Synthesis, Characterization and Application
136
Novel solid base catalysts for Michael additions Synthesis, Characterization and Application DISSERTATION zur Erlangung des akademischen Grades doctor rerum naturalium (Dr. rer. nat.) im Fach Chemie eingereicht an der Mathematisch-Naturwissenschaftlichen Fakultät I Humboldt-Universität zu Berlin von M.Sc. (Chemistry) Zhijian Li geboren am 27.04.1977 in Fujian, P.R. China Präsident der Humboldt-Universität zu Berlin Prof. Dr. Jürgen Mlynek Dekan der Mathematisch-Naturwissenschaftlichen Fakultät I Prof. Thomas Buckhout, PhD Gutachter: 1. Prof. Dr. Erhard Kemnitz 2. Prof. Dr. Heiner Lieske Tag der mündlichen Prüfung: 18.08.2005
Transcript of Synthesis, Characterization and Application

Novel solid base catalysts for Michael additions Synthesis, Characterization and Application
DISSERTATION
zur Erlangung des akademischen Grades
doctor rerum naturalium
(Dr. rer. nat.)
im Fach Chemie
eingereicht an der
Mathematisch-Naturwissenschaftlichen Fakultät I
Humboldt-Universität zu Berlin
von
M.Sc. (Chemistry) Zhijian Li
geboren am 27.04.1977 in Fujian, P.R. China
Präsident der Humboldt-Universität zu Berlin
Prof. Dr. Jürgen Mlynek
Dekan der Mathematisch-Naturwissenschaftlichen Fakultät I
Prof. Thomas Buckhout, PhD
Gutachter:
1. Prof. Dr. Erhard Kemnitz
2. Prof. Dr. Heiner Lieske
Tag der mündlichen Prüfung: 18.08.2005

Abstract
In contrast to solid acid catalysts, much fewer efforts have been made to study solid base
catalysts. In this thesis, preparation, characterization and application of oxides and
modified oxide as solid base catalysts were studied. The catalysts include MgO prepared
by different methods, potassium-modified ZrO2, calcined Mg-Al hydrotalcites, and a novel
catalyst system Mg(O,F), which was prepared by sol-gel method for the first time. The
catalysts were studied by N2 adsorption/desorption measurement, XRD, FTIR, XPS, TG-
DTA-DTG and NMR. Acid-base properties of the catalysts were investigated by TPD,
FTIR spectroscopy and microcalorimetry to correlate with the catalytic behavior. Calcined
Mg-Al hydrotalcite and Mg(O,F) are found to be highly active and selective catalysts for
liquid-phase Michael additions of CH-acid compounds with methyl vinyl ketone.
Keywords:
Solid base catalyst, Michael addition, acid-base properties, heterogeneous catalysis, MgO,
ZrO2, hydrotalcite, Mg(O,F), sol-gel

Abstrakt
Im Gegensatz zu „festen Säuren“ sind „feste Basen“ wesentlich seltener
Untersuchungsgegenstand in ihrer Anwendung als Katalysatoren in der heterogenen
Katalyse.
In der vorliegenden Promotionsarbeit wurden entgegen diesem Trend die Herstellung,
Charakterisierung und Anwendung basischer Oxide sowie modifizierter Oxide in ihrer
Eignung als feste Basen in der Katalyse untersucht. Zu diesen Katalysatoren gehören MgO,
hergestellt nach unterschiedlichen Methoden, Kalium modifiziertes ZrO2, calcinierte Mg-
Al Hydrotalcite und ein neuartiges Katalysatorsystem auf der Basis von Mg(O,F)-
Kompositionen, die zum ersten Mal nach einem Sol-Gel-Fluorierungsverfahren hergestellt
wurden.
Die Katalysatoren wurden mittels N2 Adsorptions/Desorptionsuntersuchungen (BET),
XRD, FTIR, XPS, TG-DTA-DTG und MAS NMR untersucht. Die Säure-Basen-
Eigenschaften der Katalysatoren wurden durch TPD, FTIR Spektroskopie und
Mikrokalorimetrie charakterisiert und mit den katalytischen Eigenschaften korreliert.
Calcinierte Mg-Al Hydrotalcite und Mg(O,F) waren in diesem Zusammenhang am
stärksten aktiv und auch selektiv wie für die Flüssigphasenreaktion der Michael-Addition
von CH aciden Verbindungen mit Methylvinylketon gezeigt wurde.
Stichworte:
„Feste Basen“-Katalysator, Michael-Addition, Säure-Basen-Eigenschaften, heterogene
Katalyse, MgO, ZrO2, Hydrotalcite, Mg(O,F), Sol-Gel -Fluorierung

Table of Contents
I
Table of Contents
Acknowledgements ……………………………………………………………...... III
List of Abbreviations, Acronyms and Symbols …………………...…………...... IV
Chapter 1 Introduction …………………………………………………………. 1
1.1 General introduction – from catalyst to solid base catalyst …………...…….. 2
1.2 Types of solid base catalysts …………………………………………………. 5
1.3 Application of solid base catalysts in liquid-phase reactions …………………. 15
1.4 Main reactions investigated in this thesis: Michael additions …...………… 23
1.5 Scope and outline of this thesis ……………………………………………... 24
Chapter 2 Experimental section …………………...…………..……...….......... 26
2.1 Chemicals ……………………………………………………………...…..... 27
2.2 Catalyst preparation …………………………………………………………. 28
2.3 Characterization ……………………………………………………………... 28
2.4 Reaction ……………………………………………………………...……… 31
Chapter 3 MgO as solid base catalysts in Michael addition ………...………. 33
3.1 Introduction …………………………………………………………………. 34
3.2 Preparation and characterization of MgO prepared by different methods …. 35
3.3 Catalytic behavior of MgO catalysts ……………………………………….. 38
3.4 Conclusions ………………………………………………………………… 40
Chapter 4 Characterization and catalytic behavior of potassium-modified
ZrO2 base catalysts …………………………………………………...... 42
4.1 Introduction …………………………………………………………………. 43
4.2 Preparation and characterization of potassium-modified ZrO2 ……………... 43
4.3 Catalytic behavior of potassium-modified ZrO2 …………………………. 49
4.4 Conclusions …………………………………………………………………. 51
Chapter 5 Application of calcined Mg-Al hydrotalcites for Michael additions… 53
5.1 Introduction …………………………………………………………………. 54
5.2 Preparation and characterization of calcined Mg-Al hydrotalcites ………… 56
5.3 Catalytic behavior of calcined Mg-Al hydrotalcites ……………………….. 63
5.4 Acid-base properties of calcined Mg-Al hydrotalcites …………………....... 68
5.5 Correlation of catalytic behavior and the acid-base properties ……………... 81

Table of Contents
II
5.6 Conclusions …………………………………………………………………. 85
Chapter 6 Sol-gel preparation, characterization and catalytic behavior of
Mg(O,F)..………………………………………………………………... 86
6.1 Introduction …………………………………………………………………. 87
6.2 Sol-gel preparation …………………………………………………………. 88
6.3 Characterization of Mg(O,F) ……………………………………………….. 90
6.4 Catalytic behavior of Mg(O,F) ……………………………………………... 105
6.5 Conclusions …………………………………………………………………. 109
Chapter 7 Summary and conclusions …………………………………………… 110
Zusammenfassung ……………………………………………………………….. 114
References …………………………………………………………………………. 117
Lebenslauf …………………………………………………………………………. 126
Selbständigkeitserklärung …………………………………………………… 127

Acknowledgements
III
Acknowledgements
First and foremost, I would like to thank my advisor Prof. Dr. Erhard Kemnitz, for
offering me the opportunity to study in his group. I would like to express my deepest
gratitude and appreciation for his inspiring discussions, valuable suggestions and
encouragement throughout my study. I learn a lot and am very grateful.
I would deeply like to thank Dr. Hillary A. Prescott for her patient help, support and
encouragement throughout the duration of this thesis.
I am very grateful to the cooperation with the group of Prof. Dr. Heiner Lieske from
Institut für Angewandte Chemie Berlin-Adlershof (ACA). I would like to thank Dr.
Annette Trunschke for teaching me FTIR, Dr. Jens Deutsch for his help in the reactions.
The discussions with them and the suggestions from them are very helpful.
I am very grateful to Dr. Michael Feist for thermal analysis; Prof. Aline Auroux for
microcalorimetric measurement; Sigrid Bäßler for TPD measurement and fluoride analysis;
Elfriede Lieske for gas-phase reaction test; Thoralf Krahl for solving the XRD problems;
Dr. D. Heidemann for solid state NMR measurement; Dr. J. Radnik and Dr. Ercan Ünveren
for XPS measurement; Dr. Irmela Hähnert for TEM measurement.
I would also like to thank Dr. Krishna Murthy Janmanchi, Dr. Udo Groß, Dr. Candra
Shekar, Dr. Sergey I. Troyanov and Dr. Stephan Rüdiger for many helpful discussions,
advices and help.
I would like to thank all the members and visiting scholars in Prof. Kemnitz’s group I
ever met, Dr. Irmina Kris Murwani, Kerstin Scheurell, Mike Ahrens, Pratap Patil, Gehen
Eltanany, Sushil K. Maurya, Dr. Yuexiang Zhu, Dr. Martin Wloka, Sakthievl Ramasamy,
for their support and help in various ways.
Most of all, I would like to thank my wife and my family for encouraging me to face the
difficulty and continually supporting.
At last, I would like to thank all my friends in Berlin, who have contributed to making
my years of stay in Berlin not only educational, but also enjoyable.
Thank you!
Zhijian Li July 2005

List of Abbreviation, Acronyms and Symbols
IV
List of Abbreviations, Acronyms and Symbols
Å angstrom
Ar Argon
a.u. arbitrary units
BE binding energy
BET Brunauer-Emmett-Teller and their adsorption model
BJH Barret-Joyner-Halenda and their adsorption model
°C degree Celsius
CHT calcined hydrotalcite
CDCl3 chloroform-d
DMSO-d6 dimethyl-d6 sulphoxide
DTA differential thermal analysis
DTG differential thermogravimetry
EDX energy-dispersive X-ray emission spectroscopy
Et ethyl
Et2O ether
ESR electron spin resonance
FTIR fourier transformation infrared spectroscopy
GC gas chromatography
HT hydrotalcite
IC ionic current
ICP-OES inductively coupled plasma-optical emission spectroscopy
K kelvin
MAS NMR magic angle spinning nuclear magnetic resonance
Me methyl
MS mass spectrometry
NMR nuclear magnetic resonance
PAS photoacoustic spectroscopy
PDF No. powder diffraction file number

List of Abbreviation, Acronyms and Symbols
V
pKa negative log of ionization constant
PTFE polytetrafluoroethylene
Py pyridine
RT room temperature
SBET specific surface area calculated by BET method
STP standard temperature and pressure
TEM transmission electron microscopy
THF tetrahydrofuran
TG thermogravimetric analysis
TPD temperature-programmed desorption
XRD X-ray diffraction
XPS X-ray photoelectron spectroscopy
VI
““CChheemmiissttrryy wwiitthhoouutt ccaattaallyyssiiss wwoouulldd bbee lliikkee aa sswwoorrdd wwiitthhoouutt aa
hhaannddllee,, aa lliigghhtt wwiitthhoouutt bbrriilllliiaannccee,, aa bbeellll wwiitthhoouutt ssoouunndd…………””
------ AAllwwiinn MMiittttaasscchh

Chapter 1
1
CChhaapptteerr 11
IInnttrroodduuccttiioonn

Chapter 1
2
1.1 General introduction – from catalyst to solid base catalyst
Catalysis and Catalyst
Catalysis, from the Greek kata (cata), meaning down, and lyein (lysis) meaning to
loosen, to free [1], may come from the “philosopher’s stone” or “quinta essential” of the
medieval alchemists.
The chemical concept of catalysis was first developed by the great Swedish chemist
Berzelius (1779–1848) in 1835 to correlate observations made by other chemists in Europe
[2,3], such as the enhanced conversion of starch to sugar by acids; the hastening of gas
combustion by platinum; the stability of hydrogen peroxide in acid solution but its
decomposition in the presence of alkali and transition metals, such as manganese, silver,
platinum, and gold; and the observation that the oxidation of alcohol to acetic acid was
accomplished in the presence of finely divided platinum [4]. According to the definition of
catalysis introduced by Berzelius and scientifically defined firstly by the German chemist
Ostwald (1853–1932) in 1894, catalyst is a substance which alters the rate of approaching
of chemical equilibrium without itself being changed or substantially consumed in the
process [5]. In a catalyzed reaction the catalyst generally enters into chemical combination
with the reactants but is ultimately regenerated so that the amount of catalyst remains
unchanged. All the remarkable phenomenon involved catalyst can be called catalysis.
Catalysts may achieve astonishing activities. Very small quantities of catalyst can
catalyze the reactions containing thousands or even millions of times their own weight of
chemicals. Equally astonishing is just how selective they can be. A catalyst may increase
the rate of only one reaction out of many competing reactions [6,7]. This just is the
significant phenomenon of catalysis. Whereas normally in nature the law is valid: the cause
is equal to the effect, catalytic phenomena are of an entirely different nature. The
conceptual importance of catalysis is based on its surprising nature [8]. It is also interesting
to note that over 80% of industrial processes involve catalysts and the number is rising;
more than half of the elements in the periodic table are involved in catalytic systems.
Heterogeneous (Solid) catalysts
Catalysts are classified roughly according to their phase behavior into homogeneous
and heterogeneous catalysts. For heterogeneous catalysis, catalyst and reactants are in
different phases. The reactants may be either gases or liquids (or solutions) and usually the
catalyst is a solid. Therefore, heterogeneous catalysts are also called as solid catalysts.

Chapter 1
3
Catalysis takes place always and everywhere. Catalysis by solid materials has been
observed quantitatively at temperatures as low as 78 K and as high as 1500 K; at pressures
between 10–9 and 103 bar; with reactants in the gas phase or in liquid phase; with or
without assistance of photons, radiation, or electron transfer at electrodes; with pure metals
as unreactive as gold and as reactive as sodium; with multi-component and multi-phase
inorganic compounds and acidic organic polymers; and at site time yields as low as 10–5s–1
(one turnover per day) and as high as 109s–1 (gas kinetic collision rate at 10 bar) [9].
Nowadays the increasing social and environmental pressure on industry to substitute
traditional homogeneous-catalyzed reactions by environmentally friendly technologies
represents the most important driving force for the development of heterogeneous catalysis.
Indeed, the solid catalysts have many advantages over liquid catalysts. They are non-
corrosive and environmentally benign, presenting fewer disposal problems. Their reuse is
possible and their separation from liquid products is much easier. Furthermore, they can be
designed to give higher activity, selectivity and longer catalyst life.….
Today, heterogeneous catalytic processes may be divided into two large groups: redox
reactions and acid-base reactions. The first group includes all those reactions in which the
catalyst affects the homolytic bond rupture in the reactant molecules with the appearance
of unpaired electrons, and formation of homolytic bonds with the catalyst with the
participation of catalyst electrons. The second group includes reactions in which the
reactants form heterolytic bonds with the catalyst by using the free electron pair of the
catalyst or reactants, or the free electron pair formed in the course of reaction by
heterolytic rupture of bonds in the reactant molecules [10]. Therefore, heterogeneous
catalysts can be divided into redox catalysts and acid-base catalysts.
Solid acid-base catalysts
In general terms, a solid acid catalyst may be understood as a solid on which the color
of a basic indicator changes, or as a solid on which a base is chemically adsorbed. On the
contrary, a solid base catalyst may be understood as a solid on which the color of an acidic
indicator changes, or as a solid on which an acid is chemically adsorbed. More strictly,
following both Brønsted (-Lowry) and Lewis definitions [11]: a Brønsted acid is a proton
donor and Brønsted base is a proton acceptor; a Lewis acid is an electron-pair acceptor
and Lewis base is an electron-pair donor. A solid acid shows a tendency to donate a
proton or to accept an electron pair, whereas a solid base tends to accept a proton or to
donate an electron pair. These definitions are adequate for an understanding of the acid-
Chapter 1
4
base phenomena shown by various solids, and are convenient for a clear description of
solid acid and base catalysis. However, it should be noted that the same site could serve as
a Brønsted base as well as a Lewis base, depending on the nature of the adsorbate in the
reaction [11].
Solid base catalysts
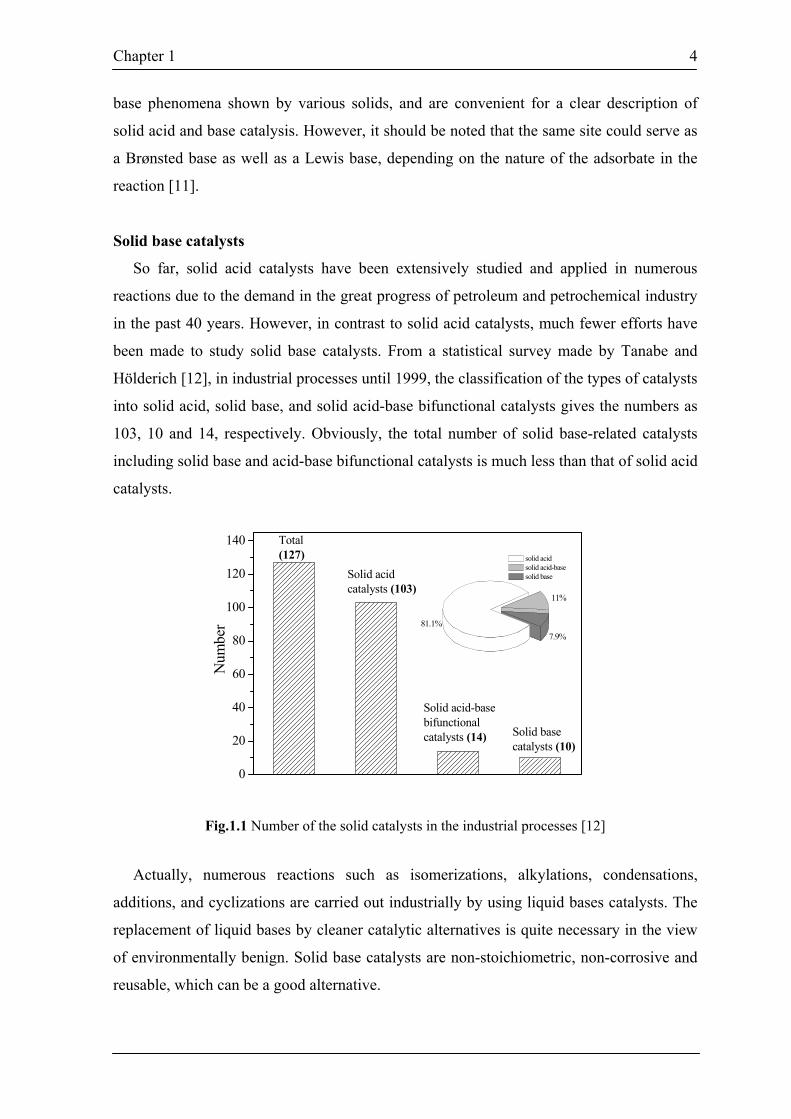
So far, solid acid catalysts have been extensively studied and applied in numerous
reactions due to the demand in the great progress of petroleum and petrochemical industry
in the past 40 years. However, in contrast to solid acid catalysts, much fewer efforts have
been made to study solid base catalysts. From a statistical survey made by Tanabe and
Hölderich [12], in industrial processes until 1999, the classification of the types of catalysts
into solid acid, solid base, and solid acid-base bifunctional catalysts gives the numbers as
103, 10 and 14, respectively. Obviously, the total number of solid base-related catalysts
including solid base and acid-base bifunctional catalysts is much less than that of solid acid
catalysts.
0
20
40
60
80
100
120
140
N
umbe
r
7.9%
11%
81.1%
solid acid solid acid-base solid base
Solid base catalysts (10)
Solid acid-base bifunctionalcatalysts (14)
Solid acid catalysts (103)
Total (127)
Fig.1.1 Number of the solid catalysts in the industrial processes [12]
Actually, numerous reactions such as isomerizations, alkylations, condensations,
additions, and cyclizations are carried out industrially by using liquid bases catalysts. The
replacement of liquid bases by cleaner catalytic alternatives is quite necessary in the view
of environmentally benign. Solid base catalysts are non-stoichiometric, non-corrosive and
reusable, which can be a good alternative.
Chapter 1
5
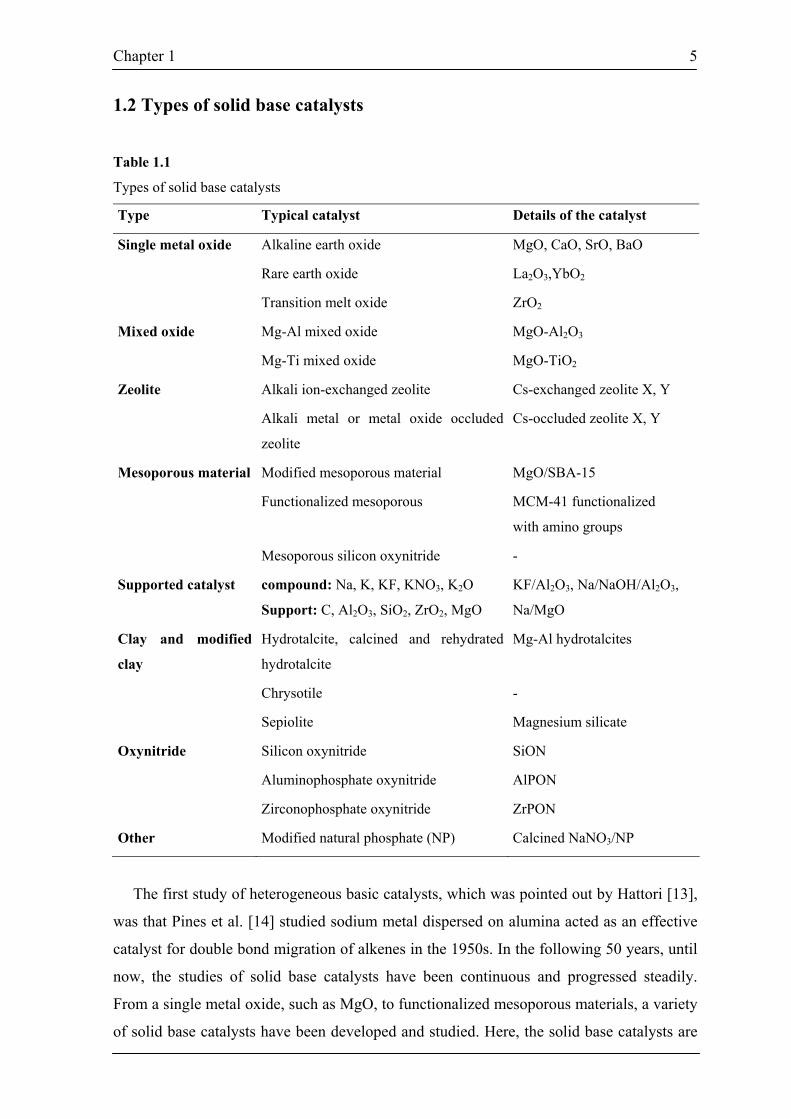
1.2 Types of solid base catalysts
Table 1.1
Types of solid base catalysts
Type Typical catalyst Details of the catalyst
Single metal oxide Alkaline earth oxide MgO, CaO, SrO, BaO
Rare earth oxide La2O3,YbO2
Transition melt oxide ZrO2
Mixed oxide Mg-Al mixed oxide MgO-Al2O3
Mg-Ti mixed oxide MgO-TiO2
Zeolite Alkali ion-exchanged zeolite Cs-exchanged zeolite X, Y
Alkali metal or metal oxide occluded
zeolite
Cs-occluded zeolite X, Y
Modified mesoporous material MgO/SBA-15
Functionalized mesoporous MCM-41 functionalized
with amino groups
Mesoporous material
Mesoporous silicon oxynitride -
Supported catalyst compound: Na, K, KF, KNO3, K2O
Support: C, Al2O3, SiO2, ZrO2, MgO
KF/Al2O3, Na/NaOH/Al2O3,
Na/MgO
Hydrotalcite, calcined and rehydrated
hydrotalcite
Mg-Al hydrotalcites
Chrysotile -
Clay and modified
clay
Sepiolite Magnesium silicate
Oxynitride Silicon oxynitride SiON
Aluminophosphate oxynitride AlPON
Zirconophosphate oxynitride ZrPON
Other Modified natural phosphate (NP) Calcined NaNO3/NP
The first study of heterogeneous basic catalysts, which was pointed out by Hattori [13],
was that Pines et al. [14] studied sodium metal dispersed on alumina acted as an effective
catalyst for double bond migration of alkenes in the 1950s. In the following 50 years, until
now, the studies of solid base catalysts have been continuous and progressed steadily.
From a single metal oxide, such as MgO, to functionalized mesoporous materials, a variety
of solid base catalysts have been developed and studied. Here, the solid base catalysts are

Chapter 1
6
divided into the types displayed in Table 1.1. Although some excellent reviews
[13,15,16,17,18,19] are available about the solid base catalysts, some selected types of
solid base catalysts, such as basic zeolites, functionalized mesoporous basic materials,
oxynitrides, KF/Al2O3 and solid superbase catalysts will be briefly discussed in the
following. Some other kinds of catalysts will also be further introduced later in the
following chapters.
Basic zeolites
Generally, zeolites are aluminosilicates that are constructed from TO4 tetrahedra (T =
tetrahedral atom, e.g., Si, Al) with each apical oxygen atom shared with an adjacent
tetrahedron. It is well known that zeolites are usually used as solid acid catalysts [20]. At
the beginning of the 1990s, zeolites were used as base catalysts in their ion-exchanged and
impregnated forms [19].
There are two main kinds of basic zeolites: alkali ion-exchanged zeolites and metal
oxide or metal occluded zeolites. The latter can also be called as modified zeolites,
supported zeolites, loaded zeolites or added zeolites. In general, the basic sites in alkali
ion-exchanged zeolites are regarded as the framework oxygens and therefore related to the
negative charge density on the oxygen atoms, which depend on the zeolite structure and
chemical composition. The basic strength and the density of basic sites in alkali ion-
exchanged zeolites decrease with an increase in framework Si/Al ratio, while basic
strength increases with an increase in electropositivity of the countercation in zeolites
[15,17]. Thus, the relatively high aluminum content of zeolite X (Si/Al = 1–1.5) results in a
substantial framework negative charge, which makes zeolite X one of the most basic
zeolites when in the alkali-exchanged form. Normally, the basic strength of alkali ion-
exchanged zeolites decreases in the following order: Cs+ > Rb+ > K+ > Na+ > Li+
[15,17,21]. This kind of basic zeolites is regarded as weak bases. Therefore, they can be
handled in ambient atmosphere, since adsorption of carbon dioxide or water is not too
strong, and they can be removed by high-temperature treatment.
Occlusion of alkali metal oxide clusters in zeolite cages via decomposition of
impregnated alkali salts results in a further increase in the basicity of basic zeolites.
Preparation of fine particles of alkali oxides inside the cavities of zeolites was developed
by Hathaway and Davis [22,23,24]. They impregnated CsNaX and CsNaY zeolite with
cesium acetate aqueous solution and calcined at 723 K to decompose cesium acetate into
cesium oxide occluded in the cavities. Very active basic sites are formed by this method. In
Chapter 1
7
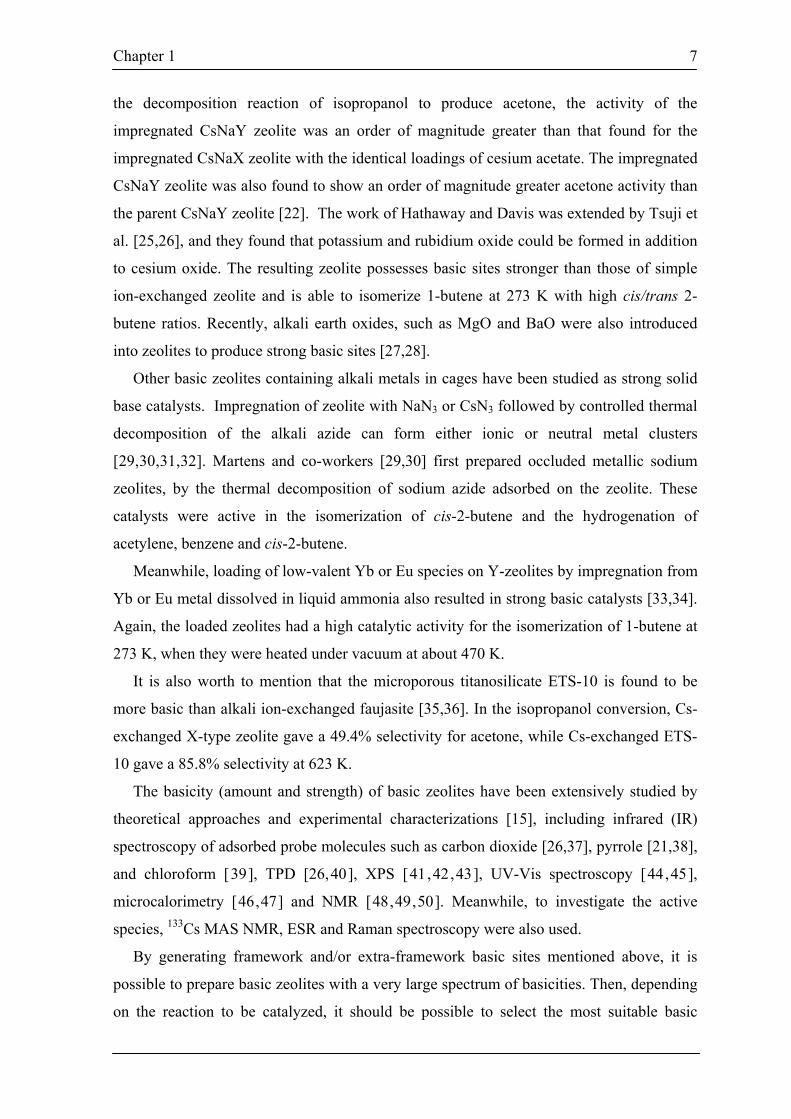
the decomposition reaction of isopropanol to produce acetone, the activity of the
impregnated CsNaY zeolite was an order of magnitude greater than that found for the
impregnated CsNaX zeolite with the identical loadings of cesium acetate. The impregnated
CsNaY zeolite was also found to show an order of magnitude greater acetone activity than
the parent CsNaY zeolite [22]. The work of Hathaway and Davis was extended by Tsuji et
al. [25,26], and they found that potassium and rubidium oxide could be formed in addition
to cesium oxide. The resulting zeolite possesses basic sites stronger than those of simple
ion-exchanged zeolite and is able to isomerize 1-butene at 273 K with high cis/trans 2-
butene ratios. Recently, alkali earth oxides, such as MgO and BaO were also introduced
into zeolites to produce strong basic sites [27,28].
Other basic zeolites containing alkali metals in cages have been studied as strong solid
base catalysts. Impregnation of zeolite with NaN3 or CsN3 followed by controlled thermal
decomposition of the alkali azide can form either ionic or neutral metal clusters
[29,30,31,32]. Martens and co-workers [29,30] first prepared occluded metallic sodium
zeolites, by the thermal decomposition of sodium azide adsorbed on the zeolite. These
catalysts were active in the isomerization of cis-2-butene and the hydrogenation of
acetylene, benzene and cis-2-butene.
Meanwhile, loading of low-valent Yb or Eu species on Y-zeolites by impregnation from
Yb or Eu metal dissolved in liquid ammonia also resulted in strong basic catalysts [33,34].
Again, the loaded zeolites had a high catalytic activity for the isomerization of 1-butene at
273 K, when they were heated under vacuum at about 470 K.
It is also worth to mention that the microporous titanosilicate ETS-10 is found to be
more basic than alkali ion-exchanged faujasite [35,36]. In the isopropanol conversion, Cs-
exchanged X-type zeolite gave a 49.4% selectivity for acetone, while Cs-exchanged ETS-
10 gave a 85.8% selectivity at 623 K.
The basicity (amount and strength) of basic zeolites have been extensively studied by
theoretical approaches and experimental characterizations [15], including infrared (IR)
spectroscopy of adsorbed probe molecules such as carbon dioxide [26,37], pyrrole [21,38],
and chloroform [39], TPD [26,40], XPS [41,42,43], UV-Vis spectroscopy [44,45],
microcalorimetry [46,47] and NMR [48,49,50]. Meanwhile, to investigate the active
species, 133Cs MAS NMR, ESR and Raman spectroscopy were also used.
By generating framework and/or extra-framework basic sites mentioned above, it is
possible to prepare basic zeolites with a very large spectrum of basicities. Then, depending
on the reaction to be catalyzed, it should be possible to select the most suitable basic

Chapter 1
8
zeolite from the very mild alkaline-exchanged zeolites up to very strong alkali- or alkaline-
oxide-cluster containing zeolites. Therefore, until now, basic zeolites have been used as
catalysts in a number of base-catalyzed reactions, such as toluene alkylations with
methanol [ 51 , 52 ] or ethylene [46], dehydrogenation of alcohols [22], double bond
isomerizations [26,40], Knoevenagel condensations [53,54,55], aldol condensations [56,57]
and cycloaddition of CO2 to epoxides [58]. However, an industrial process utilizing a basic
zeolite has not been commercialized [17].
For an excellent discussion of basic zeolites, a comprehensive review by Barthomeuf
[15] is available.
Mesoporous basic materials
Although basic zeolites have been used in a broad spectrum of reactions, in some cases
they are limited in the application of the synthesis of fine chemicals because their small
pore openings prevent bulky molecules from reaching the active sites in zeolite cages. New
families of mesoporous silicas, such as MCM-41 [59] and SBA-15 [60], open the new
opportunities for supports due to tuneable larger pore sizes.
Basic mesoporous materials may be prepared by following routes: a) cation exchange
with alkali (e.g. Na+ , K+, Cs+) metal ions; b) impregnation with alkali salts solution and
calcination; c) functionalization with organic groups. The preparations of the former two
kinds of mesoporous materials are similar to those of basic zeolites.
The use of mesoporous materials MCM-41 as carriers for basic guest species was
proposed by Kloetstra and Bekkum [61,62]. They found sodium and cesium cation-
exchanged MCM-41s were mild, selective, water-stable and recyclable catalysts for base-
catalyzed Knoevenagel condensation [61]. Meanwhile, they obtained finely dispersed
cesium oxide clusters in the pores of MCM-41 by impregnation of MCM-41 with cesium
acetate in aqueous or methanolic solution and calcination, when the cesium content was
not higher than 10 wt%. The CsOy/MCM-41 catalyst had strong base activity in Michael
addition [61]. However, the catalyst did not show a good thermal and chemical stability.
After repeated calcinations or after use, aggregation of the cesium oxide particles and a
significant reduction of the specific surface area were observed [ 63 ]. Kloetstra and
Bekkum further improved the thermal stability substantially and lowered the catalyst
moisture sensitivity by addition of equimolar amounts of lanthanum, which gave the
MCM-41 supported binary cesium-lanthanum oxide. The resulting catalyst was applied in
Michael addition [62] and novel isomerization of ω-phenylalkanals to phenyl alkyl ketones

Chapter 1
9
[64]. Recently, basic mesoporous material was also prepared by in-situ coating of SBA-15
with basic MgO in one-step procedure by adding acetate salt into the initial mixture of raw
materials for synthesis [65].
Functionalized mesoporous basic material can also be prepared by the immobilization
of an organic base, such as amino groups, cinchonine, β-aminoalcohols or quaternary
organic ammonium hydroxides, on the surface of a carrier material. There have been
various attempts to fix functional groups on the surface of mesoporous silica. Macquarrie
first reported the one-pot synthesis of surface-modified mono-disperse MCM-type silica
[66], and further found MCM-type silicas having aminopropyl groups were effective base
catalysts for the Knoevenagel reactions [67]. The amino groups can also be introduced by
post-synthesis using the reactivity of the OH groups [68,69]. Triazabicyclo[4,4,0]dec-5-ene
(TBD) is an extremely strong organic base and particularly active both in the free form and
immobilized on an organic resin. Subba Rao et al. [70] prepared a catalyst based on TBD
immobilized on MCM-41. They reported high activity for base-catalyzed reactions such as
Michael addition and Knoevenagel condensation. Rodriguez et al. [71] prepared strong and
stable Brønsted base catalysts by anchoring quaternary organic tetraalkylammonium
hydroxide on MCM-41. Corma and co-workers [ 72 ] grafted a proton sponge, 1,8-
bis(dimethylaminonaphthalene) (DMAN), onto amorphous and pure-silica MCM-41. The
results showed that DMAN supported MCM-41 was an excellent base catalyst for the
Knoevenagel condensation between benzaldehyde and different active methylene
compounds as well as for the Claisen-Schmidt condensation of benzaldehyde and 2′-
hydroxyacetophenone to chalcones and flavanones.
The organic-inorganic hybrid materials are less strongly basic than the corresponding
free organic molecules and possess a wide distribution of base sites with different strengths,
which has been explained by an H-bonding interaction of the amine function with residual
silanol groups. At the same time, these organic-inorganic hybrid materials maintain the
advantages of the inorganic support, notably a high surface area and structural stability at
elevated temperature and pressure. Thus, mesoporous silicas with a variety of organic
bases have been tested for a variety of reactions, including the syntheses of
monoglycerides from fatty acids and glycidol [68, 73 ], Knoevenagel condensations
[70,71,74,75], aldol condensations [71,74], and Michael additions [70,71]. Moreover, it is
worth noting that the immobilization of a chiral amine on MCM-41 can give a
heterogeneous catalyst for enantioselective reactions [76].

Chapter 1
10
Oxynitrides
Lednor and Rulter first prepared silicon oxynitride, Si2N2O, by a gas-solid reaction of
amorphous silica with ammonia at 1373 K [77] and further found that the material had a
solid base character in the Knoevenagel condensations [ 78 , 79 ]. After that,
aluminophosphate oxynitrides (AlPON), synthesized by nitridation under NH3 of high-
surface-area amorphous aluminophosphate precursors at around 1073 K (the temperature
and time of nitridation could be changed to modify the nitrogen content in the final solid),
[80,81,82,83,84] were described as a new family of solid basic catalysts, showing very
promising behavior to the synthesis of methyl isobutyl ketone [80] and in Knoevenagel
condensations [81,84]. The incorporation of nitrogen in the aluminophosphate anionic
framework seems to be an effective way to modify the surface acid-base properties of the
precursors and particularly to decrease the number of acid sites and to increase the number
of basic sites. Zirconophosphate oxynitride (ZrPON) [85,86,87], galloaluminophosphate
oxynitride (AlGaPON) [88,89] and aluminovanadate oxynitride (VAlON) [90,91], which
were prepared in a similar method, have also been reported as solid base catalysts.
Recently, Xia and Mokaya [92] extended the preparation method and successfully prepared
highly ordered mesoporous silicon oxynitride materials as solid base catalysts.
For oxynitrides, the identification of the basic sites is more difficult than that on oxide
basic catalysts because several species present at the surface can act as basic sites. Among
them the nitride nitrogen (N3–), the –(NH)–, and the –NH2 group could be candidates, but
the oxygen and the hydroxyl whose charge would be modified by the vicinity of the less
electronegative framework nitrogen cannot be neglected [90]. Nevertheless, it seems that
the acid-base properties of oxynitrides may be tuned by adjusting the O/N ratio.
In most cases, these oxynitrides are known to catalyze Knoevenagel condensations.
However, application of this kind of catalysts to other types of reactions is highly desirable.
KF/Al2O3
Most of heterogeneous basic catalysts are in the form of oxides and the basic sites are
O2– ions with different environments depending on their types. If the basic sites are
constituted by elements other than O2–, the catalysts are expected to show different
catalytic properties [13]. Among the catalysts of the non-oxide type, potassium fluoride
supported on alumina (KF/Al2O3) is most widely studied. KF/Al2O3 was introduced by
Clark [93] as an effective solid catalyst to promote base-catalyzed organic reactions. The
reactions using KF/Al2O3 as catalyst include Michael additions, Knoevenagel
Chapter 1
11
condensations, aldol condensations and so on. Though KF/Al2O3 has wide application in
organic chemistry because of its easy workup after reactions, the idea of its catalytically
active species is still controversial and the mechanisms of the appearance of the basicity of
KF/Al2O3 are not clarified. Moreover, conflicting conclusions have been reported on its
base strength: most authors consider it to be weak or moderate base, but some note high or
even super base.
Hattori and co-workers [94] reported that treating KF/Al2O3 at high temperature 573–
673 K under high vacuum is essential for obtaining the high catalytic activity for double-
bond isomerization of 1-pentene; the activity showed a sharp maximum at 623 K. The
dependence of the catalytic activity on evacuation temperature was also found for the
Tishchenko reaction of benzaldehyde [ 95 ] and the disproportionation of trimethyl-
silylacetylene [96]. Hattori and co-workers also found that the main containing F species
on KF/Al2O3 was K3AlF6, which was formed by the reaction of KF with alumina; however,
it was not related to the formation of active sites, which gave a peak at -150 ppm in 19F
MAS NMR [97]. Insufficient coordination of KF only with surface OH– groups may result
in the formation of the so-called ‘half-naked’ and thus active F– ions [98], which was
supported by 19F MAS NMR. Ando et al. concluded that there could be three basic species
of KF/alumina [99,100]: (a) the presence of active fluoride, (b) the presence of [Al–O–] ion
which generates OH– when water is added, and (c) the cooperation of F– and [Al–OH].
Recently, the effect of the support on the properties of KF/Al2O3 was investigated. The
basicity of supported KF can be significantly increased by a proper choice of support. The
higher basicity is probably due to the dispersion of KF in small crystals [101]. More
recently, CsF supported on α-alumina was also found to be an efficient basic catalyst [102].
Solid superbases
To activate a reactant under mild conditions, a catalyst with very strong basic sites may
be needed. Moreover, in the possible commercial industry chemical processes, effective
application of superbase catalyst to side chain alkylation for alkyl-aromatics, and high
selectivity for double-bond-isomerization of olefinic compounds without causing tar-
formation as well as in place of solid acid catalysts having problem of deactivation are
highly desirable [103]. Normally, catalysts which possess base sites stronger than H– = 26
are called superbases [5,11]. There have been some attempts to prepare those superbase
catalysts (see Table 1.2).

Chapter 1
12
Table 1.2
Types of solid superbase catalysts [104]
Catalyst Starting material (preparation method)
Pretreatment Temperature (K)
Strength (H–)
CaO CaCO3 1173 26.5
SrO Sr(OH)2 1123 26.5
NaOH/MgO (NaOH impregnated) 823 26.5
KNO3/ Al2O3, KNO3/ ZrO2 (dry ground) 873 26.5
Na/MgO (Na vaporized) 923 35
Na/Al2O3 (Na vaporized) 823 35
Na/NaOH/Al2O3 (NaOH, Na impregnated) 773 37
KNH2/Al2O3 (KNH2 impregnated) 573 >37
K(NH3)/Al2O3 (ammoniacal K impregnated) 523–573 >37
Pines and co-workers [14,105,106] loaded alkali metals on supports by deposition of
the metal vapor and used them as highly active catalysts for the isomerization of alkenes
and the related compounds. The catalysts were regarded as superbase. Kijienski and
Malinowski [107,108] also reported that sodium metal deposited on MgO (Na/MgO)
showed a high catalytic activity for the isomerization of alkenes at 293 K and the base sites
were stronger than H– = 35. Ushikubo et al. [109] also prepared a superbase catalyst by
addition of metallic sodium to MgO by decomposing NaN3 to evolve metallic sodium
vapor. The resulting catalyst acted as an efficient catalyst for decomposition of methyl
formate to CO and methanol. Sun and Klabunde [110] found nanocrystalline MgO doped
with potassium metal were capable of alkene isomerization and alkene alkylation,
including the conversion of propylene–ethylene mixtures to pentene and heptene.
Suzukamo et al. [ 111 , 112 ] prepared a superbase catalyst by addition of alkali
hydroxides to alumina followed by further addition of alkali metals. The resulting catalyst,
Na/NaOH/Al2O3, a pale blue solid, possessed basic sites stronger than H– = 37 and
catalyzed various base-catalyzed reactions, such as double bond migrations of 5-
vinylbicyclo[2.2.1]hept-2-ene to 5-ethylidenebicyclo[2.2.l]hept-2-ene at the reaction
temperature 243–373 K, 2,3-dimethylbut-l-ene to 2,3-dimethylbut-2-ene at 293 K, and
safrole to isosafrole at 293 K and side chain alkylations of alkylbenzenes at the reaction
temperature 293–433 K.
Baba et al. [113,114] obtained a superbase K(NH3)/Al2O3 by loading potassium onto
alumina in liquid ammonia and heating the resulting material under vacuum at 523–573K.
The resulting catalyst showed extremely high catalytic activity for the isomerization of

Chapter 1
13
alkene and had much higher activity than that of Al2O3 loaded with alkali metals by vapor
deposition. The active species are not metallic, but probably amide- or imide-like species.
However, Al2O3 loaded with KNH2 was found to be more active than K(NH3)/Al2O3 for
the isomerization of 2,3-dimethylbut-1-ene. Using KNH2/Al2O3, even toluene can be
activated to react with silanes at 329 K [115]. Moreover, the NH2 groups in KNH2/Al2O3
even react with methane (pKa = 50) [ 116 ].The basic strength of both catalysts was
estimated to be at least H– = 37.
Yamaguchi [117] and Wang et al. prepared superbases by dispersing potassium salts
such as KNO3, K2CO3, KHCO3 on alumina [118] or zirconia [119] followed by thermal
treatments. The dispersed compounds are decomposed partly during the thermal treatment,
but the origin of the basic sties is not clear yet. The catalysts possessed a base strength of at
least H– = 26.5 and have the advantage of easy preparation.
Acid-base bifunctional catalysts
Acidity and basicity are a pair of concepts and any kind of solid base (or solid acid)
possesses more or less acid sites (or base sites), even for the catalysts which are simply
regarded to be base (or acid) catalysts. The catalysts having suitable acid-base pair sites
sometimes show pronounced activity, even if the acid-base strength of a bifunctional
catalyst is much weaker than the acid or base strength of acid or base. ZrO2 was found to
be a very important acid-base bifunctional catalyst and has been used in industrial
applications [120]. The possible solid acid-base bifunctional catalysts are given in Table
1.3.
Table 1.3
Possible solid acid-base bifunctional catalysts
Type Details of the catalyst Typical catalyst
Single metal oxide Rare earth oxide La2O3
Transition melt oxide ZrO2
Mixed oxide Mg-Al mixed oxide MgO-Al2O3
Oxynitride Aluminophosphate oxynitride AlPON
Future prospects and problem to be solved
The role of basic active sites and their correlate with the catalytic behavior
Until now, the nature of the basic sites on some solid base catalysts, for example KF/
Al2O3 and KNH2/Al2O3, are not very clear. Moreover, the role of alumina as a support for

Chapter 1
14
some catalyst systems is also not clear. It is quite necessary to explore new or proper
characterization method to confirm the nature of the active sites. Meanwhile, there are a
number of examples of heterogeneous base-catalyzed reactions which cannot be
understood only in terms of number and strength of the basic sites, since the catalytic
behavior of solid base catalysts are not simple copies of those of homogeneous basic
catalysts. In situ spectroscopic techniques (IR, NMR) may be efficient methods to carry
out the study. These techniques will furnish new and detailed information on the
adsorbates on the working catalysts, thus helping to elucidate reaction mechanisms and
find out the active sites. As catalysts, it is also important to define the reaction environment
around the active sites to enhance the rate and selectivity of base-catalyzed reactions. On
the other hand, theoretical calculations of the surface sites and the reaction mechanisms are
quite helpful for exploration of solid base catalysis. So far the results of the quantum
chemical calculations which have been done explain well the experimental results, and
give us valuable information about the solid base catalysis. Unfortunately, the theoretical
calculations have been done only for limited cases. An attempt to calculate for many cases
is highly desirable. Keen insight into the surface reaction mechanisms and functions
required for the reactions together with the accumulation of the data will enable to design
the solid base catalysts active for desired reactions.
The roles of acid-base cooperative effects
In a lot of base-catalyzed reactions, acid sites on the surface of the catalysts were found
to have cooperative effect to enhance the activity. However, the cooperative effect has not
been well investigated. It is necessary to find an efficient way to further prove the
mechanism of the cooperative effect.
Leaching problem for some kinds of catalysts in liquid-phase reactions
Some kinds of solid catalysts, such as Na/NaOH/Al2O3, metal or metal oxide occluded
zeolites, show good activity in gas-phase reactions. However, when these catalysts were
used in liquid-phase reactions, the problem of leaching of the active sites should be
considered and studied.
Application of solid base catalysts
Novel reactions should be studied not only from the known homogeneous base-
catalyzed reactions, but also from a wider range of reactions which might proceed through
“anionic or anion-like” intermediates. Finally, solid bases should be utilized in industrial
processes.

Chapter 1
15
1.3 Application of solid base catalysts in liquid-phase reactions
Traditionally, heterogeneous catalysis has been associated with the production of
petrochemicals and bulk chemicals for a long time, whereas fine and speciality chemicals
are produced predominantly with non-catalytic organic synthesis or via homogeneous
catalysis. Recently, heterogeneous catalysis is beginning to be used in the fine-chemicals
industry because of the need for more environmentally friendly production technology.
This tendency is assisted by the availability of novel catalytic materials and modern
techniques of creating and investigating specific active sites on catalyst surfaces [121,122].
In the field of fine chemical production, important steps in the synthesis of relatively
large and complex molecules include carbon-carbon bond forming reactions such as
Knoevenagel condensations or Michael additions. Bases are usually used in organic
reactions to deprotonate and form carbanion intermediates, which are important
intermediates in many organic reactions for fine-chemical synthesis. This is why base-
catalyzed reactions usually find more applications in intermediates and fine chemical
synthesis. Replacing the conventional homogeneous base catalysts, mostly solutions of
alkali metal hydroxides and alkoxides, by solids can be desirable for various reasons, e.g.,
to suppress undesired side reactions (polymerization, self-condensation) or avoid salt
formation due to the necessary neutralization of the soluble bases. The amount of by-
products (largely inorganic salts) per kilogram of product is generally much larger in fine
chemicals and pharmaceuticals than bulk chemicals (see Table 1.4). The use of
heterogeneous base catalysts has reached great development in different areas of organic
synthesis due to their environmental compatibility combined with the good yield and
selectivity that can be achieved.
Table 1.4
The E factor (kg by-product/kg product) [121]
Industry segment Product tonnage Kg by-product/kg product
Bulk chemicals 104 – 106 < 1 – 5
Fine chemicals 102 – 104 5 – 50
Pharmaceuticals 10 – 103 25 – > 100
Therefore, in the following section, application of solid catalysts in liquid-phase
reactions, especially in C–C bond formation reactions for fine chemicals will be discussed.

Chapter 1
16
Some typical reactions, such as Knoevenagel condensation and aldol condensation, will be
detailed below.
Knoevenagel condensation
Knoevenagel condensations are the reactions between a ketone and active methylene
compounds and proceed over a variety of basic solid catalysts, including alkali-ion-
exchanged zeolites, alkali-ion-exchanged sepiolite, oxynitrides, and hydrotalcite-related
catalysts and so forth.
The Knoevenagel condensations of benzaldehyde and substituted benzaldehydes with
ethylcyanoacetate, ethylmalonate, and ethylacetoacetate [Eq.(1.1)] were catalyzed by basic
faujasite zeolites [53,54] to obtain intermediates for the production of dihydropyridine
derivatives. The catalytic activity increased with the basicity of the zeolite.
CHO
R
+ H2C
COOEt
O
RCOOEt
O
+ H2O
(R = NO2, CF3) (1.1)
Rehydrated hydrotalcite was reported by Kantam et al. to give quantitative yields for a
variety of Knoevenagel condensations [Eq.(1.2)] at room temperature using toluene or
DMF as solvent in liquid phase [123]. Mesoporous silicas modified with amino groups [74]
and mesoporous silicon oxynitride [92] were also effective in similar reactions.
R1
R2
O + H2C
CN
Y
R1
C
R2
C
CN
Y
+ H2O
(R1 = Ph, PhCH=CH, 3-MeOC6H4, 3-MeOC6H4, 2-Furyl, 4-NO2C6H4;
R2 = H, Me; Y = CN, CO2Et) (1.2)
Knoevenagel condensations of malononitrile with cyclohexanone, benzophenone and p-
amino acetophenone yield alkenes containing electron withdrawing nitrile groups, which
facilitate additions to the double band. These alkenes are useful in anionic polymerization
reactions leading to plastics, synthetic fibers or the production of liquid crystals. They can
be synthesized using ion-exchanged zeolite X, sepionlite and hydrotalcite as catalysts [124].

Chapter 1
17
Dicyanomethylene derivative dyes could be prepared by two-step synthesis using
different solid bases via Knoevenagel condensations [Eq.(1.3)]. The first step is the
condensation of acetophenone and malononitrile to give the corresponding α-
methylbenzylidene-malononitrile, which was catalyzed by a variety of solid bases such as
MgO, calcined hydrotalcites, and AlPONs. Subsequent condensation with benzaldehyde
gives the 1,1-dicyano-1,3-butadiene dye, which was catalyzed efficiently by AlPON.
Interestingly, the reaction can also be performed in a one-pot system using an optimized
AlPON as catalyst [125].
H2CCN
CN
O
+
NC CN
+ H2O
+O
NC CN
+ H2O
(1.3)
Knoevenagel condensation is also chosen for the synthesis of unsaturated arylsulfones.
For instance, phenylsulfonylacetonitrile and phenylsulfonylacetophenone reacted with
benzaldehyde and 4-substituted benzaldehydes using high-surface-area MgO, calcined Mg-
Al hydrotalcites or ALPON type materials leading to α-phenylsulfonyl-cinnamononitrile
and derivatives as well as α-phenylsulfonylchalcone [Eq.(1.4)] [126].
H2CSO2Ph
CN
H2CSO2Ph
COPh
+
R
O
O
CN
SO2Ph
COPh
SO2Ph
R
+
(R = H, NO2, CH3, OCH3)
+
+
H2O
H2O
(1.4)
Aldol condensation
The aldol condensation is an important reaction for carbonyl compound (aldehyde or
ketone) coupling via C–C bond formation. Aldol self-condensation of acetone to diacetone
alcohol is catalyzed by a variety of solid bases, such as alkaline earth oxides, La2O3 and

Chapter 1
18
ZrO2, and Ba(OH)2 [13]. Alkaline earth oxides are active for the reaction in the following
order: BaO > SrO > CaO > MgO [127] and the active sites are suggested to be surface OH-
groups. This reaction can also be catalyzed by meixnerite-like hydrotalcite-based catalysts
with high selectivity towards the desired product [128].
For aldol condensations, generally, product aldols will undergo dehydration in presence
of acid sites besides basic sites. For example, when Choudary et al. used diamino-
functionalized mesoporous silica as a catalyst, the reaction products were a mixture of the
aldols and their dehydration products [74].
Properly activated hydrotalcite was used in condensation of citral (a mixture of geranial
and neral with a proportion of 25 and 75 wt%, respectively) and acetone into pseudoionone
[Eq.(1.5)], which is an intermediate in the commercial production of vitamin A [129]. The
results showed that even at 273 K this reaction was catalyzed by modified hydrotalcites
with a conversion of 65% and a selectivity of 90%, when the citral concentration is not too
high (~1 wt%).
+
O
OH O O
- H2Obase
pseudoionone
O
citral
(1.5)
However, Climent et al. found both calcined hydrotalcites and rehydrated hydrotalcites
could perform the same reaction at 333 K with excellent conversions and selectivities with
relatively low acetone to citral ratios. It was worth noting that rehydrated hydrotalcites
showed an improved reaction rate [130]. Moreover, under the reaction conditions, it was
possible to avoid the inhibiting effect of citral found at 273 K [129]. Using rehydrated
hydrotalcites, attractive results have also been reported in the condensation between
aromatic aldehydes like benzaldehyde or substituted benzaldehydes and acetone [123].
In an aldol condensation between a ketone and an aldehyde (Claisen-Schmidt
condensation), vesidryl, which is of pharmacological interest owing to its diuretic and
choleretic properties, was produced from substituted acetephenone and substituted
benyaldehyde [Eq.(1.6)]. By use of calcined hydrotalcite as a catalyst (5 wt%), 85% yield
of vesidryl was obtained at 170 °C after 20 h [131].
Chapter 1
19
H3CO OCH3
CH3
O
+ OCH3
H
O H3CO OCH3
O
OCH3
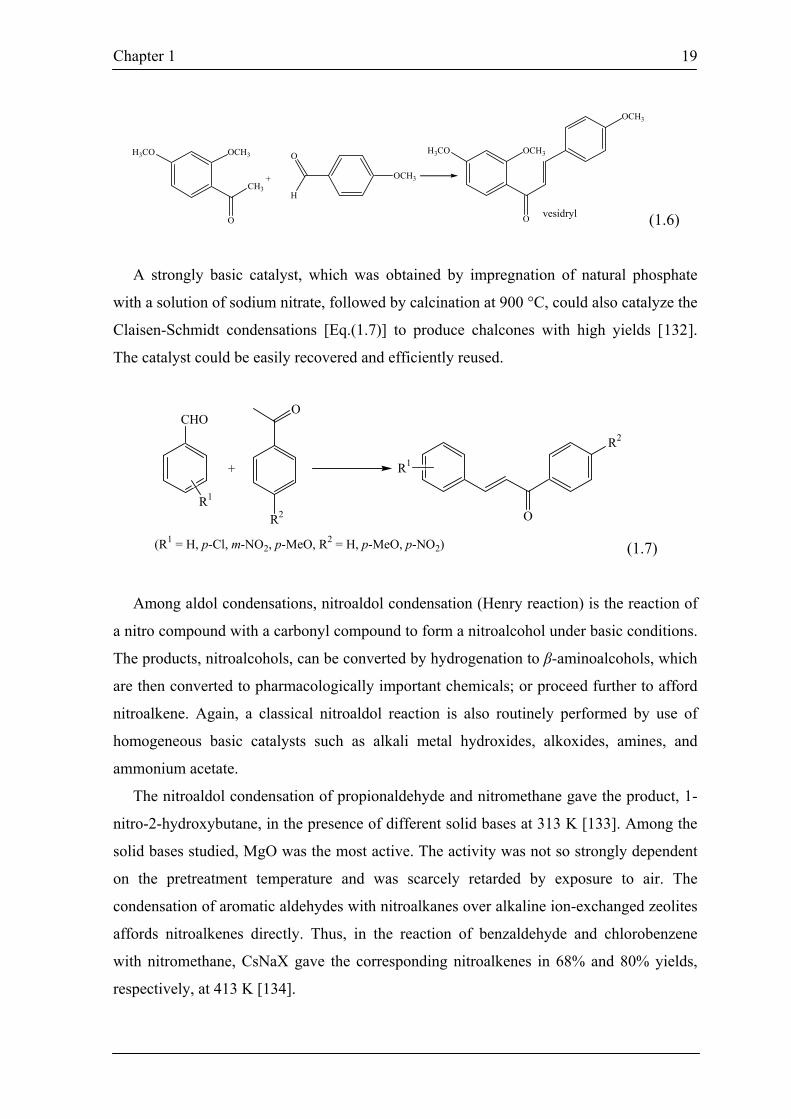
vesidryl (1.6) A strongly basic catalyst, which was obtained by impregnation of natural phosphate
with a solution of sodium nitrate, followed by calcination at 900 °C, could also catalyze the
Claisen-Schmidt condensations [Eq.(1.7)] to produce chalcones with high yields [132].
The catalyst could be easily recovered and efficiently reused.
CHO
R1
+
R2
O
R1
O
R2
(R1 = H, p-Cl, m-NO2, p-MeO, R2 = H, p-MeO, p-NO2) (1.7)
Among aldol condensations, nitroaldol condensation (Henry reaction) is the reaction of
a nitro compound with a carbonyl compound to form a nitroalcohol under basic conditions.
The products, nitroalcohols, can be converted by hydrogenation to β-aminoalcohols, which
are then converted to pharmacologically important chemicals; or proceed further to afford
nitroalkene. Again, a classical nitroaldol reaction is also routinely performed by use of
homogeneous basic catalysts such as alkali metal hydroxides, alkoxides, amines, and
ammonium acetate.
The nitroaldol condensation of propionaldehyde and nitromethane gave the product, 1-
nitro-2-hydroxybutane, in the presence of different solid bases at 313 K [133]. Among the
solid bases studied, MgO was the most active. The activity was not so strongly dependent
on the pretreatment temperature and was scarcely retarded by exposure to air. The
condensation of aromatic aldehydes with nitroalkanes over alkaline ion-exchanged zeolites
affords nitroalkenes directly. Thus, in the reaction of benzaldehyde and chlorobenzene
with nitromethane, CsNaX gave the corresponding nitroalkenes in 68% and 80% yields,
respectively, at 413 K [134].

Chapter 1
20
Mg–Al mixed oxides prepared by calcination of hydrotalcite catalyzed the nitroaldol
condensation to nitroalcohols with diastereoselective. For example, when 3-
nitrobenzaldehyde and nitroethane was refluxed in THF, 1-(3-nitrophenyl)-2-nitropropan-
1-ol was obtained in a 95% yield with a threo/erythro ratio of 12.5 [135].
Conjugate addition of alcohols
Conjugate addition of alcohols to α,β-unsaturated carbonyl compound forms a new
carbon–oxygen bond to yield valuable ethers. The reactions are catalyzed by homogeneous
base catalysts such as alkali hydroxides and alkoxides. Conjugate addition of methanol to
3-buten-2-one proceeds to form 4-methoxybutan-2-one over the solid bases such as
alkaline earth oxides, strontium hydroxide, barium hydroxide, and KF/Al2O3, KOH/Al2O3
at a reaction temperature of 273 K [136]. MgO treated at 673 K gave the highest activity.
The catalytic activities of MgO, CaO, and KF/Al2O3 were not affected by exposure of the
catalysts to carbon dioxide or air.
Among conjugate additions, cyanoethylation of alcohols is a widely used reaction for
the synthesis of drug intermediates and organic compounds of industrial interest. Again,
high activities for this reaction were reported for high temperature activated MgO catalyst
(1073 K in vacuum) [137].
Cyanoethylation of alcohols such as methanol, ethanol, and 2-propanol with
acrylonitrile [Eq.(1.8)] proceeds at 273 K over alkaline earth oxides and hydroxides,
KF/Al2O3 and KOH/Al2O3. The reaction was not poisoned by adsorption of carbon
dioxide at room temperature [138].
ROH + CNRO
CN(R = Me, Et, i-Pr, Bu, t-Bu) (1.8)
Hydrotalcite by rehydration after calcination was found to be also a highly active
catalyst for cyanoethylation of alcohols, such as methanol, ethanol, and 2-propanol, with
acrylonitrile at 50 °C. The catalyst was reusable without appreciable loss in activity and
was air stable [139].
Michael addition
Michael addition is widely used as C–C bond coupling reaction in the production of
pharmaceuticals and fine chemicals. The reaction is also conventionally catalyzed with

Chapter 1
21
soluble bases, such as KOH or amines. Normally, it involves nucleophilic addition of a
carbanion, formed by abstraction of a proton from a C–H bond of the organic donor
molecule by a base, to α,β-unsaturated carbonyl compounds. Environmental and
economical concerns are driving forces in the replacement of soluble bases by suitable
solid catalysts. The latter are easy to separate, recover, and thus, reuse. So far, several solid
base catalyst systems, such as Ba(OH)2, MgO, KF/Al2O3, Na/NaOH/Al2O3, and modified
Mg-Al hydrotalcite have been used in Michael additions. The efficient catalyst varies with
the type of the reactants. Moreover, some transition metal complexes as heterogeneous
Lewis acid catalysts instead of conventional strong bases, like montmorillonite-enwrapped
scandium, nickel (II) and cobalt (II) complexes were also applied in Michael additions.
Some Michael additions of different donors to methyl vinyl ketone (MVK) catalyzed by
solid catalysts in liquid phases are listed in Table 1.5. Table 1.5
Michael additions of different donors to methyl vinyl ketone (MVK) catalyzed by solid catalysts in
liquid phase.
Michael donor Catalyst Main supposed active sites Reference
CH3NO2 KF/alumina, KOH/alumina, MgO
Lewis base or Brønsted base
[97,140]
SHH3C
Modified Mg-Al hydrotalcite Brønsted base [141]
O
CO2Et
Tetraalkylammonium hydroxide and chiral amines on MCM-41
Brønsted base [142,143]
OEtR1
O
R2
O
Organosilicon compounds Lewis acid and Brønsted base
[144]
R2R1
O O
Nickel (II) and cobalt (II) complexes
Lewis acid [145]
R3R1
O
R2
O
Montmorillonite-enwrapped scandium
Lewis acid [146]
MeO
Me3SiO
TS-1, Ti-ß molecular sieve Lewis acid [147]
From Table 1.5, interestingly, not only solid base catalysts but also solid acid catalysts
can catalyzed the Michael additions of different donors to methyl vinyl ketone (MVK)
catalyzed in liquid phase.

Chapter 1
22
Partially dehydrogenated Ba(OH)2 catalyzes Michael additions of chalcones with active
methylene compounds such as ethyl malonate, ethyl acetoacetate, acetylacetone,
nitromethane, and acetophenone [148].
Potassium fluoride supported on alumina (KF/Al2O3) is active for the following
Michael additions at room temperature: nitromethane [149], nitroethane, 1,3-diphenyl-2-
propen-l-one[150], and dimenone with 3-buten-2-one (methyl vinyl ketone) [151].
CH3 O C
O
CH CH CH3
C CH3C
H C
CH
O
O CH3
CH3
CH2 C O
O
CH3
C CH
H3C C
CH
O
O CH3
CH3
CH2 C O
O
CH3
(E-MEG) (Z-MEG)
CH3 O C
O
CH CH CH2 CH
CH3
CH2 C O
O
CH3
(MEH)
+
+
(1.9)
For a self-Michael addition of methyl crotonate [Eq.(1.9)], MgO exhibits a higher
activity than the other basic catalysts such as CaO, SrO, BaO, KF/alumina, KX zeolite
[152]. For Michael addition of nitromethane to α,β-unsaturated carbonyl compounds,
KF/alumina and KOH/alumina exhibit high activities, while MgO and CaO exhibit low
activities [140]. The factors to be considered for an efficient catalyst are basic strength of
the site, acidity of reactant, and charge on the carbon atom at β-position to carbonyl group.
Mesoporous silica having N,N-dimethyl-3-aminopropyl groups prepared by a templated
sol-gel method are shown to be a good catalyst for Michael addition reactions of
nitroalkanes to 3-buten-2-one and 2-cyclohexen-1-one. No leaching of the catalytic
component was observed [153].
OC2H5
O
+
O O
OC2H5
O
(1.10)
Na/NaOH/Al2O3 and Zeolite X containing metallic sodium clusters or cesium oxide
were applied in Michael addition of ethyl acrylate and acetone forming 5-oxohexanoic acid
ethyl ester [Eq.(1.10)]. After 24 h at 90 °C, about 50–80% conversions with 60–70%
selectivities were achieved and the catalysts were reusable [154].
Recently, Choudary et al. found that a rehydrated Mg-Al hydrotalcite with an expected
Mg/Al ratio of 2.5, which was obtained by calcination hydrotalcite at 450 °C and then

Chapter 1
23
rehydrating at room temperature under a flow of dry nitrogen gas saturated with water
vapor, was an efficient and very selective catalyst for Michael additions. For most of the
reactions they investigated, more than 88% yield of 1,4-addition products were produced in
2 hours. Moreover, the authors observed that the as synthesized or just calcined
hydrotalcite showed no activity for the reactions and ascribed the excellent catalytic
behavior of the rehydrated hydrotalcite to Brønsted base sites [141].
1.4 Main reactions investigated in this thesis: Michael additions
The main Michael addition reactions investigated in this thesis are shown in Scheme 1.1.
Table 1.6 summarizes the results of the Michael additions using a variety of catalysts in the
literature for these reactions.
O O
O
+O O
O
O
O
solid catalyst
n (n = 1,2)n
room temperature
(n = 1,2)
O
O O1
2a (n = 1), 2b (n = 2)
3
4
5a (n = 1), 5b (n = 2)
Scheme 1.1 Michael additions of 2-methylcyclohexane-1,3-dione (1), 2-acetylcyclopentanone (2a),
and 2-acetylcyclohexanone (2b) to methyl vinyl ketone (3) to obtain Michael adducts: 2-methyl-2-
(3-oxo-butyl)-cyclohexane-1,3-dione (4), 2-acetyl-2-(3-oxo-butyl)-cyclopentanone (5a), and 2-
acetyl-2-(3-oxo-butyl)-cyclohexanone (5b).
As shown in Table 1.6, in most cases, homogeneous catalysts such as KOH and amines
or metal complexes were used in these reactions. In the Michael additions of 2-
methylcyclohexane-1,3-dione to methyl vinyl ketone, at room temperature, using
triethylamine as catalyst and methanol as solvent, only 42% yield of product was obtained.
However, increasing the reaction temperature and using hydroquinone as catalyst, about
100% yield of product was obtained. It is worth noting using acetic acid could also perform
the reaction.

Chapter 1
24
Table 1.6
Catalysts in the literatures used for the Michael additions
Catalyst Solvent Reaction conditions Yield Ref.
Reaction 1: Michael addition of 2-methylcyclohexane-1,3-dione to methyl vinyl ketone
Triethylamine Methanol RT 42% [155]
Et3N Acetonitrile 20 °C, 24 h, 750.06 Torr 67% [156]
KOH Methanol Heating, 4 h - [157]
Hydroquinone H2O 70–80 °C, 4 h ~100% [158]
Acetic acid H2O 75 °C, 1 h - [159]
Reaction 2: Michael addition of 2-acetylcyclopentanone to methyl vinyl ketone
H2O 50 °C, 1 h 97% [146]
Montmorillonite- enwrapped scandium - 50 °C, 1 h 99% [146]
Ni(OAc)2⋅4H2O with ligand CHCl3 23 °C, 16 h 41%a [160]
Reaction 3: Michael addition of 2-acetylcyclohexanone to methyl vinyl ketone
FeCl3 CH2Cl2 25 °C,18 h 79%a [160]
Ni(OAc)2⋅4H2O with ligand CHCl3 23 °C, 16 h 57%a [160]
P-BEMP b THF RT, 23 h 98% [161]
a: with stereoselective b: N-phenyl-tris(dimethylamino)iminophosphorane immobilized on polystyrene resin
Although some catalysts including normal liquid base and metal complexes have been
used in these Michael additions, few solid base catalysts have been involved in the
reactions investigated in this thesis. Solid base catalysts are non-stoichiometric, non-
corrosive, reusable and environmentally benign. Therefore, solid base catalysts are good
alternative for Michael additions.
1.5 Scope and outline of this thesis
The aim of this thesis is to study preparation, characterization and application of oxides
and modified oxide as solid base catalysts and find efficient catalysts for the liquid-phase
Michael additions, meanwhile, to understand how catalytic performances are influenced by
acid-base properties of the catalysts. The catalysts include MgO, potassium-modified ZrO2,
calcined Mg-Al hydrotalcites, and a novel catalyst system Mg(O,F), which was prepared
by sol-gel method for the first time.
Chapter 1
25
In Chapter 2, general experiment and characterization methods are described. In
Chapter 3, MgO catalysts – a common solid base, prepared by different ways are first
involved in the Michael addition. In Chapter 4, potassium-modified ZrO2 are studied in
both gas phase and liquid phase reactions. The leaching test of potassium-modified ZrO2 in
the liquid phase reaction has also been performed. Chapter 5 concentrates on the calcined
Mg-Al hydrotalcites. The Michael additions of 1,3-diones with different pKa values to
methyl vinyl ketone are examined on calcined commercial Mg-Al hydrotalcites including
an Al-rich (Mg/Al = 0.6) sample. Acid-base properties of the catalysts are investigated by
FTIR spectroscopy and microcalorimetry. In Chapter 6, based on the results of former
chapters, a novel catalyst system oxide/hydroxidefluoride Mg(O,F) is prepared by sol-gel
method for the first time and used in the Michael addition. In the final chapter, Chapter 7,
results from the previous chapters are briefly summarized.

Chapter 2
26
CChhaapptteerr 22
EExxppeerriimmeennttaall SSeeccttiioonn

Chapter 2
27
2.1 Chemicals
Inorganic chemicals
AlO(OH) (Pural SB) SASOL Germany GmbH
Magnesium (Mg) Aldrich, small turnings, 99.98%
Magnesium carbonate (MgCO3) Fluka, 99%
Magnesium hydroxide[(Mg(OH)2] Fluka, 99%
Magnesium fluoride (MgF2) Aldrich, 98%
Magnesium nitrate hexahydrate [Mg(NO3)2⋅6H2O] Fluka, 99%
Potassium acetate (KC2H3O2) Merck, 99%
Potassium bromide (KBr) Fluka, 99%
Potassium carbonate (K2CO3) Fluka, 99%
Potassium hydrocarbonate (KHCO3) Merck, 99%
Potassium hydroxide (KOH, pellets) Merck, 85%
Potassium nitrate (KNO3) Fluka, 99%
Carbon dioxide (CO2) Messer Griesheim, 99.995 vol.-%
Hydrofluoric acid (HF) Merck, 40%
Hydrofluoric acid (HF, gas) Solvay Fluor, Germany
Hydrotalcite (Pural MG30, 50, 61, 70) SASOL Germany GmbH
Zirconyl chloride octahydrate (ZrOCl2⋅8H2O) Fluka, 99%
Organic chemicals
1-Butene Aldrich, 99%
Methyl vinyl ketone Aldrich, 99%
2-Methylcyclohexane-1,3-dione Acros, 98%
2-Acetylcyclopentanone Aldrich, 98%
2-Acetylcyclohexanone Acros, 99%
Dimethyl phthalate Acros, 99%
Methanol Aldrich, 99%
2-methoxycarbonylcyclopentanone Acros, 99%
Pyridine Merck, 99%
DMSO-d6 Chemotrade, 99.5%
CDCl3 Chemotrade, 99.5%

Chapter 2
28
2.2 Catalyst preparation
Wet impregnation, thermal decomposition and sol-gel methods are used in the preparation
of the catalysts. The details are shown in the following chapters.
2.3 Characterization
Element analysis
C, N, H contents were determined by elemental analysis (Leco CHNS-932 element
analyzer). K, Zr, Mg, Al contents were determined by ICP-OES (UNICAM 701). F
contents were determined according to Seel by the method described in [162]. 10–20 mg of
sample was dissolved by melting in a mixture of K2CO3/Na2CO3 in a platinum crucible.
The mixture was cooled down to room temperature and dissolved in distilled water. About
1 g of silica and 20 mL of 98% H2SO4 were slowly added to the solution. This solution
was then distilled under a water vapor flow in order to support the formation of H2SiF6 and
its evaporation. After the condensation of H2SiF6, the fluoride content in the aqueous
solution was determined with an F– sensitive electrode.
X-ray diffraction (XRD)
X-ray powder diffraction (XRD) analysis was performed with Cu Kα radiation (λ = 1.5418
Ǻ, 40 kV, and 35 mA) using RD 7 (Rich. Seifert GmbH & Co. KG, Freiberg, Germany)
over the 2θ range from 5 to 65° or 90°.
N2 adsorption/desorption experiments
Nitrogen adsorption/desorption experiments were carried out at 77 K using a
Micromeritics ASAP 2010 system; samples were degassed at 200 °C (or 100 °C) overnight.
The specific surface area was calculated using the BET method. Pore volumes and pore
distributions were calculated using the BJH method.
CO2-TPD
CO2-TPD was used to measure the strength of basic sites. The pelleted sample
(approximately 300 mg, 0.3–0.5 mm diameter fraction) was pretreated in a nickel reactor
under Ar (70 mL/min) at 600 °C for 1 h. The sample was then cooled to 50 °C and exposed
to a stream of Ar and CO2. The sample was flushed for over 1 h at 50 °C to remove

Chapter 2
29
physisorbed CO2, after which, the TPD program (10 °C/min, up to 600 °C, held for 30 min)
was started. The desorption of gas phase CO2 was detected by monitoring the band at 2349
cm–1 with FTIR spectroscopy (FTIR system 2000, Perkin-Elmer).
1H NMR 1H NMR experiments were preformed on a Bruker AVANCE 400 spectrometer.
27Al MAS NMR 27Al MAS NMR experiments were preformed by accumulating 64 spectra on a Bruker
AVANCE 400 spectrometer at a resonance frequency of 104.3 MHz with excitation of π/6
pulses and a repetition time of 5 s. A commercial Bruker 4-mm probe was used to perform
the MAS experiments with a spinning rate of 10 kHz. An aqueous 1 M solution of
aluminum chloride was used as reference for the chemical shifts.
19F MAS NMR
Solid state NMR experiments were done on a Bruker AVANCE 400 spectrometer using a
2.5 mm double-bearing magic angle spinning (MAS) probe with a decoupling channel
optimized for 19F observation. The samples were characterized at room temperature by
measurements of 19F (I = 1/2, 282.4 MHz) nucleus at an ultrafast spinning speed of 30 kHz
to reduce most of the 19F dipolar interactions and obtain high-resolution spectra. A recycle
delay of 10 s and 64 scans were used. 19F chemical shifts were referenced to CFCl3 at 0
ppm and accurate to ±1 ppm.
Thermal analysis
Thermogravimetry (TG) and differential thermal analysis measurements (DTA) were
performed using a NETZSCH STA409C system equipped with a skimmer-coupled mass
spectrometer in air with a heating rate of 10 °C/min from room temperature up to 700 °C
(reference: Al2O3).
FTIR measurements
FTIR spectra of KBr pellets were recorded on a Perkin-Elmer 2000 spectrometer in
transmission mode. About 500 mg of KBr were pressed with 1.5–2.0 mg of the sample,
and then the samples were measured in the regions 400–4000 cm-1.

Chapter 2
30
FTIR studies were also carried out on self-supporting wafers (10–40 mg) in a transmission
IR quartz cell with CaF2 window. Pyridine (Merck, 99%) was freshly distilled and stored
over zeolite A. The samples were pretreated in flowing synthetic air for 1 h and evacuated
for 30 min both at 550 °C. The adsorption of pyridine was then performed at 40 °C with 0–
15 mbar pyridine with subsequent evacuation for 10 min to remove physisorbed pyridine.
The IR spectra were measured every 50 °C during temperature programmed desorption
(TPD) from 100 to 300 °C (heating rate of 10 °C/min) after evacuation for 10 min at each
temperature. In the case of CO2 adsorption (Messer Griesheim, 99.995 vol.-%), the
samples were pretreated under vacuum at 400 °C for 1 h. The measurement conditions
were identical to those used after pyridine adsorption except for the evacuation time during
TPD of 10 min, which was lengthened to 30 min. IR spectra (64 accumulations, resolution
of 2 cm–1) were recorded on a Digilab FTS-60A spectrometer. The spectra were
normalized with the wafer weight; the spectrum measured prior to adsorption was used as
the background spectrum.
Microcalorimetric measurements
Microcalorimetric measurements were carried out in Prof. Auroux’s group (Institut de
Recherches sur la Catalyse, France).
Gas-phase CO2 adsorption
Microcalorimetric data were collected using a heat flow Tian-Calvet-type calorimeter (C
80, Setaram) connected to a volumetric line with an online injection system for pulsing
reactive gases. CO2 (> 99.9%) was pulsed from a storage vessel. After each pulse, the
equilibrium pressure was measured with a differential pressure gauge (Barocel,
Datametrics). The calorimetric and volumetric data (pressure, adsorbed volume, heats of
adsorption, differential and integral enthalpies) were stored and analyzed by a
microcomputer. The sample (70–100 mg) was pretreated under vacuum overnight at 400
°C. The first adsorption cycle was complete after a final equilibrium pressure of 0.6 Torr
was reached at 40 °C; the system was then evacuated to remove the physisorbed CO2, and
a second adsorption cycle was performed. For all the samples measured here, the level of
irreversible adsorption was almost constant above 0.2 Torr. Thus, the amounts of totally
adsorbed (chemisorbed and physisorbed) and irreversibly (chemisorbed) CO2 were
determined from the difference between the isotherms of the first and second cycle of
adsorption, respectively.

Chapter 2
31
Liquid-phase adsorption: benzoic acid in toluene
Liquid-phase experiments were performed on a Titrys calorimeter (Setaram) with a stirring
system. The samples (about 200 mg) were pretreated under vacuum overnight at 400 °C
and then transferred to the calorimetric cell, which contained toluene (1.5 mL). The
reference cell contained the same amount of toluene before injection. At 70 °C, the
solution of benzoic acid in toluene (0.0307 mol/L) was injected stepwise (0.2 mL, injection
rate: 0.05 mL/min) every 2 h. The amount of unreacted benzoic acid was measured by UV
spectrofluorimetry.
X-ray photoelectron spectroscopy (XPS)
In chapter 5, X-ray photoelectron spectroscopy (XPS) was preformed on VG ESCALAB
220 iXL spectrometer with a Mg Kα source and a monochromated Al Kα source,
respectively [measurements were carried out in Institut für Angewandte Chemie Berlin-
Adlershof e.V. (ACA)]. In chapter 6, Narrow scan X-ray photoelectron spectra (XPS) were
acquired using Kratos Axisultra electron spectrometer with monochromatised Al Kα
excitation (hν = 1486.6 eV) operated at 75 W and in CAE 20mode [measurements were
carried out in Bundesanstalt fuer Materialforschung und -pruefung (BAM), Berlin]. Before
recording the spectra the samples were stored overnight in the Extended PrepLock
chamber in a vacuum better than 10-6 mbar in order to degas. The vacuum in the
spectrometer was better than 10-8 mbar. Binding energy data were referenced to the
aliphatic C 1s peak at 284.8 eV. Charge neutralization system was used. The spectrometer
energy scale was calibrated following ISO 15427.
Transmission electron microscopy (TEM)
Transmission electron microscopy (TEM) was preformed on Hitachi H-8110 (200 kV,
LaB6 gun) with energy dispersive X-ray detector.
2.4 Reaction
Gas-phase reaction: Double-bond isomerization of 1-butene
The isomerization of 1-butene was performed in a down-flow, fixed-bed glass reactor.
Equal volumes of the pelleted, calcined catalyst (about 300–450 mg, 0.3–0.5 mm diameter
fraction) were exposed to the feed stream mixture of nitrogen (10 mL/min) and 1-butene
(0.6 mL/min) at 150 °C. Prior to the reaction, the catalyst was pretreated in N2 at 600 °C

Chapter 2
32
for 2 h. On-line gas chromatography (Shimadzu GC-17A, FID, quartz capillary: PONA
(methylsiloxane), 50 m, 0.2 mm × 0.5 µm) was used to determine the composition of the
reaction mixture of 1-butene and cis/trans-2-butene after a time-on-stream (TOS) of 10,
30, 60 and 90 min. Due to 100% product selectivity, the reaction conversion is given by
the yield of 2-butene product. Product yields were normalized by the mass of the catalyst
used at 30 min in order to compare the catalysts’ results with each other.
Liquid-phase Michael additions
Generally, the reaction was carried out in a 50-mL round-bottom flask at room temperature.
Methyl vinyl ketone (22.5 mmol, Aldrich, 99%), a CH-acid compound (15.0 mmol) [2-
methylcyclohexane-1,3-dione (Acros, 98%, slightly soluble in methanol), 2-
acetylcyclopentanone (Aldrich, 98%) or 2-acetylcyclohexanone (Aldrich, 97%)], dimethyl
phthalate (3.75 mmol, Acros, 99%, internal NMR standard), and the solvent, methanol (10
mL, Aldrich, 99%), were stirred together for 30 min to saturate the mixture before the
powdered catalyst was added. In general, a catalyst weight of 0.225 g was used. The
reaction mixture (0.1 to 0.3 mL) was sampled at certain times and centrifuged. The
separated solution was then concentrated on a rotary evaporator to remove solvent and
unreacted methyl vinyl ketone. The yield of the target product was analyzed by 1H NMR
spectroscopy (solvent: DMSO-d6 or CDCl3) using the integrals of the CH3 signals of the
Michael adducts: 2-methyl-2-(3-oxo-butyl)-cyclohexane-1,3-dione (1.11 and 2.04 ppm,
DMSO-d6), 2-acetyl-2-(3-oxo-butyl)-cyclopentanone (2.14 and 2.09 ppm, CDCl3), 2-
acetyl-2-(3-oxo-butyl)-cyclohexanone (2.08 ppm, CDCl3, only one CH3-signal used
because the other overlapped with that of 1,3-dione reagent), 2-oxo-1-(3-oxo-butyl)-
cyclopentanecarboxylic acid methyl ester (2.11 and 3.68 ppm) and dimethyl phthalate
(3.83 ppm in DMSO-d6 and 3.88 ppm in CDCl3 ).

Chapter 3
33
CChhaapptteerr 33
MMggOO aass ssoolliidd bbaassee ccaattaallyyssttss
iinn MMiicchhaaeell aaddddiittiioonn

Chapter 3
34
3.1 Introduction
Alkaline earth oxides are generally used as solid base catalysts. Among them, MgO is
the most widely used. MgO has been extensively studied as a promising catalyst
[13,163,164,165], modifier or promoter [166,167,168] and catalyst support [169,170,171]
in heterogeneous catalysis. MgO exhibits high activities in numerous base-catalyzed
organic reactions, such as self-Michael addition to form methyl diesters [163], the
Tishchenko reactions [164] , the Meerwein-Ponndorf-Verley reactions [165] , dimerisation
of ethanol to butanol [172], and self-condensation of propanol [173].
The basicity of MgO has been studied by FTIR, CO2-TPD. Normally, MgO acts as
strong base catalyst. Coluccia and Tench [174] proposed a surface model for MgO (Fig.
3.1). There are several types of Mg–O ion pairs with different coordination numbers. Ion
pairs of low coordination numbers exist at corners, edges, or high Miller index surfaces of
the (100) plane [175]. Different basic sites generated by increasing the pre-treatment
temperature appear to correspond to the ion pairs of different coordination numbers.
However, the correspondence between the catalytically active sites for different reaction
types and the coordination number of the ion pairs is not definite yet [13].
Fig. 3.1 Ions in low coordination on the surface of MgO [174]
MgO can be prepared by simple thermal decomposition of magnesium compounds such
as Mg(OH)2, MgCO3, Mg(NO3)2 under controlled conditions. However, the pretreatment
time, calcination temperature, gas environment can influent the properties of the resulting
MgO catalysts, and therefore decide the catalytic behaviour. Choudhary et al. studied the
influence of precursors used in preparation of MgO and its surface properties and catalytic

Chapter 3
35
activity in oxidative coupling of methane and found MgO obtained from magnesium
carbonate and magnesium acetate were comparable and were much better than MgO
obtained from the other precursors [176]. However, Aramendia et al. found in Meerwein-
Ponndorf-Verley reaction of cyclohexanone with isopropyl alcohol, the most active
catalyst was the solid prepared by rehydration and subsequent calcination of a magnesium
oxide that was previously obtained from commercially available magnesium hydroxide
[165]. Nanoscale and high surface area MgO can also be prepared from Mg(OCH3)2 by use
of autoclave hypercritical drying (aerogel) procedure [177]. Meanwhile, aerogel prepared
MgO showed higher reactivity than commercial and conventionally prepared MgO in
Wadsworth–Emmons reactions [178]. However, the same MgO was poorer catalyst in
toluene benzylation by benzyl chloride [179]. Therefore, for different reactions, various
MgO catalysts may have quite different catalytic behaviors.
MgO has been proved as a good catalyst in a self-Michael addition of methyl crotonate
[152], but not in the Michael additions of nitromethane to α,β-unsaturated carbonyl
compounds [140]. The factors to be considered MgO as an efficient catalyst for Michael
addition depend on the strength of the basic sites, the acidity of reactant, and the charge on
the carbon atom at β-position to carbonyl group. Because of the importance of MgO as a
solid base catalyst, in this chapter, various MgO prepared from different precursors were
first tested in the liquid-phase Michael addition of 2-methylcyclohexane-1,3-dione to
methyl vinyl ketone to get the preliminary result.
3.2 Preparation and characterization of MgO prepared by different
methods
Table 3.1 shows the preparation and characteristics of the MgO catalysts prepared from
different precursors. In most cases, simple thermal decomposition of various precursors at
different temperatures was used to prepare MgO. All the calcination time is 4 h. As shown
in Table 3.1, MgO-1 was prepared by calcination of Mg(NO3)2⋅6H2O at 600 °C in air, and
very low surface area, 1.8 m2/g, was obtained. MgO-2 and MgO-3 were obtained by
thermal decomposition of MgCO3 at 600 and 500 °C in air, respectively. MgO-3 had a
higher surface area (106.6 m2/g) than MgO-2 (76.6 m2/g) because a lower calcination
temperature was used. MgO-4 was obtained by calcination at 600 °C of dried Mg(OH)2,
which was prepared by precipitation of MgCl2 using KOH and dried at 110 °C. MgO-4 had
a surface area of 76.7 m2/g. MgO-5 to MgO-7 were prepared by calcination of dried

Chapter 3
36
Mg(OH)2 (the hydroxide was precipitated from Mg(NO3)2 solution with KOH and dried at
110 °C) at 600, 500, 400 °C, respectively. The surface area of these three MgO increased
with decreasing calcination temperature. This is due to an increase in the crystal size
caused by sintering of MgO at the higher temperatures.
Table 3.1
Preparation and characteristics of MgO catalysts
Sample Precursor Preparation SBET
(m2/g)
VPa
(cm3/g)
dpb
(Å)
MgO-1 Mg(NO3)2 calcination at 600 °C in air 1.8 0.017 381
MgO-2 MgCO3 calcination at 600 °C in air 76.6 0.337 175
MgO-3 MgCO3 calcination at 500 °C in air 106.4 0.321 120
MgO-4 MgCl2 precipitation c and calcination at 600 °C in air 76.7 0.971 508
MgO-5 Mg(NO3)2 precipitation c and calcination at 600 °C in air 75.0 0.960 258
MgO-6 Mg(NO3)2 precipitation c and calcination at 500 °C in air 116.5 1.095 375
MgO-7 Mg(NO3)2 precipitation c and calcination at 400 °C in air 170.2 1.074 252
Mg(OH)2 Mg(NO3)2 precipitation and dried at 110 °C in air - - -
a: BJH desorption cumulative pore volume of pores between 17.0 and 3000.0 Å diameter b: Average pore diameter by BET c: Mg(OH)2 was dried at 110 °C in air before calcination
5 10 15 20 25 30 35 40 45 50 55 60 65
Inte
nsity
100
0 ct
s/s
hg
fedcb
X 0.2a
2θ [°]
PDF No. 45-946 MgO PDF No. 44-1482 Mg(OH)
2
Fig. 3.2 XRD patterns of MgO. MgO-1 (a), MgO-2 (b), MgO-3 (c), MgO-4 (d), MgO-5 (e), MgO-
6 (f), MgO-7 (g), Mg(OH)2 (h)

Chapter 3
37
0
200
400
600
800
0
200
400
600
800
0
200
400
600
800
0.0 0.2 0.4 0.6 0.8 1.0
0.0 0.2 0.4 0.6 0.8 1.00
200
400
600
800
0.0 0.2 0.4 0.6 0.8 1.0
0
2
4
6
8
10
12
Vol
ume
adso
rbed
(cm
³g-1 S
TP)
Relative Pressure (P/P0)
MgO-1
0.5 0.6 0.7 0.8 0.9 1.00
50
100
150
200
250
Vol
ume
adso
rbed
(cm
³g-1 S
TP)
Relative Pressure (P/P0)
MgO-2
Adsorption Desorption
0.4 0.5 0.6 0.7 0.8 0.9 1.00
50
100
150
200
250
Vol
ume
adso
rbed
(cm
³g-1 S
TP)
Relative Pressure (P/P0)
MgO-3
0.80 0.85 0.90 0.95 1.000
100
200
300
400
500
600
700
Relative Pressure (P/P0)
Vol
ume
adso
rbed
(cm
³g-1 S
TP)
MgO-4
0.80 0.85 0.90 0.95 1.000
100
200
300
400
500
600
700
Relative Pressure (P/P0)
Vol
ume
adso
rbed
(cm
³g-1 S
TP)
MgO-5
0.80 0.85 0.90 0.95 1.000
200
400
600
800
Relative Pressure (P/P0)
Vol
ume
adso
rbed
(cm
³g-1 S
TP)
MgO-6
0.80 0.85 0.90 0.95 1.000
200
400
600
800
Relative Pressure (P/P0)
Vol
ume
adso
rbed
(cm
³g-1 S
TP)
MgO-7
Vol
ume a
dsor
bed
(cm
³g-1 S
TP)
Relative Pressure (P/P0)
Fig. 3.3 N2 adsorption/desorption isotherms of MgO catalysts
XRD patterns of MgO catalysts are shown in Fig. 3.2. All the MgO catalysts are pure
phases of periclase MgO (PDF No.45-946) that exhibits the three characteristic peaks at
2θ values of 37.0 (1 1 1), 43.0 (2 0 0) and 62.4 (2 2 0) degrees. The hydroxide (Fig. 3.1h)
precipitated from Mg(NO3)2 exhibited a brucite-like Mg(OH)2 structure (PDF No.44-1482).
If the strongest peak at around 43.0 degree for periclase is used as a reference for
crystallinity, then MgO-1 with the smallest surface area is the most crystalline sample.

Chapter 3
38
MgO-3 is the least crystalline. From MgO-5 to MgO-7, with the decrease of the calcination
temperature, the crystallinity decreases.
The N2 adsorption/desorption isotherms of MgO catalysts are shown in Fig. 3.3. Except
of the MgO calcined from the precursor of Mg(NO3)2⋅6H2O, all other MgO exhibited
similar isotherms (type IV). According to IUPAC classification, they are typical of
mesoporous materials [180]. The shape of isotherms and the hysteresis loop can give the
information about the pore structure. The desorption isotherms of MgO-2 and MgO-3
followed different paths than the adsorption isotherm down to a P/P0 value of 0.5 and 0.4,
respectively. The hysteresis loop of MgO-3–MgO-7 closed at P/P0 values of ca.0.8. These
results indicated that MgO-2 and MgO-3 had smaller mesoporous than MgO-3–MgO-7.
Based on the shape of hysteresis loops, all MgO have ‘ink-bottle’ pores, spheroidal cavities
or volids between close-packed spherical-like particles.
3.3 Catalytic behavior of MgO catalysts
O
O
O
+
O
O
O
O
HO
1 2
3
4
O
O
OHO
O O
OCH3
5
6
(m/z=196)
(m/z=196)(m/z=196)
(m/z=210)
Scheme 3.1 Possible reaction procedure in the reaction of 2-methylcyclohexane-1,3-dione (1) with
methyl vinyl ketone (2) using MgO as catalyst
When MgO was used as catalyst in Michael addition of 2-methylcyclohexane-1,3-dione
to methyl vinyl ketone, in the 1H NMR spectra of the reaction products, besides the signals
of expected Michael adduct 2-(3-oxobutyl)-2-methylcyclohexane-1,3-dione (single peaks
at 1.11 and 2.04 ppm, DMSO-d6), additional main CH3 signals at 0.97 and 1.23 ppm, were
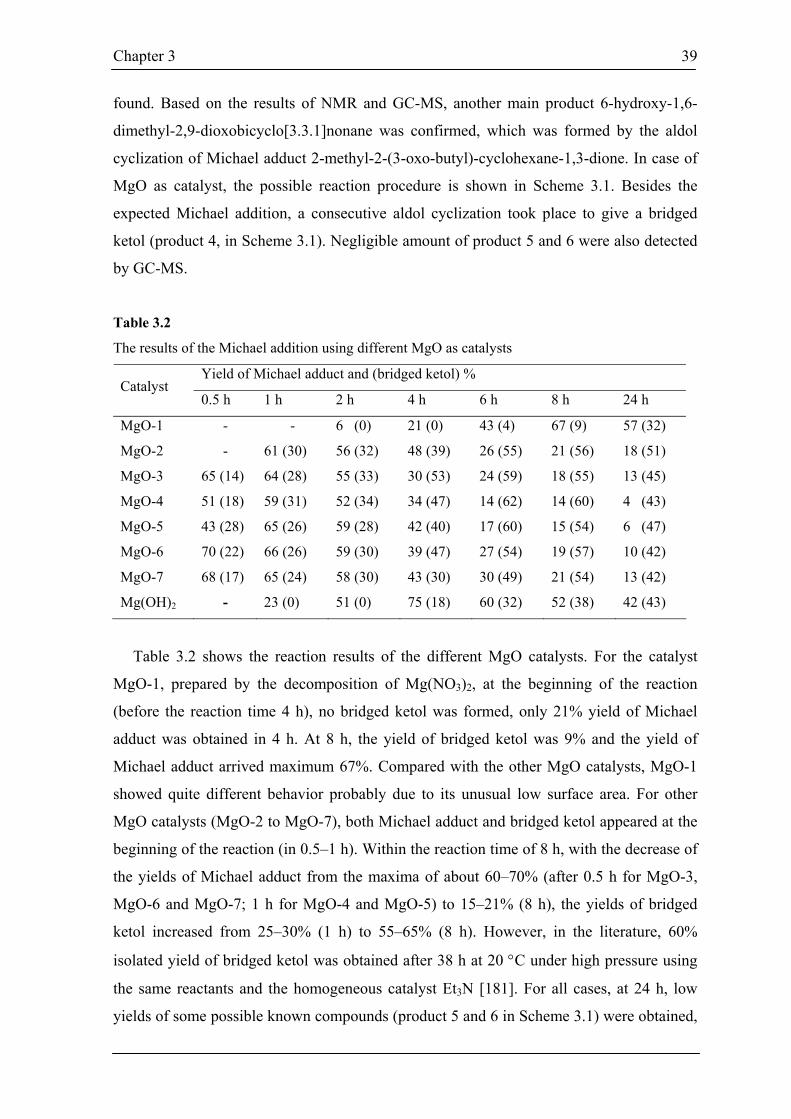
Chapter 3
39
found. Based on the results of NMR and GC-MS, another main product 6-hydroxy-1,6-
dimethyl-2,9-dioxobicyclo[3.3.1]nonane was confirmed, which was formed by the aldol
cyclization of Michael adduct 2-methyl-2-(3-oxo-butyl)-cyclohexane-1,3-dione. In case of
MgO as catalyst, the possible reaction procedure is shown in Scheme 3.1. Besides the
expected Michael addition, a consecutive aldol cyclization took place to give a bridged
ketol (product 4, in Scheme 3.1). Negligible amount of product 5 and 6 were also detected
by GC-MS.
Table 3.2
The results of the Michael addition using different MgO as catalysts
Yield of Michael adduct and (bridged ketol) % Catalyst
0.5 h 1 h 2 h 4 h 6 h 8 h 24 h
MgO-1 - - 6 (0) 21 (0) 43 (4) 67 (9) 57 (32)
MgO-2 - 61 (30) 56 (32) 48 (39) 26 (55) 21 (56) 18 (51)
MgO-3 65 (14) 64 (28) 55 (33) 30 (53) 24 (59) 18 (55) 13 (45)
MgO-4 51 (18) 59 (31) 52 (34) 34 (47) 14 (62) 14 (60) 4 (43)
MgO-5 43 (28) 65 (26) 59 (28) 42 (40) 17 (60) 15 (54) 6 (47)
MgO-6 70 (22) 66 (26) 59 (30) 39 (47) 27 (54) 19 (57) 10 (42)
MgO-7 68 (17) 65 (24) 58 (30) 43 (30) 30 (49) 21 (54) 13 (42)
Mg(OH)2 - 23 (0) 51 (0) 75 (18) 60 (32) 52 (38) 42 (43)
Table 3.2 shows the reaction results of the different MgO catalysts. For the catalyst
MgO-1, prepared by the decomposition of Mg(NO3)2, at the beginning of the reaction
(before the reaction time 4 h), no bridged ketol was formed, only 21% yield of Michael
adduct was obtained in 4 h. At 8 h, the yield of bridged ketol was 9% and the yield of
Michael adduct arrived maximum 67%. Compared with the other MgO catalysts, MgO-1
showed quite different behavior probably due to its unusual low surface area. For other
MgO catalysts (MgO-2 to MgO-7), both Michael adduct and bridged ketol appeared at the
beginning of the reaction (in 0.5–1 h). Within the reaction time of 8 h, with the decrease of
the yields of Michael adduct from the maxima of about 60–70% (after 0.5 h for MgO-3,
MgO-6 and MgO-7; 1 h for MgO-4 and MgO-5) to 15–21% (8 h), the yields of bridged
ketol increased from 25–30% (1 h) to 55–65% (8 h). However, in the literature, 60%
isolated yield of bridged ketol was obtained after 38 h at 20 °C under high pressure using
the same reactants and the homogeneous catalyst Et3N [181]. For all cases, at 24 h, low
yields of some possible known compounds (product 5 and 6 in Scheme 3.1) were obtained,

Chapter 3
40
which could be the reason for the decrease of both Michael adduct and bridged ketol. In
case of Mg(OH)2 as catalyst, within the reaction time of 2 h, 51% yield of Michael adduct
with 100% selectivity was obtained. The Michael adduct yield went through a maximum of
over 75% yield after 4 h but did not decrease as drastically as in the case of MgO (final
yield : 42%, not less than 20%). The different behavior of Mg(OH)2 and MgO may
ascribed to the different type of base sites on the surface. For the different MgO catalysts,
the catalytic performances have slight difference. Many parameters, like the nature of the
base sites on the MgO surface, the surface area of MgO, the crystallite size of MgO, can
affect the reaction results. Since MgO did not catalyze the Michael addition selectively, the
discussion here will not go further to point out what is the exact reason for the different
catalytic behavior from one MgO catalyst to another. However, the behavior of MgO will
be compared and discussed with other catalysts systems in the following chapter based on
the characterization of its basic properties.
Here, the Michael adduct is an important precursor of Wieland-Miescher keton [182],
which is particularly useful for the synthesis of biologically active compounds [183,184].
However, although bridged ketols are not normally the desired product of the reaction,
they are proven to be versatile synthetic intermediates since they can be readily dehydrated
to the bicyclic enones or converted to the fused Robinson products under mild acid
conditions. Moreover, the bridgehead or angular carbomethoxy of the bicyclic or fused-
ring compound, respectively, expands the possibilities for further synthetic transformations
at this position [181]. In our case, by careful selection of the reaction time and catalyst, the
reaction can, to an extent, be controlled to give high yields of the Michael adduct 2-(γ-
oxobutyl)-2-methyl-cyclohexan-1,3-dione or the bridged ketol 6-hydroxy-1,6-dimethyl-
2,9-dioxobicyclo [3.3.1]nonane, respectively.
In summary, MgO can not catalyze the Michael addition of 2-methylcyclohexane-1,3-
dione to methyl vinyl ketone selectively. However, either Michael adduct or bicyclic ketol
can be selected to be the dominant product by choosing the MgO catalyst and reaction time.
Moreover, two-step reaction can be performed in one-pot system.
3.4 Conclusions
MgO prepared by different methods or conditions have various textural properties.
MgO with surface area from 1.8 to 170.2 m2/g and pore volume from 0.01 to 1.0 cm3/g can
be prepared. MgO-1 prepared by calcination of Mg(NO3)2⋅6H2O at 600 °C in air has very

Chapter 3
41
low surface area of 1.8 m2/g; however, MgO-7 prepared by calcination of dried Mg(OH)2
at 400 °C has a high surface area of 170.2 m2/g.
All the MgO catalysts can not catalyze the Michael addition of 2-methylcyclohexane-
1,3-dione to methyl vinyl ketone selectively because a consecutive aldol cyclitzation
occurred. Michael adduct or bicyclic ketol can be selected to be the dominant product by
choosing the MgO catalyst and the reaction time. The catalytic behavior of MgO in
Michael addition is ascribed to its strong basicity.
Chapter 4
42
CChhaapptteerr 44
CChhaarraacctteerriizzaattiioonn aanndd ccaattaallyyttiicc bbeehhaavviioorr ooff
ppoottaassssiiuumm--mmooddiiffiieedd ZZrrOO22 bbaassee ccaattaallyyssttss
Chapter 4
43
4.1 Introduction
ZrO2 has attracted more and more attention as a promising catalyst and catalyst support
because of its high thermal stability, amphoteric nature, and redox properties [185]. Until
now, ZrO2 has been transformed into strong, solid acid catalysts by modification with
sulfate [186,187,188,189], WO3 [190], MoO3 [191], or B2O3 [192,193]. These ZrO2-based
solid acid catalysts show high activity and selectivity in many reactions. However, few
efforts have been made to turn ZrO2 into a base catalyst by taking advantage of its natural
basicity, although several studies have been done on a highly effective alkali-modified
ZrO2 catalyst for the oxidative coupling of methane [194,195]. In general, it is common to
prepare base catalysts by modifying or supporting alkali metal oxides on various supports
[13]. Various alkali metal oxides have been loaded on different supports, such as
magnesium oxide [196], zeolites [22,25,40], alumina [117,118,197], silica [198], by the
decomposition of alkali compounds. These catalysts have proved to be excellent solid base
catalysts for numerous vapor-phase probe reactions, such as isopropanol dehydrogenation
[22,197,198], the isomerization of 1-butene [26, 199 ] and cis-but-2-ene [119], the
methylation of phenol [198], toluene [200], and catechol [201] with methanol. However,
alkali metal oxides supported catalysts used in liquid phase base-catalyzed reactions have
been investigated less. It is not clear whether this kind of catalyst is a real heterogeneous
catalyst in liquid phase reactions. Recently, Wang et al. [119] used a dry impregnation
process to prepare KNO3/ZrO2 superbases, which possessed a base strength of H-= 27.0
and were very active for cis-but-2-ene isomerization under mild conditions. In this chapter,
potassium-modified ZrO2 were prepared by the calcination of hydrous zirconia and
anhydrous zirconia after impregnation with potassium compounds. The catalytic activity of
this system was studied in the vapor-phase isomerization of 1-butene and in the liquid-
phase Michael addition of 2-methylcyclohexane-1,3-dione to methyl vinyl ketone [202].
4.2 Preparation and characterization of potassium-modified ZrO2
Catalyst preparation
Hydrous zirconia, ZrO(OH)2·aq, was prepared from ZrOCl2⋅8H2O (Fluka, 99%). Pure
anhydrous ZrO2 was obtained by calcination of hydrous zirconia at 600 °C in air for 4h.
The supported catalysts were prepared by wet impregnation of ZrO(OH)2 (ZRH samples)
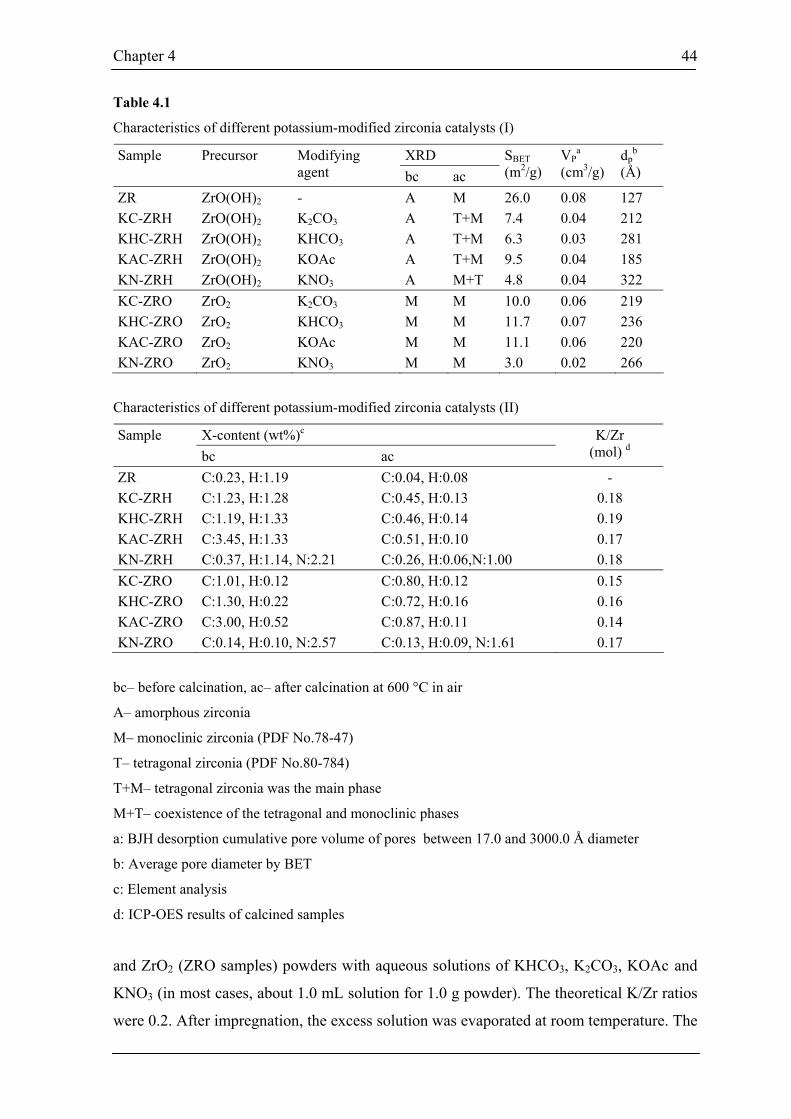
Chapter 4
44
Table 4.1
Characteristics of different potassium-modified zirconia catalysts (I)
XRD Sample Precursor Modifying agent bc ac
SBET (m2/g)
VPa
(cm3/g) dp
b
(Å)
ZR ZrO(OH)2 - A M 26.0 0.08 127 KC-ZRH ZrO(OH)2 K2CO3 A T+M 7.4 0.04 212 KHC-ZRH ZrO(OH)2 KHCO3 A T+M 6.3 0.03 281 KAC-ZRH ZrO(OH)2 KOAc A T+M 9.5 0.04 185 KN-ZRH ZrO(OH)2 KNO3 A M+T 4.8 0.04 322 KC-ZRO ZrO2 K2CO3 M M 10.0 0.06 219 KHC-ZRO ZrO2 KHCO3 M M 11.7 0.07 236 KAC-ZRO ZrO2 KOAc M M 11.1 0.06 220 KN-ZRO ZrO2 KNO3 M M 3.0 0.02 266
Characteristics of different potassium-modified zirconia catalysts (II)
X-content (wt%)c Sample bc ac
K/Zr (mol) d
ZR C:0.23, H:1.19 C:0.04, H:0.08 - KC-ZRH C:1.23, H:1.28 C:0.45, H:0.13 0.18 KHC-ZRH C:1.19, H:1.33 C:0.46, H:0.14 0.19 KAC-ZRH C:3.45, H:1.33 C:0.51, H:0.10 0.17 KN-ZRH C:0.37, H:1.14, N:2.21 C:0.26, H:0.06,N:1.00 0.18 KC-ZRO C:1.01, H:0.12 C:0.80, H:0.12 0.15 KHC-ZRO C:1.30, H:0.22 C:0.72, H:0.16 0.16 KAC-ZRO C:3.00, H:0.52 C:0.87, H:0.11 0.14 KN-ZRO C:0.14, H:0.10, N:2.57 C:0.13, H:0.09, N:1.61 0.17
bc– before calcination, ac– after calcination at 600 °C in air
A– amorphous zirconia
M– monoclinic zirconia (PDF No.78-47)
T– tetragonal zirconia (PDF No.80-784)
T+M– tetragonal zirconia was the main phase
M+T– coexistence of the tetragonal and monoclinic phases
a: BJH desorption cumulative pore volume of pores between 17.0 and 3000.0 Å diameter
b: Average pore diameter by BET
c: Element analysis
d: ICP-OES results of calcined samples
and ZrO2 (ZRO samples) powders with aqueous solutions of KHCO3, K2CO3, KOAc and
KNO3 (in most cases, about 1.0 mL solution for 1.0 g powder). The theoretical K/Zr ratios
were 0.2. After impregnation, the excess solution was evaporated at room temperature. The

Chapter 4
45
samples were then dried at 110 °C (for the samples modified with KHCO3, 80 °C was used
instead), calcined at 600 °C in flowing air for 4h, and stored in closed containers until used.
Characterization of potassium-modified ZrO2
Table 4.1 gives the notations and characteristics of the samples. Fig. 4.1 shows the
XRD patterns of some catalysts after calcination. Amorphous, hydrous zirconia formed
monoclinic ZrO2 after calcination at 600 °C (Fig. 4.1: a). However, after the modification
of hydrous zirconia using C-containing potassium compounds mentioned above and
calcination, the main phase of KC-ZRH, KHC-ZRH and KAC-ZRH (Fig. 4.1: b) was
metastable, tetragonal ZrO2. Both the tetragonal and monoclinic phases were found in KN-
ZRH (Fig. 4.1: c). It has been postulated that the K+ ions are incorporated in the vacant
sites on the surface of hydrous zirconia and stabilize the tetragonal ZrO2 phase [119,203].
All of the ZRH samples, except for KN-ZRH, also have sharper and more intense XRD
peaks than those of the pure ZrO2 and the ZRO samples; this indicates higher sample
crystallinity of the ZRH samples. Almost no phase or intensity change was found in the
XRD patterns of the impregnated, anhydrous ZrO2 samples after modification with
potassium compounds (Fig. 4.1: d, KAC-ZRO).
5 10 15 20 25 30 35 40 45 50 55 60 65
d
c
b
a
Inte
nsity
500
cts.
/s
2θ [°]
PDF No. 78-47 monoclinic zirconia PDF No. 80-784 tetragonal zirconia
Fig. 4.1 XRD patterns of the catalysts after calcinations, a) ZR; b) KAC-ZRH; c) KN-ZRH; d)
KAC-ZRO

Chapter 4
46
The N2 adsorption/desorption isotherms of all the samples (not shown) are of Type IV,
according to IUPAC classification. The hysteresis loops, due to the capillary condensation
associated with large mesopores, can be ascribed to the H2 Type [204]. There is not much
difference between the adsorption/desorption isotherms of pure ZrO2 and modified ZrO2,
but the specific surface areas of the modified samples are much lower than that of ZrO2,
whereas the pore volumes are only slightly smaller (Table 4.1). The decrease in surface
area may be attributed to 1) rearrangements during the formation of the networks, 2)
surface covering by potassium oxide produced at higher temperatures, or 3) the presence of
bulk potassium compounds on the surface. On the other hand, the average pore diameters
of the samples were somewhat larger (Table 4.1). The mesopore size distributions of some
samples are shown in Fig. 4.3. The curves all show sharp maxima with narrow
distributions. The pore diameters of pure anhydrous ZrO2 and the modified samples were
centered at about 70 and 100-180 Å, respectively (Fig. 4.2). Except for the KNO3-modified
samples with the lowest pore volume, the anhydrous ZrO2 supported samples (KC-ZRO,
KHC-ZRO, and KAC-ZRO) had pores with higher pore volumes than that of the hydrous
ZrO2 supported samples, KC-ZRH, KHC-ZRH, and KAC-ZRH. The carbon and nitrogen
contents of the calcined samples indicate that the potassium compounds have not
decomposed completely, which may be one reason for the decrease in surface area. The
K/Zr mole ratios of calcined samples measured by ICP-OES were close to the nominal
value of 0.2 (Table 4.1).
30 100 1000
0,00
0,05
0,10
0,15
0,20
0,25
0,30
0,35
0,40
ZR KHC-ZRH KHC-ZRO KAC-ZRH KAC-ZRO KN-ZRH KN-ZRO
Pore
vol
ume
dV
/dlo
g(D
) (cm
³g-1Å
-1)
Pore diameter (Å)
Fig. 4.2 Pore size distributions of the indicated catalysts

Chapter 4
47
TG-DTG-DTA was used to investigate the decompositon of potassium compounds on
ZrO2. The profiles of KHC-ZRH and KHC-ZRO are shown in Fig. 4.3. From the profiles
of KHC-ZRH, a broad, endothermic effect, two DTG peaks, and 13% weight loss were
observed from 100 to 400 °C, which can be ascribed to the evolution of water in hydrous
zirconia and the decomposition of KHCO3. This was comfirmed by an increase in the ionic
currents of m/z =18 (H2O+) and 44 (CO2+) with maxima at around 135 and 228 °C. A sharp
exothermic effect at about 516 °C was observed without weight loss for the crystallization
of amorphous ZrO2.
0.20.40.60.81.01.21.41.61.82.0
Ion Current *10-10 /A
100 200 300 400 500 600 700Temperature /°C
-40
-30
-20
-10
0
10
DTA /uV
85
90
95
100
TG /%
-0.60
-0.50
-0.40
-0.30
-0.20
-0.10
0
0.10
DTG /(%/min)
TGDTG
DTA
KHC-ZRHm18
m44
135 228 492
516
-14.40
↑ exo
-40
-30
-20
-10
0
10
DTA /uV
85
90
95
100
TG /%
-0.60
-0.50
-0.40
-0.30
-0.20
-0.10
0
0.10
DTG /(%/min)
100 200 300 400 500 600 700Temperature /°C
0.2000.3000.4000.5000.6000.7000.8000.9001.0001.100
Ion Current *10-10 /A
TGDTG
DTA
m18
m44
KHC-ZRO-3.36
-0.96133 159
↑ exo
Fig. 4.3 TG-DTG-DTA profiles of KHC-ZRH (above) and KHC-ZRO (below) dried at 80 °C
before calcination

Chapter 4
48
The exothermic effect for the crystallization of pure ZrO2 is at about 410 °C in DTA
curve [189]. Thus, the introduction of potassium ions in ZrO2 shifts the crystallization
temperature of ZrO2 to higher temperatures. The sulfation of zirconia has the same effect
[189]. In the measurement of KHC-ZRO, two endothermic effects and corresponding DTG
peaks at around 133 and 159 °C clearly indicate the decomposition of KHCO3 on ZrO2
with about 3% weight loss between 100 and 200 °C, which is different from that of KHC-
ZRH. The carbon contents of KHC-ZRH and KHC-ZRO after thermal analysis up to 700
°C were 0.33% and 0.63%, respectively, which corresponds with the elemental analysis of
these samples after calcination at 600 °C (0.46 and 0.72%, respectively, in Table 4.1).
These results indicate that the loaded potassium compounds do not completely decompose;
this is also reported by Wang et al. for KNO3/ZrO2. For a sample with 20% KNO3 on ZrO2,
the percentage of decomposed KNO3 was only 7.6% [119]. This and our results could be
explained by the formation of layers of thermally stable potassium compounds on the
zirconia surface.
0 1000 2000 3000 4000 50000
100
200
300
400
500
600
CO2 d
esor
ptio
n: IR
inte
nsity
KC-ZRH
KHC-ZRHKC-ZRO
KHC-ZROZR
Time (seconds)
Te
mpe
ratu
re(o C)
isothermal
Fig. 4.4 Temperature-programmed desorption of CO2
The CO2-TPD results (Fig. 4.4) show that pure ZrO2 has basic sites indicated by two
desorption maxima at about 135 and 335 °C. The potassium-modified zirconia samples,
like ZrO2, show an initial desorption maximum at around 140 °C. A second step of CO2
desorption at higher temperatures starts at around 400 °C for KC-ZRH and KHC-ZRH, but
at a lower temperature, 250 instead of 400 °C, for the ZRO samples. This increase in the

Chapter 4
49
CO2 profile intensity continues up to 600 °C and lasts for 5–10 min under isothermal
conditions. These results suggest that modified anhydrous zirconia (ZRO samples) has a
wider distribution of basic sites than modified hydrous zirconia (ZRH samples). The
second step of desorption of the modified samples indicates their stronger basic sites in
comparison to those of ZrO2.
CO2 desorption at higher temperatures could be attributed to strong basic sites formed
by K2O extra-fine particles on the surfaces of ZrO2 during decomposition. This has been
reported by Zhu et al. [197]. He also excluded the possibility of some unusual oxides of
potassium as the main basic sites on KNO3/Al2O3. Hathaway et al. [22,23] and Kim et al.
[40] also suggested in the case of Cs-modified zeolites that the decomposition product,
cesium oxide, forms the active sites.
4.3 Catalytic behavior of potassium-modified ZrO2
Table 4.2
The results of double-bond isomerization of 1-butene at 150 °C over calcined catalysts
Yield of 2-butene (%) Catalyst Weight
(mg) 10 min 30 min 60 min 90 min
Yield/mass (%/mg) at
30 min
Average cis/trans ratios
ZR 330 24.1 21.7 19.1 16.7 0.066 4.0 KC-ZRH 395 69.7 54.2 42.4 35.2 0.137 5.3 KC-ZRHa 395 75.2 62.9 49.6 40.7 0.159 5.1 KHC-ZRH 361 62.7 44.3 30.2 22.8 0.123 5.3 KAC-ZRH 411 74.1 63.8 52.1 44.7 0.155 5.0 KAC-ZRHa 411 63.2 58.5 50.2 44.8 0.142 5.2 KN-ZRH 379 9.1 6.8 5.6 4.7 0.018 3.9 KC-ZRO 380 51.9 40.8 30.8 25.1 0.107 5.1 KHC-ZRO 350 53.1 36.8 25.9 21.0 0.105 5.3 KAC-ZRO 316 56.5 41.3 29.6 23.4 0.131 5.0 KN-ZRO 329 4.1 3.6 2.7 2.1 0.011 2.5 a: second run (the same reaction procedure was repeated again)
Both acid and base catalysts can catalyze the double-bond isomerization of 1-butene.
Generally, the cis/trans ratio of 2-butene produced by isomerization of 1-butene is higher
for base-catalyzed reactions [40,199]. The results of the double-bond isomerization of 1-
butene are given in Table 4.2 with the normalized yields of 2-butene at 30 min for the
catalysts. Cis- and trans-2-butene are the exclusive products found at 150 °C (100%
product selectivity); skeletal isomerization or alkylation did not occur. Unmodified ZrO2,

Chapter 4
50
which was inactive at 60 °C in [205], had a low catalytic activity at 150 °C. About 21%
yield of 2-butene with a cis/trans ratio of 3.9 was obtained after 30 min. The potassium
modification of ZrO2 resulted in an increase in the yield of 2-butene, i.e., from 21.7 up to
(at the most) 63.8% after 30 min, except for the KNO3-modified samples (Table 4.2). The
improved activity is indicated by a) the yield/mass ratio at 30 min of 0.066 (pure zirconia)
and 0.10–0.16 (potassium-modified ZrO2) and b) the higher cis/trans ratios (more than 5.0).
This can be explained by the stronger basic sites on catalysts produced by modification and
confirmed with CO2-TPD (Fig. 4.4). According to the literature [26,199], strong active
basic sites are essential for the catalysis of 1-butene isomerization. Why the KNO3-
modified samples give yields of 2-butene lower than that of ZrO2 and lower cis/trans ratios
is not clear. The catalysts prepared from the modification of hydrous zirconia are slightly
more active than the corresponding catalysts from anhydrous zirconia; this could be a
result of the difference in the distribution of basic sites indicated by CO2-TPD. At the same
time, the locations of the basic sites on the surface of the different zirconia (tetragonal or
monoclinic) may also affect the reaction. The catalysts, KC-ZRH and KAC-ZRH, were
reused without much decrease in conversion after treatment at 600 °C (Table 4.2).
The liquid-phase Michael addition of 2-methylcyclohexane-1,3-dione to methyl vinyl
ketone used for the catalytic experiments is an important reaction for the synthesis of
steroid pharmaceutical products.
Table 4.3
The results of Michael addition and leaching tests at room temperature
Yield of 2-methyl-2-(3-oxo-butyl)-cyclohexane-1,3-dione (%)a
Leaching test Catalyst 2h 4h 6h 8h 24h
Before separation After separation of the catalyst
KC-ZRH 17 24 - 48 99 73 (14h) 95 (12h) 95 (24h) KHC-ZRH 18 32 - 56 98 82 (14h) 96 (12h) 96 (24h) KAC-ZRH 16 30 41 52 96 - - - KC-ZRO 39 63 82 93 89 66 (4h) 88 (16h) 85 (24h) KHC-ZRO 59 79 90 86 86 75 (4h) 89 (16h) 89 (24h) KAC-ZRO 36 62 81 92 96 - - - a: related to 2-methylcyclohexane-1,3-dione
Pure ZrO2 was catalytically inactive in this reaction, but the modification of ZrO2 with
potassium salts was successful in producing catalytic activity. Thus, the target product, 2-
methyl-2-(3-oxo-butyl)-cyclohexane-1,3-dione, was formed selectively on the catalysts,

Chapter 4
51
KC-ZRH, KHC-ZRH, and KAC-ZRH, within 24 h in yields of more than 95% (Table 4.3).
In contrast, KN-ZRH and KN-ZRO gave yields of only 72 and 55%, respectively (not
given in Table 4.3). The rate of product formation was highest on KC-ZRO, KHC-ZRO,
and KAC-ZRO. Yields of about 80–90% were achieved within 6 h.
Leaching tests performed by filtration of the catalyst from the reaction mixture after 4
or 14 h show that the reaction continues after removal of the solid potassium-modified
zirconia catalyst. The presence of potassium ions in solution was checked and confirmed
by ICP-OES. It can be concluded that potassium compounds leach from the catalyst
surface into the methanolic reaction mixture. This leaching and consequent homogeneous
catalysis may be explained by the weak interaction of the potassium compounds with ZrO2
and the solubility of potassium compounds in methanol. Consequently, exclusive
heterogeneous catalysis can be ruled out for the liquid-phase reaction investigated on
potassium-modified zirconia in methanol. However, the catalytic results differ from those
obtained for the soluble base catalyst, KOH. When KOH is used, low product yield (40%)
and a mixture of various products is found. This indicates that different K species are
present in the methanol solution, and that the reaction may not be a straightforward
example of homogeneous catalysis.
These results show that this catalyst system is less suitable for liquid-phase reactions,
although the potassium-modified ZrO2 samples do produce both higher selectivities and
higher yields than KOH, and catalysts with potassium or alkali metal cations have been
used successfully in vapor-phase reactions. The nature of the interaction between the
support, ZrO2 or Al2O3, with potassium or other alkali metal cations is open to further
discussion [18].
4.4 Conclusions
In summary, the properties and the activities of the catalysts can be influenced by a
variety of parameters, such as the zirconia precursor and the potassium modifying agent.
High product yields and selectivities were also obtained for the liquid-phase Michael
addition of 2-methylcyclohexane-1,3-dione to methyl vinyl ketone in methanol, but
leaching could not be prevented. The following can be concluded:
Modified hydrous zirconia forms the metastable, tetragonal ZrO2 phase after calcination;
the phase of modified anhydrous zirconia, on the other hand, is monoclinic. The specific
surface areas of the modified samples are much lower than that of ZrO2. The potassium
Chapter 4
52
compounds on hydrous zirconia decompose in a broader temperature range than those on
anhydrous zirconia.
Stronger basic sites are produced after modification, and modified anhydrous zirconia
has a wider distribution of basic site strengths than modified hydrous zirconia.
Potassium-modified zirconia, except for that modified with KNO3, give higher yields
and cis/trans ratios of 2-butene in the double-bond isomerzation of 1-butene and is
reusable.
Potassium-modified zirconia is less suitable as a solid base catalyst for liquid phase
reactions in methanol because of potassium leaching effects.

Chapter 5
53
CChhaapptteerr 55
AApppplliiccaattiioonn ooff ccaallcciinneedd MMgg--AAll hhyyddrroottaallcciitteess
ffoorr MMiicchhaaeell aaddddiittiioonnss

Chapter 5
54
5.1 Introduction
Hydrotalcite (HT)-like compounds, also known as layered double hydroxides (LDH)
and anionic clays, are natural or synthetic crystalline materials consisting of positively
charged two-dimensional sheets with water and exchangeable charge-compensating anions
in the interlayer region. They may be represented by the general formula [M2+1-xM3+
x
(OH)2]x+[An−x/n·mH2O]x−. M2+ are divalent anions (e.g., Mg2+, Zn2+, Mn2+, Ni2+, Co2+, Fe2+),
M3+ are trivalent metal ions (e.g., Al3+, Cr3+, Fe3+, Co3+, Ga3+) and An- is the interlayer
anion with charge n. The structure of hydrotalcite (HT) itself, Mg6Al2(OH)16CO3⋅4H2O, is
similar to that of brucite, Mg(OH)2, in which Mg2+ is octahedrally coordinated by hydroxyl
groups. These octahedra share adjacent edges to form sheets or layers. In HT, part of the
Mg2+ ions is replaced by Al3+ ions, resulting in positively charged layers. The space
between the stacked brucite-like cation layers is filled with charge compensating anions
(e.g., CO32−, Cl−, NO3
−, SO42−, OH− and many others) and water molecules. In naturally
occurring HT, mostly carbonate is the interlayer anion. The synthesis, the textural and
acid-base properties, and the catalytic application of hydrotalcites and hydrotalcite-related
catalysts have been reviewed in [206,207,208,209]. Hydrotalcites and hydrotalcite-related
materials are used in different forms as follows:
As-synthesized hydrotalcite
As-synthesized hydrotalcite is used as flame retardant, ion exchanger, adsorbent for waste
water in industry. As-synthesized hydrotalcite can also be used as catalyst and showed a
high catalytic activity for decomposition of 2-methyl-3-butyn-2-ol into acetone and
acetylene [210]. Halide exchange reactions between alkyl chloride and bromide/iodide are
catalyzed by the catalysts having Cl−, Br−, or I− in the interlayers [211]. Moreover, after
anion exchange with inorganic heteropolyacids, hydrotalcite may also exhibit acid
properties, which mainly are associated with the anions in interlayers [206].
Calcined hydrotalcite
The calcined hydrotalcites are normally referred to as mixed oxides and most widely used
as catalysts. The most interesting and important properties of the mixed oxides obtained by
calcination are the following: a) high surface area; b) basic properties; c) homogeneous
mixtures of oxides with very small crystal size; d) memory effect, which allows the
reconstruction of the original hydrotalcite-related structure under mild conditions [206]. In
the field of heterogeneous catalysis (hydrogenation, reforming, basic catalysis and catalyst
support), properties a), b) and c) have found various applications [206,208]. Recently, in
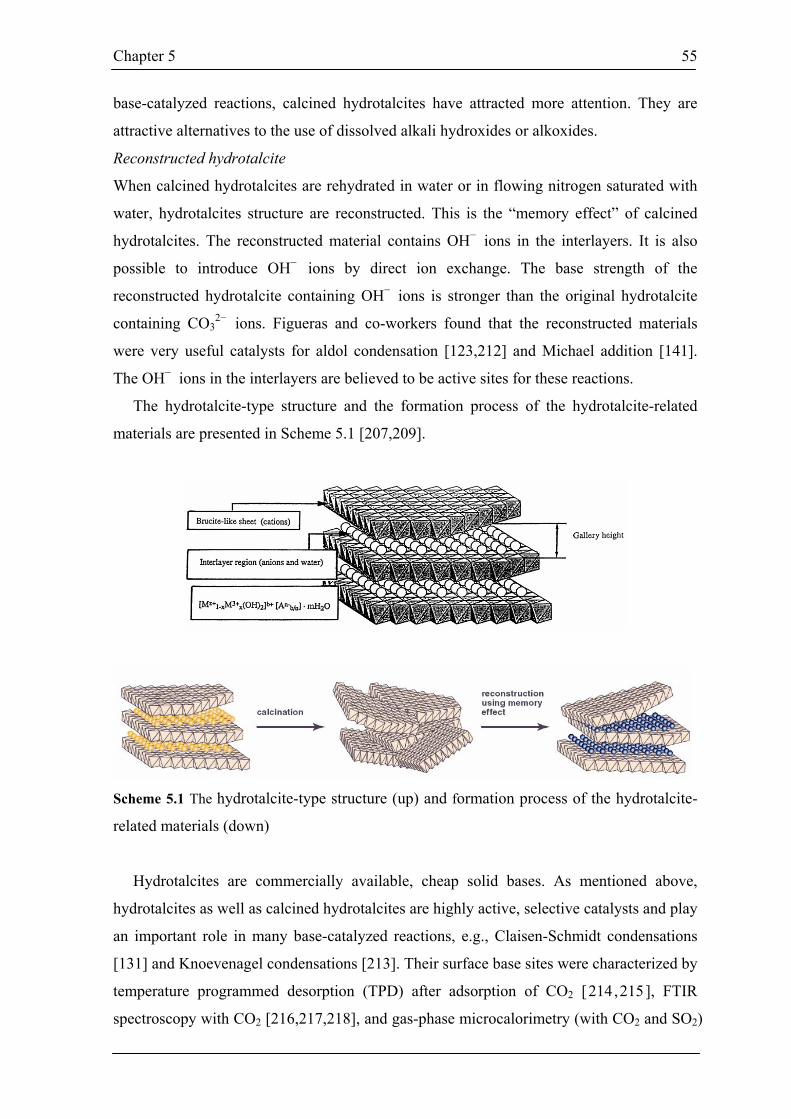
Chapter 5
55
base-catalyzed reactions, calcined hydrotalcites have attracted more attention. They are
attractive alternatives to the use of dissolved alkali hydroxides or alkoxides.
Reconstructed hydrotalcite
When calcined hydrotalcites are rehydrated in water or in flowing nitrogen saturated with
water, hydrotalcites structure are reconstructed. This is the “memory effect” of calcined
hydrotalcites. The reconstructed material contains OH− ions in the interlayers. It is also
possible to introduce OH− ions by direct ion exchange. The base strength of the
reconstructed hydrotalcite containing OH− ions is stronger than the original hydrotalcite
containing CO32− ions. Figueras and co-workers found that the reconstructed materials
were very useful catalysts for aldol condensation [123,212] and Michael addition [141].
The OH− ions in the interlayers are believed to be active sites for these reactions.
The hydrotalcite-type structure and the formation process of the hydrotalcite-related
materials are presented in Scheme 5.1 [207,209].
Scheme 5.1 The hydrotalcite-type structure (up) and formation process of the hydrotalcite-
related materials (down)
Hydrotalcites are commercially available, cheap solid bases. As mentioned above,
hydrotalcites as well as calcined hydrotalcites are highly active, selective catalysts and play
an important role in many base-catalyzed reactions, e.g., Claisen-Schmidt condensations
[131] and Knoevenagel condensations [213]. Their surface base sites were characterized by
temperature programmed desorption (TPD) after adsorption of CO2 [214,215], FTIR
spectroscopy with CO2 [216,217,218], and gas-phase microcalorimetry (with CO2 and SO2)

Chapter 5
56
[216,219,220,221]. In addition to the base sites, acid sites or acid-base pairs on these
materials also influence catalytic performance. Acid-base sites on mixed oxides are highly
active sites for many reactions: Meerwein-Ponndorf-Verley reactions [222], cycloadditions
of carbon dioxide to epoxides [223], and aldol condensations to form 2-nonenal [224].
Acid-base properties of Mg-Al mixed oxides are governed by the Mg/Al molar ratio
[215,216,217,218], calcination temperature [219], and preparation condition
[214,218, 225 , 226 ]. While the acid-base properties are important for understanding
catalytic activity and selectivity, the relation between catalytic behavior in Michael
additions, the acid-base properties, and the composition of hydrotalcite and calcined
hydrotalcites is still poorly understood.
Thus, the aim of this chapter was to a) find efficient, selective catalyst that is easily
acquired or prepared for further Michael additions and b) study the influence of its acid-
base properties and chemical composition on the catalytic performance of the calcined
hydrotalcites [227]. The Michael additions of 1,3-diones with different pKa values to
methyl vinyl ketone were examined on calcined commercial Mg-Al hydrotalcites including
an Al-rich (Mg/Al = 0.6) sample. MgO and Al2O3 were also involved for comparison.
Acid-base properties of the catalysts were investigated by gaseous probe molecules with
FTIR spectroscopy and microcalorimetry. Microcalorimetric measurements with benzoic
acid were carried out for the study of catalyst basicity under similar liquid-phase reaction
conditions.
5.2 Preparation and characterization of calcined Mg-Al hydrotalcites
5.2.1 Catalyst preparation
Hydrotalcites (PURAL MG 30, 50, 61, 70 from SASOL Germany GmbH) [228] were
calcined at 550 °C in air for 3 h. Al2O3 was obtained by calcination of the AlO(OH) (Pural
SB, SASOL Germany GmbH) [228] under the same conditions. Calcination of dried
Mg(OH)2 at 600 °C in air for 4 h produced MgO. The hydroxide was precipitated from
Mg(NO3)2 with KOH and dried at 110 °C (see chapter 3). In this chapter, the following
sample codes are used: HT0.6 or CHT0.6 for the sample with a bulk Mg/Al molar ratio of
0.6; the C in the sample code indicates that the sample has been calcined (Table 5.1).
5.2.2 Characterization of calcined hydrotalcites
Physical properties
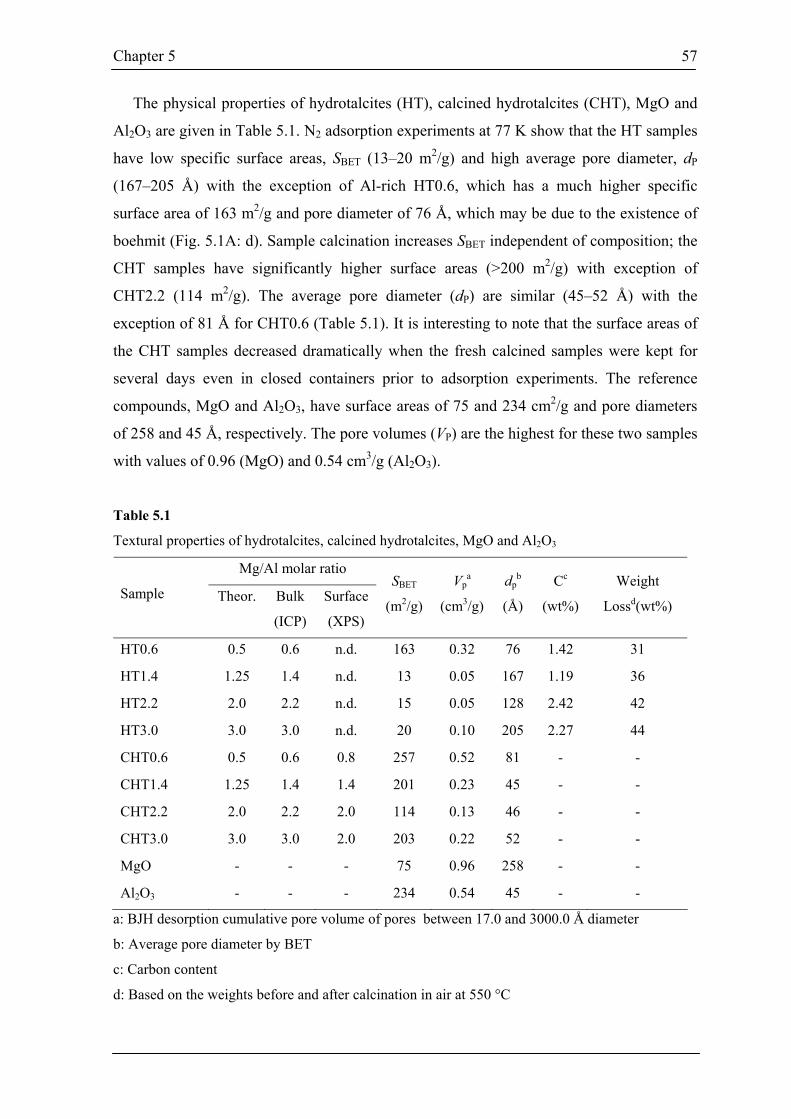
Chapter 5
57
The physical properties of hydrotalcites (HT), calcined hydrotalcites (CHT), MgO and
Al2O3 are given in Table 5.1. N2 adsorption experiments at 77 K show that the HT samples
have low specific surface areas, SBET (13–20 m2/g) and high average pore diameter, dP
(167–205 Å) with the exception of Al-rich HT0.6, which has a much higher specific
surface area of 163 m2/g and pore diameter of 76 Å, which may be due to the existence of
boehmit (Fig. 5.1A: d). Sample calcination increases SBET independent of composition; the
CHT samples have significantly higher surface areas (>200 m2/g) with exception of
CHT2.2 (114 m2/g). The average pore diameter (dP) are similar (45–52 Å) with the
exception of 81 Å for CHT0.6 (Table 5.1). It is interesting to note that the surface areas of
the CHT samples decreased dramatically when the fresh calcined samples were kept for
several days even in closed containers prior to adsorption experiments. The reference
compounds, MgO and Al2O3, have surface areas of 75 and 234 cm2/g and pore diameters
of 258 and 45 Å, respectively. The pore volumes (VP) are the highest for these two samples
with values of 0.96 (MgO) and 0.54 cm3/g (Al2O3).
Table 5.1
Textural properties of hydrotalcites, calcined hydrotalcites, MgO and Al2O3
Mg/Al molar ratio
Sample Theor. Bulk
(ICP)
Surface
(XPS)
SBET
(m2/g)
Vpa
(cm3/g)
dpb
(Å)
Cc
(wt%)
Weight
Lossd(wt%)
HT0.6 0.5 0.6 n.d. 163 0.32 76 1.42 31
HT1.4 1.25 1.4 n.d. 13 0.05 167 1.19 36
HT2.2 2.0 2.2 n.d. 15 0.05 128 2.42 42
HT3.0 3.0 3.0 n.d. 20 0.10 205 2.27 44
CHT0.6 0.5 0.6 0.8 257 0.52 81 - -
CHT1.4 1.25 1.4 1.4 201 0.23 45 - -
CHT2.2 2.0 2.2 2.0 114 0.13 46 - -
CHT3.0 3.0 3.0 2.0 203 0.22 52 - -
MgO - - - 75 0.96 258 - -
Al2O3 - - - 234 0.54 45 - -
a: BJH desorption cumulative pore volume of pores between 17.0 and 3000.0 Å diameter
b: Average pore diameter by BET
c: Carbon content
d: Based on the weights before and after calcination in air at 550 °C

Chapter 5
58
ICP-OES results show that the Mg/Al molar ratios of the corresponding HT and CHT
samples are identical and, thus, independent of the samples’ thermal treatment. In
comparison, the surface Mg/Al molar ratios (XPS measurements) deviate from the bulk
ratios depending on the composition (Mg/Al molar ratio) of the CHT samples. The surface
Mg/Al ratio for CHT0.6 of 0.8 is slightly higher than the bulk ratio (Mg-enriched surface,
Alsurface < Albulk), whereas the identical surface Mg/Al molar ratios of CHT2.2 and CHT3.0
are lower in value (both 2.0) than that of the bulks (Al-enriched surfaces, Alsurface > Albulk).
The bulk and surface Mg/Al ratios of CHT1.4 are identical (Alsurface = Albulk). If XPS is
considered a pure surface method independent of surface area [214,215], the ICP and XPS
results confirm the homogeneity of CHT1.4. This homogeneity suggests that smaller Al3+
cations are more easily incorporated into the main Mg oxygen network (Mg/Al > 1) than
the larger Mg2+ cations into the main Al oxygen network (Mg/Al < 1: CHT0.6). The
“nonincorporation” effect becomes more significant (Al-enriched surfaces) the higher the
Mg/Al ratio (>> 1); the degree of Al enrichment of the CHT3.0 surface is higher than that
of CHT2.2. Al-enriched surfaces were also found with XPS (Mg/Al = 1.5 and 2.4) for
calcined Mg-Al hydrotalcites with Mg/Al molar ratios of 1.87 and 4.57, respectively [214].
XRD
The XRD patterns of the HT samples show that crystallinity of the HT samples
increases with Mg content (Fig. 5.1A: a–d) and that the HT samples have a hydrotalcite-
like structure similar to those presented in [225,226,229,230]. Additional weak peaks at 28
and 49° in the HT0.6 pattern (Fig. 5.1A: d) can be assigned to boehmit (cf. Fig. 5.1A: e for
Pural SB, AlO(OH), PDF No. 49-133) . Calcination of the HT samples (CHT3.0–1.4)
results in the destruction of the hydrotalcite-like structure and the formation of a periclase
MgO (PDF No. 45-946, Fig. 5.1B: a, b, c) also found for the pure MgO sample (Fig. 5.1B:
f). The MgO peaks (at about 43 and 63°) of the CHT samples including CHT0.6 (Fig. 5.1B:
a, b, c and d) have higher 2θ values than those of pure MgO; this is caused by the
incorporation of smaller Al3+ cations in the bulk lattice of all four CHT samples
[14,18,29,30]. These peaks shift from higher to lower 2θ values as the Mg/Al ratio
increases, which shows that the amount of Al3+ cations incorporated decreases accordingly.
These results agree with the XPS results: CHT0.6 (Alsurface < Albulk) and CHT3.0 (Alsurface >
Albulk). The AlO(OH) reference material forms γ-Al2O3 after calcination (PDF No. 29-63,
Fig. 5.1B: e). In the pattern of the homogeneous CHT1.4 sample (Alsurface = Albulk, Fig.
5.1B: c), weak broad peaks for MgAl2O4 (35°, PDF No. 21-1152) and γ-Al2O3 (66°) are

Chapter 5
59
5 10 15 20 25 30 35 40 45 50 55 60 65
Inte
nsity
400
cts.
/s
A
edcb
a
2θ [°]
10 20 30 40 50 60 70 80 90
2θ [°]
Inte
nsity
400
cts.
/s
B
d1
/5f
ed
cba
PDF No. 29-63 γ-Al2O3 PDF No. 45-946 MgO PDF No.21-1152 MgAl2O4
Fig. 5.1 XRD patterns of hydrotalcites (A) and hydrotalcites calcined at 550 °C (B) with Mg/Al
molar ratios of 3.0 (a), 2.2 (b), 1.4 (c), and 0.6 (d). The sample in A: d was further calcined at 700
°C to give the XRD pattern B: d1. The MgO reference material is shown after calcination in B: f.
The Al2O3 reference oxide is shown before (boehmit in A: e) and after calcination (γ-Al2O3 in B: e).
observed. The intensity decrease of the MgAl2O4 and γ-Al2O3 peaks from CHT0.6 to
CHT3.0 also indicates finely dispersed Al3+ cations in the bulk MgO network [219]. In the
pattern of the very amorphous CHT0.6 sample, the broad peak at ca. 43° (Fig. 5.1B: d)
may be attributed to regions of MgO, γ-Al2O3, and an additional spinel phase of MgAl2O4
in this sample [215]. Its maximum narrows, sharpens, and shifts to a slightly higher 2θ

Chapter 5
60
value (45°) as a separate spinel phase forms during further calcination at 700 °C (Fig. 5.1B:
d1); weak, broad peaks for MgO at ca. 43 and 63° (Fig. 5.1B: b) decrease in intensity after
calcination at 700 °C, whereas the peaks for MgAl2O4 at 37, 45, 59, and 65° become
stronger (Fig. 5.1B: d1). Thus, the increased calcination temperature of 700 °C causes a
separate phase of MgAl2O4 to form [219,231]. With higher Mg contents (higher Mg/Al
ratios), MgO is the main phase (strong peak at ca. 63° in Fig. 5.1A: a), and the spinel peak
disappears (2θ = 37°).
27Al MAS NMR
The 27Al MAS NMR spectra of γ-Al2O3 and calcined hydrotalcites are shown in Fig. 5.2.
Two broad signals at about 5 and 64 ppm are observed in the spectra of both pure Al2O3
and the CHT samples for octahedrally and tetrahedrally coordinated aluminum cations
(AlO and AlT), respectively [214,217,219,229,231]. The identical spectra of γ-Al2O3 and
CHT0.6 (highest Al content) regarding signal shapes, in particular that of the 64-ppm
signal, indicate a similar Al coordination in these two samples and explains the weak,
broad peaks in the XRD patterns (Fig. 5.1B: b and d). The maximum of the signal at 5 ppm
shifts slightly to lower fields (from ca. 2 to 6.5 ppm) with increasing Mg/Al ratio, which
indicates increased bonding of the AlO6 octahedra in the bulk to a less electronegative
element (Mg): Mg–O–AlO [217,219]. A lack of signal splitting [219] suggests that distinct
Al coordination sites do not exist in the samples. CHT1.4 has a relatively narrow signal (at
5 ppm) compared to other samples, which indicates a low degree of disorder of the AlO6
octahedra and may be related to the homogeneity of this sample confirmed by ICP-OES
and XPS (Albulk = Alsurface).
The AlT/AlO ratio calculated from the integrated signals for Al2O3 is 0.38 (or 28% AlT)
and is close to the value 0.4 of alumina given in [214]. The 28% AlT observed here is
somewhat lower than that found in cubic aluminas (31–33%), but higher than the amount
of AlT found in hexagonal alumina (15–25%) [232]. The samples, CHT0.6, CHT1.4, and
CHT2.2, all have a AlT/AlO ratio identical to that of Al2O3 (0.38); however, CHT3.0 has a
much higher ratio of 0.59 (37% AlT). This indicates that the octahedral coordination AlO is
predominant in the structure of all the samples, yet tetrahedral AlT cations are more
common in CHT3.0 possibly by forming inverse spinel-like domains: Mg–O–AlT [217].
AlO4 tetrahedra are generally formed during calcination [231, 233 ] (pre-calcination:
exclusively AlO6 octahedra); the preparation method [214] and Al content [214,217] can
also influence the AlT/AlO ratio. The CHT samples were all prepared and calcined under

Chapter 5
61
the same conditions; thus, the higher AlT/AlO ratio in CHT3.0 (Alsurface >> Albulk) can only
be the result of the strong difference in Al content between the bulk and surface not
observed in the other samples. The influence of surface Al on the AlT/AlO ratio has been
suggested before [214].
150 100 50 0 -50 -100 -150
CHT3.0
Chemical shift (ppm)
CHT2.2
CHT1.4
CHT0.6
5 ppm
64 ppm
Al2O3
Fig. 5.2 27Al MAS NMR spectra of Al2O3 and calcined hydrotalcites
TG-DTA
The TG-DTA curves of HT0.6 and HT3.0 are shown in Fig. 5.3. In the TG-DTA
curves of HT0.6 (Fig. 5.3a) and HT3.0 (Fig. 5.3b), gradual weight loss is observed from
about 60 to approximately 600 °C with two main endothermic effects at about 250 and 416
(432) °C; a broad, weak endothermic peak is found at 90 °C for HT0.6. The first large
endothermic effect at about 250 °C may be attributable to the loss of inter-layer water
[225,234]; the second endothermic effect of HT3.0 signifying the loss of OH– groups and
the decomposition of the CO32– anion in the brucite-like layers of hydrotalcites [225,234]
occurs at 432 °C. The total weight loss observed for HT0.6 and HT3.0 (ca. 33.5 and 42.5%,
respectively) is similar to that given in Table 5.1 measured pre- and post-calcination at 550
°C (31 and 44%, respectively).

Chapter 5
62
-30
-20
-10
0
10
20
DTA /uV
40
50
60
70
80
90
100
TG /%
100 200 300 400 500 600 700Temperature /°C
0
1.0
2.0
3.0
4.0
5.0
6.0
Ion Current *10-10 /ATG
DTA
m18
m44
a
208
90
247
416
339
-20.28
-13.20
↑ exo
-60.0
-50.0
-40.0
-30.0
-20.0
-10.0
0
10.0
20.0
30.0
DTA /uV
40
50
60
70
80
90
100
TG /%
100 200 300 400 500 600 700Temperature /°C
0
1.0
2.0
3.0
4.0
5.0
6.0
Ion Current *10-10 /ATG
DTA
m18
m44
b
250
432
-15.06
-27.39↑ exo
Fig. 5.3 TG-DTA profiles of hydrotalcites with Mg/Al molar ratios of 0.6 (a) and 3.0 (b)
The monitored m/z peak at 18 (H2O+) for H2O or OH– shows an immediate, continuous
increase in intensity upon heating up to 416 °C with slight maxima at 247 and 416 °C (Fig.
5.3a) and 250 and 432 °C (Fig. 5.3b) for HT0.6 and HT3.0, respectively. The shape of
these curves confirms the release of water and OH– groups as the main cause of weight loss.
Intensity increases of the mass peak, m/z = 44 (CO2+), are only observed during the second
main step of weight loss from 300 (HT0.6) or 400 (HT3.0) to 600 °C (both) with maxima
at around 460 °C [231]. This increase is also gradual for HT0.6 at temperatures higher than
300 °C, but immediate and more defined for HT3.0 at 410 °C. The intensity differences of
the m/z = 44 maxima are a direct result of the varying carbon contents (1.42 for HT0.6 <
2.27 for HT3.0, Table 5.1) and are less significant to the samples’ overall weight loss (1
mole CO32– vs. 16 moles OH– and 4 moles crystal water). Due to the removal of water and

Chapter 5
63
dehydroxylation, as well as the decomposition of carbonate anions observed by the thermal
analysis, surface areas and pore volumes increased after calcination (Table 5.1).
5.3 Catalytic behavior of calcined Mg-Al hydrotalcites
Michael addition of 2-methylcyclohexane-1,3-dione to methyl vinyl ketone – comparison of
hydrotalcites and calcined hydrotalcites
A comparative catalytic study of the HT and CHT samples is shown in Fig. 5.4A and
5.4B, respectively. Both types of samples (HT and CHT) are very active and produce the
target product with 100% selectivity. In contrast, the calcined hydrotalcite studied in [141]
exhibited no catalytic activity in 1,4-Michael additions. This could not be confirmed here.
The catalytic activity of the sample was evaluated from the yield of the Michael adduct as
a function of reaction time. After a reaction time of 24 h, the final catalytic yields
decreased in the following order regardless of sample calcination: (C)HT0.6 > (C)HT3.0 >
(C)HT1.4 > (C)HT2.2 (> Al2O3 > MgO ≈ 0 in Fig. 5.4B). A linear correlation between
Mg/Al molar ratio and catalytic activity was not found; samples with the highest and
lowest Mg content, (C)HT0.6 and (C)HT3.0, respectively, achieved the highest yields.
HT0.6 and CHT0.6 gave respective target product yields of 98 and 100% after 24 h; the
use of HT3.0 and CHT3.0 resulted in yields of 82 and 94%, respectively. The sample with
a Mg/Al ratio of 2.2 (HT2.2 and CHT2.2) was the least active of these samples. The
catalytic yield a) remained more or less the same (Mg/Al = 1.4 and 0.6), b) decreased from
69 to 49% (Mg/Al = 2.2), or c) increased significantly from 82 to 94% (Mg/Al = 3.0) after
calcination of the corresponding hydrotalcite at 550 °C. Due to weight loss during
calcination, i.e., amount of catalyst (0.225 g) used was weighed out prior to calcination,
CHT0.6 and CHT3.0 showed enhanced yields. This weight loss could also explain the
drastic decrease in the catalytic activity of CHT2.2; however, HT2.2 also gave the lowest
catalytic yield suggesting that other factors may be involved in the low yield of CHT2.2.
In the case of the pure oxides (Al2O3 and MgO), the catalytic activity of Al2O3 was
lower than that of the CHT samples (final yield of 23% after 24 h, Fig. 5.4B), whereas
MgO was found to have a considerably different, less selective behavior. In the case of
MgO, 65% of the target product was formed within 30 min, but the amount of the Michael
adduct in the reaction mixture dropped to 6% in a reaction time of 24 h. In the 1H NMR
spectra of the reaction mixtures, additional CH3 signals (0.97 and 1.23 ppm) were found
for 6-hydroxy-1,6-dimethyl-2,9-dioxobicyclo[3.3.1]nonane formed by the aldol cyclization

Chapter 5
64
of 2-methyl-2-(3-oxo-butyl)-cyclohexane-1,3-dione. In our experiments, when Mg(OH)2 or
different MgO catalysts were used, cyclization under the same conditions also took place
(see chapter 3).
0 4 8 12 16 20 240
10
20
30
40
50
60
70
80
90
100 A
HT0.6 HT1.4 HT2.2 HT3.0
Yie
ld o
f Mic
hael
add
uct (
%)
Time (h)
0 4 8 12 16 20 240
10
20
30
40
50
60
70
80
90
100 B
CHT0.6 Al2O
3 CHT1.4 MgO CHT2.2 CHT3.0
Yie
ld o
f Mic
hael
add
uct (
%)
Time (h)
Fig. 5.4 Results of the Michael addition of 2-methylcyclohexane-1,3-dione (15 mmol) to methyl
vinyl ketone (22.5 mmol) in 10 mL methanol over the hydrotalcites (A) and over the calcined
hydrotalcites, Al2O3 and MgO (B). Catalyst amounts were 0.225 g for the hydrotalcites, Al2O3, and
MgO and the amount remaining after calcination of 0.225 g hydrotalcite at 550 °C
Michael addition of 2-acetylcyclopentanone and 2-acetylcyclohexanone to methyl vinyl
ketone over calcined hydrotalcites
The Michael addition of 2-acetylcyclopentanone (pKa = 7.8) and 2-
acetylcyclohexanone (pKa = 10.1) to methyl vinyl ketone was performed (Fig. 5.5A and
5.5B, respectively) to investigate possible further applications and compare the basic site
strengths and numbers of CHT samples.

Chapter 5
65
The catalytic results (Fig. 5.5) using these liquid diones can not be compared directly
to those in Fig. 5.4B (2-methylcyclohexane-1,3-dione, a solid, is only slightly soluble in
methanol at room temperature). A similar decreasing order of catalytic activity (CHT0.6 >
CHT3.0 > CHT2.2 > CHT1.4 > Al2O3 > MgO) was found in these two Michael additions
after 24 h. Note, CHT1.4 was the least active of the CHT samples for these reactions in
comparison to the results of the reaction with the 1,3-dione.
0 4 8 12 16 20 240
10
20
30
40
50
60
70
80
90
100 A
CHT0.6 Al2O3 CHT1.4 MgO CHT2.2 CHT3.0
Yie
ld o
f Mic
hael
add
uct (
%)
Time (h)
0 4 8 12 16 20 240
10
20
30
40
50
60
70
80
90
100 B
CHT0.6 Al2O
3 CHT1.4 MgO CHT2.2 CHT3.0
Yie
ld o
f Mic
hael
add
uct (
%)
Time (h)
Fig. 5.5 Results of the Michael additions of 2-acetylcyclopentanone (15 mmol) (A) and 2-
acetylcyclohexanone (15 mmol) (B) to methyl vinyl ketone (22.5 mmol) in 10 mL methanol over
calcined hydrotalcites (0.225 g)

Chapter 5
66
0.0 0.5 1.0 1.5 2.0 2.5 3.00
20
40
60
80
100 C
CHT3.0CHT2.2CHT1.4CHT0.6Al2O
3
acetylcyclopentanone pKa = 7.8 acetylcyclohexanone pKa = 10.1 dione w/ CHT pKa = 6.7 dione w/ HT pKa = 6.7
Yie
ld a
fter 2
4 h
(%)
Mg/Al ratio
Fig. 5.6 Dependence of Michael adduct yield on Mg/Al ratio of catalyst after 24 h
The correlation between catalytic activity and the Mg/Al molar ratio was again
nonlinear (Fig. 5.6) and identical for both reactions. Independent of the sample used (CHT,
MgO, or Al2O3), the addition of 2-acetylcyclopentanone to methyl vinyl ketone proceeds
faster than that of 2-acetylcyclohexanone (i.e., slope of curves is higher in Fig. 5.5A than
in Fig. 5.5B up to a reaction time of 8 h). The higher slopes (Fig. 5.5A) and final yields
reached after 24 h (Fig. 5.6) are both easily explained by the higher acidity of 2-
acetylcyclopentanone (lower pKa, deprotonation ease). In the case of the less acidic 2-
acetylcyclohexanone, CHT0.6 exhibited a much higher activity than that of the other
catalysts (Fig. 5.5B and Fig. 5.6). It has been suggested that a decrease in Al contents
results in a decrease of the total basic sites, but the fraction of stronger ones increases
[213]. The high activity observed for CHT0.6 could also be caused by strong Lewis acid
sites discussed below. It was also suggested that the catalytic performance of MgyAlOx
catalysts is related not only to the surface density of active sites but also to the nature of
the bulk structure and transformations in the cation (Mg2+ or Al3+) environment induced
by a change in the chemical composition [217]. The higher initial yield after 1 h for MgO
in the cyclohexanone addition reaction (cf. Fig. 5.5A and 5.5B) indicates a slowed
(consecutive) reaction.

Chapter 5
67
0 4 8 12 16 20 240
10
20
30
40
50
60
70
80
90
100 A
Time (h)
Yie
ld o
f Mic
hael
add
uct (
%)
CHT0.6 in methanol CHT3.0 in methanol CHT0.6 without methanol CHT3.0 without methanol
0 4 8 12 16 20 240
10
20
30
40
50
60
70
80
90
100 B
Time (h)
Yie
ld o
f Mic
hael
add
uct (
%)
CHT0.6 in methanol CHT3.0 in methanol CHT0.6 without methanol CHT3.0 without methanol
Fig. 5.7 Results of the solvent-free Michael additions of 2-acetylcyclopentanone (15 mmol) (A)
and 2-acetylcyclohexanone (15 mmol) (B) to methyl vinyl ketone (22.5 mmol) on CHT0.6 and
CHT3.0 (0.225 g)
Solvent-free Michael additions were carried out to examine the possibility of this type
of environmentally friendly implementation of the reaction. This was checked with the
most active samples, CHT0.6 and CHT3.0, in the Michael additions with 2-
acetylcyclopentanone (Penta) and 2-acetylcyclohexanone (Hex) (Fig. 5.7). The reactions
were catalyzed without the presence of a solvent, and CHT0.6 is again the more active
catalyst; however, yields are decreased for both catalysts: from 99 (Penta) and 90% (Hex)
to 55 (Penta) and 64% (Hex) for CHT0.6 and from 93 (Penta) and 40% (Hex) to 28 (Penta)
and 18% (Hex) for CHT3.0 after 24 h. Moreover, in the case of CHT0.6, the solvent-free
addition of 2-acetylcyclopentanone (pKa = 7.8) to methyl vinyl ketone proceeded slightly
slower than that of 2-acetylcyclohexanone (pKa = 10.1). This result of CHT0.6 was

Chapter 5
68
unexpected since the pKa value of the former 1,3-dione is lower; the addition of former
1,3-dione should proceed faster. However, for CHT0.6, the reactions seem to be
independent of the pKa values of the reactants that are normally determined in water or
methanol. The similar result was also observed in base-catalyzed Knoevenagel
condensation before [235] and could be explained by the role of the level of stabilization
of the carbanionic intermediate throughout the particular interactions between reactant and
the catalyst [235]. In contrast, the reaction with cyclopentanone proceeded slightly faster
than the latter in the case of CHT3.0. Meanwhile, yields of the target products were lower
than those found when a solvent was used for both catalysts after 24 h. The low (delayed)
product formation may be related to the absence of solvation necessary to stabilize the
carbanion generated from the CH-acid compound for the addition to methyl vinyl ketone.
Nonetheless, the investigated heterogeneously catalyzed Michael-additions can be
performed under solvent-free conditions with only slightly longer reaction times.
In summary, although the reaction rates and product yields of solvent-free Michael
additions were, respectively, slower and lower than those observed in methanol, the
solvent-free results are promising regarding their environmental impact.
5.4 Acid-base properties of calcined hydrotalcites
To understand the catalytic behavior of the catalysts, the acid-base properties were
characterized by FTIR studies after pyridine and CO2 adsorption. Temperature
programmed desorption (TPD) of the adsorbed probe molecules was used to study the
strength of the acid and base sites. Microcalorimetric measurements were also involved in
the investigation.
5.4.1 FTIR study of pyridine adsorption
The spectra measured after pyridine adsorption at 40 °C on Al2O3, MgO and CHT
samples are shown in Fig. 5.8. The spectra of all the samples show bands for stretching
vibrations of pyridine molecules coordinatively bonded to Lewis acid sites between 1630
and 1600 cm–1 (ν8a mode) and between 1450 and 1440 cm–1 (ν19b mode). Protonation of
pyridine on Brønsted acid sites (bands at 1640 and 1540 cm-1) [236,237] was not observed
on any of the samples studied here.

Chapter 5
69
1650 1600 1550 1500 1450 1400
Abs
orba
nce
1622
0.1
1613
1449
a
b
c
d
ef
1606
Wave number (cm -1)
1622
Fig. 5.8 Pyridine adsorption on Al2O3 (a), calcined hydrotalcites with Mg/Al molar ratios of 0.6 (b),
1.4 (c), 2.2 (d) and 3.0 (e) and MgO (f). Spectra were measured after adsorption and evacuation at
40 °C
The negligible Lewis acidity of MgO (Fig. 5.8f) indicated by weak bands at 1600 and
1440 cm–1 corresponds to coordinatively unsaturated Mg2+ cations [237]. The shift of the
ν8a band distinguishes the strength of the Lewis acid sites, whereas the intensity of the ν19b
band characterizes their number [238]. With increasing aluminum content, the ν8a band
shifts to higher wave numbers from 1601 (CHT3.0, Fig. 5.8e) to 1613 cm–1 Al2O3 (Fig.
5.8a). In general, bands at 1618–1612 and 1626–1620 cm–1 on Al2O3 are attributed to
pyridine bonded to a pair of coordinatively unsaturated Al3+ ions in octahedral and
tetrahedral positions and coordinatively unsaturated tetrahedral Al3+, respectively
[239,240,241,242]. In the spectrum of Al2O3 (Fig. 5.8a), an additional band at 1622 cm–1
can be ascribed to pyridine strongly adsorbed on Al3+ ions in tetrahedral positions, AlT. A
band similar in wave number, but of much lower intensity was observed for the CHT0.6
sample (Fig. 5.8b). These results indicate the presence of stronger Lewis acid sites
(involving AlT) on the surface of Al2O3 and CHT0.6, but that CHT0.6 has a much lower
number of these sites. The XPS results show that the Mg/Al ratio on the surface of CHT0.6
is slightly higher than in the bulk. The presence of MgO domains probably leads to the
decrease in the number of strong acid sites on the surface of CHT0.6. Although 27Al MAS
NMR showed that the bulk AlT/AlO ratio was identical for Al2O3 and CHT0.6–2.2 (0.38),
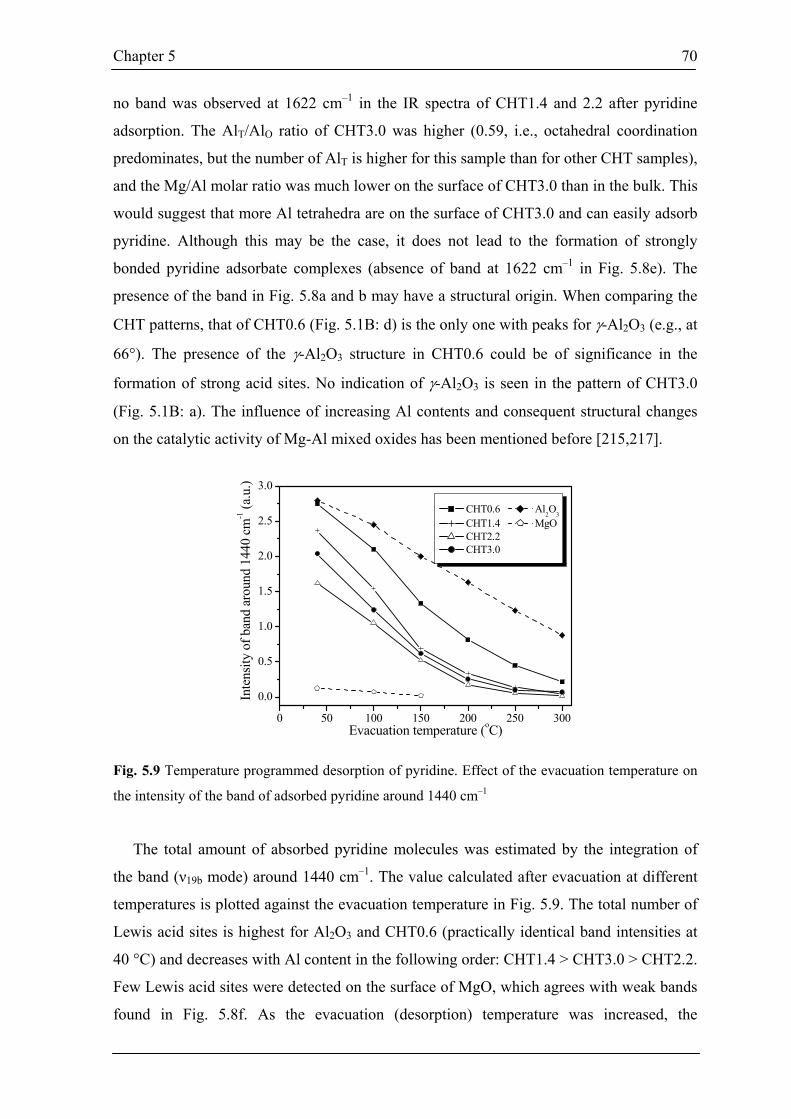
Chapter 5
70
no band was observed at 1622 cm–1 in the IR spectra of CHT1.4 and 2.2 after pyridine
adsorption. The AlT/AlO ratio of CHT3.0 was higher (0.59, i.e., octahedral coordination
predominates, but the number of AlT is higher for this sample than for other CHT samples),
and the Mg/Al molar ratio was much lower on the surface of CHT3.0 than in the bulk. This
would suggest that more Al tetrahedra are on the surface of CHT3.0 and can easily adsorb
pyridine. Although this may be the case, it does not lead to the formation of strongly
bonded pyridine adsorbate complexes (absence of band at 1622 cm–1 in Fig. 5.8e). The
presence of the band in Fig. 5.8a and b may have a structural origin. When comparing the
CHT patterns, that of CHT0.6 (Fig. 5.1B: d) is the only one with peaks for γ-Al2O3 (e.g., at
66°). The presence of the γ-Al2O3 structure in CHT0.6 could be of significance in the
formation of strong acid sites. No indication of γ-Al2O3 is seen in the pattern of CHT3.0
(Fig. 5.1B: a). The influence of increasing Al contents and consequent structural changes
on the catalytic activity of Mg-Al mixed oxides has been mentioned before [215,217].
0 50 100 150 200 250 300
0.0
0.5
1.0
1.5
2.0
2.5
3.0
In
tens
ity o
f ban
d ar
ound
144
0 cm
-1 (a
.u.)
CHT0.6 Al2O3 CHT1.4 MgO CHT2.2 CHT3.0
Evacuation temperature (oC)
Fig. 5.9 Temperature programmed desorption of pyridine. Effect of the evacuation temperature on
the intensity of the band of adsorbed pyridine around 1440 cm–1
The total amount of absorbed pyridine molecules was estimated by the integration of
the band (ν19b mode) around 1440 cm–1. The value calculated after evacuation at different
temperatures is plotted against the evacuation temperature in Fig. 5.9. The total number of
Lewis acid sites is highest for Al2O3 and CHT0.6 (practically identical band intensities at
40 °C) and decreases with Al content in the following order: CHT1.4 > CHT3.0 > CHT2.2.
Few Lewis acid sites were detected on the surface of MgO, which agrees with weak bands
found in Fig. 5.8f. As the evacuation (desorption) temperature was increased, the

Chapter 5
71
integrated intensity, i.e., number of pyridine molecules still adsorbed, decreased. At an
evacuation temperature of 200 °C, most of the pyridine on CHT1.4–3.0 had desorbed;
higher intensities (> 0.5 a.u.) are only observed for Al2O3 and CHT0.6. After evacuation at
300 °C, Al2O3 is the only sample with a band intensity over 0.5 a.u. These experiments
show that while the CHT1.4–3.0 have varying amounts of acid sites (different band
intensities after evacuation at 40 °C), they have a similar number of stronger acid sites
(similar intensities after evacuation at temperatures higher than 150 °C). Thus, the amount
of weaker acid sites increases from CHT2.2 to CHT3.0 to CHT1.4, which may explain the
slightly lower activity of this sample (CHT1.4) in the Michael addition with 2-
methylcyclohexane-1,3-dione in comparison to that of the other CHT samples.
In summary, CHT0.6 has the highest acidity among the CHT samples with respect to
the number and strength of acid sites. The total amount of acid sites on the other CHT
samples (CHT1.4–3.0) is much lower. The Al-rich sample (CHT0.6) and Al2O3 have the
same total amount of acid sites (identical intensities at 40 °C), yet the stronger the sites are
(the higher the evacuation temperature) the lower their numbers (amount of pyridine still
adsorbed) for CHT0.6 compared to that for Al2O3. This may begin to explain the drastic
difference in the activity of a) CHT0.6 and Al2O3 and b) CHT0.6 and CHT1.4–3.0.
5.4.2 FTIR study of CO2 adsorption
Because CO2 is acidic, it adsorbs specifically on basic sites. However, a lot of species
can be formed. CO2 reacts with basic hydroxyl groups forming hydrogen carbonate
(bicarbonate) species (Scheme 5.1) and with basic oxygen ions forming different kinds of
carbonate species (Scheme 5.2) [243,244].
O
H
M
C
O
O
C
O
M
OO
H
Scheme 5.1 Bicarbonate species

Chapter 5
72
C
O O
O
C
O O
O
M
C
OO
O
M
C
OO
O
M
C
OO
O
M
M C
OO
O
MM
C
O O
O
M
M M2- 2- 2- 2- 2- 2- 2-
D3h C2v Cs C2v Cs C2v
symmetrical unidentate bidentate bridged polydentate
Scheme 5.2 Carbonate species
In the infrared spectra of bulk alkaline bicarbonates, which are present in dimer form in
solid state, bands are observed at 2620-2450 cm-1 (νOH…O), 1655-15 (asym νC=O), 1430-
1370 (sym νC=O) and 1300 cm-1 (δOH…O).
The free carbonate ion (D3h symmetry) has three IR active vibrations:
ν3 (E) asymmetric νCO vibration: 1415 cm-1
ν2 (A2’) out of plane π (CO3) deformation: 879 cm-1
ν4 (E) in plane δ (CO3) deformation: 680 cm-1
and one Raman active vibration:
ν1 (A1’) symmetric νCO vibration: 1063 cm-1.
In the adsorbed state, the symmetry is lowered (Scheme 5.2) and the doubly degenerate
ν3 and ν4 vibrations are splitted and the ν1 vibration becomes IR active. The splitting of the
ν3 mode is related to the structure of the carbonate (the angular distortion from D3h
symmetry within the carbonate ligand) [244]:
∆ν3 ca. 100 cm-1 monodentate
∆ν3 ca. 300 cm-1 bidentate
∆ν3 ca. 400 cm-1 bridged
However, much smaller values (50–150 cm-1) also have been observed for bridging
carbonates. The thermal stability of surface carbonates should also be taken into account
[5]. For instance, monodentate carbonates are usually less stable than the corresponding
bidentate carbonates.

Chapter 5
73
The FTIR spectra (1100–1800 cm–1) of Al2O3, MgO and CHT samples after CO2
adsorption at 40 °C are shown in Fig. 5.10. The thermal stability of the surface species was
studied by desorption experiments at temperatures up to 300 °C (Fig. 5.11, 5.12 and 5.13).
Analysis of the spectra allows us to distinguish two different types of surface basic sites on
all catalysts, Brønsted base sites (basic OH– groups) and Lewis base sites (basic O2– ions),
and to estimate the respective amount and strength of the basic sites.
1800 1600 1400 1200
a
b
0.1
Abs
orba
nce
c
d
e
f
Wave number (cm -1)
1233
1647
1476
14
50
1304
1686
1630
15
78
1525
1381
1217
1658
1300 1500 1700
1452
1365
14
44
Fig. 5.10 CO2 adsorption on Al2O3 (a), calcined hydrotalcites with Mg/Al ratios of 0.6 (b), 1.4 (c),
2.2 (d) and 3.0 (e), and MgO (f). Spectra were measured after adsorption and evacuation at 40 °C
FTIR study of CO2 adsorption on Al2O3
The predominant species observed on Al2O3 (Fig.5.10a and Fig.5.11) is bicarbonate
(HCO3–) with bands at 3609 (νOH), 1647 (asym νC=O), 1476 (sym νC=O) and 1233 cm–1
(δOH), which forms on surface basic OH– groups. Bands at 1756, 1704, 1537, 1265, and
1204 cm–1 (Fig. 5.11) and the one at 1450 cm–1 can be attributed to surface carbonate
species, CO32–. The adsorption of CO2 on surface oxygen atoms can form different types of
carbonates, monodentate, bidentate, bridged or polydentate, as mentioned above,
depending on the environment of the oxygen atom [243,244]. One of the three IR active
vibrations of the free carbonate ion, which possesses D3h symmetry, is the doubly
degenerate ν3 (E) mode at 1415 cm–1. In the adsorbed state, the symmetry of the CO32– ion
is lowered, and the ν3 vibration splits into two components (∆ν3) [243,244] dependent on

Chapter 5
74
the structure of the surface carbonates. In the case of Al2O3, this splitting leads to bands at
1756 and 1204 cm–1 (∆ν3 splitting = 552 cm–1), which can be assigned to the νC=O
vibrations of bridged “organic-like” complexes; the shoulders at 1704 and 1265 cm–1 (∆ν3
splitting = 439 cm–1) can be assigned to bidentate carbonate species. The assignment of the
bands at 1537 cm–1 and 1450 cm–1 is less clear, which could indicate the presence of non-
coordinated symmetrical carbonate or monodentate carbonate.
0
.2
.4
3500 3000 2500 2000 1500
Wavenumber (cm-1)
Abso
rban
ce
1081
1235
1476
1265
1646
1756
3609 15
37
1204
Fig. 5.11 TPD of CO2 adsorbed on Al2O3, spectra taken in vacuum at 40, 100, 150, 200 and 250 °C
FTIR study of CO2 adsorption on MgO
The spectrum of MgO (Fig. 5.10f and Fig. 5.12) after CO2 adsorption is complex with
numerous bands between 1800 and 1100 cm–1. The major bicarbonate species is indicated
by the bands at 1630, 1452 and 1217 cm–1. Weaker bands (shoulders) at 1600, 1448 and
1200 cm–1 (Fig. 5.12) could belong to another type of bicarbonate species. Pairs of bands at
1686/1365 and 1658/1304 cm–1 can be assigned to the ν3 vibrations of two different
bidentate carbonate structures. Based on desorption experiments (spectra not shown), the
most thermally stable species on MgO have band pairs at 1578/1444 and 1525/1381 cm–1.
Based on their low ∆ν3 splitting (134 and 144 cm–1, respectively), these bands could be
assigned to monodentate carbonate species [244, 245 , 246 ]. However, since they are
observed even at higher evacuation temperatures of 200 °C, i.e., high thermal stability of
these corresponding species, they are probably caused by polydentate carbonates [243].
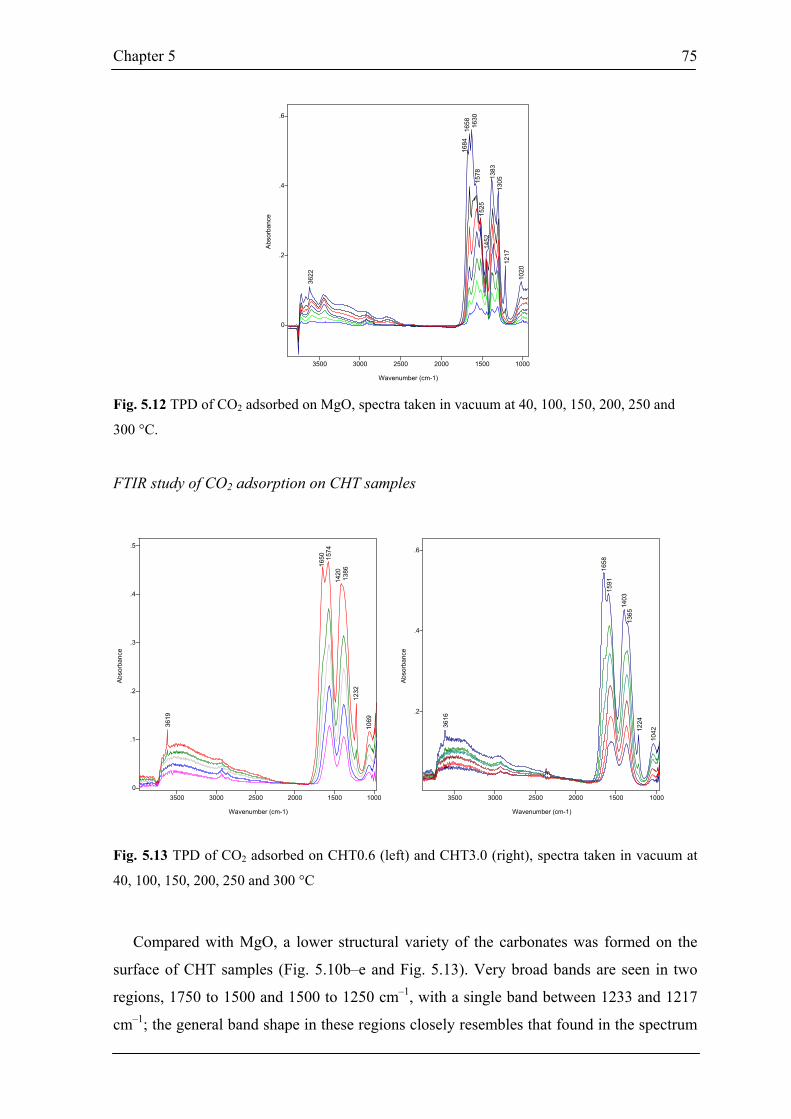
Chapter 5
75
0
.2
.4
.6
3500 3000 2500 2000 1500 1000
Wavenumber (cm-1)
Abs
orba
nce
1684
1020
1217
1525
1452
1383
1578
1658
3622
1305
1630
Fig. 5.12 TPD of CO2 adsorbed on MgO, spectra taken in vacuum at 40, 100, 150, 200, 250 and
300 °C.
FTIR study of CO2 adsorption on CHT samples
0
.1
.2
.3
.4
.5
3500 3000 2500 2000 1500 1000
Wavenumber (cm-1)
Abso
rban
ce
1069
1232
1420
1386
1574
1650
3619
.2
.4
.6
3500 3000 2500 2000 1500 1000
Wavenumber (cm-1)
Abso
rban
ce
104212
24
1403
1365
1591
1658
3616
Fig. 5.13 TPD of CO2 adsorbed on CHT0.6 (left) and CHT3.0 (right), spectra taken in vacuum at
40, 100, 150, 200, 250 and 300 °C
Compared with MgO, a lower structural variety of the carbonates was formed on the
surface of CHT samples (Fig. 5.10b–e and Fig. 5.13). Very broad bands are seen in two
regions, 1750 to 1500 and 1500 to 1250 cm–1, with a single band between 1233 and 1217
cm–1; the general band shape in these regions closely resembles that found in the spectrum

Chapter 5
76
of MgO without the distinct maxima. The band for bicarbonates formed on the surface
broadens and shifts to lower wave numbers (from 1233 cm–1 for CHT0.6 in Fig. 10b to
1220 cm–1 for CHT3.0 in Fig. 5.10e) as the Mg/Al ratio increases; its intensity also gives
information about the number of OH– species and compares the basicities of surface
hydroxyl groups [243,244]. Based on the ∆ν3 splittings between 188 and 226 cm–1, the
maxima at 1591–74 and 1386–65 cm–1 could be assigned to monodentate surface
carbonates. On the other hand, the thermal stability of these species is rather high. The
bands are observed even after evacuation at 300 °C. Thus, as in the case of MgO, the
formation of polydentate structures is likely, similar to that of bulk species [244].
The strength and the amount of base sites
According to Davydov et al. [246], the formation of different types of carbonates is
related to the basicity of the surface oxygen atoms. It was postulated that the structural
nonuniformity of oxygen ions on the catalyst surface leads to differences in the effective
negative charge of the oxygen ions, i.e., their basicity, and that this causes the formation of
different carbonate structures. The spectral parameter, ∆ν3, was proposed as a measure of
the relative strength of surface basic sites [246]: the smaller the ∆ν3 value, the stronger the
surface basic site is involved in the interaction with CO2.
Based on the ν3 splittings, the following conclusions can be drawn. Al2O3 exhibits the
weakest Lewis basicity with ∆ν3 values of 552 and 439 cm–1 for the bridged and bidentate
carbonate species, respectively. The strongest basicity was observed for MgO, which
formed monodentate species with CO2 and exhibits the smallest ∆ν3 of 134 cm–1. The
calcined hydrotalcites are less basic than MgO, but more basic than Al2O3. Here, the
strength of basic sites (decrease in ∆ν3) of the CHT samples decreases with increasing
magnesium content in the following order: CHT0.6 (188 cm–1) > CHT1.4 (209 cm–1) >
CHT2.2 (225 cm–1) ≈ CHT3.0 (226 cm–1). The relative amount of surface, basic oxygen
atoms (Lewis base sites) was estimated by the integration of the carbonate bands (1572,
1444, 1517 and 1388 cm–1 for MgO, and bands at 1574–1581 and 1368–1386 cm–1 for
CHT samples) after evacuation at 150 °C, i.e., after removal of bicarbonate species
(spectra not shown). When the amount of Lewis base sites is normalized by weight,
intensities decreased for the samples in the following order: CHT3.0 ~ CHT1.4 ~ MgO >
CHT2.2 > CHT0.6 >> Al2O3. CHT3.0 has the highest number of weakest Lewis base sites
(higher splitting), whose strengths are similar to those found on CHT2.2; Lewis base sites
on CHT0.6, the most catalytically active sample, are the strongest, but few in number.

Chapter 5
77
These findings agree with results of Corma et al. who observed that the total amount of
basic sites increases, but the proportion of stronger basic sites decreases with increasing
Mg/Al molar ratio of calcined hydrotalcites [229].
Finally, the intensity of the OH– deformation band (around 1230 cm–1) for surface
bicarbonates after evacuation at 40 °C has been used to quantitatively determine the
number of basic OH– species [245]. The amount of basic OH– groups (Brønsted base sites)
on the surface of the calcined hydrotalcites does not correlate linearly with an increase in
the Mg/Al ratio (Fig. 5.14). Interestingly enough, however, the decrease in the band
intensities (amount of OH– species), CHT0.6 > CHT3.0 > CHT1.4 > CHT2.2 (Fig. 5.14),
does correlate with catalytic activities found for the CHT samples in the Michael addition
of 2-methyl-cyclohexane-1,3-dione. This is not true of the Michael addition with the
cyclopentanone and cyclohexanone, in which CHT1.4 was less active than CHT2.2. The
shift of the 1230-cm–1 band to lower wave number indicates that the strengths increase
with Mg content from CHT0.6 to MgO. Thus, CHT0.6 has a high number of Brønsted base
sites; the Brønsted base sites on CHT3.0 are lower in number, but stronger. This may
explain why both of these samples achieved the highest catalytic yields.
0.0
0.5
1.0
1.5
2.0
2.5
3.0
Increasing Mg content
MgO
CHT3.0
CHT2.2
CHT1.4
CHT0.6
Al2O
3
Inte
nsity
of
δ(O
H) b
and
aro
und
1220
cm
-1
Fig. 5.14 Intensity of band around 1220 cm–1 after evacuation at 40 °C
5.4.3 Microcalorimetric measurements
The base sites were further characterized by a series of microcalorimetric measurements
using a gaseous probe molecule, CO2, and a liquid probe molecule, benzoic acid, to gain
new insights into and supplementary information on the basic sites and differences in their
behavior in gas atmosphere and in solution.
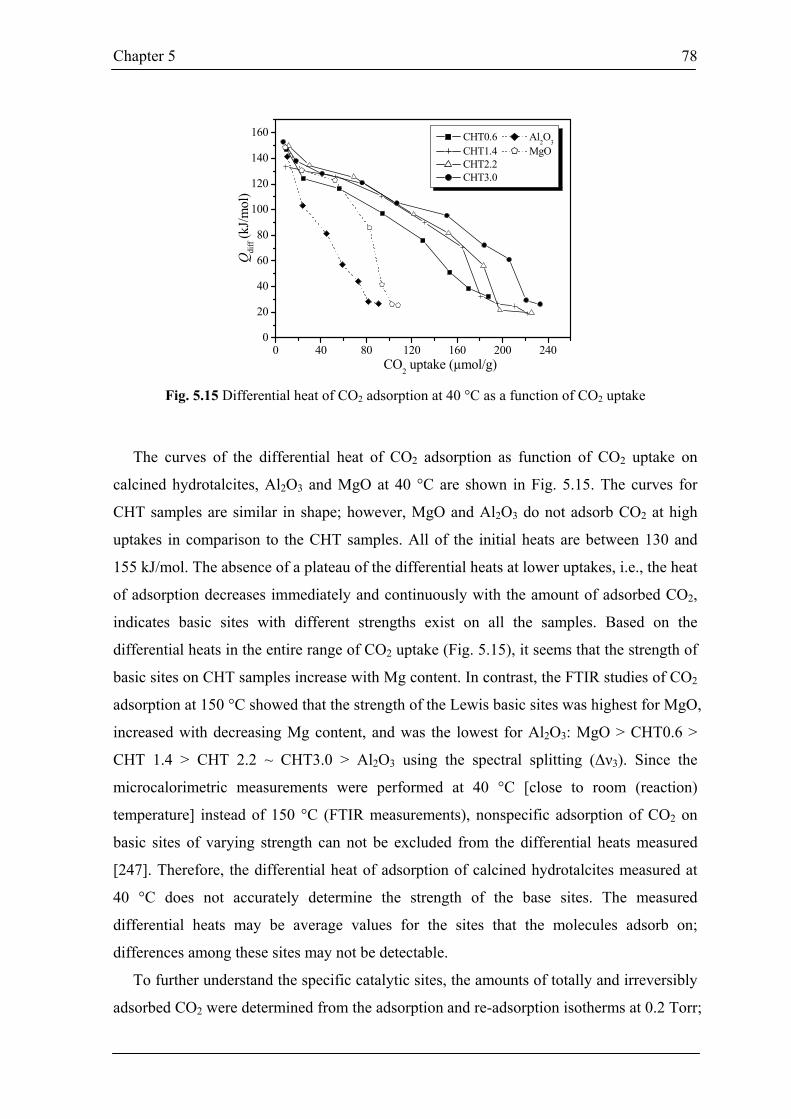
Chapter 5
78
0 40 80 120 160 200 2400
20
40
60
80
100
120
140
160
Q
diff (k
J/mol
)
CHT0.6 Al2O3 CHT1.4 MgO CHT2.2 CHT3.0
CO2 uptake (µmol/g)
Fig. 5.15 Differential heat of CO2 adsorption at 40 °C as a function of CO2 uptake
The curves of the differential heat of CO2 adsorption as function of CO2 uptake on
calcined hydrotalcites, Al2O3 and MgO at 40 °C are shown in Fig. 5.15. The curves for
CHT samples are similar in shape; however, MgO and Al2O3 do not adsorb CO2 at high
uptakes in comparison to the CHT samples. All of the initial heats are between 130 and
155 kJ/mol. The absence of a plateau of the differential heats at lower uptakes, i.e., the heat
of adsorption decreases immediately and continuously with the amount of adsorbed CO2,
indicates basic sites with different strengths exist on all the samples. Based on the
differential heats in the entire range of CO2 uptake (Fig. 5.15), it seems that the strength of
basic sites on CHT samples increase with Mg content. In contrast, the FTIR studies of CO2
adsorption at 150 °C showed that the strength of the Lewis basic sites was highest for MgO,
increased with decreasing Mg content, and was the lowest for Al2O3: MgO > CHT0.6 >
CHT 1.4 > CHT 2.2 ~ CHT3.0 > Al2O3 using the spectral splitting (∆ν3). Since the
microcalorimetric measurements were performed at 40 °C [close to room (reaction)
temperature] instead of 150 °C (FTIR measurements), nonspecific adsorption of CO2 on
basic sites of varying strength can not be excluded from the differential heats measured
[247]. Therefore, the differential heat of adsorption of calcined hydrotalcites measured at
40 °C does not accurately determine the strength of the base sites. The measured
differential heats may be average values for the sites that the molecules adsorb on;
differences among these sites may not be detectable.
To further understand the specific catalytic sites, the amounts of totally and irreversibly
adsorbed CO2 were determined from the adsorption and re-adsorption isotherms at 0.2 Torr;

Chapter 5
79
this pressure was chosen because the level of irreversible adsorption is practically constant
above it. The quantitative results are shown in Table 5.2.
Table 5.2
Total and irreversible adsorption of CO2 at p = 0.2 Torr at 40°C
Catalyst Vtot (µmol/g) Virr (µmol/g) Virr/Vtot
CHT0.6 155.6 110.3 0.71
CHT1.4 189.4 154.6 0.82
CHT2.2 184.9 140.5 0.76
CHT3.0 201.4 166.5 0.83
Al2O3 70.2 44.0 0.63
MgO 97.0 75.1 0.77
The total amount of adsorbed CO2 including reversible and irreversible adsorption
decreases in the following order: CHT3.0 > CHT 2.2 ~ CHT 1.4 > CHT 0.6 > MgO >
Al2O3. The CO2 amount decreases with a decrease in Mg content except for MgO.
Reversible adsorption involves weak interactions and is ascribed mainly to physisorption.
The irreversibly adsorbed CO2 corresponds to the chemisorption of CO2; the amount of
chemisorbed CO2 (Virr) decreases in the following way: CHT3.0 > CHT1.4 > CHT2.2 >
CHT0.6 > MgO > Al2O3. The portion of CO2 chemisorbed on Al2O3 of 0.63 is slightly
lower than that of the other samples: 0.71–0.83. MgO has a lower total CO2 uptake (97.0
µmol/g) and a lower amount of chemisorbed CO2 (75.1 µmol/g) than those of the calcined
hydrotalcites. This may result from the formation of bulk carbonates on strong basic sites
on MgO, which are then blocked and inaccessible to CO2. Species (CO2) with high thermal
stability that exhibit a rather low ∆ν3 splitting (134 cm–1 for MgO is smallest observed
here), can have a polydentate structure similar to that of bulk species. The intensity of the
bands, which corresponds to the amount of Lewis basic sites, decreases similarly to Virr
values observed: CHT3.0 ~ CHT1.4 ~ MgO > CHT2.2 > CHT0.6 > Al2O3 with exception
of MgO (FTIR). This suggests the results of microcalorimetric gas-phase CO2 adsorption
under our conditions do give some information about the amount of basic sites, but are not
accurate in regard to strength.

Chapter 5
80
0 50 100 150 200 250 300 3500
50
100
150
200
250
300
CHT0.6 MgO CHT1.4 CHT2.2 CHT3.0
Qdi
ff(kJ/m
ol)
Adsorbed benzoic acid (µmol/g)
0 20 40 60 80 100 120
0
10
20
30
40
50
Qin
t(J/g
)
CHT0.6 MgO CHT1.4 CHT2.2 CHT3.0
Amount of Benzoic Acid introduced (µmol) Fig. 5.16 Differential heat (up) and integral heats (down) of adsorption of benzoic acid in toluene
measured by microcalorimetry at 70 °C, except for that of MgO (at 40 °C)
Benzoic acid is used for the measurement of the strength and amount of basic sites by
indicator titration [11]. Microcalorimetric measurements with benzoic acid in toluene were
also performed here to measure basicity under liquid phase conditions identical to that of
the catalytic test reactions studied here. The curves of the differential heat and integral heat
of adsorption are shown in Fig. 5.16 for MgO and CHT0.6–2.2. The number of base sites
(amount of benzoic acid uptake) differs from that found using CO2 and decreases in the
following order: CHT0.6 > MgO > CHT3.0 > CHT2.2 ~ CHT1.4; in this case, not CHT3.0,
but CHT0.6 has the most base sites and MgO has more sites using the benzoic acid probe
molecule than the rest of the CHT samples. Based on the integral heats measured, the
following order of decreasing strength was observed: CHT3.0 > CHT0.6 > MgO > CHT1.4
≈ CHT2.2. The change in the order of decreasing amounts of acid sites, i.e., MgO after

Chapter 5
81
CHT0.6 has the second highest amount of base sites found using benzoic acid, could be a
direct effect of the absence of site blocking by the probe molecule.
Since chemisorption of CO2 occurs on the catalytically active base sites, the amount of
chemisorbed CO2 should correlate with the catalytic results. However, here, the gas phase
microcalorimetric results do not agree with the activities found for the liquid phase
Michael reactions. In contrast, the activities of CHT samples in the Michael additions
directly relate to the amount of the base sites determined by liquid phase microcalorimetric
measurements. This reflects the difference in behavior of base sites in the gas and liquid
phase. Differences in the base site properties of MgO with the probe molecules, however,
also suggest that the chemistry of the probe molecule may influence their number and
strength. Interestingly enough, the base sites of CHT1.4 and 2.2 were similar in strength
and number using the probe molecule, benzoic acid; these sites were also similar in
number based on gas phase microcalorimetry experiments, but CHT1.4 chemisorbed more
CO2 than CHT2.2. These gas phase result indicate some differences between CHT1.4 and
2.2 and may begin to explain the reactant-dependent catalytic behavior of these two
samples.
5.5 Correlation of catalytic behavior and the acid-base properties
Information regarding the nature, strength and number of the acid-base sites obtained
from the FTIR and microcalorimetric measurements is crucial to understanding the
relationship between acid-base properties and catalytic activities. To clarify this
relationship the results of these measurements and findings are discussed here by
answering several questions.
Is the acidity responsible for the activity?
Michael additions can be catalyzed by not only base catalysts, but also acid catalysts.
Acid-catalyzed Michael additions have been reported for such catalysts as acetic acid [159]
(homogeneous catalyst) and metal complexes [146] or TS-1 molecular sieve [147] (both
heterogeneous catalysts). However, among the oxide catalysts studied here, Al2O3, which
has the strongest and highest amount of Lewis acid sites (IR, pyridine adsorption), as well
as the weakest and lowest amount of base sites compared with CHT samples (IR, CO2
adsorption) was the least active in the Michael additions. Moreover, when HS-AlF3 [248],
a very strong Lewis acid, was used as a catalyst for the Michael addition with 1,3-dione,

Chapter 5
82
no obvious activity was observed. These results suggest that the acid sites are not the main
ones responsible for catalytic activity and that they cannot catalyze the Michael additions
independently of base sites. Interestingly enough, Al2O3 does show a considerable activity
(50% catalytic yield) in the Michael addition of 2-acetylcyclopentanone (pKa = 7.8) (Fig.
5.5A). The presence of weak base sites combined with mild acid sites on Al2O3 can
catalyze the Michael addition to some extent. In other words, the important active sites
determining the catalytic activity for Michael additions investigated here are base sites.
However, the cooperation of the acid sites with the base sites can not be excluded. This is
indicated by the very high activity of CHT0.6, the only sample to exhibit acid sites similar
to those found in Al2O3, but much lower in number (IR, pyridine adsorption). These acid
sites are much stronger than those in the other CHT samples.
Which base sites contribute to the Michael additions, Brønsted base or Lewis base sites or
both?
For hydrotalcites, Brønsted base sites (OH– groups) are the main base sites. However,
Lewis and Brønsted base sites (O2– anions) are present on the surface of MgO and the
calcined hydrotalcites (CHT samples). As demonstrated in the Michael additions of 1,3-
diones, both kinds of sites catalyze the reaction. This result is very different from that of
Choudary et al.[141], who observed that Brønsted base sites exclusively catalyzed the
Michael additions. Moreover, it is interesting that the amount of Brønsted base sites (Fig.
5.14) on the CHT samples correlates with the catalytic yields; CHT0.6 and CHT3.0, which
have the highest number of OH– groups (Brønsted base sites, Fig. 5.14), achieved the
highest catalytic yields. However, this does not prove that the Brønsted base sites are the
only active sites for the reactions. Lewis base sites on the CHT samples predominate with
respect to their amount and the strength in comparison to those of the Brønsted base sites;
this suggest that OH– groups enhance catalytic activity, but by no means exclusively cause
it.
Does the base strength influence the selectivity?
MgO did not selectively produce the target Michael adducts. This could be attributed to
the very strong Lewis basic character of MgO, which is demonstrated by FTIR; the
reaction pathway of the resulting consecutive reaction is shown in chapter 3. Mg(OH)2
exhibits the same poor selectivity as MgO in the reaction with the 1,3-dione because of its
expected strong Brønsted basicity, yet the reaction was much faster with Mg(OH)2 (4 h).

Chapter 5
83
This indicates that the reaction time needed decreases with an increasing number of
Brønsted base sites. It seems clear that Michael additions investigated here are selectively
catalyzed by moderate strength base sites, Brønsted base or Lewis base sites (∆ν3), in
methanol. The strength of the base sites that is lower than those on MgO prevents
consecutive reactions and yields high selectivities.
What is more important: the strength or the amount of moderate basic sites?
And what is the possible mechanism of reaction?
For the Michael additions, the performance of the calcined hydrotalcites in the reactions
depended on the Mg/Al molar ratios and the acidity of the Michael donors. The general
activity of the catalysts has following order: CHT0.6 > CHT3.0 > CHT2.2 ~ CHT1.4. A
direct (linear) correlation between the Mg/Al molar ratios and the catalytic behavior was
not observed. However, based on the catalytic behaviors, the four CHT catalysts can be
divided into two groups. One is the Al-rich sample CHT0.6, which showed the highest
activity in all three reactions. High yields (90–99%) were obtained after 24 h for all three
Michael additions. The second group includes the Mg-rich samples (Mg/Al > 1.0). Why
CHT0.6 is the most efficient catalyst should be related to its special acid-base properties.
Regarding strength, CHT0.6 (∆ν3 = 188 cm–1) has the strongest Lewis base sites after those
on MgO (∆ν3 = 134 cm–1) and medium-strength Lewis acid sites comparable to strength of
those on Al2O3. Regarding amount of base sites, CHT0.6 has the most Brønsted base sites
and highest total number of base sites determined by IR and liquid phase microcalorimetric
measurement, respectively. It is interesting to point out that the activity directly correlates
with the amount of the base sites determined by the liquid phase microcalorimetric
measurements. However, as mentioned above, the acid sites may participate in and
enhance the catalytic process, because the difference in the amount of the Lewis base sites
between CHT0.6 and the other three samples does not completely explain its outstanding
behavior in the Michael addition of 1,3-dione, especially with 2-acetylcyclohexanone with
a high pKa value.
Therefore, a plausible mechanism based on the cooperation of the acid sites with the
basic sites (synergy) is presented in Scheme 5.3. Initially, the 1,3-dione is exclusively
activated by deprotonation of the α-C atom between the two ketone groups by base site on
the surface of the catalyst to produce a carbanion. At the same time, methyl vinyl ketone
via its O atom is bonded to the surface of the adjacent Lewis acid site. Then, the carbanion
attacks the carbon atom at β-position of methyl vinyl ketone to form the product anion. The
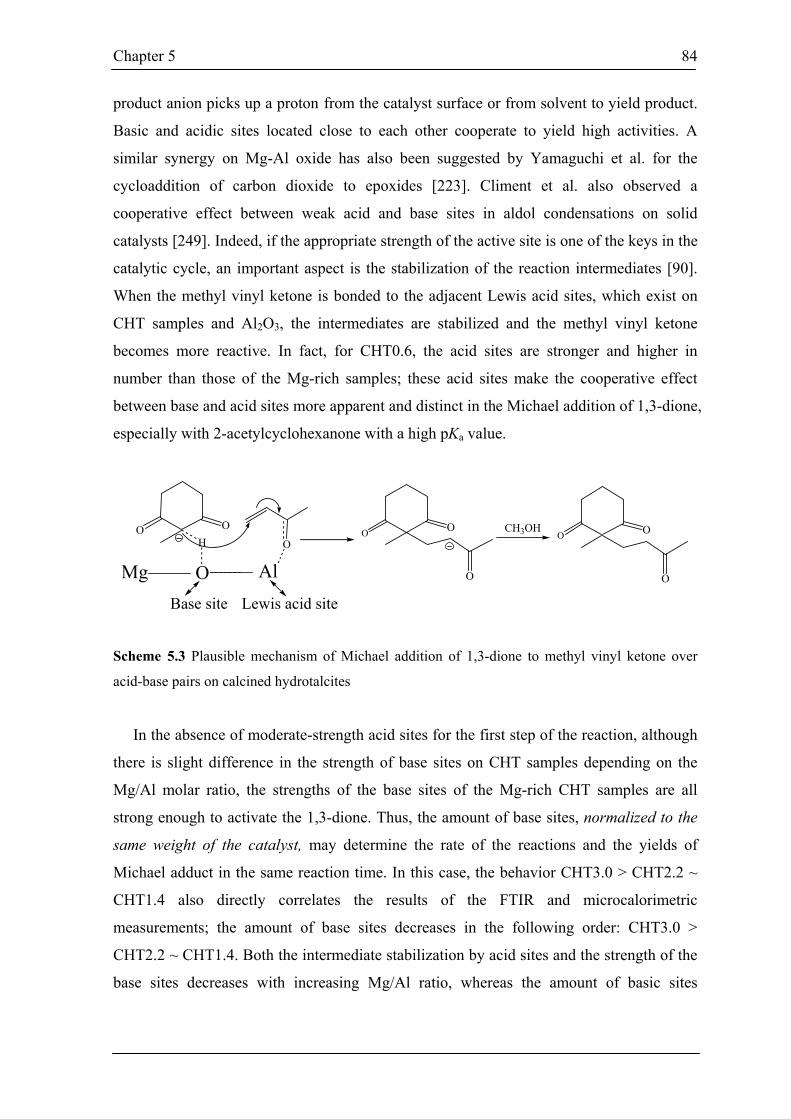
Chapter 5
84
product anion picks up a proton from the catalyst surface or from solvent to yield product.
Basic and acidic sites located close to each other cooperate to yield high activities. A
similar synergy on Mg-Al oxide has also been suggested by Yamaguchi et al. for the
cycloaddition of carbon dioxide to epoxides [223]. Climent et al. also observed a
cooperative effect between weak acid and base sites in aldol condensations on solid
catalysts [249]. Indeed, if the appropriate strength of the active site is one of the keys in the
catalytic cycle, an important aspect is the stabilization of the reaction intermediates [90].
When the methyl vinyl ketone is bonded to the adjacent Lewis acid sites, which exist on
CHT samples and Al2O3, the intermediates are stabilized and the methyl vinyl ketone
becomes more reactive. In fact, for CHT0.6, the acid sites are stronger and higher in
number than those of the Mg-rich samples; these acid sites make the cooperative effect
between base and acid sites more apparent and distinct in the Michael addition of 1,3-dione,
especially with 2-acetylcyclohexanone with a high pKa value.
O O
O
OMg AlH
O O
O
Base site Lewis acid site
O O
O
CH3OH
Scheme 5.3 Plausible mechanism of Michael addition of 1,3-dione to methyl vinyl ketone over
acid-base pairs on calcined hydrotalcites
In the absence of moderate-strength acid sites for the first step of the reaction, although
there is slight difference in the strength of base sites on CHT samples depending on the
Mg/Al molar ratio, the strengths of the base sites of the Mg-rich CHT samples are all
strong enough to activate the 1,3-dione. Thus, the amount of base sites, normalized to the
same weight of the catalyst, may determine the rate of the reactions and the yields of
Michael adduct in the same reaction time. In this case, the behavior CHT3.0 > CHT2.2 ~
CHT1.4 also directly correlates the results of the FTIR and microcalorimetric
measurements; the amount of base sites decreases in the following order: CHT3.0 >
CHT2.2 ~ CHT1.4. Both the intermediate stabilization by acid sites and the strength of the
base sites decreases with increasing Mg/Al ratio, whereas the amount of basic sites

Chapter 5
85
increases with higher Mg/Al ratios; this “compensation” explains the V-like (first decrease
then increase, Fig. 5.6) catalytic behavior of the CHT samples with increasing Mg/Al ratio.
In conclusion, the optimal balance of acid-base properties compared to that of Al2O3
and MgO makes the Al-rich calcined hydrotalcite an excellent catalyst in the Michael
addition of numerous 1,3-diones independent of their pKa values.
5.6 Conclusions
Calcined hydrotalcites exhibit Lewis acid, Brønsted base, and Lewis base sites. The Al-
rich sample (Mg/Al molar ratio of 0.6) possesses Lewis acid sites similar in strength to
those found on Al2O3, but stronger than those found on the Mg-rich hydrotalcites.
Hydrotalcites and calcined hydrotalcites catalyze the Michael additions of 2-
methylcyclohexane-1,3-dione, 2-acetylcyclopentanone, and 2-acetylcyclohexanone to
methyl vinyl ketone with high selectivity (no side product formation). These
heterogeneously catalyzed Michael additions in methanol proceeded faster than the
solvent-free reactions.
Pure Al2O3 was the least active among the investigated catalysts. Both the Al-rich
hydrotalcite and calcined hydrotalcite (Mg/Al molar ratio of 0.6) gave product yields
above 95% within 24 h.
A nonlinear correlation between the Mg content and catalytic activity suggested the
activity of pure MgO surpasses that of the calcined hydrotalcites, but causes consecutive
reactions of the Michael addition products, which reduce the product selectivities and
yields.
Catalytic activity correlates with the amount of the base sites determined by benzoic
acid microcalorimetry dependent on the Mg/Al molar ratio.
An optimal balance of acid-base properties may make the Al-rich calcined hydrotalcite
an excellent catalyst in the Michael addition of numerous 1,3-diones independent of their
pKa values.

Chapter 6
86
CChhaapptteerr 66
SSooll--ggeell pprreeppaarraattiioonn,, cchhaarraacctteerriizzaattiioonn aanndd
ccaattaallyyttiicc bbeehhaavviioorr ooff MMgg((OO,,FF))

Chapter 6
87
6.1 Introduction
Sol-gel preparation of catalytic materials has the ability to change physical
characteristics such as surface area, pore size distribution and pore volume, and vary
compositional homogeneity at a molecular level. Moreover, during sol-gel step, it is
possible to introduce several components into solution to prepare multi-component oxides
and bimetallic catalysts. A promoter or an active species can also be introduced to catalysts
by sol-gel process. With its versatility and excellent control on a product’s characteristics,
sol-gel method has played an important role in catalyst preparation and will continue to do
so [250].
In chapter 3, MgO catalysts were found too strong solid base to catalyze Michael
addition selectively; in contrast, in chapter 5 calcined Mg-Al hydrotalcites (mixed oxides)
with suitable acid-base properties are highly efficient and selective catalysts for Michael
additions. F– and O2– are similar “basic” anions; however, MgF2 is neutral and catalytically
inactive, while MgO is a strong base.Thus, the question was if by sol-gel method OH– or
O2– groups can be introduced into the MgF2 framework and obtain new compounds and
tune the acid-base properties of the resulting materials.
Recently, a novel facile sol-gel synthesis route was reported to prepare high-surface-
area X-ray amorphous metal fluorides [248,251], such as AlF3 and MgF2. The resulting
high-surface-area AlF3 (HS-AlF3) has not only a very high surface area but also an
extremely strong Lewis acid [248]. More recently, the first aluminum alkoxide fluoride
was prepared by a sol-gel fluorination method and the process of fluorination was
presented in detail [252]. As in the case of oxides, the sol-gel process was proved an
efficient method to prepare fluoride compound with special properties. Meanwhile, “F-
anion-doped” metal oxo/hydroxidefluorides prepared by fluorination of metal oxides
[253,254,255], aluminum chloride fluoride [256] and aluminum bromide fluoride [257]
were proved to have some special structure and catalytic properties in many acid-catalyzed
reactions. Acidic Al(III), Cr(III), Fe(III) oxyhydroxy-fluorides were also synthesized by
Demourgue et al. [258]. A review about fluorinated metal oxides and metal fluorides as
heterogeneous catalysts is also available [259].
Therefore, in this chapter, an amorphous-like magnesium oxide/hydroxidefluoride,
Mg(O,F), with high surface area was prepared by soft sol-gel fluorination-hydrolysis
method for the first time and the structure properties are studied by XRD, FTIR, XPS, 19F
Chapter 6
88
MAS NMR. Magnesium oxide/hydroxidefluoride catalysts were also tested in Michael
additions of CH-acid compounds with methyl vinyl ketone.
6.2 Sol-gel preparation
Sol-gel method is widely used to prepare materials with high surface areas, such as
ZrO2 [260], Al2O3 [261] and MgO [177,262]. Generally, at its simplest level, sol-gel
process can be achieved through the hydrolysis and condensation of a metal alkoxide.
hydrolysis: ─M─OR + H2O ─M─ OH + ROH
condensation: ─M─ OH + XO─M─ ─M─ O─M─ + XOH (X = H or R)
However, using Mg(OCH3)2, the sol-gel process may involve following reactions:
hydrolysis: Mg(OCH3)2 + 2H2O Mg(OH)2 + 2CH3OH (6.1)
Mg(OCH3)2 + H2O Mg(OCH3)(OH) + CH3OH (6.2)
Mg(OCH3)(OH) + H2O Mg(OH)2 + CH3OH (6.3)
condensation: ─Mg─OH + ─Mg─OH ─Mg─O─Mg─ + H2O (6.4)
─Mg─OCH3 + ─Mg─OH ─Mg─O─Mg─ + CH3OH (6.5)
The formation of gel from the hydrolysis of alkoxides involves simultaneous hydrolysis
and polycondensation reactions. It is found the hydrolysis does not complete according to
Eq.(6.1) even an adequate amount of water is added. Instead, a stepwise hydrolysis
according to Eq.(6.2) and Eq.(6.3) are suggested [263]. Eq.(6.3) is also suggested to be
reversible reaction, therefore, the hydrolysis may proceed to completion as shown in
Eq.(6.2), but not complete according to Eq.(6.3). Moreover, condensation reactions
[Eq.(6.4) and Eq.(6.5)] are simultaneous to hydrolysis, which may be the reason why the
hydrolysis step does not complete. Finally, an intimate gel of MgO–Mg(OH)2–
Mg(OCH3)(OH) may be obtained.
In our case of preparation of magnesium oxide/hydroxidefluoride, before the hydrolysis
step, Mg(OCH3)2 is first partial fluorinated with anhydrous HF/Et2O solution via following
reaction [Eq.(6.6)]:
fluorination: Mg(OCH3)2 + xHF Mg(OCH3)2-xFx + xCH3OH (6.6)
If stoichiometric amount of HF is used, it is supposed to obtain pure MgF2. Since MgF2 is
a neutral material, which is of less interest, our aim is not to prepare MgF2. Moreover, in

Chapter 6
89
the case of preparation of high-surface-area AlF3, under non-aqueous conditions, it was
found only aluminum alkoxide fluoride was obtained even stoichiometric amount of HF
was used. Thus, a second gas phase fluorination step was applied to get the pure high-
surface-area of AlF3 [248]. However, here, after fluorination, further hydrolysis is used to
introduce –OH groups into the framework of the final product via following reaction
[Eq.(6.7)].
hydrolysis: Mg(OCH3)2-xFx + y H2O Mg(OCH3)2-x-yFx(OH)y + yCH3OH (6.7)
Consequently, the sol-gel process for the preparation of magnesium
oxide/hydroxidefluoride with different F contents (see Table 6.1, MOF-0.4–MOF-2.0)
involved two steps (scheme 6.1): (1) Synthesis of fluoride precursor gel under non-aqueous
conditions by partial fluorination of magnesium methoxide with anhydrous HF/Et2O
solution (HF is dangerous, which must be handled with care); 2) one-pot hydrolysis of the
precursors by adding moderate excess of water to the gel. By this soft sol-gel method,
fluoride and hydroxide groups can be simultaneously introduced into the network of the
final product. Typically, dried CH3OH (100 mL) was added to magnesium metal (5.0 g,
small turnings, 99.98%, Aldrich) in a round-bottom flask with a reflux condenser. After the
mixture reacted for about 1─2 h, the Mg(OCH3)2 solution was transferred to a PTFE
(polytetrafluoroethylene) bottle. Then a certain amount of HF/Et2O (17.4 mol/L) was
added to Mg(OCH3)2 drop by drop at 0 °C in an ice bath and the resulting mixture was
stirred for 4─6 h in the tightly closed PTFE bottle. After that, certain amount (a two-fold
stoichiometric amount) of distilled water was then added and the reaction mixture was
stirred overnight. The finial gel was evaporated under vacuum at around 50 °C to produce
dry powder. The dry powder was calcined in a flow-through tube furnace at 350 °C under
Ar for 3 h to get the catalyst for Michael addition. The detailed preparation conditions were
shown in Table 6.1.
crystalline mixture: MgO + MgF2 + unknown phase
Mg(OCH3)2
+x HF in Et2O
CH3OH + (2 - x) H2O
amorphous Mg(O,F)
Mg(OH)2-xFx·CH3OH·H2O
350 °CAr
>400 °C
Scheme 6.1 Sol-gel preparation of the Mg(O,F) samples

Chapter 6
90
Samples MgO-s and MgF2-s (Table 6.1) were also prepared by only hydrolysis step
with four-fold stoichiometric amount of H2O (MgO-s) and only fluorination step with 2.5-
fold stoichiometric amount of HF (MgF2-s), respectively. Meanwhile, the precursor
samples were also prepared by only partial fluorination step (i.e. without hydrolysis step,
see Table 6.1, MF-1.0–MF-2.0) as reference materials.
The series of samples (MOF and MF) are denoted in the following way: MOF-1.6 for
the magnesium oxyfluoride [Mg(O,F)] fluorinated with a preparation F/Mg ratio of 1.6 and
hydrolyzed; MF-1.6 for the magnesium oxyfluoride precursor fluorinated with a F/Mg
ratio of 1.6 without hydrolysis; MgO-s and MgF2-s are MgO and MgF2 prepared by sol-gel
method, respectively. MgF2-c is a commercially available MgF2 (Aldrich, 99%).
Table 6.1
Preparation conditions, elemental analysis results and texture properties of the samples
X (wt%) after calcinationb
Sample HF/Mg
(mol ratio)
H2O/Mg
(mol ratio)
C
(wt%)a C H F
F/Mge O/Mge
MgO-s 0 4.0 5.19 1.34 1.18 - - 1.1
MOF-0.4 0.4 3.2 5.86 3.15 2.12 10.19 0.3 1.0
MOF-0.8 0.8 2.4 7.85 3.94 2.26 23.36 0.5 0.9
MOF-1.2 1.2 1.6 5.93 2.86 1.57 28.10 0.8 0.7
MOF-1.6 1.6 0.8 5.01 1.51 1.02 40.60 0.9 0.5
MOF-2.0 2.0 0.8 3.12 0.20 0.23 49.19 - -
MF-1.0 1.0 0 17.87 11.67 3.02 23.99 - -
MF-1.6 1.6 0 10.00 2.95f 1.20f n.d. - -
MF-2.0 2.0 0 8.47 n.d. n.d. n.d. - -
MgF2-s 2.5 0 0.58 0.05 0.04 56.17 - -
MgF2-cc - - - 0.03c 0c 59.52c (62d) - -
a: before calcination b: after calcination in Ar at 350 °C c: commercial product without further calcination d: calculated value e: determined by XPS f: after calcination in air at 350 °C 6.3 Characterization of Mg(O,F) samples
Elemental analysis
The elemental analysis results of samples are summarized in Table 6.1. High carbon
contents (3–8 wt%) on the as-prepared samples could be attributed to remaining –OCH3

Chapter 6
91
groups [263,264] or adsorbed organic compounds. The remaining –OCH3 groups could not
even totally substituted by the second hydrolysis step. The carbon contents of dried
precursor gels (MF-1.0, MF-1.6 and MF-2.0, prepared without further hydrolysis step) are
much higher than that of corresponding final dried Mg(O,F) samples after hydrolysis (e.g.
10 wt% carbon content for MF-1.6 and only 5 wt% carbon content for MOF-1.6).
Compared the carbon contents, it indicates the second hydrolysis completed around 50%
during the sol-gel process. Thus, the hydrolysis step seems to be critical to the substitution
of alkoxy groups with hydroxy groups, yet the carbon contents indicates that the hydrolysis
step does not result in complete replacement of the methoxy groups with hydroxy groups
despite the two-fold stoichiometric amount of water used, which is same as the previous
results [263]. Hence, in our case, Mg (OCH3)2-x-yFx(OH)y (x and y depended on the HF/Mg
and H2O/Mg ratios) was probably formed after the fluorination and hydrolysis of the
solution of Mg(OCH3)2 in methanol.
After calcination, the carbon contents decrease more or less due to the remove of
residual organics. However, the remaining –OCH3 groups could not even totally removed
by calcination at 350 °C in Ar (Table 6.1), which agrees with the results in literature [265].
When the nominal ratio of HF/Mg was increased, the final carbon contents after
calcination decreased to some extent; the experimental fluorine contents increased linearly
with the amount of HF added (MOF series). It is interesting to note that the carbon content
of MgF2-s prepared by this method was only 0.58% and 0.05%, respectively, before and
after calcination. The low carbon contents found for MgF2-s suggests that the addition of
excess HF does lead to the complete removal of –OCH3 groups. On the other hand, the
fluorine content of this sample (56.17 wt%) indicates incomplete fluorination (MgF2: 62
wt%). Oxygen as either O2– or OH– must be present in the network. Compared the nominal
F contents, it was found that the F contents were less than the corresponding theoretical
values, even for MgF2-s, because HF could not completely react with Mg(OCH3)2 under
the conditions. The measured and calculated F content of commercial MgF2 are 59.52%
and 62%, respectively. The difference comes from the measurement.
Textural properties
The Mg(O,F) samples after calcination at 350 °C in Ar have very high surface areas
(270–390 m2/g, Table 6.2) with high pore volumes (0.37–0.56 cm3/g, Table 6.2) except
that MOF-2.0 has a relative lower surface area of 104 m2/g with pore volume of 0.38 cm3/g. However, the surface area of MgF2-s is only 27 m2/g, which is similar to that of MgF2

Chapter 6
92
prepared by normal methods [266]. Commercially available MgF2 has only surface area of
0.4 m2/g. The surface areas of the fluorinated MOF samples (MOF-0.4–1.6) may be
roughly related to the carbon (–OCH3) contents (high C, high SBET), whereas MgO-s has a
low carbon content (1.5 wt%) but an incredibly large surface area (373 m2/g). This
suggests a different relationship between the carbon content and surface area in systems
containing only magnesium and oxygen.
Table 6.2
Texture properties of the samples
Sample SBET (m2/g) VBJH-d (cm3/g)b davg (Å)c
MgO-s 373 0.58 62
MOF-0.4 327 0.37 46
MOF-0.8 387 0.45 48
MOF-1.2 363 0.56 62
MOF-1.6 278 0.46 66
MOF-2.0 104 0.38 146
MgF2-s 27 0.16 230
MgF2-ca 0.4 0.005 427
a: commercial product without further calcination b: BJH desorption cumulative pore volume of pores between 17.0 and 3000.0 Å diameter c: Average pore diameter by BET
The adsorption/desorption isotherms of all the samples are of type IV, which are
obtained for mesoporous adsorbents. The isotherms and hysteresis loops are slightly
different depending on the F contents (Fig. 6.1). Combination of the isotherm sharp with
the analysis of the shape and the width of the hysteresis loop can give the main information
on the texture characteristics of a solid [267]. Small mesopores in MgO-s and MOF-0.4–
1.6 are indicated by a closing of the hysteresis loop at P/Po values of ca. 0.4. Larger
mesopores are found in the samples with higher fluorine contents, MOF-2.0 and MgF2-s,
whose loops close at around 0.6 and 0.7, respectively. All the samples exhibit a limited
amount of macroporosity (i.e., slight increase in adsorption between 0.95 and 1.00), which
can be attributed to N2 adsorption between particles. The observed loops in Fig.6.1 indicate
that the types of pore formed depend on the fluorine content from small cone-shaped pores
(MgO-s) to ink-bottle pores (MOF-0.4 and MOF-0.8) to cylinder-shaped pores and parallel
plates (MOF-2.0 and MgF2-s, respectively) [267]. MOF-1.2 and MOF-1.6 exhibit two

Chapter 6
93
desorption steps but it is unclear if this is due to two different types of pores or to pores
with two different cross sections [268].
0
100
200
300
400
0
100
200
300
400
0
100
200
300
400
0.0 0.2 0.4 0.6 0.8 1.0
0.0 0.2 0.4 0.6 0.8 1.0
0
100
200
300
400
MgO-s
MOF-0.4
Adsorption Desorption
MOF-0.8
MOF-1.2
MOF-1.6
MOF-2.0
MgF2-s
Relative Pressure (P/P0)
Vol
ume a
dsor
bed
(cm
³g-1 S
TP)
Fig. 6.1 N2 adsorption/desorption isotherms of calcined Mg(O,F) samples
The pore size distributions of calcined Mg(O,F) samples are shown in Fig.6.2. The pore
size distributions of MOF-0.4–MOF-1.6 have maxima at 35 Å, except that MOF-1.6 has an
additional maximum at about 55 Å. However, MOF-2.0, MgO-s and MgF2-s exhibit
broader pore size distributions with maxima at higher values about 90, 60 and 135 Å,
respectively.

Chapter 6
94
20 30 40 50 60 70 80 90
0
1
2
3
4
5 MOF-0.4 MOF-0.8 MOF-1.2 MOF-1.6
Pore
vol
ume
dV
/dlo
g(D
) (cm
³g-1Å
-1)
Pore diameter (Å)0 40 80 120 160 200
0.0
0.4
0.8
1.2
1.6
2.0
Po
re v
olum
e
dV/d
log(
D) (
cm³g
-1Å
-1)
MgO-s MOF-2.0 MgF
2-s
Pore diameter (Å) Fig. 6.2 Pore size distributions of calcined Mg(O,F) samples
XRD study
Before calcination, all the dried samples are X-ray amorphous-like materials (Fig. 6.3A).
However, broad peaks around 2θ of 11 and 61° and the the decaying peak at 2θ of 33.5°
(Fig. 6.3A: a,b,c,d) indicate the presence of Mg(OH)x(OCH3)y or Mg(OH)x(OCH3)yFz (i.e.
the hydrolysis of –OCH3 groups is not totally completed) [263]. The XRD pattern is
similar to that of Mg(OCH3)1.3(OH)0.7 (PDF No.22-1788). This is also the reason why the
dried products have high carbon contents (3–8 wt%, Table 6.1). Broad characteristic peaks
around 2θ of 40 and 53° with very low intensity are observed in the patterns of MOF-1.6
(Fig. 6.3A:e) and MOF-2.0 (Fig. 6.3A:f), the samples with high F contents. Reference
MgF2-s prepared by this sol-gel method has all the characteristic peaks from MgF2 (PDF
No. 41-1443) and these peaks are all broad.
After calcination at 350 °C in Ar, MgO-s (Fig. 6.3B:a) and MgF2-s (Fig. 6.3B:g) show
the patterns of MgO (PDF No. 45-946) and MgF2 (PDF No. 72-1150), respectively.
However, the Mg(O,F) samples (MOF-0.4 to MOF-2.0) are still amorphous-like materials.
Characteristic peaks from Mg(OH)x(OCH3)yFz disappear more or less in the patterns of
MOF-0.4, MOF-0.8 and MOF-1.2 (Fig. 2B: b,c,d). Broad peaks for MgF2 in the patterns of
sample MOF-1.6 and MOF-2.0 (Fig. 6.3A: e,f) become a little sharper (Fig. 6.3B: e,f), still
with low intensities. In contrast, good crystalline MgF2 is formed (Fig. 6.3B: g) after
calcining the reference material MgF2-s under the same conditions. These results indicate
that crystallization process promoted by calcination is not obvious for Mg(O,F) samples.
Some special species formed during hydrolysis preserved the distortion during the
calcination. Further calcination at 550 °C led to the formation of separated crystalline
phases MgO and MgF2 (Fig. 6.3C: c,d,e,f). Further calcination at 550 °C led to separate,
crystalline phases of MgO and MgF2. The main phase was MgF2 for the samples with
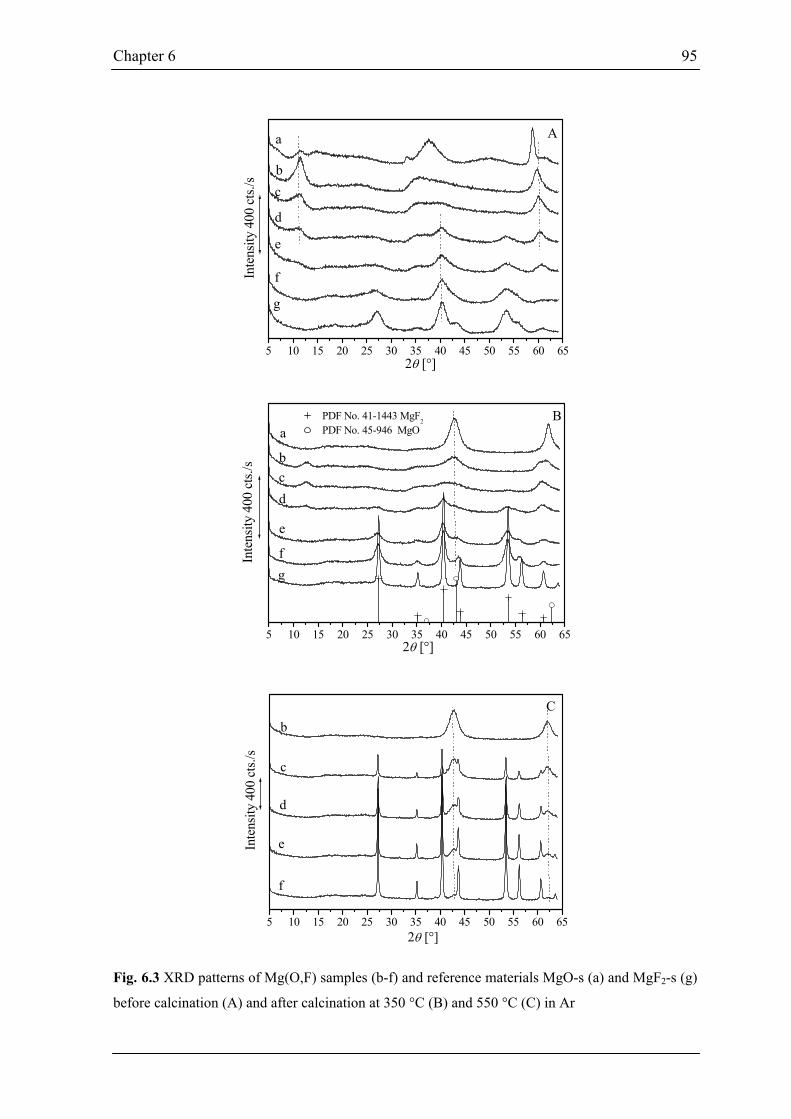
Chapter 6
95
5 10 15 20 25 30 35 40 45 50 55 60 65
A
g
f
e
d
cb
a
Inte
nsity
400
cts.
/s
2θ [°]
5 10 15 20 25 30 35 40 45 50 55 60 65
B
gf
e
dcb
a
In
tens
ity 4
00 c
ts./s
2θ [°]
PDF No. 41-1443 MgF2 PDF No. 45-946 MgO
5 10 15 20 25 30 35 40 45 50 55 60 65
C
f
e
d
c
b
2θ [°]
Inte
nsity
400
cts.
/s
Fig. 6.3 XRD patterns of Mg(O,F) samples (b-f) and reference materials MgO-s (a) and MgF2-s (g)
before calcination (A) and after calcination at 350 °C (B) and 550 °C (C) in Ar

Chapter 6
96
F/Mg ratios higher than 1.0. Peaks for both MgF2 and MgO indicated a mixture of these
phases in MOF-0.8, whereas the pattern of MOF-0.4 (Fig. 6.3C: b)with 10.2 wt% F
exhibited a pure MgO showing two broad MgO peaks and no MgF2 peaks, which can be
explained by that small amount of MgF2 is covered by MgO and can not be detected by
XRD.
Thermal analysis
-15
-10
-5
0
5
10
DTA /uV
60.0
65.0
70.0
75.0
80.0
85.0
90.0
95.0
100.0
TG /%
-1.2
-1.0
-0.8
-0.6
-0.4
-0.2
0
DTG /(%/min)
100 200 300 400 500 600 700Temperature /°C
0
0.2
0.4
0.6
0.8
1.0
1.2
1.4[4]
Ion Current *10-10 /ATG
DTA
m18
m17
m31
m19(x100)DTG
91
148 429
347-8.67
-10.20
↑ exo
Fig. 6.4 TG- DTA profiles of uncalcined MOF-1.6
The presence of –OH and –OCH3 in the framework was confirmed by simultaneous
thermal analysis (performed using a TA-MS device). TG-DTA profiles of the uncalcined
samples, MOF-1.6 (5.0 wt% C) is shown in Fig. 6.4. The TG curve (under N2) of MOF-1.6
shows an initial weight loss of about 8.7% below 320 °C mainly due to the desorption of
water [m/z = 17 (OH+), 18 (H2O+)]. The corresponding differential thermal analysis (DTA)
peak and endothermic effect are around 148 °C. However, the condensation of some
unstable –OH groups cannot be excluded completely in this case. The weight loss (10.2%)
from 320 to 600 °C corresponds to the loss of –OH and also some –OCH3 species. The
corresponding DTA curve with a strong endothermic peak with Ton 347 °C and Tp 429 °C
has to be attributed to the condensation reactions of –OH groups to produce H2O or
condensation reactions of –OH and –OCH3 groups to produce CH3OH, which is confirmed
by the ionic current signal for m/z = 18 (H2O+) and m/z = 32 (CH3OH+), respectively. The
thermal behavior of the sample after calcination at 350 °C in Ar is similar (not shown),
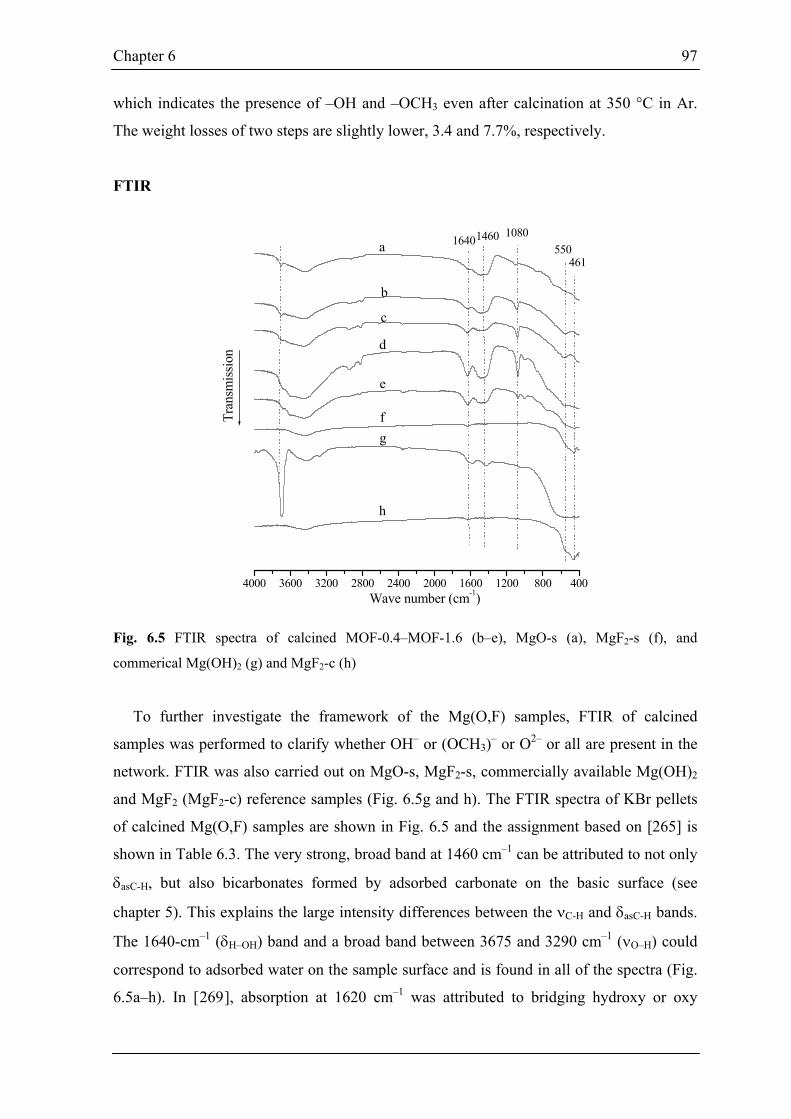
Chapter 6
97
which indicates the presence of –OH and –OCH3 even after calcination at 350 °C in Ar.
The weight losses of two steps are slightly lower, 3.4 and 7.7%, respectively.
FTIR
4000 3600 3200 2800 2400 2000 1600 1200 800 400
108016401460
Wave number (cm-1)
h
gf
e
d
c
b
aTr
ansm
issio
n550
461
Fig. 6.5 FTIR spectra of calcined MOF-0.4–MOF-1.6 (b–e), MgO-s (a), MgF2-s (f), and
commerical Mg(OH)2 (g) and MgF2-c (h)
To further investigate the framework of the Mg(O,F) samples, FTIR of calcined
samples was performed to clarify whether OH– or (OCH3)– or O2– or all are present in the
network. FTIR was also carried out on MgO-s, MgF2-s, commercially available Mg(OH)2
and MgF2 (MgF2-c) reference samples (Fig. 6.5g and h). The FTIR spectra of KBr pellets
of calcined Mg(O,F) samples are shown in Fig. 6.5 and the assignment based on [265] is
shown in Table 6.3. The very strong, broad band at 1460 cm–1 can be attributed to not only
δasC-H, but also bicarbonates formed by adsorbed carbonate on the basic surface (see
chapter 5). This explains the large intensity differences between the νC-H and δasC-H bands.
The 1640-cm–1 (δH–OH) band and a broad band between 3675 and 3290 cm–1 (νO–H) could
correspond to adsorbed water on the sample surface and is found in all of the spectra (Fig.
6.5a–h). In [269], absorption at 1620 cm–1 was attributed to bridging hydroxy or oxy

Chapter 6
98
groups in intermediate alkoxy/hydroxy compounds. A very weak band at 872 cm–1 (νC─O)
could indicate a negligible amount of methanol in the sample.
Table 6.3
Assignment of the FTIR absorption bands
Wave number (cm-1) Mode assigned Group or compound 3700 νO─H Hydroxyl group
3630 (3750─3000) νO─H Adsorbed water
2750─2970 νC─H Alkoxy group
1630─1650 δH─OH Adsorbed water
1400─1500 νC─O Carbonate ion
1050─1130 νC─O Alkoxy group
500─600 νMg─O Mg–OR
400─500 νMg─F Mg–F
The spectrum of MgO-s (Fig. 6.5a) shows a band at 3700 cm–1 for isolated OH groups.
Very weak vibrations observed between 3000 and about 2750 cm–1 (νC–H) and 1087 cm−1
(νC–H or νC–O) suggests the presence of very few methoxy groups in this sample. The
spectra of the MOF samples and MgO-s vary in their band intensities except for the band(s)
at 1087 cm–1 (and 1001 cm–1 in Fig. 6.5e) and the region above 3000 cm–1 and below 600
cm–1. The following changes are observed in the MOF spectra with increasing fluorine
contents: the OH-band at 3700 cm–1 decreases in intensity and shifts to lower wave number;
a second band at 3609 cm–1 appears (Fig. 6.5d) and increases in intensity (Fig. 6.5e); the
1080-cm–1 band becomes stronger (Fig. 6.5b–d) and then decreases in intensity (Fig. 6.5e),
while a weaker band appears at 1000 cm–1 (Fig. 6.5e); bands below 600 cm–1 are shifted. It
seems the isolated OH groups become bridged when higher amounts of fluorine are present
in the network. The spectrum of Mg(OH)2 (Fig. 6.5g) has a very strong band at 3700 cm–1
for the isolated OH group characteristic. Carbonates are also found on the surface of
Mg(OH)2 (1460 cm–1 band). Whereas adsorbed water is observed on the surface of the
hydroxide, very little water is found on the surface of MgF2 (MgF2-s and MgF2-s, Fig. 6.5f
and h). The only strong bands for these two samples are observed below 600 cm–1 and can
be attributed to νMg–F [270]. The main band is at 460 cm–1 with a shoulder at 550 cm–1 and
a sharp but weak band at 410 cm–1. The crystal structure of MgF2 (ICSD No. 56506, PDF
No. 41-1443) contains two Mg–F bonds (2.012 and 1.988 Å).
In the range of 400–600 cm−1, the bands of calcined Mg(O,F) samples (Fig. 6.5b–e) are
different with that of MgF2 (Fig. 6.5f and 6.5e) and MgO-s (Fig. 6.5a). The band at 550

Chapter 6
99
cm−1 (Mg–OR stretching [271]) are observed in the spectra (Fig. 6.5b and 6.3c) of calcined
MOF-0.4 and MOF-0.8, which contain low F content (< 25 wt% F). However this band
does not appear in the spectrum of calcined MgO-s. Meanwhile, the band of Mg–F
stretching mode for MgF2 (MgF2-s and MgF2-c) around 460 cm−1 (Fig. 6.5f and 6.3h) is
not observed in all the spectra of calcined Mg(O,F) samples (Fig. 6.5b–e). These results
can be explained by the coexistence of Mg–O(R) and Mg–F in the different coordinated
Mg spheres of calcined Mg(O,F) samples.
19F MAS NMR
-100 -120 -140 -160 -180 -200 -220 -240 -260 -280 -300
g**
Chemical shift (ppm)
5*10
8
f
-176.7
e
d
c
b
a-158-167.8 -192
-184.4
-198.4
Fig. 6.6 19F MAS NMR spectra of MOF samples after calcination at 350 °C: (a) MOF-0.4, (b)
MOF-0.8, (c) MOF1.2, (d) MOF-1.6, (e) MOF-2.0, (f) MgF2-s, and (g) MgF2-c
From the structure of the crystal solvate of magnesium methoxide with methanol, Mg
atom is octahedrally coordinated [272]. During the fluorination-hydrolysis process, F and

Chapter 6
100
OH could substitute for –OCH3 groups to form MgOxF6-x octahedrally coordinated units.
The coordinative state depends on the relative F and O contents.
High-solution solid-state 19F MAS NMR was used to study the fluorine coordination
species in calcined Mg(O,F) samples. The spectra of the samples with different fluoride
contents and the commercial MgF2 (MgF2-c, without further treatment) are shown in Fig.
6.6. For MgF2-c (Fig. 6.6f), only signal around –198 ppm is observed which corresponds to
the bridging fluorine in octahedrally coordinated MgF6 sphere [251,273]. Crystalline,
tetragonal MgF2 (ICSD 56506, PDF No. 41-1443) has only one crystallographically unique
fluorine atom, which coordinates three Mg atoms (Mg–F lengths: 2.0119, 2.0119, and
1.9883 Ǻ and Mg–F–Mg bond angles: 129.9, 129.9, and 100.2°). Calcined MgF2-s has
similar spectrum as commercial MgF2 with an additional small signal at –184 ppm, which
suggests a second type of fluorine coordination species in this sample. After calcination of
the same sample at 550 °C, a very weak peak in the XRD pattern (Fig.6.3C: f) indicated a
separate and minor phase of MgO. Thus, it seems there are minor mixed lattice regions
(MgOxFy) in the network, in which the fluorine coordination (Mg–F bond lengths and Mg–
F–Mg angles) is different than that found in MgF2. With the decreasing fluorine
concentrations of the Mg(O,F) samples, the 19F MAS NMR signals (Fig. 6.6d–a) become
broader. MOF-2.0, MOF-1.6 and MOF-1.2 have the same maximum at around –198 ppm
as MgF2-c. Meanwhile MOF-1.6 has two shoulder signals at around –192 and –184 ppm,
and MOF-1.2 has another maximum at –192 ppm. MOF-0.8 and MOF-0.4 have much
broader signals. Maximums at around –192 and –177 ppm with shoulders are observed,
respectively. The dominant fluorine species in these samples has a different coordination
compared to that in MgF2. Based on the spectra of all the samples, six resonance positions
from high to low field may be distinguished at about the chemical shifts of about –158, –
168, –177, –184, –192, and –198 ppm, which are supposed to be MgO5F, MgO4F2, MgO3F3,
MgO2F4, MgOF5, MgF6 (oxygen may come from oxo or hydroxyl group, fluorine may
come from bridge or terminal coordinated fluorine specie) coordination species in the first
octahedrally coordinated Mg sphere. The number of fluorine atoms coordinated to Mg
increases with fluorine chemical shift decreasing from high to low chemical shift field. A
similar trend between the number of fluoride atoms coordinated to aluminum and the
fluorine chemical shift was also observed in hydroxyl/oxyfluorides aluminum before (see
Fig.6.7) [274]. In this case, the broad signals may be ascribed to the coexistence of some
different fluorine coordination species. Meanwhile, the high disorder structure of Mg(O,F)
samples indicated by XRD may be another reason for the broad signals. The former

Chapter 6
101
interpretation is preferred because two maxima are observed in the spectrum of MOF-1.2
(Fig. 6.6c), which cannot simply be explained by the degree of the disorder of the sample.
-100 -120 -140 -160 -180
AlF6
AlF5O1
AlF4O2
AlF3O3
AlF2O4
AlF1O5
Fluorine chemical shift (ppm) Fig. 6.7 Typical 19F chemical shifts of octahedral aluminum environments with oxygen and
fluorine in the first coordination sphere, AlO6-xFx, versus x [274]
In 19F MAS NMR spectrum of MOF-1.6 calcined at 550 °C (Fig. 6.8) the signal around
–198 ppm with some weak signals (–150 to –190 ppm) appeared instead of the broad signal
with a maximum at –198 ppm of the sample calcined at 350 °C (Fig. 6.6d). This indicates
high temperature calcination can destroy the framework of Mg(O,F) and result in
crystalline MgF2. This result also agrees with the presence of crystalline MgF2 in XRD
patterns of the samples calcined at 550 °C (Fig. 6.3C). However, the weak signals
demonstrate negligible amount of certain or some unknown fluorine species were formed
during high temperature calcination, which can not be detected by XRD.
-100 -120 -140 -160 -180 -200 -220 -240 -260 -280 -300
-152-159-163.5
-169
-175
-182
-198.3
5*10
8
**
Chemical shift (ppm) Fig. 6.8 19F MAS NMR spectra of MOF-1.6 after calcination at 550 °C

Chapter 6
102
XPS
The XPS (Mg 1s, F 1s, O 1s) results of selected calcined Mg(O,F) samples and
commercially available MgF2 are shown in Fig. 6.9. The surface atomic ratios, F/Mg and
O/Mg, for the MOF samples were determined by integration of the XPS peaks in Fig. 6.9
and are given in Table 1. The XPS spectra of commercially available MgF2 (MgF2-c) was
measured and discussed in [251].
From the surface atomic ratio F/Mg and O/Mg, with the nominal F/Mg ratio increase,
the surface F/Mg increases and the O/Mg decreases. The O/Mg of MgO-s is 1.1, which
indicates that the surface species is MgO. This is consistent with the XRD result. For
calcined MOF-0.4, MOF-0.8 and MOF-1.2, the values of (2O/Mg+F/Mg) are more than
2.0, which indicates that besides O2– species on the surface there is OH– or (OCH3)–
species. This result agrees with the FTIR result. However, on the surface of calcined MOF-
1.6, the oxygen species is more likely O2– since the value of (2O/Mg+F/Mg) is almost
equal to 2.0, which means this sample seems to be a true magnesium fluoride exclusively
with O2– species.
Changes in the chemical environment of an atom may be followed by changes in the
photoelectron energies. From the binding energy (BE) of Mg 1s, it seems that when more F
is bonded to Mg from MgO-s to MOF-1.6, the Mg 1s BE shift to high value from 1302.7 to
1304.0 eV. This means the introduction of F does change the chemical environment of Mg.
The BEs of F 1s varied from sample to sample as shown in Fig.6.9, while there is not a
direct correlation between the BE and the F content. It is surprising to note that in the F 1s
spectrum of calcined MOF-1.2, there is an additional peak at around 687.6 eV besides the
peak at around 684.6 eV, which may be ascribed to the significantly different F chemical
environment. From the 19F MAS NMR spectra, obviously, calcined MOF-1.2 is the only
sample that has two separated peaks. It is the same case for calcined MOF-1.2 in the O 1s
spectra. Calcined MOF-1.2 has two peaks at around 530.8 and 533.5 eV, respectively.
Again, there is no direct correlation between the BE and the O content. The BE varies from
530.8 to 533.5 eV.

Chapter 6
103
1296 1298 1300 1302 1304 1306 1308 1310
1302.7
1302.6
1302.8
+
++
1303.0+
1304.0+
e
d
cba
In
tens
ity 2
0000
cts.
/s
Mg 1s d: MOF-1.6c: MOF-1.2b: MOF-0.8a: MOF-0.4e: MOF-0
Binding energy (eV)
678 680 682 684 686 688 690 692 694
685.1
684.5
684.6687.6
685.4
+
++
+
+
dcba
Inte
nsity
100
00 c
ts/s.
F 1sd: MOF-1.6c: MOF-1.2b: MOF-0.8a: MOF-0.4
Binding energy (eV)
524 526 528 530 532 534 536 538 540
530.9
530.8
531.4
533.5
531.6
+
++
+
+
d
c
ba
O 1s
d: MOF-1.6c: MOF-1.2b: MOF-0.8a: MOF-0.4
Inte
nsity
100
00 c
ts./s
Binding energy (eV)
Fig. 6.9 XPS results of Mg(O,F) samples after calcination at 350 °C in Ar

Chapter 6
104
TEM
TEM was used to study the morphology of calcined Mg(O,F) sample. The TEM of
calcined MOF-1.6 at 350 °C in Ar is shown in Fig. 6.10. Irregular shapes of particles
(around 10 nm) are observed, which has low contrast and are probably agglomerates of
much smaller particles. The selected-area electron diffraction patterns of the particles are
not very diffused, which indicates the particles are somehow crystalline. Because the
particles are very small, in XRD pattern of this sample, only broad peaks are observed.
According to the lattice distances measured from the diffraction rings, the predominant
phase may be MgF2 and some isolated particles may be MgO. Probably, MgO particles
also coalesce with MgF2 particles since very broad diffraction rings are also observed.
Because of the very close lattice distances (d values) of MgF2 and MgO, O atom partially
incorporation in the lattice of MgF2 may not change the structure and only slightly changes
lattice distances. Thus, lattice distances measured from the diffraction rings can not be
distinguished with that of MgF2 and can not indicate the existence of the Mg(O,F)
compound in this case. In contrast, the coexistence of O and F in the frameworks of
Mg(O,F) samples has been proved by FTIR, 19F MAS NMR and XPS. Energy-dispersive
X-ray spectroscopy (EDX) confirmed qualitatively that calcined MOF-1.6 consists of Mg,
F and O.
Fig. 6.10 TEM of calcined MOF-1.6

Chapter 6
105
6.4 Catalytic behavior of Mg(O,F)
Catalytic behaviour of Mg(O,F) in Michael addition of 2-methylcyclohexane-1,3-dione to
methyl vinyl ketone
0 2 4 6 8 20 22 240
10
20
30
40
50
60
70
80
90
100
A
MgO-s MOF-0.4 MOF-1.2 MOF-1.6 MOF-2.0 Mg(OH)2
Yie
ld o
f Mic
hael
add
uct (
%)
Time (h)
0 2 4 6 8 20 22 240
10
20
30
40
50
60
70
80
90
100
B
Time (h)
MgO-s MOF-0.4 MOF-1.2 MOF-1.6 MOF-2.0 Mg(OH)2
Sele
ctiv
ity o
f Mic
hael
add
uct (
%)
Fig. 6.11 Michael addition of 2-methyl-cyclohexane-1,3-dione to methyl vinyl ketone with the
MOF samples calcined at 350 °C. Yield (A) and selectivity (B) of Michael adduct versus reaction
time. Reaction temperature: room temperature (RT)
The catalytic activity of the MOF samples was first screened for the Michael addition of
2-methylcyclohexane-1,3-dione to methyl vinyl ketone at room temperature; these results
are shown in Fig. 6.11. Although supported fluoride ion (e.g. KF/Al2O3) as a solid base
shows very good activities in many reactions [93], including Michaeal additions, the pure,
crystalline MgF2 samples, MgF2-c and MgF2-s, were totally inactive. The MOF samples,
MOF-0.4–MOF-2.0, MgO-s and commercially available Mg(OH)2 exhibited diverse

Chapter 6
106
catalytic activities. MgO-s (Fig. 6.11) shows a very unselective catalytic activity similar to
that found for MgO synthesized in aqueous medium in chapter 3: high initial yield (ca.
70%, 1 h) with a decrease to below 20% over 24 h caused by a consecutive intramolecular
aldol cyclization (see chapter 3). The product yield achieved with commercial Mg(OH)2
went through a maximum of over 70% yield after 4 h but did not decrease as drastically as
in the case of MgO (final yield: 45%, not 20%). In chapter 5, the activity and selectivity of
the catalyst were attributed to the type of base site and presence of Lewis acid sites. MgO
had a low amount of Brønsted base sites (OH–), but more and stronger Lewis base sites
(O2–), whereas Mg(OH)2 only has Brønsted base sites (strong absorption at 3700 cm–1 for
isolate OH groups in IR spectrum). This could indicate that not only Brønsted base sites but
also Lewis base sites can catalyzed the reaction, however, the presence of acid sites may be
important for high reaction selectivity.
The different F contents of the MOF-0.4–MOF-2.0 samples also have a direct effect on
catalytic activity. The sample with the lowest fluorine contents (MOF-0.4, 10.2 wt% F)
exhibits the highest initial yield of about 90% after 2 h, after which the yield decreases
parallel to that of MgO-s giving a final yield of ca. 25%. In the case of MOF-1.2, maximum
yield was reached at a longer reaction time (4 h) and was lower (65%). The decrease in
yield for this sample thereafter resembles that of Mg(OH)2 and not MgO (final yield: 45%).
The yields of the samples with higher fluorine contents (MOF-1.6, 40 wt% F and MOF-2.0,
49.2 wt% F) no longer went through a maximum of yield; a consecutive reaction did not
occur. Both of these samples demonstrated the most selective activities and achieved the
highest final yields: 65% for MOF-2.0 and 90% for MOF-1.6. Thus, a preliminary
conclusion is that the combination of Brønsted base sites, Lewis base sites, and Lewis acid
sites is optimal in these two samples. Reaction with MOF-2.0 is however significantly
slower than with MOF-1.6. Fig. 6.11B shows that the reaction selectivity achieved with
MOF-0.4 and MOF-1.2 are in between that of MgO-s (MgO) and Mg(OH)2. Based on the
results of calcined hydrotalcite (chapter 5), it is assumed that optimum acid–base properties,
compared to MgO and Mg(OH)2, could make MOF-1.6 and MOF-2.0 more selective
catalyst in the reaction. On the other hand, the results indicate that the acid-base properties
on Mg(O,F) can be adjusted by adjusting the F. From the catalysis results, it is shown that
the acid-base property of the material may be modified by varying the relative ratio of the
anions.

Chapter 6
107
Catalytic behaviour of MOF-1.6 in Michael addition of 2-methylcyclohexane-1,3-dione to
methyl vinyl ketone at different temperatures
The Michael addition of 2-methylcyclohexane-1,3-dione to methyl vinyl ketone was
performed using MOF-1.6 as catalyst at 50 and 75 °C. The results were shown in Fig. 6.12.
With the reaction temperature increase, the yield of Michael adduct went through a
maximum of over 90% yield after 2 h at reaction temperature of 50 °C and over 85% after
1 h at 75 °C. The yield of Michael adduct decreased to 76% and 35%; and the yield of
bridged ketol increased to 20% and 57% after 8 h at 50 °C and 75 °C, respectively because
of the consecutive reaction described in chapter 3. These results indicted that at higher
reaction temperature, the behavior of MOF-1.6 became similar to that of MgO at room
temperature.
0 1 2 3 4 5 6 7 8
0
20
40
60
80
100A
75 °C 50 °C RT
Yie
ld o
f Mic
hael
add
uct (
%)
Time (h) 0 1 2 3 4 5 6 7 8
0
20
40
60
80
100B
75 °C 50 °C RT
Yie
ld o
f brid
ged
keto
l (%
)
Time (h) Fig. 6.12 Michael addition of 2-methyl-cyclohexane-1,3-dione to methyl vinyl ketone with the
MOF-1.6 at RT, 50 and 75 °C. Yield of Michael adduct (A) and bridged ketol (B) versus reaction
time
Michael addition of 2-acetylcyclopentanone, 2-acetylcyclohexanone and 2-methoxycarbonyl
cyclopentanone to methyl vinyl ketone over MOF-1.6
Based on its high activity and selectivity, MOF-1.6 was chosen to test in three Michael
additions (see Scheme 6.2) with liquid CH-acids of different strengths (pKa values): 2-
acetylcyclopentanone (7.8), 2-acetylcyclohexanone (10.1), and 2-methoxycarbonyl
cyclopentanone (10.3) at room temperature. The result was shown in Fig. 6.13. As in the
reaction with 2-methyl-cyclohexane-1,3-dione to methyl vinyl ketone, high product yields
(75–90% after 24 h) with 100% selectivities were obtained successfully with MOF-1.6 that
were directly dependent on the pKa of the CH-acid. The addition of reactant with lower pKa

Chapter 6
108
to methyl vinyl ketone proceeds faster. Interesting enough, MOF-1.6 had a similar catalytic
behavior as the most active calcined hydrotalcite catalyst CHT0.6 (see chapter 5). It means
by fluorination-hydrolysis sol-gel process, it was successful to design a new efficient
catalyst system for Michael additions.
O OO
+
O O
O
O
O
solid catalyst
n (n = 1,2)nroom temperature
(n = 1,2)
O
O O1
2a(n = 1), 2b(n = 2)
3
5
6a(n = 1), 6b(n = 2)4
OO
O
O
O
O
O
7 Scheme 6.2 Michael additions of 2-methylcyclohexane-1,3-dione (1), 2-acetylcyclopentanone (2a),
2-acetylcyclohexanone (2b) and 2-methoxycarbonyl cyclopentanone (3) to methyl vinyl ketone (4).
Michael adduct: 2-methyl-2-(3-oxo-butyl)-cyclohexane-1,3-dione (5), 2-acetyl-2-(3-oxo-butyl)-
cyclopentanone (6a), 2-acetyl-2-(3-oxo-butyl)-cyclohexanone (6b) and 2-oxo-1-(3-oxo-butyl)-
cyclopentanecarboxylic acid methyl ester (7)
0 4 8 12 16 20 24
0
10
20
30
40
50
60
70
80
90
100
pKa= 7.8 pKa= 10.1 pK
a= 10.3
Yie
ld o
f Mic
hael
add
uct (
%)
Time (h)
Fig. 6.13 Michael addition of 2-acetylcyclopentanone (pKa = 7.8), 2-acetylcyclohexanone (pKa =
10.1) and 2-methoxycarbonyl cyclopentanone (pKa = 10.3) to methyl vinyl ketone with calcined
MOF-1.6. Yield of Michael adduct versus reaction time. Reaction temperature: room temperature
(RT).

Chapter 6
109
6.5 Conclusions
Amorphous-like material Mg(O,F) with high surface area can be prepared by two-step
soft fluorination-hydrolysis sol-gel process.
Different fluorine species in Mg(O,F) are detected by 19F MAS NMR and XPS. A
periclase MgO or tetragonal MgF2 structure is formed during low-temperature calcination
at 350 °C depending on the fluorine contents of sample. As the fluorine content decreases
in the sample, the structural distortion of the fluorine coordination becomes greater. Low
fluorine contents in the MgO network results in diverse fluorine coordinations. Two
distinct fluorine coordinations are present in the mixed lattice of MgO and MgF2. As the
fluorine content increases, the FMg3 species becomes the dominant species. High-
temperature calcination of Mg(O,F) leads to the formation of separated crystalline MgO
and MgF2 phases.
Successfully controlled introduction of F into the MgO network makes it possible to
tune the acid-base property of the resulting material.Mg(O,F) with suitable F content can
act as an efficient and selective catalyst for Michael additions. In the Michael addition of 2-
methylcyclohexane-1,3-dione to methyl vinyl ketone. The catalyst with a F/Mg mol ratio of
1.6 achieved the best catalytic results producing the Michael addition product in a yield of
90% with a selectivity of 100% at room temperature within 24 h. This catalyst was
successfully applied in other Michael additions of 2-acetylcyclopentanone, 2-
acetylcyclohexanone, and 2-methoxycarbonylcyclopentanone as further CH-acids to
methyl vinyl ketone to obtain high final yields and selectivities.

Chapter 7
110
CChhaapptteerr 77
SSuummmmaarryy aanndd ccoonncclluussiioonn

Chapter 7
111
The research in this thesis concerns the design of highly active and selective
heterogeneous base catalysts for liquid-phase Michael additions. MgO, potassium-
modified ZrO2, calcined Mg-Al hydrotalcite, and Mg(O,F) catalyst systems were prepared,
characterized and tested in Michael additions. The research is simplified in scheme 7.1.
Scheme 7.1 Table 7.1 gives a brief summary of catalytic behavior of different catalysts.
Table 7.1
Summary of the behavior of catalysts in Michael addition
Catalysts Active sites Catalytic results in the reaction
MgO Strong Lewis base High activity, low selectivity
Mg(OH)2 Brønsted base High activity, low selectivity
ZrO2 Amphoteric No activity
Al2O3 Amphoteric No activity or low activity
K-modified ZrO2 Base High activity, leaching of active sites
Calcined hydrotalcite Base (main) + acid (weak) High activity and high selectivity
Low F Mg(O,F) Base High activity and low selectivity
High F Mg(O,F) Base (main) + acid (weak) High activity and high selectivity
Thermal decomposition Wet impregnation Sol-gel method
Catalysts [MgO, K-modified ZrO2, Calcined hydrotalcite, Mg(O,F)]
Bulk phase characterization Element analysis, XRD, N2 adsorption/desorption 27Al, 19F MAS NMR Thermal analysis, XPS, TEM
Michael additionsAcid-base property CO2-TPD FTIR (Pyridine,CO2)Microcalorimetry (CO2, benzoic acid)

Chapter 7
112
In Chapter 3, MgO prepared by different methods and conditions was first investigated in
Michael additions of 2-methylcyclohexane-1,3-dione to methyl vinyl ketone. MgO can not
catalyze the reaction selectively because of a consecutive aldol cyclitzation.
In Chapter 4, the properties and the activities of the catalysts can be influenced by a
variety of parameters, such as the zirconia precursor and the potassium modifying agent.
Modified hydrous zirconia forms the metastable, tetragonal ZrO2 phase after calcination;
the phase of modified anhydrous zirconia, on the other hand, is monoclinic. The specific
surface areas of the modified samples are much lower than that of ZrO2. The potassium
compounds on hydrous zirconia decompose in a broader temperature range than those on
anhydrous zirconia. Stronger base catalysts were produced by potassium-modification of
ZrO2. The modified anhydrous zirconia has a wider distribution of basic site strengths than
modified hydrous zirconia. Potassium-modified zirconia give high yields and high
cis/trans ratios of 2-butene in the double-bond isomerzation of 1-butene. Although
potassium-modified zirconia exhibit high activity and selectivity, it is less suitable as a
solid base catalyst for liquid-phase Micheal addition in methanol because of potassium
leaching effects.
In Chapter 5, the influence of chemical composition and acid-base property on the
catalytic performance of the calcined hydrotalcites was studied. Calcined hydrotalcites
(Mg/Al = 0.6, 1.4, 2.2, 3.0) exhibit Lewis acid, Brønsted base, and Lewis base sites. The
Al-rich sample (Mg/Al molar ratio of 0.6) possesses Lewis acid sites similar in strength to
those found on Al2O3, but stronger than those found on the Mg-rich hydrotalcites. Calcined
hydrotalcites can catalyze the Michael additions of 2-methylcyclohexane-1,3-dione, 2-
acetylcyclopentanone, and 2-acetylcyclohexanone to methyl vinyl ketone with 100%
selectivity. A nonlinear correlation between the Mg content and catalytic activity was
found. However, catalytic activity correlates with the amount of the base sites determined
by benzoic acid microcalorimetry. An optimal balance of acid-base properties may make
the Al-rich calcined hydrotalcite an excellent catalyst in the Michael addition of numerous
1,3-diones independent of their pKa values.
In Chapter 6, a novel catalyst system was prepared by sol-gel method. Amorphous-like
material Mg(O,F) with high surface area can be prepared by two-step soft fluorination-
hydrolysis sol-gel process. Different fluorine species in Mg(O,F) are detected by 19F MAS
NMR and XPS. Mg(O,F) with suitable F content can act as an efficient and selective
catalyst for Michael additions. The catalyst with a F/Mg mol ratio of 1.6 achieved the best
catalytic results producing the Michael addition product in a yield of 90% with a selectivity

Chapter 7
113
of 100% at room temperature within 24 h. Successfully controlled introduction of F and
OH group into the MgO network makes it possible to tune the acid-base property of the
resulting material. Therefore, this method enables the design of new bifunctional materials
for catalytic reactions that have very specific requirements on the amount and type of base
and acid sites necessary.

Zusammenfassung
114
Zusammenfassung
Die Promotionsarbeit befasst sich mit der Herstellung und Untersuchung von hoch aktiven
und selektiv wirkenden alkalischen Katalysatoren für Michael-Additionen in Flüssig-
Phasen Reaktionen.
MgO, Kalium-modifiziertes ZrO2, calcinierte Mg-Al Hydrotalcite und Mg(O,F) basierte
Katalysatoren mit basischen Zentren wurden hergestellt, charakterisiert und in Michael-
Additionen getestet. Die Untersuchungen sind im Folgenden schematisch dargestellt.
Schema 7.1
Thermische Zersetzung Imprägnierung Sol-Gel Methode
Katalysatoren [MgO, K-mod. ZrO2, calcinierte Hydrotalcite, Mg(O,F)]
Charakterisierung der Volumen-Phase Elementaranalyse, XRD, N2 Adsorption/Desorption 27Al, 19F MAS NMR Thermische Analyse, XPS, TEM
Michael AdditionSäure-Base Verh. CO2-TPD FTIR (Pyridin, CO2)Microcalorimetrie (CO2, Benzoesäure)
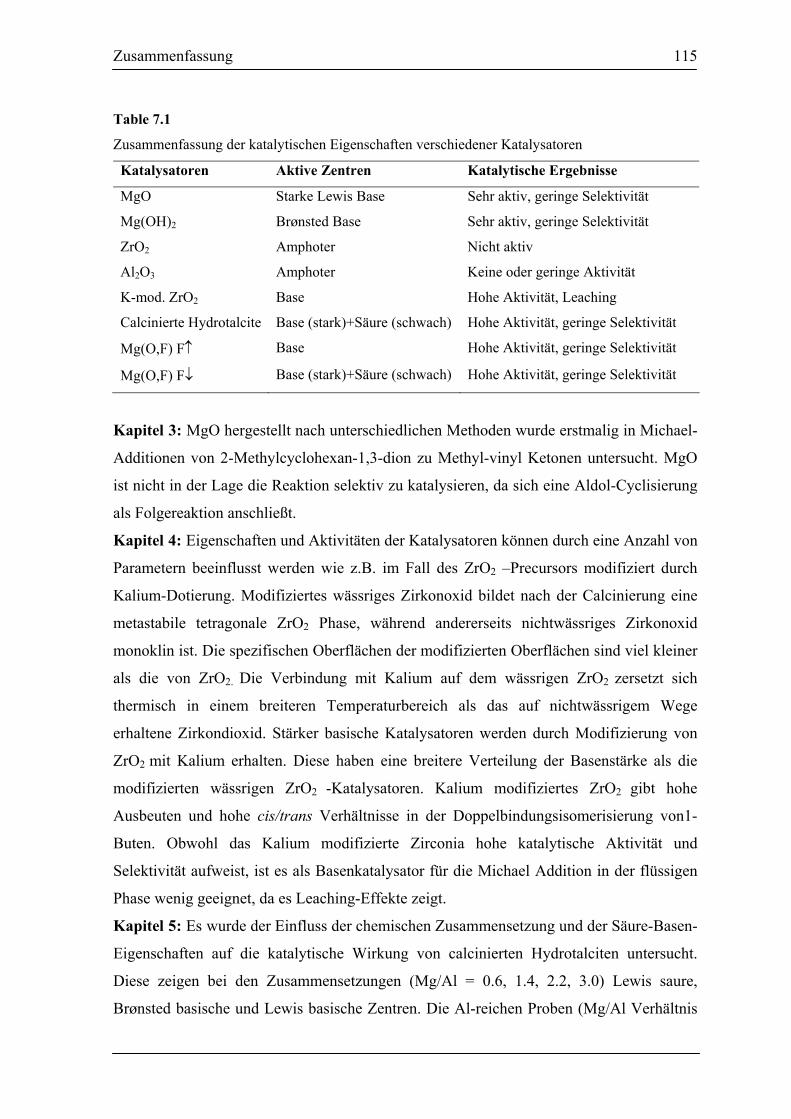
Zusammenfassung
115
Table 7.1
Zusammenfassung der katalytischen Eigenschaften verschiedener Katalysatoren
Katalysatoren Aktive Zentren Katalytische Ergebnisse
MgO Starke Lewis Base Sehr aktiv, geringe Selektivität
Mg(OH)2 Brønsted Base Sehr aktiv, geringe Selektivität
ZrO2 Amphoter Nicht aktiv
Al2O3 Amphoter Keine oder geringe Aktivität
K-mod. ZrO2 Base Hohe Aktivität, Leaching
Calcinierte Hydrotalcite Base (stark)+Säure (schwach) Hohe Aktivität, geringe Selektivität
Mg(O,F) F↑ Base Hohe Aktivität, geringe Selektivität
Mg(O,F) F↓ Base (stark)+Säure (schwach) Hohe Aktivität, geringe Selektivität
Kapitel 3: MgO hergestellt nach unterschiedlichen Methoden wurde erstmalig in Michael-
Additionen von 2-Methylcyclohexan-1,3-dion zu Methyl-vinyl Ketonen untersucht. MgO
ist nicht in der Lage die Reaktion selektiv zu katalysieren, da sich eine Aldol-Cyclisierung
als Folgereaktion anschließt.
Kapitel 4: Eigenschaften und Aktivitäten der Katalysatoren können durch eine Anzahl von
Parametern beeinflusst werden wie z.B. im Fall des ZrO2 –Precursors modifiziert durch
Kalium-Dotierung. Modifiziertes wässriges Zirkonoxid bildet nach der Calcinierung eine
metastabile tetragonale ZrO2 Phase, während andererseits nichtwässriges Zirkonoxid
monoklin ist. Die spezifischen Oberflächen der modifizierten Oberflächen sind viel kleiner
als die von ZrO2. Die Verbindung mit Kalium auf dem wässrigen ZrO2 zersetzt sich
thermisch in einem breiteren Temperaturbereich als das auf nichtwässrigem Wege
erhaltene Zirkondioxid. Stärker basische Katalysatoren werden durch Modifizierung von
ZrO2 mit Kalium erhalten. Diese haben eine breitere Verteilung der Basenstärke als die
modifizierten wässrigen ZrO2 -Katalysatoren. Kalium modifiziertes ZrO2 gibt hohe
Ausbeuten und hohe cis/trans Verhältnisse in der Doppelbindungsisomerisierung von1-
Buten. Obwohl das Kalium modifizierte Zirconia hohe katalytische Aktivität und
Selektivität aufweist, ist es als Basenkatalysator für die Michael Addition in der flüssigen
Phase wenig geeignet, da es Leaching-Effekte zeigt.
Kapitel 5: Es wurde der Einfluss der chemischen Zusammensetzung und der Säure-Basen-
Eigenschaften auf die katalytische Wirkung von calcinierten Hydrotalciten untersucht.
Diese zeigen bei den Zusammensetzungen (Mg/Al = 0.6, 1.4, 2.2, 3.0) Lewis saure,
Brønsted basische und Lewis basische Zentren. Die Al-reichen Proben (Mg/Al Verhältnis

Zusammenfassung
116
0.6) besitzen Lewis saure Zentren in vergleichbarer Stärke wie im Al2O3 und jedoch
stärkere als in den Mg-reichen Hydrotalciten. Calcinierte Hydrotalcite können Michael-
Additionen wie 2-methylcyclohexan-1,3-dion, 2-acetylcyclopentanon, and 2-
acetylcyclohexanon zu Methyl-vinyl keton mit 100% Selektivität katalysieren. Dabei hat
sich eine nichtlineare Korrelation zwischen dem Mg-Gehalt und der katalytischen Aktivität
ergeben. Die katalytische Aktivität korreliert dagegen jedoch mit der Anzahl der basischen
Zentren, die mikrokalorimetrisch mit Benzoesäure bestimmt wurden. Ein optimales Säure-
Base Gleichgewicht der Al-reichen Hydrotalcite macht diese zu ausgezeichneten
Katalysatoren in Michael-Additionen von zahlreichen 1,3-Dionen, unabhängig von ihrem
pKa Wert.
Kapitel 6: Es wird ein neuartiges Katalysatorsystem beschrieben, dass nach einer Sol-Gel-
Methode hergestellt wurde. Ein amorphes Material der allgemeinen Zusammensetzung von
Mg(O,F) mit einer aussergewöhnlich hohen Oberfläche kann nach einem 2-Stufenprozess
in einer Fluorierungs-Hydrolyse-Reaktion vom Sol-Gel-Typ hergestellt werden.
Verschiedene fluorierte Species in der allgemeinen Zusammensetzung Mg(O,F) wurden
durch 19F MAS NMR und XPS nachgewiesen. Mg(O,F)-Materialien mit einem geeigneten
F Anteil können als effiziente und selektiv wirkende Katalysatoren in Michael-Additionen
fungieren. Katalysatoren mit einem molaren Verhältnis von F/Mg wie 1.6 haben die besten
Ergebnisse in diesen Reaktionen gezeigt mit einer Ausbeute von 90% und Selektivitäten
von 100% bei Raumtemperatur in einer Reaktionszeit von 24 h. Die erfolgreiche
kontrollierte Einführung von F und OH Gruppen in die MgO Strukturen erlaubt es die
Säure-Basen-Eigenschaften des Katalysators in der gewünschten Weise einzustellen.
Damit ermöglicht diese neuartige Methode die Herstellung von wirksamen bifunktionellen
Materialien für katalytische Zwecke mit besonderen Anforderungen an Menge und Art der
notwendigen Säure- und Basenzentren.

References
117
References [1] www.merriam-webster.com, merriam webster online dictionary.
[2] M.W. Roberts, Catal. Lett. 67 (2000) 1–73.
[3] B. Lindstrom, L.J. Pettersson, Cattech 7 (2003) 130–138.
[4] J. Wisniak, Chem. Educator 5 (2000) 343–350.
[5] Catalysis from A to Z, (eds. B. Cornils, W.A. Herrmann, R. Schlögl, C.-H. Wong), Wiley-Vch, 2003.
[6] www.nacatsoc.org, the homepage of the North American Catalysis Society and related www links.
[7] C. Adams, Chemistry and Industry, (1999) 740–743.
[8] G.-M. Schwab, in Catalysis: Science and Technology (eds. J.R. Anderson, M. Boudart), Springer-
Verlag, Berlin, 1981, Vol.2, Chapt. 1 History of concepts in catalysis, 1–11.
[9] Handbook of heterogeneous catalysis, (eds. G. Ertl, H. Knözinger, J. Weitkamp), Wiley-VCH, 1997.
[10] J. Haber, in Catalysis: Science and Technology (eds. J.R. Anderson, M. Boudart), Springer-Verlag,
Berlin, 1981, Vol.2, Chapt. 2 Crystallography of catalyst types, 13-95.
[11] K. Tanabe, M. Misono, Y. Ono, H. Hattori, New solid acids and base, Kodansha-Elsevier, Tokyo-
Amsterdam, 1989.
[12] K. Tanabe, W.F. Hölderich, Appl. Catal. A 181 (1999) 399–434.
[13] H. Hattori, Chem. Rev. 95 (1995) 537–558.
[14] H. Pines, J.A. Veseley, V.N. Ipatieff, J. Am. Chem. Soc. 77 (1955) 6314–6321.
[15] D. Barthomeuf, Catal. Rev.-Sci. Eng. 38 (1996) 521–612.
[16] Y. Ono, T. Baba, Catal. Today 38 (1997) 321–337.
[17] R.J. Davis, J. Catal. 216 (2003) 396–405.
[18] Y. Ono, J. Catal. 216 (2003) 406–415.
[19] J. Weitkamp, M. Hunger, U. Rymsa, Micropor. Mesopor. Mater. 48 (2001) 255–270.
[20] A. Corma, Chem. Rev. 95 (1995) 559–614.
[21] D. Barthomeuf, J. Phys. Chem. 88 (1984) 42–45.
[22] P.E. Hathaway, M.E. Davis, J. Catal. 116 (1989) 263–278.
[23] P.E. Hathaway, M.E. Davis, J. Catal. 116 (1989) 279–284.
[24] P.E. Hathaway, M.E. Davis, J. Catal. 119 (1989) 497–507.
[25] H. Tsuji, F. Yagi, H. Hattori, Chem. Lett. (1991) 1881–1884.
[26] F. Yagi, H. Tshji, H. Hattori, Micropor. Mater. 9 (1997) 237–245.
[27] Y. Wang, J.H. Zhu, J.M. Cao, Y. Chun, Q.H. Xu, Micropor. Mesopor. Mater. 26 (1998) 175–184.
[28] K. Arishtirova, P. Kovacheva, A. Predoeva, Appl. Catal. A 243 (2003) 191–196.
[29] L.R.M. Martens, P.J. Grobet, P.A. Jacobs, Nature 315 (1985) 568–570.
[30] L.R.M. Martens, P.J. Grobet, W.J.M. Vermeiren, P.A. Jacobs, Stud. Surf. Sci. Catal. 28 (1986) 935–
941.
[31] B. Xu, L. Kevan, J. Chem. Soc. Faraday Trans. 87 (1991) 2843–2847.
[32] B. Xu, L. Kevan, J. Phys. Chem. 96 (1992) 2642–2645.
[33] T. Baba, G.J. Kim, Y. Ono, J. Chem. Soc. Faraday Trans. 88 (1992) 891–897.

References
118
[34] T. Baba, S. Hikita, R. Koide, Y. Ono, T. Hanada, T. Tanaka, S. Yoshida, J. Chem. Soc. Faraday Trans.
89 (1993) 3177–3180.
[35] A. Philippou, J. Rocha, M. Anderson, Catal. Lett. 57 (1999) 151–153.
[36] A. Philippou, M. Anderson, J. Catal. 189 (2000) 395–400.
[37] J.C. Lavalley, Catal. Today 27 (1996) 377–401.
[38] M. Huang, S. Kaliaguine, J. Chem. Soc. Faraday Trans. 88 (1992) 751–758.
[39] J. Xie, M. Huang, S. Kaliaguine, React. Kinet. Catal. Lett. 58 (1996) 217–227.
[40] J.C. Kim, H.-X. Li, C.-Y. Chen, M.E. Davis, Micropor. Mater. 2 (1994) 413–423.
[41] Y. Okamoto, M. Ogawa, A. Maezawa, T. Imanaka, J. Catal. 112 (1988) 427–436.
[42] M. Huang, A. Adnot, S. Kaliaguine, J. Catal. 137 (1992) 322–332.
[43] M. Huang, A. Adnot, S. Kaliaguine, J. Am. Chem. Soc. 114 (1992) 10005–10010.
[44] S.Y. Choi, Y.S. Park, S.B. Hong, K.B. Yoon, J. Am. Chem. Soc. 118 (1996) 9377–9386.
[45] E.J. Doskocil, S.V. Nordawekar, B.G. Kaya, R.J. Davis, J. Phys. Chem. B 103 (1999) 6277–6282.
[46] M. Huang, S. Kaliaguine, M. Muscas, A. Auroux, J. Catal. 157 (1995) 266–269.
[47] S.V. Bordawekar, R.J. Davis, J. Catal. 189 (2000) 79–90.
[48] A.A. Kheir, J.F. Haw, J. Am. Chem. Soc. 116 (1994) 817–818.
[49] M. Sánchez-Sánchez, T. Blasco, F. Rey, Phy. Chem. Chem. Phys. 1 (1999) 4529–4535.
[50] V. Bosacek, R. Klik, F. Genoni, G. Spano, F. Rivetti, F. Figueras, Magn. Reson. Chem. 37 (1999)
S135–S141.
[51] J. Engelhardt, J. Szanyi, J. Valyon, J. Catal. 107 (1987) 296–306.
[52] W.S. Wieland, R.J. Davis, J.M. Garces, J. Catal. 173 (1998) 490–500.
[53] A. Corma, R.M. Martin-Aranda, F. Sanchez, J. Catal. 126 (1990) 192–198.
[54] A. Corma, V. Fornes, R.M. Martin-Aranda, H. Garcia, J. Primo, Appl. Catal. 59 (1990) 237–248.
[55] A. Corma, R.M. Martin-Aranda, F. Sanchez, Stud. Surf. Sci. Catal. 59 (1991) 503–511.
[56] R. Ballini, F. Bigi, E. Gogni, R. Maggi, G. Sartori, J. Catal. 191 (2000) 348–353.
[57] P.T. Wierzchowski, L.W. Zatorski, Catal. Lett. 9 (1991) 411–414.
[58] M. Tu, R.J. Davis, J. Catal. 199 (2001) 85–91.
[59] C.T. Kresge, M.E. Leonowicz, W.J. Roth, J.C. Vartuli, J.S. Beck, Nature 359 (1992) 710–712.
[60] D. Zhao, J. Feng, Q. Huo, N. Melosh, G.H. Fredrickson, B.F. Chmelka, G.D. Stucky, Science 279
(1998) 548–553.
[61] K.R. Kloetstra, H. van Bekkum, J. Chem. Soc. Chem. Commun. (1995) 1005–1006.
[62] K.R. Kloetstra, M. van Laren, H. van Bekkum, J. Chem. Soc. Faraday Trans. 93 (1997) 1211–1220.
[63] K.R. Kloetstra, H. van Bekkum, Stud. Surf. Sci. Catal. 105 (1997) 431.
[64] K.R. Kloetstra, J. van den Broek, H. van Bekkum, Catal. Lett. 47 (1997) 235–242.
[65] Y.L Wie, Y.M. Wang, J.H. Zhu, Z.Y. Wu, Adv. Mater. 15 (2003) 1943–1945.
[66] D.J. Macquarrie, Chem. Commun. (1996) 1961–1962; (1997) 601–602.
[67] D.J. Macquarrie, D.B. Jackson, Chem. Commun. (1997) 1781–1782.
[68] A. Cauval, G. Renard, D. Brunel, J. Org. Chem. 62 (1997) 749–751.
[69] M. Laspéras, T. Llorett, L. Chaves, I. Rodriguez, A. Cauvel, D. Brunel, Stud. Surf. Sci. Catal. 108
(1997) 75–82.

References
119
[70] Y.V. Subba Rao, D.E. De Vos, P.A. Jacobs, Angew. Chem. Int. Ed. 36 (1997) 2661–2663.
[71] I. Rodriguez, S. Iborra, A. Corma, F. Rey, J.L. Jorda, Chem. Commun. (1999) 593–594.
[72] A. Corma, S. Iborra, I. Rodriguez, F. Sanchez, J. Catal. 211 (2002) 208–215.
[73] X. Lin, G.K. Chuah, S. Jaenicke, J. Mol. Catal. A 150 (1999) 287–294.
[74] B.M. Choudary, M.L. Kantam, P. Sreekanth, T. Bandopadhyay, F. Figueras, A. Tuel, J. Mol. Catal. A
142 (1999) 361–365.
[75] S. Jaenicke, G.K. Chuah, X.H. Lin, X.C. Hu, Micropor. Mesopor. Mater. 35–36 (2000) 143–153.
[76] A. Corma, S. Iborra, I. Rodriguez, M. Iglesia, F. Sanchez, Cata. Lett. 82 (2002) 237–242.
[77] P.W. Lednor, R. de Ruiter, J. Chem. Soc. Chem. Commun. (1989) 320–321.
[78] P.W. Lednor, R. de Ruiter, J. Chem. Soc. Chem. Commun. (1991) 1625–1626.
[79] P.W. Lednor, Catal. Today 15 (1992) 243–261.
[80] L.M. Gandia, R. Malm, R. Marchand, R. Conanec, Y. Laurent, M. Montes, Appl. Catal. A 114 (1994)
L1–L7.
[81] P. Grange, P. Bastians, R. Conanec, R. Marchand, Y. Laurent, Appl. Catal. A 114 (1994) L191–L196.
[82] J.J. Benitez, J.A. Odriozola, R. Marchand, Y. Laurant, P. Grange, J. Chem. Soc. Faraday Trans. 91
(1995) 4477–4479.
[83] A. Massinon, J.A. Odriozola, Ph. Bastians, R. Conanec, R. Marchand, Y. Laurant, P. Grange, Appl.
Catal. A 137 (1996) 9–23.
[84] M.J. Climent, A. Corma, V. Fornés, A. Frau, R. Guil-López, S. Iborra, J. Primo, J. Catal. 163 (1996)
392–398.
[85] N. Fripiat, P. Grange, Chem. Commun. (1996) 1409–1410.
[86] N. Fripiat, R. Conanec, A. Auroux, R. Marchand, Y. Laurent, P. Grange, J. Catal. 167 (1997) 543–549.
[87] N. Fripiat, V. Parvulescu, V.I. Parvulescu, P. Grange, Appl. Catal. A 181 (1999) 331–346.
[88] M.A. Centeno, S. Delsarte, P. Grange, J. Phys. Chem. B 103 (1999) 7214–7221.
[89] D. Delsarte, A. Auroux, P. Grange, Phys. Chem. Chem. Phys. 2 (2000) 2821–2827.
[90] H. Wiame, C. Cellier, P. Grange, J. Catal. 190 (2000) 406–418.
[91] H. Wiame, C. Cellier, P. Grange, J. Phys. Chem. B 104 (2000) 591–596.
[92] Y.D. Xia, R. Mokaya, Angew. Chem. 115 (2003) 2743–2748; Angew. Chem. Int. Ed. 42 (2003) 2639–
2644.
[93] J.H. Clark, Chem. Rev. 80 (1980) 429–452.
[94] H. Tsuji, H. Kabashima, H. Kita, H. Hattori, React. Kinet. Catal. Lett. 56 (1995) 363–369.
[95] H. Handa, T. Baba, Y. Ono, J. Mol. Catal. A 134 (1998) 171–177.
[96] T. Baba, A. Kato, H. Takahashi, F. Toriyama, H. Handa, Y. Ono, H. Sugisawa, J. Catal. 176 (1998)
488–494.
[97] H. Kabashima, H. Tsuji, S. Nakata, Y. Tanaka, H. Hattori, Appl. Catal. A 194–195 (2000) 227–240.
[98] T. Ando, Stud. Surf. Sci. Catal. 85 (1994) 9–20.
[99] T. Ando, J.H. Clark, D.G. Cork, T. Hanafusa, J. Ichihara, T. Kimura, Tetrahedron Lett. 28 (1987) 1421–
1424.
[100] T. Ando, S.J. Brown, J.H. Clark, D.G. Cork, T. Hanafusa, J. Ichihara, J.M. Miller, M.S. Robertson, J.
Chem. Soc. Perkin Trans. 2 (1986) 1133–1139.

References
120
[101] J.-M. Clacens, D. Genuit, L. Delmotte, A. Garcia-Ruiz, G. Bergeret, R. Montiel, J. Lopez, F. Figueras,
J. Catal. 221 (2004) 483–490.
[102] J.-M. Clacens, D. Genuit, B. Veldurthy, G. Bergeret, L. Delmotte, A. Garcia-Ruiz, F. Figueras, Appl.
Catal. B 53 (2004) 95–100.
[103] A. Mitsutani, Catal. Today 73 (2002) 57–63.
[104] T. Yamaguchi, Y. Wang, M. Komatsu, M. Ookawa, Catal. Surveys Jpn. 5 (2002) 81–89.
[105] W.O. Haag, H. Pines, J. Am. Chem. Soc. 82 (1960) 387–391.
[106] H. Pines, W.M. Stalick, Base-catalyzed reactions of hydrocarbons and related compounds, Academic
press, New York, 1977, Chapt.2.
[107] J. Kijienski, S. Malinowski, Reac. Kinet. Catal. Lett. 3 (1975) 343–347.
[108] J. Kijienski, S. Malinowski, Catalysis, Vol. 4, R. Soc. Chem., London, 1981, 130.
[109] T. Ushikubo, H. Hattori, K. Tanabe, Chem. Lett. (1984) 649–652.
[110] N.J Sun, K.J. Klabunde, J. Catal. 185 (1999) 506–512.
[111] G. Suzukamo, M. Fukao, M. Minobe, Chem. Lett. (1987) 585–588.
[112] G. Suzukamo, M. Fukao, T. Hibi, K. Chikaishi, Acid-Base Catalysis, 1989, 405
[113] T. Baba, H. Handa, Y. Ono, J. Chem. Soc. Faraday Trans. 90 (1994) 187–191.
[114] T. Baba, Catal. Surveys Jpn. (2000) 17–29.
[115] T. Baba, H. Yuasa, H. Handa, Y. Ono, Catal. Lett. 50 (1998) 83–85.
[116] H. Handa, T. Baba, Y. Ono, J. Chem. Soc. Faraday Trans. 94 (1998) 451–454.
[117] T. Yamaguchi, J.H. Zhu, Y. Wang, M. Komatsu, M. Ookawa, Chem. Lett. (1997) 989–990.
[118] Y. Wang, J.H. Zhu, W.Y. Huang, Phys. Chem. Chem. Phys. 3 (2001) 2537–2543.
[119] Y. Wang, W.Y. Huang, Y. Chun, J.R. Xia, J.H. Zhu, Chem. Mater. 13 (2001) 670–677.
[120] K. Tanabe, T. Yamaguchi, Catal. Today 20 (1994) 185–198.
[121] R.A. Sheldon, J. Dakka, Catal. Today 19 (1994) 215–246.
[122] R.A. Sheldon, R.S. Downing, Appl. Catal. A 189 (1999) 163–183.
[123] M.L. Kantam, B.M. Choudary, Ch.V. Reddy, K.K. Rao, F. Figueras, Chem. Commun. (1998) 1033–
1034.
[124] A. Corma, R.M. Martin-Aranda, Appl. Catal. A 105 (1993) 271–279.
[125] M.J. Climent, A. Corma, R. Guil-Lopez, S. Iborra, Catal. Lett. 74 (2001) 161–167.
[126] M.J. Climent, A. Corma , R. Guil-Lopez, S. Iborra, J. Primo, Catal. Lett. 59 (1999) 33–38.
[127] G. Zhang, H. Hattori, K. Tanabe, Appl. Catal. 36 (1988) 189–197; G. Zhang, H. Hattori, Appl. Catal.
40 (1988) 183–190.
[128] D. Tichit, M.N. Bennani, F. Figueras, R. Teissier, J. Kervennal, Appl. Clay Sci. 13 (1998) 401–415.
[129] J.C.A.A. Roelofs, A.J. van Dillen, K.P. de Jong, Catal. Today 60 (2000) 297–303.
[130] M.J. Climent, A. Corma, S. Iborra, A. Velty, Catal. Lett. 79 (2002) 157–163.
[131] M.J. Climent, A. Corma, S. Iborra, J. Primo, J. Catal. 151 (1995) 60–66.
[132] S. Sebti, A. Solhy, R. Tahir, S. Abdelatif, S. Boulaajaj, J.A. Mayoral, J.I. García, J.M. Fraile, A.
Kossir, H. Oumimoun, J. Catal. 213 (2003) 1–6.
[133] K. Akutu, H. Kabashima, T. Seki, H. Hattori, Appl. Catal. A 247 (2003) 65–74.
[134] R. Ballini, F. Bigi, R. Maggi, G. Sartori, J. Catal. 191 (2000) 348–353.

References
121
[135] V.J. Bulbulbe, V.H. Deshpande, S. Velu, A. Sudalai, S. Shivasankar, V.T. Sathe, Tetrahedron 55
(1999) 9325–9332.
[136] H. Kabashima, T. Katou, H. Hattori, Appl. Catal. A 241 (2001) 121–124.
[137] H. Hattori , K. Kabashima, Appl. Catal. A 161 (1997) L33–L35.
[138] K. Kabashima, H. Tsuji, H. Hattori, React. Kinet. Catal. Lett. 58 (1996) 255–259.
[139] P.S. Kumbhar, J. Sanchez-Valente, F. Figueras, Chem. Commun. (1998) 1091–1092.
[140] H. Kabashima, H. Tsuji, T. Shibuya, H. Hattori, J. Mol. Catal. A 155 (2000) 23–29.
[141] B.M. Choudary, M.L. Kantam, Ch.V. Reddy, K.K. Rao, F. Figueras, J. Mol. Catal. A 146 (1999) 279–
284.
[142] I. Rodriguez, S. Iborra, F. Rey, A. Corma, Appl. Catal. A 194–195 (2000) 241–252.
[143] A. Corma, S. Iborra, I. Rodriguez, M. Iglesias, F. Sanchez, Catal. Lett. 82 (2002) 237–242.
[144] J.I. Tateiwa, A. Hosomi, Eur. J. Org. Chem. (2001) 1445–1448.
[145] P. Mastrorilli, C.F. Nobile, G.P. Suranna, J. Mol. Catal. A 103 (1995) 23–29.
[146] T. Kawabata, T. Mizugaki, K. Ebitani, K. Kaneda, J. Am. Chem. Soc. 125 (2003) 10486–10487.
[147] M. Sasidharan, R. Kumar, J. Catal. 220 (2003) 326–332.
[148] J. Barrios, R.Rojas, A.R. Alcanrara, J.V. Sinisterra, J. Catal. 112 (1988) 529–542.
[149] J. Yamawaki, T. Kawate, T. Ando, T. Hanafusa, Bull. Chem. Soc. Jpn. 56 (1983) 1885–1886.
[150] J.M. Campelo, M.S. Climent, J.M. Marinas, React. Kinet. Catal. Lett. 47 (1992) 7–11.
[151] P. Laszlo, P. Pennetreau, Tetrahedron Lett. 26 (1985) 2645–2648.
[152] K. Kabashima, H. Tsuji, H. Hattori, Appl. Catal. A 165 (1997) 319–325.
[153] J.E.G. Mdoe, J.H. Clark, D.J. Macquarrie, Synlett (1998) 625-627.
[154] U. Meyer, H. Gorzawski, W. F. Hölderich, Catal. Lett. 59 (1999) 201-206.
[155] N.L. Wendler, H.L. Slates, M. Tishler, J. Am. Chem. Soc. 73 (1951) 3816–3818.
[156] W.G. Dauben, R.A. Bunce, J. Org. Chem. 48 (1983) 4642–4648.
[157] J.W. Muskopf, R.M. Coates, J. Org. Chem. 50 (1985) 69–76.
[158] N. Harada, T. Sugioka, H. Uda, T. Kuriki, Synthesis (1990) 53–56.
[159] T. Bui, C.F. Barbas III, Tetrahedron Lett. 36 (2000) 6951–6954.
[160] J. Christoffers, U. Rössler, T. Werner, Eur. J. Org. Chem. (2000) 701–705.
[161] D. Bensa, T. Constantieux, J. Rodriguez, Synthesis (2004) 923–927.
[162] F. Seel, Angew. Chem. 76 (1964) 532–534.
[163] H. Kabashima, H. Tsuji, H. Hattori, Appl. Catal. A 165 (1997) 319–325.
[164] T. Seki, H. Kabashima, K. Akutsu, H. Tachikawa, H. Hattori, J. Catal. 204 (2001) 393–401.
[165] M.A. Aramendia, V. Borau, C. Jiménez, J.M. Marinas, J.R. Ruiz, F.J. Urbano, Appl. Catal. A 244
(2003) 207–215.
[166] Y. Wang, J.H. Zhu, J.M. Cao, Y. Chun, Q.H. Xu, Micropor. Mesopor. Mater., 26 (1998) 175–184.
[167] D.E. Jiang, G.C. Pan, B.Y. Zhao, G.P. Ran, Y.C. Xie, E.Z. Min, Appl. Catal. A 201 (2001) 169–176.
[168] P. Kovacheva, K. Arishtirova, S. Vassilev, Appl. Catal. A 210 (2001) 391–395.
[169] Y. Sakurai, T. Suzaki, K. Nakagawa, N. Ikenaga, H. Aota, T. Suzuki, J. Catal. 209 (2002) 16–24.
[170] S. Freni, S. Cavallaro, N. Mondello, L. Spadaio, F. Frusteri, Catal. Commun. 4 (2003) 287–293.
[171] K.D. Jung, O. S. Joo , S.H. Cho, S.H. Han, Appl. Catal. A 240 (2003) 235–241.

References
122
[172] A.S. Ndou, N. Plint, N.J. Coville, Appl. Catal. A 251 (2003) 337–345.
[173] A.S. Ndou, N.J. Coville, Appl. Catal. A 275 (2004) 103–110.
[174] S. Coluccia, A.J Tench, Proceedines of the 7th International Congress on Catalysis Tokyo, Japan,
1980, P1160.
[175] G. Martra, T. Cacciatori, L. Marchese, J.S.J. Hargreaves, I.M. Mellor, R.W. Joyner, S. Cosuccia, Catal.
Today 70 (2001) 121–130 and references therein.
[176] V.R. Choudary, V.H. Rane, R.V. Gadre, J. Catal. 145 (1994) 300–311.
[177] S. Utamapanya, K.J. Klabunde, J. Schlup, Chem. Mater. 3 (1991) 175–181.
[178] B.M. Choudary, K. Mahendar, K.V.S. Ranganath, J. Mol. Catal. A 234 (2005) 25–27.
[179] B.M. Choudary, R.S. Mulukutla, K.J. Klabunde, J. Am. Chem. Soc. 125 (2003) 2020–2021.
[180] K.S.W. Sing, J. Rouquerol, in Handbook of Heterogeneous Catalysis, Vol. 2 (eds. G. Ertl, H.
Knözinger, J. Weitkamp), Wiley, New York, 1997, p427.
[181] W. G. Dauben, R.A. Bunce, J. Org. Chem. 48 (1983) 4642–4648.
[182] P. Wieland, K. Miescher, Helv. Chim. Acta 33 (1950) 2215–2228.
[183] S.J. Danishefsky, J.J. Masters, W.B. Young, J.T. Link, L.B. Snyder, T.V. Magee, D.K. Jung, R.C.A.
Isaacs, W.G. Bornmann, C.A. Alaimo, C. A. Coburn, M.J. Di Grandi, J. Am. Chem. Soc. 118 (1996)
2843–2859.
[184] L.A. Paquette, D. Backhaus, R. Braun, T.L. Underiner, K. Fuchs, J. Am. Chem. Soc. 119 (1997)
9662–9671.
[185] T. Yamaguchi, Catal. Today 20 (1994) 199–218.
[186] M. Hino, K. Arata, J. Chem. Soc. Chem. Commun. (1980) 851–852.
[187] D.A. Ward, E.I. Ko, J. Catal. 157 (1995) 321–333.
[188] V. Quaschning, J. Deutsch, P. Druska, H.J. Niclas, E. Kemnitz, J. Catal. 177 (1998) 164–174.
[189] X.M. Song, A. Sayari, Catal. Rev. -Sci. Eng. 38 (1996) 329–412.
[190] W.M. Hua, F. Zhang, Z. Ma, Z. Gao, Catal. Lett. 65 (2000) 85–89.
[191] J.C. Yori, C.L. Pieck, J.M. Parera, Catal. Lett. 64 (2000) 141–146.
[192] B.Q. Xu, S.B. Cheng, X. Zhang, S.F. Ying, Q.M. Zhu, Chem. Commun. (2000) 1121–1122.
[193] P.T. Patil, K.M. Malshe, P. Kumar, M.K. Dongare, E. Kemnitz, Catal. Commun. 3 (2002) 411–416.
[194] A.Z. Khan, E. Ruckenstein, J. Catal. 139 (1993) 304–321.
[195] S. Sugiyama, K. Shimodan, H. Hayashi, N. Shigemoto, K. Miyaura, K. Saitoh, J.B. Moffat, J. Catal.
141 (1993) 279–286.
[196] P. Thomasson, O.S. Tyagi, H. Knözinger, Appl. Catal. A 181 (1999) 181–188.
[197] J.H. Zhu, Y. Wang, Y. Chun, X.S. Wang, J. Chem. Soc. Faraday Trans. 94 (1998) 1163–1169.
[198] R. Bal, B.B. Tope, T.K. Das, S.G. Hegde, S. Sivasanker, J. Catal. 204 (2001) 358–363.
[199] J.H. Li, R.J. Davis, Appl. Catal. A 239 (2003) 59–70.
[200] W.S. Wieland, R.J. Davis, J.M. Garces, Catal. Today 28 (1996) 443–450.
[201] Y. Fu, T. Baba, Y. Ono, Appl. Catal. A 176 (1999) 201–204.
[202] Z.-J. Li, H.A. Prescott, J. Deutsch, A. Trunschke, H. Lieske, E. Kemnitz, Catal. Lett. 92 (2004) 175–
180.
[203] Z. Liu, W.J. Jie, L. Dong, Y. Chen, J. Solid State Chem. 138 (1998) 41–46.

References
123
[204] G. Leofani, M. Padovan, G. Tozzola, B. Venturelli, Catal. Today 41 (1998) 207–219.
[205] K. Parida, V. Quaschning, E. Lieske, E. Kemnitz, J. Mater. Chem. 11 (2001) 1903–1911.
[206] F. Cavani, F. Trifiro, A. Vaccari, Catal. Today 11 (1991) 173–301.
[207] A. Vaccari, Catal. Today 41 (1998) 53–71.
[208] B.F. Sels, D.E. De Vos, P.A. Jacobs, Catal. Rev. -Sci. Eng. 43 (2001) 443–488.
[209] D. Tichit, B. Coq, Cattech 7 (2003) 206–217.
[210] V.R.L. Constantino, T.J. Pinnavaia, Catal. Lett. 23 (1994) 361–367.
[211] E. Suzuki, M. Okamoto, Y. Ono, J. Mol. Catal. 61 (1990) 283–294.
[212] K.K. Rao, M. Gravelle, J. Sanchez-Valente, F. Figueras, J. Catal. 173 (1998) 115–121.
[213] A. Corma, V. Fornés, R.M. Martin-Aranda, F. Rey, J. Catal. 134 (1992) 58–65.
[214] A.L. McKenzie, C.T. Fishel, R.J. Davis, J. Catal. 138 (1992) 547–561.
[215] J.I. Di Cosimo, V.K. Díez, M. Xu, E. Iglesia, C.R. Apesteguía, J. Catal. 178 (1998) 499–510.
[216] J. Shen, J.M. Kobe, Y. Chen, J.A. Dumesic, Langmuir 10 (1994) 3902–3908.
[217] V.K. Díez, C.R. Apesteguía, J.I. Di Cosimo, J. Catal. 215 (2003) 220–233.
[218] F. Prinetto, G. Ghiotti, R. Durand, D. Tichit, J. Phys. Chem. B 104 (2000) 11117–11126.
[219] J. Shen, M. Tu, C. Hu, J. Solid State Chem. 137 (1998) 295–301.
[220] S. Casenave, H. Martinez, C. Guimon, A. Auroux, V. Hulea, A. Cordoneanu, E. Dumitriu,
Thermochim. Acta 379 (2001) 85–93.
[221] S. Casenave, H. Martinez, C. Guimon, A. Auroux, V. Hulea, E. Dumitriu, J. Therm. Anal. Cal. 72
(2003) 191–198.
[222] P.S. Kumbhar, J.S. Valente, J. Lopez, F. Figueras, Chem. Commun. (1998) 535–536.
[223] K. Yamaguchi, K. Ebitani, T. Yoshida, H. Yoshida, K. Kaneda, J. Am. Chem. Soc. 121 (1999) 4526–
4527.
[224] D. Tichit, D. Lutic, B. Coq, R. Durand, R. Teissier, J. Catal. 219 (2003) 167–175.
[225] D. Tichit, M.H. Lhouty, A. Guida, B.H. Chiche, F. Figueras, A. Auroux, D. Bartalini, E. Garrone, J.
Catal. 151 (1995) 50–59.
[226] M.J. Climent, A. Corma, S. Iborra, K. Epping, A. Velty, J. Catal. 225 (2004) 316–326.
[227] H.A. Prescott, Z.-J. Li, E. Kemnitz, A. Trunschke, J. Deutsch, H. Lieske, A. Auroux, J. Catal. 234
(2005) 119–130.
[228] www.sasol.com, product information.
[229] A. Corma, V. Fornés, F. Rey, J. Catal. 148 (1994) 205–212.
[230] G. Fornasari, M. Gazzano, D. Matteuzi, F. Trifiro, A. Vaccari, Appl. Clay Sci. 10 (1995) 69–82.
[231] K.J.D. MacKenzie, R.H. Meinhold, B.L. Sherriff, Z. Xu, J. Mater. Chem. 3 (1993) 1263–1269.
[232] R.H. Meinhold, R.C.T. Slade, R.H. Newman, Appl. Magn. Reson. 4 (1993) 121–140.
[233] W.T. Reichle, S.Y. Kang, D.S. Everhardt, J. Catal. 101 (1986) 352–359.
[234] S. Miyata, Clays Clay Miner. 28 (1980) 50–56.
[235] M.J. Climent, A. Corma, V. Fornés, A. Frau, R. Guil-Lόpez, S. Iborra, J. Primo, J. Catal. 163 (1996)
392–398.
[236] H. Knözinger, Adv. Catal. 25 (1976) 184–271.
[237] G. Busca, Phys. Chem. Chem. Phys. 1 (1999) 723–736.

References
124
[238] N. Fripiat, R. Conanec, A. Auroux, Y. Laurent, P. Grange, J. Catal. 167 (1997) 543–549.
[239] C. Morterra, A. Chiorino, G. Ghiotti, E. Garrone, J. Chem. Soc. Faraday Trans. 1, 75 (1979) 271–288.
[240] C. Morterra, S. Coluccia, A. Chiorino, F. Boccuzzi, J. Catal. 54 (1978) 348–364.
[241] F. Abbattista, S. Delmastro, G. Gozzelino, D. Mazza, M. Vallino, G. Busca, V. Lorenzelli, G. Ramis,
J. Catal. 117 (1989) 42–51.
[242] P. Nortier, P. Fourre, A.B. Mohammed Saad, O. Saur, J.C. Lavalley, Appl. Catal. 61 (1990) 141–160.
[243] G. Busca, V. Lorenzelli, Mater. Chem. 7 (1982) 89–126.
[244] J.C. Lavalley, Cata. Today 27 (1996) 377–401.
[245] J.A. Lercher, C. Colombier, H. Noller, J. Chem. Soc., Faraday Trans. 1, 80 (1984) 949–959.
[246] A.A. Davydov, M.L. Shepot’ko, A.A. Budneva, Kinet. Catal. 35 (1994) 299–306.
[247] V. Solinas, I. Ferino, Catal. Today 41 (1998) 179–189.
[248] E. Kemnitz, U. Groß, S. Rüdiger, C.S. Shekar, Angew. Chem. Int. Ed. 42 (2003) 4251–4254.
[249] M.J. Climent, A. Corma, V. Fornés, R. Guil-Lopez, S. Iborra, Adv. Synth. Catal. 344 (2002) 1090–
1096.
[250] E.I. Ko, Sol-Gel Process, in Handbook of Heterogeneous Catalysis (eds. G. Ertl, H. Knözinger, J.
Weitkamp), Wiely-VCH, Weinheim, 1997.
[251] J.K. Murthy, U. Groß, S. Rüdiger, E. Ünveren, E. Kemnitz, J. Fluorine Chem. 125 (2004) 937–949.
[252] S. Rüdiger, U. Groß, M. Feist, H.A. Prescott, C.S. Shekar, S. Troyanov, E. Kemnitz, J. Mater. Chem.
15 (2005) 588–597.
[253] A. Hess, E. Kemnitz, J. Catal. 149 (1994) 449–457.
[254] E. Kemnitz, A. Hess, G. Rother, S. Troyanov, J. Catal. 159 (1996) 332–339.
[255] B. Adamczyka, O. Boesea, N. Weiherb, S.L.M. Schroederb, E. Kemnitz, J. Fluorine Chem. 101 (2000)
239–246.
[256] T. Krahl, R. Stösser, E. Kemnitz, G. Scholz, M. Feist, G. Silly, J.-Y. Buzare, Inorg. Chem. 42 (2003)
6474–6483.
[257] T. Krahl, E. Kemnitz, Angew. Chem. Int. Ed. 43 (2004) 6653–6656.
[258] A. Demourgues, L. Francke, E. Durand, A. Tressaud, J. Fluorine Chem. 114 (2002) 229–236.
[259] E. Kemnitz, D.-H. Menz, Prog. Solid State Chem. 26 (1998) 97–153.
[260] D.J. Suh, T.-J Park, Chem. Mater. 14 (2002) 1452–1454.
[261] K. Niesz, P. Yang, G.A. Somorjai, Chem. Commun. (2005) 1986–1987.
[262] T. Lopez, I. Garcia-Cruz, R. Gomez, J. Catal. 127 (1991) 75–85.
[263] Y. Diao, W.P. Walawender, C.M. Sorensen, K.J. Klabunde, T. Ricker, Chem. Mater. 14 (2002) 362–
368.
[264] R. Portillo, T. Lopez, R. Gomez, B.A. Morales, O. Novaro, Langmuir 12 (1996) 40–44.
[265] H.S. Jung, J.-K. Lee, J.-Y. Kim, K.S. Hong, J. Collid Inter. Sci. 259 (2003) 127–132.
[266] M. Wojciechowska, M. Zielinski, M. Pietrowski, J. Fluorine Chem. 120 (2003) 1–11.
[267] A.J. Lecloux, in Catalysis: Science and Technology (eds. J.R. Anderson, M. Boudart), Akademie-
Verlag, Berlin, 1983, Vol.2, Chapt. 4 Texture of catalysts, 171–230.
[268] D. Wallacher, N. Künzner, D. Kovalen, N. Knorr, K. Knorr, Phys. Rev. Lett. 92 (2004) 195704–
195708.

References
125
[269] H. Thoms, M. Epple, A. Reller, Solid State Ionics 101–103 (1997) 79–84.
[270] http://webbook.nist.gov/chemistry/
[271] H. Thoms, M. Epple, H. Viebrock, A. Reller, J. Mater. Chem. 5 (1995) 589–594.
[272] Z.A. Starikova, A.I. Yanovsky, E.P. Turevskaya, N.Ya Turova, Polyhedron 16 (1997) 967–974.
[273] J.M Miller, Prog. Nucl. Magn. Reson. Sp. 28 (1996) 255–281.
[274] P.J. Chupas, D.R. Corbin,V.N.M Rao, J.C. Hanson, C.P. Grey, J. Phys. Chem. B 107 (2003) 8327–
8336.

Lebenslauf
126
Lebenslauf
Name: Zhijian Li
Geburtsort: Zhangping, Fujian, P.R China
Geburtsdatum: 27.04.1977
Schulbildung
09.1983–06.1989 Shiyan Primary School, Zhangping, Fujian, P.R China
09.1989–06.1992 No.1 Middle School, Zhangping, Fujian, P.R China
09.1992–06.1995 No.1 High School, Zhangping, Fujian, P.R China
Hochschulbildung
09.1995–06.1999 Department of Chemistry, Nankai University, Tianjin, P.R.China
Bachelor of Science (Chemistry)
09.1999–07.2002 Department of Chemistry, Nankai University, Tianjin, P.R.China
Master of Science (Chemistry)
10.2002–08.2005 Promotion an der Humboldt-Universität zu Berlin
im Institut für Anorganische Chemie bei Prof. Dr. E. Kemnitz

Selbständigkeitserklärung
127
Selbständigkeitserklärung
Hiermit erkläre ich, die vorliegende Arbeit selbständig ohne fremde Hilfe verfaßt und nur
die angegebene Literatur und Hilfsmittel verwendet zu haben.
Zhijian Li
5 Juli 2005