SYNTHESIS AND STUDY OF CARBOHYDRATE BASED …
263
SYNTHESIS AND STUDY OF CARBOHYDRATE BASED HYDROGELS AND SELF ASSEMBLED GLYCOACRYLAMIDES FOR BIOMEDICAL APPLICATIONS By JUBY K. AJISH CHEM 01201104016 Bhabha Atomic Research Centre, Mumbai A thesis submitted to the board of studies in Chemical Sciences In partial fulfillment of requirements for the degree of DOCTOR OF PHILOSOPHY Of HOMI BHABHA NATIONAL INSTITUTE May 2016
Transcript of SYNTHESIS AND STUDY OF CARBOHYDRATE BASED …

SYNTHESIS AND STUDY OF
CARBOHYDRATE BASED HYDROGELS AND
SELF ASSEMBLED GLYCOACRYLAMIDES
FOR BIOMEDICAL APPLICATIONS
By
JUBY K. AJISH
CHEM 01201104016
Bhabha Atomic Research Centre, Mumbai
A thesis submitted to the board of studies in Chemical Sciences
In partial fulfillment of requirements for the degree of
DOCTOR OF PHILOSOPHY
Of
HOMI BHABHA NATIONAL INSTITUTE
May 2016


List of publications arising from the thesis
1. Glycopolymeric gel stabilized N-succinyl chitosan beads for controlled
doxorubicin delivery.
Juby K. Ajish, K. S. Ajish Kumar, S. Chattopadhyay, Manmohan Kumar,
Carbohydrate Polymers 2016, 144, 98-105.
2. D-glucose based bisacrylamide crosslinker: Synthesis and study of
homogeneous biocompatible glycopolymeric hydrogels.
Juby K. Ajish, K. S. Ajish Kumar, Mahesh Subramanian, Manmohan
Kumar, RSC Advances, 2014, 4, 59370-59378.
3. Silver nanoparticle loaded PVA/gum acacia hydrogel: Synthesis,
characterization and antibacterial study.
K. A. Juby, Charu Dwivedi, Manmohan Kumar, Swathi Kota, H. S.
Misra, P. N. Bajaj, Carbohydrate Polymers, 2012, 89, 906-913.
4. Fluorescence turn-on sensing of lectins and cell imaging based on
aggregation-induced emission of glycoacrylamides.
Juby K. Ajish, K. S. Ajish Kumar, Mahesh Subramanian, S.
Chattopadhyay, Manmohan Kumar, RSC Advances, 2016
(Communicated).

List of publications: associated with research work
1. Copper hexacyanoferrate–polymer composite beads for cesium ion
removal: Synthesis, characterization, sorption, and kinetic studies.
Charu Dwivedi, Amar Kumar, Krishan Kant Singh, Ajish K. Juby,
Manmohan Kumar, P. K. Wattal, P. N. Bajaj, Journal of Applied Polymer
Science, 2013, 152-160.
2. PC-88A - Impregnated polymeric beads: Preparation, characterization and
application for extraction of Pu (IV) from nitric acid medium.
S. K. Pathak, Subhash C. Tripathi, K. K. Singh, A. K. Mahtele, Charu
Dwivedi, K. A. Juby, Manmohan Kumar, P. M. Gandhi, P. N. Bajaj,
Radiochimica Acta, 2013, 101,761-771.
3. Resorcinol-formaldehyde coated XAD resin beads for removal of cesium
ions from radioactive waste: synthesis, sorption and kinetic studies.
Charu Dwivedi, Amar Kumar, Juby K. Ajish, Krishan Kant Singh,
Manmohan Kumar, P. K. Wattal, P. N. Bajaj, RSC Advances, 2012, 2,
5557-5564.
4. Preparation and evaluation of alginate-assisted spherical resorcinol–
formaldehyde resin beads for removal of cesium from alkaline waste.
Charu Dwivedi, Amar Kumar, Kuttan Ajish Juby, Manmohan Kumar, P.
K. Wattal, P. N. Bajaj, Chemical Engineering Journal, 2012, 200-202,
491-498.


DEDICATIONS
Dedicated to my Husband and Parents

ACKNOWLEDGEMENTS
At this stage of writing the acknowledgements part of my Ph.D thesis, I look back
through the last five years of Ph.D life, when I really feel the importance of each
and every person involved in my doctoral work. This thesis does not only
represent my work at the keyboard. Now at this final stage, I would like to
express my heartfelt gratitude to all those who made this happen.
First and foremost I want to thank my supervisor Dr. Manmohan Kumar
for his continuous support till the final stage of Ph.D work. I appreciate all his
contributions of time, effort, ideas and encouragements throughout the tenure of
my research. His guidance in every stage of the project has helped me in gaining a
better knowledge about the subject. Dr. Manmohan Kumar was relentless in
providing timely advice, direction and hope when things were not going right.
Thanks a lot sir, for being such a good human being.
I convey my warm gratitude to Dr. B. N. Jagatap, Director, Chemistry
group and Dr. D. K. Palit, Head, Radiation and Photochemistry division (RPCD)
of BARC, Mumbai for providing me all the facilities in BARC to carry out my
PhD work.
I am immensely thankful to all the doctoral committee members Dr. S. K.
Sarkar, Dr. Lalit Varshney, Dr. Ashok Pandey and Dr. B. S. Patro for their
valuable guidance, timely cooperation and guidance. I am equally obliged to Dr.
S. Chattopadhyay, Head, Bio-sciences Group, for the scientific discussions
during the course of my research work, which helped me a lot. I take this

opportunity to thank Dr. P. N. Bajaj for his valuable time and suggestions during
article correction.
Words would not be enough to express my gratitude towards my husband
and main collaborator in the Ph.D work, Dr. Ajish Kumar K. S, without whom it
would have been difficult to carry out the work. My research work was benefitted
immensely with the molecules synthesized with your help. The molecules were
just tailor made for my work and helped improving the quality of the work.
I am grateful to my lab mates Mr. Krishankant Singh, Mr. Anant
Kanagare and Ms. Aakansha Ruhela for their assistance in experimental work.
Working with them is always a pleasure. I am equally grateful to Dr. Chetan P.
Shah and Dr. Charu Dwivedi, who were there with me during the initial stages of
my Ph.D work.
My sincere thanks to all my fellow lab mates Mrs. Ridhima Chadha, Mr.
Abhishek Das, Dr. Nandita Maiti, Mr. Akshay Dhayagude, Mr. Sugosh R.
Prabhu, Mr. Tushar Debnath, Mr. Aruna Kumar Mora and Mrs. Laboni Das,
all of you call for a special mention. Thank you all for being such good friends
which made my daily work enjoyable and fun. Avery special thanks to my dear
and dearest friend Dr. Neha Thakur for her glorious presence in my life. Thank
you for being such a gem of a friend who gave a soothing hand during the most
difficult times. I also extend my sincere thanks to all my friends and colleagues of
Radiation and Photochemistry Division for their love and support.


CONTENTS
Page No.
SYNOPSIS i
LIST OF FIGURES ix
LIST OF SCHEMES xiv
LIST OF TABLES xiv
CHAPTER 1: Introduction
1.1. Radiation induced formation of hydrogels 3
1.2. Hydrogel based antibacterial wound dressings 4
1.3. States of water in hydrogels 5
1.4. Metal nanoparticle embedded hydrogels 6
1.4.1. Hydrogel formation in nanoparticle suspension 8
1.4.2. Gelation of hydrogel matrix followed by physical 8
embedding of nanoparticles
1.4.3. Reactive nanoparticle formation aided by 9
hydrogel network
1.4.4. Nanoparticle assisted hydrogel formation 9
1.5. Antibacterial activity of silver nanoparticle 10
(AgNPs) loaded hydrogels
1.6. Next generation of nanocomposite hydrogels 11
1.7. Hydrogels for controlled drug delivery applications 13
1.7.1. Methods of hydrogel synthesis 15
1.7.1.1. Bulk polymerization 15

1.7.1.2. Suspension polymerization or inverse – 16
suspension polymerization
1.7.1.3. Solution polymerization 16
1.7.1.4. Polymerization by irradiation 17
1.7.2. Classification of hydrogels 17
1.7.2.1. Chemically crosslinked hydrogels 17
1.7.2.2. Physically crosslinked hydrogels 18
1.7.2.3. Ionically crosslinked hydrogels 18
1.7.3. Drug release mechanisms from hydrogel devices 19
1.7.3.1. Diffusion controlled delivery systems 19
1.7.3.2. Swelling controlled delivery systems 23
1.7.3.3. Chemically controlled delivery systems 24
1.8. Design and synthesis of glycopolymers: 26
Multivalent recognition with lectins
1.9. Lectin–carbohydrate interaction, “the cluster 31
glycoside effect”
1.9.1. Plant lectins 32
1.9.1.1. Legumes 32
1.9.1.2. Cereal lectins 33
1.9.2. Animal lectins 33
1.9.2.1. C-Type 33
1.9.2.2. S-Type (Galectins) 34
1.9.3. Lectin Binding assays 35

1.10. Aggregation induced emission 37
1.10.1. Planarity and rotatability 39
1.10.2. Intramolecular restrictions 39
1.10.3. Intermolecular interactions 40
1.11. Technological applications 41
CHAPTER 2: Experimental and Techniques
2.1. Introduction 44
2.2. Materials 44
2.3. Synthetic strategies for hydrogels and polymeric beads 45
2.3.1. Synthesis of hydrogels by γ-radiation induced technique 45
2.3.2. Synthesis of glycopolymer stabilized N-succinyl 46
chitosan beads
2.3.3. Synthesis of self assembled fluorescent 46
glycoacrylamide nanoparticles
2.4. Analytical Methods 47
2.4.1. Scanning electron microscopy (SEM) 47
2.4.2. Tunneling electron microscope (TEM) 49
2.4.3. Confocal fluorescence microscopy 50
2.4.4. Fourier transform infra-red (FT-IR) spectroscopy 52
2.4.5. UV-visible absorption spectroscopy 54
2.4.6. Fluorescence spectrophotometry 56
2.4.7. Nuclear magnetic resonance (NMR) spectroscopy 58
2.4.8. Thermal analysis 63

2.4.8.1. Thermogravimetric analysis (TGA) 63
2.4.8.2. Differential scanning calorimetry (DSC) 64
2.4.9. Dynamic light scattering (DLS) 67
2.5.0. Cobalt-60 gamma irradiator 69
2.5.1. Rheometer 71
CHAPTER 3: Silver nanoparticle loaded antibacterial PVA/gum
acacia hydrogel
3.1. Introduction 76
3.2. Experimental 78
3.2.1. Preparation of Ag /PVA-GA hydrogel 78
3.2.2. Characterization of the synthesized Ag /PVA-GA hydrogels 81
3.2.2.1. FT-IR analysis 81
3.2.2.2. Thermogravimetric analysis 83
3.2.3. Swelling studies of the hydrogel 84
3.2.3.1. Equilibrium degree of swelling as a function of PVA 85
and GA concentration
3.2.3.2. Equilibrium degree of swelling as a function of pH 86
3.2.4. Release of silver from hydrogels 87
3.2.5. Particle size analysis 89
3.2.6. Gel point determination 91
3.2.6.1. Conditions of rheology experiments 92
3.2.6.2. Evolution of the modulus G’ and G” with applied 92
radiation dose and determination of the gel point

3.2.7. Antibacterial Studies 95
3.3. Conclusions 96
CHAPTER 4: Synthesis and study of biocompatible glycopolymeric
hydrogels
4.1. Introduction 99
4.2. Experimental 102
4.2.1. 3-Azido-3-deoxy-5-hydroxy-1,2-O-isopropylidene-6-O- 102
tosyl--D-gluco-furanose (4)
4.2.2. 3,6-Diazido-3,6,-dideoxy-5-hydroxy-1,- O-isopropylidene 103
--D-gluco-furanose(5)
4.2.3. 3,6-Bisacrylamido-3,6,-dideoxy-5-hydroxy-1,2-O- 116
isopropylidene--D-gluco-furanose (6)
4.2.4. (2R,3S,4S,5S)-4-acrylamido-6-(acrylamidomethyl)- 108
tetrahydro-2H-Pyran-2,3,5-triol (Glc-bis, 2a)
4.2.5. {[1,2,],[5,6]}-Di-O-isopropylidene-3-O-tert- 108
butyldiphenylsilyl--D-gluco-furanose (8)
4.2.6. 5,6-Dihydroxy-1,2-O-isopropylidene-3-O-tert- 112
butyldiphenylsilyl--D-gluco-furanose (9)
4.2.7. 6-Azido-6-deoxy-5-hydroxy-1,2-O-isopropylidene-3- 113
O-tert-butyldiphenylsilyl--D-gluco-furanose (10)
4.2.8. 6-Acrylamido-6-deoxy-5-hydroxy-1,2-O-isopropylidene- 116
3-O-tert-butyldiphenylsilyl--D-gluco-furanose (11)
4.2.9. 6-Acrylamido-6-deoxy-3,5-dihydroxy-1,2-O- 117
isopropylidene--D-gluco-furanose (12)

4.3.0. N-(((3S,4S,5S,6R)-tetrahydro-3,4,5,6-tetrahydroxy- 120
2H-pyran-2-yl)methyl) acrylamide (Glc-acryl, 2b)
4.3.1. Preparation of Glc-gel 121
4.3.2. Characterization of hydrogels 121
4.3.2.1. Swelling kinetics and equilibrium degree of swelling 121
4.3.2.2. Dynamic rheological analysis 122
4.3.2.3. Thermal Analysis of Glc-gel 122
4.3.3. In vitro cell cytotoxicity test 124
4.3.4. Lectin recognition studies 125
4.4. Results and Discussion 125
4.4.1. Synthesis of Glc-bis (2a) 125
4.4.2. Synthesis of Glc-acryl (2b) 126
4.4.3. FT-IR analysis 129
4.4.4. Swelling studies 130
4.4.5. Effect of Glc-bis concentration on viscoelastic properties 131
4.4.6. Thermogravimetric analysis 134
4.4.7. Influence of Glc-bis concentration upon states of water 135
4.4.8. Influence of Glc-acryl concentration upon states of water 136
4.4.9. In vitro cytotoxicity of Glc-acryl, Glc-bis and Glc-gel 137
4.4.10. Recognition study of Glc-gel towards Con A 140
4.5. Conclusion 141
CHAPTER 5: Glycopolymer gel stabilized N-succinyl chitosan beads
for controlled doxorubicin delivery

5.1. Introduction 143
5.2. Experimental 146
5.2.1. Synthesis of NSCs 146
5.2.2. Synthesis of Glycopolymeric hydrogel (Glc-gel) 147
5.2.3. Synthesis of NSC/Glc-gel beads 147
5.2.4. Determination of glycopolymer content in the bead 147
5.2.5. Swelling and weight loss studies of NSC/Glc-gel beads 148
5.2.6. Synthesis of DOX-loaded NSC/Glc-gel beads 148
5.3. Characterization 149
5.3.1. Drug release studies 149
5.3.2. Morphological studies 149
5.3.3. Specific lectin recognition studies of DOX 150
loaded NSC/Glc-gel beads
5.4. Results and discussion 150
5.4.1. Synthesis and characterization of NSC/Glc-gel beads 150
5.4.2. Swelling studies of NSC/Glc-gel beads 154
5.4.3. DOX encapsulation by the NSC/Glc-gel beads 156
5.4.4. Thermal Analysis of the beads 157
5.4.5. Swelling and pH responsiveness of the DOX-loaded 158
NSC/Glc-gel beads
5.4.6. Drug release studies in vitro 159
5.4.7. Specific interaction between NSC and DOX 161
5.4.8. Mechanism of drug release 161

5.4.9. Surface morphology of the beads 163
5.4.10. Specific interaction between DOX loaded 165
NSC/Glc-gel beads and Con A
5.5. Conclusion 166
CHAPTER 6: Self assembled fluorescent glycoacrylamides
6.1. Introduction 169
6.2. Experimental 172
6.2.1. Sample preparation for self- assembly studies of 172
Glc-acryl and Glc-bis
6.2.2. Sample preparation for lectin sensing studies 173
6.2.3. Determination of Association Constant (Ka) 173
6.2.4. Confocal microscopic imaging of cells using 174
Glc-acryl and Glc-bis
6.3. Results and discussion 174
6.3.1. Fluorescence spectral properties of 174
Glc-acryl and Glc-bis
6.3.2. Critical aggregation concentration (CAC) 176
6.3.3. pH dependent self assembly and fluorescence emission 177
6.3.4. Fluorescence “turn on” sensing of Con A 179
6.3.5. Binding affinities and limit of detection (LOD) 181
of Glc-acryl and Glc-bis towards lectins
6.3.6. Cell imaging application of Glc-acryl and Glc-bis 184
6.4. Conclusions 185

CHAPTER 7: Conclusions and future perspectives
7.1. Outcome of present work 188
7.2. Future Scope 191
REFERENCES 193


SYNOPSIS
i
SYNOPSIS
Polymers in various forms like hydrogels, polymeric beads, thin films,
nanoparticles so on and so forth; have become a part of our day to day life. These
materials have become inevitable especially with advancement of technology.
Hence development of new materials and investigating the properties with better
applicability has become a major area of research these days. This dissertation is
therefore aimed at the synthesis and study of bulk hydrogels as well as gel beads
for antibacterial and drug delivery applications. Apart from this, the last part of
the thesis also focuses on the aggregation induced emission studies of new
glycoacrylamides, for cell imaging and biosensing applications.
Chapter 1: Introduction
This chapter deals with a general introduction about the polymeric hydrogels,
methods of synthesis and their applications in various biomedical fields. It begins
with a brief note on the existing methods of hydrogel synthesis and the
advantages of radiation-induced polymerization method. A detailed literature
survey on the nanoparticles loaded hydrogels, their properties, applications, etc.,
have been discussed. In the next part a background about the synthetic
glycopolymers, their biorecognition ability and use in targeted drug delivery is
given. Later part of the chapter portrays the self assembly behaviour of small
molecules, aggregation-induced emission and its importance in cell imaging as

SYNOPSIS
ii
well as biosensing applications. The chapter ends with the scope of the work and
future possibilities in the fields presented in the dissertation.
Chapter 2: Experimental Techniques
This chapter gives a brief description about the experimental techniques utilized
for the work mentioned in the thesis. Basic working principles of the instruments
used like Rheometer, Thermogravimeter (TG), Differential scanning calorimeter
(DSC), Infrared spectrometer (IR), Elemental analyzer, Dynamic light scattering
(DLS), UV-vis and Fluorescence spectrophotometry, is presented briefly in this
chapter. The working principle and experimental arrangement of microscopic
techniques, like Scanning electron microscopy (SEM), Tunneling electron
microscopy (TEM), and Confocal microscopy (CM) is also given. The chapter
also contains a brief description about the Nuclear magnetic resonance
spectroscopy (NMR) which was utilized for characterization of the synthesized
glycoacrylamides and chitosan derivatives.
Chapter 3: Silver nanoparticle loaded antibacterial PVA/gum acacia
hydrogel
This chapter deals with a simple one-pot method for in-situ synthesis of silver
nanoparticles (AgNPs), within polyvinyl alcohol-gum acacia (PVA–GA) hydrogel
matrix, by γ-radiation induced cross-linking. While considering the synthesis of
hydrogels, its biocompatibility is an important parameter for biomedical
applications. Synthesis of biocompatible hydrogel matrix from a nontoxic,

SYNOPSIS
iii
economical, and easily available materials, such as polysaccharides, is more
advantageous than that from synthetic polymers1. However, polysaccharides like
GA cannot be cross-linked by γ-irradiation, whereas PVA can and results in
formation of hydrogels, induced by gamma, as well as electron irradiation. The
highly biocompatible, economical and environmental friendly nature of both gum
acacia and PVA make this obvious choice for the synthesis of a composite
hydrogel matrix. Recent studies have shown that, silver, in the form of
nanoparticles, is very effective as antimicrobial agent, both in-vivo and in-vitro,
as compared to bulk silver, or silver ions, due to their enhanced permeation and
retention (EPR) effects2. Thus, a combination of water soluble biopolymer GA
and synthetic polymer PVA with silver nanoparticles (AgNPs) can produce new
hydrogel matrix, with antimicrobial property.
The AgNPs were generated in-situ in the hydrogel matrix by γ-irradiation. This
chapter gives a brief description about the reactions taking place in aqueous
solutions during γ-radiolysis, which leads to crosslinking and reduction of silver
ions3. The synthesized gels were tested for thermal stability, equilibrium swelling,
AgNPs release kinetics, size of AgNPs leached out and its dependence on the
antibacterial activity against E.coli bacteria. Major objective of this study was to
determine how the size and rate of leaching out of AgNPs affect the antibacterial
activity. It was observed that higher the crosslinking density, smaller is the size of
AgNPs and better is the antibacterial activity, even though the rate of leaching is
slow.

SYNOPSIS
iv
In addition, gel point of the synthesized hydrogel was determined rheologically by
Chambon-Winter (CW) criterion4. A radiation dose of 25.34 kGy was calculated
to be the gel point which is close to the sterilization dose for biomedical
applications.
Chapter 4: Synthesis and study of biocompatible glycopolymeric hydrogels
This chapter contains the synthesis of D-glucose derived glycoacrylamides and
glycopolymeric hydrogels. The objective of synthesizing a glycopolymeric gel
was to generate a material which can be targeted to specific cellular site. The
ability of sugar pendants in glycopolymers to mimic that on the cell surface
makes them a unique class of materials for targeted drug delivery applications5.
Generally, sugar based hydrogels are synthesized from low molecular weight
gelators (LMWG) like alkyl gluconamides, phenyl β-D-glucopyranoside etc.
However, it has been reported that hydrogels derived from LMWG possess
several disadvantages that include aggregation, crystallization or precipitation
with time6. One of the ways to overcome this is to synthesize hydrogel from low
molecular weight carbohydrate derivative by radiation polymerization. This
technique has the potential to overcome most of the limitations that arise from
LMWG, as the radiation crosslinked hydrogels possess more lifetime stability due
to covalent crosslinking. An added advantage of radiation-induced synthesis is
that, by applying appropriate radiation dose, a sterilized hydrogel can be achieved
in a one pot process.

SYNOPSIS
v
Citing the significance of glycopolymeric hydrogels, D-glucose based
bisacrylamide substituted at C-3 and C-6 carbon of sugar (Glc-bis) and
monoacrylamide substituted at C-6 position (Glc-acryl) was synthesized and their
gelation was studied using radiation polymerization. The synthesized Glc-bis and
Glc-acryl were characterized by 1H and 13C-NMR. The molecular structure, water
content, viscoelasticity, thermal stability, cytotoxicity and lectin recognition of the
synthesized hydrogels (Glc-gel) were studied using the techniques, like FT-IR
spectroscopy, Oscillatory rheology, Thermogravimetric-Differential Scanning
Calorimetric (TG-DSC) analysis, MTT assay and UV-vis spectroscopy, all of
which have been discussed in detail in this chapter.
Chapter 5: Glycopolymer gel stabilized N-succinyl chitosan beads for
controlled doxorubicin delivery
This chapter involves the synthesis and study of N-succinyl chitosan (NSC) based
hydrogel beads, stabilized with glycopolymeric network (NSC/Glc-gel), for
application in delivery of anticancer drug, doxorubicin (DOX). We hypothesized
that the Glc-gel would provide the required stability for the NSC beads against
dissolution upon drug loading, and could control the drug release. The
biocompatible Glc-gel used for stabilization of the beads was made from
bisacrylamide (Glc-bis) and monoacrylamide (Glc-acryl) derived from D-glucose.
The bio-recognition of lectins by the NSC/Glc-gel beads was also studied by UV-
vis spectrophotometry.

SYNOPSIS
vi
The extent of DOX loading was proportional to the degree of
succinylation and the swelling kinetics of the beads exhibited pH dependency.
The beads exhibited sustained release of DOX over a period of more than 15 days
in an acidic environment, mimicking the microenvironment of tumor cells. While
the rate of DOX release at physiological pH was found to be much slower7.
Release exponent ‘n’ derived from Korsmeyer-Peppas model implied that the
NSC88/Glc-gel beads with 88% succinylation of chitosan followed fickian
diffusion controlled release mechanism, whereas the NSC75/Glc-gel beads with
75% succinylation of chitosan followed zero order release profile8. The
synthesized beads also showed specificity to lectin Concanavalin A. This
stabilized polysaccharide based glycopolymeric gel bead could be a suitable base
for pharmaceutical applications.
Chapter 6: Self assembled fluorescent glycoacrylamides
The design and synthesis of fluorescent self assembled nanostructures are of great
interest due to their applicability in drug delivery, molecular actuators, functional
biomaterials and analytical biosensors. Multiple weak non covalent interactions
play a major role in formation of interesting structures with a particular
arrangement, which imparts some amazing properties that make them stimuli
responsive. These non-covalent interactions in self assembled systems make them
fluorescent and this property can be utilized in bio-sensing, cell imaging, etc.

SYNOPSIS
vii
Syntheses of amphiphilic molecules containing carbohydrate moieties,
which can self assemble to well defined nanostructures, can be promising
scaffolds for interacting with biological receptors. The glucose based C-6
acrylamide (Glc- acryl) and C-3, C-6 bisacrylamide (Glc-bis) exhibit pH
dependent self assembly with fluorescent emission. The building blocks contain
hydrophobic acrylamide units which act as the fluorescent probe by virtue of its
stacking through weak π-π interaction and the hydrophilic glucose units serve as
the lectin binding moiety. Significant fluorescence enhancement upon interaction
with Con A arises due to enhanced Aggregation Induced Emission (AIE) effect9.
The biocompatibility and cell uptake behaviours of Glc-acryl and Glc-bis were
also studied using human intestinal cell lines (INT407), as it contain receptors
which can specifically identify D-glucose moieties10.
Chapter 7: Conclusions and Future Perspectives
This chapter gives a brief summary and highlights of the present investigation
with future perspectives that can be explored utilizing the present knowledge on
synthesis of hydrogels and self assembled nanoparticles. The main findings are as
follows:
AgNPs loaded hydrogels utilizing naturally occurring polysaccharide can
be made by gamma radiation induced method.
The size of AgNPs as well as its rate of leaching plays an important role in
antibacterial applications.

SYNOPSIS
viii
A purely glycopolymer based hydrogel utilizing the synthesized
glycoacrylamides as the constituents were synthesized by γ- radiation
induced polymerization and crosslinking.
The glycopolymeric hydrogel showed specificity to lectins and can be
utilized for drug delivery applications.
Glycopolymer stabilized N-succinyl chitosan beads were synthesized for
anticancer drug, doxorubicin (DOX) delivery.
The NSC/Glc-gel beads exhibited a slow and sustained pH dependent
delivery of the drug over a period of about 18 days.
The synthesized glycoacrylamides were found to self assemble in water
which results in pH dependent fluorescent emission.
A comparative study of emission, cellular uptake, and lectin biosensing
was carried out for both the synthesized glycoacrylamides Glc-acryl and
Glc-bis.
References
1. Francis, S.; Varshney, L. and Kumar, M. Radiat. Phys. and Chem. 2004,
69, 481-486.
2. Kora, A. J.; Sashidhar, R. B. and Arunachalam, J. Carbohydr. Polym.
2010, 82, 670-679.
3. Rao, Y. N.; Banerjee, D.; Datta, A.; Das, S. K.; Guin, R and Saha, A.
Radiat. Phys. and Chem. 2010, 79, 1240-1246.

SYNOPSIS
ix
4. Chambon, F.; Petrovic, Z. S.; MacKnight, W. J. and Winter, H. H.
Macromolecules, 1986, 19, 2146-2149.
5. Kopecek, J.; Kopeckova, P.; Brondsted, H.; Rathi, R.; Rihova, B.; Yeh, P.
Y. and Ikesue, K. J. Control. Release, 1992, 19, 121-130.
6. Raeburn, J.; Cardoso, A. Z. and Adams, D. J. Chem. Soc. Rev. 2013, 42,
5143-5156.
7. Duan, C.; Gao, J.; Zhang, D.; Jia, L.; Liu, Y.; Zheng, D.; Liu, G.; Tian, X.;
Wang, F. and Zhang, Q. Biomacromolecules, 2011, 12, 4335-4343.
8. Korsemeyer, R. W.; Gurny, R.; Doelker, E.; Buri, P. and Peppas, N. A.
Intl. J. Pharm.1983, 15, 25-35.
9. Sanji,T.; Shiraishi, K.; Nakamura, M. and Tanaka, M. Chem. Asian J.
2010, 5, 817-824.
10. Lu, Z.; Mei, L.; Zhang, X.; Wang, Y.; Zhao,Y. and Li, C. Polym. Chem.
2013, 4, 5743-5750.

LIST OF FIGURES
ix
Fig.
No: Title
Page
No:
1.1 An overview of potential bio-medical applications of AgNP-
hydrogel composites. 11
1.2 Drug delivery from a typical reservoir device 20
1.3 Drug delivery from a typical matrix drug delivery system 21
1.4 Structures of natural glycopolymers. (1) starch; (2) chitin; (3)
cellulose; (4) heparin; (5) hyaluronan; (6) chondroitin sulfate. 27
1.5 Allyl glucosides derived from various monosaccharides (7) 27
1.6 Methacrylate and ethyl acrylate of glucopyranosyloxy (8),
galactopyranosyloxy (9), mannopyranosyloxy (10),
xylopyranosyloxy (11).
28
1.7 4-acrylamidophenyl -lactoside (12) 29
1.8 Coupling of glucosamine to polyvinyl alcohol functionalized with
4-nitrophenyl carbonate groups 30
1.9 Structure of perylene 38
1.10 Propeller type structure of HPS 38
1.11 RIR effect on luminescence behaviours of biphenyl-based
luminogens. 40
1.12 Structure of AIE active TPE molecule 41
2.1 Various components of a typical SEM 48
2.2 Schematic diagram of TEM. 50
2.3 Picture depicting the principle of confocal fluorescence
microscopy. 51
2.4 Schematic of excitation of the specimen in confocal fluorescence
microscopy by a laser. 52
2.5 Schematic of FT-IR spectrometer equipped with ATR-cell. 53
2.6 A schematic of the UV-visible spectrophotometer 55 2.7 Schematic diagram of a fluorescence spectrophotometer 57

LIST OF FIGURES
x
2.8 Jablonski diagram 58 2.9 Energy levels of a nucleus with spin quantum number ½ 60
2.10 Schematic representation of NMR spectrometer 62 2.11 Block diagram of thermogravimeter 64 2.12 Pictorial representation of (a) heat flow and (b) heat flux DSC 65 2.13 Decay scheme of Cobalt-60 70 3.1 Schematic representation of the synthesis of PVA-GA hydrogel
containing AgNPs 79
3.2 FT-IR spectra of vaccum dried hydrogel samples: (A) (a) without
AgNPs (b) with AgNPs. (B) Synthesized using variable GA
concentrations ((a) 0%, (b) 1%, (c) 3%, (d) (5%) with 3% PVA, 1
mM AgNO3, at an applied radiation dose of 35 kGy).
82
3.3 Thermogravimetric curve showing the weight loss in (Ag/PVA-
GA) and (PVA-GA) vaccum dried hydrogel samples. 84
3.4 Graph showing the silver release profiles of hydrogels prepared
with different GA concentrations, at 5% PVA, 1 mM AgNO3 and
applied radiation dose of 35 kGy
88
3.5 Variation in particle size at different GA concentration keeping all
other parameters constant (a) 1% GA (b) 2% GA (c) 3% GA (d)
5% GA
90
3.6 Frequency dependence of storage modulus G’ (closed symbols) and
loss modulus G” (open symbols) at different applied radiation dose 93
3.7 Frequency dependence of damping factor at different applied
radiation doses 94
3.8 Power law coefficient (q), versus irradiation time for samples
synthesized with 5% PVA, 3% GA and 1 mM AgNO3 .All
correlation coefficients for power law fit R2≥ 0.95
95
3.9 Antibacterial activity picture of hydrogel samples, against E.Coli 96

LIST OF FIGURES
xi
bacteria (a) no silver loading (b) 1% GA (c) 2% GA (d) 3% GA (e)
5% GA. All samples were prepared with 1 mM AgNO3, 3 % PVA
and radiation dose of 35 kGy.
4.1 Acrylamides derived from D-glucose 101
4.2 1H NMR spectrum of compound 4 104
4.3 13C NMR spectrum of compound 4 104
4.4 1H NMR spectrum of compound 5 105
4.5 13C NMR spectrum of compound 5 105
4.6 1H NMR spectrum of compound 6 107
4.7 13C NMR spectrum of compound 6 107
4.8 1H NMR spectrum of compound 2a 110
4.9 13C NMR spectrum of compound 2a 110
4.10 1H NMR spectrum of compound 8 111
4.11 13C NMR spectrum of compound 8 111
4.12 1H NMR spectrum of compound 9 114
4.13 13C NMR spectrum of compound 9 114
4.14 1H NMR spectrum of compound 10 115
4.15 13C NMR spectrum of compound 10 115
4.16 1H NMR spectrum of compound 11 118
4.17 13C NMR spectrum of compound 11 118
4.18 1H NMR spectrum of compound 12 119
4.19 13C NMR spectrum of compound 12 119
4.20 1H NMR spectrum of compound 2b 120
4.21 13C NMR spectrum of compound 2b 121
4.22 Possible hydrogen bonding between anomeric OH and lone pair on
ring oxygen 128
4.23 Photograph of (A) freeze dried Glc-gel (B) swollen Glc-gel formed
by radiation induced polymerization. 128

LIST OF FIGURES
xii
4.24 FT-IR spectrum of (A) dried Glc-gel, (B) Glc-bis and (C) Glc-acryl
powder. 129
4.25 The effect of Glc-bis concentration on the rate of swelling of the
Glc-gel (8% w/v Glc-acryl at radiation dose of 29.5 kGy) (left).
Variation in %EDS at different Glc-bis concentration in the
hydrogel formed with, 8% w/v Glc-acryl at radiation dose of 29.5
KGy (right).
130
4.26 Effect of Glc-bis concentration on the complex viscosity of
hydrogels at 37 oC at varying angular frequency 133
4.27 Thermal degradation profile of a typical vaccum dried Glc-gel 134
4.28 Thermal degradation curves for Glc-gel with varying Glc-acryl
concentration (a) 4 (b) 6 (c) 8 and (d) 10% w/v, at 0.1% w/v Glc-
bis and at an applied radiation dose of 29.5 kGy
135
4.29 DSC curves for determination of states of water in the Glc-gel with
varying Glc-bis concentration. 136
4.30 DSC curves for determination of states of water in the Glc-gel with
varying Glc-acryl concentration. 137
4.31 Quantification of viable cells by MTT assay after treatment for 48 h
with different test samples. The test samples were not different
from untreated sample (p< 0.05) as evaluated by unpaired student’s
t–test in case of both the cell lines.
138
4.32 Growth of cells monitored in the absence and presence of test
samples (1 mg/mL each of Glc-acryl and Glc-bis and 20 mg piece
of Glc-gel) under microscope (40 × magnification). (A) INT407
cells and (B) L929 cells
139
4.33 Interactions of Glc-gel with Con A (solid line) and BSA (dotted
line).
140
5.1 Doxorubicin hydrochloride and sugar acrylamides 144

LIST OF FIGURES
xiii
5.2 1H NMR spectrum of (A) Chitosan (85% deacetylation (D2O-0.1%
DCl, 25 oC)), (B) NSC (after 6h of succinylation (D2O, 25 oC)), (C)
NSC (after 9h of succinylation (D2O, 25 oC))
151
5.3 FT-IR spectra (a) CS, (b) NSC/Glc-gel and (c) NSC powders 153
5.4 Swelling behaviors of (A) Glc-gel at pHs 3, 5 and 7.4 (B)
NSC/Glc-gel beads at pHs 5 and 7.4 155
5.5 A) Photographic image of DOX solution as such (500 µg/mL) (1),
in presence of NSC67/Glc-gel (2) and NSC80/Glc-gel (3) beads (B)
Optical microscope image of DOX loaded (red) and unloaded
(transparent) swollen NSC67/Glc-gel beads (C) vacuum dried DOX
loaded NSC67/Glc-gel bead (left), NSC67/Glc-gel bead (middle)
and swollen NSC67/Glc-gel bead (right).
156
5.6 TGA thermograms of NSC beads and Glc-gel (A), unloaded and
DOX-loaded NSC/Glc-gel beads (B) 158
5.7 Swelling and pH responsiveness of DOX loaded NSC/Glc-gel
beads at pH 7.4 and 5. (Red symbols indicate data for DOX loaded
beads and black symbols indicate those for unloaded NSC/Glc-gel
beads
159
5.8 DOX release profiles from the loaded NSC/Glc-gel beads at pHs
7.4 and 5. 160
5.9 UV-Vis spectra of DOX and NSC75-DOX complex in aqueous
solution 161
5.10 Linear fitted curves of drug release applying Korsmeyer-Peppas
equation for (A) NSC75/Glc-gel bead at pH5 (B) NSC88/Glc-gel
bead at pH 5 (C) NSC75/Glc-gel bead at pH 7.4 (D) NSC88/Glc-
gel bead at pH 7.4.
163
5.11 SEM images of DOX loaded NSC67/Glc-gel beads after swelling
and freeze dried at (A) pH 5 (B) pH 7.4. Magnified images showing 164

LIST OF FIGURES
xiv
Glc-gel network on the surface at (C) pH 5 (D) pH 7.4. Images of
same beads at even higher magnification showing the NSC
networks (E) bead with precipitated NSC at pH 5 (F) uniform and
intact bead at pH 7.4.
5.12 Interaction of the DOX loaded NSC/Glc-gel beads with Con A,
PNA and BSA 166
6.1 Sugar acrylamides 171
6.2 Emission spectra of Glc-acryl (A) and Glc-bis (B) at varying
excitation wavelengths. 175
6.3 Bright field image (A) and Fluorescent images (B, C, D) showing
blue, red and yellow emissions of glycoacrylamide 176
6.4 Log of Concentration versus Fluorescence intensity plot for Glc-
acryl (A) and Glc- bis (B) 177
6.5 pH dependent fluorescent emission of (A) Glc-acryl and (B) Glc-
bis 178
6.6 TEM images of Glc-acryl and Glc-bis at different pH 179
6.7 Fluorescence enhancement of Glc- acryl (A) and Glc- bis (B) upon
addition of Con A 181
6.8 Fluorescence quenching of FITC-Con A and FITC-PNA by Glc-
acryl (A) and Glc-bis (B). 182
6.9 Scatchard Plot for Glc- acryl upon addition of (A) FITC- Con A (B)
FITC- PNA; for Glc- bis upon addition of (C) FITC- Con A D)
FITC- PNA
183
6.10 Confocal microscopy images of INT407 cell lines incubated with
Glc-acryl (Top row) and Glc-bis (Bottom row): (A) & (B)
Bright field, (C) & (D) Fluorescent images after excitation at 355
nm, (E) & (F) Merged image.
185

LIST OF SCHEMES & TABLES
xiv
List of Schemes
Scheme
No: Title
Page
No:
4.1 Synthesis of bisacrylamide 126
4.2 Synthesis of monoacrylamide 127
4.3 Synthesis of D-glucose derived glycopolymeric hydrogel 128
5.1 Synthesis of N-succinyl chitosan glycopolymeric gel bead
(NSC/Glc-gel) and the schematic of DOX release
mechanism. 152
List of Tables
Table
No: Title
Page
No:
1.1 Release exponent values (n) in the empirical power law model. 23
2.1 Thermal analysis techniques 63
3.1 Variation in % EDS at different PVA and GA concentrations
in the presence of 1 mM AgNO3. 86
3.2 Effect of pH on the % EDS of the hydrogel formed by
gamma irradiation of aqueous solution containing 3%
PVA, 5% GA, and 1 mM AgNO3 for 35 kGy dose.
87
5.1 Elemental analysis data of chitosan and NSC synthesized after
6 h (NSC-6h) and 9h (NSC-9h) of succinylation 152
6.1 Association constants (Ka) and Limit of Detection (LOD) of
Glc-acryl and Glc-bis towards Con A and PNA. 184


Chapter 1
1
CHAPTER 1
INTRODUCTION


Chapter 1
2
Introduction
Polymers and macromolecules in general have become a major part of our day to
day lives that it has become a necessity. As per the requirement or application
they are used in various forms, like hydrogels, nanoparticles, thin films, spherical
beads so on and so forth. For example, hydrogels have gained attention for
various biomedical applications, due to their biocompatibility imparted by high
water content in the three dimensional network.1,2 Hydrogels contain polymeric
units with hydrophilic domains which are hydrated in an aqueous environment,
creating the hydrogel structure. Hydrogels or gels in general can be synthesized
by chemical or physical crosslinks. Chemical crosslinks involves the construction
of covalent linkages between the polymer chains leading to the formation of
‘permanent’ or irreversible’ gels whereas, physical crosslinks comprise
interactions like interpenetrating networks (IPNs) or secondary forces like ionic
interaction, H-bonding or hydrophobic forces. Unlike chemicals crosslinks, the
gels formed through physical crosslinks are ‘physical’ or ‘reversible’ gels.3 The
hydrogels prepared by these crosslinks can exist in different physical forms
including solid molded forms, powdered matrices, microparticles, coatings,
membranes or sheets, etc.
Hydrogels can be made from natural or synthetic polymers. Natural
polymers, inspite of their various advantages like biodegradability, derivatization
at suitable reactive sites, etc., have disadvantages like enzymatic cleavage of
glycosidic bonds, batch wise variation and low mechanical strength.4 Synthetic

Chapter 1
3
polymers are advantageous in various aspects of hydrogel formation like, they can
be made responsive to external stimuli and their physical properties can be varied
by modifying the synthetic conditions. But they have several drawbacks like low
biodegradability and interference of various toxic side products arising during
synthesis which limits their usage in biomedical field. Considering all pros and
cons of synthetic and natural polymers, combinations of these polymers have
attracted much interest for manufacturing hydrogels.5
1.1. Radiation induced formation of hydrogels
Radiolysis of an aqueous solution by γ- radiation mainly produces hydroxyl
radical (HO.), hydrogen radicals (H
.) and hydrated electrons (eaq) species along
with some molecular products due to radiolysis of solvent (equation 1.1).
-radiationeaq, H3O, H2, H, HO, H2O2 (1.1)H2O
Among the transient species HO. is oxidizing while, H
. and eaq are reducing in
nature. Hydrated electrons exhibit low reactivity towards simple, hydrophilic gel
forming polymers, due to the absence of efficient scavengers. The main species
which are responsible for the formation of reactive polymer radicals are mainly
the hydroxyl radicals formed during water radiolysis. The macroradicals formed
during the interaction of HO.
with the polymer chains undergoes intermolecular
crosslinks i.e, recombination of two polymeric radicals to form gel. Other
reactions which compete with the intermolecular crosslinking include

Chapter 1
4
intramolecular crosslinks, inter and intramolecular disproportionation, processes
involving reactions like hydrogen transfer or chain scission, which do not lead to
the formation of macroscopic gels. Hence the concentration of the reactive species
should be optimized to form strong crosslinked networks. The hydrogels formed
by radiation induced method leads to formation of sterilized and permanent three
dimensional networks concurrently, at appropriate dose.7
1.2. Hydrogel based antibacterial wound dressings
Even though hydrogels are increasingly used in various biomedical fields, its use
in wound dressing applications is highly pronounced. The hydrogel wound
dressings produced by radiation based technology has following advantages:
1. It forms an efficient barrier for bacteria and prevents excessive loss of
body fluids.
2. Hydrogels allow diffusion of oxygen into the wound.
3. Hydrogels are soft and elastic but possess sufficient mechanical strength.
4. It has good non-sticky adhesive properties to the wound and healthy skin,
enabling painless removal/exchange of the dressing without disturbing the
healing process.
5. The transparency of the hydrogel dressing helps in easy monitoring of
wound healing process.
6. Controlled release of a drug to the wound can be done with the hydrogel
dressing.
7. Hydrogel maintains constant humidity on the wound environment.

Chapter 1
5
8. Hydrogels can also be utilized as sprays, emulsions, ointments and
creams.
The ability of hydrogels to absorb and retain water not only gives hydrogels a
strong superficial resemblance to living tissues, but also makes them permeable to
small molecules such as oxygen, nutrients and metabolites. The soft and flexible
nature of swollen hydrogels minimizes frictional irritation felt by the surrounding
cells and tissues.8
1.3. States of water in hydrogels
Water in hydrogels maintains a moist environment in the region of application
thereby facilitating processes like wound healing. In, addition, it also helps in
transport of various active agents through the network. A completely dried
hydrogel matrix can swell even 1000 times their initial weight. The amount of
absorbed water is usually expressed as the equilibrium water content (EWC,
equation 1.2).
EWC =Ww
Wt
X 100 (1.2)
Ww = weight of water in hydrogel
Wt = total weight of the hydrated gel
EWC is the water holding capacity of a hydrogel and is one of the most important
parameter which determines the potential efficiency of the hydrogel in biomedical
field.

Chapter 1
6
The swelling process in hydrogels is a complicated process consisting of three
main steps. In the first step, the most polar and hydrophilic groups are hydrated
resulting in the formation of primary bound water. In the second step, the
interaction of water molecules with the exposed hydrophobic groups leads to
formation of hydrophobically bound water or secondary bound water. Primary
and secondary bound water together form total bound water. The third step
involves the water uptake due to resistance of osmotic driving force of the
network towards infinite dilution by covalent or physical cross-links. The water
absorbed up to the equilibrium swelling level is called bulk water or free water;
which fills the space or voids between the networks.9 Major techniques used to
characterize water in the hydrogels are use of small molecular probes, Differential
Scanning Calorimetry (DSC), and Nuclear Magnetic Resonance (NMR)
spectroscopy.
1.4. Metal nanoparticle embedded hydrogels
Metal nanoparticles embedded hydrogels are those in which nanoparticles are
stabilized by the three dimensional polymeric network of the hydrogels. This
combination of metal nanoparticles with hydrogels provides superior functionality
to these materials, which can find applications in electronics, drug delivery,
biosensing, catalysis, nano-medicine and environmental remediation.10 The
nanoparticle embedded hydrogels have got synergistic enhancement in properties
of each component, like mechanical strength of the hydrogel and concomitantly,
decreased aggregation of the embedded nanoparticles. For example, silica

Chapter 1
7
nanoparticle loaded hydrogels made of modified polyethylene glycol exhibit
remarkable enhancement in tissue adhesion and mechanical strength than the
unloaded ones.10 Similarly poly N-isopropyl amide hydrogels with gold
nanoparticles showed significant changes in mechanical properties and thermal
response.11 The result of such a combination of nanoparticles and hydrogels is
that it leads to the development of advanced materials with unique properties
better than that of individual constituents.12
However properties such as mechanical toughness, swelling ratio, stimuli
responsiveness, and biocompatibility/biodegradability of such composites need to
be investigated and optimized for effective applications. Silver nanoparticles (Ag-
NPs) have been incorporated into polyacrylamide (PAAm),13 polyacrylic acid
(PAA),14 poly N-isopropyl acrylamide (PNIPAAm),15 polymethyl methacrylate
(PMMA),16 and polyvinyl alcohol (PVA) based hydrogels.17 Efforts in recent
years have been shifted to utilizing naturally occurring polymers such as
chitosan,18 gum acacia, dextran19 and gelatin20 to produce bio-
compatible/degradable composite materials that have potential applications as
implantable dressings. The controlled-release of AgNPs from the dressing
provides consistent protection for a good period of time, without frequent removal
of the dressings.
Different approaches used for synthesis of a hydrogel network with uniform
distribution of nanoparticles are:
1. Hydrogel formation in nanoparticle suspension.

Chapter 1
8
2. Gelation of hydrogel matrix followed by physical embedding of
nanoparticles.
3. Reactive nanoparticle formation within a preformed gel.
4. Nanoparticle assisted hydrogel formation.
1.4.1. Hydrogel formation in nanoparticle suspension
This is the simplest approach for making a nanoparticle-hydrogel composite. It
involves gelation of a hydrogel forming monomer solution with preformed
nanoparticles. A major drawback of this method is that the nanoparticles may
leach out of the hydrogel matrix if the crosslinking density is low.
1.4.2. Gelation of hydrogel matrix followed by physical embedding of
nanoparticles
Incorporation of nanoparticles physically into the gel is a kind of ‘breathing in’
mechanism which is repeated several times to obtain sufficient nanoparticle
density. The gel initially is made to ‘breathe out’ by expulsion of water by placing
in acetone. The shrunken gel is then equilibrated with a solution containing
preformed nanoparticles. This cause the gel to swell (breathing in) leading to
uptake of suspended nanoparticles as well. Finally, the gel is washed thoroughly
with water to remove any weakly adsorbed nanoparticles on the surface. In the
next breathing out cycle, the nanoparticles are bound to the gel matrix through
some physical entanglement or H-bonding interactions between the polymer
chains and capping on the nanoparticles. The increase in nanoparticles density
inside the hydrogel can be monitored after every cycle using techniques like X-

Chapter 1
9
ray Photoelectron Spectroscopy (XPS), and Atomic Absorption Spectroscopy
(AAS).
1.4.3. Reactive nanoparticle formation aided by hydrogel network
This approach was developed by Langer’s group, where nanoparticle precursors
are loaded into the gel rather than preformed nanoparticles.21 For example free-
radical crosslinking polymerization of acrylamide monomer in an aqueous
solution containing Ag+ ions yields Ag+ ions functionalized polyacrylamide
hydrogel matrix, which is reduced to yield AgNPs within the hydrogel network.
The resulting hydrogel contained un-aggregated nanoparticles throughout the
matrix. Ionizing radiations like gamma or electron beam induced formation of
nanoparticles in the hydrogel network also belongs to this category where in the
aqueous solution containing nanoparticle precursor and the crosslinking polymer
is irradiated. As mentioned before, radiolysis of water generates HO.
and H.
radicals that are mainly responsible for crosslinking/degradation of polymeric
solutes. The reducing radicals like H. and eaq
reduce the metal ions to
corresponding nanoparticles.
1.4.4. Nanoparticle assisted hydrogel formation
In this method, nanoparticles or groups present on the surface of nanoparticles
assist the crosslinking process to form hydrogels. For example, the semiconductor
nanoparticles-based hydrogels, where CdSe and CdTe function as inorganic

Chapter 1
10
initiators to form stable gels with N,N-dimethylacrylamide (DMAA) on
irradiation using visible light.22
1.5. Antibacterial activity of silver nanoparticles (AgNPs) loaded hydrogels
Among the inorganic antibacterial agents, silver has been employed most
extensively, since ancient times, to fight infections and control spoilage.23 The
antibacterial and antiviral actions of silver, silver ion, and silver compounds have
been thoroughly investigated.24-26 At very low concentrations, silver is nontoxic to
human cells. The epidemological history of silver has established its nontoxicity
in normal use. Catalytic oxidation by metallic silver and reaction with dissolved
monovalent silver ion probably contribute to its bactericidal effect.27 Microbes are
unlikely to develop resistance against silver, as they do against conventional and
narrow-target antibiotics, because the metal attacks a broad range of targets in the
organisms. Therefore, microbes have to develop a host of mutations
simultaneously to protect themselves. Hence, silver ions have been used as an
antibacterial ingredient in dental resin composites28, in synthetic zeolites29, and in
coatings of medical devices.30 A number of encouraging results about the
bactericidal activity of silver nanoparticles of either a simple or composite nature
have been reported.31, 32 Elechiguerra and coworkers33 found that silver
nanoparticles undergo a size-dependent interaction with human
immunodeficiency virus type 1, preferably via binding to gp120 glycoprotein
knobs. The same group also investigted the size-dependent interaction of AgNPs
with gram-negative bacteria.34 AgNPs loaded hydrogels gain importance when it

Chapter 1
11
comes to the necessity of sustained antimicrobial efficacy. AgNP-hydrogel
composites also provide functional coatings for various applications as shown in
the figure 1.1.
Figure 1.1: An overview of potential bio-medical applications of AgNP-hydrogel
composites.
1.6. Next generation of nanocomposite hydrogels
Even though nanocomposite hydrogels are being increasingly evaluated for
various biomedical applications, most of the existing nanocomposite approaches
lack control over some essential features such as stimuli responsiveness and
biodegradation. To address these challenges, alternate strategies have been
developed to design nanocomposite hydrogels with multiple functionalities.
Recent trends in designing advanced biomaterials aimed at designing stimuli-
responsive nanocomposites. These biomaterials show significant change in their
physical, chemical/biological properties with environmental stimuli. For example,

Chapter 1
12
(PNIPAAm) based nanoparticles/hydrogels were used to design therapeutics
device for tissue engineering and drug delivery applications. PNIPAAm exhibits a
negative swelling transition at 34 oC, which makes it an attractive system for
applications in drug delivery. Such polymeric systems were further decorated
with appropriate nanoparticles to develop stimuli responsive matrices. The type of
nanoparticles embedded within the hydrogel networks determines the type of
stimuli to which they respond. A range of stimuli responsive elements such as
mechanically adaptive, pH/enzyme/ion responsive, electrically stimulating,
thermo- and magnetic responsive can be incorporated within nano-composite
hydrogels. These types of responsive nano-composite hydrogels will direct the
development of next generation of nanocomposite hydrogels. In a recent effort,
Au nanoparticles were entrapped within interpenetrating polymer network of
thermally responsive polyacrylamide (PAAm)-poly(acrylic acid) (PAA) to design
therapeutic hydrogels.35 Au nanoparticles have the ability to absorb visible-to-
near infrared (530–1,200 nm) light and thus can be used to generate heat locally.
The local heating by the nanoparticles was used to trigger swelling/deswelling of
the polymeric network and can result in the release of entrapped macromolecules.
The covalently crosslinked PAAm-PAA interpenetrating polymer network can be
used to deliver therapeutics using external trigger for a range of biomedical and
drug delivery applications.
In future, it is expected that hybrid materials will merge with other types of
technologies such as micro-fabrication approaches to understand cell-

Chapter 1
13
nanomaterial interactions. Microscale technologies are emerging as one of the
powerful technologies to address some of the challenges in tissue engineering.
Additionally, future studies of nanocomposite hydrogels will also focus on
understanding the interactions between polymeric chains and nanoparticles at
different length scale. This will tailor the properties of the nanocomposite
hydrogels for required applications.36
1.7. Hydrogels for controlled drug delivery applications
The limitations associated with the conventional therapeutics have led to the need
of targeted controlled drug delivery (TCDD) vehicles with improved
biocompatibility and biodegradability. In recent years, the pharmaceutical
industry is involved in developing hydrogel based systems in various forms by
tuning the structure, shape and surface modifications of the biopolymers.
Hydrogels can be formulated in a variety of physical forms, including slabs,
microparticles, beads, nanoparticles, coatings, and films. Hence they find
application in various biomedical fields including tissue engineering, regenerative
medicine,37 diagnostics,38 cellular immobilization,39 separation of biomolecules or
cells,40 and barrier materials to regulate biological adhesions.41
The unique physical properties of hydrogels, like their highly porous nature, can
be easily tuned by controlling the crosslinking density of the matrix. This expands
its application in the region of interest. Also the high water content and the
physiochemical similarity of hydrogels with human tissues have sparked interest
in their use in drug delivery applications. The porosity permits loading of drugs

Chapter 1
14
into the gel matrix and subsequent drug release at a rate which is dependent on the
diffusion coefficient of the small molecules or the macromolecules through the
gel network. The pharmacokinetics of drug release from the hydrogel matrix
facilitates slow and sustained elution, maintaining a high local concentration of
drug in the surrounding tissues over an extended period, although they can also be
used for systemic delivery. Biocompatibility is promoted by the high water
content of hydrogels and the physiochemical similarity of hydrogels to the native
extracellular matrix, both compositionally (particularly in the case of
carbohydrate-based hydrogels) and mechanically. Hydrogels can be made
biodegradable via enzymatic, hydrolytic or environmental pathways. The muco-
or bioadhesive properties of some hydrogels are advantageous in immobilizing
them at particular sites even on surfaces which are not horizontal.42
Hydrogels, based on their response to external stimuli, can be classified as pH
sensitive, temperature sensitive; enzyme sensitive, electrical sensitive etc. pH
sensitive hydrogels can be neutral or ionic in nature. The anionic hydrogels
contain negatively charged moieties, cationic networks contain positively charged
moieties, and neutral networks either do not contain ionic moieties or contain both
positively and negatively charged moieties. In neutral hydrogels, the driving force
for swelling arises from the water-polymer thermodynamic mixing contributions,
and elastic-polymer contributions. In ionic hydrogels, the swelling is due to the
previous two contributions, as well as ionic interactions between charged polymer
and free ions. The presence of ionizable functional groups like carboxylic acid,

Chapter 1
15
sulfonic acid or amine groups, renders the polymer more hydrophilic, and results
in high water uptake.
In the case of anionic polymeric network containing carboxylic or sulphonic acid
groups, ionization takes place as the pH of the external swelling medium rises
above the pKa of the ionizable moiety. The dynamic swelling change of the
anionic hydrogels can be used in the design of intelligent controlled release
devices for site-specific drug delivery. The change in the pH of the external
environment will act as a stimulus, and the response to the stimulus is the change
in swelling properties of the hydrogels, causing the release of the drug.
The cationic hydrogels show swelling at pH values below pKa of the cationic
group. The amine groups are protonated at pH lower than pKa, and become
hydrophilic and absorb water. At pH greater than pKa, the polymeric hydrogel is
hydrophobic, and excludes water.43
1.7.1. Methods of hydrogel synthesis
Several techniques are known for the synthesis of hydrogels, out of which the
commonly used are:
1.7.1.1. Bulk polymerization
Bulk polymerization involves only monomer and monomer soluble initiators.
Because of high concentration of monomer, high rate of polymerization and
degree of polymerization occurs. The bulk polymerization of monomers to form
homogeneous hydrogels produces hard, glassy and transparent polymer matrix. It
becomes soft and flexible when immersed in water. Heat generated during bulk

Chapter 1
16
polymerization has to be avoided by controlling the reaction at low conversions.
The best example is preparation of poly(2-hydroxyethyl methacrylate)44
hydrogels from hydroxyethyl methacrylate, using ethylene glycol dimethacrylate
as crosslinking agent.
1.7.1.2. Suspension polymerization or inverse–suspension polymerization
In this method of dispersion polymerization, the products are obtained as powder
or microspheres. When water in oil (W/O) process is chosen instead of the more
common oil in water (O/W), the polymerization is referred as “inverse
suspension”. This technique involves dispersion of monomers and initiators as a
homogeneous mixture in the hydrocarbon phase. The viscosity of the monomer
solution, agitation speed, rotor design and the dispersant type governs the resin
particle size and shape. The dispersion is thermodynamically unstable and
requires both continuous agitation and hydrophilic-lipophilic balance (HLB)
suspending agent. Hydrogel microparticles of poly (vinyl alcohol) and poly
(hydroxyethyl methacrylate) have been prepared using this method.45
1.7.1.3. Solution polymerization
Here the ionic or neutral monomers are mixed with the multifunctional
crosslinking agent. The polymerization is initiated by UV-irradiation or by a
redox initiator system. In solution polymerization, solvent acts as a heat sink. The
prepared hydrogels has to be washed with distilled water to remove any unreacted
monomers, oligomers, crosslinking agents, the initiator and other impurities. After
formation of the heterogeneous hydrogel, phase separation occurs when the

Chapter 1
17
amount of water during polymerization is more than the water content
corresponding to the equilibrium swelling. Commonly used solvents are water,
ethanol, water-ethanol mixtures and benzyl alcohol. The solvent is finally
removed by swelling the hydrogels in water.
1.7.1.4. Polymerization by irradiation
Irradiation of aqueous polymer solution by high energy radiation like gamma and
electron beam, have been used to prepare the hydrogels the details of which is
given in section 1.1.46 Even sterile hydrogels can be produced by tuning the
required radiation dose for the crosslinking. Examples of polymers crosslinked by
radiation method include poly (vinyl alcohol),47 poly (ethylene glycol),48,49 poly
(acrylic acid).50 The major advantage of radiation induced technique over
chemical initiation is the production of relatively pure, residue-free hydrogels.
1.7.2. Classification of hydrogels
1.7.2.1. Chemically crosslinked hydrogels
Polymers containing functional groups like -OH, -COOH, -NH2 can be used to
prepare hydrogels by forming covalent linkages between the polymer chains and
functional group pairs such as amine-carboxylic acid, isocyanate- OH/NH2 or by
Schiff base formation. Glutaraldehyde can be used as a crosslinking agent to
prepare hydrogels of polymers containing -OH groups like poly (vinyl alcohol)
and polymers containing amine groups (albumin, gelatin, polysaccharides).
However crosslinking agents like glutaraldehyde is highly toxic, and hence

Chapter 1
18
unreacted agents have to be extracted before using material for biomedical
applications.
1.7.2.2. Physically crosslinked hydrogels
In physical gels, as mentioned before, the nature of crosslinking process is
physical. This is achieved through various physical processes such as
hydrophobic association, chain aggregation, crystallization and hydrogen
bonding. Poly vinyl alcohol (PVA) is a water soluble polymer, the aqueous
solution of which is stored at room temperature to form gel of low mechanical
strength. But once the aqueous solution of this polymer undergoes freeze-thawing
process, a strong and highly elastic gel is formed. This is due to formation of PVA
crystallites that act as physical crosslinking sites in the network. Crosslinking
between poly (methacrylic acid) and poly (ethylene glycol) through hydrogen
bond formation also leads to hydrogel formation. The hydrogen bond formation
takes place between the oxygen of poly (ethylene glycol) and carboxylic acid
group of poly (methacrylic acid).
1.7.2.3. Ionically crosslinked hydrogels
Most of the covalent crosslinking agents are known to be toxic, even in small
traces. Reversible ionic crosslinking can avoid the purification step post- hydrogel
synthesis. Chitosan, a polycationic polymer can react with negatively charged
components, either ions or molecules, forming a network through ionic bridges
between the polymeric chains. Among anionic molecules, phosphate bearing
groups, particularly sodium tripolyphosphate has been widely studied. Ionic

Chapter 1
19
crosslinking is a simple method compared to covalent crosslinking as no auxiliary
molecules are required. Chitosan is also known to form polyelectrolyte complex
with poly (acrylic acid) which undergoes slow erosion, thus making them more
biodegradable material than covalently crosslinked hydrogels.
1.7.3. Drug release mechanisms from hydrogel devices
Hydrogels can imbibe large quantities of water because of which, the release
mechanism is very much different from hydrophobic polymers. Based on the rate
limiting step for controlled release of an active agent from hydrogel matrix, the
models of drug release are classified as follows:
1.7.3.1. Diffusion controlled delivery systems
In case of macroporous hydrogels, with pore size much larger than the molecular
dimensions of the drug, the diffusion coefficient can be related to the porosity and
the tortuosity of the hydrogels.51 However, for non-porous hydrogels and for
porous gels with pore sizes comparable to the drug molecular size, the steric
hindrance provided by polymer chains within the crosslinked networks decrease
the drug diffusion coefficients.51, 52, 53 Due to the usually high permeabilities of
hydrogel networks and the advantages of in situ fabrication, most research efforts
are focused on understanding diffusion-controlled release of encapsulated drugs
from three-dimensional hydrogel matrices. Diffusion-controlled hydrogel delivery
systems can be either reservoir or matrix systems.54
(i) Reservoir system:

Chapter 1
20
In reservoir drug delivery system, a uniform polymeric membrane of hydrogel
with a drug-enriched core (often termed as reservoir) is present and the membrane
allows the diffusion of drug through it (Figure 1.2).46, 47 As the system comes in
contact with water, water diffuses into the system and dissolves the drug and
provides a concentration equivalent to the saturation solubility of the drug (Cs).
The drug diffuses through the membrane to the external environment and the
concentration falls below Cs. The solid drug present in the core dissolves and
restores the concentration back to Cs. This maintains a constant rate of release of
drug from the core and follows zero order kinetics as long as the solid drug is
present in the core. Once the solid drug is exhausted, the release becomes
concentration dependent following first order kinetics. These kinds of drug
delivery systems are mainly used to deliver the active agents by oral, ocular,
uterine, or transdermal routes.
Figure 1.2: Drug delivery from a typical reservoir device
(ii) Matrix system:
Here the hydrogel acts as the matrix in which the active agent is homogeneously
dispersed (Figure 1.3) and the properties of the matrix determines the release of

Chapter 1
21
the drug. When the matrix is in contact with an aqueous medium, the system gets
hydrated initially as water starts diffusing into the matrix. This hydration process
starts at the surface and continues towards the center of the core. The release of
drug is dependent on the diffusion of water into the matrix followed by the
dissolution of the drug and finally the diffusion of the dissolved drug from the
matrix. Initially inert polymer matrices were used to prepare such delivery
systems but of late, bio-degradable polymers have also been used to design such
delivery systems.
Figure 1.3: Drug delivery from a typical matrix drug delivery system
For a reservoir system where the drug depot is surrounded by a polymeric
hydrogel membrane, Fick's first law of diffusion can be used to describe drug
release through the membrane (equation 1.3):
JA = D (1.3)dCA
dx
Here, JA is the flux of the drug, D is the drug diffusion coefficient, and CA is drug
concentration.

Chapter 1
22
For a matrix system where the drug is uniformly dispersed throughout the matrix,
unsteady-state drug diffusion in a one-dimensional slab-shaped matrix can be
described using Fick's second law of diffusion (equation 1.4):
Here, the drug diffusion coefficient is again assumed as a constant.
When diffusivity is concentration dependent the equation 1.5 is used:
dCA
dt=
d
dxD (CA)
dCA
dx(1.5)
Another empirical equation developed by Peppas et al. assumes a time-dependent
power law function (equation 1.6).57,58
M
Mt= Ktn (1.6)
Here, K is a structural/geometric constant for a particular system and n is
designated as release exponent representing the release mechanism. Table 1.1 lists
the n values for delivery matrices with different geometries and release
mechanisms.58 It is noteworthy that in a purely swelling-controlled slab-based
delivery system, the fractional drug release (Mt/M∞) appears to be zero-order as
the release exponent equals unity. The power law is easy to use and can be
applied to most diffusion-controlled release systems. In diffusion-controlled
systems where n = 0.5, the power law is only valid for the first 60% of the release
profile.

Chapter 1
23
Matrix
geometry
Diffusion-controlled
delivery system (Case I)
Swelling controlled delivery
system (Case II)
Slab n = 0.50 n = 1.00
Cylinder n = 0.45 n = 0.89
Sphere n = 0.43 n = 0.85
Table 1.1: Release exponent values (n) in the empirical power law model
These empirical models can only predict the release profile after certain release
experiments are conducted and have limited capability to predict how the release
profiles will change as the chemical or network properties of the system are
varied.
1.7.3.2. Swelling controlled delivery systems
Swelling controlled drug delivery devices, in a broader sense, are those in which
swelling is the most important release rate controlling step but other mass
transport processes also play a major role (eg: drug dissolution, drug diffusion and
polymer dissolution). Swelling controlled delivery systems consists of hydrophilic
polymeric networks. Hydrogels may undergo a swelling-driven phase transition
from a glassy state where entrapped molecules remain immobile to a rubbery state
where molecules rapidly diffuse. In these systems, the rate of molecular release
depends on the rate of gel swelling. One example of swelling-controlled drug
delivery systems is hydroxypropyl methylcellulose (HPMC).
After oral administration, HPMC polymer absorbs liquid and a rapid glassy-to-
rubbery phase transition occurs once the glass transition temperature (Tg) is
reached, causing the systematic release of loaded drugs. The drug release rates are

Chapter 1
24
modulated by the rate of water transport and the thickness of the gel layer. Drug
diffusion time and polymer chain relaxation time are the two key parameters that
determine drug delivery from polymeric matrices. In swelling-controlled delivery
systems the time-scale for polymer relaxation (λ) is the rate-limiting step. The
Deborah number (De) is used to compare these two time-scales (equation 1.7)
De =
t=
D
t2(1.7)
In diffusion-controlled delivery systems (De ≪ 1), Fickian diffusion dominates
the drug release process and diffusion equations described in the previous section
can be used to predict molecule release. In swelling-controlled delivery systems
(De ≫ 1), the rate of molecule release depends on the swelling rate of polymer
networks.
1.7.3.3. Chemically controlled delivery systems
Chemically controlled release systems can be classified into two (i) purely
kinetic-controlled release systems where polymer degradation (bond-cleavage) is
the rate-determining step and diffusion term is assumed to be negligible; and (ii)
reaction-diffusion-controlled release in which both reaction (e.g. polymer
degradation, protein–drug interaction) and diffusion terms must be included in the
model to accurately predict drug release.
(i) Kinetic-controlled release
There are two types of kinetic-controlled-release systems: (a) pendant chain
(prodrugs) and (b) surface-eroding systems.
(a) Pendant chain (prodrugs)

Chapter 1
25
Pendant chain systems are those in which the drugs are covalently linked to the
hydrogel network and the rate of cleavage of spacer controls the rate of drug
release. So drug diffusion is not the rate determining factor in such systems.
Prodrugs or polymer-drug conjugates enhance the therapeutic efficacy of the drug
and are useful for delivering substrates which are susceptible to proteolytic
degradation like growth factors, peptide based drugs, etc. Generally, the release of
covalently tethered prodrugs is determined by the degradation rate of the
polymer–drug linkage. These systems are designed in such a way that the
degradation of covalently linked prodrugs follows simple first order kinetics.
(b) Surface-eroding systems
Surface erosion is a phenomenon which occurs when the rate of water transport
into the polymer is much slower than the rate of bond hydrolysis. But due to the
high water content of hydrogels, this is not observed. Surface erosion is only seen
in enzymatic-degrading systems where the transport of enzyme into the gel is
slower than the rate of enzymatic degradation. Surface erosion of enzymatically
degradable poly(ethylene glycol)-polycaprolactone block copolymer (PCL-b-
PEG-b-PCL) hydrogels has been observed in vitro by Rice et al. when exposed to
relatively high concentrations of lipase.62
Most of the models focusing on surface-eroding polymers are based on
hydrolytic-degrading polymers. These relationships, however, can also be applied
to enzymatically degradable, surface-eroding hydrogel systems. Surface-eroding
matrices are advantageous for drug delivery applications as the structural integrity

Chapter 1
26
of the carrier device is maintained during delivery and zero-order release of the
encapsulated molecules can be readily obtained by appropriate choice of device
geometry.
(ii) Reaction-diffusion-controlled release (bulk degrading systems)
With the development of more complicated drug delivery systems, mechanisms
like diffusion, swelling or degradation alone was not sufficient enough to explain
the drug release. For instance coupling of reaction and diffusion phenomena can
be seen in bulk degrading networks where drug release profiles are governed by
both network degradation and molecule diffusion.
1.8. Design and synthesis of glycopolymers: Multivalent recognition with
lectins
Carbohydrates are involved in a myriad of biological events including cellular
recognition, inflammation, signal transmission so on and so forth.61-66 Even
though there exist naturally occurring polysaccharides (figure 1.4), there is lot of
interest in synthesizing and studying synthetic sugar containing polymers. Homo-
or co-polymerisation of unsaturated carbohydrate derivatives yields synthetic
polysaccharides with a chemically and biologically stable C-C backbone and
pendent hydrophilic carbohydrate residues so-called 'glycopolymers'. This
definition includes macromolecules presenting diverse architectures, comb
polymers, dendrimers and cross-linking hydrogels. The first glycopolymer was
synthesized in 1978 via free radical polymerization of acrylamide and allyl

Chapter 1
27
glycosides of various sugars 7 (Figure 1.5) in water, using ammonium persulfate
as initiator and tetramethylethylenediamine (TMEDA) as catalyst.
Figure 1.4: Structures of natural polysaccharides. (1) starch; (2) chitin; (3)
cellulose; (4) heparin; (5) hyaluronan; (6) chondroitin sulfate.
Advances in synthetic chemistry have accelerated the preparation of well defined
and multi-functional glycopolymers in a relatively facile manner.67
Figure 1.5: Allyl glucosides derived from various monosaccharides (7).

Chapter 1
28
It is important to control the chain length, composition and topology of the
glycopolymer since these factors determine the location/distance between the
carbohydrates on the polymer chain.68,69 Importantly, precise recognition
properties can be achieved by an absolute control over the microstructure of the
glycopolymer. The area of synthetic glycopolymers became popular in 1990s with
the increasing interest in biomimics, and most of the attempts were based on the
polymerization of monomers containing carbohydrate moieties.70-74 In 1990,
Kitazawa et al. reported an elegant method to obtain novel acrylic monomers
containing a pendent monosaccharide 8–11 (Figure 1.6), by glycosidation of
methyl glycosides with 2-hydroxyethyl acrylate or methacrylate in the presence of
a heteropolyacid catalyst.
Figure 1.6: Methacrylate and Ethyl acrylate of glucopyranosyloxy (8),
galactopyranosyloxy (9), mannopyranosyloxy (10), xylopyranosyloxy (11)
In 1992, Roy and coworkers reported a new method for synthesizing acrylamide
monomers containing sugar residues. The glycosyl bromide and p-nitrophenol
were reacted under phase transfer catalysis conditions, which gave 4-nitrophenyl-
β-glycoside with total anomeric stereocontrol. This nitrophenyl derivative was
then easily transformed into acrylamide-based monomer by reaction with

Chapter 1
29
appropriate amine. Using this method, 4-acrylamidophenyl β-lactoside 12 was
successfully synthesized (Figure 1.7).75
Figure 1.7: 4-acrylamidophenyl -lactoside (12)
Polymerisation and co-polymerisation with various comonomers were easily
carried out under free radical polymerisation conditions. Different techniques like
free radical, controlled radical, anionic, cationic, ring opening and ring opening
metathesis polymerization were utilized for polymerizing these glycomonomers
(sugar carrying monomers).72,76,77 Until last decade, very limited attempts were
carried out to react a functional polymeric backbone with a carbohydrate moiety
to obtain a glycopolymer. This was because of the difficulty in introducing
sufficiently reactive pendant groups onto the polymer backbone to react with
carbohydrates. Modification of poly (vinylalcohol) with 4-nitrophenyl carbonate
groups was the first successful attempt to form synthetic glycopolymers (Figure
1.8).78 The reactive nitrophenyl carbonate groups were transformed with D-
glucosamine to form glycopolymers, which were subsequently investigated for
their interaction with a commonly used lectin, Concanavalin A (Con A).79

Chapter 1
30
Figure 1.8: Coupling of D-glucosamine to polyvinyl alcohol functionalized with
4-nitrophenyl carbonate groups.
Carbohydrates can form a glycocode which can convey bulk of information. In
peptides and oligonucleotides, the number of amino acids present and their
sequences decide the information carried by them, whereas in carbohydrates,
information is also encoded in the position and configuration (α or β) of the
glycosidic units and in the occurrence of branch points. Therefore, it is calculated
that four different monosaccharides can form 35,560 tetrasaccharides whereas
four amino acids or nucleotides can form only 24 tetramers! Carbohydrates also
become more diverse by functionalization of the hydroxyl groups. Thus, in
theory, an enormous number of oligosaccharides can be derived from a relatively
small number of monosaccharides. Concurrently due to their potential for coding
biological information, carbohydrates were found on the surface of nearly every
cell in the form of polysaccharides, glycoproteins, glycolipids or other
glycoconjugates.78
As mentioned before, carbohydrates play a major role in many recognition events.
Recognition is important for initializing variety of biological processes and the

Chapter 1
31
first step in numerous phenomena based on cell–cell interactions, such as
fertilization, embryogenesis, cell migration, organ formation, immune defense,
microbial and viral infection, inflammation, and cancer metastasis.80,81 These
recognition processes are thought to proceed by specific carbohydrate–protein
interactions. The proteins involved in such processes are most frequently found on
cell surfaces and are generically named lectins. They have the ability to bind
specifically and non-covalently to carbohydrates.82 The mechanism involved in
the carbohydrate–lectin interaction and the structures of the glycopolymers
leading to these recognition processes is still largely unknown. Consequently,
synthetic complex carbohydrates and carbohydrate-based polymers, which are
“glycomimics”, are emerging as an important tool for investigating
glycopolymer–protein interactions.83,84
1.9. Lectin–carbohydrate interaction, “the cluster glycoside effect”
Lectins (latin: legere (to select)) are sugar-binding proteins that bind with
carbohydrates reversibly but with high specificity. This class of proteins can be
found in all biological systems and they play a pivotal role in many biological
events such as cell adhesion. The reaction between lectins and carbohydrates form
the basis of cell agglutination such as hemagglutination.85,86 Cell recognition
follows the concept of lock-and-key type of mechanism, as first mentioned by
Emil Fisher in1897. More recently, Ambrosi et al. have described lectins as tools
for the molecular understanding of the glycocode.

Chapter 1
32
Hundreds of lectins have now been identified and isolated from plants, animals
and microorganisms. All these lectins have certain biological properties in
common such as the binding to carbohydrates, their diversity in terms of structure
and size. Many of them can be grouped into families depending on their function
or certain functional parameters. Lectins can be classified as follows based on
their origin:
1.9.1. Plant lectins
1.9.1.1. Legumes87
The largest family among the simple lectins is the legume family with more than
70 lectins being isolated and many of them have been structurally characterized.88
Main source of these lectins have been from seeds of plants belonging to the
Fabaceae family. Molecular weights of legumes are usually below 40 kD and
their interactions with carbohydrates often require the presence of Ca2+ and Mn2+
ions. They usually consist of 2 or 4 subunits with typically one binding site per
subunit. The main representatives of the legume family are:
(a) Concanavalin A (Con A), lectin extracted from jack beans, is the most
widely abundant lectin within the legume family. The abundance is due to
the ease of isolation and their interactions with wide range of saccharides
has led to many in-depth studies of this member of the legume family.86,89
Con A has a strong affinity to mannose, but binds to glucose as well.
(b) Peanut agglutinin (PNA, Arachis hypogaea), legume which binds
specifically to galactose, preferably to galactosyl (β-1,3) N-

Chapter 1
33
acetylgalactosamine. PNA does not require any divalent cations for
binding, but binding is enhanced in the presence of Ca2+ ions.
1.9.1.2. Cereal lectins
Cereal lectins consist of two subunits with usually 2 binding sites per subunit. The
presence of ions such as Ca2+ is not required. Cereal lectins are known to be rich
in disulfide bonds. Wheat germ agglutinin (WGA) consists of two identical
subunits whilst being rich in cysteine.90
Even though function of plant lectins is unknown, but it has been suggested that
they act as defense system for the plant.
1.9.2. Animal lectins
Animal lectins were originally divided into C-type lectins (need Ca2+-ions) and S-
type lectins (sulfydryl-dependent). Later more and more groups were identified
and the list now includes: C-type, S-type (galectins), I-type (siglecs and others),
P-type (phosphomannosyl receptors) etc. and some single lectins that cannot yet
be assigned to any of these groups.91 Only C-Type and S-Type (Galectins) are
discussed here:
1.9.2.1. C-Type
C-Type lectins are dependent on Ca2+ ions for their reactions with carbohydrates.
They can have complex structures consisting of a carbohydrate recognition
domain (CRD) of around 120 amino acids. C-Type lectins therefore, can have a
variable number of subunits with 1–8 binding sites per subunit.

Chapter 1
34
A C-type lectin is the endocytic lectin, which is more frequently described as the
hepatic asialoglycoprotein (hepatic lectin), a lectin specific for galactose/N-
acetylgalactosamine.85,92 In depth studies have been carried out using copolymers
with galactose moieties for the interactions with hepatic lectins and results
suggested that high sugar concentrations facilitated binding.93,94
1.9.2.2. S-Type (Galectins)
S-type lectins which are now called Galectins,95 are involved in a range of
activities like from inflammation response to a suggested role in cancer. A
common trait in galectins is the affinity for β-galactosides, preferably as lactose
and N-acetyl lactosamine, and a significant sequence similarity in the
carbohydrate-binding site.
Functions of animal lectins 91
Animal lectins play a pivotal role in a variety of functions including:
Self/non-self recognition
Intracellular routing of glycoconjugates
Molecular chaperones during glycoprotein synthesis
Mediation of endocytosis
Cellular growth regulation
Extracellular molecular bridging
Cell –cell interactions for homing and trafficking
Scavenging of cellular debris; anti-inflammatory action
Urate transport

Chapter 1
35
Immune regulation (suppression or enhancement)
Most saccharides bind to the protein receptors with high specificity but weakly,
which is not sufficient enough to control the in-vivo events mediated by protein–
carbohydrate binding. Hence, multiple interactions between carbohydrates and
lectins are necessary to achieve strong binding. In nature, carbohydrate–binding
proteins are typically aggregated into higher-order oligomeric structures, which
suggest that binding limitations can be circumvented by introducing multivalency.
Also, most of the multimeric carbohydrates (glycopolymers) which have been
synthesized show some enhancement in the activity compared to the
corresponding monovalent ligand on a valence-corrected basis. This enhancement
is known as the “cluster glycoside effect”.84 The mechanism by which multivalent
ligands interact is still not clear, but it is known that the cluster glycoside effect
relies on aggregation.
1.9.3. Lectin Binding assays
Carbohydrate-lectin binding assays can be conducted through a wide variety of
methods, ranging from the earliest hemagglutination inhibition assay (HIA),
evaluated by Landsteiner, to the sophisticated surface plasmon resonance (SPR),
which uses materials absorbed onto metal.96,97 The basic principle behind lectin
binding assays is the formation of isolated complexes between lectins and their
ligands.98
HIA is one of the earliest assay methods used for studying the interactions
between viruses/viral antigens and their corresponding ligands. Ligand solutions

Chapter 1
36
are initially placed at different concentrations into the microwells, followed by the
addition of soluble lectin to allow precipitation of aggregates. After complete
precipitation, the minimum concentration of carbohydrate that inhibits the
hemagglutination reaction is reported. In order to determine physical parameters,
like carbohydrate-lectin binding constants isothermal titration microcalorimetry
(ITC) is used, which involves quantification of the heat generated (enthalpy) from
the binding.99 Surface Plasmon Resonance (SPR) is another technique which
utilizes the flow of lectin solution over a gold surfaced chip with immobilized
ligands resulting in a change in the refractive index at the surface. The binding
constant is calculated from the removal of the bound lectin during the flow of
buffer solution.96 Turbidimetric assays carried out using UV-vis spectroscopy is
now more frequently used as a method in determining the successful binding of
glycopolymers with lectins.100 Two-dimensional immunodiffusion tests (double
diffusion agar, DDA) is also a technique for identifying specific binding between
carbohydrates and lectins.72 There are other complementary techniques, such as
using a quartz crystal microbalance (QCM), measuring the weight of the attached
lectin, and electrophoresis which determines the molecular size of proteins
adhered. The binding assay solution should also be chosen with care. Narain and
Xu found that in their system, the use of a certain concentration of Ca2+ and Mn2+
salts with the same anion (Cl) greatly enhanced the aggregation upon interaction
of glycopolymer with proteins.101, 102

Chapter 1
37
The quantification of binding constant can be done by fluorescence spectroscopy
using Scatchard equation (1.8).103
[S]
F=
Fmax
1
[S]+
Fmax
1
Ka
(1.8)
Where [S] is the glycopolymer concentration, ΔF the fluorescence intensity, and
Ka the association constant. ΔFmax is the maximum fluorescence intensity.
1.10. Aggregation induced emission
Aggregation of luminophores will lead to two competing effects of
photoluminescence (PL): aggregation-caused quenching (ACQ) and aggregation-
induced emission (AIE). The ACQ or AIE effect exhibited by luminogens
depends on the molecular structure as well as the intermolecular packing. When
aggregation reduces luminescence the effect is called ACQ, which is a major
obstacle reducing the applicability of most of the luminescent materials. On the
other hand if aggregation enhances fluorescence it is AIE. In ACQ phenomena,
addition of a poor solvent in to the solution of the luminescent molecule makes it
less emissive. Whereas in AIE addition of a poor solvent makes the system more
emissive.
ACQ is an effect common to most aromatic hydrocarbons and their derivatives
The structural reason for this is that, conventional luminophores are made up of
planar aromatic rings (e.g., perylene, figure 1.9), since electronic conjugation and
π-π stacking is an important structural strategy to be fulfilled for luminescence.

Chapter 1
38
But at higher concentrations the chances of formation of excimers or exciplexes
are more leading to quenching.104
Figure 1.9: Structure of perylene
Hexaphenyl silole (HPS) was the first AIE molecule to be investigated. In the
aggregates, the HPS molecules cannot pack through a π–π stacking process due to
its propeller shape, while the intramolecular rotations of its aryl rotors are greatly
restricted owing to the physical constraint. This restriction of intramolecular
rotations (RIR) blocks the non-radiative pathway and opens up the radiative
channel. As a result, the HPS molecules become emissive in the aggregated state
(Figure 1.10).
Figure 1.10: Propeller type structure of HPS
Different classes of luminogens which show AIE effect are:

Chapter 1
39
1. Hydrocarbon luminogens
2. Heteroatom containing luminogens
3. Luminogens with cyanosubstituents
4. luminogens with hydrogen bonds
5. Polymeric luminogens
6. Organometallic luminogens
The mechanisms by which the above mentioned materials exhibit luminescence
are given below:
1.10.1. Planarity and rotatability
The intramolecular rotations of aromatic rotors in an AIE luminogen are faster in
solution state and it serves as a relaxation channel for its excitons to decay non
radiatively. Whereas in the aggregated state, the intramolecular rotations are
restricted due to physical constraint and this blocks the non-radiative pathway and
opens the radiative channel.105
1.10.2. Intramolecular restrictions
One can tune the emission performance of a molecule by modulating its
conformational stability. A covalent linkage can lock or stabilize molecular
conformation, hinder intra-molecular rotation and thus enhance the emission
intensity. For example, in case of biphenyl based luminogens (Figure 1.11) the
methylene bridge makes the conformation more planar and restricts the
intramolecular rotations.

Chapter 1
40
Figure 1.11: RIR effect on luminescence behaviours of biphenyl-based
luminogens.
Like the covalent chemical bonds, non-covalent physical interactions such as
charge-transfer complexation can also trigger molecular RIR processes.103
1.10.3. Intermolecular interactions
Conformation of a molecule can also be influenced by intramolecular forces. The
molecular conformations can be affected by changes in the surrounding
environments like increasing viscosity; decreasing temperature and elevating
pressure. These variations may lead to enhancement in the photoluminescence
intensity. Luminescence behaviors can be influenced by rigidification of structure
by intermolecular processes. For eg: the phenyl ring in tetra phenyl ethylene
(TPE) is twisted out of the central ethane plane by ~50o (Figure 1.12).

Chapter 1
41
Figure 1.12: Structure of AIE active TPE molecule
In crystalline state, the propeller shape of TPE molecule prevents π-π stacking and
excimer formation. The multiple C-H….π hydrogen bonds formed between the
phenyl rings of one TPE molecule with phenyl rings of other adjacent TPE
molecule, stiffen the conformation and enhance their light emission. Many such
molecules are known to show enhanced emission by such intermolecular
interactions.
1.11. Technological applications
Wherever a RIR phenomenon is involved, AIE effect can be utilized. Various
applications of AIE based luminogens are:
1. Electroluminescence: AIE luminogens covering the whole range of visible
light spectra have been designed and prepared. The performance of
conventional OLEDs (Organic Light Emitting Diodes) based on flat
luminogens are unsatisfactory because of ACQ problem. Therefore AIE
materials which are emissive in aggregated state are promising materials
for manufacture of highly efficient OLEDs.
2. Fluorescence sensors: Conventional fluorescent sensors are fluorescence
turn off type, i.e. the emission of these molecules is quenched when they
form aggregates with some chemical species or biological analytes.

Chapter 1
42
Whereas AIE effect facilitates the development of sensing systems which
work on fluorescence turn on phenomena. These sensors are more
effective than turn off type because of high sensitivity and are less likely
to develop positive false signals. AIE luminogens have been designed for
sensing explosives, pollutants like Hg2+, CN etc., and also for studying
various sugar - lectin interactions.
3. Cell imaging: Most of the luminophores especially ionic luminophores,
which are used for cellular imaging face a major problem of
photobleaching at low concentration and perturbation of membrane
potential as well as cellular physiology at higher concentration. During
cell division process, the cellular dyes may diffuse into the extracellular
media leading to a concentration gradient which leads to decrease in
emission of the stained cells
AIE luminogens can overcome many of these problems as they can be used in
higher concentrations in cell imaging processes and the nanoaggregates formed
cannot escape from the cellular compartment. Also they remain internalized for a
long period of time so that we can monitor the processes like growth of a specific
cell line.


Chapter 2
43
CHAPTER 2
EXPERIMENTAL AND TECHNIQUES


Chapter 2
44
2.1. Introduction
Silver nanoparticles loaded hydrogels, glycopolymeric hydrogels, drug loaded
polysaccharide glycopolymer composite beads and self assembled fluorescent
nanoparticles have been synthesized for various biomedical applications like
wound dressings, drug delivery, cell imaging etc. This chapter deals with the
methodologies used for synthesis of these material and different techniques used
for their characterization as well as studying their applications in biomedical field.
2.2. Materials
Silver nitrate (Merck), gum acacia (S D Fine Chemicals), polyvinyl alcohol
(Molecular weight approximately 125,000, S D Fine Chemicals), were of
analytical grade, and were used, without further purification. LB agar, used for
antibacterial studies, was obtained from Hi Media Laboratories. Methanol,
dichloromethane, pyridine, triethylamine, were purified and dried before use for
the synthesis of glycoacrylamides. The n-hexane used was the fraction distilling
between 40–60 ºC. All the other chemicals including acryloyl chloride, Chitosan
(CS) (Molecular weight ~ 1,25,000 Da and 85% deacetylation), succinic
anhydride (SA) and doxorubicin hydrochloride (DOX) were procured from either
Sigma-Aldrich or Fluka. MTT (3-(4,5-dimethyl thiazol-2-yl)-2,5-diphenyl
tetrazolium bromide), Staurosporine, lyophilized powders of Concanavalin A
(Con A) from Canavalia ensiformis, Peanut Agglutinin (PNA) from Arachis
hypogaea, FITC conjugates of both Concanavlin A (FITC-Con A) as well as
Peanut agglutinin (FITC-PNA) and Bovine Serum Albumin (BSA) were

Chapter 2
45
purchased from Sigma-Aldrich and were used directly. 0.01 M phosphate-buffer
saline (PBS) at pH 7.4 was prepared by diluting 10 X concentrated PBS
purchased from sigma into distilled water with 150 mM NaCl, 1 mM NaN3, 1 mM
CaCl2 and 1 mM MnCl2. DMEM cell culture medium, penicillin and streptomycin
were purchased from Hi Media, Mumbai, India. Fetal Bovine Serum (FBS) was
procured from Invitrogen BioServices India Pvt. Ltd. irradiation was carried
out in 1 cm diameter closed glass vials under nitrogen atmosphere, using an
indigenous Cobalt-60 -irradiator (dose rate 0.75 kGy/h). Water, with
conductivity 0.6 µS cm−1 or lower, obtained from Millipore Milli-Q system, was
used for the preparation of aqueous solutions, and was purged with nitrogen,
wherever required. Glassware’s were cleaned, using chromic acid, followed by
rinsing with distilled water, and then, with water, purified by Millipore Milli-Q
water purification system and dried in an oven at 110 oC.
2.3. Synthetic strategies for hydrogels and polymeric beads
2.3.1. Synthesis of hydrogels by γ-radiation induced technique
Many methods are known for the synthesis of hydrogels out of which the greener
and cleaner technique is the radiation induced one. Even some of the degrading
type of polymers which cannot crosslink upon irradiation, can be utilized for
making hydrogels by irradiating along with crosslinking type polymers. The
crosslinking density can be controlled by varying the radiation dose and relative
concentration of the two types of polymers. This strategy was utilized for the
synthesis of PVA/gum acacia hydrogels wherein AgNPs were also generated in

Chapter 2
46
situ by the reducing radicals formed during γ-radiolysis. This technique helps in
synthesizing sterile nanoparticles - loaded hydrogels in a single step. Purely
synthetic hydrogels were also synthesized by γ-radiation induced method. This
method was also employed for production of biocompatible glucose based sterile
hydrogels from the synthesized non-cytotoxic mono- and bisacrylamide
derivatives. The details of the procedures and experimental parameters will be
discussed in chapter 3 and 4. The synthesized hydrogels were characterized by
different techniques, as discussed in the subsequent sections.
2.3.2. Synthesis of glycopolymer stabilized N-succinyl chitosan beads
The N-succinyl chitosan beads were synthesized by ionic crossslinking method.
But these beads are not stable at high ionic strength of body fluids which makes
them unsuitable for controlled drug delivery purposes. Hence the synthesized
beads were stabilized by glycopolymer, which forms an interpenetrating network
in the bead thereby stabilizing it. The succinyl units in the beads facilitate the
loading of the cationic drug doxorubicin and also pH dependent delivery of the
drug. The appropriate swelling kinetics of the hydrogel network in the beads also
helps in slow and sustained delivery of the drug. The experimental parameters
will be discussed in detail in the respective chapters.
2.3.3. Synthesis of self assembled fluorescent glycoacrylamide nanoparticles
Glycoacrylamides, both mono and bisacrylamide were synthesized, in a high
yielding reaction sequence starting with D-glucose. The synthesis was designed in
such a way that these molecules become emissive upon aggregation in aqueous

Chapter 2
47
media. The extensive hydrogen bonding of the hydrophilic sugar units makes the
hydrophobic acrylamide side chain to align in a position with restricted motion,
leading to π –π stacking. The stacking of the π electrons makes them emissive and
thus exhibit Aggregation Induced Emission (AIE) phenomenon. The
characterization of the size of the self assembled particles, pH dependency,
emission characteristics etc. is described in detail in chapter 6.
2.4. Analytical Methods
2.4.1. Scanning electron microscopy (SEM)
SEM technique unlike optical microscopy provides insight into the surface
morphology, particle size, magnetic domains and surface defects of materials.
SEM can achieve higher magnifications as it uses a focused electron beam to scan
the surface. In a typical SEM, a source of electrons is focused into a beam of a
very fine spot size of ~5 nm having energy ranging from a few hundred eV to 50
keV, to examine a very small area of an object.
Accelerated electrons originating from a filament in an electron gun are focused
to the specimen in a vaccum chamber. These accelerated electrons interacts with
samples and generate signals which includes secondary electrons, back scattered
electrons (BSE), differential back scattered electrons, characteristic X-rays,
visible light and heat. Secondary electrons (SE), with energies between 0 and 50
eV, are easy to collect, and can be used over a wide range of incident beam
energies. The secondary electrons (SE) are ejected from the specimen, and have
energies lower than that of primary electrons. SEs are created near the surface,

Chapter 2
48
and give idea about the morphology and topography of the sample. BSEs are
generated when the primary electrons interact with the nucleus of a sample atom,
and get scattered in any direction with little loss of energy. These BSEs are more
energetic than SEs and therefore can emerge out from a greater depth within the
sample. Hence unlike SEs, the BSEs will neither carry much information about
sample topography nor will it be highly resolved in space. The contrast in the
BSE image depends on atomic number as well as magnetic and crystallographic
nature of the sample. BSEs illustrate contrast in composition of multiphase
samples.
Figure 2.1: Various components of a typical SEM

Chapter 2
49
Recording SEM images of the organic or non conductive samples, faces a major
problem of destruction of sample due to build-up of charges, or the strong electric
currents produced by the electron beam. Hence, such samples should be coated
with a thin layer of conductive material, before recording the image. Depending
on the type of interactions, the emitted rays are detected by a silicon-lithium (Si
(Li)) detector. Each signal is collected, amplified and corrected for absorption and
other effects to give an image. The schematic of a typical SEM is shown in figure
2.1. The porosity and the crosslinking density of the hydrogels as well as hydrogel
beads were studied using MECK-FEI Model NOVA Nanosem 450 scanning
electron microscope.
2.4.2. Transmission electron microscope (TEM)
TEM is a technique which operates on the same basic principles as that of a light
microscope, but uses electrons instead of light. The lower wavelength of electrons
compared to that of light, results in better resolution of the TEM image compared
to a light microscope image. TEM uses electromagnetic lenses rather than glass
lenses to focus the electrons into a very thin beam. The electron beam then travels
through the specimen, depending on the density of the material, out of which
some are scattered and disappears from the beam.
At the bottom of the microscope the unscattered electrons hit a fluorescent screen,
which gives rise to a "shadow image" of the specimen with its different parts
displayed in varied darkness according to their density. The image can be studied
directly by the operator or photographed with a camera. The structures of the self

Chapter 2
50
assembled particles were studied using Zeiss-Carl (Libra-120) transmission
electron microscope at an accelerating voltage of 120 kV. The schematic of a
typical TEM is shown in figure 2.2.
Figure 2.2: Schematic diagram of TEM.
2.4.3. Confocal fluorescence microscopy
Confocal fluorescence microscopy is a microscopic technique that provides true
three-dimensional (3D) optical resolution. In microscopy, 3D resolution is
generally realized by designing the instrument so that it is primarily sensitive to a
specimen’s response coming from an in-focus plane, or by subsequently removing
the contributions from out-of-focus planes. Several techniques have been
developed to achieve this. True 3D resolution is accomplished by actively

Chapter 2
51
suppressing any signal coming from out-of-focus planes. This is achieved by
using a pinhole in front of the detector as schematically depicted in figure 2.3.
Figure 2.3: Picture depicting the principle of confocal fluorescence microscopy.
Light coming from out-of-focus planes is largely blocked by a pinhole in front of
the detector.
Light originating from an in-focus plane is imaged by the microscope objective
such that it freely passes the pinhole, whereas light coming from out-of-focus
planes is largely blocked by the pinhole. In a confocal fluorescence microscope
(Figure 2.4), the specimen is generally illuminated by a laser. The light coming
from the laser passes through an (excitation) pinhole, is reflected by a dichroic
mirror, and focused by a microscope objective to a small spot in the specimen. A
fraction of the fluorescence emitted by the fluorophores in the specimen is
collected by the microscope objective and imaged onto the detection pinhole in

Chapter 2
52
front of a photo-detector. The dichroic mirror reflects light of a shorter
wavelength while transmitting that of a longer wavelength. Specific dichroic
mirrors can be made for the relevant wavelength regions of excitation and
fluorescence. By having a confocal pinhole, the microscope is really efficient at
rejecting the out of focus fluorescent light.
Figure 2.4: Schematic of excitation of the specimen in confocal fluorescence
microscopy by a laser.
2.4.4. Fourier transform infra-red (FT-IR) spectroscopy
When IR radiation passes through the sample a part of it is absorbed and the
remaining is transmitted. The resulting spectrum is due to the molecular
absorption and transmission, creating a molecular fingerprint of the sample. Two
unique molecular structures do not produce the same infrared spectrum like
fingerprints. It can identify different functional groups present in organic and

Chapter 2
53
inorganic materials. For example, double and single bonds associated with carbon
oxygen and carbon hydrogen (associated with sp2 and sp3 carbon) bonding (=C-
H,-C-H, C-O and C=O) can be distinguished by IR absorption.
When IR radiation is illuminated on a sample, the vibrating bonds in the molecule
absorb energy of the incoming radiation which leads to either bending or
stretching of a molecule or functional group.
Figure 2.5: Schematic of FT-IR spectrometer equipped with ATR-cell.
The main part of the FT-IR spectrometer is a Michelson interferometer composed
of a beam-splitter and two mirrors: one is fixed- and other is moving which
produce the interference pattern. Infra red spectroscopy measures the absorption
of this incident infra-red radiation as it passes through the vibrating atoms of a
molecule. Only those vibrations are IR active which are associated with changes

Chapter 2
54
in dipole moments. A typical instrumentation of IR is shown in figure 2.5. The IR
spectra of the polymer samples were recorded using diamond attenuated total
reflectance (ATR) with IR Affinity, Shimadzu spectrophotometer.
2.4.5. UV-visible absorption spectroscopy
UV-vis spectrophotometers are commonly used to determine the concentration of
an absorbing species in a solution/solid and to study the molecular structure and
electronic excitations. When the energy of the excited state of any
atom/molecule/radical/ion resonates with the photon energy, absorption occurs
and the intensity of the transmitted light is decreased which gives rise to an
absorption band.
The principle of UV-visible absorption spectroscopy is based on the “Beer-
Lambert’s Law”. It states that “A beam of light passing through a solution of
absorbing molecules transfers energy to the molecules, as it proceeds, and,
therefore decreases progressively in intensity. The decrease in the intensity, or
irradiance, dI, over the course of a small volume element is proportional to the
irradiance of the light entering the element, the concentration of absorbers (C)
and the thickness of the absorbing element, dl.
Mathematically it can be expressed as
-dI/dl c (2.1)
or
dI/I = kcdl (2.2)

Chapter 2
55
where, k is the constant of proportionality and is called absorption coefficient.
The integrated form is given as
ln I0/I = kcl (2.3)
or
log I0/I = (k/2.303)cl (2.4)
k/2.303 = Extinction coefficient)
For any absorbing substance (solution/solid) absorbance ‘A’ is defined as
A = log I0/I (2.5)
From eqn. 2.4 and 2.5, the absorbance can be written as
A= cl (2.6)
UV-visible spectra were recorded using Jasco V-650 spectrometer. A typical
instrumentation of a double beam UV-vis spectrophotometer is shown in figure
2.6.
Figure 2.6: A schematic of the UV-visible spectrophotometer

Chapter 2
56
2.4.6. Fluorescence spectrophotometry
Fluorescence spectrophotometry is a fast, simple and inexpensive method to
determine the concentration of an analyte in solution based on its fluorescent
properties. In fluorescence spectroscopy, a beam with a wavelength varying
between 180 and ∼800 nm passes through a solution in a cuvette. The light that is
emitted by the sample is measured from an angle. In fluorescence
spectrophotometry both an excitation spectrum (the light that is absorbed by the
sample) and/or an emission spectrum (the light emitted by the sample) can be
measured. The concentration of the analyte is directly proportional to the intensity
of emission.
Intensity and shape of the spectra while recording emission spectra is dependent
on various factors like:
Excitation wavelength
Concentration of the analyte solvent
Path length of the cuvette
Self-absorption of the sample
The schematic of a fluorimeter shown in figure 2.7 depicts that the light source
and the detector are at 90O angle and the sample cuvette is at the intersection of
the two beam paths. The 90O angle is maintained to prevent interference from the
transmitted excitation light. Fluorescence spectroscopy is primarily concerned
with electronic and vibrational states of molecules. The species under study is
first excited, by absorbing a photon, from its ground electronic state to one of the

Chapter 2
57
various vibrational states in the excited electronic state. Intermolecular collisions
cause the excited molecule to lose vibrational energy until it reaches the lowest
vibrational state of the excited electronic state.
Figure 2.7: Schematic diagram of a fluorescence spectrophotometer
This can be visualized with a Jablonski diagram as shown in figure 2.8. As
molecules may drop down into any of several vibrational levels in the ground
state, photons are emitted with different energies, and thus frequencies. Therefore,
by analyzing the different frequencies of light emitted in fluorescence
spectroscopy, along with their relative intensities, the structure of the different
vibrational levels can be determined. In a typical fluorescence (emission)
measurement, the excitation wavelength is fixed and the detection wavelength
varies, while in fluorescence excitation measurement the detection wavelength is
fixed and the excitation wavelength is varied across a region of interest.

Chapter 2
58
Figure 2.8: Jablonski diagram
The fluorescence measurements were carried using Jasco Spectrofluorometer FP-
8500.
2.4.7. Nuclear magnetic resonance spectroscopy
Nuclear Magnetic Resonance (NMR) spectroscopy is a powerful and theoretically
complex analytical tool. The information obtained from the NMR spectra about
the nuclei, can be utilized to deduce the chemical environment of a specific
nuclei.
Subatomic particles (electrons, neutrons and protons) are imagined to be spinning
about their own axis. The nuclei of an atom are like a charge particle, which
generates a magnetic field because of its spin. In many atoms (such as 12C) these
spins are paired against each other, such that the nucleus of the atom has no
overall spin. However, in some atoms (such as 1H and 13C) the nucleus does

Chapter 2
59
possess an overall spin. The rules for determining the net spin of a nucleus are as
follows;
1. If the number of neutrons and the number of protons are both even, then
the nucleus has NO spin.
2. If the number of neutrons plus the number of protons is odd, then the
nucleus has a half-integer spin (i.e. 1/2, 3/2, 5/2)
3. If the number of neutrons and the number of protons are both odd, then
the nucleus has an integer spin (i.e. 1, 2, 3)
Quantum mechanics tells us that a nucleus of spin I will have 2I + 1 possible
orientations. A nucleus with spin 1/2 will have 2 possible orientations. In the
absence of an external magnetic field, these orientations are of equal energy
(Figure 2.9). The nucleus which is spinning on its own axis, in the presence of a
magnetic field, will precess around the magnetic field. The frequency of
precession is termed the larmor frequency, which is identical to the transition
frequency. If energy is absorbed by the nucleus, then the angle of precession will
change.
In case of ½ spin nucleus, the magnetic moment “flips”, so that it opposes the
applied field. This generates two spin states +1/2 and -1/2 as shown in figure 2.9.
Each level is given a magnetic quantum number, m. When the nucleus is in a
magnetic field, the initial populations of the energy levels are determined by
thermodynamics, as described by the Boltzmann distribution.

Chapter 2
60
Figure 2.9: Energy levels of a nucleus with spin quantum number ½.
This is very important, and it means that the lower energy level will contain
slightly more nuclei than the higher energy level. It is possible to excite these
nuclei into the higher energy level with electromagnetic radiation. The frequency
of radiation needed is determined by the difference in energy between the two
levels. The nucleus has a positive charge and is spinning. This generates a small
magnetic field. The nucleus therefore possesses a magnetic moment, µ, which is
proportional to its spin, I.
The constant, γ, is called the magnetogyric ratio and is a fundamental nuclear
constant which has a different value for every nucleus, h is the Planck’s constant.
The energy of a particular level is given by;
Where B is the strength of the magnetic field at the nucleus.

Chapter 2
61
The difference in energy between the levels (the transition energy) can be found
from equation 2.9.
This means that if the magnetic field, B, is increased, so is ΔE. It also means that
if a nucleus has a relatively large magnetogyric ratio, then ΔE is correspondingly
large. The magnetic field experienced by the nucleus is not equal to the applied
magnetic field, as the electrons around the nucleus shield it from the applied field.
The difference between the applied magnetic field and field at the nucleus is
termed as nuclear shielding. The precise resonance frequency of the energy
transition is dependent on the extent of nuclear shielding, which is in turn
dependent on the chemical environment. The chemical shift of a nucleus is the
ratio of the difference between the resonance frequency of the nucleus and a
standard and the resonance frequency of the standard. This quantity is reported in
ppm and is given by the symbol δ.
In NMR spectroscopy, the standard often used is tetramethylsilane, Si(CH3)4,
abbreviated TMS. The chemical shift is a very precise metric of the chemical
environment around a nucleus. The NMR spectrometer must be tuned to a
specific nucleus, like the 1H, 13C etc. The actual procedure for obtaining the
spectrum varies, but the simplest is referred to as the continuous wave (CW)
method. A typical CW-spectrometer is shown in the following figure 2.10.
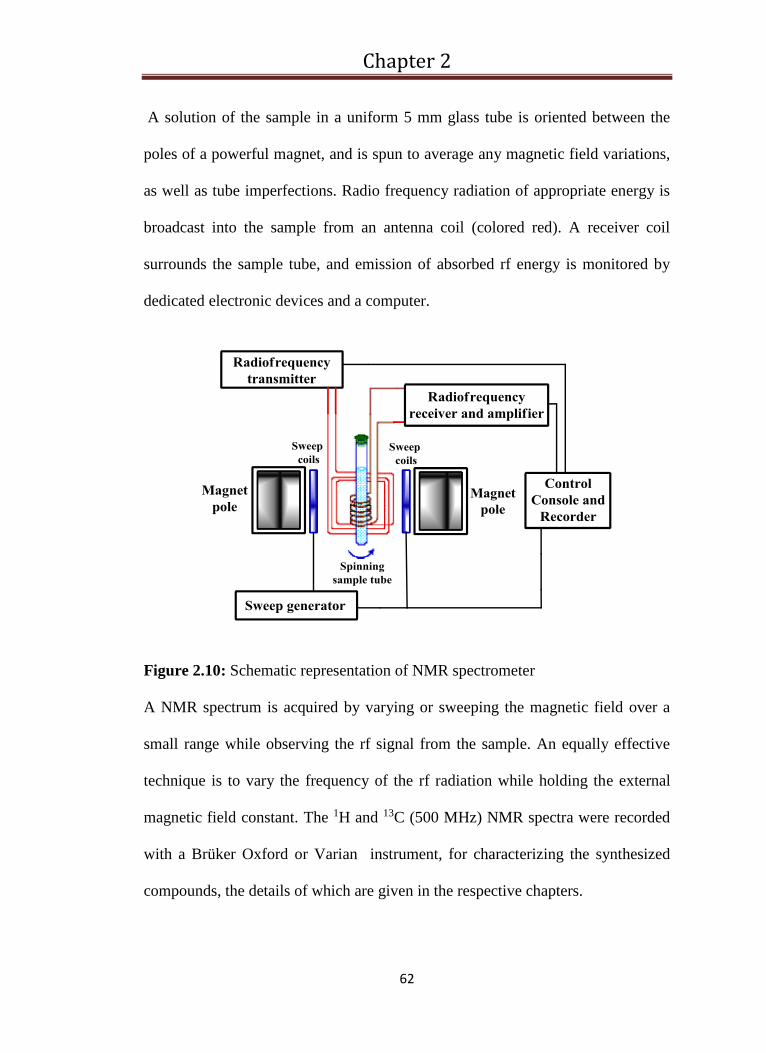
Chapter 2
62
A solution of the sample in a uniform 5 mm glass tube is oriented between the
poles of a powerful magnet, and is spun to average any magnetic field variations,
as well as tube imperfections. Radio frequency radiation of appropriate energy is
broadcast into the sample from an antenna coil (colored red). A receiver coil
surrounds the sample tube, and emission of absorbed rf energy is monitored by
dedicated electronic devices and a computer.
Figure 2.10: Schematic representation of NMR spectrometer
A NMR spectrum is acquired by varying or sweeping the magnetic field over a
small range while observing the rf signal from the sample. An equally effective
technique is to vary the frequency of the rf radiation while holding the external
magnetic field constant. The 1H and 13C (500 MHz) NMR spectra were recorded
with a Brüker Oxford or Varian instrument, for characterizing the synthesized
compounds, the details of which are given in the respective chapters.

Chapter 2
63
2.4.8. Thermal analysis
Thermal analysis involves a variety of techniques in which a particular property
of a sample is monitored when it is subjected to a predetermined temperature
profile. Recently there have been major advances in the thermal analysis
technique through improved furnace technology, microcomputer-based
electronics and the addition of microcomputer data handling systems. There are
multiple methods in thermal analysis depending on the type of properties of the
sample that are to be measured. The most commonly used techniques of thermal
analysis are given in table 2.1.
Name of the technique Measurement
Object
Unit Uses
Differential thermal
analysis (DTA)
Temperature
difference
oC µV Phase changes
different reactions
Differential scanning
calorimetry (DSC)
Thermal flow J/sec Heat capacity
Phase changes
Reactions
Thermogravimetry (TG) Mass mg Decompositions
Oxidation
Thermomechanical
analysis (TMA)
Deformations µm Softening
Expansion
Dynamic
thermomechanical
measurements (DTM)
Elasticity Pa, dyn/cm2 Phase changes
Polymer curing
Table 2.1: Thermal analysis techniques
2.4.8.1. Thermogravimetric analysis (TGA)
TGA is a technique in which the sample specimen is subjected to a controlled
temperature program and mass of the substance is monitored as a function of
temperature or time. Any physical or chemical process (evaporation, sublimation,

Chapter 2
64
oxidation, thermal degradation etc.) involving mass loss or gain of the material
can be studied by this technique. TGA can be carried out by using either a heating
ramp (dynamic mode) or a constant test temperature (isothermal mode).The
decomposition of a substance can be studied under inert, oxidizing or reducing
conditions by changing the test atmosphere by gas switching. The major
components of TGA are: a precision balance, a programmable furnace and a
recorder or a computer. In addition provisions are also made for surrounding the
sample with air, nitrogen or an oxygen atmosphere. A schematic layout of TGA
instrument is shown in figure 2.11.
Figure 2.11: Block diagram of thermogravimeter
In the present studies, thermogravimetric analysis measurements have been
carried out, using Mettler Toledo TG/DSC stare system. The details of thermal
programming, used in studying the individual systems will be discussed in the
relevant sections.
2.4.8.2. Differential Scanning Calorimetry (DSC)
Differential scanning calorimeter (DSC) is a fundamental tool in thermal analysis
which can be used in many industries – from pharmaceuticals and polymers, to

Chapter 2
65
nanomaterials and food products. The information these instruments generate is
used to understand amorphous and crystalline behavior, polymorph and eutectic
transitions, curing and degree of cure, and many other material properties used to
design, manufacture, and test products. DSC, is a thermal analysis technique that
looks at how heat capacity of a material (Cp) is changed with temperature. A
sample of known mass is heated or cooled and the changes in its heat capacity are
tracked as changes in the heat flow. This allows the detection of transitions such
as melts, glass transitions, phase changes, and curing.
In the 1960s, Mike O’Neill of Perkin-Elmer developed the first double-furnace, or
power controlled DSC in order to measure heat flow, the movement of heat in and
out of a sample, directly. This instrument uses a feedback loop to maintain the
sample at a set temperature while measuring the power needed to do this against a
reference furnace. This allows for very precise control of temperature, hence very
accurate enthalpy and heat capacity measurements, and true isothermal
performance. Because of its direct measurement of heat flow, it is often called
heat flow DSC. DSC technique can be used for measuring temperature difference
between sample and reference or heat flux. This is called heat flux DSC. It
measures the temperature difference and calculates heat flow from calibration
data. Because of their single furnace design, heat flux DSCs are less sensitive to
small transitions, heat and cool at slower rates than heat flow DSC and give less
accurate values for Cp and enthalpy. A pictorial representation of heat flux DSC
and heat flow DSC are given in figure 2.12.

Chapter 2
66
Figure 2.12: Pictorial representation of (a) heat flow and (b) heat flux DSC.
In a heat flow DSC, the endothermic peaks – those events which require energy,
point up – because the instrument must supply more power to the sample, to keep
the sample and reference furnaces at the same temperature. In a heat flux DSC,
these same events cause the sample to absorb heat and be cooler than the furnace,
so they point down. The reverse logic applies to exothermic events where energy
is released. Modulated Temperature DSC (MT-DSC) is the general term for DSC
techniques, where a non-linear heating or cooling rate is applied to the sample to
separate the kinetic from the thermodynamic data. This is done by applying a
series of heating (or cooling) micro-steps followed by an isothermal hold. This
technique removes kinetic noises from transitions, such as enthalpic overshoot or
curing exotherm, from an overlapping Tg.
Mettler Toledo DSC stare system was utilized for determination of states of water
in the synthesized hydrogel samples, the details of the experiment is given in the
respective chapters.

Chapter 2
67
2.4.9 Dynamic light scattering (DLS)
DLS is most commonly used to analyze nanoparticles. A monochromatic light
source, usually a laser, is shot through a polarizer and into a sample. The scattered
light then goes through a second polarizer where it is collected by a
photomultiplier and the resulting image is projected onto a screen. All of the
molecules in the solution, being hit with the light, diffract the light in all
directions. The diffracted light from all of the molecules can either interfere
constructively (light regions) or destructively (dark regions). If the light source is
a laser, which is monochromatic and coherent, the scattering intensity fluctuates
over time. This fluctuation is due to the fact that the small molecules in solutions
are undergoing Brownian motion, and so the distance between them is constantly
changing with time. This scattered light then undergoes either constructive or
destructive interference and we get information about the scale of motion of small
molecules in solution from this intensity fluctuation.
It is very important to remove dust and artifacts from the solution during the
sample preparation either by filtration or centrifugation. The dynamic information
of the particles is derived from an autocorrelation of the intensity trace recorded
during the experiment. Once the autocorrelation data have been generated,
different mathematical approaches can be employed to determine particle size
information from it. Analysis of the scattering is facilitated when particles do not
interact through collisions or electrostatic forces between ions which can be
suppressed by dilution, and charge effects are reduced by the use of salts to

Chapter 2
68
collapse the electrical double layer. The simplest approach is to treat the first
order autocorrelation function as a single exponential decay, which is appropriate
for a monodisperse population.
where g1(q;τ) is the autocorrelation function at a particular wave vector, q, and
delay time, τ, Where Γ is the decay rate. The translational diffusion coefficient Dt
may be derived at a single angle or at a range of angles depending on the wave
vector q.
Г = q2 Dt (2.12)
Where
Where λ is the incident laser wavelength, n0 is the refractive index of the sample
and θ is angle at which the detector is located with respect to the sample cell.
Dt is used to calculate the hydrodynamic radius of the particles using Stokes-
Einstein equation (2.14) which is as follows:
Where, KB = Boltzmann constant
T = Absolute temperature
η = Dynamic viscosity
r = Radius of the spherical particle

Chapter 2
69
It is important to note that the size determined by dynamic light scattering is the
size of a sphere that moves in the same manner as the scatterer. So, for example,
if the scatterer is a random coil polymer, the determined size is not the same as
the radius of gyration determined by static light scattering. The obtained size will
include any other molecules or solvent molecules that move with the particle.
2.5.0. Cobalt-60 gamma irradiator
The radionuclide cobalt-60 (Co-60 or 60Co27) is the most commonly used source
of gamma radiation for radiation technology, both for industrial and medical
purposes. Production of radioactive cobalt starts with natural cobalt (metal),
which is an element with 100% abundance of the stable isotope cobalt-59. Cobalt-
rich ore is rare and this metal makes up only about 0.001% of the earth’s crust.
Slugs (small cylinders) or pellets made out of 99.9% pure cobalt sintered powder
are generally welded in Zircaloy capsules and placed in a nuclear power reactor,
where they stay for a limited period (about 18–24 months) depending on the
neutron flux at the location.
While in the reactor, a cobalt-59 atom absorbs a neutron and is converted into a
cobalt-60 atom. During the two years in the reactor, a small percentage of the
atoms in the cobalt slug are converted into cobalt-60 atoms. Specific activity is
usually limited to about 120 Ci/g of cobalt. After irradiation, the capsules
containing the cobalt slugs are further encapsulated in corrosion resistant stainless
steel to finally produce the finished source pencils in a form such that gamma
radiation can come through but not the radioactive material (cobalt-60) itself. The

Chapter 2
70
source pencils are arranged in the form of a cylinder, over the source rack of the
industrial irradiator. Cobalt-60 (60Co27) decays (disintegrates) into a stable (non-
radioactive) nickel isotope (60Ni28) principally emitting one negative beta particle
(of maximum energy 0.313 MeV) with a half-life of about 5.27 years. Nickel-60
thus produced is in an excited state, and it immediately emits two photons of
energy 1.17 and 1.33 MeV in succession to reach its stable state. The decay
scheme is given in figure 2.13.
Figure 2.13: Decay scheme of Cobalt-60
These two gamma ray photons are responsible for radiation processing in the
cobalt-60 gamma irradiators. With the decay of every cobalt-60 atom, the strength
or the radioactivity level of the cobalt source is decreasing, such that the decrease
amounts to 50% in about 5.27 years, or about 12% in one year. Additional pencils
of cobalt-60 are added periodically to the source rack to maintain the required
capacity of the irradiator. Cobalt-60 pencils are eventually removed from the

Chapter 2
71
irradiator at the end of their useful life, which is typically 20 years. Cobalt-60
gamma irradiator was used for synthesis of sterilized hydrogels and also
glycopolymers, the dose rate of which was determined by Fricke dosimetry.
2.5.1. Rheometer
A rheometer is a laboratory device used to measure the way in which a liquid,
suspension or slurry flows in response to applied forces. There are two
distinctively different types of rheometers. Rheometers that control the applied
shear stress or shear strain are called rotational or shear rheometers, whereas
rheometers that apply extensional stress or extensional strain are extensional
rheometers. Rotational or shear type rheometers are usually designed as either a
native strain-controlled instrument (control and apply a user-defined shear strain
which can then measure the resulting shear stress) or a native stress-controlled
instrument (control and apply a user-defined shear stress and measure the
resulting shear strain). Different types of rotational or shear type rheometers are:
1. Dynamic shear rheometer: Dynamic shear rheometer commonly known as
(DSR) is used for studying the viscoelastic behavior of thick liquids or gels.
This is done by deriving the complex modulus (G*) from the storage modulus
(elastic response, G') and loss modulus (viscous behaviour, G") yielding G*
as a function of stress over strain.
2. Rotational cylinder type shear rheometer: This set up contains liquid placed
within the annulus of one cylinder inside another. One of the cylinders is
rotated at a set speed. This determines the shear rate inside the annulus. The

Chapter 2
72
liquid tends to drag the other cylinder round, and the force it exerts on that
cylinder (torque) is measured, which can be converted to a shear stress.
3. Cone and plate shear rheometer: The liquid is placed on horizontal plate and
a shallow cone placed into it. The angle between the surface of the cone and
the plate is around 1 to 2 degrees but can vary depending on the types of tests
being run. Typically the plate is rotated and the force on the cone is
measured. Cone and plate rheometers can also be operated in an oscillating
mode to measure elastic properties, or in combined rotational and oscillating
modes.
Rheological characterization is based on a response to an applied load, force or
deformation and substances can thus be rheologically classified as, elastic (ideal
solids), viscous (ideal fluids) or viscoelastic. Viscoelastic materials like rubbers,
paints, gels etc. exhibit a combination of elastic and viscous effects
simultaneously. These materials are characterized by parameters such as phase
angle (δ), elastic (G′) and loss moduli (G′′). Ideal solids (elastic) and ideal fluids
(viscous) represent extremes for rheological analyses, and substances between the
two extreme scenarios are called viscoelastic materials. Ideal solids store energy
gained during deformation and following the removal of the load return to an
original shape using the stored energy. Hooke’s law is observed in such solids
which state that the load applied to a body is directly proportional to the imposed
deformation. In rheological terms, stress and strain are related linearly to each
other,

Chapter 2
73
σ = G γ (2.15)
The degree of viscoelasticity is characterized by parameters which are generally
obtained through dynamic or oscillatory testing. In such tests, a stress or strain
varying in a sinusoidal fashion is allowed into the material, and the resulting
strain or stress respectively, is assessed. The amplitude of the input stress or strain
is the peak stress (σ a) or strain (γa) during oscillation.
Viscoelastic parameters include the complex modulus (G*), the phase angle (δ),
elastic (or storage) modulus (G′), and viscous (or loss) modulus (G′′).
Complex modulus is the ratio of the amplitude stress and strain determined in the
linear viscoelastic region
G∗ = σa/γa (2.16)
Phase angle can be defined as the ratio of the viscous effects to the elastic effects.
In the linear viscoelastic region, when a strain is input into a material, phase angle
is the angle with which the responding shear stress deviates from the input strain.
For a perfectly elastic solid, the stress is in phase with the strain without any lag,
and hence the phase angle is 0°. For a perfectly viscous liquid, the strain and
stress are totally out of phase, and the phase angle is 90°. Mathematically, phase
angle is determined as
δ = tan-1 (G′′/G′) (2.17)

Chapter 2
74
Thus, a large value of elastic modulus, G′, in comparison with loss modulus, G′′,
indic7ates a more elastic material, while a larger value of G′′ indicates a more
viscous material. A material with a phase angle between 0°and 90°is deemed
viscoelastic in nature. The elastic modulus or the storage modulus (G′) represents
the energy stored within the material and corresponds to the elastic behavior of
the sample. Mathematically, storage modulus is computed as the product of
complex modulus and the cosine of the phase angle (equation 2.18).
The loss modulus (G′′) is used as a measure of the energy lost through dissipation
and accordingly describes the viscous behavior of the sample. Loss modulus is the
product of complex modulus and sine of the phase angle (equation 2.19).
Consequently, complex modulus can be re-written as a combination of the elastic
and loss modulus which form the real and imaginary parts defined as,
G∗ = G′ + iG′′ (2.20)


Chapter 3
75
CHAPTER 3
SILVER NANOPARTICLE LOADED
ANTIBACTERIAL PVA/GUM ACACIA
HYDROGEL


Chapter 3
76
3.1. Introduction
Metal nanoparticles-embedded hydrogels, wherein the three dimensional,
hydrophilic polymeric network stabilizes the nanoparticles, have attracted
attention mainly due to their wide range of applications in the field of catalysis,
biomedicine, optics, pharmaceuticals, etc.106 Most of the synthetic routes for the
formation of metal nanoparticles employ chemical reduction methods, using
hydrazine hydrate, dimethyl formamide, ethylene glycol, etc., which causes
toxicity and biological hazards.107 Recent research efforts in this area are directed
more towards developing new approaches, to incorporate metal nanoparticles into
polymeric hydrogel matrices, without involving any toxic chemical reductants, or
using any complicated physical techniques, such as sputtering, plasma deposition,
etc. Radiation technology is one such method, by which it is now possible to
synthesize nanoparticles incorporated hydrogel matrices in situ.
The advantage of using radiation-induced synthesis of hydrogels is that, the
process can be optimized to form a sterilized gel matrix, which can be used,
without further purification, for various biomedical applications. This makes it
one of the best methods for hydrogel synthesis. Also, radiation-induced method of
synthesis of nanoparticles has a better control over the size.106 Hence, radiation
technique can be used as a cleaner and simpler method, to form a hydrogel matrix,
with nanoparticles embedded in it. While considering the synthesis of hydrogels
for biomedical applications, its biocompatibility is an important parameter.
Synthesis of biocompatible hydrogel matrix from a nontoxic, economical, and

Chapter 3
77
easily available material such as polysaccharides, is usually more advantageous
than that from synthetic polymers.108 Gum acacia (GA) is a well-known
polysaccharide, obtained from the stems and branches of acacia Senegal tree.109-
111 According to the recent structural studies, it is known to be composed of (i)
arabinogalactan, (ii) arabinogalactan-protein (AGP) complex fraction, and (iii)
minor glycoprotein fraction.110,111 The high molecular weight protein part in GA is
attached to polysaccharide through hydroxyproline and serine residues. Uronic
acid (16%) is present in low quantities in different components of the gum, which
makes it a weakly charged polyelectrolyte.110 But, GA cannot be cross-linked by
gamma irradiation, whereas poly vinyl alcohol (PVA) is well known to form
hydrogels induced by gamma, as well as electron irradiation. In the present work,
gum acacia and PVA was an obvious choice for the synthesis of a composite
hydrogel matrix, due to its biocompatible, economical and environmental friendly
nature.
Thus a combination of water soluble biopolymer GA and synthetic polymer PVA
with silver nanoparticles can produce new hydrogel matrix, with antimicrobial
property. Recent studies have shown that, silver in the form of nanoparticles, is
very effective as antimicrobial agent, both in vivo and in vitro, compared to bulk
silver or silver ions, due to their enhanced permeation and retention effects
(EPR).112-115 Their antimicrobial activity is due to its interaction with sulphur
containing proteins present in bacterial cell membrane as well as with
phosphorous containing DNA. The size and the rate of leaching of the silver

Chapter 3
78
nanoparticles also play a major role in antimicrobial activity of such hydrogels,
especially for wound dressing applications. For such applications, a hydrophilic
environment is necessary, to facilitate the release of silver from the polymer
matrix, and also to maintain a moist environment around the wound bed, which is
essential for optimal wound healing. The polysaccharides, like gum acacia,
carrageenan, agar, etc., can improve the water retention properties, and hence are
suitable for such hydrogel synthesis.
In the present work, in view of the advantages of radiation induced technique and
biocompatibility of the hydrogel matrix, radiolytic synthesis of silver nanoparticle
loaded PVA-GA hydrogel (Ag/PVA-GA hydrogel) was carried out, and its
antibacterial behaviour was studied.
3.2. Experimental
3.2.1. Preparation of Ag /PVA-GA hydrogel
Freshly prepared stocks of 10% PVA and 10% GA (W/V) in water were used for
preparation of PVA-GA blends. Aqueous solution of 3% PVA containing
different concentrations of GA (1%, 3%, and 5%) and 1 mM AgNO3, were
prepared by appropriate dilution of these stock solutions. The PVA-GA blends
containing AgNO3 were transferred into glass tubes and sealed after bubbling
with nitrogen~ (for 30 min at 5 ml/min) to flush out any dissolved oxygen. These
tubes were irradiated in Co-60 gamma source at a dose rate of 1.44 kGy/h, to an
absorbed dose of 35 kGy under ambient conditions. Thus, silver nanoparticles

Chapter 3
79
(AgNPs) were produced in situ in the hydrogel which were taken out and washed
thoroughly with distilled water to remove any unreacted species (Figure 3.1).
Figure 3.1: Schematic representation of the synthesis of PVA-GA hydrogel
containing AgNPs.
These gels were dried to constant weight in vaccum at 40 oC for further
characterization by different techniques. The mechanism of formation of silver
nanoparticles in the hydrogel matrix can be explained as follows.
Gamma irradiation of an aqueous solution mainly produces ˙OH, ˙H radicals and
hydrated electrons (eaq), along with some molecular products, due to radiolysis of
solvent as shown in equation 1.1 (Chapter 1).
Among these ˙OH is oxidizing in nature, while ˙H and eaq are of reducing nature.
The ˙OH and ˙H radicals are mainly responsible for crosslinking of the PVA
chains, whereas ˙H and eaq reduce Ag+ ions to AgNPs. The initially formed
neutral Ago atoms can combine with themselves or with the Ag+ ions trapped in
the polymer chains, to form dimeric clusters of silver (equation (3.1-3.3)).9

Chapter 3
80
These dimeric clusters can further react with excess silver cations to form
trimeric, tetrameric and higher order silver ion clusters which simultaneously get
reduced by eaq and H atoms.112, 116 These higher nanometallic clusters grow with
time and get stabilized in the nanolevel domains of gum acacia/PVA matrix.
These nano level domains are formed due to inter and intramolecular H-bonds
between –COOH and –OH groups of gum acacia and –OH groups of PVA and
radiation induced crosslinks between the polymeric chains, resulting in a hydrogel
network system. Upon continuous irradiation the clusters trapped in these
domains are converted into nanoparticles. The ‘O’ atom of the functional groups
on the network chains anchor the AgNPs, resulting in a surface charge which
leads to electrostatic repulsive force, and the steric effects of the polymer chains,
stabilize the nanoparticles.117
Generally polymers may crosslink or degrade upon irradiation depending on its
chemical structure. PVA is known to be a crosslinking polymer, while GA is of
degrading nature. Therefore along with crosslinking of PVA, degradation of
polysaccharide GA is also taking place in the reaction medium, and the overall
behavior will depend up on the relative concentration of the two polymers.

Chapter 3
81
The rate constants for reaction of ˙OH and ˙H radicals with both PVA and GA are
very similar and are of the order of 109 dm3 mol-1 s-1 while the rate constants for
the reaction of eaqwith both these polymers are much lower. On the contrary,
reactivity of both ˙H and eaqwith Ag+ ions are about an order of magnitude
higher (i.e 1010 dm3 mol-1 s-1). The concentration of the solutes are appropriately
chosen so that the ˙OH and ˙H radicals preferentially react with the polymers and
the eaq reacts mostly with Ag+ ions, leading to a cross-linked hydrogel network
containing AgNPs. Thus an aqueous solution of PVA, GA and silver nitrate of
appropriate concentrations upon gamma irradiation, form covalently crosslinked
yellow colored hydrogel with AgNPs trapped in the network. The parameters like
gel strength, water absorption capacity, thermal strength, adhesion, etc. depend on
the concentration of PVA, GA, crosslinking density, gamma dose, irradiation
conditions etc.106
3.2.2. Characterization of the synthesized Ag /PVA-GA hydrogels
The synthesized hydrogel samples were vacuum dried to constant weight and then
utilized for characterization techniques like FT-IR, swelling studies, thermal
analysis, and particle size measurements.
3.2.2.1. FT-IR analysis
The FT-IR spectra of PVA/GA and AgNPs/PVA-GA hydrogel samples were
recorded in order to identify the functional groups involved in the synthesis of
AgNPs.

Chapter 3
82
4000 3500 3000 2500 2000 1500 1000
% T
rans
mitt
ance
Wavenumber(cm-1)
(a)
(b)
3273
2920
1087
2852
1244
3258
(A)
4000 3500 3000 2500 2000 1500 1000 500
% T
rans
mit
tanc
e
Wavenumber(cm-1
)
(a)
(b)
(C)
(d)
3275
2920
2852
1750 14171373
1244
1087
(B)
Figure 3.2: FT-IR spectra of vaccum dried hydrogel samples: (A) (a) without
AgNPs (b) with AgNPs. (B) Synthesized using variable GA concentrations ((a)
0%, (b) 1%, (c) 3%, (d) (5%) with 3% PVA, 1 mM AgNO3, at an applied
radiation dose of 35 kGy).

Chapter 3
83
In the presence of silver the oxygen atom of -OH and -COOH groups gets
associated with silver clusters.116 This leads to broadening and shifting of O-H
stretching from 3273 cm-1 (silver unloaded) to 3258 cm-1(silver loaded). The C-H
stretching peak at 2920 cm-1 in silver unloaded sample is slightly broadened and
also split into two peaks upon silver loading (Figure 3.2A). This indicates the
interaction of silver with -OH groups, which leads to a shift in the stretching of
the C-H groups associated with these hydroxyl groups.
FT-IR spectra of silver loaded hydrogel samples containing different
concentrations of GA (1%, 3% and 5%) were also recorded to understand the
variation in the interaction between GA, PVA and silver (Figure 3.2B). The major
peaks are 3275 cm-1 (O-H stretching), 2920 cm-1, 2852 cm-1 (C-H stretching),
1417 cm-1 (O-H deformation), 1244 cm-1 (C-O stretching of PVA), 1087 cm-1 (C-
OH stretching of GA) (Figure 3.2B).117 The presence of large number of hydroxyl
and carboxyl groups and the possible hydrogen bonding between them resulted in
broadening of peaks at ~3200 cm-1 and ~1000 cm-1. With increase in
concentration of GA more hydroxyl groups are involved in hydrogen bonding and
this leads to further peak broadening and slight shift in the C-O stretching
frequency at 1244 cm-1 of PVA as well at 1087 cm-1 of GA (Figure 3.2B).
3.2.2.2. Thermogravimetric analysis
Thermogravimetric analysis was performed using Mettler Toledo TG/DSC stare
system. About 5-10 mg of the dried hydrogel samples were heated in an alumina
crucible and the profiles were recorded from 30-750 oC, at a scan rate of 10

Chapter 3
84
oC/min, under nitrogen atmosphere, with a flow rate of 50 ml/min. The thermal
stability of the matrix and the silver loading in the hydrogel matrix was studied
from the thermogravimetric data. Figure 3.3 illustrates the thermogram of silver
loaded and unloaded dry hydrogel samples. The weight loss observed for
PVA/GA hydrogel sample was 72.7% at 500 °C whereas Ag/PVA-GA composite
hydrogel showed only 64.3% at the same temperature. This weight loss difference
indicates the presence of AgNPs and its possible matrix stabilization due to its
interaction with the matrix.
100 200 300 400 500 600 700 800
10
20
30
40
50
60
70
80
90
100
110
Temperature(oC)
PVA-GA
Ag/PVA-GA
Wei
gh
t %
Figure 3.3: Thermogravimetric curves showing the weight loss in (Ag/PVA-GA)
and (PVA-GA) vaccum dried hydrogel samples.
3.2.3. Swelling studies of the hydrogels
Equilibrium degree of swelling (EDS) was determined gravimetrically. The
hydrogel samples dried to constant weight were immersed in double distilled
water at room temperature for ~ 24 h. The excess water was removed with a filter

Chapter 3
85
paper and the samples were weighed. The EDS was calculated using equation
3.4.118
Where,
We = weight of the swollen hydrogel at equilibrium
Wd = initial weight of the dried hydrogels.
The % EDS values were determined at different pH as well as at different
compositions of hydrogels. The pH was adjusted to desired value by using 0.1 M
HCl and 0.1 M NaOH solutions and the ionic strength was maintained to 0.1 M
with NaCl.
3.2.3.1. Equilibrium degree of swelling as a function of PVA and GA
concentration
The % EDS was determined for the hydrogels containing different concentrations
of PVA and GA, keeping concentration of silver nitrate and applied radiation dose
constant, to study the effect of this variation, on the network structure of the
hydrogels (Table 3.1). The % EDS was found to decrease with increase in relative
concentration of PVA (Table.3.1). This is because at higher PVA concentrations
cross linking density is more, hence results in a tighter 3D-structure which will
swell less compared to the hydrogels with lower concentration of PVA. The %
EDS of the resultant hydrogels increased from 984% to 1826% with increase in
GA fraction from 0 to 0.63 (Table.3.1). This may be due to the hydrophilic nature
of GA which can lead to more hydrogen bonding between GA and water.

Chapter 3
86
Sample (Dose = 35 kGy)**
GA fraction % EDS*
0.00 984
0.29 1170
0.38 1390
0.50 1553
0.63 1826
*Average of three measurements **Gel formation was not observed when the PVA concentration was below 3% or GA
concentration was above 5% at an applied radiation dose of 35 kGy.
Table 3.1: Variation in % EDS at different PVA and GA concentrations in the
presence of 1 mM AgNO3.
The increase in % EDS can also be explained in terms of decrease in crystallinity
of PVA segments, due to the bulky units of GA. In fact, the hydrogen bonding
due to –OH groups crystallize PVA through physical cross linking but the steric
hindrance of the bulky GA groups disturbs the chains and decreases the
crystallinity. Also, the presence of GA in polymer solution reduces the probability
of radical recombination during irradiation, which ultimately reduces the
crosslinking density of the gel leading to more free volumes in the polymer
network and consequently more water can be absorbed.119
3.2.3.2. Equilibrium degree of swelling as a function of pH
The pH sensitivity of the matrix was analyzed by determining % EDS at different
pH of the absorbing medium. It was observed that the % EDS does not vary
significantly with variation in the pH of the medium (Table.3.2). This behavior

Chapter 3
87
may be because, the pH dependent –COOH groups of GA are very less compared
to the –OH groups present in PVA and GA together. So the pH variation doesn’t
significantly affect % EDS of the hydrogels.
* Average of three measurements
Table 3.2: Effect of pH on the % EDS of the hydrogel formed by gamma
irradiation of aqueous solution containing 3% PVA, 5% GA, and 1 mM
AgNO3 for 35 kGy dose.
3.2.4. Release of silver from hydrogels
The antimicrobial activity of silver containing hydrogels is dependent on the
release of silver from the polymeric matrix to the pathogenic environment. UV-
vis spectroscopic technique was utilized to study the leaching of silver. A freshly
prepared Ag/PVA-GA hydrogel samples with different initial GA contents 1%,
2%, 3%, 5% (w/v) and 5% (w/v) PVA were used for the analysis. The in vitro
release profiles of silver from hydrogel matrices were obtained by measuring the
optical density (O.D) at different time periods. Briefly, hydrogels of 1.0 g was
stored in a flask containing 10 ml of distilled water at 37 oC and the flask was
pH % EDS*
1 1424
4 1485
7 1466
10 1489
12 Gel disintegrated

Chapter 3
88
oscillated at a frequency of 60 rpm in a rotary shaker. The amount of silver
released was determined by measuring the O.D at the λmax, due to the silver
nanoparticles released in the aqueous medium.
As shown in figure 3.4, in the case of 5% GA sample the release of silver was
rapid in the beginning and became almost constant.
0 2 4 6 8 10 12 14 16 18 20 22 24 26
0.0
0.1
0.2
0.3
0.4
0.5
Ab
so
rban
ce
Time (h)
5% GA
3% GA
2% GA
1% GA
Figure 3.4: Graph showing the silver release profiles of hydrogels prepared with
different GA concentrations, at 5% PVA, 1 mM AgNO3 and applied radiation
dose of 35 kGy.
This is probably due to higher silver loading as well as higher hydrophilicity of
the matrix with increasing GA concentration. But at lower concentration (1%, 2%
and 3% GA) the initial release was not so rapid; it increases gradually and a
considerable increase can be observed only after long incubation period of ~ 20 h.
The longer time for the release of silver may be the result of slow swelling nature
of the matrix with low GA content vide supra (3.2.3.1).

Chapter 3
89
3.2.5. Particle size analysis
Particle size analysis was carried out by dynamic light scattering (DLS) method
using VASCO γ particle size analyzer at 25 oC (laser wavelength 658 nm). DLS
method measures the Rayleigh scattering. Based on the assumptions (monomodal
particle size distribution, spherical particles) it is possible to compute particle size
distributions by intensity, by volume, and by number.120

Chapter 3
90
Figure 3.5: Variation in particle size at different GA concentration keeping all
other parameters constant (a) 1% GA (b) 2% GA (c) 3% GA (d) 5% GA.
The variation in particle size distribution as a function of GA concentration was
studied keeping the radiation dose (35 kGy), PVA (3%) and silver ion
concentration (1 mM) constant. The mean particle diameters when GA
concentration was 1%, 2%, 3% and 5%; was obtained as 9.8 nm, 13.7 nm, 16.9
nm, 42.0 nm (Figure 3.5). This may be because with increase in GA
concentration the possibility of inter- and intra-molecular crosslinking in PVA
decreases because of steric effects due to GA and hence the crosslinking density

Chapter 3
91
decreases. So there is more probability of aggregation of silver nanoparticles in
the matrix resulting in larger clusters of nanoparticles.
3.2.6. Gel point determination
Gelation is a process which involves change from liquid to solid like behavior.
This can be studied by rheological experiments. The storage modulus G’ (ω) and
the loss modulus G” (ω) can be measured by applying an oscillatory shear field to
the sample. The phase difference (δ) between the externally applied stress σ and
strain γ inside the sample describes the viscoelastic properties of the material. The
condition of G’<G” indicates liquid like behavior and while that of G’>G”
indicates more of solid like behavior.121
Determination of gel point can be done by different rheological methods out of
which the most reliable and generally valid is the one based on Chambon-Winter
(CW) criterion. According to CW criterion, the gel point is indicated by the
independence of the viscoelastic function, tan (δ) on frequency (ω).122 The
crossover of G’ and G” has been suggested as a criterion for gelation, however it
is frequency dependent in most polymer systems and is only observable in
polymer fluids, where there are permanent molecular entanglements, extending
throughout the system. Also due to ‘weak gel’ characteristics of the present
system observing a crossover is perhaps not expected. Such crossovers in weak
gels can be expected at lower frequencies (ω), however the experiments become
unfeasible at very low frequencies because the measurement time, texp is inversely
proportional to ωmin, where ωmin is the lowest investigated frequency.123 Hence to

Chapter 3
92
determine gel point Tg accurately, it is most appropriate to consider the point at
which tan (δ) exhibits frequency independence or alternatively the frequency
independence can be shown by the power law (equation 3.5),
Where, q = 0 at the gel point and K is a constant which is characteristic of the
gel.124
3.2.6.1. Conditions of rheology experiments
The composition of the samples used for irradiation was 5% (w/v) GA, 3% (w/v)
PVA and 1 mM AgNO3, which was kept constant. The samples were irradiated
under the same conditions at different radiation doses to study the viscoelastic
properties. All measurements were done in the linear viscoelastic region so that
the storage moduli (G’) and the loss moduli (G”) were independent of the applied
strain. Therefore, a strain sweep test was conducted for each sample. For the study
of gelation, the storage and loss moduli were measured, from a constant strain-
frequency sweep experiments over frequency range of 100-0.1 rad/s.
3.2.6.2. Evolution of the modulus G’ and G” with applied radiation dose and
determination of the gel point
Initially, with the samples obtained at lower radiation doses G’(ω) was smaller
than G”(ω) and remained small during the frequency sweep test. Then, with
increase in applied radiation dose, both moduli were found to increase and finally
G’ (ω) became larger than G”(ω).125 It was observed that above ~30 kGy

Chapter 3
93
radiation dose the G’ (ω) was larger than G”(ω) indicating solid like behavior.126
Also there is congruency of G’(ω) and G”(ω ) values above ~30 kGy (Figure 3.6).
1 10 1001E-4
1E-3
0.01
0.1
1
10
23.0 KGy
23.0 KGy
24.5 KGy
24.5 KGy
30.2 KGy
30.2 KGy
33.0 KGy
33.0 KGy
34.5 KGy
34.5 KGy
38.9 KGy
38.9 KGy
G',G
"
angular frequency (rad/s)
Figure 3.6: Frequency dependence of storage modulus G’ (closed symbols) and
loss modulus G” (open symbols) at different applied radiation dose.
But this observation cannot give us the exact gel point. To consider the
applicability of the gel point determination method proposed by Winter and
Chambon, it is necessary to take a power law fit of tan (δ) over a range of
frequencies. Figure 3.7 illustrates the frequency dependence of tan (δ), for each
applied dose to the system described. Below the gelation dose, G’ increases more
rapidly than G” and thus tan (δ) decreases rapidly with dose. Initially at lower
doses the tan (δ) value is higher at lower frequencies, which is typical for a
viscoelastic liquid. This indicates that the networks are not interconnected to a
macroscopic scale.

Chapter 3
94
20 40 60 80 100
1
2
3
4
5
6
7
8
9
10
11
12
13
14
15
38,9 KGy
34.5 KGy
33.0 KGy
30.2 KGy
24.5 KGy
23.0 KGy
Dam
pin
g f
act
or
Angular frequency (rad/s)
(For clarity only necessary datas are incorporated.)
Figure 3.7: Frequency dependence of damping factor at different applied
radiation doses.
After the gel point, the clusters form three dimensional interconnected networks
which is reflected by the less rapid increase of G’ over G”. As a result tan (δ)
decreases gradually with dose and increases smoothly with frequency, indicating
the formation of a visco elastic solid. After 30.2 kGy, the tan(δ) values become
almost independent of frequency, suggesting the post gel point region.127 A power
law fit to the data in figure 3.7 was observed over two decades of frequency with
a correlation coefficient R2≥ 0.95.
Fitting tan (δ) to a power law relationship, yields a power law coefficient (q), for
each radiation dose, the relationship of which, with irradiation time is described in
figure 3.8 The time of irradiation, at which the power law coefficient (q), passes
through zero represents a frequency independent measure of tan(δ) and thus
congruency in the behavior of G’ and G”, fulfilling the requirements for the gel

Chapter 3
95
point.111 From the figure 3.8 it can be concluded that gel point occurs at 19.2
hours of irradiation i.e. 25.34 kGy of radiation dose.
0 2 4 6 8 10 12 14 16 18 20 22 24 26 28 30
-0.4
-0.3
-0.2
-0.1
0.0
0.1
0.2
0.3
0.4
Po
wer l
aw
co
eff
icie
nt(
q)
Time of irradiation (hrs)
Figure 3.8: Power law coefficient (q) vs irradiation time for samples synthesized
with 5 % PVA, 3 % GA and 1 mM AgNO3. All correlation coefficients for power
law fit R2≥ 0.95.
3.2.7. Antibacterial Studies
Antibacterial activity of the Ag/PVA-GA blend hydrogels against wild type
Escherichia coli W1103 (E.Coli) (Gram negative) was evaluated using the disc
diffusion method. Overnight grown culture of E.Coli was diluted and plated on
LB agar. Equally weighed hydrogel samples consisting of 1%, 2%, 3% and 5%
GA; keeping silver nitrate and PVA concentration unchanged, were kept on the
plates which were incubated at 37 ºC for 24 h, then the plates were taken out and
the inhibition area was observed. The incubation zone was observed in each of the

Chapter 3
96
samples, which decreased with increase in GA concentration (Figure 3.9).
Hydrogel samples with 1% and 2% GA concentration, showed an inhibition zone
around the sample. But for 3% and 5% GA concentration, the gels were found to
be just contact active. This is in agreement with the particle size data given in
section 3.2.5. So it can be observed smaller the particle size better is the
antibacterial activity.
Figure 3.9: Antibacterial activity picture of hydrogel samples, against E.Coli
bacteria (a) no silver loading (b) 1% GA (c) 2% GA (d) 3% GA (e) 5% GA. All
samples were prepared with 1 mM AgNO3, 3% PVA and radiation dose of 35
kGy.
3.3. Conclusions
In the present work, a simple one-pot synthesis of silver nanoparticle loaded
PVA/GA hydrogel with varying size distribution (average 10-20 nm) of
nanoparticles, depending on the concentration of GA, through gamma irradiation
route was accomplished. The addition of GA improved the biocompatibility as

Chapter 3
97
well as the swelling properties of the hydrogels. The FT-IR analysis suggested
that the hydroxyl and carboxylic acid functional groups present in GA and PVA,
interact with AgNPs during their formation. The silver loaded hydrogel network
was found to be more thermally stable than unloaded one, reveals the TG
analysis. The results of the study showed that this method has a good control over
the size of the AgNPs for producing hydrogels with appropriate antibacterial
activity. The swelling studies showed that, the % EDS increases with increase in
GA concentration and decreases with increase in PVA concentration. Also %
EDS of the hydrogels were independent of pH. The silver release profiles showed
an increase with increase in GA concentration. The gel point determination using
CW criterion gives the gel point at 25.34 kGy with highest GA concentration. It
was observed that nano silver containing hydrogels had good antibacterial
performance against gram negative E.Coli bacteria.

Chapter 4
98
CHAPTER 4
SYNTHESIS AND STUDY OF
BIOCOMPATIBLE GLYCOPOLYMERIC
HYDROGELS


Chapter 4
99
4.1. Introduction
A new class of biocompatible and biodegradable materials containing sugar
moieties called as glycopolymers has received great attention in the scientific
community. This is largely due to their wide range of applications, which include,
the synthesis of macromolecular drugs, matrices for cell culture, model biological
systems, surface modifiers, chromatographic purposes and so on.128 The advanced
polymerization techniques have facilitated the synthesis of glycopolymers of
different types required for specific applications. In general, the application of
polymers widens, with the scope of achieving it in different forms like gels.
The last three decades saw a vast and more creative development in the field of
hydrogels directed towards a more precise/selective application.129 The most
attractive and important aspect of hydrogel is its bio-compatibility and bio-
degradability which ensures its application in biomedical field.130 This is largely
promoted by its high water content and a similar physiochemical nature of
hydrogels to the native extracellular matrix.131 Even though extensive work have
been carried out in the area of glycopolymers,132 very little is known about the
synthesis and study of purely sugar based hydrogels.133 The significance of
carbohydrate based polymers/hydrogels in the biomedical field is owing to the
glycotargeting ability of carbohydrate pendants present in the polymer network.134
The carbohydrate pendants in the glycopolymeric framework can be recognized
by the cell surface carbohydrate binding proteins-lectins 135 and this makes them a
unique class of materials for targeted drug delivery applications.136

Chapter 4
100
Generally, sugar based hydrogels are synthesized from low molecular weight
gelators (LMWG).137 However, it has been reported that hydrogels derived from
LMWG possess several disadvantages that include aggregation, crystallization or
precipitation with time.137d One way to overcome this is to synthesize hydrogel
from low molecular weight carbohydrate derivative by radiation polymerization.
This technique has the potential to overcome most of the limitations that arises
from LMWG, as the radiation crosslinked hydrogels possess more lifetime
stability due to covalent crosslinking. An added advantage of radiation induced
synthesis is that, a sterilized hydrogel can be achieved in a single step process by
applying appropriate radiation dose.
Recently, studies towards the synthesis of biodegradable materials revealed that
incorporation of biodegradable crosslinkers into a non-biodegradable but
biocompatible polymer could transform the latter to a biodegradable material.14
This observation triggered efforts to make biodegradable crosslinkers based on
peptides/saccharides. In this context, it is of interest to have a crosslinker with
functional groups like that on the monomer, so that the functional homogeneity is
maintained throughout the polymeric network. Currently, for the synthesis of
glycopolymeric hydrogels, commercially available crosslinking agents with non-
sugar residue are being used.138c It was Dordick and coworkers who demonstrated
for the first time a chemoenzymatic method for the synthesis of sugar containing
polyacrylate hydrogels.138d To the best of our knowledge there exists only one
report on the chemical synthesis of a sugar based cross linker i.e.,

Chapter 4
101
bis(methacrylamido) derivative of D-glucose 1 (Figure 4.1). The utility of 1 to
form hydrogel has been tested successfully by synthesizing PHEMA based
biocompatible hydrogel.138c
Citing the significance of glycopolymeric hydrogels and the relevance of having a
sugar based crosslinker, we here by describe the synthesis of a D-glucose based
bisacrylamide cross linker substituted at C-3 and C-6 carbon of sugar (Glc-bis)
2a, (Figure 4.1) with hemiacetal functionality. To check the feasibility of Glc-bis
to form homogeneous glycopolymeric gel (Glc-gel), a related monoacrylamide
substituted at C-6 position (Glc-acryl) 2b was also synthesized and their gelation
was studied using radiation polymerization. The targets selected are also
interesting by the fact that D-glucose derived polymers substituted at C-6 position
showed specific binding to the asialoglycoprotein receptor of mouse primary
hepatocytes.139
The synthesized Glc-bis and Glc-acryl were characterized by 1H and 13C-NMR.
The molecular structure, water content, viscoelasticity, thermal stability,
cytotoxicity and lectin recognition of the synthesized hydrogels (Glc-gel) were
studied using the techniques like Fourier Transform Infra-Red (FT-IR)

Chapter 4
102
spectroscopy, oscillatory rheology, Thermogravimetric-Differential Scanning
Calorimetric (TG-DSC) analysis, MTT assay and UV-vis spectroscopy.
4.2. Experimental
The details of synthesis procedures followed for achieving the required
intermediates and targets are given below.
4.2.1. 3-Azido-3-deoxy-5-hydroxy-1,2-O-isopropylidene-6-O-tosyl--D-gluco-
furanose (4).
To a stirred solution of the azido diol 3 (3.50 g, 14.27 mmol) and pyridine (1.38
mL, 17.12 mmol) in CH2Cl2 (50 mL) at 0 oC, was added tosyl chloride (2.91 g,
15.27 mmol) dissolved in CH2Cl2 (15 mL) dropwise and DMAP (4-Dimethyl
aminopyridine) (0.08 g, 0.71 mmol). The reaction mixture was stirred at same
temperature for 1 h, slowly brought to 25 ºC and stirred for additional 2 h. After
completion of reaction (cf. TLC), water (50 mL) was added and extracted with
CH2Cl2 (100 mL). The organic layer was washed, sequentially, with cold 1N HCl
(2 x 20 mL), saturated NaHCO3 (1 x 20 mL), brine (1 x 20 mL), water (1 x 50
mL), and dried over anhydrous Na2SO4. Filtration and evaporation in vacuum
gave a residue, which on column chromatography afforded 4 (4.96 g, 87%) as a
thick liquid: Rf = 0.48 (30% EtOAc/hexane); []25
D 7.27 (c 1.1, CHCl3);
max
/cm-1
1176, 1367; δH(600 MHz; CDCl3) 7.81 (d, J = 8.2 Hz, 2H), 7.36 (d, J =
8.2 Hz, 2H), 5.81 (d, J = 3.4 Hz, 1H), 4.61 (d, J = 3.4 Hz, 1H), 4.31 (d, J = 8.8
Hz, 1H), 4.17 (s, 1H), 4.11 – 4.07 (m, 3H), 2.74 (d, J = 3.7 Hz, 1H, exchangeable

Chapter 4
103
with D2O), 2.46 (s, 3H), 1.47 (s, 3H), 1.31 (s, 3H) (Figure 4.2); δC(50 MHz;
CDCl3) 145.8, 132.9, 130.7, 128.7, 113.1, 105.6, 83.8, 78.1, 73.1, 68.2, 66.8,
27.2, 26.9, 22.3 (Figure 4.3). Elemental Analysis Calculated for C16H21N3O7S: C,
48.11; H, 5.30. Found: C, 48.15; H, 5.37; ESI-MS: Calculated for [C16H21N3O7S+
Na]+: 422.01 Da, Observed: 421.85 Da.
4.2.2. 3,6-Diazido-3,6,-dideoxy-5-hydroxy-1,2-O-isopropylidene--D-gluco-
furanose (5).
Sodium azide (1.83 g, 28.25 mmol) was added to a solution of tosylate (4) (4.51
g, 11.29 mmol) in DMF (20 mL) and heated at 80 oC for 3 h. After completion of
reaction (cf. TLC), DMF was removed under vacuo, and the residue was extracted
with EtOAc (3 x 50 mL). The combined organic layer was dried over anhydrous
Na2SO4, concentrated and purified using column chromatography to give diazide
(5) as a thick liquid (2.63 g, 86%): Rf = 0.49 (25% EtOAc/hexane); []25
D 40.05
(c 1.2, CHCl3); max
/cm-1
2100; δH(700 MHz; CDCl3) 5.87 (d, J = 3.5 Hz, 1H),
4.65 (d, J = 3.5 Hz, 1H), 4.12 – 4.17 (m, 2H), 4.03 – 3.96 (m, 1H), 3.67 (dd, J =
12.6, 2.8 Hz, 1H), 3.51 (dd, J = 12.6, 6.3 Hz, 1H), 2.38 – 2.32 (m, 1H,
exchangeable with D2O), 1.51 (s, 3H), 1.33 (s, 3H) (Figure 4.4.); δC(176 MHz,
CDCl3) 113.1, 105.6, 83.9, 79.8, 69.3, 66.8, 55.5, 27.2, 26.8 (Figure 4.5). Elem.
Anal. Calcd. for C9H14N6O4: C, 40.00; H, 5.22. Found: C, 40.07; H, 5.18.

Chapter 4
104

Chapter 4
105

Chapter 4
106
4.2.3. 3,6-Bisacrylamido-3,6,-dideoxy-5-hydroxy-1,2-O-isopropylidene--D-
gluco-furanose (6).
To a solution of diazido alcohol (5) (2.45 g, 9.06 mmol) in MeOH (30 mL), was
added 10% Pd/C (0.17 g) and hydrogenated (80 psi) for 12 h at 25 ºC. The
catalyst was filtered through a pad of Celite 545 using MeOH (4 x 10 mL). The
filterate was concentrated and dried under vaccum. The vaccum dried diamine
was dissolved in CH2Cl2 (35 mL) and DIEA (Diisopropylethylamine) (7.89 mL,
45.30 mmol), cooled to 40 oC, acryloyl chloride (1.64 mL, 20.11 mmol) was
added and stirred at same temperature for 20 min. After completion of reaction
(cf. TLC), reaction mixture was diluted with cold water (5 mL), and extracted
using CH2Cl2 (3 x 30 mL). The combined organic layer was kept over anhydrous
Na2SO4, concentrated under vacuo, and purified using column chromatography to
afford (6) as a thick liquid (2.36 g, 79% (over two steps)): Rf = 0.15 (80%
EtOAc/hexane); []25
D 90.35 (c 1.50, CHCl3); max
/cm-1
1685, 1665, 1551; δH(600
MHz; CD3OD) 7.85 (s, 1H, exchangeable with D2O), 6.30 – 6.12 (m, 4H), 5.84
(d, J = 3.6 Hz, 1H), 5.66 (dd, J = 8.4, 3.5 Hz, 1H), 5.59 (dd, J = 10.1, 1.8 Hz, 1H),
4.48 (d, J = 3.6 Hz, 1H), 4.43 (d, J = 3.3 Hz, 1H), 3.98 (dd, J = 8.6, 3.3 Hz, 1H),
3.70 – 3.62 (m, 2H), 3.27 (s, 1H, exchangeable with D2O), 3.15 (dd, J = 14.4, 8.6
Hz, 1H), 1.44 (s, 3H), 1.26 (s, 3H) (Figure 4.6); δC(126 MHz; CD3OD) 167.1,
167.0, 130.6, 129.9, 126.7, 125.5, 111.7, 104.7, 84.0, 79.8, 67.2, 55.8, 42.9, 25.5,
25.1(Figure 4.7). Elem. Anal. Calcd. for C15H22N2O6: C, 55.21; H, 6.79. Found:

Chapter 4
107
C, 55.19; H, 6.85; ESI-MS: Calcd. for [C15H22N2O6+ Na]+: 349.12 Da, Obsd:
348.98 Da.

Chapter 4
108
4.2.4. (2R,3S,4S,5S)-4-acrylamido-6-(acrylamidomethyl)-tetrahydro-2H-Pyran-
2,3,5-triol (Glc-bis, 2a)
A pre-cooled solution of TFA-H2O (3:2, 10 mL) was added dropwise to a RB
flask charged with bisacrylamide 6 (1.30 g, 3.98 mmol) (synthesized as shown in
scheme 4.1) at 0 oC. The reaction mixture was stirred at same temperature for 30
min, slowly brought to 25 oC and stirred for additional 10 h. After completion of
reaction (cf. TLC) TFA was evaporated along with toluene and dried under
vaccum. The residue was precipitated using dry EtOAc (20 mL) and washed well
with EtOAc (5 x 10 mL). The residue was vaccum dried, redissolved in double
distilled water, filtered through Millex (25 mm, 5 µm) and lyophilized to afford
bisacrylamide 2a as a white amorphous powder (0.78 g, 68%). In the 1H NMR
spectrum of 2a (Figure 4.8) the anomeric protons H1e and H1a appeared as two
distinct doublets at 5.27 and 4.76 with J1e,2a = 3.6 Hz, and J1a2a = 7.8 Hz,
respectively. The three sets of multiplets at δ 6.41 – 6.31, 6.29 – 6.21, and 5.88 –
5.78 were due to protons attached to the olefinic carbons. The 13C NMR spectrum
confirmed the presence of two amide bonds with the appearance of peaks at δ
169.5, 168.8, while peaks at δ 129.9, 129.7, 127.7, 127.5, accounted for four
olefinic carbons of the bisacrylamide moiety (Figure 4.9).
4.2.5. {[1,2,],[5,6]}-Di-O-isopropylidene-3-O-tert-butyldiphenylsilyl--D-gluco-
furanose (8)
To a cooled (0 oC) solution of diacetone D-glucose (7) (5.00 g, 19.21 mmol) and
imidazole (2.61 g, 38.42 mmol) in DMF (25 mL) was added TBDPSCl (tert-butyl

Chapter 4
109
(chloro) diphenyl silane) (6.16 mL, 24.01 mmol) dropwise, followed it with
DMAP (N,N-Dimethyl amino pyridine) (0.12 g, 0.96 mmol). The reaction mixture
was slowly brought to 30 oC, and stirred for additional 24 h. After the completion
of reaction (cf. TLC), DMF was evaporated under pressure and then extracted
using EtOAc (200 mL) afforded a thick residue which on coloumn purification
afforded (8) as a thick liquid (8.30 g, 86%): Rf = 0.55 (10% EtOAc/hexane);
[] 25
D 10.08 (c 1.0, CHCl3); max
/cm-1
1211, 1093; δH(600 MHz; CDCl3) 7.98 –
7.64 (m, 4H), 7.52 – 7.32 (m, 6H), 5.81 (d, J = 3.2 Hz, 1H), 4.48 – 4.42 (m, 2H),
4.19 – 4.15 (m, 1H), 4.06 (d, J = 3.1 Hz, 1H), 4.05 – 3.97 (m, 2H), 1.42 (s, 3H),
1.39 (s, 3H), 1.33 (s, 3H), 1.09 (s, 9H), 1.08 (s, 3H) (Figure 4.10); δC(176 MHz;
CDCl3) 136.7, 136.4, 134.7, 133.2, 130.6, 130.2, 128.5, 128.3, 112.3, 109.8,
105.7, 85.2, 83.2, 77.3, 72.9, 68.6, 27.6, 27.5, 27.3, 26.7, 25.9, 20.1 (Figure 4.11).
Elem. Anal. Calcd. for C28H38O6Si: C, 67.44; H, 7.68. Found: C, 67.47; H, 7.62.

Chapter 4
110

Chapter 4
111

Chapter 4
112
4.2.6. 5,6-Dihydroxy-1,2-O-isopropylidene-3-O-tert-butyldiphenylsilyl--D-
gluco-furanose (9)
30% Perchloric acid (8 mL) was slowly added to a solution of (8) (8.00 g, 16.04
mmol) in THF (20 mL) at 0 oC. The reaction mixture was stirred at same
temperature until it showed complete conversion (cf. TLC), neutralized using
K2CO3 (saturated) solution, concentrated, and extracted using EtOAc (3 x 50 mL).
The combined organic layer was dried over anhydrous Na2SO4, concentrated, to
afford a thick liquid which was purified using column chromatography to yield
diol (9) as a white solid (5.72 g, 77%): Mp 120 oC; Rf = 0.30 (30%
EtOAc/hexane); [] 25
D 17.50 (c 1.1, CHCl3); max
/cm-1
3355br, 1227, 1064;
δH(700 MHz; CDCl3) 7.73 (d, J = 7.7 Hz, 2H), 7.68 (d, J = 7.7 Hz, 2H), 7.47 (t, J
= 7.3 Hz, 2H), 7.42 (t, J = 7.3 Hz, 4H), 5.84 (d, J = 3.5 Hz, 1H), 4.48 (s, 1H), 4.28
(d, J = 3.5 Hz, 1H), 4.06 – 3.97 (m, 2H), 3.88 – 3.78 (m, 1H), 3.73 (dd, J = 11.2,
5.3 Hz, 1H), 1.67 – 1.61 (m, 2H, exchangeable with D2O), 1.40 (s, 3H), 1.14 (s,
3H), 1.10 (s, 9H) (Figure 4.12); δC(176 MHz; CDCl3) 136.5, 136.4, 134.5, 133.2,
130.9, 130.8, 128.7, 128.6, 112.4, 105.5, 85.1, 81.9, 77.4, 69.2, 65.2, 27.7, 27.3,
26.7, 20.2 (Figure 4.13). Elem. Anal. Calcd for C25H34O6Si: C, 65.47; H, 7.47.
Found: C, 65.44; H, 7.45; ESI-MS: Calcd. for [C25H34O6Si + Na]+: 481.19 Da,
Obsd: 481.02 Da.

Chapter 4
113
4.2.7.6-Azido-6-deoxy-5-hydroxy-1,2-O-isopropylidene-3-O-tert
butyldiphenylsilyl--D-gluco-furanose (10)
To a solution of diol (9) (5.52 g, 12.03 mmol) in CH2Cl2 (60 mL) at 0 oC was
added triethyl amine (TEA) (2.01 mL, 14.42 mmol) followed it with dropwise
addition of methane sulfonyl chloride (0.98 mL, 12.63 mmol) in CH2Cl2 (15 mL)
over 30 min. The reaction was stirred at same temperature for 1 h, then brought to
25 oC and stirred for additional 1 h. The reaction was quenched using cold water
(20 mL) and extracted using CH2Cl2 (3 x 25 mL). The combined organic layers
were dried over anhydrous Na2SO4, concentrated and dried under vacuum to
afford mesylate (crude) as a thick liquid. To the solution of mesylate (crude) in
DMF (25 mL), was added sodium azide (5.47 g, 84.21 mmol) and heated at 70-80
oC for 3 h. The usual workup and column purification afforded azide (10) (3.10 g,
53%) as a thick liquid: Rf = 0.70 (20% EtOAc/hexane); []25
D 22.25 (c 1.1,
CHCl3); max
/cm-1
2098, 1215, 1093; δH(700 MHz; CDCl3) 7.74 (d, J = 7.7 Hz,
2H), 7.70 (d, J = 7.7 Hz, 2H), 7.48 – 7.45 (m, 2H), 7.44 – 7.39 (m, 4H), 5.90 (d, J
= 3.5 Hz, 1H), 4.48 (d, J = 3.5 Hz, 1H), 4.32 (t, J = 2.7 Hz, 1H), 4.22 (q, J = 4.7
Hz, 1H), 4.12 – 4.08 (m, 1H), 3.40 (dd, J = 12.8, 4.8 Hz, 1H), 3.33 (dd, J = 12.8,
4.0 Hz, 1H), 3.19 (d, J = 3.5 Hz, 1H, exchangeable with D2O), 1.49 (s, 3H), 1.31
(s, 3H), 1.09 (s, 9H) (Figure 4.14); δC(176 MHz; CDCl3) 136.4, 136.3, 134.2,
133.1, 131.0, 130.9, 128.8, 128.7, 112.5, 105.6, 85.2, 81.7, 77.1, 68.5, 55.5, 27.7,

Chapter 4
114
27.4, 26.8, 20.1 (Figure 4.15). Elem. Anal. Calcd. for C25H33N3O5Si: C, 62.09; H,
6.88. Found: C, 62.15; H, 6.93.

Chapter 4
115

Chapter 4
116
4.2.8. 6-Acrylamido-6-deoxy-5-hydroxy-1,2-O-isopropylidene-3-O-tert-
butyldiphenylsilyl--D-gluco-furanose (11)
The hydroxyl azide (10) (3.30 g, 6.82 mmol) was subjected to hydrogenation
(10% Pd/C (0.20 g), H2 (20 psi), 5 h) and acrylation ( acryloyl chloride (0.58 mL,
7.17 mmol), DIEA (1.42 mL, 8.18 mmol) sequentially, as mentioned earlier for
the synthesis of bisacrylamide (6), to afford acrylamide (11) as a thick liquid
(2.90 g, 83% (over two steps)): Rf = 0.20 (30% EtOAc/hexane); []25
D +24.21 (c
1.2, CHCl3); max
/cm-1
3490br, 1680; δH(700 MHz; CDCl3) 7.76 – 7.74 (m, 2H),
7.70 – 7.67 (m, 2H), 7.48 – 7.42 (m, 2H), 7.40 (q, J = 7.2 Hz, 4H), 6.34 – 6.29
(m, 1H), 6.19 (s, 1H, exchangeable with D2O), 6.13 (dd, J = 17.0, 10.3 Hz, 1H),
5.80 (d, J = 3.4 Hz, 1H), 5.69 (dd, J = 10.3, 1.1 Hz, 1H), 4.50 (d, J = 2.2 Hz, 1H),
4.14 – 4.11 (m, 2H), 3.84 (ddd, J = 14.4, 6.1, 2.7 Hz, 1H), 3.79 (bs, 1H), 3.46 (dt,
J = 14.4, 6.1 Hz, 1H), 1.61 (s, 1H, exchangeable with D2O), 1.36 (s, 3H), 1.09 (s,
12H) (Figure 4.16); δC(176 MHz; CDCl3) 168.6, 136.7, 136.4, 134.8, 133.1,
130.9, 130.8, 130.7, 128.7, 128.6, 127.9, 112.3, 105.5, 85.1, 82.6, 77.1, 69.1, 45.5,
27.6, 27.5, 26.8, 20.2 (Figure 4.17). Elem. Anal. Calcd. for C28H37NO6Si: C,
65.72; H, 7.29; Found: C, 65.75; H, 7.36; ESI-MS: Calcd. for [C28H37NO6Si +
Na]+: 534.22 Da, Obsd: 534.09 Da.

Chapter 4
117
4.2.9. 6-Acrylamido-6-deoxy-3,5-dihydroxy-1,2-O-isopropylidene--D-gluco-
furanose (12)
To a solution of acrylamide (11) (1.00 g, 1.93 mmol) in THF at 0 oC was added
TBAF (Tetra-n- butyl ammonium fluoride) (1M in THF) (2.51 mL, 2.51 mmol).
The reaction mixture was stirred for 1.5 h and brought to 30 oC. After completion
of reaction (cf. TLC) the reaction mixture was concentrated under vaccum, and
extracted using EtOAc (6 x 20 mL). The resultant thick liquid, was purified using
coloumn chromatography to afford the diol (12) as a thick liquid (0.44 g, 83 %):
Rf = 0.25 (EtOAc); [] 25
D 4.00 (c 1.1, MeOH); max
/cm-1
3500br, 1687, 1671,
1545; δH(600 MHz; CD3OD) 6.34 – 6.19 (m, 2H), 5.87 (d, J = 2.1 Hz, 1H), 5.65
(d, J = 10.0 Hz, 1H), 4.47 (s, 1H), 4.20 (s, 1H), 3.98 – 3.90 (m, 2H), 3.68 (d, J =
13.9 Hz, 1H), 3.32 – 3.27 (m, 2H), 1.44 (s, 3H), 1.29 (s, 3H) (Figure 4.18); δC(176
MHz; CD3OD) 167.4, 130.7, 125.4, 111.3, 105.1, 85.6, 81.4, 73.9, 67.3, 43.4,
25.7, 25.0 (Figure 4.19). Elem. Anal. Calcd. for C12H19NO6: C, 52.74; H, 7.01.
Found: C, 52.81; H, 6.97; ESI-MS: Calcd. for [C12H19NO6 + Na]+: 296.10 Da,
Obsd: 295.92 Da.

Chapter 4
118

Chapter 4
119

Chapter 4
120
4.3.0. N-(((3S,4S,5S,6R)-tetrahydro-3,4,5,6-tetrahydroxy-2H-pyran-2-yl)methyl)
acrylamide (Glc-acryl, 2b)
A pre-cooled solution of TFA-H2O (3:2, 10 mL) was added dropwise to RB
charged with acrylamide 12 (1.30 g, 4.75 mmol) (synthesized as shown in
Scheme 4.2) at 0 oC. The reaction mixture was stirred at same temperature for 30
min, slowly brought to 25 oC and was stirred for additional 10 h. After completion
of reaction (cf. TLC) the reaction was worked up as mentioned for the synthesis
of bisacrylamide 2a to get 2b as a white amorphous powder (0.73 g, 66%). In the
1H NMR anomeric protons of 2b (Figure 4.20), H1e and H1a, appeared as two
doublets at 5.20 and 4.62 with J1e2a = 3.6 Hz and J1a2a = 7.0 Hz, respectively.
The multiplets at δ 6.61 – 6.42, and 5.85 – 5.73 accounted for three olefinic
protons of acrylamide functionality. In the 13C NMR spectrum, the peak appeared

Chapter 4
121
at δ 168.9 was due to the amide functionality and the peaks at δ 129.6, 127.6 were
attributed to olefinic carbons of the monoacrylamide 2b (Figure 4.21).
4.3.1. Preparation of Glc-gel
The aqueous solutions of 2a and 2b prepared in different compositions were
irradiated upto 29.5 KGy in Co-60 -source (dose rate 1.23 KGy/h), under
ambient conditions. The synthesized gels were washed thoroughly with deionized
water and vacuum dried at 40 oC to constant weight. These dried gels were used
for different studies.
4.3.2. Characterization of the hydrogels
4.3.2.1. Swelling kinetics and equilibrium degree of swelling
The swelling studies were carried out gravimetrically by immersing the dried
hydrogel discs of known weight in 50 mL of double distilled water at 25 oC. The
hydrogel discs were removed from water at regular intervals and weighed after

Chapter 4
122
wiping off the free water on the surface with tissue paper. After weighing, the
samples were replaced into the same aqueous medium. The samples were swollen
and reweighed until they attained a constant weight. The percentage of swelling at
time‘t’ (%S) of the swollen hydrogels was calculated using the relation (4.1):
Where, Wt is the weight of swollen gel at time‘t’ while Wd is the weight of dried
gel. The values reported are average of three repeated experiments.
The percentage equilibrium degree of swelling (%EDS) of the gel was calculated
using the relation (4.2):
Where, We is the weight of the gel at equilibrium swollen state.
4.3.2.2. Dynamic rheological analysis
All the dynamic measurements were performed in the linear viscoelastic region.
Viscoelastic properties were measured in 0.1–100 Hz frequency range at a
constant deformation strain (5%).
4.3.2.3. Thermal Analysis of Glc-gel
Thermogravimetric analysis (TGA)
About 5–10 mg of the dried hydrogel samples were heated in an alumina crucible
and the thermogravimetric profiles were recorded from 25 to 900 °C, at a scan

Chapter 4
123
rate of 10 °C/min, under nitrogen atmosphere, with a flow rate of 50 mL/min. The
weight loss profiles of the hydrogel samples were studied from the thermogram.
Differential Scanning Calorimetry (DSC)
The biomedical and pharmaceutical activity of the hydrogel is decided by the
manner in which the water molecules are associated with the polymer in the
matrix. It is well established that water exists in three different physical states in
polymeric networks: free water, freezing bound water and non-freezing bound
water. The composition of different states of water in the hydrogel matrix can be
determined by DSC analysis. For this the vaccum dried hydrogel samples were
brought to equilibrium swollen state and then sealed in aluminium crucibles.
These samples were initially subjected to a cooling run from 30 oC to 50 oC and
then a heating run from 50 oC to 40 oC at a rate of 5 oC/min in nitrogen
atmosphere. The fractions of the freezing water (free water and freezing bound
water (Wf)) within the hydrogels were calculated from the area under the
endothermic melting peak (∆Hm) during the heating run and heat of fusion of pure
water (∆Hw = 333.3 J/g) according to the relation (4.3):140
Non-freezing bound water content (Wnf) was determined by subtracting Wf from
the equilibrium water content of the hydrogel (W∞) (relation (4.4)), which can be

Chapter 4
124
calculated from the fraction of equilibrium degree of swelling (EDS) of the
corresponding hydrogel using the relation (4.5).
4.3.3. In vitro cell cytotoxicity test
The cell lines INT407 (human intestinal epithelial cell line) and L929 (mouse
fibroblast cell line) were obtained from National Centre for Cell Sciences
(NCCS), Pune, India. The cells were grown in DMEM medium with 10% fetal
bovine serum, penicillin (100 U/mL) and streptomycin (100 µg/mL). Both the
qualitative and quantitative in vitro cytotoxicity studies towards the test samples,
were performed, respectively by microscopically observing the growth of the cells
and by MTT, (3-[4,5-dimethylthiazol-2-yl]-2,5 diphenyl tetrazolium bromide)
assay. In the former 15,000 cells were plated per well in a 24 well plate and
allowed to adhere overnight. The test samples Glc-acryl, Glc-bis and Glc-gel
(obtained directly after gamma irradiation) were added to the appropriate wells
next day. Photograph of the cells were taken at regular intervals employing an
inverted microscope with an attached camera (Leica EC3 type, Switzerland) at
40X magnification. In the MTT assay the procedure mentioned above was
followed and at the end of 48 h of incubation with the test samples, the number of
viable cells in each well was quantified by incubation with MTT (0.5 mg/mL) for

Chapter 4
125
4 h, followed by solubilisation buffer (10% SDS in 0.01 N HCl) overnight. The
plate was read in a plate reader at 550 nm. In both the experiments the samples
were in triplicates and each experiment was conducted twice.
4.3.4. Lectin recognition studies
The interaction of Glc-gel with lectin Con A and BSA was studied by measuring
the absorbance at λ = 420 nm and 278 nm, respectively, of the corresponding
buffer solution before and after treatment with the hydrogel.
4.4. Results and Discussion
4.4.1. Synthesis of Glc-bis (2a)
In the synthesis, as shown in Scheme 4.1, easily available and cost effective
monosaccharide D-glucose was transformed to azidodiol 3 as reported before.141
Selective tosylation of primary hydroxyl group in 3, using TsCl and pyridine,
afforded monotosylated product 4 in 87% yield. Heating tosylate 4 with sodium
azide in DMF furnished the desired diazide 5 in 86% yield. In the next step, both
azide groups in 5 were reduced to diamine under hydrogenation condition which,
without purification, was subjected to acrylation using acryloyl chloride and
DIEA in CH2Cl2 at 40 oC to obtain bisacrylamide 6 as a thick liquid. Unmasking
of 1,2-hydroxyl group in 6 using TFA-H2O (3:2) afforded the required fully
unprotected Glc-bis 2a in 68% yield (8% overall yield from azido diol 3).

Chapter 4
126
The Glc-bis 2a is the only sugar based crosslinker wherein, two hydroxyl groups
in the sugar ring are substituted with bis-reactive site in the form of bisacrylamide
with the hemiacetal functionality intact, which could find usefulness in further
functionalization to make materials of different properties.
4.4.2. Synthesis of Glc-acryl (2b)
In order to study and understand the ability of 2a to function as crosslinker for the
synthesis of Glc-gel it is required to have a suitable glycomonomer. Most of the
known sugar based monomers have the active group (olefinic) located at the
secondary carbon.142 Since the distance of the sugar pendent from the carbon
chain frame work is also an important factor for the glycopolymer to show
affinity to lectins, we thought of synthesizing a new C-6 acrylamide derivative of
D-glucose, which would place the sugar residue at an optimum distance from the
main skeleton without using a spacer.140

Chapter 4
127
Thus, as shown in scheme 4.2, C-3 hydroxyl functionality in 7 141a was protected
using TBDPS to yield fully protected furanose 8. The 5, 6-acetonide in 8 was
selectively deprotected using 30% HClO4 in THF to furnish the diol 9 in 77%
yield. Mono mesylation of 1o hydroxyl group in diol 9 followed by heating of the
resultant mesylate with sodium azide in DMF afforded the azido compound 10 in
53% yield (over two steps). The azide 10 was reduced and acrylated vide infra to
afford the monoacrylamide 11 in 83% yield, (over two steps). Further,
deprotection of TBDPS group in 11 using TBAF in THF yielded the azido diol 12
in 83% yield. Finally, deketalization of monoacrylamide 12 using TFA-water
generated the Glc-acryl 2b in 66% yield. 1H NMR studies of 2a revealed the
predominance of -anomer over -anomer, due to anomeric effect, however the

Chapter 4
128
ratio didn’t differ (55:45) too much, largely due to the possible H-bonding144
between anomeric hydroxyl group and ring oxygen, as shown in Figure 4.22.
However, in the case of 2b 1H NMR confirmed the formation of -anomer as the
major product with to ratio as 45:55. Glc-acryl and Glc-bis thus obtained were
dissolved in water (in suitable proportions) and irradiated with -source at a
radiation dose of 29.5 KGy to yield transparent Glc-gel (Scheme 4.3 and Figure
4.23).
Scheme 4.3: Synthesis of D-glucose derived glycopolymeric hydrogel
Figure 4.23: Photograph of (A) freeze dried Glc-gel (B) swollen Glc-gel formed
by radiation induced polymerization.

Chapter 4
129
4.4.3. FT-IR analysis
Figure 4.24 shows the FT-IR spectra of Glc-bis (B) and Glc-acryl (C) in the
powder form and also of the dry Glc-gel (A). The characteristic peaks of Glc-
acryl are slightly broadened due to the hygroscopic nature of the material. The
typical peaks of amide I (~1651 cm-1) and amide II (~1552 cm-1) in the monomer
(Glc-acryl) and the crosslinker (Glc-bis) remains unaffected in the polymerized
dry gel. The peak attributed to CH=CH2 group (~1640 cm-1) in the FT-IR spectra
of Glc-acryl and Glc-bis, disappeared in the polymerized gel. This observation
suggest that the polymerization has taken place via the C=C groups in the Glc-
acryl and the Glc-bis.145
Figure 4.24: FT-IR spectrum of (A) dried Glc-gel, (B) Glc-bis and (C) Glc-acryl
powder.

Chapter 4
130
4.4.4. Swelling studies
The rate of swelling (Figure 4.25) was found to decrease with the increase in Glc-
bis concentration in the hydrogel. This is because as the Glc-bis concentration
increases the rigidity of the hydrogel increases and hence the degree of freedom
between the chains decreases. Therefore, the polymeric network swells up slowly
as compared to the gel with less concentration of Glc-bis. The %EDS (Table in
figure 4.25.) calculated using relation 2 shows that the equilibrium swelling is
dependent on the Glc-bis content.
Figure 4.25: The effect of Glc-bis concentration on the rate of swelling of the
Glc-gel (8% w/v Glc-acryl at radiation dose of 29.5 KGy) (left). Variation in
%EDS at different Glc-bis concentration in the hydrogel formed with, 8% w/v
Glc-acryl at radiation dose of 29.5 KGy (right).

Chapter 4
131
4.4.5. Effect of Glc-bis concentration on viscoelastic properties
In order to evaluate the effect of crosslinker concentration on the viscoelastic
response, the hydrogels derived from different Glc-bis compositions at 8% w/v
Glc-acryl and a radiation dose of 29.5 KGy, were used to investigate the
viscoelastic parameters in the linear viscoelastic range. The complex viscosity *
is given by the relation (4.6)146a:
Wherein, G' = storage modulus (elastic component) (Pa), G" = loss modulus
(viscous component) (Pa)
ω = angular frequency (rad/sec), η' = Dynamic viscosity (Pa-sec) and η" = in
phase component of dynamic viscosity (Pa-sec).
The complex viscosity (η*) was found to increase with increase in Glc-bis
concentration at a fixed Glc-acryl concentration (8% w/v). This indicates the rise
in gel strength with crosslinker content. At low frequencies, the rate of molecular
rearrangement exceeds the rate of oscillation, hence the entanglement of polymer
chains can occur easily during long period of oscillation. However, it was
observed that during the frequency sweep the value of complex viscosity
decreases with increasing frequency, which could be due to the faster oscillation
rate than the rate for entanglement of polymer chains (Figure 4.26).146 Figure 4.26
also represents the variation of G' with oscillatory frequency. All the Glc-gels

Chapter 4
132
(measured) exhibits a plateau in the range 0.110 Hz, which indicates a stable,
strong crosslinked gel network. At higher frequencies, all gels showed an increase
in G', with the rate of increase highest for the gel with lowest crosslinker
concentration (0.1% Glc-bis) and that lowest for the gel with highest crosslinker
concentration (0.3% Glc-bis). The loss modulus (G") also exhibited a similar
behavior. This is because the magnitude of the viscoelastic response of a
polymeric network depends on length of the flexible polymer chains and the
nature of the imposed mechanical motion.
0.01
0.1
1
10
100
Pa
G'
1 10 100%
Strain
Anton Paar GmbH
0.3% Glc-bis
Shear Stress
G' Storage Modulus
0.2% Glc-bis
Shear Stress
G' Storage Modulus
0.1% Glc-bis
Shear Stress
G' Storage Modulus

Chapter 4
133
10-1
100
101
102
103
Pa·s
| *|
100
101
102
103
Pa
G'
G''
0.1 1 10 1001/s
0.1% Glc-bis
| *| Complex Viscosity
G' Storage Modulus
G'' Loss Modulus
0.2% Glc-bis
| *| Complex Viscosity
G' Storage Modulus
G'' Loss Modulus
0.3% Glc-bis
| *| Complex Viscosity
G' Storage Modulus
G'' Loss Modulus
Figure 4.26: Effect of Glc-bis concentration on the complex viscosity of
hydrogels at 37 oC at varying angular frequency.
The relaxation times are longer for longer polymeric chains, which depend on the
crosslinker content. In the case of less crosslinked networks the polymeric chain
segments between the crosslinks are longer, which gives lower molecular motion
frequencies than those arising from highly crosslinked networks. This implies
that, at higher frequencies, long chains fail to rearrange themselves at the imposed
time scale and they assume more stiff and 'solid- like ' behavior which is
characterized by a sharp increase in G' in this region.147 In other words, for highly
crosslinked networks even higher applied frequencies are required for a similar
response which is the reason for gradual rise in G' in case of Glc-gel with 0.3%
Glc-bis concentration.

Chapter 4
134
4.4.6. Thermogravimetric analysis
The thermal degradation profiles of the dried hydrogels at various Glc-bis
concentrations (0.1, 0.2, 0.3% w/v) and Glc-acryl concentrations (4, 6, 8, and 10%
w/v) at a radiation dose of 29.5 KGy, were studied and were found to be similar.
A typical degradation profile is shown in figure 4.27.
Figure 4.27: Thermal degradation profile of a typical vaccum dried Glc-gel
Degradation takes place in two different steps, first step from 180-320 oC and
second step from 370-520 oC, which is characteristic of glycopolymers.145 The
effect of Glc-acryl concentration on the thermal stability of Glc-gels, is shown in
figure 4.28. From the percentage weight loss at 900 oC we can deduce that the
gels with higher Glc-bis to Glc-acryl ratio are thermally more stable. Thus, the
thermal stability of Glc-gel decreases with increase in Glc-acryl concentration
keeping all other factors constant, due to the decrease in crosslinking density of
the hydrogel.
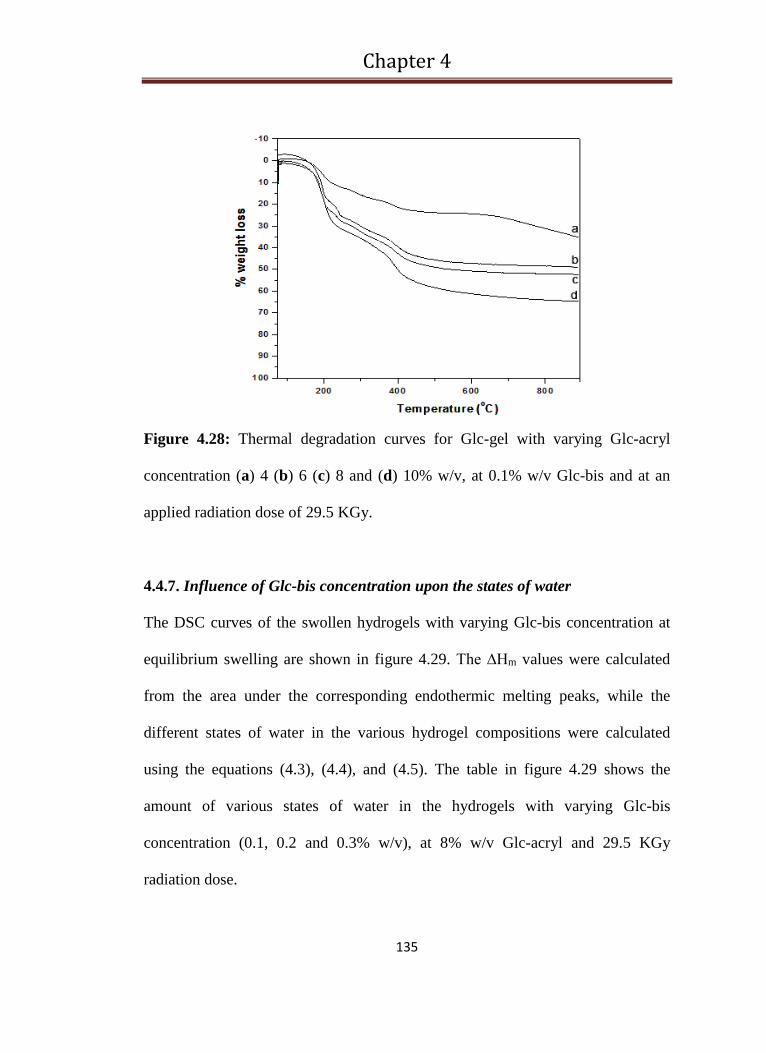
Chapter 4
135
Figure 4.28: Thermal degradation curves for Glc-gel with varying Glc-acryl
concentration (a) 4 (b) 6 (c) 8 and (d) 10% w/v, at 0.1% w/v Glc-bis and at an
applied radiation dose of 29.5 KGy.
4.4.7. Influence of Glc-bis concentration upon the states of water
The DSC curves of the swollen hydrogels with varying Glc-bis concentration at
equilibrium swelling are shown in figure 4.29. The ∆Hm values were calculated
from the area under the corresponding endothermic melting peaks, while the
different states of water in the various hydrogel compositions were calculated
using the equations (4.3), (4.4), and (4.5). The table in figure 4.29 shows the
amount of various states of water in the hydrogels with varying Glc-bis
concentration (0.1, 0.2 and 0.3% w/v), at 8% w/v Glc-acryl and 29.5 KGy
radiation dose.

Chapter 4
136
Figure 4.29: DSC curves for determination of states of water in the Glc-gel with
varying Glc-bis concentration.
It was observed that the amount of freezing water (Wf) and non-freezing water
(Wnf) was almost same at all the studied Glc-bis concentrations.
4.4.8. Influence of Glc-acryl concentration upon states of water
States of water in the hydrogels were also determined with varying Glc-acryl
concentration. It was observed that with an increase in Glc-acryl concentration the
amount of freezing water increased, while the proportion of non-freezing water
decreased (Figure 4.30). This suggests that the water absorbed by the Glc-gel,
with high Glc-acryl concentration, is slightly structured with its freezing
occurring in a temperature range close to that of pure water.

Chapter 4
137
Figure 4.30: DSC curves for determination of states of water in the Glc-gel with
varying Glc-acryl concentration.
This could be due to the lower crosslinking density with the increase in Glc-acryl
content. Hence unlike Glc-bis the variation in Glc-acryl concentration could
decide the amount of various states of water in Glc-gel.
4.4.9. In vitro cytotoxicity of Glc-acryl, Glc-bis and Glc-gel
The in vitro cytotoxicity of Glc-acryl, Glc-bis and Glc-gel were evaluated
qualitatively and quantitatively.148 At a concentration of 1 mg/mL of Glc-acryl
and Glc-bis as well as Glc-gel (20 mg) did not exhibit any toxicity to both the cell
lines tested while 1 µM Staurosporine killed both the cell lines completely. As is
evident from the figures 4.31, both the cell lines grew normally in the presence of

Chapter 4
138
the test materials without any reduced growth or cell death when observed under a
microscope.
Unt
reat
ed
0.25
0.50
1.00
0.25
0.50
1.00
Glc
-gel
Sta
uros
porine
0.0
0.1
0.2
0.3
0.4
0.5
0.6
0.7
0.8
0.9
1.0
1.1
Glc-bis (mg/mL)Glc-acryl (mg/mL)
Ab
so
rban
ce 5
50 n
m
Treatment
L929
INT407
Figure 4.31: Quantification of viable cells by MTT assay after treatment for 48
hrs with different test samples. The test samples were not different from
untreated sample (p < 0.05) as evaluated by unpaired student’s t–test in case of
both the cell lines.
A

Chapter 4
139
B
Figure 4.32: Growth of cells monitored in the absence and presence of test
samples (1 mg/mL each of Glc-acryl and Glc-bis and 20 mg piece of Glc-gel)
under microscope (40 × magnification). (A) INT407 cells and (B) L929 cells
At the end of 5 days all the samples attained confluence and the surface of the
well was completely covered with the growing cells (Figure 4.32). In the
quantitative MTT assay different concentrations (0.25 to 1 mg/mL) of Glc-acryl,
Glc-bis and 50 mg of Glc-gel were tested.149
In this assay too both the cell lines grew in a comparable manner to the untreated
sample at all the concentrations tested (Figure 4.31). To demonstrate death in the
cells 1 µM Staurosporine was used which killed the cells completely. This clearly
indicated that the test samples were nontoxic to the cells as they neither retarded
the growth nor induced cell death in both the cell lines.

Chapter 4
140
4.4.10. Recognition study of Glc-gel towards Con A
To determine the amount of protein that can be precipitated by Glc-gel, UV/vis
spectroscopy was performed.150 Therefore Con A (0.25 mg) in PBS-buffer (1 mL)
was mixed with swollen gel pieces (20 mg) and recorded the spectra at regular
intervals after separation of the gel pieces. Comparison of UV/vis spectra
recorded before and after treatment with gel showed a decrease of peak height at λ
= 420 nm of 43.8% after an interaction period of 10 minutes which can be
attributed to the protein adsorbed on Glc-gel (Figure 4.33). The amount of protein
left in solution is therefore calculated to be 0.14 mg (Δm = 0.11 mg) which
means, that 20 mg of swollen Glc-gel is able to precipitate 0.11 mg of Con A.
Similar studies in the presence of BSA solution showed a negligible decrement in
the absorbance at λ = 278 nm.
Figure 4.33: Interactions of Glc-gel with Con A (solid line) and BSA (dotted
line).

Chapter 4
141
4.5. Conclusion
In summary we have devised for the first time a D-glucose based bisacrylamide
(Glc-bis) and monoacrylamide (Glc-acryl) with hemiacetal functionality. The
high yielding reaction sequence proves the strategy is good enough to make them
in gram quantities. The acrylamides were converted to a sterilized, noncytotoxic
and homogeneous Glc-gel using radiation induced polymerization, which also
showed strong interaction to lectin Con A. The thermal stability decreased with
increase in monomer concentration. The states of water were dependent on Glc-
acryl concentration and viscoelastic studies of the gels indicated that the gel
strength increased with the Glc-bis content.


Chapter 5
142
CHAPTER 5
GLYCOPOLYMER GEL STABILIZED N-
SUCCINYL CHITOSAN BEADS FOR
CONTROLLED DOXORUBICIN
DELIVERY


Chapter 5
143
5.1. Introduction
Cancer therapy has developed at a fast pace in last few decades but still there exist
a lot of worries regarding the efficacy of the cancer chemotherapy. This is largely
due to the mode of administration of drugs which is mostly done either orally or
intravenously.151, 152 The systemic and cellular transport mechanism of our body
restricts bioavailability of the drugs leading to rapid clearance from the body.
Also, many anticancer drugs have short plasma life time, low cell membrane
permeability, and are highly toxic.153 In addition, even the advanced drug delivery
systems based on liposomes, micelles, polymeric vesicles etc., suffer from non-
specific drug delivery and affect the healthy tissues. Hence, there is a strong
demand for target-specific, localized vehicles with improved efficacy for
sustained drug delivery to reduce the side effects.154, 155 There has been intense
effort to develop improved drug delivery systems which not only provide a
sustained release but also control the initial burst release.156, 159 To address this
issue, pilot molecules like sugars, peptides, antibodies, etc. that hold selective
interaction with receptors on the cancer cells are being explored. In particular, the
sugar-based polymers are very attractive, since the glycopolymeric framework
can act as drug carriers, while their constituent sugar pendants can function as
pilot molecules as per the principle of “glyco-cluster effect”.156 Also,
carbohydrates play significant role in the cell-involved biorecognition events and
the glyco-targeting ability of glycopolymers have been proven ideal for cellular
specific drug targeting.160

Chapter 5
144
Doxorubicin (DOX, 1) (Figure 5.1) is a highly efficient chemotherapeutic
anticancer drug against various types of cancers including breast cancer,
urothelial cancer, hematopoietic malignancies, and other solid tumors. But its
effectiveness is curtailed by its short life time in the blood stream and toxicity to
normal tissues. Its clinical dosage far exceeds the non-toxic cumulative dose that
should be limited to 500-600 mg/m2. 157-164
These emphasize the need for a sustained localized DOX delivery system to
increase its activity with least toxicity. It is well established that sustained release
of drug at the malicious site is more effective for tumor treatment than the
administration of drug in definite doses at specific intervals.165-170 The
development of pH sensitive glycopolymer based drug delivery systems for
cancer chemotherapy have attracted tremendous interest owing to the fact that the
microenvironment of tumor tissues is mildly acidic (pH 4.5-6.5) in comparison to
the healthy tissues. The most common protocol, used so far for efficient loading
and delivery of drugs like DOX involves reversible covalent bonding,

Chapter 5
145
electrostatic interaction, as well as attachment of the drugs to a carrier through an
acid labile spacer which releases the drug at a definite pH.171
In the search for a new drug delivery system based on naturally occurring
polysaccharide, we realized that the second most abundant polysaccharide,
chitosan (CS) can be a potential candidate. It possesses a C2-amino group that can
be easily modified using succinic anhydride (SA) to provide a range of polymers,
N-succinyl chitosans (NSCs). The plasma half life of NSCs in both normal and
tumour cells was earlier found to be higher than the related macromolecules
studied, possibly due to the anionic charges that can interact with the blood
vessels and tissues.152, 172-175 Moreover, NSCs can accumulate on malicious
tissues by virtue of enhanced permeability and retention (EPR) effects.176-178 Most
importantly, the percentage of –NH2 and –COOH groups in the NSCs can be
easily controlled under suitable conditions. This provides a simple option to tune
the carrier property of the NSCs for various types of drugs.179 All these attributes
along with the less toxicity of NSCs prompted us to use them as carriers for
delivery of DOX.
The present work emphasizes on the synthesis and study of Ca2+ cross-linked
NSC beads that were stabilized by the interpenetrating network (IPN) of
glycopolymeric gel (Glc-gel). We hypothesized that the Glc-gel would provide
the required stability for the NSC beads against dissolution upon drug loading,
and could control the drug release. The biocompatible Glc-gel used for
stabilization of the bead was made from D-glucose based bisacrylamide

Chapter 5
146
crosslinker (Glc-bis, 2a) and monoacrylamide (Glc-acryl, 2b) (Figure 5.1)
developed in our laboratory.180 The crosslinker 2a was used to alleviate the
problem of toxicity of crosslinkers, for drug delivery applications.181, 182
5.2. Experimental Section
5.2.1. Synthesis of NSCs
To a solution of CS powder (2 g) in DMSO (40 mL) was added SA (2 g, 1250
mol eq) in portions, and the mixture stirred at 65 oC for 6 h/9 h for different extent
of substitutions. The pH was adjusted to 10–12 using aqueous 1 M NaOH to
obtain the respective precipitates, which were collected by filtration and dissolved
in distilled water (90 mL). The solution was dialysed in a dialysis membrane
(mol. weight cut off 12,000-14,000 Da) at room temperature for 2-3 days,
lyophilised, and the samples stored till further experiments. The synthesized
NSCs were characterized using FT-IR spectroscopy, and the degree of
substitution (DS) was determined from 1H NMR spectra using equation (5.1).183,
184
Further DS was also determined by elemental analysis using equation 5.2 and this
value was used to represent the extent of succinylation in CS. Thus, based on
CHN analysis NSC-6h was found to have 75% DS (NSC75) while that for NSC-
9h was 88% (NSC88).
Chapter 5
147
5.2.2. Synthesis of Glycopolymeric hydrogel (Glc-gel)
For the synthesis of glycopolymeric hydrogel the aqueous solution of 5 w/v%
Glc-acryl 2a and 0.1 w/v% Glc-bis 2b were irradiated upto 29.5 kGy in Co-60
source (dose rate 0.75 kGy/h), under ambient conditions. The synthesized gels
were washed thoroughly with deionized water and dried to constant weight.
5.2.3. Synthesis of NSC/Glc-gel beads
To a gently stirred aqueous saturated solution of CaCl2, was added dropwise, an
aqueous solution of 4 w/v% NSC (10 mL) using a microsyringe. The beads, thus
formed, were allowed to equilibrate for 3 h, filtered, washed with water (250 mL),
and transferred to a solution containing 5 w/v% Glc-acryl and 0.1 w/v% Glc-bis
(10 mL). After equilibrating overnight, the mixture was purged with nitrogen for
30 min, sealed tightly and irradiated (total dose 1.68 kGy , dose rate 0.75 kGy/h)
with a Co-60 -source. The irradiated Glc-gel beads were washed with water,
dried under vacuum at 40 oC to constant weights and used for further studies.
5.2.4. Determination of glycopolymer content in the bead
The extent of glycopolymer loading on the Ca2+ ions - crosslinked NSC75 and
NSC88 beads were gravimetrically determined using the equation (5.3) and the
values are the average of three independent measurements.

Chapter 5
148
where, Wg and Wd are the weights of vacuum dried glycopolymer loaded and
unloaded NSC beads, respectively.
5.2.5. Swelling and weight loss studies of NSC/Glc-gel beads
The swelling studies were carried out at 37 oC at pHs 7.4 and 5 at a
physiologically relevant ionic strength (154 mM). The swelling percentage of the
gel samples dried to constant weights was determined gravimetrically using
equation (5.4) and the values are the average of three independent measurements.
where, Wt is the weight of swollen bead at time‘t’ and Wd is the weight of dried
bead.
5.2.6. Synthesis of DOX-loaded NSC/Glc-gel beads
The synthesized swollen beads (1.5 mg) were incubated with 100 µl of DOX
solution (500 µg/mL) for 24 h in dark. The absorbances of DOX at 480 nm in the
feed solution after loading into the beads were spectrophotometrically measured.
The drug encapsulation efficiency of the beads were determined using equation
(5.5).185
Chapter 5
149
5.3. Characterization
5.3.1. Drug release studies
The swollen, DOX loaded NSC/Glc-gel bead (2.0 mg) was equilibrated with
acetate (pH 5) or phosphate (pH 7.4) buffer (each, 25 mL), with constant stirring
at 37 oC. Aliquots (each, 1 mL) were withdrawn at fixed time intervals and
replenished with fresh buffer solution in order to maintain constant sink
conditions of the media. The absorbances of the aliquots were measured, and the
amount of DOX released was determined using equation (5.6) against the
calibration plot prepared under similar conditions using standard DOX
solutions.186 The data are average of three independent measurements.
where, Vt, is the volume taken at time “t” V0 is the volume of the release medium
(V0 = 25 mL), mDOX represents the amount of DOX in the hydrogel, Ci and Cn
are the initial loaded concentration of DOX and that in the nth sample,
respectively.
5.3.2. Morphological studies
Morphology of the beads was determined with a QX5 DIGITAL BLUE computer
microscope, and MECK-FEI Model NOVA Nanosem 450 scanning electron
microscope (SEM). The lyophilized beads were coated in vacuo with gold for the
SEM characterization.

Chapter 5
150
5.3.3. Specific lectin recognition studies of DOX loaded NSC/Glc-gel beads
DOX loaded NSC/Glc-gel beads were treated with each of 0.05 mg/mL Con A,
PNA and BSA solutions. The supernatant solution was removed at regular time
intervals, centrifuged and measured the absorbance at 278 nm.
5.4. Results and discussion
5.4.1. Synthesis and characterization of NSC/Glc-gel beads
In this work, we synthesized two NSCs by succinylation of CS with SA at 65 oC.
The reaction proceeded to 75% and 88% of succinylation at 6 h and 9 h, as
indicated by elemental analysis and 1H-NMR (Figure 5.2 and Table 5.1) of the
products, and was designated as NSC75 and NSC88, respectively. These were
converted to the Ca2+ cross-linked NSC beads that were unsuitable for drug
delivery applications as they had poor mechanical strength and disintegrated fast
on DOX loading. Therefore, these beads were reacted with Glc-acryl and Glc-bis
under -irradiation to obtain the stabilized NSC/Glc-gel beads (Scheme 5.1).
During equilibration with the NSC beads, the Glc-acryl and Glc-bis solutions
penetrate into the matrix, and a cross-linked IPN of glycopolymer is formed
through the pores of the bead, on -irradiation. After glycopolymer loading, the
weights of resultant NSC75/Glc-gel and NSC88/Glc-gel beads were enhanced by
88-90 w/w%. The -irradiation grafting protocol is suited better for medicinal
applications as it was clean and avoided use of any additional chemicals/reagents.

Chapter 5
151
Figure 5.2: 1H NMR spectrum of (A) Chitosan (85% deacetylation (D2O-0.1%
DCl, 25 oC)), (B) NSC (after 6h of succinylation (D2O, 25 oC)), (C) NSC (after 9h
of succinylation (D2O, 25 oC))

Chapter 5
152
OOHO O
NH
OH
O
NH
R
OHO
OH
O
HONH2
OH
O
O
OH
O
NSC
Saturated
CaCl2
OHOHN
OHOH
NH
O
O
OHOHO
OHOH
NH
O
Co-60 ()
DOX loading
= NSC
= DOX
= Ca
= Glc gel= Cl-DOX release at pH = 5
Scheme 5.1: Synthesis of N-succinyl chitosan glycopolymeric gel bead
(NSC/Glc-gel) and the schematic of DOX release mechanism.
Compounds Carbon
(C)
Hydrogen
(C)
Nitrogen
(N)
C/N % DS184
Chitosan 42.2 8.8 6.3 6.7
NSC-6h 39.6 8.1 4.1 9.7 75
NSC-9h 36.7 7.9 3.6 10.2 88
Table 5.1: Elemental analysis data of chitosan and NSC synthesized after 6 h
(NSC-6h) and 9h (NSC-9h) of succinylation.
Also, the cell cytotoxicity studies using L929 and INT407 cell lines by MTT
assay of Glc-acryl, Glc-bis as well as the Glc-gel did not showed any significant
difference between the untreated and treated samples. These results clearly
indicated that Glc-acryl and Glc-bis as well as Glc-gel were not toxic to the
cells.180

Chapter 5
153
For characterization, the FT-IR spectra of CS, and powdered NSC and NSC/Glc-
gel beads were recorded and are shown in figure 5.3. The spectrum of CS showed
main absorption bands at (i) 1646 cm-1 and 1593 cm-1, corresponding to amide I
and amide II; and (ii) 1149 cm-1 (asymmetric stretching of C-O-C bridge) and (iii)
1068 and 1027 cm-1 (skeletal vibration involving the C-O stretching),
characteristics of the saccharine moiety. In the case of NSC, appearance of new
peak at 1421 cm-1 was assigned to the symmetric COO stretching, while that at
3085 cm-1 accounted for the N-succinyl –CH2 stretching.
3500 3000 2500 2000 1500 1000 500
50
60
70
80
90
100
110
% T
ran
smitt
an
ce
Wavelength (cm-1
)
1545
1651 1421
1376
1024
642
(a)
1312
1112
(C)
3400
2870 16461593
1149
30851068
1027
1551
(b)
Figure 5.3: FT-IR spectra (a) CS, (b) NSC/Glc-gel and (c) NSC powders.
A new peak at 1545 cm−1 (secondary amine) also appeared with simultaneous
depletion of the 1593 cm-1 (–NH2 bending) peak. This confirmed formation of
NSC via N-succinylation of CS to produce –NH–CO– bond.179,188-193 The spectra
(b) in figure 5.3 indicates the peaks corresponding to NSC/Glc-gel. The peaks at

Chapter 5
154
1651 and 1551 cm-1 which are of equal intensity, involves amide I and amide II
peaks of Glc-gel also.
5.4.2. Swelling studies of NSC/Glc-gel beads
Initially we tested the acid sensitivity of the Glc-gel as we assumed that this could
play a significant part in the controlled release of drug. The studies conducted at
different pHs (3, 5 and 7.4) revealed that the Glc-gel was stable and retained its
shape at the studied pHs. However, its equilibrium degree of swelling was
reduced progressively with lowering the pH of the medium. As shown in figure
5.4A, its maximum swelling capacities were 587% at pH 7.4, 500% at pH 5 and
389% at pH 3. At low pH, on the surface of the bead, the screening effect of
amidonium ions by Cl counter ions decreases the swelling drastically, due to
reduced hydrogen bonding with water molecules. But at pH 7.4, the amide groups
remain unprotonated and are freely available for hydrogen bonding with water,
facilitating the diffusivity of water molecules into the hydrogel network. Hence,
greater equilibrium swelling was observed .194,195
Next, the swelling behaviors of the NSC88 and NSC75 gel beads as such, and
after grafting Glc-gel were studied at pHs 5 and 7.4. The NSC88 and NSC75 gel
beads, i.e. without glycopolymer, swelled rapidly, and disintegrated within a few
minutes. On the other hand, the swelling kinetics of the vacuum dried
NSC88/Glc-gel and NSC75/Glc-gel beads were found to be pH dependent (Figure
5.4B) with more swelling for NSC88/Glc-gel beads compared to NSC75/Glc-gel

Chapter 5
155
beads at both the pHs, at a fixed ionic strength (154 mM). Higher and faster
swelling was observed for both NSC88/Glc-gel and NSC75/Glc-gel beads at pH
7.4 than at pH 5.
Figure 5.4: Swelling behaviors of (A) Glc-gel at pHs 3, 5 and 7.4 (B) NSC/Glc-
gel beads at pHs 5 and 7.4.
The maximum swelling capacities of NSC88/Glc-gel and NSC75/Glc-gel beads
were 2906% and 1436%, respectively at pH 7.4. These were reduced to 543% and
313% respectively at pH 5. The higher swelling at the basic pH may be due to the
increased repulsive interaction between the –COO units of the NSCs. This force
the polymeric units to be more stretched out and facilitates higher water uptake
compared to the beads containing the uncharged –COOH groups at pH 5.196,197
The Glc-gel loaded beads were stable during swelling studies at both the pHs (7.4
and 5) for 5-6 h. Later these beads showed weight loss due to leaching out of
NSC. Nevertheless the shape of the beads remained intact. However, despite the

Chapter 5
156
initial higher swelling of both the beads at pH 7.4, the swelling percentage
attained the same value as that of pH 5 after 45 h. This suggested higher rate of
leaching out of NSC from the beads at pH 7.4.196,198,199
5.4.3. DOX encapsulation by the NSC/Glc-gel beads
Incubation of the DOX solution with the NSC75/Glc-gel and NSC88/Glc-gel
beads led to its decolorization, confirming loading of the drug in the beads. Best
DOX encapsulation was observed at 12 h of incubation (Figure 5.5(A)). The DOX
encapsulation efficiency (EE) of the beads was dependent on the degrees of
succinylation in the NSCs. Quantification of the data revealed that the EEs of the
NSC88/Glc-gel and NSC75/Glc-gel beads were 92.7% and 75% respectively.
This suggested that the mechanism of loading is governed mainly by the
electrostatic interaction between the –COO groups in the polymer and the NH2
group of DOX.181 The DOX loading was also evident from the significant color
differences in the appearances of the loaded and unloaded NSC75/Glc-gel beads
(Figure 5.5(B)). The NSC88/Glc-gel beads also showed similar changes in their
appearances on DOX loading (images not shown).
Figure 5.5: (A) Photographic image of DOX solution as such (500 µg/mL) (1), in
presence of NSC67/Glc-gel (2) and NSC80/Glc-gel (3) beads (B) Optical

Chapter 5
157
microscope image of DOX loaded (red) and unloaded (transparent) swollen
NSC67/Glc-gel beads (C) vacuum dried DOX loaded NSC67/Glc-gel bead (left),
NSC67/Glc-gel bead (middle) and swollen NSC67/Glc-gel bead (right).
5.4.4. Thermal Analysis of the beads
All the samples showed a small weight loss at about 100 oC due to the loss of the
absorbed and bonded water. The NSC beads showed 20% weight loss at 250-350
oC, while a similar weight loss was observed at 150-250 oC in case of Glc-gel
(Figure 5.6). The TGA data confirmed enhanced thermal stability of the
NSC/Glc-gel beads compared to the blank NSC beads.196 Notably, higher the
degree of succinylation greater the thermal stability, because the NSC88/Glc-gel
and NSC75/Glc-gel beads showed 70% and 80 % weight loss respectively at 700
oC. DOX loaded NSC/Glc-gel bead also showed similar TGA profiles as that of
the corresponding unloaded bead.
100 200 300 400 500 600 700 800 900100
80
60
40
20
0(a) NSC bead
(b) Glc-gel
% w
eig
ht
los
s
Temperature (oC)
(a)
(b)
(A)

Chapter 5
158
100 200 300 400 500 600 700 800 900
100
80
60
40
20
0 (a) NSC88/Glc-gel bead
(b) NSC75/Glc-gel bead
(c) DOX NSC88/Glc-gel bead
(d) DOX NSC75/Glc-gel bead
% w
eig
ht
loss
Temperature (oC)
(a)
(b)
(C)
(d)
(B)
Figure 5.6: TGA thermograms of NSC beads and Glc-gel (A), unloaded and
DOX-loaded NSC/Glc-gel beads (B).
However, the weight loss in the region 150-250 oC was gradual. A 20% weight
loss for DOX loaded beads in the region 250-350 oC corresponding to NSC
decomposition as shown in figure 5.6.
5.4.5 Swelling and pH responsiveness of the DOX-loaded NSC/Glc-gel beads
The swelling profile of the DOX-loaded beads was much different from that of
the unloaded beads especially at pH 7.4 (Figure 5.7). The DOX loaded
NSC75/Glc-gel beads showed lesser degree of weight loss compared to the
unloaded beads at pH 7.4, implying their increased stability on DOX loading.
In NSC88/Glc-gel beads, more DOX loading made the beads to swell rapidly
compared to NSC75/Glc-gel at pH 7.4 resulting in higher weight loss in DOX
loaded NSC88/Glc-gel beads than the unloaded beads. The swelling behaviors of

Chapter 5
159
the loaded and unloaded NSC88/Glc-gel and NSC75/Glc-gel beads were
comparable at pH 5.
0 5 10 15 20 25 30 35 40 450
500
1000
1500
2000
2500
3000
pH5 NSC88/Glc-gel bead
pH5 NSC75/Glc-gel bead
pH7.4 NSC88/Glc-gel bead
pH7.4 NSC75/Glc-gel bead%
sw
ellin
g
Time (h)
Figure 5.7: Swelling and pH responsiveness of DOX loaded NSC/Glc-gel beads
at pH 7.4 and 5. (Red symbols indicate data for DOX loaded beads and black
symbols indicate those for unloaded NSC/Glc-gel beads.)
5.4.6. Drug release studies in vitro
Figure 5.8 shows the DOX release profiles of the NSC/Glc-gel beads at pHs 7.4
and 5 at 37 oC. In case of NSC75/Glc-gel beads both at pH 7.4 and 5 the initial
burst release was only ~25% over a period of 24 h whereas, the NSC88/Glc-gel
beads showed 30% initial burst release of DOX within 6 h at pHs 7.4 and 5. This
is in agreement with our results of swelling studies of the corresponding DOX
loaded beads. The initially released DOX molecules are those physisorbed in the
hydrogel matrix. But at the later stage, a slow and sustained DOX delivery profile
was shown by both types of beads, with greater release rate at pH 5.

Chapter 5
160
The increased release at pH 5 may be due to (i) weakened electrostatic
interactions between the protonated carboxylic group of NSC and DOX amino
group196, and (ii) precipitation of NSC from the beads at acidic pH as evident
visually as well as from the SEM image (Figure 5.11E). The precipitation of a
small fraction of NSC would leave behind the uncomplexed DOX, trapped in the
glycopolymeric network. This can subsequently diffuse out at a faster rate. A
purely electrostatic interaction between the DOX and the matrix would have
resulted in a 100% release of DOX at acidic pH. Since this was not observed, we
assume that some non-ionic interactions may also be playing significant role. The
percentages of maximum cumulative release from the NSC75/Glc-gel beads at
pHs 5 and 7.4 were 76% and 36% respectively. The respective values with the
NSC88/Glc-gel beads were 88% and 79%. Hence NSC75/Glc-gel beads can be
considered as ideal matrices for localized drug delivery to the cancer cells with
minimal side effects.
0 1 2 3 4 5 6 7 8 9 10 11 12 13 14 15 16 17 18
0
20
40
60
80
100
120
NSC 67/Glc-gel bead
NSC 80/Glc-gel bead
Cu
mu
lati
ve
DO
X r
ele
as
e %
Days
pH 5
pH 7.4 pH 5
pH7.4
Figure 5.8: DOX release profiles from the loaded NSC/Glc-gel beads at pHs 7.4
and 5.

Chapter 5
161
5.4.7. Specific interaction between NSC and DOX
The specific interaction between DOX and NSC was investigated from the UV-
Vis spectra of aqueous DOX solution as such and equilibrating for 5 minutes after
addition of NSC67. DOX showed an absorption maxima at λmax 480 nm that upon
addition of NSC got shifted to 495 nm and the peak intensity was also
significantly reduced (Figure 5.9). These spectral changes indicated that a
complex is formed between DOX and NSC.196
300 400 500 600
0.0
0.5
1.0
1.5
2.0
Ab
so
rba
nc
e
Wavelength (nm)
(a) DOX
(b) NSC67-DOX
(a)
(b)
480 nm
495 nm
Figure 5.9: UV-Vis spectra of DOX and NSC75-DOX complex in aqueous
solution.
5.4.8. Mechanism of drug release
In order to understand the different modes of drug release from the gel beads the
release profiles were fitted by the exponential Korsemeyer-Peppas equation
(5.7).200

Chapter 5
162
where, ‘Fr’ is the fraction of drug released at time ‘t’, ‘k’ is the kinetic constant
and ‘n’ is the diffusion exponent indicative of the drug release mechanism.
The drug release follows fickian-diffusion when n is ≤ 0.43, but takes
swelling/erosion controlled (non-fickian diffusion) mode between 0.43<n<0.85
but, when n = 1.0, it corresponds to a zero-order release for non-swellable
controlled release systems. The model was applied for release upto Fr = 0.6
(Figure 5.10). From the fitting plots of both beads, at pH 7.4 and 5, the
NSC75/Glc-gel beads followed zero-order release kinetics at both the pHs. This is
because of low swelling kinetics of NSC75/Glc-gel beads which results in
constant rate of release of the drug independent of its concentration.
The fitted data in case of NSC88/Glc-gel bead at pH 5 gave n = 1.52 at the
beginning, which is due to rapid release of the physisorbed DOX molecules from
the surface of the hydrogel network. At later stage, the value of n dropped to 0.37,
indicating fickian-type diffusion of DOX. But at pH 7.4, the values of ‘n’ were
0.094 and 0.315, at the initial and later stages respectively of DOX release from
the NSC88/Glc-gel beads. This implied a fickian-diffusion controlled drug release
throughout the kinetic studies at pH 7.4. This may be because of greater swelling
of the NSC88/Glc-gel bead and also greater solubility of NSC88 at pH 7.4 and 5.
Therefore the major mechanism of release in case of NSC88/Glc-gel bead is by
ion exchange mechanism and/or diffusion of the drug through the matrix.

Chapter 5
163
Figure 5.10: Linear fitted curves of drug release applying Korsmeyer-Peppas
equation for (A) NSC75/Glc-gel bead at pH5 (B) NSC88/Glc-gel bead at pH 5
(C) NSC75/Glc-gel bead at pH 7.4 (D) NSC88/Glc-gel bead at pH 7.4.
5.4.9. Surface morphology of the beads
The drug release studies, showed a slow and sustained delivery from the
NSC75/Glc-gel beads, vide supra. Hence the freeze dried DOX loaded
NSC75/Glc-gel beads were chosen for surface morphology analysis. The SEM
images of the freeze dried NSC75/Glc-gel beads showed porous surface with
number of interconnecting pores, which control the drug release profile. The

Chapter 5
164
images of the DOX loaded beads after few hours of swelling at pH 5 (Figure
5.11A) and pH 7.4 (Figure 5.11B) buffers were recorded in order to get an insight
into the network structure during DOX release. Figure 5.11C-F are the magnified
images of the beads showing the glycopolymeric network on the surface swollen
at pH 5 and 7.4. In figure 5.11E the precipitated NSC at pH 5 is visually clear and
is responsible for the faster release of DOX whereas, in figure 5.11F a uniform,
intact network of NSC is observed at pH 7.4 which prevents uncontrolled drug
release in to the extracellular body fluids.
Figure 5.11: SEM images of DOX loaded NSC67/Glc-gel beads after swelling
and freeze dried at (A) pH 5 (B) pH 7.4. Magnified images showing Glc-gel

Chapter 5
165
network on the surface at (C) pH 5 (D) pH 7.4. Images of same beads at even
higher magnification showing the NSC networks (E) bead with precipitated NSC
at pH 5 (F) uniform and intact bead at pH 7.4.
5.4.10. Specific interaction between DOX loaded NSC/Glc-gel beads and Con A
Con A binds specifically to glycopolymers containing glucosyl or mannosyl
residues in the presence of Ca2+ and Mn2+. Since Con A can activate cellular
signaling on the cell surface the glycopolymer attached to Con A can regulate
various activities like cell proliferation, adhesion and survival. To understand the
interaction between the DOX loaded beads and Con A the UV-vis-absorbance of
the buffer in which the bead is equilibrated was measured after centrifugation
every minute (Figure 5.12).
The absorbance of the media increased in the beginning but after 4 minutes the
solution became turbid and the absorbance dropped down as well. This is because
of the aggregation of the glycopolymer components in the solution which,
subsequently got adhered to the surface of the glycopolymer gel stabilized beads.
Interaction studies of the DOX loaded beads with BSA and PNA under similar
conditions showed no significant change in absorbance. It remained constant
without much fluctuations and the solution remained relatively transparent
indicating no specific interaction between glycopolymer and BSA or PNA.

Chapter 5
166
0 5 10 15 20 25 300.0
0.2
0.4
0.6
0.8
1.0
1.2 Con A
BSA
PNA
Ab
so
rba
nce
Time (min)
Figure 5.12: Interaction of the DOX loaded NSC/Glc-gel beads with Con A,
PNA and BSA.
5.5. Conclusion
In short, we have furnished a carbohydrate based bio-compatible drug delivery
system which has pH sensitive matrix in the form of interpenetrating network of
NSC and glycopolymeric gel. NSC was synthesized with two different degrees of
substitution NSC88 and NSC75 which were then stabilized by the Glc-gel
network. A maximum swelling of 2906% and 1436% were reached at pH 7.4
whereas it was 543% and 313% at pH 5 for both the beads respectively. The DOX
encapsulation efficiency (EE) of the synthesized beads was found to be dependent
on the degree of succinylation. The EE for DOX was found to be 92.7% for
NSC88/Glc-gel bead and 75% for NSC75/Glc-gel bead. The spectral
characteristics of NSC-DOX complex indicated specific interaction between NSC
and DOX. The DOX loaded NSC/Glc-gel beads gave slow and sustained drug
delivery at pH 5 but much lesser rate of release at pH 7.4, a situation suitable for

Chapter 5
167
cancer chemotherapy. Upto 76% cumulative drug release was obtained in case of
NSC75/Glc-gel bead at pH 5 whereas, for NSC88/Glc-gel bead it was 88% after
18 days. In case of NSC75/Glc-gel bead the release was slower and it sustained
better, also it followed a zero order release profile, which is ideal for implant
purpose or post surgical treatment of localized cancer; whereas NSC88/Glc-gel
beads showed a two stage release profile. The synthesized beads showed
specificity to lectin Con A rather than PNA or BSA. Finally, this polysaccharide
based glycopolymeric gel coated bead could be a suitable base for pharmaceutical
applications.


Chapter 6
168
CHAPTER 6
SELF ASSEMBLED FLUORESCENT
GLYCOACRYLAMIDES


Chapter 6
169
6.1. Introduction
The design and synthesis of fluorescent self assembled nanostructures are of great
interest due to their applicability in drug delivery, molecular actuators, functional
biomaterials, and analytical biosensors. Multiple weak non covalent/secondary
interactions play a major role in the formation of such structures with a particular
arrangement, which imparts some amazing properties that make them stimuli
responsive. This non covalent interaction in self assembled biocompatible systems
make them fluorescent which allows it to use in bio-sensing, cell imaging, etc.
However, most of the commercially available fluorescent materials often have
various disadvantages, which limit their application in bio-medical field. For
example, fluorescent proteins are usually expensive, possess low molar
absorptivity, and low photobleaching thresholds. The high toxicity of
semiconductor quantum dots precludes its use in biomedical applications. In
materials like organic dyes there exists a problem of aggregation caused
quenching (ACQ) which leads to fluorescence quenching and photobleaching.201
A good alternative to materials that causes ACQ is to search for materials that can
exhibit the phenomenon of aggregation induced emission (AIE). After the first
report by Tang et al. in 2001 on AIE dyes, many AIE fluorogens have been
synthesized.202 Unlike ACQ, AIE possess various advantages like facile synthesis,
ease of modification, stability, good solubility, high emission efficiency in the
aggregated states etc.203,204

Chapter 6
170
Synthesis of amphiphilic molecules containing carbohydrate moieties, that can
self assemble to form well defined nanostructures, can be promising scaffolds for
various applications as it can interact with biological receptors. It is well known
that carbohydrates play a significant role in many biological events like cell–cell
recognition, inflammation, immune response, so on and so forth.205-212 Self
assembled monosaccharide analogues with amide units can mimic natural
glycopeptides and hence can be important candidates for cell uptake and related
studies. Very few amphiphilic glyco-amides/glyco-monomers have been reported
that exhibit self assembly behavior to form well defined structures.213 These
structures can amplify the highly significant protein-saccharide interactions
through multivalent effect of clustered saccharides called “cluster glycoside
effect”.
Molecules having aliphatic chains such as proteins, carbohydrates, lipids which
play important roles in biological systems are mostly non-fluorescent or weakly
fluorescent in their concentrated as well as dilute solutions due to ultrafast
rotation around the single bond.214 Hence such molecules are not reported to show
AIE effect. Thus to study the structure and functions of these macrosystems we
ought to have a system that can either mimic them or bind to them. In this regard
there are a number of reports on AIE fluorogens such as siloles,
tetraphenylethene, tri-phenylethene, cyano-substituted diarylethene, and distyryl-
anthracene derivatives which are extensively investigated for chemosensing and
bioimaging applications.211-213

Chapter 6
171
We had previously synthesized two different monomer units (see chapter 4) with
mono and bis-acrylamide units (hydrophobic) in to the C-6 position or C-3 and C-
6 positions of glucose units, respectively (Figure 6.1).
This substitution can introduce a hydropohobic-hydrophilic balance in aqueous
solution leading to the formation of self assembled structures of glyco-
acrylamides and glyco-bis acrylamides. The extensive hydrogen bonding between
the neighboring glucose units as well as inter- and intra- molecular H-bonding
with the amide units, restricts the motion of hydrophobic acrylamide units and
consequently results in the formation of self assembled structures. The restricted
rotation in these structures can lead to fluorescence emission as a result of AIE
phenomenon.
In this chapter discussion is about the self assembly of Glc-acryl and Glc-bis, the
pH dependency on its self assembly and its applicability in aggregation induced
fluorescence sensing method for concanavalin A (Con A). Eventhough
glycoclusters or glycopolymers exhibiting fluorescence quenching after binding to
lectins have been widely studied, fluoresence enhancement upon binding to

Chapter 6
172
specific lectins is less explored and is more efficient in bioimaging of live cells.
Fluorescence enhancement upon binding to lectin can be due to deaggregation
induced emission, aggregation- induced emission, fluorescence resonance energy
transfer (FRET) and/or hydrophobic interaction.215-219 In the building blocks the
presence of hydrophobic acrylamide units could act as the fluorescent probe by
virtue of its weak π-π stacking and the hydrophilic glucose units would serve as
the lectin binding moiety. The biocompatibility and cell uptake behaviours of Glc-
acryl and Glc-bis were studied using human intestinal cell lines (INT407) which
contain receptors which can be specifically identified by D-glucose moieties.
6.2. Experimental
The Glc-bis and Glc-acryl which will be commonly called as glyco-acrylamides
were synthesized from D-glucose, the details of which along with characterization
are given in chapter 4.
6.2.1. Self- assembly studies of Glc-acryl and Glc-bis
2.5 mM stock solutions of Glc-acryl and Glc-bis were prepared in aqueous media.
To determine the critical aggregation concentration (CAC), aqueous solutions of
Glc-acryl and Glc-bis ranging from 1 µM – 20 µM were added to PBS buffer.
After each addition, the sample was stirred and then subjected to fluorescence
measurements (λex = 330 nm). The pH dependent self assemblies of acrylamides
were studied by adjusting the pH using 1 M NaOH/1 M HCl.

Chapter 6
173
6.2.2. Sample preparation for lectin sensing studies
A 2.5 mM stock solution of Glc-acryl in a buffer solution (10 mM PBS; pH 7.2,
0.1 mM MnCl2, 0.1 mM CaCl2) was prepared. The stock solution was diluted to
6.25 µM into which aliquots of Con A ranging from 0 nM - 120 nM were added.
After each addition, the solution was stirred for 10 minutes and then subjected to
fluorescence measurements (λex = 330 nm). The same procedure was repeated
with 2.5 mM stock solution of Glc-bis.
6.2.3. Determination of association constant (Ka)
A typical procedure was followed: Aliquots (2 µl) of Glc-acryl as well as Glc-bis
solution (2.5 mM) in buffer solution (10 mM PBS; pH 7.2, 0.1 mM MnCl2, 0.1
mM CaCl2) were added to a solution of FITC-Con A (1 µM, 2 ml) in the same
buffer solution. The fluorescence spectra were measured at an excitation
wavelength of 492 nm. The same procedure was repeated with FITC-PNA.
The binding constant (Ka) was estimated from the Scatchard plot using the
following equation 6.1.220
where, [sugar] = concentration of the monomer
Fo = initial fluorescence intensity of FITC- Con A/PNA
Δ F = relative change in fluorescence intensity i.e (F- Fo)/Fo

Chapter 6
174
6.2.4. Confocal microscopic imaging of cells using Glc-acryl and Glc-bis
INT407 cells were grown in DMEM medium with 10% FCS under 5% CO2
atmosphere at 37 ºC. In a six well plate, sterile cover-slips were placed carefully
and 1 × 10⁵ cells/well in 2 ml volume of medium was added to each well. The
cells were allowed to attach overnight. Glc-acryl and Glc-bis-acryl at 20 mM each
(final concentration) were added to different wells and incubated for 1 h. At the
end of the incubation period the individual cover-slip with the cells were picked
up with sterile forceps and mildly rinsed in PBS. The cover-slips were then placed
on a glass side in such a way that the cells remain between the two surfaces. The
slides were immediately observed under a florescent microscope (LSM 780
Carlzeiss fluorescent microscope) with UV filter (excitation 355 nm and emission
395 nm).
6.3. Results and discussion
6.3.1. Fluorescence spectral properties of Glc-acryl and Glc-bis
The emission intensity was obtained at varying excitation wavelength ranging
from 300 nm-400 nm. For both Glc-acryl and Glc-bis maximum emission
intensity was obtained at λex = 330 nm. For Glc-acryl there was not much shift in
the λmax emission at varying excitation wavelength. But for Glc-bis a red shift was
observed in the λmax emission with increasing λex (Figure 6.2).

Chapter 6
175
300 400 5000
3000
6000
Flu
ore
sce
nc
e In
ten
sit
y
Emission wavelength (nm)
330 nm
340 nm
290 nm
300 nm
310 nm
320 nm
Glc-acryl (A)
400 5000
1000
2000
3000
4000
Flu
ore
sc
en
ce I
nte
ns
ity
Emission wavelength (nm)
340 nm
350 nm
290 nm
300 nm
310 nm
320 nm
330 nm
Glc-bis (B)
Figure 6.2: Emission spectra of Glc-acryl (A) and Glc-bis (B) at varying
excitation wavelengths.
The emissions at different wavelengths were observed by fluorescent and bright
field images of the glyco mono-acrylamides/bis-acrylamides. The red, yellow and
blue emissions as shown in figure 6.3 could be possibly arising from the
hydrophobic channels of a concentrated glycoacrylamide solution coated on a
glass slide.
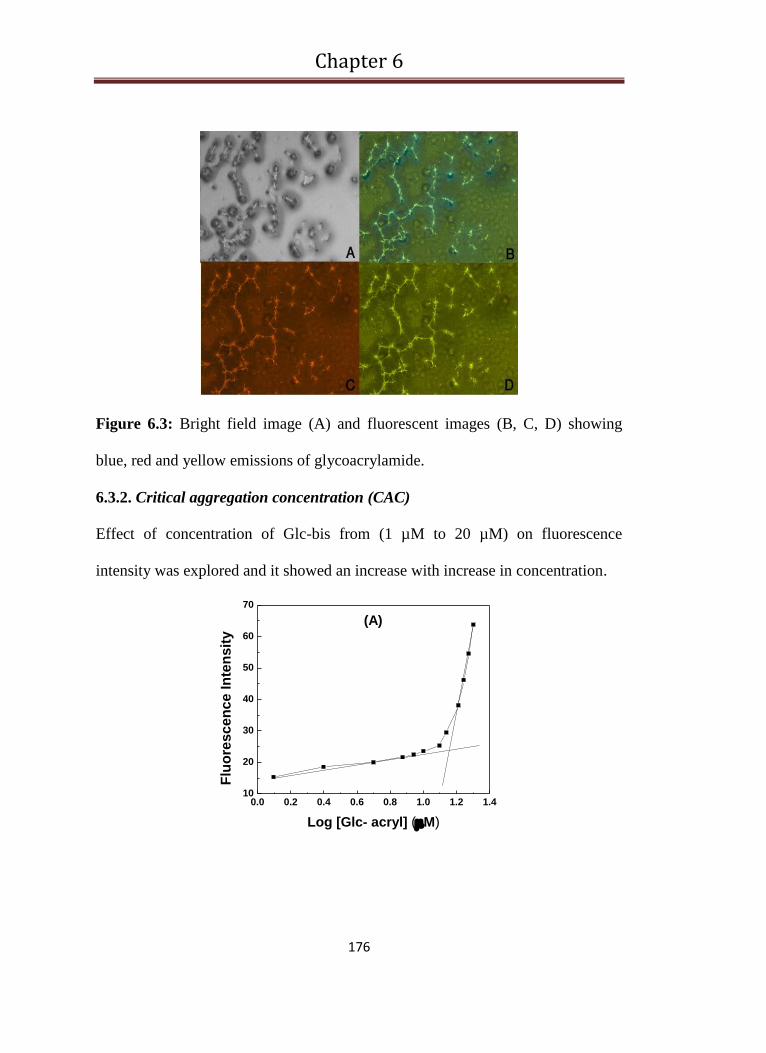
Chapter 6
176
Figure 6.3: Bright field image (A) and fluorescent images (B, C, D) showing
blue, red and yellow emissions of glycoacrylamide.
6.3.2. Critical aggregation concentration (CAC)
Effect of concentration of Glc-bis from (1 µM to 20 µM) on fluorescence
intensity was explored and it showed an increase with increase in concentration.
0.0 0.2 0.4 0.6 0.8 1.0 1.2 1.410
20
30
40
50
60
70
Flu
ore
sc
en
ce
In
ten
sit
y
Log [Glc- acryl] (M)
(A)

Chapter 6
177
0.0 0.2 0.4 0.6 0.8 1.0 1.2 1.40
100
200
300
400
500
600
Flu
ore
sc
en
ce
In
ten
sit
y
Log [Glc- bis] (M)
(B)
Figure 6.4: Log of concentration vs fluorescence intensity plot for Glc- acryl (A)
and Glc- bis (B).
From the plot of log of concentration vs fluorescence intensity, the critical
aggregation concentration (CAC) for Glc-bis was calculated to be 13.18 µM
(Figure 6.4). Similarly, for Glc-acryl CAC was found to be 14.45 µM.
6.3.3. pH dependent self assembly and fluorescence emission
Glc-acryl as well as Glc-bis showed a pH dependent variation in fluorescence
emission (Figure 6.5).
350 400 450 500 550
1000
2000
3000
4000
5000
6000
7000
Flu
ore
scen
ce I
nte
nsi
ty
Wavelength (nm)
Basic
Neutral
Acidic
pH
(A)

Chapter 6
178
350 400 450 500 550 6000
200
400
600
800
1000
1200
1400
Flu
oresc
en
ce I
nte
nsi
ty
Wavelength (nm)
Acidic
Neutral
Basic
pH
(B)
Figure 6.5: pH dependent fluorescent emission of (A) Glc-acryl and (B) Glc-bis.
At basic pH Glc-acryl showed higher emission whereas at acidic pH the emission
intensity decreased with a red shift in emission maxima λem. Conversely, Glc-bis
showed higher emission at acidic pH but emission intensity lowered at basic pH
without any significant shift in emission maxima λem. This was further confirmed
by TEM images (Figure 6.6).
TEM images revealed that at basic pH the self assembled Glc-acryl undergoes
aggregation to form elongated hair like structures, but under neutral conditions the
self assembled molecules are in the form of small granular structures. As the pH
drops to acidic range these Glc-acryl particles self assemble to form small well
separated rod like structures, which makes them less emissive. Whereas in the
case of Glc-bis the TEM images reveal that at neutral pH the assembly is almost

Chapter 6
179
similar to that of Glc-acryl but at acidic pH, smaller aggregates come closer to
become more emissive.
Figure 6.6: TEM images of Glc-bis and Glc-acryl at different pH.
While under basic pH, the Glc-bis form very fine particles with an average size
of 5-10 nm. This highly dispersed nature of Glc-bis nanoparticles make them
weakly emissive at basic pH.
6.3.4. Fluorescence “turn on” sensing of Con A
The effect of binding of Con A to glucose based acrylamide and bis-acrylamide
was studied using fluorescence spectroscopy. Concanavalin A (Con A), which is a
well-studied lectin from Canavalia ensiformis (Jack bean), was used as a model
protein in the present study to understand protein–carbohydrate interactions. Con

Chapter 6
180
A exists as a tetramer above neutral pH and it can selectively recognize α-
mannopyranoside and its C-2 epimer α-glucopyranoside residues.221-223
As shown in figure 6.7, a progressive increase in the fluorescence emission
intensity of Glc-acryl and Glc-bis was observed with increasing Con A
concentration, but with no obvious shift in the emission maxima. The binding of
the self assembled Glc-acryl and Glc-bis to Con A results in the formation of
aggregates through secondary interactions. This aggregation results in
enhancement in fluorescence due to AIE and thus the solution of
glycoacrylamides which were usually very weakly emissive, starts to emit better
in presence of Con A. The extent of fluorescence enhancement was found to be
more in the case of Glc-acryl than in Glc-bis. Therefore Glc-acryl is a better
fluorescence “turn on” sensor for Con A compared to Glc-bis.
400 450 500 550 6000
20
40
60
80
100
120
Flu
ore
sc
en
ce
In
ten
sit
y
Wavelength (nm)
[Con A]= 0 nM- 96 nM
(A)

Chapter 6
181
400 450 500 5500
20
40
60
80
Flu
ore
sc
en
ce
In
ten
sit
y
Wavelength (nm)
[Con A]= 0 nM- 115 nM
(B)
Figure 6.7: Fluorescence enhancement of Glc-acryl (A) and Glc-bis (B) upon
addition of Con A.
6.3.5. Binding affinities and limit of detection (LOD) of Glc-acryl and Glc-bis
towards lectins
In order to elucidate the binding affinities of glycoacrylamides towards Con A,
the fluorescence quenching titration of fluoroscein isothiocyanate labeled Con A
(FITC-ConA) as well PNA (FITC-PNA) was carried out. FITC groups have an
intrinsic emission peak at 517 nm, which quenches upon binding with
saccharides, making it possible to quantify the extent of binding. Figure 6.8
indicate the relative change in fluorescence intensity (F/F0) with concentration of
Glc-acryl and Glc-bis.

Chapter 6
182
0 10 20 30 40
0.80
0.85
0.90
0.95
1.00
F/F
o
[Glc- acryl] (M)
FITC-Con A
FITC-PNA
(A)
0 10 20 30 40
0.80
0.85
0.90
0.95
1.00
F/F
o
[Glc- bis] (M)
FITC-Con A
FITC-PNA
(B)
Figure 6.8: Fluorescence quenching of FITC-Con A and FITC-PNA by Glc-acryl
(A) and Glc-bis (B).
A non linear decrease in fluorescence intensity with concentration was observed.
The association constant (Ka) was calculated from the scatchard plot. The
scatchard plot of Glc-acryl and Glc-bis binding to FITC-Con A and FITC-PNA
are shown in figure 6.9. The Ka value of Glc-acryl to FITC-Con A was 144.00 X
103 M-1 which was twice as compared to Glc-bis (76.31 X 10³ M-1). The Ka value
of Glc- acryl to FITC- PNA is 57.90 X 10³ M-1 whereas of Glc- bis to FITC- PNA
is 46.54 X 10³ M-1. This observation agrees with the observed enhancement in

Chapter 6
183
fluorescence on addition of Con A to glycoacrylamide monomer solutions. The
enhanced affinity of glycoacrylamide to Con A when compared to
monosaccharides like methyl β-D-glucopyranoside (Ka = 70 M-1) could be due to
the “glyco cluster effect” arising from the self assembly of Glc-acryl and Glc-bis
which is absent/less in latter.
0 5 10 15 20 25 30 35 40 45-500000
-400000
-300000
-200000
-100000
[su
ga
r]F
o/
F
[Glc- acryl] (M)
(A)
0 5 10 15 20 25 30 35 40 45
-1400000
-1200000
-1000000
-800000
-600000
-400000
[su
gar]
Fo
/F
[Glc- acryl] (M)
(B)
0 5 10 15 20 25 30 35 40 45
-150000
-120000
-90000
-60000
-30000
[su
gar]
Fo
/F
[Glc- bis] (M)
(C)
0 10 20 30 40 50
-800000
-600000
-400000
-200000
[su
ga
r]F
o/
F
[Glc- bis] (M)
(D)
Figure 6.9: Scatchard plot for Glc-acryl upon addition of (A) FITC- Con A (B)
FITC- PNA; for Glc-bis upon addition of (C) FITC- Con A (D) FITC- PNA.
Limit of detection was calculated from the enhancement in fluorescence intensity
on addition of Con A to 6.25 µM Glc-acryl as well as Glc-bis. The typical limit of
detection (LOD) as evaluated from the ratio of signal to noise (S/N) higher than 3,

Chapter 6
184
was estimated to be 7.85 pM for Glc-acryl and 3.49 nM for Glc-bis. Thus, unlike
Glc-bis, Glc-acryl showed high sensitivity to Con A which is more than any Con
A sensors reported so far.
Compound
Ka (M-1) LOD (nM)
(for Con A) Con A PNA
Glc-acryl 144.00 X 10³ M-1 57.90 X 10³ M-1 7.85 pM
Glc-bis 76.31 X 10³ M-1 46.54 X 10³ M-1 3.49 nM
Table 6.1: Association constants (Ka) and Limit of Detection (LOD) of Glc-acryl
and Glc-bis towards Con A and PNA.
6.3.6. Cell imaging application of Glc-acryl and Glc-bis
Taking advantage of the fluorescent properties, biocompatibility and
hydrophilicity of the synthesized glyco-acrylamides, the cell uptake behavior was
explored using confocal microscopy as demonstrated in figure 6.10. INT407 cell
lines showed strong blue fluorescence after equilibrating with 20 mM of glyco-
acrylamides for 1 hr. Most of the fluorescent nanoparticles were found to be
dispersed in the cytoplasm. Interestingly, the cells stained with Glc-bis were more
fluorescent than Glc-acryl. These finding are against the results from Con A
interaction studies, in terms of selectivity of Con A to Glc-acryl and Glc-bis. This
automatically suggest that apart from Con A there could be other carbohydrate
binding proteins/molecules present in the cytoplasm that can aggregate to show
fluorescence enhancement. These results also suggest that the glycoacrylamides

Chapter 6
185
can be good candidates for cell imaging applications with good water
dispersibility and intense fluorescence even under dilute body fluid conditions.224
Figure 6.10: Confocal microscopy images of INT407 cell lines incubated with
Glc-acryl (Top row) and Glc-bis (Bottom row): (A) & (B) bright field, (C) & (D)
fluorescent images after excitation at 355 nm, (E) & (F) merged image.
6.4. Conclusions
In summary, glyco-acrylamides synthesized from D-glucose, were found to self
assemble in aqueous solution to form fluorescent nanoparticles. These particles
showed variable emission at different excitation wavelengths. The self assembly
of Glc-acryl as well as Glc-bis was found to be pH dependent and both of them
showed opposite behaviours with varying pH. Also, the self assembly enhances
the glyco cluster effect, thereby leading to specific recognition of lectin Con A
even in pico molar range which is much better than the Con A sensors reported so
far. The lectin sensing takes place by a fluorescence “turn on” mechanism. The
fluorescence enhancement upon interaction with Con A is more in case of Glc-

Chapter 6
186
acryl than with Glc-bis as association constant (Ka) measurements with Con A for
Glc-acryl was twice that of Glc-bis. The synthesized glycoacrylamides could also
be promising candidates for cell imaging applications.

Chapter 7
187
CHAPTER 7
CONCLUSIONS AND FUTURE
PERSPECTIVES


Chapter 7
188
7.1. Outcome of present work
The work incorporated in the thesis emphasize on the utility of natural
polysaccharides along with synthetic polymers/monomers for various biomedical
applications. Composites of natural polysaccharides with synthetic polymers were
utilized for the production of hydrogels for applications like wound dressings and
drug delivery. In this regard special care has been given for biocompatibility of
the synthesized material applying green methods for synthesis. Hence all the
crosslinking and synthesis of hydrogels work has been carried out by radiation
induced method without addition of any external chemical agents.
Silver nanoparticle loaded PVA-GA hydrogels were synthesized for antibacterial
wound dressing applications and were found to be effective against gram negative
E. Coli bacteria. We were able to determine the gel point of the synthesized
hydrogels rheologically which is the most accurate method among the existing
ones. The key information which we got from this work was that the size of the
silver nanoparticles determines its antibacterial activity.
The rest of the thesis is based on two D-glucose based acrylamide molecules
synthesized in our laboratory which are named Glc-acryl and Glc-bis and together
mentioned as glyco-acrylamides. These glucose based mono-acrylamide and bis-
acrylamide were made from economically cheap D-glucose as the starting
material, in a high yielding reaction sequence, consisting of few steps.

Chapter 7
189
A synthetic glycopolymeric hydrogel was made from these molecules using
gamma radiation induced crosslinking. This hydrogel matrix was synthesized with
an aim to develop a new targeted drug delivery vehicle. Since glycopolymers can
selectively recognize the lectins, which are carbohydrate interacting proteins,
present on the cell surface and are responsible for a number of biological events,
we expected that the synthesized glycopolymeric hydrogel (Glc-gel) would be of
great importance in biomedical field. The Glc-gel showed specificity to lectin
concanavalin A, which is a glucose/mannose binding lectin.
To test the applicability of the glycopolymeric gel in targeted drug delivery, a
hydrogel bead of N-succinyl chitosan was made, which was mechanically
stabilized by Glc-gel network. This network not only renders stability but also
helps to guide the gel bead to the target site. N-succinyl chitosan was chosen
because of its well known biocompatibility, long systemic circulation time and
appropriate water solubility. Chitosan was succinylated to different degrees of
75% and 88%. The calcium ion crosslinked beads thus synthesized were utilized
for DOX loading and it was observed that we can tune the extent of loading by
varying the degree of succinylation. The DOX delivery was studied in simulated
body fluids under varying pH conditions. This matrix showed a slow and
sustained delivery of the drug over a period of 18 days and also displayed
specificity to lectin Con A. The drug release was faster in acidic pH rather than
normal body fluid conditions making it a localized drug delivery vehicle. Another
important feature of this bead was that it started degradation after 3-4 hours of

Chapter 7
190
delivery due to leaching out of NSC, but still maintaining its spherical shape.
Hence it is a self degrading system which can be a suitable candidate to satisfy the
localized and targeted drug delivery needs of the biomedical industry.
Fluorescent nanoparticles are always in demand both in industry as well in
biomedical field. The glyco-acrylamides can also form such fluorescent
nanoparticles due to their hydrogen bond induced self assembly leading to AIE.
The major outcome of this work was that we were able to synthesize a material
which can self assemble in water with good solubility, emit at varying
wavelengths depending on the excitation and most importantly the emissions were
pH dependent. The self assembled glyco-acrylamides can act as a biosensor for
lectins like Con A. Sensing is generally done by observing variation in some
property of the material which can be measured. Fluorescence “turn on” is one of
the best way of sensing since it eliminates unnecessary noise and background.
Glc-acryl showed better fluorescence enhancement compared to Glc-bis, which
was also clear from its binding studies with Con A. The LOD for Con A in the
case of Glc-acryl is in the picomolar range. Also these glyco-acrylamides were
found to perform as good cell imaging agents. They can penetrate in to the cell
cytoplasm and exhibit good emission and dispersability even in the body fluid
conditions. The double bond/hemiacetal groups which are freely available could
also help us to integrate other functional components like drugs, imaging agents,
targeting agents, etc. which can widen the scope of the synthesized glyco-
acrylamides. Therefore multifunctional theranostic platforms can be manufactured

Chapter 7
191
using these glyco-acrylamides, which can find wide range of biomedical
applications.
7.2. Future Scope
Currently lot of work has been carried out in developing new polymers as well as
modifying the naturally existing ones to generate a system which cater the
demands of the biomedical industry. This thesis is also a dedicated effort to
introduce systems which are biocompatible, non cytotoxic, biodegradable and
economical. Also we have attempted to utilize radiation technology which in
future could be extended to make more advanced systems. Gum acacia and N-
succinyl chitosan are derived from natural products which can be utilized in
biomedical field without any worries of toxicity, biodegradability etc. We have
also emphasized on the extensive applications of carbohydrate chemistry through
the glyco-acrylamides as well as the glycopolymers synthesized from them. The
future scope of the carbohydrate chemistry lies in the fact that precise
biorecognition properties can be achieved by an absolute control over the
microstructure of the glycopolymers. The carbohydrate units critically control the
specific biological functions of the cells and play a major role in cell-cell
recognition. The advances in synthetic chemistry allow us to prepare well defined
and multifunctional glycopolymers in a facile manner.
Targeted drug delivery vehicles are in increasing demand, especially those can
exhibit slow and sustained delivery properties. In the global drug delivery market
the largest segment is for targeted systems, which reached $80.2 billion in 2014.

Chapter 7
192
Incorporating an existing medicine in to a new drug delivery system can enhance
its performance in terms of its efficacy, safety and patient compliance. The
increasing need for delivery of drug with minimal side effects has prompted
pharmaceutical industries to develop new drug delivery systems. Also localized
delivery systems like microspheres or beads could find application in delivering
drugs to sites less accessible to systemic circulation or those which degrade in the
systemic circulation. In future, drugs are going to be more challenging in terms of
delivery system development, which makes it a more exiting task ahead.


References
193
References
1. N. Kashyap, N. Kumar and M. N. V. Ravi Kumar, Critical Review in Therapeutic Drug
Carrier Systems, 2005, 22,107.
2. B. D. Ratner and A. S. Hoffman, ACS Symposium Series, 1976, 31, 1.
3. M. R. Huglin, CRC Press, Boca Raton, FL, 1-3, 1987.
4. K. Park, W. S. W. Shalaby and H. E. Park, Technomic, Lancaster, PA, 1993.
5. L. Varshney, Nuclear Instruments and Methods in Physics Research B, 2007, 255, 343.
6. Z. Ajji, I. Othman and J. M. Rosiak, Nuclear Instruments and Methods in Physics Research
B, 2005, 229, 375.
7. Y. N. Rao, D. Banerjee, A. Datta, S. K. Das, R. Guin and A. Saha, Radiation Physics and
Chemistry, 2010, 79, 1240.
8. S. H. Allan, Advanced Drug Delivery Reviews, 2002, 54, 3.
9. G. Iwona and H. Janik, Chemistry and Chemical Technology, 2010, 4, 297.
10. (a) Y. Liu, H. Meng, S. Konst, R. Sarmiento, R. Rajachar and B. P. Lee, ACS Applied
Material Interfaces, 2014, 6, 16982; (b) S. Skelton, M. Bostwick, K. O'Connor, S. Konst, S.
Casey and B. P. Lee, Soft Matter, 2013, 9, 3825.
11. G. Marcelo, M. López-González, F. Mendicuti, M. P. Tarazona, M. Valiente,
Macromolecules, 2014, 47, 6028.
12. P. Thoniyot, M. J. Tan, A. A. Karim, D. J. Young and X. J. Loh, Advanced Science, 2015, 2,
1400010.

References
194
13. K. Vimala, K. S. Sivudu, Y. M. Mohan, B. Sreedhar and K. M. Raju, Carbohydrate
Polymers, 2009, 75, 463.
14. G. R. Bardajee, Z. Hooshyar and H. Rezanezhad, Journal of Inorganic Biochemistry. 2012,
117, 367.
15. Y. M. Mohan, K. Lee, T. Premkumar and K. E. Geckeler, Polymer, 2007, 48, 158.
16. Q.-B. Wei, F. Fu, Y.-Q. Zhang and L. Tang, Journal of Polymer Research, 2014, 21, 1.
17. K. A. Juby, C. Dwivedi, M. Kumar, S. Kota, H. S. Misra and P. N. Bajaj, Carbohydrate
Polymers, 2012, 89, 906.
18. R.-C. Luo, Z. H. Lim, W. Li, P. Shi and C.-H. Chen, Chemical Communications, 2014, 50,
7052.
19. Y.-Q. Ma, J.-Z. Yi and L.-M. Zhang, Journal of Macromolecular Science, Part A: Pure and
Applied Chemistry, 2009, 46, 643.
20. H. L. Abd El-Mohdy, Journal of Polymer Research, 2013, 20, 1.
21. C. Wang, N. T. Flynn and R. Langer, Advanced Materials, 2004, 16, 1074.
22. M. Liu, Y. Ishida, Y. Ebina, T. Sasaki and T. Aida, Nature Communications, 2013, 4, 2029.
23. L. S. Nair and C. T. Laurencin, Journal of Biomedical Nanotechnology, 2007, 3, 301.
24. H. Oka, T. Tomioka, K. Tomita, A. Nishino and S. Ueda, Metal-Based Drugs, 1994, 1, 511.
25. A. Oloffs, C. Crosse-Siestrup, S. Bisson, M. Rinck, R. Rudolvh and U. Gross, Biomaterials,
1994, 15, 753.
26. T. Tokumaru, Y. Shimizu and C. L. Fox, Research communications in chemical pathology
and pharmacology. 1984, 8,151.
27. G. V. James, Water treatment, 1971, 4th ed., p. 38. CRC Press, Cleveland, OH.

References
195
28. M. Herrera, P. Carrion, P. Baca, J. Liebana and A. Castillo, Microbios, 2001, 104, 141.
29. Y. Matsumura, K. Yoshikata, S. Kunisaki and T. Tsuchido, Appied. Environmental
Microbiology, 2003, 69, 4278.
30. M. Bosetti, A. Masse, E. Tobin and M. Cannas, Biomaterials, 2002, 23, 887.
31. P. Li, J. Li, C. Wu, Q. Wu and J. Li, Nanotechnology, 2005,16,1912.
32. I. Sondi and B. Salopek-Sondi, Journal of Colloid and Interface Science, 2004, 275,177.
33. J. L. Elechiguerra, J. L. Burt, J. R. Morones, A. Camacho-Bragado, X. Gao, H. H. Lara and
M. J. Yacaman, Journal of Nanobiotechnology, 2005, 3, 6.
34. J. R. Morones, J. L. Elechiguerra, A. Camacho, K. Holt, J. B. Kouri, J. T. Ramirez and M. J.
Yacaman, Nanotechnology, 2005, 16, 2346.
35. D. E. Owens, J. K. Eby, Y, Jian and N. A. Peppas, Journal of Biomedical Materials Research
Part A, 2007, 83, 692.
36. A. K. Gaharwar, N. A. Peppas and A. Khademhosseini, Biotechnology and Bioengineering,
2014, 111, 441.
37. K.Y. Lee and D. J. Mooney, Chemical Reviews, 2001, 101, 1869.
38. H. J. v-d Linden, S. Herber, W. Olthuis and P. Bergveld, Analyst, 2003, 128, 325.
39. A. C. Jen, M. C. Wake and A. G. Mikos, Biotechnology and Bioengineering, 1996, 50, 357.
40. K. Wang, J. Burban and E. Cussler, Responsive gels: volume transitions II , 1993, 67.
41. S. L. Bennett, D. A. Melanson, D. F. Torchiana, D. M. Wiseman and A. S. Sawhney, Journal
of Cardiac Surgery, 2003,18, 494.
42. T. R. Hoare and D. S. Kohane, Polymer, 2008, 49, 1993.

References
196
43. C. S. Satish, K. P. Satish and H. G. Shivakumar, Indian Journal of Pharmaceutical Sciences,
2006, 68, 133.
44. O. Wichterle and D. Lim, Nature, 1960, 185, 117.
45. N. A. Peppas and A.G. Mikos, N.A. Peppas, Eds,. In Preparation Methods and Structure of
Hydrogels, Hydrogels in Medicine and Pharmacy, Vol I, CRC Press, Boca Raton, FL, 986, 1.
46. N.A, Peppas and E.W, Merrill, Journal of Applied Polymer Science, 1977, 21, 1763.
47. P. Kofinas, V. Athanasssiou and E. W. Merrill, Biomaterials, 1996, 17, 1547.
48. E. W. Merrill, K. A. Dennison and C. Sung, Biomaterials, 1993, 14, 1117.
49. J. L. Stringer and N.A. Peppas, Journal of Controlled Release, 1996, 42, 195.
50. E. Jabbari and S. Nozari, European Polymer Journal, 2000, 36, 2685.
51. N. A. Peppas, Hydrogels in Medicine and Pharmacy, 1986, vol. 1–3, CRC Press, Boca
Raton, FL, 180.
52. B. Amsden, Macromolecules, 1998, 31, 8382.
53. L. Masaro and X. X. Zhu, Progress in Polymer Science, 1999, 24, 731.
54. N. A. Peppas, Y. Huang, M. Torres-Lugo, J. H. Ward and J. Zhang, Annual Review of
Biomedical Engineering. 2000, 2, 9.
55. M. Chasin and R. Langer. (eds), Biodegradable Polymers as Drug Delivery Systems, New
York, Marcel Dekker, 1990
56. Y. W. Chien, Novel Drug Delivery Systems, New York, Marcel Dekker, 1982.
57. N. A. Peppas, P. Bures, W. Leobandung and H. Ichikawa, European Journal of
Pharmaceutics and Biopharmaceutics. 2000, 50, 27.
58. J. Siepmann and N. A. Peppas, Advanced Drug Delivery Reviews, 2001, 48, 139.

References
197
59. M. A. Rice, J. Sanchez-Adams and K. S. Anseth, Biomacromolecules, 2006, 7, 1968.
60. R. A. Dwek, Chemical Reviews, 1996, 96, 683.
61. H. Lis and N. Sharon, Chemical Reviews, 1998, 98, 637.
62. J. J. Lundquist and E. J. Toone, Chemical Reviews, 2002,102, 555.
63. M. Mammen, S.-K. Chio and G. M. Whitesides, Angewandte Chemie International Edition,
1998, 37, 2754.
64. Y. Miura, Journal of Polymer Science Part A: Polymer Chemistry, 2007, 45, 5031.
65. V. Horoejsí, O. Chaloupecká and J. Kocourek, Biochimica et Biophysica Acta (BBA) -
General Subjects, 1978, 539, 287.
66. C. J. Hawker and K. L. Wooley, The convergence of synthetic organic and polymer
chemistries Science, 2005, 309, 1200.
67. L. L. Kiessling, L. E. Strong and J. E. Gestwicki, Principles for multivalent ligand design,
Annual Reports in Medicinal Chemistry, Academic Press Inc., San Diego, 2000, 321.
68. B. Voit and D. Appelhans, Macromolecular Chemistry and Physics, 2010, 211, 727.
69. R. Roy, F. D. Tropper and A. Romanowska, Bioconjugate Chemistry, 1992, 3, 256.
70. M. Okada, Progress in Polymer Science, 1992, 26, 67.
71. D. M. Haddleton, R. Edmonds, A. M. Heming, E. J. Kelly and D. Kukulj, New Journal of
Chemistry, 1999, 23, 477.
72. K. Ohno, Y. Tsujii and T. Fukuda, Journal of Polymer Science Part A: Polymer Chemistry,
1998, 36, 2473.
73. S. R. S. Ting, A. M. Granville, D. Quémener, T. P. Davis, M. H. Stenzel and C. Barner-
Kowollik, Australian Journal of Chemistry, 2007, 60, 405.

References
198
74. R. Roy, F. D. Tropper and A. Romanowska, Bioconjugate Chemistry, 1992, 3, 256.
75. V. Ladmiral, E. Melia and D. M. Haddleton, European Polymer Journal, 2004, 40, 431.
76. R. Roy, Trends in Glycoscience and Glycotechnology, 1996, 8, 79.
77. S. Slavin, J. Burns, D. M. Haddleton and C. R. Becer, European Polymer Journal, 2011, 47,
435.
78. M. C. García-Oteiza, M. Sánchez-Chaves and F. Arranz, Macromolecular Chemistry and
Physics, 1997, 198, 2237.
79. R. A. Dwek , Chemical Reviews, 1996, 96, 683.
80. N. Sharon and H. Lis, Scientific American, 1993, 268, 82.
81. N. Sharon and H. Lis, Science, 1989, 246, 227.
82. E. E. Simanek, G. J. McGarvey, J. A. Jablonowski and C.-H. Wong, Chemical Reviews.
1998, 98, 833.
83. Y.C. Lee and R.T. Lee, Accounts of Chemical Research, 1995, 28, 321.
84. H. Lis and N. Sharon, Chemical Reviews, 1998, 98, 637.
85. M. Ambrosi, N. R. Cameron and B. G. Davis, Organic and Biomolecular Chemistry, 2005, 3,
1593.
86. R. Loris, T. Hamelryck, J. Bouckaert and L. Wyns, Biochimica et Biophysica Acta (BBA) -
Protein Structure and Molecular Enzymology, 1998, 1383, 9.
87. N. Sharon, Trends in Biochemical Sciences, 1993, 18, 221.
88. R. J. Pieters, Organic and Biomolecular Chemistry, 2009, 7, 2013.
89. C. S. Wright, Journal of Molecular Biology, 1987, 194, 501.
90. D. C. Kilpatrick, Biochimica et Biophysica Acta (BBA) - General Subjects, 2002, 1572, 187.

References
199
91. L. A. J. M. Sliedregt, P. C. N. Rensen, E. T. Rump, P. J. Van Santbrink, M. K. Bijsterbosch,
A. R. P. M. Valentijn, G. A. Vander Marel, J. H. Van Boom, T. J. C. Van Berkel and E. A. L.
Biessen, Journal of Medicinal Chemistry, 1999, 42, 609.
92. A. David, P. Kopeckova, A. Rubinstein and J. Kopecek, Bioconjugate Chemistry, 2001, 12,
890.
93. P. R. Taylor, L. Martinez-Pomares, M. Stacey, H. H. Lin, G. D. Brown and S. Gordon,
Annual Review of Immunology, 2005, 23, 901.
94. H. Leffler, S. Carlsson, M. Hedlund, Y. N. Qian and F. Poirier, Glycoconjugate Journal,
2002, 19, 433.
95. B. Ernst, G. W. Hart and P. Sinaý, Carbohydrates in Chemistry and Biology, Wiley-VCH
Verlag GmbH, 2000,1045.
96. K. Landsteiner, The Specificity of Serological Reactions, Dover, New York, 1962.
97. L. R. Olsen, A. Dessen, D. Gupta, S. Sabesan, J. C. Sacchettini and C. F. Brewer,
Biochemistry, 1997, 36, 15073.
98. E. Freire, O. L. Mayorga and M. Straume, Analytical Chemistry, 1990, 62, 950A.
99. C. W. Cairo, J. E. Gestwicki, M. Kanai and L. L. Kiessling, Journal of American Chemical
Society, 2002, 124, 1615.
100. Z. Deng, S. Li, X. Jiang and R. Narain, Macromolecules, 2009, 42, 6393.
101. Q. Yang, M.-X. Hu, Z.-W. Dai, J. Tian and Z.-K. Xu, Langmuir, 2006, 22, 9345.
102. T. Furuike, N. Nishi, S. Tokura and S.-I. Nishimura, Macromolecules, 1995, 28, 7241.
103. Y. Hong, J. W. Y. Lam and B. Z. Tang, Chemical Society Reviews, 2011, 40, 5361.

References
200
104. Q. Peng, Y. Yi, Z. Shuai and J. Shao, Journal of American Chemical Society, 2007, 129,
9333.
105. A. Iida and S. Yamaguchi, Chemical Communications, 2009, 21, 3002.
106. Z. Jovanovic´, A. Krkljeˇs, J. Stojkovska, S.Tomic´, B. Obradovic´, V. Miˇskovic´-
Stankovic´ and Z. Kacˇarevic´-Popovic´, Radiation Physics and Chemistry, 2011, 80,
1208.
107. L. Varshney, Nuclear Instruments and Methods in Physics Research B, 2007, 255, 343.
108. V. K. Sharma, R. A. Yongard and Y. Lin, Advances in Colloid and Interface Science,
2009, 145, 83.
109. H. Kong and J. Jang, Langmuir, 2008, 24, 2051.
110. V. Thomas, M. Namdeo, Y. M. Mohan, S. K. Bajpai and M. Bajpai, Journal of
Macromolecular Science Part A: Pure Applied Chemistry, 2008, 45, 107.
111. V. Thomas, Y. M. Mohan, B. Sreedhar and S. K. Bajpai, Journal of Biomaterial Science,
Part A: Polymer Edition, 2009, 20, 2129.
112. S. K. Bajpai, Y. M. Mohan, M. Bajpai, R. Tankhiwale and V. Thomas, Journal of
Nanoscience and Nanotechnology, 2007, 7, 2994.
113. Y. Dror, Y. Cohen and R. Yerushalmi-Rozen, Journal of Polymer Science: Part B:
Polymer Physics, 2006, 44, 3265.
114. Y. N. J. Rao, D. Banerjee, A. Datta, S. K. Das, R. Guin and A. Saha, Radiation Physics
and Chemistry, 2010, 79, 1240.
115. S. Lu, W. Gao and H. Y. Gu, Burns, 2008, 34, 623.

References
201
116. K. Vimala, Y. M. Mohan, K. Varaprasad, N. N. Reddy, S. Ravindra, N. S. Naidu and K.
M. Raju, Journal of Biomaterials and Nanobiotechnology, 2011, 2, 55.
117. J. Malý, H. Lampová, A. Semerádtová, M. Štofik and L. Kováčik, Nanotechnology,
2009, 20, 385101.
118. K. Varaprasad, Y. M. Mohan, K. Vimala and K .M. Raju, Journal of Applied Polymer
Science, 2011, 121, 784.
119. S. Francis, L. Varshney and K. Tirumalesh, Radiation Physics and Chemistry, 2006, 75,
747.
120. D. Mahl, J. Diendorf, W. Meyer-Zaika and M. Epple, Colloids and Surfaces A:
Physicochemical and Engineering Aspects, 2011, 377, 386.
121. T. Fuchs, W. Richtering, W. Burchard, K. Kajiwara and S. Kitamura, Polymer Gels and
Networks, 1997, 5, 541.
122. F. Chambon, Z. S. Petrovic, W. J. MacKnight and H. H. Winter, Macromolecules, 1986,
19, 2146.
123. A. B. Rodd, J. J. Cooper-white, D. E. Dunstan and D. V. Boger, Polymer, 2001, 42, 3923.
124. A. B. Rodd, J. J. Cooper-white, D. E. Dunstan and D.V. Boger, Polymer, 2001, 42, 185.
125. S. Francis, L. Varshney and M. Kumar, Radiation Physics and Chemistry, 2004, 69, 481.
126. A. Montembault, C. Viton and A. Domard, Biomaterials, 2005, 26, 1633.
127. C. Sandolo, P. Matricardi, F. Alhaique and T. Coviello, Food hydrocolloids, 2009, 23,
210.
128. (a) N. Peppas, Hydrogels in Medicine and Pharmacy (CRC) Boca Raton, Florida, 1987.
(b) N. Vyavahare and J. Kohn, Journal of Polymer Science, 1994, 32, 1271. (c) R.

References
202
Bahulekar, T. Tokiwa, J. Kano, T. Matsumura, I. Kojima and M. Kodama, Carbohydrate
Polymers, 1998, 37, 71. (d) G. Wulff, J. Schmid and T. Venhoff, Macromolecular
Chemistry and Physics, 1996, 197, 259. (e) M. J. Carneiro, A. Fernandes, C. M.
Figueiredo, A. G. Fortes and A. M. Freitas, Carbohydrate Polymers, 2001, 45, 135.
129. J-Y. Sun, X. Zhao, W. R. K. Illeperuma, O. Chaudhuri, K. H. Oh, D. J. Mooney, J. J.
Vlassak and Z. Suo, Nature, 2012, 489, 133.
130. (a) N. A. Peppas, P. Bures, W. Leobandung and H. Ichikawa, European Journal of
Pharmaceutics and Biopharmaceutics, 2000, 50, 27. (b) N. Bhattarai, J. Gunn and M.
Zhang, Advanced Drug Delivery Reviews, 2010, 62, 83. (c) O. Wichterle and D. Lim,
Nature, 1960, 185, 117. (d) R. Yoshida, K. Uchida, Y. Kaneko, K. Sakai, A. Kikuchi, Y.
Sakurai and T. Okano, Nature, 1995, 374, 240. (e) Q. Wang, J. S. Dordick and R.
Linhardt, Chemistry of Materials, 2002, 14, 3232. (f) A. S .Hoffman, Advanced Drug
Delivery Reviews, 2002, 54, 3.
131. (a) E. A. Appel, X. J. Loh, S. T. Jones, F. Biedermann, C. A. Dreiss and O.A. Scherman,
Journal of American Chemical Society, 2012, 134 , 11767. (b) M. Kurecic, M. Sfiligoj-
Smole and K. Stana-Kleinschek, Materials and Technology, 2012, 46, 87.
132. (a) V. Ladmiral, E. Melia and D. M. Haddleton, European Polymer Journal, 2004, 40,
431. (b) S. Slavin, J. Burns, D. M. Haddleton and C. R. Becer, European Polymer
Journal, 2011, 47, 435.
133. (a) J. F. Lutz, O. Akdemir and A. Hoth, Journal of American Chemical Society, 2006,
128, 13046. (b) J. F. Lutz and A. Hoth, Macromolecules, 2006, 39, 893. (c) J. Tavakoli,
E. Jabbari, M. E. Khosroshahi and M. Boroujerdi, Iranian Polymer Journal, 2006, 15,

References
203
891. (d) M. A. Casadei, G. Pitarresi, R. Calabrese, P. Paolicelli and G. Giammona,
Biomacromolecules, 2008, 9, 43.(e) H. Shin, J. W. Nichol and A. Khademhosseini, Acta
Biomaterialia, 2011, 7, 106. (f) X. Chen, B. D. Martin, T. K. Neubauer, R. J. Linhardt, J.
S. Dordick and D. G. Rethwisch, Carbohydrate Polymers, 1995, 28, 15.
134. (a) J. S. Dordick, R. J. Linhardt and D. G. Rethwisch, ChemTech, 1994, 24, 33. (b) X. M.
Chen, J. S. Dordick and D. G. Rethwisch, Macromolecules, 1995, 28, 6014. (c) R.
Bahulekar, T. Tokiwa, J. Kano, T. Matsumura, I. Kojima and M. Kodama, Carbohydrate
Polymers, 1998, 37, 71. (d) J. K. F. Suh and H. W. T. Matthew, Biomaterials, 2000, 21,
2589. (e) S. H. Kim, M. Goto, C. S. Cho and T. Akaike, Biotechnology Letters, 2000, 22,
1049.
135. (a) N. Sharon and H. Lis, Scientific American, 1993, 268, 82. (b) R. A. Dwek, Chemical
Reviews, 1996, 96, 683. (c) Y. C. Lee and R. T. Lee, Accounts of Chemical Research,
1995, 28, 321. (d) E. E. Simanek, G. J. McGarvey, J. A. Jablonowski and C. -H. Wong,
Chemical Reviews, 1998, 98, 833. (e) A. Pfaff, L. Barner, A. H. E. Müller and A. M.
Granville, European Polymer Journal, 2011, 47, 805.
136. J. Kopecek, P. Kopeckova, H. Brondsted, R. Rathi, B. Rihova, P. Y. Yeh and K. Ikesue,
Journal of Controlled Release, 1992, 19, 121.
137. (a) S. Nandi, H. -J. Altenbach, B. Jakob, K. Lange, R. Jhizane, M. P. Schneider, Ü. Gün
and A. Mayer, Organic Letters, 2012, 14, 3826. (b) A. R. Hirst, I. A. Coates, T. R.
Boucheteau, J. F. Miravet, B. Escuder, V. Castelletto, I. W. Hamley and D. K. Smith,
Journal of American Chemical Society, 2008, 130, 9113. (c) K. A. Houton, K. L. Morris,
L. Chen, M. Schmidtmann, J. T. A. Jones, L. C. Serpell, G. O. Lloyd and D. J. Adams,

References
204
Langmuir 2012, 28, 9797. (d) J. Raeburn, A. Z. Cardoso and D. J. Adams, Chemical
Society Reviews, 2013, 42, 5143.
138. (a) N. S. Khelfallah, G. Decher and P. J. Mésini, Macromolecular Rapid
Communications, 2006, 27, 1004. (b) Y. S. Casadio, D. H. Brown, T. V. Chirila, H. -B.
Kraatz and M. V. Baker, Biomacromolecules, 2010, 11, 2949. (c) S. M. Paterson, J.
Clark, K. A. Syubbs, T. V. Chirila and M. V. Baker, Journal of Polymer Science Part A:
Polymer Chemistry, 2011, 49, 4312. (d) B. D. Martin, S. A. Ampofo, R. J. Linhardt and J.
S. Dordick, Macromolecules, 1992, 25, 7081.
139. S. H. Kim, M. Goto and T. Akaike, The Journal of Biological Chemistry, 2001, 276,
35312.
140. B. Cursaru, O. `P. Stănescu and M. Teodorescu, UPB Scientific Bulletin, Series B:
Chemistry and Materials Science, 2010, 72, 99.
141. (a) K. P. R. Kartha, Tetrahedron Letters, 1986, 27, 3415. (b) J. M. J. Tronchet, B. Getile,
J. Ojha-Poncet, G. Moret, D. Schwarzanbach and F. Barblat-Ray, Carbohydrate
Research, 1977, 59, 87.
142. (a) Y. Miura, Polymer Journal, 2012, 44, 679 and the references cited therein. (b) V. S.
Shinde and V. U. Pawar, Journal of Applied Polymer Science, 2009, 111, 2607.
143. (a) W. S. Hlavacek, R. G. Posner and A. S. Perelson, Biophysical Journal, 1999, 76,
3031. (b) T. Furuike, N. Nishi, S. Tokura and S. - I. Nishimura, Macromolecules, 1995,
28, 7241. (c) Y. Miura, D. Koketsu and K. Kobayashi, Polymers for Advanced
Technologies, 2007, 18, 647.

References
205
144. (a) R. U. Lemieux, Pure and Applied Chemistry, 1971, 25, 527 and references therein. (b)
S. Wolfe, M. H. Whangbo and D. Mitchell, Journal of Carbohydrate Research, 1979, 69,
1. (c) V. G. S. Box, Heterocycles, 1990, 31, 1157. (d) I. Tvaroska and T. Bleha, Advances
in Carbohydrate Chemistry and Biochemistry, 1989, 47, 45.
145. L. -M. Stefan, A. -M. Pana, G. Bandur, P. Martin, M. Popa and L. -M. Rusnac, Journal of
Thermal Analysis and Calorimetry, 2013, 111, 789.
146. (a) J. D. Ferry, Viscoelastic Properties of Polymers,Wiley, New York, 1961.(b) J. You, J.
Zhou, Q. Li and L. Zhang, Langmuir, 2012, 28, 4965. (c) O. Okay and W. Oppermann,
Macromolecules, 2007, 40, 3378.
147. M. J. Moura, M. M. Figueiredo and M. H. Gil, Biomacromolecules, 2007, 8, 3823.
148. X. Li, X. Kong, Z. Zhang, K. Nan, L. Li, X. Wang and H. Chen, International Journal of
Biological Macromolecules, 2012, 50, 1299.
149. M. Jaiswal, V. Koul, Journal of Biomaterials Applications, 2013, 27, 848.
150. L. Jiawei, Z. Weidong, R. Sarah-Jane, G. I. Matthew and C. Gaojian, Polymer Chemistry,
2014, 5, 2326.
151. M. Chen, W. Feng, S. Lin, C. He, Y. Gao, and H. Wang, RSC Advances, 2014, 4, 53344.
152. Q. Wang, and A. Q. Wang, Journal of Functional Polymer, 2004, 17, 51 (in Chinese).
153. S. Feng, and S. Chien, Chemical Engineering Science, 2003, 58, 4087.
154. M. Singh, S. Kundu, A. M. Reddy, V. Sreekanth, R. K. Motiani, S. Sengupta, A.
Srivastava and A. Bajaj, Nanoscale, 2014, 6, 12849.
155. X. Zhao, L. Yang, X. Le, X. Jia, L. Liu, J. Zeng, J. Guo and P. Liu, Bioconjugate
Chemistry, 2015, 26,128.

References
206
156. H. Freichels, R. Jerome and C. Jerome, Carbohydrate Polymers, 2011, 86, 1093.
157. M. L. Huan, S. Y. Zhou, Z. H. Teng, B. L. Zhang, X. Y. Liu, . P. J. Wang and Q. B. Mei,
Bioorganic and Medicinal Chemistry Letters, 2009, 19, 2579.
158. B. S. Chhikara, N. Jean, D. Mandal, A. Kumar and K. Parang, European Journal of
Medicinal Chemistry, 2011, 46, 2037.
159. M. Talelli, K. Morita, C. J. Rijcken, R. W. Aben, T. Lammers, H. W. Scheeren, C. F. van
Nostrum, G. Storm and W. E. Hennink, Bioconjugate Chemistry, 2011, 22, 2519.
160. J. J. Lundquist and E. J. Toone, Chemical Reviews, 2002, 102, 555.
161. H. T. Ta, C. R. Dass, I. Larson, P. F. M. Choong and D. E. Dunstan, Biomaterials, 2009,
30, 3605.
162. J. H. Maeng, D. H. Lee, K. H. Jung, Y. H. Bae, I. S. Park, S. Jeong, Y. S. Jeon, C. K.
Shim, W. Kim, J. Kim, J. Lee, Y. M. Lee, J. H. Kim, W. H. Kim and S. S. Hong,
Biomaterials, 2010, 31, 4995.
163. C. Zhang, W. Wang, T. Liu, Y. Wu, H. Guo, P. Wang, Q. Tian, Y. Wang and Z. Yuan,
Biomaterials, 2012, 33, 2187.
164. K. C. Weng, C. O. Noble, B. P-Sternberg, F. F. Chen, D. C. Drummond, D. B. Kirpotin,
D. H. Wang, Y. K. Hom, B. Hann and J. W. Park, Nano Letters, 2008, 8, 2851.
165. D. D. Von Hoff, M. Rozencweig and M. Piccart, Seminars in Oncology, 1982, 9, 23.
166. P. Singal, N. Iliskovic, T. Li and D. Kumar, FASEB Journal, 1997, 11, 931.
167. L. J. Goldstein, H. Galski, A. Fojo, M. Willingham, S-L. Lai, A, Gazdar, R. Pirker, A.
Green, W. Crist, G. M. Brodeur, M. Lieber, J. Cossman, M. M. Gottesman and I.
Pastan, Journal of the National Cancer Institute, 1989, 81, 116.

References
207
168. Y. Bae, S. Fukushima, A. Harada and K. Kataoka, Angewandte Chemie International
Edition, 2003, 42, 4640.
169. J. Shi, W. Guobao, H. Chen, W. Zhong, X. Z. Qiu and M. M. Q. Xing, Polymer
Chemistry, 2014, 5, 6180.
170. M. Dadsetana, Z. Liu, M. Pumberger, C. V. Giraldo, T. Ruesink, L. Lu and M. J.
Yaszemski, Biomaterials, 2010, 31, 8051.
171. C. Duan, J. Gao, D. Zhang, L. Jia, Y. Liu, D. Zheng, G. Liu, X. Tian, F. Wang and Q.
Zhang, Biomacromolecules, 2011, 12, 4335.
172. Y. Kato, H. Onishi and Y. Machida, Biomaterials, 2004, 25, 907.
173. S. M. Moghimi, A. C. Hunter and J. C. Murray, Pharmacological Reviews, 2001, 53,
283.
174. Y. Kato, H. Onishi and Y. Machida, Biomaterials, 2000, 21, 1579.
175. Y. Matsumura and H. Maeda, Cancer Research, 1986, 46, 6387.
176. H. Maeda, Advances in Enzyme Regulation, 2001, 41, 189.
177. H. Maeda, J. Wu, T. Sawa, Y. Matsumura and K. Hori, Journal of Controlled Release,
2000, 65, 271.
178. H. Maeda and Y. Matsumura, Critical Reviews in Therapeutic Drug Carrier Systems,
1989, 6, 193.
179. Y. N. Dai, P. Li, J. P. Zhang, A.Q. Wang and Q. Wei, Biopharmaceutics and Drug
Desposition, 2008, 29, 173.
180. J. K. Ajish, K. S. A. Kumar, M. Subramanian and M. Kumar, RSC Advances, 2014, 4,
59370.

References
208
181. D. Das, P. Ghosh, S. Dhara, A. B. Panda and S. Pal, ACS Applied Materials &
Interfaces, 2015, 7, 4791.
182. C. Ding, L. Zhao, F. Liu, J. Cheng, J. Gu, S. Dan, C. Liu, X. Qu and Z. Yang,
Biomacromolecules, 2010, 11, 1043.
183. Z. Aiping, C. Tian, Y. Langue, W. Hao and L. Ping, Carbohydrate Polymers, 2006, 66,
274.
184. C. Yan, D. Chen, J. Gu, H. Hu, X. Zhao and M. Qiao, Pharmaceutical Society of Japan,
2006, 126, 789.
185. M. Gonçalves, P. Figueira, D. Maciel, J. Rodrigues, X. Shi, H. Tomás and Y. Li,
Macromolecular Bioscience, 2014, 14, 110.
186. P. Yousefpour, F. Atyabi, E. V. Farahani, R. Sakhtianchi and R. Dinarvand, Int. J.
Nanomedicine, 2011, 6, 1487.
187. N. N. Mobarak and Md. P. Abdullah, The Malaysian Journal of Analytical Sciences,
2010, 14, 82.
188. X. Y. Hu, L. D. Feng, A. M. Xie, W. Wei, S. M. Wang, J. F. Zhang and W. Dong,
Journal of Material Chemistry B, 2014, 2, 3646.
189. X. Y. Hu, L. D. Feng, W. Wei, A. M. Xie, S. M. Wang, J. F. Zhang and W. Dong,
Carbohydrate Polymers, 2014, 105, 135.
190. A. H. Xiu, Y. Kong, M. Y. Zhou, B. Zhu, S. M. Wang and J. F. Zhang, Carbohydrate
Polymers, 2010, 82, 623.
191. E. Jabbari, N. Wisniewski and N. A. Peppas, Journal of Controlled Release, 1993, 26, 99.

References
209
192. M. V. Dinu, M. M. Perju and E. S. Dragan, Macromolecular Physics and Chemistry,
2011, 212, 240.
193. M. K. Rao, B. Mallikarjuna, K. K. S. V. Rao, K. Sudhakar, C. K. Rao and M. C. S.
Subha, International Journal of Polymeric Materials and Polymeric Biomaterials, 2013,
62, 565.
194. H. Zhang, Y. Dong, L. Wang, G. Wang, J. Wu, Y. Zheng, H. Yang and S. Zhuc, Journal
of Material Chemistry, 2011, 21, 13530.
195. Y. Liu, V. S. Bryantsev and M. S. Diallo, Journal of American Chemical Society, 2009,
131, 2798.
196. B. Manocha and A. Margaritis, Journal of Nanomaterials, 2010, Article ID 780171,
doi:10.1155/2010/780171.
197. R. Jin, L. S. M. Teixeira, P. J. Dijkstra, M. Karperien, C. A. van Blitterswijk, Z. Y. Zhong
and J. Feijen, Biomaterials, 2009, 30, 2544.
198. W. G. Duan, C. H. Chen, L. B. Jiang and G. H. Li, Carbohydrate Polymers, 2008, 73,
582.
199. M. C. I. M. Amin, N. Ahmad, N. Halib and I. Ahmad, Carbohydrate Polymers, 2012, 88,
465.
200. R. W. Korsemeyer, R. Gurny, E. Doelker, P. Buri and N. A. Peppas, International
Journal of Pharmaceutics, 1983, 15, 25.
201. J. Mei, N. L. C. Leung, R. T. K. Kwok, J. W. Y. Lam and B. Z. Tang, Chemical Reviews,
2015, 115, 11718.

References
210
202. J. Luo, Z. Xie, J. W. Y. Lam, L. Cheng, H. Chen, C. Qiu, H. S. Kwok, X. Zhan,
Y. Liu, D. Zhuc and B. Z. Tang, Chemical Communications, 2001, 18, 1740.
203. Y. Hong, J. W. Y. Lam and B. Z. Tang, Chemical Communications, 2009, 29, 4332.
204. J. Mei, Y. Hong, J. W. Lam, A. Qin, Y. Tang and B. Z. Tang. Advanced materials,
2014, 26, 5429.
205. M. S. Mathew, K. Sreenivasan and K. Joseph, RSC Advances, 2015, 5, 100176.
206. Y. Hong, J. W. Y. Lam and B. Z. Tang, Chemical Society Reviews, 2011, 40, 5361.
207. R. Hu, N. L. C. Leung and B. Z. Tang, Chemical Society Reviews, 2014, 43, 4494.
208. J. Chen, C. C. W. Law, J. W. Y. Lam, Y. Dong, S. M. F. Lo, I. D. Williams, D. Zhu and
B. Z. Tang, Chemistry of Materials, 2003,15, 1535.
209. K-R. Wang, Y-Q. Wang, H-W. An, J-C. Zhang and X-L. Li, Chemistry A European
Journal, 2013, 19, 2903.
210. O. Rusin, V. Kr_l, J. O. Escobedo and R. M. Strongin, Organic Letters, 2004, 6, 1373.
211. A. Makky, J. P. Michel, A. Kasselouri, E. Briand, Ph. Maillard and V. Rosilio, Langmuir,
2010, 26, 12761.
212. T. Sanji, K. Shiraishi, M. Nakamura and M. Tanaka, Chemistry-An Asian Journal, 2010,
5, 817.
213. Q. Guo, T. Zhang, J. An, Z. Wu,Y. Zhao, X. Dai, X. Zhang and C. Li,
Biomacromolecules 2015, 16, 3345.
214. Q. Chen, N. Bian, C. Cao, X. L. Qiu, A. D. Qi and B. H. Han, Chemical
Communications, 2010, 46, 4067.

References
211
215. J. X. Wang, Q. Chen, N. Bian, F. Yang, J. Sun, A. D. Qi, C. G. Yan and B. H. Han,
Organic and Biomolecular Chemistry, 2011, 9, 2219.
216. X. M. Hu, Q. Chen, J. X. Wang, Q. Y. Cheng, C. G. Yan, J. Cao, Y. J. He and B. H. Han,
Chemistry- An Asian Journal, 2011, 6, 2376.
217. K. Shiraishi, T. Sanji and M. Tanaka, Tetrahedron Letters, 2010, 51, 6331.
218. J. Shi, L. Cai, K. Y. Pu and B. Liu, Chemistry-An Asian Journal, 2010, 5, 301.
219. K. Y. Pu, J. Shi, L. Wang, L. Cai, G. Wang and B. Liu, Macromolecules, 2010, 43, 9690.
220. H. Shi, L. Liu, X. Wang and J. Li, Polymer Chemistry, 2012, 3, 1182.
221. I. Otsuka, T. Otsuka, H. Nakade, A. Narumi, R. Sakai, T. Satoh, H. Kaga and T. Kakuchi,
Macromolecules, 2007, 40, 8930.
222. T. Sanji, K. Shiraishi, M. Nakamura and M. Tanaka, Chemistry- An Asian Journal, 2010,
5, 817.
223. H. Bittiger and H. P. Schnebli, Concanavalin A as a Tool, Wiley, London, 1976.
224. K. Wang, X. Zhang, X. Zhang, B. Yang, Z. Li, Q. Zhang, Z. Huanga and Y. Wei,
Polymer Chemistry, 2015, 6, 1360.