Superionic conductivity in lithium argyrodite solid-state ...

Synthesis and Crystal Structure Determination of Ag9FeS4.1Te1.9, theFirst Example of an Iron Containing ArgyroditeDominik Frank,† Birgit Gerke,‡ Matthias Eul,‡ Rainer Pottgen,‡ and Arno Pfitzner†,*†Institut fur Anorganische Chemie, Universitat Regensburg, Universitatsstraße 31, 93040 Regensburg, Germany‡Institut fur Anorganische und Analytische Chemie, Westfalische Wilhelms-Universitat Munster, Corrensstraße 30, 48149 Munster,Germany
*S Supporting Information
ABSTRACT: Ag9FeS4.1Te1.9 was prepared by solid state synthesis from stoichiometricamounts of the elements at 873 K. The compound forms gray crystals which are stable againstair and moisture. The crystal structure was determined by X-ray diffraction from selected singlecrystals. Ag9FeS4.1Te1.9 crystallizes in the space group F4 3m, a = 11.0415(7) Å, V = 1346.1(1)Å3, and Z = 4 (powder data at 293 K). The compound shows a reversible phase transition uponcooling to the space group P213, a = 11.0213(1) Å, V = 1338.75(2) Å3, and Z = 4 (singlecrystal data at 200 K). The title compound is the first example of an iron containing argyrodite-type material with Fe3+ located in tetrahedral sites. Silver atoms are disordered at roomtemperature which was taken into account by nonharmonic refinement of the silver positions.The refinement converged to R1 = 3.51% and wR2 = 10.66% for the room temperaturemeasurement and to R1 = 1.55% and wR2= 5.23% for the 200 K data set (all data). Impedancemeasurements were performed in the temperature range from 323 to 473 K. Ionic conductivityvalues are 1.81 × 10⁻² S cm−1 at 323 K and 1.41 × 10⁻¹ S cm−1 at 468 K. The activation energyis 0.19 eV from 323 to 423 K and 0.06 eV from 393 to 473 K. DTA measurements revealcongruent melting at 907 K. A phase transition temperature of 232 K with an enthalpy of 7.9 kJ/mol was determined by DSCmeasurements. 57Fe Mossbauer spectra show one signal at 298 K and a doublet at 78 K, indicating Fe3+ and structural distortionsupon cooling the samples. Hyperfine field splitting of iron is observed at 5 K. Measurements of the molar susceptibility revealedthat the compound is paramagnetic down to a Neel temperature of TN = 22.1(5) K. Antiferromagnetic ordering is observed atlower temperatures.
KEYWORDS: argyrodite, ion conductor, nonharmonic refinement, Mossbauer spectroscopy, magnetism
■ INTRODUCTION
The mineral Argyrodite Ag8GeS6 was the first representative ofa large family of compounds which is nowadays calledargyrodites. They have been investigated for a long timebecause of their interesting physical and chemical properties.Among these, ionic conductivity is the most prominent one. Itis associated with argyrodites of Li,1,2 Ag,3,4 and Cu.5,6 A hugenumber of argyrodites is known to date due to a manifold ofsubstitution possibilities on the different sites. Kuhs et al.generalized the formula of argyrodites and found severalsubstituted representatives with mixed anion substructure.7
Today argyrodites consisting of mono- or divalent cations A(Cu+, Ag+, Li+, Cd2+, Hg2+), and a tri-, tetra-, or pentavalentcation B forming a complex anion with a chalcogenide ion Q(O2−, S2−, Se2−, Te2−) are known. The general formula isAm+
((12−n−y)/m)Bn+Q2−
6−yX−y. The multivalent cation B must
have an appropriate size and must be capable of formingtetrahedra. Typical multivalent cations are the main groupelements Al3+, Ga3+, Si4+, Ge4+, Sn4+, P5+, As5+, and Sb5+. Alimited number of examples with the transition metals Ti4+,Nb5+, and Ta5+ are also established.8−10 Argyrodites typicallyshow a rich phase transition behavior. Superionic conductivityis a feature which is observed quite often, especially in the high
temperature modification with space group F4 3m. A part of thechalcogen atoms in the structure can be substituted by halideions X (Cl−, Br−, I−) in many cases. Typically, a quaternaryargyrodite in the high-temperature modification is stabilizedeven at ambient temperature. Electroneutrality is achieved inthis case by a decreasing content of the mobile species A. Thehigh mobility of the monovalent cations often results in apronounced disorder of the respective ions, and in the structurerefinements short distances between partially occupiedpositions are observed. These short distances are physicallymeaningless. Strong correlations are usual when the crystalstructures of such compounds are refined. Therefore manycrystal structures were only poorly refined in the past. Theapplication of the Gram-Charlier expansion11 to atomicdisplacement parameters is state of the art to overcome suchproblems. It allows describing the electron density of themobile species without introducing a huge number ofparameters with strong correlations. In addition, it becomespossible to derive structure−property relations for the ion
Received: April 2, 2013Revised: May 14, 2013Published: May 15, 2013
Article
pubs.acs.org/cm
© 2013 American Chemical Society 2339 dx.doi.org/10.1021/cm401057u | Chem. Mater. 2013, 25, 2339−2345
conducting materials based on significant displacementparameters.12 A systematic analysis of the diffusions pathwaysand the conductivity of quaternary copper argyrodites wasreported by Nilges.5,13 Silver argyrodites have been wellinvestigated by Boucher et al.,3 Evain et al.,4 and Belin etal.14 The first Li based argyrodites were recently discovered byDeiseroth et al.1 These compounds show a very high ionicconductivity over a wide temperature range and are of a specialinterest for Li-ion batteries. These are important for electro-motive applications because of the optimum ratio of mass andtransported charge in the case of Li+. Li based argyrodites withphosphorus and arsenic15 have been investigated in quite a bitof detail. Among them are the first oxygen containingexamples.16 Silver and copper containing argyrodites areinteresting for special applications. This holds true especiallyfor the silver compounds due to their low activation energies.Moreover, the structural concepts derived from the prettystable Cu and Ag materials are transferable to Li argyrodites,which are quite sensitive to air and moisture. Herein, we reporton the synthesis and characterization of Ag9FeS4.1Te1.9. Thecompound is related to the mineral Chenguodait. Chenguodait(mineral number IMA-CNMMN 2004-042a), Ag9FeS4Te2,
17
was reported to crystallize in the orthorhombic system with a =12.769(2) Å, b = 14.814(2) Å, c = 16.233(1) Å, V = 3070.6 Å3,and Z = 9. According to the composition of Chenguodait, ironhas the oxidation stage +III, and a tetrahedral coordinationseems reasonable. The composition of this mineral is verysimilar to ternary argyrodites with the general formulaAg9M(III)Q6 (M = Al3+, Ga3+; Q = S2−, Se2−).18−21 Theionic radius of Fe3+ (63 pm) is comparable to that of Ga3+ (61pm) (both for tetrahedral conformation).22 However, severalexamples of compounds like Ag5PS4Cl2,
23 Ag5PS4I2,24
Ag6GeS4X2 (X = Cl−, Br−),25 and Ag6SnS4Br226 with
“argyrodite-like” formulas but quite different crystal structuresshow that the composition gives only a rough idea about thestructure. Thus, the aforementioned mineral attracted ourinterest. Trials to synthesize a Chenguodait analogue resultedin a new argyrodite with the composition Ag9FeS4.1Te1.9 andcubic symmetry instead of the orthorhombic one which wasreported for the mineral.Ag9FeS4.1Te1.9 is the first iron containing representative of
this structure family. The crystal structures of the high and lowtemperature modification, the ionic conductivity, and furtherphysical properties of this material are discussed.
■ EXPERIMENTAL SECTIONSynthesis. Ag9FeS4Te2 was obtained by solid state reaction of
stoichiometric amounts of Ag (99.9%, chemPUR), Fe (99,998%, AlfaAesar), S (99.999%, chemPUR), and Te (99.999%, chemPUR) in theratio 9:1:4:2 in an evacuated quartz ampule. The starting materialswere slowly heated to 1273 K, cooled down to ambient temperature,homogenized, and then annealed again in an evacuated quartz ampulefor two weeks at 873 K. A gray reaction product was obtained. Sincethe subsequent characterization showed that a compound with thecomposition Ag9FeS4.1Te1.9 is preferably formed, the same procedurewas applied to reaction mixtures with the corresponding stoichio-metric amounts of the elements. These samples were then used forfurther characterization. Samples for 57Fe Mossbauer and molarsusceptibility measurements were synthesized according to theformulas Ag9FeS4Te2 and Ag9FeS4.1Te1.9 for comparison. All steps ofthe procedure were carried out using nonmetallic items. Furthertreatment of the samples was done as already described.Powder Diffraction. The diffraction pattern of Ag9FeS4Te2 at
ambient temperature was collected with a STOE STADI Pdiffractometer using Cu Kα1 radiation and a germanium mono-
chromator. All reflections could be indexed by Werner’s algorithm.27 Acubic F-centered cell with a = 11.044(1) Å was determined in a least-squares refinement. Ag9FeS4.1Te1.9 shows the same pattern, and thecell is also cubic F-centered with a = 11.0415(7) Å; see Figure 1. Thedifferences of the lattice constants are within three esd’s. Powderdiffraction data are provided as Supporting Information (Tables S11,S12).
Thermal Analysis. Difference thermal analysis (DTA) measure-ments of Ag9FeS4.1Te1.9 were performed with a SETARAM TG/DTA92-16. The ground samples were placed in evacuated silica tubes andmeasured in the temperature range from 298 to 1273 K with a heatingrate of 10 K/min.
Low-temperature differential scanning calorimetry (DSC) ofAg9FeS4.1Te1.9 was performed with a METTLER TOLEDO DSC 30instrument in the temperature range from 123 to 298 K with a heatingrate of 10 K/min; see Figure 2.
Single Crystal Structure Determination. An appropriate pieceof a selected single crystal was fixed to a glass capillary and thenmounted on an Oxford Diffraction Gemini R Ultra single crystaldiffractometer with CCD detector using a graphite monochromatorand Mo Kα radiation. The crystal was first measured at 293 K. Sincethe DSC measurements show a phase transition (see below), thecrystal was slowly cooled down to 200 K, held at this temperature forapproximately one hour, and then measured again at this temperature.A subsequent X-ray measurement at room temperature revealed theinitial cell. All these measurements were performed in one series onone single crystal without taking it off the diffractometer. The crystal
Figure 1. Measured powder diffraction pattern of Ag9FeS4.1Te1.9 at293 K in comparison with a pattern calculated from single crystal data.
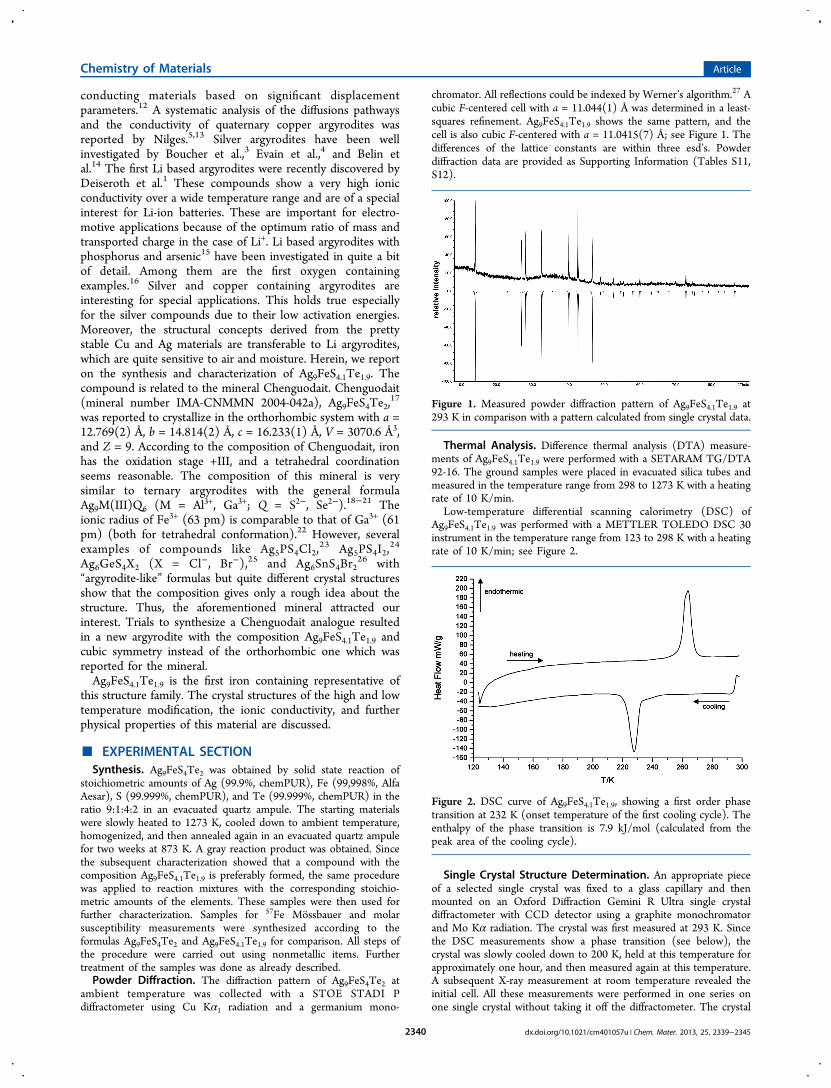
Figure 2. DSC curve of Ag9FeS4.1Te1.9, showing a first order phasetransition at 232 K (onset temperature of the first cooling cycle). Theenthalpy of the phase transition is 7.9 kJ/mol (calculated from thepeak area of the cooling cycle).
Chemistry of Materials Article
dx.doi.org/10.1021/cm401057u | Chem. Mater. 2013, 25, 2339−23452340
quality did not suffer from the phase transitions during this series.Temperature was controlled with an Oxford Cryojet Controller.Data processing was carried out with the CrysAlisPro28 software
package. An analytical numerical absorption correction according toClark and Reid29 was applied in the Laue-class m3 for themeasurement at 200 K (Rint= 0.030) and in the Laue-class m3m(Rint = 0.029) for the RT measurements. The structures were solvedby direct methods using Sir9230 and then refined with SHELX-97.31 Inthe last stage of the refinement a huge number of so-called splitpositions with rather low occupation factors had to be taken intoaccount for the silver atoms. Nonharmonic refinements11 using theGram-Charlier expansion were then performed with the JANA200632
program package. Thus, it is possible to reduce the number of freevariables and to reduce the correlation between different parameters.Nonharmonic tensor elements smaller than 3σ were fixed to 0 insubsequent refinement cycles. The significance of the higher-ordertensor elements was carefully checked as described in the literature.12
All structure models were checked for twinning with TWINROT-MAT. The models were standardized with the program STRUCTURETIDY.33 Both programs are included in the PLATON34 program suite.Structures were visualized by using the program Endeavor.35 Thejoint-probability-density functions (j.p.d.f.) were visualized withTecplot 360.36
Ag9FeS4.1Te1.9−cP64. The structure of Ag9FeS4.1Te1.9 at 200 Kwas solved straightforward in the acentric space group P213. Astructure model with fully occupied sites for all atoms could be refinedto acceptable reliability factors at a first stage. The refinement was thenfurther improved by introduction of nonharmonic third order tensorsfor the displacement parameters of the silver atoms. A subsequentrefinement of the tellurium site occupancies showed that the Te2 site4d is not fully occupied. Contrary, the Te1 site 4a showed fulloccupation. Therefore a mixed occupation of the 4d site by sulfur andtellurium was introduced and restrained to full occupation. Thus, therefinement converged to a final R1 = 1.55, wR2 = 5.23, and a GoF =1.07 for all 1804 unique reflections and 66 parameters. The refinedformula is Ag9FeS4.1Te1.9.Ag9FeS4.1Te1.9−cF64. The structure of Ag9FeS4.1Te1.9 at ambient
temperature was solved in the acentric space group F43m. Therefinement of the low temperature phase revealed clearly that one Tesite shows a mixed occupancy by tellurium and sulfur and that theformula Ag9FeS4.1Te1.9 is applicable. As a result of the fact that silver iscompletely ordered in Ag9FeS4.1Te1.9−cP64, it can be assumed that thesite occupation factors (s.o.f.) refined for the low temperaturemodification are quite precise. Therefore, the s.o.f.’s for Te2/S3were transferred from the low temperature structure to the roomtemperature model. Furthermore, electroneutrality was assured byintroducing an appropriate equation for the s.o.f.’s of the disorderedsilver sites. The most reasonable model was obtained by refining threesilver sites with fourth order nonharmonic tensors. The least-squaresrefinement for Ag9.1FeS4.1Te1.9 finally converged to R1 = 3.51% andwR2 = 10.66% with 52 parameters for 303 unique reflections. Thisratio of parameters to reflections is still acceptable in the case of suchnonharmonic refinements, and this kind of refinement does not sufferfrom severe correlation effects as a conventional split model would do.Crystallographic parameters for both modifications are provided in
Table 1, and positional parameters are listed in Tables 2 and 3.Anisotropic and nonharmonic displacement parameters are providedas Supporting Information (Tables S5, S6, S8, and S9) as well asselected bond lengths and angles (Tables S7 and S10).Impedance Measurements. Temperature dependent impedance
measurements were performed with an IM6 impedance analyzer(Zahner Elektrik) in the frequency range from 1 MHz to 1 Hz and inthe temperature range from 323 to 473 K. The amplitude was 10 mV.The finely ground samples were pressed into cylindrical pellets of 8mm diameter and placed between two sets of electron blockingelectrodes composed of Ag, a mixture of Ag and RbAg4I5, and pureRbAg4I5. The measurements were carried out in a homemade cell asdescribed elsewhere.37,38 A weak stream of dry argon passed throughthe cell during the measurements. The measurements were carried outin steps of 10 K with annealing periods of 40 min to ensure
equilibrating of the samples. The ionic conductivities were determinedfrom Nyquist plots.
Magnetism. The magnetic measurements were carried out on aQUANTUM DESIGN Physical Property Measurement System(PPMS) using the VSM option. For VSM measurements 74.97 mgof the polycrystalline Ag9FeS4.1Te1.9 sample were packed in apolypropylene capsule. The capsule was attached to a sample holderrod for measuring the magnetic properties in the temperature range of3−300 K with magnetic flux densities up to 10 kOe.
Mossbauer Spectroscopy. A 57Co/Rh source was available forthe 57Fe Mossbauer spectroscopy investigations. The Ag9FeS4.1Te1.9sample was placed in a thin-walled PVC container at an optimizedthickness of about 0.9 mg Fe/cm2. The measurements were run in theusual transmission geometry at 298, 78, and 5 K. The source was keptat room temperature. The total counting times were 7 d for the 298and 78 K and 15 d for the 5 K measurement.
■ RESULTS AND DISCUSSIONThermal Analyses. DTA measurements indicate congruent
melting of the sample. The melting point is 911 K, and thecrystallization point is 881 K. DSC measurements show areversible phase transition at 232 K with an enthalpy of 7.9 kJ/mol (first cooling cycle) (see Figure 2).
Crystal Structure. Ag9FeS4.1Te1.9−cF64 crystallizes in theacentric cubic space group F43m with a = 11.0415(7) Å whichcorresponds to the high temperature modification of theargyrodite structure type (Figure 3a). This structure type is well
Table 1. Crystallographic Data and Experimental Conditionsof Ag9FeS4.1Te1.9
refined composition: Ag9FeS4.094Te1.906
color grayformular weight (g mol−1) 1401.18crystal dimension (mm3) 0.55 × 0.46 × 0.34temperature (K) 200 293crystal system, Z cubic, 4 cubic, 4space group P213 F43m
No. 198 No. 216lattice parameters single crystal powdera (Å) 11.0213(1) 11.0415(7)V (Å3) 1338.75(2) 1346.1(1)absorption coeff. μ(Mo) 18.6 18.5ρcalc (g cm−3) 6.95 6.91diffractometer Xcalibur, Ruby, Gemini ultrawavelength Mo Kα1, λ = 0.71073 Åmonochromator graphiteabsorption correction analytical numerical29
software CrysAlisPro28
hkl ranges −17 ≤ h ≤ 13 −16 ≤ h ≤ 16−14 ≤ k ≤ 17 −16 ≤ k ≤ 16−17 ≤ l ≤ 16 −16 ≤ l ≤ 13
measured reflections 15255 4433indep. reflections (I > 3σI) 1772 287Rint; Rσ 3.03; 1.31 2.90; 1.252θ range (deg) 6.4−68.4 6.6−66.6no. of parameters 66 52structure solution Sir9230
structure refinement SHELXL-97,31 Jana200632
weighting scheme σ
extinction coefficient (GIso) 0.054(6) 0.23(3)R(obs) (I > 3σI); R(all) 1.49; 1.55 3.36; 3.51Rw(obs) (I > 3σI); Rw(all) 5.16; 5.23 10.51; 10.66GOF(obs); GOF(all) 1.06; 1.07 2.22; 2.17res. electron density (e Å−3) +0.63; −0.56 +0.76; −0.42
Chemistry of Materials Article
dx.doi.org/10.1021/cm401057u | Chem. Mater. 2013, 25, 2339−23452341

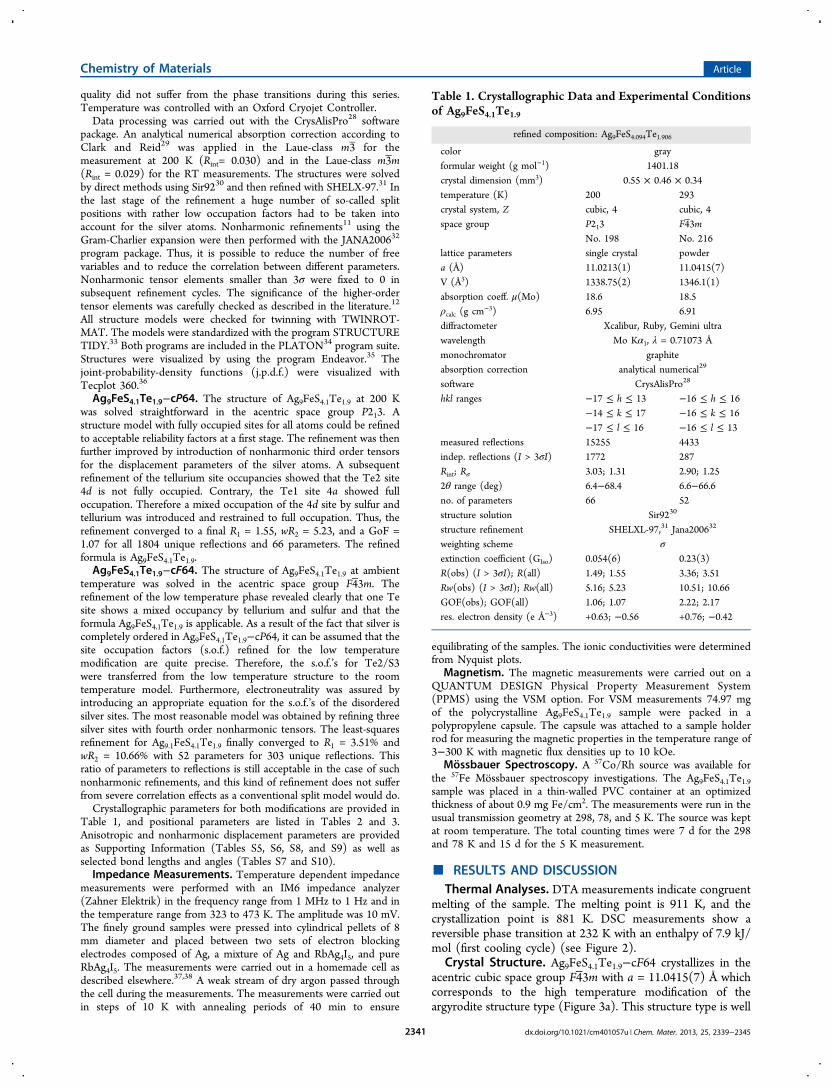
established, and therefore only the major facts will be discussedherein. Tellurium Te1, site 4a, forms the motif of a cubicclosest packing in which half of the tetrahedral holes isstatistically occupied by tellurium and sulfur (Te2/S2, site 4d),respectively. However, this is just the motif of the packing andthere are no bonding interactions present between theconstituting atoms. Iron, Fe1, site 4b, occupies the second setof tetrahedral holes of this cubic closest packing, and it iscoordinated by four sulfur atoms on site S1, 16e. The distanceswithin this tetrahedron [FeS4] are d(Fe−S) = 2.278(1) Å, andthe angles ∠(S−Fe−S) are 109.47° due to the local symmetry.In the title compound silver shows a strong nonharmonicbehavior. It partially occupies one 24g site and two 48h sites.The displacement parameters for Te2 and for Fe1 are ratherlarge. This effect is also observed in other argyrodite-typecompounds like in γ-Ag7PSe6,
4 where phosphorus and seleniumshow large displacement parameters. The high displacementparameters of phosphorus and selenium are ascribed to thehigh ionic conductivity of that phase. On cooling the crystal to200 K the compound fulfills a reversible phase transition andcrystallizes in the acentric space group P213 with Z = 4 (Figure3). The anion substructure is similar to that ofAg9.1FeS4.1Te1.9−cF64, but the atoms are shifted from theideal positions in comparison to the γ phase. Sulfur is located intwo sites instead of one in this low temperature modification(S1, site 4a, and site S2, site 12b). Iron coordinates to bothsites, forming a distorted tetrahedron. The distance Fe1−S1 is2.2493(9) Å, and the distance Fe1−S2 is 2.287(1) Å. The angleS1−Fe1−S2 is 110.95°, and the angle S2−Fe1−S2 is 107.95°.Silver is mainly distributed over three 12b sites. The R-values
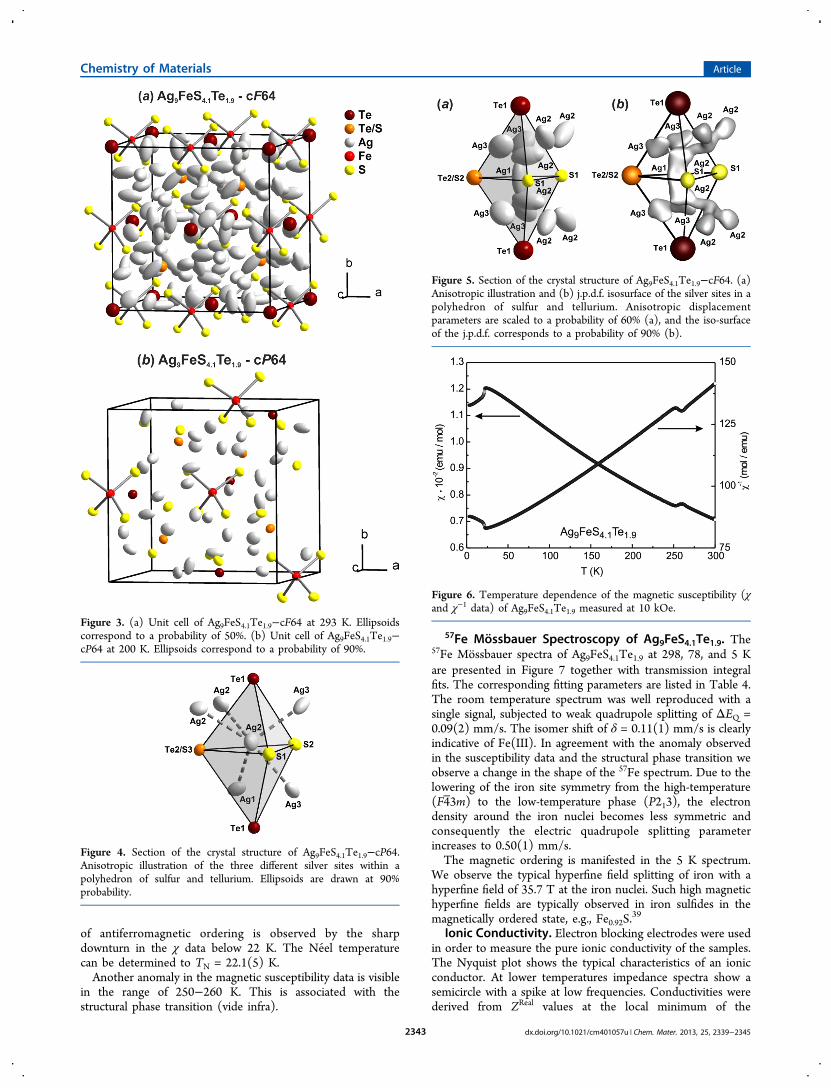
drop significantly upon splitting these sites into two sites withdistances of less than 0.3 Å. This illustrates the mobility of silverin this material, even at 200 K. The R-values of the anisotropicsplit model seemed good, but there were large correlations.Therefore, these silver sites were treated by a nonharmonicrefinement with higher order tensors. Since the displacementparameters of Te2 were unreasonably large at this stage of therefinement a tellurium−sulfur mixed occupation of this site wasintroduced. The coordinates and ADPs for Te2 and S3 wereconstrained, and full site occupancy was maintained. At the finalstage of the refinement all silver atoms are shifted out of thecenters of the surrounding tetrahedra formed by sulfur andtellurium toward a trigonal planar coordination (Figure 4). Theresults of the nonharmonic refinement are displayed in Figure5. It becomes obvious that silver occupies numerous sites whichare connected by positions with a significant electron density.
Magnetic Properties of Ag9FeS4.1Te1.9. The temperaturedependence of the magnetic and reciprocal magneticsusceptibility of Ag9FeS4.1Te1.9 is displayed in Figure 6. Theinverse magnetic susceptibility (χ−1 data) displays a nearlylinear dependence in the temperature range of 100−240 Kwhich can be fitted using the Curie−Weiss law. This results inan effective magnetic moment of μeff = 5.80(1) μB/Fe atom anda Weiss constant of θp = −301(1) K. The effective magneticmoment is close to the expected value of 5.92 μB for a spin-onlyhigh-spin system with S = 5/2 (Fe(III)). This also supports theMossbauer spectroscopic measurements, showing that the ironatoms are indeed in a stable trivalent state. The high negativevalue of θp suggests strong antiferromagnetic interactions in theparamagnetic range. Due to these strong interactions the onset
Table 2. Atomic Parameters and Equivalent Isotropic Displacement Parameters Ueq in Å2 for Ag9FeS4.1Te1.9−cF64 at 293 K
atom Wyck. occ. x y z Ueq
Te1 4a 1 0 0 0 0.0944(6)Te2 4d 0.9065 0.75 0.75 0.75 0.0608(4)S2 4d 0.0935 0.75 0.75 0.75 0.0608(4)Fe1 4b 1 0.5 0.5 0.5 0.0261(3)S1 16e 1 0.3809(1) 0.3809(1) 0.3809(1) 0.0367(3)Ag1 24g 0.51(2) 0.5125(4) 0.25 0.25 0.157(4)Ag1m 0.5096 0.2863 0.2137Ag2 48h 0.28(1) 0.1728(6) 0.1728(6) 0.032(2) 0.156(4)Ag2m 0.1856 0.1856 0.0032Ag3 48h 0.22(1) 0.049(1) 0.049(1) 0.780(1) 0.138(3)Ag3m 0.0613 0.0613 0.7687
mMode position, represents the maximum of the electron density.40
Table 3. Atomic Parameters and Equivalent Isotropic Displacement Parameters Ueq in Å2 for Ag9FeS4.1Te1.90−cP64 at 200 K
atom Wyck. occ. x y z Ueq
Te1 4a 1 0.97575(2) 0.97575(2) 0.97575(2) 0.01456(4)Te2 4a 0.906(4) 0.73366(2) 0.73366(2) 0.73366(2) 0.01402(7)S3 4a 0.094 0.73366(2) 0.73366(2) 0.73366(2) 0.01402(7)Fe1 4a 1 0.48993(4) 0.48993(4) 0.48993(4) 0.01273(8)S1 4a 1 0.37210(7) 0.37210(7) 0.37210(7) 0.0168(1)S2 12b 1 0.10118(8) 0.12498(8) 0.37793(8) 0.0158(2)Ag1 12b 1 0.03090(4) 0.61847(7) 0.31210(4) 0.02604(8)Ag1m 0.0304 0.6156 0.3106Ag2 12b 1 0.22908(8) 0.27375(3) 0.52026(6) 0.02767(8)Ag2m 0.2269 0.2736 0.5205Ag3 12b 1 0.05290(8) 0.34655(3) 0.31180(4) 0.0310(1)Ag3m 0.0514 0.3469 0.3124
mMode position, represents the maximum of the electron density.
Chemistry of Materials Article
dx.doi.org/10.1021/cm401057u | Chem. Mater. 2013, 25, 2339−23452342
of antiferromagnetic ordering is observed by the sharpdownturn in the χ data below 22 K. The Neel temperaturecan be determined to TN = 22.1(5) K.Another anomaly in the magnetic susceptibility data is visible
in the range of 250−260 K. This is associated with thestructural phase transition (vide infra).
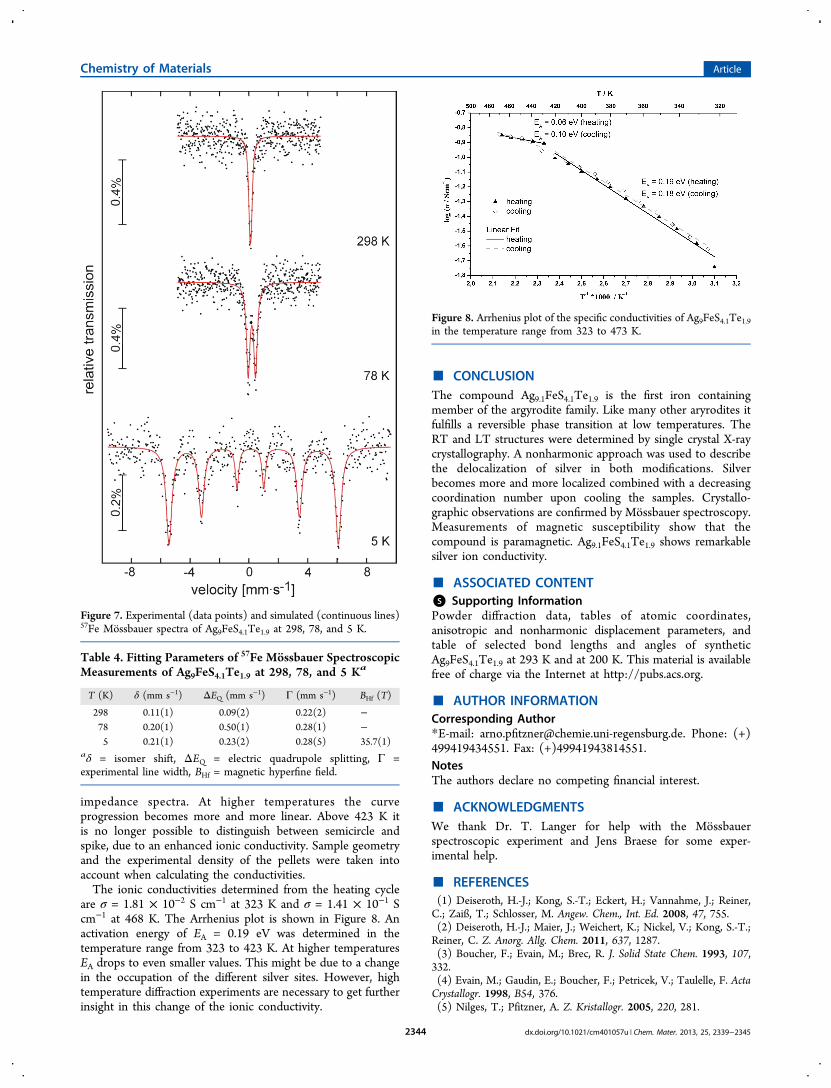
57Fe Mossbauer Spectroscopy of Ag9FeS4.1Te1.9. The57Fe Mossbauer spectra of Ag9FeS4.1Te1.9 at 298, 78, and 5 Kare presented in Figure 7 together with transmission integralfits. The corresponding fitting parameters are listed in Table 4.The room temperature spectrum was well reproduced with asingle signal, subjected to weak quadrupole splitting of ΔEQ =0.09(2) mm/s. The isomer shift of δ = 0.11(1) mm/s is clearlyindicative of Fe(III). In agreement with the anomaly observedin the susceptibility data and the structural phase transition weobserve a change in the shape of the 57Fe spectrum. Due to thelowering of the iron site symmetry from the high-temperature(F4 3m) to the low-temperature phase (P213), the electrondensity around the iron nuclei becomes less symmetric andconsequently the electric quadrupole splitting parameterincreases to 0.50(1) mm/s.The magnetic ordering is manifested in the 5 K spectrum.
We observe the typical hyperfine field splitting of iron with ahyperfine field of 35.7 T at the iron nuclei. Such high magnetichyperfine fields are typically observed in iron sulfides in themagnetically ordered state, e.g., Fe0.92S.
39
Ionic Conductivity. Electron blocking electrodes were usedin order to measure the pure ionic conductivity of the samples.The Nyquist plot shows the typical characteristics of an ionicconductor. At lower temperatures impedance spectra show asemicircle with a spike at low frequencies. Conductivities werederived from ZReal values at the local minimum of the
Figure 3. (a) Unit cell of Ag9FeS4.1Te1.9−cF64 at 293 K. Ellipsoidscorrespond to a probability of 50%. (b) Unit cell of Ag9FeS4.1Te1.9−cP64 at 200 K. Ellipsoids correspond to a probability of 90%.
Figure 4. Section of the crystal structure of Ag9FeS4.1Te1.9−cP64.Anisotropic illustration of the three different silver sites within apolyhedron of sulfur and tellurium. Ellipsoids are drawn at 90%probability.
Figure 5. Section of the crystal structure of Ag9FeS4.1Te1.9−cF64. (a)Anisotropic illustration and (b) j.p.d.f. isosurface of the silver sites in apolyhedron of sulfur and tellurium. Anisotropic displacementparameters are scaled to a probability of 60% (a), and the iso-surfaceof the j.p.d.f. corresponds to a probability of 90% (b).
Figure 6. Temperature dependence of the magnetic susceptibility (χand χ−1 data) of Ag9FeS4.1Te1.9 measured at 10 kOe.
Chemistry of Materials Article
dx.doi.org/10.1021/cm401057u | Chem. Mater. 2013, 25, 2339−23452343
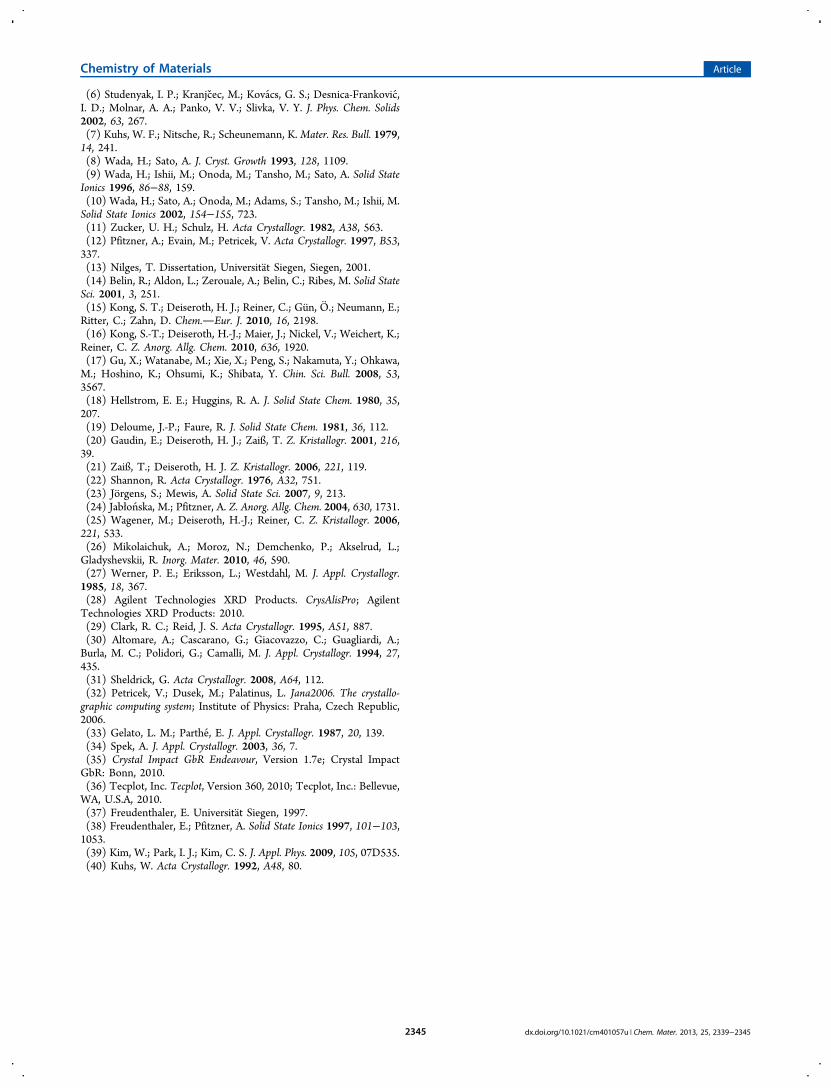
impedance spectra. At higher temperatures the curveprogression becomes more and more linear. Above 423 K itis no longer possible to distinguish between semicircle andspike, due to an enhanced ionic conductivity. Sample geometryand the experimental density of the pellets were taken intoaccount when calculating the conductivities.The ionic conductivities determined from the heating cycle
are σ = 1.81 × 10⁻² S cm−1 at 323 K and σ = 1.41 × 10⁻¹ Scm−1 at 468 K. The Arrhenius plot is shown in Figure 8. Anactivation energy of EA = 0.19 eV was determined in thetemperature range from 323 to 423 K. At higher temperaturesEA drops to even smaller values. This might be due to a changein the occupation of the different silver sites. However, hightemperature diffraction experiments are necessary to get furtherinsight in this change of the ionic conductivity.
■ CONCLUSIONThe compound Ag9.1FeS4.1Te1.9 is the first iron containingmember of the argyrodite family. Like many other aryrodites itfulfills a reversible phase transition at low temperatures. TheRT and LT structures were determined by single crystal X-raycrystallography. A nonharmonic approach was used to describethe delocalization of silver in both modifications. Silverbecomes more and more localized combined with a decreasingcoordination number upon cooling the samples. Crystallo-graphic observations are confirmed by Mossbauer spectroscopy.Measurements of magnetic susceptibility show that thecompound is paramagnetic. Ag9.1FeS4.1Te1.9 shows remarkablesilver ion conductivity.
■ ASSOCIATED CONTENT*S Supporting InformationPowder diffraction data, tables of atomic coordinates,anisotropic and nonharmonic displacement parameters, andtable of selected bond lengths and angles of syntheticAg9FeS4.1Te1.9 at 293 K and at 200 K. This material is availablefree of charge via the Internet at http://pubs.acs.org.
■ AUTHOR INFORMATIONCorresponding Author*E-mail: [email protected]. Phone: (+)499419434551. Fax: (+)49941943814551.NotesThe authors declare no competing financial interest.
■ ACKNOWLEDGMENTSWe thank Dr. T. Langer for help with the Mossbauerspectroscopic experiment and Jens Braese for some exper-imental help.
■ REFERENCES(1) Deiseroth, H.-J.; Kong, S.-T.; Eckert, H.; Vannahme, J.; Reiner,C.; Zaiß, T.; Schlosser, M. Angew. Chem., Int. Ed. 2008, 47, 755.(2) Deiseroth, H.-J.; Maier, J.; Weichert, K.; Nickel, V.; Kong, S.-T.;Reiner, C. Z. Anorg. Allg. Chem. 2011, 637, 1287.(3) Boucher, F.; Evain, M.; Brec, R. J. Solid State Chem. 1993, 107,332.(4) Evain, M.; Gaudin, E.; Boucher, F.; Petricek, V.; Taulelle, F. ActaCrystallogr. 1998, B54, 376.(5) Nilges, T.; Pfitzner, A. Z. Kristallogr. 2005, 220, 281.
Figure 7. Experimental (data points) and simulated (continuous lines)57Fe Mossbauer spectra of Ag9FeS4.1Te1.9 at 298, 78, and 5 K.
Table 4. Fitting Parameters of 57Fe Mossbauer SpectroscopicMeasurements of Ag9FeS4.1Te1.9 at 298, 78, and 5 Ka
T (K) δ (mm s−1) ΔEQ (mm s−1) Γ (mm s−1) BHf (T)
298 0.11(1) 0.09(2) 0.22(2) −78 0.20(1) 0.50(1) 0.28(1) −5 0.21(1) 0.23(2) 0.28(5) 35.7(1)
aδ = isomer shift, ΔEQ = electric quadrupole splitting, Γ =experimental line width, BHf = magnetic hyperfine field.
Figure 8. Arrhenius plot of the specific conductivities of Ag9FeS4.1Te1.9in the temperature range from 323 to 473 K.
Chemistry of Materials Article
dx.doi.org/10.1021/cm401057u | Chem. Mater. 2013, 25, 2339−23452344
(6) Studenyak, I. P.; Kranjcec, M.; Kovacs, G. S.; Desnica-Frankovic,I. D.; Molnar, A. A.; Panko, V. V.; Slivka, V. Y. J. Phys. Chem. Solids2002, 63, 267.(7) Kuhs, W. F.; Nitsche, R.; Scheunemann, K. Mater. Res. Bull. 1979,14, 241.(8) Wada, H.; Sato, A. J. Cryst. Growth 1993, 128, 1109.(9) Wada, H.; Ishii, M.; Onoda, M.; Tansho, M.; Sato, A. Solid StateIonics 1996, 86−88, 159.(10) Wada, H.; Sato, A.; Onoda, M.; Adams, S.; Tansho, M.; Ishii, M.Solid State Ionics 2002, 154−155, 723.(11) Zucker, U. H.; Schulz, H. Acta Crystallogr. 1982, A38, 563.(12) Pfitzner, A.; Evain, M.; Petricek, V. Acta Crystallogr. 1997, B53,337.(13) Nilges, T. Dissertation, Universitat Siegen, Siegen, 2001.(14) Belin, R.; Aldon, L.; Zerouale, A.; Belin, C.; Ribes, M. Solid StateSci. 2001, 3, 251.(15) Kong, S. T.; Deiseroth, H. J.; Reiner, C.; Gun, O.; Neumann, E.;Ritter, C.; Zahn, D. Chem.Eur. J. 2010, 16, 2198.(16) Kong, S.-T.; Deiseroth, H.-J.; Maier, J.; Nickel, V.; Weichert, K.;Reiner, C. Z. Anorg. Allg. Chem. 2010, 636, 1920.(17) Gu, X.; Watanabe, M.; Xie, X.; Peng, S.; Nakamuta, Y.; Ohkawa,M.; Hoshino, K.; Ohsumi, K.; Shibata, Y. Chin. Sci. Bull. 2008, 53,3567.(18) Hellstrom, E. E.; Huggins, R. A. J. Solid State Chem. 1980, 35,207.(19) Deloume, J.-P.; Faure, R. J. Solid State Chem. 1981, 36, 112.(20) Gaudin, E.; Deiseroth, H. J.; Zaiß, T. Z. Kristallogr. 2001, 216,39.(21) Zaiß, T.; Deiseroth, H. J. Z. Kristallogr. 2006, 221, 119.(22) Shannon, R. Acta Crystallogr. 1976, A32, 751.(23) Jorgens, S.; Mewis, A. Solid State Sci. 2007, 9, 213.(24) Jabłonska, M.; Pfitzner, A. Z. Anorg. Allg. Chem. 2004, 630, 1731.(25) Wagener, M.; Deiseroth, H.-J.; Reiner, C. Z. Kristallogr. 2006,221, 533.(26) Mikolaichuk, A.; Moroz, N.; Demchenko, P.; Akselrud, L.;Gladyshevskii, R. Inorg. Mater. 2010, 46, 590.(27) Werner, P. E.; Eriksson, L.; Westdahl, M. J. Appl. Crystallogr.1985, 18, 367.(28) Agilent Technologies XRD Products. CrysAlisPro; AgilentTechnologies XRD Products: 2010.(29) Clark, R. C.; Reid, J. S. Acta Crystallogr. 1995, A51, 887.(30) Altomare, A.; Cascarano, G.; Giacovazzo, C.; Guagliardi, A.;Burla, M. C.; Polidori, G.; Camalli, M. J. Appl. Crystallogr. 1994, 27,435.(31) Sheldrick, G. Acta Crystallogr. 2008, A64, 112.(32) Petricek, V.; Dusek, M.; Palatinus, L. Jana2006. The crystallo-graphic computing system; Institute of Physics: Praha, Czech Republic,2006.(33) Gelato, L. M.; Parthe, E. J. Appl. Crystallogr. 1987, 20, 139.(34) Spek, A. J. Appl. Crystallogr. 2003, 36, 7.(35) Crystal Impact GbR Endeavour, Version 1.7e; Crystal ImpactGbR: Bonn, 2010.(36) Tecplot, Inc. Tecplot, Version 360, 2010; Tecplot, Inc.: Bellevue,WA, U.S.A, 2010.(37) Freudenthaler, E. Universitat Siegen, 1997.(38) Freudenthaler, E.; Pfitzner, A. Solid State Ionics 1997, 101−103,1053.(39) Kim, W.; Park, I. J.; Kim, C. S. J. Appl. Phys. 2009, 105, 07D535.(40) Kuhs, W. Acta Crystallogr. 1992, A48, 80.
Chemistry of Materials Article
dx.doi.org/10.1021/cm401057u | Chem. Mater. 2013, 25, 2339−23452345