Synthesis and Chemiluminescence Studies of Luminol and ... · chemiluminescence quantum yield is...
15
1 Synthesis and Chemiluminescence Studies of Luminol and Derivatives Filipe M. C. Menezes 1 , Carlos A. M. Afonso 1 , Carlos M. B. Baleizão 1 , Luís F. Veiros 2 , Mário N. Berberan-Santos 1 1 CQFM-Centro de Química-Física Molecular and IN-Institute of Nanoscience and Nanotechnology, Instituto Superior Técnico, 1049-001 Lisboa, Portugal. E-mail: Fax: +351 218464455; Tel: +351 218419221 2 Centro de Química Estrutural, Departamento de Engenharia Química e Biológica, Instituto Superior Técnico, Av. Rovisco Pais, 1049-001 Lisboa, Portugal Luminol is a well-known chemiluminescent compound with a strong blue emission. Owing to its visible emission, chemiluminescence mechanism and high quantum yield, it has been used in biosensors, sensitive metal ion detection and in several in vivo applications. 1 In this work, we report the synthesis and properties of some new derivatives of luminol in our search for green chemiluminescence as well as some photophysical and computational studies on luminol and the respective diphthalate anion. 1. Introduction Since its synthesis in 1928 by Albrecht, 2 luminol (Figure 1, species A) has been subject to several mechanistic and synthetic studies, not only to fully understand the processes underlying its chemiluminescence but also to obtain more chemiluminescent compounds with emission in other colours. It is believed that the reaction itself can follow several pathways. In water, the chemiluminescence quantum yield is just 1%. Nevertheless, it is in this medium where most of luminol’s interesting applications are found. 1,3 Figure 1: Generic Scheme for luminol’s (A) chemiluminescence. B is the related aminodiphthalate. Here we report the effect of N-acylation of luminol (aniline moiety) in its chemiluminescence and in the photophysical properties of the chromophore. The acyl groups chosen were trifluoroacetyl, benzoyl, ethyl carbamate and two still unknown structures obtained with reaction with dimethyl carbamic chloride. Computational studies on luminol’s tautomerism and acidity as well as spectroscopic studies on luminol and the aminodiphthalate (B) were performed. The absorption spectra are compared with theoretical results. 2. Computational Details All theoretical calculations were performed with Gaussian 03 program package, 4 using the restricted approximation of the wavefunctions. Geometry optimizations were performed with Möller-Plesset second order perturbation theory with 6-31G** basis set. MP2 calculations with Dunning’s aug-cc-pVTZ basis set were performed for single point energy calculations. Charges are analysed using natural population analysis for the most refined basis sets. Solvent effects were considered using the polarisable continuum model (PCM) 5 in single point energy calculations using the optimized MP2/6-31G** geometry. The augmented version
Transcript of Synthesis and Chemiluminescence Studies of Luminol and ... · chemiluminescence quantum yield is...

1
Synthesis and Chemiluminescence Studies of Luminol and Derivatives
Filipe M. C. Menezes1, Carlos A. M. Afonso
1, Carlos M. B. Baleizão
1, Luís F. Veiros
2, Mário N. Berberan-Santos
1
1CQFM-Centro de Química-Física Molecular and IN-Institute of Nanoscience and Nanotechnology, Instituto Superior
Técnico, 1049-001 Lisboa, Portugal. E-mail: Fax: +351 218464455; Tel: +351 2184192212
Centro de Química Estrutural, Departamento de Engenharia Química e Biológica, Instituto Superior Técnico, Av.
Rovisco Pais, 1049-001 Lisboa, Portugal
Luminol is a well-known chemiluminescent compound with a strong blue emission. Owing to its
visible emission, chemiluminescence mechanism and high quantum yield, it has been used in biosensors,
sensitive metal ion detection and in several in vivo applications.1
In this work, we report the synthesis and properties of some new derivatives of luminol in our search
for green chemiluminescence as well as some photophysical and computational studies on luminol and the
respective diphthalate anion.
1. Introduction
Since its synthesis in 1928 by Albrecht,2
luminol (Figure 1, species A) has been subject to
several mechanistic and synthetic studies, not
only to fully understand the processes underlying
its chemiluminescence but also to obtain more
chemiluminescent compounds with emission in
other colours.
It is believed that the reaction itself can
follow several pathways. In water, the
chemiluminescence quantum yield is just 1%.
Nevertheless, it is in this medium where most of
luminol’s interesting applications are found.1,3
Figure 1: Generic Scheme for luminol’s (A)
chemiluminescence. B is the related aminodiphthalate.
Here we report the effect of N-acylation of
luminol (aniline moiety) in its chemiluminescence
and in the photophysical properties of the
chromophore. The acyl groups chosen were
trifluoroacetyl, benzoyl, ethyl carbamate and two
still unknown structures obtained with reaction
with dimethyl carbamic chloride. Computational
studies on luminol’s tautomerism and acidity as
well as spectroscopic studies on luminol and the
aminodiphthalate (B) were performed. The
absorption spectra are compared with theoretical
results.
2. Computational Details
All theoretical calculations were
performed with Gaussian 03 program package,4
using the restricted approximation of the
wavefunctions.
Geometry optimizations were performed
with Möller-Plesset second order perturbation
theory with 6-31G** basis set. MP2 calculations
with Dunning’s aug-cc-pVTZ basis set were
performed for single point energy calculations.
Charges are analysed using natural population
analysis for the most refined basis sets.
Solvent effects were considered using the
polarisable continuum model (PCM)5
in single
point energy calculations using the optimized
MP2/6-31G** geometry. The augmented version

2
of Dunning’s triple zeta basis set was once again
used in these calculations.
The Hessian matrix was calculated
analytically for the optimized structures to prove
the exact location of correct minima in potential
energy surfaces (only positive frequencies) and to
estimate thermodynamic parameters at 298 K and
1 atm.
TDDFT calculations using
PBE1PBE/aug-cc-pVTZ were used to predict the
absorption spectra of luminol. The solvent
dielectric was used in the calculations. Optimized
MP2/6-31G** geometries were also used in these
calculations.
3. Experimental
3.1. Reagents and Solvents
All the solvents used in synthetic
experimental procedures were dried and/or
distilled according to standard procedures.6
Reagents for synthetic procedures were
all reagent grade and samples for spectroscopic
studies (and solvents) were all with spectroscopic
purity, being also commercially available.
3.2. Instrumentation
NMR spectra were recorded in an
Ultrashield Bruker Avance III 300 or Bruker
Avance III 400. The solvent and the standard are
in brackets in the synthetic procedure description.
All shifts are reported in ppm and coupling
constants in Hz.
For fluorescence, excitation spectra and
chemiluminescence studies a Spex Fluorolog
F112A fluorimeter was used.
UV/Vis spectra were all recorded in a
Shimadzu UV-3101PC UV-Vis-NIR spectro-
photometer.
Aqueous solutions pH was measured in a
Crison micro pH 2001.
3.3. Chemiluminescence
Chemiluminescence assays were carried
out as described by Rauhut and co-workers:25
K2S2O8 6.010-2
M, H2O2 3.010-2
M, and luminol
or one of its derivatives 5.010-5
M.
3.4 Synthesis
N-trifluoroacetyl Luminol (TFALum)
To 100 mg of Luminol (0.564 mmol) were
added 2 mL of DMF (complete dissolution). 90 µL
of triethylamine (TEA; 0.646 mmol) were added.
88 µL (0.628 mmol) of trifluoroacetic anhydride
were added directly and slowly. After one hour, a
white dispersion substituted the yellow colour
indicating the end of the reaction. 50 mL of H2O
were rapidly added and the isolated solid
crystallized in EtOH-H2O mixture (20 and 5 mL
respectively). The yield was 70%. Alternatively,
H2O-acetone mixtures can be used. The isolated
crystals were white and cotton like and melted at
335 ºC. They showed the following NMR data:
1H NMR (400 MHz, DMSO D6, TMS): 14.5 (1H, s);
12.1 (2H, large s); 8.7 (1H, d, 8.1); 7.9 (1H, t, 8.1);
7.7 (1H, d, 8.0).
13C NMR (100 MHz, DMSO D6, TMS): 161.3;
154.5; 152.0; 138.2; 135.2; 126.3; 121.7; 120.6;
120.2; 115.9.
19F NMR (376 MHz, DMSO D6, CFCl3): 75.5 ppm.
N-benzoyl Luminol (BnLum)
To 200 mg of Luminol (1.13 mmol) were
added 4 mL of DMF (complete dissolution) 150 µL
of TEA (1.08 mmol) were added. 200 µL of BnCl
(1.72 mmol) were directly and slowly added. The
solution acquired a yellow colour and a white
dispersion appeared. The reaction progress was

3
followed by TLC. After completion, 50 mL of H2O
were rapidly added and the precipitate was
purified by crystallization in EtOH-H2O mixture (20
and 5 mL respectively). The yield was 34%.
Crystallization just in EtOH can also be
performed. yielding product with similar
composition. The isolated product was a white
powder that decomposed at 206 ºC and showed
the following NMR data:
1H NMR (300 MHz, DMSO D6, TMS): 12.2 (1H, s);
7.3 and 8.3 ppm (nH, m); 7.0 (1H, d, 8.2); 6.6 (1H,
d, 7.6).
13C NMR (75 MHz, DMSO D6, TMS): 164.6 ;
162.9; 162.3; 151.5; 146.3; 136.1; 135.3; 130.7;
130.5; 129.7; 129.5; 127.8; 127.6; 126.7; 117.5;
110.4; 108.5.
Ethyl Carbamate Luminol (ECLum)
To 200 mg of Luminol (1.13 mmol) were
added 4 mL of DMF (complete dissolution). 150
µL of TEA (1.08 mmol) were added. Then, 200 µL
of ethyl chloroformate (2.10 mmol) were directly
and slowly added. The solution achieved a yellow
colour and within 30-60 min a white dispersion
appeared, ending the reaction. 50 mL of H2O were
added. EtOAc was used to recover more product
from the aqueous phase and the product
crystallized in EtOH. The yield after crystallization
was 28%. The product obtained was pale yellow
with rod form, melted at 150 ºC and exhibited the
following NMR data:
1H NMR (400 MHz, DMSO D6, TMS): 12.1 (1H, s);
7.5 (1H, t, 6.6 and 7.4); 7.4 (2H, s); 7.0 (1H, d,
7.4); 6.7 (1H, d, 6.6); 4.3 (2H); 1.3 (3H).
13C NMR (100 MHz, DMSO-D6, TMS): 162.8;
152.5; 151.6; 145.7; 135.4; 126.4; 117.6; 110.4;
108.2; 66.1; 14.3.
Figure 2: Derivatives with assigned structure.
DMU1Luminol
To 200 mg of Luminol (1.13 mmol) were
added 4 mL of DMF (complete dissolution). 200
µL of dimethyl carbamic chloride (2.17 mmol)
were directly and slowly added. The solution got
yellow and the system heated and kept for one
day at 60 ºC. A white dispersion appeared
indicating the end of the reaction. 50 mL of H2O
were added, the precipitate dissolved and the
solvent was evaporated. The solid was
crystallized in EtOH (10-15 mL). The amount of
product obtained was 104.3 mg. Alternatively
MeOH can be used as crystallization solvent. The
isolated product was a white powder with the
following NMR data:
1H NMR (400 MHz, DMSO D6, TMS): 12.7 (1H, s);
9.0 (1H, d, 6.7); 7.9 and 7.8 (2H, [t, 8.1] and [d,
6.8]); 7.6 (1H, d, 7.8); 7.5 and 7.4 (2.5H, m); 2.5
(0.5H, s); 1.1 (2.5H, t, 7.0).
13C NMR (100 MHz, DMSO D6, TMS): 168.5;
160.9; 152.0; 145.1; 135.6; 134.8; 129.7; 129.6;
127.9; 127.6; 126.4; 121.8; 118.3; 115.3.
DMU2Luminol
The reaction and workup procedures
were exactly the same as the ones for DMU1Lum
but without heating during the reaction. The
product was crystallized in H2O-EtOH mixture (15
and 5 mL respectively). 212.7 mg of pale yellow
granulate contaminated with luminol were
obtained. The product exhibited the following

4
NMR data (peaks matching luminol were marked
with an L inside brackets).
1H NMR (400 MHz, DMSO D6, TMS): 13.8 (1H, d,
10.8); 11.3 (3H, large s); 9.3 (1H, d, 10.8); 8.0
(1H, d, 8.1); 7.8 (1H, t, 7.6 and 8.1); 7.6 (1H, d,
7.6); 7.3 (L); 6.8 (L); 6.7 (L); 3.1 (s).
13C NMR (100 MHz, DMSO D6, TMS): 161.7 (L);
161.1; 152.9; 151.9 (L); 151.1 (L); 138.9; 135.3;
134.3 (L); 126.9 (L); 126.7; 120.8; 118.0; 116.9
(L); 115.3; 110.8 (L).
4. Results and Discussion
4.1. Computational
Figure 3: Luminol’s tautomeric forms computationally
studied.
Table 1: Relative Gibbs energy for luminol’s tautomers
(tautomer B as reference). All calculations with
MP2/aug-cc-pVTZ level of theory. Energies in kcal/mol.
Gas DMSO H2O
A 7.24 5.25 5.16
B 0.00 0.00 0.00
C 3.85 2.04 1.86
D 9.58 8.58 8.38
E 49.6 45.5 44.8
F 41.3 38.7 38.2
The conformations for luminol tautomers
presented in Figure 3 were the computationally
most stable ones. With respect to their relative
energy, as Table 1 shows, tautomers without
imine character in ring 1 (6 member ring always
on left in Figure 3) are the most stable. Of those,
the less stable is the tautomer with aromaticity
extension through the two 6 member rings
(tautomer D), being the tautomer with the carboxyl
farthest from the aniline moiety enolized the most
stable one (B).
To account for the relative stability order
we have verified that not only the strength of the
hydrogen bonding would be relevant but also that
electronic density (charge) analysis proved quite
useful. From the former parameter, the stronger
the hydrogen bond between the aniline and closer
carboxyl group the most stabilized is the structure
(supplementary material S1). But because A has
stronger hydrogen bond than C and due to the
small difference of the hydrogen bond distance
between A and B (A-1.93 Å; B-1.92 Å; C-1.981
Å), the charge distribution must be evoked. The
latter parameter (charge distribution) shows that
the most stable tautomers have higher electronic
density in the most electronegative atoms, ring 2
(cf. supplementary material S2).
Regarding the aromaticity, its complete
loss in ring 1 appears to greatly destabilize the
whole structure yielding species at least 38
kcal/mol less stable (E and F). As for the
aromaticity extension, it should not be important
enough to account for the complete loss of
carboxyl groups (that also weakens the hydrogen
bond strength). Therefore, the main parameters
affecting luminol’s tautomers relative stability were
proposed to be (by increasing order of
importance) (i) aromaticity and electronic
delocalization (increase in the number of
molecular orbitals with character), (ii) hydrogen
bonding, and (iii) charge distribution. Regarding
other studies, the energetic distribution of
tautomers that we propose here is slightly
different from a previous DFT study.8
The main

5
difference is in the relative stability of tautomers A
and C. While in our theoretical calculations
tautomer C was the second most stable tautomer,
the other calculations predicted that instead of C it
is A the second most stable species. According to
our initial method and basis set scan, that may
have to do with the description of luminol’s aniline
functionality.
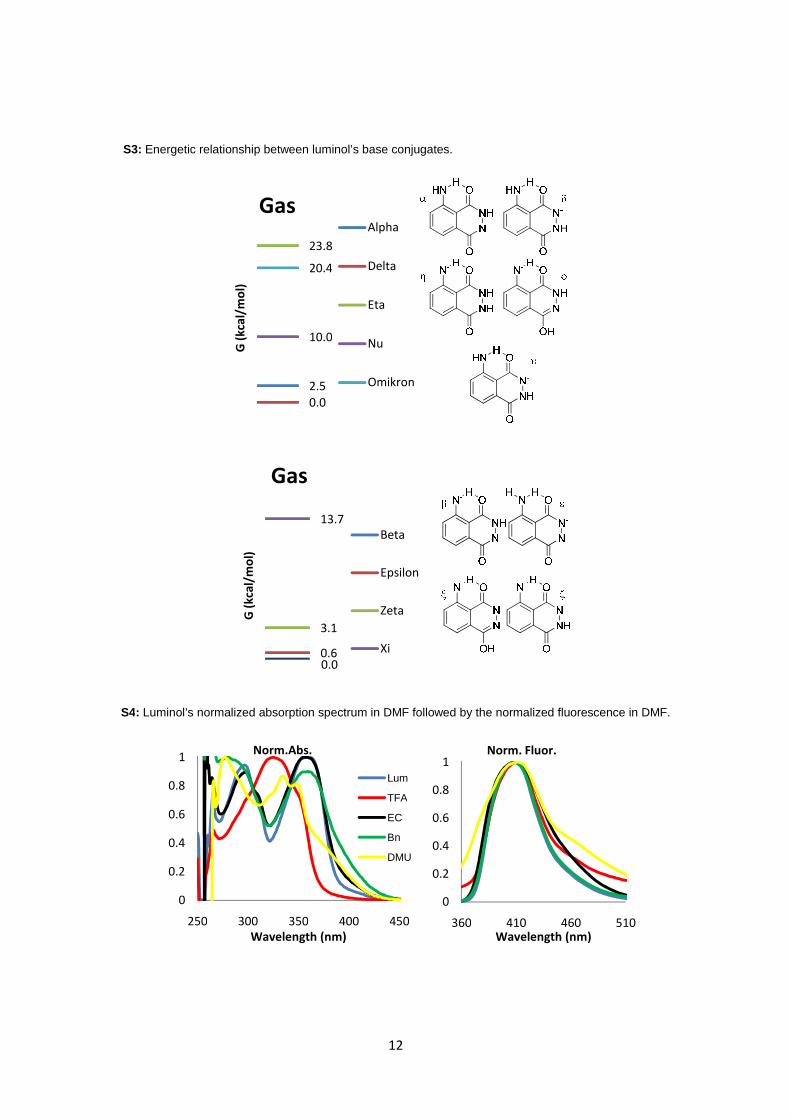
With respect to luminol’s acidity, we
verified that in solvent’s dielectric, the most acidic
protons of luminol were the hydrazide ones. Both
are practically equally labile, being the energetic
discrepancy less than 1 kcal/mol (Figure 4). As for
the second most acidic proton of luminol, we
verified that it should be an anilinic one instead of
the other hydrazide proton (Figure 5). The energy
difference between those two proton abstractions
is at least 10 kcal.mol-1
. The most stable species
are once again the ones retaining the hydrogen
bonding where the aniline’s nitrogen acts as
acceptor. Supplementary material S3 shows the
same energetic relations but for gas phase
calculations.
Figure 4: Relative stability of luminol’s monoanionic
base conjugates according to MP2/aug-cc-pVTZ/SCRF
calculations on optimized MP2/6-31G** geometries.
Figure 5: Relative stability of luminol’s dianionic base
conjugates according to MP2/aug-cc-pVTZ/SCRF
calculations on optimized MP2/6-31G** geometries.
4.2. Absorption and Fluorescence
In this work we have performed
absorption and fluorescence studies on luminol
and its derivatives in water at high pH, in DMF
and in DMSO.
Regarding absorption spectra in aprotic
media (Figure 6, left) we observed that the
generated electronic states come all from *
transitions (the same conclusion for the other
media studied). While luminol and ECLum (EC)
have both two electronic transitions (that may
come from several tautomeric forms), in the other
derivatives the relation between the energy of the
excited states is greatly affected, meaning that the
absorption spectra pattern is changed. With
respect to the fluorescence, we have observed
that all species relax to a similar structure (both in
geometry and in energy), accounting for the
emission resemblance of all those species. Of all,
the most curious case is TFALum (TFA) that has
two emission bands in DMSO. This may be an
artefact from tautomerism. When changing to
DMF (Supplementary material S4), the absorption
pattern is changed (more resolution) but the
fluorescence spectra are equal to DMSO’s. The
only exception is TFALum that only exhibits one
emission band in DMF.
G(k
cal/
mo
l)
DMSO
Alpha
Delta
Eta
Nu
Omikron
G(k
cal/
mo
l)
DMSO
Beta
Epsilon
Zeta
Xi

6
In water at pH in the range 11.5-11.8
(S5), we have verified that TFA hydrolizes.
Regarding the other spectra, BnLum (Bn) and
DMU1Lum (DMU) show just one very broad
absorption band. ECLum retains the resemblance
of luminol’s spectrum in water. As for fluorescence
in aprotic media, DMU1Lum shows a quite
complex emission. The other species exhibit a
maximum and a shoulder that we have verified to
come from acid-base reaction in the excited state.
4.3 Theoretical Spectra
With respect to theoretical absorption
spectra, we observed that using MP2/6-31G**
optimized geometries on TDDFT calculations with
PBE1PBE/aug-cc-pVTZ level of theory allowed us
to predict with some accuracy the absorption
spectrum of luminol. In Figure 7 we can observe
that the highest error is in the maximum
absorption wavelength of the first electronic
transition. The same type of error occurs in
DMSO’s theoretical absorption spectrum
(presented in supplementary material S6 and S7).
Regarding the oscillator strengths, the theoretical
predictions were more accurate in water than in
DMSO. We can also verify from Figure 7 that the
two tautomeric species predicted by us to be the
most stable in both DMSO and water are the ones
that best fit to the experimental absorption
spectrum (assuming that a fit to maximum
absorption wavelength is performed). Because in
water we only observe two transitions, and
because the transitions only show two maxima,
the best fit of the spectra excludes luminol’s
tautomer A as a significant contributor to the
ground state systems of luminol.
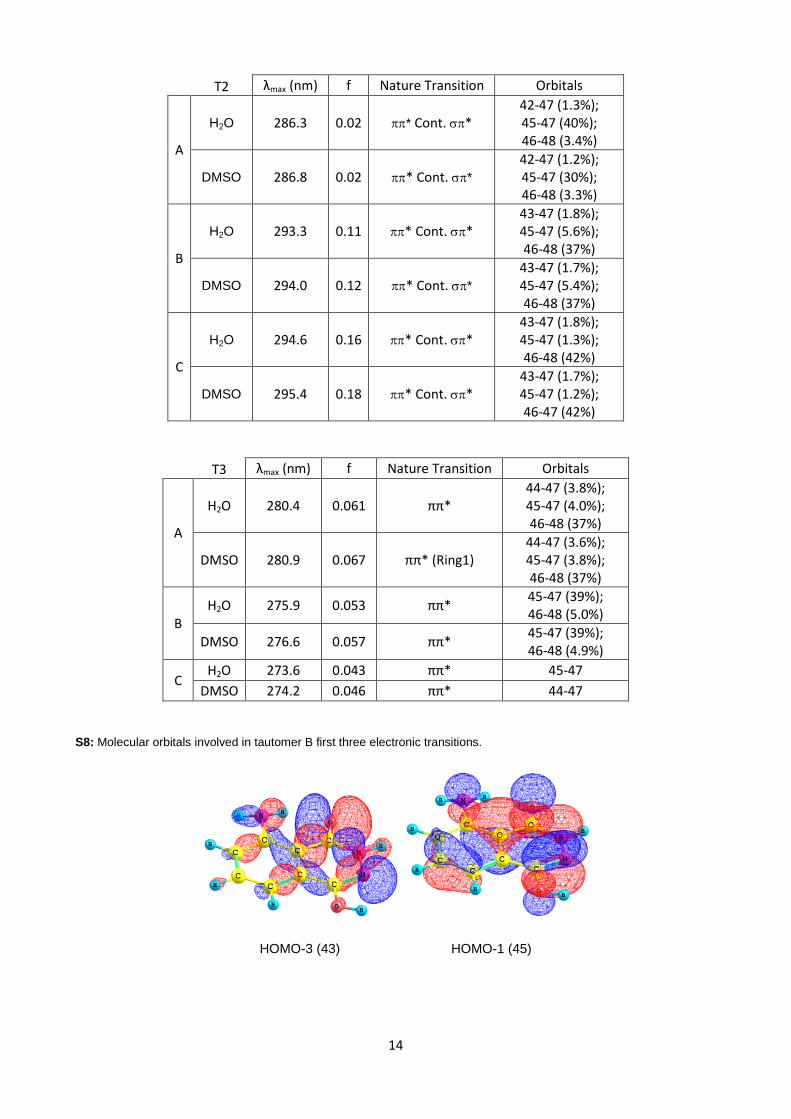
With respect to the error in the predicted
maximum absorption wavelength, we have
verified that it may be related to the level of
contamination in the transitions (*). Another
possibility is the contribution of the aniline moiety
to the molecular orbitals involved in the transition.
That proposal comes directly from the fact that
MP2 calculations described the aniline
functionality in a different way than DFT methods.
4.4 Excitation Anisotropy
We have studied luminol’s anisotropy as a
function of excitation wavelength using a 9:1
ethanol-methanol glass. The excitation spectra
were obtained following the two emission maxima
observed in the fluorescence at 100 K, 390 nm
and 406 nm. In Figure 8 we can verify that only
one of those excitation anisotropies goes to 0.4 at
the wavelength of the first electronic transition.
The fact that with the emission at 406 nm the
anisotropy has a limiting anisotropy value was
justified by the observed Stokes shift of the
sample.9
We also have verified that the transition
moment for the second electronic transition is
practically orthogonal to the transition moment for
the first transition. Using data from Table 2
(theoretical predictions for the excitation
anisotropies in water) we conclude that the only
two luminol tautomeric forms that are able to
explain the observed anisotropy at 300 nm
(excitation) are B and C but not A.
Even though we have perfectly excluded
luminol’s tautomer A existence, we cannot verify
the existence of the other two tautomeric forms of
luminol separately, i.e., we have not gathered
evidence that tautomers B and C simultaneously
exist.

7
Table 2: Excitation anisotropies theoretically predicted
in water for luminol’s tautomers A, B and C. Sn.Sm
represents the transition moments involved in the
calculated anisotropy. Inside brackets are the
angles between the transition moments.
S1.S2 S1.S3
A0.074
(132.5)-0.11(66.7)
B-0.19(96.9)
0.007(126.0)
C-0.15(73.2)
-0.18(79.6)
4.5. Chemiluminescence
One last study we performed was the
chemiluminescence of luminol’s derivatives we
have synthesized. The chemiluminescence
spectra in Figure 9 show that the maximum
emission wavelength is the same in all species
meaning that the chromophore is somewhat
independent of the aniline functionality. Besides,
we observed that the chemiluminescence
quantum yield of those derivatives is decreased
with respect to luminol’s (cf. Table 3).
Table 3: Chemiluminescence quantum yield of the
derivatives we have synthesized towards luminol’s.
EC Bn DMU
ΦCL 91% 39% 1.5%
We have also verified that the observed
emission is from the aminodiphthalate anion
(species B in Figure 1). One last point worth to be
mentioned is the observation of a shoulder in
luminol’s chemiluminescence that we have
assigned to the acid conjugate of the
aminodiphthalate dianion. This is the first time
such behaviour is observed, meaning that two
species are emitting light in the system we have
studied. We propose that the acid conjugate of
aminodiphthalate comes from an acid-base
reaction in the excited state.
5. Conclusions
We verified that of the 6 tautomeric forms
of luminol studied, the most stable have
aromaticity in ring 1 (trisubstituted benzene ring)
and in the other ring one carboxyl group. The
tautomer with the carboxyl group closer to the
aniline functionality, B, is the most stable one in all
conditions. Regarding acidity, the hydrazide
protons are the most labile, followed by an aniline
one.
From luminol’s derivatives spectra we
verified that the main effect observed is in the
absorption spectra that changes not only between
derivatives but also with the media. The
fluorescence spectra are less affected by
acylation of luminol and the chemiluminescence is
merely decreased its intensity, i.e., the
chemiluminescence quantum yield decreased
upon derivatization.
Besides, we observed that using
MP2/6-31G** geometry optimization followed by
TDDFT calculations (PBE1PBE/aug-cc-pVTZ)
yields good absorption spectra prediction. We
have also performed excitation anisotropy studies
and verified that luminol’s tautomer A (structure by
which luminol is commonly known) cannot
describe the observed results.
6. Acknowledgments
I wish to acknowledge all my laboratory
colleagues.

8
Figure 6: Luminol’s absorption and fluorescence in DMSO. Initials identify the derivatives. Lum stands for luminol, TFA
for its trifluoroacetyl derivative, EC for ECLum, Bn for BnLum and DMU for DMU1Lum.
Figure 7: Luminol’s normalized theoretical absorption (tautomers A, B and C) superposed with the experimental
absorption spectra. Theoretical calculations performed in water’s dielectric. The experimental spectrum was performed in
water at pH 7.15.
Figure 8: Luminol’s excitation anisotropy in 9:1 ethanol-methanol glass at 100 K. Study at two different emission
wavelengths, 390 nm and 406 nm.
0
0.2
0.4
0.6
0.8
1
1.2
250 300 350 400Wavelength (nm)
Norm. Abs. Lum
TFA
EC
Bn
DMU
0
0.2
0.4
0.6
0.8
1
340 440 540Wavelength (nm)
Norm. Fluor.
0
0.2
0.4
0.6
0.8
1
270 290 310 330 350 370 390 410
No
rm.A
bs.
Wavelength (nm)
Exp
A
B
C
-0.2
0
0.2
0.4
250 270 290 310 330 350 370
Wavelength (nm)
r
390
406
Exc

9
Figure 9: Luminol and its derivatives normalized chemiluminescence spectra in water at pH 11.8 using K2S2O8 and H2O2
as oxidants.7
Figure 10: Transitions moments for the first three transitions of luminol’s tautomers A, B and C (from left to right).
0
0.2
0.4
0.6
0.8
1
370 420 470 520Wavelength (nm)
Norm. Chem. Luminol
ECLum
BnLum
DMULum

10
7. References
1. Ferreira E. C., Rossi A. V., Quim. Nova, 2002,
25, 6, 1003.
2. Albrecht H.O., Z. Phys. Chem., 1928, 10, 70.
3. Yang C., Zhang Z., Wang J., Microchim. Acta,
2009, 167 91, 96.
4. Gaussian 03, Revision C.02, M. J. Frisch, G.
W. Trucks, H. B. Schlegel, G. E. Scuseria, M. A.
Robb, J. R. Cheeseman, J. A. Montgomery, Jr., T.
Vreven, K. N. Kudin, J. C. Burant, J. M. Millam, S.
S. Iyengar, J. Tomasi, V. Barone, B. Mennucci, M.
Cossi, G. Scalmani, N. Rega, G. A. Petersson, H.
Nakatsuji, M. Hada, M. Ehara, K. Toyota, R.
Fukuda, J. Hasegawa, M. Ishida, T. Nakajima, Y.
Honda, O. Kitao, H. Nakai, M. Klene, X. Li, J. E.
Knox, H. P. Hratchian, J. B. Cross, C. Adamo, J.
Jaramillo, R. Gomperts, R. E. Stratmann, O.
Yazyev, A. J. Austin, R. Cammi, C. Pomelli, J. W.
Ochterski, P. Y. Ayala, K. Morokuma, G. A. Voth,
P. Salvador, J. J. Dannenberg, V. G. Zakrzewski,
S. Dapprich, A. D. Daniels, M. C. Strain, O.
Farkas, D. K. Malick, A. D. Rabuck, K.
Raghavachari, J. B. Foresman, J. V. Ortiz, Q. Cui,
A. G. Baboul, S. Clifford, J. Cioslowski, B. B.
Stefanov, G. Liu, A. Liashenko, P. Piskorz, I.
Komaromi, R. L. Martin, D. J. Fox, T. Keith, M. A.
Al-Laham, C. Y. Peng, A. Nanayakkara, M.
Challacombe, P. M. W. Gill, B. Johnson, W. Chen,
M. W. Wong, C. Gonzalez, and J. A. Pople,
Gaussian, Inc., Wallingford CT, 2004.
5. Tomasi J., Persico M., Chem. Rev., 1997, 94,
2027.
6. Armarego W. L. F., Perrin D. D., Purification of
laboratory chemicals, 4th
ed., Butterworth
Heinemann: Oxford ; Boston, 1996.
7. Rauhut M. M., Semsel A. M., Roberts B. G., J.
Org. Chem., 1966, 31, 8, 2431.
8. Moyon N. S., Chandra A. K., Mitra S., J. Phys.
Chem. A, 2010, 114, 60.
9. Valeur B., Molecular Fluorescence, 2002,
Wiley-VCH.

11
Supplementary Material
S1: Hydrogen bonding distance in luminol’s tautomeric forms. In E2 and F2, the highest value for hydrogen
bonding is obtained for the interaction where the oxygen atom from the carboxyl moiety acts has acceptor.
Tautomer A B C D E2 F2
d (Å) 1.93 1.92 1.98 1.99 2.14|2.39 2.09|2.38
S2: Charges in luminol’s tautomers in gas and DMSO at highest level of theory (MP2/aug-cc-pVTZ). The atom
labelling is present also below. Charges in atomic units.
A B C
Vacuum DMSO Vacuum DMSO Vacuum DMSO
C1 -0.602 -0.613 -0.617 -0.61 -0.692 -0.678
C2 -0.226 -0.183 -0.241 -0.23 -0.179 -0.165
C3 -0.93 -0.962 -1.045 -1.046 -0.942 -0.954
C4 1.162 1.231 1.639 1.649 1.134 1.168
C5 0.968 0.924 0.832 0.831 1.291 1.28
C6 0.591 0.603 0.729 0.697 0.7 0.67
C7 0.152 0.266 -0.036 -0.019 -0.058 -0.083
C8 -0.064 0.039 -0.241 -0.264 -0.254 -0.232
N1 -0.741 -0.771 -0.762 -0.773 -0.748 -0.755
N2 -0.015 -0.038 0.493 0.48 -0.798 -0.826
N3 -0.04 -0.061 -0.862 -0.889 0.388 0.377
O1 -0.844 -0.995 -0.94 -0.983 -0.507 -0.53
O2 -0.869 -1.017 -0.543 -0.571 -0.968 -1.028
D E2 F2
Vacuum DMSO Vacuum DMSO Vacuum DMSO
C1 -0.674 -0.66 -0.57 -0.573 -0.553 -0.563
C2 -0.244 -0.23 -0.354 -0.35 -0.384 -0.381
C3 -0.839 -0.842 -0.998 -1.008 -0.971 -0.987
C4 1.257 1.268 1.412 1.438 1.53 1.546
C5 1.04 1.031 1.166 1.12 1.15 1.129
C6 0.71 0.68 0.968 0.925 0.963 0.909
C7 -0.044 -0.046 -0.05 -0.04 0.098 0.124
C8 -0.229 -0.225 -0.255 -0.188 -0.545 -0.507
N1 -0.746 -0.754 -1.191 -1.234 -1.199 -1.245
N2 -0.457 -0.51 -0.072 -0.072 0.406 0.392
N3 -0.507 -0.556 0.034 0.033 -0.882 -0.895
O1 -0.513 -0.534 -0.642 -0.647 -0.581 -0.589
O2 -0.552 -0.576 -0.883 -0.94 -0.549 -0.581
12
S3: Energetic relationship between luminol’s base conjugates.
S4: Luminol’s normalized absorption spectrum in DMF followed by the normalized fluorescence in DMF.
2.50.0
23.8
10.0
20.4
G(k
cal/
mo
l)
GasAlpha
Delta
Eta
Nu
Omikron
0.00.6
3.1
13.7
G(k
cal/
mo
l)
Gas
Beta
Epsilon
Zeta
Xi
0
0.2
0.4
0.6
0.8
1
250 300 350 400 450Wavelength (nm)
Norm.Abs.
Lum
TFA
EC
Bn
DMU
0
0.2
0.4
0.6
0.8
1
360 410 460 510Wavelength (nm)
Norm. Fluor.

13
S5: Luminol’s normalized absorption spectrum in water followed by the normalized fluorescence in water. pH of 11.8
S6: Luminol’s normalized theoretical absorption spectrum in DMSO superposed with the experimental one. The
excitations of luminol were predicted using tautomer’s A, B and C.
S7: Data collected from TD DFT studies on luminol. On the left superior corner is the identification of the transition. Cont.
stands for contamination on the transition and f is the oscillator strength.
T1 λmax (nm) f Nature Transition Orbitals
AH2O 339.6 0.15 *
44-48 (1.8%);46–47 (43%)
DMSO 340.7 0.16 * (Ring1)44-48 (1.7%);46-47 (44%)
BH2O 329.2 0.17 * Cont. *
43-48 (2.0%);46-47 (42%)
DMSO 330.4 0.19 * (Ring1) Cont.43-48 (1.9%);46-47 (42%)
CH2O 328.9 0.17 * Cont. *
43-48 (2.2%);46-47 (42%)
DMSO 330.1 0.19 * Cont. *43-48 (2.0%);46-47 (43%)
0
0.2
0.4
0.6
0.8
1
250 300 350 400Wavelength (nm)
Norm. Abs. Lum
EC
Bn
DMU
0
0.2
0.4
0.6
0.8
1
350 450 550Wavelength (nm)
Norm. Fluor.
0
0.2
0.4
0.6
0.8
1
260 310 360 410
No
rm.A
bs.
Wavelength (nm)
Exp
A
B
C
14
T2 λmax (nm) f Nature Transition Orbitals
A
H2O 286.3 0.02 * Cont. *42-47 (1.3%);45-47 (40%);46-48 (3.4%)
DMSO 286.8 0.02 * Cont. *
42-47 (1.2%);45-47 (30%);46-48 (3.3%)
B
H2O 293.3 0.11 * Cont. *43-47 (1.8%);45-47 (5.6%);46-48 (37%)
DMSO 294.0 0.12 * Cont. *
43-47 (1.7%);45-47 (5.4%);46-48 (37%)
C
H2O 294.6 0.16 * Cont. *43-47 (1.8%);45-47 (1.3%);46-48 (42%)
DMSO 295.4 0.18 * Cont. *43-47 (1.7%);45-47 (1.2%);46-47 (42%)
T3 λmax (nm) f Nature Transition Orbitals
A
H2O 280.4 0.061 ππ*44-47 (3.8%);45-47 (4.0%);46-48 (37%)
DMSO 280.9 0.067 ππ* (Ring1)44-47 (3.6%);45-47 (3.8%);46-48 (37%)
BH2O 275.9 0.053 ππ*
45-47 (39%);46-48 (5.0%)
DMSO 276.6 0.057 ππ*45-47 (39%);46-48 (4.9%)
CH2O 273.6 0.043 ππ* 45-47
DMSO 274.2 0.046 ππ* 44-47
S8: Molecular orbitals involved in tautomer B first three electronic transitions.
HOMO-3 (43) HOMO-1 (45)

15
HOMO (46) LUMO (47)
LUMO+1 (48)