SYNTHESIS AND CHARACTERIZATION OF SPINEL TYPE MAGNETIC …ncl.csircentral.net/914/1/th1813.pdf ·...
248
SYNTHESIS AND CHARACTERIZATION OF SPINEL TYPE MAGNETIC AND NON-MAGNETIC OXIDE NANOMATERIALS thesis submitted to the UNIVERSITY OF PUNE for the degree of DOCTOR OF PHILOSOPHY in Chemistry By S. Vijayanand Research Guide Dr. P. A. JOY Research Co-Guide Dr. H. S. POTDAR Physical and Materials Chemistry Division National Chemical Laboratory Pune 411008 India September 2010
Transcript of SYNTHESIS AND CHARACTERIZATION OF SPINEL TYPE MAGNETIC …ncl.csircentral.net/914/1/th1813.pdf ·...
SYNTHESIS AND CHARACTERIZATION OF SPINEL TYPE
MAGNETIC AND NON-MAGNETIC OXIDE NANOMATERIALS
thesis
submitted to the
UNIVERSITY OF PUNE
for the degree of
DOCTOR OF PHILOSOPHY
in Chemistry
By
S. Vijayanand
Research Guide
Dr. P. A. JOY
Research Co-Guide
Dr. H. S. POTDAR
Physical and Materials Chemistry Division
National Chemical Laboratory
Pune 411008
India
September 2010
CERTIFICATE
Certified that the work incorporated in the thesis
Synthesis and Characterization of Spinel Type Magnetic and
Non-Magnetic Oxide Nanomaterials
submitted by Mr. S. Vijayanand for the Degree of Doctor of Philosophy in
Chemistry was carried out by the candidate under our supervision at the Physical &
Materials Chemistry Division of National Chemical Laboratory, Pune. Such material
as has been obtained from other sources has been duly acknowledged in the thesis.
Dr. H. S. Potdar Dr. P. A. Joy
(Research Co-Guide) (Research Guide)
ii
DECLARATION
I, hereby declare that the thesis entitled “Synthesis and Characterization of Spinel
Type Magnetic and Non-Magnetic Oxide Nanomaterials ”, submitted for the
Degree of Doctor of Philosophy in Chemistry to the University of Pune, has been carried
out by me at the Physical & Materials Chemistry Division, National Chemical Laboratory,
Pune, India, Under the joint supervision of Dr. P. A. Joy (Research Guide) and Dr. H.
S. Potdar (Research Co-Guide). The work is original and has not been submitted in part
or full by me for any other degree or diploma to this or any other university.
Date: S. Vijayanand
iii

...Dedicated to my Parents and to mybrother ...
iv

Acknowledgements
It is a great pleasure to express my gratitude and sincere thanks to all those who helped
me directly and indirectly to complete this work. This thesis would not have been possible
without all these people and their constant encouragement.
First of all I would like to express my immense and sincere gratitude to my research
supervisor Dr. P.A. Joy for his constant support and guidance throughout my research
work. I really admired the way he handle the scientific and nonscientific things with ut-
most perfection and sincerity. There is no doubt that I learnt so many things from him
especially how to analyze and get valuable information even from small things, and how
to solve a problem. My heartfelt thanks for his valuable time in bringing this output and
shaping this thesis in the perfect manner.
I could not find enough words to thank the efforts and input rendered by my research
co-supervisor, Dr. H.S. Potdar, to bring this thesis to this stage. The enthusiasm and
interest he paid to resolve any technical problems is an inspiration for me. He is one of
the genuine, humble and down-to-earth people I have seen. Many many thanks to him for
his effort to teach so many scientific things which can be seen as an output in this thesis.
I owe my deepest gratitude to Dr. Veda Ramaswamy, who introduced me to the
research world by giving an opportunity in this prestigious laboratory. Also I would like
to express my whole hearted thanks for her personal support and care during my difficult
situations.
I am very much grateful to Dr. K. Vijayamohanan, Dr. C.V. Rode, Dr. P.P.
Patil for their valuable discussions and facilities that they afford to me to make this work
more meaningful.
I am grateful to Dr. S. Sivaram, Director, NCL who gave me an opportunity to work
v
in this esteemed research laboratory and also to CSIR for financial support. I wish to
thank Dr. S. Pal, Head of Physical Chemistry Division for allowing me to use all the
facilities in the division.
My sincere thanks to Dr. B. L. V. Prasad, Dr. C. S. Gopinath, Dr. K. Sreedhar,
Dr. S. B. Deshpande, Dr. Ravi, and Dr. Ajith Kumar for their valuable advice and
help. I am highly indebted to Mr. A.B. Gaikwad, Dr. K. R. Patil, Mr. Gholap, Mr.
Naren, Mr. Kethan, and Dr. S. Kulkarni, who were helpful for characterizing various
samples. Also I acknowledge Dr. Dewyani Patil for the sensor measurements. I extend
my gratitude to Mr. Deepak Jori, Mr. Punekar and other office staffs for their timely help.
I forever indebted to my former teacher Dr. R. Saraswathi from Materials Science De-
partment, Madurai Kamaraj University, Madurai.
My deepest and heartiest thanks goes to all my seniors, Dr. Raj, Dr. Joly, Dr. Deka, Dr.
Sanjay, Dr. Seema and Dr. Shekar, fellow lab mates Sreeja, Khaja, Mangesh, Pankaj,
Govind, Jaya, Lenin, Ramsundar and Bindhu without their help and support it is unimag-
inable to complete this work. Also I would like to mention about late Harwade kaka for
his care and memories.
I take time to convey my gratitude to the project students who worked with me Venkatesh,
Mani, Hemjoti, Selvaraj, Mathi, Souda, Yogita, Ramya for their help.
I would like to thank Geethy, Deepthi, Soya, Lilly, Pavan, Ranjith, Aneesh, Sister Mary,
Anju, Hanna, Rojisha, Maneesh for their nice and friendly atmosphere.
I also acknowledge the homely environment provided by the Tamil group friends Ed-
win, Palani, Senthil Kumar, Nagarajan, Nellai Nagaraj, Sridhar, Pandiyarajan, Mohan,
Dharma, Kannan & Sangeetha, Suresh, Padmaprasad, Viswanathan, Sabarinathan, Selva,
Dhana, Kashmir, Senthil, Venkat, Sivaranjani, Rajambal.
vi
I owe my deepest appreciation to Dr. Chidambaram, Dr. Bala, Dr. Pradeep (poori),
Dr. Mallikarjuna, Mr. Ramanujam, Mr. Marimuthu, Mr. Senthil Kumar, for their
guidance and advice. Poori deserves a special mention for the carring and love. Also I
would like to give my appreciation to Balaji anna and his family for their concern.
I am very grateful to the GJ Hostel friends Dhanraj (room partner), Alson, Joyashish,
Ajay, Venu(matchi), Manoj (matchi), Swaroop anna, Eldho, Venu, Rajesh, Suresh, Sandeep,
Prasanna anna who made my stay very memorable.
It is a pleasure for me to thank my NCL friends Deepaknand (thadiyan), Vinod (thadi),
Sumesh, Kuttan, Beena, Any, Thusara, Vinisha, Vinayak, Bhaskar, Nagesh, Manasi,
Deepthi, Ravi, Ajay, Sheetal, Jijil, Soumya, Leena, Hari, Vivek and Jayprakash Nadgeri.
In this occasion I would like mention my friends Thirumoorthy, Saravanakumar,
Kannan, Saravanaprabhu and Caroline for their constant support and help espe-
cially during my toughest time.
My deepest acknowledgement goes to Amma, Appa, Anna, Anni, Ammu and
Sappu for their love, support and encouragement which made me to come upto this level.
S. Vijayanand
vii
Contents
Abstract 1
1 Introduction 3
1.1 Materials Science . . . . . . . . . . . . . . . . . . . . . . . . . . . . . . . . 3
1.2 Metal Oxides . . . . . . . . . . . . . . . . . . . . . . . . . . . . . . . . . . 5
1.3 Spinel type oxides . . . . . . . . . . . . . . . . . . . . . . . . . . . . . . . . 6
1.4 Perovskite type oxides . . . . . . . . . . . . . . . . . . . . . . . . . . . . . 8
1.5 Nanoscience and Nanotechnology . . . . . . . . . . . . . . . . . . . . . . . 11
1.6 Oxide Nanomaterials . . . . . . . . . . . . . . . . . . . . . . . . . . . . . . 11
1.7 Some Properties and Applications of Metal Oxides . . . . . . . . . . . . . 14
1.7.1 Magnetic properties . . . . . . . . . . . . . . . . . . . . . . . . . . . 14
1.7.2 Magnetism in Ferrites . . . . . . . . . . . . . . . . . . . . . . . . . 19
1.7.3 Magnetism in Perovskites . . . . . . . . . . . . . . . . . . . . . . . 20
1.7.4 Dielectric properties . . . . . . . . . . . . . . . . . . . . . . . . . . 21
1.7.5 Multiferroism . . . . . . . . . . . . . . . . . . . . . . . . . . . . . . 23
1.7.6 Chemical Sensors . . . . . . . . . . . . . . . . . . . . . . . . . . . . 24
1.7.7 Catalysis . . . . . . . . . . . . . . . . . . . . . . . . . . . . . . . . . 28
1.7.8 Li-ion batteries . . . . . . . . . . . . . . . . . . . . . . . . . . . . . 29
1.7.9 Supercapacitors . . . . . . . . . . . . . . . . . . . . . . . . . . . . . 34
1.8 Scope of the present work . . . . . . . . . . . . . . . . . . . . . . . . . . . 36
2 Experimental Methods 49
2.1 Synthesis methods . . . . . . . . . . . . . . . . . . . . . . . . . . . . . . . 49
2.1.1 Coprecipitation . . . . . . . . . . . . . . . . . . . . . . . . . . . . . 49
2.1.2 Auto-combustion method . . . . . . . . . . . . . . . . . . . . . . . 51
viii
2.2 Characterization methods . . . . . . . . . . . . . . . . . . . . . . . . . . . 53
2.2.1 Powder X-Ray Diffraction . . . . . . . . . . . . . . . . . . . . . . . 53
2.2.2 High Resolution Transmission Electron
Microscopy (HRTEM) . . . . . . . . . . . . . . . . . . . . . . . . . 55
2.2.3 Infrared (IR) spectroscopy . . . . . . . . . . . . . . . . . . . . . . . 56
2.2.4 X-Ray Photoelectron Spectroscopy (XPS) . . . . . . . . . . . . . . 57
2.2.5 Surface Area Measurement . . . . . . . . . . . . . . . . . . . . . . . 57
2.2.6 Thermogravimetric Analysis (TGA) . . . . . . . . . . . . . . . . . . 58
2.2.7 Vibrating Sample Magnetometer (VSM) . . . . . . . . . . . . . . . 59
2.2.8 Catalytic Oxidation . . . . . . . . . . . . . . . . . . . . . . . . . . . 60
2.2.9 Gas Sensor measurements . . . . . . . . . . . . . . . . . . . . . . . 60
2.2.10 Electrochemical measurements . . . . . . . . . . . . . . . . . . . . . 62
3 Synthesis, Characterization, and Applications of Nanostructured Co3O4
and ZnCo2O4 66
3.1 Nanostructured Co3O4 . . . . . . . . . . . . . . . . . . . . . . . . . . . . . 66
3.1.1 Molecular Precursor Cobalt Hydroxy Carbonate . . . . . . . . . . . 68
3.1.2 Synthesis . . . . . . . . . . . . . . . . . . . . . . . . . . . . . . . . 70
3.1.3 Characterization . . . . . . . . . . . . . . . . . . . . . . . . . . . . 71
3.1.3.1 Thermogravimetry and Microanalysis . . . . . . . . . . . . 71
3.1.3.2 X-Ray Diffraction . . . . . . . . . . . . . . . . . . . . . . 72
3.1.3.3 HRTEM Studies . . . . . . . . . . . . . . . . . . . . . . . 75
3.1.3.4 Infrared Spectroscopy . . . . . . . . . . . . . . . . . . . . 78
3.1.3.5 Surface Area and Porosity . . . . . . . . . . . . . . . . . . 79
3.1.3.6 X-ray Photoelectron Spectroscopy . . . . . . . . . . . . . 81
3.1.3.7 Magnetic Measurements . . . . . . . . . . . . . . . . . . . 83
3.1.4 Application of Co3O4 Nanorods in CO Gas Sensing . . . . . . . . . 84
3.1.5 Application of Co3O4 nanorods in catalysis . . . . . . . . . . . . . . 91
3.1.6 Conclusions . . . . . . . . . . . . . . . . . . . . . . . . . . . . . . . 93
3.2 Nanostructured ZnCo2O4 . . . . . . . . . . . . . . . . . . . . . . . . . . . . 93
3.2.1 Synthesis . . . . . . . . . . . . . . . . . . . . . . . . . . . . . . . . 94
3.2.2 Characterization . . . . . . . . . . . . . . . . . . . . . . . . . . . . 95
ix
3.2.2.1 Thermogravimetry and Microanalysis . . . . . . . . . . . . 95
3.2.2.2 X-Ray Diffraction . . . . . . . . . . . . . . . . . . . . . . 97
3.2.2.3 HRTEM . . . . . . . . . . . . . . . . . . . . . . . . . . . . 98
3.2.2.4 Surface area and porosity . . . . . . . . . . . . . . . . . . 100
3.2.2.5 Infrared Spectroscopy . . . . . . . . . . . . . . . . . . . . 101
3.2.2.6 X-ray Photoelectron Spectroscopy . . . . . . . . . . . . . 102
3.2.3 LPG Gas Sensing Properties . . . . . . . . . . . . . . . . . . . . . . 103
3.2.4 Conclusions . . . . . . . . . . . . . . . . . . . . . . . . . . . . . . . 109
4 Nanocrystalline Co3O4 in Li-ion Batteries and Supercapacitors 119
4.1 Introduction . . . . . . . . . . . . . . . . . . . . . . . . . . . . . . . . . . . 119
4.2 Application as anode in LIB . . . . . . . . . . . . . . . . . . . . . . . . . . 120
4.3 Application as a supercapacitor material . . . . . . . . . . . . . . . . . . . 127
4.4 Conclusions . . . . . . . . . . . . . . . . . . . . . . . . . . . . . . . . . . . 132
5 Synthesis and Magnetic Properties of Nanocrystalline Spinel Ferrites 136
5.1 Introduction . . . . . . . . . . . . . . . . . . . . . . . . . . . . . . . . . . . 136
5.2 Nanocrystalline Fe3O4 . . . . . . . . . . . . . . . . . . . . . . . . . . . . . 137
5.2.1 Synthesis . . . . . . . . . . . . . . . . . . . . . . . . . . . . . . . . 138
5.2.2 Characterization and Magnetic Properties . . . . . . . . . . . . . . 138
5.2.3 Conclusions . . . . . . . . . . . . . . . . . . . . . . . . . . . . . . . 148
5.3 Nanocrystalline ZnFe2O4 . . . . . . . . . . . . . . . . . . . . . . . . . . . . 148
5.3.1 Synthesis . . . . . . . . . . . . . . . . . . . . . . . . . . . . . . . . 150
5.3.2 Characterization and Magnetic Properties . . . . . . . . . . . . . . 150
5.3.3 Conclusions . . . . . . . . . . . . . . . . . . . . . . . . . . . . . . . 156
5.4 Nanocrystalline CoFe2O4 . . . . . . . . . . . . . . . . . . . . . . . . . . . . 156
5.4.1 Synthesis . . . . . . . . . . . . . . . . . . . . . . . . . . . . . . . . 157
5.4.2 Characterization and Magnetic Properties . . . . . . . . . . . . . . 158
5.4.3 Conclusions . . . . . . . . . . . . . . . . . . . . . . . . . . . . . . . 172
6 Magnetic Properties of Nanocrystalline Multiferroic BiFeO3 180
6.1 Magnetoelectric multiferroics . . . . . . . . . . . . . . . . . . . . . . . . . . 180
6.2 Structure of BiFeO3 . . . . . . . . . . . . . . . . . . . . . . . . . . . . . . . 183
x
6.3 Synthesis of BiFeO3 . . . . . . . . . . . . . . . . . . . . . . . . . . . . . . . 184
6.4 Properties of BiFeO3 . . . . . . . . . . . . . . . . . . . . . . . . . . . . . . 186
6.5 Studies on BiFeO3 synthesized by a coprecipitation/digestion method . . . 187
6.5.1 Synthesis . . . . . . . . . . . . . . . . . . . . . . . . . . . . . . . . 187
6.5.2 Characterization . . . . . . . . . . . . . . . . . . . . . . . . . . . . 188
6.5.3 Magnetic properties . . . . . . . . . . . . . . . . . . . . . . . . . . . 193
6.5.4 Conclusions . . . . . . . . . . . . . . . . . . . . . . . . . . . . . . . 204
6.6 Studies on BiFeO3 powders synthesized by an auto-combustion method . . 205
6.6.1 Synthesis . . . . . . . . . . . . . . . . . . . . . . . . . . . . . . . . 205
6.6.2 Characterization . . . . . . . . . . . . . . . . . . . . . . . . . . . . 207
6.6.3 Magnetic properties . . . . . . . . . . . . . . . . . . . . . . . . . . . 209
6.6.4 Conclusions . . . . . . . . . . . . . . . . . . . . . . . . . . . . . . . 215
7 Conclusions 223
xi
List of Tables
1.1 Example uses of advanced materials in devices and machines [2]. . . . . . . 4
1.2 Different types of spinels. . . . . . . . . . . . . . . . . . . . . . . . . . . . . 7
1.3 Some applications of spinel oxides . . . . . . . . . . . . . . . . . . . . . . . 8
1.4 Some perovskites and related oxides [14]. . . . . . . . . . . . . . . . . . . . 9
1.5 Applications of perovskite oxides. [16]. . . . . . . . . . . . . . . . . . . . . 10
1.6 Different types of nanomaterials [25]. . . . . . . . . . . . . . . . . . . . . . 12
1.7 Types of metal oxides based gas sensors. . . . . . . . . . . . . . . . . . . . 25
1.8 Some examples of metal oxides for the environmental monitoring. . . . . . 27
1.9 Application of transition metal oxide as catalysts [135]. . . . . . . . . . . . 28
1.10 History of developments in batteries [146] . . . . . . . . . . . . . . . . . . . 30
3.1 Microanalysis data on cobalt hydroxy carbonate . . . . . . . . . . . . . . . 72
3.2 Crystallite size and lattice parameter of Co3O4 calcined at different tem-
peratures and commercial Co3O4. . . . . . . . . . . . . . . . . . . . . . . . 75
3.3 Surface areas of CC-300, 600, 750, compared with that of the Aldrich sample. 79
3.4 Result of the activity of veratryl alcohol oxidation to veratryl aldehyde by
using Co3O4 nanorods. . . . . . . . . . . . . . . . . . . . . . . . . . . . . . 93
3.5 Microanalysis data on mixed precursor ZC-A . . . . . . . . . . . . . . . . . 96
3.6 Crystallite size and lattice parameter of ZnCo2O4 calcined at different tem-
peratures. . . . . . . . . . . . . . . . . . . . . . . . . . . . . . . . . . . . . 99
5.1 Sample code, digestion time, crystallite size and lattice parameter of the
Fe3O4 samples digested for different durations. . . . . . . . . . . . . . . . . 141
5.2 Sample codes and synthesis conditions of ZnFe2O4 (ZFO) synthesized by
the coprecipitation/digestion method at 70 C . . . . . . . . . . . . . . . . 149
5.3 Crystallite size and lattice parameters of different ZnFe2O4 samples. . . . . 152
xii
5.4 Sample codes and calcination temperature of CoFe2O4 (CFC) synthesized
by the corecipitation/digestion method. . . . . . . . . . . . . . . . . . . . . 157
5.5 Crystallite size and cubic lattice parameter of samples synthesized by the
coprecipitation/digestion method . . . . . . . . . . . . . . . . . . . . . . . 158
5.6 Sample codes and glycine-to-metal ratio used for the synthesis of CoFe2O4
by the auto-combustion method. . . . . . . . . . . . . . . . . . . . . . . . . 163
5.7 Crystallite size and lattice parameter of samples synthesized using various
moles of glycine . . . . . . . . . . . . . . . . . . . . . . . . . . . . . . . . . 165
6.1 Sample codes, glycine-to-metal ratios tried in the combustion reaction and
the final products obtained. Bi to Fe ratio is kept as 1:1 for the synthesis. . 206
xiii
List of Figures
1.1 Schematic representation of new hybrid materials. . . . . . . . . . . . . . . 4
1.2 The Spinel structure. . . . . . . . . . . . . . . . . . . . . . . . . . . . . . . 6
1.3 Tetrahedral and octahedral sites in the spinel structure. . . . . . . . . . . . 7
1.4 Structure of a Perovskite, ABO3. . . . . . . . . . . . . . . . . . . . . . . . 9
1.5 Different types of magnetism. . . . . . . . . . . . . . . . . . . . . . . . . . 15
1.6 Different types of magnetic exchange interactions in a ferrite. . . . . . . . . 20
1.7 Illustration of a magnetoelectric coupling. Green and orange ellipse - elec-
trically and magnetically polarizable materials. Circle inside green and
orange ellipse - Ferroelectric and ferro- or ferrimagnetic polarization. The
small circles in the middle denote systems exhibiting magnetoelectric cou-
pling [74]. . . . . . . . . . . . . . . . . . . . . . . . . . . . . . . . . . . . . 23
1.8 Schematic representation of a gas senor. . . . . . . . . . . . . . . . . . . . 25
1.9 Illustration of a battery. . . . . . . . . . . . . . . . . . . . . . . . . . . . . 32
1.10 Comparison of energy density of Li-ion battery. . . . . . . . . . . . . . . . 32
1.11 Electrochemical potential ranges of some Li insertion compounds with ref-
erence to Li [145]. . . . . . . . . . . . . . . . . . . . . . . . . . . . . . . . . 33
1.12 Schematic illustration of shuttling of Li during charge/discharge process. . 34
1.13 Ragone plot: Comparison of power and energy capabilities [157]. . . . . . . 35
2.1 Schematic representation of coprecipitation/digestion method employed in
the present work. . . . . . . . . . . . . . . . . . . . . . . . . . . . . . . . . 51
2.2 Diffraction of X-Rays. . . . . . . . . . . . . . . . . . . . . . . . . . . . . . 54
2.3 Working principle of VSM. . . . . . . . . . . . . . . . . . . . . . . . . . . . 59
2.4 Schematic diagram of a gas sensing setup. . . . . . . . . . . . . . . . . . . 61
3.1 TGA curve of the precursor . . . . . . . . . . . . . . . . . . . . . . . . . . 71
3.2 Powder XRD pattern of the precursor CC-A . . . . . . . . . . . . . . . . . 73
xiv
3.3 Comparison of the powder XRD patterns of the different Co3O4 and the
commercial samples with the simulated pattern of Co3O4. . . . . . . . . . . 74
3.4 HRTEM images of the precursor CC-A along with the SAED pattern . . . 76
3.5 HTREM images of CC-300 and CC-600 with the corresponding lattice
fringes and SAED patterns on the right side. . . . . . . . . . . . . . . . . . 77
3.6 HTREM images and SAED pattern of the Aldrich Co3O4. . . . . . . . . . 77
3.7 FTIR spectra of CC-300 and the commercial Fluka sample . Inset: En-
larged spectra showing the details of the Co-O vibrations. . . . . . . . . . . 78
3.8 BET isotherms and pore size distributions of CC-300 (a,b), CC-600 (c,d),
and CC-750 (e,f). . . . . . . . . . . . . . . . . . . . . . . . . . . . . . . . . 80
3.9 XPS of CC-300 along with the commercial samples from Aldrich and Fluka. 82
3.10 (a) ZFC and FC curves of CC-300 (H = 100 Oe), (b) M vs H curves at 10
K and 300 K. . . . . . . . . . . . . . . . . . . . . . . . . . . . . . . . . . . 83
3.11 Effect of operating temperature on the gas response of CC-300 and com-
mercial Co3O4 powder (Aldrich) to 50 ppm CO gas. . . . . . . . . . . . . . 85
3.12 Response of CC-300 to 50 ppm CO gas at 250 C. . . . . . . . . . . . . . . 86
3.13 Repetitive response of CC-300 to 50 ppm CO gas at the operating temper-
ature of 250 C. . . . . . . . . . . . . . . . . . . . . . . . . . . . . . . . . . 87
3.14 Relationship between gas response of CC-300 and CO gas concentration.
The circles are experimental data and the solid line is the fit to the data,
as discussed in the text. . . . . . . . . . . . . . . . . . . . . . . . . . . . . 88
3.15 Bar chart showing the gas response of CC-300 for different gases. The gas
concentration and operating temperature in all cases are 50 ppm and 250
C, respectively. . . . . . . . . . . . . . . . . . . . . . . . . . . . . . . . . . 89
3.16 Schematic diagram of CO sensing process of the CC-300 nanorods. . . . . . 90
3.17 Oxidation of veratryl alcohol to veratryl aldehyde by Co3O4 nanorod sam-
ples CC-300 and CC-500 and with commercial Co3O4 (Aldrich). . . . . . . 92
3.18 TGA curve of the precursor ZC-A. . . . . . . . . . . . . . . . . . . . . . . 95
3.19 XRD pattern of the precursor ZC-A. . . . . . . . . . . . . . . . . . . . . . 97
3.20 XRD patterns of the samples calcined at different temperatures. . . . . . . 98
3.21 HRTEM images of the precursor ZC-A. . . . . . . . . . . . . . . . . . . . . 99
xv
3.22 HRTEM images and the SAED patterns of the samples ZC-400 (a,b,c) and
ZC-600 (d,e,f). . . . . . . . . . . . . . . . . . . . . . . . . . . . . . . . . . 99
3.23 BET isotherm (left) and pore size distribution (right) of ZC-600. . . . . . . 100
3.24 FTIR spectrum of ZC-600. . . . . . . . . . . . . . . . . . . . . . . . . . . . 101
3.25 Co 2p and Zn 2p XPS spectra of ZC-600. . . . . . . . . . . . . . . . . . . . 102
3.26 Effect of operating temperature on the gas response of ZC-600 to 50 ppm
of LPG. The solid line is a guide to the eyes. . . . . . . . . . . . . . . . . . 103
3.27 Response of ZC-600 to 50 ppm LPG at optimum operating temperature of
350 C. . . . . . . . . . . . . . . . . . . . . . . . . . . . . . . . . . . . . . . 104
3.28 Repetitive response of ZC-600 to 50 ppm LPG at the optimum operating
temperature of 350 C . . . . . . . . . . . . . . . . . . . . . . . . . . . . . 105
3.29 Response of ZC-600 upon sequential exposure to LPG with concentrations
varying from 20 to 60 ppm at optimum operating temperature of 350 C . 106
3.30 Relationship between gas response of ZC-600 and LPG concentration. The
circles are experimental data and the solid line is the fit to the data, as
discussed in the text. . . . . . . . . . . . . . . . . . . . . . . . . . . . . . . 106
3.31 Bar chart showing the gas response of nanostructured ZC-600 for different
gases. The gas concentration and operating temperature in all cases are 50
ppm and 350 C, respectively . . . . . . . . . . . . . . . . . . . . . . . . . 108
4.1 CV plots measured at a scan rate of 1 mV/s for the CC-300 and bare stain-
less steel mesh electrodes using LiClO4 dissolved in propylene carbonate as
the electrolyte. . . . . . . . . . . . . . . . . . . . . . . . . . . . . . . . . . 121
4.2 Galvanostatic discharge curves of the sample CC-300 measured at a dis-
charge rate of 50 mAhg−1 using LiClO4 dissolved in propylene carbonate
as electrolyte. . . . . . . . . . . . . . . . . . . . . . . . . . . . . . . . . . . 122
4.3 Cycle life performance of CC-300 measured at a discharge rate of 50 mAhg−1
using LiClO4 dissolved in propylene carbonate. . . . . . . . . . . . . . . . . 123
4.4 Comparison of the XRD patterns of CC-300 with that of the material after
discharging (CC-300-D) and charging (CC-300-C). . . . . . . . . . . . . . . 124
4.5 7Li solid state NMR of CC-300 after discharge, compared with lithium
chloride as reference. . . . . . . . . . . . . . . . . . . . . . . . . . . . . . . 125
xvi
4.6 HRTEM images of the (a) discharged (CC-300-D and (b) charged (CC-
300-C) samples. . . . . . . . . . . . . . . . . . . . . . . . . . . . . . . . . . 126
4.7 M vs H measurement of CC-300-D. Inset: M vs H curves of CC-300-C and
CC-300. . . . . . . . . . . . . . . . . . . . . . . . . . . . . . . . . . . . . . 126
4.8 Cyclic voltammogram of porous CC-300 measured at a scan rate of 5 mV/s
using 6 M KOH as the electrolyte. . . . . . . . . . . . . . . . . . . . . . . . 128
4.9 Comparison of the cyclic voltammetry curves of porous CC-300 measured
at different scan rates. . . . . . . . . . . . . . . . . . . . . . . . . . . . . . 129
4.10 Scan rate dependent capacitance of CC-300 nanorods. . . . . . . . . . . . . 129
4.11 Galvanostatic charge-discharge curve obtained for porous CC-300 nanorods
at various cycles - 2nd, 500 th and 800 th cycle confirming the cycle stability
of the electrode. . . . . . . . . . . . . . . . . . . . . . . . . . . . . . . . . . 130
4.12 Response of CC-300 discharged at different current densities. . . . . . . . . 131
4.13 Impedance spectroscopy analysis of porous CC-300 nanorods. . . . . . . . 131
5.1 Powder XRD patterns of the different samples, Fe-0 to Fe-8. The simulated
patterns of Fe3O4 and γ-Fe2O3 are shown for comparison. . . . . . . . . . . 139
5.2 Shift in the (311) and (440) reflections of the samples synthesized at dif-
ferent digestion times. . . . . . . . . . . . . . . . . . . . . . . . . . . . . . 140
5.3 FTIR spectra of Fe-0, Fe-4 and Fe-8 . . . . . . . . . . . . . . . . . . . . . . 141
5.4 HRTEM images of Fe-0 and Fe-8 and the corresponding SAED patterns
(right). . . . . . . . . . . . . . . . . . . . . . . . . . . . . . . . . . . . . . . 143
5.5 M vs H curves of Fe-0, Fe-2, Fe-3, Fe-4 and Fe-8 at room temperature. . . 144
5.6 Initial magnetization curves of Fe-0, Fe-2, Fe-3, Fe-4 and Fe-8. . . . . . . . 144
5.7 M vs T measurement above room temperature of Fe-0 and 8 at 50 Oe. . . 145
5.8 M vs H measurement of Fe-8H, commercial α-Fe2O3 (Aldrich), and A-Fe-8
at room temperature. . . . . . . . . . . . . . . . . . . . . . . . . . . . . . . 146
5.9 XRD patterns of A-Fe-8, α-Fe2O3and Fe-8H. T he simulated pattern of
α-Fe2O3 is shown for comparison. . . . . . . . . . . . . . . . . . . . . . . . 147
5.10 XRD pattern of ZF-0, ZF-4, ZF-8 and ZFG1, compared with the simulated
pattern of ZnFe2O4 . . . . . . . . . . . . . . . . . . . . . . . . . . . . . . . 151
5.11 HRTEM images and the corresponding SAED patterns of ZF-8 and ZFG1 152
xvii
5.12 M vs H curves of ZF-0, ZF-8 and ZFG1 at 300 K . . . . . . . . . . . . . . 153
5.13 M vs H curves of ZF-0, ZF-8 and ZFG1 at 5 K . . . . . . . . . . . . . . . 154
5.14 M vs T measurement of ZF-0, ZF-8 and ZFG1 from 300 K to 5 k at 100 Oe 155
5.15 Powder XRD patterns of the samples calcined at different temperatures
compared with the simulated pattern of CoFe2O4. . . . . . . . . . . . . . . 159
5.16 M vs H curves of CoFe2O4 samples calcined at different temperatures. . . . 160
5.17 Variation of saturation magnetization with particle sizes (symbols). The
solid line is the fitted curve as described in the text. . . . . . . . . . . . . . 161
5.18 Coercivity of CoFe2O4 as a function of particle size. The solid line is a
guide to the eye. . . . . . . . . . . . . . . . . . . . . . . . . . . . . . . . . 162
5.19 Powder XRD patterns of CFG25, CFG40, CFG50, CFG70, CFG100. The
simulated pattern of CoFe2O4 is shown for comparison. . . . . . . . . . . . 163
5.20 Powder XRD patterns of CFG125, CFG150, CFG200. The simulated pat-
terns of CoO and Fe are shown for comparison. . . . . . . . . . . . . . . . 164
5.21 M vs H curves of CoFe2O4 samples synthesized with various glycine to
metal ratios from 0.25–1.00. Inset: M vs H of CFG25 and CFG40 . . . . . 165
5.22 Initial magnetization of CoFe2O4 samples synthesized with various glycine
ratios from 0.25–1.00 . . . . . . . . . . . . . . . . . . . . . . . . . . . . . . 166
5.23 M vs H of CoFe2O4 samples synthesized with glycine ratios 1.25, 1.50 and
2.00 . . . . . . . . . . . . . . . . . . . . . . . . . . . . . . . . . . . . . . . 167
5.24 Saturation magnetization vs crystallite size for CoFe2O4 samples synthe-
sized with various glycine ratios. The solid line is a fit to the data as
discussed in the text. . . . . . . . . . . . . . . . . . . . . . . . . . . . . . . 167
5.25 Coercivity as a function of crystallite size for CoFe2O4 samples synthesized
with various glycine ratios. The solid line is a guide to the eye. . . . . . . . 168
5.26 Comparison of M vs H at room temperature for CFG25 synthesized by
the auto-combustion method and CFC-300 obtained by the coprecipitation
method, having comparable particle sizes. . . . . . . . . . . . . . . . . . . 169
5.27 Comparison of the HRTEM images of (a) CFG25 and (b) CFC-300 . . . . 169
5.28 FC and ZFC magnetization measurements below room temperature for the
sample CFG25. . . . . . . . . . . . . . . . . . . . . . . . . . . . . . . . . . 171
xviii
5.29 FC and ZFC magnetization measurement below room temperature for the
sample CFC-300. . . . . . . . . . . . . . . . . . . . . . . . . . . . . . . . . 171
5.30 Magnetic measurement above room temperature for CFG25 and CFC-300. 172
6.1 Multiferroics and magnetoelectric control. . . . . . . . . . . . . . . . . . . 181
6.2 Schematics of the crystal structure of BiFeO3 and the direction of ferro-
electric polarization (arrow) and antiferromagnetic planes (shaded) [33]. . . 183
6.3 Compositional phase diagram of BiFeO3 [61]. . . . . . . . . . . . . . . . . . 185
6.4 Powder XRD pattern of the as-dried precipitate BFA . . . . . . . . . . . . 188
6.5 Thermogravimetric analysis of BFA . . . . . . . . . . . . . . . . . . . . . 189
6.6 Powder XRD patterns of BFO samples calcined at different temperatures.
The simulated pattern of BiFeO3 is indexed and shown for comparison. . . 190
6.7 HRTEM images and SAED pattern of BFO500 . . . . . . . . . . . . . . . 191
6.8 EDAX mapping of BFO500 . . . . . . . . . . . . . . . . . . . . . . . . . . 192
6.9 Magnetization of BFO500 and BFO650 as a function of magnetic field at
room temperature. . . . . . . . . . . . . . . . . . . . . . . . . . . . . . . . 192
6.10 FC and ZFC magnetization curves of BFO500 above room temperature. . . 193
6.11 FC and ZFC magnetization curves of BFO500 below room temperature.
The inset shows the enlarged FC curve below 50 K. . . . . . . . . . . . . . 194
6.12 FC and ZFC magnetization curves of BFO650 below room temperature. . 195
6.13 Initial magnetization curves of BF500 measured at different temperatures. 195
6.14 Comparison of the initial magnetization of BFO500 at 500 Oe as a function
of temperature with the ZFC magnetization measured at 500 Oe. . . . . . 196
6.15 M vs H curves of BFO500 recorded at different temperatures. . . . . . . . 197
6.16 M vs H curves of BFO650 recorded at different temperatures. Inset: M-H
at 10 K . . . . . . . . . . . . . . . . . . . . . . . . . . . . . . . . . . . . . 197
6.17 Coercivity Hc, remnant magnetization Mr, magnetization at 30 kOe M3T ,
saturation magnetization Ms, and the ratio Mr/Ms of BFO500 as a function
of temperature. . . . . . . . . . . . . . . . . . . . . . . . . . . . . . . . . . 199
6.18 Comparison of the FC and ZFC magnetization curves of BFO500 measured
under normal and different conditions. . . . . . . . . . . . . . . . . . . . . 200
xix
6.19 Comparison of the FC and ZFC magnetization curves of BFO650, measured
under normal and different conditions. . . . . . . . . . . . . . . . . . . . . 200
6.20 The inverse of the coercivity of BFO500, normalized with respect to the
maximum in the ZFC magnetization. . . . . . . . . . . . . . . . . . . . . . 203
6.21 Powder XRD patterns of BFO-A to BFO-H. The simulated XRD pattern
of BiFeO3 is indexed and shown for comparison. . . . . . . . . . . . . . . . 208
6.22 HRTEM image and SAED pattern of the sample BFO-E . . . . . . . . . . 209
6.23 M-H curves of BFO-E recorded at different temperatures. Inset:MH loops
at 12, 140 and 300K. . . . . . . . . . . . . . . . . . . . . . . . . . . . . . . 210
6.24 Magnetization at 5 kOe as a function of temperature. Inset: Temperature
variation of coercivity. . . . . . . . . . . . . . . . . . . . . . . . . . . . . . 211
6.25 Zero field cooled and field cooled magnetization of BFO-E measured below
room temperature in a field of 100 Oe. . . . . . . . . . . . . . . . . . . . . 211
6.26 Details of the field cooled magnetization of BFO-E showing anomalies at
different temperatures. . . . . . . . . . . . . . . . . . . . . . . . . . . . . . 212
6.27 Zero field cooled and field cooled magnetization of BFO-E measured above
room temperature in a field of 100 Oe. . . . . . . . . . . . . . . . . . . . . 213
6.28 Powder XRD pattern of BiFeO3 with simulated pattern. Inset (a) normal
and (b) slow scan XRD patterns in the 2θ region where the most intense
(311) reflection from Fe3O4 is expected. . . . . . . . . . . . . . . . . . . . . 214
xx
Abstract
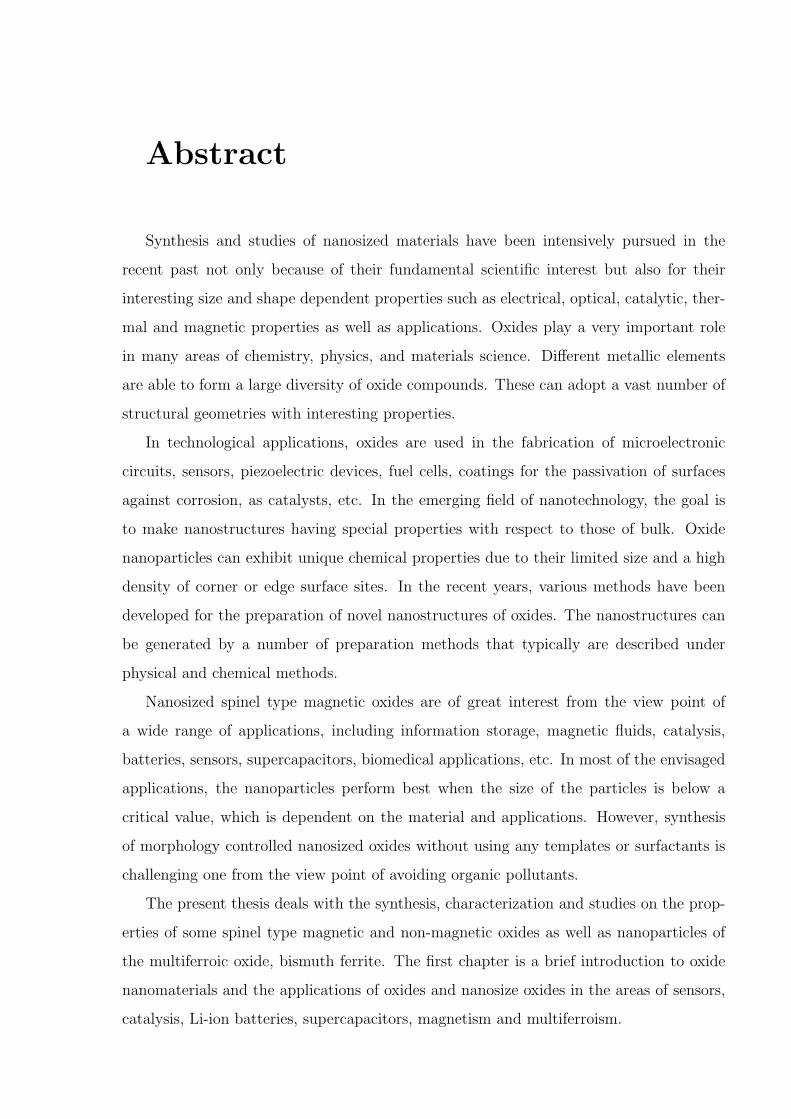
Synthesis and studies of nanosized materials have been intensively pursued in the
recent past not only because of their fundamental scientific interest but also for their
interesting size and shape dependent properties such as electrical, optical, catalytic, ther-
mal and magnetic properties as well as applications. Oxides play a very important role
in many areas of chemistry, physics, and materials science. Different metallic elements
are able to form a large diversity of oxide compounds. These can adopt a vast number of
structural geometries with interesting properties.
In technological applications, oxides are used in the fabrication of microelectronic
circuits, sensors, piezoelectric devices, fuel cells, coatings for the passivation of surfaces
against corrosion, as catalysts, etc. In the emerging field of nanotechnology, the goal is
to make nanostructures having special properties with respect to those of bulk. Oxide
nanoparticles can exhibit unique chemical properties due to their limited size and a high
density of corner or edge surface sites. In the recent years, various methods have been
developed for the preparation of novel nanostructures of oxides. The nanostructures can
be generated by a number of preparation methods that typically are described under
physical and chemical methods.
Nanosized spinel type magnetic oxides are of great interest from the view point of
a wide range of applications, including information storage, magnetic fluids, catalysis,
batteries, sensors, supercapacitors, biomedical applications, etc. In most of the envisaged
applications, the nanoparticles perform best when the size of the particles is below a
critical value, which is dependent on the material and applications. However, synthesis
of morphology controlled nanosized oxides without using any templates or surfactants is
challenging one from the view point of avoiding organic pollutants.
The present thesis deals with the synthesis, characterization and studies on the prop-
erties of some spinel type magnetic and non-magnetic oxides as well as nanoparticles of
the multiferroic oxide, bismuth ferrite. The first chapter is a brief introduction to oxide
nanomaterials and the applications of oxides and nanosize oxides in the areas of sensors,
catalysis, Li-ion batteries, supercapacitors, magnetism and multiferroism.
Abstract 2
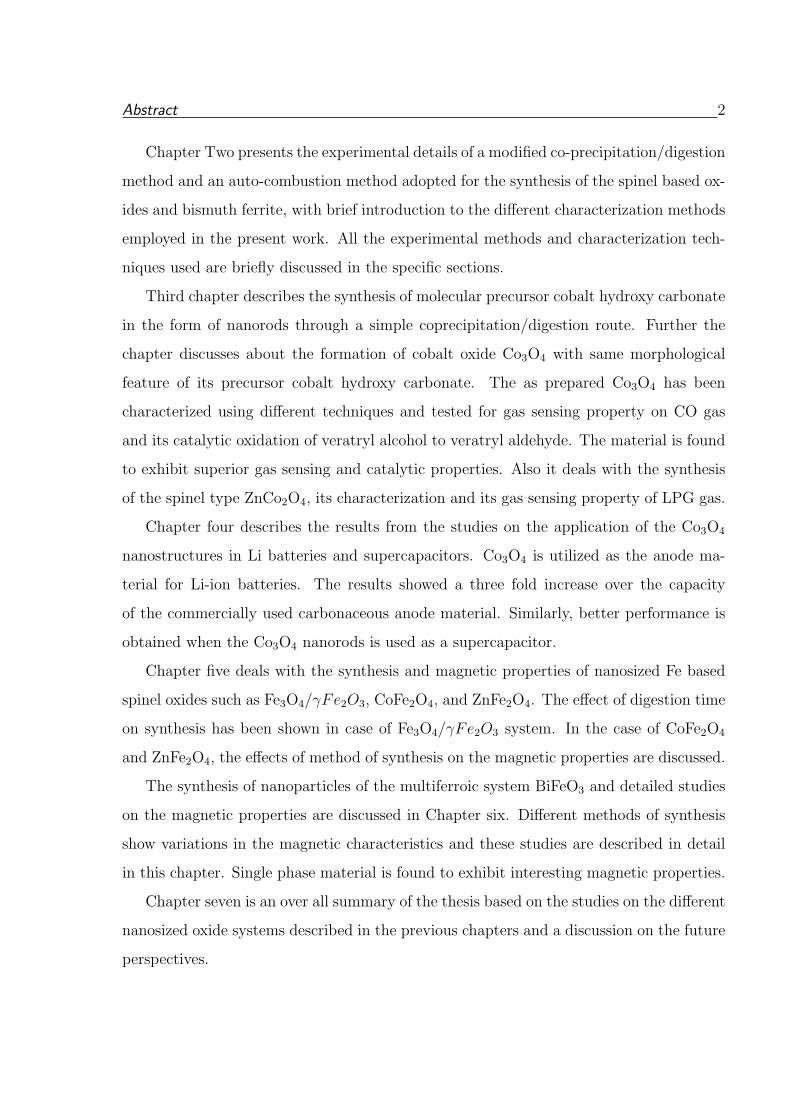
Chapter Two presents the experimental details of a modified co-precipitation/digestion
method and an auto-combustion method adopted for the synthesis of the spinel based ox-
ides and bismuth ferrite, with brief introduction to the different characterization methods
employed in the present work. All the experimental methods and characterization tech-
niques used are briefly discussed in the specific sections.
Third chapter describes the synthesis of molecular precursor cobalt hydroxy carbonate
in the form of nanorods through a simple coprecipitation/digestion route. Further the
chapter discusses about the formation of cobalt oxide Co3O4 with same morphological
feature of its precursor cobalt hydroxy carbonate. The as prepared Co3O4 has been
characterized using different techniques and tested for gas sensing property on CO gas
and its catalytic oxidation of veratryl alcohol to veratryl aldehyde. The material is found
to exhibit superior gas sensing and catalytic properties. Also it deals with the synthesis
of the spinel type ZnCo2O4, its characterization and its gas sensing property of LPG gas.
Chapter four describes the results from the studies on the application of the Co3O4
nanostructures in Li batteries and supercapacitors. Co3O4 is utilized as the anode ma-
terial for Li-ion batteries. The results showed a three fold increase over the capacity
of the commercially used carbonaceous anode material. Similarly, better performance is
obtained when the Co3O4 nanorods is used as a supercapacitor.
Chapter five deals with the synthesis and magnetic properties of nanosized Fe based
spinel oxides such as Fe3O4/γFe2O3, CoFe2O4, and ZnFe2O4. The effect of digestion time
on synthesis has been shown in case of Fe3O4/γFe2O3 system. In the case of CoFe2O4
and ZnFe2O4, the effects of method of synthesis on the magnetic properties are discussed.
The synthesis of nanoparticles of the multiferroic system BiFeO3 and detailed studies
on the magnetic properties are discussed in Chapter six. Different methods of synthesis
show variations in the magnetic characteristics and these studies are described in detail
in this chapter. Single phase material is found to exhibit interesting magnetic properties.
Chapter seven is an over all summary of the thesis based on the studies on the different
nanosized oxide systems described in the previous chapters and a discussion on the future
perspectives.
Chapter 1
Introduction
1.1 Materials Science
Materials science is an interdisciplinary subject with a combination of chemistry, physics
and engineering [1]. Materials science and technology plays a vital role in the development
of human civilization. Starting from the stone age we experienced bronze age, iron age
and at present synthetic materials age which gives plastics and fibrous composites to build
light weight technology. As a phase of development, material science has extended to a
new era which is nothing but smart materials age. The smart materials will be able to
select and execute specific functions in response to a change in an external stimuli.
In general, materials can be classified into polymers, ceramics, metals, semiconductors
and composites. Due to the tremendous growth in science and technology, materials with
different functions have been developed, such as superconductors, optical, electrical and
magnetic materials. The multidisciplinary area of material science led to the development
of intelligent materials such as sensors, actuators, optoelectronics, magnetoelectric and
biomimetic materials. Another important phase in the development of materials science
is hybrid materials. There are many interesting advanced developments in theory, design
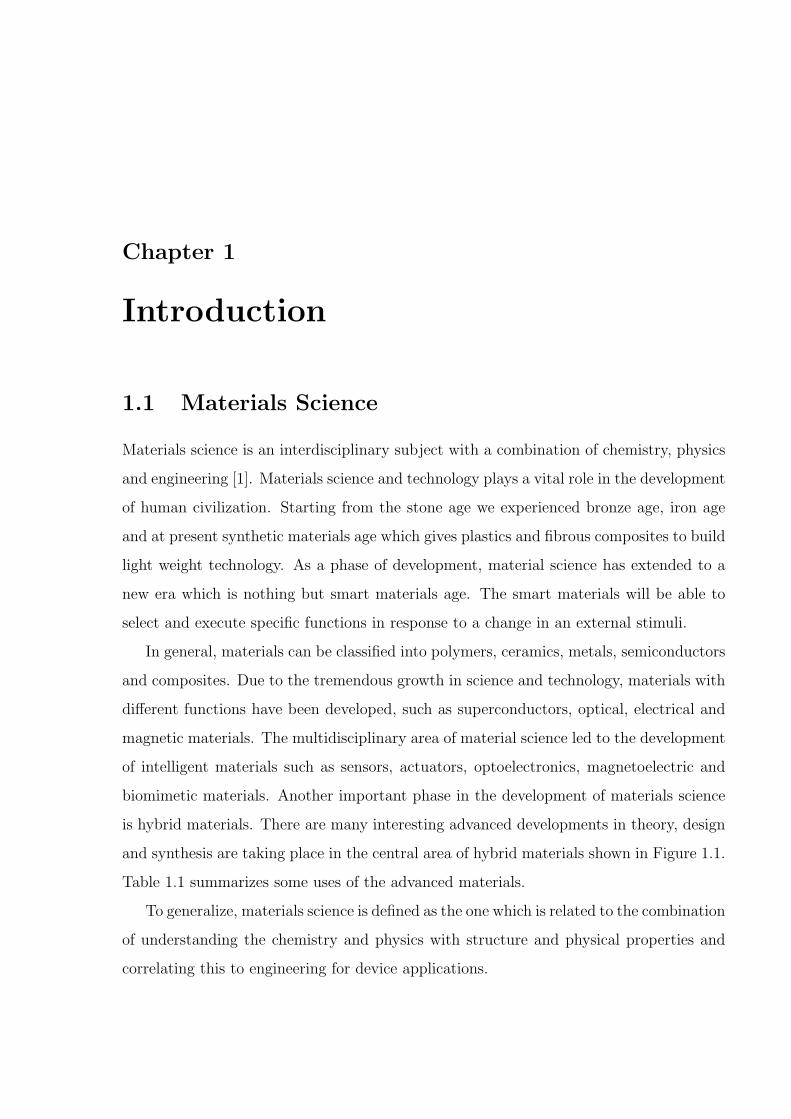
and synthesis are taking place in the central area of hybrid materials shown in Figure 1.1.
Table 1.1 summarizes some uses of the advanced materials.
To generalize, materials science is defined as the one which is related to the combination
of understanding the chemistry and physics with structure and physical properties and
correlating this to engineering for device applications.
Introduction 4
Figure 1.1: Schematic representation of new hybrid materials.
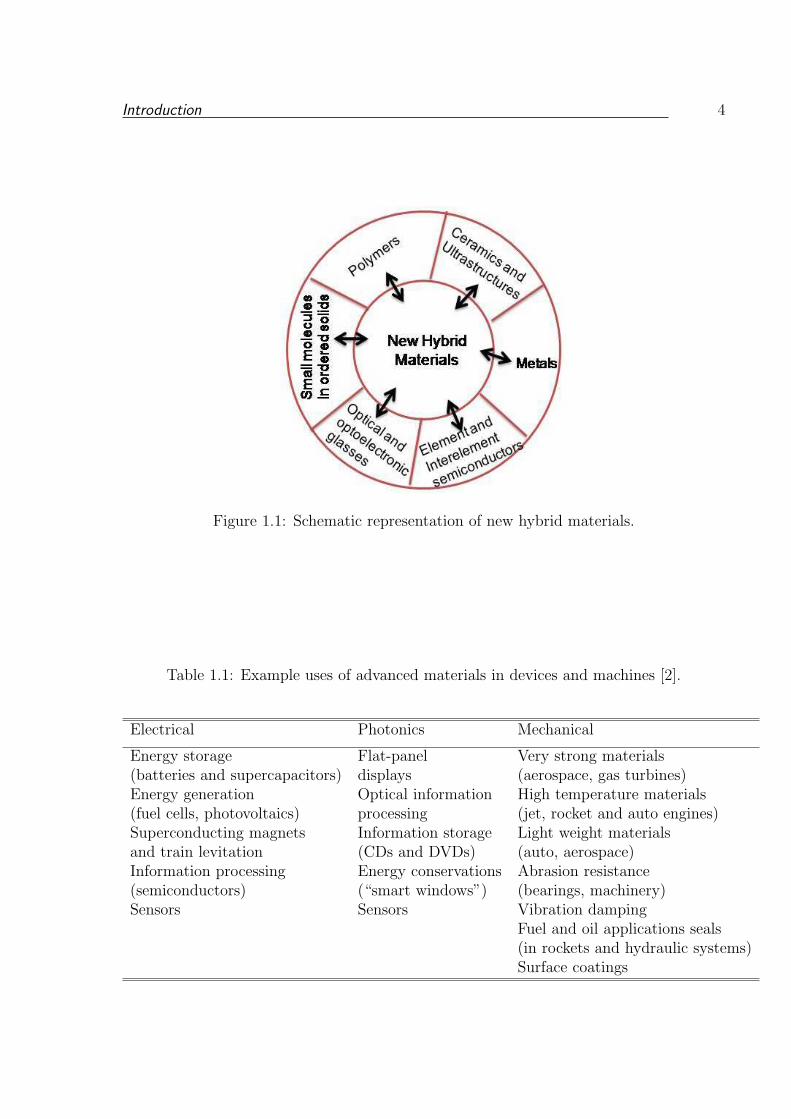
Table 1.1: Example uses of advanced materials in devices and machines [2].
Electrical Photonics Mechanical
Energy storage Flat-panel Very strong materials(batteries and supercapacitors) displays (aerospace, gas turbines)Energy generation Optical information High temperature materials(fuel cells, photovoltaics) processing (jet, rocket and auto engines)Superconducting magnets Information storage Light weight materialsand train levitation (CDs and DVDs) (auto, aerospace)Information processing Energy conservations Abrasion resistance(semiconductors) (“smart windows”) (bearings, machinery)Sensors Sensors Vibration damping
Fuel and oil applications seals(in rockets and hydraulic systems)Surface coatings
Introduction 5
1.2 Metal Oxides
In this technologically rich world of materials, metal oxides play a very important role
in many areas of science and technology [3]. Metal oxides are one of the most abundant
ones in the earth’s crust. Almost all the metals can form their oxides through oxidation
by oxygen from air at the appropriate temperature and pressure. Although there exists
different metal oxides such as alkali and alkaline earth metal oxides, rare-earth oxides,
etc., transition metal oxides are of special interest because of the interesting electrical
and magnetic properties that they exhibit. The transition metals of interest can be easily
accommodated in the interstices of the close packed layers of O2− ions. Depending on
the electronic configuration of the metal ions and the structural geometries, oxides can
be insulators, semiconductors or metallic. Oxides are chemically stable and therefore, at-
tracts attention towards various applications. Potentially important properties exhibited
by metal oxides are the high-Tc superconductivity such as in layered cuprates, colossal
magnetoresistance (CMR) observed in perovskite manganites, ferroelectricity, ferro- and
ferrimagnetism, multiferroicity where magnetism and ferroelectricity coexists together,
etc. Also, metal oxides are both technologically and industrially important because of
their interesting properties and overall characteristics such as hardness, thermal stability,
thermal conductivity, and chemical resistance. For example, SiO2 is well known for its
optical properties, ferrimagnetic iron oxides such as the spinel ferrite, γ-Fe2O3 and as
hexagonal ferrite BaFe12O19, are familiar for their application in data storage and hard
magnets. Metal oxides with variable electron mobility are used as semiconductors (ZnO,
V2O5) or superconductors (YBa2Cu3O7). Ferroelectric or dielectric perovskite type oxides
such as BaTiO3, PbZrTiO3, etc are extensively used in electronic devices. In addition to
this, oxides find applications in many fields such as in refractories to withstand very high
temperatures, in catalysis as an active material, promoter and support, in the field of
gas sensors, Li-ion batteries, fluorescent lights, cellular phones, fuel cells, etc. It is worth
noting here and highlight the application of oxides to reduce environmental pollution by
their use as a catalyst or sorbent to remove CO, NOx and SOx during combustion of fossil
derived fuels.
Spinels and perovskites are two important structural classes of oxides with interesting
properties and wide applications.
Introduction 6
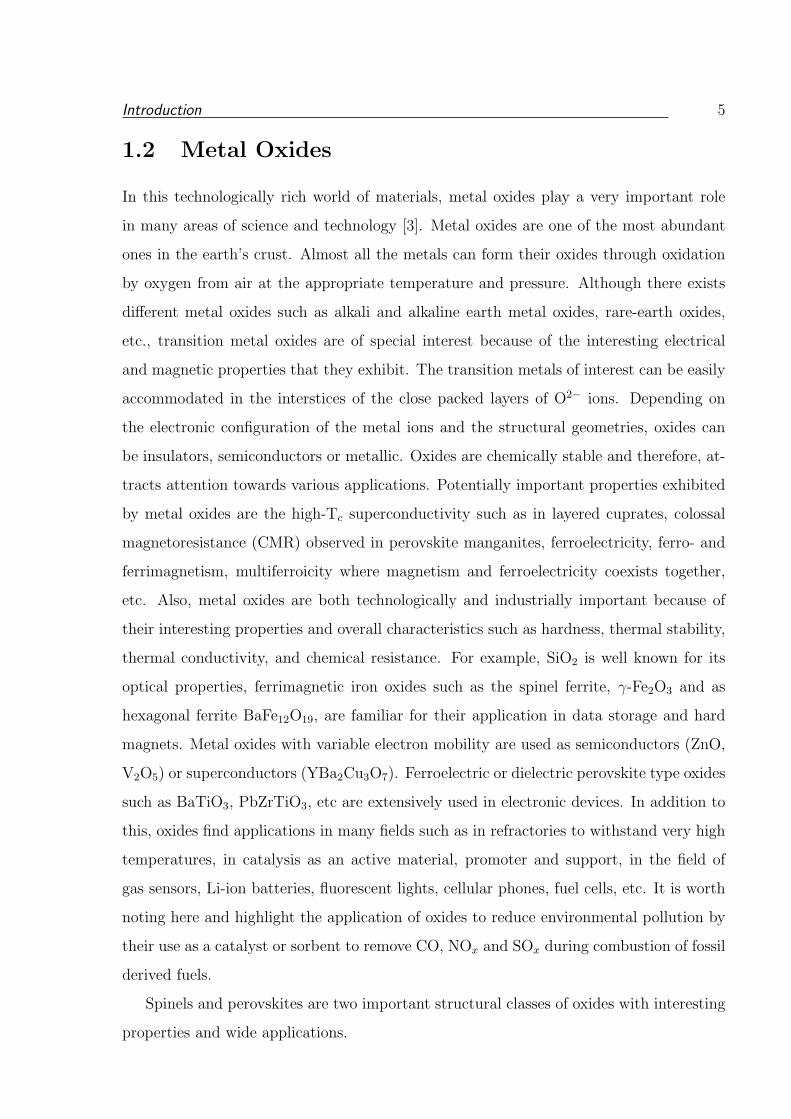
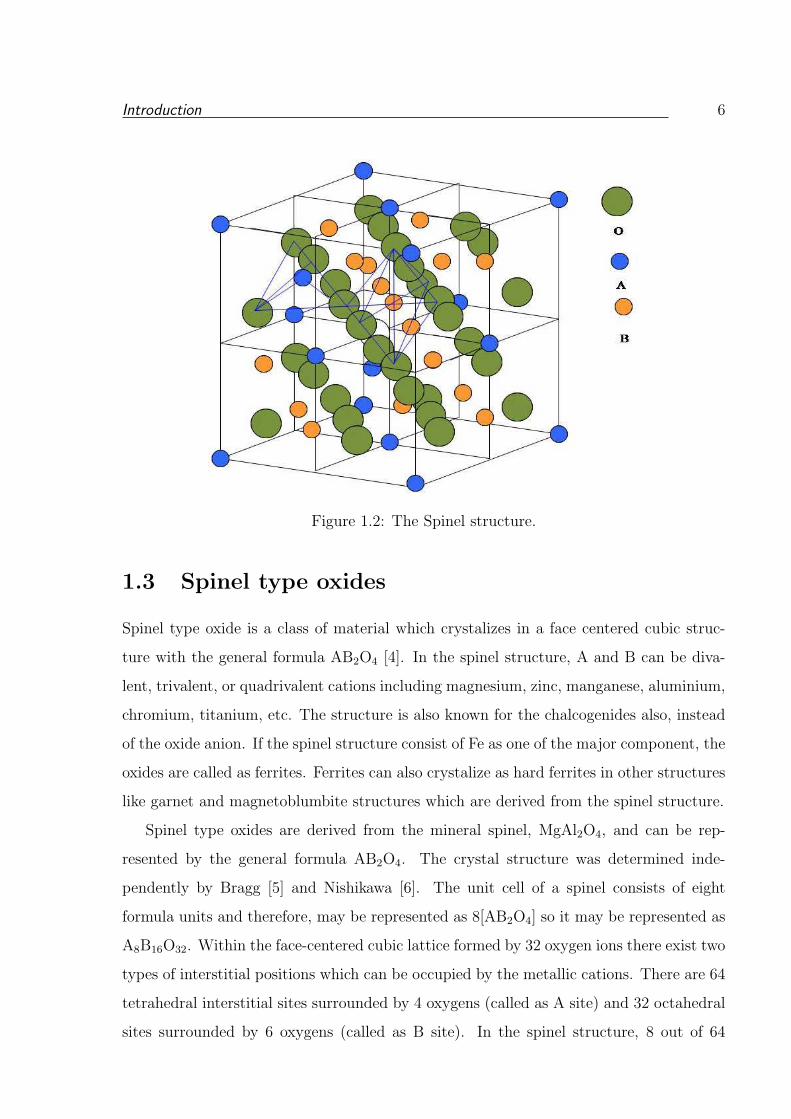
Figure 1.2: The Spinel structure.
1.3 Spinel type oxides
Spinel type oxide is a class of material which crystalizes in a face centered cubic struc-
ture with the general formula AB2O4 [4]. In the spinel structure, A and B can be diva-
lent, trivalent, or quadrivalent cations including magnesium, zinc, manganese, aluminium,
chromium, titanium, etc. The structure is also known for the chalcogenides also, instead
of the oxide anion. If the spinel structure consist of Fe as one of the major component, the
oxides are called as ferrites. Ferrites can also crystalize as hard ferrites in other structures
like garnet and magnetoblumbite structures which are derived from the spinel structure.
Spinel type oxides are derived from the mineral spinel, MgAl2O4, and can be rep-
resented by the general formula AB2O4. The crystal structure was determined inde-
pendently by Bragg [5] and Nishikawa [6]. The unit cell of a spinel consists of eight
formula units and therefore, may be represented as 8[AB2O4] so it may be represented as
A8B16O32. Within the face-centered cubic lattice formed by 32 oxygen ions there exist two
types of interstitial positions which can be occupied by the metallic cations. There are 64
tetrahedral interstitial sites surrounded by 4 oxygens (called as A site) and 32 octahedral
sites surrounded by 6 oxygens (called as B site). In the spinel structure, 8 out of 64
Introduction 7
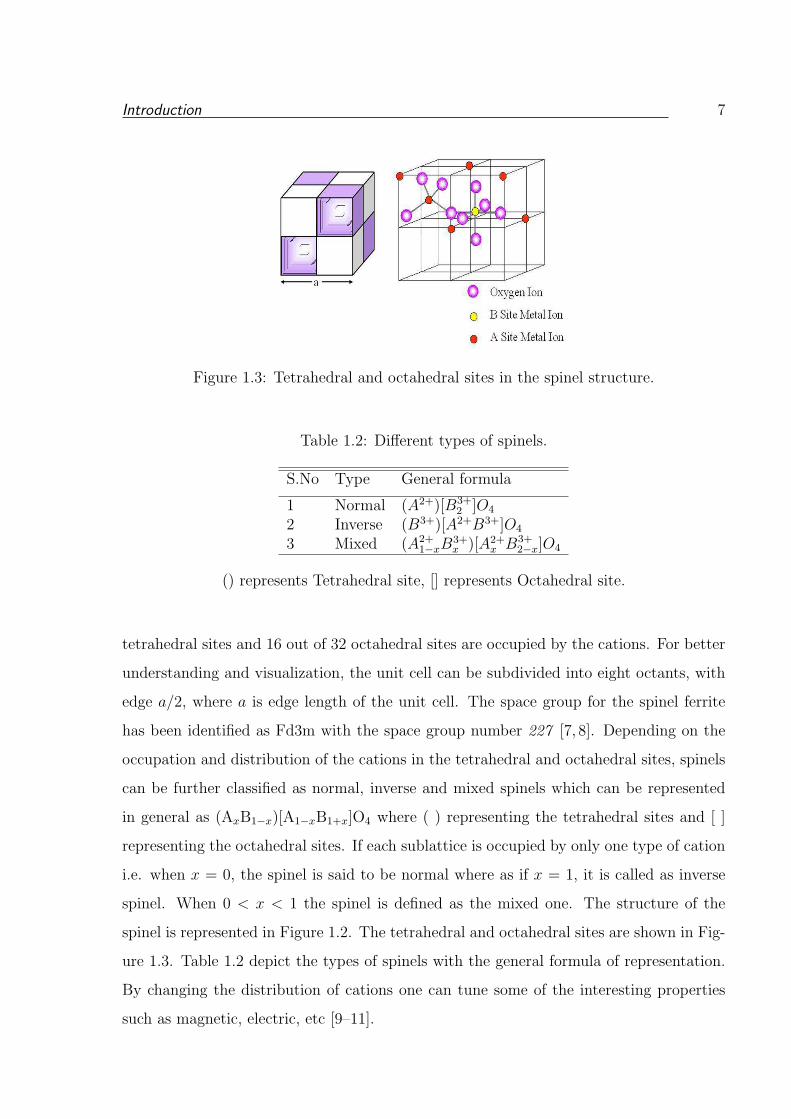
Figure 1.3: Tetrahedral and octahedral sites in the spinel structure.
Table 1.2: Different types of spinels.
S.No Type General formula
1 Normal (A2+)[B3+2 ]O4
2 Inverse (B3+)[A2+B3+]O4
3 Mixed (A2+1−xB
3+x )[A2+
x B3+2−x]O4
() represents Tetrahedral site, [] represents Octahedral site.
tetrahedral sites and 16 out of 32 octahedral sites are occupied by the cations. For better
understanding and visualization, the unit cell can be subdivided into eight octants, with
edge a/2, where a is edge length of the unit cell. The space group for the spinel ferrite
has been identified as Fd3m with the space group number 227 [7, 8]. Depending on the
occupation and distribution of the cations in the tetrahedral and octahedral sites, spinels
can be further classified as normal, inverse and mixed spinels which can be represented
in general as (AxB1−x)[A1−xB1+x]O4 where ( ) representing the tetrahedral sites and [ ]
representing the octahedral sites. If each sublattice is occupied by only one type of cation
i.e. when x = 0, the spinel is said to be normal where as if x = 1, it is called as inverse
spinel. When 0 < x < 1 the spinel is defined as the mixed one. The structure of the
spinel is represented in Figure 1.2. The tetrahedral and octahedral sites are shown in Fig-
ure 1.3. Table 1.2 depict the types of spinels with the general formula of representation.
By changing the distribution of cations one can tune some of the interesting properties
such as magnetic, electric, etc [9–11].
Introduction 8
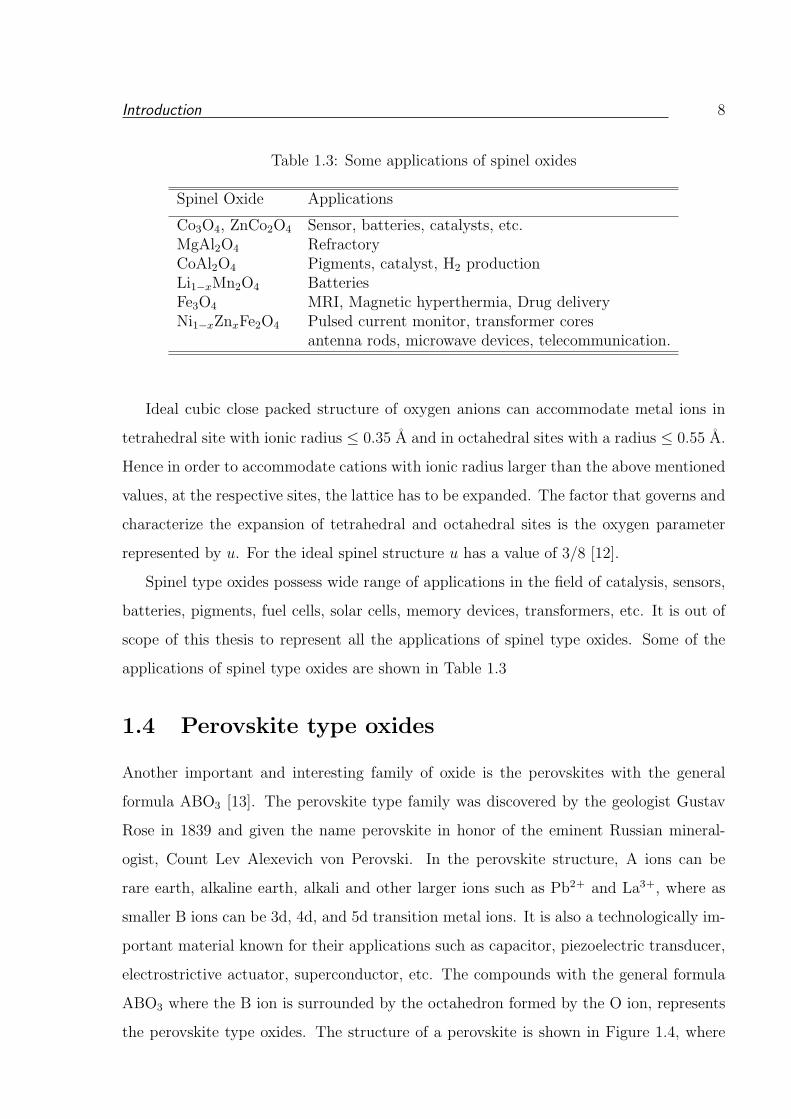
Table 1.3: Some applications of spinel oxides
Spinel Oxide Applications
Co3O4, ZnCo2O4 Sensor, batteries, catalysts, etc.MgAl2O4 RefractoryCoAl2O4 Pigments, catalyst, H2 productionLi1−xMn2O4 BatteriesFe3O4 MRI, Magnetic hyperthermia, Drug deliveryNi1−xZnxFe2O4 Pulsed current monitor, transformer cores
antenna rods, microwave devices, telecommunication.
Ideal cubic close packed structure of oxygen anions can accommodate metal ions in
tetrahedral site with ionic radius ≤ 0.35 A and in octahedral sites with a radius ≤ 0.55 A.
Hence in order to accommodate cations with ionic radius larger than the above mentioned
values, at the respective sites, the lattice has to be expanded. The factor that governs and
characterize the expansion of tetrahedral and octahedral sites is the oxygen parameter
represented by u. For the ideal spinel structure u has a value of 3/8 [12].
Spinel type oxides possess wide range of applications in the field of catalysis, sensors,
batteries, pigments, fuel cells, solar cells, memory devices, transformers, etc. It is out of
scope of this thesis to represent all the applications of spinel type oxides. Some of the
applications of spinel type oxides are shown in Table 1.3
1.4 Perovskite type oxides
Another important and interesting family of oxide is the perovskites with the general
formula ABO3 [13]. The perovskite type family was discovered by the geologist Gustav
Rose in 1839 and given the name perovskite in honor of the eminent Russian mineral-
ogist, Count Lev Alexevich von Perovski. In the perovskite structure, A ions can be
rare earth, alkaline earth, alkali and other larger ions such as Pb2+ and La3+, where as
smaller B ions can be 3d, 4d, and 5d transition metal ions. It is also a technologically im-
portant material known for their applications such as capacitor, piezoelectric transducer,
electrostrictive actuator, superconductor, etc. The compounds with the general formula
ABO3 where the B ion is surrounded by the octahedron formed by the O ion, represents
the perovskite type oxides. The structure of a perovskite is shown in Figure 1.4, where
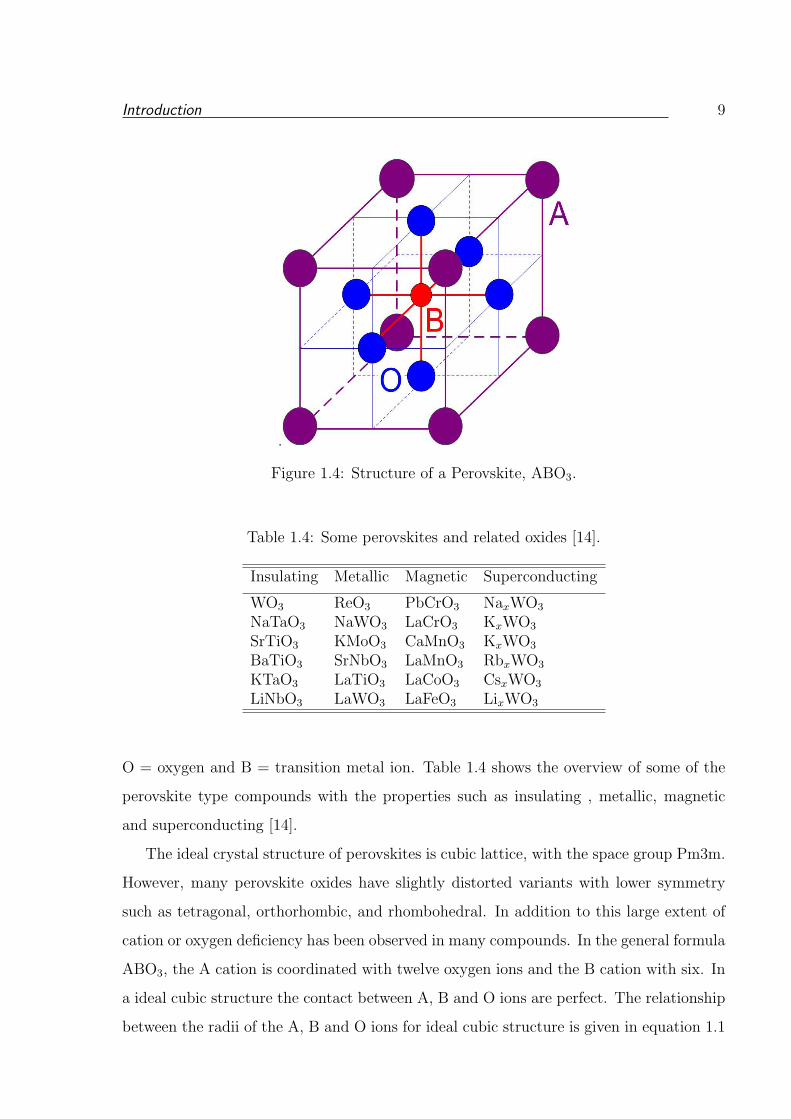
Introduction 9
.
Figure 1.4: Structure of a Perovskite, ABO3.
Table 1.4: Some perovskites and related oxides [14].
Insulating Metallic Magnetic Superconducting
WO3 ReO3 PbCrO3 NaxWO3
NaTaO3 NaWO3 LaCrO3 KxWO3
SrTiO3 KMoO3 CaMnO3 KxWO3
BaTiO3 SrNbO3 LaMnO3 RbxWO3
KTaO3 LaTiO3 LaCoO3 CsxWO3
LiNbO3 LaWO3 LaFeO3 LixWO3
O = oxygen and B = transition metal ion. Table 1.4 shows the overview of some of the
perovskite type compounds with the properties such as insulating , metallic, magnetic
and superconducting [14].
The ideal crystal structure of perovskites is cubic lattice, with the space group Pm3m.
However, many perovskite oxides have slightly distorted variants with lower symmetry
such as tetragonal, orthorhombic, and rhombohedral. In addition to this large extent of
cation or oxygen deficiency has been observed in many compounds. In the general formula
ABO3, the A cation is coordinated with twelve oxygen ions and the B cation with six. In
a ideal cubic structure the contact between A, B and O ions are perfect. The relationship
between the radii of the A, B and O ions for ideal cubic structure is given in equation 1.1
Introduction 10
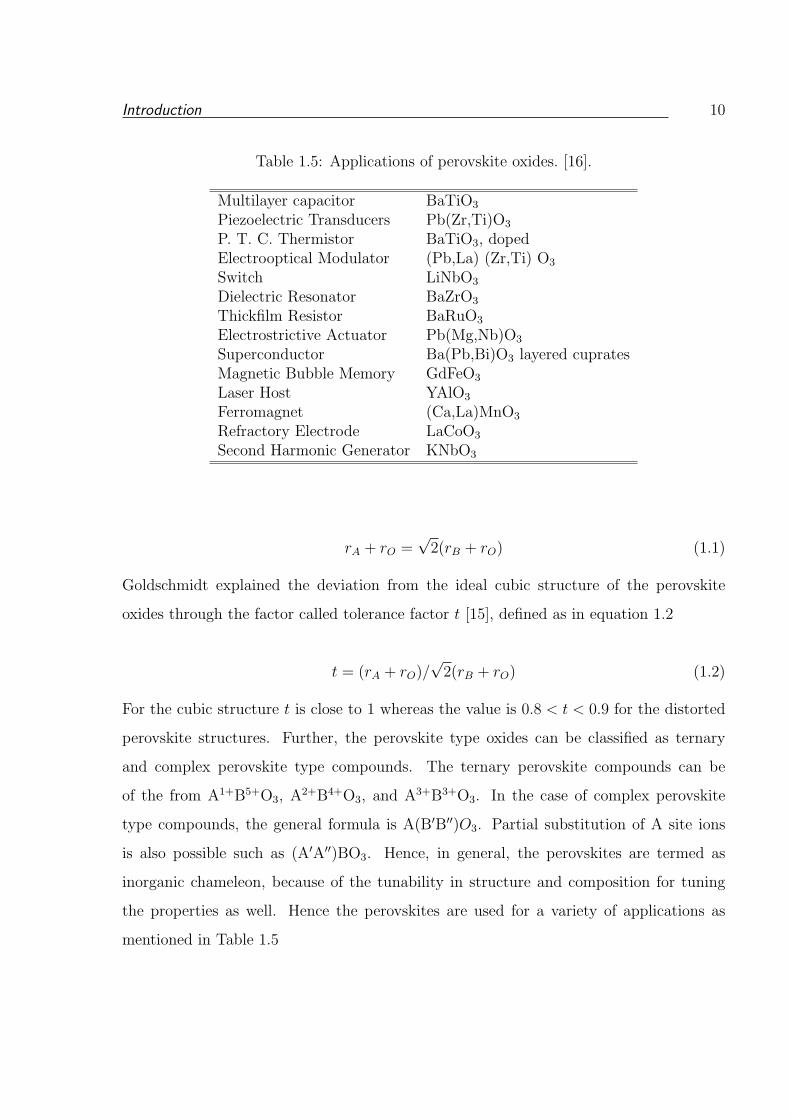
Table 1.5: Applications of perovskite oxides. [16].
Multilayer capacitor BaTiO3
Piezoelectric Transducers Pb(Zr,Ti)O3
P. T. C. Thermistor BaTiO3, dopedElectrooptical Modulator (Pb,La) (Zr,Ti) O3
Switch LiNbO3
Dielectric Resonator BaZrO3
Thickfilm Resistor BaRuO3
Electrostrictive Actuator Pb(Mg,Nb)O3
Superconductor Ba(Pb,Bi)O3 layered cupratesMagnetic Bubble Memory GdFeO3
Laser Host YAlO3
Ferromagnet (Ca,La)MnO3
Refractory Electrode LaCoO3
Second Harmonic Generator KNbO3
rA + rO =√
2(rB + rO) (1.1)
Goldschmidt explained the deviation from the ideal cubic structure of the perovskite
oxides through the factor called tolerance factor t [15], defined as in equation 1.2
t = (rA + rO)/√
2(rB + rO) (1.2)
For the cubic structure t is close to 1 whereas the value is 0.8 < t < 0.9 for the distorted
perovskite structures. Further, the perovskite type oxides can be classified as ternary
and complex perovskite type compounds. The ternary perovskite compounds can be
of the from A1+B5+O3, A2+B4+O3, and A3+B3+O3. In the case of complex perovskite
type compounds, the general formula is A(B′B′′)O3. Partial substitution of A site ions
is also possible such as (A′A′′)BO3. Hence, in general, the perovskites are termed as
inorganic chameleon, because of the tunability in structure and composition for tuning
the properties as well. Hence the perovskites are used for a variety of applications as
mentioned in Table 1.5
Introduction 11
1.5 Nanoscience and Nanotechnology
In the emerging field of science and technology, the term Nano as a ‘prefix’ has be-
come mandatory. Nanometer size i.e. 10−9 m, can be achieved by the assembly of the
constituents of atoms or molecules of few angstroms or 10−10 m in size. Studies on the sci-
ence of this nanometer scale objects is termed as nanoscience where as technology related
to the devices with the minimum feature size in this range is termed as nanotechnology,
which is nothing but manipulating and designing matter atom by atom [17–21].
The history of nano dates back to many centuries. For example, colloidal gold, a
suspension of fine particles of gold, was prepared by Faraday in 1856, which he called as
divided gold. The suspension was stable for almost a century. In addition to this, usage
of fine powders of gold was also well known for many centuries in the field of ayurveda to
increase the memory and to retain the youth. Another best example is the fourth century
AD Lycurgus cup made by Roman, which exhibit red color in the transmitted light and
green color in the reflected light.
What is then new in the present day nanotechnology is nothing but observation and
manipulation, which is key to development. This is made possible today with the inven-
tion of microscopes such as scanning tunneling microscope (STM) and scanning probe
microscope (SPM). The scanning microscopes help in the manipulation and arrangement
of atoms in a representative manner. This fact was predicted in 1959 itself by Richard
Feyman who stated that “There is plenty of room at the bottom”. The term nano was
introduced by Taniguchi in 1974, which in Greek means ‘dwarf’ to describe such fascinat-
ing materials. There are different types of materials that can exist in the nano-form, as
mentioned in Table 1.6. These nanosized materials are technologically important due to
their unique properties [22–24].
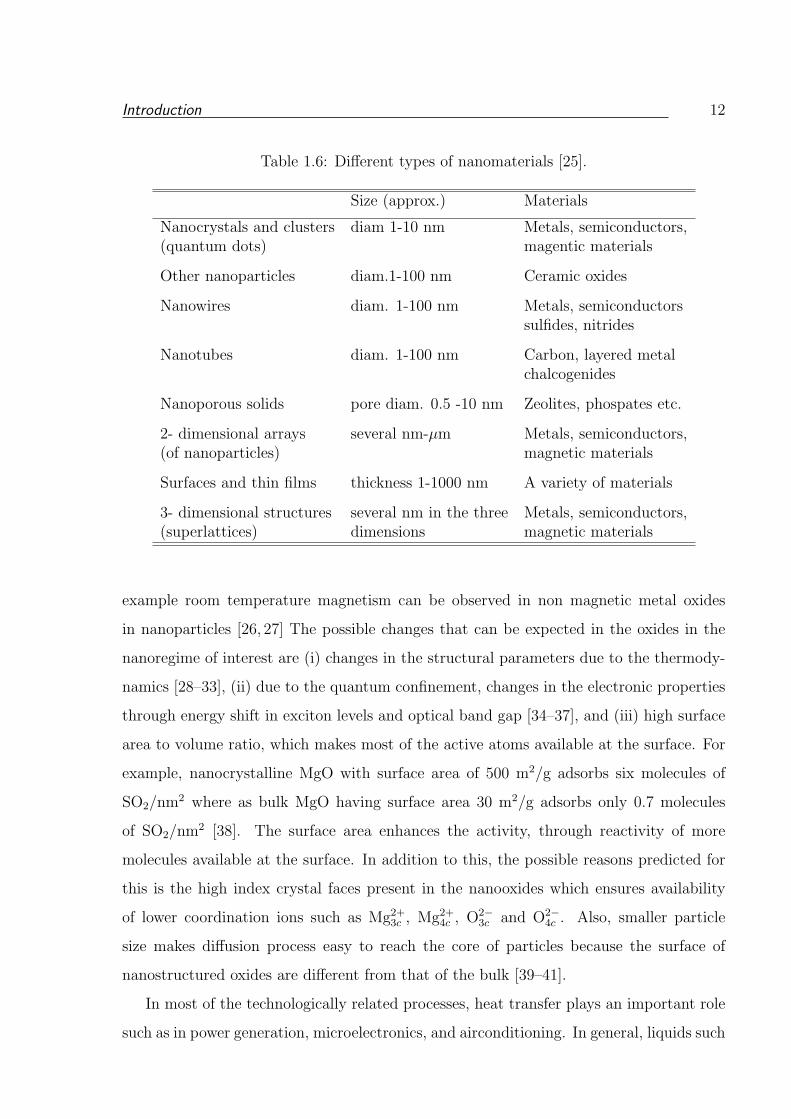
1.6 Oxide Nanomaterials
Among the different classes of nanomaterials, ceramic oxides are important ones. The
properties exhibited by the oxides in the nanoregime (1-100 nm) are different from that
of their bulk counter parts due to the high density of corners or edge surface sites, de-
fects and electronic structure, which are key factors in determining the properties. For
Introduction 12
Table 1.6: Different types of nanomaterials [25].
Size (approx.) Materials
Nanocrystals and clusters diam 1-10 nm Metals, semiconductors,(quantum dots) magentic materials
Other nanoparticles diam.1-100 nm Ceramic oxides
Nanowires diam. 1-100 nm Metals, semiconductorssulfides, nitrides
Nanotubes diam. 1-100 nm Carbon, layered metalchalcogenides
Nanoporous solids pore diam. 0.5 -10 nm Zeolites, phospates etc.
2- dimensional arrays several nm-µm Metals, semiconductors,(of nanoparticles) magnetic materials
Surfaces and thin films thickness 1-1000 nm A variety of materials
3- dimensional structures several nm in the three Metals, semiconductors,(superlattices) dimensions magnetic materials
example room temperature magnetism can be observed in non magnetic metal oxides
in nanoparticles [26, 27] The possible changes that can be expected in the oxides in the
nanoregime of interest are (i) changes in the structural parameters due to the thermody-
namics [28–33], (ii) due to the quantum confinement, changes in the electronic properties
through energy shift in exciton levels and optical band gap [34–37], and (iii) high surface
area to volume ratio, which makes most of the active atoms available at the surface. For
example, nanocrystalline MgO with surface area of 500 m2/g adsorbs six molecules of
SO2/nm2 where as bulk MgO having surface area 30 m2/g adsorbs only 0.7 molecules
of SO2/nm2 [38]. The surface area enhances the activity, through reactivity of more
molecules available at the surface. In addition to this, the possible reasons predicted for
this is the high index crystal faces present in the nanooxides which ensures availability
of lower coordination ions such as Mg2+3c , Mg2+
4c , O2−3c and O2−
4c . Also, smaller particle
size makes diffusion process easy to reach the core of particles because the surface of
nanostructured oxides are different from that of the bulk [39–41].
In most of the technologically related processes, heat transfer plays an important role
such as in power generation, microelectronics, and airconditioning. In general, liquids such
Introduction 13
as water, ethylene glycol and engine oil are commonly used as thermal conducting fluids.
When compared to this, the solid oxides possess better thermal conductivity. But the
usage of solid oxides in bulk form along with liquids for enhancing thermal conductivity
has problems such as sedimentation which can take place due to the unstability of the
mixture which may erode the channel walls [42, 43]. And most importantly this will
enhance the operating cost since it requires more pumping power to equalize the pressure
drop. One of the efficient way to improve the thermal conductivity of liquids is by using
nanosized solid oxides by making the liquid as a nonofluid a new class of the fluid having
a dispersion of very fine particles of size 1-100 nm [44, 45]. Some of the highly thermal
conducting metal oxides such as Al2O3, CuO, SiO2 and TiO2 have been made as nanofluids
and studied for their thermal conductivity [46–49].
In the case of ferrites related to transformer cores and microwave applications, pro-
cessing is a crucial step. The final sintered material should be free of voids. In the case of
bulk material, due to chemical inhomogeneity and difficulty in composition control, it is
very difficult to get a compact void free material. On the other hand, if the particle size of
the starting powders are in the nanometer range, due to high reactivity and homogeneity,
sintered ferrites of specific size and shape can be achieved for better performance. Simi-
larly, when bulk oxide is used as an anode or cathode material in a battery, there will be
a structural change due to the stress and strain developed during the transportation of
ions. Where as, the oxide nanomaterials not only shortens the path length for transport of
ions but also minimize the stress and strain. Likewise, in almost all fields of applications,
oxide nanomaterials can show better performance compared to the bulk counterparts.
Above all, it is important to form a well defined, hierarchically arranged, porous
nanomaterials for most of the applications such as in catalysis [50–52], sensors [53, 54],
Li-ion batteries [55, 56], fuel cells [57, 58], photovoltaics [59, 60], etc. In most of the cases
employed for the synthesis of nanomaterials with well defined morphological features such
as nanorods, nanotubes, nanowires, etc., templates are used which limit the growth of the
nanomaterials in some dimensions, and the templates need to be removed after formation
of the materials of interest. It is preferable to get control on the morphology and to form
porous nanomaterials with well defined morphology without any templates [61,62].
The present work comprised of synthesis of spinel based oxides like Co3O4, Fe3O4/γ-
Introduction 14
Fe2O3, CoFe2O4 and ZnFe2O4. Co3O4 nanorods prepared have been studied for appli-
cations such as sensors, catalysis, Li-ion batteries and supercapacitors. The magnetic
properties of Fe based spinels have been studied and discussed. In addition to this, de-
tailed studies has been made on the magnetic properties of multiferroic BiFeO3. Therefore,
the following sections give brief introduction to the properties and applications studied in
this work.
1.7 Some Properties and Applications of Metal Ox-
ides
1.7.1 Magnetic properties
Magnetism is a universal phenomenon associated with all materials that are composed of
charged particles. Commonly, the origin of magnetic moment in the atoms of a material
is the motion of electrons. A material may respond to an applied magnetic field in two
ways, it may get attracted or repelled. Accordingly, the magnetic materials are said to
be either paramagnetic or diamagnetic, respectively. The classification is made according
to a material’s response to an externally applied magnetic field [63]. Paramagnetism is
observed in materials that contain atoms with unpaired electrons whereas paired electronic
systems behave as diamagnetic. Diamagnetism can be regarded as originating from the
shielding currents induced by an applied magnetic field in the filled electron shells. These
currents are equivalent to an induced moment present on each of the atoms. This could
be better described by stating the Lenz’s law for orbital motion of electrons. Lenz’s law
states that if the magnetic flux enclosed by a current loop is changed by the application of
a magnetic field, a current is induced in such a direction that the corresponding magnetic
field opposes the applied field. The magnitude of the diamagnetic response is very small
in most of the materials except for superconductors which are perfect diamagnets.
A paramagnetic substance consists of atoms or molecules each of which has a net
magnetic moment. In the absence of an applied field, these atomic moments point at
random directions and cancel one another, so that the net magnetization of the specimen
is zero. When a magnetic field is applied, there is a tendency for each atomic moment
to turn towards the direction of the field. But the thermal agitation of the moments
Introduction 15
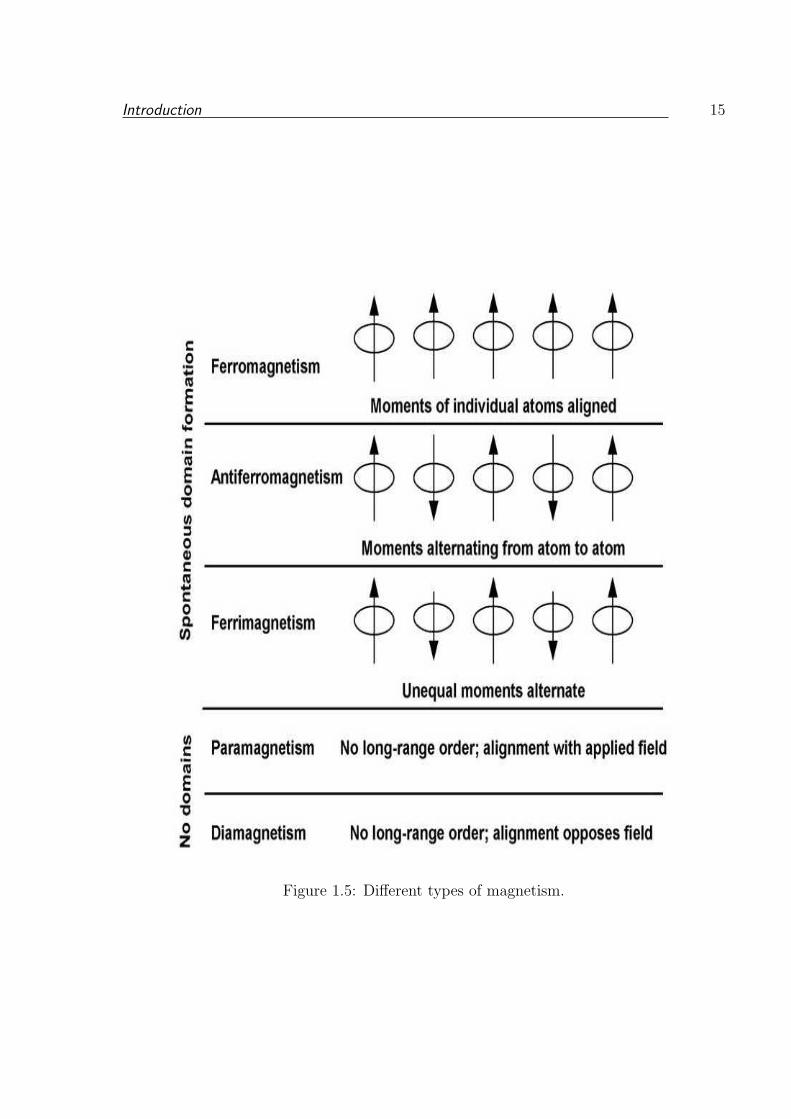
Figure 1.5: Different types of magnetism.
Introduction 16
opposes this tendency and tends to keep the atomic moments at random orientations.
The result is only a partial alignment of the moments in the field direction. The atoms
with incomplete inner electronic shells (transition metal ions and rare earth ions) can
have a large net moment and compounds of these elements are strongly paramagnetic.
Ordering of magnetic moments in most magnetic systems is controlled by the magnetic
exchange interactions. However, magnetic ordering due to dipole-dipole interactions have
also been found in some materials such as in organometallic magnets. Magnetic ordering
in materials is observed only below a critical temperature; above this, the materials show
paramagnetic behavior. Based on the type of ordering or exchange, magnetic materials are
mainly classified in to ferromagnetic, antiferromagnetic, and ferrimagnetic. Various types
of magnetism is best understood pictorially by considering the orientations of magnetic
moments in a material as shown in Figure 1.5.
Materials that possess ferromagnetism have aligned atomic magnetic moments of equal
magnitude. Also, this type of behavior is supported by the crystalline structure of the
material that allows for direct coupling interactions between the moments. Thus, there
will be strong enhancement in the flux density. Further, the aligned magnetic moments in
a ferromagnetic material can give a spontaneous magnetization in the absence of an ap-
plied magnetic field. Hence, there will be a permanent magnetic moment in this material.
Below a transition temperature called Curie temperature, TC , the magnetic moments are
ordered where as above TC , ferromagnetic materials are like paramagnets.
Atomic magnetic moments of equal magnitude that are arranged in an antiparallel
fashion displays antiferromagnetism. The exchange interaction that couples the magnetic
moments are antiparallel to each other and leaves the net magnetization as zero. There
will be a long range order below a critical temperature called the Neel temperature (TN).
Above this characteristic temperature thermal energy is sufficient to overcome the mag-
netic energy to randomize the magnetic moments. Above TN the material will behave
like a paramagnet.
In the case of ferrimagnetic materials, the sublattices possess unequal magnetic mo-
ments in an antiparallel manner like in the case of an antiferromagnetic material. But
here it shows a net magnetic moment due to the uncompensated spins. It is similar to fer-
romagnetic material since it contains a permanent magnetic moment even though the net
Introduction 17
moment is smaller than that of a ferromagnetic material. Ferrimagnetism is commonly
observed in ferrites and garnets.
The temperature dependence of various types of magnetic materials can be explained
on the basis of the molecular field theory proposed by Weiss in 1907 [64]. According to
him, in paramagnetic substances, the elementary moments will interact with each other.
This interaction can be expressed in terms of a fictitious internal field, called as the
molecular field, Hm, that acts in addition to the applied field, H. The strength of this
field depends on the extent of alignment already attained. Since the molecular field is
proportional to the magnetization M,
Hm = γM (1.3)
where γ is called the molecular field constant and it is proportional to Weiss constant Θ.
The paramagnetic susceptibility above the ordering temperature is given by
χ =C
T −Θ(1.4)
where C is the Curie constant. The inverse paramagnetic susceptibility varies linearly
with temperature and intercepts the temperature axis at the origin (Curie behavior) or
at T = Θ (Curie-Weiss behavior). The positive and negative values of Θ indicate that
the molecular field is either aiding or opposing the applied field, respectively. For a
ferromagnet, the value of Θ is approximately equal to Tc, which is large and positive. On
the other hand, for the antiferromagnetic and ferrimagnetic materials, Θ is negative.
The Heisenberg exchange interaction,
H = −2Jij
∑Si.Sj (1.5)
is used to describe the tendency of the adjacent, localized spin moments (Si and Sj) to
align parallel (Jij is positive, ferromagnetic) or antiparallel (Jij is negative, antiferromag-
netic) to each other in a material consisting of magnetic atoms/ions. The strength of the
exchange interaction depends on the overlap of the wave functions. The Heisenberg type
of exchange (direct exchange) applies only to some localized systems, and for oxides, one
needs to consider indirect forms of magnetic exchange. In oxides, the magnetic interaction
between two ions should be in such a way that their spin moments have either parallel or
Introduction 18
antiparallel alignment. In oxides, the distance between two magnetic ions are, sometimes,
two lattice constants apart and no direct exchange or orbital overlap becomes possible.
In such cases, there may be an indirect exchange mechanism operating between the two
magnetic ions. A possible mechanism in oxides is the superexchange which explains the
magnetic interaction between two neighboring transition metal ions separated by an oxide
ion, based on the symmetry of p and d states and their occupancy [65].
Superparamagnetism is a phenomenon observed in very fine magnetic particles, where
the energy required to change the direction of the magnetic moment of a particle is com-
parable to the ambient thermal energy. Nanosized magnetic materials exhibit a behavior
similar to paramagnetism at temperatures below the Curie or the Neel temperature. It
is half-way between ferro and paramagnetism. In this case, below the Curie or Neel
temperature, the thermal energy is not sufficient to overcome the coupling forces be-
tween neighboring atoms, where as the energy is sufficient to change the direction of the
magnetization of the entire crystallite. The resulting fluctuations in the direction of mag-
netization cause the magnetic moments average to zero [66]. Thus, the material behaves
in a manner similar to paramagnetism, except that instead of each individual atom be-
ing independently influenced by an external magnetic field, the magnetic moment of the
entire particle tends to align with the magnetic field. Thus, these particles are called
superparamagnetic particles. Superparamagnetism occurs when the material is composed
of very small crystallites (1-10 nm).
Magnetocrystalline anisotropy (K ) is an intrinsic property of a magnetic material,
which is caused by the spin-orbit interaction of the electrons. K is expressed as
K = 25kT/Vsp (1.6)
where k is the Boltzmann constant and Vsp is the volume of a superparamagnetic particle.
Above a particular temperature, kT dominates and this temperature is called blocking
temperature (TB). Below a particular size (called critical particle diameter, Dc), the
particles become single domains, and in this particle size range the coercivity reaches
a maximum. Below a critical diameter the coercivity become zero, because of thermal
effect, which are strong enough to spontaneously demagnetize the previously saturated
assembly of particles.
Another important property of magnetic materials is magnetostriction [67]. Magne-
Introduction 19
tostriction is the change in dimensions of a magnetic material when it is subjected to a
magnetic field. The phenomenon is reversible in the sense that an applied stress can led
to a change in the magnetic state of the magnetostrictive material. This reversible effect
gives magnetostrictive materials a special place among the existing smart materials. It
is important to develop different alternatives to the existing materials with reduced cost,
easy manufacturing and enhanced properties. Oxide based magnetic materials are being
developed as suitable alternatives to the existing alloy based materials.
1.7.2 Magnetism in Ferrites
Ferrites are nothing but the metal oxides having Fe as one of their major components
[68,69]. Ferrites can crystallize in spinel, garnet and magnetoplumbite structures. Ferrites
are not new since its history dates centuries back with the mineral Fe3O4 having the spinel
structure with general formula AB2O4. Prof. Takeshi Takei of early 1930’s, through his
remarkable work, is regarded as the father of modern ferrites.
Spinel ferrites possess interesting electrical and magnetic properties and these prop-
erties are mainly governed by the cation distribution i.e. the distribution of Fe3+ and
the divalent metal ion in the tetrahedral and octahedral sites in the spinel structure. In
general term it can be best understood with the representation M2+1−xFe3+
x [M2+x Fe3+
2−x]O4
where the ions inside and outside the square brackets represent the location of the ions in
the octahedral and the tetrahedral sites. Depending on the value of x i.e. when x = 0, the
spinel is said to be a normal spinel, e.g. ZnFe2O4 and CuFe2O4. When x = 1, the spinel
is called an inverse spinel, e.g. Fe3O4, CoFe2O4, etc. Another class of the spinel is called
mixed spinel when 0 ≤ x ≥ 1, e.g. Ni1−xZnxFe2O4, Mn1−xZnxFe2O4, etc. The distribu-
tion of cations over the sites strongly depends on the synthesis method and processing
temperature.
There are three kinds of magnetic exchange interactions possible between the metal
ions which occupy the tetrahedral (A) site and the octahedral (B) site. The superex-
change interactions taking place through the intermediate O2− ions are A-O-A, B-O-B
and A-O-B interactions. The negative interactions between metal ions at different sites
depend on the factors such as (i) distance between these ions and oxygen ions, (ii) an-
gle between the three ions, say for example when the angle is 180, interaction will be
Introduction 20
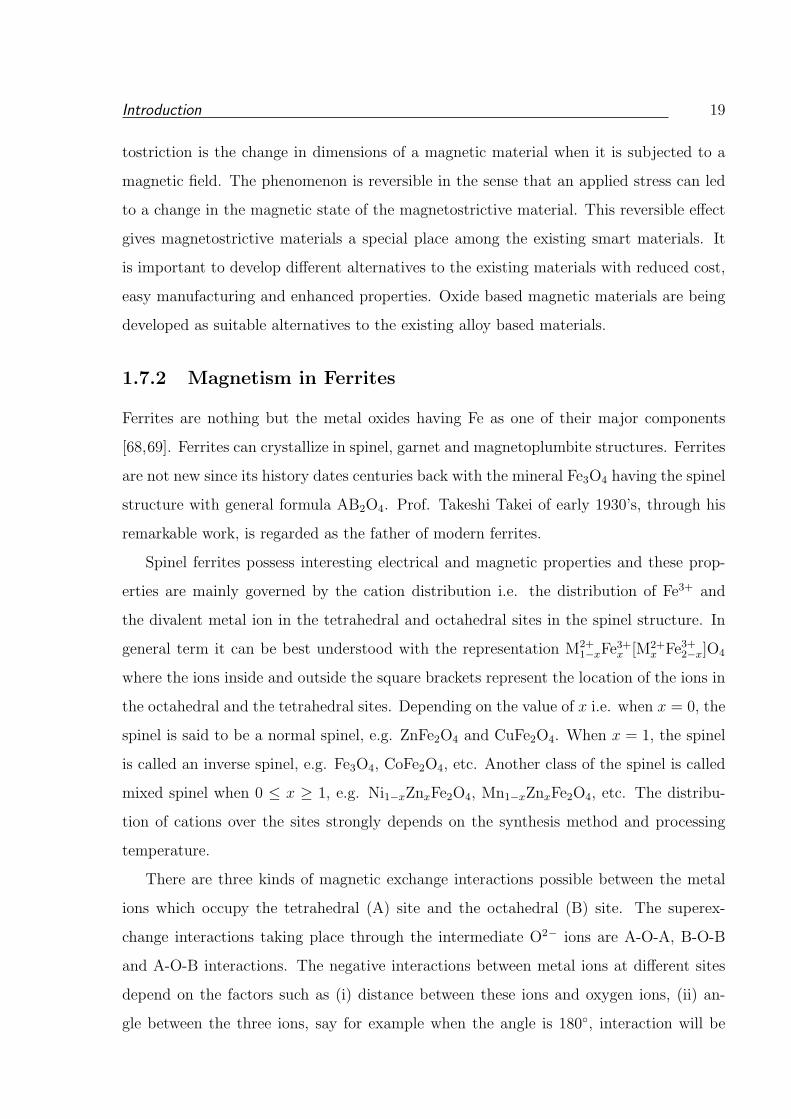
Figure 1.6: Different types of magnetic exchange interactions in a ferrite.
higher. The interatomic distances and the angles between ions for the different types of
interactions are shown in Figure 1.6 [69]. Among this A-O-B interaction is the major
one followed by next acceptable interaction B-O-B, where as A-O-A interaction is very
weak. The molecular field theory gives a better understanding since the magnetic moment
corresponding to magnetism is completely localized on a particular ion. Though the ex-
change mechanism is similar to that of antiferromagnetic case, in the case of ferrimagnetic
exchange complication arises because A and B sites are crystallographically different.
1.7.3 Magnetism in Perovskites
The existence of magnetism in perovskites is mainly due to the presence of localized
d electrons which possess localized spins [70]. The important things to be taken into
consideration are the local electronic configuration and multiplet structure. Due to the
inter-atomic exchange and correlation, there will be formation of a multiplet configuration,
with a net spin. Hund’s rule is qualitatively applicable to the perovskites with localized
d electrons. The d electron configuration is specified by tn2gemg where n and m are the
occupations of the t2g and eg levels. The different valance states and different electronic
configurations of the cations are closer in energy to each other than for the free ion. This
is a result of the polarization and electron screening of the Coulomb interactions. In a
Introduction 21
perovskite, ligand-field splitting should be taken into account while applying Hund’s rule.
However Hund’s rule is violated if the ligand-field splitting is greater than the intra-atomic
exchange energy.
The presence of localized spins favors long range magnetic ordering through superex-
change. Superexchange involves the antiferromagnetic coupling between nearest-neighbour
cations by exchange of electrons with the intervening oxygen ion. Few examples of mag-
netically ordered perovskites are LaMnO3, LaCrO3, PbCrO3, CaMnO3, LaFeO3, etc.
Jahn-Teller effect plays an important role in the case of perovskites with the localized
d electrons. Due to the Jahn-Teller distortion of MnO6 octahedra in LaMnO3, eg orbitals
loose their degeneracy. The Mn+3-O-Mn+3 exchange interactions become anisotropic and
results in A-type antiferromagnetic spin ordering, but with a positive Θ. In the A-type
AFM ordering, the ferromagnetically ordered adjacent Mn-planes are coupled antiferro-
magnetically resulting in no net magnetic moment. However, in the substituted perovskite
manganites such as (LaCa)MnO3, Mn4+ ions are present apart from Mn3+ and this gives
rise to ferromagnetic ordering and that leads to interesting properties [71]. The ferro-
magnetic ordering could not be explained by the simple superexchange scenario. Hence,
the concept of double exchange was suggested for explaining this behavior in certain
hole-doped manganites [72]. The double exchange between the Mn3+ and Mn4+ ions is
maximum when Mn-O-Mn bond angle is 180. Thus, any deviation of the bond angle
towards 180 results in stronger magnetic exchange and hence an increase of Tc.
1.7.4 Dielectric properties
A dielectric material is usually an insulating material and exhibits an electric dipole
structure. In a dipole structure, there is a separation of positive and negative electri-
cally charged entities on a molecular or atomic level. Dielectricity, piezoelectricity and
ferroelectricity are important electrical properties [73]. Materials having high dielectric
properties or dielectric constant are used as capacitors in electronic applications. The ba-
sic property is the dielectric polarization, which can be defined as the finite displacement
of bound charges of a dielectric in response to an applied electric field, and the orienta-
tion of their molecular dipoles if the latter exists. The dielectric properties vary widely
with the nature of the material and are a function of the applied field, humidity, crystal
Introduction 22
structure, etc. In a dielectric material electric dipole will get orient with the applied field.
The process of dipole alignment is called polarization.
There are three types of polarization i) electronic, ii) ionic, and iii) orientation. De-
pending on the material and also on the manner of the external applied electric field,
dielectric materials exhibit at least one of these polarizations. Electronic Polarization
results from a displacement of the center of the negatively charged electron cloud relative
to the positive nucleus of an atom by the electric field. This polarization will be in all
materials provided if there is the presence of an electric field. Ionic polarization occurs
only in materials that are ionic. Here the net dipole moment is due to the result of dis-
placement of cations and anions in opposite directions when a field is applied. Orientation
polarization is found only in materials having permanent dipole moments. Polarization
results from a rotation of the permanent moments into the direction of the applied field.
The total polarization ‘p’ of a substance is equal to the sum of the electronic, ionic
and orientation polarizations. It is also possible for either absence or negligibility of one
or more contributions of these polarizations. For example there will not be any ionic
polarization in the case of covalently bonded materials.
Ferroelectric materials exhibit spontaneous polarization, that is, polarization in the
absence of an electric field. We can consider this as a dielectric analogue of a ferromagnetic
material which shows a permanent magnetic behavior. The criteria for ferroelectricity is
that the material should not possess centrosymmetry. In a ferroelectric material, the
dipole moment results from the relative displacements of the ions. For example, dis-
placement of O2− and Ti4+ ions in BaTiO3, from their symmetrical positions. However,
ferroelectricity will be lost if we heat the material above a certain temperature called
ferroelectric Curie temperature. Spontaneous polarization in this material is a result of
interactions between adjacent permanent electric dipole moments aligned in the same
direction.
Piezoelectricity or pressure electricity is nothing but a phenomenon where polariza-
tion is induced which results in an electric field by the application of an external force.
The direction of the field can be reversed by reversing the sign of the external force.
These properties arise in materials with complicated structure and low degree of crystal
symmetry.
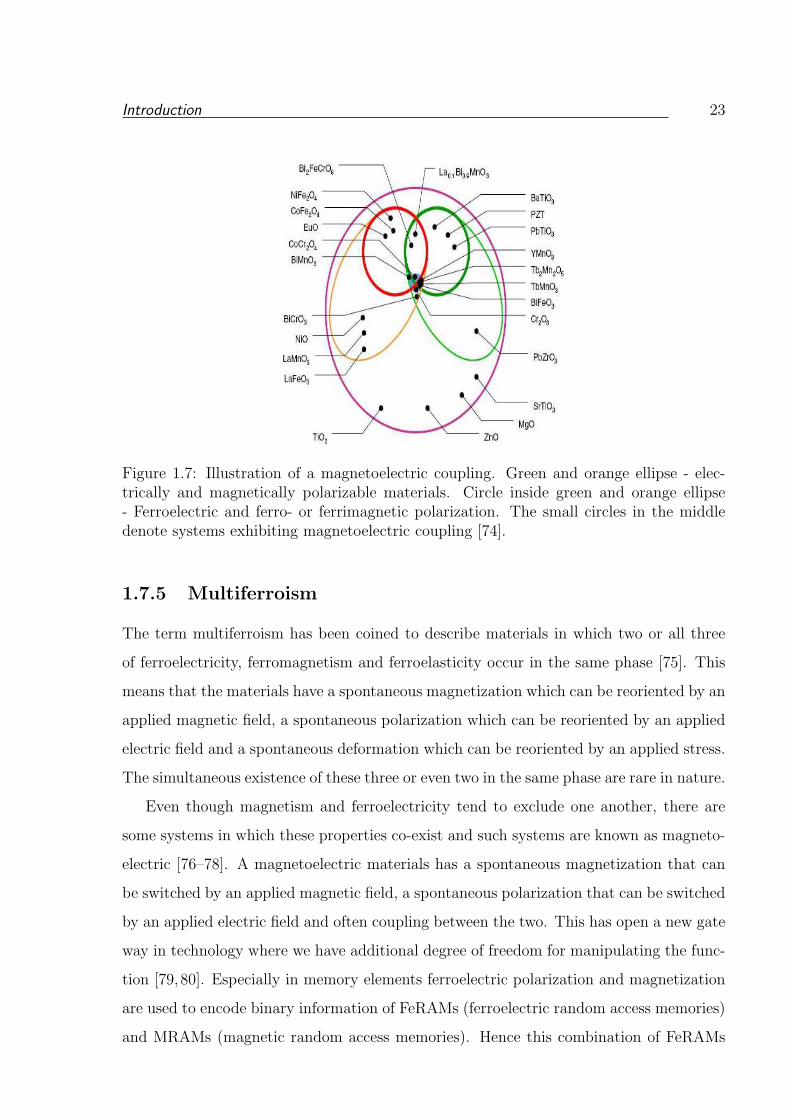
Introduction 23
Figure 1.7: Illustration of a magnetoelectric coupling. Green and orange ellipse - elec-trically and magnetically polarizable materials. Circle inside green and orange ellipse- Ferroelectric and ferro- or ferrimagnetic polarization. The small circles in the middledenote systems exhibiting magnetoelectric coupling [74].
1.7.5 Multiferroism
The term multiferroism has been coined to describe materials in which two or all three
of ferroelectricity, ferromagnetism and ferroelasticity occur in the same phase [75]. This
means that the materials have a spontaneous magnetization which can be reoriented by an
applied magnetic field, a spontaneous polarization which can be reoriented by an applied
electric field and a spontaneous deformation which can be reoriented by an applied stress.
The simultaneous existence of these three or even two in the same phase are rare in nature.
Even though magnetism and ferroelectricity tend to exclude one another, there are
some systems in which these properties co-exist and such systems are known as magneto-
electric [76–78]. A magnetoelectric materials has a spontaneous magnetization that can
be switched by an applied magnetic field, a spontaneous polarization that can be switched
by an applied electric field and often coupling between the two. This has open a new gate
way in technology where we have additional degree of freedom for manipulating the func-
tion [79,80]. Especially in memory elements ferroelectric polarization and magnetization
are used to encode binary information of FeRAMs (ferroelectric random access memories)
and MRAMs (magnetic random access memories). Hence this combination of FeRAMs
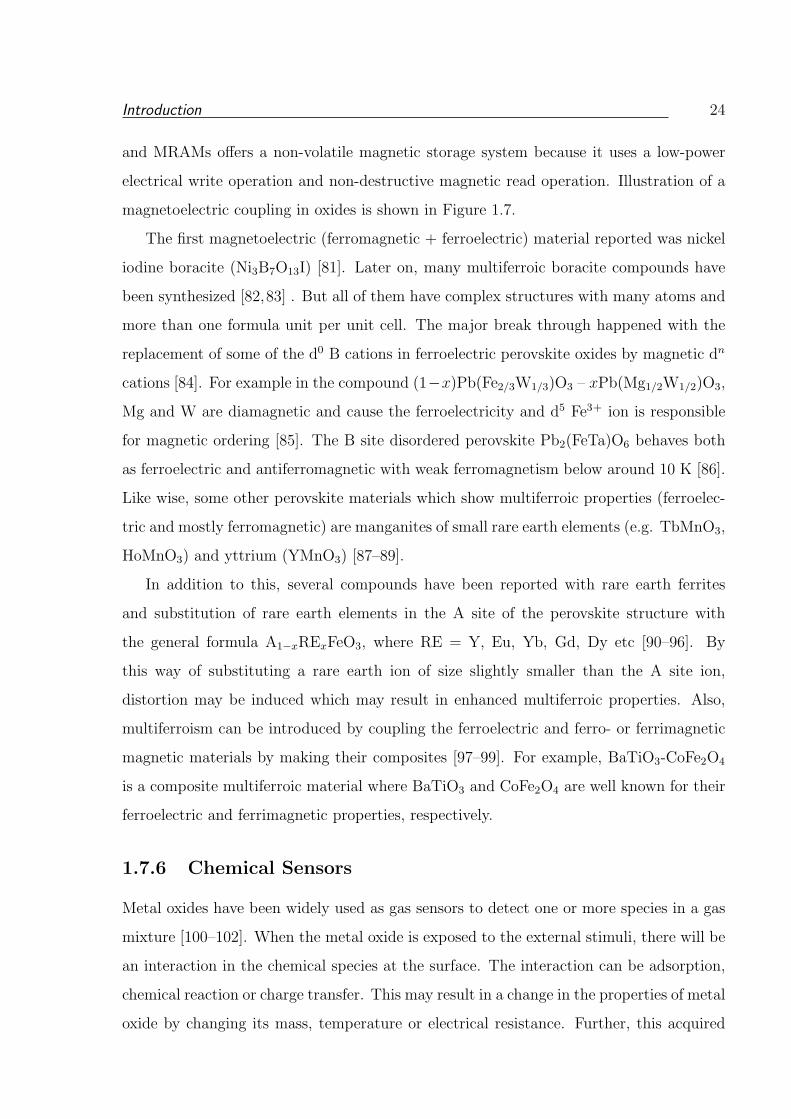
Introduction 24
and MRAMs offers a non-volatile magnetic storage system because it uses a low-power
electrical write operation and non-destructive magnetic read operation. Illustration of a
magnetoelectric coupling in oxides is shown in Figure 1.7.
The first magnetoelectric (ferromagnetic + ferroelectric) material reported was nickel
iodine boracite (Ni3B7O13I) [81]. Later on, many multiferroic boracite compounds have
been synthesized [82,83] . But all of them have complex structures with many atoms and
more than one formula unit per unit cell. The major break through happened with the
replacement of some of the d0 B cations in ferroelectric perovskite oxides by magnetic dn
cations [84]. For example in the compound (1−x)Pb(Fe2/3W1/3)O3 – xPb(Mg1/2W1/2)O3,
Mg and W are diamagnetic and cause the ferroelectricity and d5 Fe3+ ion is responsible
for magnetic ordering [85]. The B site disordered perovskite Pb2(FeTa)O6 behaves both
as ferroelectric and antiferromagnetic with weak ferromagnetism below around 10 K [86].
Like wise, some other perovskite materials which show multiferroic properties (ferroelec-
tric and mostly ferromagnetic) are manganites of small rare earth elements (e.g. TbMnO3,
HoMnO3) and yttrium (YMnO3) [87–89].
In addition to this, several compounds have been reported with rare earth ferrites
and substitution of rare earth elements in the A site of the perovskite structure with
the general formula A1−xRExFeO3, where RE = Y, Eu, Yb, Gd, Dy etc [90–96]. By
this way of substituting a rare earth ion of size slightly smaller than the A site ion,
distortion may be induced which may result in enhanced multiferroic properties. Also,
multiferroism can be introduced by coupling the ferroelectric and ferro- or ferrimagnetic
magnetic materials by making their composites [97–99]. For example, BaTiO3-CoFe2O4
is a composite multiferroic material where BaTiO3 and CoFe2O4 are well known for their
ferroelectric and ferrimagnetic properties, respectively.
1.7.6 Chemical Sensors
Metal oxides have been widely used as gas sensors to detect one or more species in a gas
mixture [100–102]. When the metal oxide is exposed to the external stimuli, there will be
an interaction in the chemical species at the surface. The interaction can be adsorption,
chemical reaction or charge transfer. This may result in a change in the properties of metal
oxide by changing its mass, temperature or electrical resistance. Further, this acquired
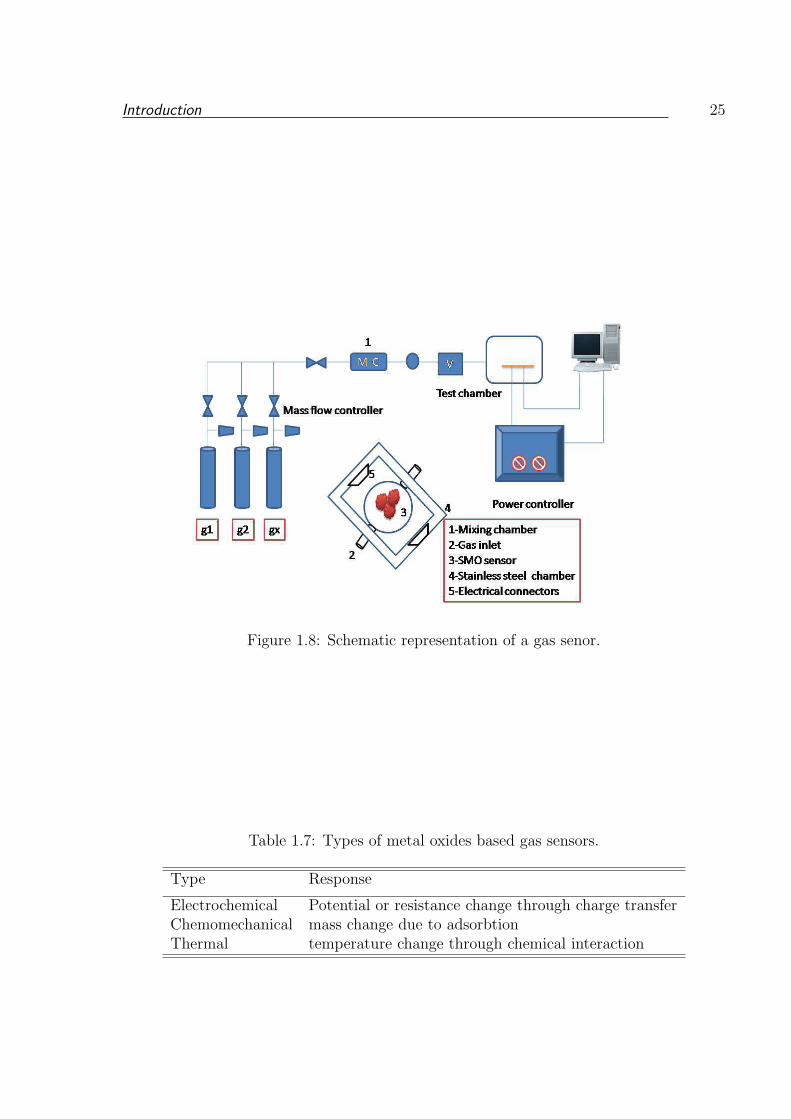
Introduction 25
Figure 1.8: Schematic representation of a gas senor.
Table 1.7: Types of metal oxides based gas sensors.
Type Response
Electrochemical Potential or resistance change through charge transferChemomechanical mass change due to adsorbtionThermal temperature change through chemical interaction
Introduction 26
change is detected as signals like frequency, current, voltage or conductance. Therefore,
basically a sensor contains a receptor which is nothing but a sensitive layer where the
physicochemical change will occur. A gas sensor works based on the recognition of a
target gas through a gas-solid interface which induces an electronic change on the oxide
surface. A transducer transforms the mechanical or electrical response that taking place
through the interaction and finally a detector is used to detect the signals as an output.
In general, there are three types of common metal oxide based sensors as mentioned in
the Table 1.7. Among this, electrochemical sensors are widely used and further it can
be classified depending upon their mode of operation as potentiometric (measurement of
voltage), amperometric (measurement of current), and conductometric (measurement of
conductivity) [103–105]. The semiconductor oxides fall into the category of conductivity,
and their gas sensitivity effect was reported in 1953 by Brattain and Bardeen in Ge [106].
The use of semiconducting metal oxides was later reported by Heiland, Bielanski et al [107]
and Seiyama et al [108]. As an industrial product, it was brought out by Taguchi [109].
Depending on their change in the conductance while getting exposed to the reducing
gases such as CO, EtOH and H2O vapors, they can be classified as ‘n’ type if there is
an increase in the conductivity and ‘p’ type if the conductivity decreases. The schematic
representation of a semiconductor based sensor is shown in Figure 1.8.
Gas sensors play a vital role in the applications related to environmental monitor-
ing [101]. For example, detection of nitrogen oxide (NOx) which has greater impact on
the green house effect, detection of sulfur dioxide and H2S due to their toxicity which
may cause death to human beings if the limit exceeds above 250 ppm, are some of the
applications. In the area of fuel cells, hydrogen sensors have been developed to detect
the leakage of H2 gas which may form explosive mixture upon leaking in the air [110].
Similarly, there are gas sensors to detect other gases such as NH3 and amines, ozone,
volatile organic compounds, methane, etc. Table 1.8 shows some of the metal oxides used
as sensors in the above mentioned field.
Recently, there are some developments using morphology, size and shape controlled
nanomaterials which opens up another degree of freedom to explore the gas sensing prop-
erties of some transition metal oxides like Co3O4 [132], ZnCo2O4 [133], ZnFe2O4 [134],
etc.
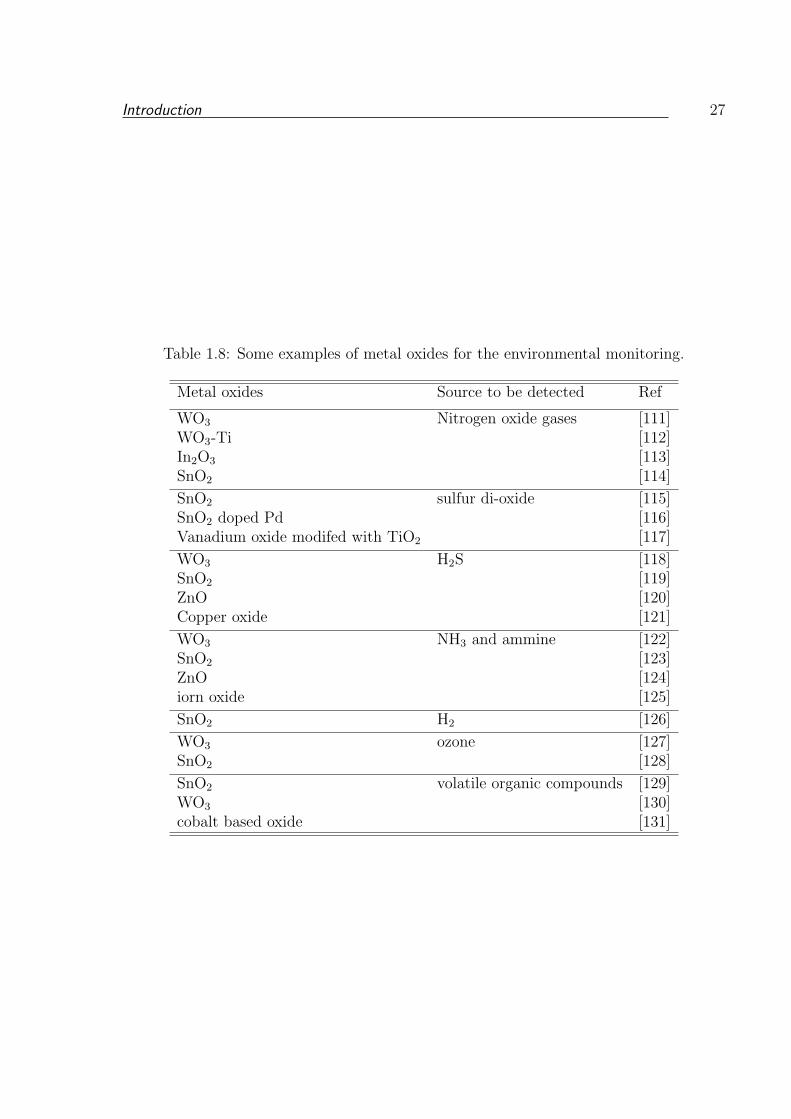
Introduction 27
Table 1.8: Some examples of metal oxides for the environmental monitoring.
Metal oxides Source to be detected Ref
WO3 Nitrogen oxide gases [111]WO3-Ti [112]In2O3 [113]SnO2 [114]
SnO2 sulfur di-oxide [115]SnO2 doped Pd [116]Vanadium oxide modifed with TiO2 [117]
WO3 H2S [118]SnO2 [119]ZnO [120]Copper oxide [121]
WO3 NH3 and ammine [122]SnO2 [123]ZnO [124]iorn oxide [125]
SnO2 H2 [126]
WO3 ozone [127]SnO2 [128]
SnO2 volatile organic compounds [129]WO3 [130]cobalt based oxide [131]
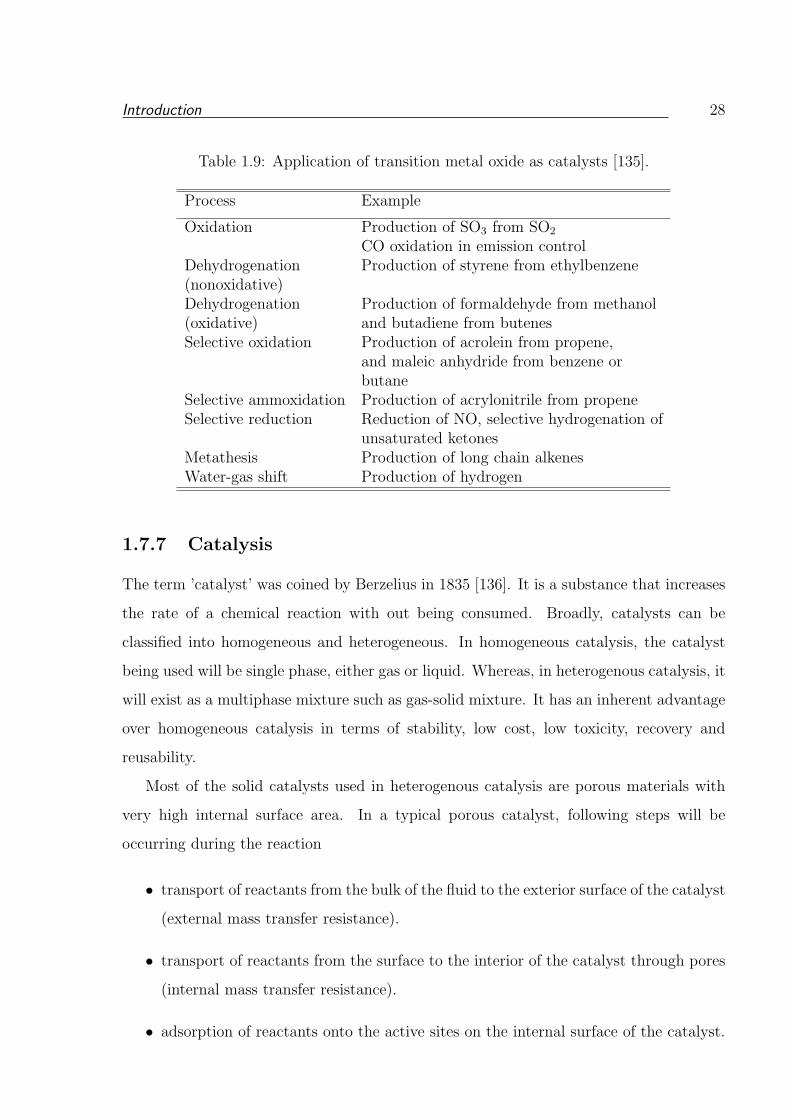
Introduction 28
Table 1.9: Application of transition metal oxide as catalysts [135].
Process Example
Oxidation Production of SO3 from SO2
CO oxidation in emission controlDehydrogenation Production of styrene from ethylbenzene(nonoxidative)Dehydrogenation Production of formaldehyde from methanol(oxidative) and butadiene from butenesSelective oxidation Production of acrolein from propene,
and maleic anhydride from benzene orbutane
Selective ammoxidation Production of acrylonitrile from propeneSelective reduction Reduction of NO, selective hydrogenation of
unsaturated ketonesMetathesis Production of long chain alkenesWater-gas shift Production of hydrogen
1.7.7 Catalysis
The term ’catalyst’ was coined by Berzelius in 1835 [136]. It is a substance that increases
the rate of a chemical reaction with out being consumed. Broadly, catalysts can be
classified into homogeneous and heterogeneous. In homogeneous catalysis, the catalyst
being used will be single phase, either gas or liquid. Whereas, in heterogenous catalysis, it
will exist as a multiphase mixture such as gas-solid mixture. It has an inherent advantage
over homogeneous catalysis in terms of stability, low cost, low toxicity, recovery and
reusability.
Most of the solid catalysts used in heterogenous catalysis are porous materials with
very high internal surface area. In a typical porous catalyst, following steps will be
occurring during the reaction
• transport of reactants from the bulk of the fluid to the exterior surface of the catalyst
(external mass transfer resistance).
• transport of reactants from the surface to the interior of the catalyst through pores
(internal mass transfer resistance).
• adsorption of reactants onto the active sites on the internal surface of the catalyst.
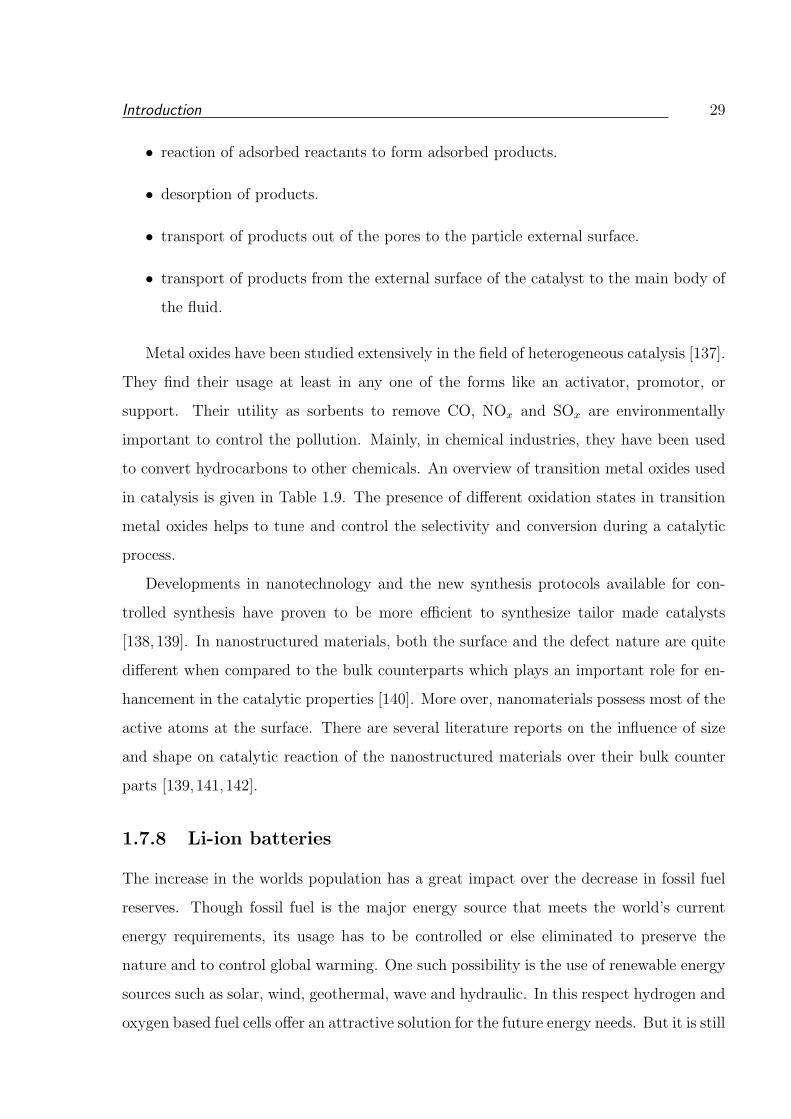
Introduction 29
• reaction of adsorbed reactants to form adsorbed products.
• desorption of products.
• transport of products out of the pores to the particle external surface.
• transport of products from the external surface of the catalyst to the main body of
the fluid.
Metal oxides have been studied extensively in the field of heterogeneous catalysis [137].
They find their usage at least in any one of the forms like an activator, promotor, or
support. Their utility as sorbents to remove CO, NOx and SOx are environmentally
important to control the pollution. Mainly, in chemical industries, they have been used
to convert hydrocarbons to other chemicals. An overview of transition metal oxides used
in catalysis is given in Table 1.9. The presence of different oxidation states in transition
metal oxides helps to tune and control the selectivity and conversion during a catalytic
process.
Developments in nanotechnology and the new synthesis protocols available for con-
trolled synthesis have proven to be more efficient to synthesize tailor made catalysts
[138, 139]. In nanostructured materials, both the surface and the defect nature are quite
different when compared to the bulk counterparts which plays an important role for en-
hancement in the catalytic properties [140]. More over, nanomaterials possess most of the
active atoms at the surface. There are several literature reports on the influence of size
and shape on catalytic reaction of the nanostructured materials over their bulk counter
parts [139,141,142].
1.7.8 Li-ion batteries
The increase in the worlds population has a great impact over the decrease in fossil fuel
reserves. Though fossil fuel is the major energy source that meets the world’s current
energy requirements, its usage has to be controlled or else eliminated to preserve the
nature and to control global warming. One such possibility is the use of renewable energy
sources such as solar, wind, geothermal, wave and hydraulic. In this respect hydrogen and
oxygen based fuel cells offer an attractive solution for the future energy needs. But it is still
Introduction 30
Table 1.10: History of developments in batteries [146].
1600 Gilbert (England) Establishment electrochemistry study1791 Galvani (Italy) Discovery of animal electricity1800 Volta (Italy) Invention of the voltaic cell1802 Cruickshank (England) First electric battery capable
of mass production1820 Ampre (France) Electricity through magnetism1833 Faraday (England) Announcement of Faradays Law1836 Daniell (England) Invention of the Daniell cell1859 Plant (France) Invention of the lead acid battery1868 Leclanch (France) Invention of the Leclanch cell1888 Gassner (USA) Completion of the dry cell1899 Jungner (Sweden) Invention of the nickel-cadmium battery1901 Edison (USA) Invention of the nickel-iron battery1932 Shlecht & Ackermann (Germany) Invention of the sintered
pole plate1947 Neumann (France) Successfully sealing the nickel-cadmium
batteryMid 1960 Union Carbide (USA) Development of primary
alkaline batteryMid 1970 Development of valve regulated lead
acid battery1990 Commercialization nickel-metal
hydride battery1992 Kordesch (Canada) Commercialization reusable
alkaline battery1999 Commercialization lithium-ion polymer2001 Anticipated volume production of
proton exchange membrane fuel cell
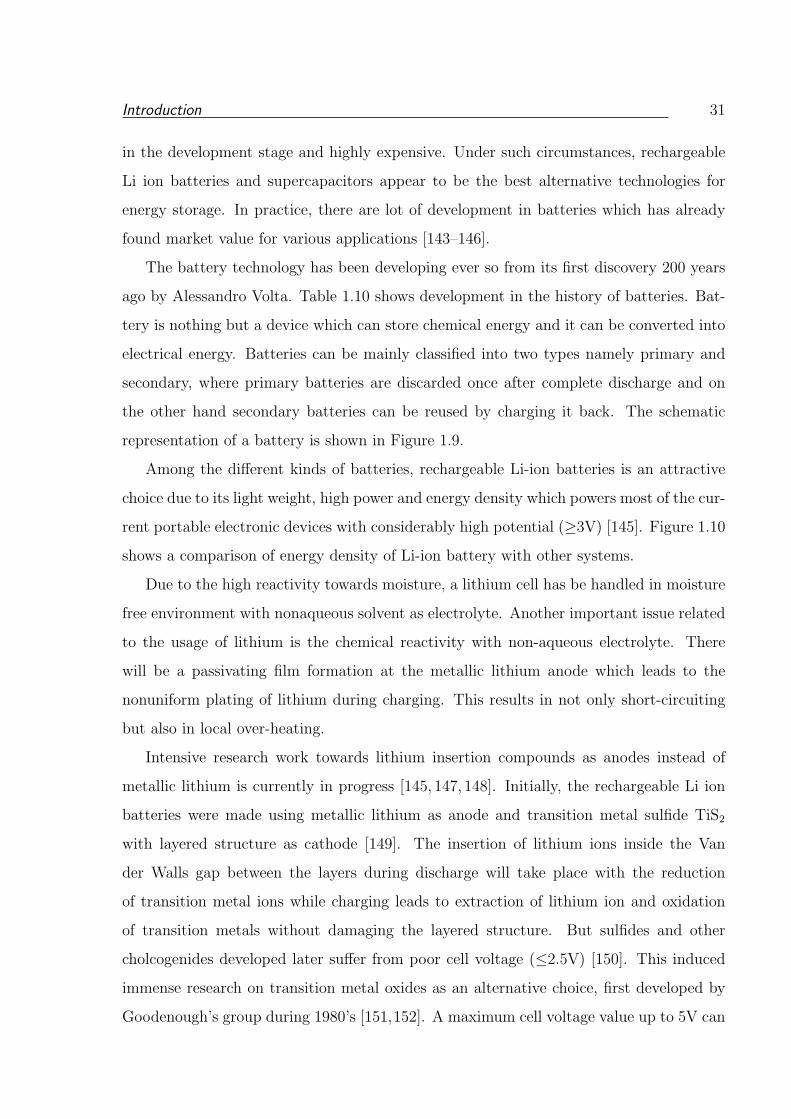
Introduction 31
in the development stage and highly expensive. Under such circumstances, rechargeable
Li ion batteries and supercapacitors appear to be the best alternative technologies for
energy storage. In practice, there are lot of development in batteries which has already
found market value for various applications [143–146].
The battery technology has been developing ever so from its first discovery 200 years
ago by Alessandro Volta. Table 1.10 shows development in the history of batteries. Bat-
tery is nothing but a device which can store chemical energy and it can be converted into
electrical energy. Batteries can be mainly classified into two types namely primary and
secondary, where primary batteries are discarded once after complete discharge and on
the other hand secondary batteries can be reused by charging it back. The schematic
representation of a battery is shown in Figure 1.9.
Among the different kinds of batteries, rechargeable Li-ion batteries is an attractive
choice due to its light weight, high power and energy density which powers most of the cur-
rent portable electronic devices with considerably high potential (≥3V) [145]. Figure 1.10
shows a comparison of energy density of Li-ion battery with other systems.
Due to the high reactivity towards moisture, a lithium cell has be handled in moisture
free environment with nonaqueous solvent as electrolyte. Another important issue related
to the usage of lithium is the chemical reactivity with non-aqueous electrolyte. There
will be a passivating film formation at the metallic lithium anode which leads to the
nonuniform plating of lithium during charging. This results in not only short-circuiting
but also in local over-heating.
Intensive research work towards lithium insertion compounds as anodes instead of
metallic lithium is currently in progress [145, 147, 148]. Initially, the rechargeable Li ion
batteries were made using metallic lithium as anode and transition metal sulfide TiS2
with layered structure as cathode [149]. The insertion of lithium ions inside the Van
der Walls gap between the layers during discharge will take place with the reduction
of transition metal ions while charging leads to extraction of lithium ion and oxidation
of transition metals without damaging the layered structure. But sulfides and other
cholcogenides developed later suffer from poor cell voltage (≤2.5V) [150]. This induced
immense research on transition metal oxides as an alternative choice, first developed by
Goodenough’s group during 1980’s [151,152]. A maximum cell voltage value up to 5V can
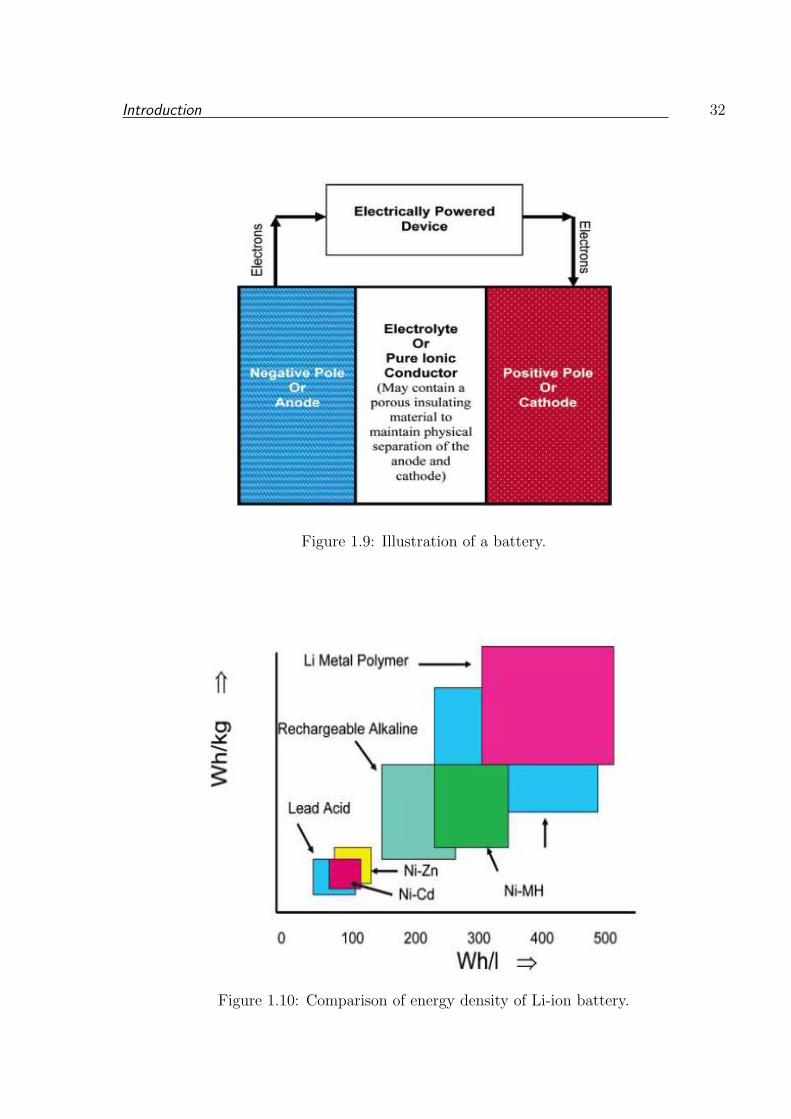
Introduction 32
Figure 1.9: Illustration of a battery.
Figure 1.10: Comparison of energy density of Li-ion battery.
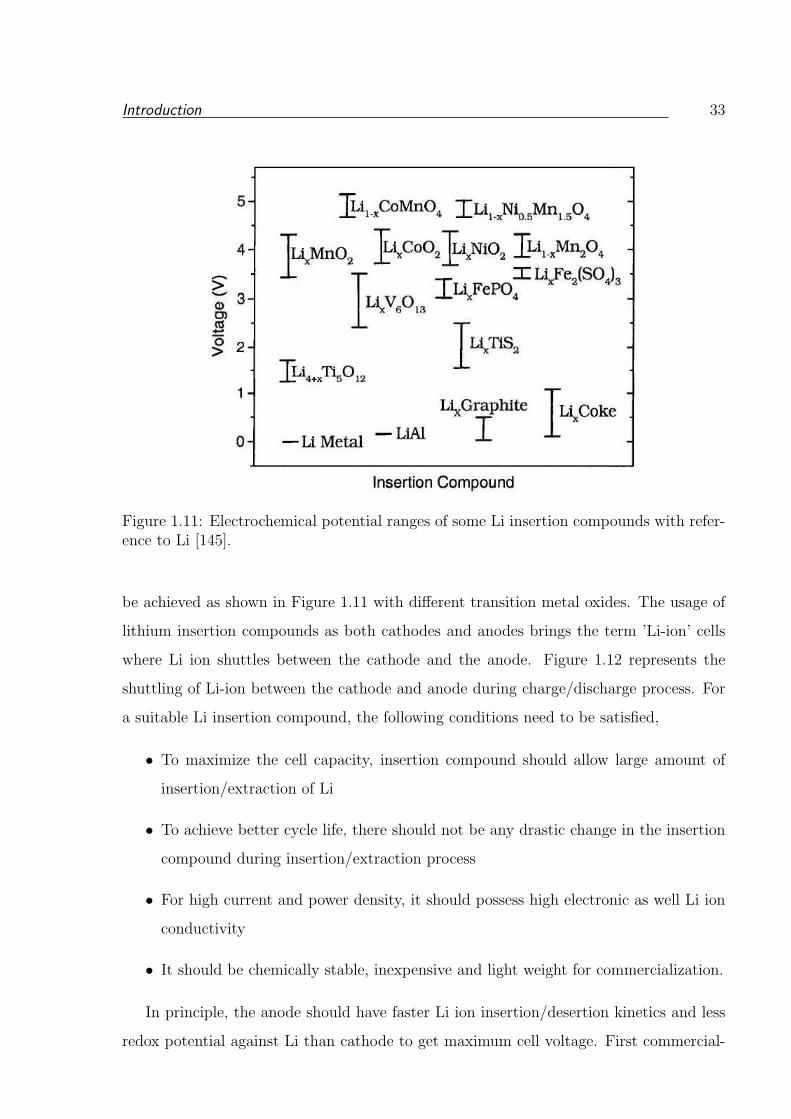
Introduction 33
Figure 1.11: Electrochemical potential ranges of some Li insertion compounds with refer-ence to Li [145].
be achieved as shown in Figure 1.11 with different transition metal oxides. The usage of
lithium insertion compounds as both cathodes and anodes brings the term ’Li-ion’ cells
where Li ion shuttles between the cathode and the anode. Figure 1.12 represents the
shuttling of Li-ion between the cathode and anode during charge/discharge process. For
a suitable Li insertion compound, the following conditions need to be satisfied,
• To maximize the cell capacity, insertion compound should allow large amount of
insertion/extraction of Li
• To achieve better cycle life, there should not be any drastic change in the insertion
compound during insertion/extraction process
• For high current and power density, it should possess high electronic as well Li ion
conductivity
• It should be chemically stable, inexpensive and light weight for commercialization.
In principle, the anode should have faster Li ion insertion/desertion kinetics and less
redox potential against Li than cathode to get maximum cell voltage. First commercial-
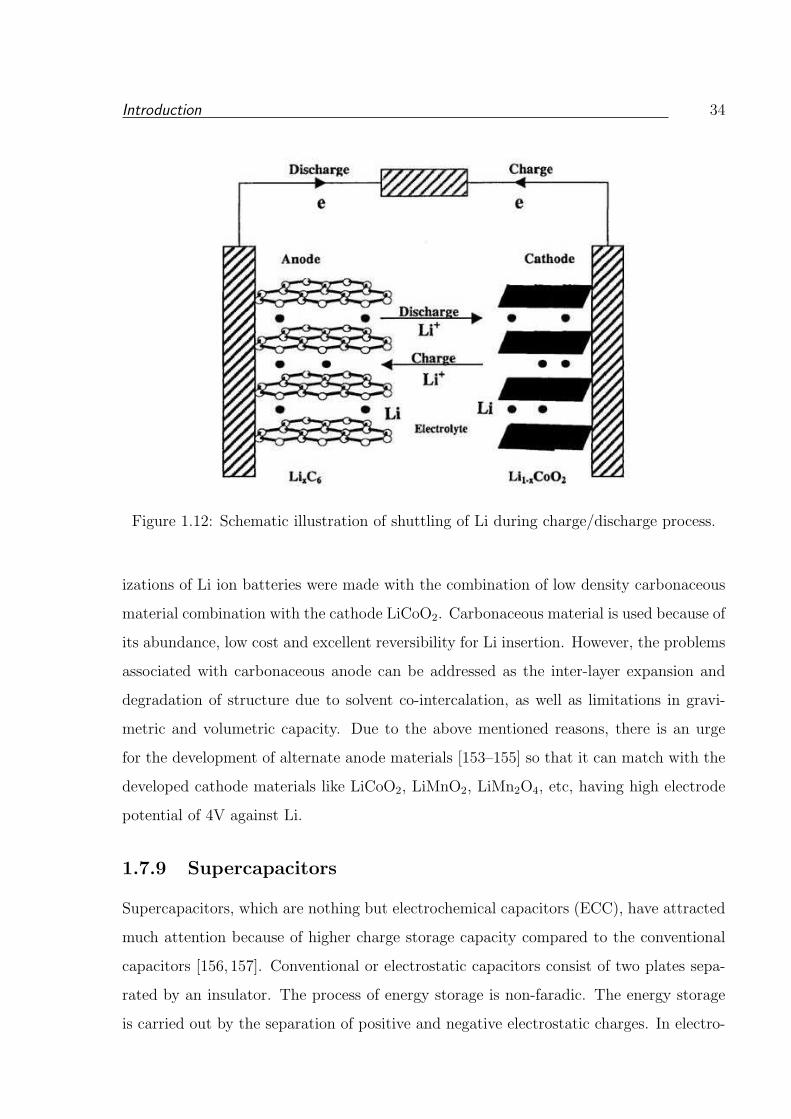
Introduction 34
Figure 1.12: Schematic illustration of shuttling of Li during charge/discharge process.
izations of Li ion batteries were made with the combination of low density carbonaceous
material combination with the cathode LiCoO2. Carbonaceous material is used because of
its abundance, low cost and excellent reversibility for Li insertion. However, the problems
associated with carbonaceous anode can be addressed as the inter-layer expansion and
degradation of structure due to solvent co-intercalation, as well as limitations in gravi-
metric and volumetric capacity. Due to the above mentioned reasons, there is an urge
for the development of alternate anode materials [153–155] so that it can match with the
developed cathode materials like LiCoO2, LiMnO2, LiMn2O4, etc, having high electrode
potential of 4V against Li.
1.7.9 Supercapacitors
Supercapacitors, which are nothing but electrochemical capacitors (ECC), have attracted
much attention because of higher charge storage capacity compared to the conventional
capacitors [156, 157]. Conventional or electrostatic capacitors consist of two plates sepa-
rated by an insulator. The process of energy storage is non-faradic. The energy storage
is carried out by the separation of positive and negative electrostatic charges. In electro-
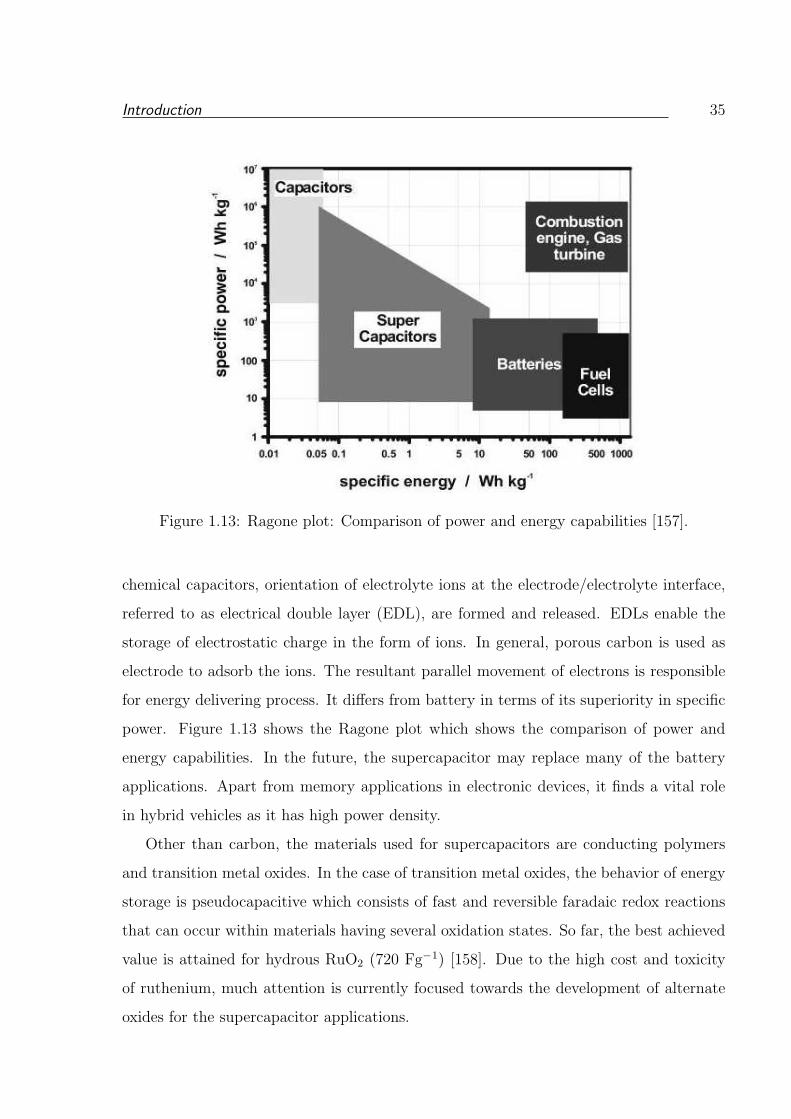
Introduction 35
Figure 1.13: Ragone plot: Comparison of power and energy capabilities [157].
chemical capacitors, orientation of electrolyte ions at the electrode/electrolyte interface,
referred to as electrical double layer (EDL), are formed and released. EDLs enable the
storage of electrostatic charge in the form of ions. In general, porous carbon is used as
electrode to adsorb the ions. The resultant parallel movement of electrons is responsible
for energy delivering process. It differs from battery in terms of its superiority in specific
power. Figure 1.13 shows the Ragone plot which shows the comparison of power and
energy capabilities. In the future, the supercapacitor may replace many of the battery
applications. Apart from memory applications in electronic devices, it finds a vital role
in hybrid vehicles as it has high power density.
Other than carbon, the materials used for supercapacitors are conducting polymers
and transition metal oxides. In the case of transition metal oxides, the behavior of energy
storage is pseudocapacitive which consists of fast and reversible faradaic redox reactions
that can occur within materials having several oxidation states. So far, the best achieved
value is attained for hydrous RuO2 (720 Fg−1) [158]. Due to the high cost and toxicity
of ruthenium, much attention is currently focused towards the development of alternate
oxides for the supercapacitor applications.
Introduction 36
1.8 Scope of the present work
Synthesis of nanomaterials in 1D has attracted much interest in view of its specific prop-
erties and applications. However, in most of the synthesis, usage of templates, mainly
organic compounds, plays a vital role in synthesizing materials having growth in uniaxial
direction. One of the main disadvantage in using templates is that the length being lim-
ited by the length of the templates. Also, the usage of a template requires removal of it
which further ends as an organic pollutant. Even though we have the choice of different
existing methods of synthesis, still it is a challenge to optimize the synthesis and process-
ing conditions to get morphologically defined porous nanostructured oxides. By ensuring
molecular level mixing in a precursor, with improved crystallinity of the product, desired
shapes like nanorods, nanowires, nanosheets, etc., can be achieved.
Oriental attachment is one of the way to synthesize nanostructured materials with
defined morphological features using simple synthetic protocols. The specific morpholog-
ical feature of the precursor can be transformed topotactically to the corresponding oxide
upon pyrolysis in air through oriental attachment. By considering the above issue, the
simple and facile coprecipition method has been modified in such a way to get a molec-
ular precursor with rod shaped morphology in the case of the cobalt spinels Co3O4 and
ZnCo2O4. The topotactical growth was confirmed by the formation of cobalt oxide with
same morphology as that of the precursor after pyrolysis in air. The optimized synthesis
conditions not only improved the crystallinity of the molecular precursor (cobalt hydroxy
carbonate) but also helped in the formation of porous nanorods of cobalt oxide. Since the
porous material has an important role in applications, it has been tested for its utility in
the field of catalysis, sensors, batteries and supercapacacitors.
Further as an extension, the same synthetic protocol has been tried in the case of Fe
based spinels of the general formula AFe2O4, where A = Fe, Zn, and Co. In the case of
cobalt ferrite, a homogeneously mixed active precursor has been formed by optimizing the
synthesis conditions which on calcination gave the spinel oxide. In the case of zinc ferrite,
a very fine nanosized material has been directly obtained at room temperature itself. In
all cases, the crystallinity was improved by digesting the precipitate at a mild condition
of 70 C. Further, as the spinel type ferrites are magnetic, the magnetic properties have
been studied and used as a tool to get detailed information on the characteristics of the

Introduction 37
nanostructures. To get insight and information on the dependence of synthesis conditions
on the magnetic properties, these mixed ferrites have also been synthesized through an
auto-combustion method. The corresponding magnetic properties are correlated with the
effect of synthesis methodologies.
This thesis also comprises of an imperative work on the nanosized, single phase, mul-
tiferroic bismuth ferrite. Its detailed magnetic properties on the basis of the impact of
the synthesis conditions have been studied.
References
[1] J.F. Shackelford, Introduction to Materials Science for Engineers, Prentice Hall,
2009.
[2] H.R. Allcock, Introduction to Materials Chemistry; Wiley Hoboken, 2008.
[3] J.L.G. Fierro, Metal Oxides: Chemistry and Applications, CRC Press, 2006.
[4] O. Muller, R. Roy, Major Ternary Structural Families, Springer-Verlag, 1974.
[5] W.H. Bragg, Philos. Mag. 30 (1915) 305.
[6] S. Nishikawa, Proc. Tokyo Math. Phys. (1915) 199.
[7] F.S. Galasso, Structure and Properties of Inorganic Solids, Pergamon, 1970.
[8] R.W.G. Wyckoff, Crystal Structures. Vol. 4, Miscellaneous inorganic com-
pounds, silicates, and basic structural information, Wiley and Sons, New York,
1969.
[9] J.G. Na, T.D. Lee, S.J. Park, IEEE T. Magn. 28 (1992) 2433.
[10] Z.J. Zhang, Z.L. Wang, B.C. Chakoumakos, J.S. Yin, J. Am. Chem. Soc. 120
(1998) 1800.
[11] R. Arulmurugan, B. Jeyadevan, G. Vaidyanathan, S. Sendhilnathan, J. Magn.
Magn. Mater. 288 (2005) 470.
[12] K.J. Standley, Oxide Magnetic Materials, Oxford University Press, 1972.
[13] R.H. Mitchell, Perovskites: Modern and Ancient, Almaz Press Inc., Canada,
2002.
References 39
[14] T. Wolfram, S. Ellialioglu Electronic and Optical Properties of d-band Per-
ovskites, Cambridge Universsity Press, 2006.
[15] V. M. Goldschmidt, Nature 7 (1926) 2.
[16] L.G. Tejuca, J. L. G. Fierro, Properties and Applications of Perovskite-type Ox-
ides; CRC, 1993.
[17] K.J. Klabunde, Nanoscale Materials in Chemistry, Wiley-Interscience New York,
2001.
[18] J.A. Rodrguez, M.F. Garcia, Synthesis, Properties, and Applications of Oxide
Nanomaterials, John Wiley & Sons, 2007.
[19] A.S. Edelstein, R.C. Cammarata, Nanomaterials: Synthesis, Properties, and
Applications, Taylor & Francis, 1998.
[20] C.A. Mirkin, C.M. Niemeyer, Nanobiotechnology II: More Concepts and Appli-
cations, Vch Verlag GmbH & Co.KGaA, 2007.
[21] O. Shoseyov, I. Levy, Nano BioTechnology: Bioinspired Devices and Materials
of the Future, Springer Verlag, 2007.
[22] V.M. Rotello, Nanoparticles: Building Blocks for Nanotechnology, Kluwer Aca-
demic/Plenum Publishers, 2004.
[23] H. Gleiter, Adv. Mater. 4 (1992) 474.
[24] G.A. Ozin, Adv. Mater. 4 (1992) 612.
[25] C.N.R. Rao, A. Muller, A.K. Cheetham, The chemistry of Nanomaterials: Syn-
thesis, Properties and Applications, John Wiley & Sons GmbH, 2004.
[26] L.S. Panchakarla, Y. Sundarayya, S. Manjunatha, A. Sundaresan, C.N.R. Rao,
Chem. Phys. Chem. 11 1673.
[27] A. Sundaresan, R. Bhargavi, N. Rangarajan, U. Siddesh, C.N.R. Rao, Phys.
Rev. B. 74 (2006) 161306(R).
References 40
[28] T. Belin, N. Millot, F. Villieras, O. Bertrand, J.P. Bellat, J. Phys. Chem. B.
108 (2004) 5333
[29] P. Ayyub, V.R. Palkar, S. Chattopadhyay, M. Multani, Phys. Rev. B. 51 (1995)
6135.
[30] J. Schoiswohl, G. Kresse, S. Surnev, M. Sock, M.G. Ramsey, F.P. Netzer, Phys.
Rev. Lett. 92 (2004) 206103.
[31] S. Tsunekawa, R. Sivamohan, S. Ito, A. Kasuya, T. Fukuda, Nanostruct. Mater.
11 (1999) 141.
[32] K.N. Yu, Y. Xiong, Y. Liu, C. Xiong, Phys. Rev. B 55 (1997) 2666.
[33] E. Mamontov, T. Egami, J. Phys. Chem. Solids. 61 (2000) 1345.
[34] H.Z. Zhang, J.F. Banfield, J. Mater. Chem. 8 (1998) 2073.
[35] W.I. Park, G.C. Yi, M.Y. Kim, S.J. Pennycook, Adv. Mater. 15 (2003) 526.
[36] M. Yin, Y. Gu, I.L. Kuskovsky, T. Andelman, Y. Zhu, G.F. Neumark, S.
O’Brien, J. Am. Chem. Soc. 126 (2004) 6206.
[37] K.K. Kim, N. Koguchi, Y.W. Ok, T.Y. Seong, S.J. Park, Appl. Phys. Lett. 84
(2004) 3810.
[38] J.V. Stark, D.G. Park, I. Lagadic, K.J. Klabunde, Chem. Mater. 8 (1996) 1904.
[39] K.J. Klabunde, J. Stark, O. Koper, C. Mohs, D.G. Park, S. Decker, Y. Jiang, I.
Lagadic, D.J. Zhang, J. Phys. Chem. 100 (1996) 12142.
[40] K.T. Ranjit, G. Medine, P. Jeevanandam, I.N. Martyanov, K.J. Klabunde, In
Environmental Catalysis, V.H. Grassion (Editor), CRC Press, Boca Raton, FL,
(2005) 391.
[41] E. Lucas, S. Decker, A. Khaleel, A. Seitz, S. Fultz, A. Ponce, W.F. Li, C. Carnes,
K.J. Klabunde, Chem. Eur. J. 7 (2001) 2505.
[42] B.-X. Wang, L.-P. Zhou, X.-F. Peng, Int. J. Heat Mass Trans. 46 (2003 ) 2665.
References 41
[43] P. Keblinski, S.R. Phillpot, S.U.S. Choi, J.A. Eastman, Int. J. Heat Mass Trans.
45 (2002) 855.
[44] S.K. Das, S.U.S. Choi, W. Yu, T. Pradeep, Nanofluids: Science and Technology,
John Wiley & Sons, 2007.
[45] S.P. Jang, S.U.S. Choi, Appl. Phys. Lett. 84 (2004) 4316.
[46] D.S. Zhu, X.F. Li, N. Wang, X.J. Wang, J.W. Gao, H. Li, Curr. Appl. Phys. 9
(2009) 131.
[47] M.S. Liu, M.C.C. Lin, I.T. Huang, C.C. Wang, Chem. Eng. Tech. 29 (2006) 72.
[48] Z.L. Wang, D.W. Tang, S. Liu, X.H. Zheng, N. Araki, Int. J. Thermophys. 28
(2007) 1255.
[49] S.M.S. Murshed, K.C. Leong, C. Yang, Int. J. Therm. Sci. 44 (2005) 367.
[50] S. Park, R.J. Gorte, J.M. Vohs, Appl. Catal. A 200 (2000) 55.
[51] J.C. Ganley, K.L. Riechmann, E.G. Seebauer, R.I. Masel, J. Catal. 227 (2004)
26.
[52] T. Rajkumar, G. Ranga Rao, J. Mol. Catal. A: Chem. 295 (2008) 1
[53] Z. Jin, H.J. Zhou, Z.L. Jin, Sensor. Actuat. B 52 (1998) 188.
[54] S.H. Wang, T.C. Chou, C.C. Liu, Sensor. Actuat. B 94 (2003) 343.
[55] J. Liu, H. Xia, L. Lu, D. Xue, J. Mater. Chem. 20 (2010) 1506.
[56] Y. Wang, H.C. Zeng, J.Y. Lee, Adv. Mater. 18 (2006) 645.
[57] G.S. Chai, S.B. Yoon, J.S. Yu, J.H. Choi, Y.E. Sung, J. Phys. Chem. B 108
(2004) 7074.
[58] M. Mamak, N. Coombs, G. Ozin, J. Am. Chem. Soc. 122 (2000) 8932.
[59] J. Liu, T. Luo, S.M. T, F. Meng, B. Sun, M. Li, Chem. Comm. 46 (2010) 472
References 42
[60] M. Zukalov, J. Prochzka, A. Zukal, J.H. Yum, L. Kavan, M. Graetzel, J. Elec-
trochem. Soc. 157 (2010) H99.
[61] E.S. Toberer, A. Joshi, R. Seshadri, Chem. Mater. 17 (2005) 2142.
[62] P. Jeevanandam, R.S. Mulukutla, Z. Yang, H. Kwen, K.J. Klabunde, Chem.
Mater. 19 (2007) 5395
[63] B.D. Cullity, C.D. Graham, Introduction to Magnetic Materials, Wiley-IEEE
Press, 2008.
[64] J.S. Smart, Effective Field Theories of Magnetism, W.B. Saunders Company,
Piladelphia& London, 1966.
[65] J.B. Goodenough, Magnetism and the Chemical Bond, Interscience Publishers,
New York, 1963.
[66] J.L. Dormann, D. Fiorani, E. Tronc, Adv. Chem. Phys. 98 (1997) 283.
[67] M.R.J. Gibbs, Modern Trends in Magnetostriction Study and Application,
Springer Netherlands, 2001.
[68] J. Smit, H.P.J. Wijn, Ferrites, Philips Technical Library, Eindhoven, 1959.
[69] A. Goldman, Modern Ferrite Technology, Springer Verlag, 2006.
[70] J.B. Goodenough, J.M. Longo, ”Crystallographic and magnetic properties of
perovskite and perovskite-related compounds”, Landbolt-Bornstein, New Series,
vol. III.4(a), Springer, Berlin, 1970, p. 126.
[71] C.N.R. Rao, B. Raveau, Colossal Magnetoresistance, Charge Ordering and Re-
lated Properties of Manganese Oxides, World Scientific Pub Co Inc, 1998.
[72] C. Zener, Phys. Rev. 82 (1951) 403.
[73] W.D. Callister, D.G. Rethwisch, Fundamentals of Materials Science and Engi-
neering, John Wiley & Sons, 2003.
[74] H. Bea, M. Gajek, M. Bibes, A.Barthelemy, J. Phys.: Condens. Mattter 20
(2008) 434221.
References 43
[75] H. Schmid, Ferroelectrics 162 (1994) 317.
[76] C. Ederer, N.A. Spaldin, Nat. Mater. 3 (2004) 849.
[77] D.I. Khomskii, J. Magn. Magn. Mater. 306 (2006) 1.
[78] S.W. Cheong, M. Mostovoy, Nat. Mater. 6 (2007) 13.
[79] J.F. Scott, Nat. Mater. 6 (2007) 256.
[80] M. Bibes, A. Barthelemy, Nat. Mater. 7 (2008) 425.
[81] E. Ascher, H. Rieder, H. Schmid, H. Stssel, J. Appl. Phys. 37 (1966) 1404.
[82] R. Moctezuma, M.E. Mendoza, J.L. Carrillo, J. Magn. Magn. Mater. 320 (2008)
e186.
[83] D. Andreica, J.P. Rivera, S. Gentil, Z.G. Ye, M. Senthil Kumar, H. Schmid,
Ferroelectrics 204 (1997) 73.
[84] G.A. Smolensky, A.I. Agranovskaya, V.A. Isupov, Sov. Phys. Solid State 1 (1959)
149.
[85] G.A. Smolensky, V.A. Isupov, A.I. Agronovskaya, Sov. Phys. Solid State 1 (1959)
150.
[86] W. Brixel, J.P. Rivera, A. Steiner, H. Schmid, Ferroelectrics 79 (1988) 201.
[87] S. Kharrazi, D.C. Kundaliya, S.W. Gosavi, S.K. Kulkarni, T. Venkatesan, S.B.
Ogale, J. Urban, S. Park, S.W. Cheong, Solid State Communi. 138 (2006) 395.
[88] E. Galstyan, B. Lorenz, K.S. Martirosyan, F. Yen, Y.Y. Sun, M.M. Gospodinov,
C.W. Chu, J. Phys.: Condens. Matter 20 (2008) 325241.
[89] N. Fujimura, T. Ishida, T. Yoshimura, T. Ito, Appl. Phys. Lett. 69 (1996) 1011.
[90] C.R. Serrao, J.R. Sahu, K. Ramesha, C.N.R. Rao, J. Appl. Phys. 104 (2008)
016102.
[91] P. Uniyal, K.L. Yadav, Mater. Lett. 62 (2008) 2858.
References 44
[92] P. Uniyal, K.L. Yadav, J. Phys.: Condens. Matter 21 (2009) 012205.
[93] R.K. Mishra, D.K. Pradhan, R.N.P. Choudhary, A. Banerjee, J. Phys.: Condens.
Matter 20 (2008) 045218.
[94] I.O. Troyanchuk, M.V. Bushinsky, D.V. Karpinsky, O.S. Mantytskaya, V.V.
Fedotova, O.I. Prochnenko, Phys. Status solidi B 246 (2009) 1901.
[95] V.A. Khomchenko, V.V. Shvartsman, P. Borisov, W. Kleemann, D.A. Kiselev,
I.K. Bdikin, J.M. Vieira, A.L. Kholkin, Acta Mater. 57 (2009) 5137.
[96] Z. Yan, K.F. Wang, J.F. Qu, Y. Wang, Z.T. Song, S.L. Feng, Appl. Phys. Lett.
91 (2007) 082906.
[97] C.G. Duan, S.S. Jaswal, E.Y. Tsymbal, Phys. Rev. Lett. 97 (2006) 47201.
[98] N. Ortega, P. Bhattacharya, R.S. Katiyar, P. Dutta, A. Manivannan, M.S.
Seehra, I. Takeuchi, S.B. Majumder, J. Appl. Phys. 100 (2006) 126105
[99] H. Zheng, J. Wang, S.E. Lofland, Z. Ma, L. Mohaddes-Ardabili, T. Zhao, L.
Salamanca-Riba, S.R. Shinde, S.B. Ogale, F. Bai, Science 303 (2004) 661.
[100] T. Asefa, C.T. Duncan, K.K. Sharma, The Analyst 134 (2009) 1980.
[101] S.M. Kanan, O.M. El-Kadri, I.A. Abu-Yousef, M.C. Kanan, Sensors 9 (2009)
8158.
[102] T. Anderson, F. Ren, S. Peal-ton, Sensors 9 (2009) 4669.
[103] J. Janata, M. Josowicz, P. Vansek, D.M. DeVaney, Anal. Chem. 70 (1998) 179.
[104] E. Bakker, M. Telting-Diaz, Anal. Chem. 74 (2002) 2781
[105] D. Kohl, J. phys. D: Appl. phys. 34 (2001) R125.
[106] W.H. Brattain, J. Bardeen, Bell Syst. Tech. J. 32 (1953) 1.
[107] A. Bielanski, J. Deren, J. Haber, Nature 179 (1957) 668.
[108] T. Seiyama, A. Kato, K. Fujiishi, M. Nagatani, Anal. Chem. 34 (1962) 1502f.
References 45
[109] N. Taguchi, U. S. Patent 3631436, 1971.
[110] J. Gong, Q. Chen, M.R. Lian, N.C. Liu, R.G. Stevenson, F. Adami, Sensor.
Actuat. B 114 (2006) 32.
[111] S. Vallejos, V. Khatko, J. Calderer, I. Gracia, C. Cane, E. Llobet, X. Correig,
Sensor. Actuat. B 132 (2008) 209.
[112] V. Guidi, D. Boscarino, E. Comini, G. Faglia, M. Ferroni, C. Malagu, G. Mar-
tinelli, V. Rigato, G. Sberveglieri, Sensor. Actuat. B 65 (2000) 264.
[113] P.C. Xu, Z.X. Cheng, Q.Y. Pan, J.Q. Xu, Q. Xiang, W.J. Yu, Y.L. Chu, Sensor.
Actuat. B 130 (2008) 802.
[114] J. Kaur, S.C. Roy, M.C. Bhatnagar, Sensor. Actuat. B 123 (2007) 1090.
[115] F. Berger, M. Fromm, A. Chambaudet, R. Planade, Sensor. Actuat. B 45 (1997)
175.
[116] H. Torvela, J. Huusko, V. Lantto, Sensor. Actuat. B 4 (1991) 479.
[117] M. Penza, G. Cassano, F. Tortorella, Sensor. Actuat. B 81 (2001) 115.
[118] C.S. Rout, M. Hegde, C.N.R. Rao, Sensor. Actuat. B 128 (2008) 488.
[119] D.D. Vuong, G. Sakai, K. Shimanoe, N. Yamazoe, Sensor. Actuat. B 105 (2005)
437.
[120] Z. Liu, T. Fan, D. Zhang, X. Gong, J. Xu, Sensor. Actuat. B 136 (2009) 499.
[121] K.J. Wallace, S.R. Cordero, C.P. Tan, V.M. Lynch, E.V. Anslyn, Sensor. Actuat.
B 120 (2007) 362.
[122] M. Tong, G. Dai, D. Gao, Mater. Chem. Phys. 69 (2001) 176.
[123] Y.D. Wang, X.H. Wu, Q. Su, Y.F. Li, Z.L. Zhou, Solid State Electron. 45 (2001)
347.
[124] M.S. Wagh, G.H. Jain, D.R. Patil, S.A. Patil, L.A. Patil, Sensor. Actuat. B 115
(2006) 128.
References 46
[125] D.N. Suryawanshi, D.R. Patil, L.A. Patil, Sensor. Actuat. B 134 (2008) 579.
[126] G.J. Li, S. Kawi, Talanta 45 (1998) 759.
[127] S. Vallejos, V. Khatko, K. Aguir, K.A. Ngo, J. Calderer, I. Gr cia, C. Cane, E.
Llobet, X. Correig, Sensor. Actuat. B 126 (2007) 573.
[128] G. Korotcenkov, I. Blinov, M. Ivanov, J.R. Stetter, Sensor. Actuat. B 120 (2007)
679.
[129] T. Jinkawa, G. Sakai, J. Tamaki, N. Miura, N. Yamazoe, J. Mol. Cat. A 155
(2000) 193.
[130] R.S. Khadayate, J.V. Sali, P.P. Patil, Talanta 72 (2007) 1077.
[131] S. Ajami, Y. Mortazavi, A. Khodadadi, F. Pourfayaz, S. Mohajerzadeh, Sensor.
Actuat. B 117 (2006) 420.
[132] D. Patil, P. Patil, V. Subramanian, P.A. Joy, H.S. Potdar, Talanta 81 (2010) 37.
[133] X. Niu, W. Du, Sensor. Actuat. B-Chem. 99 (2004) 405.
[134] C. Xiangfeng, L. Xingqin, M. Guangyao, Sensor. Actuat. B 55 (1999) 19.
[135] H.H. Kung, Transition Metal Oxides: Surface Chemistry and Catalysis, Elsevier,
1989.
[136] K. J. Laidler, Chemical Kinetics, Harper and Row, New York, (1987) P29.
[137] S.D. Jackson, J.S.J. Hargreaves, Metal Oxide Catalysis, Wiley-VCH, 2009.
[138] H.C. Zeng, Inorg. Chem. 37 (1998) 1967.
[139] M.S. Chen, D.W. Goodman, Science 306 (2004) 252.
[140] Z. Zhang, C.C. Wang, R. Zakaria, J.Y. Ying, J. Phys. Chem. B 102 (1998)
10871.
[141] N.R. Shiju, V.V. Guliants, Appl. Catal. A 356 (2009) 1.
[142] X. Xie, Y. Li, Z.Q. Liu, M. Haruta, W. Shen, Nature 458 (2009) 746.
References 47
[143] S. Dhameja, Electric Vehicle Battery Systems, Newnes, 2002.
[144] R. Dell, D.A.J. Rand, Understanding Batteries, Royal Society of Chemistry,
2001.
[145] G. Nazri, G. Pistoia, Lithium Batteries: Science and Technology, Springer
Netherlands, 2004.
[146] I. Buchmann, Batteries in a Portable World, Cadex Electronics, 2001.
[147] P. Poizot, S. Laruelle, S. Grugeon, L. Dupont, J.M. Tarascon, Nature 407 (2000)
496.
[148] B. Scrosati, Electrochim. Acta 45 (2000) 2461
[149] M.S. Whittingham, Science 192 (1976) 1126
[150] M.S. Whittingham, A.J. Jacobson, Intercalation Chemistry, Academic Press,
New York, 1982.
[151] K. Mizushima, P.C. Jones, P.J. Wiseman, J.B. Goodenough, Mater. Res. Bull.
15 (1980) 783.
[152] M.M. Thackeray, W.I.F. David, P.G. Bruce, J.B. Goodenough, Mater. Res. Bull.
18 (1983) 461
[153] Y. Idota, T. Kubota, A. Matsufuji, Y. Maekawa, T. Miyasaka, Science 276
(1997) 1395.
[154] C.K. Chan, H.L. Peng, G. Liu, K. McIlwrath, X.F. Zhang, R.A. Huggins, Y.
Cui, Nat. Nanotechnol. 3 (2008) 31.
[155] D.W. Kim, I.S. Hwang, S.J. Kwon, H.Y. Kang, K.S. Park, Y.J. Choi, K.J. Choi,
J.G. Park, Nano Lett. 7 (2007) 3041.
[156] B.E. Conway, Electrochemical Supercapacitors: Scientific Fundamentals and
Technological Applications, Springer, 1999.
[157] M. Winter, R.J. Brodd, Chem. Rev. 104 (2004) 4245.

References 48
[158] J.P. Zheng, P.J. Cygan, T.R. Jow, J. Electrochem. Soc. 142 (1995) 2699.
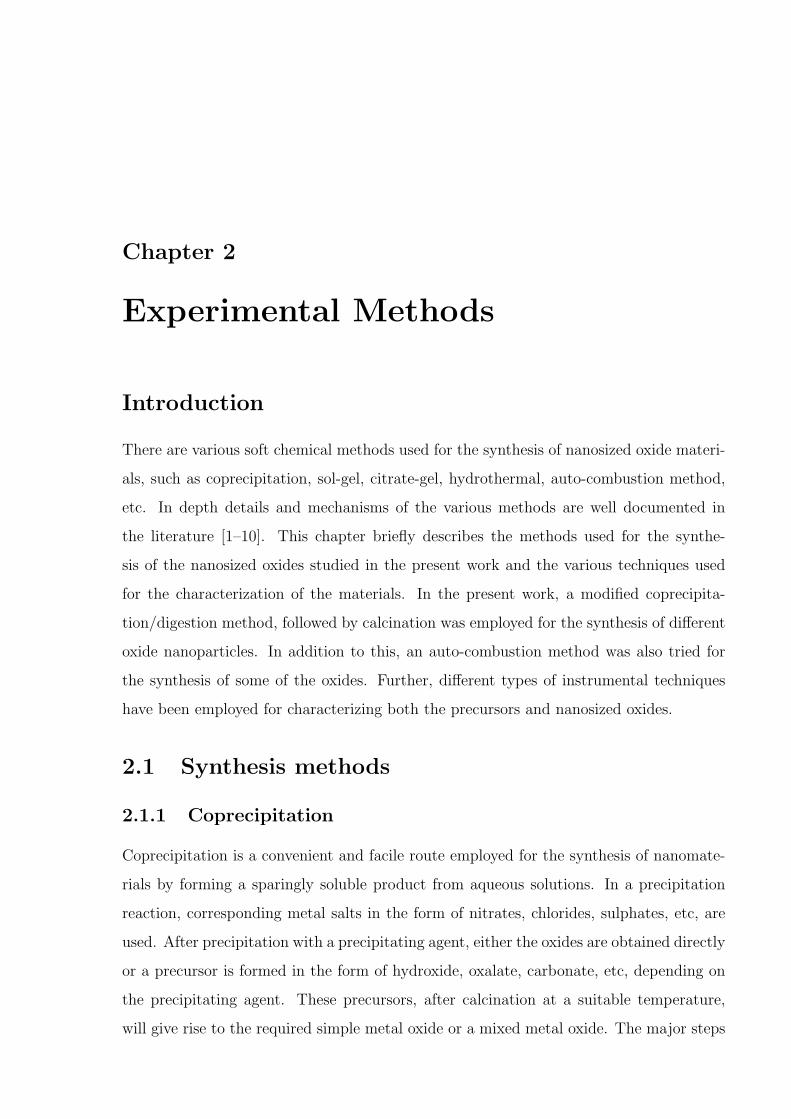
Chapter 2
Experimental Methods
Introduction
There are various soft chemical methods used for the synthesis of nanosized oxide materi-
als, such as coprecipitation, sol-gel, citrate-gel, hydrothermal, auto-combustion method,
etc. In depth details and mechanisms of the various methods are well documented in
the literature [1–10]. This chapter briefly describes the methods used for the synthe-
sis of the nanosized oxides studied in the present work and the various techniques used
for the characterization of the materials. In the present work, a modified coprecipita-
tion/digestion method, followed by calcination was employed for the synthesis of different
oxide nanoparticles. In addition to this, an auto-combustion method was also tried for
the synthesis of some of the oxides. Further, different types of instrumental techniques
have been employed for characterizing both the precursors and nanosized oxides.
2.1 Synthesis methods
2.1.1 Coprecipitation
Coprecipitation is a convenient and facile route employed for the synthesis of nanomate-
rials by forming a sparingly soluble product from aqueous solutions. In a precipitation
reaction, corresponding metal salts in the form of nitrates, chlorides, sulphates, etc, are
used. After precipitation with a precipitating agent, either the oxides are obtained directly
or a precursor is formed in the form of hydroxide, oxalate, carbonate, etc, depending on
the precipitating agent. These precursors, after calcination at a suitable temperature,
will give rise to the required simple metal oxide or a mixed metal oxide. The major steps
Experimental Methods 50
governing a precipitation reaction are nucleation, growth and agglomeration. The theory
and mechanism behind each individual step is well described in the literature [11–16].
In a precipitation reaction, the primary process taking place is nucleation which can be
considered as the key step. During nucleation, there will be formation of numerous small
particles. The formation of products result in a sparingly soluble species formed un-
der the condition of higher supersaturation. Supersaturation can be induced by various
parameters such as temperature, pressure and chemical reaction. The particles formed
will tend to grow/aggregate together either through the process of Ostwald ripening or
through oriental attachment to minimize their energy and to become thermodynamically
stable. If the crystallinity of the precursor is improved during precipitation, the high
energy facets will attach together orientally to give morphologically controlled precursors.
Those precursors upon calcination in air will form their corresponding oxides retaining
their morphology as such. Such a growth process is called topotatical growth.
In the present work, most of the precipitation reactions have been carried out by
using metal nitrates with potassium carbonate as the precipitating agent. Only in the
case of Fe3O4, corresponding metal chlorides have been precipitated by using ammonium
carbonate. Since the purity is very important for a material, all the starting chemicals
have been carefully chosen with purity greater than 99%. The schematic representation
of the synthesis is shown in Figure 2.1
As represented in Figure 2.1, corresponding metal nitrates and the precipitating agent
are added simultaneously from separate burettes to deionized water kept at 70 C in a
round bottom flask, under vigourous stirring conditions. Deionized water is used as a
medium for the reaction. Several initial experiments have been performed to control the
pH required for the reaction (pH ≈ 7–8). With optimized pH conditions, the precipitation
reaction is carried out with out any drastic change in pH. The controlled addition and
stirring, with digestion at 70 C helped to increase the crystallinity of the precursor. The
same procedure was adapted for the synthesis of all oxides reported in this work, except
that the starting chemicals are different, ferrous and ferric chlorides with ammonium
carbonate as precipitant in the case of Fe3O4 .
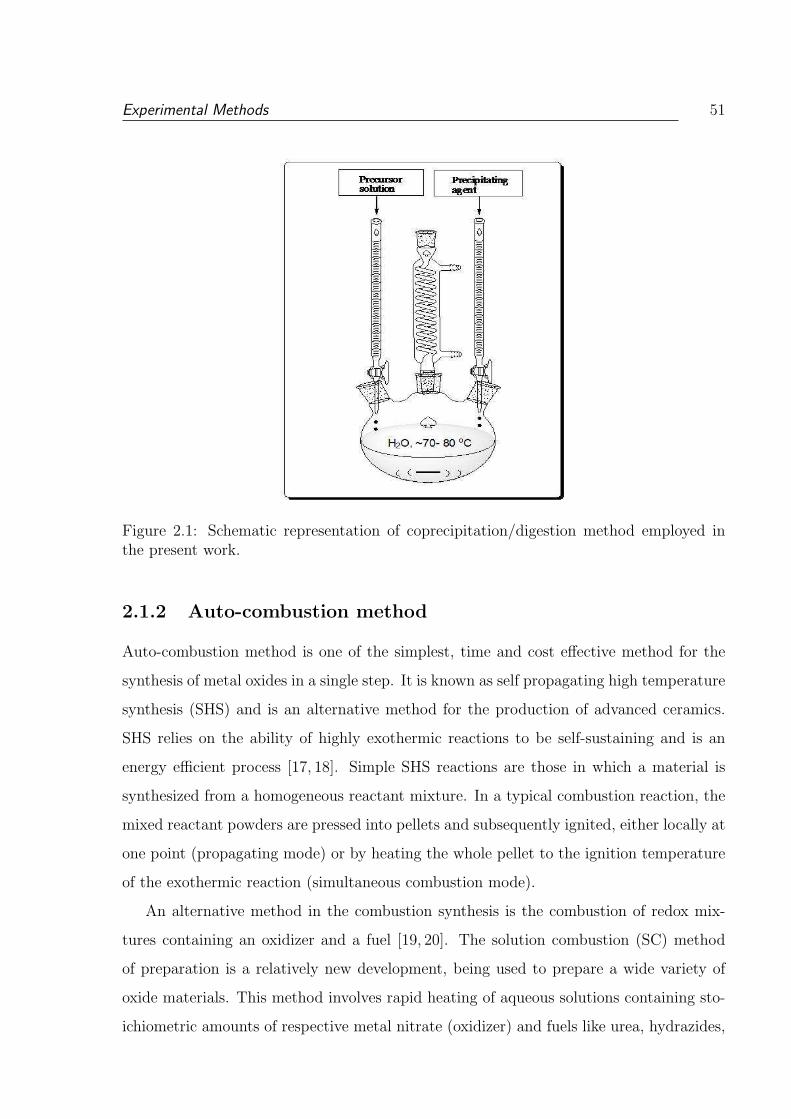
Experimental Methods 51
Figure 2.1: Schematic representation of coprecipitation/digestion method employed inthe present work.
2.1.2 Auto-combustion method
Auto-combustion method is one of the simplest, time and cost effective method for the
synthesis of metal oxides in a single step. It is known as self propagating high temperature
synthesis (SHS) and is an alternative method for the production of advanced ceramics.
SHS relies on the ability of highly exothermic reactions to be self-sustaining and is an
energy efficient process [17, 18]. Simple SHS reactions are those in which a material is
synthesized from a homogeneous reactant mixture. In a typical combustion reaction, the
mixed reactant powders are pressed into pellets and subsequently ignited, either locally at
one point (propagating mode) or by heating the whole pellet to the ignition temperature
of the exothermic reaction (simultaneous combustion mode).
An alternative method in the combustion synthesis is the combustion of redox mix-
tures containing an oxidizer and a fuel [19, 20]. The solution combustion (SC) method
of preparation is a relatively new development, being used to prepare a wide variety of
oxide materials. This method involves rapid heating of aqueous solutions containing sto-
ichiometric amounts of respective metal nitrate (oxidizer) and fuels like urea, hydrazides,
Experimental Methods 52
citric acid, etc [21–28]. A wide range of technologically important oxides with interesting
magnetic, dielectric, electrical, mechanical, catalytic, luminescent and optical properties
have been prepared by this method. In the solution combustion method, the fuel used are
the source of C and H, which on combustion form CO and H2O and liberate heat. Also,
they form complexes with the metal ions facilitating homogeneous mixing of the cations
in solution. The process can yield nanosized metal oxides some times having very high
surface area.
In the present study, the glycine-nitrate process (GNP) has been used to synthesize
some of the nanosized ferrites. Glycine has a carboxylic acid group at one end and amino
acid group at other end [29]. Through this zwiterionic character, it can effectively complex
metal ions of various ionic sizes. During the combustion reaction, it will act as a fuel also
through oxidation by nitrate ion. The fuel/oxidizer ratio mainly governs the powder
characteristics such as crystallite size, surface area, agglomeration etc. Theoretically
calculated ratios of metal nitrate to fuel for a divalent and a trivalent metal ions is given
in equation 2.1 and equation 2.2.
M(NO3)2 +10
9C2H5O2N = MO +
20
9CO2 +
25
9H2O +
14
9N2 (2.1)
2M(NO3)3 +30
9C2H5O2N = M2O3 +
60
9CO2 +
75
9H2O +
42
9N2 (2.2)
In the present work, corresponding metal nitrates of AR grade have been used to
synthesize the corresponding oxides in a single step. Required moles of metal nitrate and
fuel (glycine) were dissolved separately in minimum amount of distilled water and then
mixed together. This homogeneous mixture solution was taken in a crystalizing dish of
size 150 mm x 75 mm and kept on a hot plate with controlled heating. After evaporation
of water, there will be gelation followed by a self ignition to yield the corresponding oxides
in a single step. To get control over the particle size and phase purity different ratios of
nitrate to fuel has been tried.
Experimental Methods 53
2.2 Characterization methods
2.2.1 Powder X-Ray Diffraction
Powder X-Ray diffraction (XRD) is a basic tool for characterization of materials for its
phase identification [30, 31]. Each crystalline solid has its unique characteristic X-ray
powder pattern, which may be used as a ”fingerprint” for its identification. X-ray diffrac-
tion is a versatile, non-destructive analytical technique for identification and quantitative
determination of the various crystalline compounds, known as ’phases’, present in solid
materials and powders. Identification is achieved by comparing the x-ray diffraction pat-
tern - or ’diffractogram’ - obtained from an unknown sample with an internationally
recognized database containing reference patterns of almost all known phases. Modern
computer-controlled diffractometer systems use automatic routines to measure, record and
interpret the unique diffractograms produced by individual constituents in even highly
complex mixtures.
The characteristics of X-Ray diffraction were discovered by W. H. Bragg. When a
monochromatic X-ray beam with wavelength λ is projected onto a crystalline material
at an angle θ, diffraction occurs only when the distance traveled by the rays reflected
from successive planes differs by a complete number ’n’ of wavelengths. The incident
X-radiation strikes the planes (hkl) at an angle θ. The spacing between these planes is
’d’. Relationship between the wavelength of X-Ray beam, the angle of diffraction θ, and
the distance between each set of planes separated with spacing ’d’ is given by the Bragg
condition
nλ = 2dsinθ (2.3)
where ‘n’ is the order of the diffraction. The diffraction of X-Rays on a set of crystals
can be represented schematically as shown in Figure 2.2. Bragg’s law is the necessary
condition for diffraction.
The angular spread of the reflection from a crystal plane is affected not only by the
perfection of the crystal but also by the size of the crystal. As the average size of the
crystallites decreases, the angular spread of the reflection from a powder will increase.
After suitable calibration, the half height width of a reflection in a powder diffractogram
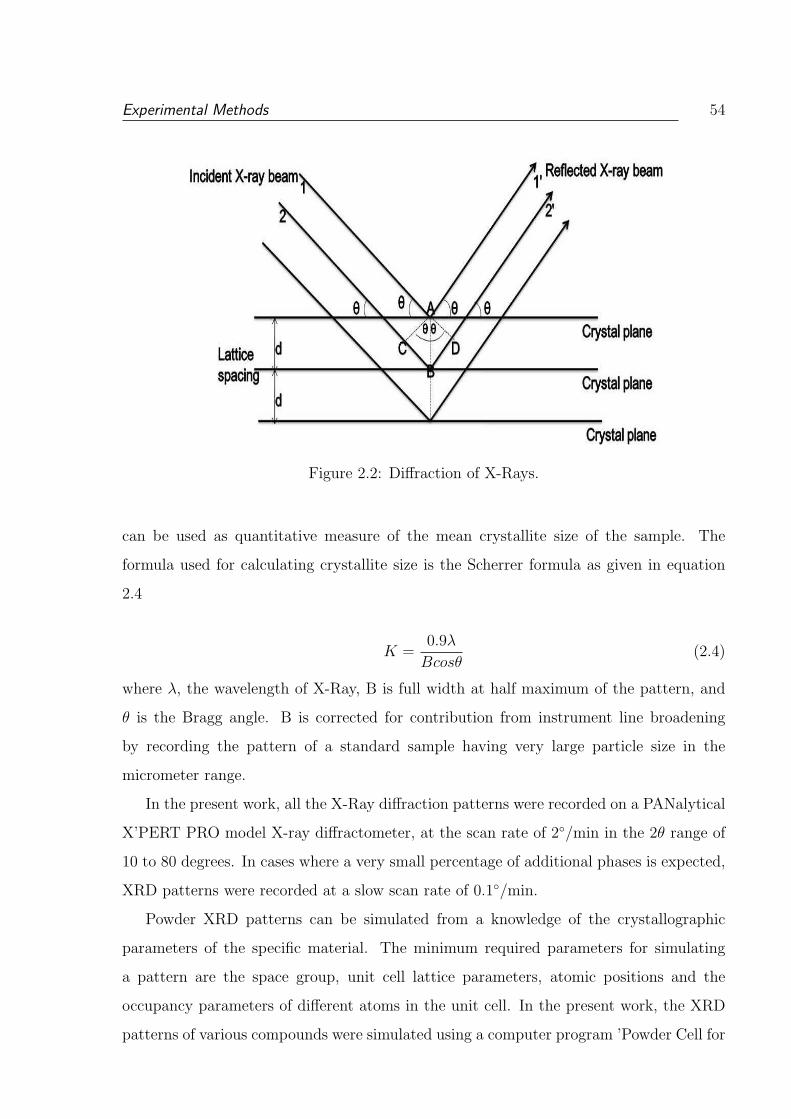
Experimental Methods 54
Figure 2.2: Diffraction of X-Rays.
can be used as quantitative measure of the mean crystallite size of the sample. The
formula used for calculating crystallite size is the Scherrer formula as given in equation
2.4
K =0.9λ
Bcosθ(2.4)
where λ, the wavelength of X-Ray, B is full width at half maximum of the pattern, and
θ is the Bragg angle. B is corrected for contribution from instrument line broadening
by recording the pattern of a standard sample having very large particle size in the
micrometer range.
In the present work, all the X-Ray diffraction patterns were recorded on a PANalytical
X’PERT PRO model X-ray diffractometer, at the scan rate of 2/min in the 2θ range of
10 to 80 degrees. In cases where a very small percentage of additional phases is expected,
XRD patterns were recorded at a slow scan rate of 0.1/min.
Powder XRD patterns can be simulated from a knowledge of the crystallographic
parameters of the specific material. The minimum required parameters for simulating
a pattern are the space group, unit cell lattice parameters, atomic positions and the
occupancy parameters of different atoms in the unit cell. In the present work, the XRD
patterns of various compounds were simulated using a computer program ’Powder Cell for
Experimental Methods 55
Windows’, PCW version 2.4, developed by W. Krauz and G. Nolze [32]. Along with the
simulated pattern, the corresponding XRD patterns were compared with the standard
available data from the Joint Committee on Powder Diffraction Standards (JCPDS),
International Center for Diffraction Data, with the card number.
2.2.2 High Resolution Transmission Electron
Microscopy (HRTEM)
In nanoscience and nanotechnology observation is one of the key step for manipulation
and arrangement of atoms for understanding and development. Human eye can resolve
smallest distance between two points of about 0.1–0.2 mm. This distance is the resolving
power of the eye. So, to visualize tiny objects, we need a technique or instrument which
is the microscope to get enlarged images. The word microscope is derived from greek
-“micros” meaning ‘small’ and “skopos” meaning ‘to look at’. A microscope consists of
an illumination source, condenser lens for coverage of beam, an objective lens for mag-
nification and a projector lens for projecting the image which can be photographed or it
can be seen in CCD cameras. Here, electrons are being used because electrons are smaller
than atoms and therefore, it is possible to “see” details at the atomic level. Through this
technique, one can get insight information about size, shape and arrangement of particles
in a sample [33]. Through the scattering phenomenon, which occurs during the interac-
tion of electrons with matter, we can get diffraction patterns. For example, there will be
a coherent scattering as a result of elastic scattering occurring from well ordered arrange-
ments of atoms in a crystal. The resultant coherent scattering will give spot patterns in
case of single crystals and ring patterns for polycrystalline materials. The d-spacing be-
tween lattice planes of crystalline materials can be calculated from selected area electron
diffraction pattern (SAED) through the relationship
dr = λL (2.5)
where L is the distance between the specimen and the photographic plate, and the term
λL can be taken as a camera constant and r is the radius of the diffracted ring. By
calibrating the instrument with a standard sample (Au), we can calculate the camera
constant. Hence, through λL and r one can calculate d values which will give information
Experimental Methods 56
about the specific crystal structure. As the name implies ‘High resolution’ one can resolve
in depth to get informations like lattice fringes which once again gives information about
the d values to know details of the crystal structure [34].
All the nanosized oxides synthesized in this present work were analyzed using a model
SEI, PECNAI G2TF30 transmission electron microscope. The powder sample was dis-
persed in a solvent with low boiling point like isopropanol and dropped on the carbon
and polymeric film coated copper grids for analysis. The coated samples were allowed to
dry for overnight to evaporate the solvents before the analysis.
2.2.3 Infrared (IR) spectroscopy
IR spectroscopy analysis is based on the interaction of electromagnetic radiation with
matter [35,36]. It has been widely used for structural analysis, chemical compound iden-
tification and monitoring of changes occurring during the course of a chemical reaction.
Normally all the atoms in a molecules are in motion to some extent. Molecules tend to
rotate, translate and vibrate. The energy of IR radiation is sufficient to change the vibra-
tional energy states of molecules. There will be an interaction of IR radiation with the
molecule if the dipole moment changes due to vibration. Hence, such mode of vibration
is said to be IR active. We can observe increase in amplitude of vibration when energy is
transferred to the molecule if the frequency of radiation matches with the frequency of a
particular vibration. The frequency of vibration can be obtained from Hooke’s law
ν =1
2πc
√K
µ(2.6)
where ν is the vibrational frequency, K is the force constant and µ is reduced mass. So,
from the characteristic bands of certain vibrational frequencies in the IR spectra, one can
get structural information about the molecules. In the present work, the IR studies were
carried out on the oxide samples using a Perkin Elmer Spectrum-One FTIR Spectrometer
in the frequency range 400 to 4000 cm−1 by properly mixing the sample with spectroscopic
grade KBr.
Experimental Methods 57
2.2.4 X-Ray Photoelectron Spectroscopy (XPS)
In solid materials surface properties are crucial in determining many properties. There
will be an interaction with the surroundings through the surface, the physical and chem-
ical composition of these surfaces determines the nature of interaction. XPS is a surface
sensitive technique since it has a relatively low penetration depth (0.5–2 nm) of the elas-
tically scattered electron. XPS is based on the principle of photoelectric effect, emission
of an electron when X-rays incident on a solid surface, discovered by Hertz in 1887.
This technique has been widely used to characterize materials to get information about
the elemental status [37, 38]. Through the electron spectrometer, energy of the emitted
photoelectrons can be measured. From the binding energies (BEs), which depend on
the element, one can characterize the solid materials. Following equation 2.7 gives the
relationship between the parameters involved in the XPS measurement:
EB = hν − EK −W (2.7)
where hν is the photon energy, EK , is the kinetic energy of the electron and W is the spec-
trometer work function. Binding energy can be calculated from equation 2.7 and hence
information about elements can be obtained from the characteristic binding energies. In
addition to this, chemical information can be obtained from the shift in binding energies
which depend on the chemical bonding of the elements under investigation.
XPS studies in this work have been made on the model VG Microtech Multilab ESCA
3000 spectrometer using a non-monochromatized MgKα source, hν = 1253.6 eV with a
base pressure in the analysis chamber as 4 x 10⁻¹⁰ torr. The instrument’s overall energy
resolution was better than 0.7 eV, as determined from the full width at half maximum
of the 4f7/2 core level of gold surface. Further, all the binding energies were corrected if
there is any error using C1S peak of carbon with the binding energy value of 285.00 eV
as the reference.
2.2.5 Surface Area Measurement
Solids surface may be of porous or non-porous in nature. If there is porosity, depending
on the size of the pores, the solids are classified into macroporous (diameter above 50
nm) mesoporous (diameter 2–50 nm) and microporous (diameter less than 2 nm). To
Experimental Methods 58
get information about the surface area of a solid, it is important to know the number of
molecules that cover the surface with a single layer of the adsorbate, which is nothing
but monolayer capacity. From the area of cross section of the adsorbate molecule, the
surface area can be calculated. Brunauer-Emmett-Teller (BET) equation for calculating
the monolayer capacity of a solid is given by
P
v(P0 − P )=
1
Cvm
+(C − 1)P
CvmP0
(2.8)
where P is adsorption equilibrium pressure, P0 is saturation vapour pressure of the adsor-
bate at the experimental temperature, v is volume of N2 adsorbed at a pressure P, vm is
the volume of adsorbate required for monolayer coverage, C is a constant that is related
to the heat of adsorption and liquefaction. From the valid BET equation we can get a
straight line if we plot Pv(P0−P )
against P/P0 with the slope s=C−1vmC
and intercept i = 1vmC
.
Here, the monolayer capacity is vm = 1s+i
. Since vm is the volume in ml at standard tem-
perature and pressure, the number of molecules is vmN22414
, where N is Avagadro’s number.
From these relations total surface area of the solid is given by
surface area =vmN
22414Am × 10−20m2 (2.9)
where Am is the area of cross section of the adsorbate molecule. The specific surface area
of the solid material will be obtained by dividing total surface by mass of the solid [39].
The surface area measurements of the samples were carried out using the model Mi-
cromeritics NOVA 1200 (Quanta Chrome) instrument using N2 as adsorbent.
2.2.6 Thermogravimetric Analysis (TGA)
TGA is a type of thermal analysis in which physical properties of a material are measured
as a function of temperature [40]. Information about any weight changes associated with
thermally induced transformations can be obtained from TGA. The loss of weight as a
function of temperature is the characteristic features of a material since there will be
physical and chemical changes over a wide temperature range.
In this work, TGA was performed on a Perkin-Elmer TGA7 analyzer under normal
atmospheric conditions.
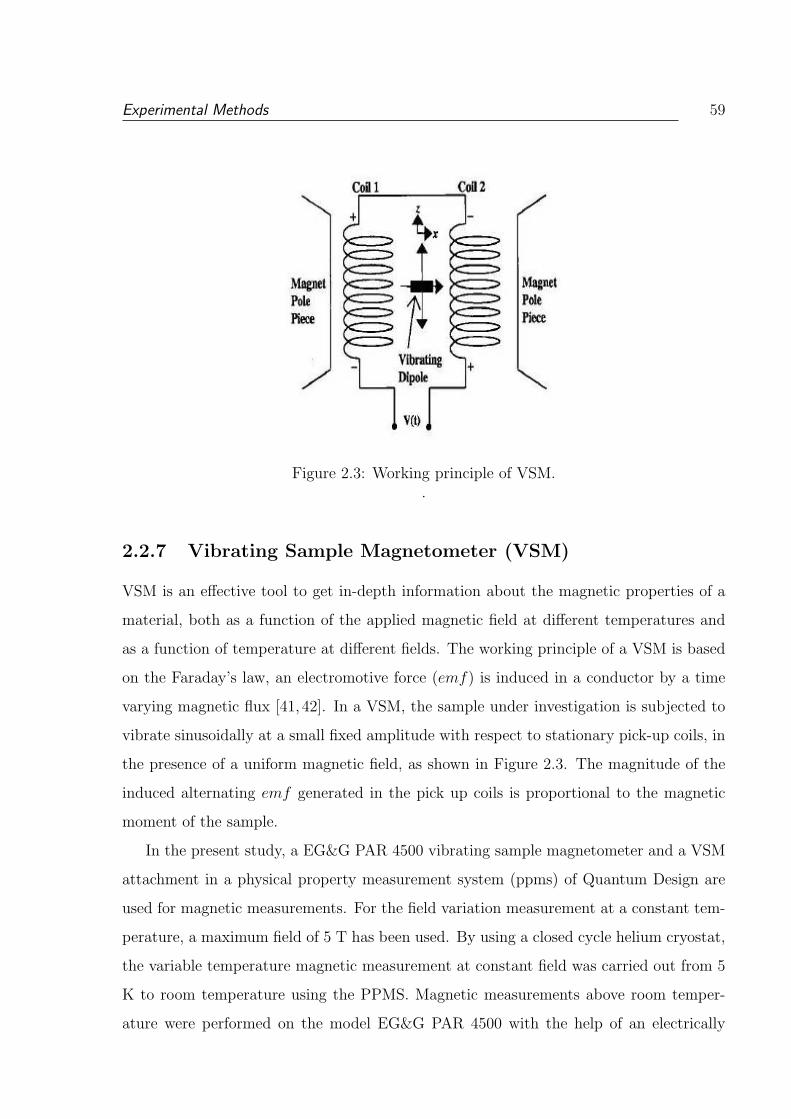
Experimental Methods 59
Figure 2.3: Working principle of VSM..
2.2.7 Vibrating Sample Magnetometer (VSM)
VSM is an effective tool to get in-depth information about the magnetic properties of a
material, both as a function of the applied magnetic field at different temperatures and
as a function of temperature at different fields. The working principle of a VSM is based
on the Faraday’s law, an electromotive force (emf) is induced in a conductor by a time
varying magnetic flux [41, 42]. In a VSM, the sample under investigation is subjected to
vibrate sinusoidally at a small fixed amplitude with respect to stationary pick-up coils, in
the presence of a uniform magnetic field, as shown in Figure 2.3. The magnitude of the
induced alternating emf generated in the pick up coils is proportional to the magnetic
moment of the sample.
In the present study, a EG&G PAR 4500 vibrating sample magnetometer and a VSM
attachment in a physical property measurement system (ppms) of Quantum Design are
used for magnetic measurements. For the field variation measurement at a constant tem-
perature, a maximum field of 5 T has been used. By using a closed cycle helium cryostat,
the variable temperature magnetic measurement at constant field was carried out from 5
K to room temperature using the PPMS. Magnetic measurements above room temper-
ature were performed on the model EG&G PAR 4500 with the help of an electrically
Experimental Methods 60
heated oven attached to it. For room temperature magnetic measurements, sample was
subjected to the field at room temperature. For zero field cooled (ZFC) measurement,
sample was cooled to the lowest possible temperature in zero magnetic field and then
magnetization was recorded while warming it back to room temperature under a constant
field. In the case of field cooled (FC) measurement, a constant field was applied during
cooling down to the lowest possible temperature and the magnetization was measured
under the field while heating back to room temperature.
2.2.8 Catalytic Oxidation
Catalytic oxidation reaction was performed in an autoclave (Parr Instruments) having a
total capacity of 300 ml. In a typical oxidation reaction, 0.5 gm (0.3 mmol) of veratryl
alcohol was added to 70 ml of methanol. This reaction mixture was charged in the Parr
autoclave having provisions of heating arrangement, overhead stirrer, internal cooling
loop, pressure gauge as well as a transducer, gas inlet, gas outlet, sampling valve, safety
rupture disc, cooling coil, etc. 0.1 gm the catalyst was added to the reaction mixture
and was heated up to 130 C. When the desired temperature was attained, the reactor
was pressurized with oxygen up to 100 psig and then the reaction was started by putting
on an agitation at the rate of 900 rpm. Total oxygen pressure was kept constant at 100
psi by adding oxygen from time to time. The reaction was continued for 2 h. Liquid
samples were analyzed by HPLC using a Hewlett-Packard model 1050 liquid chromato-
graph equipped with a UV detector for analysis. The analysis was performed on a 25
cm RP-18 column supplied by Hewlett-Packard. The product and reactant were detected
using a UV detector at λmax = 223 nm using 35 % methanol as mobile phase at a column
temperature of 35 C and the flow rate of 1 ml/min. For the analysis, samples of 20 µl
were injected into the column using an auto sampler HP1100.
2.2.9 Gas Sensor measurements
Gas sensing measurements were performed in the set up as shown in Figure 2.4. The
description of the set up is as follows: It consist of glass chamber (2 liters capacity
and ∼11 cm diameter), a nicrome wire heater (resistance ∼55 Ω at room temperature)
with a power of 750W. A dimmerstat was used to control the heating. The ceramic
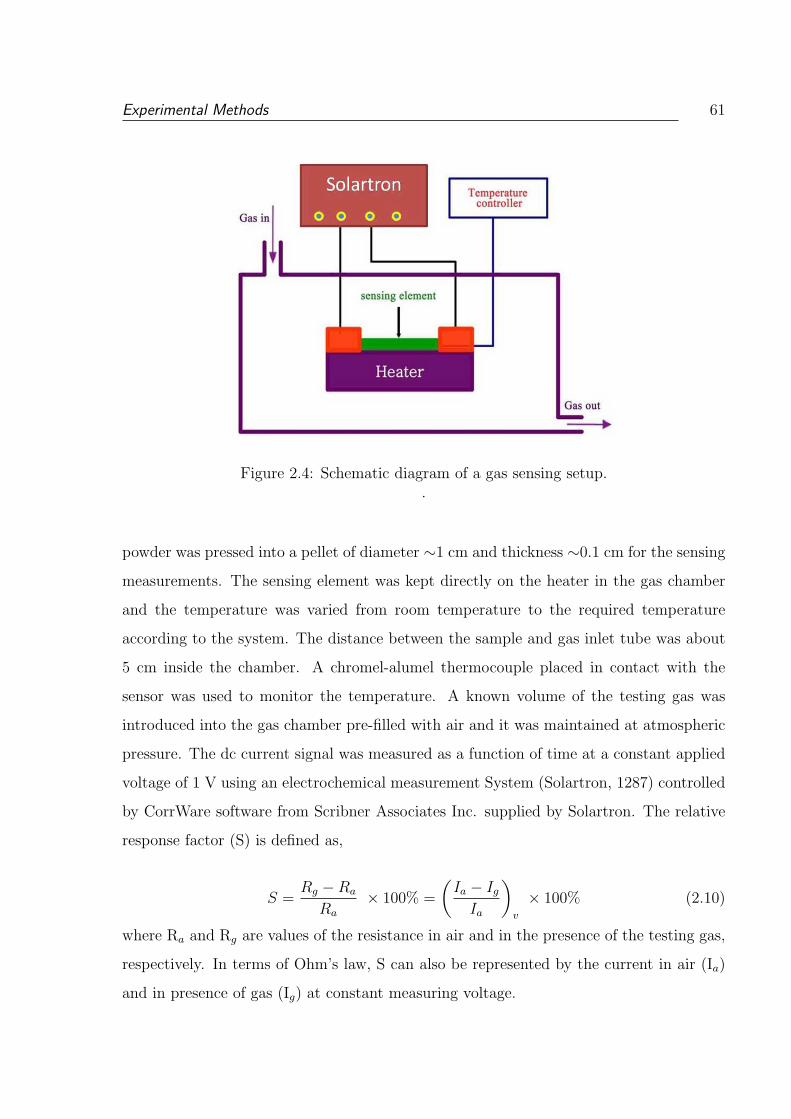
Experimental Methods 61
Figure 2.4: Schematic diagram of a gas sensing setup..
powder was pressed into a pellet of diameter ∼1 cm and thickness ∼0.1 cm for the sensing
measurements. The sensing element was kept directly on the heater in the gas chamber
and the temperature was varied from room temperature to the required temperature
according to the system. The distance between the sample and gas inlet tube was about
5 cm inside the chamber. A chromel-alumel thermocouple placed in contact with the
sensor was used to monitor the temperature. A known volume of the testing gas was
introduced into the gas chamber pre-filled with air and it was maintained at atmospheric
pressure. The dc current signal was measured as a function of time at a constant applied
voltage of 1 V using an electrochemical measurement System (Solartron, 1287) controlled
by CorrWare software from Scribner Associates Inc. supplied by Solartron. The relative
response factor (S) is defined as,
S =Rg −Ra
Ra
× 100% =
(Ia − Ig
Ia
)
v
× 100% (2.10)
where Ra and Rg are values of the resistance in air and in the presence of the testing gas,
respectively. In terms of Ohm’s law, S can also be represented by the current in air (Ia)
and in presence of gas (Ig) at constant measuring voltage.
Experimental Methods 62
2.2.10 Electrochemical measurements
Cyclic voltammetry (CV) is an effective tool to study the different electrochemical pro-
cesses (faradaic and non-faradaic) associated with an electrode material [43, 44]. It can
be used to study the electrochemical behavior of species diffusing to an electrode surface,
interfacial phenomena at an electrode surface, and bulk properties of materials in or on
electrodes. In CV, normally three electrode systems are in common practice although
two electrode systems can also be used. In three electrode systems the potential is ap-
plied between working electrode and reference electrode while the current is measured in
between the working electrode and the counter electrode. To tackle with large currents,
normally counter electrode will be with very high surface area.
In the present study all the electrochemical work related to CV and impedance mea-
surements were carried out on both Autolab 30 PGSTAT and Solartron instruments.
Charge-discharge experiments were carried out on a home made galvanostatic set up with
a Keithley 6514 electrometer and 2010 multimeter connected in series with a variable
resistance box.
References
[1] C.N.R. Rao, Chemical Approaches to the Synthesis of Inorganic Materials, Wiley
Eastern Ltd., New Delhi., 1994.
[2] A.S. Edelstein, R.C. Cammarata, Nanomaterials: Synthesis, Properties, and
Applications, Taylor & Francis, 1998.
[3] G.A. Ozin, A.C. Arsenault, Nanochemistry: A Chemical Approach to Nanoma-
terials, Royal Society of Chemistry, 2005.
[4] G. Cao, Nanostructures & Nanomaterials: Synthesis, Properties & Applications,
Imperial College Press, 2004.
[5] D. Segal, Chemical Synthesis of Advanced Ceramic Materials, Cambridge Univ
Press, 1991.
[6] J.P. Jolivet, Metal Oxide Chemistry and Synthesis: From Solution to Solid State,
Wiley, New York, 2000.
[7] K.C. Patil, Chemistry of Nanocrystalline Oxide Materials: Combustion Synthe-
sis, Properties and Applications, World Scientific Pub Co Inc, 2008.
[8] D. Segal, J. Mater. Chem. 7 (1997) 1297.
[9] B.L. Cushing, V.L. Kolesnichenko, C.J. O’Connor, Chem. Rev. 104 (2004) 3893.
[10] O. Masala, R. Seshadri, Annu. Rev. Mater. Res. 34 (2004) 41.
[11] T.A. Ring, Fundamentals of Ceramic Powder Processing and Synthesis, Aca-
demic Press, 1996.
[12] A.E. Nielsen, Kinetics of Precipitation, Pergamon, 1964.
References 64
[13] H. Furedi-Milhofer, Pure Appl. Chem. 53 (1981) 2041.
[14] J.A. Dirksen, T.A. Ring, Chem. Eng. Sci. 46 (1991) 2389.
[15] I.M. Lifshitz, V.V. Slyozov, J. Phys. Chem. Solids. 19 (1961) 35.
[16] R.M. Tromp, J.B. Hannon, Surf. Rev. Lett. 9 (2002) 1565.
[17] J.J. Moore, H.J. Feng, Prog. Mater. Sci. 39 (1995) 243.
[18] J.J. Moore, H.J. Feng, Prog. Mater. Sci. 39 (1995) 275.
[19] K.C. Patil, S.T. Aruna, S. Ekambaram, Current Opinion Solid State Mater. Sci.
2 (1997) 158.
[20] K.C. Patil, S.T. Aruna, T. Mimani, Current Opinion Solid State Mater. Sci. 6
(2002) 507.
[21] R.D. Purohit, B.P. Sharma, K.T. Pillai, A.K. Tyagi, Mater. Res. Bull. 36 (2001)
2711.
[22] Y. Xijuan, X. Pingbo, S. Qingde, Phys. Chem. Chem. Phys. 3 (2001) 5266.
[23] C.C. Hwang, J.S. Tsai, T.H. Huang, Mater. Chem. Phys. 93 (2005) 330.
[24] G. Avgouropoulos, T. Ioannides, Appl. Catal. A 244 (2003) 155.
[25] J.J. Kingsley, K.C. Patil, Mater. Lett. 6 (1988) 427.
[26] Y. Han, S. Li, X. Wang, X. Chen, Mater. Res. Bull. 39 (2004) 25.
[27] Z. Yue, L. Li, J. Zhou, H. Zhang, Z. Gui, Mater. Sci. Eng. B 64 (1999) 68.
[28] J. Zhang, L. Gao, Mater. Res. Bull. 39 (2004) 2249.
[29] L.A. Chick, L.R. Pederson, G.D. Maupin, J.L. Bates, L.E. Thomas, G.J.
Exarhos, Mater. Lett. 10 (1990) 6.
[30] B.D. Cullity, S.R. Stock, Elements of X-Ray Diffraction, Addison-Wesley Read-
ing, MA, 1978.
References 65
[31] H.P. Klug, L.E. Alexander, X-Ray Diffraction Procedures, Wiley New York,
1954.
[32] The software is freely available from http://www.ccp14.ac.uk.
[33] D.B. Williams, C.B. Carter, The Transmission Electron Microscopy: A Text
Book for Materials Science, Springer 2 nd edition , 2009.
[34] M. De Graef, Introduction to Conventional Transmission Electron Microscopy,
Cambridge Univ Press, 2003.
[35] B.H. Stuart, Infrared spectroscopy: Fundamentals and Applications, Wiley, 2004.
[36] D.L. Pavia, G.M. Lampman, G.S. Kriz, Introduction to Spectroscopy,
Brooks/Cole Pub Co, 2009.
[37] J.F. Watts, J. Wolstenholme, An Introduction to Surface Analysis by XPS and
AES, John Wolstenholme, 2003.
[38] G.A. Somorjai, A.S. Mujumdar, Introduction to Surface Chemistry and Cataly-
sis, Wiley New York, 1994.
[39] S. Lowell, Characterization of Porous Solids and Powders: Surface Area, Pore
Size, and Density, Springer, 2004.
[40] H.H. Willard, L.L. Merrit, J.A. Dean, F.A. Settle, Instrumental Methods of
Analysis, CBS Publishers & Distributers, New Delhi, 1986.
[41] B.D. Cullity, C.D. Graham, Introduction to Magnetic Materials, Wiley-IEEE
Press, 2008.
[42] S. Foner, Rev. Sci. Inst. 30 (1959) 548.
[43] A.J. Bard, L.R. Faulkner, Electrochemical Methods, Wiley New York, 2001.
[44] J.F. Rusling, S.L. Suib, Adv. Mater. 6 (2004) 922.
Chapter 3
Synthesis, Characterization, andApplications of NanostructuredCo3O4 and ZnCo2O4
3.1 Nanostructured Co3O4
Among the transition metal oxides, cobalt oxide (Co3O4), an important magnetic p-
type semiconductor, has received considerable attention in the past few years due to
its application potential in many technological areas such as heterogeneous catalysis,
anode material in lithium rechargeable batteries, sensors, electrochromic devices, solar
energy absorber, etc. [1–5]. However, morphology-controlled synthesis of Co3O4 is a
great challenge in materials science and its physical and chemical properties are greatly
dependent of its size and shape. Therefore, a lot of research is being carried out to develop
facile, environmental friendly, rational synthetic approaches to achieve better control over
composition and nanostructures having directed pore size distribution. Also, synthesis
of Co3O4 nanostructures, without the use of templates or surfactants, is again an urgent
need since it can eliminate the cost and contamination due to the surfactants, avoiding
complicated processes of operation and impurities in the final product, apart from the
environmental impact.
Both p-type and n-type semiconductors are well known for their gas sensing properties.
Carbon monoxide (CO) is one of the most harmful pollutants, which poses significant
health risks [6–8]. Studies have shown that it interacts with the haemoglobin and damages
the human body by producing a reduction in cellular respiration [9]. This aspect has
stimulated considerable interest and scientific research, in recent years, to develop a simple
and cost-effective chemical sensor for the detection of CO. Many efforts, in this field, are
Nanostructured Co3O4 and ZnCo2O4 67
today devoted to the synthesis of novel sensing materials with enhanced performance
[6, 9–12]. Metal oxide semiconductors have been widely investigated in the past decades
as gas sensing materials because of their low cost and power consumption, simplicity of
fabrication and use, versatility in detecting a wide range of toxic/flammable gases, and
stability in harsh environments [13,14]. The metal oxide semiconductors such as SnO2 [9],
In2O3 [10] and ZnO [15] have been investigated as CO sensing materials.
Recent studies revealed that nanostructured metal oxides with reduced dimensionality
(i.e. in the form of nanoparticles, nanorods, nanotubes, nanowires and nanoribbons) have
ultrahigh sensitivity to different gases due to their small grain size and large surface-to-
volume ratio [16–21]. Various nanostructured metal oxides like CdO nanoparticles [16],
α-Fe2O3 nanorods [17], SnO2 nanotubes [18], In2O3 nanowires [19], CuO nanoribbons [20]
and ZnO nanorods [21] have been evaluated as gas sensing materials during the past few
years. There are only few studies reported on the gas sensing properties of nanostruc-
tured Co3O4 [3, 22]. A two-step polyol process to synthesize nanostructured Co3O4 with
different morphologies such as nanoplates, well-organized cabbage like structures and mi-
crospherical composites was reported recently by Cao et al [22]. The authors investigated
the CO and alcohol sensing properties of the synthesized nanostructured Co3O4. The
synthesized nanostructured Co3O4 exhibited good sensitivity (>8-50 ppm), response and
recovery times (<10 s), remarkable selectivity and high stability to alcohol at an oper-
ating temperature of 300 C. However, it was found to be insensitive to 50 ppm CO at
300 C and the resistance change was still at a much lower level for 1000 ppm of CO. Li
et al [3] prepared Co3O4 nanotubes by thermal decomposition of Co(NO3)2.6H2O within
an ordered porous alumina template and investigated the gas sensing characteristics of
these nanotubes exposed to H2 and alcohol. The prepared Co3O4 nanotubes exhibited
excellent sensitivity to hydrogen and alcohol at room temperature.
Similarly, Co3O4 is very well known for its use as a catalyst in various reactions such
as CO and hydrocarbon oxidation [2,23–25], Fischer-Tropsch synthesis [26], NO decompo-
sition [27], H2O2 decomposition [28], etc. Oxidation is one of the most important process
step for producing fine chemicals from petroleum and vegetable feedstocks [29]. Selective
oxidation of hydroxyl group of alcohols to aldehyde is the most common step in oxida-
tion reactions, and varieties of techniques for carrying out this reaction are known [30].
Nanostructured Co3O4 and ZnCo2O4 68
Oxidation products of alcohols such as aldehydes and carboxylic acids are versatile inter-
mediates in a variety of synthetic transformation in organic synthesis. For the oxidation
reactions, in general, the stoichiometric oxidants such as permanganate and dichromate
are being used. But their usage has to be avoided since they are expensive, toxic and
produce large amounts of waste [23, 31]. Therefore, use of molecular oxygen is preferred
as an environmentally acceptable, selective and strong oxidant for liquid-phase oxidation
reactions. In the case of oxidation reactions, heterogeneous catalytic oxidation is more
acceptable because of inherent advantages of ease of separation, recovery, recycling, and
amenability for continuous processing as compared to the homogeneous counterparts [32].
This section describes the synthesis and characterization of a molecular precursor
cobalt hydroxy carbonate having controlled rod shaped morphological features. The cor-
responding oxide, Co3O4, was formed with same morphological features as that of the pre-
cursor after calcination in air. The techniques such as microanalysis (MA), thermogravi-
metric analysis (TGA), X-Ray diffraction (XRD), high resolution transmission electron
microscopy (HRTEM), Brunauer-Emmet-Teller (BET) surface area, X-Ray photoelectron
spectroscopy (XPS), infrared (IR) and magnetic measurements have been employed for
the characterization of the material. The as-prepared cobalt oxide in the form of nanorods
was tested for the gas sensing properties as well as in catalytic oxidation reactions.
3.1.1 Molecular Precursor Cobalt Hydroxy Carbonate
Remarkable progress for synthesizing Co3O4 nanostructures with various morphologies
have been reported in the literature [33–35]. There are several chemical methods avail-
able for the synthesis of Co3O4 nanostructures, including microemulsion [36], spray pyroly-
sis [37], hydrothermal [38], reduction/oxidation route [39], homogeneous or heterogeneous
precipitation of precursor particles [40–44] followed by calcination in air, etc. Among all
the reported methods, synthesis of novel nanostructures from coprecipitated molecular
precursors is a very convenient method, which can help to control the morphology of
nanostructures of Co3O4 by precipitating a suitable precursor with desired morphologies.
For the synthesis of Co3O4, cobalt hydroxy carbonate is a desirable precursor, as no toxic
byproducts are liberated during its pyrolysis in air [45, 46]. In most of the reported pre-
cipitation routes to obtain cobalt hydroxy carbonate precursor, cobalt nitrate/chloride
Nanostructured Co3O4 and ZnCo2O4 69
solution is added to a solution containing excess precipitants like sodium carbonate, am-
monium carbonate, sodium bicarbonate, a mixture of sodium carbonate and sodium hy-
droxide, etc, or vice versa to get the pH in the range of 7-9 [40–44]. Therefore, initial
drastic pH variation during precipitation can not be avoided.
The existence of heterogeneous equilibria in the Co(NO3)2-Na2CO3-H2O system [47,48]
governs the characteristics of the precipitated cobalt hydroxy carbonate. The main prob-
lems/difficulties associated with the precipitation reaction are [43–46]: i) the samples
synthesized at room temperature have poor crystallinity, ii) the spherical monodispersed
nanosized particles produced during precipitation tend to aggregate randomly, iii) if cobalt
nitrate and ammonium carbonate are used as starting chemicals then soluble complexes
of the type [Co(NH)3]2+ are formed if pH > 8, iv) if Co(NO3)2 and Na2CO3 solutions
are mixed together to precipitate cobalt hydroxy carbonate, then, depending on the con-
ditions of coprecipitation, the precursors with different OH−/CO2−3 ratios are obtained,
and v) there is possibility of precipitation of Co(OH)xCl2−x.nH2O or chloride containing
carbonates of the type Co(OH)xCly(CO3)0.5(2−x−y).nH2O along with cobalt hydroxy car-
bonate if proper pH is not maintained during precipitation and when cobalt chloride is
used as the starting chemical during precipitation. Therefore, it is very important to per-
form a precipitation reaction with a suitable starting material and in a controlled manner
to avoid the problems described above and to optimize the synthesis conditions to get
precursors with reproducible properties. By this way, one can avoid the drastic change in
the pH during the precipitation reaction [49]. Another important aspect to be taken into
consideration is the formation of nanomaterials with high porosity and with specific mor-
phology for many technological applications like sensors [50, 51], Li-ion batteries [52, 53],
catalysis [54, 55], solar cells [56], etc. For the synthesis of the precursor, cost effective
and pollutant free methods are preferred. Template free method which involves the ori-
ental attachment of particles, in a desired manner, is a right alternative [57,58]. Oriental
attachment of nanocrystalline particles can be obtained by controlled aggregation [59].
Therefore, optimization of synthesis condition is a crucial step to get the desired precursor
with controlled morphology.
Coprecipitation/digestion method has been reported for the synthesis of nanocrytalline
oxides [49, 60, 61]. It helps to enhance the solubility product of the cations during pre-
Nanostructured Co3O4 and ZnCo2O4 70
cipitation, to a limited extent. As a result of the better solubility products of the cation,
improvement in the crystallinity can be attained for the material at a much lower temper-
ature with controlled physical and chemical characteristics by the controlled aggregation
process. Otherwise, the product formed is reported to be amorphous [60,61].
From the solubility diagram reported by Lewis et al [48], in the case of cobalt-water-
carbonate system, water-free cobalt carbonate is precipitated above 160 C. However,
cobalt hydroxy carbonate is preferentially precipitated at room temperature in the pH
range 7.5-9.0. It has been reported that the cobalt hydroxy carbonate precursor par-
ticles are not well crystallized at room temperature [43]. Considering these reported
observations, co-precipitation/digestion has been carried out at 70 C in the pH range
of 7–8. The pH range has been selected in such a way that supersaturation leads to
homogeneous fast nucleation with controlled growth of particles. Synthesis of the metal-
hydroxide-carbonates usually involves precipitation reaction at a constant pH in the range
of 7–9 [41,42,44].
3.1.2 Synthesis
Nanocrystalline Co3O4 powder was synthesized by the coprecipitation/digestion method
as described in section 2.1.1. Analytical grade Co(NO3)2.6H2O and K2CO3 were used as
the starting materials. Initially, 200 ml of distilled water was taken in a three-necked round
bottom flask (RBF) and purged with argon gas for 1 hour to remove the excess oxygen
present. The distilled water was then slowly heated to 70 C on a heating mantle. Burettes
having equal volume of water solutions of Co(NO3)2 (0.0339 M) and K2CO3 (0.0627 M)
were connected on the two necks of the RBF, while a water condenser was connected
to the third neck. The two solutions were added simultaneously to the water heated in
the RBF. Concentrations of the acidic and basic solutions were calibrated through trial
experiments for maintaining the pH in the range 7–8. The precipitate obtained after
completion of addition was digested in the mother liquor, at the same temperature, for 8
hours. The precipitate formed was thoroughly washed with distilled water, several times,
to avoid K+ ion contamination and further dried in an oven at 70 C and labeled as CC-A.
The as-prepared precursor CC-A was calcined at different temperatures at 300 C
(CC-300), 500 C (CC-500), 600 C (CC-600) and 750 C (CC-750) for 5 hours each
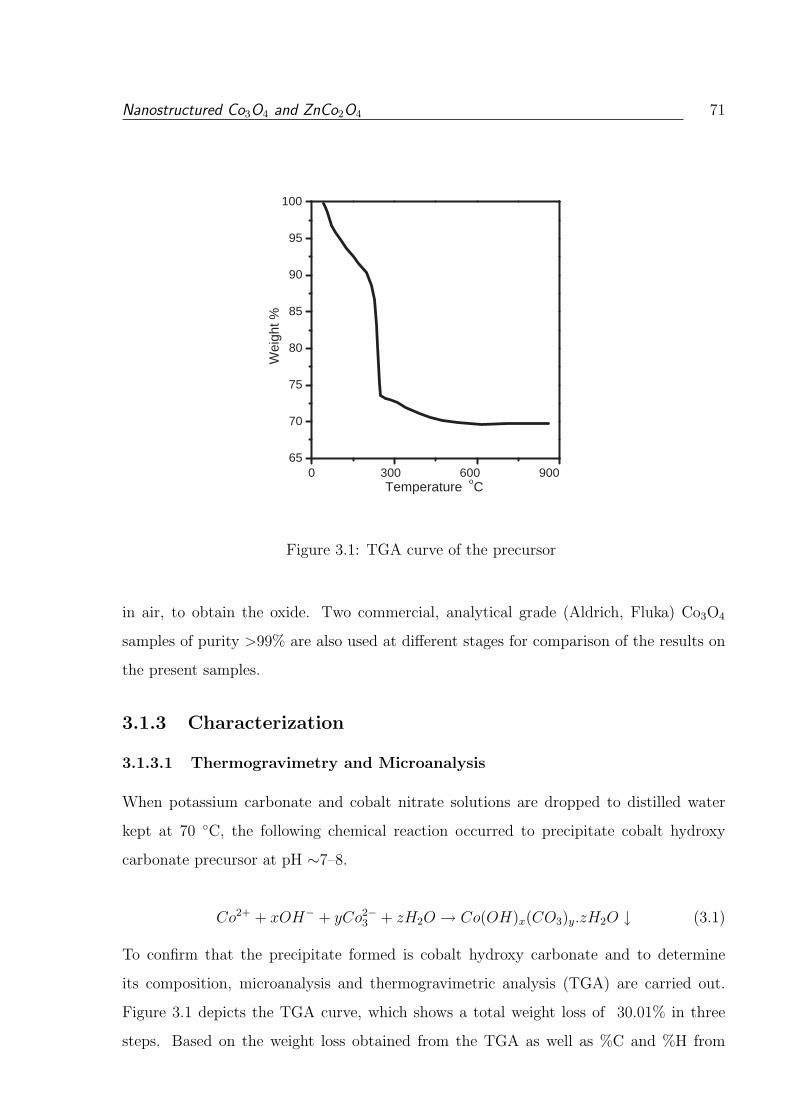
Nanostructured Co3O4 and ZnCo2O4 71
0 300 600 900 65
70
75
80
85
90
95
100
W
eigh
t %
Temperature o C
Figure 3.1: TGA curve of the precursor
in air, to obtain the oxide. Two commercial, analytical grade (Aldrich, Fluka) Co3O4
samples of purity >99% are also used at different stages for comparison of the results on
the present samples.
3.1.3 Characterization
3.1.3.1 Thermogravimetry and Microanalysis
When potassium carbonate and cobalt nitrate solutions are dropped to distilled water
kept at 70 C, the following chemical reaction occurred to precipitate cobalt hydroxy
carbonate precursor at pH ∼7–8.
Co2+ + xOH− + yCo2−3 + zH2O → Co(OH)x(CO3)y.zH2O ↓ (3.1)
To confirm that the precipitate formed is cobalt hydroxy carbonate and to determine
its composition, microanalysis and thermogravimetric analysis (TGA) are carried out.
Figure 3.1 depicts the TGA curve, which shows a total weight loss of 30.01% in three
steps. Based on the weight loss obtained from the TGA as well as %C and %H from
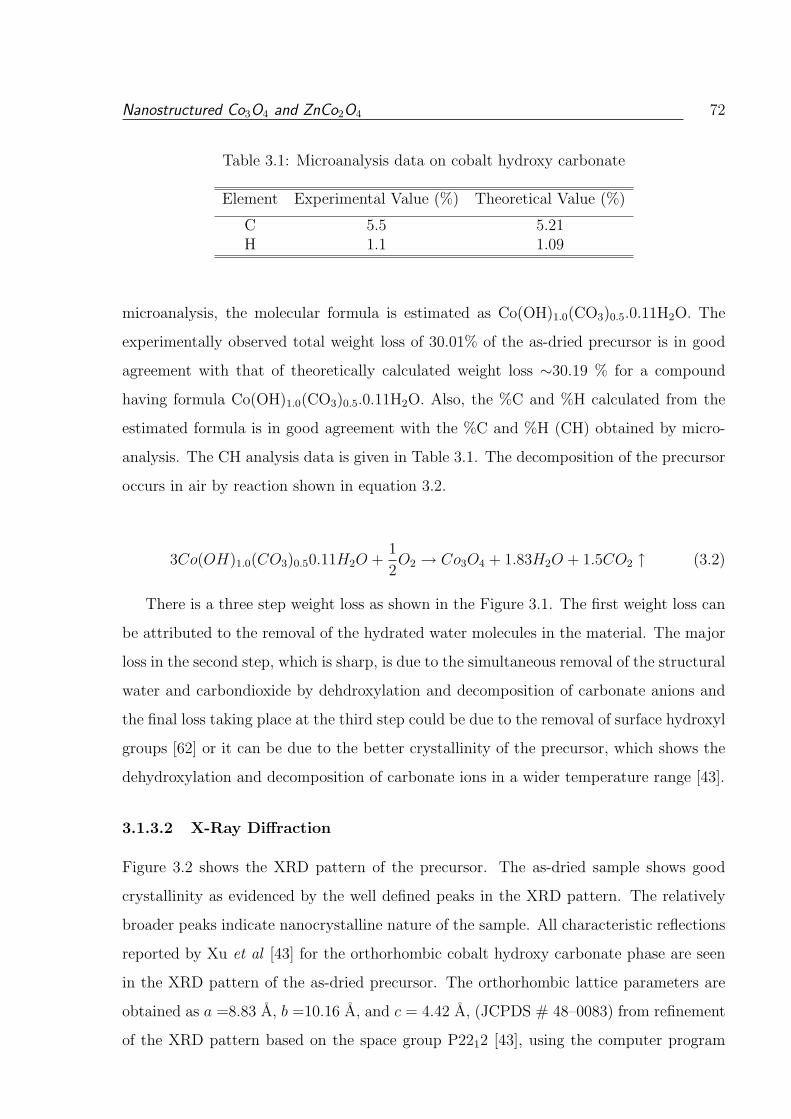
Nanostructured Co3O4 and ZnCo2O4 72
Table 3.1: Microanalysis data on cobalt hydroxy carbonate
Element Experimental Value (%) Theoretical Value (%)
C 5.5 5.21H 1.1 1.09
microanalysis, the molecular formula is estimated as Co(OH)1.0(CO3)0.5.0.11H2O. The
experimentally observed total weight loss of 30.01% of the as-dried precursor is in good
agreement with that of theoretically calculated weight loss ∼30.19 % for a compound
having formula Co(OH)1.0(CO3)0.5.0.11H2O. Also, the %C and %H calculated from the
estimated formula is in good agreement with the %C and %H (CH) obtained by micro-
analysis. The CH analysis data is given in Table 3.1. The decomposition of the precursor
occurs in air by reaction shown in equation 3.2.
3Co(OH)1.0(CO3)0.50.11H2O +1
2O2 → Co3O4 + 1.83H2O + 1.5CO2 ↑ (3.2)
There is a three step weight loss as shown in the Figure 3.1. The first weight loss can
be attributed to the removal of the hydrated water molecules in the material. The major
loss in the second step, which is sharp, is due to the simultaneous removal of the structural
water and carbondioxide by dehdroxylation and decomposition of carbonate anions and
the final loss taking place at the third step could be due to the removal of surface hydroxyl
groups [62] or it can be due to the better crystallinity of the precursor, which shows the
dehydroxylation and decomposition of carbonate ions in a wider temperature range [43].
3.1.3.2 X-Ray Diffraction
Figure 3.2 shows the XRD pattern of the precursor. The as-dried sample shows good
crystallinity as evidenced by the well defined peaks in the XRD pattern. The relatively
broader peaks indicate nanocrystalline nature of the sample. All characteristic reflections
reported by Xu et al [43] for the orthorhombic cobalt hydroxy carbonate phase are seen
in the XRD pattern of the as-dried precursor. The orthorhombic lattice parameters are
obtained as a =8.83 A, b =10.16 A, and c = 4.42 A, (JCPDS # 48–0083) from refinement
of the XRD pattern based on the space group P2212 [43], using the computer program
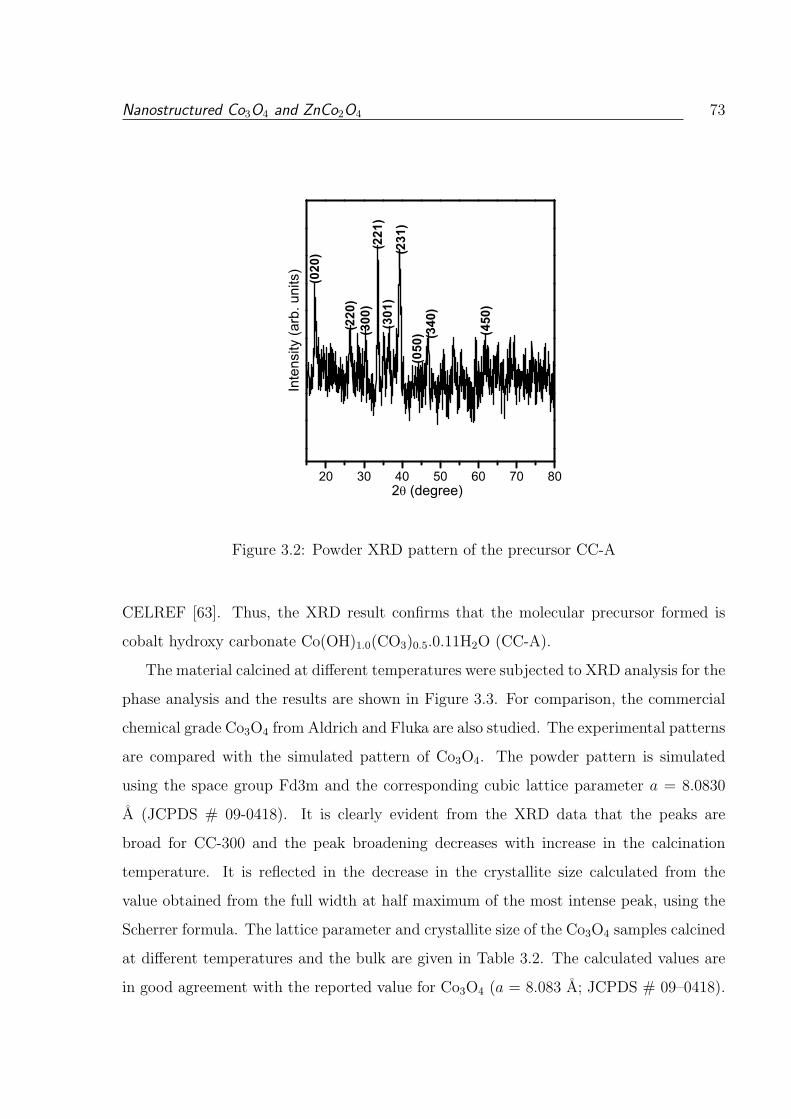
Nanostructured Co3O4 and ZnCo2O4 73
20 30 40 50 60 70 80
(301
)
(450
)
(220
)(300
)(221
)
(231
)(050
) (340
)
(020
)In
tens
ity (a
rb. u
nits
)
2 (degree)
Figure 3.2: Powder XRD pattern of the precursor CC-A
CELREF [63]. Thus, the XRD result confirms that the molecular precursor formed is
cobalt hydroxy carbonate Co(OH)1.0(CO3)0.5.0.11H2O (CC-A).
The material calcined at different temperatures were subjected to XRD analysis for the
phase analysis and the results are shown in Figure 3.3. For comparison, the commercial
chemical grade Co3O4 from Aldrich and Fluka are also studied. The experimental patterns
are compared with the simulated pattern of Co3O4. The powder pattern is simulated
using the space group Fd3m and the corresponding cubic lattice parameter a = 8.0830
A (JCPDS # 09-0418). It is clearly evident from the XRD data that the peaks are
broad for CC-300 and the peak broadening decreases with increase in the calcination
temperature. It is reflected in the decrease in the crystallite size calculated from the
value obtained from the full width at half maximum of the most intense peak, using the
Scherrer formula. The lattice parameter and crystallite size of the Co3O4 samples calcined
at different temperatures and the bulk are given in Table 3.2. The calculated values are
in good agreement with the reported value for Co3O4 (a = 8.083 A; JCPDS # 09–0418).
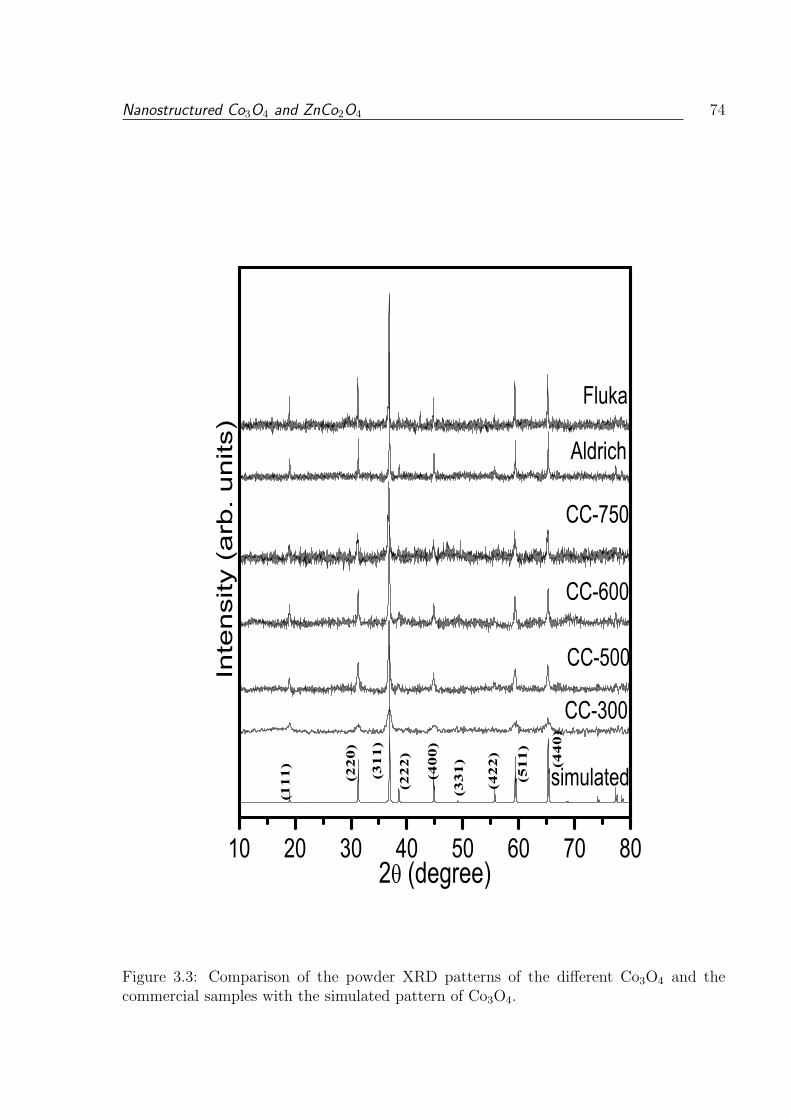
Nanostructured Co3O4 and ZnCo2O4 74
10 20 30 40 50 60 70 80
CC-750
CC-600
CC-500
Fluka
(440)
(511)
(422)
(331)
(400)
(222)
(311)
(220)
(111)
Aldrich
CC-300
simulated
In
ten
sity (
arb
. u
nits)
2 (degree)
Figure 3.3: Comparison of the powder XRD patterns of the different Co3O4 and thecommercial samples with the simulated pattern of Co3O4.
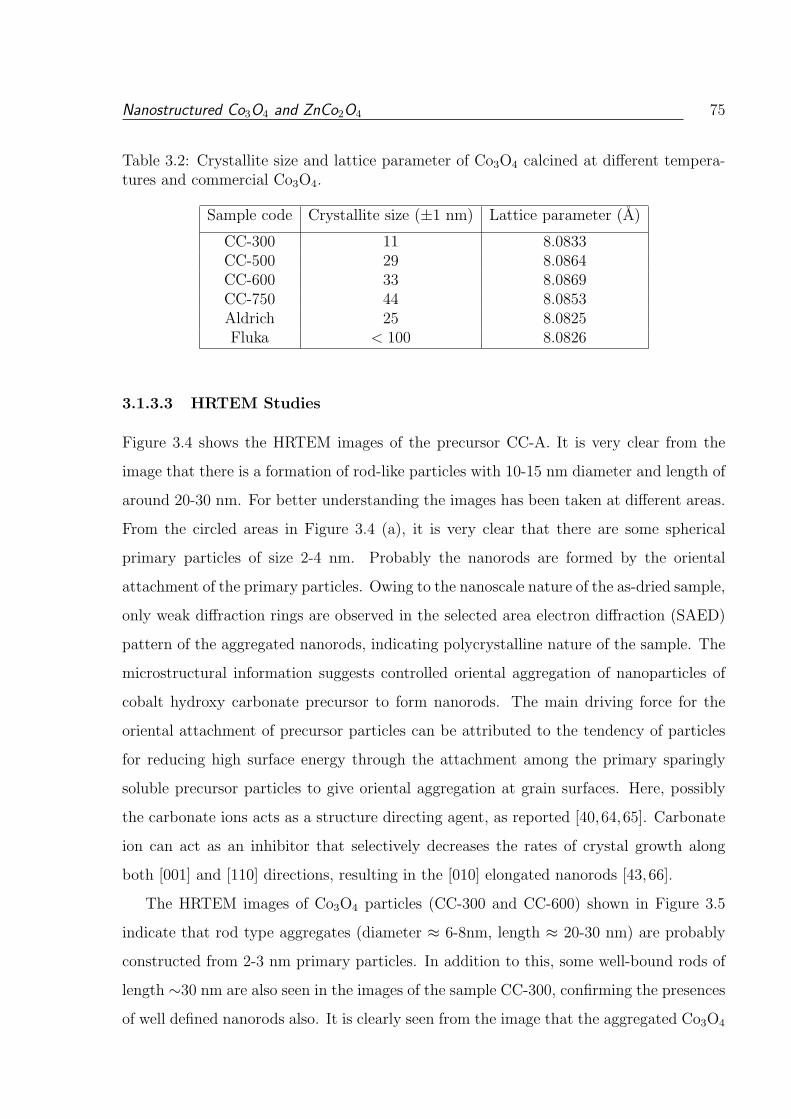
Nanostructured Co3O4 and ZnCo2O4 75
Table 3.2: Crystallite size and lattice parameter of Co3O4 calcined at different tempera-tures and commercial Co3O4.
Sample code Crystallite size (±1 nm) Lattice parameter (A)
CC-300 11 8.0833CC-500 29 8.0864CC-600 33 8.0869CC-750 44 8.0853Aldrich 25 8.0825Fluka < 100 8.0826
3.1.3.3 HRTEM Studies
Figure 3.4 shows the HRTEM images of the precursor CC-A. It is very clear from the
image that there is a formation of rod-like particles with 10-15 nm diameter and length of
around 20-30 nm. For better understanding the images has been taken at different areas.
From the circled areas in Figure 3.4 (a), it is very clear that there are some spherical
primary particles of size 2-4 nm. Probably the nanorods are formed by the oriental
attachment of the primary particles. Owing to the nanoscale nature of the as-dried sample,
only weak diffraction rings are observed in the selected area electron diffraction (SAED)
pattern of the aggregated nanorods, indicating polycrystalline nature of the sample. The
microstructural information suggests controlled oriental aggregation of nanoparticles of
cobalt hydroxy carbonate precursor to form nanorods. The main driving force for the
oriental attachment of precursor particles can be attributed to the tendency of particles
for reducing high surface energy through the attachment among the primary sparingly
soluble precursor particles to give oriental aggregation at grain surfaces. Here, possibly
the carbonate ions acts as a structure directing agent, as reported [40,64,65]. Carbonate
ion can act as an inhibitor that selectively decreases the rates of crystal growth along
both [001] and [110] directions, resulting in the [010] elongated nanorods [43,66].
The HRTEM images of Co3O4 particles (CC-300 and CC-600) shown in Figure 3.5
indicate that rod type aggregates (diameter ≈ 6-8nm, length ≈ 20-30 nm) are probably
constructed from 2-3 nm primary particles. In addition to this, some well-bound rods of
length ∼30 nm are also seen in the images of the sample CC-300, confirming the presences
of well defined nanorods also. It is clearly seen from the image that the aggregated Co3O4
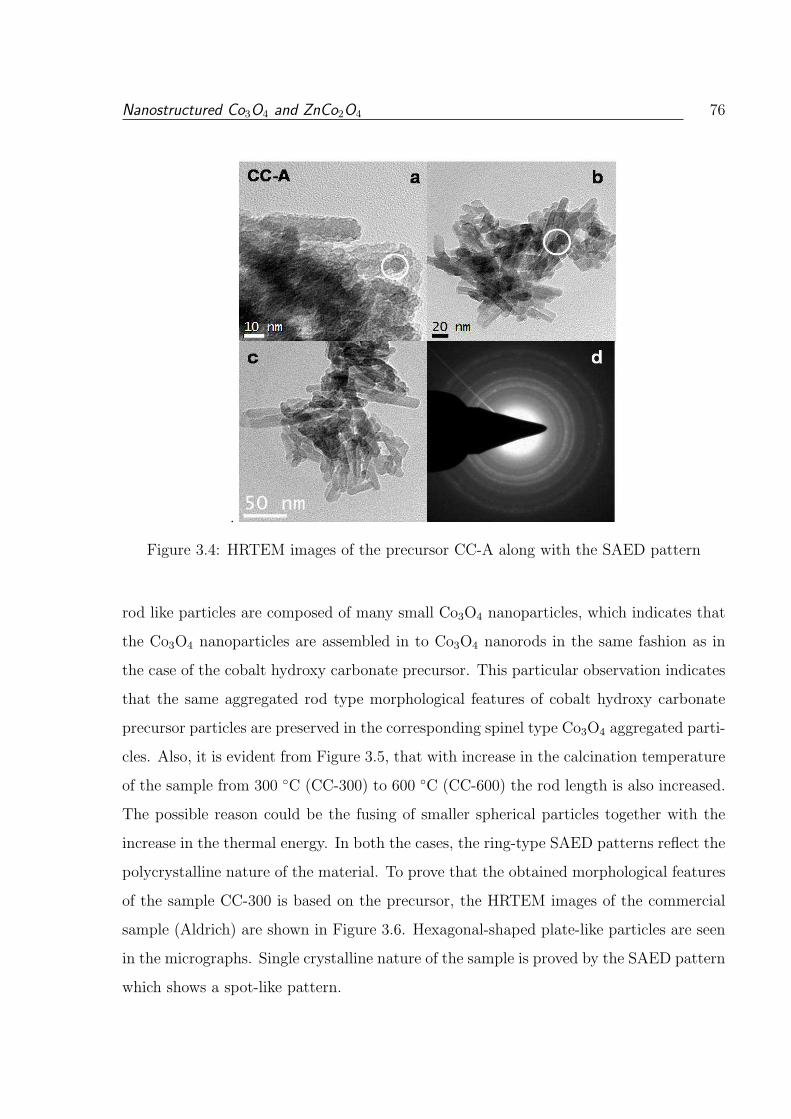
Nanostructured Co3O4 and ZnCo2O4 76
.
Figure 3.4: HRTEM images of the precursor CC-A along with the SAED pattern
rod like particles are composed of many small Co3O4 nanoparticles, which indicates that
the Co3O4 nanoparticles are assembled in to Co3O4 nanorods in the same fashion as in
the case of the cobalt hydroxy carbonate precursor. This particular observation indicates
that the same aggregated rod type morphological features of cobalt hydroxy carbonate
precursor particles are preserved in the corresponding spinel type Co3O4 aggregated parti-
cles. Also, it is evident from Figure 3.5, that with increase in the calcination temperature
of the sample from 300 C (CC-300) to 600 C (CC-600) the rod length is also increased.
The possible reason could be the fusing of smaller spherical particles together with the
increase in the thermal energy. In both the cases, the ring-type SAED patterns reflect the
polycrystalline nature of the material. To prove that the obtained morphological features
of the sample CC-300 is based on the precursor, the HRTEM images of the commercial
sample (Aldrich) are shown in Figure 3.6. Hexagonal-shaped plate-like particles are seen
in the micrographs. Single crystalline nature of the sample is proved by the SAED pattern
which shows a spot-like pattern.
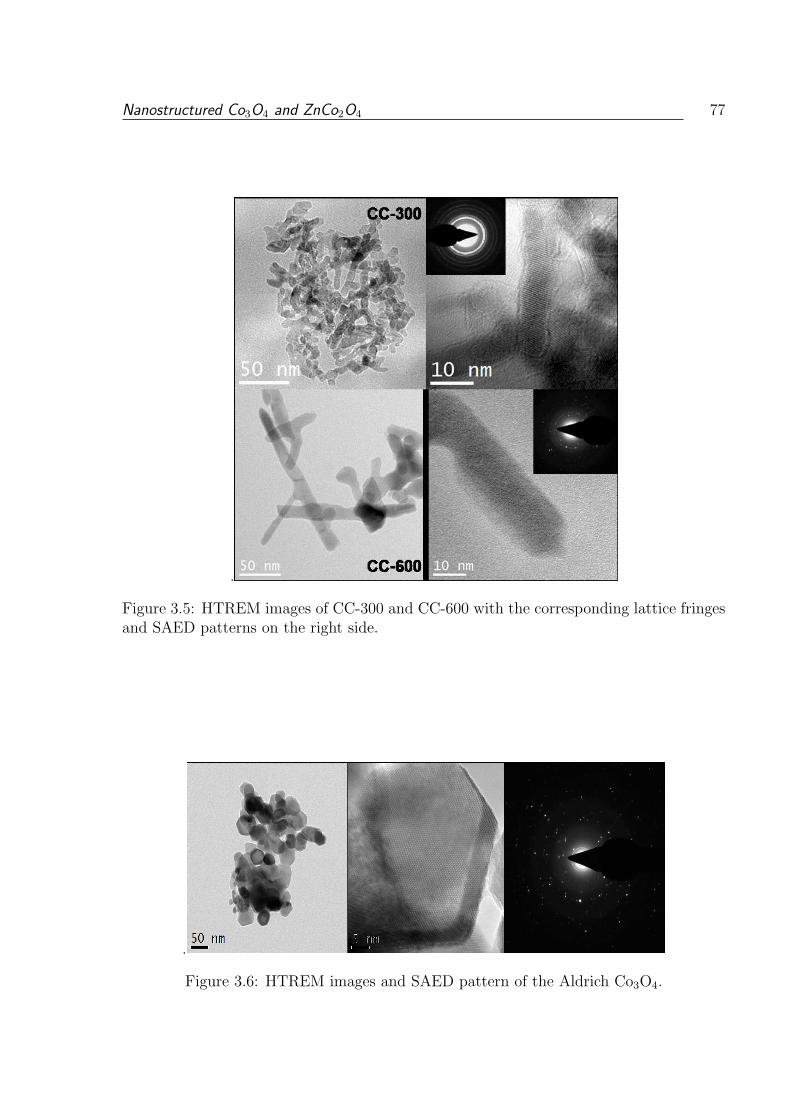
Nanostructured Co3O4 and ZnCo2O4 77
.
Figure 3.5: HTREM images of CC-300 and CC-600 with the corresponding lattice fringesand SAED patterns on the right side.
.
Figure 3.6: HTREM images and SAED pattern of the Aldrich Co3O4.
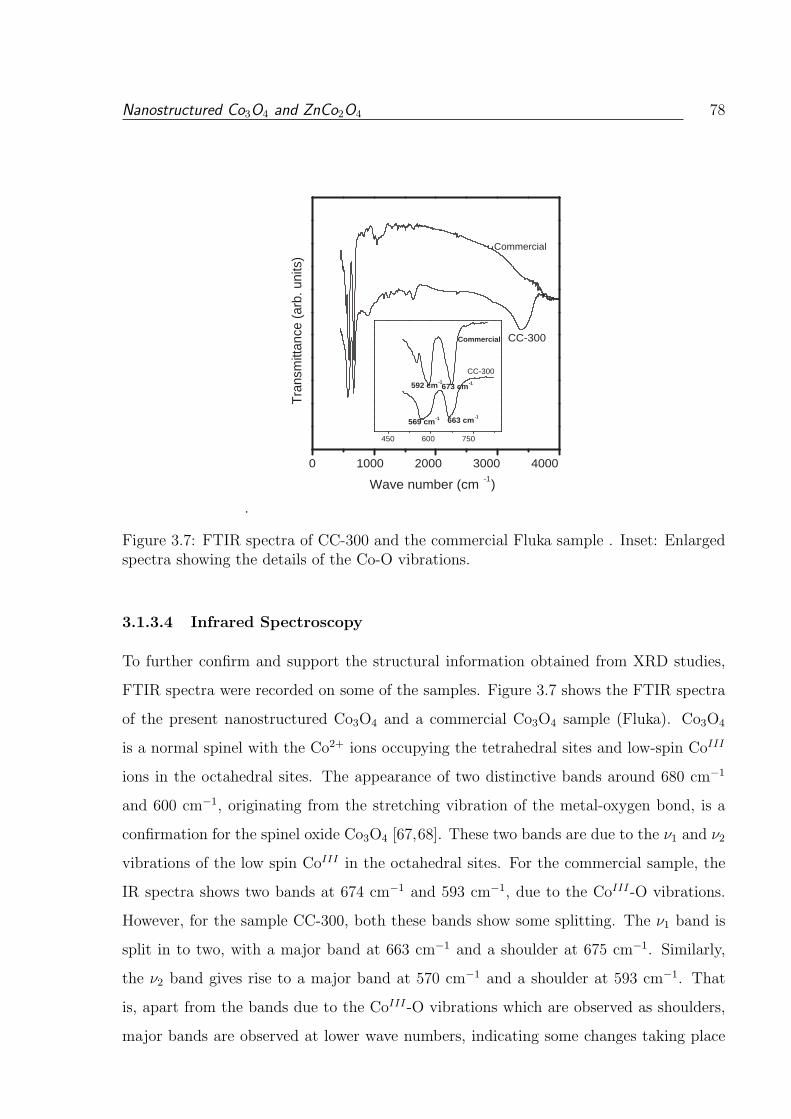
Nanostructured Co3O4 and ZnCo2O4 78
.
0 1000 2000 3000 4000
450 600 750
CC-300
Commercial
Tra
nsm
ittan
ce (
arb.
uni
ts)
Wave number (cm -1 )
673 cm -1 592 cm -1
663 cm -1 569 cm -1
Commercial
CC-300
Figure 3.7: FTIR spectra of CC-300 and the commercial Fluka sample . Inset: Enlargedspectra showing the details of the Co-O vibrations.
3.1.3.4 Infrared Spectroscopy
To further confirm and support the structural information obtained from XRD studies,
FTIR spectra were recorded on some of the samples. Figure 3.7 shows the FTIR spectra
of the present nanostructured Co3O4 and a commercial Co3O4 sample (Fluka). Co3O4
is a normal spinel with the Co2+ ions occupying the tetrahedral sites and low-spin CoIII
ions in the octahedral sites. The appearance of two distinctive bands around 680 cm−1
and 600 cm−1, originating from the stretching vibration of the metal-oxygen bond, is a
confirmation for the spinel oxide Co3O4 [67,68]. These two bands are due to the ν1 and ν2
vibrations of the low spin CoIII in the octahedral sites. For the commercial sample, the
IR spectra shows two bands at 674 cm−1 and 593 cm−1, due to the CoIII-O vibrations.
However, for the sample CC-300, both these bands show some splitting. The ν1 band is
split in to two, with a major band at 663 cm−1 and a shoulder at 675 cm−1. Similarly,
the ν2 band gives rise to a major band at 570 cm−1 and a shoulder at 593 cm−1. That
is, apart from the bands due to the CoIII-O vibrations which are observed as shoulders,
major bands are observed at lower wave numbers, indicating some changes taking place
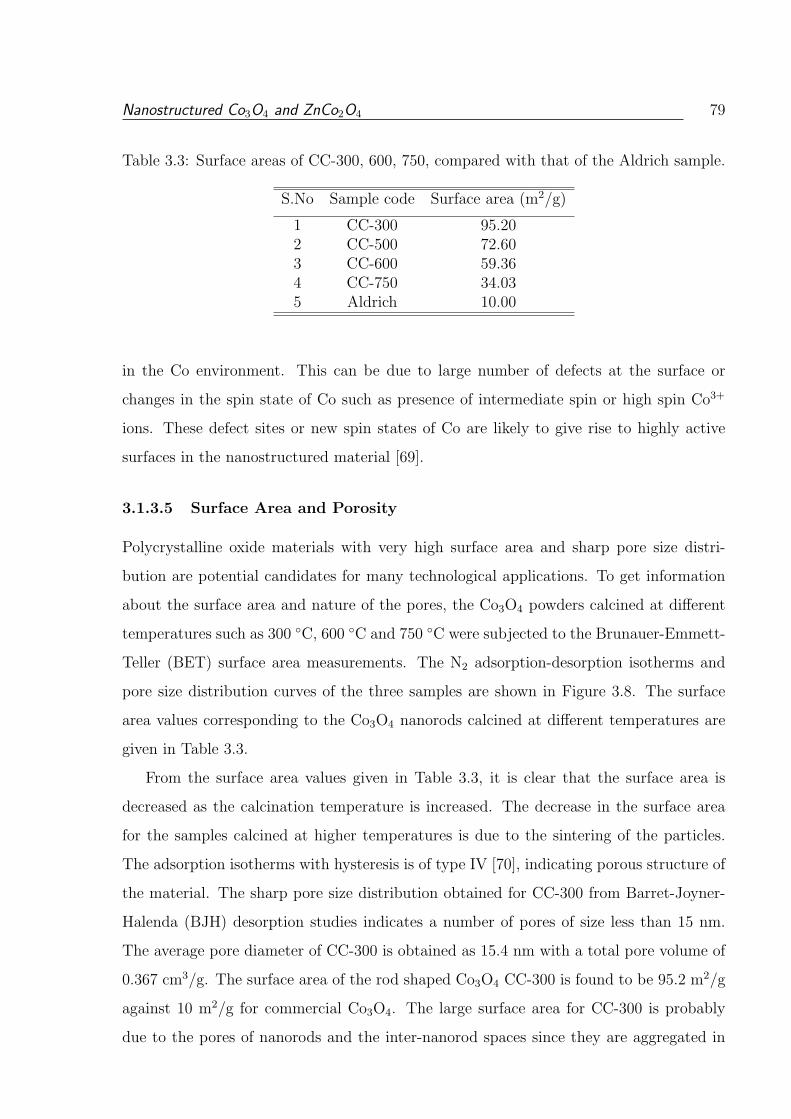
Nanostructured Co3O4 and ZnCo2O4 79
Table 3.3: Surface areas of CC-300, 600, 750, compared with that of the Aldrich sample.
S.No Sample code Surface area (m2/g)
1 CC-300 95.202 CC-500 72.603 CC-600 59.364 CC-750 34.035 Aldrich 10.00
in the Co environment. This can be due to large number of defects at the surface or
changes in the spin state of Co such as presence of intermediate spin or high spin Co3+
ions. These defect sites or new spin states of Co are likely to give rise to highly active
surfaces in the nanostructured material [69].
3.1.3.5 Surface Area and Porosity
Polycrystalline oxide materials with very high surface area and sharp pore size distri-
bution are potential candidates for many technological applications. To get information
about the surface area and nature of the pores, the Co3O4 powders calcined at different
temperatures such as 300 C, 600 C and 750 C were subjected to the Brunauer-Emmett-
Teller (BET) surface area measurements. The N2 adsorption-desorption isotherms and
pore size distribution curves of the three samples are shown in Figure 3.8. The surface
area values corresponding to the Co3O4 nanorods calcined at different temperatures are
given in Table 3.3.
From the surface area values given in Table 3.3, it is clear that the surface area is
decreased as the calcination temperature is increased. The decrease in the surface area
for the samples calcined at higher temperatures is due to the sintering of the particles.
The adsorption isotherms with hysteresis is of type IV [70], indicating porous structure of
the material. The sharp pore size distribution obtained for CC-300 from Barret-Joyner-
Halenda (BJH) desorption studies indicates a number of pores of size less than 15 nm.
The average pore diameter of CC-300 is obtained as 15.4 nm with a total pore volume of
0.367 cm3/g. The surface area of the rod shaped Co3O4 CC-300 is found to be 95.2 m2/g
against 10 m2/g for commercial Co3O4. The large surface area for CC-300 is probably
due to the pores of nanorods and the inter-nanorod spaces since they are aggregated in
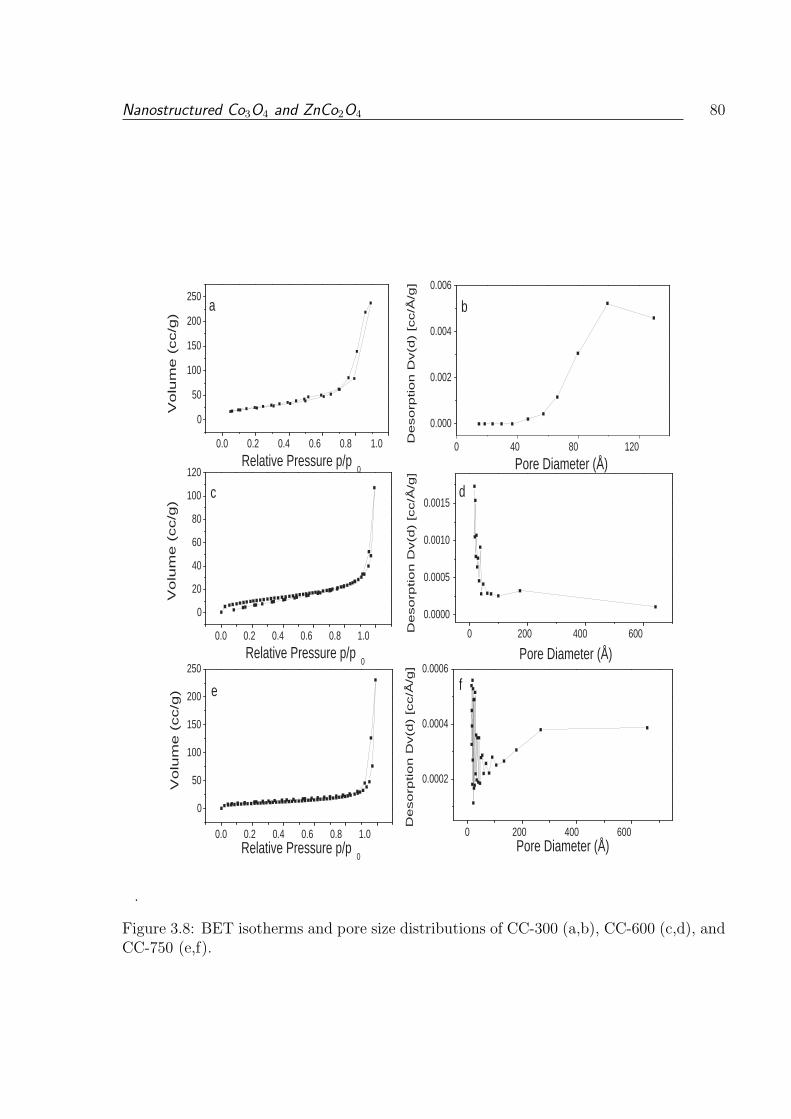
Nanostructured Co3O4 and ZnCo2O4 80
.
0.0 0.2 0.4 0.6 0.8 1.0
0
50
100
150
200
250 b a
De
so
rptio
n D
v(d
) [c
c/Å
/g]
De
so
rptio
n D
v(d
) [c
c/Å
/g]
Vo
lum
e (
cc/g
)
De
so
rptio
n D
v(d
) [c
c/Å
/g]
Vo
lum
e (
cc/g
)
0 40 80 120
0.000
0.002
0.004
0.006
0.0 0.2 0.4 0.6 0.8 1.0
0
20
40
60
80
100
120
c
Vo
lum
e (
cc/g
)
Relative Pressure p/p 0
Relative Pressure p/p 0
0 200 400 600
0.0000
0.0005
0.0010
0.0015 d
Pore Diameter (Å)
Pore Diameter (Å)
0.0 0.2 0.4 0.6 0.8 1.0
0
50
100
150
200
250
e
0 200 400 600
0.0002
0.0004
0.0006
f
Pore Diameter (Å) Relative Pressure p/p 0
Figure 3.8: BET isotherms and pore size distributions of CC-300 (a,b), CC-600 (c,d), andCC-750 (e,f).
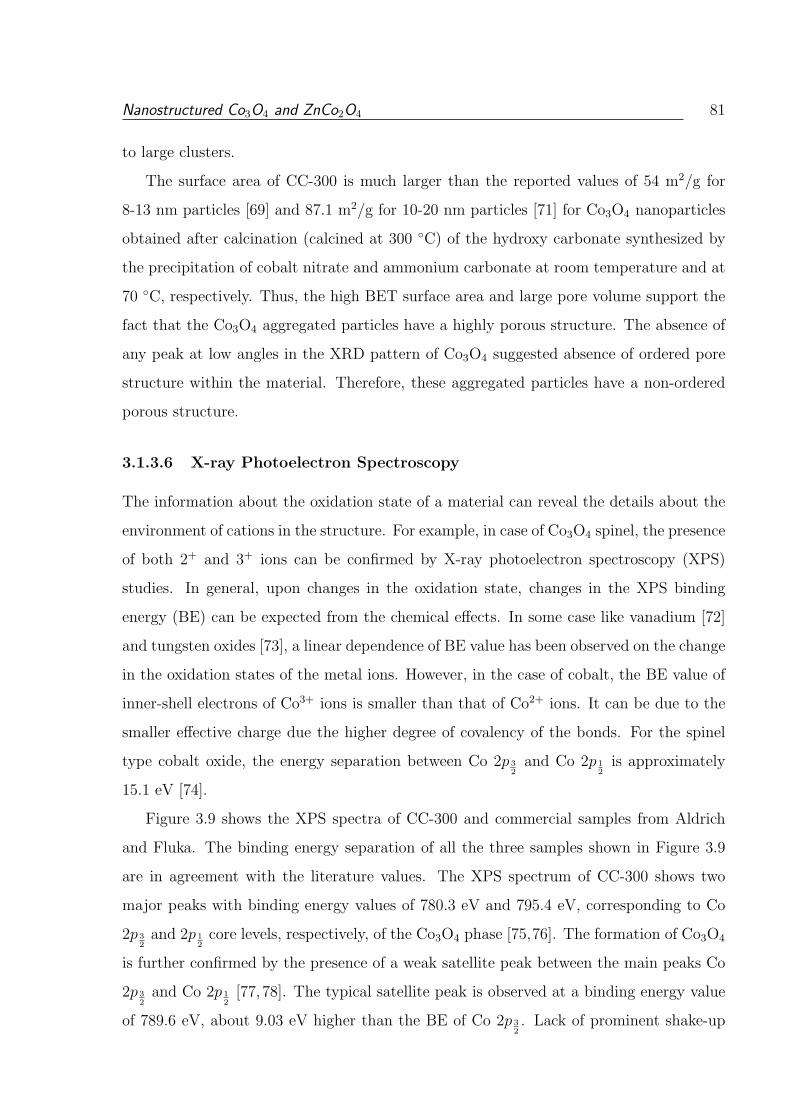
Nanostructured Co3O4 and ZnCo2O4 81
to large clusters.
The surface area of CC-300 is much larger than the reported values of 54 m2/g for
8-13 nm particles [69] and 87.1 m2/g for 10-20 nm particles [71] for Co3O4 nanoparticles
obtained after calcination (calcined at 300 C) of the hydroxy carbonate synthesized by
the precipitation of cobalt nitrate and ammonium carbonate at room temperature and at
70 C, respectively. Thus, the high BET surface area and large pore volume support the
fact that the Co3O4 aggregated particles have a highly porous structure. The absence of
any peak at low angles in the XRD pattern of Co3O4 suggested absence of ordered pore
structure within the material. Therefore, these aggregated particles have a non-ordered
porous structure.
3.1.3.6 X-ray Photoelectron Spectroscopy
The information about the oxidation state of a material can reveal the details about the
environment of cations in the structure. For example, in case of Co3O4 spinel, the presence
of both 2+ and 3+ ions can be confirmed by X-ray photoelectron spectroscopy (XPS)
studies. In general, upon changes in the oxidation state, changes in the XPS binding
energy (BE) can be expected from the chemical effects. In some case like vanadium [72]
and tungsten oxides [73], a linear dependence of BE value has been observed on the change
in the oxidation states of the metal ions. However, in the case of cobalt, the BE value of
inner-shell electrons of Co3+ ions is smaller than that of Co2+ ions. It can be due to the
smaller effective charge due the higher degree of covalency of the bonds. For the spinel
type cobalt oxide, the energy separation between Co 2p 32
and Co 2p 12
is approximately
15.1 eV [74].
Figure 3.9 shows the XPS spectra of CC-300 and commercial samples from Aldrich
and Fluka. The binding energy separation of all the three samples shown in Figure 3.9
are in agreement with the literature values. The XPS spectrum of CC-300 shows two
major peaks with binding energy values of 780.3 eV and 795.4 eV, corresponding to Co
2p 32
and 2p 12
core levels, respectively, of the Co3O4 phase [75,76]. The formation of Co3O4
is further confirmed by the presence of a weak satellite peak between the main peaks Co
2p 32
and Co 2p 12
[77, 78]. The typical satellite peak is observed at a binding energy value
of 789.6 eV, about 9.03 eV higher than the BE of Co 2p 32. Lack of prominent shake-up
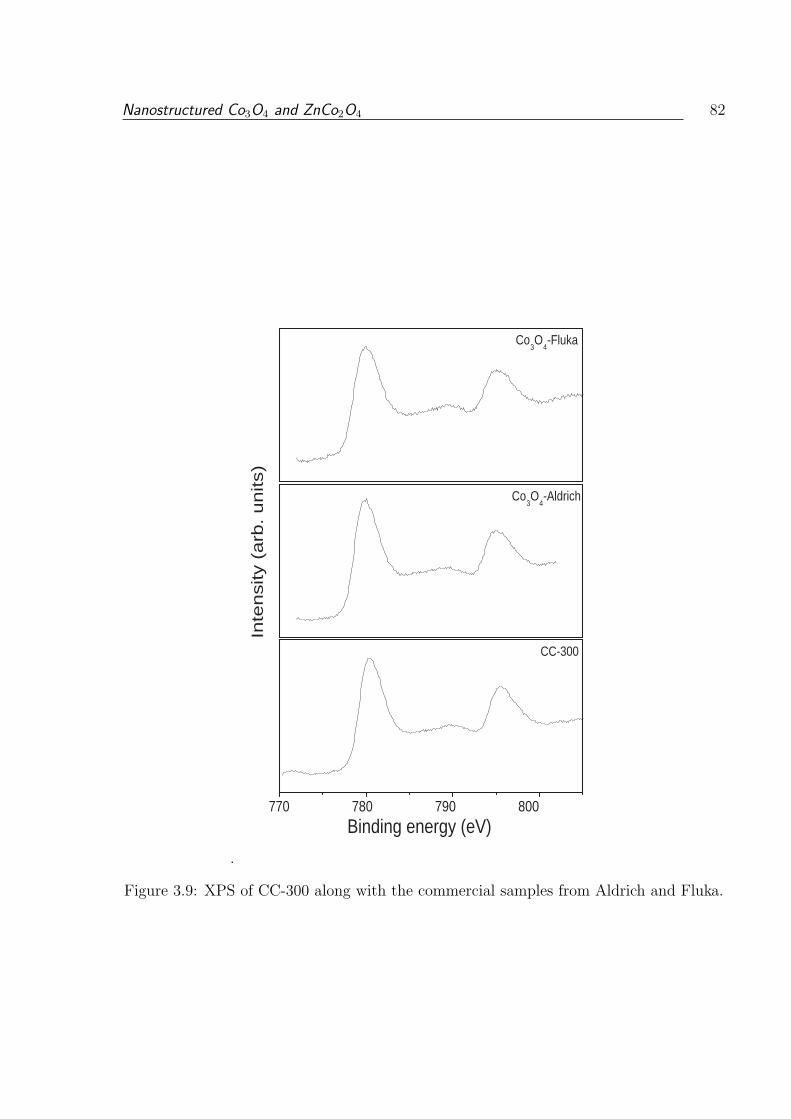
Nanostructured Co3O4 and ZnCo2O4 82
.
770 780 790 800
CC-300
Binding energy (eV)
Co 3 O
4 -Aldrich
Inte
nsity (
arb
. u
nits)
Co 3 O
4 -Fluka
Figure 3.9: XPS of CC-300 along with the commercial samples from Aldrich and Fluka.
Nanostructured Co3O4 and ZnCo2O4 83
.
0 50 100 150 200 250 300
0.0016
0.0024
0.0032
0.0040
0.0048
0.0056
0.0064
0.0072
0.0080
0.0088 a
ZFC
FC
M (
em
u/g
)
T (K) -30 -20 -10 0 10 20 30
-3
-2
-1
0
1
2
3 b
300 K
10 K
M (
em
u/g
)
H (kOe)
Figure 3.10: (a) ZFC and FC curves of CC-300 (H = 100 Oe), (b) M vs H curves at 10K and 300 K.
satellite peaks in the Co 2p spectra further suggests the presence of mainly Co3O4 phase.
The Cobalt compounds of valence 2+ are paramagnetic and have a strong satellite peak
around 6 eV above the Co 2p 32
line, where as CoIII does not show any satellites. The
mixed valence Co3O4 has a weak satellite that characterizes the minor component Co2+.
Thus the XPS measurement confirms the formation of Co3O4.
3.1.3.7 Magnetic Measurements
The temperature dependence of magnetization was measured to investigate the magnetic
behavior of the porous Co3O4 nanorods. Bulk Co3O4 is a normal spinel with the Co2+ ions
in the tetrahedral site and the low-spin CoIII ions distributed in the octahedral site of the
spinel lattice. Therefore, bulk Co3O4 is antiferromagnetic with a Neel temperature (TN)
of 40 K. Figure 3.10 shows the zero field cooled (ZFC) and field cooled (FC) magnetization
behavior of CC-300. The FC and ZFC magnetization curves, measured in a field of 100 Oe,
deviate below 41 K, with a sharp magnetic transition below this temperature, exhibiting
typical characteristics expected for ferro- or ferrimagnetic materials [79]. The magnetic
Nanostructured Co3O4 and ZnCo2O4 84
transition is at the Neel temperature reported in the literature for Co3O4 [80–82]. Similar
characteristics are reported for other antiferromagnetic materials when the particle sizes
are reduced to nanometer sizes [83]. The deviation of FC and ZFC magnetizations below
TN suggests ferromagnetic interactions in the nanoparticles [84,85]. The field dependent
magnetization measurements shown in Figure 3.10 suggest that CC-300 is paramagnetic
at room temperature. A small magnetic hysteresis loop is observed at 5 K, supporting
this conclusion that weak ferromagnetic interactions are present in the nanoparticles.
The weak ferromagnetism is possibly due to the presence of some intermediate or high-
spin Co3+ ions in the octahedral sites and/or possible redistribution of the Co2+ and Co3+
ions in the tetrahedral and octahedral sites. Similar features are observed for other spinels
such as nanosized ZnFe2O4, where the normal spinel structure changes to mixed spinel
structure, giving rise to enhanced magnetic characteristics [86, 87]. Presence of high-
spin Co3+ ions in the octahedral sites of Co3O4 is reported from electronic spectroscopic
studies [88].
3.1.4 Application of Co3O4 Nanorods in CO Gas Sensing
The CO gas sensing experiments were performed at different temperatures in order to
find out the optimum operating temperature for CO gas detection. Before exposing to
the CO gas, the sensing element was allowed to equilibrate inside the gas chamber at
an operating temperature for 1 h. A number of experiments have been carried out to
measure the gas response as a function of the operating temperature. All the time, the
gas response of the sensor element had approximately constant values, indicating the
repeatability of the sensor. The effect of operating temperature on the gas response of
CC-300 to 50 ppm CO gas is shown in Figure 3.11. The relationship between the gas
response and the operating temperature exhibits a trend of “increase-maximum decay”
behavior to 50 ppm CO gas. At low temperatures, the gas response is relatively low (e.g.
1.66 at 100 C), but it increases rapidly with an increase in the operating temperature. At
250 C , the gas response is peaked to its maximum value of 6.55. Above 250 C, the gas
response decreased as the operating temperature increased further. Thus, the optimum
operating temperature for the CC-300 to detect CO gas is at 250 C, which is better than
the reported value of 300 C [22]. Hence, to investigate the CO gas sensing properties
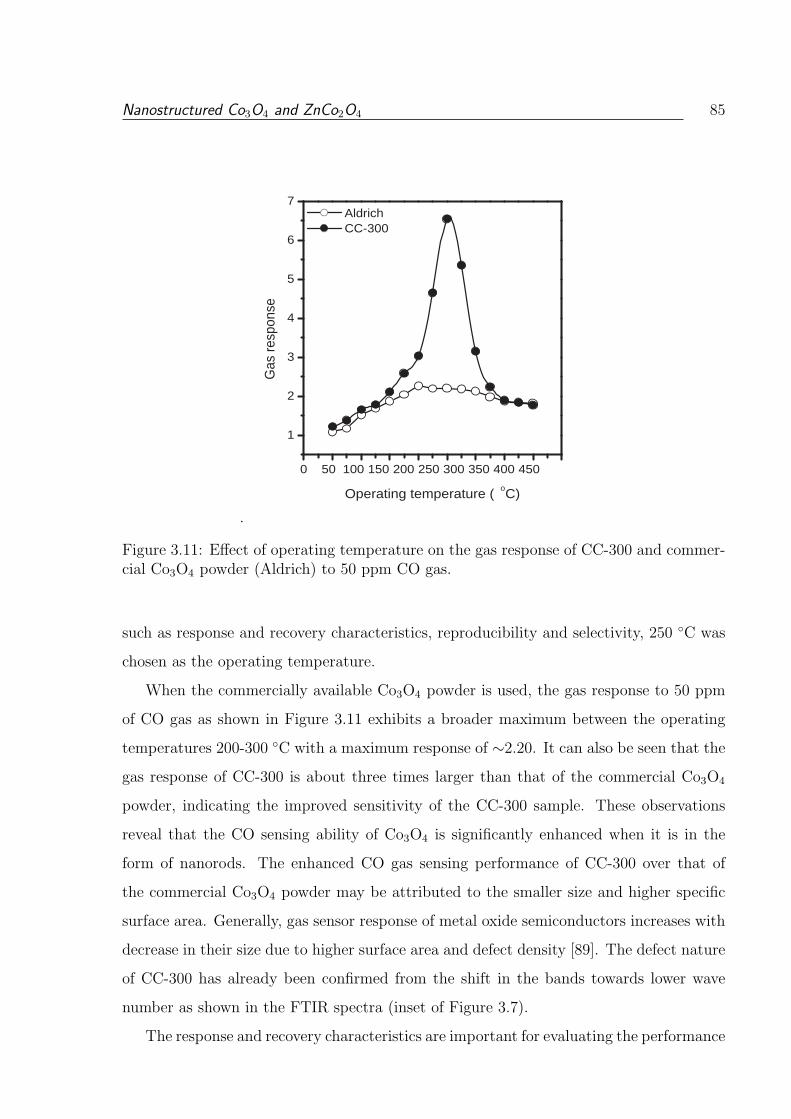
Nanostructured Co3O4 and ZnCo2O4 85
.
0 50 100 150 200 250 300 350 400 450
1
2
3
4
5
6
7 Aldrich CC-300
Gas
resp
onse
Operating temperature ( o C)
Figure 3.11: Effect of operating temperature on the gas response of CC-300 and commer-cial Co3O4 powder (Aldrich) to 50 ppm CO gas.
such as response and recovery characteristics, reproducibility and selectivity, 250 C was
chosen as the operating temperature.
When the commercially available Co3O4 powder is used, the gas response to 50 ppm
of CO gas as shown in Figure 3.11 exhibits a broader maximum between the operating
temperatures 200-300 C with a maximum response of ∼2.20. It can also be seen that the
gas response of CC-300 is about three times larger than that of the commercial Co3O4
powder, indicating the improved sensitivity of the CC-300 sample. These observations
reveal that the CO sensing ability of Co3O4 is significantly enhanced when it is in the
form of nanorods. The enhanced CO gas sensing performance of CC-300 over that of
the commercial Co3O4 powder may be attributed to the smaller size and higher specific
surface area. Generally, gas sensor response of metal oxide semiconductors increases with
decrease in their size due to higher surface area and defect density [89]. The defect nature
of CC-300 has already been confirmed from the shift in the bands towards lower wave
number as shown in the FTIR spectra (inset of Figure 3.7).
The response and recovery characteristics are important for evaluating the performance
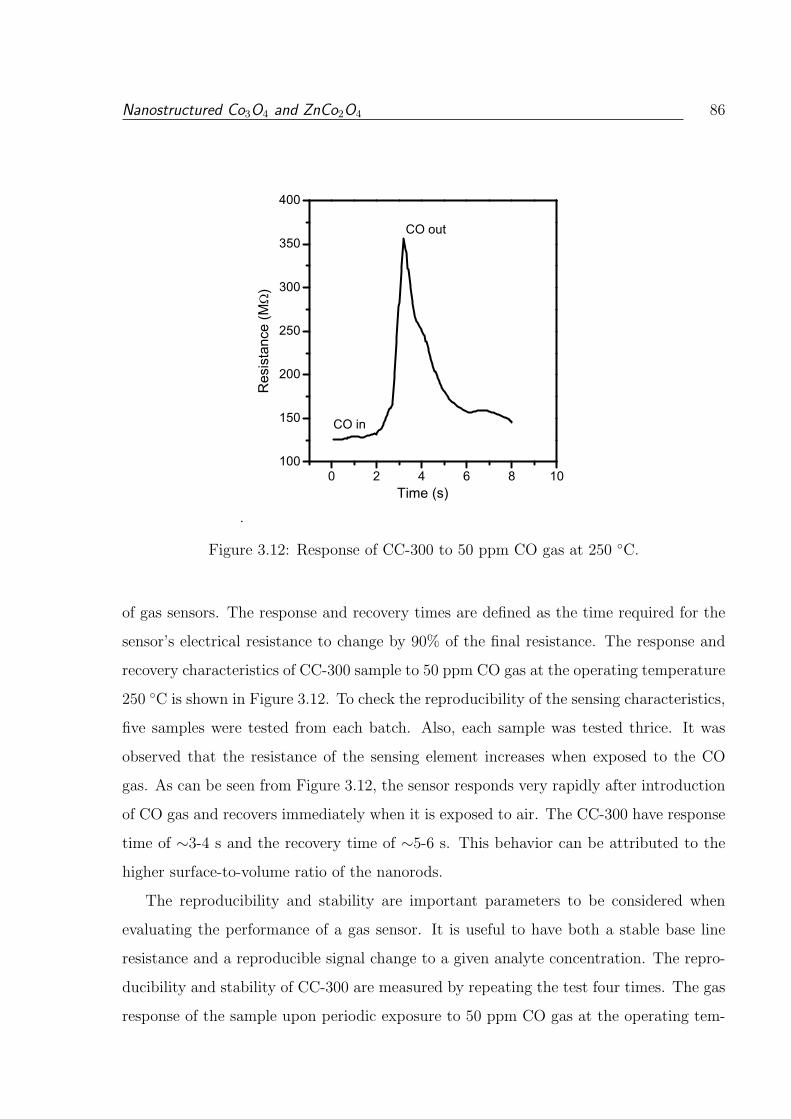
Nanostructured Co3O4 and ZnCo2O4 86
.
0 2 4 6 8 10100
150
200
250
300
350
400
CO in
CO out
Res
ista
nce
(M)
Time (s)
Figure 3.12: Response of CC-300 to 50 ppm CO gas at 250 C.
of gas sensors. The response and recovery times are defined as the time required for the
sensor’s electrical resistance to change by 90% of the final resistance. The response and
recovery characteristics of CC-300 sample to 50 ppm CO gas at the operating temperature
250 C is shown in Figure 3.12. To check the reproducibility of the sensing characteristics,
five samples were tested from each batch. Also, each sample was tested thrice. It was
observed that the resistance of the sensing element increases when exposed to the CO
gas. As can be seen from Figure 3.12, the sensor responds very rapidly after introduction
of CO gas and recovers immediately when it is exposed to air. The CC-300 have response
time of ∼3-4 s and the recovery time of ∼5-6 s. This behavior can be attributed to the
higher surface-to-volume ratio of the nanorods.
The reproducibility and stability are important parameters to be considered when
evaluating the performance of a gas sensor. It is useful to have both a stable base line
resistance and a reproducible signal change to a given analyte concentration. The repro-
ducibility and stability of CC-300 are measured by repeating the test four times. The gas
response of the sample upon periodic exposure to 50 ppm CO gas at the operating tem-
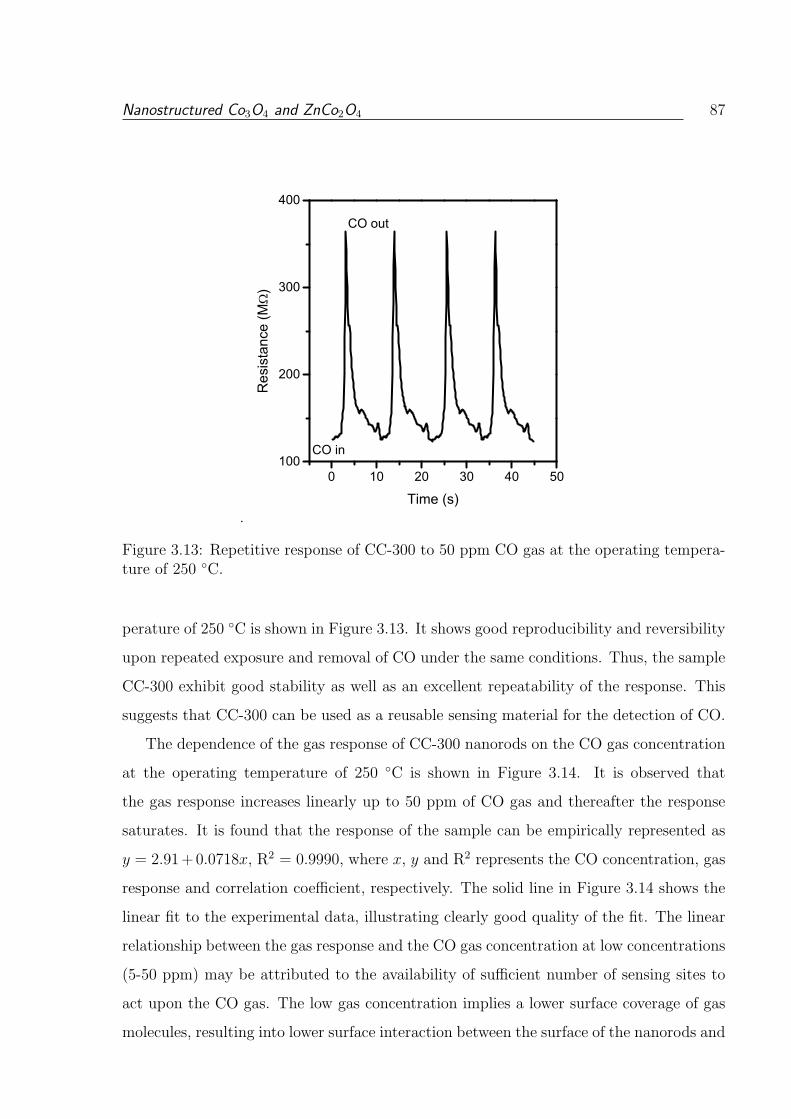
Nanostructured Co3O4 and ZnCo2O4 87
.
0 10 20 30 40 50100
200
300
400
CO out
CO in
Res
ista
nce
(M)
Time (s)
Figure 3.13: Repetitive response of CC-300 to 50 ppm CO gas at the operating tempera-ture of 250 C.
perature of 250 C is shown in Figure 3.13. It shows good reproducibility and reversibility
upon repeated exposure and removal of CO under the same conditions. Thus, the sample
CC-300 exhibit good stability as well as an excellent repeatability of the response. This
suggests that CC-300 can be used as a reusable sensing material for the detection of CO.
The dependence of the gas response of CC-300 nanorods on the CO gas concentration
at the operating temperature of 250 C is shown in Figure 3.14. It is observed that
the gas response increases linearly up to 50 ppm of CO gas and thereafter the response
saturates. It is found that the response of the sample can be empirically represented as
y = 2.91+0.0718x, R2 = 0.9990, where x, y and R2 represents the CO concentration, gas
response and correlation coefficient, respectively. The solid line in Figure 3.14 shows the
linear fit to the experimental data, illustrating clearly good quality of the fit. The linear
relationship between the gas response and the CO gas concentration at low concentrations
(5-50 ppm) may be attributed to the availability of sufficient number of sensing sites to
act upon the CO gas. The low gas concentration implies a lower surface coverage of gas
molecules, resulting into lower surface interaction between the surface of the nanorods and
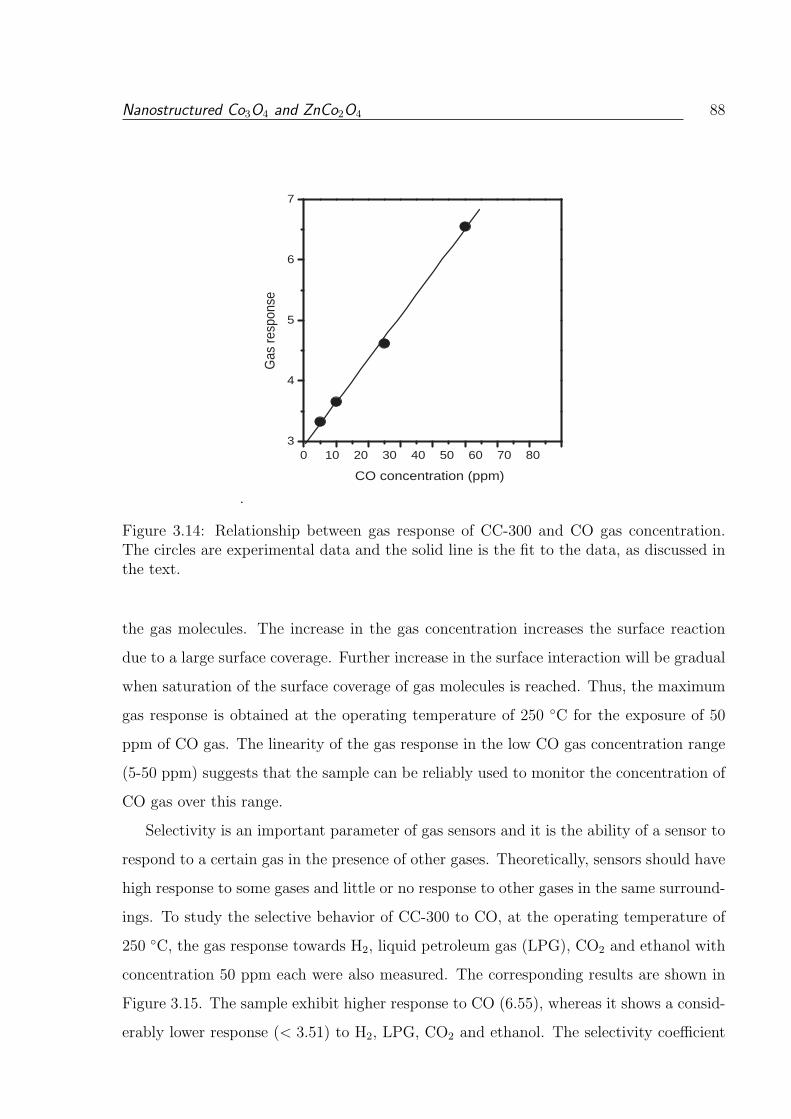
Nanostructured Co3O4 and ZnCo2O4 88
.
0 10 20 30 40 50 60 70 80 3
4
5
6
7
Gas
resp
onse
CO concentration (ppm)
Figure 3.14: Relationship between gas response of CC-300 and CO gas concentration.The circles are experimental data and the solid line is the fit to the data, as discussed inthe text.
the gas molecules. The increase in the gas concentration increases the surface reaction
due to a large surface coverage. Further increase in the surface interaction will be gradual
when saturation of the surface coverage of gas molecules is reached. Thus, the maximum
gas response is obtained at the operating temperature of 250 C for the exposure of 50
ppm of CO gas. The linearity of the gas response in the low CO gas concentration range
(5-50 ppm) suggests that the sample can be reliably used to monitor the concentration of
CO gas over this range.
Selectivity is an important parameter of gas sensors and it is the ability of a sensor to
respond to a certain gas in the presence of other gases. Theoretically, sensors should have
high response to some gases and little or no response to other gases in the same surround-
ings. To study the selective behavior of CC-300 to CO, at the operating temperature of
250 C, the gas response towards H2, liquid petroleum gas (LPG), CO2 and ethanol with
concentration 50 ppm each were also measured. The corresponding results are shown in
Figure 3.15. The sample exhibit higher response to CO (6.55), whereas it shows a consid-
erably lower response (< 3.51) to H2, LPG, CO2 and ethanol. The selectivity coefficient
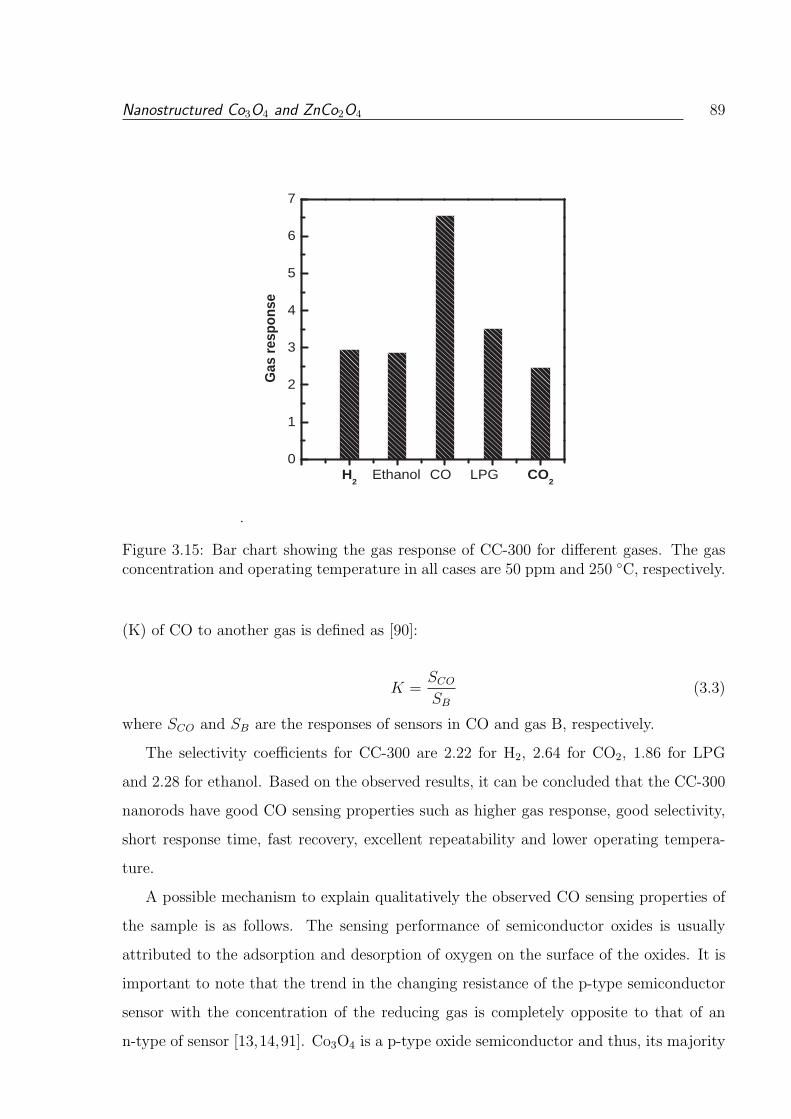
Nanostructured Co3O4 and ZnCo2O4 89
.
H 2
Ethanol CO LPG CO 2
0
1
2
3
4
5
6
7
Gas
res
pons
e
Figure 3.15: Bar chart showing the gas response of CC-300 for different gases. The gasconcentration and operating temperature in all cases are 50 ppm and 250 C, respectively.
(K) of CO to another gas is defined as [90]:
K =SCO
SB
(3.3)
where SCO and SB are the responses of sensors in CO and gas B, respectively.
The selectivity coefficients for CC-300 are 2.22 for H2, 2.64 for CO2, 1.86 for LPG
and 2.28 for ethanol. Based on the observed results, it can be concluded that the CC-300
nanorods have good CO sensing properties such as higher gas response, good selectivity,
short response time, fast recovery, excellent repeatability and lower operating tempera-
ture.
A possible mechanism to explain qualitatively the observed CO sensing properties of
the sample is as follows. The sensing performance of semiconductor oxides is usually
attributed to the adsorption and desorption of oxygen on the surface of the oxides. It is
important to note that the trend in the changing resistance of the p-type semiconductor
sensor with the concentration of the reducing gas is completely opposite to that of an
n-type of sensor [13,14,91]. Co3O4 is a p-type oxide semiconductor and thus, its majority
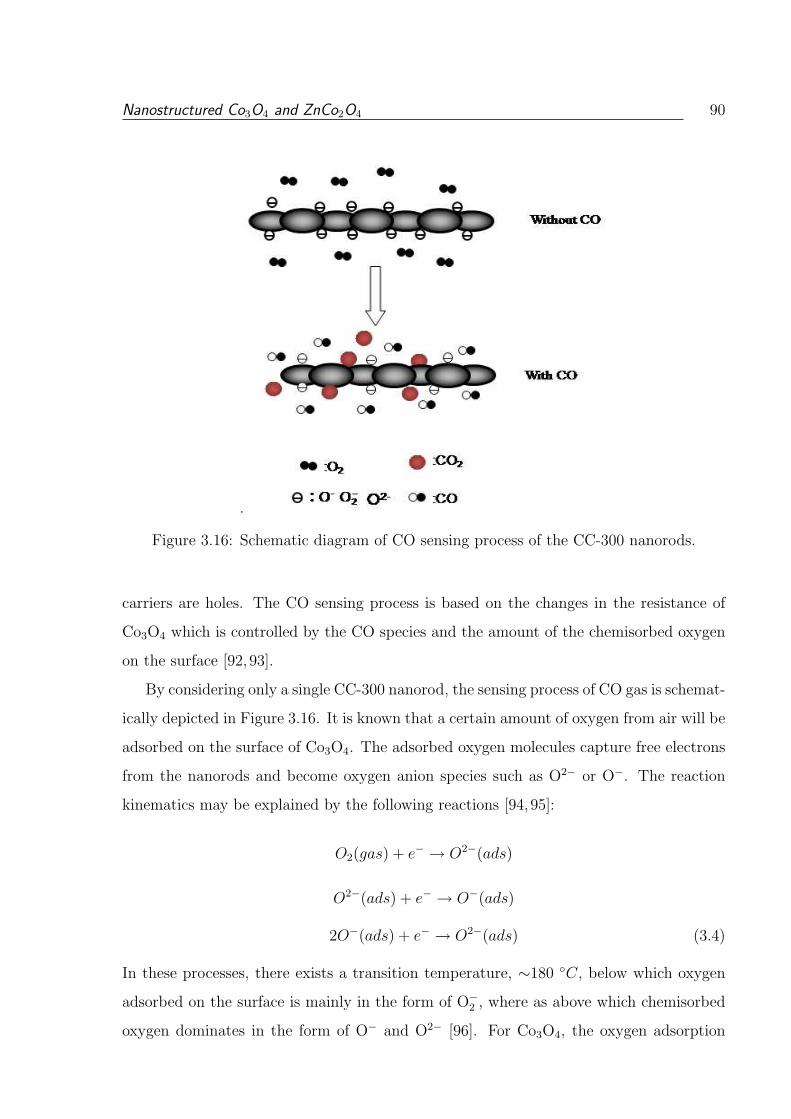
Nanostructured Co3O4 and ZnCo2O4 90
.
Figure 3.16: Schematic diagram of CO sensing process of the CC-300 nanorods.
carriers are holes. The CO sensing process is based on the changes in the resistance of
Co3O4 which is controlled by the CO species and the amount of the chemisorbed oxygen
on the surface [92, 93].
By considering only a single CC-300 nanorod, the sensing process of CO gas is schemat-
ically depicted in Figure 3.16. It is known that a certain amount of oxygen from air will be
adsorbed on the surface of Co3O4. The adsorbed oxygen molecules capture free electrons
from the nanorods and become oxygen anion species such as O2− or O−. The reaction
kinematics may be explained by the following reactions [94,95]:
O2(gas) + e− → O2−(ads)
O2−(ads) + e− → O−(ads)
2O−(ads) + e− → O2−(ads) (3.4)
In these processes, there exists a transition temperature, ∼180 C, below which oxygen
adsorbed on the surface is mainly in the form of O−2 , where as above which chemisorbed
oxygen dominates in the form of O− and O2− [96]. For Co3O4, the oxygen adsorption
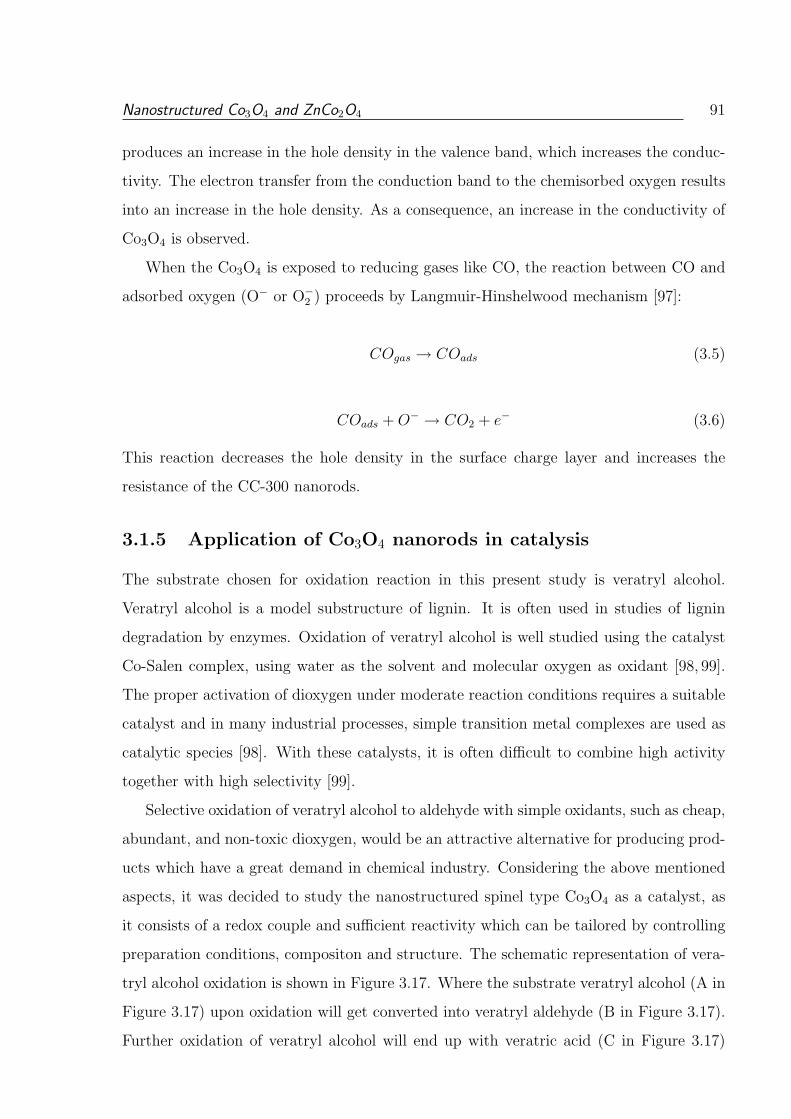
Nanostructured Co3O4 and ZnCo2O4 91
produces an increase in the hole density in the valence band, which increases the conduc-
tivity. The electron transfer from the conduction band to the chemisorbed oxygen results
into an increase in the hole density. As a consequence, an increase in the conductivity of
Co3O4 is observed.
When the Co3O4 is exposed to reducing gases like CO, the reaction between CO and
adsorbed oxygen (O− or O−2 ) proceeds by Langmuir-Hinshelwood mechanism [97]:
COgas → COads (3.5)
COads + O− → CO2 + e− (3.6)
This reaction decreases the hole density in the surface charge layer and increases the
resistance of the CC-300 nanorods.
3.1.5 Application of Co3O4 nanorods in catalysis
The substrate chosen for oxidation reaction in this present study is veratryl alcohol.
Veratryl alcohol is a model substructure of lignin. It is often used in studies of lignin
degradation by enzymes. Oxidation of veratryl alcohol is well studied using the catalyst
Co-Salen complex, using water as the solvent and molecular oxygen as oxidant [98, 99].
The proper activation of dioxygen under moderate reaction conditions requires a suitable
catalyst and in many industrial processes, simple transition metal complexes are used as
catalytic species [98]. With these catalysts, it is often difficult to combine high activity
together with high selectivity [99].
Selective oxidation of veratryl alcohol to aldehyde with simple oxidants, such as cheap,
abundant, and non-toxic dioxygen, would be an attractive alternative for producing prod-
ucts which have a great demand in chemical industry. Considering the above mentioned
aspects, it was decided to study the nanostructured spinel type Co3O4 as a catalyst, as
it consists of a redox couple and sufficient reactivity which can be tailored by controlling
preparation conditions, compositon and structure. The schematic representation of vera-
tryl alcohol oxidation is shown in Figure 3.17. Where the substrate veratryl alcohol (A in
Figure 3.17) upon oxidation will get converted into veratryl aldehyde (B in Figure 3.17).
Further oxidation of veratryl alcohol will end up with veratric acid (C in Figure 3.17)
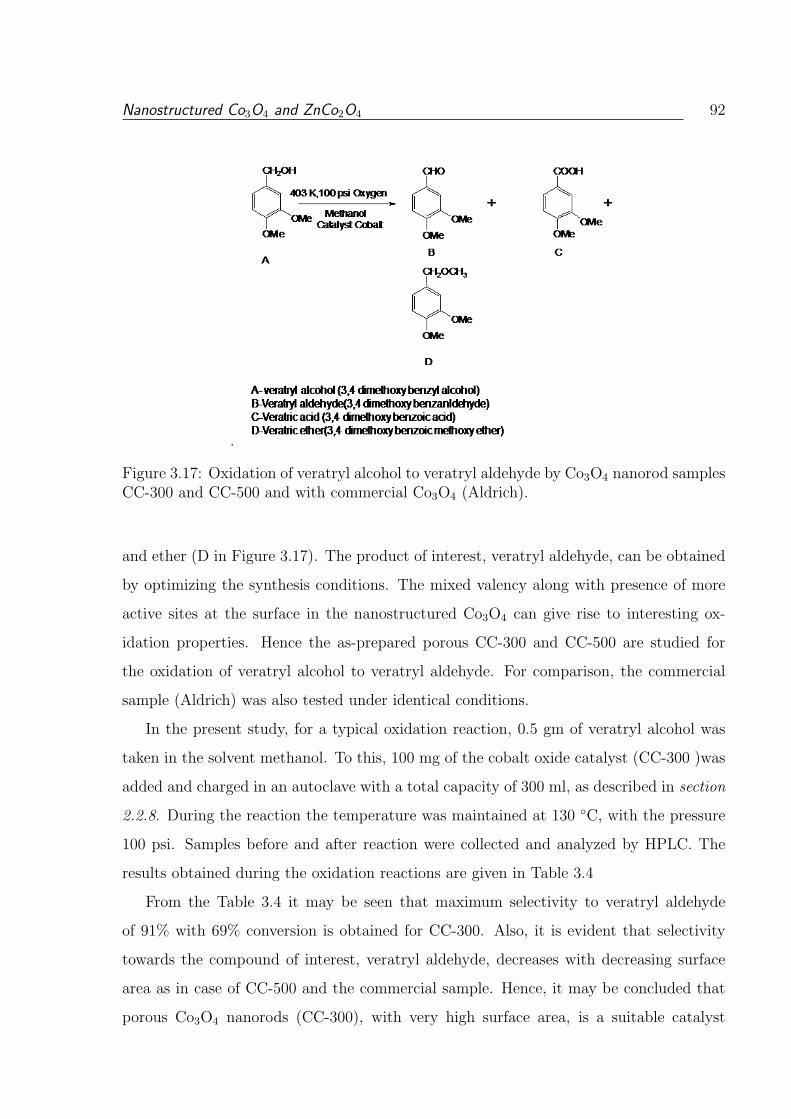
Nanostructured Co3O4 and ZnCo2O4 92
.
Figure 3.17: Oxidation of veratryl alcohol to veratryl aldehyde by Co3O4 nanorod samplesCC-300 and CC-500 and with commercial Co3O4 (Aldrich).
and ether (D in Figure 3.17). The product of interest, veratryl aldehyde, can be obtained
by optimizing the synthesis conditions. The mixed valency along with presence of more
active sites at the surface in the nanostructured Co3O4 can give rise to interesting ox-
idation properties. Hence the as-prepared porous CC-300 and CC-500 are studied for
the oxidation of veratryl alcohol to veratryl aldehyde. For comparison, the commercial
sample (Aldrich) was also tested under identical conditions.
In the present study, for a typical oxidation reaction, 0.5 gm of veratryl alcohol was
taken in the solvent methanol. To this, 100 mg of the cobalt oxide catalyst (CC-300 )was
added and charged in an autoclave with a total capacity of 300 ml, as described in section
2.2.8. During the reaction the temperature was maintained at 130 C, with the pressure
100 psi. Samples before and after reaction were collected and analyzed by HPLC. The
results obtained during the oxidation reactions are given in Table 3.4
From the Table 3.4 it may be seen that maximum selectivity to veratryl aldehyde
of 91% with 69% conversion is obtained for CC-300. Also, it is evident that selectivity
towards the compound of interest, veratryl aldehyde, decreases with decreasing surface
area as in case of CC-500 and the commercial sample. Hence, it may be concluded that
porous Co3O4 nanorods (CC-300), with very high surface area, is a suitable catalyst
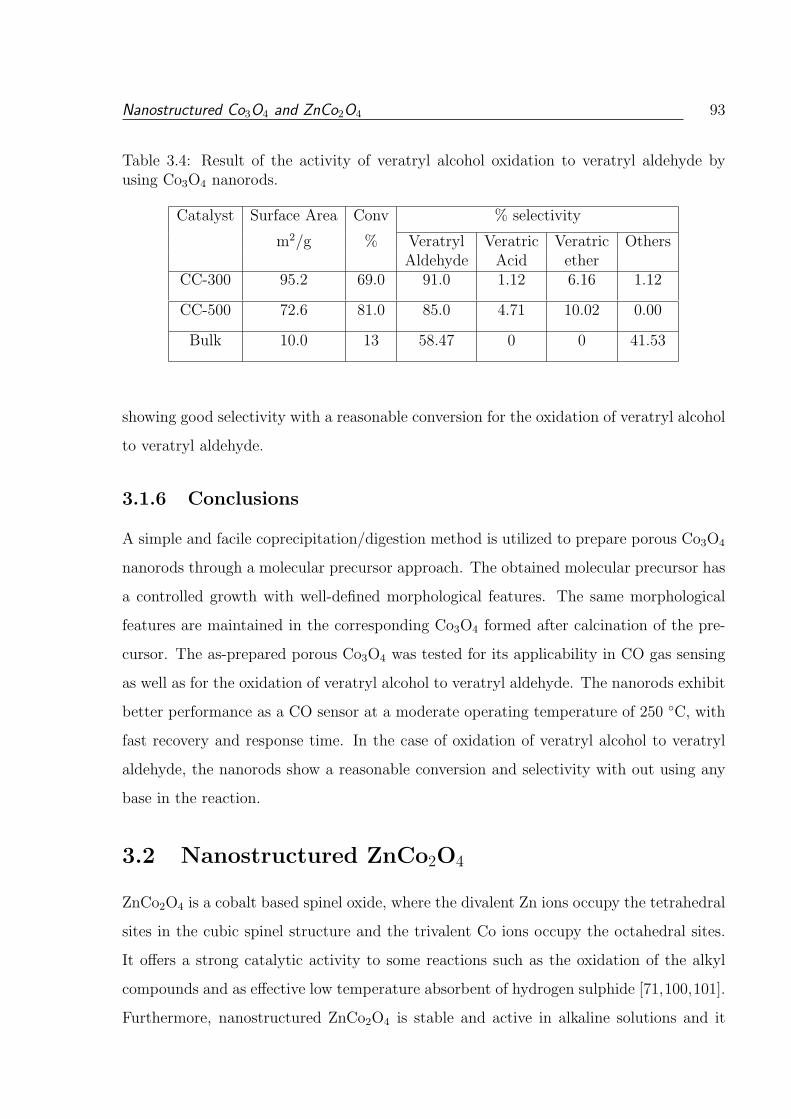
Nanostructured Co3O4 and ZnCo2O4 93
Table 3.4: Result of the activity of veratryl alcohol oxidation to veratryl aldehyde byusing Co3O4 nanorods.
Catalyst Surface Area Conv % selectivity
m2/g % Veratryl Veratric Veratric OthersAldehyde Acid ether
CC-300 95.2 69.0 91.0 1.12 6.16 1.12
CC-500 72.6 81.0 85.0 4.71 10.02 0.00
Bulk 10.0 13 58.47 0 0 41.53
showing good selectivity with a reasonable conversion for the oxidation of veratryl alcohol
to veratryl aldehyde.
3.1.6 Conclusions
A simple and facile coprecipitation/digestion method is utilized to prepare porous Co3O4
nanorods through a molecular precursor approach. The obtained molecular precursor has
a controlled growth with well-defined morphological features. The same morphological
features are maintained in the corresponding Co3O4 formed after calcination of the pre-
cursor. The as-prepared porous Co3O4 was tested for its applicability in CO gas sensing
as well as for the oxidation of veratryl alcohol to veratryl aldehyde. The nanorods exhibit
better performance as a CO sensor at a moderate operating temperature of 250 C, with
fast recovery and response time. In the case of oxidation of veratryl alcohol to veratryl
aldehyde, the nanorods show a reasonable conversion and selectivity with out using any
base in the reaction.
3.2 Nanostructured ZnCo2O4
ZnCo2O4 is a cobalt based spinel oxide, where the divalent Zn ions occupy the tetrahedral
sites in the cubic spinel structure and the trivalent Co ions occupy the octahedral sites.
It offers a strong catalytic activity to some reactions such as the oxidation of the alkyl
compounds and as effective low temperature absorbent of hydrogen sulphide [71,100,101].
Furthermore, nanostructured ZnCo2O4 is stable and active in alkaline solutions and it
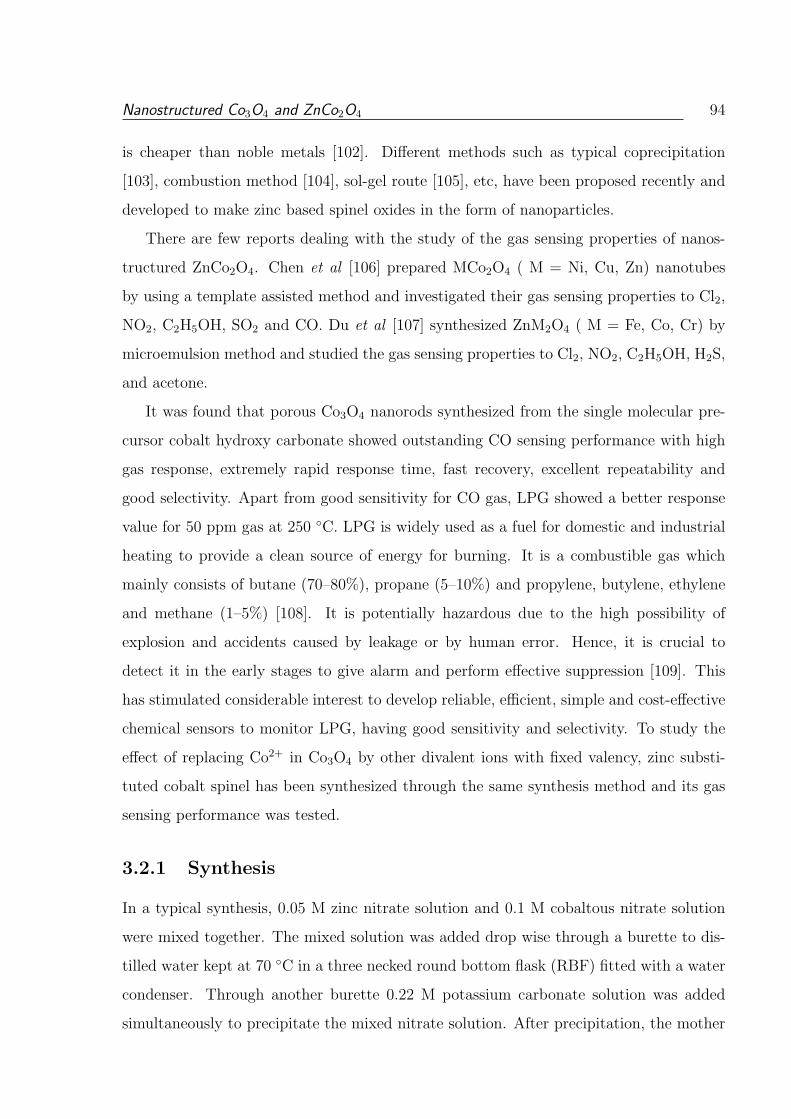
Nanostructured Co3O4 and ZnCo2O4 94
is cheaper than noble metals [102]. Different methods such as typical coprecipitation
[103], combustion method [104], sol-gel route [105], etc, have been proposed recently and
developed to make zinc based spinel oxides in the form of nanoparticles.
There are few reports dealing with the study of the gas sensing properties of nanos-
tructured ZnCo2O4. Chen et al [106] prepared MCo2O4 ( M = Ni, Cu, Zn) nanotubes
by using a template assisted method and investigated their gas sensing properties to Cl2,
NO2, C2H5OH, SO2 and CO. Du et al [107] synthesized ZnM2O4 ( M = Fe, Co, Cr) by
microemulsion method and studied the gas sensing properties to Cl2, NO2, C2H5OH, H2S,
and acetone.
It was found that porous Co3O4 nanorods synthesized from the single molecular pre-
cursor cobalt hydroxy carbonate showed outstanding CO sensing performance with high
gas response, extremely rapid response time, fast recovery, excellent repeatability and
good selectivity. Apart from good sensitivity for CO gas, LPG showed a better response
value for 50 ppm gas at 250 C. LPG is widely used as a fuel for domestic and industrial
heating to provide a clean source of energy for burning. It is a combustible gas which
mainly consists of butane (70–80%), propane (5–10%) and propylene, butylene, ethylene
and methane (1–5%) [108]. It is potentially hazardous due to the high possibility of
explosion and accidents caused by leakage or by human error. Hence, it is crucial to
detect it in the early stages to give alarm and perform effective suppression [109]. This
has stimulated considerable interest to develop reliable, efficient, simple and cost-effective
chemical sensors to monitor LPG, having good sensitivity and selectivity. To study the
effect of replacing Co2+ in Co3O4 by other divalent ions with fixed valency, zinc substi-
tuted cobalt spinel has been synthesized through the same synthesis method and its gas
sensing performance was tested.
3.2.1 Synthesis
In a typical synthesis, 0.05 M zinc nitrate solution and 0.1 M cobaltous nitrate solution
were mixed together. The mixed solution was added drop wise through a burette to dis-
tilled water kept at 70 C in a three necked round bottom flask (RBF) fitted with a water
condenser. Through another burette 0.22 M potassium carbonate solution was added
simultaneously to precipitate the mixed nitrate solution. After precipitation, the mother
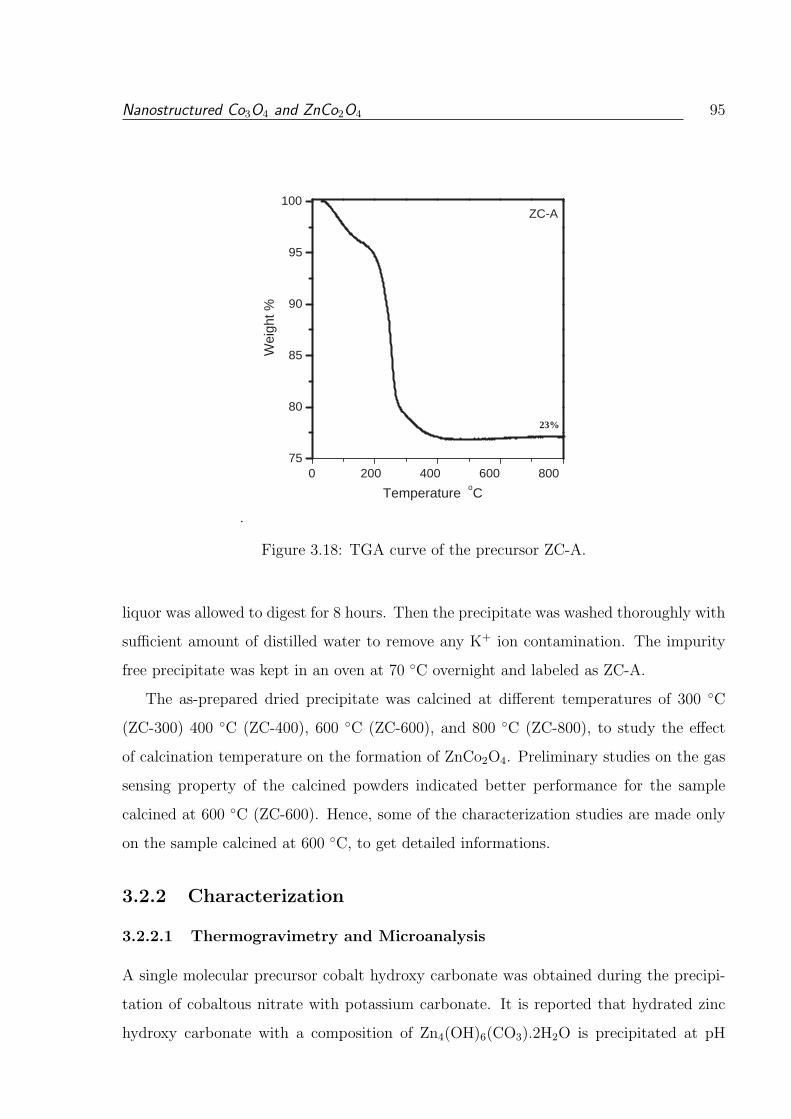
Nanostructured Co3O4 and ZnCo2O4 95
.
0 200 400 600 800 75
80
85
90
95
100 ZC-A
23%
Temperature o C
Wei
ght %
Figure 3.18: TGA curve of the precursor ZC-A.
liquor was allowed to digest for 8 hours. Then the precipitate was washed thoroughly with
sufficient amount of distilled water to remove any K+ ion contamination. The impurity
free precipitate was kept in an oven at 70 C overnight and labeled as ZC-A.
The as-prepared dried precipitate was calcined at different temperatures of 300 C
(ZC-300) 400 C (ZC-400), 600 C (ZC-600), and 800 C (ZC-800), to study the effect
of calcination temperature on the formation of ZnCo2O4. Preliminary studies on the gas
sensing property of the calcined powders indicated better performance for the sample
calcined at 600 C (ZC-600). Hence, some of the characterization studies are made only
on the sample calcined at 600 C, to get detailed informations.
3.2.2 Characterization
3.2.2.1 Thermogravimetry and Microanalysis
A single molecular precursor cobalt hydroxy carbonate was obtained during the precipi-
tation of cobaltous nitrate with potassium carbonate. It is reported that hydrated zinc
hydroxy carbonate with a composition of Zn4(OH)6(CO3).2H2O is precipitated at pH
Nanostructured Co3O4 and ZnCo2O4 96
Table 3.5: Microanalysis data on mixed precursor ZC-A
Element Experimental value (%) Theoretical value (%)
C 4.22 4.56H 1.21 1.32
∼7.5-8.0 when zinc nitrate is precipitated with carbonate ions [110]. Hence, it is expected
that when potassium carbonate, cobaltous nitrate and zinc nitrate solutions are sepa-
rately dropped to stirred distilled water kept at 70 C, the following chemical reaction
may occur to precipitate a mixed precursor consisting of cobalt hydroxy carbonate and
zinc hydroxy carbonate at pH ∼7.5-8.0.
Co2+ + OH− + CO2−3 + H2O + Zn2+ → Co(OH)1.0(CO3)0.50.11H2O + Zn4(OH)6(CO3)
(3.7)
Thermogravimetry (TGA) and microanalysis (MA) were carried out on the mixed
precursor to get information on the decomposition behavior and its composition. The
TGA curve of the mixed precursor is shown in Figure 3.18. The TGA curve of the
as-prepared mixed precursor exhibits two major weight losses in the temperature range
30–200 C and a minor weight loss in the 200-400 C temperature region. The continuous
loss in the first step can be assigned to the removal of adsorbed and hydrated water
molecules. The second step, which is a major one, can be attributed to the decomposition
of carbonate ions. The CH and TGA data are presented in Table 3.5 by considering the
decomposition scheme shown by the equation 3.8.
2Co(OH)1.0(CO3)0.50.11H2O +1
4[Zn4(OH)6(CO3)] → ZnCo2O4 +1.25CO2 ↑ +2.22H2O
(3.8)
The CH analysis and total weight loss in TGA are consistent with the theoretically
calculated CH and weight loss data assuming the composition of the mixed precursors.
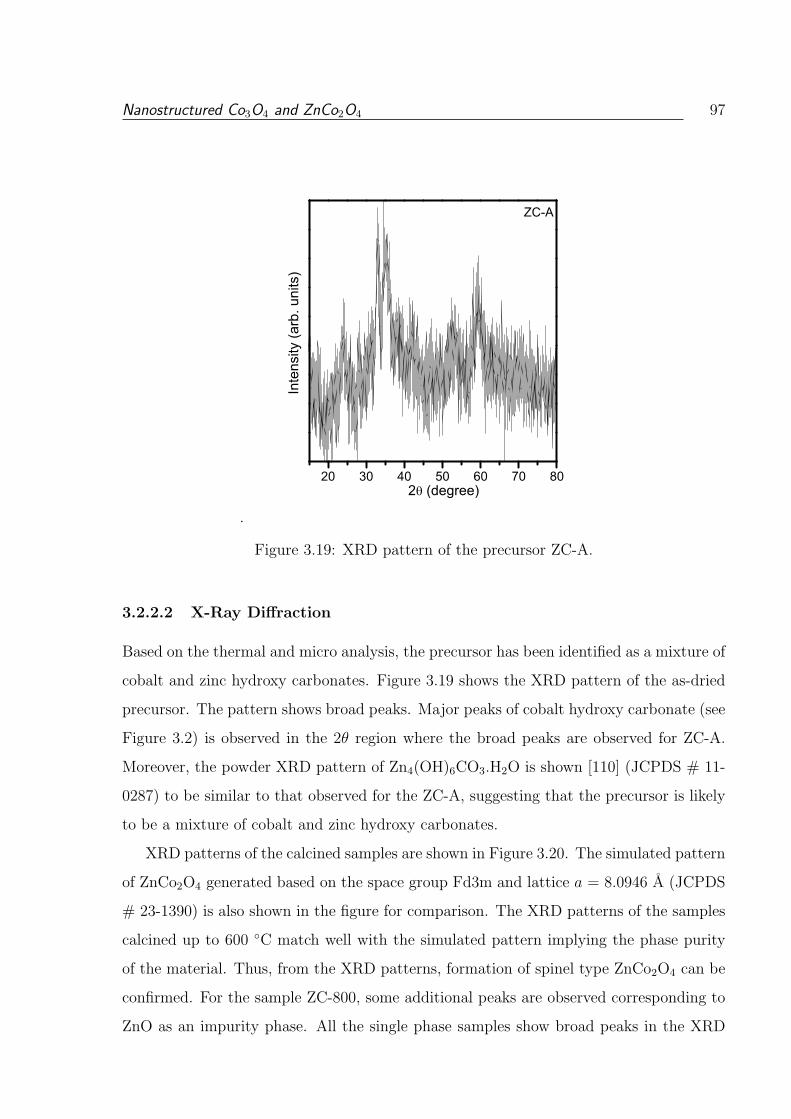
Nanostructured Co3O4 and ZnCo2O4 97
.
20 30 40 50 60 70 80
Inte
nsity
(arb
. uni
ts)
ZC-A
2 (degree)
Figure 3.19: XRD pattern of the precursor ZC-A.
3.2.2.2 X-Ray Diffraction
Based on the thermal and micro analysis, the precursor has been identified as a mixture of
cobalt and zinc hydroxy carbonates. Figure 3.19 shows the XRD pattern of the as-dried
precursor. The pattern shows broad peaks. Major peaks of cobalt hydroxy carbonate (see
Figure 3.2) is observed in the 2θ region where the broad peaks are observed for ZC-A.
Moreover, the powder XRD pattern of Zn4(OH)6CO3.H2O is shown [110] (JCPDS # 11-
0287) to be similar to that observed for the ZC-A, suggesting that the precursor is likely
to be a mixture of cobalt and zinc hydroxy carbonates.
XRD patterns of the calcined samples are shown in Figure 3.20. The simulated pattern
of ZnCo2O4 generated based on the space group Fd3m and lattice a = 8.0946 A (JCPDS
# 23-1390) is also shown in the figure for comparison. The XRD patterns of the samples
calcined up to 600 C match well with the simulated pattern implying the phase purity
of the material. Thus, from the XRD patterns, formation of spinel type ZnCo2O4 can be
confirmed. For the sample ZC-800, some additional peaks are observed corresponding to
ZnO as an impurity phase. All the single phase samples show broad peaks in the XRD
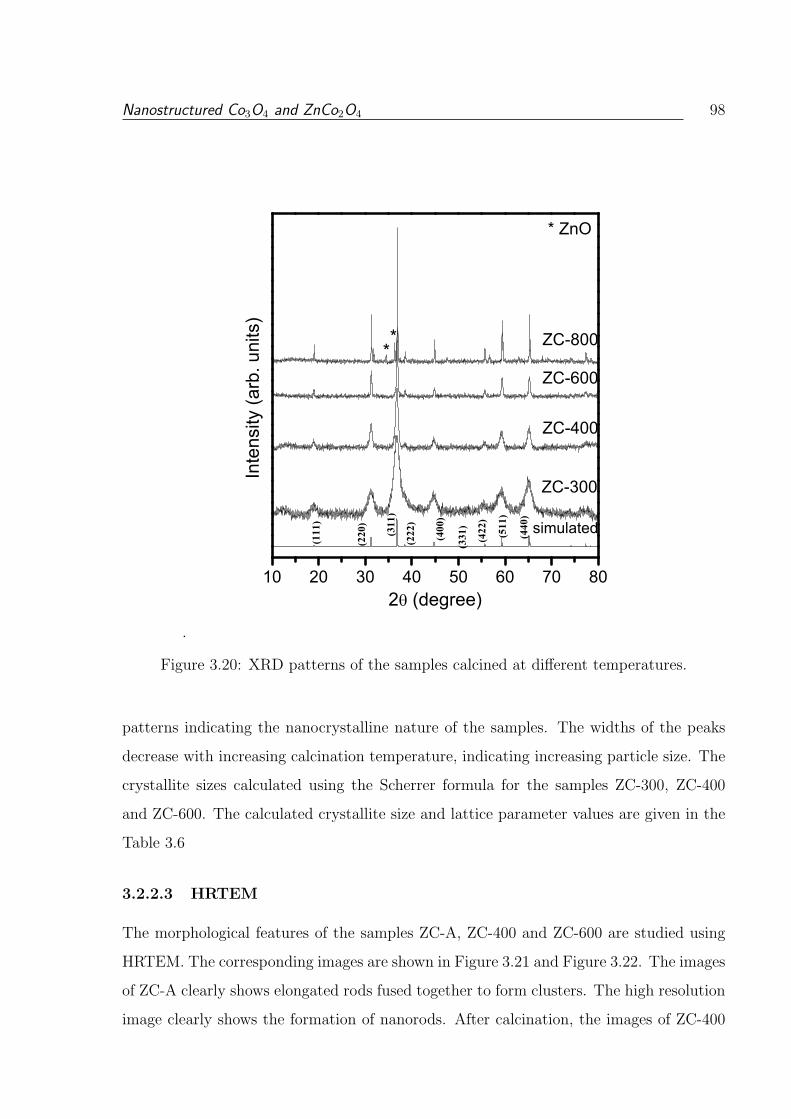
Nanostructured Co3O4 and ZnCo2O4 98
.
10 20 30 40 50 60 70 80
ZC-800
ZC-600
ZC-400
ZC-300
simulated(440
)
(511
)
(422
)
(331
)
(400
)
(222
)
(311
)
(220
)
(111
)
* ZnO
**
Inte
nsity
(arb
. uni
ts)
2 (degree)
Figure 3.20: XRD patterns of the samples calcined at different temperatures.
patterns indicating the nanocrystalline nature of the samples. The widths of the peaks
decrease with increasing calcination temperature, indicating increasing particle size. The
crystallite sizes calculated using the Scherrer formula for the samples ZC-300, ZC-400
and ZC-600. The calculated crystallite size and lattice parameter values are given in the
Table 3.6
3.2.2.3 HRTEM
The morphological features of the samples ZC-A, ZC-400 and ZC-600 are studied using
HRTEM. The corresponding images are shown in Figure 3.21 and Figure 3.22. The images
of ZC-A clearly shows elongated rods fused together to form clusters. The high resolution
image clearly shows the formation of nanorods. After calcination, the images of ZC-400
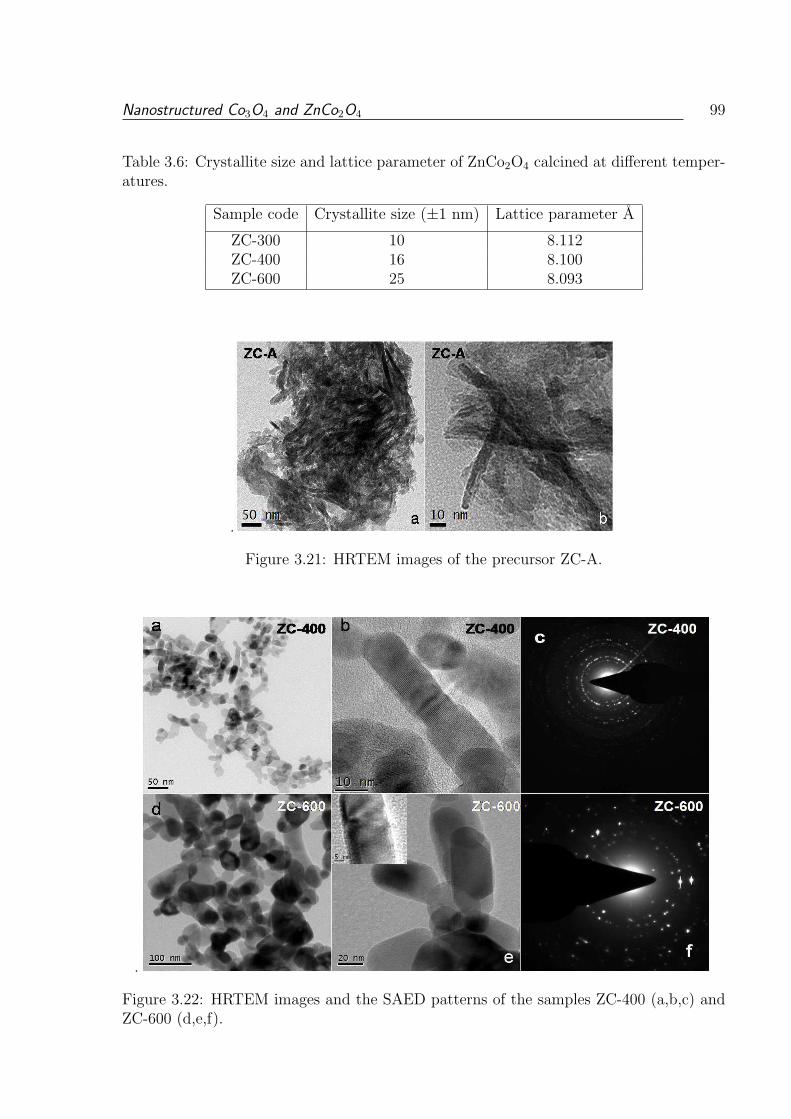
Nanostructured Co3O4 and ZnCo2O4 99
Table 3.6: Crystallite size and lattice parameter of ZnCo2O4 calcined at different temper-atures.
Sample code Crystallite size (±1 nm) Lattice parameter A
ZC-300 10 8.112ZC-400 16 8.100ZC-600 25 8.093
.
Figure 3.21: HRTEM images of the precursor ZC-A.
.
Figure 3.22: HRTEM images and the SAED patterns of the samples ZC-400 (a,b,c) andZC-600 (d,e,f).
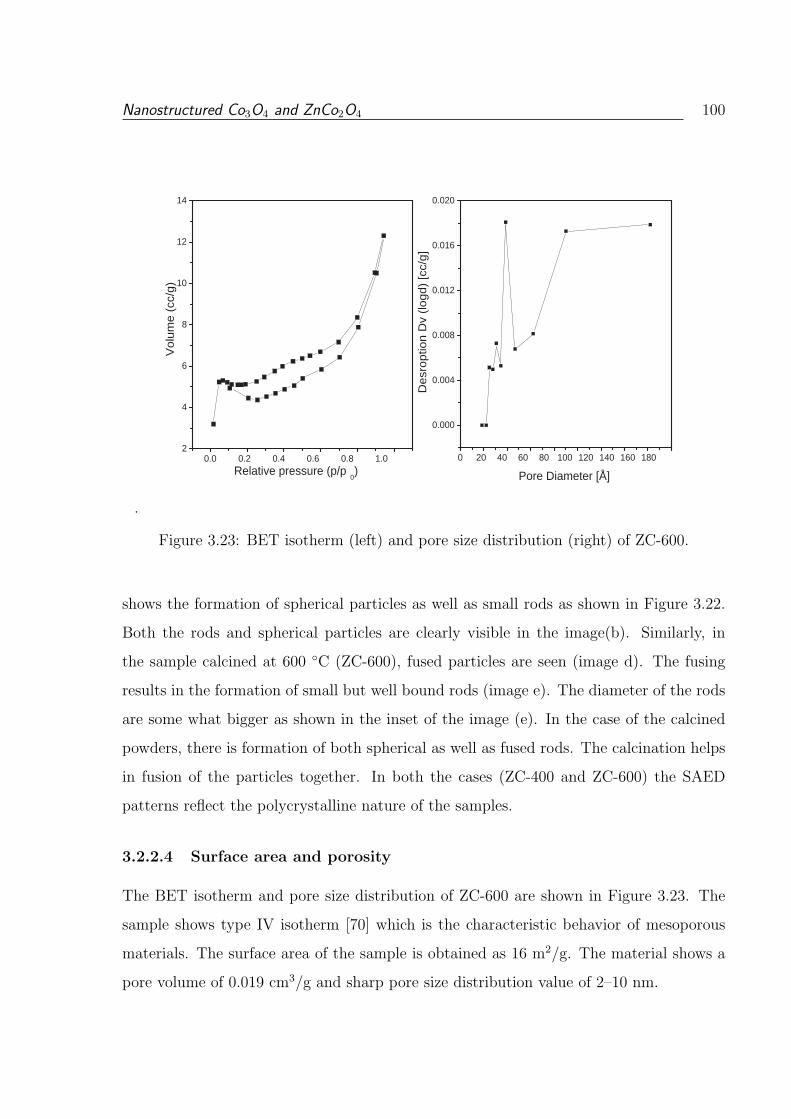
Nanostructured Co3O4 and ZnCo2O4 100
.
0.0 0.2 0.4 0.6 0.8 1.0 2
4
6
8
10
12
14
Vo
lum
e (
cc/g
)
Relative pressure (p/p 0 )
0 20 40 60 80 100 120 140 160 180
0.000
0.004
0.008
0.012
0.016
0.020
D
esr
op
tion
Dv
(lo
gd
) [c
c/g
]
Pore Diameter [Å]
Figure 3.23: BET isotherm (left) and pore size distribution (right) of ZC-600.
shows the formation of spherical particles as well as small rods as shown in Figure 3.22.
Both the rods and spherical particles are clearly visible in the image(b). Similarly, in
the sample calcined at 600 C (ZC-600), fused particles are seen (image d). The fusing
results in the formation of small but well bound rods (image e). The diameter of the rods
are some what bigger as shown in the inset of the image (e). In the case of the calcined
powders, there is formation of both spherical as well as fused rods. The calcination helps
in fusion of the particles together. In both the cases (ZC-400 and ZC-600) the SAED
patterns reflect the polycrystalline nature of the samples.
3.2.2.4 Surface area and porosity
The BET isotherm and pore size distribution of ZC-600 are shown in Figure 3.23. The
sample shows type IV isotherm [70] which is the characteristic behavior of mesoporous
materials. The surface area of the sample is obtained as 16 m2/g. The material shows a
pore volume of 0.019 cm3/g and sharp pore size distribution value of 2–10 nm.
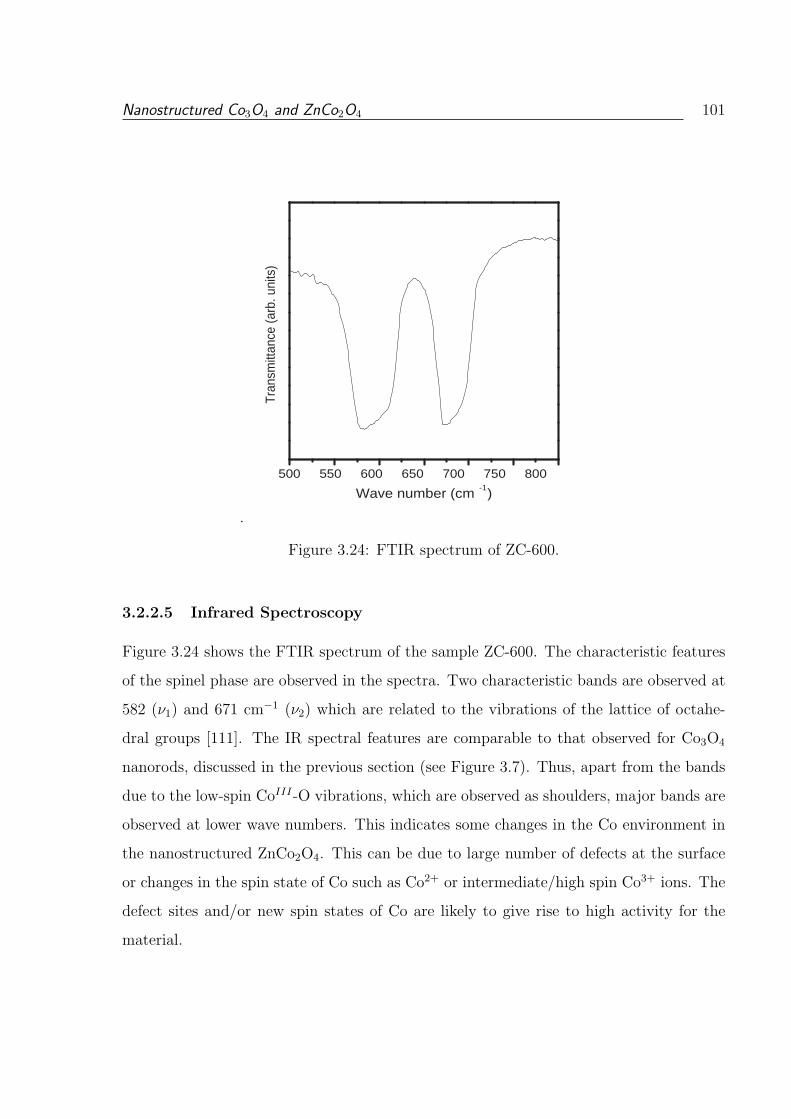
Nanostructured Co3O4 and ZnCo2O4 101
.
500 550 600 650 700 750 800
Tran
smitt
ance
(arb
. uni
ts)
Wave number (cm -1 )
Figure 3.24: FTIR spectrum of ZC-600.
3.2.2.5 Infrared Spectroscopy
Figure 3.24 shows the FTIR spectrum of the sample ZC-600. The characteristic features
of the spinel phase are observed in the spectra. Two characteristic bands are observed at
582 (ν1) and 671 cm−1 (ν2) which are related to the vibrations of the lattice of octahe-
dral groups [111]. The IR spectral features are comparable to that observed for Co3O4
nanorods, discussed in the previous section (see Figure 3.7). Thus, apart from the bands
due to the low-spin CoIII-O vibrations, which are observed as shoulders, major bands are
observed at lower wave numbers. This indicates some changes in the Co environment in
the nanostructured ZnCo2O4. This can be due to large number of defects at the surface
or changes in the spin state of Co such as Co2+ or intermediate/high spin Co3+ ions. The
defect sites and/or new spin states of Co are likely to give rise to high activity for the
material.
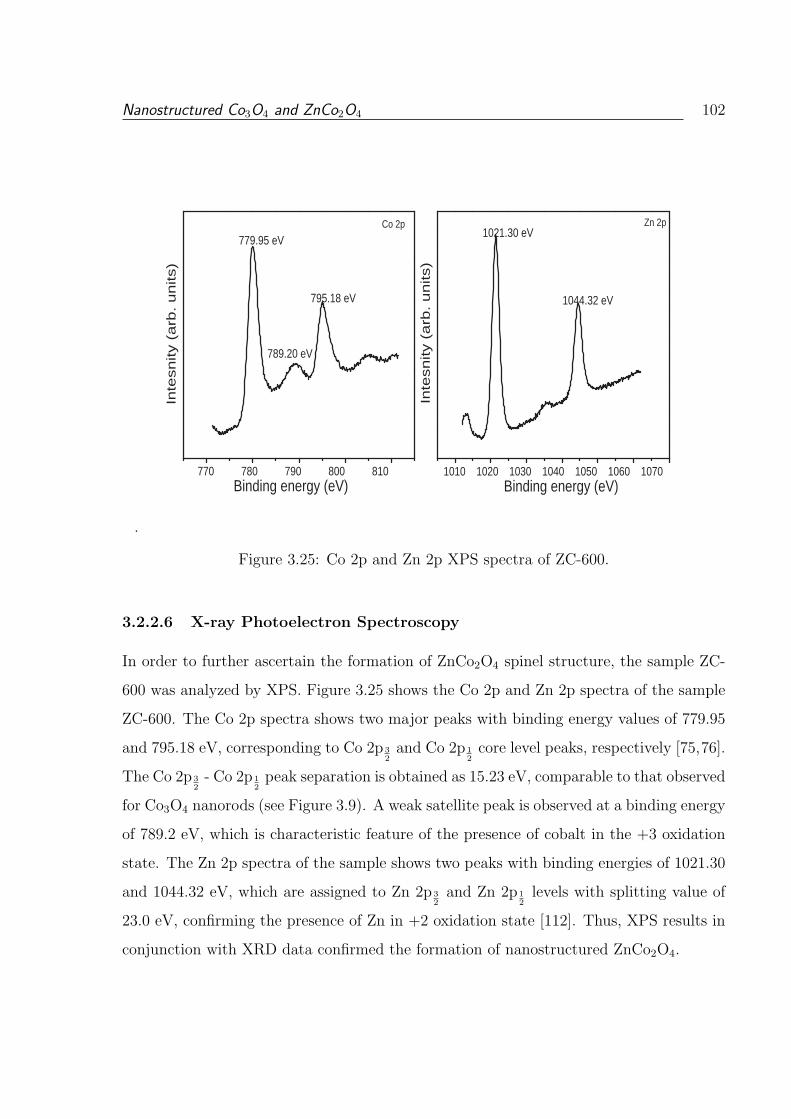
Nanostructured Co3O4 and ZnCo2O4 102
.
770 780 790 800 810
Co 2p
Binding energy (eV)
795.18 eV
789.20 eV
779.95 eV
Inte
sn
ity (
arb
. un
its)
Binding energy (eV) 1010 1020 1030 1040 1050 1060 1070
Zn 2p
Inte
snity (
arb
. u
nits)
1044.32 eV
1021.30 eV
Figure 3.25: Co 2p and Zn 2p XPS spectra of ZC-600.
3.2.2.6 X-ray Photoelectron Spectroscopy
In order to further ascertain the formation of ZnCo2O4 spinel structure, the sample ZC-
600 was analyzed by XPS. Figure 3.25 shows the Co 2p and Zn 2p spectra of the sample
ZC-600. The Co 2p spectra shows two major peaks with binding energy values of 779.95
and 795.18 eV, corresponding to Co 2p 32
and Co 2p 12
core level peaks, respectively [75,76].
The Co 2p 32
- Co 2p 12
peak separation is obtained as 15.23 eV, comparable to that observed
for Co3O4 nanorods (see Figure 3.9). A weak satellite peak is observed at a binding energy
of 789.2 eV, which is characteristic feature of the presence of cobalt in the +3 oxidation
state. The Zn 2p spectra of the sample shows two peaks with binding energies of 1021.30
and 1044.32 eV, which are assigned to Zn 2p 32
and Zn 2p 12
levels with splitting value of
23.0 eV, confirming the presence of Zn in +2 oxidation state [112]. Thus, XPS results in
conjunction with XRD data confirmed the formation of nanostructured ZnCo2O4.
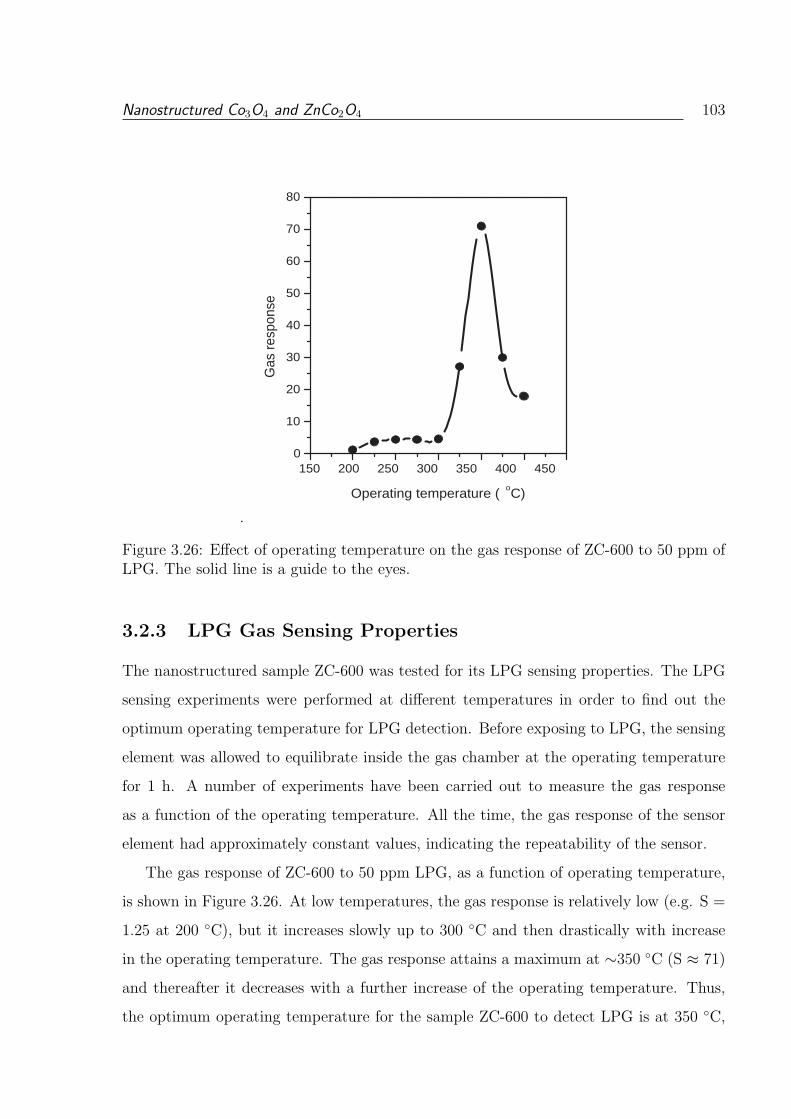
Nanostructured Co3O4 and ZnCo2O4 103
.
150 200 250 300 350 400 450 0
10
20
30
40
50
60
70
80
Gas
res
pons
e
Operating temperature ( o C)
Figure 3.26: Effect of operating temperature on the gas response of ZC-600 to 50 ppm ofLPG. The solid line is a guide to the eyes.
3.2.3 LPG Gas Sensing Properties
The nanostructured sample ZC-600 was tested for its LPG sensing properties. The LPG
sensing experiments were performed at different temperatures in order to find out the
optimum operating temperature for LPG detection. Before exposing to LPG, the sensing
element was allowed to equilibrate inside the gas chamber at the operating temperature
for 1 h. A number of experiments have been carried out to measure the gas response
as a function of the operating temperature. All the time, the gas response of the sensor
element had approximately constant values, indicating the repeatability of the sensor.
The gas response of ZC-600 to 50 ppm LPG, as a function of operating temperature,
is shown in Figure 3.26. At low temperatures, the gas response is relatively low (e.g. S =
1.25 at 200 C), but it increases slowly up to 300 C and then drastically with increase
in the operating temperature. The gas response attains a maximum at ∼350 C (S ≈ 71)
and thereafter it decreases with a further increase of the operating temperature. Thus,
the optimum operating temperature for the sample ZC-600 to detect LPG is at 350 C,
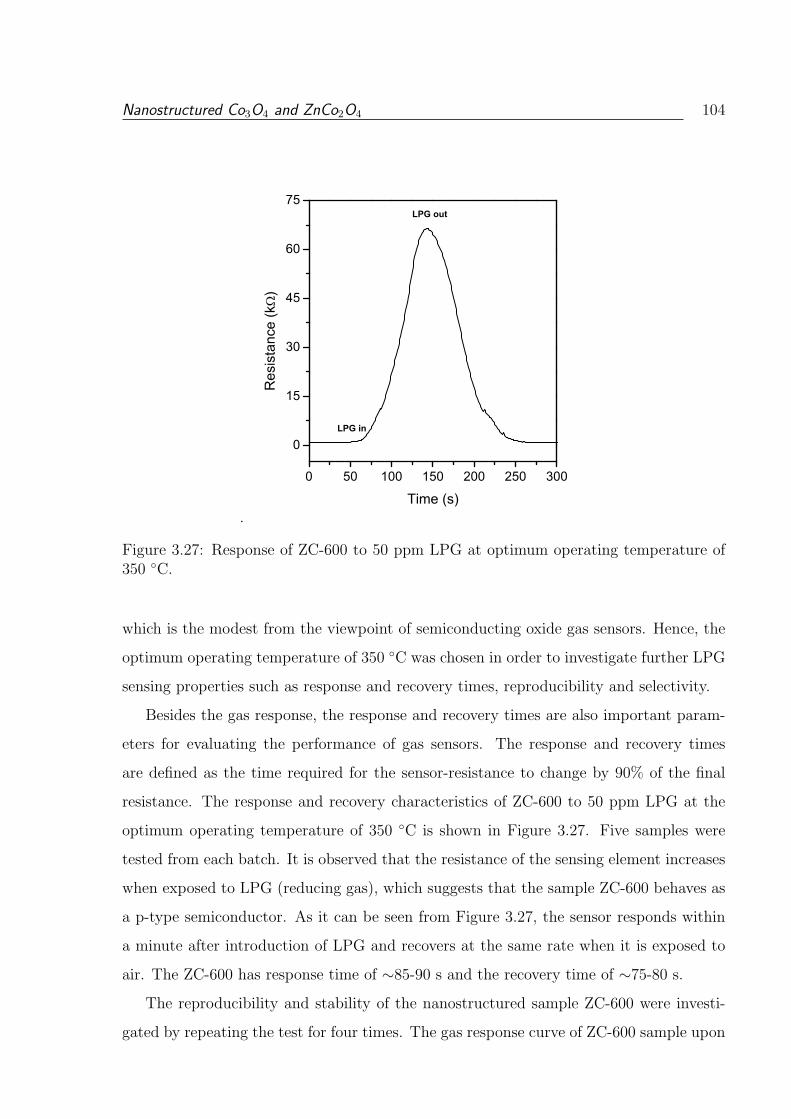
Nanostructured Co3O4 and ZnCo2O4 104
.
0 50 100 150 200 250 300
0
15
30
45
60
75LPG out
LPG in
Res
ista
nce
(k)
Time (s)
Figure 3.27: Response of ZC-600 to 50 ppm LPG at optimum operating temperature of350 C.
which is the modest from the viewpoint of semiconducting oxide gas sensors. Hence, the
optimum operating temperature of 350 C was chosen in order to investigate further LPG
sensing properties such as response and recovery times, reproducibility and selectivity.
Besides the gas response, the response and recovery times are also important param-
eters for evaluating the performance of gas sensors. The response and recovery times
are defined as the time required for the sensor-resistance to change by 90% of the final
resistance. The response and recovery characteristics of ZC-600 to 50 ppm LPG at the
optimum operating temperature of 350 C is shown in Figure 3.27. Five samples were
tested from each batch. It is observed that the resistance of the sensing element increases
when exposed to LPG (reducing gas), which suggests that the sample ZC-600 behaves as
a p-type semiconductor. As it can be seen from Figure 3.27, the sensor responds within
a minute after introduction of LPG and recovers at the same rate when it is exposed to
air. The ZC-600 has response time of ∼85-90 s and the recovery time of ∼75-80 s.
The reproducibility and stability of the nanostructured sample ZC-600 were investi-
gated by repeating the test for four times. The gas response curve of ZC-600 sample upon
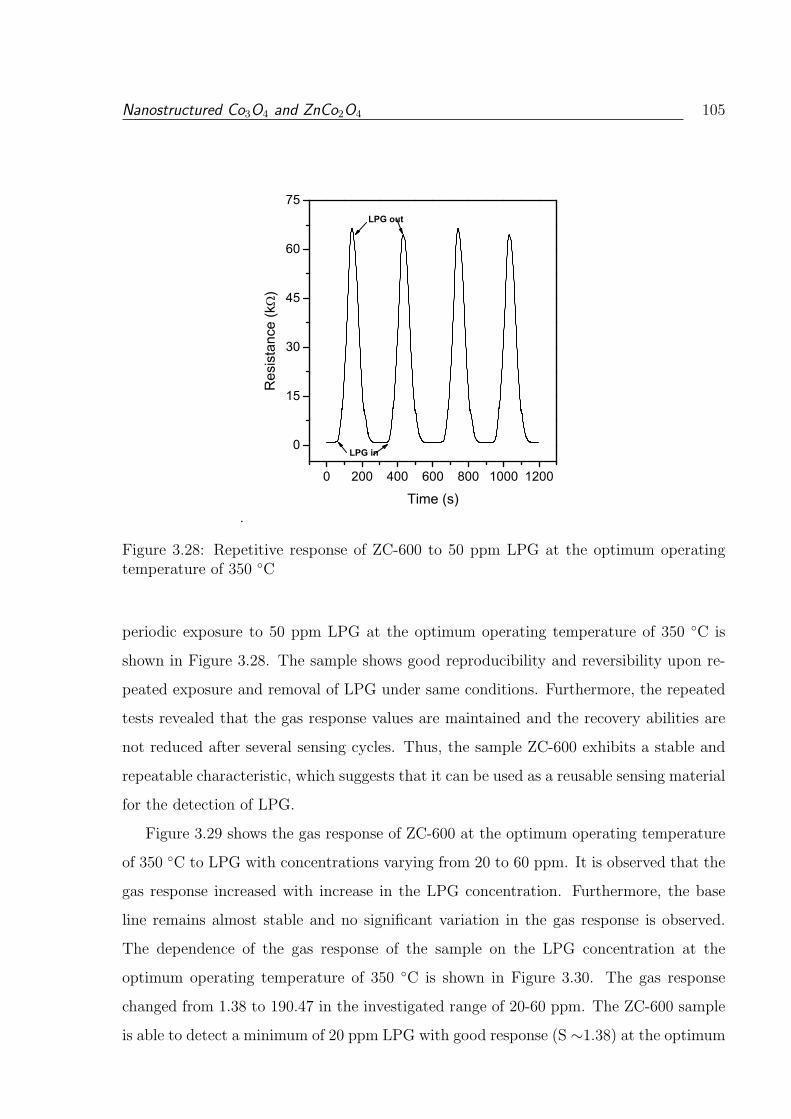
Nanostructured Co3O4 and ZnCo2O4 105
.
0 200 400 600 800 1000 1200
0
15
30
45
60
75LPG out
LPG in
Res
ista
nce
(k)
Time (s)
Figure 3.28: Repetitive response of ZC-600 to 50 ppm LPG at the optimum operatingtemperature of 350 C
periodic exposure to 50 ppm LPG at the optimum operating temperature of 350 C is
shown in Figure 3.28. The sample shows good reproducibility and reversibility upon re-
peated exposure and removal of LPG under same conditions. Furthermore, the repeated
tests revealed that the gas response values are maintained and the recovery abilities are
not reduced after several sensing cycles. Thus, the sample ZC-600 exhibits a stable and
repeatable characteristic, which suggests that it can be used as a reusable sensing material
for the detection of LPG.
Figure 3.29 shows the gas response of ZC-600 at the optimum operating temperature
of 350 C to LPG with concentrations varying from 20 to 60 ppm. It is observed that the
gas response increased with increase in the LPG concentration. Furthermore, the base
line remains almost stable and no significant variation in the gas response is observed.
The dependence of the gas response of the sample on the LPG concentration at the
optimum operating temperature of 350 C is shown in Figure 3.30. The gas response
changed from 1.38 to 190.47 in the investigated range of 20-60 ppm. The ZC-600 sample
is able to detect a minimum of 20 ppm LPG with good response (S ∼1.38) at the optimum
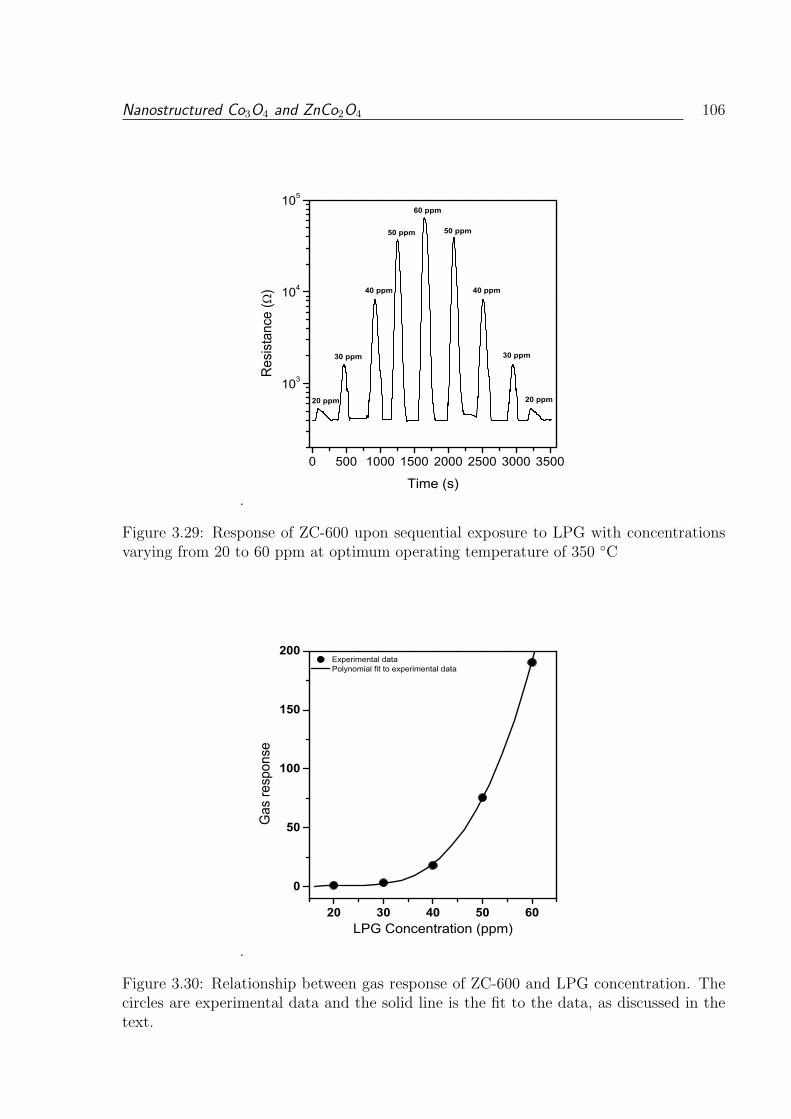
Nanostructured Co3O4 and ZnCo2O4 106
.
0 500 1000 1500 2000 2500 3000 3500
103
104
105
30 ppm
40 ppm
50 ppm
60 ppm
50 ppm
40 ppm
30 ppm
20 ppm20 ppm
Res
ista
nce
()
Time (s)
Figure 3.29: Response of ZC-600 upon sequential exposure to LPG with concentrationsvarying from 20 to 60 ppm at optimum operating temperature of 350 C
.
20 30 40 50 60
0
50
100
150
200 Experimental data Polynomial fit to experimental data
Gas
resp
onse
LPG Concentration (ppm)
Figure 3.30: Relationship between gas response of ZC-600 and LPG concentration. Thecircles are experimental data and the solid line is the fit to the data, as discussed in thetext.
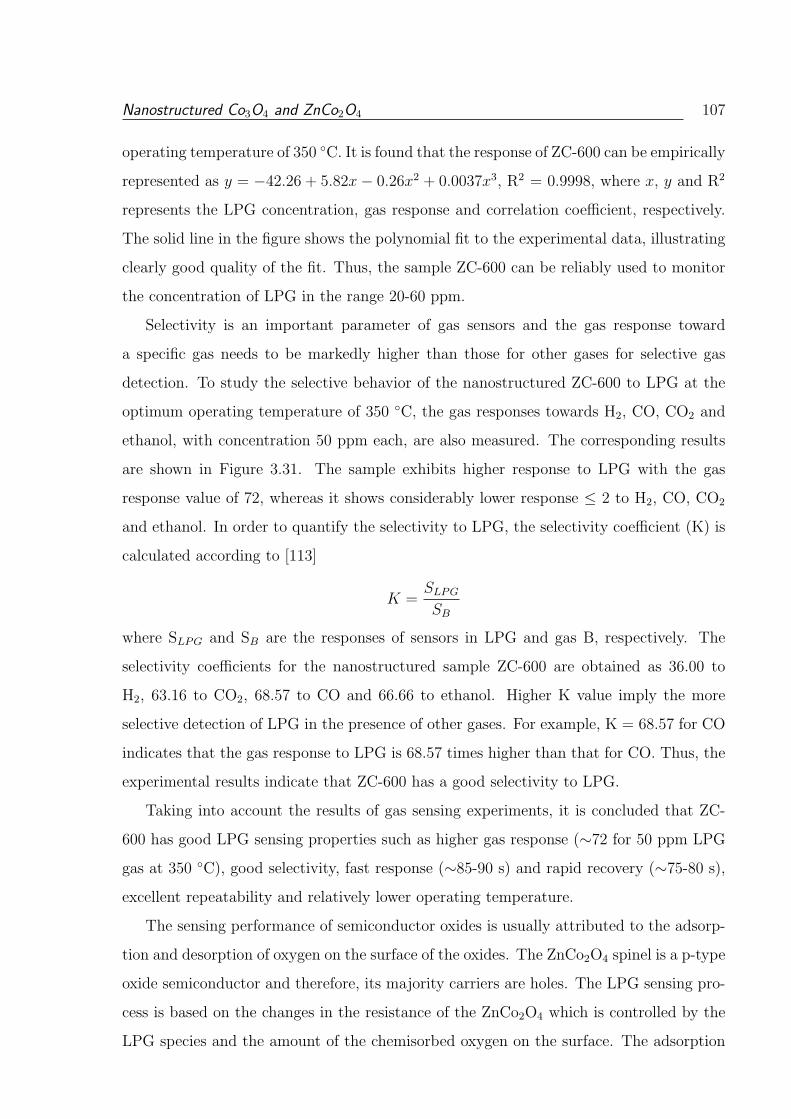
Nanostructured Co3O4 and ZnCo2O4 107
operating temperature of 350 C. It is found that the response of ZC-600 can be empirically
represented as y = −42.26 + 5.82x− 0.26x2 + 0.0037x3, R2 = 0.9998, where x, y and R2
represents the LPG concentration, gas response and correlation coefficient, respectively.
The solid line in the figure shows the polynomial fit to the experimental data, illustrating
clearly good quality of the fit. Thus, the sample ZC-600 can be reliably used to monitor
the concentration of LPG in the range 20-60 ppm.
Selectivity is an important parameter of gas sensors and the gas response toward
a specific gas needs to be markedly higher than those for other gases for selective gas
detection. To study the selective behavior of the nanostructured ZC-600 to LPG at the
optimum operating temperature of 350 C, the gas responses towards H2, CO, CO2 and
ethanol, with concentration 50 ppm each, are also measured. The corresponding results
are shown in Figure 3.31. The sample exhibits higher response to LPG with the gas
response value of 72, whereas it shows considerably lower response ≤ 2 to H2, CO, CO2
and ethanol. In order to quantify the selectivity to LPG, the selectivity coefficient (K) is
calculated according to [113]
K =SLPG
SB
where SLPG and SB are the responses of sensors in LPG and gas B, respectively. The
selectivity coefficients for the nanostructured sample ZC-600 are obtained as 36.00 to
H2, 63.16 to CO2, 68.57 to CO and 66.66 to ethanol. Higher K value imply the more
selective detection of LPG in the presence of other gases. For example, K = 68.57 for CO
indicates that the gas response to LPG is 68.57 times higher than that for CO. Thus, the
experimental results indicate that ZC-600 has a good selectivity to LPG.
Taking into account the results of gas sensing experiments, it is concluded that ZC-
600 has good LPG sensing properties such as higher gas response (∼72 for 50 ppm LPG
gas at 350 C), good selectivity, fast response (∼85-90 s) and rapid recovery (∼75-80 s),
excellent repeatability and relatively lower operating temperature.
The sensing performance of semiconductor oxides is usually attributed to the adsorp-
tion and desorption of oxygen on the surface of the oxides. The ZnCo2O4 spinel is a p-type
oxide semiconductor and therefore, its majority carriers are holes. The LPG sensing pro-
cess is based on the changes in the resistance of the ZnCo2O4 which is controlled by the
LPG species and the amount of the chemisorbed oxygen on the surface. The adsorption
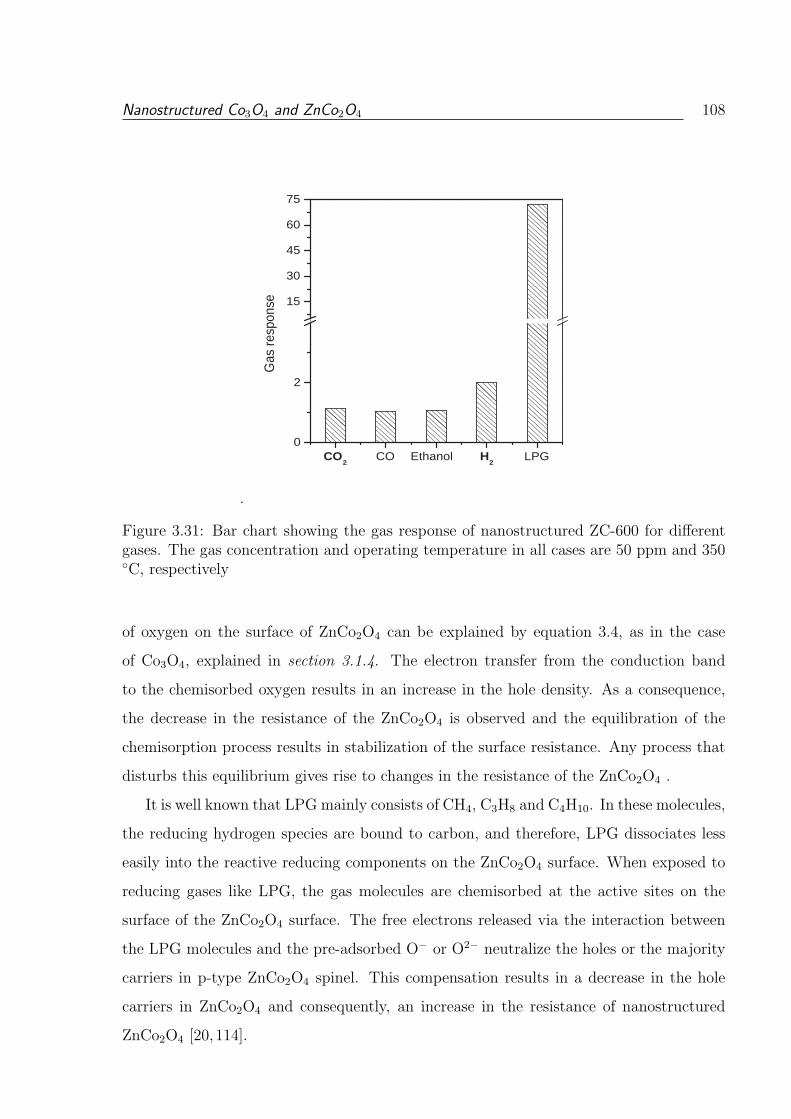
Nanostructured Co3O4 and ZnCo2O4 108
.
CO 2
CO Ethanol H 2
LPG 0
2
15
30
45
60
75
Gas
resp
onse
Figure 3.31: Bar chart showing the gas response of nanostructured ZC-600 for differentgases. The gas concentration and operating temperature in all cases are 50 ppm and 350C, respectively
of oxygen on the surface of ZnCo2O4 can be explained by equation 3.4, as in the case
of Co3O4, explained in section 3.1.4. The electron transfer from the conduction band
to the chemisorbed oxygen results in an increase in the hole density. As a consequence,
the decrease in the resistance of the ZnCo2O4 is observed and the equilibration of the
chemisorption process results in stabilization of the surface resistance. Any process that
disturbs this equilibrium gives rise to changes in the resistance of the ZnCo2O4 .
It is well known that LPG mainly consists of CH4, C3H8 and C4H10. In these molecules,
the reducing hydrogen species are bound to carbon, and therefore, LPG dissociates less
easily into the reactive reducing components on the ZnCo2O4 surface. When exposed to
reducing gases like LPG, the gas molecules are chemisorbed at the active sites on the
surface of the ZnCo2O4 surface. The free electrons released via the interaction between
the LPG molecules and the pre-adsorbed O− or O2− neutralize the holes or the majority
carriers in p-type ZnCo2O4 spinel. This compensation results in a decrease in the hole
carriers in ZnCo2O4 and consequently, an increase in the resistance of nanostructured
ZnCo2O4 [20, 114].
Nanostructured Co3O4 and ZnCo2O4 109
The LPG sensing characteristics of the nanostructured ZC-600 sample is better than
or comparable to those of the sensors with other oxide semiconductors. Jiao et al [115]
reported an LPG sensor based on ZnGa2O4 nanocrystals (10-20 nm) having a maximum
sensitivity of ∼7 at 410 C and having response time of a few seconds, with a recovery
time of ∼60 s for 500 ppm of LPG. Waghulade et al [16] reported the synthesis of CdO
nanoparticles by using chemical coprecipitation method and investigated the LPG sensing
performance. The CdO nanoparticles showed a maximum sensitivity of 3.41 at 450 C
with the response and recovery times of 3-5 and 8-10 s for 25 ppm of LPG, respectively.
Salunke et al [116] reported a chemical bath deposition of unsensitized and Pd-sensitized
CdO nanorods and investigated their LPG sensing performance. The unsensitized CdO
nanorods exhibited a maximum response of ∼0.14 at 425 C for 0.1 vol% of LPG, which
improved up to 0.35 at an optimum temperature of 375 C after Pd-sensitization, with
response and recovery times of 30 s and 90 s, respectively. Phani et al [108] investigated
the LPG sensing property of Pd doped SnO2. The Pd (1.5 wt%) doped SnO2 showed a
maximum sensitivity of 0.97 at 350 C for 1000 ppm. Sahay et al [117] reported chemical
spray deposited Al doped ZnO thin films for LPG sensors. The 0.5 at.% Al doped ZnO
thin films showed a maximum sensitivity of 0.89 at 325 C for 1 vol% of LPG. Chaudhari
et al [118] studied the LPG sensor based on nanosized BaTiO3 (∼65 nm) thick films,
which showed a maximum sensitivity of 0.45 at 300 C for 5000 ppm of LPG and an
improvement in the sensitivity and selectivity was observed by doping BaTiO3 with CuO
and CdO. However, the present LPG sensor based on nanostructured ZnCo2O4 without
any activators show a high gas response of 72 for 50 ppm of LPG at a relatively lower
operating temperature of 350 C, as shown in Figure 3.26. Furthermore, the material has
a high gas response of 1.38-190.47 for 20-60 ppm of LPG, excellent repeatability and good
selectivity when operating at 350 C.
3.2.4 Conclusions
Nanostructured ZnCo2O4 spinel (26-30 nm) is successfully synthesized by calcining a
mixed precursor consisting of cobalt hydroxy carbonate and zinc hydroxy carbonate at
at different temperatures. The sample calcined at 600 C in air for 5 h is found to be
a good sensor for LPG gas. The gas response to 50 ppm of LPG is found to be max-
Nanostructured Co3O4 and ZnCo2O4 110
imum at an optimum operating temperature of 350 C. The maximum gas response is
obtained as ∼72, much larger than that reported in the literature using different nanos-
tructured oxide materials, with a response time of nearly 85-90 s and recovery time of
75-80 s. The minimum detection limit of the nanostructured ZnCo2O4 is 20 ppm of LPG
with reasonable response (∼1.38) at 350 C. Further, the LPG sensor based on ZnCo2O4
has a high gas response of 1.38-190.47 to 20-60 ppm LPG, excellent repeatability and
good selectivity when operating at 350 C. The overall LPG sensing performance of the
nanostructured ZnCo2O4 is better than those of most of the oxide semiconductor sensors
already developed.
References
[1] H.S. Roh, H.S. Potdar, K.W. Jun, J.W. Kim, Y.S. Oh, Appl. Catal. A: Gen.
276 (2004) 231.
[2] X. Xie, Y. Li, Z.Q. Liu, M. Haruta, W. Shen, Nature 458 (2009) 746.
[3] W.Y. Li, L.N. Xu, J. Chen, Adv. Func. Mater. 15 (2005) 851.
[4] L. Fu, Z. Liu, Y. Liu, B. Han, P. Hu, L. Cao, D. Zhu, Adv. Mater. 17 (2005)
217.
[5] M. G. Hutchins, P. J. Wright and P. D. Grebenik, Sol. Energ. Mater. 16, (1987)
113.
[6] N. Wu, M. Zhao, J.G. Zheng, C. Jiang, B. Myers, S. Li, M. Chyu, S.X. Mao,
Nanotechnology 16 (2005) 2878-2881.
[7] A. Srivastava, R. K. Jain, Mater. Chem. Phys. 105 (2007) 385.
[8] W.J. Moon, J.H. Yu, G.M. Choi, Sensor. Actuat. B 87 (2002) 464.
[9] T. Zhang, L. Liu, Q. Qi, S. Li, G. Lu, Sensor. Actuat. B. 139 (2009) 287.
[10] K.I. Choi, H.R. Kim, J.H. Lee, Sensor. Actuat. B 138 (2009) 497.
[11] B. Bahrami, A. Khodadadi, M. Kazemeini, Y. Mortazavi, Sensor. Actuat. B 133
(2008) 352.
[12] L. Zhang, J. Hu, P. Song, H. Qin, K. An, X. Wang, M. Jiang, Sensor. Actuat.
B 119 (2006) 315.
[13] C.C. Wang, S.A. Akbar, M.J. Madou, J. Electroceram. 2 (1998) 273
References 112
[14] N. Barsan, U. Weimar, J. Electroceram. 7 (2001 ) 143
[15] J.X. Wang, X.W. Sun, H. Huang, Y.C. Lee, O.K. Tan, M.B. Yu, G.Q. Lo, D.L.
Kwong, Appl. Phys. A 88 (2007) 611.
[16] R.B. Waghulade, P.P. Patil, R. Pasricha, Talanta 72 (2007) 594.
[17] C. Wu, P. Yin, X. Zhu, C. OuYang, Y. Xie, J. Phys. Chem. B 110 (2006) 17806.
[18] Y. Jia, L.F. He, Z. Guo, X. Chen, F.L. Meng, T. Luo, M.Q. Li, J.H. Liu,J. Phys.
Chem. C 113 (2009) 9581.
[19] C. Li, D. Zhang, B. Lei, S. Han, X. Liu, C. Zhou, J. Phys. Chem. B 107 (2003)
12451
[20] X. Gou, G. Wang, J. Yang, J. Park, D. Wexler, J. Mater Chem. 18 (2008) 965
[21] C.C. Li, Z.F. Du, L.M. Li, H.C. Yu, Q. Wan, T.H. Wang, Appl. Phys. Lett. 91
(2007) 032101.
[22] A.M. Cao, J.S. Hu, H.P. Liang, W.G. Song, L.J. Wan, X.L. He, X.G. Gao, S.H.
Xia, J. Phys. Chem. B 110 (2006) 15858.
[23] Y.Z. Wang, Y.X. Zhao, C.G. Gao, D.S. Liu, Catal. Lett. 116 (2007) 136
[24] Y.F.Y. Yao, J. Catal. 33 (1974) 108
[25] R.S. Drago, K. Jurczyk, D.J. Singh, V. Young, App. Catal. B 6 (1995) 155.
[26] E.V. Steen , H. Schulz, Appl. Catal. A 186 (1999 ) 309
[27] Z.L. Zhang, H.R. Geng, L.S. Zheng, B. Du, J. Alloy. Compd. 392 (2005) 317.
[28] M. Casas-Cabanas, G. Binotto, D. Larcher, A. Lecup, V. Giordani, J.M. Taras-
con, Chem. Mater. 21 (2009) 1939.
[29] M. Guisnet, J. Barrauit, C. Bouchoule, D. Duperz, G. Perot, R. Maure land, C.
Montassier, Heterogeneous Catalysis and Fine Chemicals II.
[30] T. Mallat, A. Baiker, Chem. Rev. 104 (2004) 3037.
References 113
[31] Y. Su, L.C. Wang, Y.M. Liu, Y. Cao, H.Y. He, K.N. Fan, Cataly. Commun. 8
(2007) 2181.
[32] T. Punniyamurthy, S. Velusamy, J. Iqbal, Chem. Rev. 105 ( 2005) 2329.
[33] Z. Dong, Y. Fu, Q. Han, Y. Xu, H. Zhang, J. Phys. Chem. C 111 (2007) 18475.
[34] B.B. Lakshmi, C.J. Patrissi, C.R. Martin, Chem. Mater. 9 (1997) 2544.
[35] K.T. Nam, D.W. Kim, P.J. Yoo, C.Y. Chiang, N. Meethong, P.T. Hammond,
Y.M. Chiang, A.M. Belcher, Science 312 (2006) 885.
[36] R.M. Wang, C.M. Liu, H.Z. Zhang, C.P. Chen, L. Guo, H.B. Xu, S.H. Yang,
App. Phys. Lett. 85 (2004) 2080.
[37] R.N. Singh, J.F. Koenig, G. Poillerat, P. Chartier, J. Electrochem. Soc. 137
(1990) 1408.
[38] B. Li, Y. Xie, C. Wu, Z. Li, J. Zhang, Mater. Chem. Phys. 99 (2006) 479.
[39] Y.H. Ni, X.W. Ge, Z.C. Zhang, H.R. Liu, Z.L. Zhu, Q. Ye, Mater. Res. Bull. 36
(2001) 2383.
[40] Z. Wang, X. Chen, M. Zhang, Y. Qian, Solid State Sci. 7 (2005) 13.
[41] T. Baird, K.C. Campbell, P.J. Holliman, R.W. Hoyle, D. Stirling, B.P. Williams,
M. Morris, J. Mater. Chem. 7 (1997) 319.
[42] P. Porta, R. Dragone, G. Fierro, M. Inversi, M. Lojacono, G. Moretti, J. Chem.
Soc. Faraday Trans. 88 (1992) 311.
[43] R. Xu, H.C. Zeng, J. Phys. Chem. B 107 (2003) 12643.
[44] D.G. Klissurski, E.L. Uzunova, Chem. Mater. 3 (1991) 1060.
[45] A.G. Belous, O.Z. Yanchevskii, A.V. Kramarenko, Russ. J. Appl. Chem. 79
(2006) 345.
[46] D.G. Klissurski, E.L. Uzunova, J. Mater. Sci. Lett. 9 (1990) 1255.
References 114
[47] M.G. Mostafa, A. Matsumoto, K. Wase, Y. Kishi, Hydrometallurgy 57 (2000)
97.
[48] S. Lacor, R.P. Van Hille, K. Peterson, A.E. Lewis, AIChE J. 51 (2005) 2358.
[49] H.S. Potdar, K.W. Jun, J.W. Bae, S.M. Kim, Y.J. Lee, App. Catal. A 321 (2007)
109.
[50] Z. Jin, H.J. Zhou, Z.L. Jin, Sensor. Actuat. B 52 (1998) 188.
[51] S.H. Wang, T.C. Chou, C.C. Liu, Sensor. Actuat. B 94 (2003) 343.
[52] J. Liu, H. Xia, L. Lu, D. Xue, J. Mater.Chem. 20 (2010) 1506.
[53] Y. Wang, H.C. Zeng, J.Y. Lee, Adv. Mater. 18 (2006) 645.
[54] S. Park, R.J. Gorte, J.M. Vohs, Appl. Catal. A: 200 (2000) 55.
[55] J.C. Ganley, K.L. Riechmann, E.G. Seebauer, R.I. Masel, J. Catal. 227 (2004)
26.
[56] M. Sato, H. Hara, H. Kuritani, T. Nishide, Sol. Ener. Mat. Sol. C 45 (1997) 43.
[57] E.S. Toberer, M. Grossman, T. Schladt, F.F. Lange, R. Seshadri, Chem. Mater.
19 (2007) 4833.
[58] S.A. Corr, D.P. Shoemaker, E.S. Toberer, R. Seshadri, J. Mater. Chem. 20
(2010) 1413.
[59] R.L. Penn, J.F. Banfield, Geochim. Cosmochim. Acta 63 (1999) 1549.
[60] S.R. Dhage, S.P. Gaikwad, P. Muthukumar, V. Ravi, Ceram. Int. 31 (2005) 211.
[61] M. Anilkumar, V. Ravi, Mater. Res. Bull. 40 (2005) 605.
[62] T. He, D. Chen, X. Jiao, Chem. Mater. 16 (2004) 737.
[63] The software is freely available from http://www.ccp14.ac.uk.
[64] G. Wang, X. Shen, J. Horvat, B. Wang, H. Liu, D. Wexler, J. Yao, J. Phys.
Chem. C 113 (2009) 4357.
References 115
[65] E. Hosono, S. Fujihara, I. Honma, H. Zhou, J. Mater. Chem. 15 (2005) 1938.
[66] X. Xie, P. Shang, Z. Liu, Y. Lv, Y. Li, W. Shen, J. Phys. Chem. C 114 (2010)
2116.
[67] B. Lefez, P. Nkeng, J. Lopitaux, G. Poillerat, Mater. Res. Bull. 31 (1996) 1263.
[68] P. Nkeng, G. Poillerat, J.F. Koenig, P. Chartier, B. Lefez, J. Lopitaux, M.
Lenglet, J. Electrochem. Soc. 142 (1995) 1777.
[69] C.B. Wang, C.W. Tang, S.J. Gau, S.H. Chien, Catal. Lett. 101 (2005) 59.
[70] K.S.W. Sing, D.H. Everett, R.A.W. Haul, L. Moscou, R.A. Pierotti, J. Rou-
querol, T. Siemieniewska, Pure Appl. Chem. 57 (1985) 603
[71] T. Baird, K.C. Campbell, P.J. Holliman, R.W. Hoyle, M. Huxam, D. Stirling,
B.P. Williams, M. Morris, J. Mater. Chem. 9 (1999) 599.
[72] C. Blaauw, F. Leenhouts, F. Woude, G.A. Sawatzky, J. Phys. C: Solid State 8
(1975) 459.
[73] J. Haber, J. Stoch, L. Ungler, J. Solid State Chem. 19 (1976) 113.
[74] B.J. Tan, K.J. Klabunde, P.M.A. Sherwood, J. Am. Chem. Soc. 113 (1991) 855.
[75] C.V. Chenck, J.G. Dillard, J.W. Murray, J. Colloid Interf. Sci. 95 (1983) 398.
[76] M. Oku, Y. Sato, Appl. Surf. Sci. 55 (1992) 37.
[77] T.J. Chuang, C.R. Brundle, D.W. Rice, Surf. Sci. 59 (1976) 413.
[78] M.A. Langell, M.D. Anderson, G.A. Carson, L. Peng, S. Smith, Phys. Rev. B
59 (1999) 4791.
[79] P.A. Joy, S.K. Date, J. Magn. Magn. Mater. 222 (2000) 33.
[80] S. Gangopadhyay, G.C. Hadjipanayis, C.M. Sorensen, K.J. Klabunde, J. Appl.
Phys. 73 (1993) 6964.
[81] W.L. Roth, J. Phys. Chem. Solids 25 (1964) 1.
References 116
[82] C.D. Spencer, D. Schroeer, Phys. Rev. B 9 (1974) 3658.
[83] S. Vijayanand, M.B. Mahajan, H.S. Potdar, P.A. Joy, Phys. Rev. B 80 (2009)
64423.
[84] D. Parker, F. Ladieu, E. Vincent, G. Mriguet, E. Dubois, V. Dupuis, R. Perzyn-
ski, J. Appl. Phys. 97 (2005) 10A502.
[85] M. Sasaki, P.E. Jnsson, H. Takayama, H. Mamiya, Phys. Rev. B 71 (2005)
104405.
[86] S. Deka, P.A. Joy, J. Nanosci. Nanotech. 8 (2008) 3955.
[87] M.R. Anantharaman, S. Jagatheesan, K.A. Malini, S. Sindhu, A. Narayanasamy,
C.N. Chinnasamy, J.P. Jacobs, S. Reijne, K. Seshan, R.H.H. Smits, J. Magn.
Magn. Mater. 189 (1998) 83.
[88] C.N.R. Rao, M.M. Seikh, C. Narayana, Top. Curr. Chem. 284 (2004) 1.
[89] X.J. Huang, Y.K. Choi, Sensor. Actuat. B 122 (2007) 659.
[90] M. Siemons, U. Simon, Sensor. Actuat. B 120 (2006) 110.
[91] Z. Liu, T. Yamazaki, Y. Shen, T. Kikuta, N. Nakatani, T. Kawabata, Appl.
Phys. Lett. 90 (2007) 173119.
[92] H. Huang, O.K. Tan, Y.C. Lee, T.D. Tran, M.S. Tse, X. Yao, Appl. Phys. Lett.
87 (2005) 163123.
[93] A. Ponzoni, E. Comini, G. Sberveglieri, J. Zhou, S.Z. Deng, N.S. Xu, Y. Ding,
Z.L. Wang, Appl. Phys. Lett. 88 (2006) 203101.
[94] H. Mbarek, M. Saadoun, B. Bessa s, Mater. Sci. Eng. C 26 (2006) 500.
[95] K. Arshak, I. Gaidan, Sensor. Actuat. B 111 (2005) 58
[96] D. Kohl, Sensor. Actuator. 18 (1989) 71.
[97] D. Koziej, K. Thomas, N. Barsan, F. Thibault-Starzyk, U. Weimar, Catal. Today
126 (2007) 211.
References 117
[98] K. Kervinen, P. Lahtinen, T. Repo, M. Svahn, M. Leskel, Catal. Today 75
(2002) 183.
[99] K. Kervinen, H. Korpi, M. Leskel, T. Repo, J. Mole. Cat. A 203 (2003) 9.
[100] D. Klissurski, E. Uzunova, K. Yankova, Appl. Catal. A 95 (1993) 103.
[101] K. Papadatos, K.A. Shelstad, J. Catal. 28 (1973) 116.
[102] S. Trasatti, The Electrochemistry of Novel Materials, VCH, Weinheim, 1994,
207.
[103] K. Omata, T. Takada, S. Kasahara, M. Yamada, Appl. Catal. A 146 (1996) 255.
[104] Y. Sharma, N. Sharma, G.V.S. Rao, B.V.R. Chowdari, Adv. Funct. Mater. 17
(2007) 2855.
[105] X. Wei, D. Chen, W. Tang, Mater. Chem. Phys. 103 (2007) 54.
[106] G.Y. Zhang, B. Guo, J. Chen, Sensor. Actuat. B 114 (2006) 402.
[107] X. Niu, W. Du, W. Du, Sensor. Actuat. B 99 (2004) 405.
[108] A.R. Phani, Appl. Phys. Lett. 71 ( 1997) 2358.
[109] L.D. Feng, X.J. Huang, Y.K. Choi, Microchim. Acta 156 (2006) 245.
[110] N. Kanari, D. Mishra, I. Gaballah, B. Dupre, Thermochim. Acta 410 (2004) 93
[111] J. Preudhomme, P. Tarte, Spectrochim. Acta A 27 (1971) 1817.
[112] I. Grohmann, B. Peplinski, W. Unger, Surf. Interface Anal. 19 (1992) 591.
[113] M. Siemons, U. Simon, Sensor. Actuat. B 126 (2007) 595
[114] D. Patil, P. Patil, V. Subramanian, P.A. Joy, H.S. Potdar, Talanta 81 (2010) 37.
[115] Z. Jiao, G. Ye, F. Chen, M. Li, J. Liu, Sensors 2 (2002) 71.
[116] R.R. Salunkhe, D.S. Dhawale, U.M. Patil, C.D. Lokhande, Sensor. Actuat. B.
136 (2009) 39.

References 118
[117] P.P. Sahay, R.K. Nath, Sensor. Actuat. B 133 (2008) 222.
[118] G.N. Chaudhari, D.R. Bambole, A.B. Bodade, Vacuum 81 (2006) 251.
Chapter 4
Nanocrystalline Co3O4 in Li-ionBatteries and Supercapacitors
4.1 Introduction
The ever growing need for better energy storage materials demands compelling improve-
ments in the primary energy technology sector such as batteries, fuel cells, solar cells
and supercapacitors. Among them Li-ion batteries (LIB) represent one of the dominant
candidates for mobile phones and portable applications, due to their high energy density,
modularity and long cycle life [1–5]. The present generation of LIB, however, uses expen-
sive components that will restrict the growth of LIB in the next decade, urging researchers
to develop better materials that are cheaper and more efficient. Transition metal oxides
are known to have, in principle, higher capacity but suffer major set backs in the per-
spective of cycle life [6–8]. On the other hand, the commercial batteries use carbonaceous
materials as the negative electrode that have shown reasonable cycle life despite posing
severe restrictions on the maximum attainable energy density (<372 mAhg−1) along with
staging and fading of capacity that is commonly observed in these electrodes [9]. This
prompted the need for immense research on alternate electrode materials, from a wide va-
riety of compounds ranging from metal oxides and intercalation compounds of transition
metals to nanostructured materials such as Si/Sn based nanowires and hybrid materials
like LiFePO4 [10–15]. In the case of nanostructured materials, different morphologies,
such as nanowires, nanotubes and nanorods, tend to give varying energy density due to
their preferred orientational features [16–20].
The tremendous growth in the consumption of energy resulted in an urgent need for
efficient energy conversion and storage. While fuel cells and batteries offer higher energy
Co3O4 in Li-ion Batteries and Supercapacitors 120
density, they cannot offer very high power density. On the other hand, electrochemical
supercapacitors provide higher power density when compared to the Li-ion batteries. The
simplified Ragone plots (see Figure 1.13 in chapter 1) clearly reveal that to match the
performance of internal combustion engines, a hybrid between supercapacitors with fuel
cell and/or batteries is necessary [21]. Further, supercapacitors are suitable for many
applications such as hybrid electric vehicles, uninterrupted power supplies and backup
power sources for computer memory due to their higher power density and longer cycle
life. Supercapacitors are generally of two types, electric double layer capacitors (EDLCs),
where non-faradaic processes are the key for energy storage while in pseudo-capacitors,
the redox process of the active material contributes for the capacitance. The application
of RuO2.xH2O as an electrode material marked a new breakthrough in pseudo-capacitors
that brought the attention towards various transition metal oxides such as NiO, MnO2,
and Ni(OH)2 for electrode applications [22–24].
Among transition metal oxides, Co3O4 with selective shapes has recently been shown
to be a promising anode material for LIB technology [25–28]. The inherent advantages
of the needle like structures obtained through a virus enabled synthesis route is utilized
for increased capacity [26]. Similarly, the influence of shape over the capacity has been
demonstrated [29]. After proving its utility as an anode material in Li-ion batteries, Co3O4
has also prompted the research on its supercapacitive behavior due to the presence of redox
couple to show pseudocapacitive behavior [30,31]. An important criterion to improve the
energy density of any transition metal oxide based electrode is to improve the electrode-
electrolyte interface by means of reducing the particle size and increasing the porosity [31].
Hence, the Co3O4 porous nanorods prepared by a template free simple and facile
coprecipitation/digestion method, as described in the previous chapter (the sample CC-
300) has been tested as an anode material in the LIB application and also evaluated for
its performance in a supercapacitor .
4.2 Application as anode in LIB
For the evaluation of Co3O4 as the anode material for rechargeable LIB, a mixture of
Co3O4 obtained by calcining the precursor at 300 C (CC-300), Vulcan XC-72 carbon
and Nafion taken in the ratio of 75:20:5, was brushed on a stainless steel 316 (SS) mesh
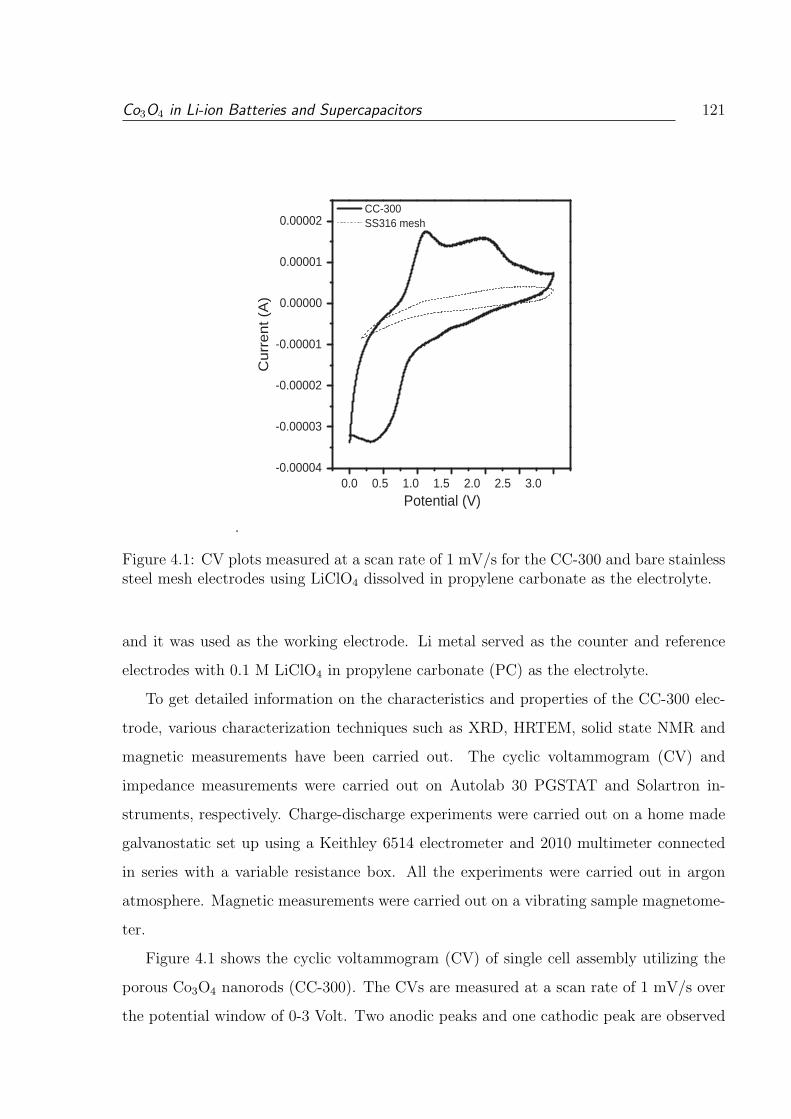
Co3O4 in Li-ion Batteries and Supercapacitors 121
.
0.0 0.5 1.0 1.5 2.0 2.5 3.0 -0.00004
-0.00003
-0.00002
-0.00001
0.00000
0.00001
0.00002 CC-300 SS316 mesh
Curr
ent (A
)
Potential (V)
Figure 4.1: CV plots measured at a scan rate of 1 mV/s for the CC-300 and bare stainlesssteel mesh electrodes using LiClO4 dissolved in propylene carbonate as the electrolyte.
and it was used as the working electrode. Li metal served as the counter and reference
electrodes with 0.1 M LiClO4 in propylene carbonate (PC) as the electrolyte.
To get detailed information on the characteristics and properties of the CC-300 elec-
trode, various characterization techniques such as XRD, HRTEM, solid state NMR and
magnetic measurements have been carried out. The cyclic voltammogram (CV) and
impedance measurements were carried out on Autolab 30 PGSTAT and Solartron in-
struments, respectively. Charge-discharge experiments were carried out on a home made
galvanostatic set up using a Keithley 6514 electrometer and 2010 multimeter connected
in series with a variable resistance box. All the experiments were carried out in argon
atmosphere. Magnetic measurements were carried out on a vibrating sample magnetome-
ter.
Figure 4.1 shows the cyclic voltammogram (CV) of single cell assembly utilizing the
porous Co3O4 nanorods (CC-300). The CVs are measured at a scan rate of 1 mV/s over
the potential window of 0-3 Volt. Two anodic peaks and one cathodic peak are observed
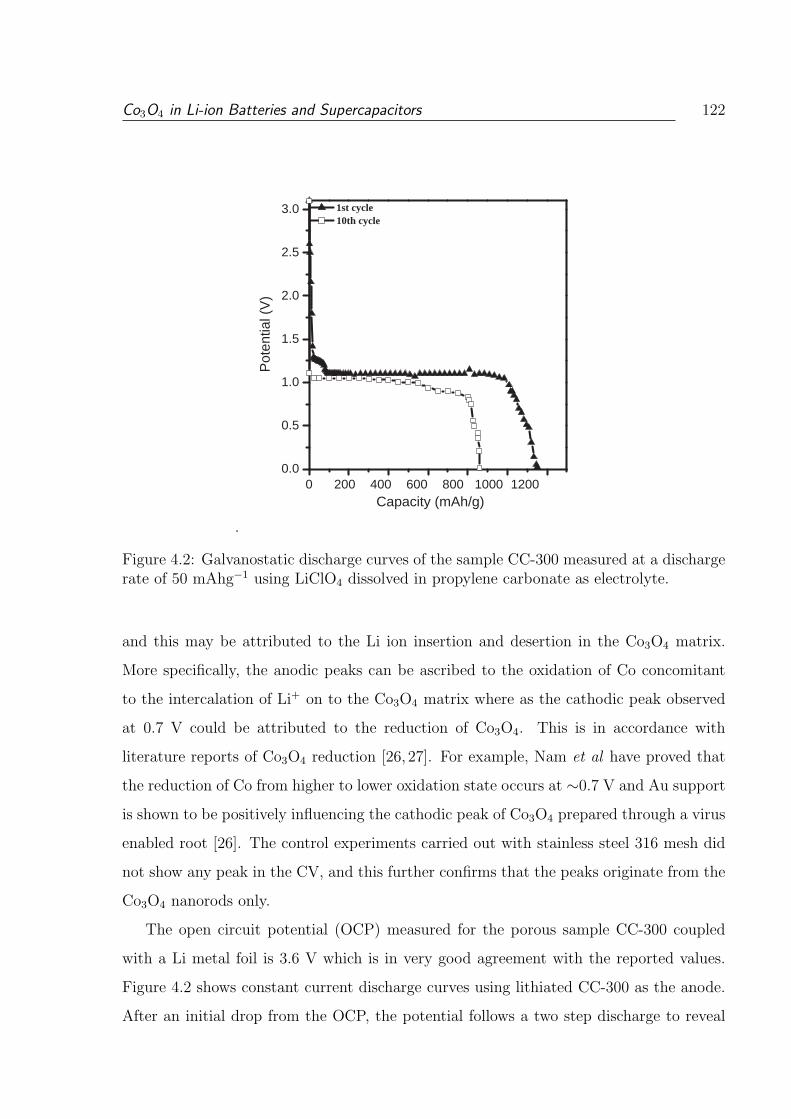
Co3O4 in Li-ion Batteries and Supercapacitors 122
.
0 200 400 600 800 1000 1200 0.0
0.5
1.0
1.5
2.0
2.5
3.0
1st cycle 10th cycle
Pot
entia
l (V
)
Capacity (mAh/g)
Figure 4.2: Galvanostatic discharge curves of the sample CC-300 measured at a dischargerate of 50 mAhg−1 using LiClO4 dissolved in propylene carbonate as electrolyte.
and this may be attributed to the Li ion insertion and desertion in the Co3O4 matrix.
More specifically, the anodic peaks can be ascribed to the oxidation of Co concomitant
to the intercalation of Li+ on to the Co3O4 matrix where as the cathodic peak observed
at 0.7 V could be attributed to the reduction of Co3O4. This is in accordance with
literature reports of Co3O4 reduction [26, 27]. For example, Nam et al have proved that
the reduction of Co from higher to lower oxidation state occurs at ∼0.7 V and Au support
is shown to be positively influencing the cathodic peak of Co3O4 prepared through a virus
enabled root [26]. The control experiments carried out with stainless steel 316 mesh did
not show any peak in the CV, and this further confirms that the peaks originate from the
Co3O4 nanorods only.
The open circuit potential (OCP) measured for the porous sample CC-300 coupled
with a Li metal foil is 3.6 V which is in very good agreement with the reported values.
Figure 4.2 shows constant current discharge curves using lithiated CC-300 as the anode.
After an initial drop from the OCP, the potential follows a two step discharge to reveal
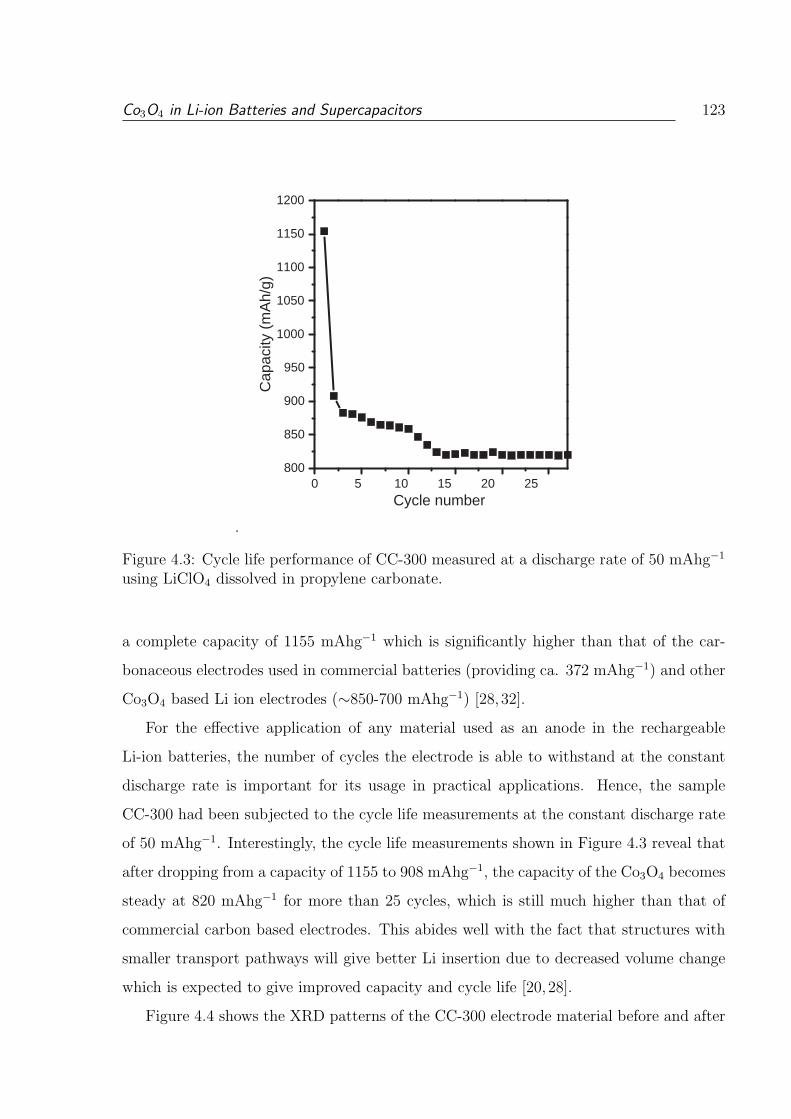
Co3O4 in Li-ion Batteries and Supercapacitors 123
.
0 5 10 15 20 25 800
850
900
950
1000
1050
1100
1150
1200
C
apac
ity (
mA
h/g)
Cycle number
Figure 4.3: Cycle life performance of CC-300 measured at a discharge rate of 50 mAhg−1
using LiClO4 dissolved in propylene carbonate.
a complete capacity of 1155 mAhg−1 which is significantly higher than that of the car-
bonaceous electrodes used in commercial batteries (providing ca. 372 mAhg−1) and other
Co3O4 based Li ion electrodes (∼850-700 mAhg−1) [28,32].
For the effective application of any material used as an anode in the rechargeable
Li-ion batteries, the number of cycles the electrode is able to withstand at the constant
discharge rate is important for its usage in practical applications. Hence, the sample
CC-300 had been subjected to the cycle life measurements at the constant discharge rate
of 50 mAhg−1. Interestingly, the cycle life measurements shown in Figure 4.3 reveal that
after dropping from a capacity of 1155 to 908 mAhg−1, the capacity of the Co3O4 becomes
steady at 820 mAhg−1 for more than 25 cycles, which is still much higher than that of
commercial carbon based electrodes. This abides well with the fact that structures with
smaller transport pathways will give better Li insertion due to decreased volume change
which is expected to give improved capacity and cycle life [20, 28].
Figure 4.4 shows the XRD patterns of the CC-300 electrode material before and after
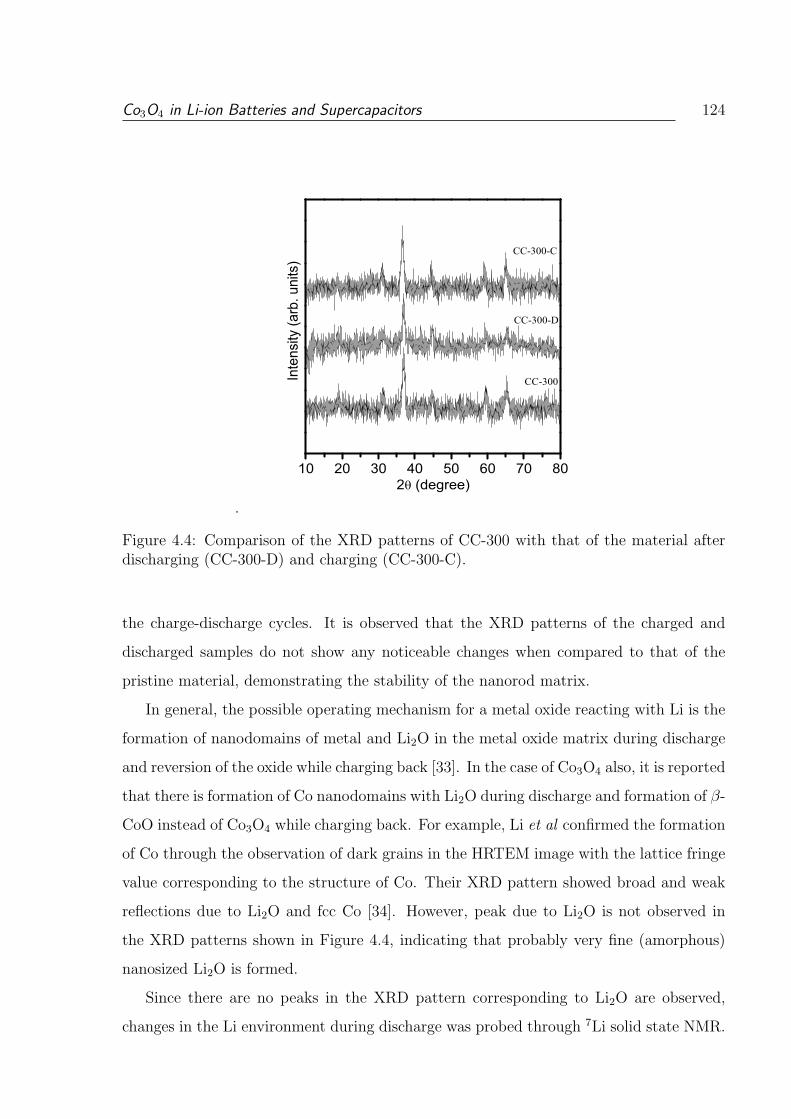
Co3O4 in Li-ion Batteries and Supercapacitors 124
.
10 20 30 40 50 60 70 80
Inte
nsity
(arb
. uni
ts)
CC-300-C
CC-300-D
CC-300
2 (degree)
Figure 4.4: Comparison of the XRD patterns of CC-300 with that of the material afterdischarging (CC-300-D) and charging (CC-300-C).
the charge-discharge cycles. It is observed that the XRD patterns of the charged and
discharged samples do not show any noticeable changes when compared to that of the
pristine material, demonstrating the stability of the nanorod matrix.
In general, the possible operating mechanism for a metal oxide reacting with Li is the
formation of nanodomains of metal and Li2O in the metal oxide matrix during discharge
and reversion of the oxide while charging back [33]. In the case of Co3O4 also, it is reported
that there is formation of Co nanodomains with Li2O during discharge and formation of β-
CoO instead of Co3O4 while charging back. For example, Li et al confirmed the formation
of Co through the observation of dark grains in the HRTEM image with the lattice fringe
value corresponding to the structure of Co. Their XRD pattern showed broad and weak
reflections due to Li2O and fcc Co [34]. However, peak due to Li2O is not observed in
the XRD patterns shown in Figure 4.4, indicating that probably very fine (amorphous)
nanosized Li2O is formed.
Since there are no peaks in the XRD pattern corresponding to Li2O are observed,
changes in the Li environment during discharge was probed through 7Li solid state NMR.
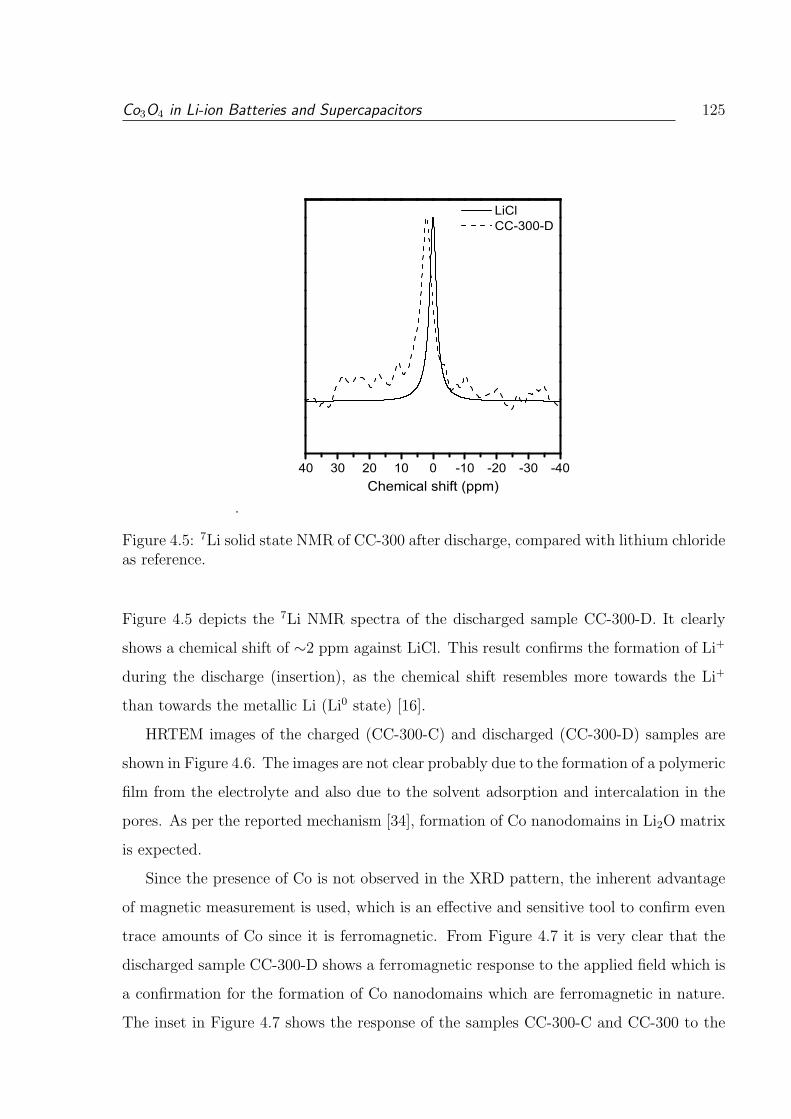
Co3O4 in Li-ion Batteries and Supercapacitors 125
.
40 30 20 10 0 -10 -20 -30 -40
LiCl CC-300-D
Chemical shift (ppm)
Figure 4.5: 7Li solid state NMR of CC-300 after discharge, compared with lithium chlorideas reference.
Figure 4.5 depicts the 7Li NMR spectra of the discharged sample CC-300-D. It clearly
shows a chemical shift of ∼2 ppm against LiCl. This result confirms the formation of Li+
during the discharge (insertion), as the chemical shift resembles more towards the Li+
than towards the metallic Li (Li0 state) [16].
HRTEM images of the charged (CC-300-C) and discharged (CC-300-D) samples are
shown in Figure 4.6. The images are not clear probably due to the formation of a polymeric
film from the electrolyte and also due to the solvent adsorption and intercalation in the
pores. As per the reported mechanism [34], formation of Co nanodomains in Li2O matrix
is expected.
Since the presence of Co is not observed in the XRD pattern, the inherent advantage
of magnetic measurement is used, which is an effective and sensitive tool to confirm even
trace amounts of Co since it is ferromagnetic. From Figure 4.7 it is very clear that the
discharged sample CC-300-D shows a ferromagnetic response to the applied field which is
a confirmation for the formation of Co nanodomains which are ferromagnetic in nature.
The inset in Figure 4.7 shows the response of the samples CC-300-C and CC-300 to the
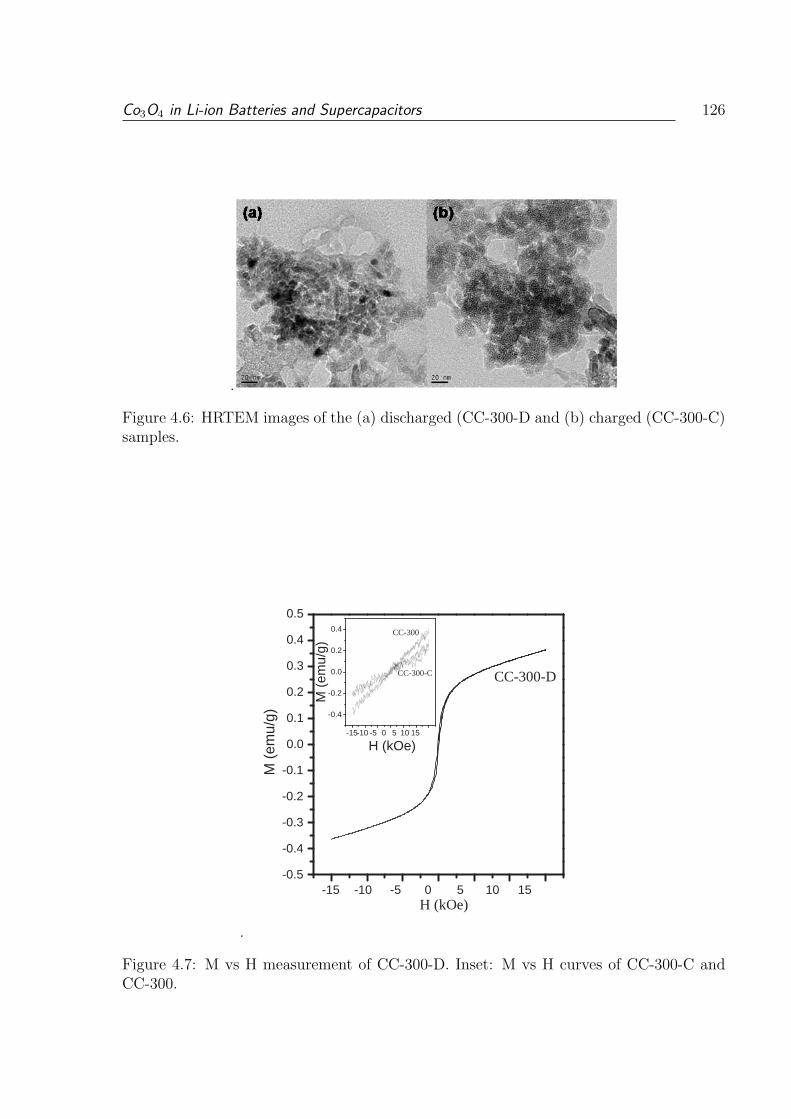
Co3O4 in Li-ion Batteries and Supercapacitors 126
.
Figure 4.6: HRTEM images of the (a) discharged (CC-300-D and (b) charged (CC-300-C)samples.
.
-15 -10 -5 0 5 10 15 -0.5
-0.4
-0.3
-0.2
-0.1
0.0
0.1
0.2
0.3
0.4
0.5
-15 -10 -5 0 5 10 15
-0.4
-0.2
0.0
0.2
0.4
M (
emu/
g)
H (kOe)
CC-300-D
H (kOe)
M (
emu/
g)
CC-300
CC-300-C
Figure 4.7: M vs H measurement of CC-300-D. Inset: M vs H curves of CC-300-C andCC-300.
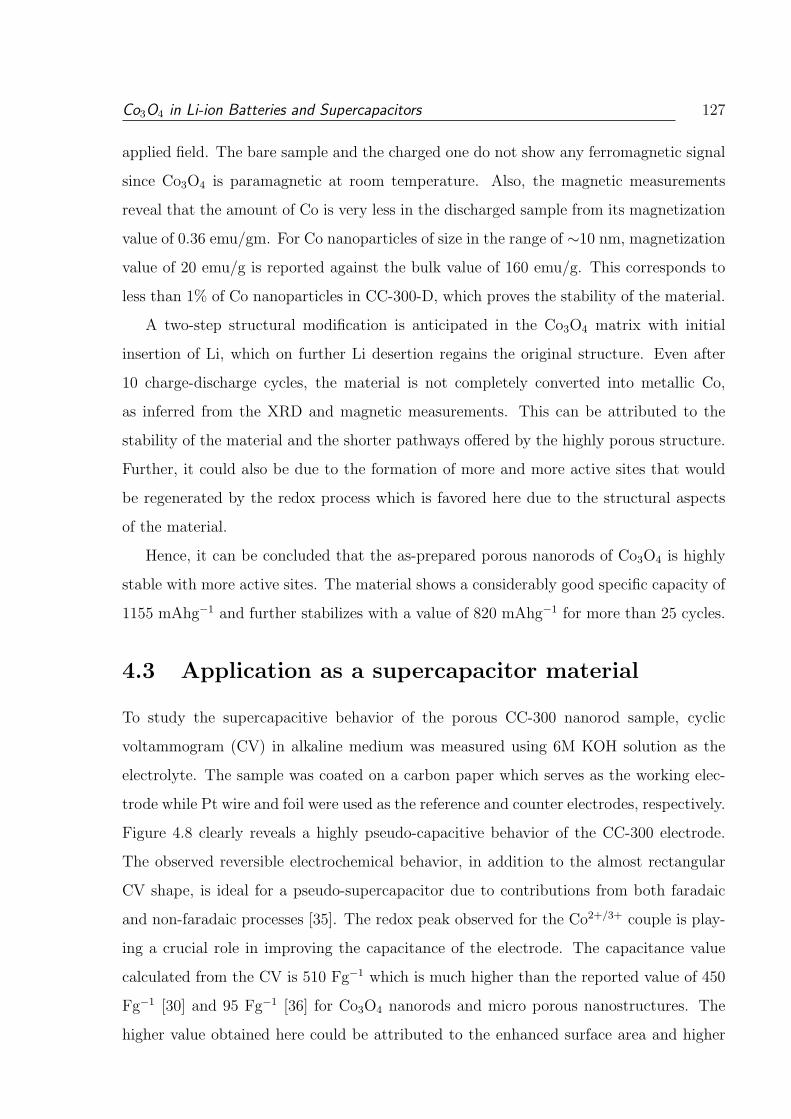
Co3O4 in Li-ion Batteries and Supercapacitors 127
applied field. The bare sample and the charged one do not show any ferromagnetic signal
since Co3O4 is paramagnetic at room temperature. Also, the magnetic measurements
reveal that the amount of Co is very less in the discharged sample from its magnetization
value of 0.36 emu/gm. For Co nanoparticles of size in the range of ∼10 nm, magnetization
value of 20 emu/g is reported against the bulk value of 160 emu/g. This corresponds to
less than 1% of Co nanoparticles in CC-300-D, which proves the stability of the material.
A two-step structural modification is anticipated in the Co3O4 matrix with initial
insertion of Li, which on further Li desertion regains the original structure. Even after
10 charge-discharge cycles, the material is not completely converted into metallic Co,
as inferred from the XRD and magnetic measurements. This can be attributed to the
stability of the material and the shorter pathways offered by the highly porous structure.
Further, it could also be due to the formation of more and more active sites that would
be regenerated by the redox process which is favored here due to the structural aspects
of the material.
Hence, it can be concluded that the as-prepared porous nanorods of Co3O4 is highly
stable with more active sites. The material shows a considerably good specific capacity of
1155 mAhg−1 and further stabilizes with a value of 820 mAhg−1 for more than 25 cycles.
4.3 Application as a supercapacitor material
To study the supercapacitive behavior of the porous CC-300 nanorod sample, cyclic
voltammogram (CV) in alkaline medium was measured using 6M KOH solution as the
electrolyte. The sample was coated on a carbon paper which serves as the working elec-
trode while Pt wire and foil were used as the reference and counter electrodes, respectively.
Figure 4.8 clearly reveals a highly pseudo-capacitive behavior of the CC-300 electrode.
The observed reversible electrochemical behavior, in addition to the almost rectangular
CV shape, is ideal for a pseudo-supercapacitor due to contributions from both faradaic
and non-faradaic processes [35]. The redox peak observed for the Co2+/3+ couple is play-
ing a crucial role in improving the capacitance of the electrode. The capacitance value
calculated from the CV is 510 Fg−1 which is much higher than the reported value of 450
Fg−1 [30] and 95 Fg−1 [36] for Co3O4 nanorods and micro porous nanostructures. The
higher value obtained here could be attributed to the enhanced surface area and higher
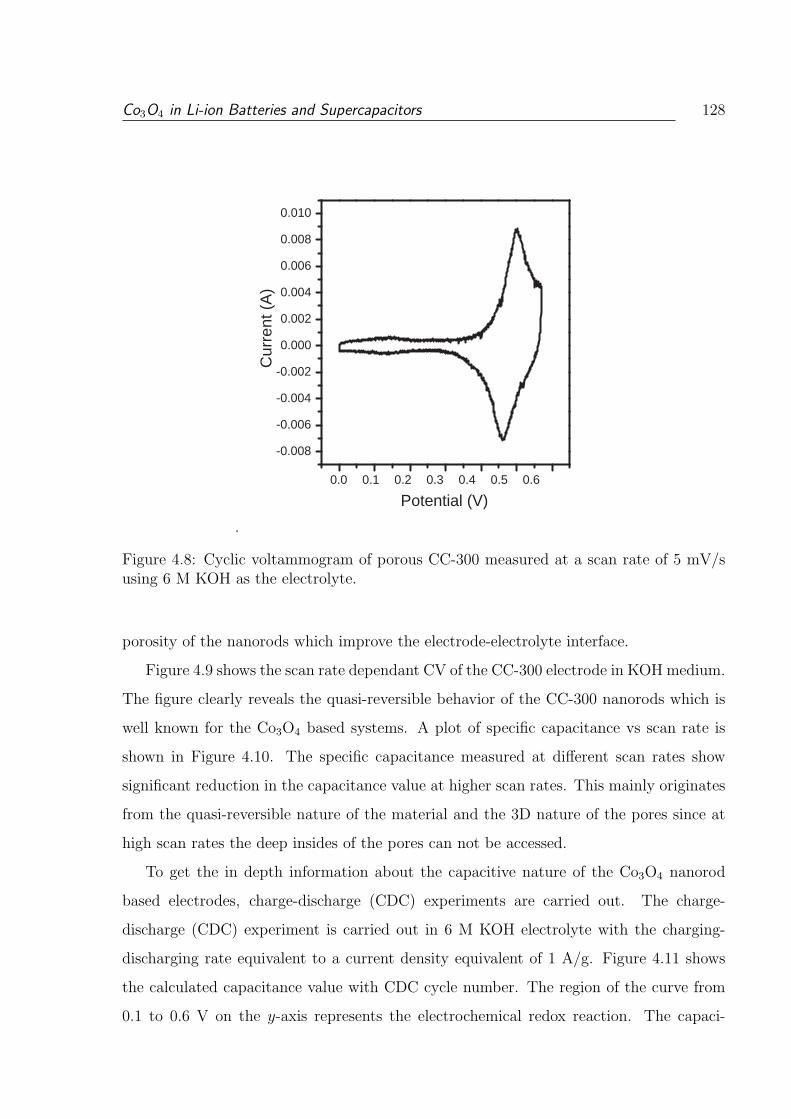
Co3O4 in Li-ion Batteries and Supercapacitors 128
.
0.0 0.1 0.2 0.3 0.4 0.5 0.6
-0.008
-0.006
-0.004
-0.002
0.000
0.002
0.004
0.006
0.008
0.010
Cur
rent
(A
)
Potential (V)
Figure 4.8: Cyclic voltammogram of porous CC-300 measured at a scan rate of 5 mV/susing 6 M KOH as the electrolyte.
porosity of the nanorods which improve the electrode-electrolyte interface.
Figure 4.9 shows the scan rate dependant CV of the CC-300 electrode in KOH medium.
The figure clearly reveals the quasi-reversible behavior of the CC-300 nanorods which is
well known for the Co3O4 based systems. A plot of specific capacitance vs scan rate is
shown in Figure 4.10. The specific capacitance measured at different scan rates show
significant reduction in the capacitance value at higher scan rates. This mainly originates
from the quasi-reversible nature of the material and the 3D nature of the pores since at
high scan rates the deep insides of the pores can not be accessed.
To get the in depth information about the capacitive nature of the Co3O4 nanorod
based electrodes, charge-discharge (CDC) experiments are carried out. The charge-
discharge (CDC) experiment is carried out in 6 M KOH electrolyte with the charging-
discharging rate equivalent to a current density equivalent of 1 A/g. Figure 4.11 shows
the calculated capacitance value with CDC cycle number. The region of the curve from
0.1 to 0.6 V on the y-axis represents the electrochemical redox reaction. The capaci-
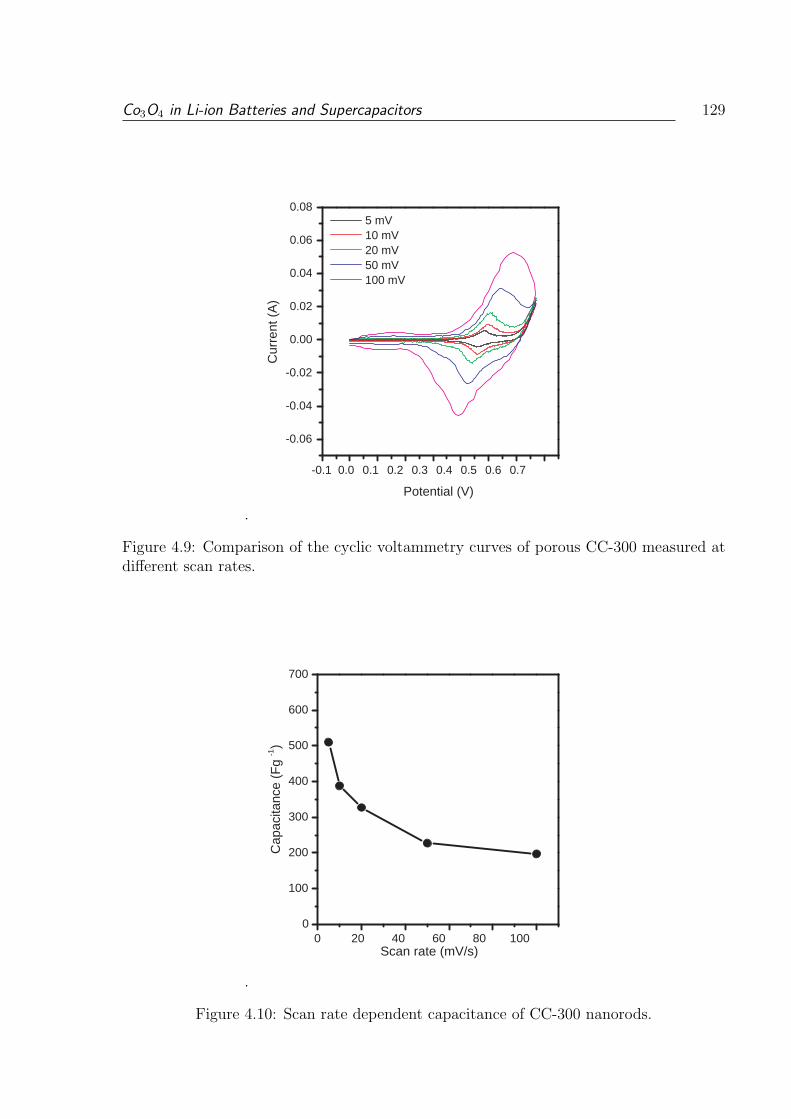
Co3O4 in Li-ion Batteries and Supercapacitors 129
.
-0.1 0.0 0.1 0.2 0.3 0.4 0.5 0.6 0.7
-0.06
-0.04
-0.02
0.00
0.02
0.04
0.06
0.08
5 mV 10 mV 20 mV 50 mV 100 mV
Cur
rent
(A
)
Potential (V)
Figure 4.9: Comparison of the cyclic voltammetry curves of porous CC-300 measured atdifferent scan rates.
.
0 20 40 60 80 100 0
100
200
300
400
500
600
700
Cap
acita
nce
(Fg
-1 )
Scan rate (mV/s)
Figure 4.10: Scan rate dependent capacitance of CC-300 nanorods.
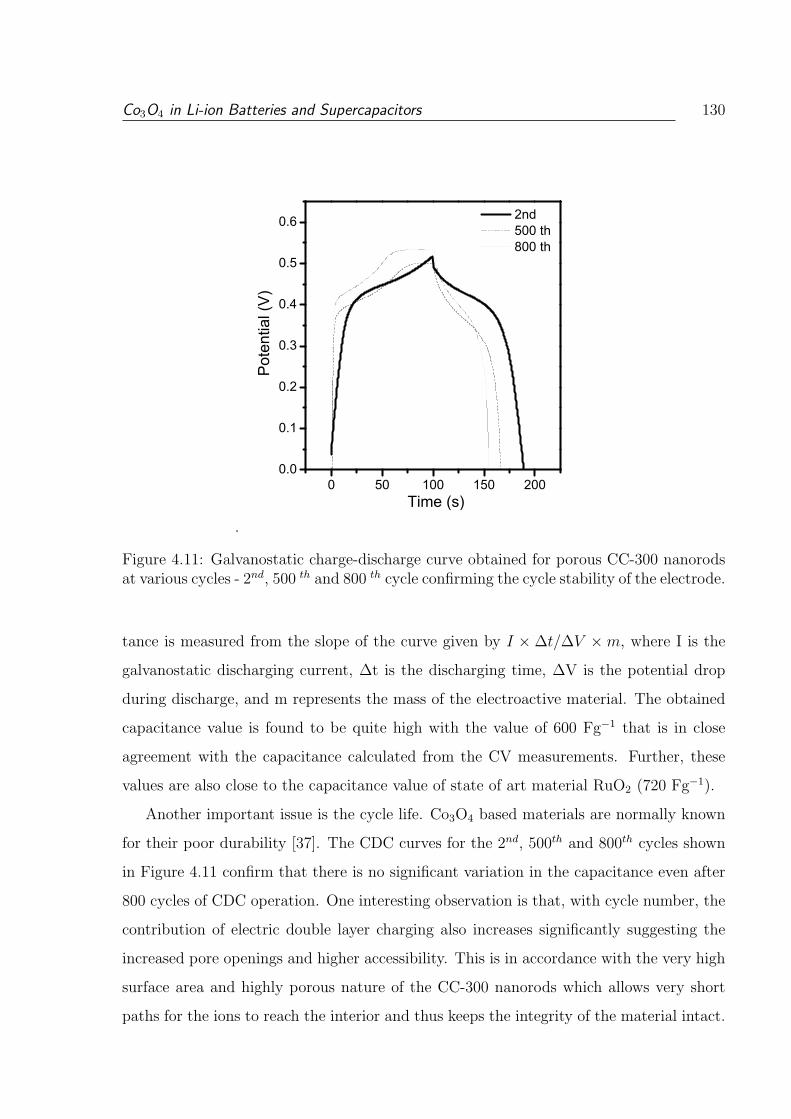
Co3O4 in Li-ion Batteries and Supercapacitors 130
.
0 50 100 150 2000.0
0.1
0.2
0.3
0.4
0.5
0.6
Pot
entia
l (V
)
Time (s)
2nd 500 th 800 th
Figure 4.11: Galvanostatic charge-discharge curve obtained for porous CC-300 nanorodsat various cycles - 2nd, 500 th and 800 th cycle confirming the cycle stability of the electrode.
tance is measured from the slope of the curve given by I × ∆t/∆V ×m, where I is the
galvanostatic discharging current, ∆t is the discharging time, ∆V is the potential drop
during discharge, and m represents the mass of the electroactive material. The obtained
capacitance value is found to be quite high with the value of 600 Fg−1 that is in close
agreement with the capacitance calculated from the CV measurements. Further, these
values are also close to the capacitance value of state of art material RuO2 (720 Fg−1).
Another important issue is the cycle life. Co3O4 based materials are normally known
for their poor durability [37]. The CDC curves for the 2nd, 500th and 800th cycles shown
in Figure 4.11 confirm that there is no significant variation in the capacitance even after
800 cycles of CDC operation. One interesting observation is that, with cycle number, the
contribution of electric double layer charging also increases significantly suggesting the
increased pore openings and higher accessibility. This is in accordance with the very high
surface area and highly porous nature of the CC-300 nanorods which allows very short
paths for the ions to reach the interior and thus keeps the integrity of the material intact.
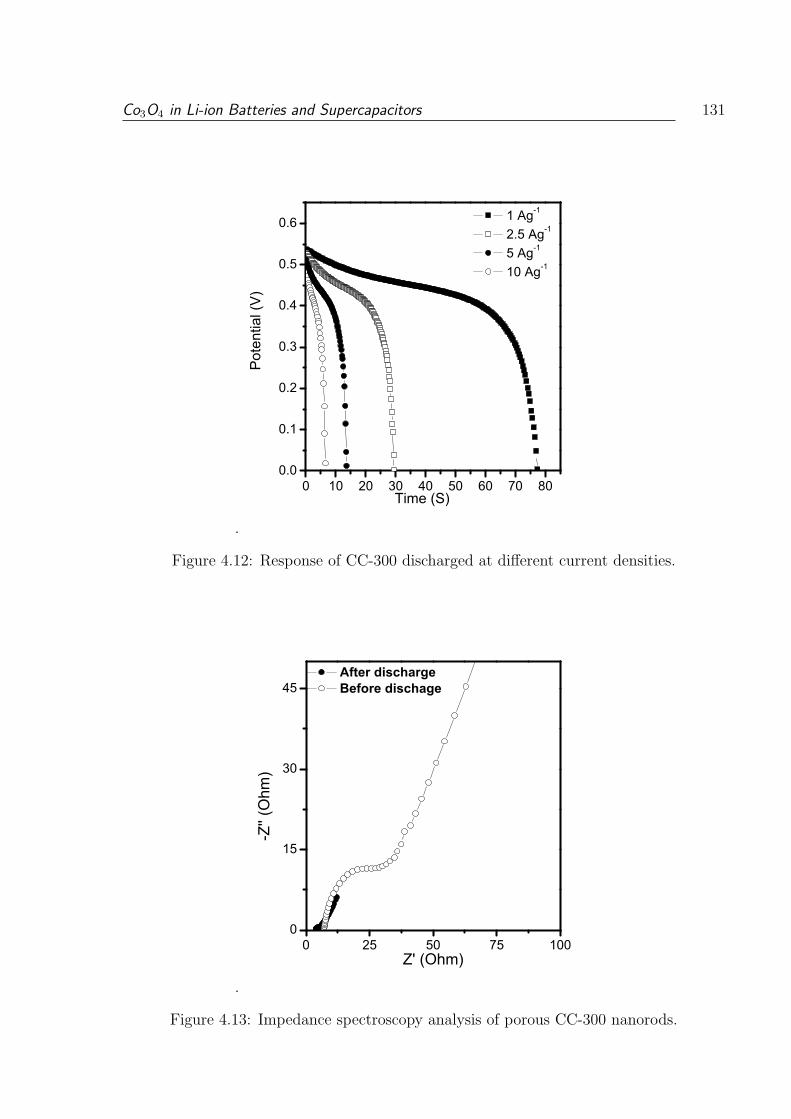
Co3O4 in Li-ion Batteries and Supercapacitors 131
.
0 10 20 30 40 50 60 70 800.0
0.1
0.2
0.3
0.4
0.5
0.6
1 Ag-1
2.5 Ag-1
5 Ag-1
10 Ag-1P
oten
tial (
V)
Time (S)
Figure 4.12: Response of CC-300 discharged at different current densities.
.
0 25 50 75 1000
15
30
45
-Z'' (
Ohm
)
Z' (Ohm)
After discharge Before dischage
Figure 4.13: Impedance spectroscopy analysis of porous CC-300 nanorods.
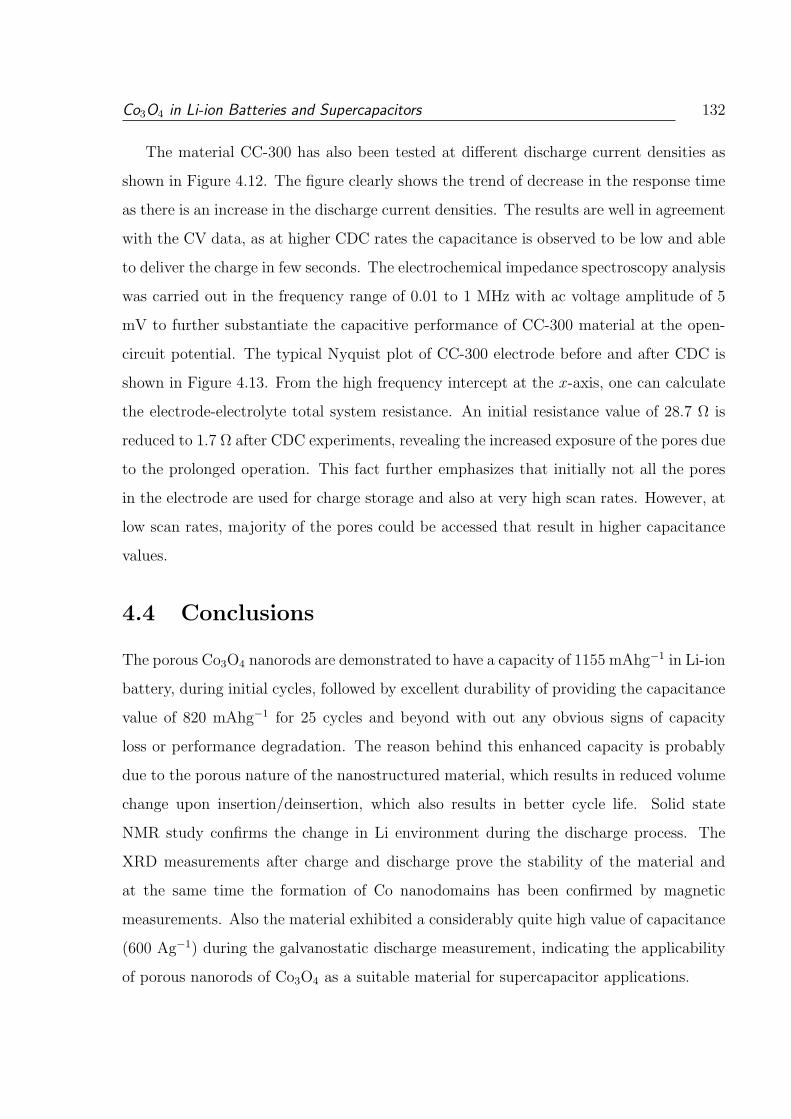
Co3O4 in Li-ion Batteries and Supercapacitors 132
The material CC-300 has also been tested at different discharge current densities as
shown in Figure 4.12. The figure clearly shows the trend of decrease in the response time
as there is an increase in the discharge current densities. The results are well in agreement
with the CV data, as at higher CDC rates the capacitance is observed to be low and able
to deliver the charge in few seconds. The electrochemical impedance spectroscopy analysis
was carried out in the frequency range of 0.01 to 1 MHz with ac voltage amplitude of 5
mV to further substantiate the capacitive performance of CC-300 material at the open-
circuit potential. The typical Nyquist plot of CC-300 electrode before and after CDC is
shown in Figure 4.13. From the high frequency intercept at the x-axis, one can calculate
the electrode-electrolyte total system resistance. An initial resistance value of 28.7 Ω is
reduced to 1.7 Ω after CDC experiments, revealing the increased exposure of the pores due
to the prolonged operation. This fact further emphasizes that initially not all the pores
in the electrode are used for charge storage and also at very high scan rates. However, at
low scan rates, majority of the pores could be accessed that result in higher capacitance
values.
4.4 Conclusions
The porous Co3O4 nanorods are demonstrated to have a capacity of 1155 mAhg−1 in Li-ion
battery, during initial cycles, followed by excellent durability of providing the capacitance
value of 820 mAhg−1 for 25 cycles and beyond with out any obvious signs of capacity
loss or performance degradation. The reason behind this enhanced capacity is probably
due to the porous nature of the nanostructured material, which results in reduced volume
change upon insertion/deinsertion, which also results in better cycle life. Solid state
NMR study confirms the change in Li environment during the discharge process. The
XRD measurements after charge and discharge prove the stability of the material and
at the same time the formation of Co nanodomains has been confirmed by magnetic
measurements. Also the material exhibited a considerably quite high value of capacitance
(600 Ag−1) during the galvanostatic discharge measurement, indicating the applicability
of porous nanorods of Co3O4 as a suitable material for supercapacitor applications.
References
[1] G. Nazri, G. Pistoia, Lithium Batteries: Science and Technology, Springer
Netherlands, 2004.
[2] W.A. van Schalkwijk, B. Scrosati, Advances in Lithium-Ion Batteries, Plenum
Pub Corp, 2002.
[3] M. Wakihara, O. Yamamoto, Lithium Ion Batteries: Fundamentals and Perfor-
mance, Wiley-Vch, 1998.
[4] G. Pistoia, Battery Operated Devices and Systems: From Portable Electronics
to Industrial Products, Elsevier Science Ltd, 2008.
[5] S. Dhameja, Electric Vehicle Battery Systems, Newnes, 2002.
[6] Y.M. Kang, M.S. Song, J.H. Kim, H.S. Kim, M.S. Park, J.Y. Lee, H.K. Liu,
S.X. Dou, Electrochim. Acta. 50 (2005) 3667.
[7] W. Li, F. Cheng, Z. Tao, J. Chen, J. Phys. Chem. B 110 (2006) 119.
[8] M.S. Park, G.X. Wang, Y.M. Kang, D. Wexler, S.X. Dou, H.K. Liu, Ang. Chem.
Int. Ed. 46 (2007) 750.
[9] S.H. Yoon, C.W. Park, H.J. Yang, Y. Korai, I. Mochida, R.T.K. Baker, N.M.
Rodriguez, Carbon 42 (2004) 21.
[10] M.V. Reddy, S.S. Manoharan, J. John, B. Singh, G.V.S. Rao, B.V.R. Chowdari,
J. Electrochem. Soc. 156 (2009) A652.
[11] C.K. Chan, H.L. Peng, G. Liu, K. McIlwrath, X.F. Zhang, R.A. Huggins, Y.
Cui, Nat. Nanotechnol. 3 (2008) 31.
References 134
[12] X.P. Gao, J.L. Bao, G.L. Pan, H.Y. Zhu, P.X. Huang, F. Wu, D.Y. Song, J.
Phys. Chem. B 108 (2004) 5547.
[13] Y. Wang, H.C. Zeng, J.Y. Lee, Adv. Mater. 18 (2006) 645.
[14] D.W. Kim, I.S. Hwang, S.J. Kwon, H.Y. Kang, K.S. Park, Y.J. Choi, K.J. Choi,
J.G. Park, Nano Lett. 7 (2007) 3041.
[15] M.S. Whittingham, Chem. Rev. 104 (2004) 4271.
[16] Y. Idota, T. Kubota, A. Matsufuji, Y. Maekawa, T. Miyasaka, Science 276
(1997) 1395.
[17] J. Chen, L. Xu, W. Li, X. Gou, Adv. Mater. 17 (2005) 582.
[18] P.L. Taberna, S. Mitra, P. Poizot, P. Simon, J.M. Tarascon, Nat. Mater. 5 (2006)
567.
[19] T. Cassagneau, J.H. Fendler, Adv. Mater. 10 (1998) 877
[20] J.B. Goodenough, Y. Kim, Chem. Mater. 22 (2010) 587.
[21] M. Winter, R.J. Brodd, Chem. Rev. 104 (2004) 4245.
[22] P. Justin, S.K. Meher, G.R. Rao, J Phys Chem C. 114 5203.
[23] V. Subramanian, H. Zhu, B. Wei, J. Power Sources 159 (2006) 361.
[24] J. Cheng, G.P. Cao, Y.S. Yang, J. Power Sources 159 (2006) 734.
[25] Y. Li, B. Tan, Y. Wu, Nano Lett. 8 (2008) 265.
[26] K.T. Nam, D.W. Kim, P.J. Yoo, C.Y. Chiang, N. Meethong, P.T. Hammond,
Y.M. Chiang, A.M. Belcher, Science 312 (2006) 885.
[27] F. Zhan, B. Geng, Y. Guo, Chem. Eur. J. 15 (2009) 6169.
[28] W.Y. Li, L.N. Xu, J. Chen, Adv. Funct. Mater. 15 (2005) 851.
[29] B. Guo, C. Li, Z.Y. Yuan, J. Phys. Chem. C 114 ( 2010) 12805
[30] L. Cui, J. Li, X.G. Zhang, J. App. Electrochem. 39 (2009) 1871.
References 135
[31] S.L. Xiong, C.Z. Yuan, M.F. Zhang, B.J. Xi, Y.T. Qian, Chem. Eur. J. 15 (2009)
5320.
[32] X.W. Lou, D. Deng, J.Y. Lee, J. Feng, L.A. Archer, Adv. Mater. 20 (2008) 258.
[33] P. Poizot, S. Laruelle, S. Grugeon, L. Dupont, J.M. Tarascon, Nature 407 (2000)
496.
[34] Y. Li, B. Tan, Y. Wu, Nano lett. 8 (2008) 265.
[35] Y. Liu, W. Zhao, X. Zhang, Electrochim. Acta 53 (2008) 3296.
[36] S.L. Xiong, C.Z. Yuan, M.F. Zhang, B.J. Xi, Y.T. Qian, Chem. Eur. J. 15 (2009)
5320.
[37] L. Wang, X. Liu, X. Wang, X. Yang, L. Lu, Curr. Appl. Phys. 10 (2010) 1422.
Chapter 5
Synthesis and Magnetic Propertiesof Nanocrystalline Spinel Ferrites
5.1 Introduction
Spinel type ferrites crystalize with the general formula MFe2O4, where M is a divalent ion
such as Mg, Fe, Mn, Ni, Zn, Co, Cu etc [1]. Most of the commercially used ferrites are
solid solutions of more than one ferrite, represented by the general formula M1−xM′xFe2O4,
where M and M ′ are divalent metal ions [2]. Ferrites are well known for their ability to
combine extremely high electrical resistivity with magnetic properties, which helps in the
operation without any eddy-current loss at high frequencies.
Spinel type ferrites in the nanocrystalline form have attracted the attention of the
researchers because of the interesting properties that they exhibit [3–7]. The properties
such as superparamagnetic blocking temperature, saturation and remnant magnetiza-
tions, coercivity, etc, depend on the particle size [8, 9]. The distribution of cations in the
tetrahedral and octahedral sites of the spinel structure is an important factor deciding
the properties they exhibit. The degree of inversion of the cations between tetrahedral
and octahedral sites are found to be different in nanosized ferrite particles [10]. Higher
Curie temperatures are reported for nanoparticles due to the difference in the cation dis-
tribution [11,12]. Room temperature ferrimagnetism is observed in nanosized zinc ferrite
particles where as the bulk material is paramagnetic [13,14]. Hence, due to the nanosized
nature, different magnetic properties are exhibited by ferrite particles when compared
to their bulk counter parts. Monodispersed ferrite particles such as that of magnetite
or maghemite exhibiting superparamagnetic property are widely studied for their use in
biomedical applications such as in drug delivery, MRI contrasting agent, etc [15–17].
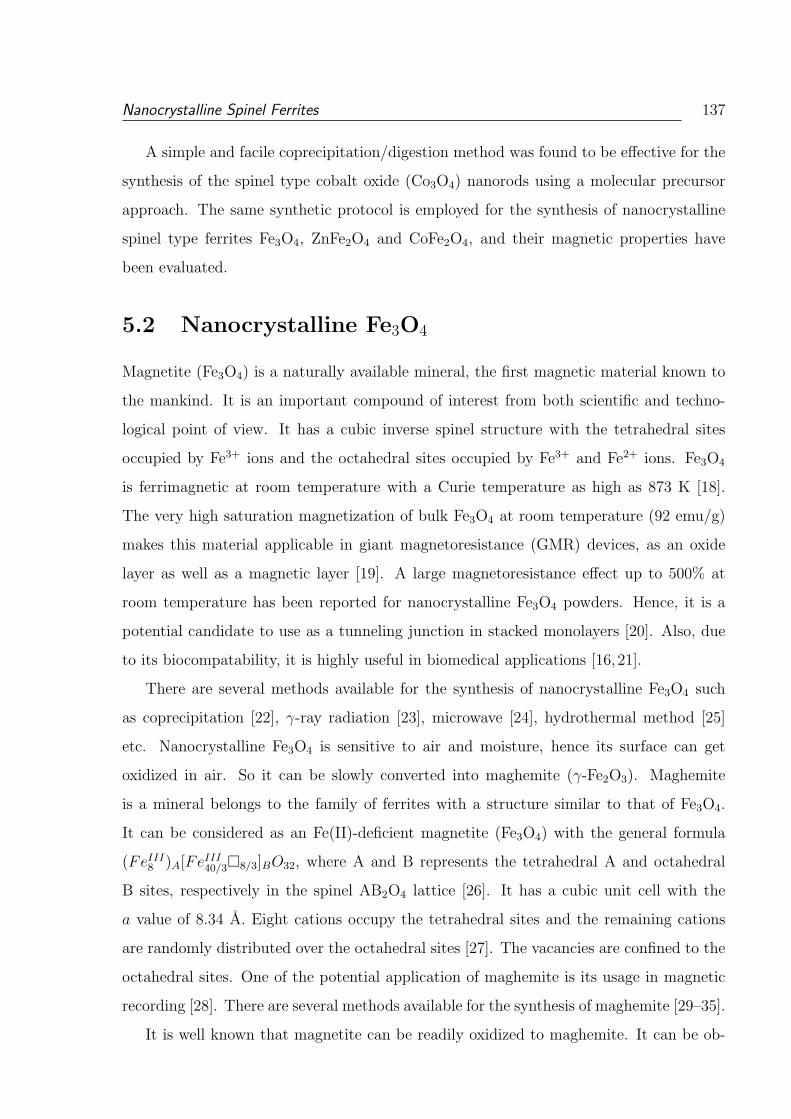
Nanocrystalline Spinel Ferrites 137
A simple and facile coprecipitation/digestion method was found to be effective for the
synthesis of the spinel type cobalt oxide (Co3O4) nanorods using a molecular precursor
approach. The same synthetic protocol is employed for the synthesis of nanocrystalline
spinel type ferrites Fe3O4, ZnFe2O4 and CoFe2O4, and their magnetic properties have
been evaluated.
5.2 Nanocrystalline Fe3O4
Magnetite (Fe3O4) is a naturally available mineral, the first magnetic material known to
the mankind. It is an important compound of interest from both scientific and techno-
logical point of view. It has a cubic inverse spinel structure with the tetrahedral sites
occupied by Fe3+ ions and the octahedral sites occupied by Fe3+ and Fe2+ ions. Fe3O4
is ferrimagnetic at room temperature with a Curie temperature as high as 873 K [18].
The very high saturation magnetization of bulk Fe3O4 at room temperature (92 emu/g)
makes this material applicable in giant magnetoresistance (GMR) devices, as an oxide
layer as well as a magnetic layer [19]. A large magnetoresistance effect up to 500% at
room temperature has been reported for nanocrystalline Fe3O4 powders. Hence, it is a
potential candidate to use as a tunneling junction in stacked monolayers [20]. Also, due
to its biocompatability, it is highly useful in biomedical applications [16,21].
There are several methods available for the synthesis of nanocrystalline Fe3O4 such
as coprecipitation [22], γ-ray radiation [23], microwave [24], hydrothermal method [25]
etc. Nanocrystalline Fe3O4 is sensitive to air and moisture, hence its surface can get
oxidized in air. So it can be slowly converted into maghemite (γ-Fe2O3). Maghemite
is a mineral belongs to the family of ferrites with a structure similar to that of Fe3O4.
It can be considered as an Fe(II)-deficient magnetite (Fe3O4) with the general formula
(FeIII8 )A[FeIII
40/3¤8/3]BO32, where A and B represents the tetrahedral A and octahedral
B sites, respectively in the spinel AB2O4 lattice [26]. It has a cubic unit cell with the
a value of 8.34 A. Eight cations occupy the tetrahedral sites and the remaining cations
are randomly distributed over the octahedral sites [27]. The vacancies are confined to the
octahedral sites. One of the potential application of maghemite is its usage in magnetic
recording [28]. There are several methods available for the synthesis of maghemite [29–35].
It is well known that magnetite can be readily oxidized to maghemite. It can be ob-
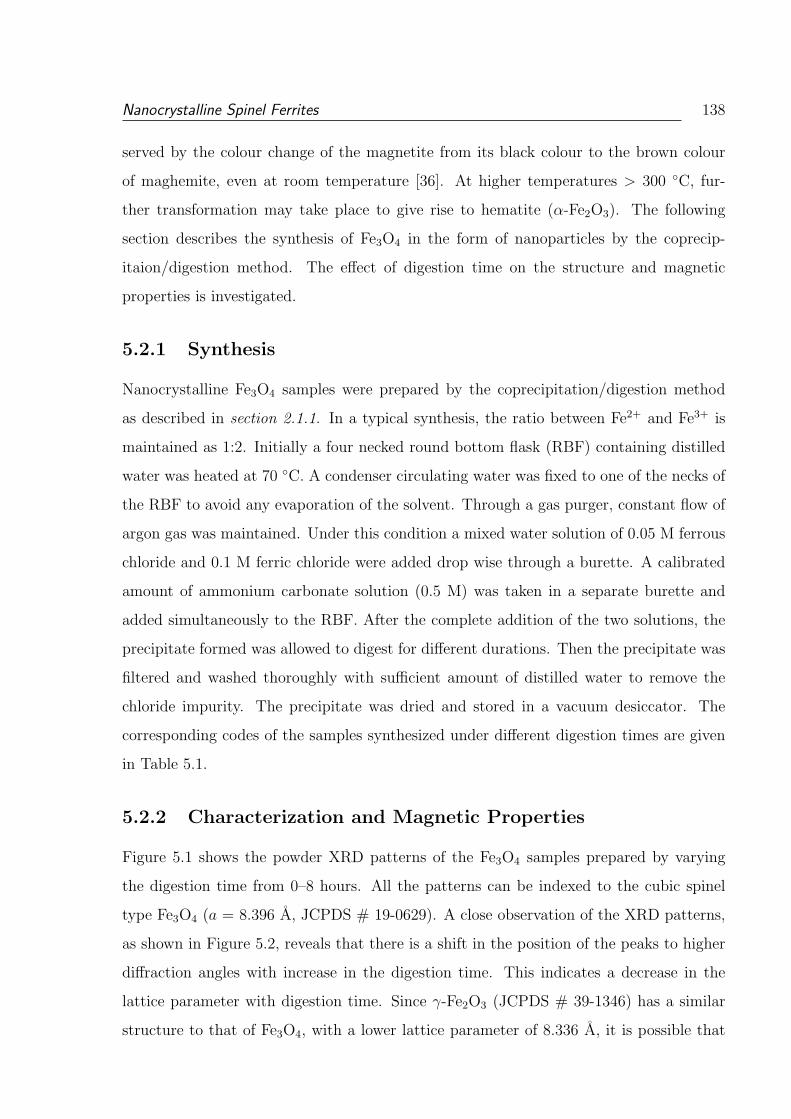
Nanocrystalline Spinel Ferrites 138
served by the colour change of the magnetite from its black colour to the brown colour
of maghemite, even at room temperature [36]. At higher temperatures > 300 C, fur-
ther transformation may take place to give rise to hematite (α-Fe2O3). The following
section describes the synthesis of Fe3O4 in the form of nanoparticles by the coprecip-
itaion/digestion method. The effect of digestion time on the structure and magnetic
properties is investigated.
5.2.1 Synthesis
Nanocrystalline Fe3O4 samples were prepared by the coprecipitation/digestion method
as described in section 2.1.1. In a typical synthesis, the ratio between Fe2+ and Fe3+ is
maintained as 1:2. Initially a four necked round bottom flask (RBF) containing distilled
water was heated at 70 C. A condenser circulating water was fixed to one of the necks of
the RBF to avoid any evaporation of the solvent. Through a gas purger, constant flow of
argon gas was maintained. Under this condition a mixed water solution of 0.05 M ferrous
chloride and 0.1 M ferric chloride were added drop wise through a burette. A calibrated
amount of ammonium carbonate solution (0.5 M) was taken in a separate burette and
added simultaneously to the RBF. After the complete addition of the two solutions, the
precipitate formed was allowed to digest for different durations. Then the precipitate was
filtered and washed thoroughly with sufficient amount of distilled water to remove the
chloride impurity. The precipitate was dried and stored in a vacuum desiccator. The
corresponding codes of the samples synthesized under different digestion times are given
in Table 5.1.
5.2.2 Characterization and Magnetic Properties
Figure 5.1 shows the powder XRD patterns of the Fe3O4 samples prepared by varying
the digestion time from 0–8 hours. All the patterns can be indexed to the cubic spinel
type Fe3O4 (a = 8.396 A, JCPDS # 19-0629). A close observation of the XRD patterns,
as shown in Figure 5.2, reveals that there is a shift in the position of the peaks to higher
diffraction angles with increase in the digestion time. This indicates a decrease in the
lattice parameter with digestion time. Since γ-Fe2O3 (JCPDS # 39-1346) has a similar
structure to that of Fe3O4, with a lower lattice parameter of 8.336 A, it is possible that
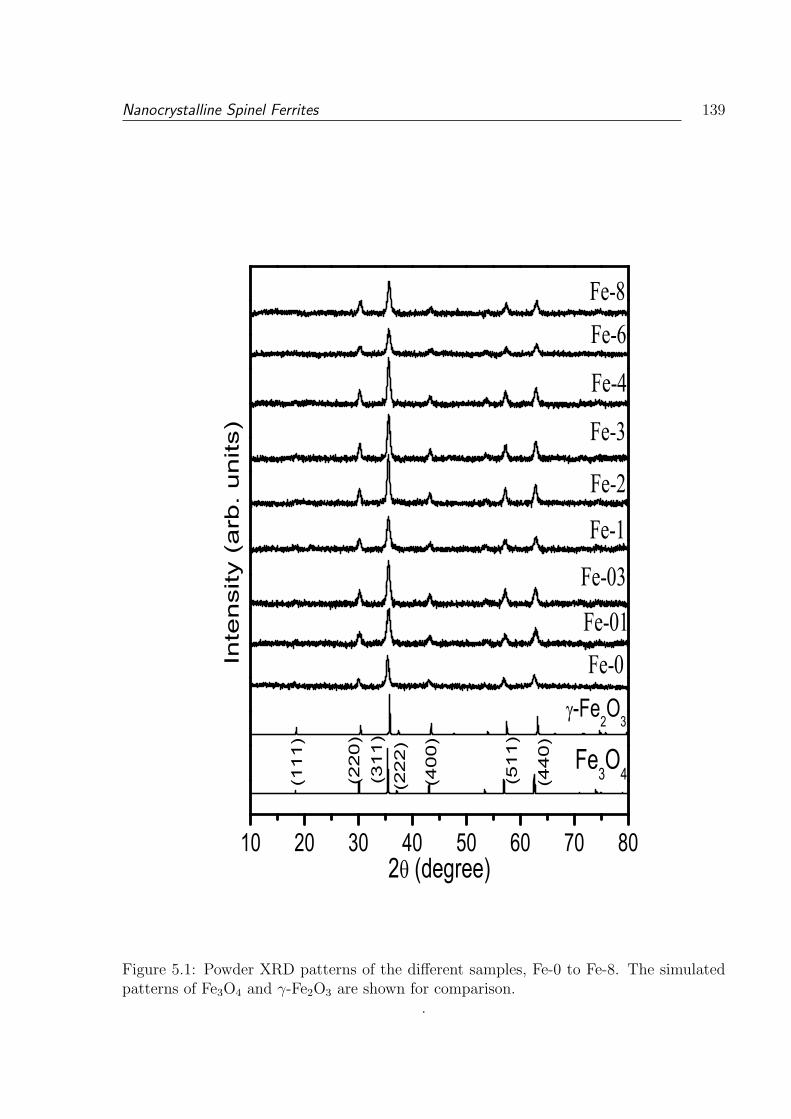
Nanocrystalline Spinel Ferrites 139
10 20 30 40 50 60 70 80
(440)
(511)
(400)
(222)
(311)
(220)
(111)
-Fe2O
3
Fe3O4
Inte
nsity (
arb
. units) Fe-3
Fe-8
Fe-01
Fe-03
Fe-1
Fe-2
Fe-4
Fe-6
Fe-0
2 (degree)
Figure 5.1: Powder XRD patterns of the different samples, Fe-0 to Fe-8. The simulatedpatterns of Fe3O4 and γ-Fe2O3 are shown for comparison.
.
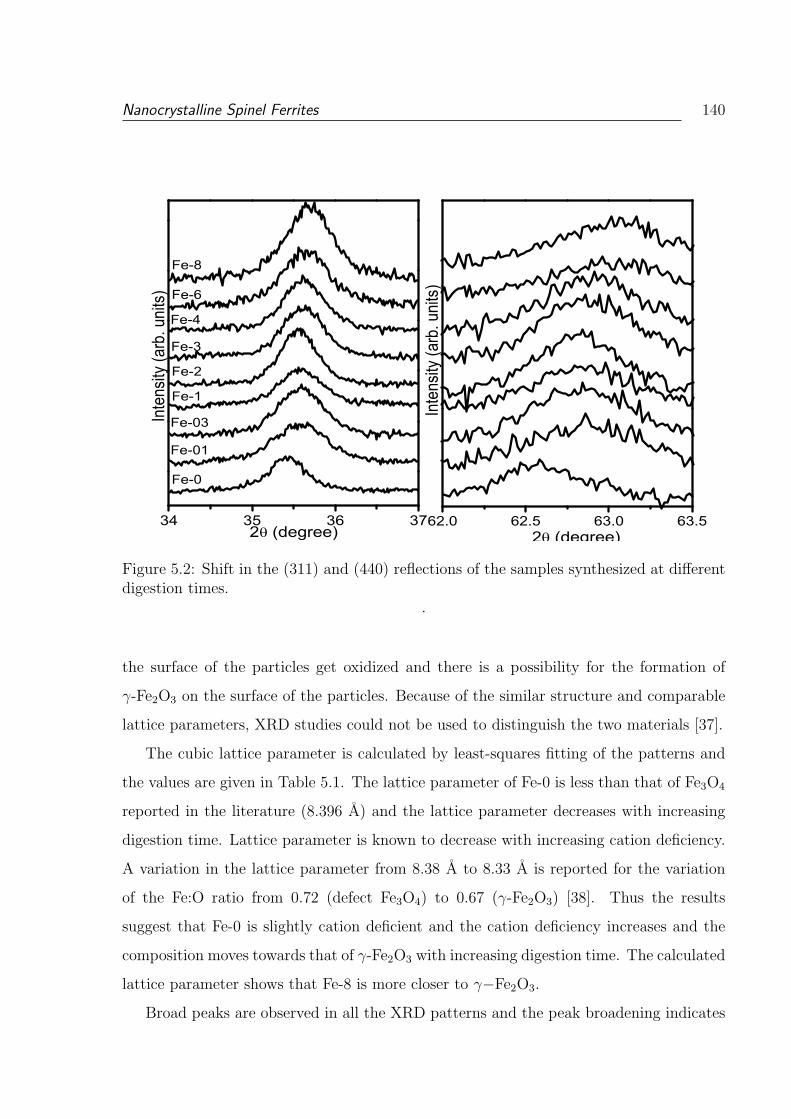
Nanocrystalline Spinel Ferrites 140
34 35 36 37
Fe-8
Fe-6
Fe-3
Fe-4
Fe-1
Fe-2
Fe-03
Fe-01
Fe-0
Inte
nsity
(arb
. uni
ts)
2 (degree)62.0 62.5 63.0 63.5
Inte
nsity
(arb
. uni
ts)
2 (degree)
Figure 5.2: Shift in the (311) and (440) reflections of the samples synthesized at differentdigestion times.
.
the surface of the particles get oxidized and there is a possibility for the formation of
γ-Fe2O3 on the surface of the particles. Because of the similar structure and comparable
lattice parameters, XRD studies could not be used to distinguish the two materials [37].
The cubic lattice parameter is calculated by least-squares fitting of the patterns and
the values are given in Table 5.1. The lattice parameter of Fe-0 is less than that of Fe3O4
reported in the literature (8.396 A) and the lattice parameter decreases with increasing
digestion time. Lattice parameter is known to decrease with increasing cation deficiency.
A variation in the lattice parameter from 8.38 A to 8.33 A is reported for the variation
of the Fe:O ratio from 0.72 (defect Fe3O4) to 0.67 (γ-Fe2O3) [38]. Thus the results
suggest that Fe-0 is slightly cation deficient and the cation deficiency increases and the
composition moves towards that of γ-Fe2O3 with increasing digestion time. The calculated
lattice parameter shows that Fe-8 is more closer to γ−Fe2O3.
Broad peaks are observed in all the XRD patterns and the peak broadening indicates
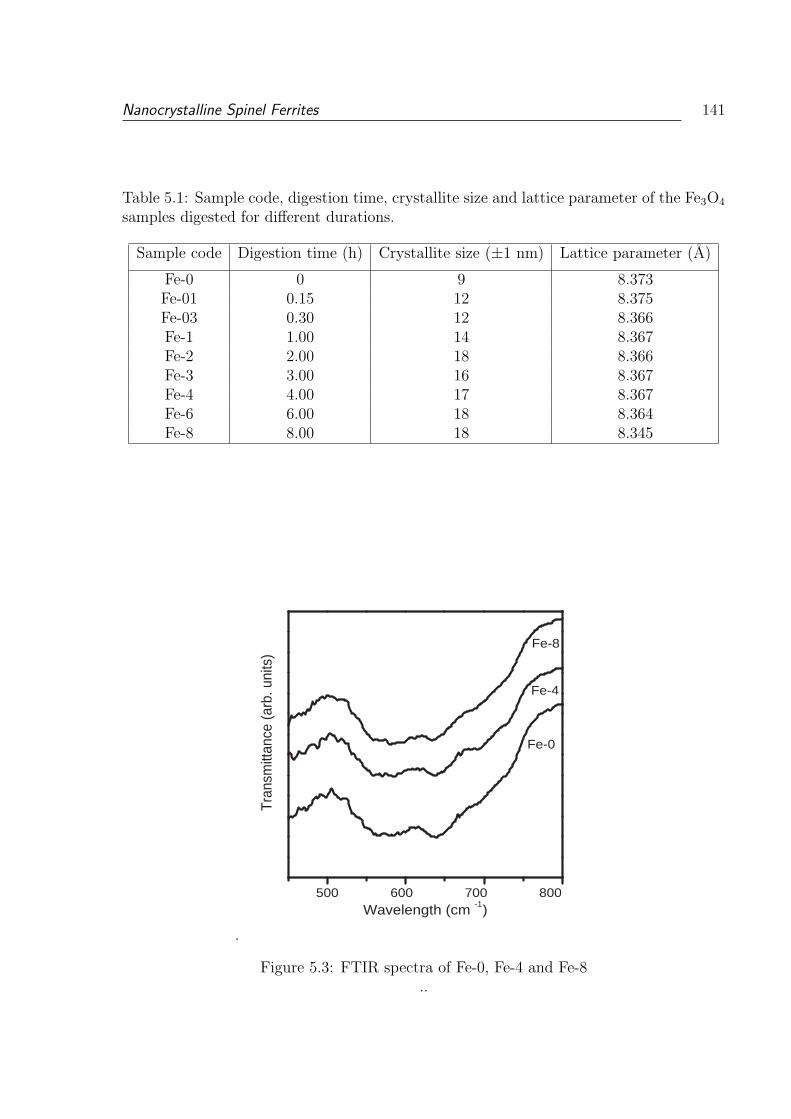
Nanocrystalline Spinel Ferrites 141
Table 5.1: Sample code, digestion time, crystallite size and lattice parameter of the Fe3O4
samples digested for different durations.
Sample code Digestion time (h) Crystallite size (±1 nm) Lattice parameter (A)
Fe-0 0 9 8.373Fe-01 0.15 12 8.375Fe-03 0.30 12 8.366Fe-1 1.00 14 8.367Fe-2 2.00 18 8.366Fe-3 3.00 16 8.367Fe-4 4.00 17 8.367Fe-6 6.00 18 8.364Fe-8 8.00 18 8.345
.
500 600 700 800
Fe-8
Fe-4
Fe-0
Tran
smitt
ance
(arb
. uni
ts)
Wavelength (cm -1 )
Figure 5.3: FTIR spectra of Fe-0, Fe-4 and Fe-8..
Nanocrystalline Spinel Ferrites 142
the nanocrystalline nature of the samples. The average crystallite sizes are calculated
using the Scherrer formula and the calculated values are shown in Table 5.1. There is
a continuous increase in the crystallite size with increasing digestion time, due to the
growth of the particles during the digestion.
The different samples are further characterized by infrared spectroscopy to get in-
formation on the structural changes taking place with variation in the digestion time.
Figure 5.3 shows the FTIR spectra of the samples Fe-0, Fe-4 and Fe-8. Two broad bands
are observed at ∼570 cm−1 and ∼635 cm−1. For spinel type ferrites, four bands are ex-
pected in the infrared spectra [39]. Fe3O4 exhibits two strong bands at 570 cm−1 and 390
cm−1, due to ν1 and ν2 modes of vibrations. The ν1 vibration is assigned to Fe-O stretch-
ing mode of Fe in the octahedral and tetrahedral sites and ν2 due to Fe-O stretching mode
in the octahedral site [40]. For defect-free Fe3O4, with lattice parameter of 8.396 A, a
strong band at 570 cm−1 is expected. Splitting of the ν1 and ν2 bands is expected with
increasing cation deficiency [41]. The ν1 band gives rise to another band at 630 cm−1 due
to the splitting. As Fe-0 shows two bands at ∼570 cm−1 and ∼635 cm−1, these bands can
be assigned to the Fe-O stretching mode of the tetrahedral and octahedral sites and it can
be assumed that the sample is cation deficient Fe3O4. Also, the lower lattice parameter
of this sample (8.373 A) compared to that of stoichiometric magnetite (8.396 A) supports
this conclusion, as the lattice parameter decreases with increasing cation deficiency [38].
The IR spectral data along with the structural data indicate that the deficiency increases
with increasing digestion time and that the sample obtained after 8 hour digestion is a
defective spinel close to that of γ-Fe2O3.
Figure 5.4 reveals the morphological features of the samples Fe-0 and Fe-8. The particle
sizes of both the samples are in the range 10-20 nm. In both the cases, the particles are
almost spherical in nature. It is clear from the images that the particles are aggregated
together. From the ring type pattern observed in SAED, the polycrystalline nature of the
samples can be confirmed.
The effect of the digestion time on the magnetic properties of the samples are ana-
lyzed from the magnetic measurements. The room temperature magnetization curves of
the samples digested for different time durations are shown in Figure 5.5 and the cor-
responding enlarged curves are shown in inset of Figure 5.5. The initial magnetization
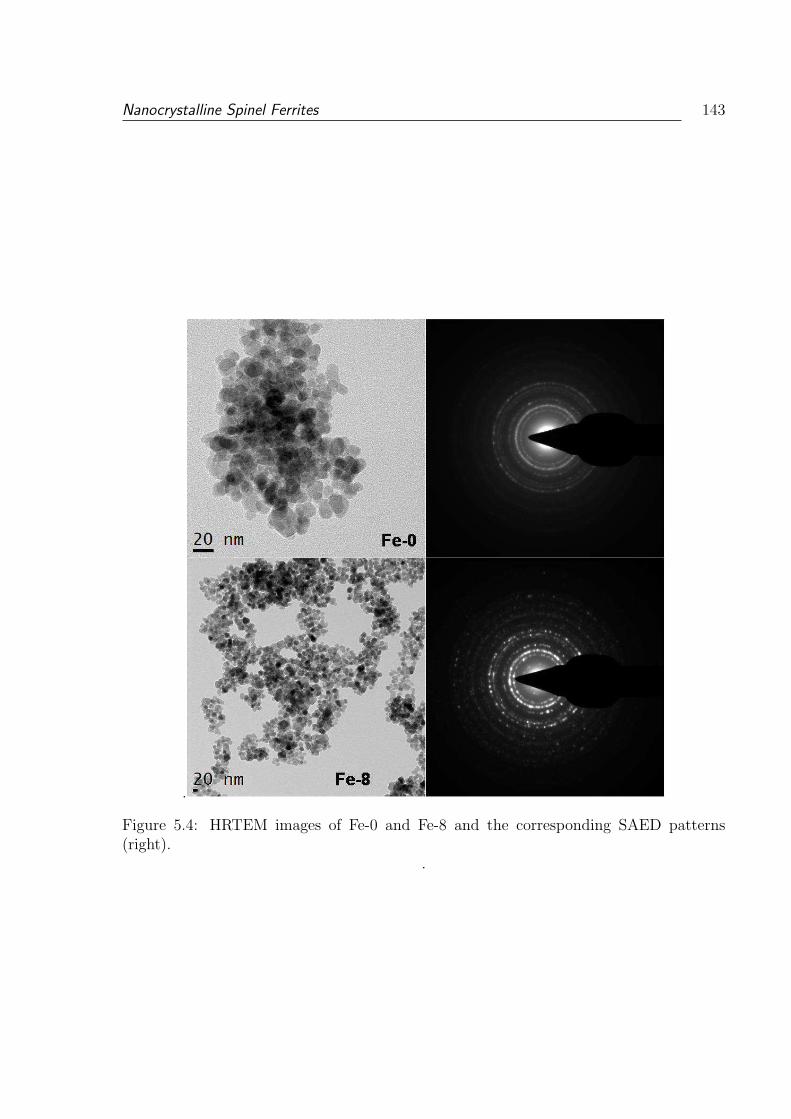
Nanocrystalline Spinel Ferrites 143
.
Figure 5.4: HRTEM images of Fe-0 and Fe-8 and the corresponding SAED patterns(right).
.
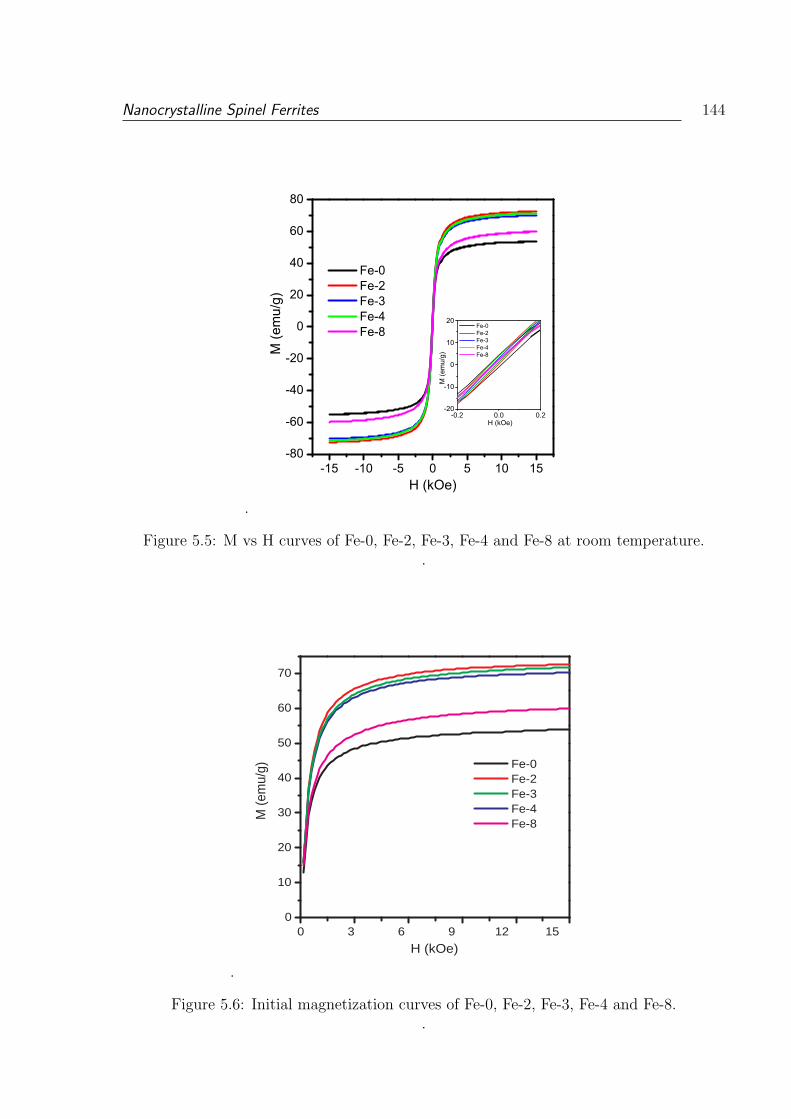
Nanocrystalline Spinel Ferrites 144
.
-15 -10 -5 0 5 10 15-80
-60
-40
-20
0
20
40
60
80
-0.2 0.0 0.2-20
-10
0
10
20 Fe-0 Fe-2 Fe-3 Fe-4 Fe-8
M (e
mu/
g)
H (kOe)
Fe-0 Fe-2 Fe-3 Fe-4 Fe-8
M (e
mu/
g)
H (kOe)
Figure 5.5: M vs H curves of Fe-0, Fe-2, Fe-3, Fe-4 and Fe-8 at room temperature..
.
0 3 6 9 12 15 0
10
20
30
40
50
60
70
Fe-0 Fe-2 Fe-3 Fe-4 Fe-8
M (e
mu/
g)
H (kOe)
Figure 5.6: Initial magnetization curves of Fe-0, Fe-2, Fe-3, Fe-4 and Fe-8..
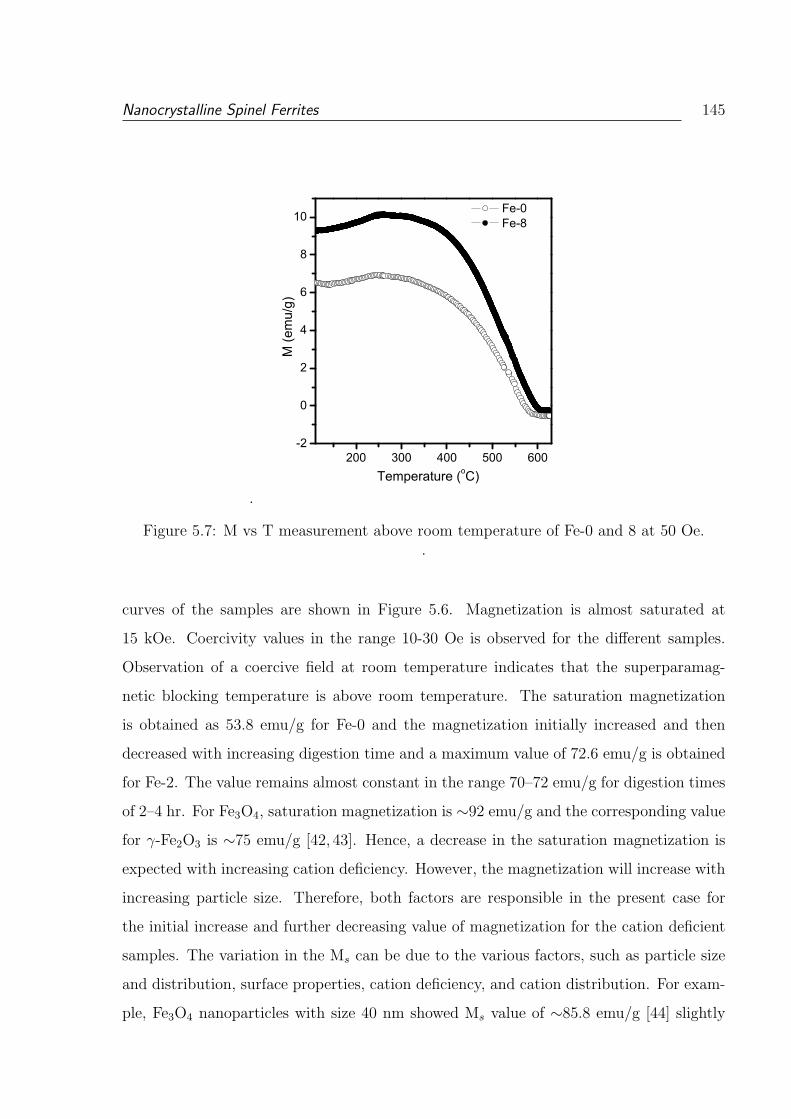
Nanocrystalline Spinel Ferrites 145
.
200 300 400 500 600-2
0
2
4
6
8
10
Fe-0 Fe-8
M (e
mu/
g)
Temperature (oC)
Figure 5.7: M vs T measurement above room temperature of Fe-0 and 8 at 50 Oe..
curves of the samples are shown in Figure 5.6. Magnetization is almost saturated at
15 kOe. Coercivity values in the range 10-30 Oe is observed for the different samples.
Observation of a coercive field at room temperature indicates that the superparamag-
netic blocking temperature is above room temperature. The saturation magnetization
is obtained as 53.8 emu/g for Fe-0 and the magnetization initially increased and then
decreased with increasing digestion time and a maximum value of 72.6 emu/g is obtained
for Fe-2. The value remains almost constant in the range 70–72 emu/g for digestion times
of 2–4 hr. For Fe3O4, saturation magnetization is ∼92 emu/g and the corresponding value
for γ-Fe2O3 is ∼75 emu/g [42, 43]. Hence, a decrease in the saturation magnetization is
expected with increasing cation deficiency. However, the magnetization will increase with
increasing particle size. Therefore, both factors are responsible in the present case for
the initial increase and further decreasing value of magnetization for the cation deficient
samples. The variation in the Ms can be due to the various factors, such as particle size
and distribution, surface properties, cation deficiency, and cation distribution. For exam-
ple, Fe3O4 nanoparticles with size 40 nm showed Ms value of ∼85.8 emu/g [44] slightly
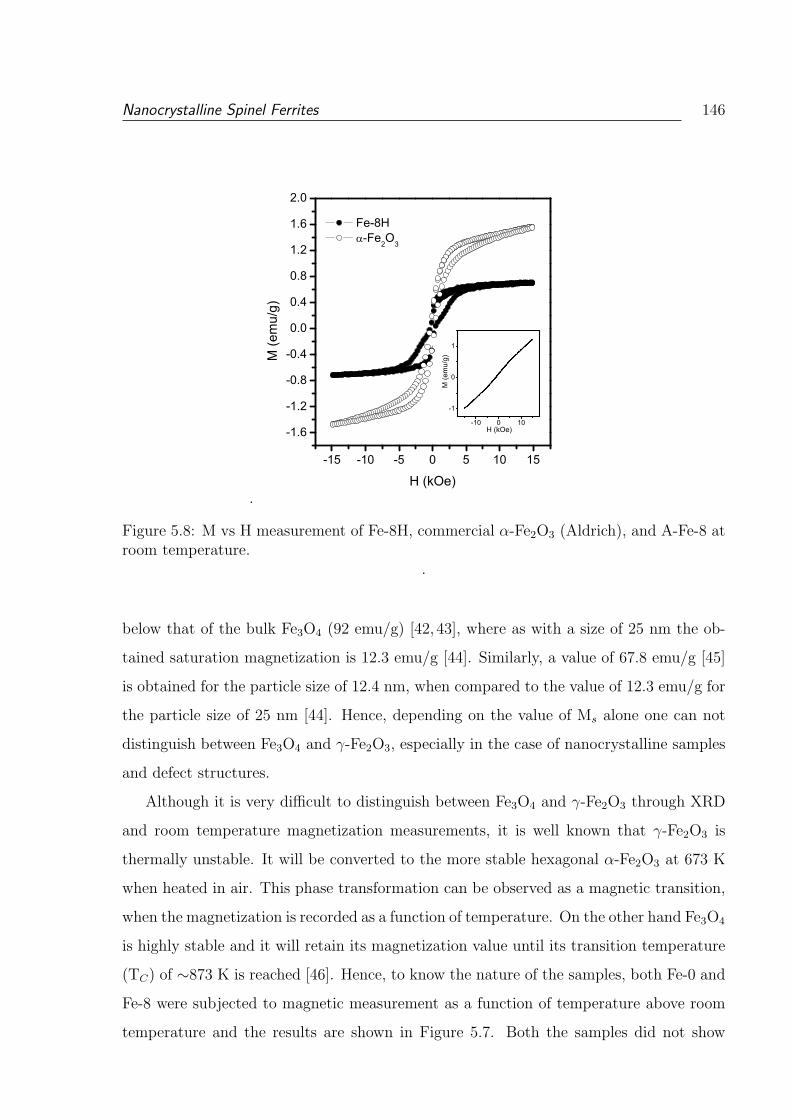
Nanocrystalline Spinel Ferrites 146
.
-15 -10 -5 0 5 10 15
-1.6
-1.2
-0.8
-0.4
0.0
0.4
0.8
1.2
1.6
2.0
-10 0 10
-1
0
1
M (e
mu/
g)
H (kOe)
Fe-8H -Fe2O3
M (e
mu/
g)
H (kOe)
Figure 5.8: M vs H measurement of Fe-8H, commercial α-Fe2O3 (Aldrich), and A-Fe-8 atroom temperature.
.
below that of the bulk Fe3O4 (92 emu/g) [42, 43], where as with a size of 25 nm the ob-
tained saturation magnetization is 12.3 emu/g [44]. Similarly, a value of 67.8 emu/g [45]
is obtained for the particle size of 12.4 nm, when compared to the value of 12.3 emu/g for
the particle size of 25 nm [44]. Hence, depending on the value of Ms alone one can not
distinguish between Fe3O4 and γ-Fe2O3, especially in the case of nanocrystalline samples
and defect structures.
Although it is very difficult to distinguish between Fe3O4 and γ-Fe2O3 through XRD
and room temperature magnetization measurements, it is well known that γ-Fe2O3 is
thermally unstable. It will be converted to the more stable hexagonal α-Fe2O3 at 673 K
when heated in air. This phase transformation can be observed as a magnetic transition,
when the magnetization is recorded as a function of temperature. On the other hand Fe3O4
is highly stable and it will retain its magnetization value until its transition temperature
(TC) of ∼873 K is reached [46]. Hence, to know the nature of the samples, both Fe-0 and
Fe-8 were subjected to magnetic measurement as a function of temperature above room
temperature and the results are shown in Figure 5.7. Both the samples did not show
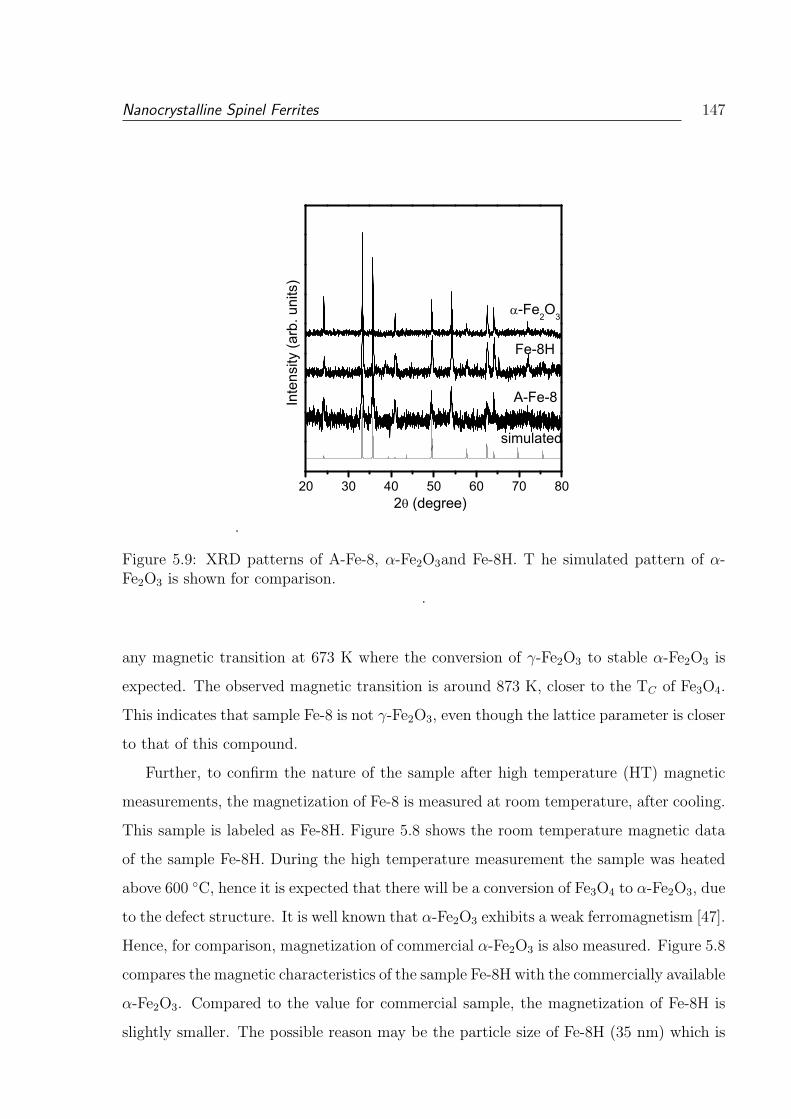
Nanocrystalline Spinel Ferrites 147
.
20 30 40 50 60 70 80
simulated
-Fe2O3
Fe-8H
A-Fe-8Inte
nsity
(arb
. uni
ts)
2 (degree)
Figure 5.9: XRD patterns of A-Fe-8, α-Fe2O3and Fe-8H. T he simulated pattern of α-Fe2O3 is shown for comparison.
.
any magnetic transition at 673 K where the conversion of γ-Fe2O3 to stable α-Fe2O3 is
expected. The observed magnetic transition is around 873 K, closer to the TC of Fe3O4.
This indicates that sample Fe-8 is not γ-Fe2O3, even though the lattice parameter is closer
to that of this compound.
Further, to confirm the nature of the sample after high temperature (HT) magnetic
measurements, the magnetization of Fe-8 is measured at room temperature, after cooling.
This sample is labeled as Fe-8H. Figure 5.8 shows the room temperature magnetic data
of the sample Fe-8H. During the high temperature measurement the sample was heated
above 600 C, hence it is expected that there will be a conversion of Fe3O4 to α-Fe2O3, due
to the defect structure. It is well known that α-Fe2O3 exhibits a weak ferromagnetism [47].
Hence, for comparison, magnetization of commercial α-Fe2O3 is also measured. Figure 5.8
compares the magnetic characteristics of the sample Fe-8H with the commercially available
α-Fe2O3. Compared to the value for commercial sample, the magnetization of Fe-8H is
slightly smaller. The possible reason may be the particle size of Fe-8H (35 nm) which is
Nanocrystalline Spinel Ferrites 148
smaller than the particle size of the commercial sample (70 nm). To confirm the particle
size effect, α-Fe2O3 was freshly prepared (A-Fe-8) through the same synthesis method
using only ferric nitrate. Particle size of A-Fe-8 is obtained as 15 nm, comparable to that
of Fe-8 and the magnetization curve of this sample is shown in the inset of Figure 5.8.
It exhibits a superparamagnetic behavior. The XRD patterns of the samples Fe-8H,
commercial α-Fe2O3 (Aldrich) and A-Fe-8 are compared in Figure 5.9. XRD analysis has
confirmed that the recovered sample Fe-8H is α-Fe2O3.
5.2.3 Conclusions
A simple coprecipitation/digestion method is employed for the synthesis of nanosized
Fe3O4. The effect of digestion time on the structure and properties has been analyzed. A
decrease in the cubic lattice parameter, shifting towards the value for γ-Fe2O3, is observed
with increase in the digestion time. This coupled with IR analysis indicated presence of
cation deficiency in the samples, where the Fe:O ratio decreasing with increasing diges-
tion time. Room temperature saturation magnetization initially increased and further
decreased with increasing digestion time and this could be explained in terms of the
competition between increasing particle size and increasing cation deficiency. Magnetic
measurements above room temperature showed that the compositions of the samples are
closer to that of Fe3O4.
5.3 Nanocrystalline ZnFe2O4
ZnFe2O4 belongs to the normal spinel type structure with the Zn2+ ions occupying the
tetrahedral sites and the Fe3+ ions occupying the octahedral sites [2]. The material is
paramagnetic at room temperature and becomes antiferromagnetic below the Neel tem-
perature of about 10.5 K. However, Neel suggested that small antiferromagnetic particles
can exhibit superparamagnetism and weak ferromagnetism due to uncompensated spins
in the two sublattices [48].
It is well known that by changing the cation distribution in ferrites, one can tune the
magnetic and electrical properties [13,14,49–52]. There are several reports demonstrating
that when normal spinel ferrites becomes nanosized there is a change in the cation distri-
bution, which enhances the magnetic properties [13,53–60]. When ZnFe2O4 is prepared in
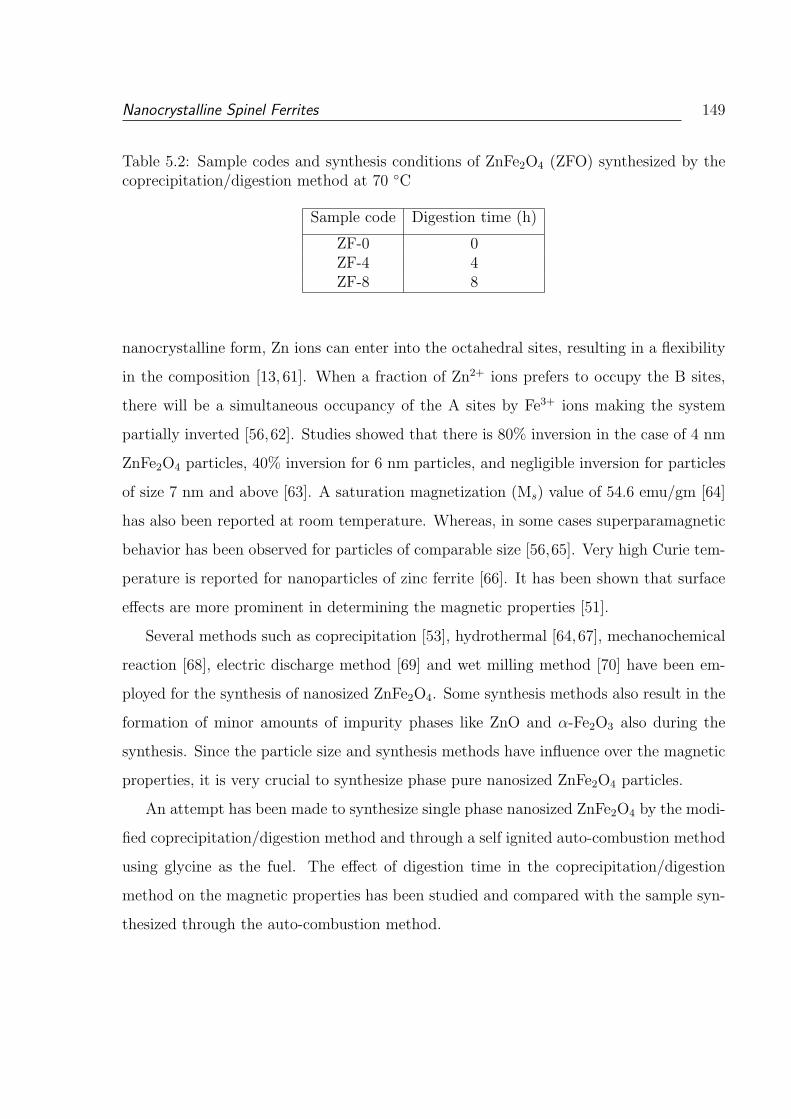
Nanocrystalline Spinel Ferrites 149
Table 5.2: Sample codes and synthesis conditions of ZnFe2O4 (ZFO) synthesized by thecoprecipitation/digestion method at 70 C
Sample code Digestion time (h)
ZF-0 0ZF-4 4ZF-8 8
nanocrystalline form, Zn ions can enter into the octahedral sites, resulting in a flexibility
in the composition [13, 61]. When a fraction of Zn2+ ions prefers to occupy the B sites,
there will be a simultaneous occupancy of the A sites by Fe3+ ions making the system
partially inverted [56,62]. Studies showed that there is 80% inversion in the case of 4 nm
ZnFe2O4 particles, 40% inversion for 6 nm particles, and negligible inversion for particles
of size 7 nm and above [63]. A saturation magnetization (Ms) value of 54.6 emu/gm [64]
has also been reported at room temperature. Whereas, in some cases superparamagnetic
behavior has been observed for particles of comparable size [56,65]. Very high Curie tem-
perature is reported for nanoparticles of zinc ferrite [66]. It has been shown that surface
effects are more prominent in determining the magnetic properties [51].
Several methods such as coprecipitation [53], hydrothermal [64,67], mechanochemical
reaction [68], electric discharge method [69] and wet milling method [70] have been em-
ployed for the synthesis of nanosized ZnFe2O4. Some synthesis methods also result in the
formation of minor amounts of impurity phases like ZnO and α-Fe2O3 also during the
synthesis. Since the particle size and synthesis methods have influence over the magnetic
properties, it is very crucial to synthesize phase pure nanosized ZnFe2O4 particles.
An attempt has been made to synthesize single phase nanosized ZnFe2O4 by the modi-
fied coprecipitation/digestion method and through a self ignited auto-combustion method
using glycine as the fuel. The effect of digestion time in the coprecipitation/digestion
method on the magnetic properties has been studied and compared with the sample syn-
thesized through the auto-combustion method.
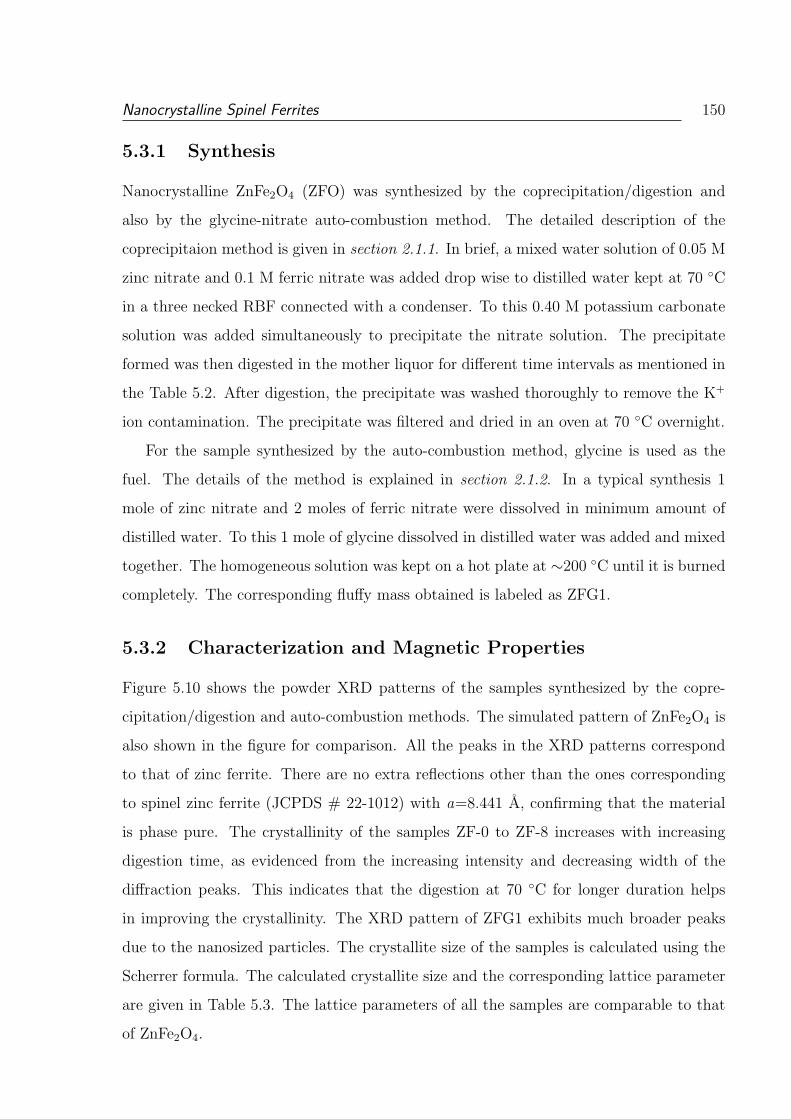
Nanocrystalline Spinel Ferrites 150
5.3.1 Synthesis
Nanocrystalline ZnFe2O4 (ZFO) was synthesized by the coprecipitation/digestion and
also by the glycine-nitrate auto-combustion method. The detailed description of the
coprecipitaion method is given in section 2.1.1. In brief, a mixed water solution of 0.05 M
zinc nitrate and 0.1 M ferric nitrate was added drop wise to distilled water kept at 70 C
in a three necked RBF connected with a condenser. To this 0.40 M potassium carbonate
solution was added simultaneously to precipitate the nitrate solution. The precipitate
formed was then digested in the mother liquor for different time intervals as mentioned in
the Table 5.2. After digestion, the precipitate was washed thoroughly to remove the K+
ion contamination. The precipitate was filtered and dried in an oven at 70 C overnight.
For the sample synthesized by the auto-combustion method, glycine is used as the
fuel. The details of the method is explained in section 2.1.2. In a typical synthesis 1
mole of zinc nitrate and 2 moles of ferric nitrate were dissolved in minimum amount of
distilled water. To this 1 mole of glycine dissolved in distilled water was added and mixed
together. The homogeneous solution was kept on a hot plate at ∼200 C until it is burned
completely. The corresponding fluffy mass obtained is labeled as ZFG1.
5.3.2 Characterization and Magnetic Properties
Figure 5.10 shows the powder XRD patterns of the samples synthesized by the copre-
cipitation/digestion and auto-combustion methods. The simulated pattern of ZnFe2O4 is
also shown in the figure for comparison. All the peaks in the XRD patterns correspond
to that of zinc ferrite. There are no extra reflections other than the ones corresponding
to spinel zinc ferrite (JCPDS # 22-1012) with a=8.441 A, confirming that the material
is phase pure. The crystallinity of the samples ZF-0 to ZF-8 increases with increasing
digestion time, as evidenced from the increasing intensity and decreasing width of the
diffraction peaks. This indicates that the digestion at 70 C for longer duration helps
in improving the crystallinity. The XRD pattern of ZFG1 exhibits much broader peaks
due to the nanosized particles. The crystallite size of the samples is calculated using the
Scherrer formula. The calculated crystallite size and the corresponding lattice parameter
are given in Table 5.3. The lattice parameters of all the samples are comparable to that
of ZnFe2O4.
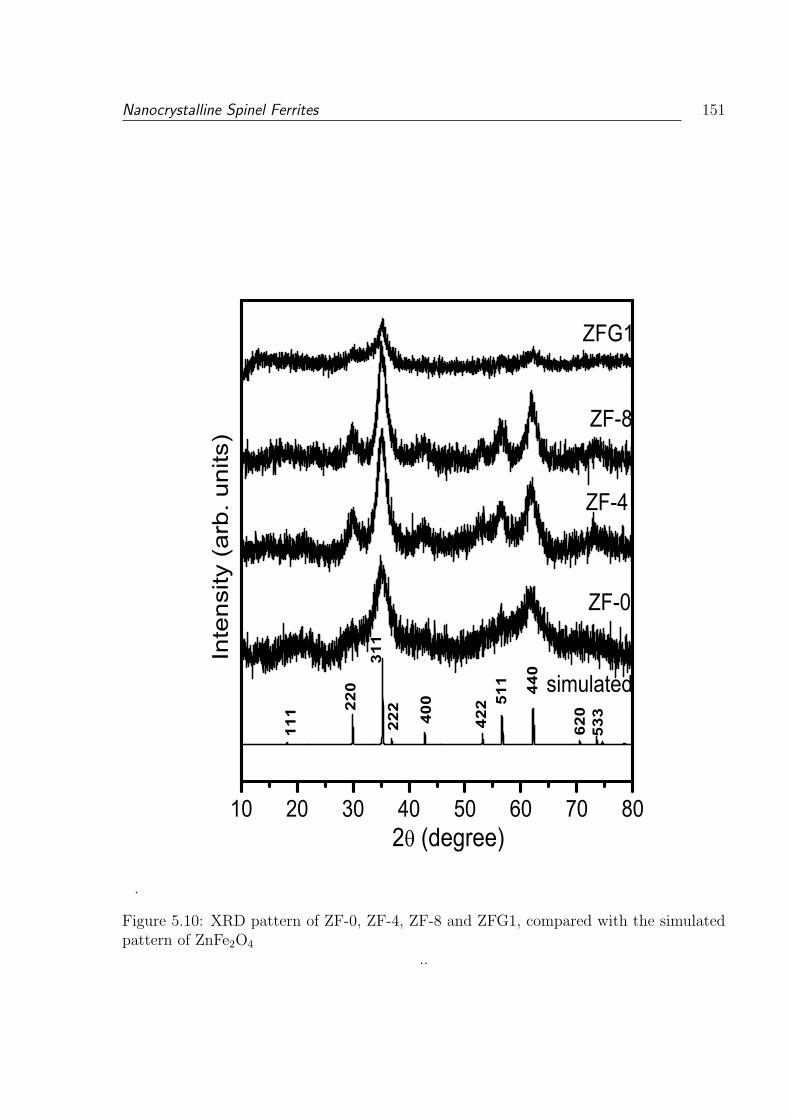
Nanocrystalline Spinel Ferrites 151
.
10 20 30 40 50 60 70 80
simulated
ZFG1
ZF-8
ZF-4
ZF-053
362
0
440
511
422
222
400
311
220
111
Inte
nsity
(ar
b. u
nits
)
2 (degree)
Figure 5.10: XRD pattern of ZF-0, ZF-4, ZF-8 and ZFG1, compared with the simulatedpattern of ZnFe2O4
..
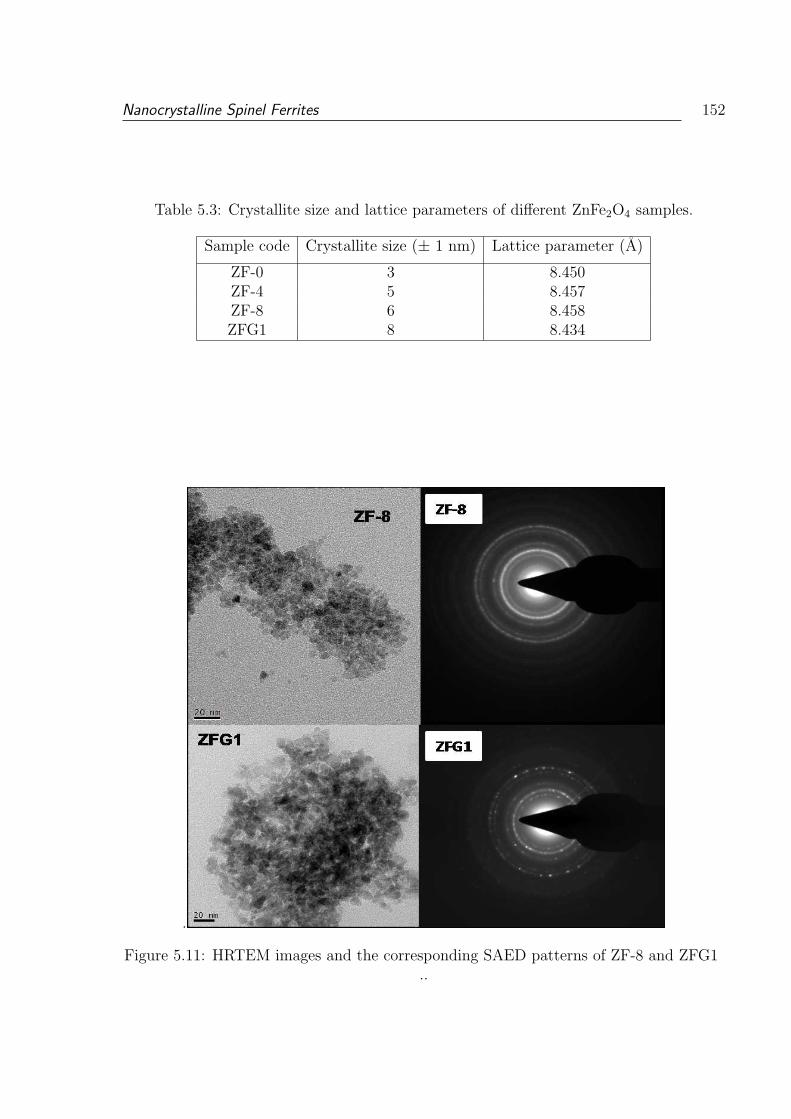
Nanocrystalline Spinel Ferrites 152
Table 5.3: Crystallite size and lattice parameters of different ZnFe2O4 samples.
Sample code Crystallite size (± 1 nm) Lattice parameter (A)
ZF-0 3 8.450ZF-4 5 8.457ZF-8 6 8.458ZFG1 8 8.434
.
Figure 5.11: HRTEM images and the corresponding SAED patterns of ZF-8 and ZFG1..
Nanocrystalline Spinel Ferrites 153
.
-60 -40 -20 0 20 40 60 -8
-6
-4
-2
0
2
4
6
8
ZFG1
ZF-8
ZF-0
M (
emu/
g)
H (KOe)
Figure 5.12: M vs H curves of ZF-0, ZF-8 and ZFG1 at 300 K..
Morphological features the samples ZF-8 and ZFG1 are obtained from HRTEM as
shown in Figure 5.11. The micrographs show that the particle size distribution is narrow
in both the cases. In both the cases the particles formed are spherical in nature and
aggregated together. The average particle size obtained from HRTEM is 6–8 nm for ZF-8
and 8–10 nm for ZFG1. In both the cases, ring type patterns are observed in SAED which
reflects the polycrystalline nature of the samples.
To get information on the effect of digestion time and the method of synthesis on the
magnetic properties, magnetic measurements were carried out on all samples. The magne-
tization as a function of field (M-H) recorded at room temperature for the samples ZF-0,
ZF-8 and ZFG1 are shown in Figure 5.12. The samples ZF-0 and ZF-8 are paramagnetic
in nature, where as the sample ZFG1 synthesized through the auto-combustion method
shows superparamagnetic behavior. The Ms value of ZFG1 is calculated as 10.2 emu/g
by extrapolating the M vs 1/H curve to 1/H = 0. The M-H curves measured at 5K are
shown in Figure 5.13. All the three samples show magnetic hysteresis loops and the coer-
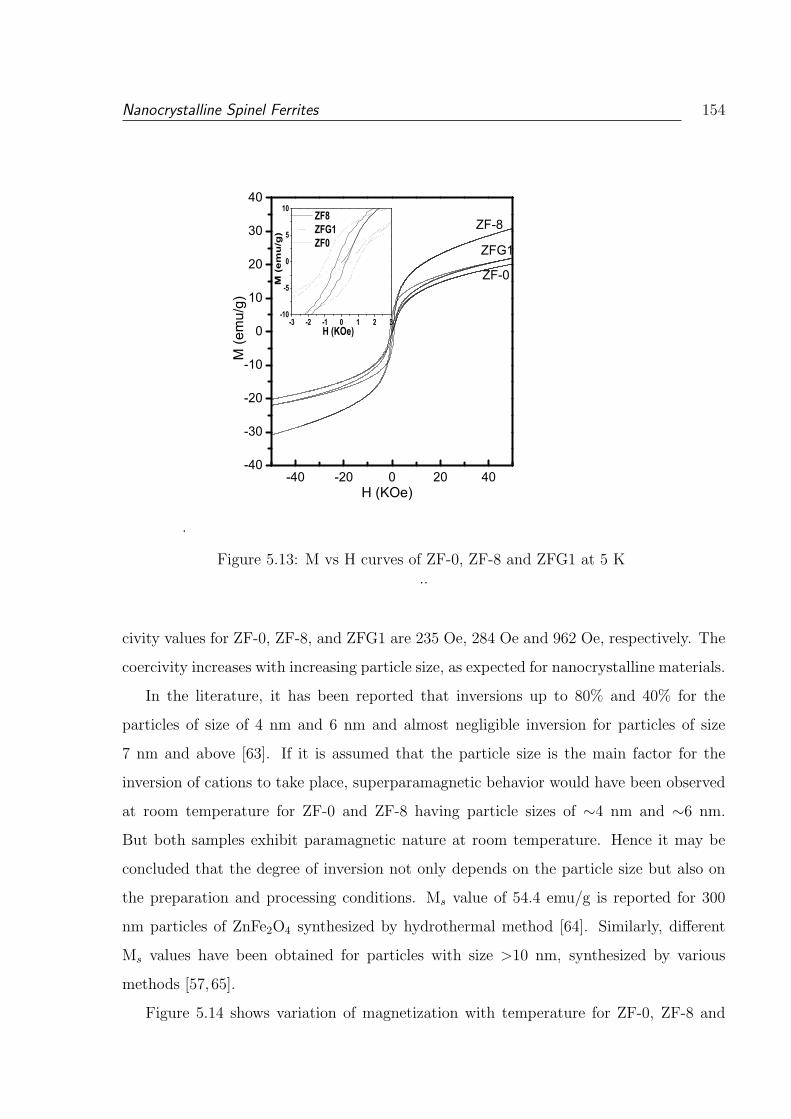
Nanocrystalline Spinel Ferrites 154
.
-40 -20 0 20 40-40
-30
-20
-10
0
10
20
30
40
-3 -2 -1 0 1 2 3-10
-5
0
5
10 ZF8 ZFG1 ZF0
M (
em
u/g
)
H (KOe)
ZF-0
ZFG1
ZF-8
M (e
mu/
g)
H (KOe)
Figure 5.13: M vs H curves of ZF-0, ZF-8 and ZFG1 at 5 K..
civity values for ZF-0, ZF-8, and ZFG1 are 235 Oe, 284 Oe and 962 Oe, respectively. The
coercivity increases with increasing particle size, as expected for nanocrystalline materials.
In the literature, it has been reported that inversions up to 80% and 40% for the
particles of size of 4 nm and 6 nm and almost negligible inversion for particles of size
7 nm and above [63]. If it is assumed that the particle size is the main factor for the
inversion of cations to take place, superparamagnetic behavior would have been observed
at room temperature for ZF-0 and ZF-8 having particle sizes of ∼4 nm and ∼6 nm.
But both samples exhibit paramagnetic nature at room temperature. Hence it may be
concluded that the degree of inversion not only depends on the particle size but also on
the preparation and processing conditions. Ms value of 54.4 emu/g is reported for 300
nm particles of ZnFe2O4 synthesized by hydrothermal method [64]. Similarly, different
Ms values have been obtained for particles with size >10 nm, synthesized by various
methods [57,65].
Figure 5.14 shows variation of magnetization with temperature for ZF-0, ZF-8 and
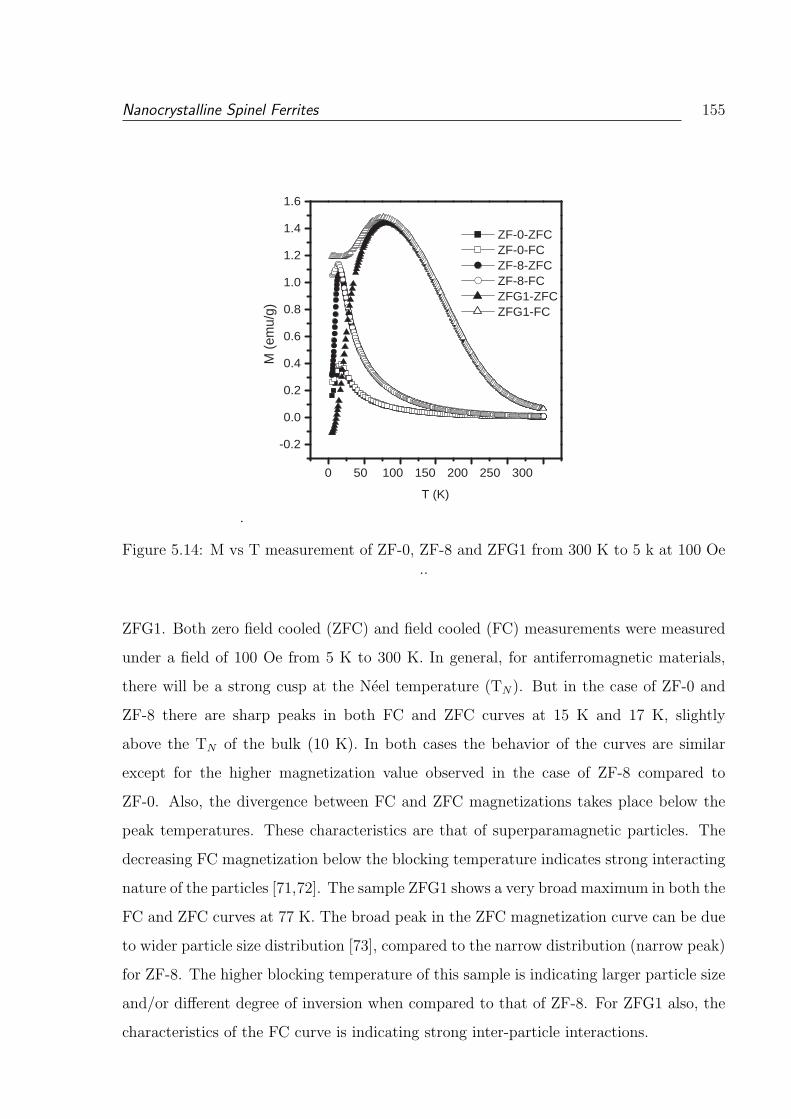
Nanocrystalline Spinel Ferrites 155
.
0 50 100 150 200 250 300
-0.2
0.0
0.2
0.4
0.6
0.8
1.0
1.2
1.4
1.6
ZF-0-ZFC ZF-0-FC ZF-8-ZFC ZF-8-FC ZFG1-ZFC ZFG1-FC
M (
emu/
g)
T (K)
Figure 5.14: M vs T measurement of ZF-0, ZF-8 and ZFG1 from 300 K to 5 k at 100 Oe..
ZFG1. Both zero field cooled (ZFC) and field cooled (FC) measurements were measured
under a field of 100 Oe from 5 K to 300 K. In general, for antiferromagnetic materials,
there will be a strong cusp at the Neel temperature (TN). But in the case of ZF-0 and
ZF-8 there are sharp peaks in both FC and ZFC curves at 15 K and 17 K, slightly
above the TN of the bulk (10 K). In both cases the behavior of the curves are similar
except for the higher magnetization value observed in the case of ZF-8 compared to
ZF-0. Also, the divergence between FC and ZFC magnetizations takes place below the
peak temperatures. These characteristics are that of superparamagnetic particles. The
decreasing FC magnetization below the blocking temperature indicates strong interacting
nature of the particles [71,72]. The sample ZFG1 shows a very broad maximum in both the
FC and ZFC curves at 77 K. The broad peak in the ZFC magnetization curve can be due
to wider particle size distribution [73], compared to the narrow distribution (narrow peak)
for ZF-8. The higher blocking temperature of this sample is indicating larger particle size
and/or different degree of inversion when compared to that of ZF-8. For ZFG1 also, the
characteristics of the FC curve is indicating strong inter-particle interactions.
Nanocrystalline Spinel Ferrites 156
5.3.3 Conclusions
Nanocrystalline ZnFe2O4 has been synthesized at a mild condition of 70 C by a copre-
cipitation/digestion method. During the synthesis, digestion time is varied and this gives
particles of different sizes. Particles of size 3 and 6 nm shows paramagnetic behavior
at room temperature and superparamagnetic blocking temperatures of 15 K and 17 K,
respectively. Nature of the magnetization curves indicate narrow particle size distribu-
tion. For a sample synthesized by an auto-combustion method, with comparable average
particle size, superparamagnetic behavior is observed at room temperature. This sample
shows a larger blocking temperature of 77 K and a broad peak in the ZFC magnetiza-
tion indicating wider particle size distribution. Particles of comparable sizes show widely
differing magnetic behavior. This indicates that the degree of inversion of the cations
depends not only the size but also on the method of synthesis.
5.4 Nanocrystalline CoFe2O4
CoFe2O4 is a technologically important ferrimagnetic oxide with high coercivity, moder-
ate saturation magnetization and with remarkable chemical stability. The material has
been extensively studied for its various properties [74–78] and applications such as an-
ode material for Li-ion batteries [6], as a gas sensor [79], and in high density magnetic
recording. Cobalt ferrite has been studied for its magnetostrictive properties [80, 81]. In
the field of medicine, it may find application as heating agents in magnetically activated
drug delivery system [82].
CoFe2O4 crystalizes in the inverse cubic spinel structure. It can be represented with
the general formula (CoxFe1−x)[Co1−xFe1+x]O4. The cation distribution factor x describes
the fraction of tetrahedral sites occupied by Co2+ cations [83]. The degree of inversion of
the cations is determined by the preparation and processing conditions [84, 85]. The mi-
gration of ions between the two sites has been experimentally studied by using Mossbauer
spectroscopy [86], Raman spectroscopy [76]. Depending on the particle size [9, 87] and
cation distribution [76, 88], the magnetic properties are known to vary for the CoFe2O4
system. Very recently, inverse magnetocaloric effect is reported for nanoparticles of cobalt
ferrite [89].
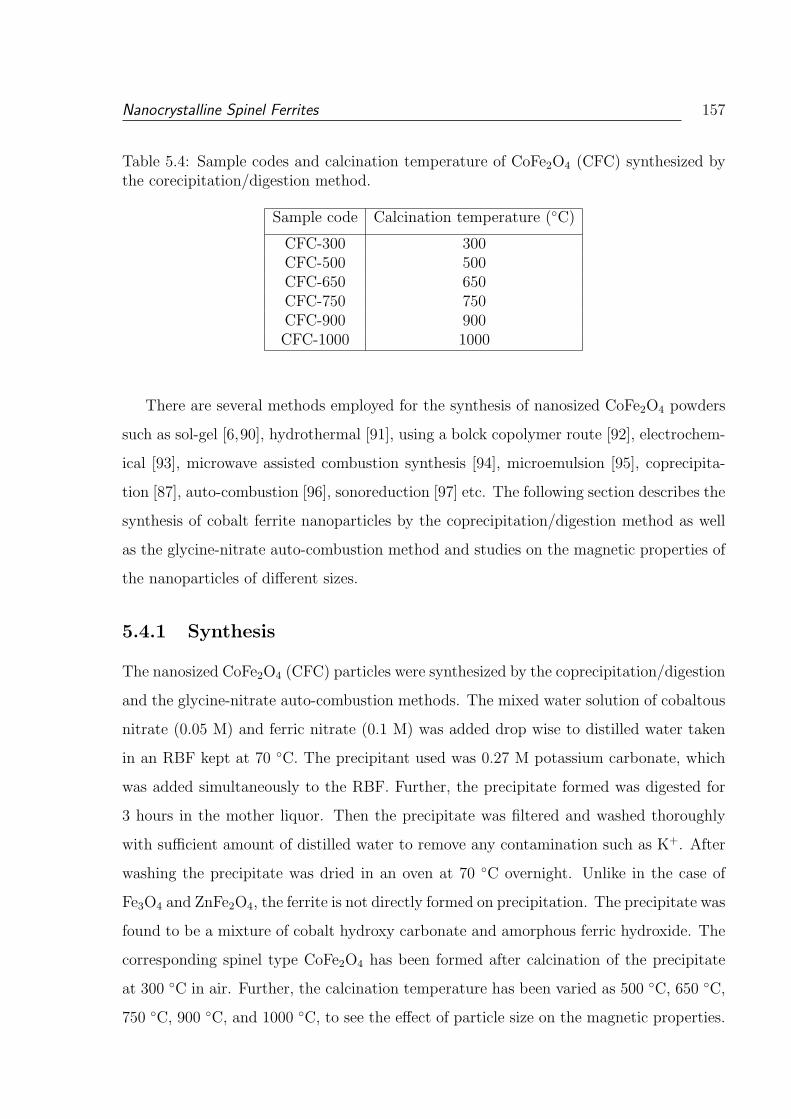
Nanocrystalline Spinel Ferrites 157
Table 5.4: Sample codes and calcination temperature of CoFe2O4 (CFC) synthesized bythe corecipitation/digestion method.
Sample code Calcination temperature (C)
CFC-300 300CFC-500 500CFC-650 650CFC-750 750CFC-900 900CFC-1000 1000
There are several methods employed for the synthesis of nanosized CoFe2O4 powders
such as sol-gel [6,90], hydrothermal [91], using a bolck copolymer route [92], electrochem-
ical [93], microwave assisted combustion synthesis [94], microemulsion [95], coprecipita-
tion [87], auto-combustion [96], sonoreduction [97] etc. The following section describes the
synthesis of cobalt ferrite nanoparticles by the coprecipitation/digestion method as well
as the glycine-nitrate auto-combustion method and studies on the magnetic properties of
the nanoparticles of different sizes.
5.4.1 Synthesis
The nanosized CoFe2O4 (CFC) particles were synthesized by the coprecipitation/digestion
and the glycine-nitrate auto-combustion methods. The mixed water solution of cobaltous
nitrate (0.05 M) and ferric nitrate (0.1 M) was added drop wise to distilled water taken
in an RBF kept at 70 C. The precipitant used was 0.27 M potassium carbonate, which
was added simultaneously to the RBF. Further, the precipitate formed was digested for
3 hours in the mother liquor. Then the precipitate was filtered and washed thoroughly
with sufficient amount of distilled water to remove any contamination such as K+. After
washing the precipitate was dried in an oven at 70 C overnight. Unlike in the case of
Fe3O4 and ZnFe2O4, the ferrite is not directly formed on precipitation. The precipitate was
found to be a mixture of cobalt hydroxy carbonate and amorphous ferric hydroxide. The
corresponding spinel type CoFe2O4 has been formed after calcination of the precipitate
at 300 C in air. Further, the calcination temperature has been varied as 500 C, 650 C,
750 C, 900 C, and 1000 C, to see the effect of particle size on the magnetic properties.
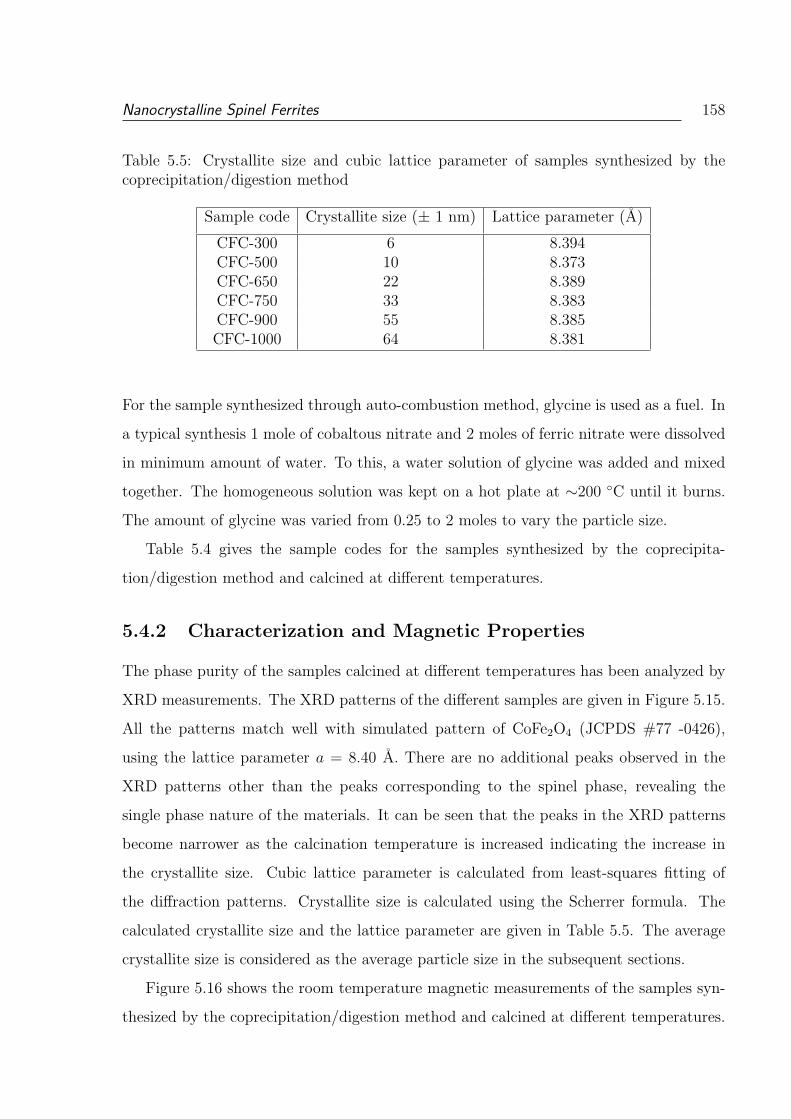
Nanocrystalline Spinel Ferrites 158
Table 5.5: Crystallite size and cubic lattice parameter of samples synthesized by thecoprecipitation/digestion method
Sample code Crystallite size (± 1 nm) Lattice parameter (A)
CFC-300 6 8.394CFC-500 10 8.373CFC-650 22 8.389CFC-750 33 8.383CFC-900 55 8.385CFC-1000 64 8.381
For the sample synthesized through auto-combustion method, glycine is used as a fuel. In
a typical synthesis 1 mole of cobaltous nitrate and 2 moles of ferric nitrate were dissolved
in minimum amount of water. To this, a water solution of glycine was added and mixed
together. The homogeneous solution was kept on a hot plate at ∼200 C until it burns.
The amount of glycine was varied from 0.25 to 2 moles to vary the particle size.
Table 5.4 gives the sample codes for the samples synthesized by the coprecipita-
tion/digestion method and calcined at different temperatures.
5.4.2 Characterization and Magnetic Properties
The phase purity of the samples calcined at different temperatures has been analyzed by
XRD measurements. The XRD patterns of the different samples are given in Figure 5.15.
All the patterns match well with simulated pattern of CoFe2O4 (JCPDS #77 -0426),
using the lattice parameter a = 8.40 A. There are no additional peaks observed in the
XRD patterns other than the peaks corresponding to the spinel phase, revealing the
single phase nature of the materials. It can be seen that the peaks in the XRD patterns
become narrower as the calcination temperature is increased indicating the increase in
the crystallite size. Cubic lattice parameter is calculated from least-squares fitting of
the diffraction patterns. Crystallite size is calculated using the Scherrer formula. The
calculated crystallite size and the lattice parameter are given in Table 5.5. The average
crystallite size is considered as the average particle size in the subsequent sections.
Figure 5.16 shows the room temperature magnetic measurements of the samples syn-
thesized by the coprecipitation/digestion method and calcined at different temperatures.
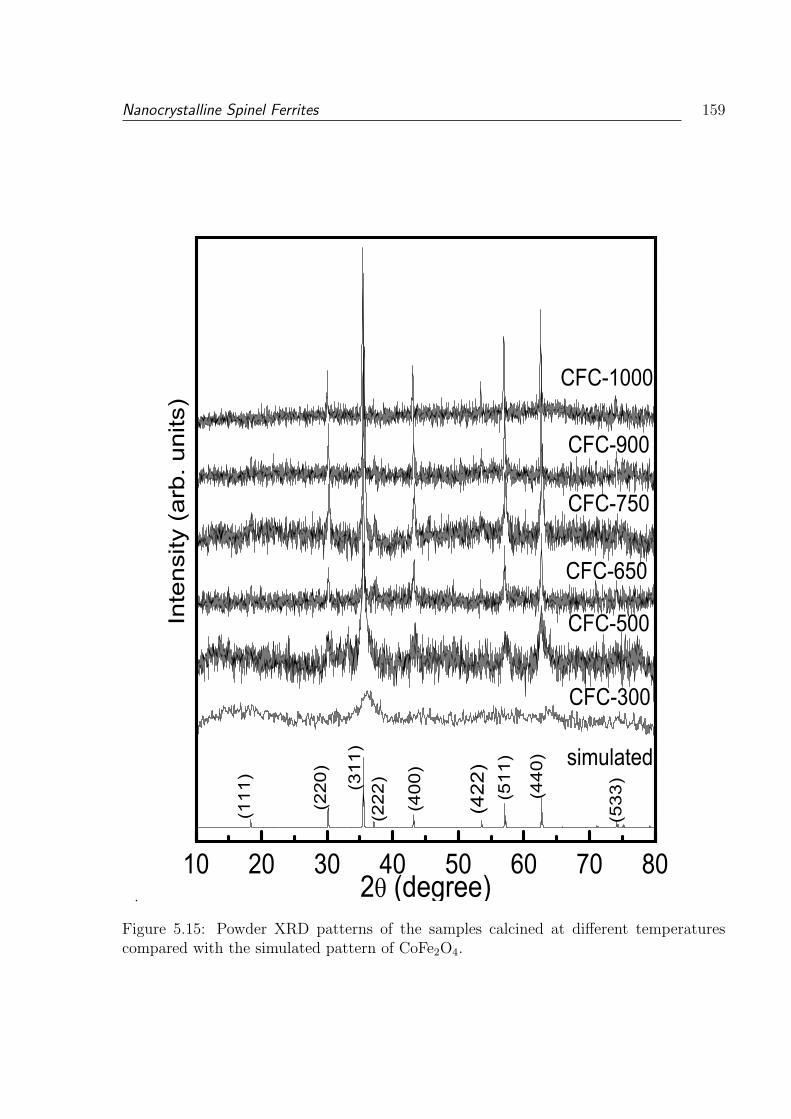
Nanocrystalline Spinel Ferrites 159
.
10 20 30 40 50 60 70 80
(533
)
(422
)
(440
)
(511
)
(400
)
(222
)(311
)
(220
)
(111
)
Inte
nsity
(ar
b. u
nits
)
simulated
CFC-500
CFC-650
CFC-750
CFC-900
CFC-1000
CFC-300
2 (degree)Figure 5.15: Powder XRD patterns of the samples calcined at different temperaturescompared with the simulated pattern of CoFe2O4.
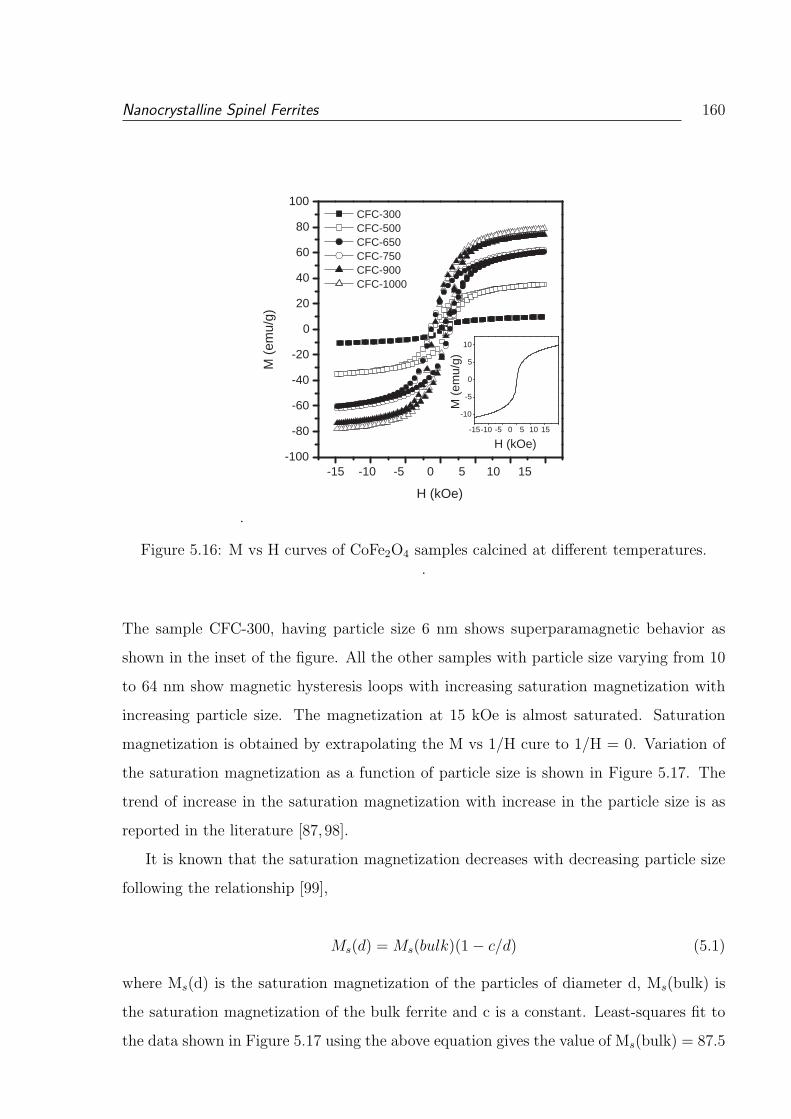
Nanocrystalline Spinel Ferrites 160
.
-15 -10 -5 0 5 10 15 -100
-80
-60
-40
-20
0
20
40
60
80
100
M (
emu/
g)
H (kOe)
M (
emu/
g)
H (kOe)
CFC-300 CFC-500 CFC-650 CFC-750 CFC-900 CFC-1000
-15 -10 -5 0 5 10 15
-10
-5
0
5
10
Figure 5.16: M vs H curves of CoFe2O4 samples calcined at different temperatures..
The sample CFC-300, having particle size 6 nm shows superparamagnetic behavior as
shown in the inset of the figure. All the other samples with particle size varying from 10
to 64 nm show magnetic hysteresis loops with increasing saturation magnetization with
increasing particle size. The magnetization at 15 kOe is almost saturated. Saturation
magnetization is obtained by extrapolating the M vs 1/H cure to 1/H = 0. Variation of
the saturation magnetization as a function of particle size is shown in Figure 5.17. The
trend of increase in the saturation magnetization with increase in the particle size is as
reported in the literature [87,98].
It is known that the saturation magnetization decreases with decreasing particle size
following the relationship [99],
Ms(d) = Ms(bulk)(1− c/d) (5.1)
where Ms(d) is the saturation magnetization of the particles of diameter d, Ms(bulk) is
the saturation magnetization of the bulk ferrite and c is a constant. Least-squares fit to
the data shown in Figure 5.17 using the above equation gives the value of Ms(bulk) = 87.5
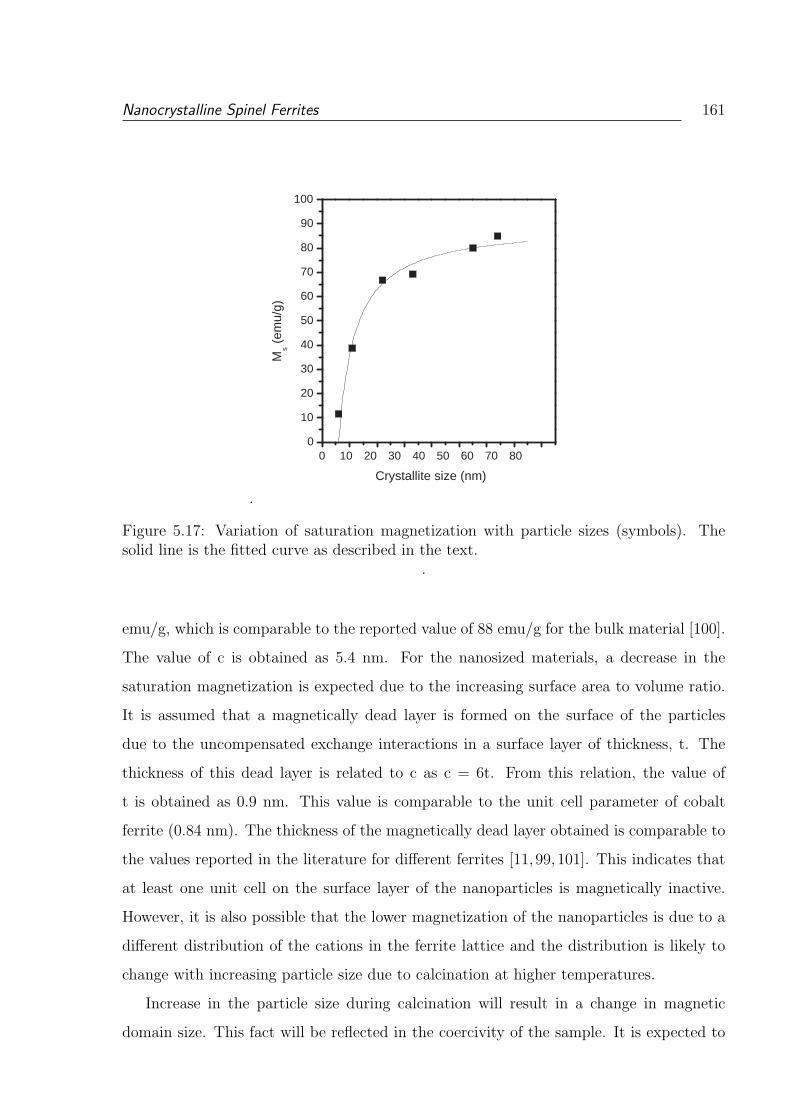
Nanocrystalline Spinel Ferrites 161
.
0 10 20 30 40 50 60 70 80 0
10
20
30
40
50
60
70
80
90
100
M s (
emu/
g)
Crystallite size (nm)
Figure 5.17: Variation of saturation magnetization with particle sizes (symbols). Thesolid line is the fitted curve as described in the text.
.
emu/g, which is comparable to the reported value of 88 emu/g for the bulk material [100].
The value of c is obtained as 5.4 nm. For the nanosized materials, a decrease in the
saturation magnetization is expected due to the increasing surface area to volume ratio.
It is assumed that a magnetically dead layer is formed on the surface of the particles
due to the uncompensated exchange interactions in a surface layer of thickness, t. The
thickness of this dead layer is related to c as c = 6t. From this relation, the value of
t is obtained as 0.9 nm. This value is comparable to the unit cell parameter of cobalt
ferrite (0.84 nm). The thickness of the magnetically dead layer obtained is comparable to
the values reported in the literature for different ferrites [11, 99,101]. This indicates that
at least one unit cell on the surface layer of the nanoparticles is magnetically inactive.
However, it is also possible that the lower magnetization of the nanoparticles is due to a
different distribution of the cations in the ferrite lattice and the distribution is likely to
change with increasing particle size due to calcination at higher temperatures.
Increase in the particle size during calcination will result in a change in magnetic
domain size. This fact will be reflected in the coercivity of the sample. It is expected to
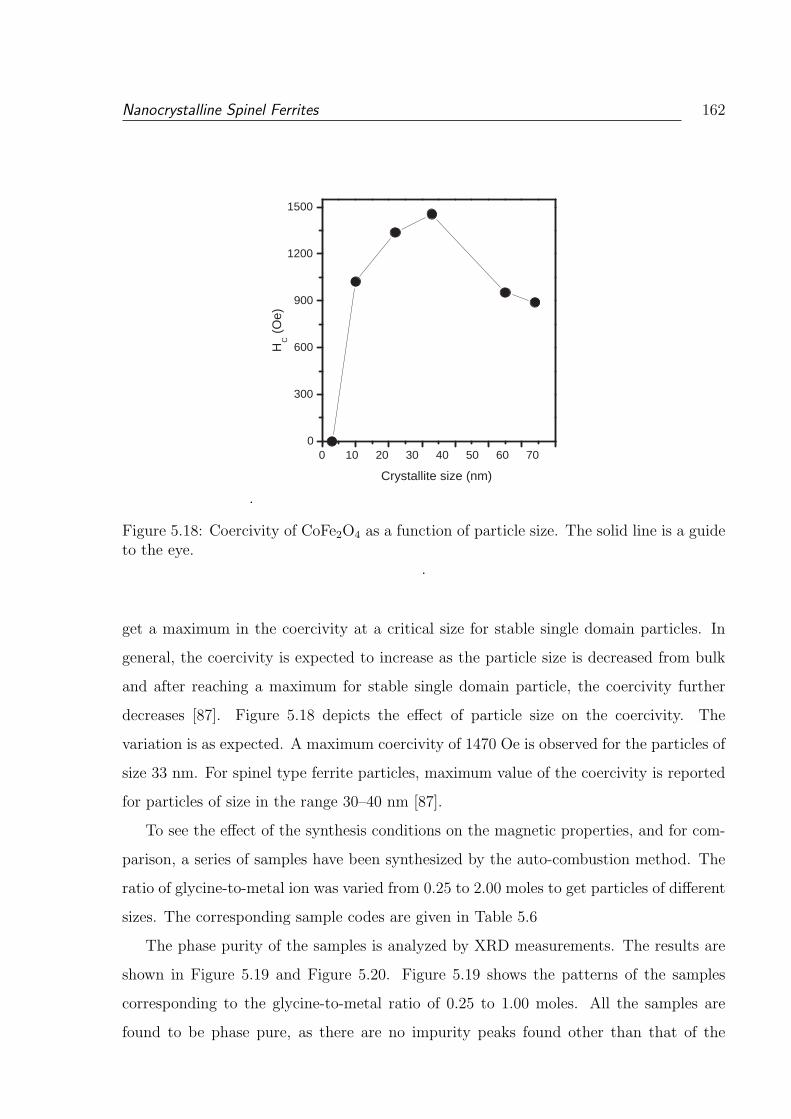
Nanocrystalline Spinel Ferrites 162
.
0 10 20 30 40 50 60 70 0
300
600
900
1200
1500
H C
(O
e)
Crystallite size (nm)
Figure 5.18: Coercivity of CoFe2O4 as a function of particle size. The solid line is a guideto the eye.
.
get a maximum in the coercivity at a critical size for stable single domain particles. In
general, the coercivity is expected to increase as the particle size is decreased from bulk
and after reaching a maximum for stable single domain particle, the coercivity further
decreases [87]. Figure 5.18 depicts the effect of particle size on the coercivity. The
variation is as expected. A maximum coercivity of 1470 Oe is observed for the particles of
size 33 nm. For spinel type ferrite particles, maximum value of the coercivity is reported
for particles of size in the range 30–40 nm [87].
To see the effect of the synthesis conditions on the magnetic properties, and for com-
parison, a series of samples have been synthesized by the auto-combustion method. The
ratio of glycine-to-metal ion was varied from 0.25 to 2.00 moles to get particles of different
sizes. The corresponding sample codes are given in Table 5.6
The phase purity of the samples is analyzed by XRD measurements. The results are
shown in Figure 5.19 and Figure 5.20. Figure 5.19 shows the patterns of the samples
corresponding to the glycine-to-metal ratio of 0.25 to 1.00 moles. All the samples are
found to be phase pure, as there are no impurity peaks found other than that of the
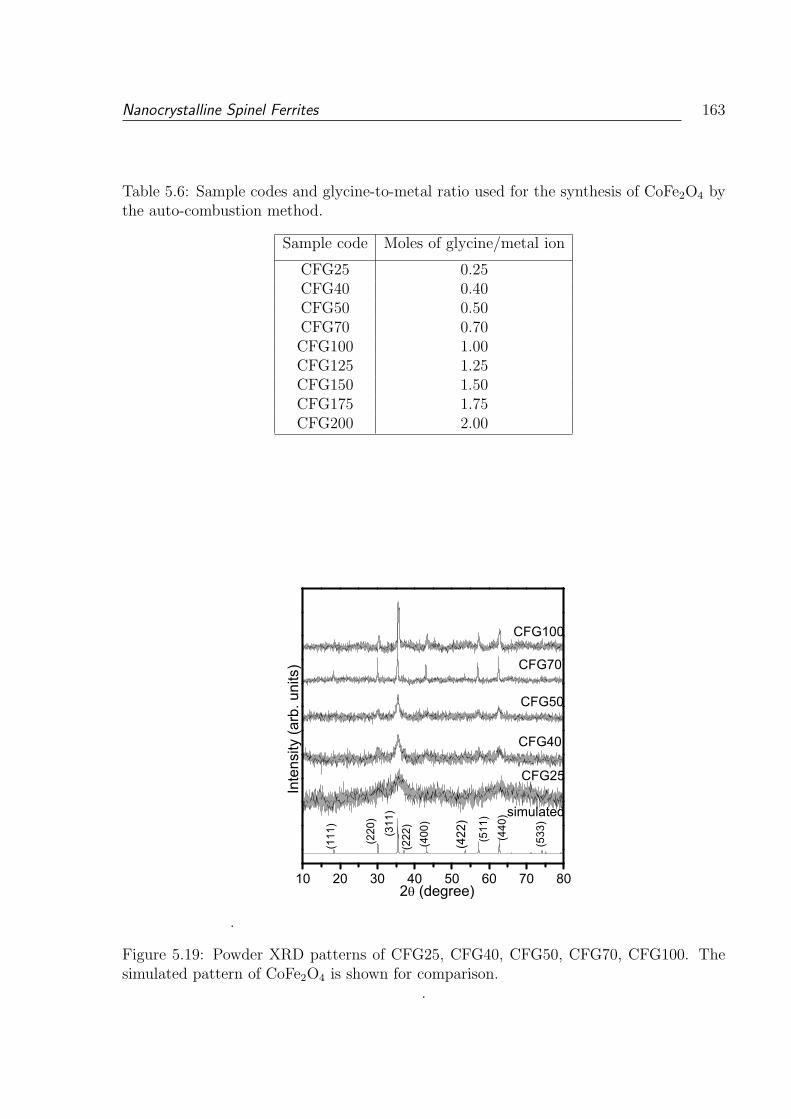
Nanocrystalline Spinel Ferrites 163
Table 5.6: Sample codes and glycine-to-metal ratio used for the synthesis of CoFe2O4 bythe auto-combustion method.
Sample code Moles of glycine/metal ion
CFG25 0.25CFG40 0.40CFG50 0.50CFG70 0.70CFG100 1.00CFG125 1.25CFG150 1.50CFG175 1.75CFG200 2.00
.
10 20 30 40 50 60 70 80
simulated
(533
)
(440
)
(511
)
(422
)
(400
)(2
22)
(311
)
(220
)
(111
)
CFG100
CFG70
CFG50
CFG40
CFG25
Inte
nsity
(arb
. uni
ts)
2 (degree)
Figure 5.19: Powder XRD patterns of CFG25, CFG40, CFG50, CFG70, CFG100. Thesimulated pattern of CoFe2O4 is shown for comparison.
.
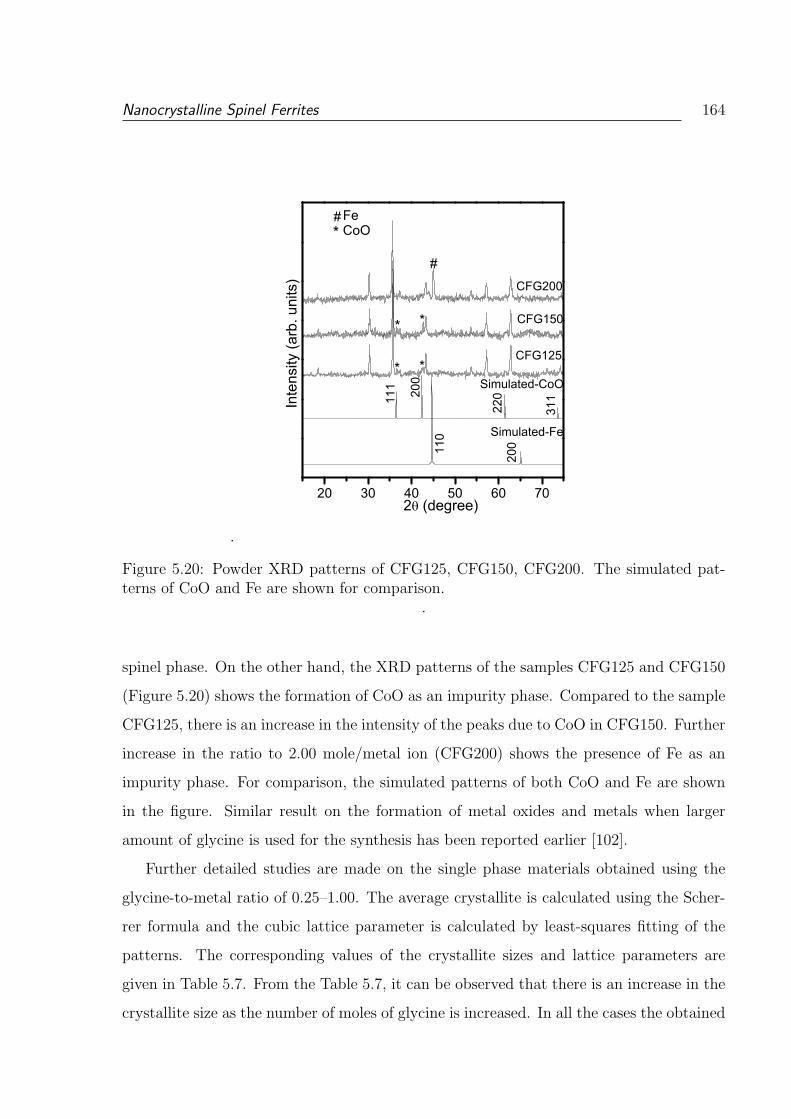
Nanocrystalline Spinel Ferrites 164
.
20 30 40 50 60 7020
0110
311
22020
0
111 Simulated-CoO
Simulated-Fe
#* CoO
Fe
CFG200
CFG150
CFG125
**
#
* *
Inte
nsity
(arb
. uni
ts)
2 (degree)
Figure 5.20: Powder XRD patterns of CFG125, CFG150, CFG200. The simulated pat-terns of CoO and Fe are shown for comparison.
.
spinel phase. On the other hand, the XRD patterns of the samples CFG125 and CFG150
(Figure 5.20) shows the formation of CoO as an impurity phase. Compared to the sample
CFG125, there is an increase in the intensity of the peaks due to CoO in CFG150. Further
increase in the ratio to 2.00 mole/metal ion (CFG200) shows the presence of Fe as an
impurity phase. For comparison, the simulated patterns of both CoO and Fe are shown
in the figure. Similar result on the formation of metal oxides and metals when larger
amount of glycine is used for the synthesis has been reported earlier [102].
Further detailed studies are made on the single phase materials obtained using the
glycine-to-metal ratio of 0.25–1.00. The average crystallite is calculated using the Scher-
rer formula and the cubic lattice parameter is calculated by least-squares fitting of the
patterns. The corresponding values of the crystallite sizes and lattice parameters are
given in Table 5.7. From the Table 5.7, it can be observed that there is an increase in the
crystallite size as the number of moles of glycine is increased. In all the cases the obtained

Nanocrystalline Spinel Ferrites 165
Table 5.7: Crystallite size and lattice parameter of samples synthesized using variousmoles of glycine
Sample code Crystallite size (±1 nm) Lattice parameter (A)
CFG25 5 8.393CFG40 6 8.382CFG50 10 8.387CFG70 24 8.396CFG100 48 8.395
.
-15 -10 -5 0 5 10 15 -60
-40
-20
0
20
40
60
M (
emu/
g)
H (kOe)
CFG25 CFG40 CFG50 CFG70 CFG100
M (
emu/
g)
H (kOe)
-15 -10 -5 0 5 10 15 -9
-6
-3
0
3
6
9 CFG40
CFG25
Figure 5.21: M vs H curves of CoFe2O4 samples synthesized with various glycine to metalratios from 0.25–1.00. Inset: M vs H of CFG25 and CFG40
..
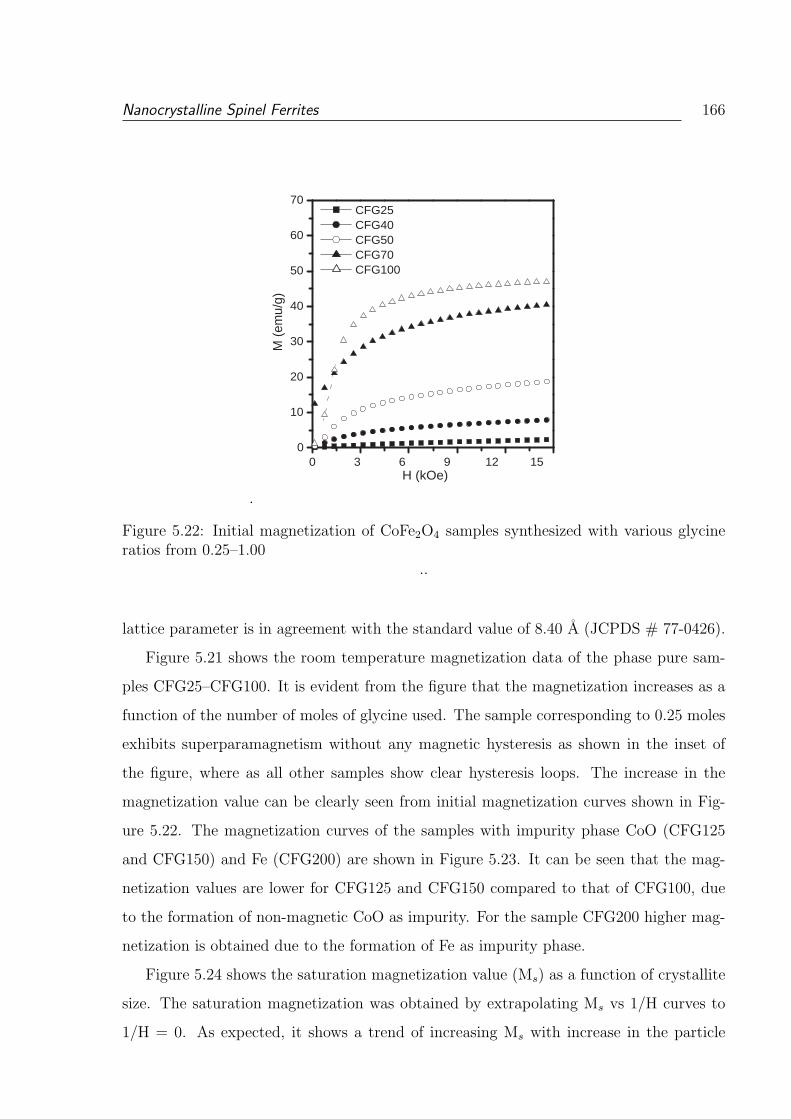
Nanocrystalline Spinel Ferrites 166
.
0 3 6 9 12 15 0
10
20
30
40
50
60
70 CFG25 CFG40 CFG50 CFG70 CFG100
M (
emu/
g)
H (kOe)
Figure 5.22: Initial magnetization of CoFe2O4 samples synthesized with various glycineratios from 0.25–1.00
..
lattice parameter is in agreement with the standard value of 8.40 A (JCPDS # 77-0426).
Figure 5.21 shows the room temperature magnetization data of the phase pure sam-
ples CFG25–CFG100. It is evident from the figure that the magnetization increases as a
function of the number of moles of glycine used. The sample corresponding to 0.25 moles
exhibits superparamagnetism without any magnetic hysteresis as shown in the inset of
the figure, where as all other samples show clear hysteresis loops. The increase in the
magnetization value can be clearly seen from initial magnetization curves shown in Fig-
ure 5.22. The magnetization curves of the samples with impurity phase CoO (CFG125
and CFG150) and Fe (CFG200) are shown in Figure 5.23. It can be seen that the mag-
netization values are lower for CFG125 and CFG150 compared to that of CFG100, due
to the formation of non-magnetic CoO as impurity. For the sample CFG200 higher mag-
netization is obtained due to the formation of Fe as impurity phase.
Figure 5.24 shows the saturation magnetization value (Ms) as a function of crystallite
size. The saturation magnetization was obtained by extrapolating Ms vs 1/H curves to
1/H = 0. As expected, it shows a trend of increasing Ms with increase in the particle
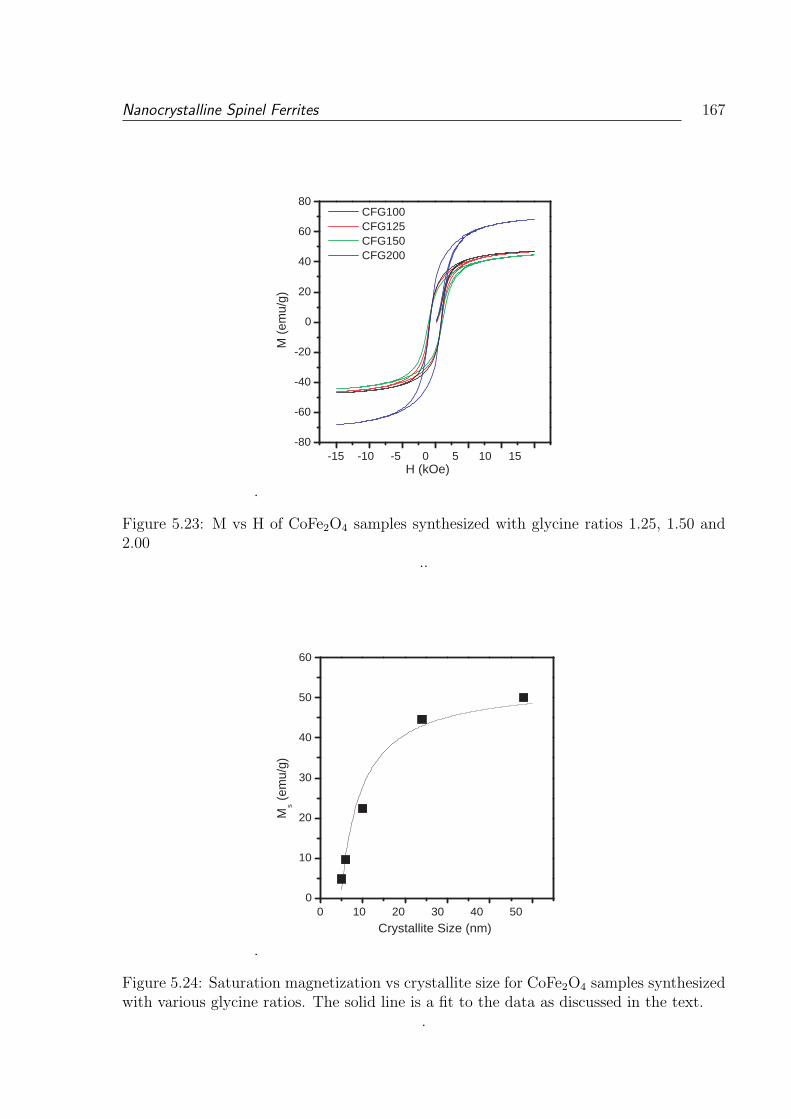
Nanocrystalline Spinel Ferrites 167
.
-15 -10 -5 0 5 10 15 -80
-60
-40
-20
0
20
40
60
80 CFG100 CFG125 CFG150 CFG200
M (
emu/
g)
H (kOe)
Figure 5.23: M vs H of CoFe2O4 samples synthesized with glycine ratios 1.25, 1.50 and2.00
..
.
0 10 20 30 40 50 0
10
20
30
40
50
60
M s (
emu/
g)
Crystallite Size (nm)
Figure 5.24: Saturation magnetization vs crystallite size for CoFe2O4 samples synthesizedwith various glycine ratios. The solid line is a fit to the data as discussed in the text.
.
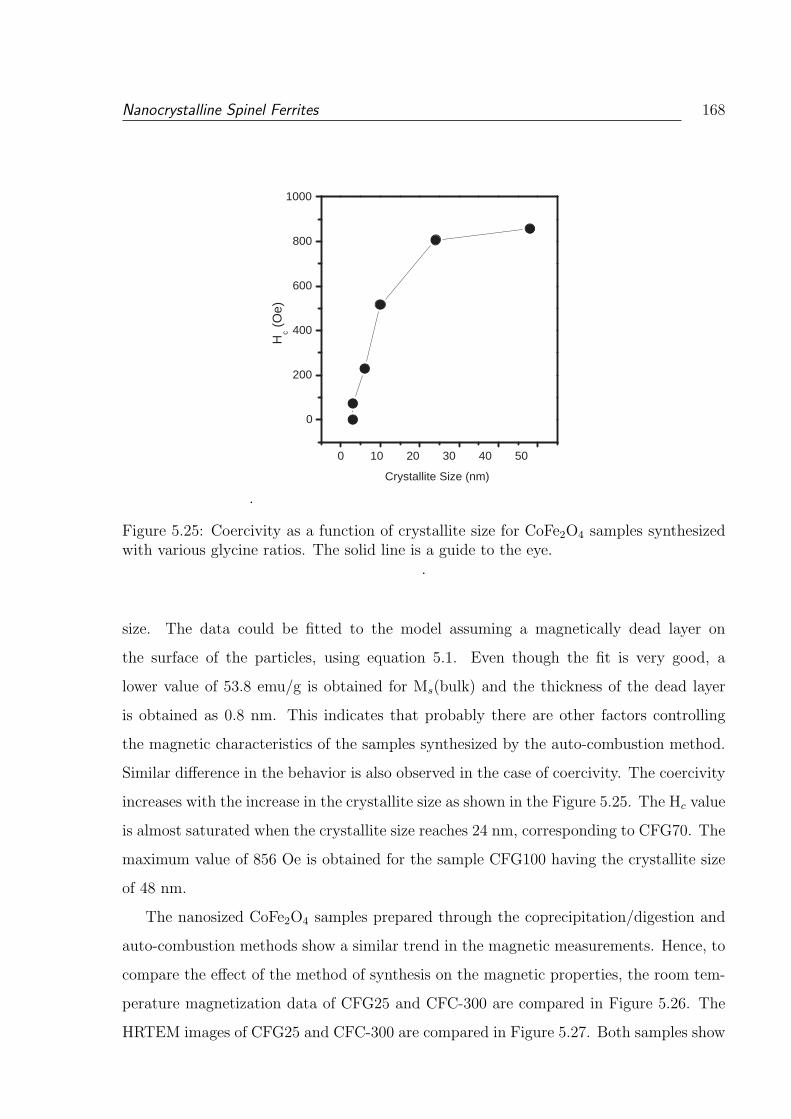
Nanocrystalline Spinel Ferrites 168
.
0 10 20 30 40 50
0
200
400
600
800
1000
H c (
Oe)
Crystallite Size (nm)
Figure 5.25: Coercivity as a function of crystallite size for CoFe2O4 samples synthesizedwith various glycine ratios. The solid line is a guide to the eye.
.
size. The data could be fitted to the model assuming a magnetically dead layer on
the surface of the particles, using equation 5.1. Even though the fit is very good, a
lower value of 53.8 emu/g is obtained for Ms(bulk) and the thickness of the dead layer
is obtained as 0.8 nm. This indicates that probably there are other factors controlling
the magnetic characteristics of the samples synthesized by the auto-combustion method.
Similar difference in the behavior is also observed in the case of coercivity. The coercivity
increases with the increase in the crystallite size as shown in the Figure 5.25. The Hc value
is almost saturated when the crystallite size reaches 24 nm, corresponding to CFG70. The
maximum value of 856 Oe is obtained for the sample CFG100 having the crystallite size
of 48 nm.
The nanosized CoFe2O4 samples prepared through the coprecipitation/digestion and
auto-combustion methods show a similar trend in the magnetic measurements. Hence, to
compare the effect of the method of synthesis on the magnetic properties, the room tem-
perature magnetization data of CFG25 and CFC-300 are compared in Figure 5.26. The
HRTEM images of CFG25 and CFC-300 are compared in Figure 5.27. Both samples show
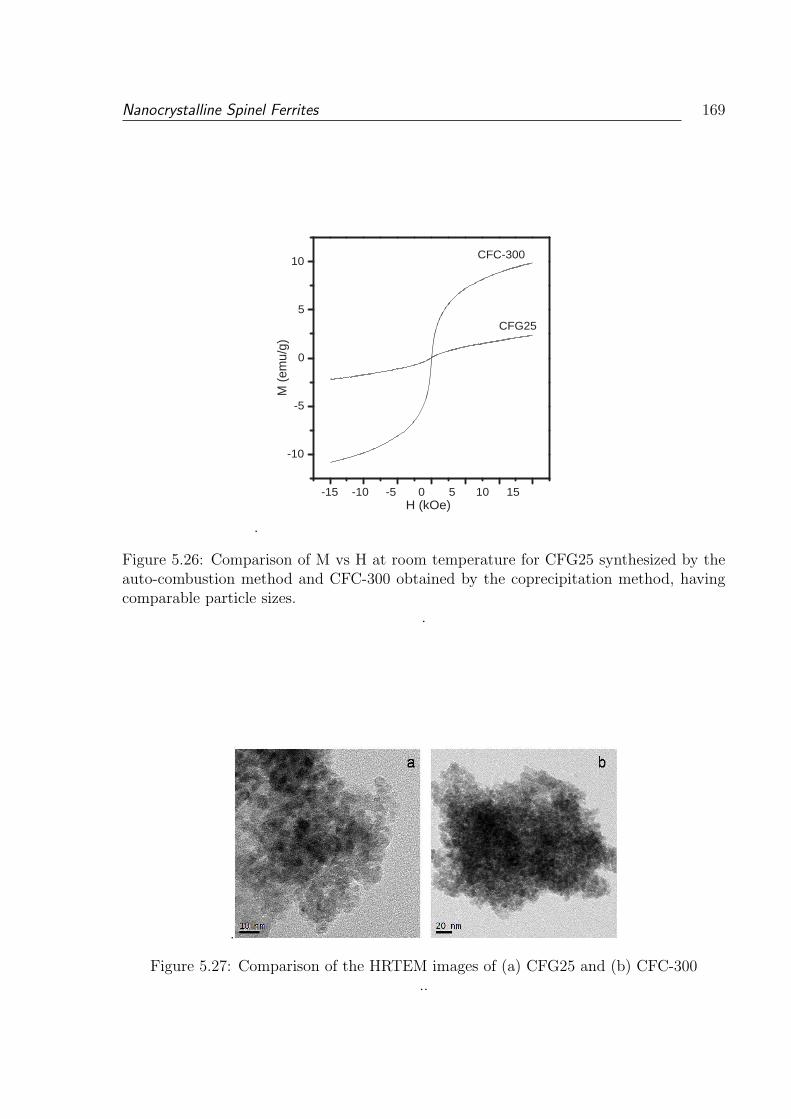
Nanocrystalline Spinel Ferrites 169
.
-15 -10 -5 0 5 10 15
-10
-5
0
5
10 CFC-300
CFG25
M (
emu/
g)
H (kOe)
Figure 5.26: Comparison of M vs H at room temperature for CFG25 synthesized by theauto-combustion method and CFC-300 obtained by the coprecipitation method, havingcomparable particle sizes.
.
.
Figure 5.27: Comparison of the HRTEM images of (a) CFG25 and (b) CFC-300..
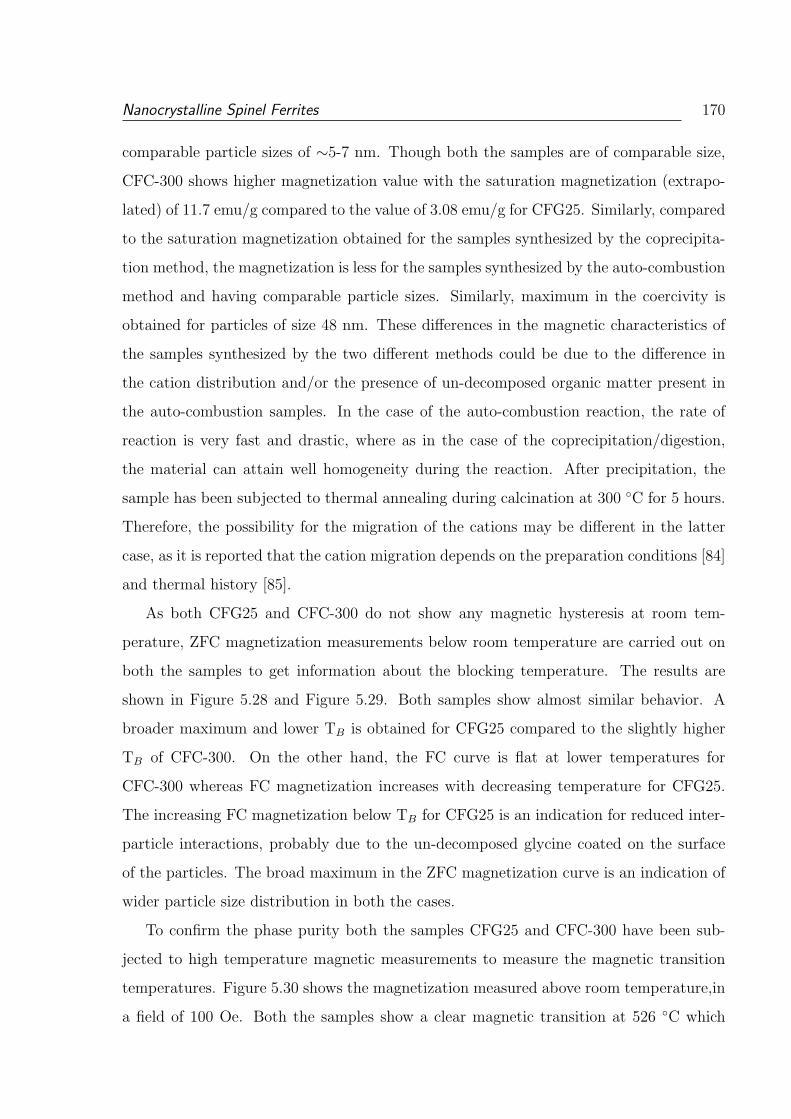
Nanocrystalline Spinel Ferrites 170
comparable particle sizes of ∼5-7 nm. Though both the samples are of comparable size,
CFC-300 shows higher magnetization value with the saturation magnetization (extrapo-
lated) of 11.7 emu/g compared to the value of 3.08 emu/g for CFG25. Similarly, compared
to the saturation magnetization obtained for the samples synthesized by the coprecipita-
tion method, the magnetization is less for the samples synthesized by the auto-combustion
method and having comparable particle sizes. Similarly, maximum in the coercivity is
obtained for particles of size 48 nm. These differences in the magnetic characteristics of
the samples synthesized by the two different methods could be due to the difference in
the cation distribution and/or the presence of un-decomposed organic matter present in
the auto-combustion samples. In the case of the auto-combustion reaction, the rate of
reaction is very fast and drastic, where as in the case of the coprecipitation/digestion,
the material can attain well homogeneity during the reaction. After precipitation, the
sample has been subjected to thermal annealing during calcination at 300 C for 5 hours.
Therefore, the possibility for the migration of the cations may be different in the latter
case, as it is reported that the cation migration depends on the preparation conditions [84]
and thermal history [85].
As both CFG25 and CFC-300 do not show any magnetic hysteresis at room tem-
perature, ZFC magnetization measurements below room temperature are carried out on
both the samples to get information about the blocking temperature. The results are
shown in Figure 5.28 and Figure 5.29. Both samples show almost similar behavior. A
broader maximum and lower TB is obtained for CFG25 compared to the slightly higher
TB of CFC-300. On the other hand, the FC curve is flat at lower temperatures for
CFC-300 whereas FC magnetization increases with decreasing temperature for CFG25.
The increasing FC magnetization below TB for CFG25 is an indication for reduced inter-
particle interactions, probably due to the un-decomposed glycine coated on the surface
of the particles. The broad maximum in the ZFC magnetization curve is an indication of
wider particle size distribution in both the cases.
To confirm the phase purity both the samples CFG25 and CFC-300 have been sub-
jected to high temperature magnetic measurements to measure the magnetic transition
temperatures. Figure 5.30 shows the magnetization measured above room temperature,in
a field of 100 Oe. Both the samples show a clear magnetic transition at 526 C which
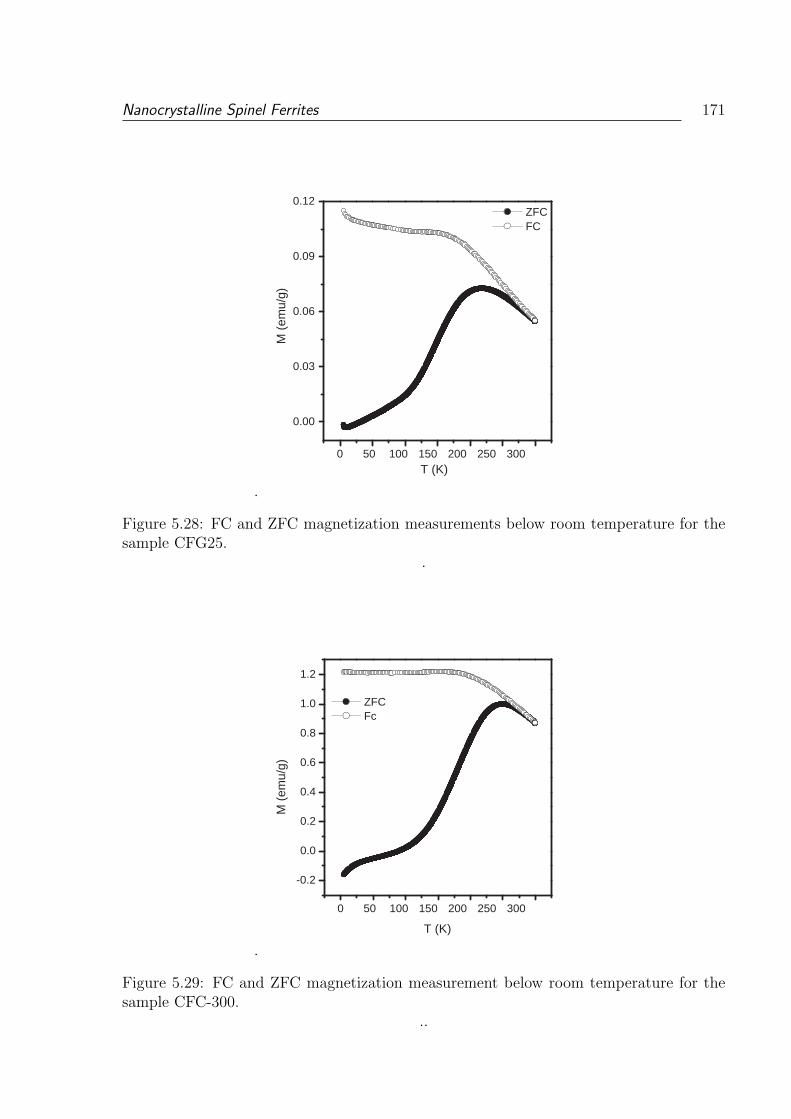
Nanocrystalline Spinel Ferrites 171
.
0 50 100 150 200 250 300
0.00
0.03
0.06
0.09
0.12 ZFC FC
M (
emu/
g)
T (K)
Figure 5.28: FC and ZFC magnetization measurements below room temperature for thesample CFG25.
.
.
0 50 100 150 200 250 300
-0.2
0.0
0.2
0.4
0.6
0.8
1.0
1.2
ZFC Fc
M (
emu/
g)
T (K)
Figure 5.29: FC and ZFC magnetization measurement below room temperature for thesample CFC-300.
..
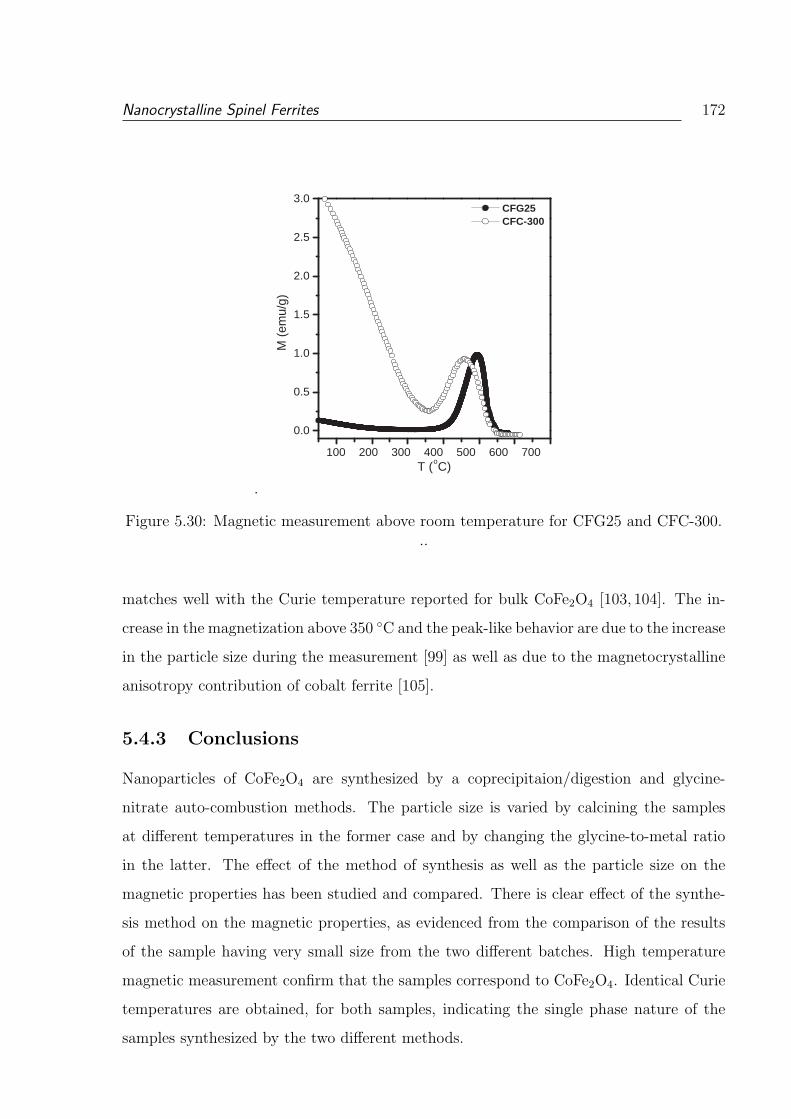
Nanocrystalline Spinel Ferrites 172
.
100 200 300 400 500 600 700
0.0
0.5
1.0
1.5
2.0
2.5
3.0 CFG25 CFC-300
M (
emu/
g)
T ( o C)
Figure 5.30: Magnetic measurement above room temperature for CFG25 and CFC-300...
matches well with the Curie temperature reported for bulk CoFe2O4 [103, 104]. The in-
crease in the magnetization above 350 C and the peak-like behavior are due to the increase
in the particle size during the measurement [99] as well as due to the magnetocrystalline
anisotropy contribution of cobalt ferrite [105].
5.4.3 Conclusions
Nanoparticles of CoFe2O4 are synthesized by a coprecipitaion/digestion and glycine-
nitrate auto-combustion methods. The particle size is varied by calcining the samples
at different temperatures in the former case and by changing the glycine-to-metal ratio
in the latter. The effect of the method of synthesis as well as the particle size on the
magnetic properties has been studied and compared. There is clear effect of the synthe-
sis method on the magnetic properties, as evidenced from the comparison of the results
of the sample having very small size from the two different batches. High temperature
magnetic measurement confirm that the samples correspond to CoFe2O4. Identical Curie
temperatures are obtained, for both samples, indicating the single phase nature of the
samples synthesized by the two different methods.
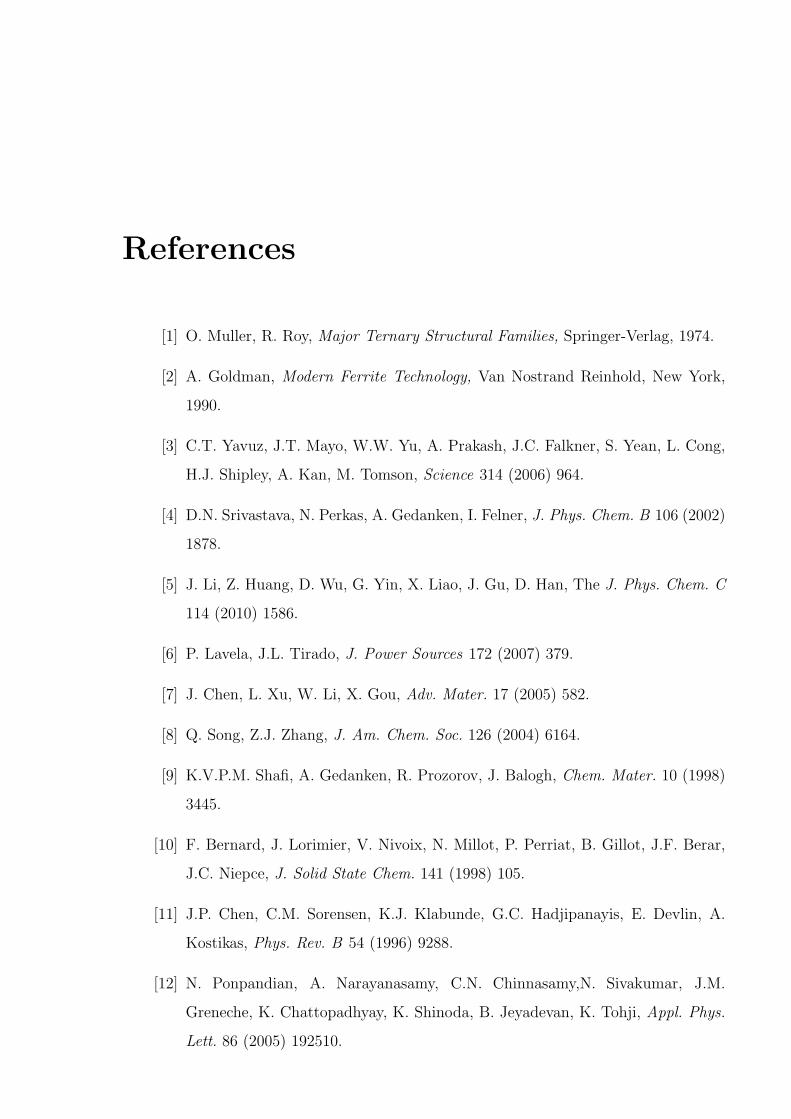
References
[1] O. Muller, R. Roy, Major Ternary Structural Families, Springer-Verlag, 1974.
[2] A. Goldman, Modern Ferrite Technology, Van Nostrand Reinhold, New York,
1990.
[3] C.T. Yavuz, J.T. Mayo, W.W. Yu, A. Prakash, J.C. Falkner, S. Yean, L. Cong,
H.J. Shipley, A. Kan, M. Tomson, Science 314 (2006) 964.
[4] D.N. Srivastava, N. Perkas, A. Gedanken, I. Felner, J. Phys. Chem. B 106 (2002)
1878.
[5] J. Li, Z. Huang, D. Wu, G. Yin, X. Liao, J. Gu, D. Han, The J. Phys. Chem. C
114 (2010) 1586.
[6] P. Lavela, J.L. Tirado, J. Power Sources 172 (2007) 379.
[7] J. Chen, L. Xu, W. Li, X. Gou, Adv. Mater. 17 (2005) 582.
[8] Q. Song, Z.J. Zhang, J. Am. Chem. Soc. 126 (2004) 6164.
[9] K.V.P.M. Shafi, A. Gedanken, R. Prozorov, J. Balogh, Chem. Mater. 10 (1998)
3445.
[10] F. Bernard, J. Lorimier, V. Nivoix, N. Millot, P. Perriat, B. Gillot, J.F. Berar,
J.C. Niepce, J. Solid State Chem. 141 (1998) 105.
[11] J.P. Chen, C.M. Sorensen, K.J. Klabunde, G.C. Hadjipanayis, E. Devlin, A.
Kostikas, Phys. Rev. B 54 (1996) 9288.
[12] N. Ponpandian, A. Narayanasamy, C.N. Chinnasamy,N. Sivakumar, J.M.
Greneche, K. Chattopadhyay, K. Shinoda, B. Jeyadevan, K. Tohji, Appl. Phys.
Lett. 86 (2005) 192510.
References 174
[13] J.F. Hochepied, P. Bonville, M.P. Pileni, J. Phys. Chem. B 104 (2000) 905.
[14] T. Kamiyama, K. Haneda, T. Sato, S. Ikeda, H. Asano, Solid State Commun.
81 (1992) 563.
[15] P.C. Wu, W.S. Wang, Y.T. Huang, H.S. Sheu, Y.W. Lo, T.L. Tsai, D.B. Shieh,
C.S. Yeh, Chem. Eur. J. 13 (2007) 3878.
[16] C. Sun, C. Fang, Z. Stephen, O. Veiseh, S. Hansen, D. Lee, R.G. Ellenbogen, J.
Olson, M. Zhang, Nanomedicine 3 (2008) 495.
[17] J.F. Schultz, J.D. Bell, R.M. Goldstein, J.A. Kuhn, T.M. McCarty, Ann. Surg.
Oncol. 6 (1999) 691.
[18] R.C. O’Handley, Modern Magnetic Materials: Principles and Applications, Wi-
ley New York, 2000.
[19] J.J. Versluijs, M.A. Bari, J.M.D. Coey, Phys. Rev. Lett. 87 (2001) 26601.
[20] P. Poddar, T. Fried, G. Markovich, Phys. Rev. B 65 (2002) 172405.
[21] A.K. Gupta, M. Gupta, Biomaterials 26 (2005) 3995.
[22] L. Shen, P.E. Laibinis, T.A. Hatton, Langmuir 15 (1999) 447.
[23] S. Wang, H. Xin, Y. Qian, Mater. Lett. 33 (1997) 113.
[24] W.W. Wang, Y.J. Zhu, M.L. Ruan, J. Nanopart. Res. 9 (2007) 419.
[25] D. Chen, R. Xu, Mater. Res. Bullet. 33 (1998) 1015.
[26] R.M. Cornell, U. Schwertmann, The Iron Oxides: Structure, Properties, Reac-
tion, Occurance and Uses. Wiley-VCH Weinheim, 2003.
[27] G.A. Waychunas, Rev. Mineral. Geochem. 25 (1991) 11.
[28] M.P. Sharrock, R.E. Bodnar, J. Appl. Phys. 57 (1985) 3919.
[29] E.M. Moreno, M. Zayat, M.P. Morales, C.J. Serna, A. Roig, D. Levy, Langmuir
18 (2002) 4972.
References 175
[30] T. Hyeon, S.S. Lee, J. Park, Y. Chung, H.B. Na, J. Am. Chem. Soc. 123 (2001)
12798.
[31] F. Del Monte, M.P. Morales, D. Levy, A. Fernandez, M. Ocana, A. Roig, E.
Molins, K. O’Grady, C.J. Serna, Langmuir 13 (1997) 3627.
[32] X. Dong, H. Chen, W. Zhao, X. Li, J. Shi, Chem. Mater. 19 (2007) 3484.
[33] K.E. Gonsalves, H. Li, P. Santiago, J. Mater. Sci. 36 (2001) 2461.
[34] L. Suber, P. Imperatori, G. Ausanio, F. Fabbri, H. Hofmeister, J. Phys. Chem.
B 109 (2005) 7103.
[35] S. Basak, K.S. Rane, P. Biswas, Chem. Mater. 20 (2008) 4906.
[36] E. Murad, U. Schwertmann, Clay. Clay Miner. 41 (1993) 111.
[37] N. Pinna, S. Grancharov, P. Beato, P. Bonville, M. Antonietti, M. Niederbergers,
Chem. Mater. 17 (2005) 3044.
[38] E.J. Fasika, Corros. Sci. 7 (1967) 833.
[39] R.D. Waldron, Phys. Rev. 99 (1955) 1727.
[40] M. Ishii, M. Nakahira, Solid State Commun. 11 (1972) 209.
[41] S. Nasrazadani, A. Raman, Corros. Sci. 34 (1993) 1355.
[42] J.M.D. Coey, Magnetic Properties of Iron in Soil; Iron Oxides and Clay Minerals
In: Stucki, J. W.Goodman, B. A. Schwertmann, U. (eds) Iron in soils and clay
minerals, D Reidel Pub Co, (1988) 397-466.
[43] D.H. Han, J.P. Wang, H.L. Luo, J. Magn. Magn. Mater. 136 (1994) 176.
[44] J. Wang, J. Sun, Q. Sun, Q. Chen, Mater. Res. Bullet. 38 (2003) 1113.
[45] R.N. Panda, N.S. Gajbhiye, G. Balaji, J. Alloy. Compd. 326 (2001) 50.
[46] J. Smit, H.P.J. Wijn, Ferrites, Philips Technical Library, Eindhoven, 1959.
References 176
[47] T. Moriya, Magnetic Ions in Insulators Their Interactions, Resonances and Op-
tical Properties, Volume 1, Magnetism, Edited by G. T. Rado and H. Suhl,
Acaemic Press, Newyork and London, 1963, p86.
[48] L. Neel, Compt. Rend. 252 ( 1961 ) 4075.
[49] J.G. Na, T.D. Lee, S.J. Park, IEEE T. Magn. 28 (1992) 2433.
[50] Z.J. Zhang, Z.L. Wang, B.C. Chakoumakos, J.S. Yin, J. Am. Chem. Soc. 120
(1998) 1800.
[51] S.D. Shenoy , P.A. Joy, M.R. Anantharaman, J. Magn. Magn. Mater. 269 (2004)
217
[52] R. Arulmurugan, B. Jeyadevan, G. Vaidyanathan, S. Sendhilnathan, J. Magn.
Magn. Mater. 288 (2005) 470.
[53] T. Sato, K. Haneda, M. Seki, T. Iijima, Appl. Phys. A 50 (1990) 13.
[54] F.S. Li, L. Wang, J.B. Wang, Q.G. Zhou, X.Z. Zhou, H.P. Kunkel, G. Williams,
J. Magn. Magn. Mater. 268 (2004) 332.
[55] F. Grasset, N. Labhsetwar, D. Li, D.C. Park, N. Saito, H. Haneda, O. Cador,
T. Roisnel, S. Mornet, E. Duguet, Langmuir 18 (2002) 8209.
[56] H.H. Hamdeh, J.C. Ho, S.A. Oliver, R.J. Willey, G. Oliveri, J. Appl. Phys. 81
(1997) 1851.
[57] C.N. Chinnasamy, A. Narayanasamy, N. Ponpandian, K. Chattopadhyay, H.
Guerault, J.M. Greneche, J. Phys. Cond. Matter 12 (2000) 7795.
[58] M. Hofmann, S.J. Campbell, H. Ehrhardt, R. Feyerherm, J. Mater. Sci. 39
(2004) 5057.
[59] M.K. Roy, B. Haldar, H.C. Verma, Nanotechnology 17 (2006) 232.
[60] J.H. Shim, S. Lee, J.H. Park, S.J. Han, Y.H. Jeong, Y.W. Cho, Phys. Rev. B 73
(2006) 64404.
References 177
[61] D. Makovec, M. Drofenik, J. Nanopart. Res. 10 (2008) 131.
[62] B. Jeyadevan, K. Tohji, K. Nakatsuka, J. Appl. Phys. 76 (1994) 6325.
[63] C. Upadhyay, H.C. Verma, V. Sathe, A.V. Pimpale, J. Magn. Magn. Mater. 312
(2007) 271.
[64] S.H. Yu, T. Fujino, M. Yoshimura, J. Magn. Magn. Mater. 256 (2003) 420.
[65] F. Li, H. Wang, L. Wang, J. Wang, J. Magn. Magn. Mater. 309 (2007) 295.
[66] S. Deka, P.A. Joy, J. Nanosci. Nanotech. 8 (2008) 3955.
[67] X.J. Xu, L.H. Zhou, Q.G. Zhai, C.Z. Lu, J. Am. Ceram. Soc. 90 (2007) 1959.
[68] H. Yang, X. Zhang, C. Huang, W. Yang, G. Qiu, J. Phys. Chem. Solids 65
(2004) 1329.
[69] P.Y. Lee, H. Suematsu, T. Nakayama, W. Jiang, K. Niihara, J. Magn. Magn.
Mater. 312 (2007) 27.
[70] S. Ozcan, B. Kaynar, M.M. Can, T. Firat, Mater. Sci. Eng. B 121 (2005) 278.
[71] D. Parker, F. Ladieu, E. Vincent, G. Mriguet, E. Dubois, V. Dupuis, R. Perzyn-
ski, J. Appl. Phys. 97 (2005) 10A502.
[72] M. Sasaki, P.E. Jnsson, H. Takayama, H. Mamiya, Phys. Rev. B 71 (2005)
104405.
[73] S. Mørup, F. Bdker, P.V. Hendriksen, S. Linderoth, Phys. Rev. B 52 (1995) 287.
[74] A.J. Rondinone, A.C.S. Samia, Z.J. Zhang, Appl. Phys. Lett. 76 (2000) 3624.
[75] J. Ding, Y.J. Chen, Y. Shi, S. Wang, Appl. Phys. Lett. 77 (2000) 3621.
[76] T. Yu, Z.X. Shen, Y. Shi, J. Ding, J. Phys. Cond. Matter 14 (2002) L613.
[77] A.C. Nunes, C.F. Majkrzak, A.E. Berkowitz, J. Magn. Magn. Mater. 39 (1983)
59.
References 178
[78] A. Mumtaz, K. Maaz, B. Janjua, S.K. Hasanain, M.F. Bertino, J. Magn. Magn.
Mater. 313 (2007) 266.
[79] C. Xiangfeng, J. Dongli, G. Yu, Z. Chenmou, Sensor. Actuat. B: Chem. 120
(2006) 177.
[80] J.A. Paulsen, A.P. Ring, C.C.H. Lo, J.E. Snyder, D.C. Jiles, J. Appl. Phys. 97
(2005) 044502.
[81] S.D. Bhame, P.A. Joy, J. Am. Ceram. Soc. 91 (2008) 1976.
[82] D.H. Kim, D.E. Nikles, D.T. Johnson, C.S. Brazel, J. Magn. Magn. Mater. 320
(2008) 2390.
[83] M.R. DeGuire, R.C. OHandley, K. Gretchen, J. Appl. Phys. 65 (1989) 3167.
[84] P.N. Vasambekar, C.B. Kolekar, A.S. Vaingankar, Mater. Chem. Phys. 60 (1999)
282.
[85] K. Haneda, A.H. Morrish, J. Appl. Phys. 63 (1988) 4258.
[86] C.S. Kim, S.W. Lee, P.S. L., J.Y. Park, Y.J. Oh, J. Appl. Phys. 79 (1996) 5428.
[87] Y. Qu, H. Yang, N. Yang, Y. Fan, H. Zhu, G. Zou, Mater. Lett. 60 (2006) 3548.
[88] S. Li, V.T. John, C. OConnor, V. Harris, E. Carpenter, J. Appl. Phys. 87 (2000)
6223.
[89] E.V. Gopalan, I.A. Al-Omari, D.S. Kumar, Y. Yoshida, P.A. Joy, M.R. Anan-
tharaman, Appl. Phys. A 99 (2010) 497.
[90] J.G. Lee, J. Magn. Magn. Mater. 177 (1998) 900.
[91] L.J. Cote, A.S. Teja, A.P. Wilkinson, Z.J. Zhang, Fluid Phase Equilibr. 210
(2003) 307.
[92] S.R. Ahmed, P. Kofinas, Macromolecules 35 (2002) 3338.
[93] S.D. Sartale, C.D. Lokhande, Ceram. Int. 28 (2002) 467.
References 179
[94] N. Kasapoglu, A. Baykal, Y. Kseoglu, M.S. Toprak, Scripta Mater. 57 (2007)
441.
[95] V. Pillai, D.O. Shah, J. Magn. Magn. Mater. 163 (1996) 243
[96] S.D. Bhame, P.A. Joy, Sensor. Actuat. A Phys. 137 (2007) 256.
[97] M. Mohan, V. Chandra, S.S. Manoharan, Curr Sci. India 93 (2008) 473.
[98] M. Rajendran, R.C. Pullar, A.K. Bhattacharya, D. Das, S.N. Chintalapudi, C.K.
Majumdar, J. Magn. Magn. Mater. 232 (2001) 71.
[99] S. Verma, P.A. Joy, J. Appl. Phys. 98 (2005) 124312.
[100] R. Mller, W. Schppel, J. Magn. Magn. Mater. 155 (1996) 110.
[101] V. Sreeja, S. Vijayanand, S. Deka, P.A. Joy, Hyperfine Int. 183 (2008) 99.
[102] N. Kikukawa, M. Takemori, Y. Nagano, M. Sugasawa, S. Kobayashi, J. Magn.
Magn. Mater. 284 (2004) 206.
[103] J. Teillet, F. Bouree, R. Krishnan, J. Magn. Magn. Mater. 123 (1993) 93.
[104] S.D. Bhame, P.A. Joy, J. Appl. Phys. 100 (2006) 113911.
[105] P.A. Joy, S.K. Date, J. Magn. Magn. Mater. 222 (2000) 33.
Chapter 6
Magnetic Properties ofNanocrystalline Multiferroic BiFeO3
This chapter describes the results from the studies on the magnetic properties of nanocrys-
talline multiferroic BiFeO3 system. The compound has been synthesized by a coprecipi-
tation/digestion method as well as a self ignition auto-combustion method. The detailed
magnetic properties studied on the basis of the effect of synthetic methodology have been
discussed.
6.1 Magnetoelectric multiferroics
Ferromagnetism and ferroelectricity are well known properties of solids and have been
studied extensively and individually in materials, especially in perovskite type compounds
of the general formula ABO3. The magnetic perovskites have been extensively studied and
tabulated by Goodenough and Longo [1]. Mitsui et al have compiled a list of hundreds of
ferroelectric perovskites [2]. If one considers a perovskite type structure, ferroelectricity
requires a B-site ion with d0 configuration, whereas for magnetism, a dj electronic config-
uration, with j different from zero, is required for the B-site ion [3]. It is well known that
in the oxide perovskites such as BaTiO3, the Ti ion plays a key role for ferroelectricity.
Even though ferromagnetism and ferroelectricity tend to exclude one another, there are
some systems in which these properties co-exist and such systems are known as magneto-
electric or multiferroic materials [4,5]. In such materials, the origins of ferroelectricity and
ferromagnetism are from different sources. In the case of magnetoelectric materials, there
can be a spontaneous magnetization that can be switched by an applied magnetic field,
a spontaneous polarization that can be switched by an applied electric field and often
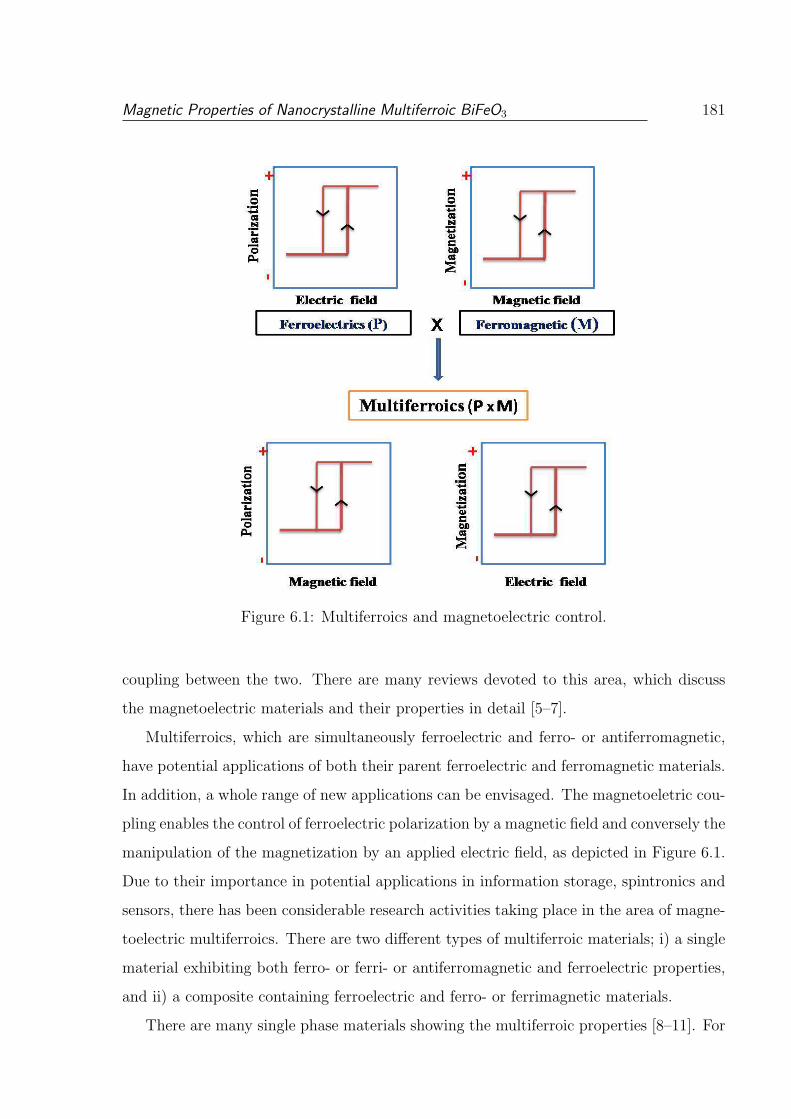
Magnetic Properties of Nanocrystalline Multiferroic BiFeO3 181
Figure 6.1: Multiferroics and magnetoelectric control.
coupling between the two. There are many reviews devoted to this area, which discuss
the magnetoelectric materials and their properties in detail [5–7].
Multiferroics, which are simultaneously ferroelectric and ferro- or antiferromagnetic,
have potential applications of both their parent ferroelectric and ferromagnetic materials.
In addition, a whole range of new applications can be envisaged. The magnetoeletric cou-
pling enables the control of ferroelectric polarization by a magnetic field and conversely the
manipulation of the magnetization by an applied electric field, as depicted in Figure 6.1.
Due to their importance in potential applications in information storage, spintronics and
sensors, there has been considerable research activities taking place in the area of magne-
toelectric multiferroics. There are two different types of multiferroic materials; i) a single
material exhibiting both ferro- or ferri- or antiferromagnetic and ferroelectric properties,
and ii) a composite containing ferroelectric and ferro- or ferrimagnetic materials.
There are many single phase materials showing the multiferroic properties [8–11]. For
Magnetic Properties of Nanocrystalline Multiferroic BiFeO3 182
example, YMnO3 is a hexagonal perovskite that is antiferromagnetic with Neel tempera-
ture (TN) of 80 K and ferroelectric with Curie temperature (TC) of 914 K [8]. Similarly,
BiMnO3, a monoclinic perovskite, is both ferromagnetic (TN ≈100 K) and ferroelectric
(TC ≈450 K) [9, 10]. For practical applications, room temperature multiferroism is an
important criteria. Hence, BiFeO3 becomes the potential candidate because it is the only
material which shows magnetoelectric coupling at or above room temperature [12]. Bulk
BiFeO3 is antiferromagnetic below TN ≈ 645 K, and it exhibits ferroelectric behavior
below TC ≈ 1100 K [13]. It also exhibits weak magnetism at room temperature due to
residual magnetic moment from a canted spin structure [14]. The information on the
magnetic ordering of the Fe ions in BiFeO3 has been extensively studied by Sosnowska et
al [15].
The magnetoelectric response exhibited by single phase materials is either too weak
or occurs at very low temperatures [16]. The alternate choice is composite materials
made out of piezoelectric and magnetostrictive components. The magnetoelectric ef-
fect in a composite material is nothing but the product properties of the two separate
phases [17]. The magnetoelectric response which they exhibit will be larger than those
of the single phase materials [18–20]. Magnetoelectric perovskite-spinel composites have
attracted considerable attention in the recent past [21]. For example, a composite of
BaTiO3 and CoFe2O4 [20–22] is known for its enhanced magnetoelectric effect. In this
composite, both the materials are well known for their ferroelectric and ferrimagnetic
properties, respectively. In the composite made out of BaTiO3 and CoFe2O4, a polar-
ization value of ∼23 µC/cm2, with a piezoelectric hysteresis value of ∼50 pm/V, and
saturation magnetization value of ∼350 emu/cm3 have been reported [20]. Similarly, self
assembled nanostructures of the composites CoFe2O4-PbTiO3 [23], CoFe2O4-BiFeO3 [24],
and BaTiO3-NiFe2O4 [25] have been studied for their magnetoelectric properties. In the
case of CoFe2O4-BiFeO3, room temperature magnetization reversal induced by an electric
field has been demonstrated [24]. The application of a magnetoelectric read-head, using
bilayered heterostructures of BaTiO3-NiFe2O4 and BaTiO3-CoFe2O4 has been demon-
strated [26]. Hence, considerable attention has been focused in the area of multiferroic
composites [20,22,27–30]. Such composites are useful in several types of devices [31,32].
Being the single phase multiferroic material with ferroelectric and antiferromagnetic
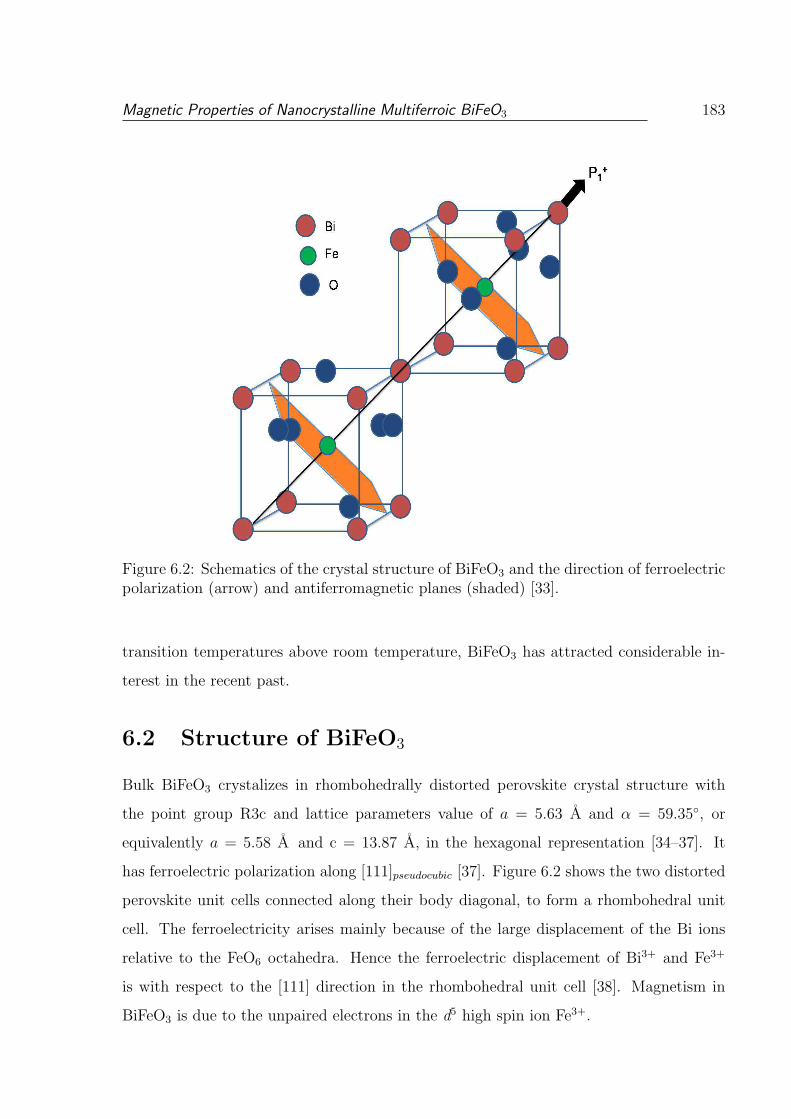
Magnetic Properties of Nanocrystalline Multiferroic BiFeO3 183
Figure 6.2: Schematics of the crystal structure of BiFeO3 and the direction of ferroelectricpolarization (arrow) and antiferromagnetic planes (shaded) [33].
transition temperatures above room temperature, BiFeO3 has attracted considerable in-
terest in the recent past.
6.2 Structure of BiFeO3
Bulk BiFeO3 crystalizes in rhombohedrally distorted perovskite crystal structure with
the point group R3c and lattice parameters value of a = 5.63 A and α = 59.35, or
equivalently a = 5.58 A and c = 13.87 A, in the hexagonal representation [34–37]. It
has ferroelectric polarization along [111]pseudocubic [37]. Figure 6.2 shows the two distorted
perovskite unit cells connected along their body diagonal, to form a rhombohedral unit
cell. The ferroelectricity arises mainly because of the large displacement of the Bi ions
relative to the FeO6 octahedra. Hence the ferroelectric displacement of Bi3+ and Fe3+
is with respect to the [111] direction in the rhombohedral unit cell [38]. Magnetism in
BiFeO3 is due to the unpaired electrons in the d5 high spin ion Fe3+.
Magnetic Properties of Nanocrystalline Multiferroic BiFeO3 184
The magnetic structure of BiFeO3 is of G-type antiferromagnetic, with a modulated
spiral spin structure having a long periodicity of 62 nm [15]. Recent neutron diffraction
studies revealed that the character of the modulated cycloidal ordering of the Fe3+ mag-
netic moments remains the same from 4 K up to the Neel temperature, suggesting that
the magnetic interactions are relatively stable in this temperature range [39]. Similarly,
high resolution synchrotron radiation diffraction measurement did not show any sign of
charge ordering nor any crystal symmetry breaking in BiFeO3 in the temperature range
5–1000 K [40]. The cycloidal periodic spin arrangement cancels out the macroscopic mag-
netic moment and as a result, very weak magnetoelectric effect is observed. There are
ways to suppress the spiral magnetic ordering by application of a very high magnetic field,
by decreasing the dimensions of the sample below spin periodicity (nanoparticles or thin
films) or by chemical substitution of Bi3+ or Fe3+ by other suitable ions of comparable
ionic sizes. Reduction in dimension is shown to enhance the magnetization in thin films
and in nanoparticles [41–43].
6.3 Synthesis of BiFeO3
Though BiFeO3 is known to be a potential candidate for multiferroic applications, it is
very hard to avoid the formation of impurity phases during the synthesis. BiFeO3 can
be stabilized only within a narrow temperature range, as depicted in the phase diagram
shown in Figure 6.3. Bi-rich Bi25FeO40 and Fe-rich Bi2Fe4O9 are the stable compounds
on each side of BiFeO3 [44, 45]. BiFeO3 can be made by the conventional solid state
method of synthesis by firing a mixture of Bi2O3 and Fe2O3 with slightly excess amount
of Bi2O3. But the compound after formation always ends with the impurity phases such
as Bi2Fe4O9 and Bi25FeO40 [46]. Impurity phases formed during this process has to be
leached out by washing the product with dilute nitric acid [47]. An attempt has been
made successfully to synthesize a phase pure BiFeO3 through a technique called “rapid
liquid phase sintering”, where an equimolar mixture of the precursor oxides is rapidly
heated and fired for a short time. During this process the temperature maintained was
slightly above the melting temperature of Bi2O3 (Tfus = 817 C) [46, 48, 49]. There
are many wet chemical routes reported such as sol-gel method [50–54],coprecipitation
method [55], hydrothermal method [56,57], classic Pechini method [58], sonochemical and
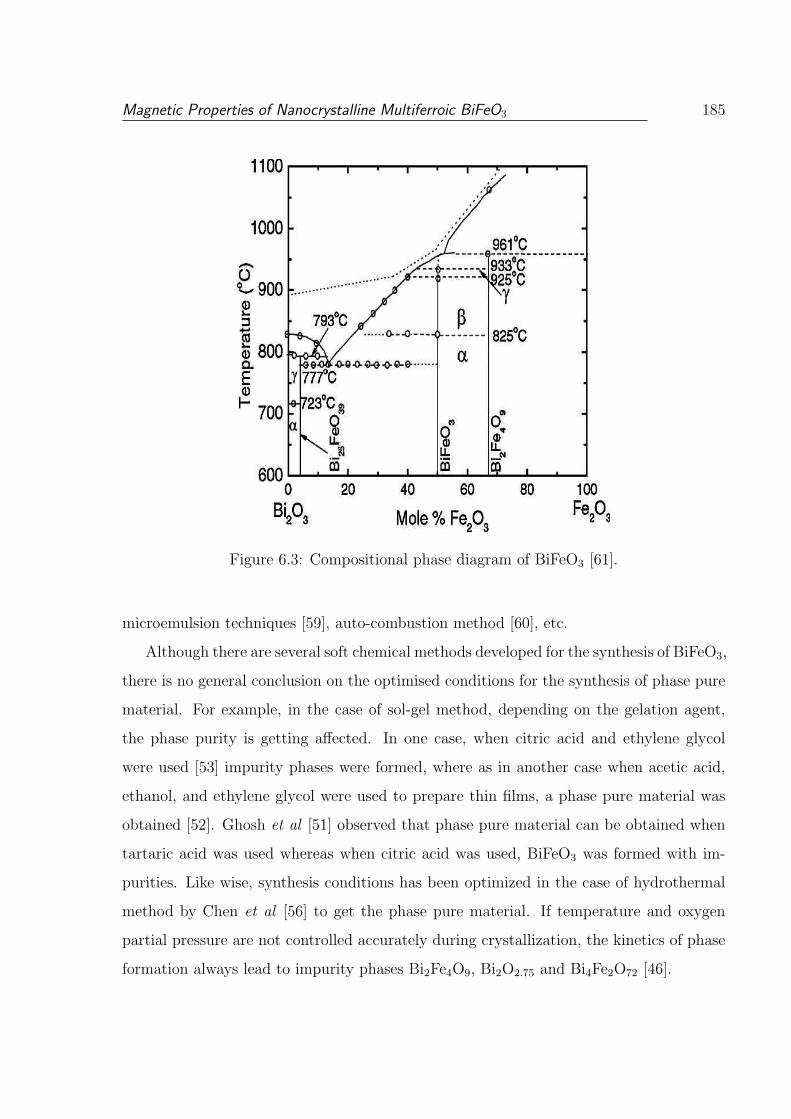
Magnetic Properties of Nanocrystalline Multiferroic BiFeO3 185
Figure 6.3: Compositional phase diagram of BiFeO3 [61].
microemulsion techniques [59], auto-combustion method [60], etc.
Although there are several soft chemical methods developed for the synthesis of BiFeO3,
there is no general conclusion on the optimised conditions for the synthesis of phase pure
material. For example, in the case of sol-gel method, depending on the gelation agent,
the phase purity is getting affected. In one case, when citric acid and ethylene glycol
were used [53] impurity phases were formed, where as in another case when acetic acid,
ethanol, and ethylene glycol were used to prepare thin films, a phase pure material was
obtained [52]. Ghosh et al [51] observed that phase pure material can be obtained when
tartaric acid was used whereas when citric acid was used, BiFeO3 was formed with im-
purities. Like wise, synthesis conditions has been optimized in the case of hydrothermal
method by Chen et al [56] to get the phase pure material. If temperature and oxygen
partial pressure are not controlled accurately during crystallization, the kinetics of phase
formation always lead to impurity phases Bi2Fe4O9, Bi2O2.75 and Bi4Fe2O72 [46].
Magnetic Properties of Nanocrystalline Multiferroic BiFeO3 186
6.4 Properties of BiFeO3
There are also contradictions in the reported properties of BiFeO3 synthesized by various
methods. Some authors have reported large polarization values with interesting magnetic
properties [41,62–64]. Although the large polarization is not in agreement with the value
for bulk [38], it is in good agreement with the theoretical values [65–67]. Similarly, there
are reports on the observation of very high magnetization [53, 60, 68]. Wang et al [41]
have reported very large polarization value which is 15 times larger than that of the bulk,
apart from very large ferromagnetism with a value of ca. 1.0 Bohr magneton (µB) per unit
cell. Further research by other groups could confirm the large polarization as an intrinsic
property of BiFeO3 [69–71] whereas the intrinsic magnetization value was thought to be
zero [72,73] i.e with the value of ca. 0.02 µB/unit cell.
There are many reports on the different magnetic behavior exhibited by BiFeO3. Zero-
field-cooled (ZFC) and field-cooled (FC) magnetization studies on single crystals, mea-
sured in a field of 10 kOe, showed a decrease below 350 K like a conventional antiferromag-
net but the two curves diverge below 250 K, indicating spin glass behavior [74]. However,
further studies on thin films reported a spin-glass transition at 50 K [75]. Recent studies
indicated few more weak magnetic transitions below and above room temperature. From
the studies on the temperature dependence of the Raman integrated intensities of the
electromagnon on single crystals of BiFeO3, a maximum around 140 K is observed, indi-
cating a small spin reorientation out of the cycloidal plane [76]. Phase transitions at 90,
140, 200, and 250 K are also discovered from further Raman spectroscopic studies [77,78].
These transitions are also observed in dielectric constant measurements and thermome-
chanical studies [79]. These transitions are assigned to different origins such as magnetic
but glassy and with magnetoelectric coupling phase transition at 50 K, dominantly mag-
netic transition at 140 K, magnetoelastic phase transition at 200 K, and magnetic but
glassy transition at 230 K.
Recently there has been considerable interest on the studies of nanosized BiFeO3,
because of the possibility of inducing ferromagnetism in the material by decreasing the
particle size. As the magnetic structure of BiFeO3 if of G-type antiferromagnetic, with
a modulated spiral spin structure having a long periodicity of 62 nm, material having
particle size comparable or smaller than the 62 nm is expected to exhibit a strong size
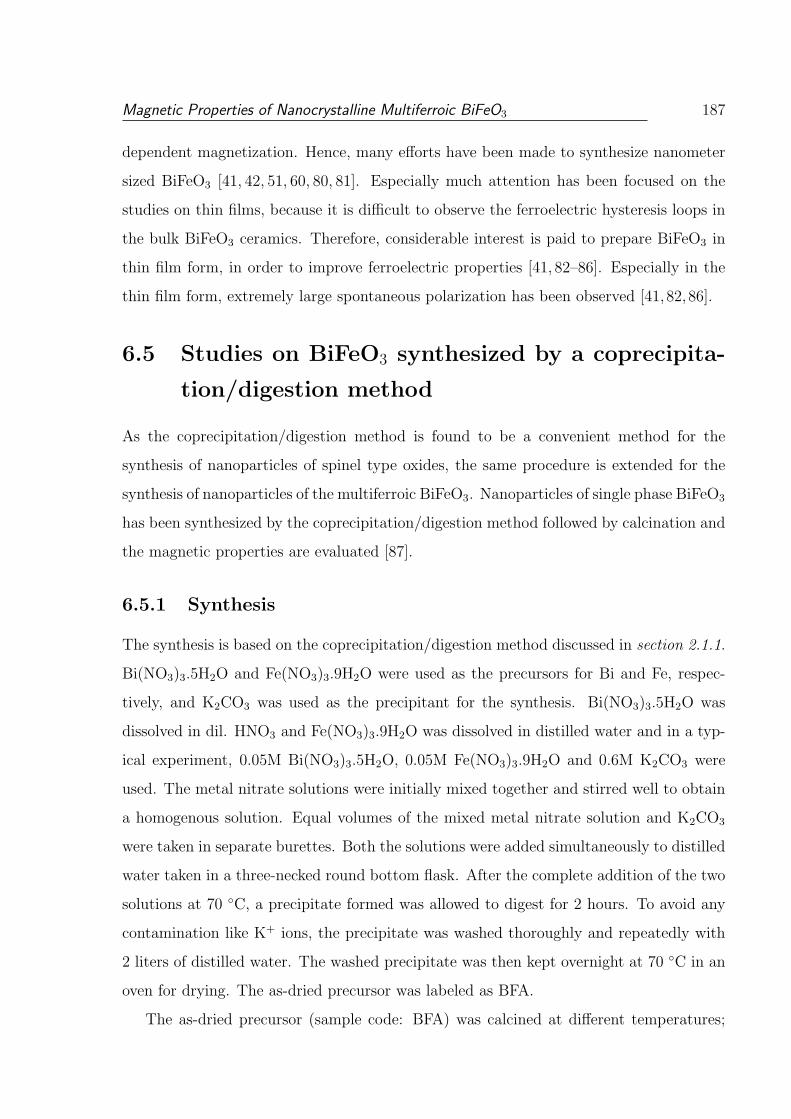
Magnetic Properties of Nanocrystalline Multiferroic BiFeO3 187
dependent magnetization. Hence, many efforts have been made to synthesize nanometer
sized BiFeO3 [41, 42, 51, 60, 80, 81]. Especially much attention has been focused on the
studies on thin films, because it is difficult to observe the ferroelectric hysteresis loops in
the bulk BiFeO3 ceramics. Therefore, considerable interest is paid to prepare BiFeO3 in
thin film form, in order to improve ferroelectric properties [41, 82–86]. Especially in the
thin film form, extremely large spontaneous polarization has been observed [41,82,86].
6.5 Studies on BiFeO3 synthesized by a coprecipita-
tion/digestion method
As the coprecipitation/digestion method is found to be a convenient method for the
synthesis of nanoparticles of spinel type oxides, the same procedure is extended for the
synthesis of nanoparticles of the multiferroic BiFeO3. Nanoparticles of single phase BiFeO3
has been synthesized by the coprecipitation/digestion method followed by calcination and
the magnetic properties are evaluated [87].
6.5.1 Synthesis
The synthesis is based on the coprecipitation/digestion method discussed in section 2.1.1.
Bi(NO3)3.5H2O and Fe(NO3)3.9H2O were used as the precursors for Bi and Fe, respec-
tively, and K2CO3 was used as the precipitant for the synthesis. Bi(NO3)3.5H2O was
dissolved in dil. HNO3 and Fe(NO3)3.9H2O was dissolved in distilled water and in a typ-
ical experiment, 0.05M Bi(NO3)3.5H2O, 0.05M Fe(NO3)3.9H2O and 0.6M K2CO3 were
used. The metal nitrate solutions were initially mixed together and stirred well to obtain
a homogenous solution. Equal volumes of the mixed metal nitrate solution and K2CO3
were taken in separate burettes. Both the solutions were added simultaneously to distilled
water taken in a three-necked round bottom flask. After the complete addition of the two
solutions at 70 C, a precipitate formed was allowed to digest for 2 hours. To avoid any
contamination like K+ ions, the precipitate was washed thoroughly and repeatedly with
2 liters of distilled water. The washed precipitate was then kept overnight at 70 C in an
oven for drying. The as-dried precursor was labeled as BFA.
The as-dried precursor (sample code: BFA) was calcined at different temperatures;
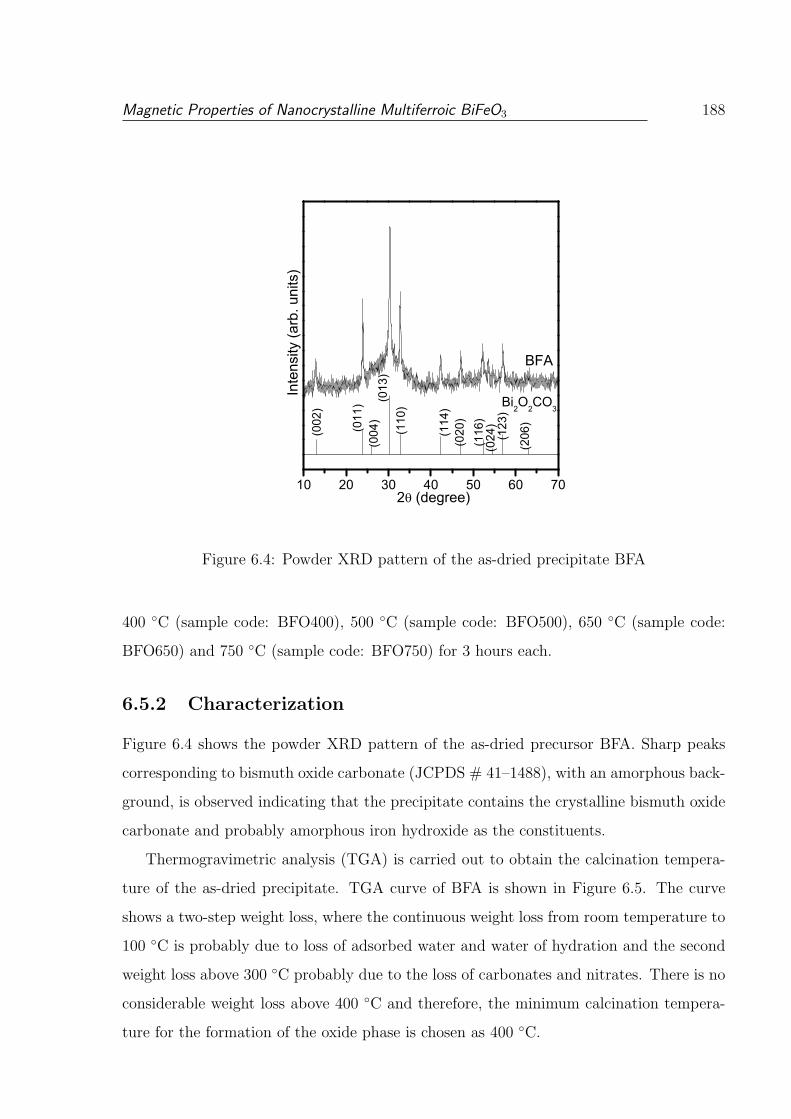
Magnetic Properties of Nanocrystalline Multiferroic BiFeO3 188
10 20 30 40 50 60 70
Bi2O2CO3
2 (degree)
BFA
(206
)
(123
)(0
24)
(116
)(0
20)
(114
)
(110
)(0
13)
(004
)(0
11)
(002
)
Inte
nsity
(arb
. uni
ts)
Figure 6.4: Powder XRD pattern of the as-dried precipitate BFA
400 C (sample code: BFO400), 500 C (sample code: BFO500), 650 C (sample code:
BFO650) and 750 C (sample code: BFO750) for 3 hours each.
6.5.2 Characterization
Figure 6.4 shows the powder XRD pattern of the as-dried precursor BFA. Sharp peaks
corresponding to bismuth oxide carbonate (JCPDS # 41–1488), with an amorphous back-
ground, is observed indicating that the precipitate contains the crystalline bismuth oxide
carbonate and probably amorphous iron hydroxide as the constituents.
Thermogravimetric analysis (TGA) is carried out to obtain the calcination tempera-
ture of the as-dried precipitate. TGA curve of BFA is shown in Figure 6.5. The curve
shows a two-step weight loss, where the continuous weight loss from room temperature to
100 C is probably due to loss of adsorbed water and water of hydration and the second
weight loss above 300 C probably due to the loss of carbonates and nitrates. There is no
considerable weight loss above 400 C and therefore, the minimum calcination tempera-
ture for the formation of the oxide phase is chosen as 400 C.
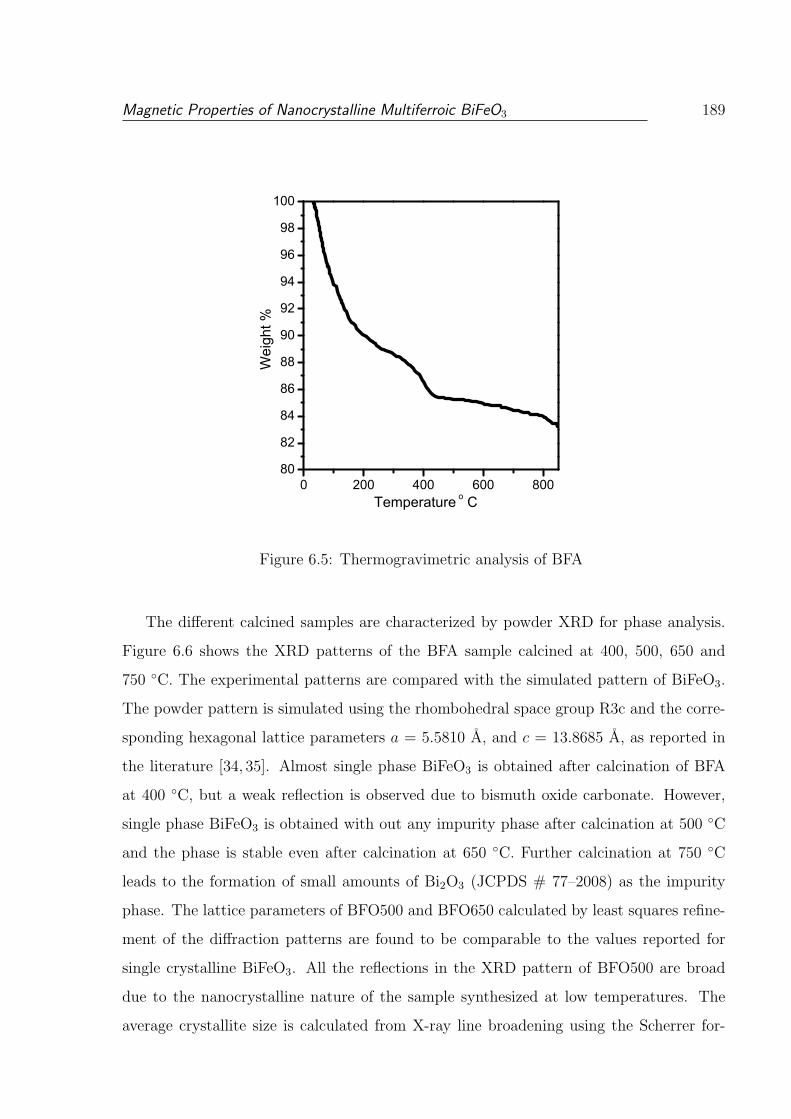
Magnetic Properties of Nanocrystalline Multiferroic BiFeO3 189
0 200 400 600 80080
82
84
86
88
90
92
94
96
98
100
Wei
ght %
Temperature o C
Figure 6.5: Thermogravimetric analysis of BFA
The different calcined samples are characterized by powder XRD for phase analysis.
Figure 6.6 shows the XRD patterns of the BFA sample calcined at 400, 500, 650 and
750 C. The experimental patterns are compared with the simulated pattern of BiFeO3.
The powder pattern is simulated using the rhombohedral space group R3c and the corre-
sponding hexagonal lattice parameters a = 5.5810 A, and c = 13.8685 A, as reported in
the literature [34, 35]. Almost single phase BiFeO3 is obtained after calcination of BFA
at 400 C, but a weak reflection is observed due to bismuth oxide carbonate. However,
single phase BiFeO3 is obtained with out any impurity phase after calcination at 500 C
and the phase is stable even after calcination at 650 C. Further calcination at 750 C
leads to the formation of small amounts of Bi2O3 (JCPDS # 77–2008) as the impurity
phase. The lattice parameters of BFO500 and BFO650 calculated by least squares refine-
ment of the diffraction patterns are found to be comparable to the values reported for
single crystalline BiFeO3. All the reflections in the XRD pattern of BFO500 are broad
due to the nanocrystalline nature of the sample synthesized at low temperatures. The
average crystallite size is calculated from X-ray line broadening using the Scherrer for-
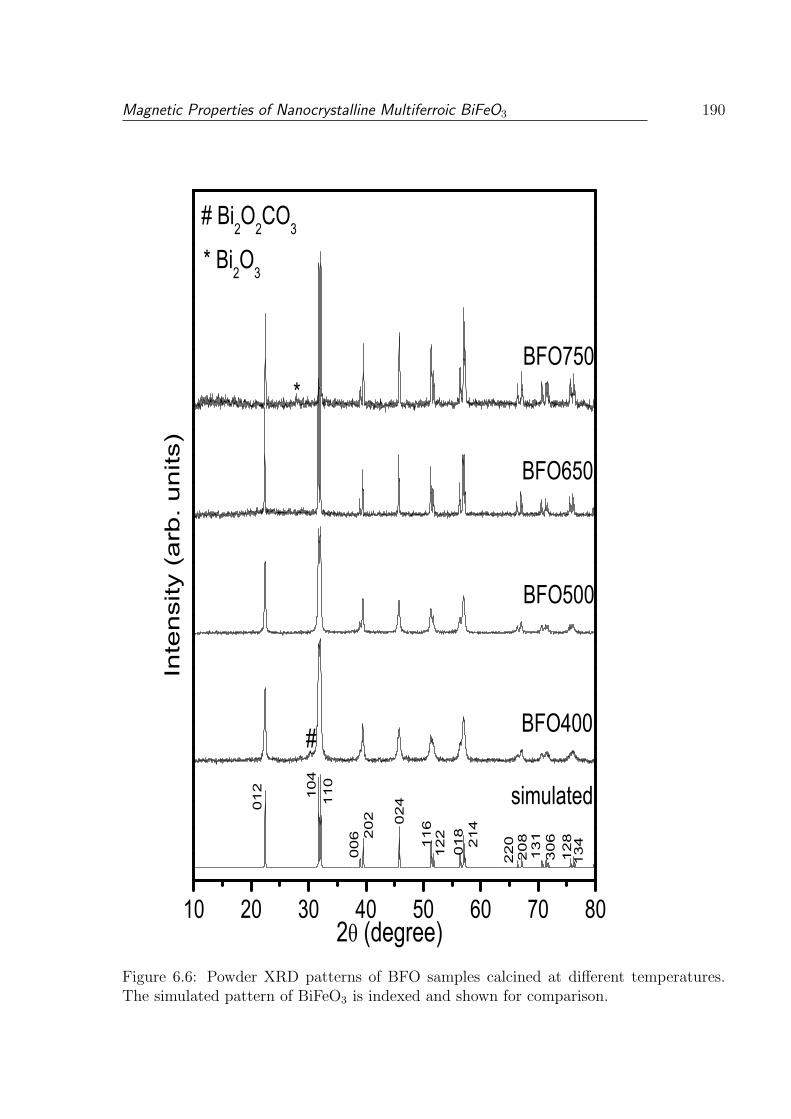
Magnetic Properties of Nanocrystalline Multiferroic BiFeO3 190
10 20 30 40 50 60 70 80
simulated
# Bi2O2CO3
#
* Bi2O3
Inte
nsi
ty (
arb
. u
nits
)
*
134
128
306
131
208
220214
018
122
1160
24
202
006
110
104
012
BFO750
BFO650
BFO500
BFO400
2 (degree)Figure 6.6: Powder XRD patterns of BFO samples calcined at different temperatures.The simulated pattern of BiFeO3 is indexed and shown for comparison.
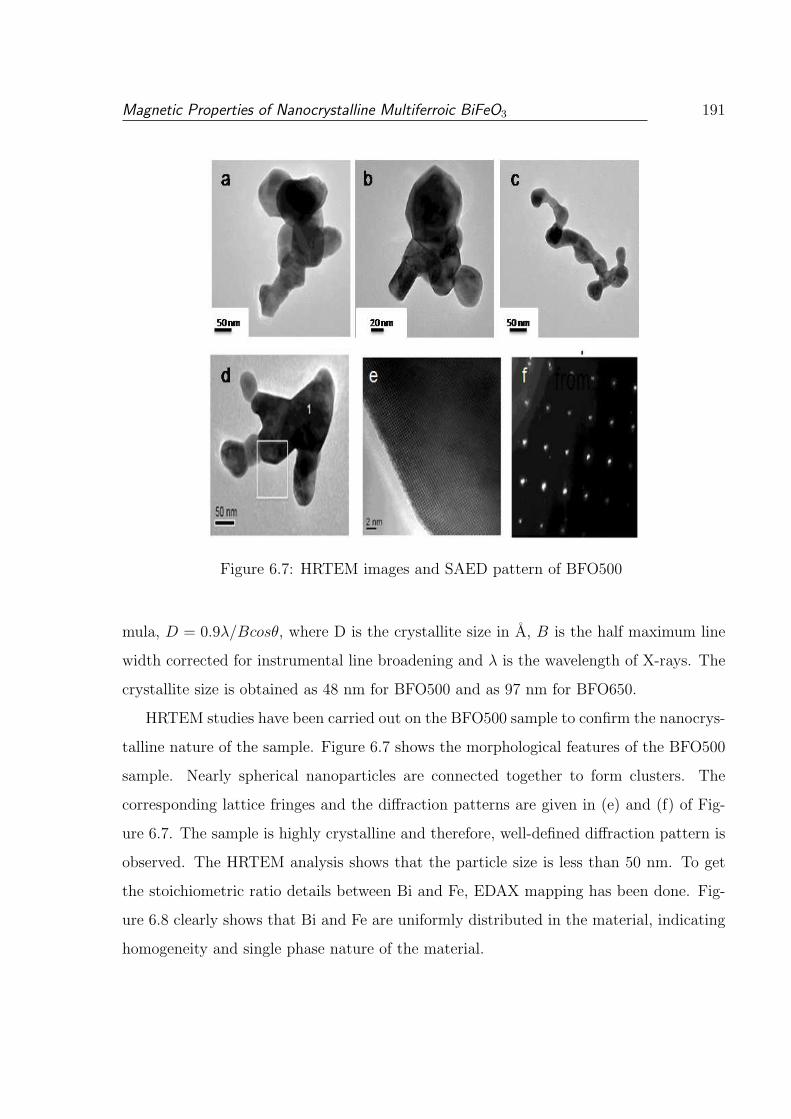
Magnetic Properties of Nanocrystalline Multiferroic BiFeO3 191
Figure 6.7: HRTEM images and SAED pattern of BFO500
mula, D = 0.9λ/Bcosθ, where D is the crystallite size in A, B is the half maximum line
width corrected for instrumental line broadening and λ is the wavelength of X-rays. The
crystallite size is obtained as 48 nm for BFO500 and as 97 nm for BFO650.
HRTEM studies have been carried out on the BFO500 sample to confirm the nanocrys-
talline nature of the sample. Figure 6.7 shows the morphological features of the BFO500
sample. Nearly spherical nanoparticles are connected together to form clusters. The
corresponding lattice fringes and the diffraction patterns are given in (e) and (f) of Fig-
ure 6.7. The sample is highly crystalline and therefore, well-defined diffraction pattern is
observed. The HRTEM analysis shows that the particle size is less than 50 nm. To get
the stoichiometric ratio details between Bi and Fe, EDAX mapping has been done. Fig-
ure 6.8 clearly shows that Bi and Fe are uniformly distributed in the material, indicating
homogeneity and single phase nature of the material.

Magnetic Properties of Nanocrystalline Multiferroic BiFeO3 192
Figure 6.8: EDAX mapping of BFO500
-30 -20 -10 0 10 20 30
-0.4
-0.3
-0.2
-0.1
0.0
0.1
0.2
0.3
0.4
BFO500
BFO650
M (e
mu/
g)
H (kOe)
Figure 6.9: Magnetization of BFO500 and BFO650 as a function of magnetic field at roomtemperature.
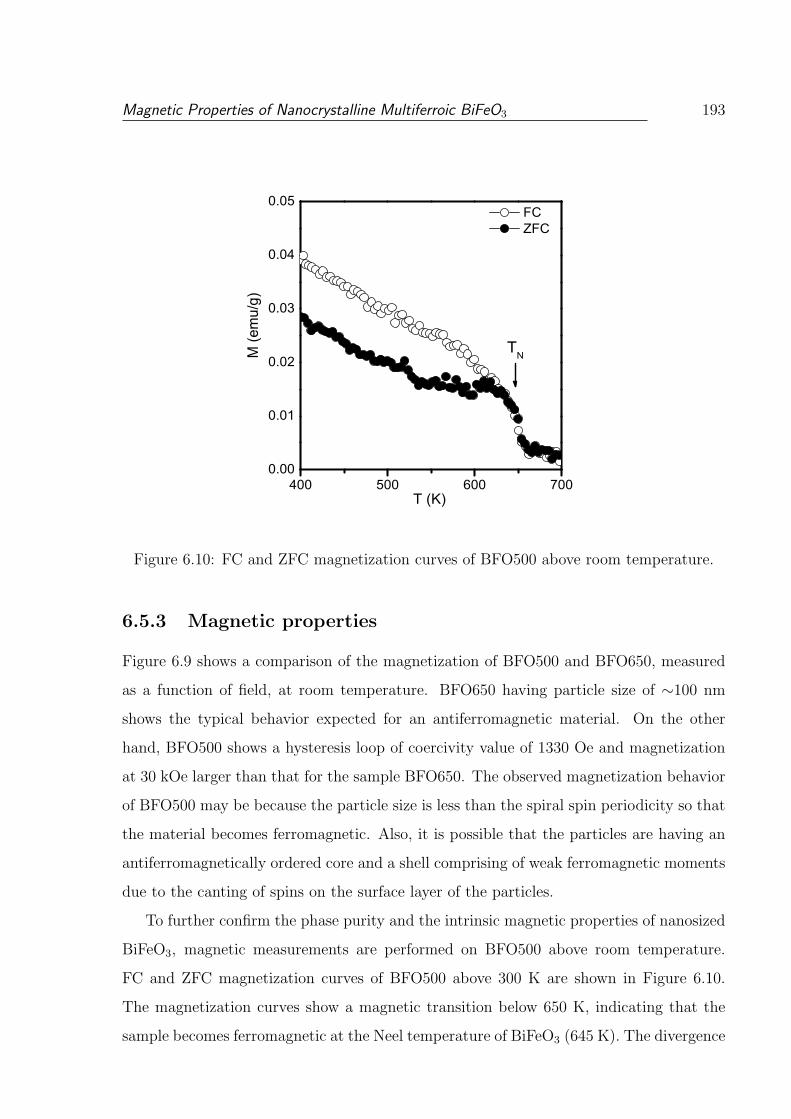
Magnetic Properties of Nanocrystalline Multiferroic BiFeO3 193
400 500 600 7000.00
0.01
0.02
0.03
0.04
0.05 FC ZFC
TNM (e
mu/
g)
T (K)
Figure 6.10: FC and ZFC magnetization curves of BFO500 above room temperature.
6.5.3 Magnetic properties
Figure 6.9 shows a comparison of the magnetization of BFO500 and BFO650, measured
as a function of field, at room temperature. BFO650 having particle size of ∼100 nm
shows the typical behavior expected for an antiferromagnetic material. On the other
hand, BFO500 shows a hysteresis loop of coercivity value of 1330 Oe and magnetization
at 30 kOe larger than that for the sample BFO650. The observed magnetization behavior
of BFO500 may be because the particle size is less than the spiral spin periodicity so that
the material becomes ferromagnetic. Also, it is possible that the particles are having an
antiferromagnetically ordered core and a shell comprising of weak ferromagnetic moments
due to the canting of spins on the surface layer of the particles.
To further confirm the phase purity and the intrinsic magnetic properties of nanosized
BiFeO3, magnetic measurements are performed on BFO500 above room temperature.
FC and ZFC magnetization curves of BFO500 above 300 K are shown in Figure 6.10.
The magnetization curves show a magnetic transition below 650 K, indicating that the
sample becomes ferromagnetic at the Neel temperature of BiFeO3 (645 K). The divergence
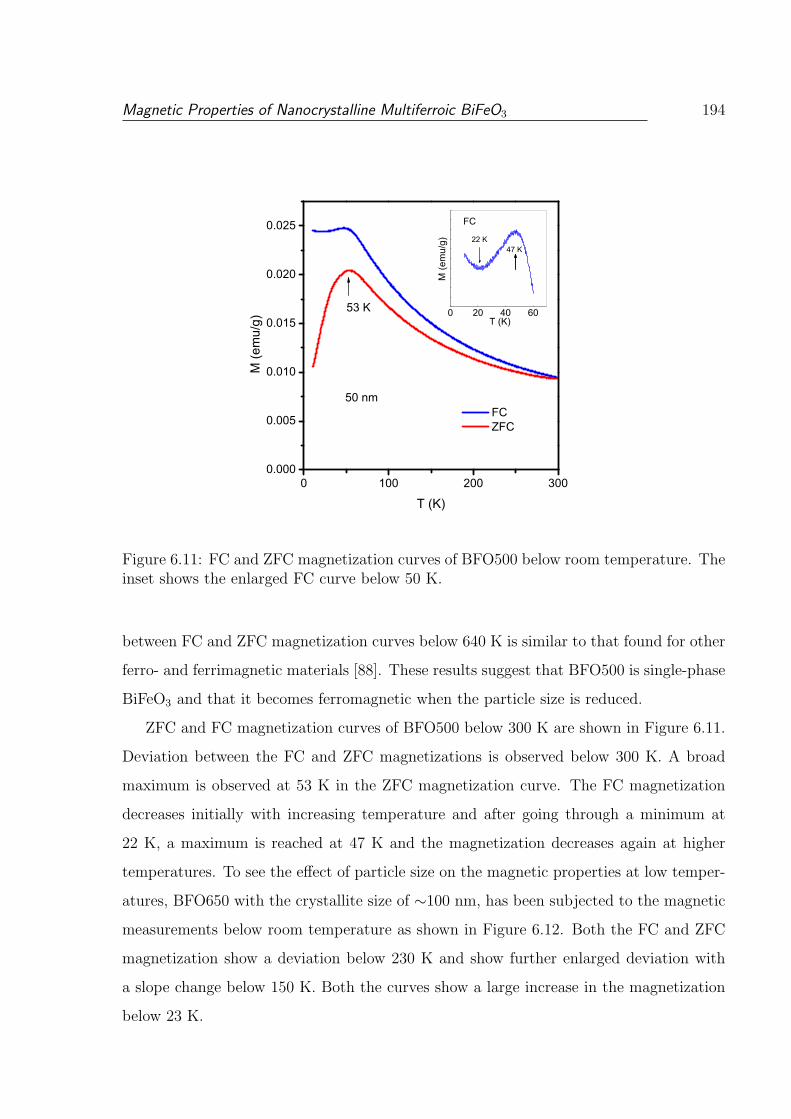
Magnetic Properties of Nanocrystalline Multiferroic BiFeO3 194
0 100 200 3000.000
0.005
0.010
0.015
0.020
0.025
0 20 40 60
50 nm
53 K
M (e
mu/
g)
T (K)
FC ZFC
22 K47 K
FC
M (e
mu/
g)
T (K)
Figure 6.11: FC and ZFC magnetization curves of BFO500 below room temperature. Theinset shows the enlarged FC curve below 50 K.
between FC and ZFC magnetization curves below 640 K is similar to that found for other
ferro- and ferrimagnetic materials [88]. These results suggest that BFO500 is single-phase
BiFeO3 and that it becomes ferromagnetic when the particle size is reduced.
ZFC and FC magnetization curves of BFO500 below 300 K are shown in Figure 6.11.
Deviation between the FC and ZFC magnetizations is observed below 300 K. A broad
maximum is observed at 53 K in the ZFC magnetization curve. The FC magnetization
decreases initially with increasing temperature and after going through a minimum at
22 K, a maximum is reached at 47 K and the magnetization decreases again at higher
temperatures. To see the effect of particle size on the magnetic properties at low temper-
atures, BFO650 with the crystallite size of ∼100 nm, has been subjected to the magnetic
measurements below room temperature as shown in Figure 6.12. Both the FC and ZFC
magnetization show a deviation below 230 K and show further enlarged deviation with
a slope change below 150 K. Both the curves show a large increase in the magnetization
below 23 K.
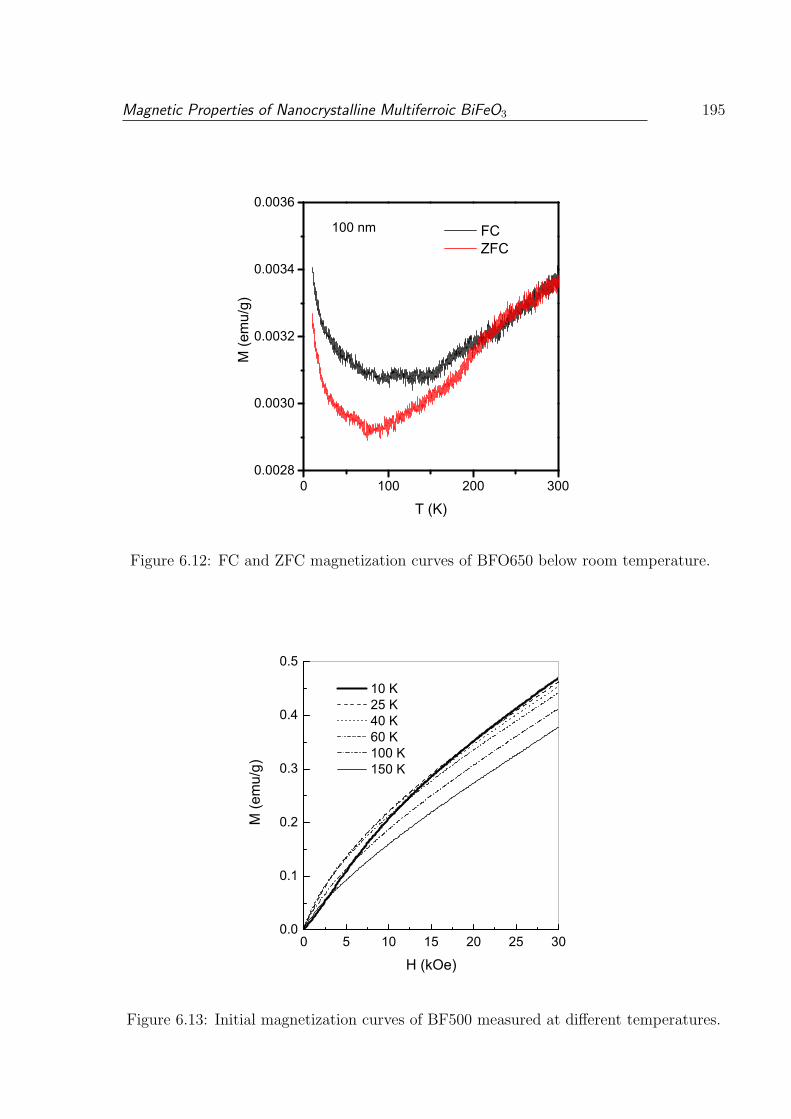
Magnetic Properties of Nanocrystalline Multiferroic BiFeO3 195
0 100 200 3000.0028
0.0030
0.0032
0.0034
0.0036
100 nm FC ZFC
M (e
mu/
g)
T (K)
Figure 6.12: FC and ZFC magnetization curves of BFO650 below room temperature.
0 5 10 15 20 25 300.0
0.1
0.2
0.3
0.4
0.5
M (e
mu/
g)
H (kOe)
10 K 25 K 40 K 60 K 100 K 150 K
Figure 6.13: Initial magnetization curves of BF500 measured at different temperatures.
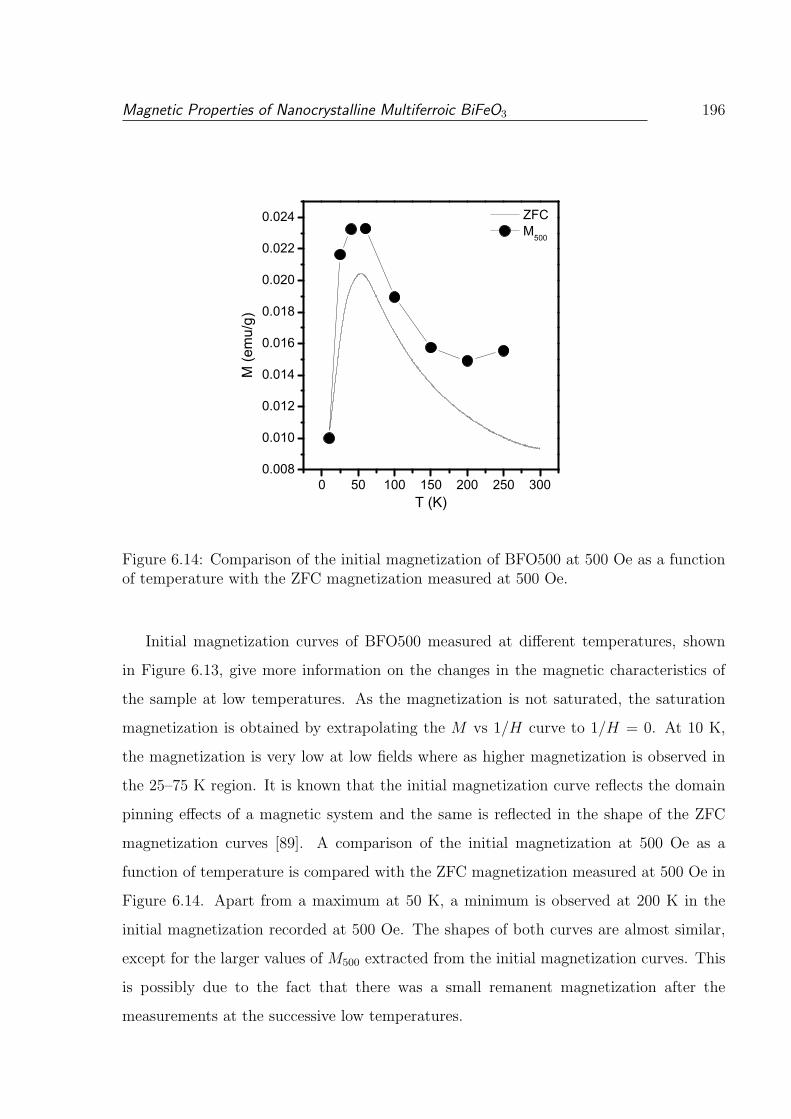
Magnetic Properties of Nanocrystalline Multiferroic BiFeO3 196
0 50 100 150 200 250 3000.008
0.010
0.012
0.014
0.016
0.018
0.020
0.022
0.024 ZFC M500
M (e
mu/
g)
T (K)
Figure 6.14: Comparison of the initial magnetization of BFO500 at 500 Oe as a functionof temperature with the ZFC magnetization measured at 500 Oe.
Initial magnetization curves of BFO500 measured at different temperatures, shown
in Figure 6.13, give more information on the changes in the magnetic characteristics of
the sample at low temperatures. As the magnetization is not saturated, the saturation
magnetization is obtained by extrapolating the M vs 1/H curve to 1/H = 0. At 10 K,
the magnetization is very low at low fields where as higher magnetization is observed in
the 25–75 K region. It is known that the initial magnetization curve reflects the domain
pinning effects of a magnetic system and the same is reflected in the shape of the ZFC
magnetization curves [89]. A comparison of the initial magnetization at 500 Oe as a
function of temperature is compared with the ZFC magnetization measured at 500 Oe in
Figure 6.14. Apart from a maximum at 50 K, a minimum is observed at 200 K in the
initial magnetization recorded at 500 Oe. The shapes of both curves are almost similar,
except for the larger values of M500 extracted from the initial magnetization curves. This
is possibly due to the fact that there was a small remanent magnetization after the
measurements at the successive low temperatures.
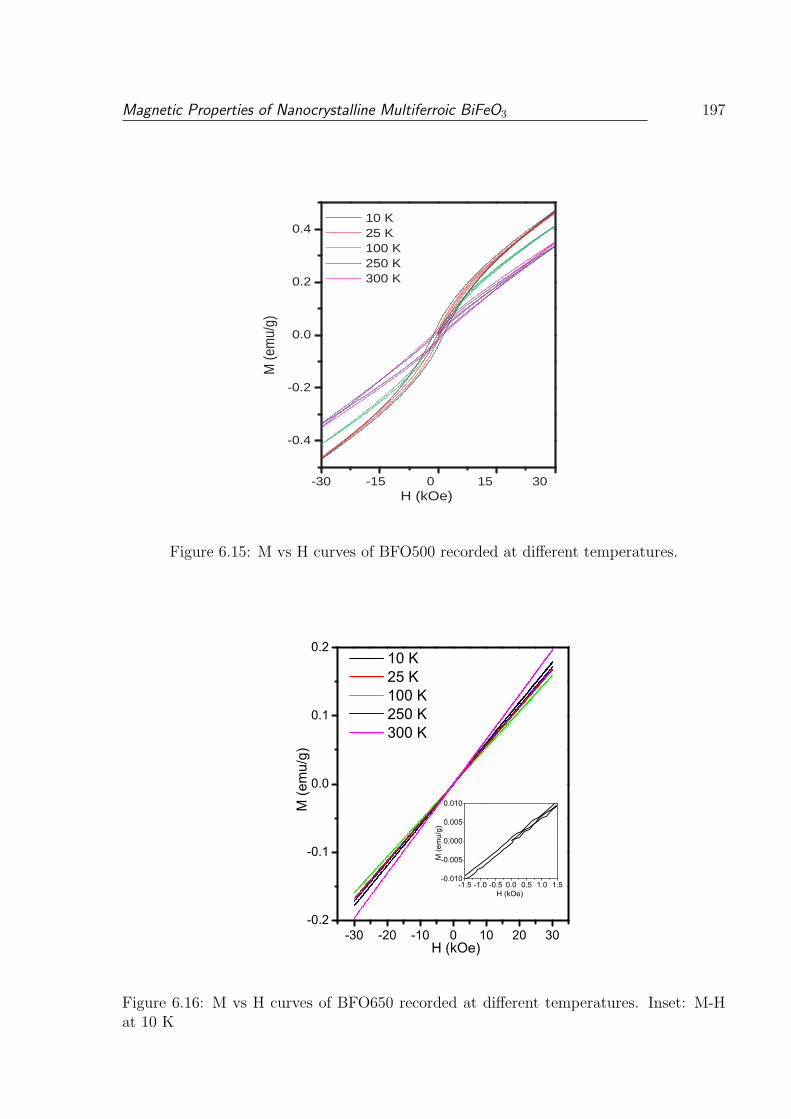
Magnetic Properties of Nanocrystalline Multiferroic BiFeO3 197
-30 -15 0 15 30
-0.4
-0.2
0.0
0.2
0.4
10 K 25 K 100 K 250 K 300 K
M (e
mu/
g)
H (kOe)
Figure 6.15: M vs H curves of BFO500 recorded at different temperatures.
-30 -20 -10 0 10 20 30-0.2
-0.1
0.0
0.1
0.2
-1.5 -1.0 -0.5 0.0 0.5 1.0 1.5-0.010
-0.005
0.000
0.005
0.010
M (e
mu/
g)
H (kOe)
M (e
mu/
g)
H (kOe)
10 K 25 K 100 K 250 K 300 K
Figure 6.16: M vs H curves of BFO650 recorded at different temperatures. Inset: M-Hat 10 K
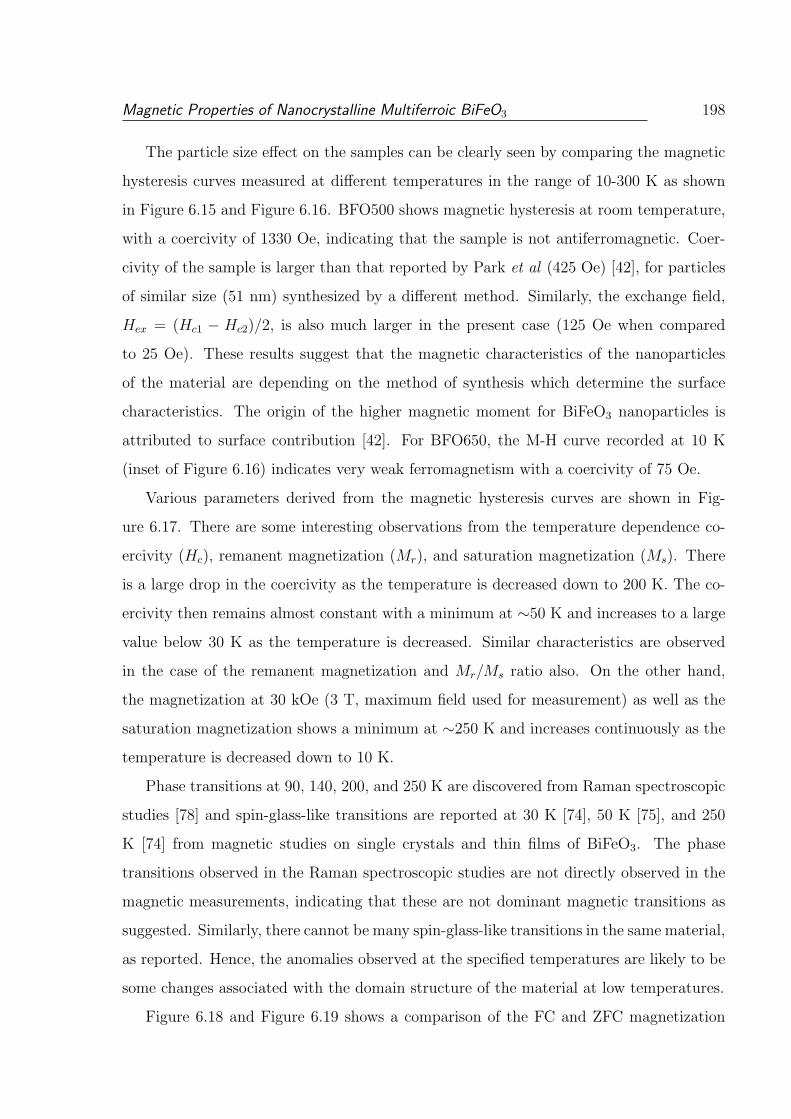
Magnetic Properties of Nanocrystalline Multiferroic BiFeO3 198
The particle size effect on the samples can be clearly seen by comparing the magnetic
hysteresis curves measured at different temperatures in the range of 10-300 K as shown
in Figure 6.15 and Figure 6.16. BFO500 shows magnetic hysteresis at room temperature,
with a coercivity of 1330 Oe, indicating that the sample is not antiferromagnetic. Coer-
civity of the sample is larger than that reported by Park et al (425 Oe) [42], for particles
of similar size (51 nm) synthesized by a different method. Similarly, the exchange field,
Hex = (Hc1 − Hc2)/2, is also much larger in the present case (125 Oe when compared
to 25 Oe). These results suggest that the magnetic characteristics of the nanoparticles
of the material are depending on the method of synthesis which determine the surface
characteristics. The origin of the higher magnetic moment for BiFeO3 nanoparticles is
attributed to surface contribution [42]. For BFO650, the M-H curve recorded at 10 K
(inset of Figure 6.16) indicates very weak ferromagnetism with a coercivity of 75 Oe.
Various parameters derived from the magnetic hysteresis curves are shown in Fig-
ure 6.17. There are some interesting observations from the temperature dependence co-
ercivity (Hc), remanent magnetization (Mr), and saturation magnetization (Ms). There
is a large drop in the coercivity as the temperature is decreased down to 200 K. The co-
ercivity then remains almost constant with a minimum at ∼50 K and increases to a large
value below 30 K as the temperature is decreased. Similar characteristics are observed
in the case of the remanent magnetization and Mr/Ms ratio also. On the other hand,
the magnetization at 30 kOe (3 T, maximum field used for measurement) as well as the
saturation magnetization shows a minimum at ∼250 K and increases continuously as the
temperature is decreased down to 10 K.
Phase transitions at 90, 140, 200, and 250 K are discovered from Raman spectroscopic
studies [78] and spin-glass-like transitions are reported at 30 K [74], 50 K [75], and 250
K [74] from magnetic studies on single crystals and thin films of BiFeO3. The phase
transitions observed in the Raman spectroscopic studies are not directly observed in the
magnetic measurements, indicating that these are not dominant magnetic transitions as
suggested. Similarly, there cannot be many spin-glass-like transitions in the same material,
as reported. Hence, the anomalies observed at the specified temperatures are likely to be
some changes associated with the domain structure of the material at low temperatures.
Figure 6.18 and Figure 6.19 shows a comparison of the FC and ZFC magnetization
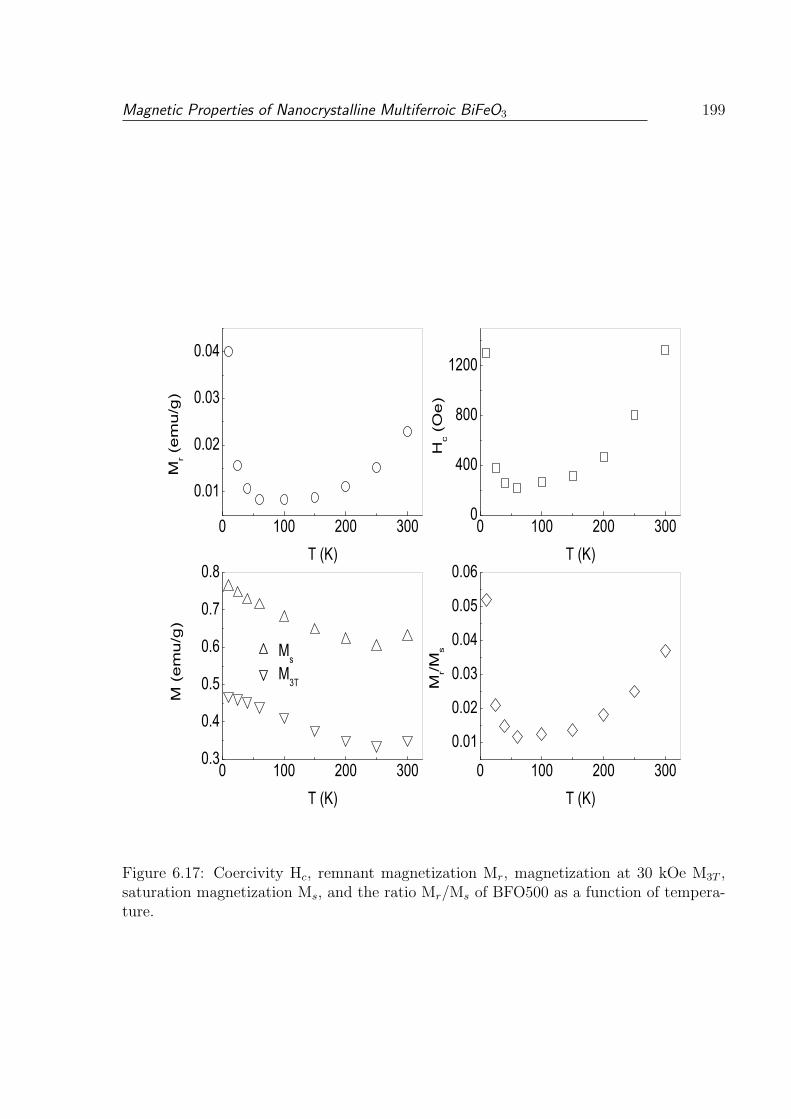
Magnetic Properties of Nanocrystalline Multiferroic BiFeO3 199
0 100 200 300
0.01
0.02
0.03
0.04
Mr (
em
u/g
)
T (K)0 100 200 300
0
400
800
1200
Hc
(Oe
)
T (K)
0 100 200 3000.3
0.4
0.5
0.6
0.7
0.8
M (
em
u/g
)
T (K)
MsM3T
0 100 200 300
0.01
0.02
0.03
0.04
0.05
0.06
Mr/M
s
T (K)
Figure 6.17: Coercivity Hc, remnant magnetization Mr, magnetization at 30 kOe M3T ,saturation magnetization Ms, and the ratio Mr/Ms of BFO500 as a function of tempera-ture.
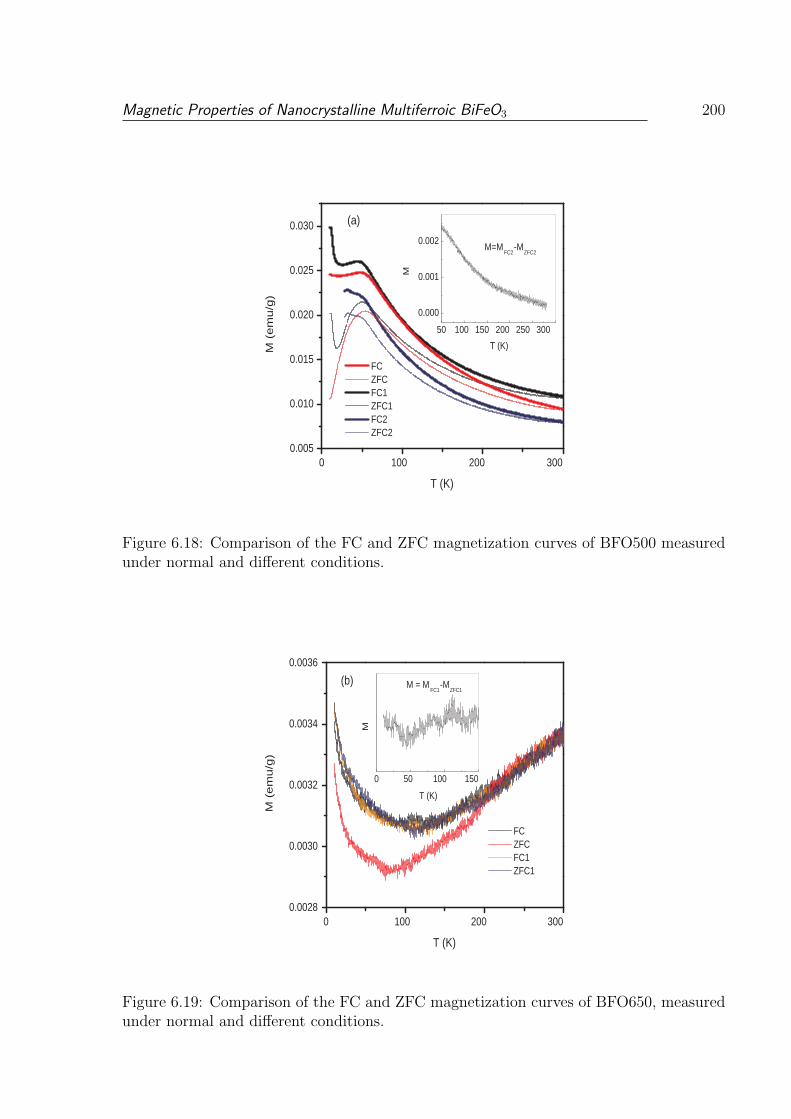
Magnetic Properties of Nanocrystalline Multiferroic BiFeO3 200
0 100 200 300 0.005
0.010
0.015
0.020
0.025
0.030
50 100 150 200 250 300
0.000
0.001
0.002
(a)
M (
em
u/g
)
T (K)
FC ZFC FC1 ZFC1 FC2 ZFC2
M=M FC2
-M ZFC2
M
T (K)
Figure 6.18: Comparison of the FC and ZFC magnetization curves of BFO500 measuredunder normal and different conditions.
0 100 200 300 0.0028
0.0030
0.0032
0.0034
0.0036
0 50 100 150
(b)
FC ZFC FC1 ZFC1
M (
em
u/g
)
T (K)
M = M FC1
-M ZFC1
T (K)
M
Figure 6.19: Comparison of the FC and ZFC magnetization curves of BFO650, measuredunder normal and different conditions.
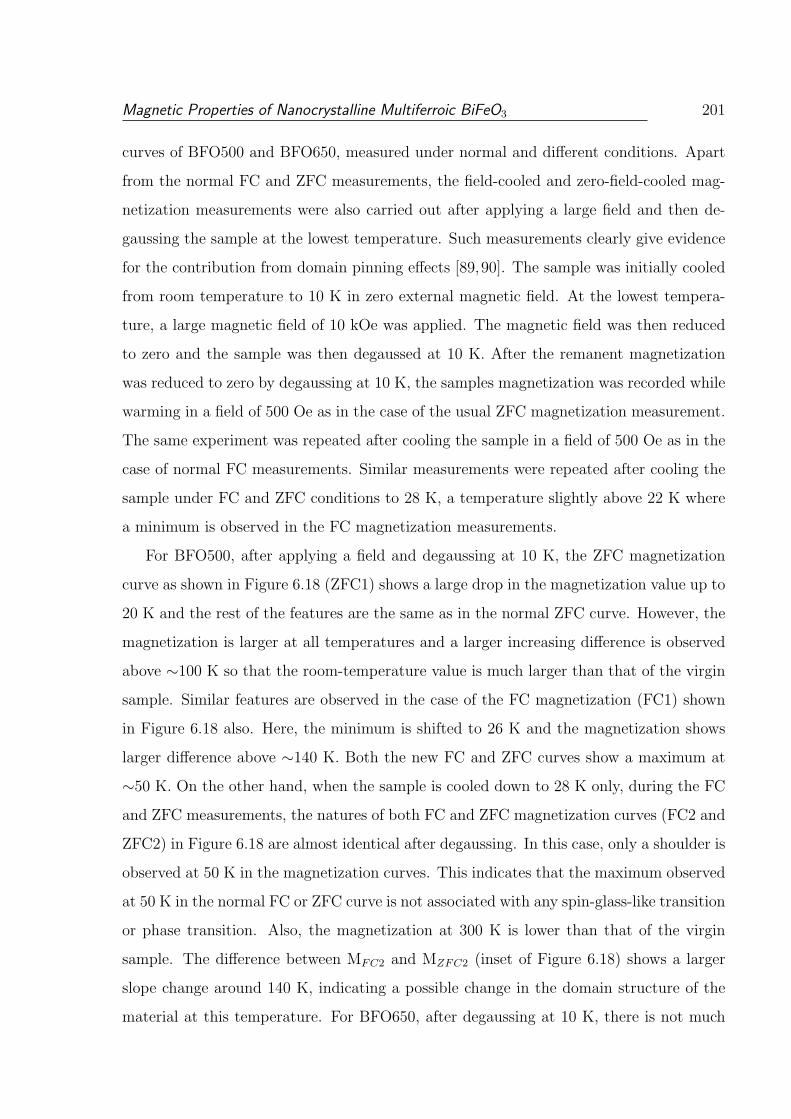
Magnetic Properties of Nanocrystalline Multiferroic BiFeO3 201
curves of BFO500 and BFO650, measured under normal and different conditions. Apart
from the normal FC and ZFC measurements, the field-cooled and zero-field-cooled mag-
netization measurements were also carried out after applying a large field and then de-
gaussing the sample at the lowest temperature. Such measurements clearly give evidence
for the contribution from domain pinning effects [89,90]. The sample was initially cooled
from room temperature to 10 K in zero external magnetic field. At the lowest tempera-
ture, a large magnetic field of 10 kOe was applied. The magnetic field was then reduced
to zero and the sample was then degaussed at 10 K. After the remanent magnetization
was reduced to zero by degaussing at 10 K, the samples magnetization was recorded while
warming in a field of 500 Oe as in the case of the usual ZFC magnetization measurement.
The same experiment was repeated after cooling the sample in a field of 500 Oe as in the
case of normal FC measurements. Similar measurements were repeated after cooling the
sample under FC and ZFC conditions to 28 K, a temperature slightly above 22 K where
a minimum is observed in the FC magnetization measurements.
For BFO500, after applying a field and degaussing at 10 K, the ZFC magnetization
curve as shown in Figure 6.18 (ZFC1) shows a large drop in the magnetization value up to
20 K and the rest of the features are the same as in the normal ZFC curve. However, the
magnetization is larger at all temperatures and a larger increasing difference is observed
above ∼100 K so that the room-temperature value is much larger than that of the virgin
sample. Similar features are observed in the case of the FC magnetization (FC1) shown
in Figure 6.18 also. Here, the minimum is shifted to 26 K and the magnetization shows
larger difference above ∼140 K. Both the new FC and ZFC curves show a maximum at
∼50 K. On the other hand, when the sample is cooled down to 28 K only, during the FC
and ZFC measurements, the natures of both FC and ZFC magnetization curves (FC2 and
ZFC2) in Figure 6.18 are almost identical after degaussing. In this case, only a shoulder is
observed at 50 K in the magnetization curves. This indicates that the maximum observed
at 50 K in the normal FC or ZFC curve is not associated with any spin-glass-like transition
or phase transition. Also, the magnetization at 300 K is lower than that of the virgin
sample. The difference between MFC2 and MZFC2 (inset of Figure 6.18) shows a larger
slope change around 140 K, indicating a possible change in the domain structure of the
material at this temperature. For BFO650, after degaussing at 10 K, there is not much
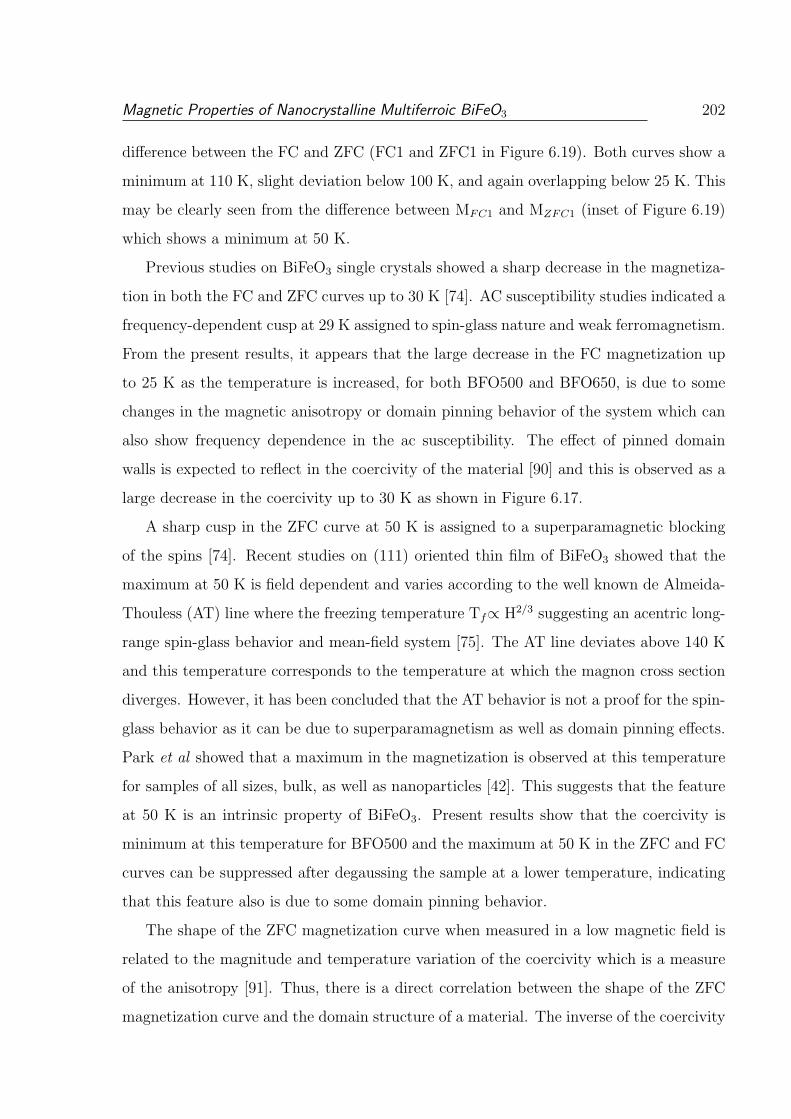
Magnetic Properties of Nanocrystalline Multiferroic BiFeO3 202
difference between the FC and ZFC (FC1 and ZFC1 in Figure 6.19). Both curves show a
minimum at 110 K, slight deviation below 100 K, and again overlapping below 25 K. This
may be clearly seen from the difference between MFC1 and MZFC1 (inset of Figure 6.19)
which shows a minimum at 50 K.
Previous studies on BiFeO3 single crystals showed a sharp decrease in the magnetiza-
tion in both the FC and ZFC curves up to 30 K [74]. AC susceptibility studies indicated a
frequency-dependent cusp at 29 K assigned to spin-glass nature and weak ferromagnetism.
From the present results, it appears that the large decrease in the FC magnetization up
to 25 K as the temperature is increased, for both BFO500 and BFO650, is due to some
changes in the magnetic anisotropy or domain pinning behavior of the system which can
also show frequency dependence in the ac susceptibility. The effect of pinned domain
walls is expected to reflect in the coercivity of the material [90] and this is observed as a
large decrease in the coercivity up to 30 K as shown in Figure 6.17.
A sharp cusp in the ZFC curve at 50 K is assigned to a superparamagnetic blocking
of the spins [74]. Recent studies on (111) oriented thin film of BiFeO3 showed that the
maximum at 50 K is field dependent and varies according to the well known de Almeida-
Thouless (AT) line where the freezing temperature Tf∝ H2/3 suggesting an acentric long-
range spin-glass behavior and mean-field system [75]. The AT line deviates above 140 K
and this temperature corresponds to the temperature at which the magnon cross section
diverges. However, it has been concluded that the AT behavior is not a proof for the spin-
glass behavior as it can be due to superparamagnetism as well as domain pinning effects.
Park et al showed that a maximum in the magnetization is observed at this temperature
for samples of all sizes, bulk, as well as nanoparticles [42]. This suggests that the feature
at 50 K is an intrinsic property of BiFeO3. Present results show that the coercivity is
minimum at this temperature for BFO500 and the maximum at 50 K in the ZFC and FC
curves can be suppressed after degaussing the sample at a lower temperature, indicating
that this feature also is due to some domain pinning behavior.
The shape of the ZFC magnetization curve when measured in a low magnetic field is
related to the magnitude and temperature variation of the coercivity which is a measure
of the anisotropy [91]. Thus, there is a direct correlation between the shape of the ZFC
magnetization curve and the domain structure of a material. The inverse of the coercivity
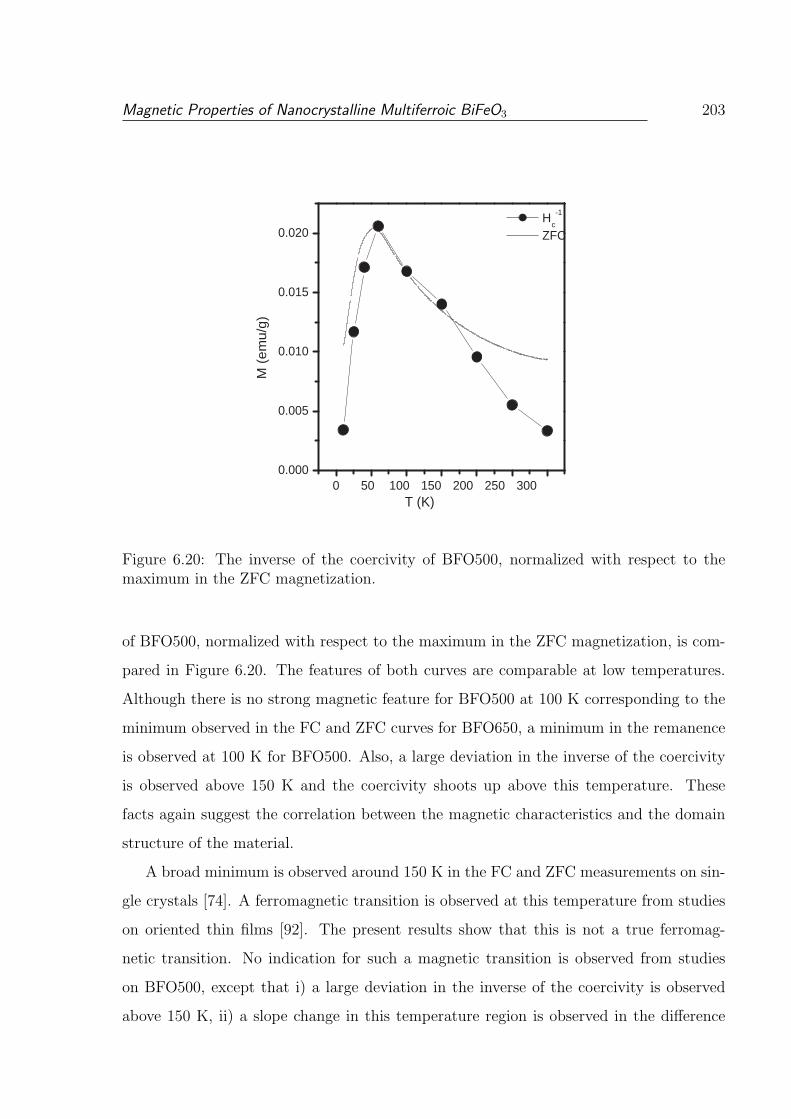
Magnetic Properties of Nanocrystalline Multiferroic BiFeO3 203
0 50 100 150 200 250 300 0.000
0.005
0.010
0.015
0.020 H
c
-1
ZFC
M (
emu/
g)
T (K)
Figure 6.20: The inverse of the coercivity of BFO500, normalized with respect to themaximum in the ZFC magnetization.
of BFO500, normalized with respect to the maximum in the ZFC magnetization, is com-
pared in Figure 6.20. The features of both curves are comparable at low temperatures.
Although there is no strong magnetic feature for BFO500 at 100 K corresponding to the
minimum observed in the FC and ZFC curves for BFO650, a minimum in the remanence
is observed at 100 K for BFO500. Also, a large deviation in the inverse of the coercivity
is observed above 150 K and the coercivity shoots up above this temperature. These
facts again suggest the correlation between the magnetic characteristics and the domain
structure of the material.
A broad minimum is observed around 150 K in the FC and ZFC measurements on sin-
gle crystals [74]. A ferromagnetic transition is observed at this temperature from studies
on oriented thin films [92]. The present results show that this is not a true ferromag-
netic transition. No indication for such a magnetic transition is observed from studies
on BFO500, except that i) a large deviation in the inverse of the coercivity is observed
above 150 K, ii) a slope change in this temperature region is observed in the difference
Magnetic Properties of Nanocrystalline Multiferroic BiFeO3 204
between FC and ZFC magnetizations after degaussing of BFO500, and iii) the coerciv-
ity shoots up above this temperature. These facts again suggest the correlation between
the magnetic characteristics and the domain structure of the material. The divergence
between FC and ZFC magnetization curves of single crystalline BiFeO3 below 250 K is
previously assigned to spin glass behavior [74]. A similar feature is observed for the larger
particles of BiFeO3 (BFO650) in the present work. However, this divergence between FC
and ZFC is observed immediately below the magnetic transition temperature (∼645 K)
for the smaller particles (BFO500), similar to other ferromagnetic systems. A minimum
in the saturation magnetization is observed around 250 K for BFO500, indicating that
the divergence between FC and ZFC curves for BFO650 below 230 K is not a true spin
glass behavior. For larger particles, this can be due to the strong coupling between the
antiferromagnetic and ferroelectric domain structures.
6.5.4 Conclusions
BiFeO3 nanoparticles with average size of ∼50 nm, smaller than the spin periodicity value,
is synthesized by a coprecipitation/digestion method. The material becomes ferromag-
netic below the Neel temperature of the bulk material (∼645 K). There is a divergence
between FC and ZFC magnetization, immediately below the magnetic transition tem-
perature, similar to that observed in the case of other ferromagnetic systems. On the
other hand, for larger particles of size ∼100 nm (BFO650) the divergence is observed only
below 230 K, as in the case of the bulk material. This temperature is comparable to
the minimum in the saturation magnetization observed for BFO500 at 250 K, indicating
that the divergence observed in case of BFO650 with larger particle size can be due to
the strong coupling between the antiferromagnetic and ferroelectric domain structures.
For nanoparticles of BiFeO3 of two different sizes, anomalous magnetic characteristics are
observed at temperature regions closer to that of the phase transitions reported in the
literature at 90, 140, 200 and 250 K from Raman spectroscopic studies and spin-glass-like
transitions reported at 30, 50, 150, and 250 K from magnetic studies on single crys-
tals and thin films. Some changes in the magnetic characteristics are observed at these
temperatures when the measurements are done under different experimental conditions,
suggesting that the phase transitions or spin-glass-like transitions are directly associated
Magnetic Properties of Nanocrystalline Multiferroic BiFeO3 205
with changes in the intrinsic magnetic nature of the BiFeO3, strongly coupled with the lat-
tice. The phase transitions observed in the Raman spectroscopic studies are not directly
observed in the magnetic measurements, indicating that these are not dominant magnetic
transitions as suggested. Similarly, there cannot be many spin-glass-like transitions in the
same material, as reported. Hence the anomalies observed at the specified temperatures
are likely to be some changes associated with the domain structure of the material at low
temperatures.
6.6 Studies on BiFeO3 powders synthesized by an
auto-combustion method
It has been reported that room temperature ferromagnetism with high saturation mag-
netization of 0.4µB/Fe can be achieved for 4 nm sized particles of BiFeO3 synthesized by
a combustion method using glycine as a fuel [60]. On the other hand, for particles of
comparable average sizes synthesized by a sol-gel method, much lower magnetic moments
are reported [42]. Therefore, it appears that ferromagnetism in nanocrystalline BiFeO3
depends on the method of synthesis. This is probably due to the nature of surface defects,
lattice strain, presence of Fe2+ in the nanomaterials due to oxygen deficiency, etc. We
have synthesized single phase nanocrystalline BiFeO3 by controlling the stoichiometry of
the fuel used in the auto-combustion method reported previously [60,93], and studied the
magnetic properties of the material above and below room temperature.
In this present work glycine-to-metal molar ratio has been optimized to get the sin-
gle phase BFO. Further, detailed magnetic measurements have been carried out to get
information on the possible cause of the high value of room temperature saturation mag-
netization of 0.25 (µB/Fe) observed in the present work [43].
6.6.1 Synthesis
BiFeO3 was synthesized by the glycine-nitrate auto-combustion method. The starting
materials for the synthesis were the metal nitrates Bi(NO3)3.5H2O, Fe(NO3)3.9H2O and
glycine, C6H5NH2, as fuel. Stoichiometric amounts of Bi(NO3)3.5H2O and Fe(NO3)3.9H2O
were dissolved in distilled water. The water solutions of the metal nitrates and glycine were
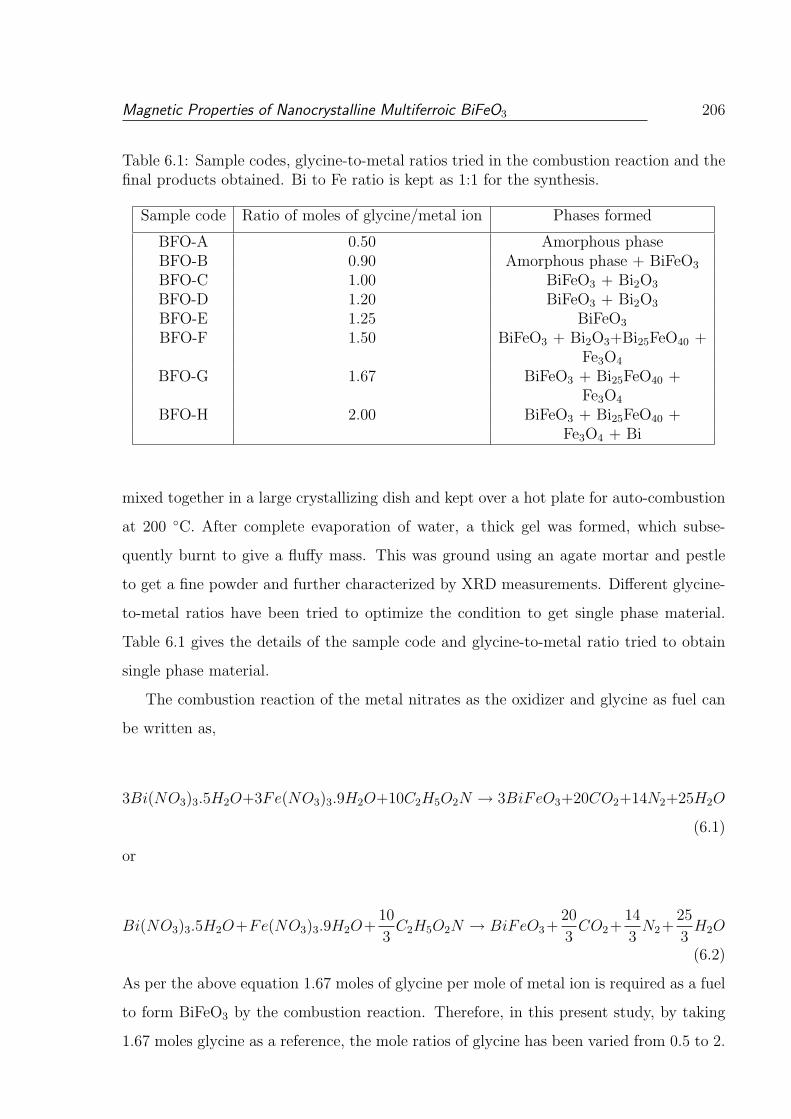
Magnetic Properties of Nanocrystalline Multiferroic BiFeO3 206
Table 6.1: Sample codes, glycine-to-metal ratios tried in the combustion reaction and thefinal products obtained. Bi to Fe ratio is kept as 1:1 for the synthesis.
Sample code Ratio of moles of glycine/metal ion Phases formed
BFO-A 0.50 Amorphous phaseBFO-B 0.90 Amorphous phase + BiFeO3
BFO-C 1.00 BiFeO3 + Bi2O3
BFO-D 1.20 BiFeO3 + Bi2O3
BFO-E 1.25 BiFeO3
BFO-F 1.50 BiFeO3 + Bi2O3+Bi25FeO40 +Fe3O4
BFO-G 1.67 BiFeO3 + Bi25FeO40 +Fe3O4
BFO-H 2.00 BiFeO3 + Bi25FeO40 +Fe3O4 + Bi
mixed together in a large crystallizing dish and kept over a hot plate for auto-combustion
at 200 C. After complete evaporation of water, a thick gel was formed, which subse-
quently burnt to give a fluffy mass. This was ground using an agate mortar and pestle
to get a fine powder and further characterized by XRD measurements. Different glycine-
to-metal ratios have been tried to optimize the condition to get single phase material.
Table 6.1 gives the details of the sample code and glycine-to-metal ratio tried to obtain
single phase material.
The combustion reaction of the metal nitrates as the oxidizer and glycine as fuel can
be written as,
3Bi(NO3)3.5H2O+3Fe(NO3)3.9H2O+10C2H5O2N → 3BiFeO3+20CO2+14N2+25H2O
(6.1)
or
Bi(NO3)3.5H2O+Fe(NO3)3.9H2O+10
3C2H5O2N → BiFeO3+
20
3CO2+
14
3N2+
25
3H2O
(6.2)
As per the above equation 1.67 moles of glycine per mole of metal ion is required as a fuel
to form BiFeO3 by the combustion reaction. Therefore, in this present study, by taking
1.67 moles glycine as a reference, the mole ratios of glycine has been varied from 0.5 to 2.
Magnetic Properties of Nanocrystalline Multiferroic BiFeO3 207
6.6.2 Characterization
Figure 6.21 shows the powder XRD patterns of the as-prepared samples by varying the
glycine-to-metal molar ratio. From the figure it is clear that when the glycine-to-metal
ratio is very low (0.50) the material formed is highly amorphous (BFO-A). This is because,
sufficient fuel is not available for the combustion reaction and the temperature is very
low. When the ratio is increased to 0.90 (BFO-B), weak reflections due to BiFeO3 are
observed, apart from an amorphous phase. Further increase in the ratio to 1.00 (BFO-C)
shows improvement in the crystallinity of the BiFeO3 phase, with the formation of Bi2O3
(JCPDS # 74–2008) as an impurity phase. The intensity of the peak due to this impurity
phase is decreased with increasing the amount of glycine further to 1.20 (BFO-D) and
when the ratio is 1.25, single phase BiFeO3 is formed (BFO-E). As the glycine to metal
ratio is increased further, including the stoichiometric ratio of 1.67 for the combustion
reaction (obtained from the equation), other impurity phases such as Fe3O4 (JCPDS #
19–0629), Bi (JCPDS # 01–0688), Bi25FeO40 (JCPDS # 46–0416), etc., are formed apart
from BiFeO3.
All the observed peaks of BFO-E correspond to BiFeO3 as evidenced from a com-
parison of the experimental and simulated patterns. The XRD pattern is indexed on
the reported rhombohedral structure of the compound (space group R3c) with lattice
parameters value of a = 5.586 A, and c = 13.863 A [34,35]. All the reflections in the ex-
perimental patterns are some what broad indicating nanocrystalline nature of the sample.
The average crystallite size is calculated as 26 nm from the full width at half maximum
of the (024) peak, using the Scherrer formula, D = 0.9λ/βcosθ.
Figure 6.22 shows the TEM image of BFO-E, indicating the morphological features of
the sample. The image shows flaky type particles forming clusters. Similar morphological
features have been reported for different types of oxides synthesized by the glycine nitrate
combustion process [94,95]. Since the combustion reaction is very rapid, it is very difficult
to control the morphology in case of the auto-combustion method. The selected area
electron diffraction (SAED) pattern shown in Figure 6.22 indicates that the material is
polycrystalline in nature.
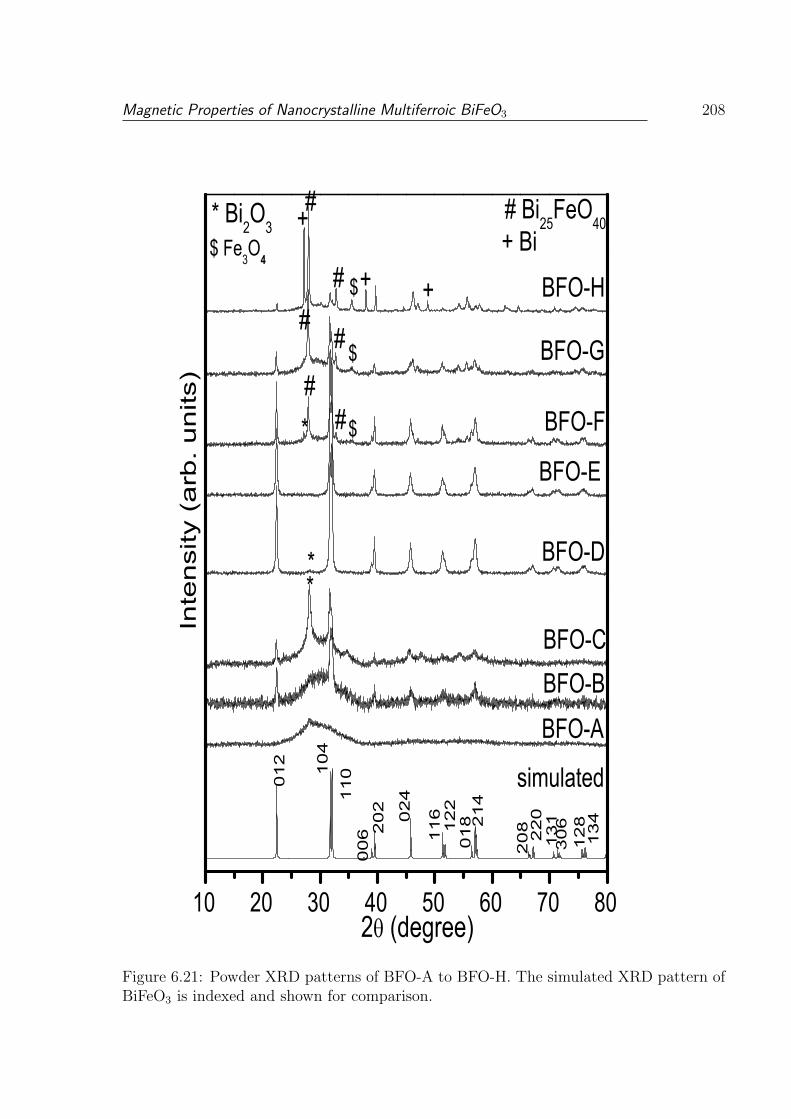
Magnetic Properties of Nanocrystalline Multiferroic BiFeO3 208
10 20 30 40 50 60 70 80
simulated
*#
#
#+$ Fe3O4
#
$
$
$
#
+ Bi# Bi25FeO40* Bi2O3
++#
**
BFO-H
BFO-G
BFO-F
BFO-E
BFO-D
BFO-CBFO-B
BFO-A
13
41
28
30
61
31
22
02
082
14
01
812
21
1602
4
20
20
06
11
010
4
01
2
Inte
nsi
ty (
arb
. u
nits
)
2 (degree)Figure 6.21: Powder XRD patterns of BFO-A to BFO-H. The simulated XRD pattern ofBiFeO3 is indexed and shown for comparison.
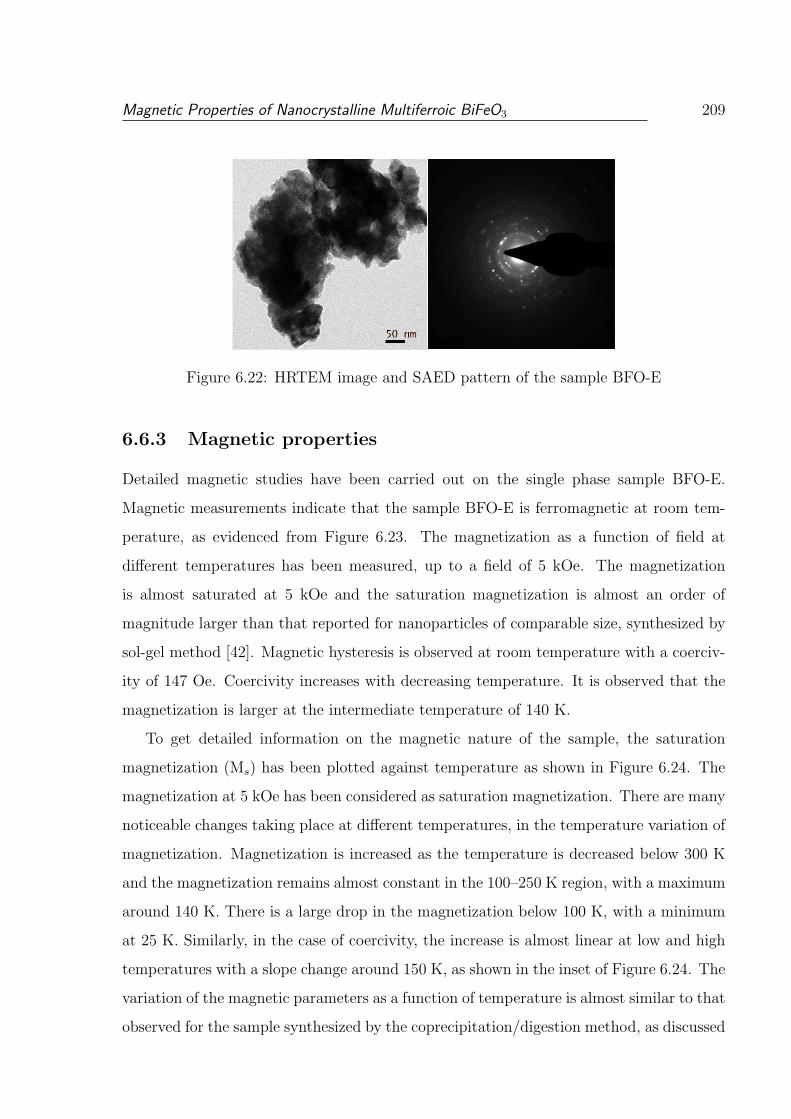
Magnetic Properties of Nanocrystalline Multiferroic BiFeO3 209
Figure 6.22: HRTEM image and SAED pattern of the sample BFO-E
6.6.3 Magnetic properties
Detailed magnetic studies have been carried out on the single phase sample BFO-E.
Magnetic measurements indicate that the sample BFO-E is ferromagnetic at room tem-
perature, as evidenced from Figure 6.23. The magnetization as a function of field at
different temperatures has been measured, up to a field of 5 kOe. The magnetization
is almost saturated at 5 kOe and the saturation magnetization is almost an order of
magnitude larger than that reported for nanoparticles of comparable size, synthesized by
sol-gel method [42]. Magnetic hysteresis is observed at room temperature with a coerciv-
ity of 147 Oe. Coercivity increases with decreasing temperature. It is observed that the
magnetization is larger at the intermediate temperature of 140 K.
To get detailed information on the magnetic nature of the sample, the saturation
magnetization (Ms) has been plotted against temperature as shown in Figure 6.24. The
magnetization at 5 kOe has been considered as saturation magnetization. There are many
noticeable changes taking place at different temperatures, in the temperature variation of
magnetization. Magnetization is increased as the temperature is decreased below 300 K
and the magnetization remains almost constant in the 100–250 K region, with a maximum
around 140 K. There is a large drop in the magnetization below 100 K, with a minimum
at 25 K. Similarly, in the case of coercivity, the increase is almost linear at low and high
temperatures with a slope change around 150 K, as shown in the inset of Figure 6.24. The
variation of the magnetic parameters as a function of temperature is almost similar to that
observed for the sample synthesized by the coprecipitation/digestion method, as discussed
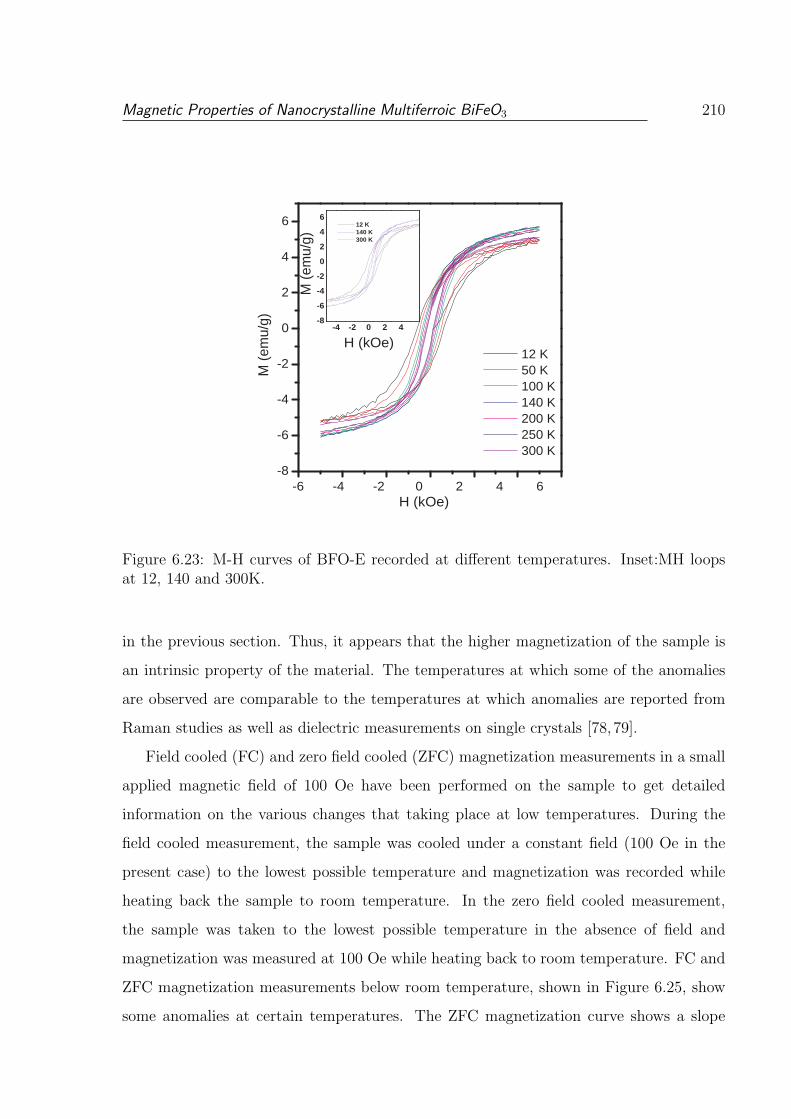
Magnetic Properties of Nanocrystalline Multiferroic BiFeO3 210
-6 -4 -2 0 2 4 6 -8
-6
-4
-2
0
2
4
6
M (
emu/
g)
H (kOe)
M (
emu/
g)
H (kOe)
12 K 50 K 100 K 140 K 200 K 250 K 300 K
-4 -2 0 2 4 -8
-6
-4
-2
0
2
4
6
12 K 140 K 300 K
Figure 6.23: M-H curves of BFO-E recorded at different temperatures. Inset:MH loopsat 12, 140 and 300K.
in the previous section. Thus, it appears that the higher magnetization of the sample is
an intrinsic property of the material. The temperatures at which some of the anomalies
are observed are comparable to the temperatures at which anomalies are reported from
Raman studies as well as dielectric measurements on single crystals [78,79].
Field cooled (FC) and zero field cooled (ZFC) magnetization measurements in a small
applied magnetic field of 100 Oe have been performed on the sample to get detailed
information on the various changes that taking place at low temperatures. During the
field cooled measurement, the sample was cooled under a constant field (100 Oe in the
present case) to the lowest possible temperature and magnetization was recorded while
heating back the sample to room temperature. In the zero field cooled measurement,
the sample was taken to the lowest possible temperature in the absence of field and
magnetization was measured at 100 Oe while heating back to room temperature. FC and
ZFC magnetization measurements below room temperature, shown in Figure 6.25, show
some anomalies at certain temperatures. The ZFC magnetization curve shows a slope
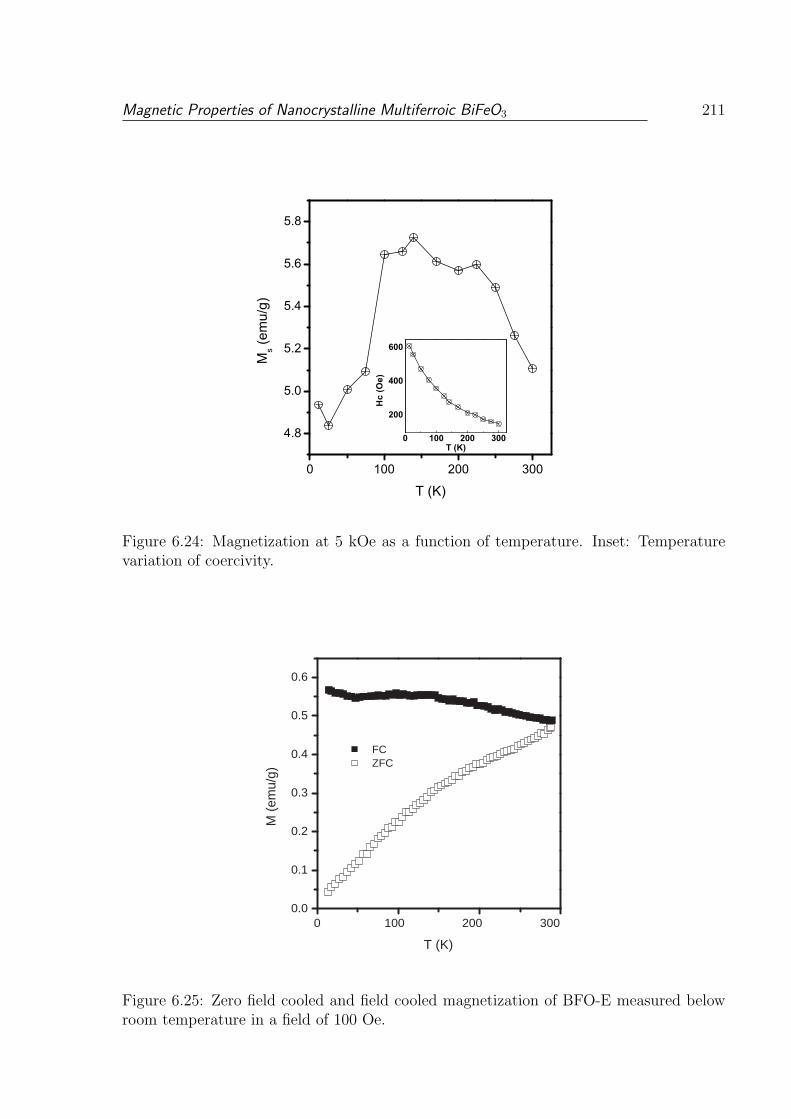
Magnetic Properties of Nanocrystalline Multiferroic BiFeO3 211
0 100 200 300
4.8
5.0
5.2
5.4
5.6
5.8
0 100 200 300
200
400
600
Ms (
emu/
g)
T (K)
Hc
(Oe)
T (K)
Figure 6.24: Magnetization at 5 kOe as a function of temperature. Inset: Temperaturevariation of coercivity.
0 100 200 300 0.0
0.1
0.2
0.3
0.4
0.5
0.6
M (
emu/
g)
T (K)
FC ZFC
Figure 6.25: Zero field cooled and field cooled magnetization of BFO-E measured belowroom temperature in a field of 100 Oe.
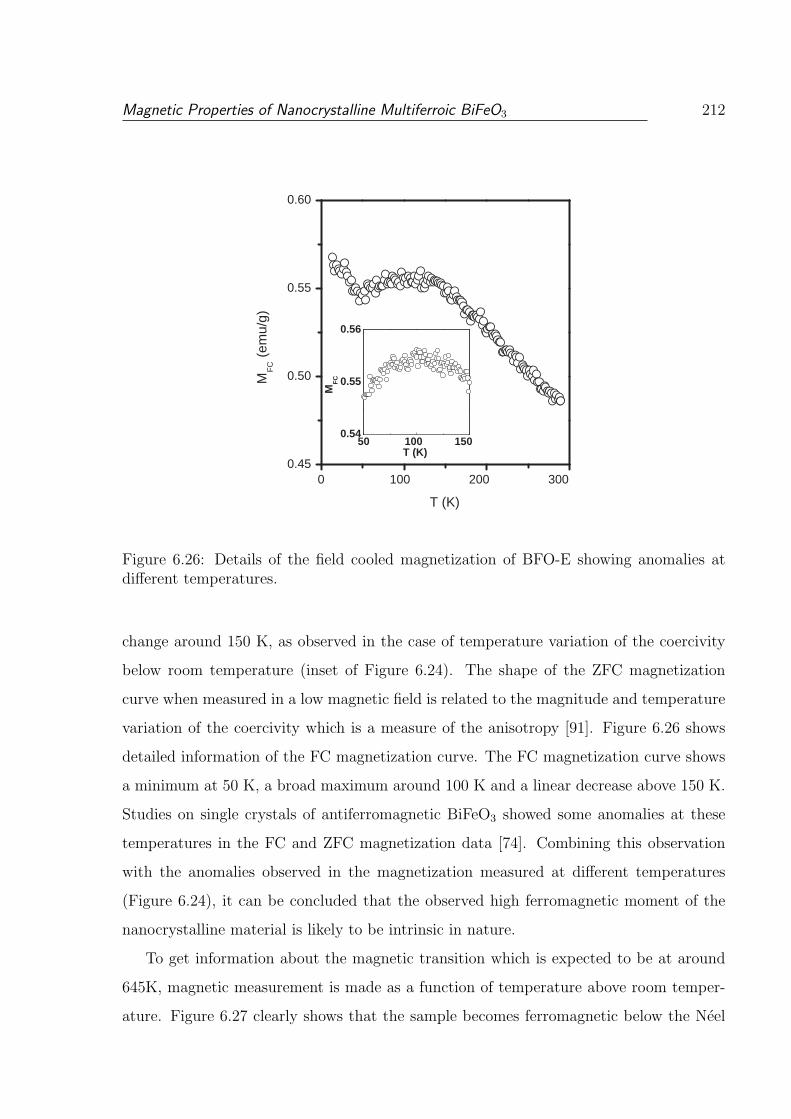
Magnetic Properties of Nanocrystalline Multiferroic BiFeO3 212
0 100 200 300 0.45
0.50
0.55
0.60
50 100 150 0.54
0.55
0.56
M F
C (
emu/
g)
T (K)
M F
C
T (K)
Figure 6.26: Details of the field cooled magnetization of BFO-E showing anomalies atdifferent temperatures.
change around 150 K, as observed in the case of temperature variation of the coercivity
below room temperature (inset of Figure 6.24). The shape of the ZFC magnetization
curve when measured in a low magnetic field is related to the magnitude and temperature
variation of the coercivity which is a measure of the anisotropy [91]. Figure 6.26 shows
detailed information of the FC magnetization curve. The FC magnetization curve shows
a minimum at 50 K, a broad maximum around 100 K and a linear decrease above 150 K.
Studies on single crystals of antiferromagnetic BiFeO3 showed some anomalies at these
temperatures in the FC and ZFC magnetization data [74]. Combining this observation
with the anomalies observed in the magnetization measured at different temperatures
(Figure 6.24), it can be concluded that the observed high ferromagnetic moment of the
nanocrystalline material is likely to be intrinsic in nature.
To get information about the magnetic transition which is expected to be at around
645K, magnetic measurement is made as a function of temperature above room temper-
ature. Figure 6.27 clearly shows that the sample becomes ferromagnetic below the Neel
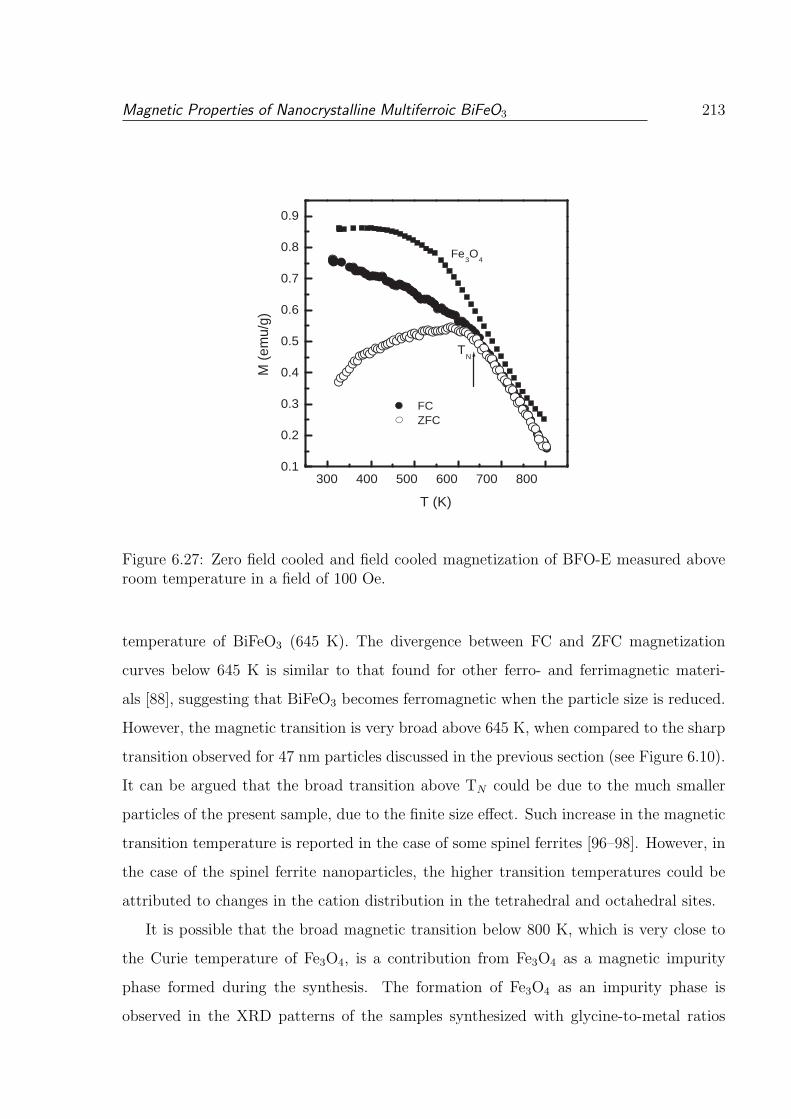
Magnetic Properties of Nanocrystalline Multiferroic BiFeO3 213
300 400 500 600 700 800 0.1
0.2
0.3
0.4
0.5
0.6
0.7
0.8
0.9
Fe 3 O
4
T N
M (
emu/
g)
T (K)
FC ZFC
Figure 6.27: Zero field cooled and field cooled magnetization of BFO-E measured aboveroom temperature in a field of 100 Oe.
temperature of BiFeO3 (645 K). The divergence between FC and ZFC magnetization
curves below 645 K is similar to that found for other ferro- and ferrimagnetic materi-
als [88], suggesting that BiFeO3 becomes ferromagnetic when the particle size is reduced.
However, the magnetic transition is very broad above 645 K, when compared to the sharp
transition observed for 47 nm particles discussed in the previous section (see Figure 6.10).
It can be argued that the broad transition above TN could be due to the much smaller
particles of the present sample, due to the finite size effect. Such increase in the magnetic
transition temperature is reported in the case of some spinel ferrites [96–98]. However, in
the case of the spinel ferrite nanoparticles, the higher transition temperatures could be
attributed to changes in the cation distribution in the tetrahedral and octahedral sites.
It is possible that the broad magnetic transition below 800 K, which is very close to
the Curie temperature of Fe3O4, is a contribution from Fe3O4 as a magnetic impurity
phase formed during the synthesis. The formation of Fe3O4 as an impurity phase is
observed in the XRD patterns of the samples synthesized with glycine-to-metal ratios
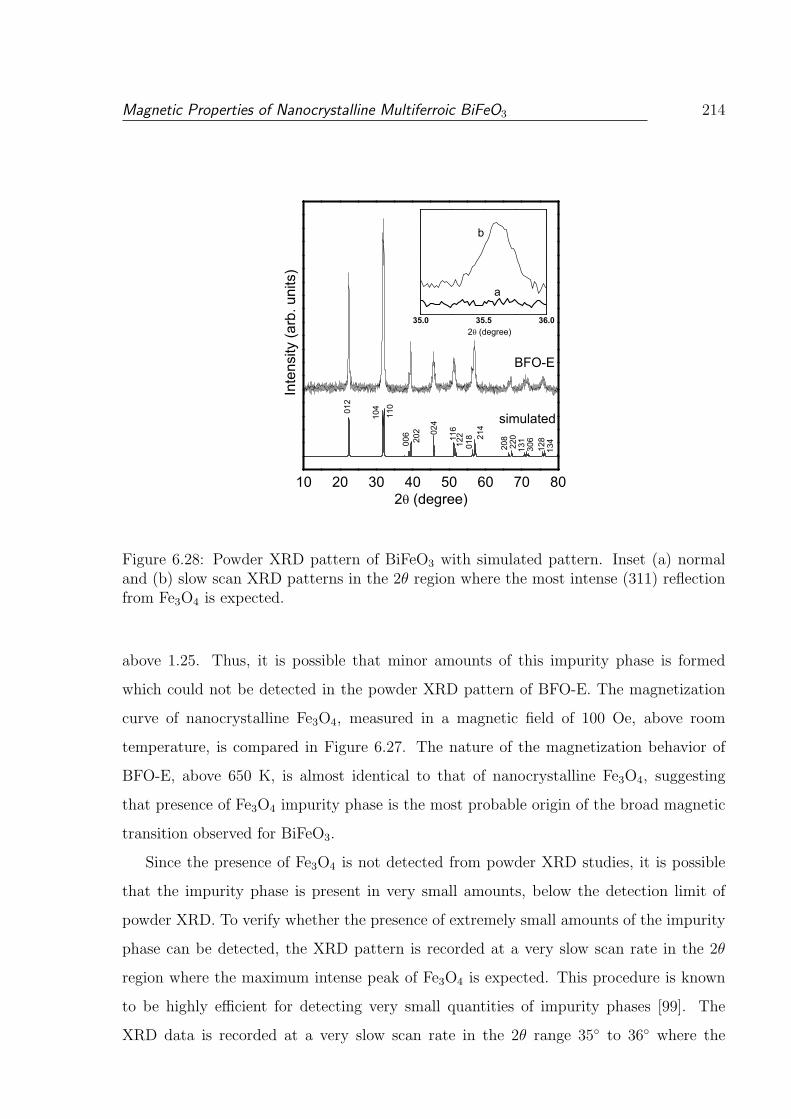
Magnetic Properties of Nanocrystalline Multiferroic BiFeO3 214
10 20 30 40 50 60 70 80
35.0 35.5 36.0
BFO-E
simulated
134
128
306
131
220
20821
401
812
211602
4
202
006
012
110
104
Inte
nsity
(arb
. uni
ts)
2 (degree)
b
a
2 (degree)
Figure 6.28: Powder XRD pattern of BiFeO3 with simulated pattern. Inset (a) normaland (b) slow scan XRD patterns in the 2θ region where the most intense (311) reflectionfrom Fe3O4 is expected.
above 1.25. Thus, it is possible that minor amounts of this impurity phase is formed
which could not be detected in the powder XRD pattern of BFO-E. The magnetization
curve of nanocrystalline Fe3O4, measured in a magnetic field of 100 Oe, above room
temperature, is compared in Figure 6.27. The nature of the magnetization behavior of
BFO-E, above 650 K, is almost identical to that of nanocrystalline Fe3O4, suggesting
that presence of Fe3O4 impurity phase is the most probable origin of the broad magnetic
transition observed for BiFeO3.
Since the presence of Fe3O4 is not detected from powder XRD studies, it is possible
that the impurity phase is present in very small amounts, below the detection limit of
powder XRD. To verify whether the presence of extremely small amounts of the impurity
phase can be detected, the XRD pattern is recorded at a very slow scan rate in the 2θ
region where the maximum intense peak of Fe3O4 is expected. This procedure is known
to be highly efficient for detecting very small quantities of impurity phases [99]. The
XRD data is recorded at a very slow scan rate in the 2θ range 35 to 36 where the
Magnetic Properties of Nanocrystalline Multiferroic BiFeO3 215
(311) reflection of Fe3O4 is expected. In the Figure 6.28 it can be seen that a very weak
reflection is observed at 2θ =35.6 corresponding to the d-spacing of 2.53A, comparable
to d311 of Fe3O4 (JCPDS # 19–0629). This confirms that Fe3O4 is present as an impurity
phase, in very small amounts, in the ferromagnetic sample. This undetected impurity
phase could be responsible for the higher magnetic moment of the sample synthesized by
the auto-combustion method, reported in the literature [60].
6.6.4 Conclusions
Almost single phase nanocrystalline multiferroic BiFeO3 is synthesized by the glycine-
nitrate auotcombustion method by optimizing the synthesis conditions. Unexpectedly
high magnetic moment is observed at room temperature for the sample synthesized by
the auto-combustion method. The possible effect of the synthetic methodology influencing
the magnetic properties of the BiFeO3 system has been explained from detailed structural
and magnetic characterization. Very large saturation magnetization is obtained at room
temperature for nanoparticles of size ∼25 nm. A broad magnetic transition above the
Neel temperature (TN) of BiFeO3, which is extended up to 800 K, suggests the presence of
Fe3O4 as a possible magnetic impurity phase responsible for the high magnetic moment at
room temperature. Normal XRD analysis failed to detect small amounts of any impurity
phase. However, detailed XRD studies showed the presence of very small amounts of Fe3O4
impurity phase, as evidenced from magnetic measurements. Thus, the present studies,
in general, give information on the importance of the detailed material characterization
studies required before coming to any final conclusions on the unusual properties observed
for functional nanomaterials.
References
[1] J.B. Goodenough, J.M. Longo, Crystallographic and magnetic properties of per-
ovskite and perovskite-related compounds, Landbolt-Bornstein, New Series, vol.
III.4(a), Springer, Berlin, 1970, p. 126.
[2] T. Mitsui, S. Nomura, A.M. Hellinege, K.H. Hellwege, Ferroelectrics and related
substances, Landolt-Bornstein, New Series, vol. 16(a),Springer, Berlin, 1981.
[3] A. Filippetti, N.A. Hill, Phys. Rev. B. 65 (2002) 195120.
[4] K.F. Wang , J.-M. Liu, Z.F. Ren, Adv. Phys. 58 (2009) 321.
[5] M. Fiebig, J. Phys. D: Appl. Phys. 38 (2005) R123.
[6] H. Schmid, Ferroelectrics 162 (1994) 317.
[7] W. Eerenstein, N.D. Mathur, J.F. Scott, Nature 442 (2006) 759.
[8] A. Filippetti, N.A. Hill, J. Magn. Magn. Mater. 236 (2001) 176.
[9] R. Seshadri, N.A. Hill, Chem. Mater. 13 (2001) 2892.
[10] A.M. dos Santos, S. Parashar, A.R. Raju, Y.S. Zhao, A.K. Cheetham, C.N.R.
Rao, Solid State Commun. 122 (2002) 49.
[11] S. Sagar, P.A. Joy, M.R. Anantharaman, Ferroelectrics 392 (2009) 13.
[12] W. Prellier, M.P. Singh, P. Murugavel, J. Phys.: Condens. Matter. 17 (2005)
R803.
[13] S.M. Selbach, T. Tybell, M.A. Einarsrud, T. Grande, Adv. Mater. 20 (2008)
3692.
References 217
[14] G.A. Smolenski, I.E. Chupis, Sov. Phys. Uspekhi. 25 (1982) 475.
[15] I. Sosnowska, T.P. Neumaier, E. Steichele, J. Phys. C: Solid State 15 (1982)
4835.
[16] N.A. Hill, J. Phys. Chem. B 104 (2000) 6694.
[17] J. Van Suchtelen, Philips Res. Rep. 27 (1972) 28.
[18] G. Srinivasan, E.T. Rasmussen, B.J. Levin, R. Hayes, Phys. Rev. B 65 (2002)
134402.
[19] S. Dong, J. Zhai, J.F. Li, D. Viehland, Appl. Phys. Lett. 88 (2006) 082907
[20] H. Zheng, J. Wang, S.E. Lofland, Z. Ma, L. Mohaddes-Ardabili, T. Zhao, L.
Salamanca-Riba, S.R. Shinde, S.B. Ogale, F. Bai, Science 303 (2004) 661
[21] L. Yan, Y. Yang, Z. Wang, Z. Xing, J. Li,D. Viehland, J. Mater. Sci. 44 (2009)
5080.
[22] I. Levin, J. Li, J. Slutsker, A.L. Roytburd, Adv. Mater. 18 (2006) 2044.
[23] J. Li, I. Levin, J. Slutsker, V. Provenzano, P.K. Schenck, R. Ramesh, J. Ouyang,
A.L. Roytburd, Appl. Phys. Lett. 87 (2005) 072909.
[24] F. Zavaliche, H. Zheng, L. Mohaddes-Ardabili, S.Y. Yang, Q. Zhan, P. Shafer,
E. Reilly, R. Chopdekar, Y. Jia, P. Wright, Nano Lett. 5 (2005) 1793
[25] C. Deng, Y. Zhang, J. Ma, Y. Lin, C.W. Nan, J. Appl. Phys. 102 (2007) 074114.
[26] Y. Zhang, Z. Li, C. Deng, J. Ma, Y. Lin, C.W. Nan, Appl. Phys. Lett. 92 (2008)
152510
[27] A. Run, D.R. Terrell, J.H. Scholing, J. Mater. Sci. 9 (1974) 1710
[28] G. Harshe, J.P. Dougherty, R.E. Newnham, Int. J. Appl. Electromagn. Mater.
4 (1993) 145
[29] M.I. Bichurin, I.A. Kornev, V.M. Petrov, I.V. Lisnevskaya, Ferroelectrics 204
(1997) 289
References 218
[30] M.I. Bichurin, V.M. Petrov, Ferroelectrics. 162 (1994) 33
[31] Y.K. Fetisov, G. Srinivasan, Electron. Lett. 41 (2005) 1066
[32] S.X. Dong, J.G. Bai, J.Y. Zhai, J.F. Li, G.Q. Lu, D. Viehland, S.J. Zhang, T.R.
Shrout, Appl. Phys. Lett. 86 (2005) 182506
[33] Y.H. Chu, L.W. Martin, M.B. Holcomb, R. Ramesh, Mater. Today 10 (2007)
16.
[34] C. Michel, J.M. Moreau, G.D. Achenbach, R. Gerson, W.J. James, Solid State
Commun. 7 (1969) 701.
[35] J.D. Bucci, B.K. Robertson, W.J. James, J. Appl. Crystallogr. 5 (1972) 187.
[36] P. Fischer, M. Polomska, I. Sosnowska, M. Szymanski, J. Phys. C: Solid State
13 (1980) 1931.
[37] F. Kubel, H. Schmid, Acta Crystallogr. B 46 (1990) 698.
[38] J. Teague, Solid State Commun. 8 (1970) 1073.
[39] R. Przenioslo, A. Palewicz, M. Regulski, I. Sosnowska, R. M. Ibberson, and K.
S. Knight, J. Phys.: Condens. Matter 18 (2006) 2069.
[40] A. Palewicz, T. Szumiata, R. Przenioslo, I. Sosnowska, I. Margiolaki, Solid State
Commun. 140 (2006) 359.
[41] J. Wang, J.B. Neaton, H. Zheng, V. Nagarajan, S.B. Ogale, B. Liu, D. Viehland,
V. Vaithyanathan, D.G. Schlom, U.V. Waghmare, N.A. Spaldin, K.M. Rabe, M.
Wuttig, R. Ramesh, Science 299 (2003) 1719.
[42] T.J. Park, G.C. Papaefthymiou, A.J. Viescas, A.R. Moodenbaugh, S.S. Wong,
Nano Lett. 7 (2007) 766.
[43] S. Vijayanand, H.S. Potdar, P.A. Joy, Appl. Phys. Lett. 94 (2009) 182507.
[44] A. Maitre, M. Francois, J. Gachon, J. Phase Equilib. 25 (2004) 59.
[45] H. Koizumi, N. Niizeki, T. Ikeda, Jpn. J. Appl. Phys. 3 (1964) 495.
References 219
[46] M.Mahesh Kumar, V.R. Palkar, K. Srinivas, S.V. Suryanarayana, Appl. Phys.
Lett. 76 (2000) 2764.
[47] G.D. Achenbach, W.J. James, R. Gerson, J. Am. Ceram. Soc. 50 (1967) 437.
[48] Y.P. Wang, L. Zhou, M.F. Zhang, X.Y. Chen, J.M. Liu, Z.G. Liu, Appl. Phys.
Lett. 84 (2004) 1731.
[49] G.L. Yuan, S.W. Or, Y.P. Wang, Z.G. Liu, J.M. Liu, Solid State Commun. 138
(2006) 76.
[50] S.M. Selbach, M.A. Einarsrud, T. Tybell, T. Grande, J. Am. Ceram. Soc. 90
(2007) 3430.
[51] S. Ghosh, S. Dasgupta, A. Sen, H.S. Maiti, J. Am. Ceram. Soc. 88 (2005) 1349.
[52] S.W. Lee, C.S. Kim, J. Magn. Magn. Mater. 304 (2006) e772.
[53] M. Kumar, K.L. Yadav, G.D. Varma, Mater. Lett. 62 (2008) 1159.
[54] J.K. Kim, S.S. Kim, W.J. Kim, Mater. Lett. 59 (2005) 4006.
[55] S. Shetty, V.R. Palkar, R. Pinto, Pramana 58 (2002) 1027.
[56] C. Chen, J. Cheng, S. Yu, L. Che, Z. Meng, J. Crys. Growth 291 (2006) 135.
[57] J.T. Han, Y.H. Huang, X.J. Wu, C.L. Wu, W. Wei, B. Peng, W. Huang, J.B.
Goodenough, Adv. Mater. 18 (2006) 2145.
[58] M.P. Pechini, US Patent (1967) US3,330,697.
[59] N. Das, R. Majumdar, A. Sen, H.S. Maiti, Mater. Lett. 61 (2007) 2100.
[60] R. Mazumder, P.S. Devi, D. Bhattacharya, P. Choudhury, A. Sen, M. Raja,
Appl. Phys. Lett. 91 (2007) 062510.
[61] G. Catalan, J.F. Scott, Adv. Mater. 21 (2009) 2463.
[62] J. Wang, H. Zheng, Z. Ma, S. Prasertchoung, M. Wuttig, R. Droopad, J. Yu, K.
Eisenbeiser, R. Ramesh, Appl. Phys. Lett. 85 (2004) 2574.
References 220
[63] J. Li, J. Wang, M. Wuttig, R. Ramesh, N. Wang, B. Ruette, A.P. Pyatakov,
A.K. Zvezdin, D. Viehland, Appl. Phys. Lett. 84 (2004) 5261.
[64] R.R. Das, D.M. Kim, S.H. Baek, C.B. Eom, F. Zavaliche, S.Y. Yang, R. Ramesh,
Y.B. Chen, X.Q. Pan, X. Ke, Appl. Phys. Lett. 88 (2006) 242904.
[65] C. Ederer, N.A. Spaldin, Phys. Rev. B 71 (2005) 224103.
[66] J.B. Neaton, C. Ederer, U.V. Waghmare, N.A. Spaldin, K.M. Rabe, Phys. Rev.
B 71 (2005) 014113.
[67] C. Ederer, N.A. Spaldin, Phys. Rev. Lett. 95 (2005) 257601.
[68] P.K. Siwach, H.K. Singh, J. Singh, O.N. Srivastava, Appl. Phys. Lett. 91 (2007)
122503.
[69] D. Lebeugle, D. Colson, A. Forget, M. Viret, P. Bonville, J.F. Marucco, S. Fusil,
Phys. Rev. B 76 (2007) 024116.
[70] R.P.S.M. Lobo, R.L. Moreira, D. Lebeugle, D. Colson, Phys. Rev. B 76 (2007)
172105.
[71] M. Cazayous, D. Malka, D. Lebeugle, D. Colson, Appl. Phys. Lett. 91 (2007)
071910.
[72] W. Eerenstein, F.D. Morrison, J. Dho, M.G. Blamire, J.F. Scott, N.D. Mathur,
Science 307 (2005) 1203a.
[73] H. Bea, M. Bibes, A. Barthelemy, K. Bouzehouane, E. Jacquet, A. Khodan, J.P.
Contour, S. Fusil, F. Wyczisk, A. Forget, Appl. Phys. Lett. 87 (2005) 072508.
[74] M.K. Singh, W. Prellier, M.P. Singh, R.S. Katiyar, J.F. Scott, Phys. Rev. B 77
(2008) 144403.
[75] M.K. Singh, R.S. Katiyar, W. Prellier, J.F. Scott, J. Phys.: Condens. Matter
21 (2009) 042202.
[76] M. Cazayous, Y. Gallais, A. Sacuto, R. De Sousa, D. Lebeugle, D. Colson, Phys.
Rev. Lett. 101 (2008) 037601.
References 221
[77] M.K. Singh, R.S. Katiyar, J.F. Scott, J. Phys.: Condens. Matter 20 (2008)
252203.
[78] J.F. Scott, M.K. Singh, R.S. Katiyar, J. Phys.: Condens. Matter 20 (2008)
322203.
[79] S.A.T. Redfern, C. Wang, J.W. Hong, G. Catalan, J.F. Scott, J. Phys.: Condens.
Matter 20 (2008) 452205.
[80] J. Chen, X. Xing, A. Watson, W. Wang, R. Yu, J. Deng, L. Yan, C. Sun, X.
Chen, Chem. Mater. 19 (2007) 3598
[81] T.J. Park, Y. Mao, S.S. Wong, Chem. Commun. 2004 (2004) 2708
[82] J. Li, J. Wang, M. Wuttig, R. Ramesh, N. Wang, B. Ruette, A.P. Pyatakov,
A.K. Zvezdin, D. Viehland, Appl. Phys. Lett. 84 (2004) 5261
[83] K.Y. Yun, M. Noda, M. Okuyama, Appl. Phys. Lett. 83 (2003) 3981
[84] Y.H. Chu, Q. Zhan, L.W. Martin, M.P. Cruz, P.L. Yang, G.W. Pabst, F.
Zavaliche, S.Y. Yang, J.X. Zhang, L.Q. Chen, Adv. Mater. 18 (2006) 2307
[85] H.W. Jang, D. Ortiz, S.H. Baek, C.M. Folkman, R.R. Das, P. Shafer, Y. Chen,
C.T. Nelson, X. Pan, R. Ramesh, Adv. Mater. 21 (2009) 817.
[86] Y. Yun, D. Ricinschi, T. Kanashima, M. Noda, M. Okuyama, Jpn. J. Appl.
Phys. 43 (2004) L647.
[87] S. Vijayanand, M.B. Mahajan, H.S. Potdar, P.A. Joy, Phys. Rev. B 80 (2009)
64423.
[88] P.A. Joy, S.K. Date, J. Magn. Magn. Mater. 222 (2000) 33.
[89] P.A. Joy, S.K. Date, J. Magn. Magn. Mater. 218, (2000) 229.
[90] C.R. Sankar, P.A. Joy, Phys. Rev. B72 (2005) 024405.
[91] P.A. Joy, S.K. Date, J. Magn. Magn. Mater. 220 (2000) 106.
References 222
[92] R. Palai, H. Huhtinen, R. S. Katiyar, J. F. Scott,
http://www.arXiv.org:0707.1657v1.
[93] C. Paraschiv, B. Jurca, A. Ianculescu, O. Carp, J. Therm. Anal. Cal. 94 (2008)
411.
[94] W. Morales, M. Cason, O. Aina, N.R. de Tacconi, K. Rajeshwar, J. Am. Chem.
Soc. 130 (2008) 6318.
[95] S. Deka, P.A. Joy, J. Nanosci. Nanotech. 8 (2008) 3955.
[96] V. Sreeja, S. Vijayanand, S. Deka, P.A. Joy, Hyperfine Interact. 183 (2008) 99.
[97] J.P. Chen, C.M. Sorensen, K.J. Klabunde, G.C. Hadjipanayis, E. Devlin, A.
Kostikas, Phys. Rev. B 54 (1996) 9288.
[98] N. Ponpandian, A. Narayanasamy, C.N. Chinnasamy,N. Sivakumar, J.M.
Greneche, K. Chattopadhyay, K. Shinoda, B. Jeyadevan, K. Tohji, Appl. Phys.
Lett. 86 (2005) 192510.
[99] J.A.T. Taylor, Am. Ceram. Soc. Bull. 74 (1995) 81.
Chapter 7
Conclusions
Nanostructured metal oxides with various morphologies such as nanoparticles, nanorods,
nanotubes, nanoplates, etc, are useful for various applications. It is important to make
nanostructures with well-defined and hierarchically arrangedmorphologies for most of the
applications such as in catalysis, sensors, Li-ion batteries, fuel cells, etc. In most of the
cases employed for the synthesis of nanomaterials with well-defined morphological fea-
tures, templates are used which limit the growth of the nanomaterials in some dimensions,
and the templates need to be removed after formation of the materials of interest. In this
respect, it is preferable to get control on the morphology without using any templates.
Many different wet chemical methods are available for the synthesis of nanostructured ox-
ide materials. Many of the physical properties of the nanostructured oxide materials are
known to be dependent on the method of synthesis and processing conditions. Also, the
properties and applications of the nanostructured oxides depend on the size, morphology,
surface area, porosity, etc. Therefore, still it is a challenge to optimize the synthesis and
processing conditions to get morphologically defined porous nanostructured oxides with
high surface area. The main objective of this work was to synthesize some spinel based
oxides in nanocrystalline form by the well-known coprecipitation method and to study
their properties.
The simple and facile coprecipitation method is modified to get a molecular precursor
with well-defined morphology, to synthesize cobalt based spinel Co3O4. Porous nanorods
of Co3O4, with the same morphology as that of the precursor, is obtained after calcination
in air. The optimized synthesis conditions improved the crystallinity of the molecular pre-
cursor, cobalt hydroxy carbonate. This also helped in the formation of porous nanorods
of Co3O4. The nanocrystalline porous Co3O4 is obtained with high surface area and the
Conclusions 224
material is found to be a promising material for selective CO gas sensing. The porous
nanorods exhibited better performance as a CO sensor, at a moderate operating temper-
ature of 250 C, with fast recovery and response time. Similarly, the nanomaterial is also
found to be a good catalyst for oxidation reactions. In the case of oxidation of veratryl
alcohol to veratryl aldehyde, the nanorods showed a reasonable conversion and selectivity.
The porous Co3O4 nanorods are found to be a good anode material for Li-ion battery.
A capacity of 1155 mAhg−1 is obtained during initial cycles, which reduced to 820 mAhg−1
after few cycles. This value is found to be higher than that reported for non-porous
nanorods of Co3O4. Excellent durability is observed for 25 cycles and beyond, with out
any obvious signs of further capacity loss or performance degradation. The mechanism
of charge-discharge process is studied using solid state NMR, powder XRD and magnetic
measurements. These studies, after charge and discharge, proved the stability of the
material and formation of Co nanodomains. The porous nanostructured Co3O4 is found
to exhibit a considerably high value of capacitance indicating the applicability of porous
nanorods of Co3O4 as a suitable material for supercapacitor applications.
To study the role of Co2+ in Co3O4, nanostructured ZnCo2O4 spinel was synthe-
sized under identical conditions. The nanocrystalline material obtained through a mixed
molecular precursor is found to be a good sensor for LPG gas. The overall LPG sens-
ing performance of the nanostructured ZnCo2O4 is better than that reported for most of
the oxide semiconductor based sensors already developed. Thus the studies showed that
nanocrystalline Co3O4 which is a good sensor for CO gas with better selectivity can be
modified to selectively detect LPG gas by replacing Co2+ with Zn2+.
Thus, the present studies indicated that there is lot of scope in the future for the
improvement of the performance of the cobalt based spinel oxides in various applica-
tions. The present method of synthesis, without using any templates, is a convenient,
cost effective and faster method for developing morphology controlled nanostructures by
suitably modifying the synthesis and processing conditions. The method is also found to
be highly reproducible and scalable for large scale production. It is expected that much
higher surface areas can be achieved by modifying the synthesis conditions. Similarly, the
performance in various applications can be possibly improved by controlling the porosity,
surface area and morphology. Also, the properties and applications can be modified and
Conclusions 225
controlled by proper substitution of Co2+ and Co3+ in Co3O4 by other transition metal
ions. The present studies suggest further scope for future work to suitably modify the
materials for a wide range of energy saving and environmental applications.
The same synthetic protocol as used for the synthesis of cobalt based spinels has been
extended to Fe based spinels of the general formula AFe2O4, where A = Fe, Zn, and Co.
However, when Co3+ in ACo2O4 is replaced by Fe3+, nanoparticles are obtained instead of
nanorods, indicating the role of the constituent ions in determining the morphology of the
final product. The oxides Fe3O4 and ZnFe2O4 are obtained directly on precipitation. On
the other hand, in the case of cobalt ferrite, a homogeneously mixed active precursor has
been formed by optimizing the synthesis conditions which on calcination gave the spinel
oxide. Fe3O4 with cation deficiency is obtained by the present method of synthesis and the
Fe:O ratio or the cation deficiency could be controlled by varying the digestion time. In
all the cases, the crystallinity is improved by digesting the precipitate at a mild condition
of 70o C. Further, as the spinel type ferrites are magnetic, the magnetic properties have
been studied and used as a tool to get detailed information on the characteristics of the
nanostructures. To get insight and information on the dependence of synthesis conditions
on the magnetic properties, the mixed ferrites have also been synthesized through an auto-
combustion method. The magnetic properties are correlated with the effect of synthesis
conditions. The present method of synthesis by coprecipitation followed by digestion at
70 C suggests that the particle size, morphology and hence the properties of the spinel
ferrite nanoparticles can be controlled by varying a single parameter, ie. the digestion
time. The method may be suitable for the synthesis of surfactant coated and other
core-shell type magnetic oxide nanoparticles for various applications, suggesting scope for
further research.
The important single phase multiferroic system, BiFeO3, has attracted attention in
the recent times because of its applications. The bulk antiferromagnetic material can
be made ferromagnetic by decreasing the particle size. As the coprecipitation/digestion
method is found to be a convenient method for the synthesis of nanoparticles of spinel
type oxides, the same procedure is extended for the synthesis of nanoparticles of the
multiferroic BiFeO3 (bismuth ortho-ferrite). There are many contradictions reported in
the literature on the magnetic properties of nanocrystalline BiFeO3 synthesized by vari-
Conclusions 226
ous methods. Hence, nanoparticles of single phase BiFeO3 has been synthesized by the
coprecipitation/digestion method followed by calcination as well as by a self ignition auto-
combustion method. The magnetic properties of the nanocrystalline material synthesized
by the two different methods are compared to study the effect of synthesis conditions on
the magnetic properties.
BiFeO3 nanoparticles with average size of ∼50 nm is synthesized by a coprecipita-
tion/digestion method. It is found that the material becomes ferromagnetic below the
Neel temperature of the bulk material (∼645 K). For nanoparticles of BiFeO3, anomalous
magnetic characteristics are observed at temperature regions closer to that of the phase
transitions reported in the literature, from Raman spectroscopic studies, on bulk materials
and single crystals. These results suggest that the phase transitions are directly associated
with changes in the intrinsic magnetic nature of the BiFeO3, strongly coupled with the
lattice. It has been concluded that the anomalies observed at the specified temperatures
are likely to be some changes associated with the domain structure of the material at low
temperatures.
Single phase nanocrystalline multiferroic BiFeO3, as evidenced from powder XRD
studies, could be synthesized by the glycine-nitrate auto-combustion method by optimiz-
ing the synthesis conditions. Unexpectedly high magnetic moment is observed for the
nanocrystalline sample synthesized by the auto-combustion method. The possible effect
of the synthetic methodology influencing the magnetic properties of the BiFeO3 system
has been explained from detailed structural and magnetic characterization. Detailed XRD
studies and high temperature magnetic measurements indicated the presence of very small
amounts of Fe3O4 as a magnetic impurity phase responsible for the higher and unexpected
magnetic moment, which could not be detected from normal XRD studies. Thus, the
present studies indicated the importance of the detailed material characterization studies
required before coming to any final conclusions on the unusual properties observed for
functional nanomaterials.
List of Publications
1. “Nanostructured spinel ZnCo2O4 for the detection of LPG”: S. Vijayanand, P. A.
Joy and H. S. Potdar, D. Patil and P. Patil Sensors and Actuators B (Accepted for
publications).
2. “A simple chemical co-precipitation/calcination route for the synthesis of simu-
lated synroc-B and synroc-C powders” H.S. Potdar, S. Vijayanand, K. Khaja
Mohaideen, K.R. Patil, P.A. Joy, R. Raja Madhavan, K.V.G. Kutty, R.D. Am-
bashta, P.K. Wattal. Mater. Chem. Phys. 123 (2010) 695.
3. “Magnetic characteristics of nanocrystalline multiferroic BiFeO3 at low tempera-
tures”: S. Vijayanand, M. B. Mahajan, H. S. Potdar, and P. A. Joy. Phys. Rev.
B 80 (2009) 064423.
4. “Highly sensitive and fast responding CO sensor based on Co3O4 nanorods : D.
Patil, P. Patil, S. Vijayanand, P A. Joy and H. S. Potdar.Talanta 81 (2010) 37.
5. “Origin of high room temperature ferromagnetic moment of nanocrystalline multi-
ferroic BiFeO3: S. Vijayanand, H. S. Potdar, and P. A. Joy. App. Phys. Lett. 94
(2009) 182507.
6. “Ferromagnetic to spin glass cross over in (La,Tb)2/3Ca1/3MnO3” : C. Raj Sankar,
S. Vijayanand and P.A. Joy. Solid State Sci. 11 (2009) 714.
7. “Magnetic and Mssbauer spectroscopic studies of NiZn ferrite nanoparticles synthe-
sized by a combustion method”: V. Sreeja, S. Vijayanand, S. Deka, and P. A. Joy.
Hyperfine Interact. 183 (2008) 99.
8. “Highly active nanostructured Co3O4 catalyst with tunable selectivity for liquid
phase air oxidation of p-Cresol”: Vikas S. Kshirsagar, S. Vijayanand, H. S. Potdar,
P. A. Joy, K. R. Patil, and C. V. Rode. Chem. Lett. 37 (2008) 310.
9. “Photocatalytic decomposition of methylene nanocrystalline titania prepared by
different blue on methods”: V. Ramaswamy, N.B. Jagtap, S. Vijayanand, D.S.
Bhange, P.S. Awati. Mater. Res. Bull. 43 (2008) 1145.
List of Publications 228
10. “Direct comparison of the aging and memory effects of magnetic nanoclusters and
nanoparticles”: C. Raj Sankar, S. Vijayanand,, Seema Verma, P. A. Joy. Solid
State Commun. 141 (2007) 307.
11. “Investigation of oxygen reduction at platinum loaded poly (o-phenylenediamine)
electrode in acid medium”: P. Gajendran, S. Vijayanand, R. Saraswathi. J.
Electroanal. Chem. 601 (2007) 132.
Awards:
“Award of Senior Research Fellowship (SRF)” for 2007-2010, by Council of
Scientific and Industrial Research (CSIR), Govt. of India, New Delhi.