Synthesis and Characterization of PbS Quantum...
21
1 Synthesis and Characterization of PbS Quantum Dots Author: Supervisor: Abdelrazek Mousa Dr. Mahmmoud Sayed Submitted to the Department of Chemical Physics, Lund University, 2011 in Partial fulfillment of the Requirements for the Degree of Master of Science in Chemistry
Transcript of Synthesis and Characterization of PbS Quantum...
1
Synthesis and Characterization of PbS Quantum Dots
Author: Supervisor:
Abdelrazek Mousa Dr. Mahmmoud Sayed
Submitted to the Department of Chemical Physics, Lund University, 2011 in
Partial fulfillment of the Requirements for the Degree of Master of Science in
Chemistry
2
Abstract
Colloidal semiconductor nanocrystals or quantum dots (QDs) have recently
attracted much attention because of their unique electronic and optical properties
and potential for a wide range of applications. Near-infrared (NIR) PbS QDs were
synthesized using oleic acid (OA) as a surfactant for stabilizing the nanocrystals.
PbS QD’s of different diameters were obtained by varying the injection
temperature from 90-120 o
C. The absorption and fluorescence measurements were
recorded and the fluorescence quantum yield relative to IR-125 dye has been
measured.
3
Table of contents
Abstract 2
List of Symbols 4
List of Figures 5
Introduction 6
Quantum dots …………………………………………………………………. 6
Quantum confinement …………………………………………………………. 6
Fluorescence ……………………………………………………………………. 7
Quantum dots synthesis …………………………………………………………. 8
Lead sulfide (PbS) quantum dots ……………………………………………….. 8
Experimental section and Results 10
Materials ……………………………………………………………………… 10
Synthesis of PbS quantum dots capped by oleic acid ………………………… 10
Characterization of PbS quantum dots ………………………………………… 10
Results and discussion 11
Calculation the size of PbS quantum dots 14
Determination the fluorescence quantum yield 14
Fluorescence quantum yield ………………………………………………….. 14
Determination the quantum yield of PbS quantum dots……………………… 15
Conclusion 18
Acknowledgement 19
References 20
4
List of symbols
Exciton Bohr radius…………………………………………………... 6
Dielectric constant of the material …………………………………….. 6
Rest mass of the electron……………………………………………….. 6
Mass of the particle (an electron or hole)………………………………. 6
Bohr radius of the hydrogen atom……………………………………... 6
Band gap energy……………………………………………………….. 14
The quantum yield for the PbS quantum dots…………………………. 16
The quantum yield for the standard dye (IR-125)…………………….. 16
The area under the emission spectrum of the standard dye (IR-125)….. 16
The area under the emission spectrum of the PbS quantum dots………. 16
The refractive index of Toluene…………………………………………. 16
The refractive index of Dimethyl sulfoxide (DMSO)………………….. 16
5
List of figures
Figure Page
1 Energy levels diagram for bulk semiconductor and quantum dot………. 7
2 Electronic transition for quantum dots …………………………………. 7
3 The experimental setup for synthesis of PbS quantum dots……………. 9
4 Absorption spectrum of PbS QDs in octadecene ……………………….. 11
5 Absorption spectrum of PbS QDs in toluene (after purification) ………. 11
6 Absorption and emission spectrum of PbS QDs in toluene at 90 oC ……. 12
7 Absorption and emission spectrum of PbS QDs in toluene at 100 oC …… 12
8 Absorption and emission spectrum of PbS QDs in toluene at 110 oC ……. 13
9 Normalized fluorescence spectrum of PbS QDs in toluene ………………. 13
10 TEM images of the synthesized PbS QDs…………………………………. 14
11 EDX spectra of the synthesized PbS QDs………………………………….. 14
12 Absorption and fluorescence spectra for PbS QDs and IR-125 dye ………. 15
6
Introduction
Quantum dots
Quantum dots (QDs) are semiconductors nanocrystals composed of II-VI, III-V or
IV-VI group elements; also known as zero-dimensional nanocrystals since the
electrons and holes within are confined in all three dimensions and with sizes
typically in the range 1-10 nm in diameter. Quantum dots have many applications
such as solar cells, optoelectronic devices, biological fluorescence labeling and
lasers1-2
.
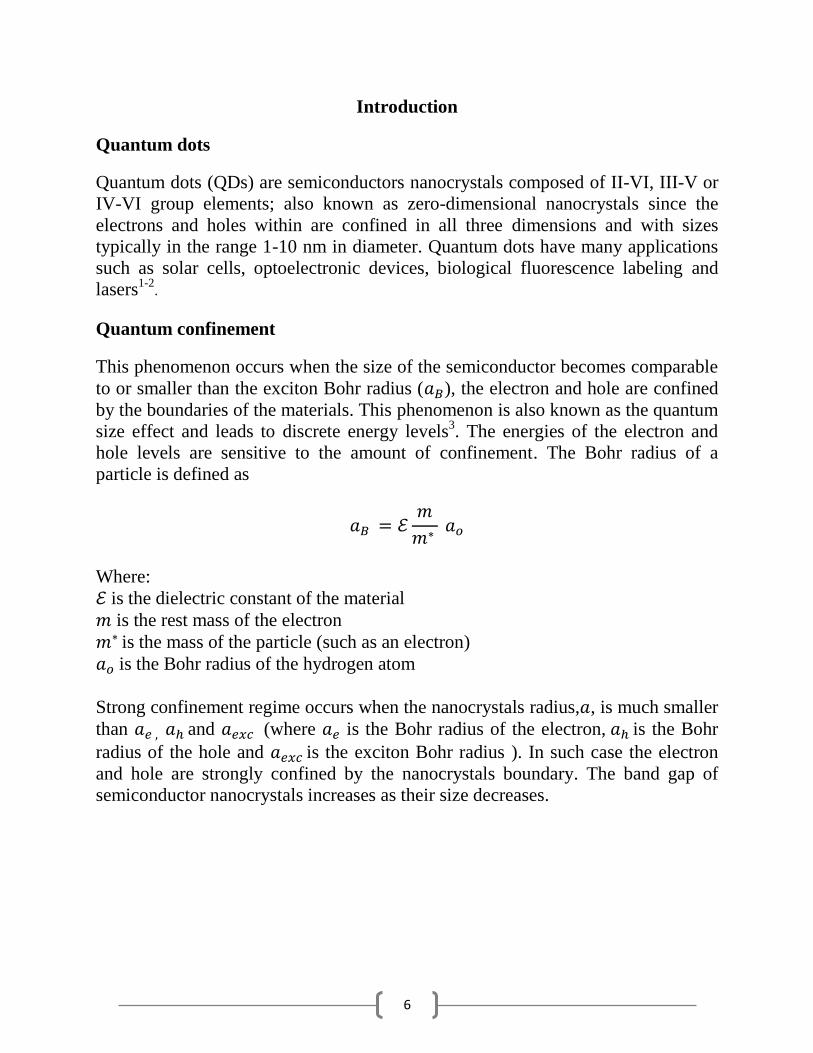
Quantum confinement
This phenomenon occurs when the size of the semiconductor becomes comparable
to or smaller than the exciton Bohr radius ( ), the electron and hole are confined
by the boundaries of the materials. This phenomenon is also known as the quantum
size effect and leads to discrete energy levels3. The energies of the electron and
hole levels are sensitive to the amount of confinement. The Bohr radius of a
particle is defined as
Where:
is the dielectric constant of the material
is the rest mass of the electron
is the mass of the particle (such as an electron)
is the Bohr radius of the hydrogen atom
Strong confinement regime occurs when the nanocrystals radius, , is much smaller
than and (where is the Bohr radius of the electron, is the Bohr
radius of the hole and is the exciton Bohr radius ). In such case the electron
and hole are strongly confined by the nanocrystals boundary. The band gap of
semiconductor nanocrystals increases as their size decreases.
7
Figure 1. Energy levels diagram for bulk semiconductor and quantum dot
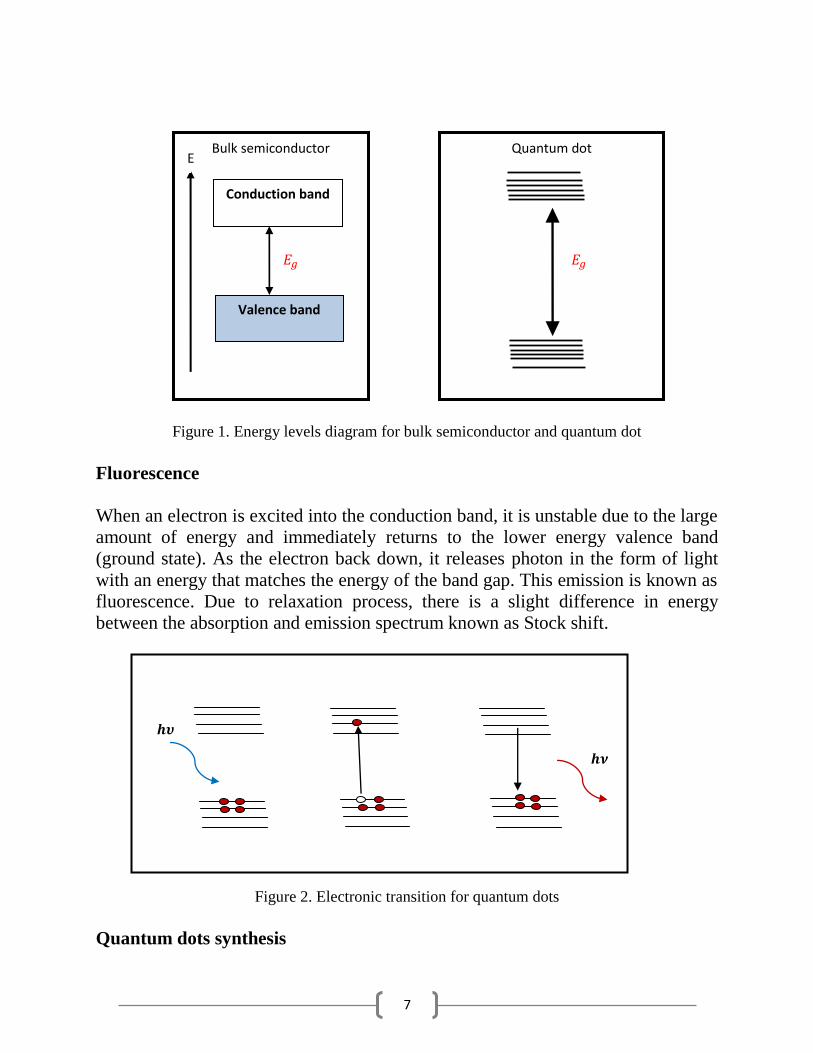
Fluorescence
When an electron is excited into the conduction band, it is unstable due to the large
amount of energy and immediately returns to the lower energy valence band
(ground state). As the electron back down, it releases photon in the form of light
with an energy that matches the energy of the band gap. This emission is known as
fluorescence. Due to relaxation process, there is a slight difference in energy
between the absorption and emission spectrum known as Stock shift.
Figure 2. Electronic transition for quantum dots
Quantum dots synthesis
Bulk semiconductor
Conduction band
Valence band
Quantum dot
E
8
There are two routes for synthesis of quantum dots: one of these is bottom-up
method and the other is top-down method
1. Bottom-up method
Molecular or ionic precursors including the surfactant react together in
solution to produce colloidal quantum dots.
2. Top-down method
The bulk semiconductor is thinned to form quantum dots e.g. lithography
technique. A top down technique inherently includes material damage and
many quantum dots produced with this technique have defects that reduce
their effectiveness.
Lead sulfide (PbS) quantum dots
Due to their small direct band gap (0.41 eV) and larger exciton Bohr radius (18
nm)4,11
, PbS QD’s are important semiconductor material. They provide potential
for applications, such as telecommunications, tunable IR lasers and solar cells5. For
these advantages, PbS was selected during my research project.
Two organic synthetic methods exist for the synthesis of PbS QD’s. The first
method includes the injection of bis (trimethylsilyl) sulfide in octadecene to a hot
solution of lead oleate (Hines and Scholes).The second method in which
oleylamine is used as solvent and includes lead chloride (PbCl2) and elemental
sulfur as sulfur precursor (Cademartiri)6-7
.
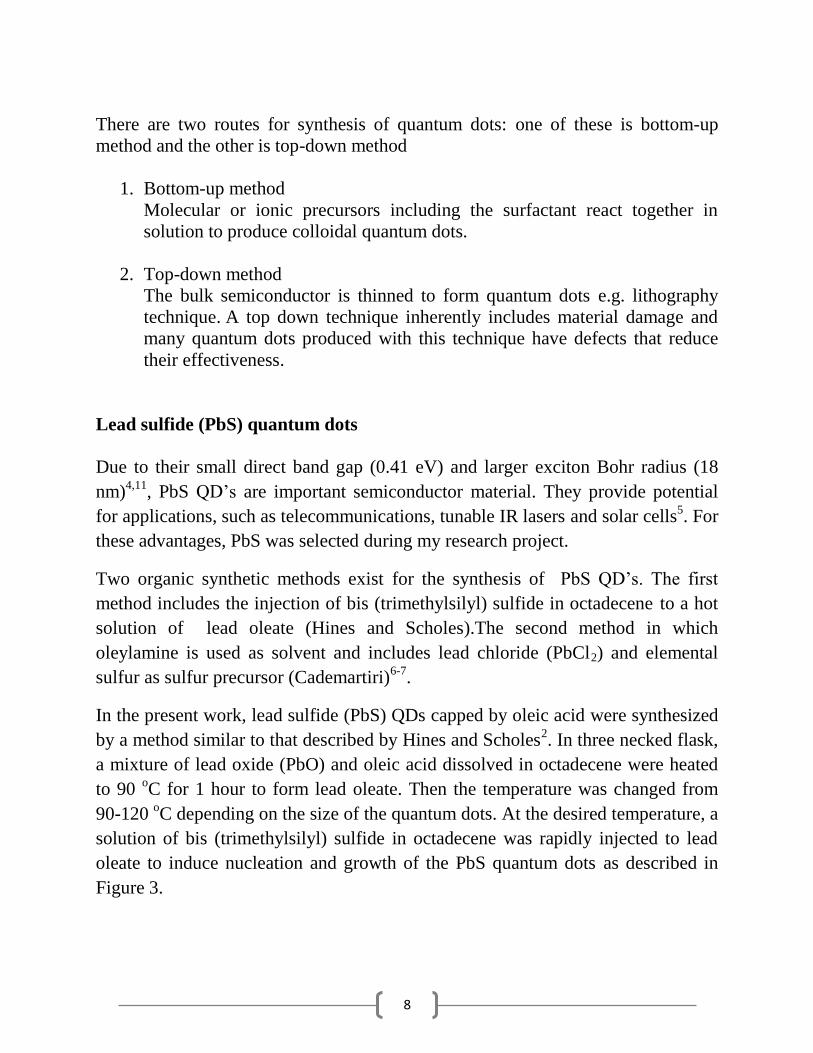
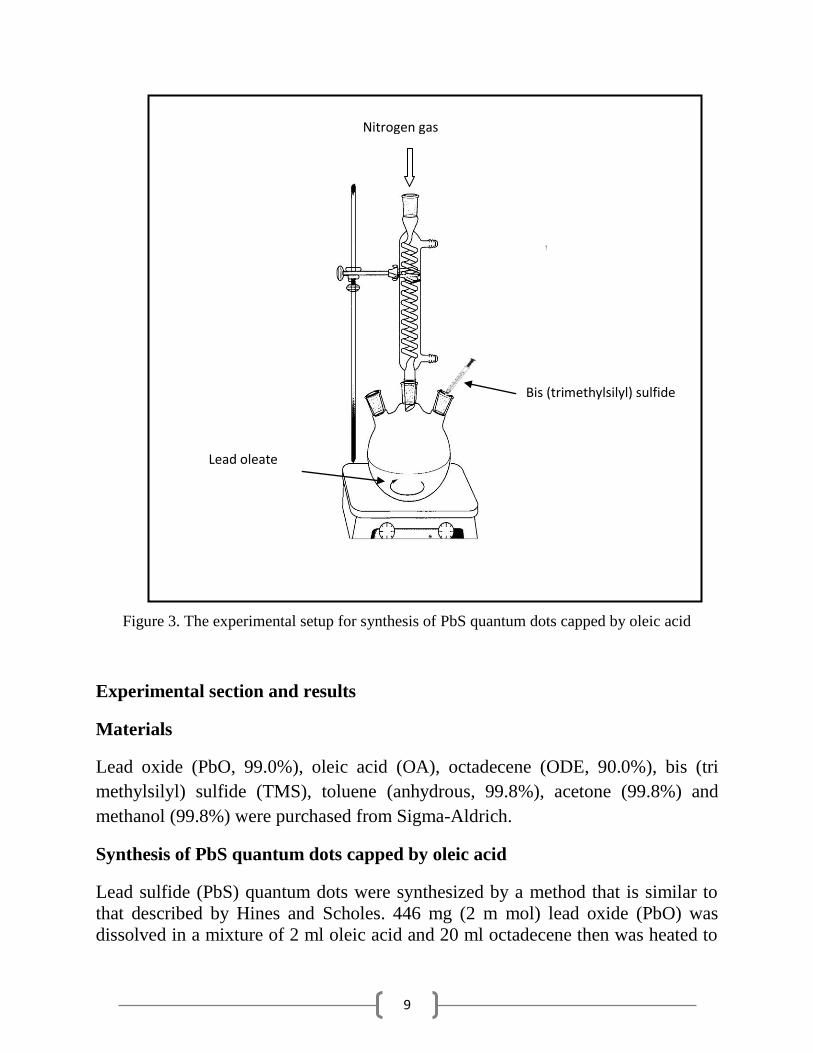
In the present work, lead sulfide (PbS) QDs capped by oleic acid were synthesized
by a method similar to that described by Hines and Scholes2. In three necked flask,
a mixture of lead oxide (PbO) and oleic acid dissolved in octadecene were heated
to 90 oC for 1 hour to form lead oleate. Then the temperature was changed from
90-120 oC depending on the size of the quantum dots. At the desired temperature, a
solution of bis (trimethylsilyl) sulfide in octadecene was rapidly injected to lead
oleate to induce nucleation and growth of the PbS quantum dots as described in
Figure 3.
9
Figure 3. The experimental setup for synthesis of PbS quantum dots capped by oleic acid
Experimental section and results
Materials
Lead oxide (PbO, 99.0%), oleic acid (OA), octadecene (ODE, 90.0%), bis (tri
methylsilyl) sulfide (TMS), toluene (anhydrous, 99.8%), acetone (99.8%) and
methanol (99.8%) were purchased from Sigma-Aldrich.
Synthesis of PbS quantum dots capped by oleic acid
Lead sulfide (PbS) quantum dots were synthesized by a method that is similar to
that described by Hines and Scholes. 446 mg (2 m mol) lead oxide (PbO) was
dissolved in a mixture of 2 ml oleic acid and 20 ml octadecene then was heated to
Bis (trimethylsilyl) sulfide
Lead oleate
Nitrogen gas
10
90 oC under nitrogen in a three necked flask. After the lead oxide is completely
decomposed to form lead oleate (indicated by color change of the solution from
yellow to clear). The temperature of the solution was raised to 120 oC. Then 0.2 ml
of bis (tri methylsilyl) sulfide dissolved in 10 ml octadecene was rapidly injected
into the lead oleate solution. The rapid injection of TMS solution into the reaction
flask changed the colour of the reaction mixture from colorless to deep brown. The
reaction continued for 2 min so that PbS nanocrystals form. The solution in the
flask was dissolved in 10 ml of toluene and was precipitated with methanol and
acetone, followed by centrifugation.
To vary the size of the QDs, the injection temperature was changed to be (90, 100,
110 and 120 o
C) and by increasing the temperature, the size of the quantum dots
increase.
Characterization of PbS quantum dots
All absorption measurements were carried out on an Agilent 8453 UV-Visible-NIR
Spectrophotometer. A blank spectrum was taken before each measurement and
subtracted from the experimental spectrum. Fluorescence spectra were measured
using IR-laser and the excitation wavelength was 700 nm. All optical
measurements were performed at room temperature.
Results and discussion
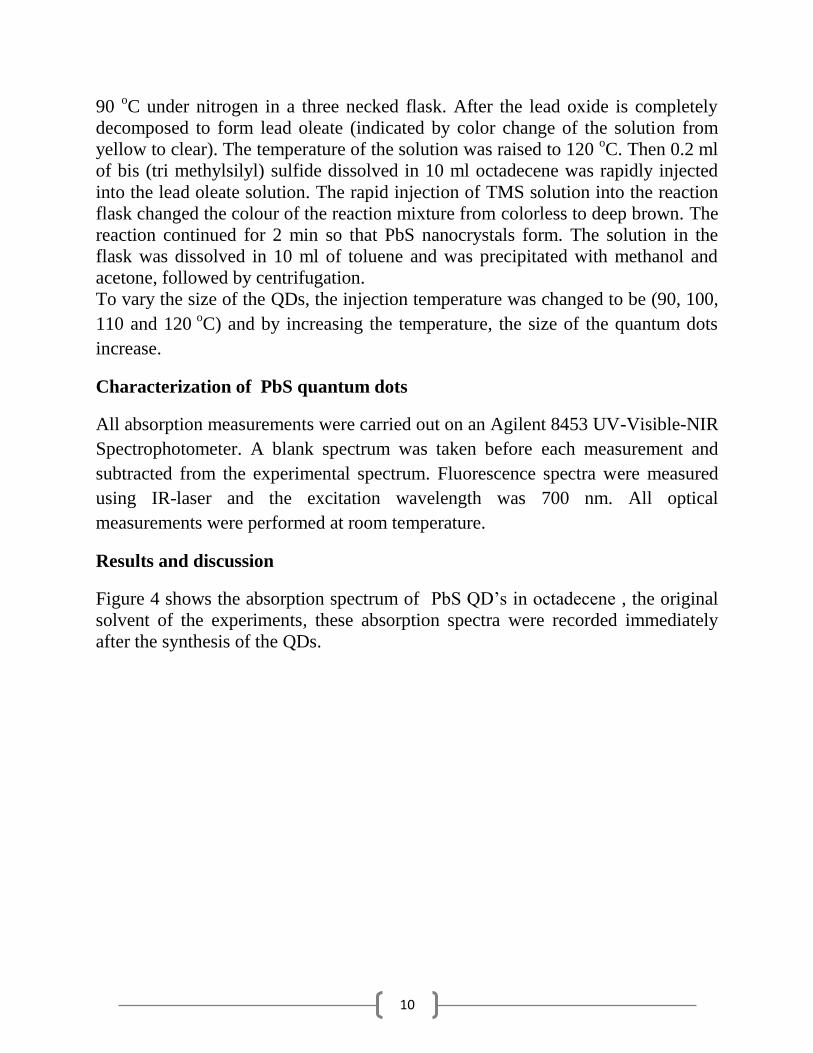
Figure 4 shows the absorption spectrum of PbS QD’s in octadecene , the original
solvent of the experiments, these absorption spectra were recorded immediately
after the synthesis of the QDs.
11
500 600 700 800 900 1000 1100 1200
90 0C
1000C
1100C
1200C
Ab
so
rba
nce
Wavelength (nm)
Figure 4. Absorption spectrum of PbS QDs in octadecene.
500 600 700 800 900 1000 1100 1200
0
1
2
3
Ab
so
rba
nce
Wavelength (nm)
90 0C
1000C
1100C
1200C
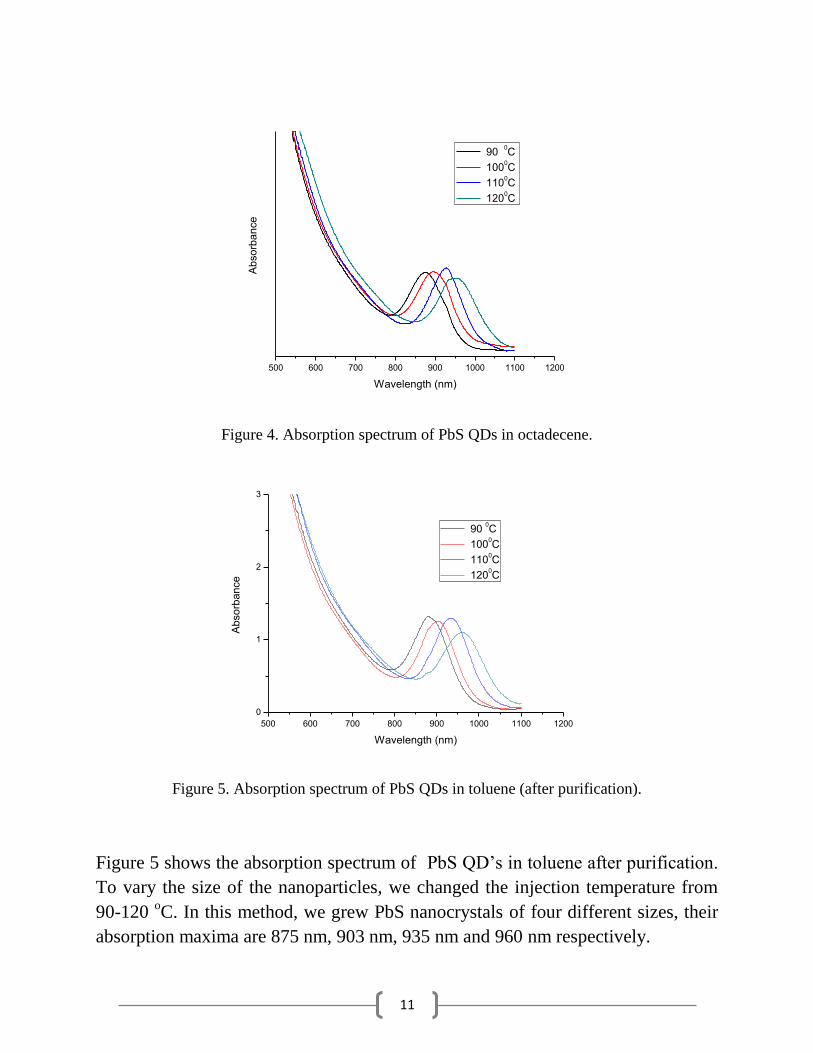
Figure 5. Absorption spectrum of PbS QDs in toluene (after purification).
Figure 5 shows the absorption spectrum of PbS QD’s in toluene after purification.
To vary the size of the nanoparticles, we changed the injection temperature from
90-120 oC. In this method, we grew PbS nanocrystals of four different sizes, their
absorption maxima are 875 nm, 903 nm, 935 nm and 960 nm respectively.
12
600 800 1000 1200
0.00
0.05
0.10A
bso
rba
nce
Wavelength (nm)
90 0C
800 850 900 950 1000 1050
0
200
400
600
800
1000
1200
1400
1600
1800
Flo
ure
sce
nce
Wavelength (nm )
90 0C
930
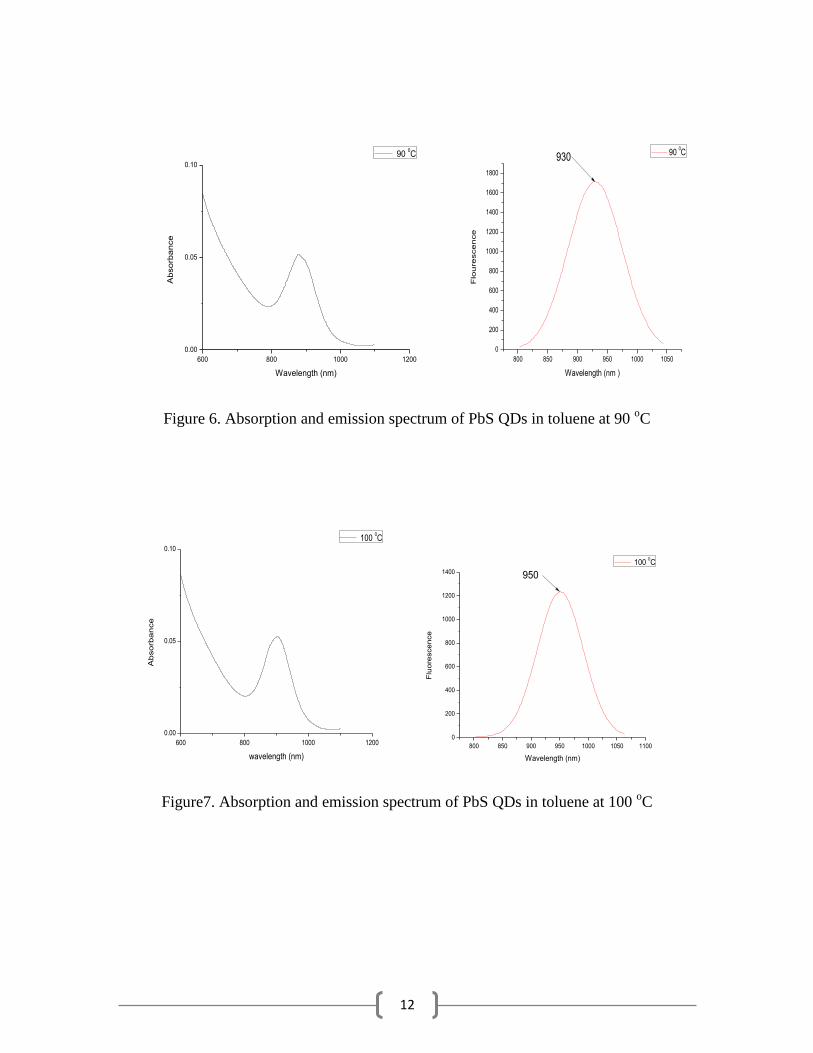
Figure 6. Absorption and emission spectrum of PbS QDs in toluene at 90 oC
600 800 1000 1200
0.00
0.05
0.10
Ab
so
rba
nce
wavelength (nm)
100 0C
800 850 900 950 1000 1050 1100
0
200
400
600
800
1000
1200
1400
Flu
ore
sce
nce
Wavelength (nm)
100 0C
950
Figure7. Absorption and emission spectrum of PbS QDs in toluene at 100 oC
13
600 800 1000 1200
0.00
0.05
0.10
Ab
so
rba
nce
Wavelength (nm)
QD 110
800 850 900 950 1000 1050 1100
0
200
400
600
800
1000
1200
Flu
ore
sce
nce
Wavelength (nm)
110 0C
965
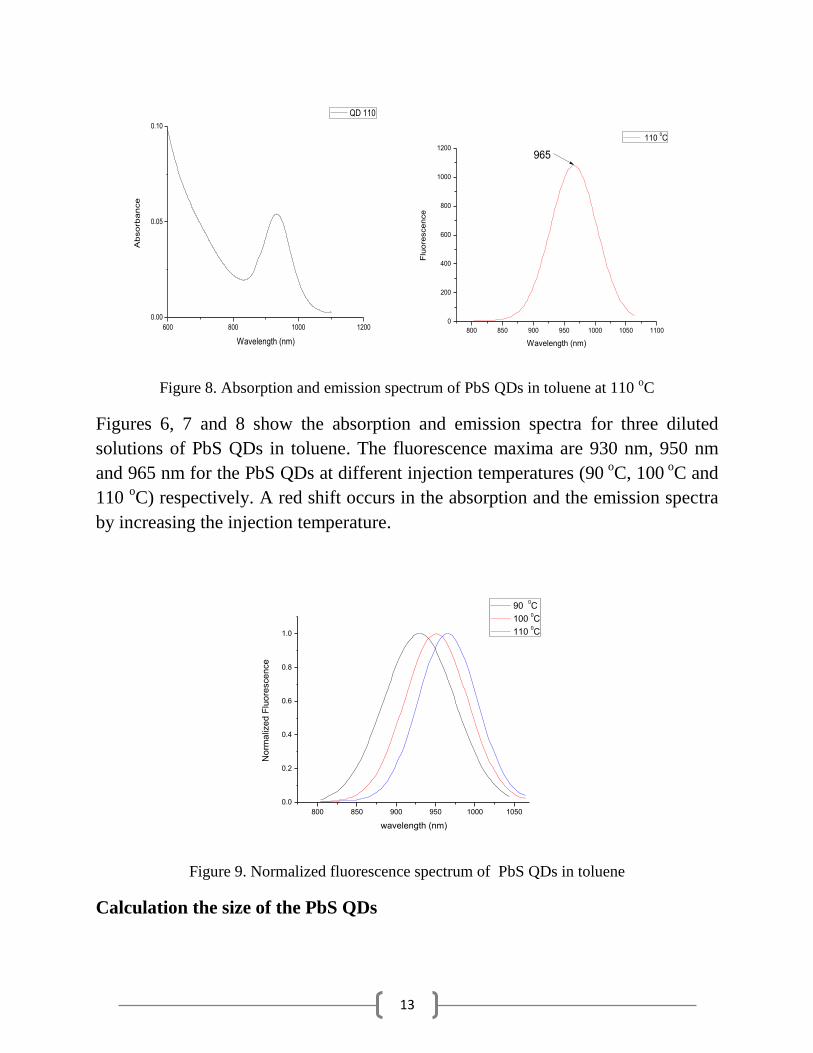
Figure 8. Absorption and emission spectrum of PbS QDs in toluene at 110 oC
Figures 6, 7 and 8 show the absorption and emission spectra for three diluted
solutions of PbS QDs in toluene. The fluorescence maxima are 930 nm, 950 nm
and 965 nm for the PbS QDs at different injection temperatures (90 o
C, 100 o
C and
110 oC) respectively. A red shift occurs in the absorption and the emission spectra
by increasing the injection temperature.
800 850 900 950 1000 1050
0.0
0.2
0.4
0.6
0.8
1.0
No
rma
lize
d F
luo
resce
nce
wavelength (nm)
90 0C
100 0C
110 0C
Figure 9. Normalized fluorescence spectrum of PbS QDs in toluene
Calculation the size of the PbS QDs
14
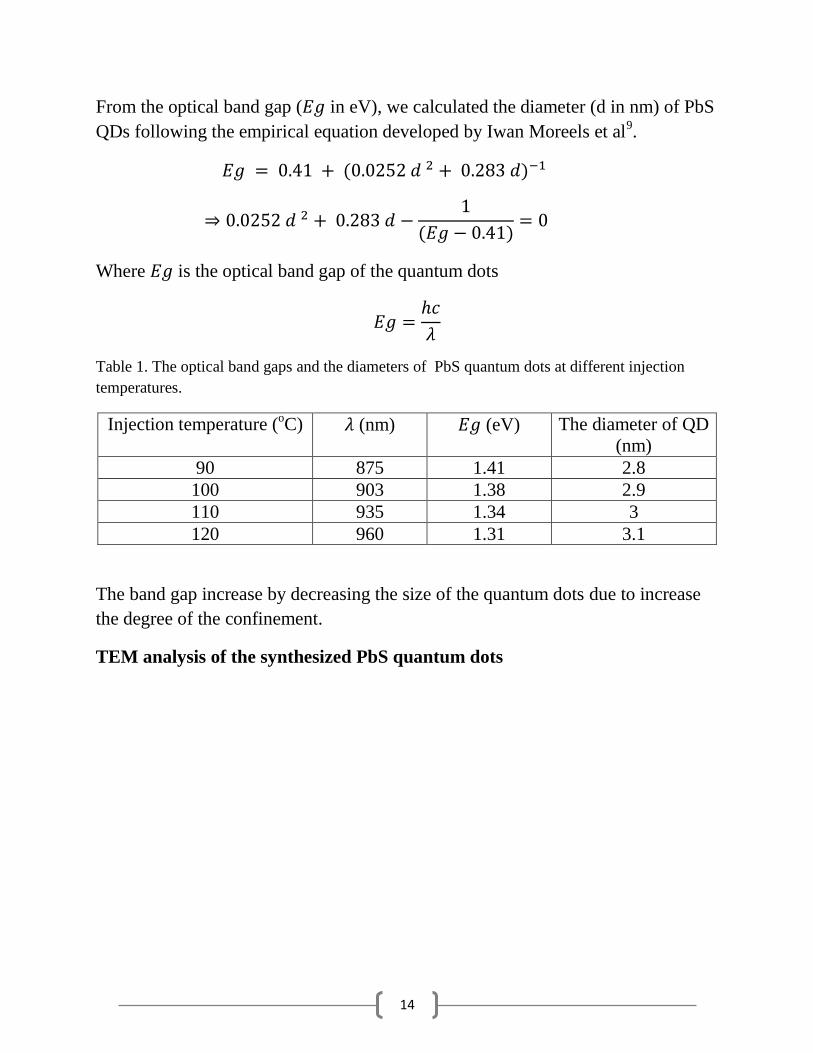
From the optical band gap ( in eV), we calculated the diameter (d in nm) of PbS
QDs following the empirical equation developed by Iwan Moreels et al9.
Where is the optical band gap of the quantum dots
Table 1. The optical band gaps and the diameters of PbS quantum dots at different injection
temperatures.
Injection temperature (oC) (nm) (eV) The diameter of QD
(nm)
90 875 1.41 2.8
100 903 1.38 2.9
110 935 1.34 3
120 960 1.31 3.1
The band gap increase by decreasing the size of the quantum dots due to increase
the degree of the confinement.
TEM analysis of the synthesized PbS quantum dots
15
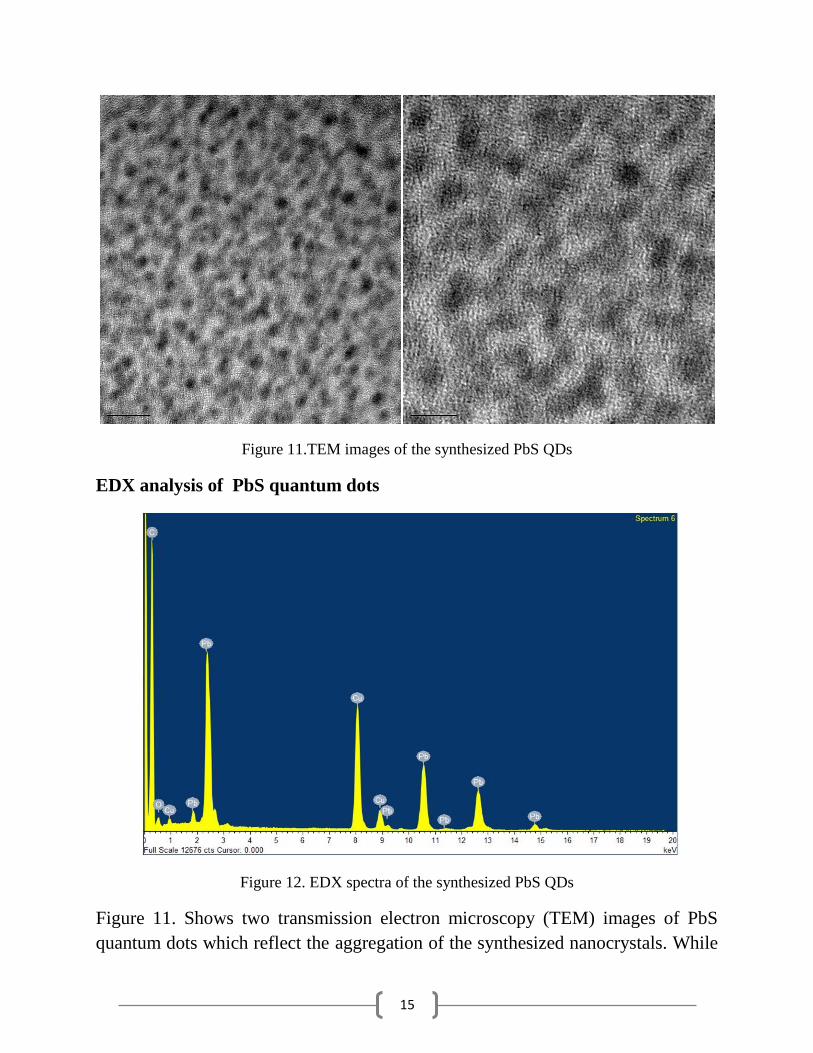
Figure 11.TEM images of the synthesized PbS QDs
EDX analysis of PbS quantum dots
Figure 12. EDX spectra of the synthesized PbS QDs
Figure 11. Shows two transmission electron microscopy (TEM) images of PbS
quantum dots which reflect the aggregation of the synthesized nanocrystals. While
16
Figure 12. Shows the elemental composition of the nanocrystals using energy
dispersive X-ray spectroscopy (EDX) which confirm the presence of Pb and S.The
peak of S is overlapped with the peak of the Pb and the two peaks appear at 2.3
KeV12
.peaks of C, Cu and O due to the carbon coated copper grid used for TEM.
Determination the fluorescence quantum yield
Fluorescence quantum yield is defined as the number of the emitted photons
to the number of the absorbed photons.
There are two methods for determining the fluorescence quantum yield
(1) Absolute method
It is not easy to determine the absolute quantum yield because this method
requires sophisticated instrumentation.
(2) Comparative method
The relative quantum yield is determined by comparison to a reference dye
with known quantum yield.
Determination the fluorescence quantum yield of PbS QD’s
Experimental
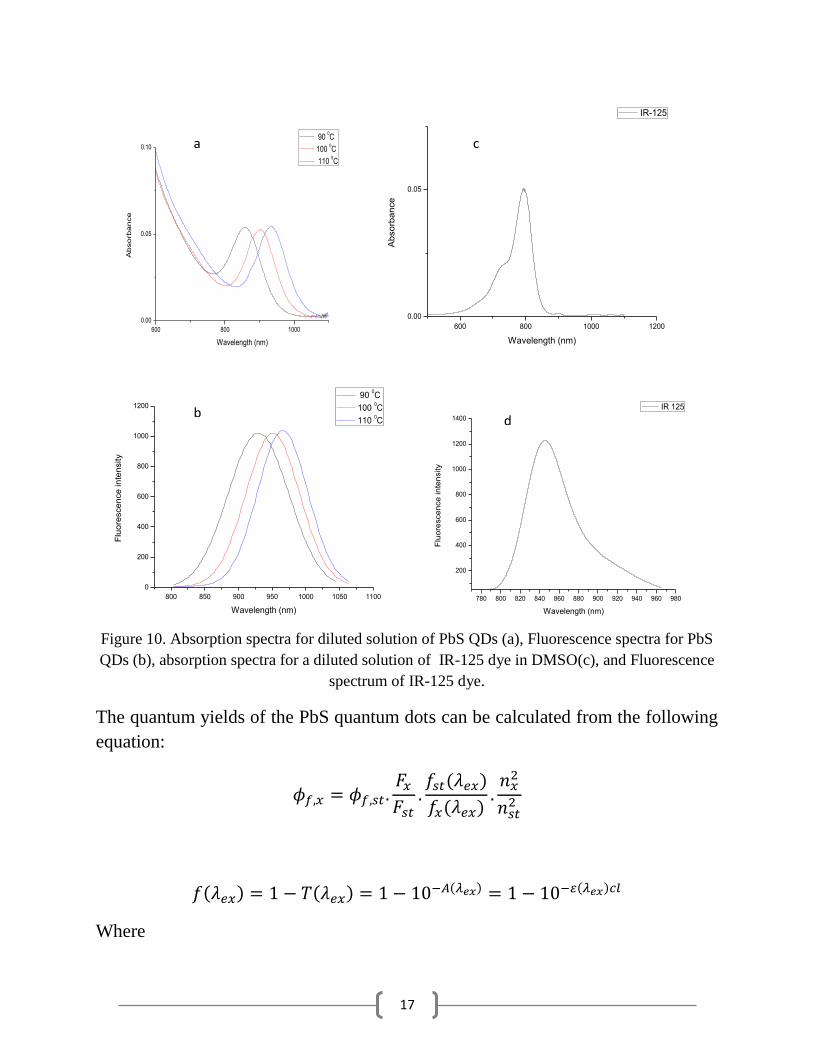
A number of diluted solutions of PbS QDs were prepared and the
absorption and the emission spectra were recorded. The fluorescence quantum
yields of PbS QDs were measured using a relative optical method. IR-125 dye
( in Dimethyl sulfoxide) was used as reference and the excitation
wavelength for the samples was 700 nm using IR-laser.
Results
17
600 800 1000
0.00
0.05
0.10
Ab
so
rba
nce
Wavelength (nm)
90 0C
100 0C
110 0C
600 800 1000 1200
0.00
0.05
Ab
so
rba
nce
Wavelength (nm)
IR-125
800 850 900 950 1000 1050 1100
0
200
400
600
800
1000
1200
Flu
ore
sce
nce
in
ten
sity
Wavelength (nm)
90 0C
100 0C
110 0C
780 800 820 840 860 880 900 920 940 960 980
200
400
600
800
1000
1200
1400
Flu
ore
sce
nce
in
ten
sity
Wavelength (nm)
IR 125
Figure 10. Absorption spectra for diluted solution of PbS QDs (a), Fluorescence spectra for PbS
QDs (b), absorption spectra for a diluted solution of IR-125 dye in DMSO(c), and Fluorescence
spectrum of IR-125 dye.
The quantum yields of the PbS quantum dots can be calculated from the following
equation:
Where
a c
b d
18
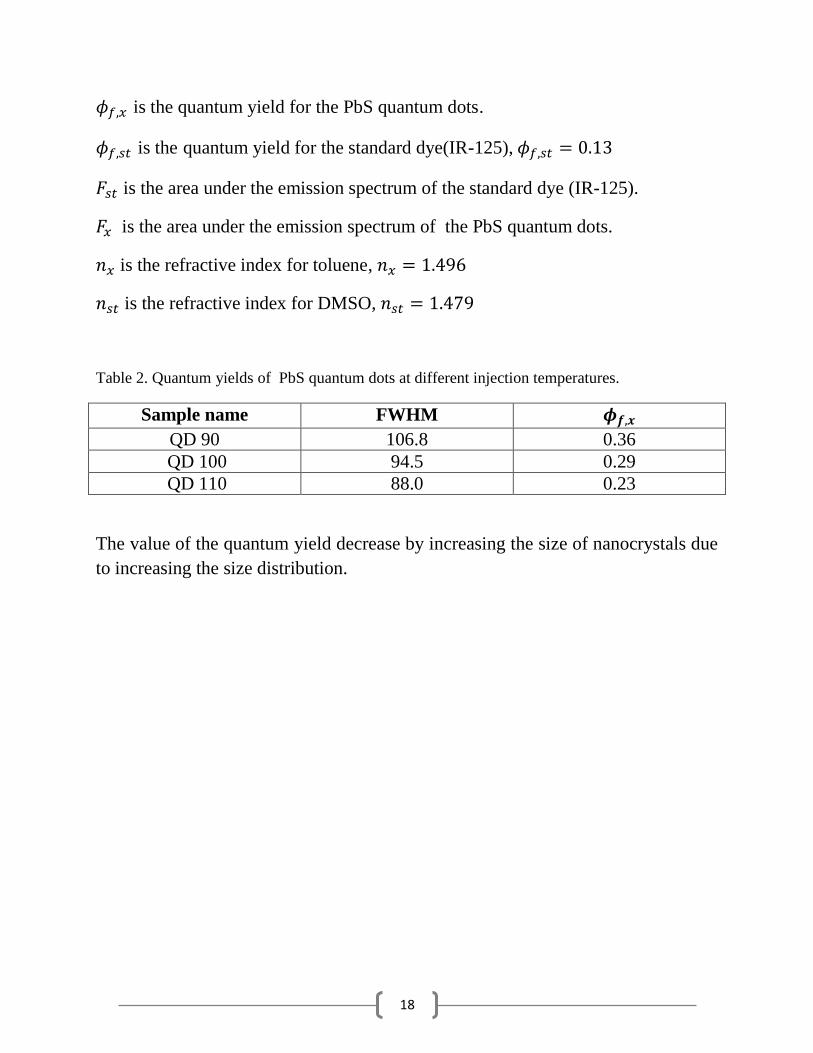
is the quantum yield for the PbS quantum dots.
is the quantum yield for the standard dye(IR-125),
is the area under the emission spectrum of the standard dye (IR-125).
is the area under the emission spectrum of the PbS quantum dots.
is the refractive index for toluene,
is the refractive index for DMSO,
Table 2. Quantum yields of PbS quantum dots at different injection temperatures.
Sample name FWHM
QD 90 106.8 0.36
QD 100 94.5 0.29
QD 110 88.0 0.23
The value of the quantum yield decrease by increasing the size of nanocrystals due
to increasing the size distribution.
19
Conclusion
PbS quantum dots with different sizes were synthesized using lead oxide as lead
source and bis (tri methylsilyl) sulfide as sulfur source (Pb: S=2:1). The quantum
dots were characterized by different techniques including absorption, fluorescence,
transmission electron microscopy and energy dispersive x-ray spectroscopy. The
quantum yield was measured relative to IR-125 dye as a reference dye.
20
Acknowledgement
I would like to offer my sincerest gratitude to Prof. Tõnu Pullerits for guidance and
support, Dr. Mahmmoud Sayed Abd El-sadek, Nanomaterial Lab., Physics
Department, Faculty of Science, South Valley University, Qena-Egypt, for his
inspiring guidance, continuous encouragement, stimulating discussions and
scholarly advice to carry out the present investigations and Dr. Kaibo Zheng, who
has support me throughout my project with his useful discussions and knowledge.
Then I want to thank everyone within our group and all people within the chemical
physics department for help and respect.
Special thanks to Mohamed Abdellah, Sumera Tubasum and Alice Corani for help
and discussion. I would like to thank my family and friends. Without their love and
support, none of this would have been possible.
21
References
1- H. Du, C. Chen, R. Krishnan, T. Krauss and J. Silcox. Optical properties of colloidal
PbSe nanocrystals. Nano letters.2004, 2, 1321-1324.
2- A. Guchhait, A. Rath and A. Pal. To make polymer: quantum dot hybrid solar cells NIR-
active by increasing diameter of PbS nanoparticles. Solar energy materials and solar cells,
2011, 95, 651-656.
3- V. Klimov. Nanocrystal quantum dots. 2nd edition. New Mexico, P.66.
4- A. Phuruangrat, T. Thongtem and S. Thongtem. Preparation of ear-like, hexapod and
dendritic PbS using cyclic microwave-assisted synthesis. Material letters, 2009, 63, 667-
669.
5- E. Sargent. Infrared quantum dots. Adv. Mater. 2005, 17, 515-522.
6- I. Moreels, Y. Justo, B. Geyter, K. Haustraete, J. Martine and Z. Hens. Size-tunable,
bright, and stable PbS quantum dots: a surface chemistry study. ACS NANO. 2004, 5,
2004-2011.
7- M. Hines and G. Scholes. Colloidal PbS nanocrystals with size-tunable Near-Infrared
emission: observation of post-synthesis self-narrowing of the particle size distribution.
Adv. Mater. 2003, 15, 1844-1849
8- M. Grabolle, M. Spieles, V. Lesnyak, N. Gaponik, A. Eychmuller, and U. Resch-Genger.
Determination of the fluorescence quantum yield of quantum dots: suitable procedures
and achievable uncertainties. Anal. Chem.2009, 81, 6285-6294.
9- I. Moreels, K. Lambert, D. Smeets, D. De Muynk, T. Nollet, J. Martins, F. Vanhaecke, A.
Vantomme,C. Delerue, G. Allan, and Z. Hens. Size-dependent optical properties of
colloidal PbS quantum dots.ACS NANO.2009, 3, 3023-3030.
10- J.Tang, L. Brzozowski, D. Aaron, D. Jamakosmanovic, and E.H. Sargent. Quantum dot
photovoltaics in the extreme quantum confinement regime: The surface-chemical origins
of exceptional air-and light-stability. ACS NANO.2010, 4,869-878.
11- k.K.Nada, F.E.Kruis, and H.Fissan. Effective mass approximation for two extreme
semiconductors: Band gap of PbS and CuBr nanoparticles. Journal of Applied
Physics.2004, 95, 5035-5041.
12- J. Warner, A. Watt and R. Tilley. Controlling PbS nanocrystals aggregation in conducting
polymers. Nanotechnology.2005, 16, 2381-2384.