
SYNTHESIS AND CHARACTERIZATION OF Mn...
169
SYNTHESIS AND CHARACTERIZATION OF Mn-DOPED CdSe QUANTUM DOTS VIA INVERSE MICELLE TECHNIQUE NOR ALIYA BINTI HAMIZI THESIS SUBMITTED IN FULFILMENT OF THE REQUIREMENTS FOR THE DEGREE OF DOCTOR OF PHILOSOPHY FACULTY OF ENGINEERING UNIVERSITY OF MALAYA KUALA LUMPUR 2017
Transcript of SYNTHESIS AND CHARACTERIZATION OF Mn...

SYNTHESIS AND CHARACTERIZATION OF Mn-DOPED CdSe
QUANTUM DOTS VIA INVERSE MICELLE TECHNIQUE
NOR ALIYA BINTI HAMIZI
THESIS SUBMITTED IN FULFILMENT OF THE
REQUIREMENTS FOR THE DEGREE OF DOCTOR OF
PHILOSOPHY
FACULTY OF ENGINEERING
UNIVERSITY OF MALAYA
KUALA LUMPUR
2017

ii
UNIVERSITI MALAYA
ORIGINAL LITERARY WORK DECLARATION
Name of Candidate: Nor Aliya binti Hamizi (I.C/Passport No: 851112-08-5500)
Registration/Matric No: KHA 110069
Name of Degree: Doctor of Philosophy
Title of Project Paper/Research Report/Dissertation/Thesis (“this Work”): Synthesis
And Characterization Of Mn-Doped CdSe Quantum Dots Via Inverse Micelle
Technique
Field of Study: Advance Materials/Nanomaterials
I do solemnly and sincerely declare that:
(1) I am the sole author/writer of this Work;
(2) This Work is original;
(3) Any use of any work in which copyright exists was done by way of fair dealing
and for permitted purposes and any excerpt or extract from, or reference to or
reproduction of any copyright work has been disclosed expressly and
sufficiently and the title of the Work and its authorship have been acknowledged
in this Work;
(4) I do not have any actual knowledge nor do I ought reasonably to know that the
making of this work constitutes an infringement of any copyright work;
(5) I hereby assign all and every rights in the copyright to this Work to the
University of Malaya (“UM”), who henceforth shall be owner of the copyright
in this Work and that any reproduction or use in any form or by any means
whatsoever is prohibited without the written consent of UM having been first
had and obtained;
(6) I am fully aware that if in the course of making this Work I have infringed any
copyright whether intentionally or otherwise, I may be subject to legal action or
any other action as may be determined by UM.
Candidate’s Signature Date
Subscribed and solemnly declared before,
Witness’s Signature Date
Name:
Designation:
iii
ABSTRACT
Various sizes of manganese-doped cadmium selenide quantum dots (Mn-doped CdSe
QDs) synthesized using inverse Micelle technique with organic solvent and surfactant
possesses zinc blende structure with physical size ranging from 3 to 14 nm and
crystallite size 2.46 to 5.46 nm respectively for 0 to 90 mins samples with narrow size
distribution. Mn-doped CdSe QDs observed to growth larger QDs compared to pure
CdSe QDs at significantly same reaction times. The lattice parameter compressed with
QDs sizes growth due to the introduction of lattice strain due to the incorporation of Mn
atoms into CdSe QDs lattice. The Mn-doped CdSe QDs shows a slight blue-shift on
absorption and emission spectra’s compared to pure CdSe even though is possessed
larger QDs. The band gap structure modification prominently affected by the lattice
strain were transition of Stoke`s, Rayleigh to anti-Stoke`s shifts observed as the Mn-
doped CdSe QDs size growth. The typical red-shift of absorption and emission
wavelength observed with growth of QDs sizes. The role of oleic acid acid as a
surfactant and capping agent shows in FTIR spectra. The lattice strain tailored the
binding energy between the ion prominently on the surface of the QDs with growth of
QDs sizes.

iv
ABSTRAK
Pelbagai saiz Mangan-dop cadmium selenida titik terkurung (Mn-doped CdSe QDs)
yang telah di sintesis dengan teknik ‘inverse Micelle’ mengunakan cecair dan
‘surfactant’ organik mempunyai struktur hablur ‘zinc blende’ dengan saiz fizikal dalam
julat daripada 3 ke 14 nm dan Saiz hablur daripada 2.46 hingga 5.46 nm untuk sampel-
sampel 0 hingga 90 minit dengan taburan saiz yang rendah. Mn-doped CdSe QDs
menghasilkan QDs dengan saiz yang lebih besar berbanding CdSe QDs. Jarak kekisi
hablur mengalami pemampatan apabila size QDs meningkat disebabkan oleh daya
tarikan ke atas kekisi hablur. Menariknya, Mn-doped CdSe QDs menunjukkan anjakan
biru berbanding CdSe QDs walaupun ia menghasilkan QDs dengan saiz yang lebih
besar. Struktur jalur orbit Mn-doped CdSe QDs mengalami perubahan besar disebabkan
oleh daya tarikan ke atas kekisi hablur yang mengakibatkan perubahan dari peralihan
Stoke`s, Rayleigh seterusnya anti-Stoke`s apabila saiz QDs meningkat. Peralihan dari
panjang gelombang rendah kepada tinggi dilihat daripada spectrum serapan dan
spectrum lepasan dengan peningkatan saiz QDs. Peranan asid oleic sebagai ‘surfactant’
dan ajen penyalut dibuktikan dalam spectrum FTIR. Daya tarikan boleh mengubahsuai
tenaga ikatan antara ion-ion terutamanya di permukaan QDs juga dengan peningkatan
saiz QDs.

v
ACKNOWLEDGEMENT
All Praise Be to Allah S.W.T. for granting me the knowledge, inspiration, patience,
perseverance and serenity to complete my Phd research. My warmest appreciation goes
to my kind and respected supervisor, Prof. Dr. Mohd Rafie Johan, for his continuing
guidance and support. This research has been meaningful and rewarding to me because
I had the opportunity to work under a supervisor who is always willing to lend me a
helping hand in order for me to give my best in this research work. I am eternally
grateful to my beloved family for their endless encouragement, support and prayers, and
for always being there for me through the thick and thin. I would not be able to
complete my Phd journey without my family’s assistance, especially my lovely mother
Madam Mashitah binti Sulaiman, my kind father Mr. Hamizi bin Adin, my beloved
husband, Mr. Shahrol Nizam bin Shamsudin. This work is specially dedicated to my
beautiful children`s Izz iman bin Shahrol Nizam and Zara Saffiya binti Shahrol Nizam.
My special gratitude goes to MyBrain15 scholarship and Malaysia Ministry of Higher
Education for the financial support throughout my Phd study. My heartfelt thanks go to
my lecturers, lab assistants and the support staff of Department of Mechanical
Engineering. Thank you for making my Phd researches a wonderful and enjoyable
learning experience despite the number of obstacles, and I wish you all the best.

vi
TABLE OF CONTENT
DECLARATION…………………………………………..……………………………ii
ABSTRACT…………………………………………………………………………….iii
ABSTRAK……………………………………………………………………………...iv
ACKNOWLEDGEMENT……………………………………………………………….v
TABLE OF CONTENT………………………………………………………………...vi
LIST OF FIGURES……………………………………………………………………viii
LIST OF TABLES……………………………………………………………………...xi
LIST OF ABBREVIATIONS………………………………………………………….xii
CHAPTER ONE…………………………………………………………………………1
INTRODUCTION……………………………………………………………………1
1.1 Background………………………………………………………………1
1.2 Important Research Problem…………………………………………….5
1.3 Significance of Research…………………………………………...……5
1.4 Research Objectives…………………………………………………......6
CHAPTER TWO………………………………………………………………………...7
LITERATURE REVIEW…………………………………………………………….7
2.1 Quantum Dots……………………………………………………………7
2.2 Synthesis Techniques of QDs Materials………………………………....9
2.3 Materials in QDs…………………………...…………………………...22
2.4 Doping in QDs………………………………………………………….27
2.5 Quantum Confinement Effect…………………………………………..30
2.6 Synthesis of Mn-doped CdSe QDs……………………………………..35
2.7 Mechanism in Synthesizing Mn-doped CdSe QDs…………………….38
2.8 Strain in QDs…………………………………………...………………41
CHAPTER THREE…………………………………………………………………….46

vii
METHODOLOGY………………………………………………………………….46
3.1 Materials………………………………………………………………..46
3.2 Samples Preparation……………………………………………………47
3.3 Samples Characterizations……………………………………………...48
CHAPTER FOUR………………………………………………………...……………51
RESULTS AND DISCUSSIONS…………………………………………...………51
4.1 Physical Observations………………………………………………….51
4.2 High Resolution Transmission Electron Microscopy (HRTEM)
Analysis………………………………………………………………...53
4.3 X-ray Diffraction Analysis……………………………………………..70
4.4 Ultraviolet Visible (UV-vis) Analysis………………………………….83
4.5 Photoluminescence (PL) Analysis……………………………………...90
4.6 Fourier Transform Infra-red (FTIR) Analysis…………...……………..99
4.7 Raman Spectroscopy Analysis………………………………………..101
4.8 X-ray Photoelectron Spectroscopy (XPS) Analysis…………………..105
4.9 Mechanism of Mn-doped CdSe QDs Formation……………………...119
CHAPTER FIVE……………………………………………………………………...121
CONCLUSION…………………………………………………………………….121
FURTHER RECOMMENDATIONS………………………………………………...122
REFERENCES…………………………………………………………………………xx
LIST OF PUBLICATIONS…………………………………………………………..xliii
APPENDIX…………………………………………………………………………...xliv

viii
LIST OF FIGURES
Figure 2.1: The general Williamson-Hall plot…………………………..……………43
Figure 3.1: The experimental setup for Mn-doped CdSe QDs sample upon Cd-Mn
solution injection into Se solution………………………………………..48
Figure 3.2: Flow chart of characterization of Mn-doped CdSe QD…………..………50
Figure 4.1: Mn-doped CdSe QDs samples with various colours at various reaction
time: (a) 0 , (b) 0.2, (c) 0.5, (d) 1, (e) 5, (f) 16, (g) 46 and (h) 90 mins….52
Figure 4.2: HRTEM image of Mn-doped CdSe QDs with QDs size distribution (insert)
at 0 min reaction time…………………………………………………….55
Figure 4.3: HRTEM image of Mn-doped CdSe QDs with QDs size distribution (insert)
at 0.2 min reaction time…………………………………………………..56
Figure 4.4: HRTEM image of Mn-doped CdSe QDs with QDs size distribution (insert)
at 0.5 min reaction time…………………………………………………..57
Figure 4.5: HRTEM image of Mn-doped CdSe QDs with QDs size distribution (insert)
at 1 min reaction time…………………………………………………….58
Figure 4.6: HRTEM image of Mn-doped CdSe QDs with QDs size distribution (insert)
at 5 min reaction time…………………………………………………….59
Figure 4.7: HRTEM image of Mn-doped CdSe QDs with QDs size distribution (insert)
at 16 min reaction time…………………………………………………...60
Figure 4.8: HRTEM image of Mn-doped CdSe QDs with QDs size distribution (insert)
at 46 min reaction time…………………………………………………...61
Figure 4.9: HRTEM image of Mn-doped CdSe QDs with QDs size distribution (insert)
at 90 min reaction time………………………………...…………………62
Figure 4.10: Relationship of QDs physical size with reaction times………………..63
Figure 4.11: HRTEM image of Mn-doped CdSe QDs lattice of 0 min sample.……..65
Figure 4.12: HRTEM image of Mn-doped CdSe QDs lattice of 0.2 min sample……65

ix
Figure 4.13: HRTEM image of Mn-doped CdSe QDs lattice of 0.5 min sample……66
Figure 4.14: HRTEM image of Mn-doped CdSe QDs lattice of 1 min sample……...66
Figure 4.15: HRTEM image of Mn-doped CdSe QDs lattice of 5 min sample……...67
Figure 4.16: HRTEM image of Mn-doped CdSe QDs lattice of 16 min sample…….67
Figure 4.17: HRTEM image of Mn-doped CdSe QDs lattice of 46 min sample…….68
Figure 4.18: HRTEM image of Mn-doped CdSe QDs lattice of 90 min sample…….68
Figure 4.19: XRD patterns of Mn-doped CdSe QDs samples at various reaction
times…………………………………………………………...……….71
Figure 4.20: Plot of βrcosθ versus sinθ from XRD data of 0 min sample………...…76
Figure 4.21: Plot of βrcosθ versus sinθ from XRD data of 0.2 min sample…………76
Figure 4.22: Plot of βrcosθ versus sinθ from XRD data of 0.5 min sample…………77
Figure 4.23: Plot of βrcosθ versus sinθ from XRD data of 1 min sample………...…77
Figure 4.24: Plot of βrcosθ versus sinθ from XRD data of 5 min sample…………...78
Figure 4.25: Plot of βrcosθ versus sinθ from XRD data of 16 min sample………….78
Figure 4.26: Plot of βrcosθ versus sinθ from XRD data of 46 min sample………….79
Figure 4.27: Plot of βrcosθ versus sinθ from XRD data of 90 min sample………….79
Figure 4.28: Lattice strain effect with growth of Mn-doped CdSe QDs crystallite
size……………………………………………………………………...81
Figure 4.29: Temporal evolution of UV-vis absorption spectra for the as-synthesized
Mn-doped CdSe QDs at different reaction times………………………84
Figure 4.30: The Tauc`s plot of Mn-doped Cdse QDs at various reaction times……86
Figure 4.31: Temporal evolution of Mn-doped CdSe QD optical band gap and exciton
energy against their crystallite radius…………………………………..89
Figure 4.32: PL emission spectra of Mn-doped CdSe QDs samples………………..92
Figure 4.33: The evolution of exciton and emission energy of Mn-doped CdSe QDs
various sizes…………………………………………………………….96

x
Figure 4.34: The approximation of carrier energy structure evolution of Mn-doped
CdSe QDs throughout different reaction times……………………...…97
Figure 4.35: The approximation of carrier energy structure evolution of pure CdSe
QDs throughout different reaction times (Hamizi & Johan, 2010)….....98
Figure 4.36: The FTIR pattern of paraffin oil, oleic acid and Mn-doped CdSe QDs at
various reaction time and……………………………………………...100
Figure 4.37: Raman scattering spectra of Mn-doped CdSe QDs at various reaction
times…………………………………………………………………..103
Figure 4.38: XPS wide scan of Mn-doped CdSe QDs at different reaction times
………………………………………………………………………...107
Figure 4.39: XPS scan of Cd 3d traced for Mn-doped CdSe QDs samples………...110
Figure 4.40: The XPS scan of Se traced for Mn-doped CdSe QDs at various reaction
times…………………………………………………………………..112
Figure 4.41: XPS scan for Mn traced for Mn-doped CdSe QDs at various reaction
time……………………………………………………………………114
Figure 4.42: Relation between peak intensity and the variation in size of Mn-doped
CdSe QDs……………………………………………………………..118
xi
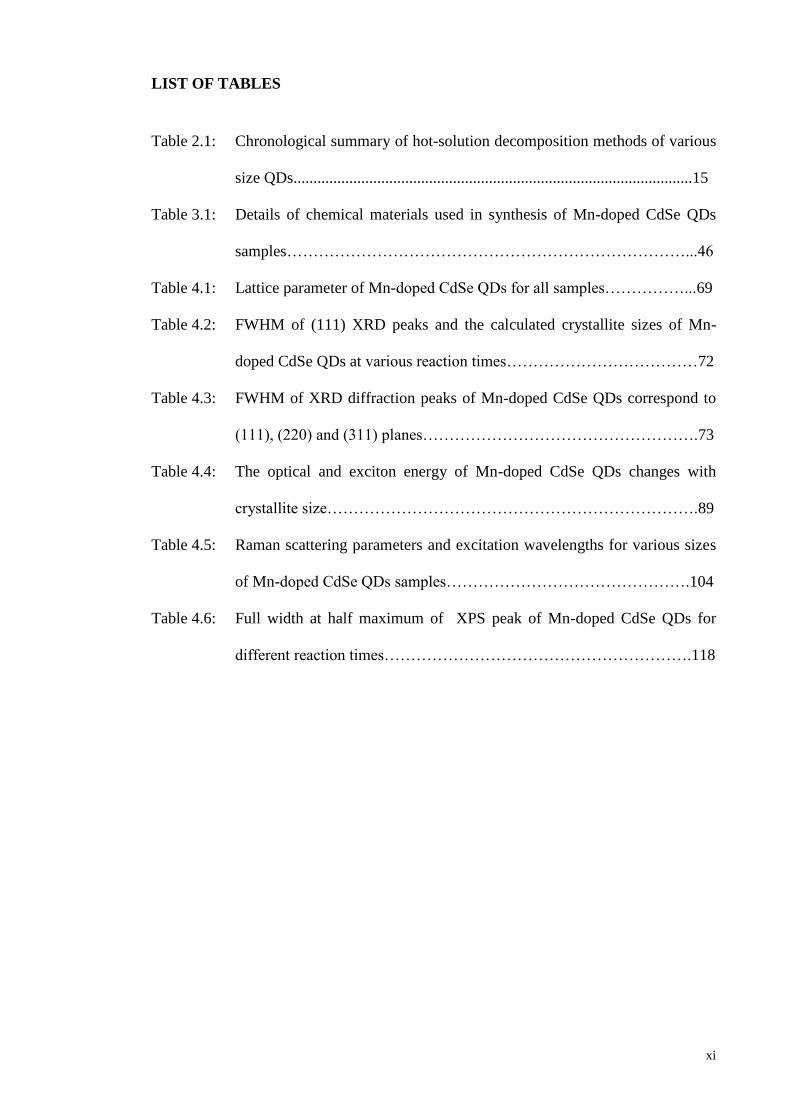
LIST OF TABLES
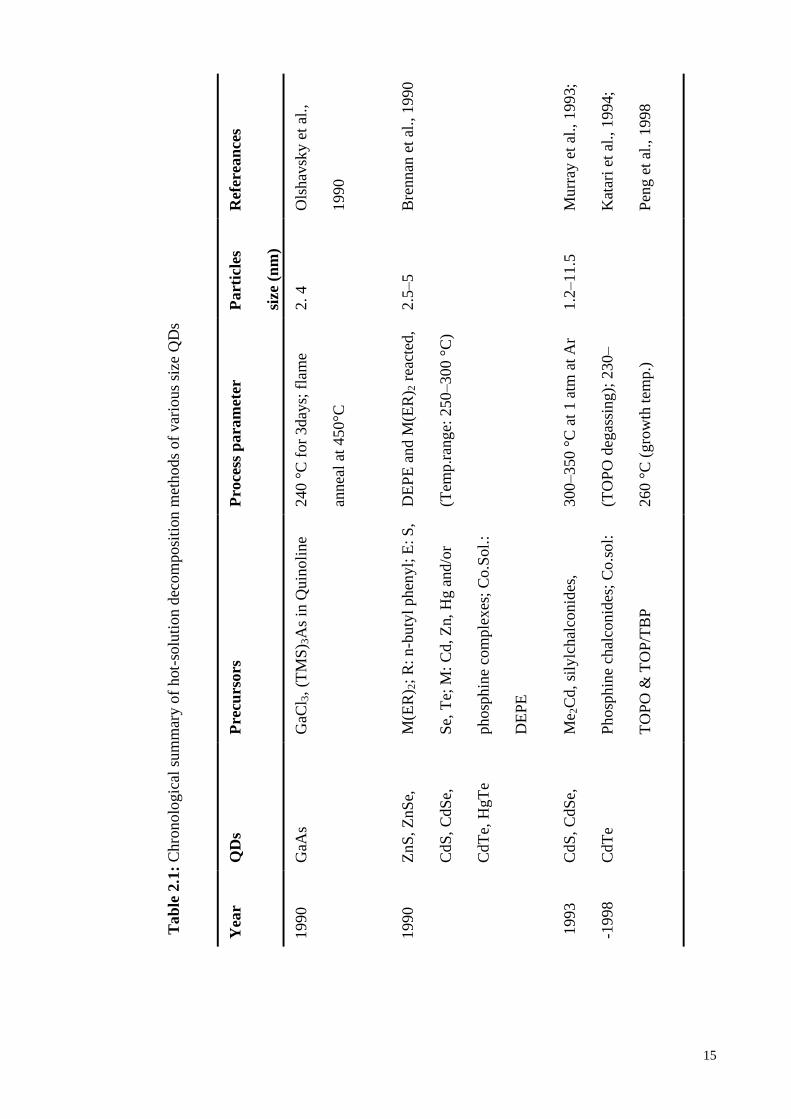
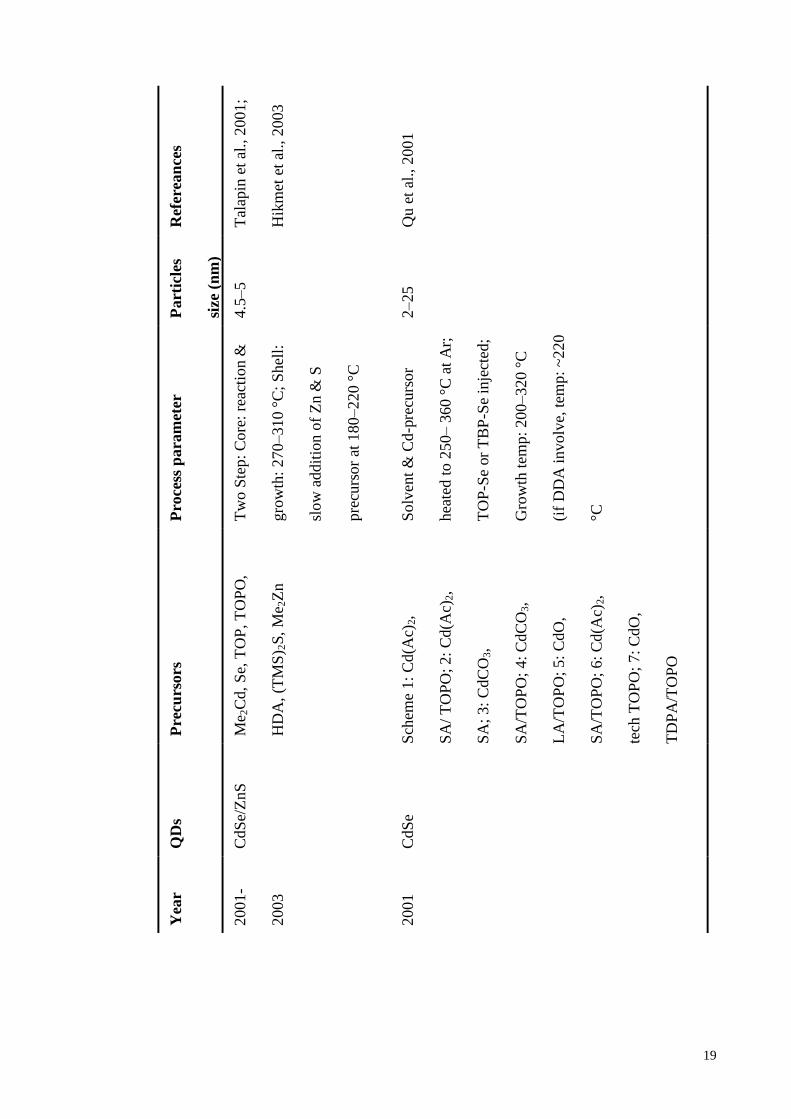
Table 2.1: Chronological summary of hot-solution decomposition methods of various
size QDs....................................................................................................15
Table 3.1: Details of chemical materials used in synthesis of Mn-doped CdSe QDs
samples…………………………………………………………………...46
Table 4.1: Lattice parameter of Mn-doped CdSe QDs for all samples……………...69
Table 4.2: FWHM of (111) XRD peaks and the calculated crystallite sizes of Mn-
doped CdSe QDs at various reaction times………………………………72
Table 4.3: FWHM of XRD diffraction peaks of Mn-doped CdSe QDs correspond to
(111), (220) and (311) planes…………………………………………….73
Table 4.4: The optical and exciton energy of Mn-doped CdSe QDs changes with
crystallite size…………………………………………………………….89
Table 4.5: Raman scattering parameters and excitation wavelengths for various sizes
of Mn-doped CdSe QDs samples……………………………………….104
Table 4.6: Full width at half maximum of XPS peak of Mn-doped CdSe QDs for
different reaction times………………………………………………….118

xii
LIST OF ABBREVIATIONS
% Percentage
(hkl) Atomic unit cell
∆(lnV) Fractional volume change
∆Ee Emission photon energy
∆Eg Shift of band gap energy
∆Ego Unstrained semiconductor band gap energy
∆Ei Exciton photon energy
∆Ev Stokes shift photon energy difference
1s First electron configured in sharp orbital
2LO First overtone of longitudinal optical
2p Second electron configured in principle orbital
3d Third electron configured in diffuse orbital
Å Amstrong (unit)
A Constant
a Negative deformation potential
a.u. Arbitrary unit
Ac Acetate
Ag Silver
Ag2S Silver (II) sulfide
Ag2Se Silver (II) selenide
AlGaAs Aluminum Galium Arsenide
AOT Aerosol OT
Ar Argon
atm Standard atmosphere pressure
Au Gold

xiii
B Boron
C Carbon
c Intercept at y-axis
c Speed of light
C36H66MnO4 Manganese-oleate
C36H70CdO4 Cadmium-oleate
Cd Cadmium
CdMe2 Dimetyl cadmium
CdS Cadmium selenide
CdSe Cadmium selenide
CdTe Cadmium telluride
CFQDs Cadmium free quantum dots
CH2 Methylene or carbene
CH3 Methyl group
CH4 Methane
cm Centimeter (unit)
Co Cobalt
Co.sol Coordinating solvent
C-QDs Carbon quantum dots
Cr Cromium
CTAB Cetyl trimethyl-ammonium bromide
Cu Cooper
CV Cyclic voltametry
d Diameter
DA Area weighted average
DDA Dodecylamine

xiv
DEPE 1,2-bis(diethyl-phosphino)-ethane
DMPA 2,2 –dimethoxy-2-phenylacetophenone
DMS Diluted magnetic semiconductor
DNA Deoxyribonucleic acid
DV Volume weighted average
e Charge of electron
ɛ Dielectric constant
E Energy primary to photon energy
Eg Band gap energy
EGDMA Ethylene glycol domethacrylate
EMA Effective mass approximation
ERy* Rydberg energy
Et Ethyl
eV Electron volt (unit)
Fe Iron
FIB Focused ion beam
FTIR Fourier Transform Infrared Spectroscopy
FWHM Full-width at half maximum
g gram (unit)
g/ml gram per milliliter (unit)
g/mol gram per molar (unit)
Ga Galium
GaAs Galium Arsenide
GPa Gigapascal (unit)
GQDs Graphene quantum dots
h Plank`s constant

xv
ℏ Reduced Plank`s constant
H2 Hidrogen
HAD Hexadecylamine
Hg Mercury
HgTe Mercury telluride
HOMO Highest occupied molecular orbital
HPA Hexyl-phosphonic acid
HRTEM High Resolution Transmission Electron Microscopy
I Electron intensity
I2LO Peak intensity of first overtone of longitudinal optical
ILO Peak intensity of longitudinal optical
Imax Maximum peak intensity
InP Indium phosphate
J Photon flux
j Total electronic angular momenta
K Instrumental factors
k Scherrer`s constant
ƙ Wave vector
kV Kilo volt (unit)
L Crystallite size
l Total orbital angular or angular quantum number
LA Lauric acid
LCAO Linear combination of atomic orbitals
Li Litium
LO Longitudinal optical
LP(θ) Lorentz and polarization factor

xvi
LUMO Lowest un-occupied molecular orbital
m* Effective mass
me Effective mass of electrons
Me Methyl
meV Milli electron volt (unit)
Mg Magnesium
mh Effective mass of holes
Mhkl Multiplicity
min Minute
ml milliliter (unit)
mm Millimeter (unit)
MMA Methylmethacrylate
Mn Manganese
MPA Marcaptopropionic acid
MRI Magnetic resonance imaging
N Nitrogen
Na Sodium
NaOH Sodium hydroxide
NCs Nanocrystals
NIR Near infrared
OA Oleic acid
ODA Octadecylamine
ODE 1-octadecene
P Phosphorus
PbS Lead sulfide
PEG Polyetylynglicol

xvii
PL Photoluminescence
QDs Quantum dots
QY Quantum yield
R Crystal size
r Radius
r(dot) Radius of quantum dots
rB Bohr radius
R-CH3(CH2)nCH3 Paraffin oil
RIE Reactive ion etching
RNA Ribonucleic acid
s Spin momenta or spin quantum number
S Sulfur
S(hkl) Structural factor
s-1
Per second
SA Stearic acid
SDS Sodium dodecyl sulphate
Se Selenium
sec Second
SERS Enhanced raman spectroscopy
Si Silicon
SO Surface optical
TBP Tri-n-butyl phosphine
TCH Thompson-Cox-Hasting function
TDPA Tetradecylphosphonic acid
Te Tellurium
tech TOPO Technical grade TOPO

xviii
temp Temparature
TF(θ) Temperature factor
TMPPA Phosphonic acid
TMS Trimethyl-silyl
TOA Trioctyl amine
TOP Trioctylphosphine
TOPO Tri-n-octyl-phophine oxide
TOPSe Trioctylphosphine selenide
UCPL Up converted photoluminescence
UV Ultra-violet
UV-vis Ultra-violet visible spectroscopy
W Molar ratio of water and surfactant
XPS X-ray photoelectron spectroscopy
XRD X-ray Diffractometer
Zn Zinc
ZnO Zinc oxide
ZnS Zinc sulfide
ZnSe Zinc selenide
ZnTe Zinc Teluride
α Absorption intensity
β Peak broadening primary refer to full-width at half maximum
βi Broadening by instrument factor
βo Observed broadening
βr Broadening by crystallite size and strain
ΓG Thompson-Cox-Hasting function in Gaussian term
ΓL Thompson-Cox-Hasting function in Lorentzian term

xix
η Strain
θ Bragg angle
λ Wavelength
μ Reduced mass
ρ Concentration of the atom or ion in the solid
σ Cross-section for photoelectron production
υ Frequency
υo Exciton frequency
υv Stokes shift frequency
𝛌 Electron attenuation length

1
CHAPTER ONE
INTRODUCTION
1.1 Background
Quantum confinement effect in quantum dots (QDs) II-VI group semiconductors
is prominently factor that contributed to the great optical and electronic properties
(Dongzhi et al., 2007). Thus, it had been intensively use in wide range of industrial
applications such in laser, bio-medical imaging and labels and light-emitting diodes
(Alivisatos, 1996; Lee et al., 2006; Klimov et al., 2000; Leatherdale et al., 2000;
Bruzhez et al., 1998; Crooker et al., 2003; Sung et a., 2006; Murray et al., 1993; Peng et
al., 1998). Cadmium selenide (CdSe) QDs is the II-VI semiconductor nanocrystal that
profoundly shows almost full range of visible light emission within a reasonable size
range compared to the other colloidal semiconductor nanocrystals (Sung et al., 2008).
Since technology and applications are moving faster with time, the need to produce
more sufficient QDs to fulfill the application need and is crucial to the research field all
around the world. Many reported works on altering the QDs properties by introducing
several doping elements to create core-shell QDs for improving or tailoring the QDs
properties to meet the need of applications (Jiang et al., 2012).
Effort on doping of QDs was arise since it is realize that the pure QDs
experience unpassivated surface due to the low atomic coordination numbers at the
surface compare to interior atoms. Hence, incomplete bonding relative to the interior
atoms forms unpassivated orbitals that are localized and carry a slight negative and
positive charge (Smith & Shuming, 2010). This inhomogenous charge will weakly

2
interact among them and form a band structure. If the energy of the unpassivated
orbitals band fall within the semiconductor band gap, then electron and holes can be
trapped at the surface of the crystal (Pokrant & Whaley, 1999). Example like in CdSe
QDs system, Cd unpassivated orbitals role as electron trap while Se unpassivated
orbitals role as hole trap. In addition, surface defect can also induce charges carrier trap.
This phenomenon induced non-radiative recombination resulting decrease of
fluorescence quantum yield. Introduction of surface bound organic ligand is generally
used to passivate the surface trap. System like CdSe QDs, the use of tri-n-
octylphosphine oxide (TOPO) and trioctylphosphine (TOP) were use as surface
passivated and as a surfactant that control the growth of CdSe QDs (Peng et al., 1997).
Despite simultaneous surface passivation by organic ligand are difficult for both anionic
and cationic surface trap since the QDs surface is incompletely covered by organic
ligand due to steric hindrance between bulky organic ligand (Peng et al., 1997; Peng et
al., 2000). Furthermore, many have reported the doping of inorganic semiconductor
shell onto the QDs surface enables the simultaneous passivation of anionic and cationic
surface trap since the probability for excitons to decay through radiative path increase
(Pokrant & Whaley, 1999).
Most common doping of CdSe QDs core-shell was the doping of shell with
larger band gap energy compare to the one possesses by the core elements. This is in
objective of creating band gap heterostuctures and significantly improve the surface
passivation (Peng et al., 1997). Example like synthesized of ZnS/CdSe, CdS/CdSe and
ZnSe/CdSe core-shell QDs are efficiently improved the quantum yield to about ~80 %
(Mekis et al., 2003; Ivanov et al., 2004; Reiss et al., 2002).

3
Equally important, the doped of intrinsically small transition metal atoms such
as magnesium (Mg) (Kwak et al., 2007), manganese (Mn) (Shen et al., 2016; Hou et al.,
2016; Norris et al., 2001), zinc (Zn) (Kwak et al., 2007), copper (Cu) (Meulenberg et
al., 2004), cobalt (Co) (Giribabu et al., 2013) and iron (Fe) (Das et al., 2014) into
variety of II-VI semiconductor QDs to achieve tunable, intense and optical and
electronic properties. Among II-VI QDs semiconductor core-shell, CdSe QDs doped
with Mn2+
catch an interest since it was the simplest way to tune the emission
wavelength due to the significantly smaller Mn atom (~0.8 nm) compared to host CdSe
atom. The Bawendi group, reported for the first time the successful of synthesized Mn-
doped CdSe QDs by organometallic decomposition technique using complex
organometallic compound {Mn2(u-SeMe)2(CO)8} (Miculec et al., 2000). A few years
later, Erwin et al. (2005), reported that the surface absorption energy during the QDs
growth are controlled by impurity incorporation. They proposed that the {001} facets in
zinc blende CdSe QDs possesses higher binding energy (~4 – 6 eV) compred to any
facets in wurtzite CdSe QDs (Erwin et al., 2005; Sung et al., 2008). Based on this, it is
strongly believe that the intention to doped Mn into CdSe are highly restricted to self-
purification in it wurtzite structure (Erwin et al., 2005; Sung et al., 2008). A great
successful of Mn doping in CdSe with a zinc blende structure was predicted by the
density-functional theory (Perdew et al., 1996). Furthermore, Mn-doped CdSe QDs
have thermal stability and strong confinement of excited electrons and holes which lead
to great optical and electronic properties compared to the un-doped CdSe bulk
semiconductor (Kwak et al., 2007).
It has been reported by many researcher on the synthesis of CdSe QDs, such as
single molecule precursor route (Green & O`Brien, 1999; Castro et al., 2003),
solvothermal route (Guifu et al., 2006; Linhui et al., 2013), sonochemical route

4
(Yupapin et al., 2011), microwave irradiation route (Schumacher et al., 2009),
organometallic precursor route (Murray et al., 1993; Hambrock et al., 2002) and non-
organometallic precursor route (Qu et al., 2001; Bullen & Mulvaney, 2004). The
popular wet-chemical synthesis methods of CdSe QDs using the coordinating solvents
such as TOPO and TOP, which hundreds of papers are published based on this route
(Yu & Peng, 2002). However, only little knowledge has been obtained for the formation
mechanism of the CdSe QDs by the TOP-Based route (Deng et al., 2005). Furthermore,
the costs for large-scale synthesis of QDs are still very high since TOP is expensive. In
addition, TOP is hazardous, unstable, and non-environmental friendly solvent (Deng et
al., 2005). Therefore, to attain the need of mass production, low cost, greener and fast
synthesis process of QDs crucially for various applications, non-TOP based routes are
more favorable (Deng et al., 2005). In this respect, high quality zinc blende CdSe QDs
are synthesized using non-TOP based routes which organic solvent and surfactant such
as paraffin oil and oleic acid were used. Deng et al. (2005) purposed the non-TOP
mechanism of CdSe QDs formation via inverse Micelle approach which they
successfully synthesized the high quality zinc blende CdSe QDs with oleic acid capping
(Deng et al., 2005). For extended studies of CdSe QDs with Mn doping, Kwak et al.
(2007) and Sung et al. (2008) used Mn acetate as a Mn precursor, for synthesizing high
quality zinc blende Mn-doped CdSe QDs (Kwak et al., 2007; Sung et al., 2008)
In this work, we synthesized Mn-doped CdSe QDs using greener inverse Micelle
technique which oleic acid was used as an organic ligand to the QDs surfaces and
controling the QDs. Our work is different with Kwak et al. (2007) and Sung et al.
(2008) because we synthesized and studied the properties of Mn-doped CdSe QDs at
various sizes (Kwak et al., 2007; Sung et al., 2008).
5
1.2 Important Research Problem
In semiconductor nanocrystal system such CdSe QDs, the crystal surface
condition are extremely crucial since the charge carrier transition at a crystal surface
draw a significant modification on the electronic and optical properties of CdSe QDs.
However, pure QDs such CdSe, will experienced surface defect that acted as a charge
carrier trap resulting the probability increase of non-radiative recombination which
reduces the fluorescence quantum yield (Talapin et al., 2001). In addition, similar to
many other QDs, CdSe QDs possesses high surface area which results in high surface
energy. Therefore, it is thermodynamically unstable or metastable (Devi et al., 2014).
Much effort has been put by researcher to encounter this problem by introducing
dopants into the CdSe QDs surface (Kwak et al., 2007). Surface doping using smaller
transition metal (i.e. Mn, Mg and Zn) onto QDs surface are one of the simplest way to
tune the light emission wavelength (Sung et al., 2008; Kwak et al., 2007). Among them,
Mn incorporation into CdSe QDs promised a high density diluted semiconductor for
spintronic application and provide good traps for excitation electrons which significant
for electronic and optoelectronic devices (Devi et al., 2014). However, doping of Mn2+
into CdSe QDs is limited due to the self-purification for QDs with wurtzite structure
(Perdew et al., 1996).
1.3 Significance of Research
CdSe semiconductor QDs has shown almost full range visible light emission
within a reasonable size range compared to other colloidal semiconductor nanocrystals
(Sung et al., 2008). Thus, this work significantly extended the research of CdSe QDs by
introducing Mn2+
into various sizes of CdSe QDs and enhanced the electronic and
6
optical properties of the QDs for various applications such as light-emitting diodes,
lasers and biological labels (Sung et al., 2008; Klimov et al., 2000). In addition, the
greener inverse Micelle technique was applied using organic ligand that is oleic acid.
This organic surface bound improved the QDs surface trap passivation of Mn-doped
CdSe QDs which then increase the quantum yield (Talapin et al., 2001). Moreover,
inverse Micelle technique is successfully used to doped Mn into CdSe QDs without the
risk of self-purification of Mn dopants as reportedly experience by wurzite CdSe QDs
(Sung et al., 2007). Mn-doped are predicted to optimize the surface simultaneously
pasivation of anionic and cationic surface trap states that cannot be overcome by
organic ligand (Talapin et al., 2001). In addition, Mn2+
corporation will introduce strain
to the CdSe QDs lattice which enable the tuning of inter-band energy structure. This
will promise the tunable of overall optical and electronic properties (Kwak et al., 2007).
1.4 Research Objectives
Objectives of this research are:
1. To synthesize colloidal Mn-doped CdSe QDs via inverse Michelle technique
2. To characterize Mn-doped CdSe QDs using several analytical techniques
3. To investigate the effect of varying the QDs size with its properties

7
CHAPTER TWO
LITERATURE REVIEW
This chapter describes the comprehensive background studies of Mn-doped
CdSe QDs including the possible synthesis techniques. The quantum confinement effect
also included in this chapter hence it is highly critical to describe the properties of the
QDs and doped QDs at various sizes. The possible mechanism of synthesizing Mn-
doped CdSe QDs is also included in this chapter for fundamental understanding of the
chemical reactions involved.
2.1 Quantum Dots
Quantum dots (QDs) were discovered in the mid of 1980’s when scientist found
unusual behavior of confined semiconductor atoms after the laser are stimulated to a
large amount of porous silicon samples. They discovered a new phenomenon of a red
light emission from silicon atom after been stimulated with laser. Prior to this, it is only
possible with connecting a diode to the electricity source (Brus, 1983; Brus, 1986; Reed
et al., 1988). Ekimov (1981) was the first discovered the present of QDs in a glass
matrix (Ekimov , 1981; Ekimov et al., 1985; Ekimov & Efros, 1988). Then Brus (1986)
discovered the QDs in a colloidal solution. He derived the relationship of size and
bandgap for semiconductor nanoparticles by apply a particle in a sphere model
approximation to the wave function for bulk semiconductors (Brus, 1986).
However, the term ‘quantum dots’ (QDs) is originally created by Reed in 1988
which defined as three-dimensional confined semiconductor quantum well (Reed et al.,

8
1988). In his paper, the electronic transport through QDs shows fine structure in
resonant tunneling which due to the discrete density of states in zero-dimensional
system (Reed et al., 1988).
Generally, QDs is defined as a semiconductor materials which having nanoscale
dimension (1- 100 nm) and highly confined in three spatial dimensions of either
electron pair or electron-hole (Dabbousi et al., 1997; Hamizi & Johan, 2010). The
electronic properties of QDs lie between bulk semiconductor and materials with discrete
molecules with almost similar sizes (Noris & Bawendi, 1996; Peng, 2000; Suyver et al.,
2000). The optoelectronic properties of QDs such as band gap are highly tunable as a
function of particles size and shape. Thus, it is possible to manipulate the emission or
absorption wavelengths by controlling the particles size to meet the specific application
(Murray et al., 2001; Brus, 2008). This serves as a basis to produce efficient
semiconductor lasers and optical amplifier, which are precisely tuned (Suri & Mehra,
2007). Furthermore, QDs promise the properties which could be harnessed for a wide
range of electronic and optical applications such as solar cells, transistor and laser diode
(Ji et al., 2003; Kasuya, 2004).
Beyond the optical and electronic applications, QDs has been applied in in-vivo
and in-vitro bioimaging and diagnostic of living cell as a substitute of conventional
organic dyes. The tunability of QDs fluorescence as a function of size are widely
available for biomedical application such as in surface enhanced raman spectroscopy
(SERS) and magnetic resonance imaging (MRI) contrast agent (Lee et al., 2013; Dahan
et al., 2003; Sapford et al., 2006).

9
2.2 Synthesis Techniques of QDs Materials
There are two major approaches for fabrication of QDs semiconductor materials
which is bottom-up and top-down methods (Bera et al., 2012).
In basis, the top-down method is the thinning or refining of bulk semiconductor to
form the QDs. Electron beam lithography, reactive-ion etching and wet chemical
etching is typical of top-down methods. Focused ion or laser beams are also used to
form arrays of QDs, however incorporation of impurities into the QDs and structural
imperfections by patterning have been it a major drawback. QDs are also widely
fabricated using etching technique. Dry etching for example is a plasmonic process,
which is operate by filling the etching chamber with a reactive gas species and a radio
frequency voltage is applied to in order to break down the gas molecules to form more
reactive fragment. These high kinetic energy species hit the surface and form a volatile
reaction product that will etch a patterned sample. In reactive ion etching (RIE), the
energetic species consist of ion, and with a masking pattern, selective etching of the
substrate can be produce (Bera et al., 2006). A Galium arsenide/Aluminium gallium
arsenide (GaAs/AlGaAs) quantum structure (~40 nm) has been successfully fabricated
using RIE by mixing boron trichloride and argon (Scherer et al., 1987). Furthermore,
RIE also reported to be use in production of close-packed arrays of zinc telluride (ZnTe)
QDs with interdot distance of 180 - 360 nm using methane (CH4) and hydrogen (H2)
(Tsutsui et al., 1993). Focused ion beam (FIB) techniques also can be use in fabricating
QDs. This techniques use molten metal source such as gallium (Ga) are sputter to the
surface of the semiconductor substrate in order to fabricate QDs with shape, size and
inter-particle distance that mold by the size and dimension of ion beam (Chason et al.,
1997). However this is a slow, low throughput process and requires expensive

10
equipment that leaves residual surface damage (Bera et al., 2010). Another method to
fabricating pattern QDs is electron beam lithography followed by etching or lift-off
processes. This method was successfully employed for the synthesis of III-V and II-VI
QDs with particle sizes as small as 30 nm (Bera et al., 2010).
The bottom-up methods can be subdivided into wet-chemical and vapor-phase
methods (Bera et al., 2012). The main components in the wet-chemical methods are the
chemical precursors, surfactant and solvent (Murray et al., 2000; Zherebetskyy et al.,
2014). In basis, wet-chemical method is the precipitation methods in solution with
precise control of parameters such as synthesis temperature, precursor concentration,
ratios of anionic to cationic species, micelle formation and synthesis time, which is
crucial in order to get desirable average QDs size, shape and composition. Furthermore,
it can be in a single solution or mixture of solutions. The precipitation process always
involves both nucleation and controlled growth of QDs (Murray et al., 2000;
Zherebetskyy et al., 2014). Nucleation can be classified as homogeneous, heterogeneous
or secondary nucleation. Homogeneous nucleation occurs when solute atoms or
molecules combine and reach a critical size without the assistance of a pre-existing solid
interface (Burda et al., 2005).
Initially, wet-chemical method in QDs production was pioneered by Louis Brus in
the late 1970s when he was in Bell Labs, and carried on by some of his post docs,
notably Paul Alivisatos and Moungi Bawendi (Bera et al., 2006; Klimov et al., 2000).
Sol-gel is one of the techniques that fall into the wet-chemical methods category
which have been used for many years to form QDs (Bang et al., 2006; Spanhel &
Anderson, 1991; Bera et al., 2008). The three main steps in sol-gel technique are

11
hydrolysis, condensation (sol formation) and growth (gel formation). Sol is product of
condensed metal precursor (alkoxides, acetates or nitrates) that been hydrolyzed in a
solvent that dispersed by Brownian motion. Next, the polymerization process is conduct
to produce a gel (Bera et al., 2010). Previously, many II-VI and IV-VI type of QDs
successfully prepared by using this method such as cadmium sulfide (CdS) (Spanhel,
1987), zinc oxide (ZnO) (Bang et al., 2006; Spanhel & Anderson, 1991; Bera et al.,
2008) and lead sulfide (PbS) (Sashchiuk et al., 2002). Example of this sol-gel method
was the production of ZnO QDs by mixing the Zinc acetate in alcohol and sodium
hydroxide (NaOH), followed by control aging in air (Bang et al., 2006). This incomplex
and economical method is suitable for mass production. However, sol-gel process
produced wide size distribution and a high concentration of defects which make it
sparingly use for QDs production (Sashchiuk et al., 2002; Bera et al., 2010).
Microemulsion is another popular wet-chemical method that is popular because
of its simplicity and can be operates at room temperature. There are two type of
microemulsion which is normal microemulsion (oil-in-water) and inverse
microemulsion (water-in-oil). It is quit straight forward that inverse microemulsion
produce inverse micelle, and this methods is popular among the scientist to produce
QDs compared to normal microemulsion. To create emulsion of inverse micelle, two
unmixable liquid that is polar solvent (i.e. polar water or polar alcohol), non-polar
solvent (i.e. non-polar long-chain alkane) and surfactant are mixed and stirred. As a
result, the nano-size water or alcohol droplets dispersed in the n-alkane solution which
is due to the contribution of surfactant that increases the surface tension of the water or
alcohol droplet. Surfactant like Aerosol OT (AOT), cetyl trimethyl-ammonium bromide
(CTAB), sodium dodecyl sulphate (SDS) or triton-X are the common surfactant use in
this method. Surfactants are terminated by hydrophilic and hydrophobic groups on
12
opposite ends, which form numerous tiny droplets called micelles that are
thermodynamically stable in the sustained oil medium. These micelles role as
‘nanoreactors’. Highly rapid stirring micellar solutions lead to a continuous exchange of
reactants due to dynamic collisions (Bera et al., 2010). The QDs size growth is
restricted by the micelle size which is controlled by the molar ratio of water and
surfactant (W) (Hoener et al., 1992).
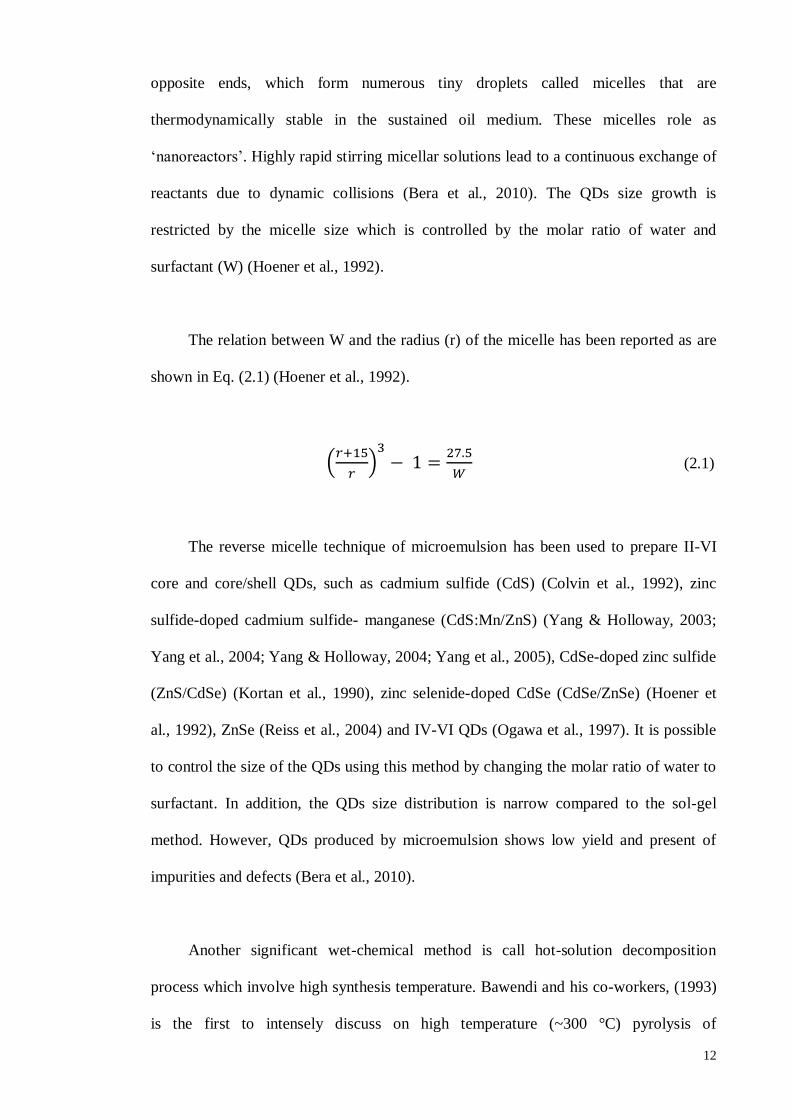
The relation between W and the radius (r) of the micelle has been reported as are
shown in Eq. (2.1) (Hoener et al., 1992).
(
)
(2.1)
The reverse micelle technique of microemulsion has been used to prepare II-VI
core and core/shell QDs, such as cadmium sulfide (CdS) (Colvin et al., 1992), zinc
sulfide-doped cadmium sulfide- manganese (CdS:Mn/ZnS) (Yang & Holloway, 2003;
Yang et al., 2004; Yang & Holloway, 2004; Yang et al., 2005), CdSe-doped zinc sulfide
(ZnS/CdSe) (Kortan et al., 1990), zinc selenide-doped CdSe (CdSe/ZnSe) (Hoener et
al., 1992), ZnSe (Reiss et al., 2004) and IV-VI QDs (Ogawa et al., 1997). It is possible
to control the size of the QDs using this method by changing the molar ratio of water to
surfactant. In addition, the QDs size distribution is narrow compared to the sol-gel
method. However, QDs produced by microemulsion shows low yield and present of
impurities and defects (Bera et al., 2010).
Another significant wet-chemical method is call hot-solution decomposition
process which involve high synthesis temperature. Bawendi and his co-workers, (1993)
is the first to intensely discuss on high temperature (~300 °C) pyrolysis of

13
organometallic compound in 1993 (Murray et al., 1993), which is nowadays among the
established method in synthesizing QDs (Hamizi & Johan, 2010). This method required
a mixture of precursors solutions of group II [i.e. alkyl (Murray et al., 1993), acetate
(Qu et al., 2001), carbonate (Qu et al., 2001) and oxides (Qu et al., 2001; Qu & Peng,
2002) and VI [i.e. phosphene or bis(trimethyl-silyl)] elements by simultaneous injection
of group II precursor solution into group VI precursor solution under a rapid stirring
condition (Bera et al., 2010; Murray et al., 1993; Hamizi & Johan, 2010). The
coordinating solvent such as trioctyl-phosphine oxide (TOPO), trioctyl-phosphine
(TOP) (Murray et al., 1993) and oleic acid (Zhengtao et al, 2005; Hamizi & Johan,
2010) are add in the process of preparing precursors solution which is aim to produce
well-dispersed QDs, increases surface passivation, and provides an adsorption barrier to
slow the growth of the QDs (Bera et al., 2010). As a result, homogeneous nucleation
and slow subsequent growth of QDs through ‘Ostwald ripening’ can be achieves. In
Ostwald ripening, smaller sizes QDs that possesses higher free energy lose it mass to
larger QDs, and gradually disappear. The final size of the QDs is mainly controlled by
the reaction time and temperature (Bera et al., 2010; Hamizi & Johan, 2010).
This method is widely used in synthesizing II-VI (Lee et al., 2006; Bae et al.,
2004; Hines & Sionnest, 1998; Yu et al., 2003; Chen et al., 2005), IV-VI (Bakueva et
al., 2003) and III-V QDs (Battaglia & Peng, 2002). This method promises a sufficient
thermal energy to anneal defects and results in monodispersed QDs (Bera et al., 2010).
A series of QDs size can be collect at different time interval from the same precursor
bath since growth of the particles is relatively slow using this method (Hamizi & Johan,
2010). Moreover, large amount of QDs can be obtain using this methods (Bae et al.,
2008), beside can also be use to produce QDs alloy (Zhong et al., 2003). However, the
toxicity of some organometallic compound use in this method essentially needs a great

14
precaution while handling the compound (Bera et al., 2010). Table 2.1 shows the
chronological summary of various QDs synthesized using hot solution decomposition
method with vary in chemical precursor and synthesis parameter.
QDs can also grow in water by applying sonic waves or microwaves to the water
bath containing a mixture of precursor. The precursor and the water molecules will be
separate by the energy from these waves leading to a growth of QDs (Zhu et al., 2000;
Qian et al., 2005; Bera et al., 2010).
QDs in the size range of 1 - 5 nm are reported synthesized using the ultrasound
waves. Ultrasound wave trigger the formation, growth and implosive collapse of
bubbles in a liquid to produce QDs (Zhu et al., 2000). An acoustic cavitation induced a
localized hotspot through adiabatic compression within the gas inside the collapsing
bubble, enabling the reactions that form QDs (Zhu et al., 2000; Bera et al., 2010).
15
Ref
erea
nce
s
Ols
hav
sky e
t al
.,
1990
Bre
nnan
et
al.,
1990
Murr
ay e
t al
., 1
993;
Kat
ari
et a
l.,
1994;
Pen
g e
t al
., 1
998
Part
icle
s
size
(n
m)
2.
4
2.5–5
1.2–11.5
Pro
cess
para
met
er
240 °
C f
or
3day
s; f
lam
e
annea
l at
45
0°C
DE
PE
and M
(ER
) 2 r
eact
ed,
(Tem
p.r
ange:
250–300 °
C)
300–350 °
C a
t 1 a
tm a
t A
r
(TO
PO
deg
assi
ng);
230–
260 °
C (
gro
wth
tem
p.)
Pre
curs
ors
GaC
l 3,
(TM
S) 3
As
in Q
uin
oli
ne
M(E
R) 2
; R
: n
-buty
l phen
yl;
E:
S,
Se,
Te;
M:
Cd, Z
n,
Hg a
nd/o
r
phosp
hin
e co
mple
xes
; C
o.S
ol.
:
DE
PE
Me 2
Cd,
sily
lchal
conid
es,
Phosp
hin
e ch
alco
nid
es;
Co.s
ol:
TO
PO
& T
OP
/TB
P
QD
s
GaA
s
ZnS
, Z
nS
e,
CdS
, C
dS
e,
CdT
e, H
gT
e
CdS
, C
dS
e,
CdT
e
Yea
r
1990
1990
1993
-1998
Tab
le 2
.1:
Chro
nolo
gic
al s
um
mar
y o
f hot-
solu
tion d
ecom
posi
tion m
ethods
of
var
ious
size
QD
s

16
Ref
erea
nce
s
Kher
& W
elss
, 1994
Mic
ic e
t al
., 1
995
Guze
lian
et
al., 1
996
(a)
; G
uze
lian
et
al.,
1996
(b)
Part
icle
s
size
(n
m)
6 -
10
2.6–4.6
(InP
),
3 (
GaP
),
6.5
(G
aInP
2)
2-6
Pro
cess
para
met
er
As,
Na-
K a
llo
y m
ixtu
re
refl
uxed
to 1
00 °
C i
n A
r fo
r 2
day
s; G
aCl 3
/GaI
3 d
igly
me
mix
ture
added
, hea
ted f
rom
0°C
to R
T t
o 1
11 °
C f
or
2 d
ays
270–360 °
C a
t ai
rles
s
condit
ion f
or
3 d
ays;
QD
s
dis
per
sed i
n m
ethan
ol
InC
l 3 &
TO
PO
hea
t at
100 °
C
for
12 h
, (T
MS
) 3P
added
, af
ter
3hr
hea
ted t
o 2
65 °
C f
or
6 d
ays
Pre
curs
ors
GaC
l 3/
GaI
3, dig
lym
e, A
s, t
olu
ene,
Na-
K a
lloy
Mix
ture
of
chlo
roin
diu
m/
gal
lium
oxal
ate
(GaC
l 3 f
or
GaP
) an
d
(TM
S)3
P i
n C
H3C
N ;
Co.s
ol:
TO
PO
& T
OP
InC
l3,
TO
PO
, (T
MS
) 3P
/(T
MS
) 3A
s
QD
s
GaA
s
InP
, G
aP,
GaI
nP
2
InP
, In
As
Yea
r
1994
1995
1996

17
Ref
erea
nce
s
Hin
es &
Sio
nnes
t,
1996
Dab
bousi
et
al.,
1997
Pen
g e
t al
., 1
99
8
Hin
es &
Sio
nnes
t,
1998
Part
icle
s
size
(n
m)
2.7
-4
2.3–5.5
2.5
-4
4.3–6
Pro
cess
para
met
er
Sin
gle
ste
p s
ynth
esis
Core
: 350 °
C
at 1
atm
at
Ar,
gro
wth
: 310 °
C
Shel
l: 3
00°C
Tw
o s
tep s
ynth
esis
(ai
rles
s)
Core
gro
wth
: 290–300 °
C
Shel
l gro
wth
: 140 °
C f
or
2.3
nm
&
220°C
for
5.5
nm
Tw
o s
tep p
roce
ss:
Core
: 300 °
C;
Shel
l: 1
00 °
C
HD
A d
ried
and
deg
asse
d a
t 150°C
for
hrs
in v
acuum
and h
eate
d t
o 3
10
°C a
t 1 a
tm i
n A
r; C
ore
gro
wth
wit
h
Zn &
Se
pre
curs
or
at 2
70 °
C.
Pre
curs
ors
Me 2
Cd,M
e 2 Z
n, S
e, (
TM
S) 2
S,
Co.s
ol:
TO
PO
, T
OP
Me 2
Cd,
Me 2
Zn,
Se,
(T
MS
) 2S
,
Co.s
ol:
TO
PO
, T
OP
Me 2
Cd,
Se,
(T
MS
) 2S
,
Co.s
ol:
TO
PO
, T
BP
Me 2
Zn,
Se,
HD
A, T
OP
QD
s
CdS
e/Z
nS
CdS
e/Z
nS
CdS
e/C
dS
ZnS
e
Yea
r
1996
1997
1997
1998

18
Ref
erea
nce
s
Core
(P
eng e
t al
.,
1998;
Guze
lian
et
al.,
1996)
Coore
/shel
l (C
ao &
Ban
in,
1999)
Pen
g e
t al
., 2
000;
Man
na
et a
l., 2000
Norr
is e
t al
., 2
001
Part
icle
s
size
(n
m)
2.5–6
(InA
s);
1.7
(core
/shel
l)
~6
2.7–6.3
Pro
cess
para
met
er
Tw
o-s
tep P
roce
ss (
airl
ess)
Core
gro
wth
: 260 °
C;
Shel
l: d
ropw
ise
addit
ion;
260 °
C
TO
PO
(+
HP
A 1
.5–3 w
t%)
deg
asse
d a
t 360 °
C (
or
310
°C,
280 °
C);
Core
gro
wth
:
300 °
C (
or
280 °
C o
r 250 °
C)
Dim
ethyl
Mn, T
OP
, S
e,
Die
thyl
Zn m
ixtu
re a
dded
to
HD
A a
t310 °
C i
n N
2.
Gro
wth
: 240–
300 °
C
Pre
curs
ors
(TM
S) 3
As,
Indiu
m
(III
)chlo
ride,
TO
P (
TM
S) 3
P,
Me 2
Cd;
TB
PS
e
Me 2
Cd,
Se,
TB
P, T
OP
O,
HP
A
Me 2
Mn,
Et 2
Zn, T
OP
, S
e, H
DA
QD
s
InA
s/In
P
InA
s/C
dS
e
CdS
e
ZnS
e:M
n
Yea
r
1996–
1999
2000
2001
19
Ref
erea
nce
s
Tal
apin
et
al., 2
001;
Hik
met
et
al.,
2003
Qu e
t al
., 2
00
1
Part
icle
s
size
(n
m)
4.5–5
2–25
Pro
cess
para
met
er
Tw
o S
tep:
Co
re:
reac
tion &
gro
wth
: 2
70–310 °
C;
Shel
l:
slow
addit
ion o
f Z
n &
S
pre
curs
or
at 1
80–220 °
C
Solv
ent
& C
d-p
recu
rsor
hea
ted t
o 2
50– 3
60 °
C a
t A
r;
TO
P-S
e or
TB
P-S
e in
ject
ed;
Gro
wth
tem
p:
200–320 °
C
(if
DD
A i
nvolv
e, t
emp:
~220
°C
Pre
curs
ors
Me 2
Cd,
Se,
TO
P,
TO
PO
,
HD
A,
(TM
S) 2
S,
Me 2
Zn
Sch
eme
1:
Cd(A
c)2,
SA
/ T
OP
O;
2:
Cd(A
c)2,
SA
; 3:
CdC
O3,
SA
/TO
PO
; 4:
CdC
O3,
LA
/TO
PO
; 5:
CdO
,
SA
/TO
PO
; 6:
Cd(A
c)2,
tech
TO
PO
; 7:
CdO
,
TD
PA
/TO
PO
QD
s
CdS
e/Z
nS
CdS
e
Yea
r
2001
-
2003
2001

20
Ref
erea
nce
s
Pen
g &
Pen
g,
2001
Qu &
Pen
g,
2002
Bak
uev
a et
al.
, 2003
Part
icle
s
size
(n
m)
2–8
5
Pro
cess
para
met
er
One
pot:
CdO
, H
PA
/TD
PA
hea
ted 3
00 °
C;
Core
wit
h
chal
conid
e pre
curs
or:
rea
ctio
n:
270 °
C,
and g
row
th 2
50 °
C
CdO
& S
A, hea
ted t
o 1
50 °
C i
n
Ar;
aft
er C
dO
dis
solu
tion,
cool
to
RT
; T
OP
O a
nd
HA
D a
dded
&
hea
ted t
o 3
20 °
C i
n A
r; T
BP
-Se
added
, G
row
th 2
90 °
C
PbO
dis
solv
ed i
n o
leic
aci
d a
t
150 °
C i
n A
r; (
TM
S)2
S &
TO
P
inje
cted
Pre
curs
ors
CdO
, T
OP
O,
HP
A/T
DP
A, S
, S
e, T
e
& T
OP
CdO
, S
e, T
OP
O,
TB
P,
HD
A,
OD
A,
SA
PbO
, O
A, (T
MS
) 2S
, T
OP
QD
s
CdS
, C
dS
e,
CdT
e
CdS
e
PbS
Yea
r
2001
2002
2003

21
Ref
erea
nce
s
Jang e
t al
., 2
003
Coe-
Sull
ivan
et
al.,
2005
Shin
ae e
t al
., 2
006
Den
g e
t al
., 2
005;
Ham
izi
& J
ohan
,
2010
Part
icle
s
size
(n
m)
~5
5
3-6
8-1
0
Pro
cess
para
met
er
CdO
+ O
A+
TO
A h
eate
d a
t 300 °
C i
n
N2,
TO
P-S
, T
OP
-Se
inje
cted
Sin
gle
Ste
p:
Pb a
ceta
te +
Co.s
ol
deg
asse
d a
t 100–120 °
C a
t 300–500
mT
orr
for
2h;
reac
tion a
nd g
row
th:
140
°C
CdO
+ O
A +
TO
A h
eate
d a
t 300 °
C;
TO
A +
C8S
H o
r C
18S
H i
nje
cted
Cd s
olu
tion p
repar
ed b
y m
ixin
g C
dO
,
OA
& p
araf
fin o
il a
nd h
eat
to 1
60 º
C.
Se
solu
tion p
repar
ed b
y d
isso
lvin
g S
e
in p
araf
fin o
il a
t 220 º
C. C
d s
olu
tion
inje
cted
to S
e so
luti
on a
t 220 º
C
Pre
curs
ors
CdO
, O
A, T
OA
, S
e, S
, T
OP
Pb-a
ceta
te t
rihydra
te,
OA
, S
e,
TO
P
CdO
, O
A, T
OA
, C
8S
H o
r C
18S
H
CdO
, S
e, O
A,
par
affi
n o
il
QD
s
CdS
eS
PbS
e
CdS
e
CdS
e
Yea
r
2003
2005
2006
2005-
2011
22
Hydrothermal synthesis approaches (Yang et al., 2008; Xie et al., 1996) and
similar approach (Rogach et al., 1996) have been used to synthesis QDs. This synthesis
approach involved the controlled of pressure and temperature during the crystallizations
of aqueous inorganic salts. Lowering the temperature and/or pressure will generally
caused the solubility of inorganic salts to dropped, results in formation of crystal
precipitates (Yang et al., 2008; Xie et al., 1996). Tailored reactants, temperature,
pressure, reaction and aging time can produce various sizes and shapes of QDs (Bera et
al., 2010).
Vapor-phase methods are one or the bottom-up methods in producing QDs beside
wet-chemical method. These methods begin with process of layers are grown in an
atom-by-atom. Consequently, self-assembly of QDs occurs on a substrate without any
patterning (Leonard et al., 1993; Swihart, 2003). Indium gallium arsenide (InGaAs) and
aluminum indium arsenide (AlInAs) QDs are successfully synthesized using this vapor-
phase method (Lobo & Leon, 1998). Despite produced QDs in inhomogeneous sizes,
this synthesis approach effectively produced QDs arrays without template (Bera et al.,
2010).
2.3 Materials in QDs
History of QDs begins when it was first discovered in glass crystals by Russian
physicists, Ekimov and Onushchenko (1981) at early 1980`s (Ekimov & Onushchenko,
1981). Efficient advancement in the science and technology of QDs was driven after
1984, when Brus (1984) derived a relationship of size and bandgap for QD by applying
a particle in a sphere model approximation to the wave function for bulk
semiconductors (Brus, 1984; Brus 1986). However, it took nearly a decade for a new

23
encouragement in QD research until the successful synthesis of colloidal CdX (X = S,
Se, Te) QDs with size-tunable band-edge absorption and emissions by Murray et al.
(1993) (Murray et al., 1993). To this date, CdX is the most investigated QDs owing to it
excellent optical and electrochemical properties. Realized of it high potential in
biological applications, the toxicity of Cd ion in CdX was paid more and more attention
(Bera et al., 2010).
For traditional QDs, Cd is the key element for their composition. However,
major drawback to Cd based QDs potential in applications is the leaking of Cd ions
which are culpits to the cytotoxicity problem. This is the main problem in it future in
applications to cellular or in vivo study. Due to high demand in biocompatible QDs, the
emphasis has shift toward the fabrication of Cd-free QDs such as silicon QDs (Si QDs),
carbon dots (C-dots), graphene QDs (GQDs), Ag2Se, Ag2S, InP and CuInS2/ZnS. Some
of them are not new emerging member, such as Si QDs, which appeared even as early
as 1990`s. In addition, this Cd free QDs reported to possesses excellent properties which
promise a wide applications as luminescent probes for biosensing and bioimaging (Bera
et al., 2010).
Si has been known to have indirect semiconductor band gap and poor optical
properties for a long time. It was until the 1990`s when efficient light emission from Si
was reported by Canham (Canham, 1990) and a year later, Lehman and Gosele (1991)
proposed the explanations on the features of porous Si absorption spectra by using
quantum confinement (Lehman & Gosele, 1991). This emerged the interest of
researcher on Si QDs. There are three discrete photoluminescence bands for Si QDs,
which is in the infrared, red and blue light range. The main advantage of Si QDs is their
good biocompatibility. Si QDs were reported to be at least ten times safer than Cd-based
24
QDs under UV irradiation (Fujioka et al., 2008). Moreover, Canham (2007) proposed
utilize of the nanoscale Si as a food additive (Canham, 2007). Till present, numerous
methods have been reported to produce colloidally and optically stable, water-
dispersible Si QDs, incorporating a range of bottom–up and top–down approaches
(Bruhn, 2012). However, a main obstacle in bioimaging applications is their oxidative
degradation in the biological environment. For a Si QDs in solution phase, surface
modification is necessary. Erogbogbo et al. (2011) prepared Si QDs using a nanoparticle
synthesis, surface functionalization, polyetylynglicol (PEG)ylated micelle
encapsulation, and bioconjugation process. This surface modification process are
reported to successfully produced Si QDs that has a high potentials in multiple cancer-
related in vivo applications, including tumor vasculature targeting, sentinel lymph node
mapping, and multicolor NIR imaging in live mice, which showed great potentials of Si
QDs as biocompatible fluorescent probes for both in vitro and in vivo imaging
(Erogbogbo et al., 2011).
Carbon dots (C-dots) are a new class of carbon nanomaterials with sizes below
10 nm, which were first reported to be successfully produced during purification of
single-walled carbon nanotubes through preparative electrophoresis (Xu et al., 2004).
Since the discovery of their outstanding optical property, C-dots have attracted wide
attentions and shows great potentials in biological applications. C-dots has a unique
optical property of excellent up-converted PL (UCPL) besides a normal or down-
converted photoluminescence (PL). This enables the design of high-performance,
complex catalyst systems based on C-dots for efficient exploitation of the full spectrum
of sunlight (Shen et al., 2012; Cao et al., 2007; Li et al., 2012; Ming et al., 2012). In
addition, C-dots can exhibit PL emission in the near infrared (NIR) spectral region
under NIR light excitation, which is particularly significant for in vivo bio-

25
nanotechnology due to its low auto-fluorescence and high tissue transparency in the
NIR region (Lim et al., 2006; Tang et al., 2012). Apart from its strong fluorescence, C-
dots also shows distinct properties such as electrochemical luminescence (Ding et al.,
2002; Zhu et al., 2009; Zhou et al., 2010 (a)), photo-induced electron transfer property
(Zhang et al, 2012; Wang et al, 2009), photo-catalysis (Li et al., 2012), optoelectronics
(Ponomarenko et al., 2008; Girit et al., 2009), which all extend their applications in
various areas. Graphene QDs (GQDs) are one of the C-dots materials which have also
attracted a lot of interest from researchers over the past few decades because of their
fascinating optical and electronic properties. Graphene is a zero band gap material in
principle, but the band gap of graphene can be tuned from 0 eV to that of benzene by
varying their sizes (Yan et al., 2010; Shen et al., 2012). The one dimension graphene
sheets could be converted into zero dimension GQDs, which assume to possess
numerous novel chemical and physical properties due to the apparent quantum
confinement and edge effects (Zhou et al., 2012 (b); Pan et al., 2010). Although GQDs
are considered as a member of C-dot family, GQDs shows several distinctions features
compared to general C-dots (Li et al., 2013). The C-dots are either amorphous or
crystalline, while GQDs possess graphene lattices inside the dots, in spite of the dot
sizes (Baker & Baker, 2010). Additionally, luminescent C-dots contain discrete, quasi-
spherical carbon nanoparticles with sizes below 10 nm, while GQDs are always defined
as the graphene sheets with lateral dimensions than 100 nm in either single, double, or a
few (3 to <10) layers (Shen et al., 2012; Ponomarenko et al., 2008). In general, the
average sizes of GQDs are mostly below 10 nm, and the largest diameter of GQDs
reported is 60 nm, which is reliant on the preparation methods (Liu et al., 2011). In
addition, GQDs shows properties of photoluminescence, good electron mobility and
chemical stability, electrochemical luminescence, and photocatalyst which contributed
to the fabrication of numerous sensors and bioimaging (Li et al., 2013; Shen et al.,

26
2012). Beside Si QDs, C-dots and GQDs, other kinds of Cd-free QDs have also been
intensely developed due to their good biocompatibility and excellent optical properties.
Examples of this others Cd-free QDs is InP (Yong et al., 2009), InP/ZnS (Tamang et al.,
2011), CuInS2/ZnS (Chen et al., 2013; Li et al., 2009), Ag2Se (Gu et al., 2012), Ag2S
(Hong et al., 2012) which shows outstanding potentials in biological imaging
applications (Chen et al., 2013; Li et al., 2009).
As an alternative to QDs, fluorescent metal nanoclusters which known to
possess very small size, superior biocompatibility, and excellent photostability, have
become a new class of fluorescent labels for biological applications. Among them, gold
(Au) and silver (Ag) nanoclusters attract much more attentions. Initially, little attention
was paid to this metal nanocluster due to extremely low quantum yield (QY) of 10-10
observed in PL from the noble metals. However, the enhancement on the QY up to 10−3
to 10−1
have been attracted interest among researchers (Mooradian, 1969). Until now, a
lot of Au and Ag NCs stabilized with different scaffolds (protein, peptide, and
oligonucleotide) have been developed and applied for the detection of thiol compounds
(Huang et al., 2011), metal ions (Su et al., 2010; Lan et al., 2010), protein (Sharma et
al., 2011; Li et al., 2012), deoxyribonucleic acid (DNA) (Yeh et al., 2012), ribonucleic
acid (RNA) (Dong et al., 2012) as well as intracellular and in vivo bioimaging. Dickson
and co-workers (2009) successfully transferred poly (acrylic acid)-stabilized Ag NCs
(PA-SCs) to anti-actin Ab/C12 and anti-α-tubulin/C12 conjugates to get fluorogenic
silver cluster biolabels for cell surface labeling (Yu et al., 2009). Wang et al. (2013)
reported fluorescent Au NCs could be spontaneously biosynthesized by cancerous cell
incubated with micromolar chloroauric acid solutions, a biocompatible molecular Au
(III) species, which could not take place in noncancerous cells (Wang et al., 2013). They
further realized in vivo self-bioimaging of tumors by subcutaneous injections of

27
millimolar chloroauric acid solution near xenograft tumors of the nude mouse model of
hepatocellular carcinoma or chronic myeloid leukemia. This shows potential of
fluorescent metal nanoclusters for in vivo bioimaging (Wang et al., 2013). Specially,
DNA-stabilized Ag NCs possess apparent advantage in DNA biosensing because of the
uncomplicated assembly of DNA sequence. Werner and colleagues designed a
nanocluster beacon to detect a DNA series related to the human Braf oncogene based on
an interesting phenomenon that the red fluorescence of DNA-stabilized Ag NCs could
be improved 500-fold when placed in proximity to guanine-rich DNA sequences (Yeh
et al., 2010).
2.4 Doping in QDs
Doping in QDs by intentionally incorporating impurities into the colloidal
semiconductor is a noteworthy approach to modifying the electronic, optical and
magnetic properties of the QDs (Stowell et al., 2003; Norris et al., 2008), especially for
technological applications such as optoelectronic, magnetic, biological and spintronic
applications (Bryan & Gamelin, 2005; Norris et al., 2008). These impurities will interrpt
the band structures by producing local quantum states that lies inside the band gaps.
Significantly, quantum confinement effect in QDs will permits the dopants to be auto-
ionized without thermal activation. This auto-ionization takes place when quantum
confinement energy exceeds Coulombic interaction between carrier (hole or electron)
and impurity (n-type or p-type) (Bera et al., 2010).
Various transition elements such as, chromium (Cr) (Yu et al., 2007),
manganese (Mn)( Beaulac et al., 2009), iron (Fe) (Rajabi et al., 2013), cobalt (Co)
(Radovanovic & Gamelin, 2001), cooper (Cu) (Stouwda et al., 2009) and silver (Ag)

28
(Sethi et al., 2009), and other elements, such as, phosphorus (P) (Hao et al., 2009),
boron (B) (Fan et al., 2014), sodium (Na) (Orlinskii et al., 2004) and litium (Li)
(Orlinskii et al., 2004) were doped into QDs, for various applications. Optical properties
of QDs can be tailor by changing the amounts (Yang et al., 2005) and the positions
(Yang et al., 2006) of dopants in the QDs. In addition, doping QDs with transition metal
ions such as Mn2+
induces diluted magnetic semiconductor phenomenon that can be
useful in spintronic devices due to the effect of giant Zeeman splitting, which results
from the exchange interaction between the transition metal ions and the electronic states
of the QDs host (Yu et al., 2010; Efros et al., 2001).
Doped Mn into II-VI QDs has captured huge attention of scientists for more than
a decade because of it good potential in improves the in solar cell and spintronic devices
efficiency (Huynh et al., 2002; Awschalom & Kikkawa, 1999). Mn possesses
paramagnetic properties that will provides a means of coupling the optical and magnetic
properties of these materials via sp-d inter-band exchange interaction. Mn2+
acts as a
paramagnetic centre (S=5/2) which will substitutes cation from group II cation in the
semiconductor lattice (Oluwafemi et al., 2010). The interaction between the
semiconductor host and the Mn, creates a new class of materials which will arise
interesting magnetic and optical properties that are not possesses by either bulk diluted
magnetic semiconductors (DMS) or pure QDs (Levy et al., 1996; Miculec et al., 2000;
Norris et al., 2001). Mn reported to has been successfully doped into CdS, ZnS and
ZnSe QDs that exhibits zinc-blende structure (Levy et al., 1996; Norris et al., 2001; Li
et al., 2006). Despite, Mn doping into CdSe QDs has been highly restricted (Erwin et
al., 2005; Kwak et al., 2007) due to intrinsic properties of CdSe, Mn adsorption binding
energy and parasitic binding of Mn by strong surfactants (Oluwafemi et al., 2010).
29
Mikulec was first reported to has been successfully doped Mn into CdSe QDs
using custom designed precursor via a high temperature pyrolysis (Mikulec et al.,
2000). In this reaction, organometallic decomposition of Mn2(μ-SeMe)2(CO)8,
trioctylphosphine selenides (TOPSe) and dimethyl cadmium (CdMe2) in TOPO was use
to produce zinc blende Mn-doped CdSe QDs. A number of attempts to use simpler
precursors containing only manganese were not succeed (Oluwafemi et al., 2010).
Zinc blende CdSe was suggested to have higher banding energy of the {001}
facet compare to any facets in wurtzite CdSe . This theory was proposed by Erwin et al.,
(1996) which is based on the density-functional theory (Erwin et al., 2005; Perdew et
al., 1996). Thus, they suggested that it would be possible to dope zinc blende CdSe QDs
with Mn compare to wurtzite CdSe QDs. Recently based on the Erwin et al. proposition,
Kwak et al. successfully synthesized Mn-doped zinc-blende CdSe QDs via an inverse
micelle technique and concluded that wurtzite CdSe cannot be doped with Mn due to
self purification (Kwak et al., 2007). On the other hand, Erwin et al., try to solve this
restriction and reported a synthesis of Mn-doped wurtzite CdSe by using a weak
binding surfactant in 2005 (Erwin et al., 2005). However this reaction involves severe
conditions such as injection of hazardous and toxic metal-alkyls. In addition, these
metal-alkyls are easily volatile compound having a low boiling point, explosive at
elevated temperature, and pyrophoric. Therefore this synthesis process requires standard
airless techniques. Hence, it is agreeable that this method is for a research setting but
undesirable for commercial exploitation (Oluwafemi et al., 2010).

30
2.5 Quantum Confinement Effect
In the early 1980s, Ekimov and Onushchenko (1981) at the Ioffe Physical-
Technical Institute in St. Petersburg detected the unusual optical spectra from glass
samples containing CdS and CdSe, this was first hints that quantum confinement in
zero-dimentional was possible (Ekimov & Onushchenko, 1981). The samples were
exposed to high temperatures which induced precipitates of the nanocrystallites on the
glass. The quantum confinement of electrons in these crystallites shows the uncommon
optical behaviour (Ekimov & Onushchenko, 1981; Reed, 1993).
For better understanding about quantum confinement effect, imagine an electron
trapped in a box. Quantum mechanics states that the electron has wave properties, like
the ripples on water or the vibrations of a violin string. Similar to a violin string tied
down at both ends, the electron wave is bounded by the walls of the box. The
wavelength of the string’s vibrations (or the electron’s) must fit within these confines.
In the case of the violin string, the point at which it is tied down changes as the
violinist’s finger slides up the fingerboard. The length of the allowed waveform
shortens, and the frequency of the string’s vibrations increases, as does that of all its
harmonic overtones. If the size of an electron’s confining box is made smaller, the
electron’s lowest energy level (the analogue of the fundamental pitch of the violin) will
increase (Reed, 1993).
For semiconductor nanocrystallites, the fundamental “pitch” is the threshold
energy for optical absorption, and the harmonic overtones correspond to new absorption
features at higher energies. In a vacuum, the effects of confinement will begin to occur
when the electron is trapped in a volume about 10 Å across. This size implies an

31
electron wavelength of 20 Å and therefore energy of about one fortieth of an electron
volt (eV). In this case, semiconductor physics is an aid for the nanotechnologist. The
wavelength of an electron depends on its energy and it’s mass. For a given wavelength,
the smaller the mass, the larger the energy, and the easier it is to observe the energy
shift which causes confinement. The electrostatic potentials of the atoms in the
crystalline lattice are superimposed to provide a medium in which the electron waves
propagate with less inertia than they do in the free space. The “effective mass” of the
electron is thus less than its actual mass (Takagahara & Takeda, 1992; Reed, 1993).
In GaAs the effective mass is about 7 % of its effective mass in a vacuum,
whereas the effective mass is 14 % in a Silicon. Consequently, quantum confinement in
semiconductors occurs in a volume about 100 Å. The threshold of optical absorption for
nanocrystallites shifts to higher energies, away from the red end of the spectrum, as the
crystallite becomes smaller. This effect appears most significantly in CdSe clusters,
which is the progression from deep red to orange to yellow (Reed, 1993).
Quantum confinement generally results in a band gap widening as a function of
size of the QDs decrement. The band gap in a material is the energy necessary to form
an electron and a hole at rest (i.e., with zero kinetic energy) at a distance far enough
apart that their Coulombic attraction is negligible. If one carrier approaches the other,
they might form a bound electron-hole pair such as exciton, which energy is a few meV
lower than the band gap. This exciton behaves similar to a hydrogen atom, except that a
hole, not a proton, forms the nucleus. Apparently, the mass of a hole is much smaller
than that of a proton, which affects the solutions to the Schrödinger wave equation. The
distance between the electron and hole is called the exciton Bohr radius (rB). If me and
mh are the effective masses of electrons and holes, respectively, the exciton Bohr radius

32
for bulk semiconductor can be expressed by Eq. (2.2), where ε, ћ, and e are the optical
dielectric constant, reduced Planck’s constant and the charge of an electron, respectively
(Bera et al., 2010).
(
) (2.2)
If the radius (rdot) of a QDs approaches rB ( i.e., rdot ≈ rB, or rdot < rB), the motion
of the electrons and holes are confined spatially to dimension of the QDs which causes
an increase of the excitonic transition energy and the shows blue shift in the QDs band
gap and luminescence. The exciton Bohr radius is a threshold value, and the
confinement effect becomes significant when the QDs radius is smaller. For small QDs,
the exciton binding energy and biexciton binding energy (exciton-exciton interaction
energy) is much larger that for bulk materials (Klimov, 2006). Note that for a material
with a relatively higher ε or smaller me and mh, the rB is larger. Two detailed theoretical
approaches are used to intensely studies the exciton properties, which is the effective
mass approximation (EMA) model and linear combination of atomic orbital (LCAO)
theory (Bera et al., 2010).
This approach, based on the ‘Particle-in-Box Model’, is typycally used model to
predict quantum confinement. It was first proposed by Efros and Efros (Efros & Efros,
1982) in 1982 and later modified by Brus (Brus, 1983). It believes that a particle in a
potential well with an infinite potential barrier at the particle boundary. For a particle
free to assume any position in the box the relationship between its energy (E) and wave
vector (ƙ) is given by Eq. (2.3) where m* is a constant (effective mass) (Brus, 1983;
Bera et al., 2010).

33
(2.3)
In the EMA model, this relationship shows in Eq (2.3) and assumed to hold for an
electron or hole in the semiconductor, therefore the energy band is parabolic near the
band-edge. The shift of band gap energy (ΔEg) due to confinement of the exciton in a
QDs with a diameter rdot can be expressed as in Eq. (2.4), where, μ is the reduced mass
of an electron-hole pair and E* Ry is Rydberg energy (Brus, 1983; Bera et al., 2010).
–
(
)
(2.4)
The first expression of the Eq (2.4) represents a relation between ‘particle-in-a-
box’ quantum localization energy or confinement energy and the radius of the QDs (rdot)
whereas the second expression shows the Columbic interaction energy with a rdot-1
dependence. The Rydberg energy term is size independent and is usually insignificant
and negligible, except for semiconductors with small dielectric constant (Wang &
Herron, 1991). Based on Eq. (2.4), the first excitonic transition (i.e., the band-gap)
increases as the rdot decreases (quantum localization term shifts to higher energy with
lower rdot value (rdot-2
) and Columbic terms shifts excited electronic state to lower value
(rdot-1
). However, the EMA model breaks down in the small QDs regime (Murray et al.,
1993; Wang & Herron, 1991) because the E-k relationship can no longer be
approximated as parabolic. (Bera et al., 2010).
A model based on a linear combination of atomic orbitals–molecular orbitals
(LCAO-MO) offers more detailed basis for predicting the evolution of the electronic
structure of clusters from atoms and/or molecules to QDs to bulk materials, and

34
predicting the dependence of band gap on size of the crystals. As the number of atoms
increase, the discrete energy band structure change from large steps to small energy
steps, i.e., to a more continuous energy band. The occupied (bonding) molecular orbital
quantum states (equivalent to the valence band) are called the highest occupied
molecular orbital (HOMO) levels. The unoccupied anti-bonding orbitals (equivalent to
the conduction band) are called the lowest unoccupied molecular orbital (LUMO)
levels. The energy difference between the top of the HOMO and bottom of the LUMO
(equal to the band-gap) increases and the bands split into discrete energy levels reduced
mixing of atomic orbitals for a small number of atoms. Therefore, the small size of the
QDs results in quantized electronic band structures intermediate between the
atomic/molecular and bulk crystalline molecular orbitals (Bera et al., 2010).
Compared to the effective mass approximation, the LCAO-MO model provides a
methodology to calculate the electronic structure of much smaller QDs. In contrast, this
method cannot be used to calculate the energy levels of large QDs due to mathematical
complexity and limitations of the computing systems. Nevertheless, the degree of
quantum confinement is determined by the ratio of the radius of a QDs to bulk excitonic
Bohr radius (rB). At crystal sizes greater than the excitonic Bohr diameter (2rB),
semiconductor crystals exhibit translational motion confinement of the fully coupled
exciton due to a strong Coulombic interaction between the electron and holes, i.e.,
exhibits singleparticle confinement behavior (sometimes called the strong confinement
regime). In the intermediate size range (R ≤ rB), the transition energies of photoexcited
carriers in the crystal are determined by the relative strengths of the kinetic energy of
confinement and the electron-hole interaction (Bera et al., 2010).

35
Band-gap of QDs can be determined by electrochemical measurement using
Qdots films. Cyclic voltametry (CV) are often employed (Ogawa et al., 1997; Inamdar
et al., 2008) to determine the oxidation and reduction potential of the film of QDs to be
measured using a standard three-electrode cell. CV is a dynamic electrochemical
method in which current-potential curves are traced at a pre-defined scan rates. QDs
coated gold plate, platinum wire or indium tin oxide film on glass substrates are often
used as working electrodes and platinum electrode acts as a counter electrode. The cell
potential is generally normalized to reference electrode using Fc/Fc+ couple (Bera et al.,
2010).
2.6 Synthesis of Mn-doped CdSe QDs
Mn-doped CdSe QDs can be obtained from a variety of Cd and Mn precursors,
including Cd and Mn salts, combined with a Se precursor, which is usually prepared
from Se powder dissolved in trioctylphosphine (TOP) or tributylphosphine (TBP) (Peng
et al., 2001; Yu et al., 2003; Qu et al., 2001; Yordanov et al., 2005). The first hot-matrix
method used to synthesis Mn-doped CdSe QDs was from Cadmium Oxide (CdO) (Peng
et al., 2001) which utilized Cd (II) alkylphosphonate salts. Various fatty acids (such as
stearic acid), applied as ligands for Cd, yield relatively faster particle growth (Yu et al.,
2003; Qu et al., 2001; Yordanov & Minkova, 2005). Although the fatty acids are
compatible with Cd precursors, they are most suited for growth of larger QDs (4 –
5nm). The Cd precursor is typically dissolved in stearic acid (SA) at moderate
temperatures (100 – 150 °C), converting the precursor to Cd (II) stearate. Complex
solvent systems of mixed amphiphiles as ligands (Han et al., 2006) usually produce
QDs possessing high quantum yields of emission and monodisperse sizes (Yordanov &
Minkova, 2005).
36
However, the effects of each ligand could not be easily distinguished. For this
purpose, one should first investigate various mixtures of the precursor with non-polar
and non-coordinating solvents such as octadecene (Yu et al., 2003) and liquid paraffin
(Deng et al., 2005; Yordanov et al., 2005). As coordinating solvents, they form
complexes with Cd (II), which develop a capping layer on the nanocrystals’ surface
(e.g. hexadecylamine or trioctylphosphine oxide, TOPO). Liquid paraffin is defined as a
non-coordinating solvent because it is a mixture of saturated hydrocarbons without
functional groups capable of coordination with Cd (II). It is possible that the
coordinating solvents may alter the reactivity of the Cd precursor by coordinating the
Cd (II) ions to form the respective complexes. The altered reactivity of Cd (II)
precursors and the capping of nanocrystals with coordinating molecules may result in
different rates of nanocrystal nucleation and growth in different (coordinating and non-
coordinating) solvents (Yordanov et al., 2005).
Peng’s group (Yu et al., 2003) noticed that the concentration of oleic acid in
octadecene strongly affects the so-called phosphine-free synthesis of Cadmium Sulfide
(CdS) nanocrystals. However, stearic acid is expected to be more stable than oleic acid,
because of the lack of double bonds, which could be oxidized easily. Stearic acid was
found to be better than oleic acid for the synthesis of CdSe QDs in liquid paraffin.
Moreover, the growth kinetics of CdSe QDs was found to be different in paraffin with
either stearic or oleic acid (Yordanov et al., 2005). Embden and Mulvaney (2005)
studied the synthesis of CdSe QDs from Cadmium Oleate and trioctylphosphine
selenide (TOP-Se) in Octadecene (ODE). The CdSe QDs contained another
coordinating amphiphile namely: bis-(2,2,4-trimethylpentyl) phosphinic acid (TMPPA),
which was injected together with tributylphosphine selenide (TBP-Se). They classified
oleic acid as a “ripening agent”, because it accelerates the ripening processes. Increasing

37
its concentration led to the formation of larger particles at lower particle concentration
(Embden & Mulvaney, 2005).
A synthetic route for preparing high-quality CdSe QDs in an aqueous solution
was reported by Xianfeng Chen’s group from Oxford University (Chen et al., 2009).
When sodium selenide is used to synthesise CdSe QDs in the presence of 3-MPA, the
formation of QDs can only happen slowly during refluxing at certain temperatures
(above room temperature). Therefore, 3-MPA can form a dense layer on CdSe QDs and
synthesise extremely small CdSe QDs having higher luminescence in aqueous solutions
(Chen et al., 2009).
However, CdSe QDs produced by chemical synthesis that using trioctylphosphine
(TOP) (Murray et al., 1993) are most common. This is due to the fact that TOP based
routes produce high-quality wurtzite CdSe QDs, which are stable in atmosphere. This is
negated by the fact that TOP solvent is expensive and not environment-friendly. This
leads to the introduction of a new non-TOP based route, which is greener and cost-
effective (Deng et al., 2005). Both methods utilize Selenium (Se) and Cadmium Oxide
(CdO) powders as starting materials. Cadmium (Cd) is a toxic heavy metal and Se is
toxic in excessive amounts (Peng, 2002). Therefore, appropriate precautions should be
taken when handling these materials. For example, the experiment should be conducted
in a fume hood and the user should wear chemical gloves and a face mask (Gerion et al.,
2001).
Non-TOP based route (Inverse Micelle) is the synthesis of CdSe QDs by injecting
Cd oleic acid (Cd-OA) or Cd complex into a Se solution without using TOP (Peng et
al., 2001). This synthesis route is much greener than TOP based routes because it uses

38
oleic acid and paraffin oil, which are natural products without toxicity (Yu et al., 2003).
Therefore, this method is beneficial for scientific research and industrial sectors. This
method produces CdSe QDs with zinc blende structures (Danek et al., 1996). On the
other hand, TOP based route also produces CdSe with wurtzite structures (Trindade et
al., 2000). This leads to a new investigation since CdSe QDs possess different properties
between zinc blende cubic and wurtzite hexagonal structures (Sharma et al., 2003).
2.7 Mechanism in Synthesizing Mn-doped CdSe QDs
The Mn-doped mechanism is tailored from the synthesized of CdSe QDs
(Hamizi & Johan, 2010). There are two possible methods in synthesizing the CdSe
QDs. The trioctylphosphine (TOP) based method (Murray et al., 1993) and the new
convenient and greener non-TOP based route (Deng et al., 2005). Non-TOP based
method and TOP based method will be elaborated in Chapter Three of this report. Both
methods were using selenium (Se) and cadmium oxide (CdO) powders as part of the
starting materials. Cadmium (Cd) is a toxic heavy metal and Se is toxic in too large
amounts (Peng, 2002). Therefore, appropriate precautions should be taken when
handling them, such as, the experiment should be held in the fume hood and wearing
chemical gloves and face mask (Gerion et al., 2001).
Non-TOP based route is the synthesis of CdSe QDs by injection of Cd oleic acid
(Cd-OA) or Cd complex into a Se solution without using TOP (Peng et al., 2001). This
synthesis route is much greener than TOP based route because it using oleic acid and
paraffin oil which both are natural products without toxicity (Yu et al., 2003). This
synthesis route is less cost since TOP is too expensive. This will give great a benefit for
the scientific research and industrial sectors.

39
The mechanism in producing CdSe QDs using non-TOP based route involved
redox reaction. Eqs. (2.5-2.8) show the possible chemical reactions involved in the
formation of CdSe QDs. Eq. (2.5) demonstrates the CdO reacts with oleic acid to
generate Cd-OA solution. This reduction process in producing Cd-OA involved the used
of paraffin oil as a solvent but it doesn’t involved in this chemical reaction (Deng et al.,
2005).
CdO + Oleic acid Cd-OA (2.5)
Eq. (2.6) is a process of dissolving Se powder into the paraffin oil and a
dehydrogenation reaction to generate H2Se gas in situ. Under the heating process, Se is
reduced to H2Se gas, while the long alkane chains are oxidized to the long alkene
chains. There are three reasons which may play the important roles in the formation of
stable homogenous Se solution. The melting point of Se powder is 221 ºC, thus the
liquid state of Se can be formed at a temperature of near or above 221 ºC in the paraffin
oil. This liquid state then can be well dispersed in the paraffin oil that has long alkane
chains. The reaction will produced H2Se that can be decomposed to Se reversibly at the
present temperatures. However, if the temperature were rose to 300 ºC, the H2Se gas
will released immediately. Thus, the moderate temperature is favorable for the
formation of Se solution. Eq. (2.7) is a general equation to produce CdSe QDs (Deng et
al., 2005).
n/4Se + R-CH2(CH2)nCH3 R-CH2(CH2CH=CHCH2)NCH3 + n/4H2S (2.6)
H2Se + Cd-complex CdSe (2.7)
(Paraffin oil)

40
Eq. (2.8) summarizes the general redox reaction for the formation of CdSe QDs,
where Se acts as oxidant and CdSe as the reduction product. While the carbon atom in
long alkane chains acts as the reducing agent and the long alkene chains should be the
oxidation product (Deng et al., 2005).
CdO + Oleic acid + Se (oxidant) CdSe + Oxided products (2.8)
TOP based route is an established CdSe synthesizing method that been used by
researchers from all over the world since long time ago. Hundreds and hundreds of
papers have already been published based on this route (Deng et al., 2005). However,
only little knowledge has been obtained for the mechanism of the formation of the CdSe
QDs through this route. In particular, no chemical reaction equations on TOP based
route have been discussed in literature. Furthermore, the cost is high because the using
of expensively TOP (Yang et al., 2007). TOP is a coordinating solvent for Se that will
stabilize the nanoparticles against flocculation during synthesis. After synthesizing the
CdSe QDs, TOP will coats the nanoparticles to provide the electronic insulation and
passivating of the nanoparticles surface. The cost aspect has to be considered, especially
in the larger scale production. In addition, TOP is hazardous, unstable and not
environmental friendly solvent (Wang et al., 2009).
Several researches had come up with the theory of CdSe QDs formation in TOP
based route based on the study of Electron Diffraction X-Ray (EDX) and FTIR of CdSe
QDs (Kotkata et al., 2009). Eq. (2.9) is the possible chemical reaction in producing
CdSe QDs by introducing alkylcadmium (Me2Cd) and trioctylphosphine selenide
(TOPSe) precursor into a heated solvent under controlled conditions (Manna et al.,
2000).
41
Me2Cd + TOPSe CdSe + Byproducts (2.9)
2.8 Strain in QDs
Lattice strain or microstrain can be generally defined as the deformation lattice
divided by their ideal lengths which can presence in two types which is uniform and un-
uniform strain. Uniform strain causes the lattice parameter to expand or contract in an
isotropic direction which simply leads to a change in the lattice parameter and shift of
peaks. There is no broadening associated with this type of strain. Non-uniform strain
generates systematic shifts of atoms from their ideal positions and results in peak
broadening. Non-uniform strain is induced by numerous factors such as point defects
(i.e. vacancies and site-disorder), plastic deformation and poor crystallinity (Delhez et
al., 1993). The atomistic strain in QDs is usually on the order of 10% (Ameen et al.,
2014). The electronic band structure is changed by the lattice strain significantly in
nano-scale materials (Ameen et al., 2014).
Scherrer (1918) was first to observe that small crystallite size could increases
line broadening and derived it’s well known Scherrer formula (Scherrer, 1918).
Scherrer’s formula (Eq. (2.10)) is the commonly use formula to calculate crystallite size
(L) using the data extract from XRD spectra (Langford & Wilson, 1978).
(2.10)
Where, k is the Scherrer’s constant of the order of unity for normal crystals,
taking a value of 0.9 which is specifically for full-width at half maximum (FWHM) of
spherical crystals with a cubic symmetry. FWHM of analyzed data was used instead of

42
integral breadth since it is more precise by taking the consideration of the highly noise
diffraction peak. The X-ray wavelength is represented by , with a value of 1.5406 Å.
is the full width at half maximum (FWHM) or the broadening of the peak and is the
Bragg`s diffraction angle (Langford & Wilson, 1978).
Stokes and Wilson (1944) first discovered that strained crystals containing line
broadening of a different type compared to the broadening that induced by the small
crystallite size. Therefore, size and strain broadening shows difference Bragg`s angle (θ)
dependence (Stokes & Wilson, 1944) with derived as Eq. (2.11). Williamson and Hall
(1953) proposed a method for deconvolution size and strain broadening by considering
at the peak width as a function of 2θ as shown in the equation below (Williamson &
Hall, 1953).
(2.11)
(2.12)
Where βo is an observed broadening of the peak, βi is the broadening by instrument
factor, βr is the broadening induced by crystallite size and strain and βc is broadening by
crystallite size. By rearrange Eq. (2.12), to form a general equation for straight line (Eq.
(2.13)) where kλ/L is the intercept of graph line with y-axis and slope of the graph is the
strain as illustrated in Figure 2.1.
(2.13)

43
Figure 2.1: The general Williamson-Hall plot
Compared to Williamson-Hall analysis, Lorentzian and Gaussian term in the
Thompson-Cox-Hasting pseudo-voigt (TCH) function shows that the size and strain
parameters can be extracted from the refined profile parameters. Eq. (2.14) shows the
TCH function in Lorentzian (ΓL) term and Eq. (2.15) shows the TCH function in
Gaussian (ΓG) term (Karen & Woodward, 1998).
(2.14)
(2.15)
The Fourier Methods is reported to be the most accurate way of extracting size
and strain information is to analyze the entire shape of several reflections in the pattern,
ideally higher order reflections of the same type. This method developed by Warren and
Averbach (1950) can be done using the step by step procedure as following (Warren &
Averbach, 1950):
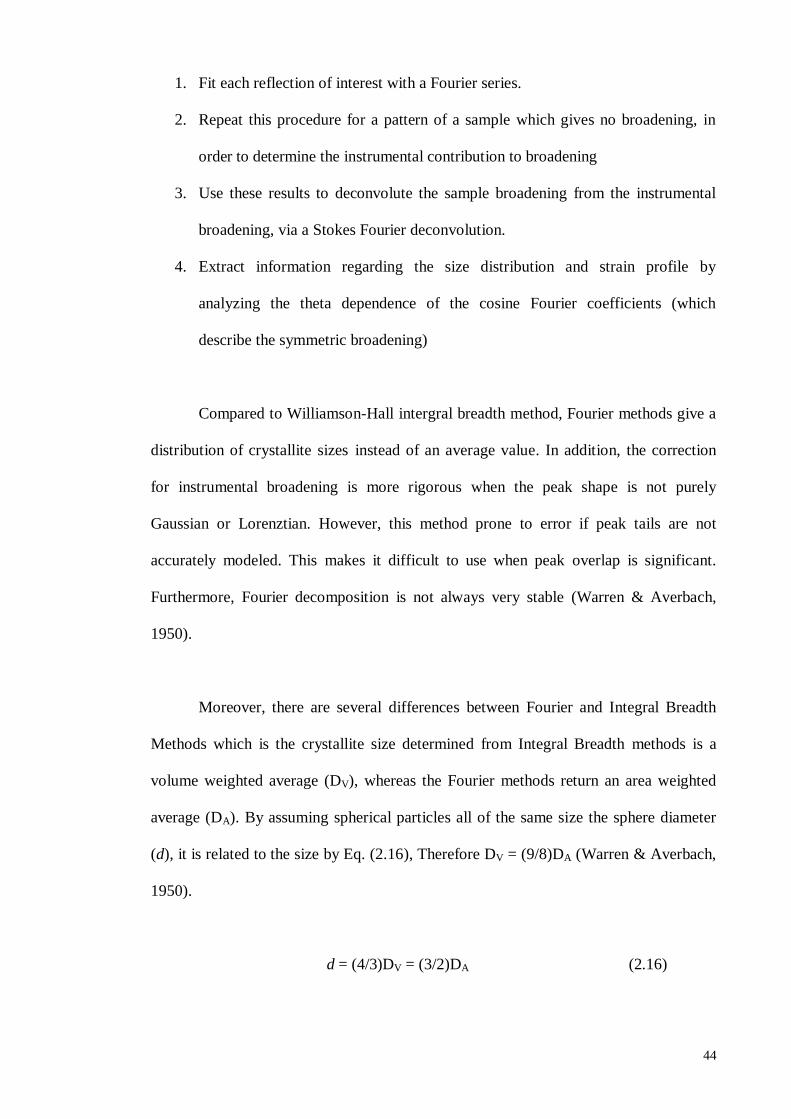
44
1. Fit each reflection of interest with a Fourier series.
2. Repeat this procedure for a pattern of a sample which gives no broadening, in
order to determine the instrumental contribution to broadening
3. Use these results to deconvolute the sample broadening from the instrumental
broadening, via a Stokes Fourier deconvolution.
4. Extract information regarding the size distribution and strain profile by
analyzing the theta dependence of the cosine Fourier coefficients (which
describe the symmetric broadening)
Compared to Williamson-Hall intergral breadth method, Fourier methods give a
distribution of crystallite sizes instead of an average value. In addition, the correction
for instrumental broadening is more rigorous when the peak shape is not purely
Gaussian or Lorenztian. However, this method prone to error if peak tails are not
accurately modeled. This makes it difficult to use when peak overlap is significant.
Furthermore, Fourier decomposition is not always very stable (Warren & Averbach,
1950).
Moreover, there are several differences between Fourier and Integral Breadth
Methods which is the crystallite size determined from Integral Breadth methods is a
volume weighted average (DV), whereas the Fourier methods return an area weighted
average (DA). By assuming spherical particles all of the same size the sphere diameter
(d), it is related to the size by Eq. (2.16), Therefore DV = (9/8)DA (Warren & Averbach,
1950).
d = (4/3)DV = (3/2)DA (2.16)

45
Double Voigt methods of analyzing peak broadening was first introduced by
Langford (1980) and developed by Balzar (1999). This methods gave the similar
information that one could obtain from the Fourier methods (Langford, 1980; Balzar,
1999). The double Voigt method proceeds along the following lines where peaks are
fitted analytically using a Voigt function (can be extended to Pseudo-voigt and Split
Pearson functions), so that the Lorentzian breadth (βL) and Gaussian breadth (βG) of
each peak can be determined. Then the integral breadths are corrected for instrumental
broadening by Eqs. (2.17) and (2.18). Williamson-Hall plots are constructed from for
both the Lorentzian and Gaussian peak widths. The crystallite size is extracted from the
Lorentzian Williamson-Hall plot and the strain is taken to be a combination of the
Lorentzian and Gaussian strain terms (Langford, 1980; Balzar, 1999).
βL(sample) = βL(fit) - βL(instrument) (2.17)
β G(sample) 2
= βG(fit)2
- βG(instrument)2 (2.18)
.
Double-Voigt method have some advantages compared to the integral Breadth
and Fourier methods. Despite of the sensitive to accurate fitting of the peak tails of
Lorentzian and Gaussian mixing parameter, this method is more robust than the Fourier
methods to the errors associated with peak overlap. Unlike the Williamson-Hall
approach Double Voigt methods can be used when the peak shape is neither pure
Lorentzian nor pure Gaussian. In addition, crystallite size distributions can be obtained
(Balzar, 1999).
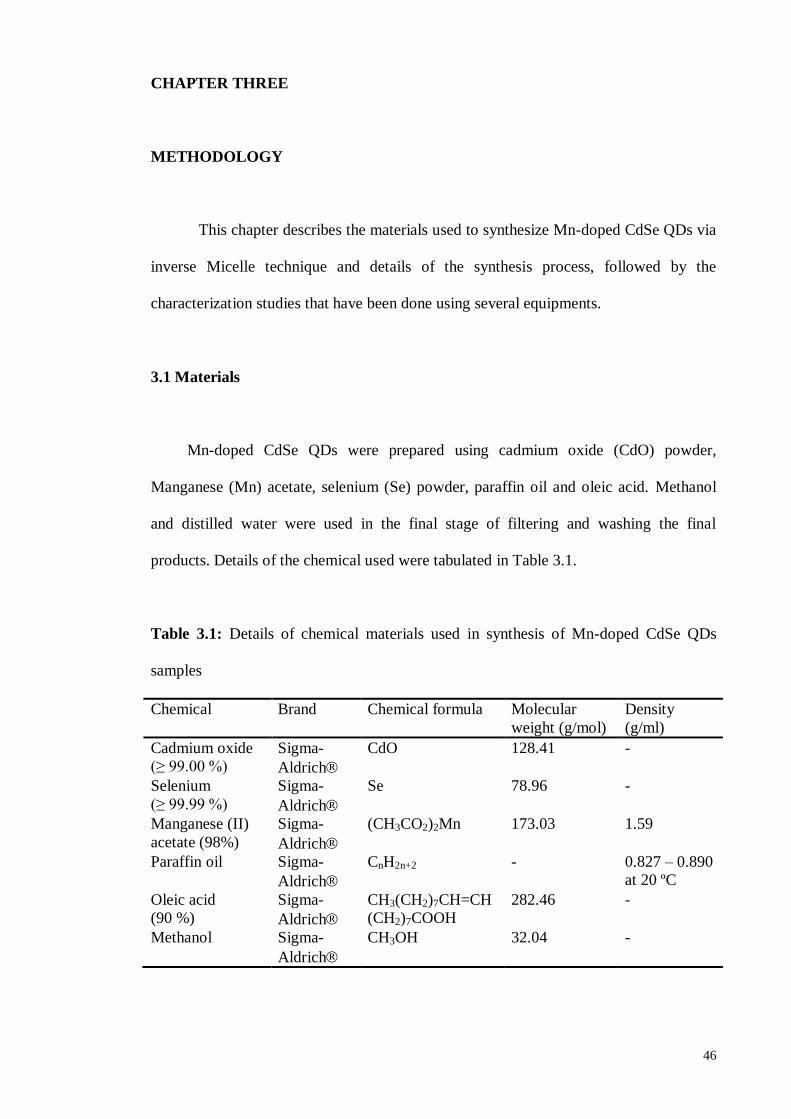
46
CHAPTER THREE
METHODOLOGY
This chapter describes the materials used to synthesize Mn-doped CdSe QDs via
inverse Micelle technique and details of the synthesis process, followed by the
characterization studies that have been done using several equipments.
3.1 Materials
Mn-doped CdSe QDs were prepared using cadmium oxide (CdO) powder,
Manganese (Mn) acetate, selenium (Se) powder, paraffin oil and oleic acid. Methanol
and distilled water were used in the final stage of filtering and washing the final
products. Details of the chemical used were tabulated in Table 3.1.
Table 3.1: Details of chemical materials used in synthesis of Mn-doped CdSe QDs
samples
Chemical Brand Chemical formula Molecular
weight (g/mol)
Density
(g/ml)
Cadmium oxide
(≥ 99.00 %)
Sigma-
Aldrich
CdO 128.41 -
Selenium
(≥ 99.99 %)
Sigma-
Aldrich
Se 78.96 -
Manganese (II)
acetate (98%)
Sigma-
Aldrich
(CH3CO2)2Mn 173.03 1.59
Paraffin oil Sigma-
Aldrich
CnH2n+2 - 0.827 – 0.890
at 20 ºC
Oleic acid
(90 %)
Sigma-
Aldrich
CH3(CH2)7CH=CH
(CH2)7COOH
282.46 -
Methanol Sigma-
Aldrich
CH3OH 32.04 -

47
3.2 Samples Preparation
Mn-doped CdSe QDs are synthesized by mixing two solutions precursor which is
Cd-Mn solution and Se solution. The synthesized processes are done under an argon gas
environment in the glove box. Cd-Mn solutions are prepared using 0.5 g of CdO, 0.5 g
Mn acetate, 25 ml of paraffin oil and 15 ml of oleic acid which are loaded into a three
necks round bottom flask. The solution heated and stirred to 160 C using heating
mantle until the CdO and Mn acetate were completely dissolve. Then, Se solution were
prepared by heated mixture of 0.079 g of Se powder and 50 ml of paraffin oil to 220 °C
with rapid stirring in another three necks round bottom flask. When the Se powder are
completely dissolved at temperature 220 °C, about 5 ml of Cd-Mn solution are swiftly
injected into Se solution with rapid stirring. For immediate sample (0 min), the heating
process was immediately stopped just after the Cd-Mn solution injection had been done.
For others samples, the temperature dropped to 210 C immediately after the injection
of Cd-Mn solution then rose back to 220 C. The final temperature was maintained at
220 C. The time was count immediately after the Cd-Mn solution injection for 0.2 min
(12 sec). The same procedure repeated at different time interval, i.e. 0.5, 1, 5, 16, 46 and
90 mins. Finally, the precipitates were isolated from solvents and unreacted reagent via
centrifugation. After been washed with methanol and distilled water consecutively, it
was dried at 50 C in vacuum oven.

48
Figure 3.1: The experimental setup for Mn-doped CdSe QDs sample upon Cd-Mn
solution injection into Se solution
3.3 Characterizations
The particles size determination of Mn-doped CdSe QDs was performed using
High-resolution Transmission Electron Microscope (HRTEM) LEO LIBRA instrument
operating at 120 kV. Powder formed samples of Mn-doped CdSe QDs are processed
and dripped onto the Cu grid for HRTEM viewing. Using micrographs and atomic scale
images of selected area are captured, the particles size and lattice parameter are
measured accordingly.
The structural studies of Mn-doped CdSe QDs samples are performed using
Panalytical Empyrean X-ray Diffractometer equipped with graphite monochromatized
Cu Kα radiation (λ= 1.54060 Ǻ) irradiated with a scanning rate of 0.02°s-1
and usable

49
range of 2º - 80º (2θ). This characterization required solid form samples that are
securely tight in the sample holder to ensure the significant high intensity in XRD
pattern produce. This is a crucial step because loose solid or powder may produce poor
intensity which is undesirable.
The optical characterization studies of Mn-doped CdSe QDs samples are
perfomed using UVIKON 923 Double Beam UV-vis spectrophotometer to obtain
absorption spectra’s and Pelkin Elmer LS55 Series PL with Xenon discharge lamp as it
light source to obtain emission spectra’s. Both equipments required a liquid samples
Mn-doped CdSe QDs that are contained in the glass cuvette with 10 mm pathlength.
Further Homogeneous dilution of all samples solution is required since spectra’s shows
supersaturated peaks especially for 16, 46 and 90 mins.
Infrared spectra of Mn-doped CdSe QDs samples are taken using a Perkin
Elmer 2000 Fourier Transform Infrared spectroscopy (FTIR) wavenumber region
between 4000 and 400 cm-1
. This FTIR are equipped with both solution and solid
samples holder and tip. For this analysis purpose, the solution samples were used.
The raman scattering behavior will be observed using Horiba Scientific Xplora
Micro-raman Spectroscopy with 532 nm laser source wavelength. The solid samples of
Mn-doped CdSe QDs are observed under a microscope and the selected areas are
targeted with laser.
The elemental compositions and chemical bonding states of solid Mn-doped
CdSe QDs samples are observed using Axis Ultra DLD/Kratos/2009 X-ray
Photoelectron Spectrometer (XPS) with 0.1 to 1 atomic % detection limit and 0.5 nm

50
depth profiles (Under argon gas environment). Figure 3.2 shows the overall synthesis
and characterizations process of Mn-doped CdSe QDs.
Figure 3.2: Flow chart of synthesis and characterization of Mn-doped CdSe QD
Mn-doped CdSe
QDs solutions
Mn-doped CdSe
QDs powder
FTIR
PL
Raman
HRTEM
UV-vis
Cleaned with
methanol & distilled
water
Filtered
Dried in vacuum oven
XPS
Synthesis of Mn-doped 0,
0.2, 0.5, 1, 5, 16, 46 and 90
mins samples of CdSe
QDs
Sonication
process
Dripped to
Cu grid
XRD

51
CHAPTER FOUR
RESULTS AND DISCUSSION
In this chapter, the results are thoroughly discussed and compared with the
published literatures.
4.1 Physical Observations
Figure 4.1 shows vials containing solution of Mn-doped CdSe QDs. The
variation in color was influenced by the sized change of Mn-doped CdSe QDs as a
function of reaction time. The observed colours are due to of the strong photon
absorption by the Mn-doped CdSe QDs at specific frequency. Sample with the
immediate reaction time (0 min) exhibits a light orange colour. While sample with 0.2
min reaction times shows a more concentrated orange colour. The sample appears red at
a reaction time of 0.5 and 1 mins. As the reaction times increases (16-90 mins), the
color turn to dark brown, as in the Fig. 4.1, the solution appeared as light brown
solution since the dark brown precipitates settled down on the bottom of the containers.
The variations in colour are attributed to the difference in QDs’ sizes due to
quantum confinement effect. Larger QDs emit longer wavelength and smaller QDs emit
shorter wavelength resulting a different colour emission (Hamizi and Rafie, 2011). The
sizes of the QDs were estimated from the absorption and photoluminescence spectra,
and confirmed by HRTEM images.

52
Figure 4.1: Mn-doped CdSe QDs samples with various colours at different reaction
times: (a) 0 , (b) 0.2, (c) 0.5, (d) 1, (e) 5, (f) 16, (g) 46 and (h) 90 mins

53
4.2 High Resolution Transmission Electron Microscopy (HRTEM) Analysis
Figures 4.2- 4.9 show the typical HRTEM images for all Mn-doped CdSe QDs
samples. The HRTEM images reveal that Mn-doped CdSe QDs posses a quasi-sphere
shape for all reaction times. The dark area formed in the image due to the high density
of particles.
The QDs mean size and distributions are measured of one hundred particles as
plotted in histogram (insert) in respective figures. The average physical sizes of the Mn-
doped CdSe QDs are range from 3 to 14 nm (± 0.1 – 0.9) for 0 to 90 mins reaction time,
respectively. This results shows that Mn-doped CdSe QDs shows a slight increment in
QDs physical size as compared to pure CdSe QDs (Hamizi & Johan, 2010). Kwak et al.
(2007) reported the significantly larger size of Mn-doped CdSe QDs produced
compared to pure CdSe QDs which can be due to the contribution of Mn which shelled
the CdSe QDs core (Kwak et al., 2007).
The growth of QDs is a function of the reaction time as proved in Figure 4.1. The
nucleation process of Mn-doped CdSe was occcured immediately after the injection of
Mn-Cd complex into Se solution. The rapid growth of QDs may not occur immediately
(0 min), but started at a few seconds later after the heating process was stopped. This is
because of the solvent temperature are not immediately dropped after stopping the
heating process were stop.
Figure 4.10 shows the relationship of QDs growth with reaction time. The growth
of QDs is very significant at the early reaction time (0 to 0.5 mins). The growth most
rapidly occur was from 0.2 to 0.5 min transition time, since the high energy surface was

54
largely used to initiate the nucleation of Mn-doped CdSe QDs at the initial stage (0 –
0.2 mins). However, as the reaction time is increased, the growth becoming less
prominent, especially from 0.5 to 90 min. This is due to the ionic concentration
reduction of the chemical precursor in the solution as the time become longer (Sung et
al., 2008, Jiang & Muscat, 2012).
In addition, narrow particles size distribution was observed in each sample. Despite
the narrow size distribution, the overall size distribution seem to shows a slight
increment over the reaction time. This due to the particles agglomeration creates a larger
size of QDs. Simultaneously, the growth of intrinsic QDs is still ongoing due to the
chemical precursor residue. This will create a wide QDs size distribution. The tendency
of agglomeration may due to the excessive high surface energy on the QDs surface
compare to the core or bulk of QDs throughout the heating process which favorable to
the built-up of surface or shell of QDs. Meaning that, as long as the heating is exist, the
QDs have the tendency to growth. Despite this, the concentration of chemical
precursors such as Cd, Se and Mn are dropped as the reaction time increases. This will
retard the creation of QDs surfaces. Hence, instead of creating a QDs, the excessive
surface energy would increase the propensity of QDs agglomeration (Sung et al., 2008).
Another essential point of QDs agglomeration is the reduction of surfactant
concentration in proportion to the increasing reaction time, since oleic acid is the crucial
chemical to create oleate shell (Mn-oleate and Cd-Oleate) on the surface of QDs (Jiang
& Muscat, 2012).

55
Figure 4.2: HRTEM image of Mn-doped CdSe QDs with QDs size distribution (insert)
at 0 min reaction time

56
Figure 4.3: HRTEM image of Mn-doped CdSe QDs with QDs size distribution (insert)
at 0.2 min reaction time
57
Figure 4.4: HRTEM image of Mn-doped CdSe QDs with QDs size distribution (insert)
at 0.5 min reaction time

58
Figure 4.5: HRTEM image of Mn-doped CdSe QDs with QDs size distribution (insert)
at 1 min reaction time
59
Figure 4.6: HRTEM image of Mn-doped CdSe QDs with QDs size distribution (insert)
at 5 min reaction time
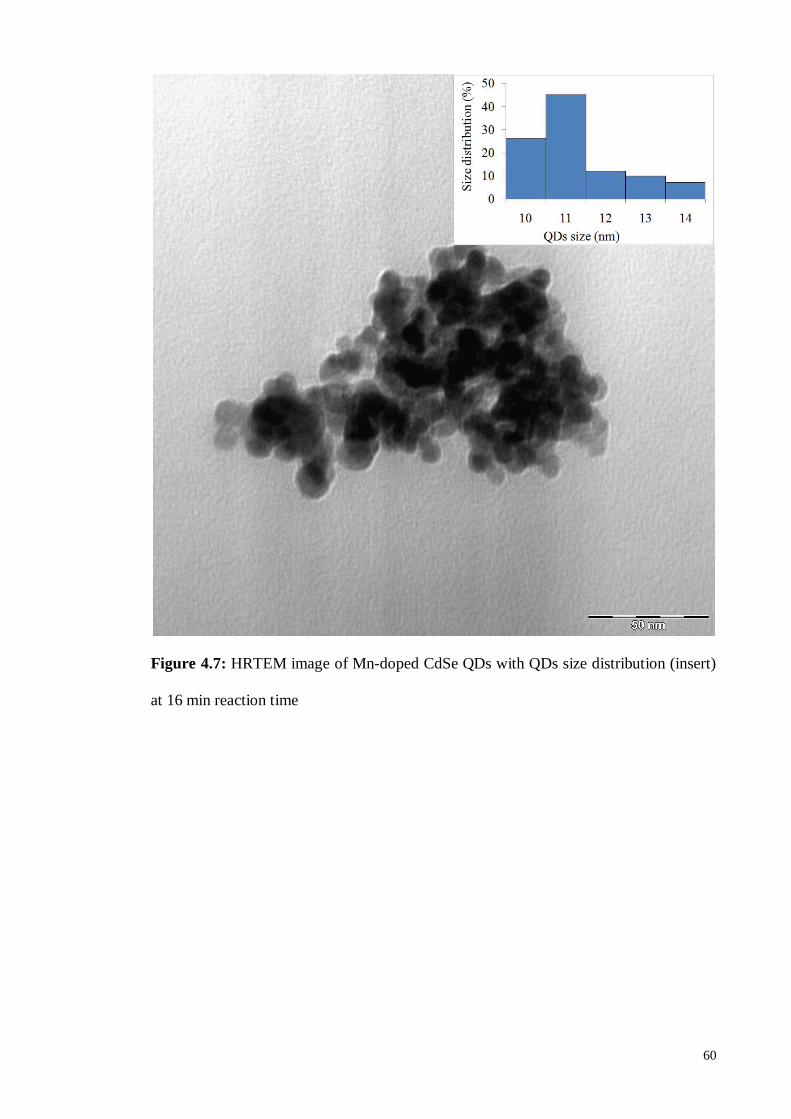
60
Figure 4.7: HRTEM image of Mn-doped CdSe QDs with QDs size distribution (insert)
at 16 min reaction time
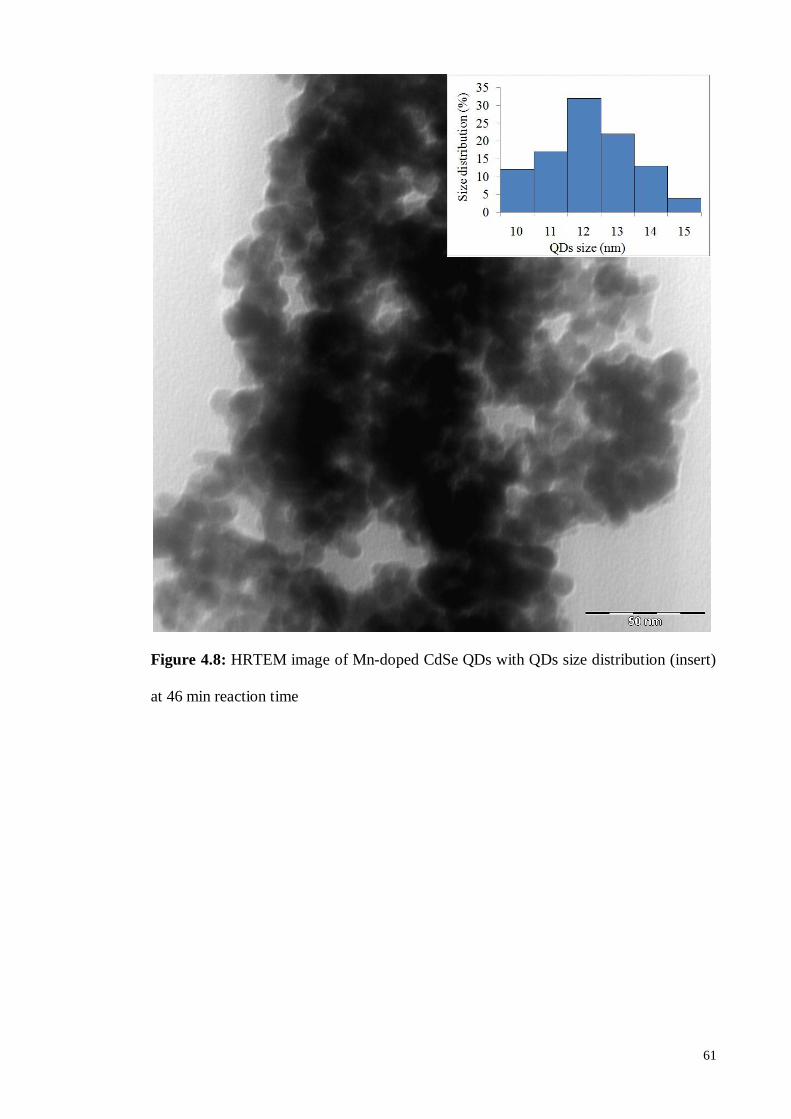
61
Figure 4.8: HRTEM image of Mn-doped CdSe QDs with QDs size distribution (insert)
at 46 min reaction time

62
Figure 4.9: HRTEM image of Mn-doped CdSe QDs with QDs size distribution (insert)
at 90 min reaction time

63
Figure 4.10: The growth of QDs with reaction times
The lattice structures of Mn-doped CdSe QDs samples are shown in Figures
4.11- 4.19. Lattice distance or lattice parameter (a) at twenty isolated area are measured
and the average value are tabulated in Table 4.1. From the HRTEM results, Mn-doped
CdSe QDs have small lattice parameter ranging from 1.8 to 3.9 Å compared to bulk
CdSe (300K) with 6.050 Å lattice parameter (Hotje et al., 2003). The introduction of
smaller Mn2+
ion (~0.8 Å) into CdSe QDs core resulting in significant lattice straining
through compression. This lattice parameter compression was also observed in Mn-
doped into CdS and ZnS (Bryan & Gamelin, 2005). The shrink in lattice parameters in
2
4
6
8
10
12
14
0 20 40 60 80 100
Reaction time (min)
QD
s p
hysi
cal
size
(nm
)
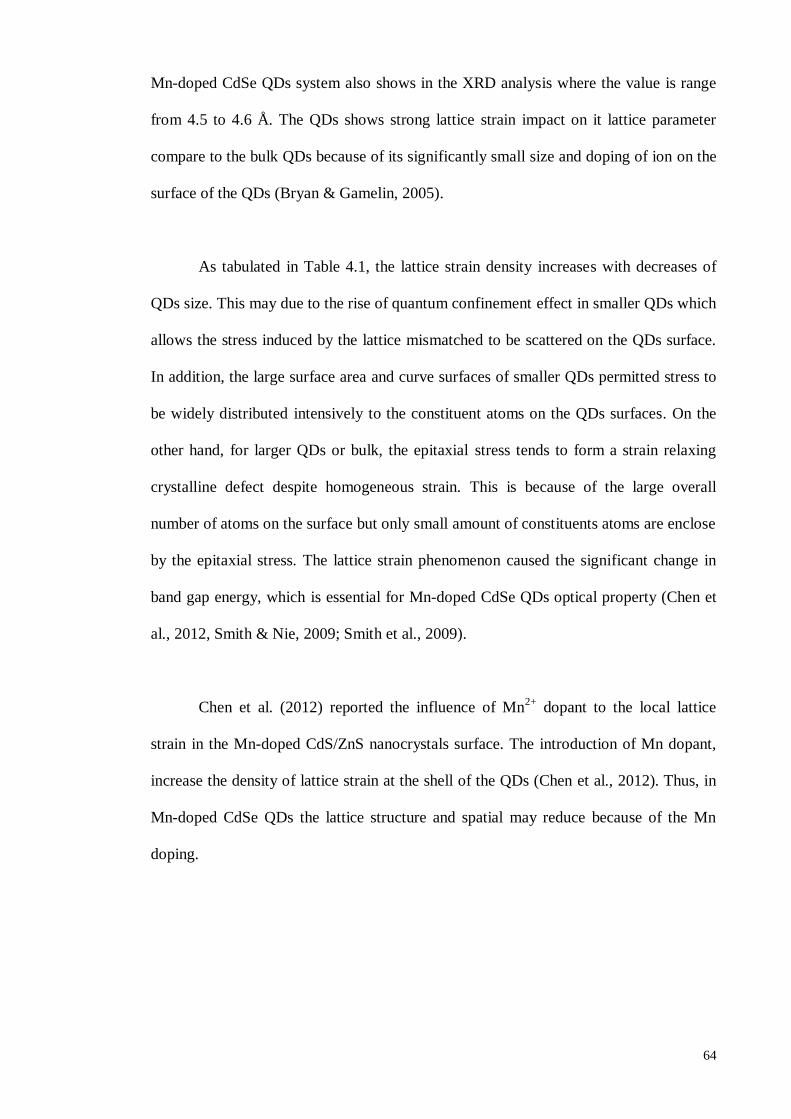
64
Mn-doped CdSe QDs system also shows in the XRD analysis where the value is range
from 4.5 to 4.6 Å. The QDs shows strong lattice strain impact on it lattice parameter
compare to the bulk QDs because of its significantly small size and doping of ion on the
surface of the QDs (Bryan & Gamelin, 2005).
As tabulated in Table 4.1, the lattice strain density increases with decreases of
QDs size. This may due to the rise of quantum confinement effect in smaller QDs which
allows the stress induced by the lattice mismatched to be scattered on the QDs surface.
In addition, the large surface area and curve surfaces of smaller QDs permitted stress to
be widely distributed intensively to the constituent atoms on the QDs surfaces. On the
other hand, for larger QDs or bulk, the epitaxial stress tends to form a strain relaxing
crystalline defect despite homogeneous strain. This is because of the large overall
number of atoms on the surface but only small amount of constituents atoms are enclose
by the epitaxial stress. The lattice strain phenomenon caused the significant change in
band gap energy, which is essential for Mn-doped CdSe QDs optical property (Chen et
al., 2012, Smith & Nie, 2009; Smith et al., 2009).
Chen et al. (2012) reported the influence of Mn2+
dopant to the local lattice
strain in the Mn-doped CdS/ZnS nanocrystals surface. The introduction of Mn dopant,
increase the density of lattice strain at the shell of the QDs (Chen et al., 2012). Thus, in
Mn-doped CdSe QDs the lattice structure and spatial may reduce because of the Mn
doping.

65
Figure 4.11: HRTEM image of Mn-doped CdSe QDs lattice of 0 min sample
Figure 4.12: HRTEM image of Mn-doped CdSe QDs lattice of 0.2 min sample

66
Figure 4.13: HRTEM image of Mn-doped CdSe QDs lattice of 0.5 min sample
Figure 4.14: HRTEM image of Mn-doped CdSe QDs lattice of 1 min sample

67
Figure 4.15: HRTEM image of Mn-doped CdSe QDs lattice of 5 min sample
Figure 4.16: HRTEM image of Mn-doped CdSe QDs lattice of 16 min sample

68
Figure 4.17: HRTEM image of Mn-doped CdSe QDs lattice of 46 min sample
Figure 4.18: HRTEM image of Mn-doped CdSe QDs lattice of 90 min sample

69
Table 4.1: Lattice parameter of Mn-doped CdSe QDs for all samples
QDs size (nm)
Latice parameter, a (Å)
HRTEM XRD
3 1.8 2.09
5 1.9 2.13
8 1.9 2.14
9 2 2.16
10 2.1 2.24
11 3.1 2.29
12 3.6 2.37
14 3.9 2.56

70
4.3 X-Ray Diffraction (XRD) Analysis
The crystal structure of Mn-doped CdSe QDs was determined by XRD diffraction
pattern as shown in Figure 4.19. Three well-defined peaks were observed at 2θ = 24.7 º,
41.6 º and 49.3 º correspond to (111), (220) and (311) planes respectively. This is in
good agreement with Kwak et al. (2007), with an extremely small shift (~0.02 º - 0.04
º) (Kwak et al, 2007). Furthermore, this XRD pattern shows that as-synthesized Mn-
doped CdSe QDs formed the zinc blende structure due to the low synthesis temperature
(220 ºC). In other chemical synthesis process, like TOP based route produced wurtzite
structure due to high synthesis temperature reach up to 300 ºC (Dongzhi et al., 2007).
The long and complex molecular chains of oleic acid that acted as a surfactant may also
contribute to the formation of zinc blend structure at {100} planes which have higher
binding energy in Mn-doped CdSe QDs system (Kwak et al., 2007).
Peaks are shifted slightly in the XRD pattern as compared to pure CdSe QDs which
located at 2θ = 25.9 º, 42.5 º and 50.3 º (Hamizi & Johan, 2010). This shifting trend
toward the lower angle (~ 0.9 º to 1.2 º) may correspond to the filled of Mn ion in the
interstitial site in the {001} planes face centered cubic lattice. Mn2+
ion has high
tendency to fill the interstitial site of CdSe QDs lattice due to a typically small size of
Mn2+
ion (~0.8 Å) compare to Cd2+
ion (~0.95 Å) (Bryan & Gamelin, 2012; Kwak et
al., 2007) . This interstitial phenomenon of Mn into CdSe QDs lattice can contribute to
the lattice microstrain that results in expansion or compression of CdSe core lattice
(Kwak et al., 2007).

71
Figure 4.19: XRD patterns of Mn-doped CdSe QDs samples at various reaction times

72
Table 4.2: FWHM of (111) XRD peaks and the calculated crystallite sizes of Mn-doped
CdSe QDs at various reaction times
Reaction time FWHM Crystallite size
(min) (radian) (nm)
0 0.058 2.46
0.2 0.049 2.90
0.5 0.035 4.06
1 0.034 4.18
5 0.033 4.30
16 0.029 4.93
46 0.027 5.20
90 0.026 5.46
Table 4.2 shows the full-width of half maximum (FWHM) of peak correspond to
(111) plane. The peak was broaden as the reaction time decreases. The crystallite sizes
were calculated using Scherrer`s formula through the obtained FWHM values. As
shown in the table, the crystallite size shows increment trend as a function of reaction
times. This is in good agreement with results of physical size in HRTEM images
(Figures 4.2 – 4.9). The crystallite size is most likely smaller than particles size because
it has small degree of nanostrustural lattice coherence compared to particle size. In
elaboration, crystallite sizes are notable to be similar to grain size of a single crystal.
Likewise particles size is a size of a single crystal or the agglomeration of several
crystals (Hamizi & Johan, 2010).

73
Table 4.3: FWHM of XRD diffraction peaks of Mn-doped CdSe QDs correspond to
(111), (220) and (311) planes
Reaction time FWHM (radian)
(min) (111) (220) (311)
0 0.058 0.035 0.029
0.2 0.049 0.029 0.029
0.5 0.035 0.029 0.012
1 0.034 0.052 0.029
5 0.033 0.058 0.035
16 0.029 0.029 0.029
46 0.027 0.046 0.029
90 0.026 0.052 0.029
XRD peak broadening feature not only limited to the QDs size reduction, but
also on the anistropic peak broadening. Table 4.3 tabulated the individual FWHM
diffraction peak correspond to (111), (220) and (311) planes. The (111) peak shows
wider FWHM compared to (220) and (311) peaks for 0, 0.2 and 0.5 mins samples. This
indicates that the QDs dimension is reducing dominantly in perpendicular to (111)
planes direction where the unit cell h, k, and l were not equal to zero (Smith et al.,
2008). On the other hand, for 1, 5, 46 and 90 mins samples, the (220) diffraction peaks
shows wide FWHM in comparison with (111) and (311) peaks. This may correspond to
the QDs dimension is decrease priory in perpendicular to (220) particular planes
direction which the unit cell l is equal to zero. Dispites, 16 min samples diffraction peak
FWHM remained constant for each peak. The anisotropic broadening in Mn-doped

74
CdSe QDs shows to be less dependent on the size of the QDs (Thanikaikarasan et al.,
2011, Smith et al., 2009, Devi et al., 2014).
The lattice parameter analyzed from XRD analysis (Table 4.1) shows increment
pattern as a function of QDs sizes. This indicate that the lattice is experience
compression or expansion strain which independent from the of QDs sizes
(Thanikaikarasan et la., 2011).
The pure CdSe QDs reported to have broader XRD diffraction peak (111)
compared to Mn-doped CdSe QDs, since the crystallite size reported to be in a range of
~2 to 4 nm (Hamizi & Johan, 2010). This narrowing diffraction peak in Mn-doped CdSe
QDs may caused by the lattice strain phenomenon, which also called microstrain since it
occasionally happen in the nanocrystalline materials. The interstitial of Mn2+
ion into
the CdSe QDs lattice introduced microstain to the unit cells that can cause by the un-
uniform lattice distortion (Chen et al., 2012). It can be assume that the strain introduced
to the CdSe QDs lattice induced the compression towards lattice parameter as results of
the Mn2+
interstitials, since lattice parameter recorded in Table 4.1 are smaller in
comparison which pure CdSe QDs (Hamizi & Johan, 2010).
The contribution of crystallite size and microstrain to the broadening of XRD
peak can be exploited for the determination of the strain which dominantly to lattice
strain, since both parameters are changing with Bragg angle. Graph of βrcosθ versus
sinθ are plotted by taking the consideration of zero instruments effect (βi) on XRD
peaks broadening since the value is extremely small. The plots in Figures 4.20 - 4.27
shown inconsistence straight line which may due to the anistropic broadening effect
(Smith et al., 2009). Since Eq. (2.13) is generally form of a straight line, all potential

75
slope are taking into consideration. Slope of the graphs obtained are equal to the lattice
strain (η), observed to change in fluctuate pattern as a function of QDs size. More than
one lattice strain value observed in for 0.5, 1, 5, 46 and 90 mins samples which may
prior to anistropic broadening of XRD peaks and inhomogeneous lattice straining. The
inhomogeneous lattice strain may relate to the inhomogeneous of Mn2+
in cooperation
on the CdSe QDs particles interfacial (Smith et al., 2009).
Smith et al. (2009) comparing the strain parameter (percentage of lattice
mismatch) of CdTe/ZnSe (core/shell) QDs and CdSe/ZnS (core/shell). CdSe/ZnS QDs
shows higher percentage of lattice mismatch. They suggested due to the inhomogenity
of the lattice strain since the inability of CdSe and ZnS to withstand strain without
forming defects. In addition, CdSe and ZnS QDs lattice are considered less elastic
compares to the CdTe and ZnSe QDs lattice when subjected to stress (Smith et al.,
2009). This may add additional point to the the strain inhomogenity shown in Figures
4.20 – 4.27. In addition, interstitial of Mn2+
into the CdSe QDs lattice induced either
compressive or/and expansion stress to the lattice, may also resulting in strain
inhomogeneous in Mn-doped CdSe QDs (Devi et al., 2014).
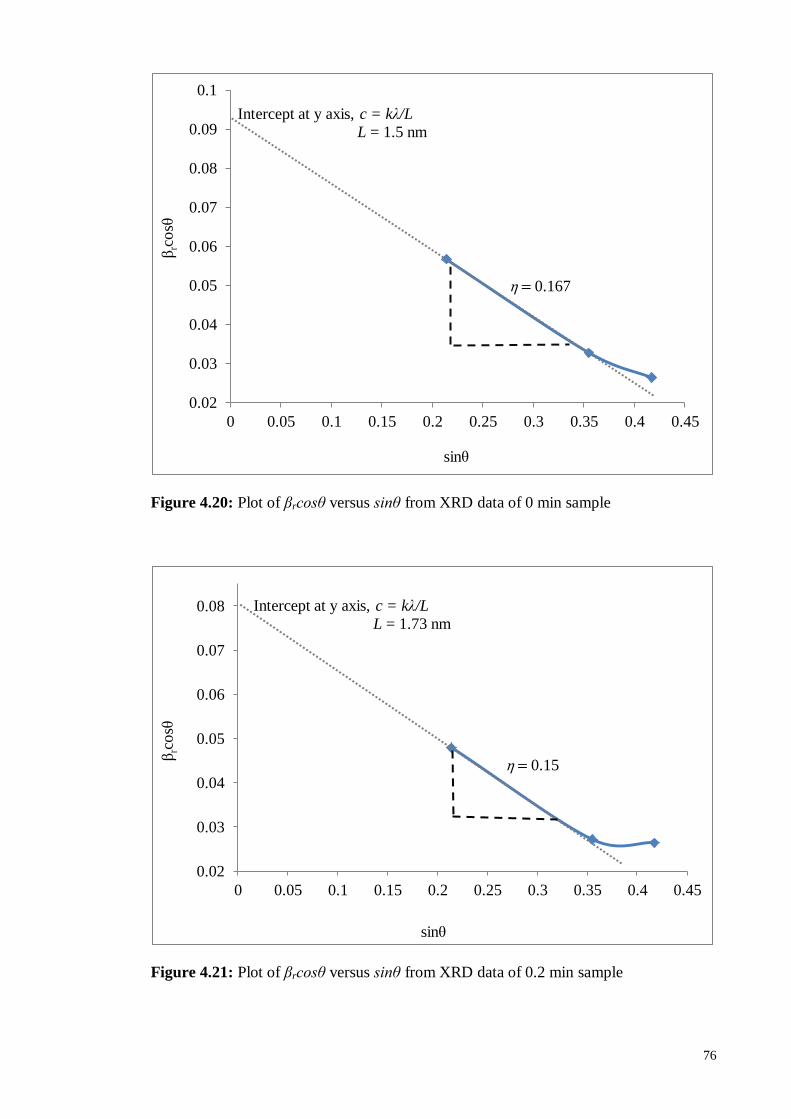
76
Figure 4.20: Plot of βrcosθ versus sinθ from XRD data of 0 min sample
Figure 4.21: Plot of βrcosθ versus sinθ from XRD data of 0.2 min sample
0.02
0.03
0.04
0.05
0.06
0.07
0.08
0.09
0.1
0 0.05 0.1 0.15 0.2 0.25 0.3 0.35 0.4 0.45
βrc
osθ
sinθ
η = 0.167
Intercept at y axis, c = kλ/L
L = 1.5 nm
0.02
0.03
0.04
0.05
0.06
0.07
0.08
0 0.05 0.1 0.15 0.2 0.25 0.3 0.35 0.4 0.45
sinθ
η = 0.15
βrc
osθ
Intercept at y axis, c = kλ/L
L = 1.73 nm

77
Figure 4.22: Plot of βrcosθ versus sinθ from XRD data of 0.5 min sample
Figure 4.23: Plot of βrcosθ versus sinθ from XRD data of 1 min sample
0.01
0.02
0.03
0.04
0.05
0 0.05 0.1 0.15 0.2 0.25 0.3 0.35 0.4 0.45
sinθ
η1 = 0.044
η2 = 0.275
βrc
osθ
Intercept at y axis, c = kλ/L
L = 3.3 nm
0
0.01
0.02
0.03
0.04
0.05
0.06
0 0.05 0.1 0.15 0.2 0.25 0.3 0.35 0.4 0.45
sinθ
η1 = 0.118 η2 = 0.438
βrc
osθ
Intercept at y axis, c = kλ/L
L = 23.1
nm

78
Figure 4.24: Plot of βrcosθ versus sinθ from XRD data of 5 min sample
Figure 4.25: Plot of βrcosθ versus sinθ from XRD data of 16 min sample
0
0.001
0.002
0.003
0 0.05 0.1 0.15 0.2 0.25 0.3 0.35 0.4 0.45
sinθ
η1 = 0.001
η2 = 0.209
βrc
osθ
Intercept at y axis, c = kλ/L
L = 81.6 nm
0
0.001
0.002
0 0.05 0.1 0.15 0.2 0.25 0.3 0.35 0.4 0.45
sinθ
η1 = 0.004
βrc
osθ
Intercept at y axis, c = kλ/L
L = 60.3 nm

79
Figure 4.26: Plot of βrcosθ versus sinθ from XRD data of 46 min sample
Figure 4.27: Plot of βrcosθ versus sinθ from XRD data of 90 min sample
0
0.0005
0.001
0.0015
0 0.05 0.1 0.15 0.2 0.25 0.3 0.35 0.4 0.45
sinθ
η1 = 0.003
η2 = 0.019
βrc
osθ
Intercept at y axis, c = kλ/L
L = 51.4 nm
-0.002
-0.0015
-0.001
-0.0005
0
0.0005
0.001
0.0015
0.002
0.0025
0.003
0 0.05 0.1 0.15 0.2 0.25 0.3 0.35 0.4 0.45
sinθ
η1 = 0.015 η2 = 0.033
βrc
osθ
sinθ
η1 = 0.015 η2 = 0.033
βrc
osθ
Intercept at y axis, c = kλ/L
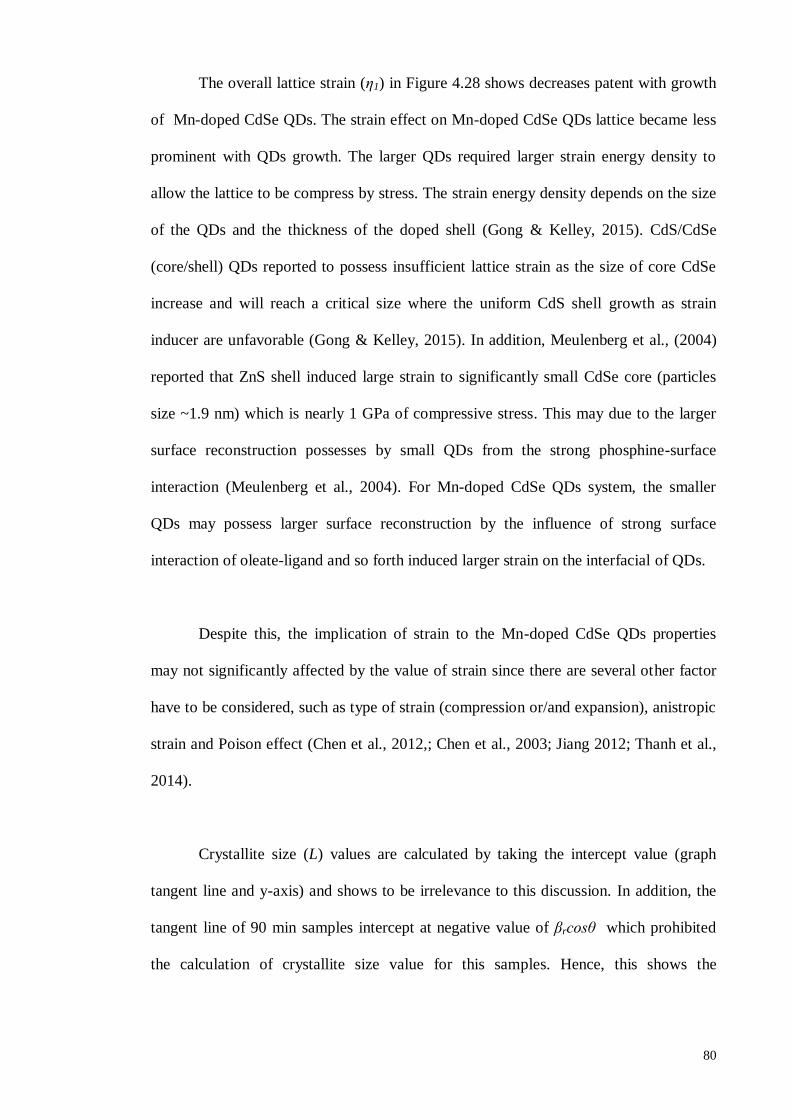
80
The overall lattice strain (η1) in Figure 4.28 shows decreases patent with growth
of Mn-doped CdSe QDs. The strain effect on Mn-doped CdSe QDs lattice became less
prominent with QDs growth. The larger QDs required larger strain energy density to
allow the lattice to be compress by stress. The strain energy density depends on the size
of the QDs and the thickness of the doped shell (Gong & Kelley, 2015). CdS/CdSe
(core/shell) QDs reported to possess insufficient lattice strain as the size of core CdSe
increase and will reach a critical size where the uniform CdS shell growth as strain
inducer are unfavorable (Gong & Kelley, 2015). In addition, Meulenberg et al., (2004)
reported that ZnS shell induced large strain to significantly small CdSe core (particles
size ~1.9 nm) which is nearly 1 GPa of compressive stress. This may due to the larger
surface reconstruction possesses by small QDs from the strong phosphine-surface
interaction (Meulenberg et al., 2004). For Mn-doped CdSe QDs system, the smaller
QDs may possess larger surface reconstruction by the influence of strong surface
interaction of oleate-ligand and so forth induced larger strain on the interfacial of QDs.
Despite this, the implication of strain to the Mn-doped CdSe QDs properties
may not significantly affected by the value of strain since there are several other factor
have to be considered, such as type of strain (compression or/and expansion), anistropic
strain and Poison effect (Chen et al., 2012,; Chen et al., 2003; Jiang 2012; Thanh et al.,
2014).
Crystallite size (L) values are calculated by taking the intercept value (graph
tangent line and y-axis) and shows to be irrelevance to this discussion. In addition, the
tangent line of 90 min samples intercept at negative value of βrcosθ which prohibited
the calculation of crystallite size value for this samples. Hence, this shows the
81
broadening of XRD peak are prominent to strain and anistropic broadening rather than
crystallite size broadening which in particular to QDs size growth.
Figure 4.28: Lattice strain effect with growth of Mn-doped CdSe QDs crystallite size
0
0.02
0.04
0.06
0.08
0.1
0.12
0.14
0.16
0.18
2 2.5 3 3.5 4 4.5 5 5.5
Lat
tice
str
ain (
η1)
Crystallite size (nm)

82
Another interesting feature of XRD diffraction peak was the maximum peak
intensity ( ) that can be expressed in very complex equation (Jian & Hejing, 2003).
In addition, of XRD diffraction peak (Figure 4.19) is observed to be increase with
QDs size decreases. This can indicate that the decrease in QDs size give essential effect
on the crystal structure and phase diffraction feature such absorption of the Mn-doped
CdSe QDs in a specific pattern. Other influences such instrument factor, environment
and diffraction angle also contribute to the changes in but not critical to the QDs
size reduction (Jian & Hejing, 2003) . Eq. (4.1) expressed in much more simple
derivation.
| | (4.1)
where, is a structural factor, is a multiplicity, is Lorentz and
polarization factors and is the temperature factor which is precisely referred to
displacement parameter (Jian & Hejing, 2003).

83
4.4 Ultraviolet Visible (UV-vis) Analysis
The optical properties of Mn-doped CdSe QDs are partially studied by using
UV-visible spectroscopy. The absorption spectra of liquid Mn-doped CdSe QDs
samples at various reaction times are illustrated in Figure 4.29. The maximum height of
absorption peaks are located at wavelengths of 489, 514, 518, 528, 533, 545, 565 and
568 nm. Significant quantum confinement effect was observed through the red-shift
behavior of maximum absorption peaks as the of QDs sizes change.
There is interesting to note that Mn-doped CdSe QDs shows a slight blue-shift
behavior as compared with pure CdSe QDs (Hamizi & Johan, 2010), despite of it
significantly larger QDs size. This may due to the doped of Mn2+
which leads to the
introduction of lattice strain into the core (CdSe QDs) and shell (Mn-doped) interfacial.
Complementary to this, the present of strain in QDs lattice can tailor the molecular band
gap structure by positive strain (expansion) or negative strain (compression). The
positive and negative axial strain can occur in the heterostructure of valence and
conduction bands (Chen et al., 2003).
Furthermore, Mn-doped CdSe QDs were excited at significantly smaller
wavelength margin (~54 nm) as compared to pure CdSe QDs (~130 nm) for 0.2 to 90
min reaction times (Hamizi & Johan 2010). This is further discussed by observing the
evolution patent of excitionic energy with Mn-doped CdSe QDs size.

84
Figure 4.29: Temporal evolution of UV-vis absorption spectra for the as-synthesized
Mn-doped CdSe QDs at different reaction times
This absorption peaks are result of the measured energy absorbed at certain
wavelength by the excited electron to the higher energy state under the UV-visible
radiation. This exciton energy has to match the energy gap between the lower and
higher energy state. Tauc`s plot is used to determine the exciton energy of Mn-doped
CdSe QDs by exploiting the data from absorption line obtained in Figure 4.29. The
Tauc`s plot are simply derive from Eq. (4.2) (Hamizi & Johan, 2010).
( )
(4.2)
85
where A is a constant, n = 1/2 for direct and n = 2 for indirect allowed transition, is
the absorption intensity and (Mehta et al, 2008). The plot of
⁄
versus shows in Figure 4.30 allowed the analysis of exicton energy evolution as a
function of Mn-doped CdSe QDs sizes variation.
The exciton energy is determined by taking the intercept ion values between
tangent line of Tauc`s graphs with x-axis ( ). The exciton energies are 2.48, 2.37, 2.35,
2.22, 2.18, 2.09, 2.05 and 2.01 eV with respect to 0 to 90 min samples. This shows the
expansion of band gap energy of Mn-doped CdSe QDs in comparison with the pure
CdSe QDs reported to have exciton energy ranging from 2.28 to 1.83 eV respectively
for 0.2 to 90 mins samples (Hamizi & Johan, 2010). This can be another critical
discussion on the lattice strain influence on the band gap structure modification in Mn-
doped CdSe QDs optical and electronic properties. The lattice strain results in large
lattice mismatch (%) which caused the elastic deformation by expansion of the optical
band gap of Mn-doped CdSe QDs (Alahmed, 2013). Peng et al., (1997) reported a
wurtzite CdSe/CdS core/shell QDs has a 3.4% bulk lattice mismatch and Talapin et al
(2004) reported CdSe/ZnS core/shell QDs has a 12% lattice mismatch which in both
report shows the enhancement of the the photoluminescence quantum yield and
photostability up to 50% compare to the pure QDs (Peng et al., 1997; Talapin et al.,
2004).

86
Figure 4.30: The Tauc`s plot of Mn-doped Cdse QDs at various reaction times
Moreover, Mn-doped CdSe QDs exciton energy was observed to evolve in a
smaller margin (~0.35 eV) compared to pure CdSe QDs (0.45 eV) (Hamizi & Johan,
2010). As discussed earlier, the strong energy quantization can be elaborated on this
narrowed exciton energy margin in the different size of Mn-doped CdSe QDs (Ren et
al., 1994).
Exciton energy is a energy gap threshold of the electron and hole pair which are
not physically bound but yet electrically attracted to each other which also known as
electric or transport gap. While, optical band gap energy is the threshold for photons to
be obsorbed (Knox, 1963). Inorganic semiconductor materials such as Mn-doped CdSe
87
QDs known to have small exciton binding energy which result from the insignificant
interaction between electron and holes. Hence, the distinction between optical and
exciton band gap theoretically small (Liang, 1970).
Thus, as an extension to the exciton energy analysis, the optical band gap energy
as a function of QDs sizes are analyzed using the strong confinement model of a
spherical QD given by the following equation (Gaponenko, 1998):
(
)
(
)
(4.3)
Here, rB is the Bohr radius (CdSe QDs) = 4.9 nm, is the CdSe QDs crystallite
radius obtained from XRD analysis, is the band gap energy of bulk CdSe QDs and
is the exciton Ryberg for CdSe = 0.016 eV. Eq. (4.3) can only be applied when
is extremely small from .
The optical calculated band gap has values of 4.13, 3.44, 2.59, 2.54, 2.49, 2.30,
2.24 and 2.19 eV for 0 to 90 min samples, respectively. A broaden in optical band gap
was observed compared to exciton energy. Figure 4.31 shows that the temporal
evolution of exciton energy (Tauc`s plot) and optical band gap. The optical band gap
behaves negatively exponential to the growth of QDs size, where as the exciton energy
shows typical approximate linear relationship. The lattice strain shows crucial effect on
the exciton band gap compare to optical band gap may due to the changes in the
hierarchy of the ground hole state and the first excited hole states in such way that both
states cross each other resulting in narrowing in exciton band gap (Phadnis et al., 2015).
This wave function overlapping behavior is intensely due to the implication of strain
effect on the CdS/ZnS core/shell QDs. The separation between inter-band 1s3/2h and
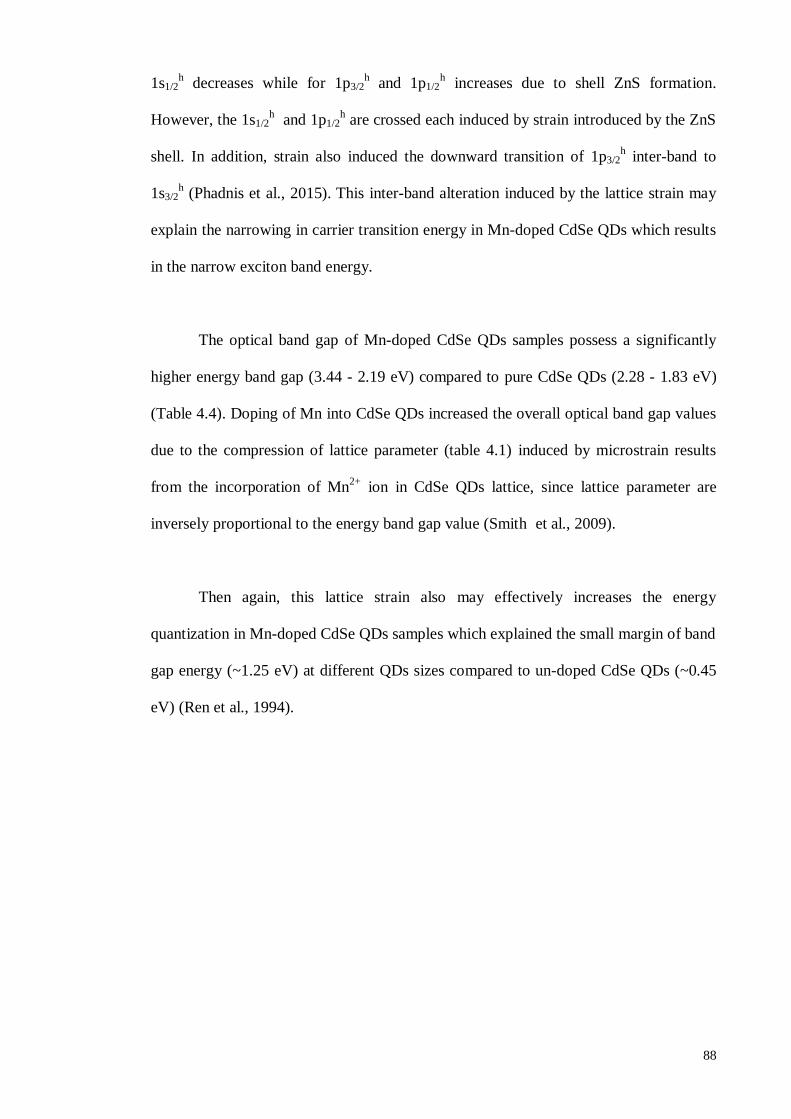
88
1s1/2h decreases while for 1p3/2
h and 1p1/2
h increases due to shell ZnS formation.
However, the 1s1/2h and 1p1/2
h are crossed each induced by strain introduced by the ZnS
shell. In addition, strain also induced the downward transition of 1p3/2h inter-band to
1s3/2h (Phadnis et al., 2015). This inter-band alteration induced by the lattice strain may
explain the narrowing in carrier transition energy in Mn-doped CdSe QDs which results
in the narrow exciton band energy.
The optical band gap of Mn-doped CdSe QDs samples possess a significantly
higher energy band gap (3.44 - 2.19 eV) compared to pure CdSe QDs (2.28 - 1.83 eV)
(Table 4.4). Doping of Mn into CdSe QDs increased the overall optical band gap values
due to the compression of lattice parameter (table 4.1) induced by microstrain results
from the incorporation of Mn2+
ion in CdSe QDs lattice, since lattice parameter are
inversely proportional to the energy band gap value (Smith et al., 2009).
Then again, this lattice strain also may effectively increases the energy
quantization in Mn-doped CdSe QDs samples which explained the small margin of band
gap energy (~1.25 eV) at different QDs sizes compared to un-doped CdSe QDs (~0.45
eV) (Ren et al., 1994).
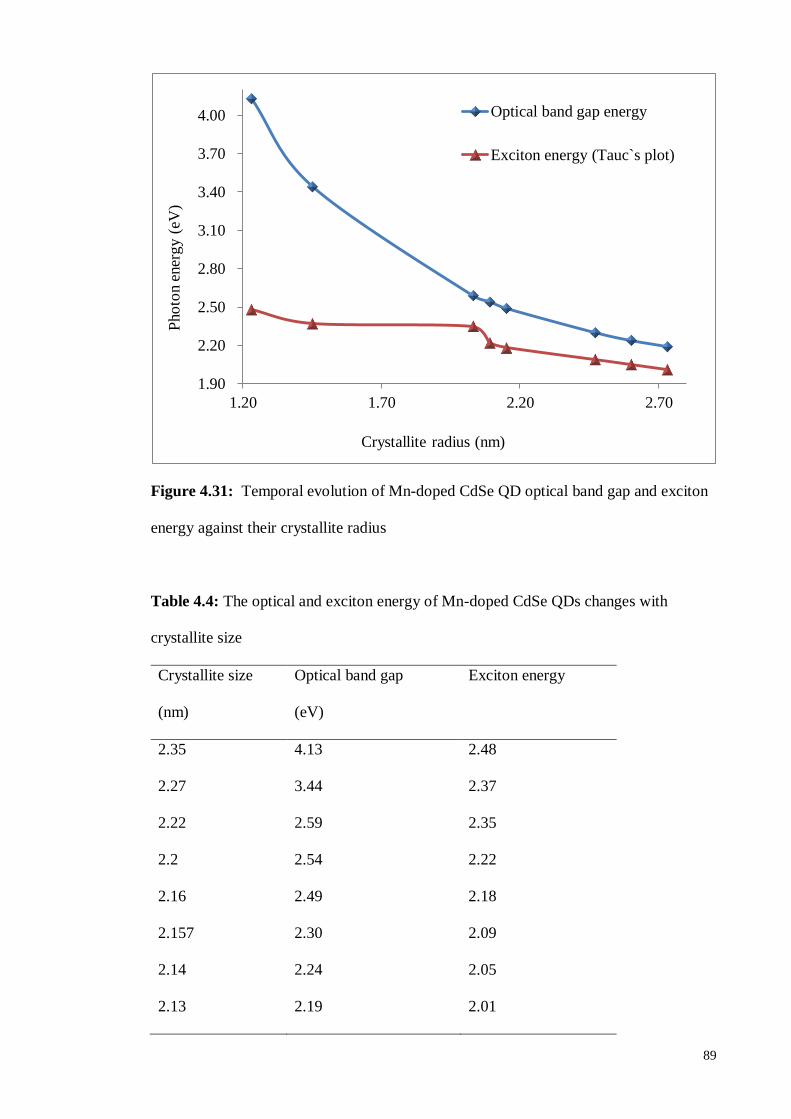
89
Figure 4.31: Temporal evolution of Mn-doped CdSe QD optical band gap and exciton
energy against their crystallite radius
Table 4.4: The optical and exciton energy of Mn-doped CdSe QDs changes with
crystallite size
Crystallite size Optical band gap Exciton energy
(nm) (eV)
2.35 4.13 2.48
2.27 3.44 2.37
2.22 2.59 2.35
2.2 2.54 2.22
2.16 2.49 2.18
2.157 2.30 2.09
2.14 2.24 2.05
2.13 2.19 2.01
1.90
2.20
2.50
2.80
3.10
3.40
3.70
4.00
1.20 1.70 2.20 2.70
Optical band gap energy
Exciton energy (Tauc`s plot)
Crystallite radius (nm)
Pho
ton e
ner
gy (
eV)

90
4.5 Photoluminescence (PL) Analysis
Another essential optical study of Mn-doped CdSe QDs is the PL emission
spectra. Figure 4.32 shows the emission spectra of Mn-doped CdSe QDs liquid samples
at various reaction times. The overall emission peaks were experienced red-shifted from
527, 546, 559, 565, 574, 575, 579 and 582 nm for 0 to 90 mins reaction times shows
prominent quantum confinement effect. As predicted, Mn-doped CdSe QDs decay to
lower energy level with shorter wavelength and with narrow emission wavelength
margin (~ 36 nm) comparable to pure CdSe QDs with emitted with wavelength range
from 546 to 719 nm for 0.2 to 90 mins with wider emission wavelength margin (~173
nm) (Hamizi & Johan, 2010). Similar phenomenon was observed in previous discussion
of of blue-shifted of absorption wavelengths experienced by Mn-doped CdSe QDs
samples as compared to pure CdSe QDs. This shows essential association of lattice
strain to the excited and decay carrier behavior of Mn-doped CdSe QDs. The lattice
strain induced by the incorporation of Mn2+
to the CdSe QDs lattice altered the carrier
band structure by compressive stress towards its (Choi et al., 2009). This lattice strain
may induced the fluorescent recombination in CdSe QDs core which the electron are
delocalized throughout the QDs while the hole is confined to the core (Steiner et al.,
2008; Peng et al., 1997). Choi et al., (2009) reported that the zinc blende CdSe/CdS
core/shell QDs observed to have blue-shifted of PL peak induced by the strain similarly
to Mn-doped CdSe QDs which may due to the increase in conduction band energy and
resulting in large wavefunction overlapping (Choi et al., 2009; Wei & Zunger, 1999).
The narrow emission wavelength margin with Mn-doped CdSe QDs growth
compared to pure CdSe QDs may due to the strong size and lateral quantization effect
induced by the lattice strain resulting in the quantization of carrier change energy.

91
Hence, the band gap energy shows a typically small broadening compared to un-
strained QDs (Pejova & Abay, 2011).
The increase in PL quantum efficiency is presented in terms of an increase in the
PL intensity (Biju et al., 2007). The PL intensity shows fluctuated values which 1 min
samples possess the higher intensity. On the other hand, the PL peaks height observed
to be increase significantly with growth of Mn-doped CdSe QDs sizes. However, the PL
peak height is insufficient for this discussion due to the change in FHWM of the PL
peaks. Thus, PL quantum efficiency does not change will QDs growth.
The width of the PL peaks shows gradually decrease with growth of the Mn-
doped CdSe QDs. The FWHM of PL peaks is 30, 25, 23, 21, 17, 8, 8 and 8 nm
approximately. The particles size distribution can be express by the PL peaks width
which is predicted to be broad at smaller QDs and gradually narrow down. The growth
of the QDs is predicted to be in relaxation states starting at 16 to 90 min samples since
there is no change in FWHM of the peak. This may due to the large total free energy
posses by Mn-doped CdSe particles at the early stage and reduces gradually with
reaction times. The total free energy of the QDs is induced thermodynamically and
highly dependent on the saturation of ion of chemical precursor (i.e. Mn, Cd and Se)
and the molar volume (Thanh et al., 2014).

92
Figure 4.32: PL emission spectra of Mn-doped CdSe QDs samples
As comparison analysis, emission energy of Mn-doped Cdse QDs liquid
samples were calculated using the classical energy equation (Eq. (4.4)). In this
particular analysis, is the emission energy and is the wavelength of maximum
emission peak height. The and both are notable plank`s constant and light velocity
constant.
(4.4)

93
Figure 4.33 shows the evolution of emission and exciton energy of Mn-doped
CdSe QDs size. Neither exciton and emission energy have the exponential nor strong
linear relation with QDs sizes growth. Both evolved in distinctly unique patent with
QDs sizes growth. Nevertheless, exciton and emission energies typically reduced with
QDs sizes growth due to a quantum confinement effect. In extent, the influence of
lattice strain may induce this change in energy band structure since it shows unique
evolution patent (Figure 4.34). It is ambiguous to prove which type of strain (expansion
or compression) experience by lower and higher state of electron transition at this point
of analysis. It has been reported that nearly all zinc blende II-VI and III-V
semiconductor, introducing of compressive force will increase the electronic band gap
(Maki et al., 2007), vice versa by the introduction of tensile strain which is represent by
a negative deformation potential, (Eq. (4.5)). Here, is the unstrained
semiconductor band gap and is the fractional volume change (Maki et al., 2007;
Persson et al., 2005).
(4.5)
Since lattice strain induces the change in conduction band in larger degree
compared to valence band (Wei & Zunger, 1999), the CdSe QDs core may experience
compressive deformation as the effect of Mn-doped shell growth with reaction time that
rise the energy level of conduction band. At the same time, Mn shell may experience
tensile strain which leads to decrease in conduction band energy level. This double
strain effect at both CdSe QDs core conduction band and Mn-doped shell conduction
band respectively, results the formation of band gap heterostructures in Mn-doped CdSe
QDs. This was similarly discussed by Smith et al., (2009) for CdTe-ZnSe core-shell
QDs (Smith et al., 2009).

94
Figure 4.33 shows obvious Stoke`s shift (~0.10 – 0.13 eV) observed in 1.23 to
2.03 QDs crystallite radius. As the QDs size increases to 2.09 and 2.15, the Stoke`s shift
(0.02 eV) became less prominent and observed to have nearly Rayleigh scattering. Anti-
Stoke`s shift shows significant effect as the QDs size growth from 2.47 to 2.74 nm. The
energy reduction rate of the conduction band became slower compared to the reduction
rate of valence band energy as the size increase from 2.09 to 2.74 nm of crystallite
radius which finally created anti-Stoke`s shift effect (Kmmell et al., 1998;
Thanikaikarasan et al., 2011). This the modification on the energy band structure of
doped QDs can be tailor by the double straining (compression or/and expansion)
induced by doping of Mn2+
and weaken the quantum confinement effect with growth of
QDs sizes (Phadnis et al., 2015; Gong et al., 2015; Chen et al., 2012).
Approximate photon energy structure of Mn-doped CdSe and pure CdSe QDs
are illustrated in Figures 4.34 and 4.35. Pure CdSe QDs in overall shows Stokes effect
at smaller QDs and anti-stokes effect in larger QDs which nearly similar to those
observed in Mn-doped CdSe QDs. Distinctly, 90 min samples of pure CdSe QDs shows
strong Stokes shift (Hamizi & Johan, 2010). Quantum confinement effect plays an
important role in creating this intermediate energy states. In Mn-doped CdSe QDs
system, Mn dopants provided extra carriers into the core CdSe QDs which will results
in creation of this intermediate energy states as illustrated in Figure 2.24 (Huang et al.,
2013).
Mn-doped CdSe QDs shows slightly larger Stokes shift (0.1 and 0.13 eV) for 0.2
and 0.5 mins samples compared to pure CdSe QDs (0.01 and 0.09 eV) (Hamizi &
Johan, 2010). This may due to the zero self-quenching and ability of doped QDs to
eliminate the re-absorption phenomenon which enlarging the Stokes shift compared to

95
pure QDs (Huang et al., 2013; Peng, 2010). Same phenomenon reported by Huang et
al., (2013) which compared stokes shift of Ag-doped CdSe QDs and pure CdSe QDs
(Huang et al., 2013). Interestingly, 1 and 5 mins samples of Mn-doped CdSe QDs
shows reduction of Stokes shift compared to pure CdSe QDs which particularly near
Rayleigh scattering and assume to be an intermediate modification of energy transition
band structure from Stokes shift to anti-stokes shift.
Many reported that the anti-stokes shift affected by non-linear phenomenon of
photon energy generation such as Auger or two-photon processes. They also reported
that the anti-stokes PL intensity increase linearly with the excitation intensity
(Yamamoto et al., 2003; Poles et al., 1999; Paskov et al., 2000; Kammerer et al., 2001;
Ignatiev et al., 1999; Edamatsu et al., 2001). This linear change of intensity of both
emission and excitation are also observed in 16, 46 and 90 mins samples of Mn-doped
CdSe QDs significantly, which shows anti-stokes effect (Figures 4.33 and 4.34).
Ignatiev et al. (1999) and Edamatsu et al, (2001) reported that the anti-stokes effect
observed in self-assemble QDs (InP and GaAs) and they both assumed that holes are
generated due to optical transition into deep level while electron are expose to external
filed such as electric current (Ignatiev et al., 1999; Edamatsu et al., 2001).

96
Figure 4.33: The evolution of exciton and emission energy of Mn-doped CdSe QDs
various sizes
2.00
2.10
2.20
2.30
2.40
2.50
1.20 1.70 2.20 2.70
Exciton energy (Tauc`s plot)
Emission energy
Crystallite radius (nm)
Pho
ton e
ner
gy (
eV)
∆Ev = 0.13 eV
0.10 eV
0.13 eV
0.02 eV
0.02 eV
0.07 eV
0.09 eV
0.12 eV
, ∆Ei
, ∆Ee

97
Fig
ure
4.3
4:
The
appro
xim
atio
n o
f ca
rrie
r en
ergy s
truct
ure
evolu
tion o
f M
n-d
oped
CdS
e Q
Ds
thro
ughout
dif
fere
nt
reac
tion t
imes
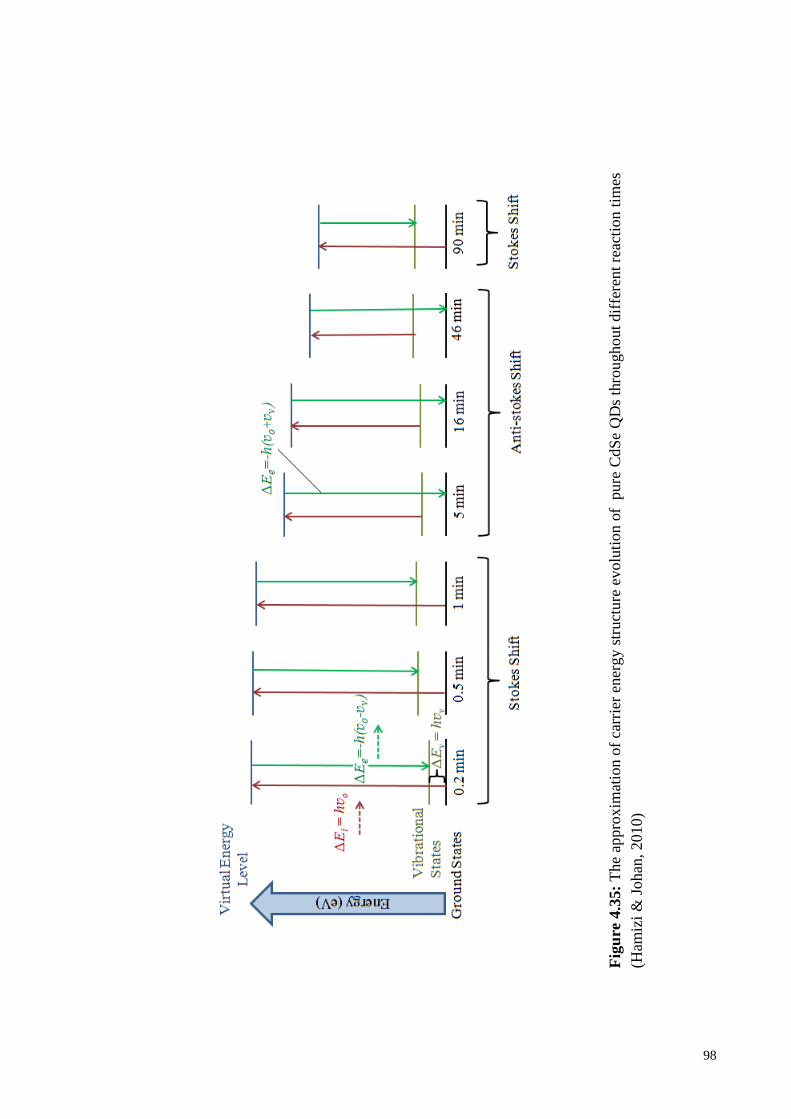
98
Fig
ure
4.3
5:
The
appro
xim
atio
n o
f ca
rrie
r en
ergy
str
uct
ure
evolu
tion o
f p
ure
CdS
e Q
Ds
thro
ughout
dif
fere
nt
reac
tion t
imes
(Ham
izi
& J
ohan
, 2010)

99
4.6 Fourier Transform Infra-red (FTIR) Analysis
The surface analysis of Mn-doped CdSe QDs performed by observing the FTIR
transmittance spectra of Mn-doped CdSe QDs samples, paraffin oil and oleic acid
(Figure 4.36). Mn-doped CdSe QDs samples spectra exhibits a well defined peak of
triplet band located at 2855, 2925 and 2956 cm−1
correspond to CH2 stretching (sp3)
which might act as surface termination of these QDs by functional groups (Deacon, et
al., 1986). The band at 722 cm−1
corresponding to CH2 vibrational mode (Becerra et al.,
1994). The peak at 1377cm−1
shows the CH3 bending in paraffin oil. C–N stretching
behavior can be shown by a peak at 1463cm−1
. In addition, the presence of IR peak at
1712 cm−1
indicates the signatures of capping agent, oleic acid bounded to the surface
of Mn-doped CdSe QDs. On the basis of the FTIR data, the surface of the CdSe QDs is
mainly coated with oleic acid ligand. Flexible organic molecules provide repulsive
interactions between the QDs in methanol, thus preventing aggregation. A small peak
shifting (~0.1 – 2 cm-1
) towards larger wavenumber observed as the QDs sizes increase.
Small peak shift towards larger wavenumber also observed in Mn-doped CdSe
QDs FTIR peaks as compared to pure CdSe QDs (Hamizi & Johan, 2010), particularly
for triplet band of CH2 stretching.
100
Figure 4.36: The FTIR pattern of paraffin oil, oleic acid and Mn-doped CdSe QDs at
various reaction time and

101
4.7 Raman Spectroscopy Analysis
Further analysis on optical and vibrational properties of Mn-doped CdSe QDs
various sizes are studied using Raman spectroscopy. Figure 4.37 shows the Raman
spectra of Mn-doped CdSe QDs of 0 to 90 min samples. Two significant peaks were
observed correspond to the scattering by the longitudinal optical (LO) of phonon and its
first overtone (2LO) which located near ~ 200 and 400 cm-1
under an exposure of 532
nm incident laser. The LO and 2LO peaks were observed to behave red-shifted with
respect to the excitation wavelength as tabulated in Table 4.4. Furthermore, the overall
LO of Mn-doped CdSe QDs shows strong blue-shift compared to the LO for and pure
CdSe QDs of 3.15 nm particle diameter (206 cm-1
) (Kelley et al., 2013) and bulk CdSe
QDs (210 cm-1
) (Plotnichenko et al., 1977). Both of these raman-shifts are induced by
phonon confinement. Furthermore, this red-shift behavior may contributed by lattice
strain induced by the doping of Mn mechanism into CdSe QDs (Barglikchory et al,
2003). These two factors may also lead to the domination of anti-Stoke`s shift in highest
occupied molecular orbital and lowest un-occupied molecular orbital (HOMO-LUMO)
transition for 16, 46 and 90 mins samples respectively (Plotnichenko et al., 1977).
In addition, Mn-doped CdSe QDs exhibits extremely broader LO (~100 cm-1
)
peak compared to bulk CdSe (~5 cm-1
) (Plotnichenko et al., 1977) which can induced by
combination factor of phonon confinement, band gap structural disorder and QDs sizes
distribution that are all is a function of QDs sizes growth and Mn-doped factor (Patel et
al., 2014; Kelley et al., 2013).
On the other hand, there was a slight increase in LO line width as the QDs size
reduced. The increment is believe to be arises from the low-wavenumber side induced
102
by the negative dispersion of phonon branch away from the zone-centre optical phonon
as proposed in Brillouin zone (Bilz and Kress., 1979). It is also reported that the line
width increases are prominent for QDs with size below 10 nm (Arora et al., 2007). This
which is contradic with Mn-doped CdSe QDs raman analysis which shows of constant
increase in LO line width for QDs size 11 to 14 nm (16- 90 mins) which similarly
observed for QDs with below size of 10 nm.
Equally important, the peak shoulder features at low wavenumber of LO peak
observed in each Raman spectra. This surface optical (SO) phonon mode are observed
in wide range of QDs semiconductors which is also contributed by the phonon
confinement phenomenon of LO phonon with non-zero angular momenta (Trallero et
al., 1998). Then again, the Mn-doped as a lattice strain inducer can influence the
formation of this SO features (Muck et al., 2004).
The intensity ratio of 2LO and LO ( ) reported to be strongly related to
the electron-phonon coupling strength in QDs (Klein et al., 1990). As for Mn-doped
CdSe QDs the not varied much change (~0.32- 0.37), which indicated that
electron-phonon coupling in Mn-doped CdSe QDs were not affected much with QDs
size variations (Klein et al., 1990).

103
Figure 4.37: Raman scattering spectra of Mn-doped CdSe QDs at various reaction
times

104
Table 4.5: Raman scattering parameters and excitation wavelengths for various sizes of
Mn-doped CdSe QDs samples
QDs physical size LO 2LO
(nm) (cm-1
) (cps)
3 205.3 410.0 0.37
5 205.6 410.7 0.37
8 206.2 411.5 0.36
9 206.6 412.3 0.33
10 207.0 412.9 0.33
11 207.8 413.4 0.34
12 208.3 414.0 0.32
14 208.8 415.0 0.33

105
4.8 X-Ray Photoelectron Spectroscopy Analysis
The surface composition of Mn-doped CdSe QDs was analyzed using X-ray
photoelectron spectroscopy (XPS) as shown Figure 4.38 The XPS scans traced the
presence of Se 3d and Cd 3d band of CdSe crystal which having a binding energy of
54.1 and 404.5 eV (Agostenelli et al., 1989), respectively. The Mn 2p band from Mn
element traced to have a binding energy of 640.7 eV (Ivanov et al., 1982)
approximately, thus confirmed the presence of Mn interstitial site on the surface of
CdSe QDs core act as a dope element. Figure 4.39 also shows the presence of C 1s and
O 1s band which each has a binding energy of 285 and 532 eV, respectively (Dai et al.,
2004).
The background correction of each XPS scan is based on C 1s (285 eV). This
background correction to tailor the shift of the peak due to the retarding field at the
surface of the specimen called static charging. The static charging phenomena reduce
the kinetic energy of the excited electron (Dai et al., 2004).
The intensity of the C 1s and O 1s peaks observed to be remained significant in
each scan, both traced elements peaks show notable intensity in each scan compared to
other element band traced such as Cd 3d, Se 3d and Mn 2p that may indicate the
influenced of oleic acid capping on the surface of the Mn-doped CdSe QDs, which
contributed to the formation of Cd-oleate (C36H70CdO4) and Mn-oleate (C36H66MnO4)
on the surface of QDs specifically on {001} planes. The present of Cd-oleate and Mn-
oleate reduced the dangling orbitals on the surface of QDs which add the essential point
of doping Mn into the CdSe QDs. These dangling orbitals is the orbitals that point away
from the surface of the QDs results from the incomplete bonding because of the lower

106
coordination number on the surface on contrary of the interior QDs structure. In the case
of CdSe QDs, both Cd and Se dangling orbitals will each act as an electron trap and
hole trap, thus will trap charge carriers on the surface of CdSe QDs which lead to the
decreases of quantum yield (Smith & Shuming, 2010; Pokrant & Whaley, 1999). Hence,
it is assume that Mn-doped CdSe QDs will have higher florescence quantum yield
disputes from pure CdSe QDs.
Furthermore, the significant C 1s peak also may associate with the existence of
organic residue from solvent used, which is a paraffin that having a general chemical
formula of CxH (2x+2). The adsorption of adventitious carbon during the drying and
handling process may add a point to observed C 1s peak (Dai et al., 2004).
Figure 4.38 not just give the information about surface elementary, it also
supplied the crucial information of the kinetic and interaction between electron at
certain orbital that contain un-paired electron. In initial or original state, the un-paired
electron suggested to be located at 3d orbital for Cd and Se and 2p orbital for Mn for
CdSe Mn-doped QDs. The spin orbital splitting may occur in the final state when the
un-paired electron from ionization during the photoemission process coupled with the
un-paired electron from the initial or original state at specific spin orbital (Dai et al.,
2004).

107
Figure 4.38: XPS wide scan of Mn-doped CdSe QDs at different reaction times
Figure 4.39 shows the Cd 3d individual peaks of Mn-doped CdSe QDs of
different reaction times. The maximum peak intensity (original spectra) observed to
shift towards larger binding energy as the reaction time rises. This suggests that this
chemical shift is a function of size of the Mn-doped CdSe QDs (Katari et al., 1994).

108
Figure 4.39 also shows Cd 3d Lorentzian-Gaussian fit peaks. The Cd 3d peak is
deconvoluted using a Lorentzian-Gaussian function. The Lorentzian-Gaussian fit shows
the existence of Cd 3d (Lorentz fit 1) and Cd 3d5/2 (Lorentz fit 2) band which suggested
that Cd is bound directly to Se at this two possible spin-orbital to form the CdSe QDs
core. The Cd 3d band with a binding energy of 404.8 eV (Agostinelli et al., 1989)
observed to be consistently appeared in 0-90 min XPS scan. The Cd 3d5/2 band peak
fitted to have a binding energy range from 405.3 to 406.1 eV quite near to the value
reported to be 405.8 eV (±2) (Gaarenstroom & Winograd,1977). The position of
Lorentz fit 1 shows that Cd 3d band appeared to have consistent binding energy of
404.8 eV for each scan, where as Cd 3d5/2 (Lorentz fit 2) appeared to have slight
chemical shift ranging between 405.3 to 406.1 eV.
In addition, Cd 3d5/2 band observed to appeared in Lorentz fit for 0.5, 1, 5, 16,
46 and 90 mins samples scan and not in 0 and 1 min. This suggested that 0.5, 1, 5, 16,
46 and 90 mins Mn-doped CdSe QDs have a un-paired electron at Cd 3d band with total
electronic angular momentum (j) of 5/2 for the multiple spin orbital splitting to
occurred. The values of j are described in Eq. (4.6).
(4.6)
where,
= total orbital angular/ angular quantum number (>1 for p, d and f orbitals)
= spin momenta/ spin quantum number (± ½)
109
Because is larger than zero for d orbital, the orbital line have the tendency to split into
doublet. For 3d orbital, the doublet will be 3d3/2 ( = ½) indicated that the orbital is
spinning down and 3d5/2 ( indicated that the orbital is spinning up. Therefore,
the spinning up orbital dominant in CdSe Mn-doped QDs orbital splitting system (Dai et
al, 2004).
In contrary, 0 and 0.2 min samples no spin orbital interaction, therefore the
energy contained in Cd 3d spin orbital are equal for both before and after the
photoemission process. This suggests being due to the increase in quantum yield on the
surface of atom as the size of QDs decrease to 5 nm downward.

110
Figure 4.39: XPS scan of Cd 3d traced for Mn-doped CdSe QDs samples
111
Figure 4.40 shows the individual XPS peaks of Se 3d and its Lorentz fits. There
is no obvious shift of original peak observed in contrary with Cd 3d results. On the
other hand, the Lorentz fit 1 notice to be shift to smaller binding energy (404.2 eV) for 0
and 0.2 mins samples which also may due to the function of QDs size to the chemical
shift.
Lorentz fit 2 shows distributed reading ranging from 54.9 to 56.7 eV exclude for
46 and 16 min samples. 0 min XPS spectra fitted to have extra Lorentz fit at 56.7 eV.
Lorentz fit 2 and 3 indicated the influence of Se 3d5/2 band in the CdSe QDs bounding.
Same elaboration as in Figure 4.10, the spinning up orbital are dominating the Se
system exclude 46 and 16 mins which may due to the absence of spinning orbital
interaction (Dai et al., 2004).
Interesting observation on 0 min samples Se 3d peak exhibit three Lorentz fitting
features, which is 54.4 eV which correspond to Se 3d band, and 55.2 and 56.7 eV
corresponds to 3d5/2 which assume to be due to the band structure complexation due to
the higher density of lattice strain of core CdSe QDs where Se atom are mainly located.

112
Figure 4.40: The XPS scan of Se traced for Mn-doped CdSe QDs at various reaction
times

113
Figure 4.41 shows the Mn 2p traced having which is crucial to the point of
proving the present of Mn-doped act as a shell in core-shell Mn-doped CdSe QDs
samples. The Lorentz fit 1 corresponds to the Mn 2p band with binding energy of 640.7
eV is well fit in each sample.
Lorentz Fit 2 with binding energy ranging from 642.2 to 645.9 eV in each XPS
scan which observed to initially created a shouldering peak and eventually shifted to
create another defined peak as the QDs size increases. The roles of Mn shell as a lattice
strain inducer may change with growth of QDs sizes. Moreover, the present of Lorentz
fit 3 and 4 for 0 min sample give an idea of extreme changes in lattice parameter at
critically small QDs which may induced by the Mn shell. In extent, the intensity of the
Mn 2p peaks is declined with QDs size growth. This can due to the decrease in Mn shell
thickness with QDs size growth, which related to the function of Mn ion concentration
with reaction time (Dai et al., 2004).
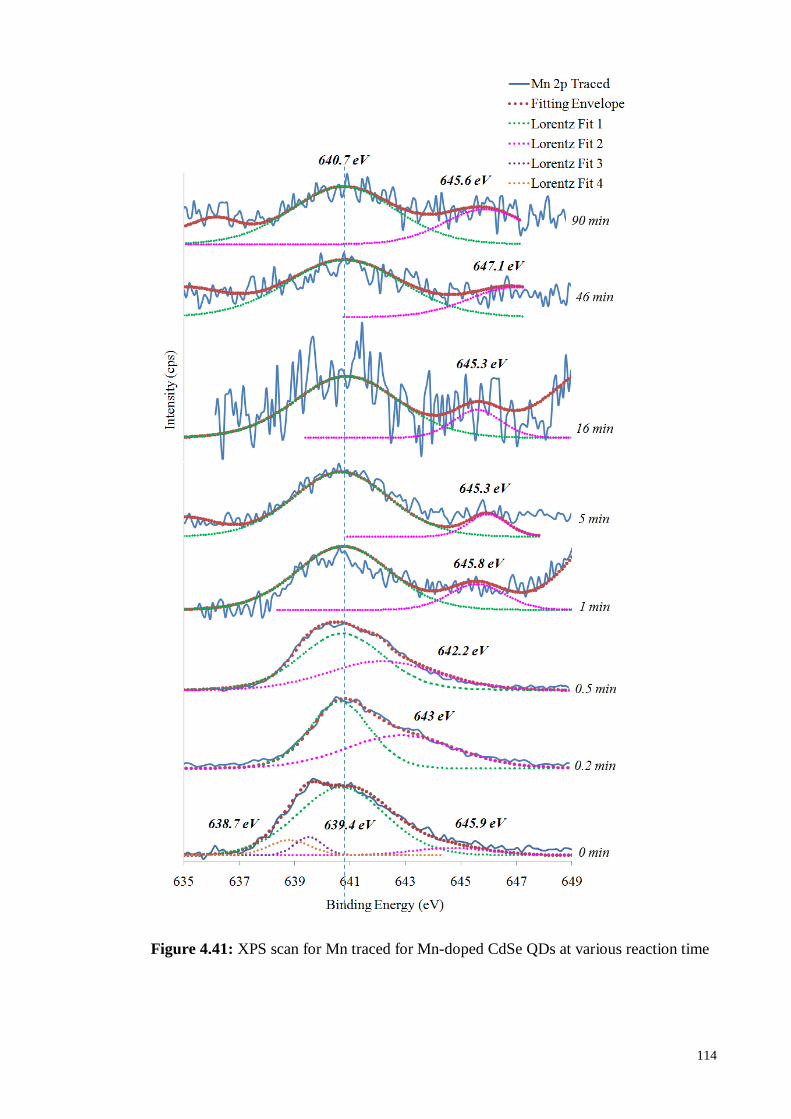
114
Figure 4.41: XPS scan for Mn traced for Mn-doped CdSe QDs at various reaction time

115
The oxidation states of excited element generally reported to be 2 for Cd, ±2, 4
and 6 for Se (Dai et al, 2004) and 7, 6, 4, 2 and 3 for Mn (Biesinger et al., 2011).
Figure 4.42 shows the relation between the Mn-doped CdSe QDs sizes with Cd
3d, Se 3d and Mn 2p XPS peak intensity. Traced Cd 3d element shows the high values
of peak intensity compared to Se 3d and Mn 2p. This due to high concentration of Cd
atoms on the surface of QDs that are presence as a Cd-oleate that act as ligand and Cd
atoms that near to the core-shell intermediate. These also add essential idea of the role
of Cd as the major electron donor in Mn-doped CdSe QDs system. The relation between
the XPS peak intensity and the ion or atom concentration are strongly support by Eq.
(4.7) where the electron intensity ( ) presents by XPS peak are directly proportional to
the concentration of the atom or ion on the samples ( ) especially on the surface of the
samples (Katari et al., 1994).
(4.7)
where,
= Electron intensity
= Photon flux
= Concentration of the atom or ion in the solid
= Cross-section for photoelectron production
= Instrumental factors
= Electron attenuation length
In addition, the intensity of Cd 3d peaks observed to be decreases from 3364 to
2000 cps as the QDs size increases. This may due to the increases of electron

116
concentration that leave the CdSe Mn-doped QDs solid samples after been irradiated by
X-ray as the sizes of QDs became smaller. The smaller QDs have a larger surface area
thus, larger sample area are exposed to the x-ray resulting in higher concentration of
electron emitted from the QDs surface (Dai et al., 2004). A great drop of peak intensity
observed for 0 to 46 min samples and became stable at the final stage (46 and 90 mins).
The influence of QDs size is less effective to the peak intensity as the size became
larger than 12 nm.
Figure 4.42: Relation between peak intensity and the variation in size of Mn-doped
CdSe QDs
Another interest feature of XPS spectra is the peak broadening. Table 4.1
tabulated the full width at half maximum (FWHM) of Cd 3d, Se 3d and Mn 2p peaks.
1000
1500
2000
2500
3000
3500
2 4 6 8 10 12 14
Cd 3d
Se 3d
Mn 2p
QDs size (nm)
Pea
k I
nte
nsi
ty (
cps)

117
The FWHM of Cd 3d are ranging between 1.3 to 1.5 eV for 0 to 5 min reaction time
samples, but then the FWHM values shows increment patent for 16 to 90 mins samples.
Se 3d and Mn 2p show FWHM values are narrowly distributed for 0 to 16 mins
samples. The FWHM values measured to be rising for 46 and 90 min.
This increment patent may relative to the QDs size increment especially for Cd
3d since Cd are predicted to be the larger carrier donor at the surface of QDs. Beside,
increases in energy band gap inversely proportional to the QDs. To elaborate more, Eq.
(4.8) are stated to shows the relation between energy band gap ( ) and the carrier
effective mass ( ) that are also inversely proportional where and are constants
factors.
(4.8)
The charge carrier lifetime is highly depending on the charge carrier
concentration since it also proportional to effective mass of carrier. Peak broadening
with decrement of energy band gap may be due to the increase in carrier lifetime.
Attribute to the Heisenberg’s uncertainty principle (Stohr, 1992), the core-hole which
created by the incident photon has a finite lifetime, which will create a broadening
effect in XPS peak. This broadening is well known as natural or lifetime broadening
which is also the minimum attainable peak width. The collision of Cd, Se and Mn
atoms with each other whether between same or different element will create distorted
energy level and resulting in a shorter lifetime of the excited state. This collision effect
leads to the broadening of XPS peak (collision broadening). Both of this broadening
match a Lorentzian profile (Dai et al., 2004). Table 4.6 summary the results.

118
Table 4.6: Full width at half maximum of XPS peak of Mn-doped CdSe QDs for
different reaction times.
Reaction Time FHWM (eV)
(min) Cd 3d Se 3d Mn 2p
0 1.5 2.2 2.3
0.2 1.4 2.2 2.2
0.5 1.3 2.6 2.3
1 1.3 2.7 2.3
5 1.3 2.6 2.4
16 2.2 2.7 2.5
46 2.5 3.6 3.0
90 2.3 4.1 5.1
A broad QDs size distribution may also lead to the XPS peak broadening. The
variation of defect density due to the QDs size distribution will lead to the variations in
band bending. This band bending will produced broaden peak. This discussion are
supported by the QDs size distribution histogram in Chapter 4.2 that shows broad QDs
size distribution in samples 46 and 90 mins samples compared to others (Dai et al.,
2004).

119
4.9 Mechanism of Mn-doped CdSe QDs Formation
Based on the properties results and some literatures, a possible mechanism for
the formation of Mn-doped CdSe QDs is suggested and summaries in Eq. (4.9) which
indicated the general redox reaction for the formation of Mn-doped CdSe QDs. Firstly,
when the mixture of Mn acetate, Cd oxide and oleic acid (OA) were dissolved in the
paraffin oil, and leaded to 160 ºC, a light yellowish solution was produced that indicated
that the formation of Mn-Cd complex (Deng et al., 2005) as shown in Eq. (4.10). Then
Se was dissolved in the paraffin oil and heated to 220 ˚C through dehydrogenation
reaction, a light orange then turn wine red solution was produced as shown in Eq.
(4.11). Se is reduced to H2Se gas under heating while the long alkane chain is oxidated
to the long alkene chain since carbon atom in the long alkane chains acts as the reducing
agent and the long alkene should be the oxidation product. When the Mn-Cd complex
was mixed with H2Se, resulting in the formation of Mn-doped CdSe nuclei as shown in
Eq (4.12):
There are three possible reasons behind the formation stable homogeneous Se
solution:
(1) The melting point of as-used Se powder is 217 ˚C. Thus the liquid stable of Se
could be formed near or above 217 ˚C in the paraffin liquid.
(2) The liquid state of Se can be well dispersed in the paraffin liquid or other
solvents with long alkane chains.
(3) H2Se gas can be formed into alkene after heating.
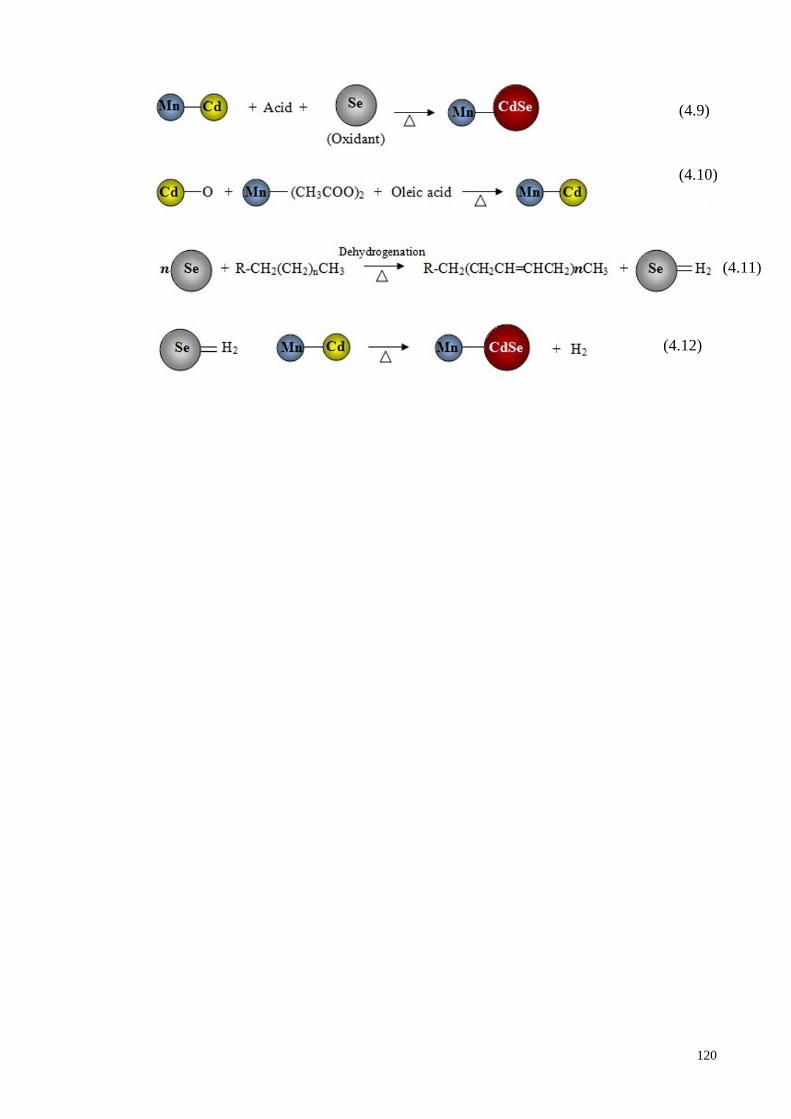
120
(4.9)
(4.10)
(4.11)
(4.12)

121
CHAPTER FIVE
CONCLUSION
Mn-doped CdSe QDs with physical size of 3 to 14 nm and crystallite size of
2.46 to 5.46 nm are successfully synthesized using inverse Micelle technique with
narrow QDs size distribution and possesses quasi-sphere QDs shape. The Mn-doped
CdSe QDs possesses high quality zinc blende crystal structure with tetrahedral plane
(001) doped with Mn ion. The QDs size reduction shows typical blue-shift of
absorption and emission wavelengths due to the quantum confinement effect. The
marginal transition from HOMO-LUMO Stoke`s shift to anti-Stoke shift as the QDs
physical size rose to 11 to 14 nm is prominent combination effect of lattice straining and
QDs size reduction. This band gap structure modification is prominenetly effected by
the introduction of lattice strain to the surface of QDs. The effect of this latice strain is
observed to be highly significant at smaller QDs. FTIR spectra confirmed the oleate-
capping introduced to the surface of Mn-doped CdSe QDs which act as the surface
passivator which reduced the particle interfacial electron and hole trapping
phenomenon. The phonon confinement observed in Mn-doped CdSe QDs from the
blue-shift behavior of LO and 2LO compared to pure CdSe QDs. The surface
composion of the Mn-doped CdSe QDs are shows the corporation of Mn into CdSe
lattice. The introduction of strain to the lattice of the core CdSe QDs are prominently at
interfacial of QDs which is highly corporate by Mn dopants. The mechanism of Mn-
doped CdSe formation are purposed.

122
FURTHER RECOMMENDATIONS
Mn-doped CdSe QDs has shown promising tunable optical and electronic
properties from this work and significant work by other researcher. Despite all this,
many research gaps have to be fill in order to provide a better understanding in Mn-
doped CdSe QDs system affected its properties. Therefore, for further work, it is
recommended to have a rapid quenching procedure immediately after the each reaction
times is over to reduce ripening effect to QDs sizes since the solution bath still under
significantly high temperature near to reaction temperature after the heating process
were stop. Furthermore, determination of quantum yield via PL spectroscopy are highly
recommended which will significantly support the discussion and better understanding
in the improvement that been contributed by Mn doping mechanism into CdSe QDs.
Further study on the thickness or the density state of Mn dopant on the surface of the
CdSe QDs are significant for further work since it is reported in this work that the Mn-
doped induced strain to the CdSe QDs lattice hence tuned the optical inter-band
structure. Intense studies on the behavior of strain apply to the CdSe QDs lattice are
highly recommended by varying a strain induced parameter such as dopants
concentration and location.

xx
REFERENCES
Agostinelli, E., Battistoni, C., Fiorani, D., Mattogno, G., & Nogues, M. (1989). An XPS
study of the electronic structure of the Zn x Cd 1− x Cr 2 (X= S, Se) spinel
system. Journal of Physics and Chemistry of Solids, 50(3), 269-272.
Alahmed, Z. A. (2013). Effects of in-plane tensile strains on structural, electronic, and
optical properties of CdSe. Solid State Sciences, 21, 11-18.
Alivisatos, A. P. (1996). Semiconductor clusters, nanocrystals, and quantum dots.
Science, 271(5251), 933-937.
Ameen, T., Ilatikhameneh, H., Charles, J., Hsueh, Y., Chen, S., Fonseca, J., . . .
Klimeck, G. (2014). Optimization of the anharmonic strain model to capture
realistic strain distributions in quantum dots. Paper presented at the 14th IEEE
International Conference on Nanotechnology.
Arora, A. K., Rajalakshmi, M., Ravindran, T., & Sivasubramanian, V. (2007). Raman
spectroscopy of optical phonon confinement in nanostructured materials.
Journal of Raman Spectroscopy, 38(6), 604-617.
Awschalom, D. D., & Kikkawa, J. M. (1999). Electron spin and optical coherence in
semiconductors. Physics Today, 52, 33-39.
Bae, W. K., Nam, M. K., Char, K., & Lee, S. (2008). Gram-Scale One-Pot Synthesis of
Highly Luminescent Blue Emitting Cd1− x Zn x S/ZnS Nanocrystals. Chemistry
of Materials, 20(16), 5307-5313.
Bae, Y., Myung, N., & Bard, A. J. (2004). Electrochemistry and electrogenerated
chemiluminescence of CdTe nanoparticles. Nano Letters, 4(6), 1153-1161.
Baker, S. N., & Baker, G. A. (2010). Luminescent carbon nanodots: emergent
nanolights. Angew Chem Int Ed Engl, 49(38), 6726-6744.
doi:10.1002/anie.200906623
Bakueva, L., Musikhin, S., Hines, M., Chang, T.-W., Tzolov, M., Scholes, G., &
Sargent, E. (2003). Size-tunable infrared (1000–1600 nm) electroluminescence
from PbS quantum-dot nanocrystals in a semiconducting polymer. Applied
physics letters, 82(17), 2895-2897.
Balet, L. P., Ivanov, S. A., Piryatinski, A., Achermann, M., & Klimov, V. I. (2004).
Inverted core/shell nanocrystals continuously tunable between type-I and type-II
localization regimes. Nano Lett., 4, 1485-1488. Retrieved from
http://dx.doi.org/10.1021/nl049146c

xxi
Balzar, D. (1999). Voigt-function model in diffraction line-broadening analysis.
International Union of Crystallography Monographs on Crystallography, 10,
94-126.
Bang, J., Yang, H., & Holloway, P. H. (2006). Enhanced and stable green emission of
ZnO nanoparticles by surface segregation of Mg. Nanotechnology, 17(4), 973.
Battaglia, D., & Peng, X. (2002). Formation of high quality InP and InAs nanocrystals
in a noncoordinating solvent. Nano Letters, 2(9), 1027-1030.
Beaulac, R., Schneider, L., Archer, P. I., Bacher, G., & Gamelin, D. R. (2009). Light-
induced spontaneous magnetization in doped colloidal quantum dots. Science,
325(5943), 973-976.
Becerra, L. R., Murray, C. B., Griffin, R. G., & Bawendi, M. G. (1994). Investigation of
the surface morphology of capped CdSe nanocrystallites by 31P nuclear
magnetic resonance. The Journal of chemical physics, 100(4), 3297-3300.
Bera, D., Qian, L., Sabui, S., Santra, S., & Holloway, P. H. (2008). Photoluminescence
of ZnO quantum dots produced by a sol–gel process. Optical Materials, 30(8),
1233-1239.
Bera, D., Qian, L., Tseng, T.-K., & Holloway, P. H. (2010). Quantum Dots and Their
Multimodal Applications: A Review. Materials, 3(4), 2260. Retrieved from
http://www.mdpi.com/1996-1944/3/4/2260
Bera, D., Yang, H., & Holloway, P. (2006). Efficient and photostable ZnS-passivated
CdS: Mn quantum dots. ECS Transactions, 3(5), 5-17.
Bhargava, R. N., Gallagher, D., Hong, X., & Nurmikko, A. (1994). Optical properties of
manganese-doped nanocrystals of ZnS. Phys. Rev. Lett., 72, 416-419. Retrieved
from http://dx.doi.org/10.1103/PhysRevLett.72.416
Biju, V., Kanemoto, R., Matsumoto, Y., Ishii, S., Nakanishi, S., Itoh, T., . . . Ishikawa,
M. (2007). Photoinduced photoluminescence variations of CdSe quantum dots in
polymer solutions. The Journal of Physical Chemistry C, 111(22), 7924-7932.
Bilz, H., & Kress, W. (1979). Springer Series in Solid State Sciences.
Bockris, J. O. M., & Reddy, A. K. N. (1970). Modern Electrochemistry.
Brennan, J. G., Siegrist, T., Carroll, P. J., Stuczynski, S. M., Reynders, P., Brus, L. E.,
& Steigerwald, M. L. (1990). Bulk and nanostructure Group II-VI compounds
from molecular organometallic precursors. Chemistry of Materials, 2(4), 403-
409. doi:10.1021/cm00010a017
xxii
Bruchez, M. J., Moronne, M., Gin, P., Weiss, S., & Alivisatos, A. P. (1998).
Semiconductor nanocrystals as fluorescent biological labels. Science, 281(5385),
2013-2016.
Brus, L. (1986). Electronic wave functions in semiconductor clusters: experiment and
theory. The Journal of Physical Chemistry, 90(12), 2555-2560.
doi:10.1021/j100403a003
Brus, L. (2008). Noble Metal Nanocrystals: Plasmon Electron Transfer Photochemistry
and Single-Molecule Raman Spectroscopy. Accounts of Chemical Research,
41(12), 1742-1749. doi:10.1021/ar800121r
Brus, L. E. (1983). A simple model for the ionization potential, electron affinity, and
aqueous redox potentials of small semiconductor crystallites. J. Chem. Phys., 79,
5566-5571. Retrieved from http://dx.doi.org/10.1063/1.445676
Brus, L. E. (1984). Electron-electron and electron-hole interactions in small
semiconductor crystallites: The size dependence of the lowest excited electronic
state. Chemical Physics, 80, 4403-4409. doi:10.1063/1.447218
Bryan, J. D., & Gamelin, D. R. (2005). Doped semiconductor nanocrystals: synthesis,
characterization, physical properties, and applications. Prog. Inorg. Chem, 54,
47-126.
Bullen, C. R., & Mulvaney, P. (2004). Nucleation and Growth Kinetics of CdSe
Nanocrystals in Octadecene. Nano Letters, 4(12), 2303-2307.
doi:10.1021/nl0496724
Burda, C., Chen, X., Narayanan, R., & El-Sayed, M. A. (2005). Chemistry and
properties of nanocrystals of different shapes. Chemical reviews, 105(4), 1025-
1102.
Canham, L. T. (1990). Silicon quantum wire array fabrication by electrochemical and
chemical dissolution of wafers. Applied Physics Letters, 57(10), 1046-1048.
doi:doi:http://dx.doi.org/10.1063/1.103561
Canham, L. T. (2007). Nanoscale semiconducting silicon as a nutritional food additive.
Nanotechnology, 18(18), 185704. Retrieved from http://stacks.iop.org/0957-
4484/18/i=18/a=185704
Cao, L., Wang, X., Meziani, M. J., Lu, F., Wang, H., Luo, P. G., . . . Sun, Y. P. (2007).
Carbon dots for multiphoton bioimaging. J Am Chem Soc, 129(37), 11318-
11319. doi:10.1021/ja073527l
Cao, Y.-W., & Banin, U. (1999). Synthesis and Characterization of InAs/InP and
InAs/CdSe Core/Shell Nanocrystals. Angewandte Chemie International Edition,
38(24), 3692-3694. doi:10.1002/(SICI)1521-3773(19991216)38:24<3692::AID-
ANIE3692>3.0.CO;2-W
xxiii
Castro, S. L., Bailey, S. G., Raffaelle, R. P., Banger, K. K., & Hepp, A. F. (2003).
Nanocrystalline Chalcopyrite Materials (CuInS2 and CuInSe2) via Low-
Temperature Pyrolysis of Molecular Single-Source Precursors. Chemistry of
Materials, 15(16), 3142-3147. doi:10.1021/cm034161o
Chason, E., Picraux, S., Poate, J., Borland, J., Current, M., De la Rubia, T. D., . . .
Magee, C. (1997). Ion beams in silicon processing and characterization. Journal
of applied physics, 81(10), 6513-6561.
Chen, H.-Y., Maiti, S., Nelson, C. A., Zhu, X., & Son, D. H. (2012). Tuning
Temperature Dependence of Dopant Luminescence via Local Lattice Strain in
Core/Shell Nanocrystal Structure. The Journal of Physical Chemistry C,
116(44), 23838-23843.
Chen, H. S., Wang, S. J. J., Lo, C. J., & Chi, J. Y. (2005). White-light emission from
organics-capped ZnSe quantum dots and application in white-light-emitting
diodes. Applied Physics Letters, 86(13), 131905.
Chen, X., Hutchison, J. L., Dobson, P. J., & Wakefield, G. (2009). Highly luminescent
monodisperse CdSe nanoparticles synthesized in aqueous solution. Journal of
materials science, 44(1), 285-292.
Chen, X., Lou, Y., Samia, A. C., & Burda, C. (2003). Coherency strain effects on the
optical response of core/shell heteronanostructures. Nano Letters, 3(6), 799-803.
Chen, Y., Li, S., Huang, L., & Pan, D. (2013). Green and facile synthesis of water-
soluble Cu–In–S/ZnS core/shell quantum dots. Inorganic chemistry, 52(14),
7819-7821.
Choi, C. L., Koski, K. J., Sivasankar, S., & Alivisatos, A. P. (2009). Strain-dependent
photoluminescence behavior of CdSe/CdS nanocrystals with spherical, linear,
and branched topologies. Nano letters, 9(10), 3544-3549.
Coe-Sullivan, S., Steckel, J. S., Woo, W. K., Bawendi, M. G., & Bulović, V. (2005).
Large-Area Ordered Quantum-Dot Monolayers via Phase Separation During
Spin-Casting. Advanced Functional Materials, 15(7), 1117-1124.
doi:10.1002/adfm.200400468
Colvin, V., Goldstein, A., & Alivisatos, A. (1992). Semiconductor nanocrystals
covalently bound to metal surfaces with self-assembled monolayers. Journal of
the American Chemical Society, 114(13), 5221-5230.
Crooker, S. A., Barrick, T., Hollingsworth, J. A., & Klimov, V. I. (2003). Multiple
temperature regimes of radiative decay in CdSe nanocrystal quantum dots:
Intrinsic limits to the dark-exciton lifetime. Appl. Phys. Lett. , 82(2793).
doi:http://dx.doi.org/10.1063/1.1570923
Dabbousi, B. O., Rodriguez-Viejo, J., Mikulec, F. V., Heine, J. R., Mattoussi, H., Ober,
R., . . . Bawendi, M. G. (1997). (CdSe)ZnS Core−Shell Quantum Dots:

xxiv
Synthesis and Characterization of a Size Series of Highly Luminescent
Nanocrystallites. The Journal of Physical Chemistry B, 101(46), 9463-9475.
doi:10.1021/jp971091y
Dahan, M., Levi, S., Luccardini, C., Rostaing, P., Riveau, B., & Triller, A. (2003).
Diffusion dynamics of glycine receptors revealed by single-quantum dot
tracking. Science, 302(5644), 442-445. doi:10.1126/science.1088525
Dai, Q., Sabio, E. M., Wang, W., & Tang, J. (2014). Pulsed laser deposition of Mn
doped CdSe quantum dots for improved solar cell performance. Applied Physics
Letters, 104(18), 183901.
Danek, M., Jensen, K. F., Murray, C. B., & Bawendi, M. G. (1996). Synthesis of
luminescent thin-film CdSe/ZnSe quantum dot composites using CdSe quantum
dots passivated with an overlayer of ZnSe. Chemistry of Materials, 8(1), 173-
180.
Das, S., Dutta, A., Banerjee, S., & Sinha, T. P. (2014). Phonon modes and activation
energy of Fe-doped CdSe nanoparticles. Materials Science in Semiconductor
Processing, 18, 152-159. doi:http://dx.doi.org/10.1016/j.mssp.2013.11.023
Deacon, G. B., Faulks, S. J., & Pain, G. N. (1986). The synthesis of organometallics by
decarboxylation reactions. Advances in organometallic chemistry, 25, 237-276.
Delhez, R., de Keijser, T. H., Langford, J., Louër, D., Mittemeijer, E., & Sonneveld, E.
(1993). Crystal imperfection broadening and peak shape in the Rietveld method.
The Rietveld Method, 132.
Deng, Z., Cao, L., Tang, F., & Zou, B. (2005). A New Route to Zinc-Blende CdSe
Nanocrystals: Mechanism and Synthesis. The Journal of Physical Chemistry B,
109(35), 16671-16675. doi:10.1021/jp052484x
Devi, L. S., Devi, K. N., Sharma, B. I., & Sarma, H. N. (2014). Influence of Mn doping
on structural and optical properties of CdS nanoparticles. Indian Journal of
Physics, 88(5), 477-482. doi:10.1007/s12648-013-0436-8
Ding, Z., Quinn, B. M., Haram, S. K., Pell, L. E., Korgel, B. A., & Bard, A. J. (2002).
Electrochemistry and electrogenerated chemiluminescence from silicon
nanocrystal quantum dots. Science, 296(5571), 1293-1297.
doi:10.1126/science.1069336
Dong, H., Jin, S., Ju, H., Hao, K., Xu, L.-P., Lu, H., & Zhang, X. (2012). Trace and
label-free microRNA detection using oligonucleotide encapsulated silver
nanoclusters as probes. Analytical chemistry, 84(20), 8670-8674.
Dongzhi, Y., Qifan, C., & Shukun, X. (2007). Synthesis of CdSe/CdS with a simple
non-TOP-based route. Journal of Luminescence, 126(2), 853-858.

xxv
Edamatsu, K., Watatani, C., Itoh, T., Shimomura, S., & Hiyamizu, S. (2001). Resonant
excitation and anti-Stokes luminescence of GaAs single quantum dots. Journal
of luminescence, 94, 143-146.
Efros, A. L., & Efros, A. L. (1982). Interband absorption of light in a semiconductor
sphere. Soviet Physics Semiconductors-Ussr, 16(7), 772-775.
Efros, A. L., Rashba, E. I., & Rosen, M. (2001). Paramagnetic ion-doped nanocrystal as
a voltage-controlled spin filter. Phys. Rev. Lett., 87, 206601. Retrieved from
http://dx.doi.org/10.1103/PhysRevLett.87.206601
Ekimov, A. I., & Efros, A. L. (1988). Optical Spectroscopy of Size Effects in
Semiconductor Microcrystals. In J. L. Birman, H. Z. Cummins, & A. A.
Kaplyanskii (Eds.), Laser Optics of Condensed Matter (pp. 199-207). Boston,
MA: Springer US.
Ekimov, A. I., Efros, A. L., & Onushchenko, A. A. (1985). Quantum size effect in
semiconductor microcrystals. Solid State Communications, 56(11), 921-924.
doi:http://dx.doi.org/10.1016/S0038-1098(85)80025-9
Ekimov, A. I., & Onushchenko, A. A. (1981). Quantum size effect in 3-dimensional
microscopic semiconductor crystals. JETP Lett., 34, 345-349.
Embden, v. J., & Mulvaney, P. (2005). Nucleation and growth of CdSe nanocrystals in a
binary ligand system. Langmuir, 21(22), 10226-10233.
Erogbogbo, F., Yong, K.-T., Roy, I., Hu, R., Law, W.-C., Zhao, W., . . . Prasad, P. N.
(2011). In Vivo Targeted Cancer Imaging, Sentinel Lymph Node Mapping and
Multi-Channel Imaging with Biocompatible Silicon Nanocrystals. ACS Nano,
5(1), 413-423. doi:10.1021/nn1018945
Erwin, S. C., Zu, L., Haftel, M. I., Efros, A. L., Kennedy, T. A., & Norris, D. J. (2005).
Doping semiconductor nanocrystals. Nature, 436(7047), 91-94.
doi:http://www.nature.com/nature/journal/v436/n7047/suppinfo/nature03832_S1
.html
Fan, Z., Li, Y., Li, X., Fan, L., Zhou, S., Fang, D., & Yang, S. (2014). Surrounding
media sensitive photoluminescence of boron-doped graphene quantum dots for
highly fluorescent dyed crystals, chemical sensing and bioimaging. Carbon, 70,
149-156.
Fujioka, K., Hiruoka, M., Sato, K., Manabe, N., Miyasaka, R., Hanada, S., . . .
Yamamoto, K. (2008). Luminescent passive-oxidized silicon quantum dots as
biological staining labels and their cytotoxicity effects at high concentration.
Nanotechnology, 19(41), 415102. doi:10.1088/0957-4484/19/41/415102
Gaarenstroom, S., & Winograd, N. (1977). Initial and final state effects in the ESCA
spectra of cadmium and silver oxides. The Journal of Chemical Physics, 67(8),
3500-3506.

xxvi
Gaponenko, S. V. (1998). Optical properties of semiconductor nanocrystals (Vol. 23):
Cambridge university press.
Gerion, D., Pinaud, F., Williams, S. C., Parak, W. J., Zanchet, D., Weiss, S., &
Alivisatos, A. P. (2001). Synthesis and properties of biocompatible water-
soluble silica-coated CdSe/ZnS semiconductor quantum dots. The Journal of
Physical Chemistry B, 105(37), 8861-8871.
Giribabu, G., Murali, G., Amaranatha Reddy, D., Liu, C., & Vijayalakshmi, R. P.
(2013). Structural, optical and magnetic properties of Co doped CdS
nanoparticles. Journal of Alloys and Compounds, 581, 363-368.
doi:http://dx.doi.org/10.1016/j.jallcom.2013.07.082
Girit, Ç. Ö., Meyer, J. C., Erni, R., Rossell, M. D., Kisielowski, C., Yang, L., . . . Zettl,
A. (2009). Graphene at the Edge: Stability and Dynamics. Science, 323(5922),
1705. Retrieved from
http://science.sciencemag.org/content/323/5922/1705.abstract
Gong, K., & Kelley, D. F. (2015). Lattice strain limit for uniform shell deposition in
zincblende CdSe/CdS quantum dots. The journal of physical chemistry letters,
6(9), 1559-1562.
Green, M., & O'Brien, P. (1999). The synthesis of cadmium phosphide nanoparticles
using cadmium diorganophosphide precursors. Journal of Materials Chemistry,
9(1), 243-247. doi:10.1039/A804965C
Gu, Y.-P., Cui, R., Zhang, Z.-L., Xie, Z.-X., & Pang, D.-W. (2011). Ultrasmall near-
infrared Ag2Se quantum dots with tunable fluorescence for in vivo imaging.
Journal of the American Chemical Society, 134(1), 79-82.
Guifu, Z., Hui, L., Yuanguang, Z., Kan, X., & Yitai, Q. (2006).
Solvothermal/hydrothermal route to semiconductor nanowires. Nanotechnology,
17(11), S313. Retrieved from http://stacks.iop.org/0957-4484/17/i=11/a=S14
Guzelian, A. A., Banin, U., Kadavanich, A. V., Peng, X., & Alivisatos, A. P. (1996).
Colloidal chemical synthesis and characterization of InAs nanocrystal quantum
dots. Applied Physics Letters, 69(10), 1432-1434 (a).
doi:doi:http://dx.doi.org/10.1063/1.117605
Guzelian, A. A., Katari, J. E. B., Kadavanich, A. V., Banin, U., Hamad, K., Juban, E., . .
. Heath, J. R. (1996). Synthesis of Size-Selected, Surface-Passivated InP
Nanocrystals. The Journal of Physical Chemistry, 100(17), 7212-7219 (b).
doi:10.1021/jp953719f
Hambrock, J., Becker, R., Birkner, A., Wei, & Fischer, R. A. (2002). A non-aqueous
organometallic route to highly monodispersed copper nanoparticles using
[Cu(OCH(Me)CH2NMe2)2]. Chemical Communications(1), 68-69.
doi:10.1039/B108797E

xxvii
Hamizi, N. A., & Johan, M. R. (2010). Synthesis and size dependent optical studies in
CdSe quantum dots via inverse micelle technique. Materials Chemistry and
Physics, 124(1), 395-398.
doi:http://dx.doi.org/10.1016/j.matchemphys.2010.06.053
Han, L., Qin, D., Jiang, X., Liu, Y., Wang, L., Chen, J., & Cao, Y. (2006). Synthesis of
high quality zinc-blende CdSe nanocrystals and their application in hybrid solar
cells. Nanotechnology, 17(18), 4736.
Hanif, K. M., Meulenberg, R. W., & Strouse, G. F. (2002). Magnetic ordering in doped
Cd1-xCoxSe diluted magnetic quantum dots. J. Am. Chem. Soc., 124, 11495-
11502. Retrieved from http://dx.doi.org/10.1021/ja0262840
Hao, X., Cho, E.-C., Scardera, G., Shen, Y., Bellet-Amalric, E., Bellet, D., . . . Green,
M. (2009). Phosphorus-doped silicon quantum dots for all-silicon quantum dot
tandem solar cells. Solar Energy Materials and Solar Cells, 93(9), 1524-1530.
Hikmet, R. A. M., Talapin, D. V., & Weller, H. (2003). Study of conduction mechanism
and electroluminescence in CdSe/ZnS quantum dot composites. Journal of
Applied Physics, 93(6), 3509-3514. doi:doi:http://dx.doi.org/10.1063/1.1542940
Hines, M. A., & Guyot-Sionnest, P. (1996). Synthesis and Characterization of Strongly
Luminescing ZnS-Capped CdSe Nanocrystals. The Journal of Physical
Chemistry, 100(2), 468-471. doi:10.1021/jp9530562
Hines, M. A., & Guyot-Sionnest, P. (1998). Bright UV-blue luminescent colloidal ZnSe
nanocrystals. The Journal of Physical Chemistry B, 102(19), 3655-3657.
Hoener, C. F., Allan, K. A., Bard, A. J., Campion, A., Fox, M. A., Mallouk, T. E., . . .
White, J. M. (1992). Demonstration of a shell-core structure in layered cadmium
selenide-zinc selenide small particles by x-ray photoelectron and Auger
spectroscopies. The Journal of Physical Chemistry, 96(9), 3812-3817.
Hoffman, D. M. (2000). Giant internal magnetic fields in Mn doped nanocrystal
quantum dots. Solid State Commun., 114, 547-550. Retrieved from
http://dx.doi.org/10.1016/S0038-1098(00)00089-2
Hong, G., Robinson, J. T., Zhang, Y., Diao, S., Antaris, A. L., Wang, Q., & Dai, H.
(2012). In Vivo Fluorescence Imaging with Ag2S Quantum Dots in the Second
Near‐Infrared Region. Angewandte Chemie, 124(39), 9956-9959.
Hou, J., Zhao, H., Huang, F., Jing, Q., Cao, H., Wu, Q., . . . Cao, G. (2016). High
performance of Mn-doped CdSe quantum dot sensitized solar cells based on the
vertical ZnO nanorod arrays. Journal of Power Sources, 325, 438-445.
doi:http://dx.doi.org/10.1016/j.jpowsour.2016.06.070
Huang, J., Jiang, Y., Duan, H., Liu, C., Mi, L., Lan, X., . . . Zhong, H. (2013). Large
Stokes Shift of Ag Doped CdSe Quantum Dots via Aqueous Route. Journal of
nanoscience and nanotechnology, 13(10), 6687-6693.

xxviii
Huang, Z., Pu, F., Lin, Y., Ren, J., & Qu, X. (2011). Modulating DNA-templated silver
nanoclusters for fluorescence turn-on detection of thiol compounds. Chemical
Communications, 47(12), 3487-3489.
Huynh, W. U., Dittmer, J. J., & Alivisatos, A. P. (2002). Hybrid nanorod-polymer solar
cells. science, 295(5564), 2425-2427.
Hwang, I. S., Kim, H. D., Kim, J. E., Park, H. Y., & Lim, H. (1994). Solid solubilities
of magnetic ions in diluted magnetic semiconductors grown under equilibrium
conditions. Phys. Rev. B, 50, 8849-8852. Retrieved from
http://dx.doi.org/10.1103/PhysRevB.50.8849
Ignatiev, I. V., Kozin, I. E., Ren, H.-W., Sugou, S., & Masumoto, Y. (1999). Anti-
Stokes photoluminescence of InP self-assembled quantum dots in the presence
of electric current. Physical review B, 60(20), R14001.
Inamdar, S. N., Ingole, P. P., & Haram, S. K. (2008). Determination of Band Structure
Parameters and the Quasi‐Particle Gap of CdSe Quantum Dots by Cyclic
Voltammetry. ChemPhysChem, 9(17), 2574-2579.
Ivanov-Ehmin, B., Nevskaya, N., Zajtsev, B., & Ivanova, T. (1982). Synthesis and
properties of calcium and strontium hydroxomanganates (3). Zhurnal
Neorganicheskoj Khimii, 27(12), 3101-3104.
Ivanov, S. A., Piryatinski, A., Nanda, J., Tretiak, S., Zavadil, K. R., Wallace, W. O., . . .
Klimov, V. I. (2007). Type-II Core/Shell CdS/ZnSe Nanocrystals: Synthesis,
Electronic Structures, and Spectroscopic Properties. Journal of the American
Chemical Society, 129(38), 11708-11719. doi:10.1021/ja068351m
Jamil, N. Y., & Shaw, D. (1995). The diffusion of Mn in CdTe. Semicond. Sci.
Technol., 10, 952-958. Retrieved from http://dx.doi.org/10.1088/0268-
1242/10/7/009
Jang, E., Jun, S., & Pu, L. (2003). High quality CdSeS nanocrystals synthesized by
facile single injection process and their electroluminescence. Chemical
Communications(24), 2964-2965. doi:10.1039/B310853H
Ji, T. H., Jian, W. B., & Fang, J. Y. (2003). The first synthesis of Pb1-xMnxSe
nanocrystals. J. Am. Chem. Soc., 125, 8448-8449. Retrieved from
http://dx.doi.org/10.1021/ja0351746
Jian, Z., & Hejing, W. (2003). The physical meanings of 5 basic parameters for an X-
ray diffraction peak and their application. Chinese Journal of Geochemistry,
22(1), 38-44.
Jiang, F., & Muscat, A. J. (2012). Ligand-controlled growth of ZnSe quantum dots in
water during Ostwald ripening. Langmuir, 28(36), 12931-12940.

xxix
Kammerer, C., Cassabois, G., Voisin, C., Delalande, C., Roussignol, P., & Gérard, J.
(2001). Photoluminescence up-conversion in single self-assembled InAs/GaAs
quantum dots. Physical review letters, 87(20), 207401.
Karen, P., & Woodward, P. M. (1998). Liquid-mix disorder in crystalline solids:
ScMnO 3. Journal of Solid State Chemistry, 141(1), 78-88.
Kasuya, A. (2004). Ultra-stable nanoparticles of CdSe revealed from mass
spectrometry. Nature Mater., 3, 99-102. Retrieved from
http://dx.doi.org/10.1038/nmat1056
Katari, J. B., Colvin, V. L., & Alivisatos, A. P. (1994). X-ray photoelectron
spectroscopy of CdSe nanocrystals with applications to studies of the
nanocrystal surface. The Journal of Physical Chemistry, 98(15), 4109-4117.
Katari, J. E. B., Colvin, V. L., & Alivisatos, A. P. (1994). X-ray Photoelectron
Spectroscopy of CdSe Nanocrystals with Applications to Studies of the
Nanocrystal Surface. The Journal of Physical Chemistry, 98(15), 4109-4117.
doi:10.1021/j100066a034
Kaxiras, E. (1990). Effect of surface reconstruction on stability and reactivity of Si
clusters. Phys. Rev. Lett., 64, 551-554. Retrieved from
http://dx.doi.org/10.1103/PhysRevLett.64.551
Kelley, A. M., Dai, Q., Jiang, Z.-j., Baker, J. A., & Kelley, D. F. (2013). Resonance
Raman spectra of wurtzite and zincblende CdSe nanocrystals. Chemical Physics,
422, 272-276.
Kher, S. S., & Wells, R. L. (1994). A Straightforward, New Method for the Synthesis of
Nanocrystalline GaAs and GaP. Chemistry of Materials, 6(11), 2056-2062.
doi:10.1021/cm00047a027
Klein, M., Hache, F., Ricard, D., & Flytzanis, C. (1990). Size dependence of electron-
phonon coupling in semiconductor nanospheres: the case of CdSe. Physical
Review B, 42(17), 11123.
Klimov, V. I. (2006). Mechanisms for photogeneration and recombination of
multiexcitons in semiconductor nanocrystals: implications for lasing and solar
energy conversion. The Journal of Physical Chemistry B, 110(34), 16827-16845.
Klimov, V. I., Mikhailovsky, A. A., Xu, S., Malko, A., Hollingsworth, J. A.,
Leatherdale, C. A., . . . Bawendi, M. G. (2000). Optical gain and stimulated
emission in nanocrystal quantum dots. Science, 290(5490), 314-317.
Knox, R. S. (1963). Theory of excitons (Vol. 5): Academic Press.

xxx
Koh, A. K., & Miller, D. J. (1986). The systematic variation of the EPR parameters of
manganese in II-VI semiconductors. Solid State Commun., 60, 217-222.
Retrieved from http://dx.doi.org/10.1016/0038-1098(86)90449-7
Kortan, A., Hull, R., Opila, R. L., Bawendi, M. G., Steigerwald, M. L., Carroll, P., &
Brus, L. E. (1990). Nucleation and growth of cadmium selendie on zinc sulfide
quantum crystallite seeds, and vice versa, in inverse micelle media. Journal of
the American Chemical Society, 112(4), 1327-1332.
Kotkata, M., Masoud, A., Mohamed, M., & Mahmoud, E. (2009). Structural
characterization of chemically synthesized CdSe nanoparticles. Physica E: Low-
dimensional Systems and Nanostructures, 41(4), 640-645.
Kresse, G., & Furthmuller, J. (1996). Efficient iterative schemes for ab initio total-
energy calculations using a plane-wave basis set. Phys. Rev. B, 54, 11169-
11186. Retrieved from http://dx.doi.org/10.1103/PhysRevB.54.11169
Kümmell, T., Bacher, G., Forchel, A., Lermann, G., Kiefer, W., Jobst, B., . . .
Landwehr, G. (1998). Size dependence of strain relaxation and lateral
quantization in deep etched Cd x Zn 1− x S e/Z n S e quantum wires. Physical
Review B, 57(24), 15439.
Kwak, W.-C., Kim, T. G., Chae, W.-S., & Sung, Y.-M. (2007). Tuning the energy
bandgap of CdSe nanocrystals via Mg doping. Nanotechnology, 18(20), 205702.
Kwak, W.-C., Sung, Y.-M., Kim, T. G., & Chae, W.-S. (2007). Synthesis of Mn-doped
zinc blende CdSe nanocrystals. Applied Physics Letters, 90(17), 173111.
doi:doi:http://dx.doi.org/10.1063/1.2731682
Lan, G.-Y., Huang, C.-C., & Chang, H.-T. (2010). Silver nanoclusters as fluorescent
probes for selective and sensitive detection of copper ions. Chemical
communications, 46(8), 1257-1259.
Langford, J. (1980). Accuracy of crystallite size and strain determined from the integral
breadth of powder diffraction lines NBS Spec. Publ. 567 (pp. 255-269): National
Bureau of Standards Washington, DC.
Langford, J. I., & Wilson, A. (1978). Scherrer after sixty years: a survey and some new
results in the determination of crystallite size. Journal of Applied
Crystallography, 11(2), 102-113.
Leatherdale, C. A., Kagan, C. R., Morgan, N. Y., Empedocles, S. A., Kastner, M. A., &
Bawendi, M. G. (2000). Photoconductivity in CdSe quantum dot solids. Physical
Review B, 62(2669).
Lee, H., Holloway, P. H., & Yang, H. (2006). Synthesis and characterization of
colloidal ternary ZnCdSe semiconductor nanorods. The Journal of chemical
physics, 125(16), 164711.

xxxi
Lee, Y.-b., Ho Lee, S., Lee, S., Lee, H., Kim, J., & Joo, J. (2013). Surface enhanced
Raman scattering effect of CdSe/ZnS quantum dots hybridized with Au
nanowire. Applied Physics Letters, 102(3), 033109.
doi:doi:http://dx.doi.org/10.1063/1.4788926
Lehmann, V., & Gösele, U. (1991). Porous silicon formation: A quantum wire effect.
Applied Physics Letters, 58(8), 856-858.
doi:doi:http://dx.doi.org/10.1063/1.104512
Leonard, D., Krishnamurthy, M., Reaves, C. M., Denbaars, S. P., & Petroff, P. M.
(1993). Direct formation of quantum‐sized dots from uniform coherent islands
of InGaAs on GaAs surfaces. Applied Physics Letters, 63(23), 3203-3205.
doi:doi:http://dx.doi.org/10.1063/1.110199
Levy, L., Hochepied, J., & Pileni, M. (1996). Control of the size and composition of
three dimensionally diluted magnetic semiconductor clusters. The Journal Of
Physical Chemistry, 100(47), 18322-18326.
Li, H., Kang, Z., Liu, Y., & Lee, S.-T. (2012). Carbon nanodots: synthesis, properties
and applications. Journal of Materials Chemistry, 22(46), 24230-24253.
doi:10.1039/C2JM34690G
Li, J., Zhong, X., Zhang, H., Le, X. C., & Zhu, J.-J. (2012). Binding-induced
fluorescence turn-on assay using aptamer-functionalized silver nanocluster DNA
probes. Analytical chemistry, 84(12), 5170-5174.
Li, L., Daou, T. J., Texier, I., Kim Chi, T. T., Liem, N. Q., & Reiss, P. (2009). Highly
luminescent CuInS2/ZnS core/shell nanocrystals: cadmium-free quantum dots
for in vivo imaging. Chemistry of Materials, 21(12), 2422-2429.
Li, L., Wu, G., Yang, G., Peng, J., Zhao, J., & Zhu, J.-J. (2013). Focusing on
luminescent graphene quantum dots: current status and future perspectives.
Nanoscale, 5(10), 4015-4039. doi:10.1039/C3NR33849E
Li, Y., Qian, F., Xiang, J., & Lieber, C. M. (2006). Nanowire electronic and
optoelectronic devices. Materials today, 9(10), 18-27.
Liang, W. (1970). Excitons. Physics Education, 5(4), 226.
Lim, S. F., Riehn, R., Ryu, W. S., Khanarian, N., Tung, C. K., Tank, D., & Austin, R.
H. (2006). In vivo and scanning electron microscopy imaging of up-converting
nanophosphors in Caenorhabditis elegans. Nano Lett, 6(2), 169-174.
doi:10.1021/nl0519175
Linhui, Y., Hong, R., Yi, Z., & Danzhen, L. (2013). A facile solvothermal method to
produce ZnS quantum dots-decorated graphene nanosheets with superior
photoactivity. Nanotechnology, 24(37), 375601. Retrieved from
http://stacks.iop.org/0957-4484/24/i=37/a=375601

xxxii
Liu, R., Wu, D., Feng, X., & Mullen, K. (2011). Bottom-up fabrication of
photoluminescent graphene quantum dots with uniform morphology. Journal of
the American Chemical Society, 133(39), 15221-15223.
Lobo, C., & Leon, R. (1998). InGaAs island shapes and adatom migration behavior on
(100), (110), (111), and (311) GaAs surfaces. Journal of Applied Physics, 83(8),
4168-4172. doi:doi:http://dx.doi.org/10.1063/1.367170
Maki, H., Sato, T., & Ishibashi, K. (2007). Direct observation of the deformation and
the band gap change from an individual single-walled carbon nanotube under
uniaxial strain. Nano letters, 7(4), 890-895.
Manna, L., Scher, E. C., & Alivisatos, A. P. (2000). Synthesis of Soluble and
Processable Rod-, Arrow-, Teardrop-, and Tetrapod-Shaped CdSe Nanocrystals.
Journal of the American Chemical Society, 122(51), 12700-12706.
doi:10.1021/ja003055+
Mehta, S., Kumar, S., Chaudhary, S., Bhasin, K., & Gradzielski, M. (2008). Evolution
of ZnS nanoparticles via facile CTAB aqueous micellar solution route: a study
on controlling parameters. Nanoscale research letters, 4(1), 17.
Mekis, I., Talapin, D. V., Kornowski, A., Haase, M., & Weller, H. (2003). One-Pot
Synthesis of Highly Luminescent CdSe/CdS Core−Shell Nanocrystals via
Organometallic and “Greener” Chemical Approaches. The Journal of Physical
Chemistry B, 107(30), 7454-7462. doi:10.1021/jp0278364
Meulenberg, R. W., Jennings, T., & Strouse, G. F. (2004). Compressive and tensile
stress in colloidal CdSe semiconductor quantum dots. Physical Review B,
70(23), 235311.
Meulenberg, R. W., van Buuren, T., Hanif, K. M., Willey, T. M., Strouse, G. F., &
Terminello, L. J. (2004). Structure and Composition of Cu-Doped CdSe
Nanocrystals Using Soft X-ray Absorption Spectroscopy. Nano Letters, 4(11),
2277-2285. doi:10.1021/nl048738s
Micic, O. I., Sprague, J. R., Curtis, C. J., Jones, K. M., Machol, J. L., Nozik, A. J., . . .
Peyghambarian, N. (1995). Synthesis and Characterization of InP, GaP, and
GaInP2 Quantum Dots. The Journal of Physical Chemistry, 99(19), 7754-7759.
doi:10.1021/j100019a063
Mikulec, F. V. (2000). Organometallic synthesis and spectroscopic characterization of
manganese-doped CdSe nanocrystals. J. Am. Chem. Soc., 122, 2532-2540.
Retrieved from http://dx.doi.org/10.1021/ja991249n
Ming, H., Ma, Z., Liu, Y., Pan, K., Yu, H., Wang, F., & Kang, Z. (2012). Large scale
electrochemical synthesis of high quality carbon nanodots and their
photocatalytic property. Dalton Trans, 41(31), 9526-9531.
doi:10.1039/c2dt30985h

xxxiii
Mooradian, A. (1969). Photoluminescence of metals. Physical Review Letters, 22(5),
185.
Muck, T., Wagner, J. W., Hansen, L., Wagner, V., & Geurts, J. (2004). Raman
identification of the in-plane axes of zincblende (100) surfaces: Basic principles
and application to II–VI/III–V heterostructures. Journal of Applied Physics,
95(10), 5403-5407. doi:doi:http://dx.doi.org/10.1063/1.1707209
Murray, C. B., Kagan, C., & Bawendi, M. (2000). Synthesis and characterization of
monodisperse nanocrystals and close-packed nanocrystal assemblies. Annual
Review of Materials Science, 30(1), 545-610.
Murray, C. B., Norris, D. J., & Bawendi, M. G. (1993). Synthesis and characterization
of nearly monodisperse CdE (E = sulfur, selenium, tellurium) semiconductor
nanocrystallites. Journal of the American Chemical Society, 115(19), 8706-
8715. doi:10.1021/ja00072a025
Murray, C. B., Sun, S., Gaschler, W., Doyle, H., Betley, T. A., & Kagan, C. R. (2001).
Colloidal synthesis of nanocrystals and nanocrystal superlattices. IBM Journal
of Research and Development, 45(1), 47-56. doi:10.1147/rd.451.0047
Nehru, L. C., & Sanjeeviraja, C. (2014). Rapid synthesis of nanocrystalline SnO2 by a
microwave-assisted combustion method. Journal of Advanced Ceramics, 3(3),
171-176. doi:10.1007/s40145-014-0101-5
Norris, D. J., & Bawendi, M. G. (1996). Measurement and assignment of the size-
dependent optical spectrum in CdSe quantum dots. Physical Review B, 53(24),
16338-16346. Retrieved from
http://link.aps.org/doi/10.1103/PhysRevB.53.16338
Norris, D. J., Efros, A. L., & Erwin, S. C. (2008). Doped nanocrystals. Science,
319(5871), 1776-1779.
Norris, D. J., Yao, N., Charnock, F. T., & Kennedy, T. A. (2001). High-Quality
Manganese-Doped ZnSe Nanocrystals. Nano Letters, 1(1), 3-7.
doi:10.1021/nl005503h
Ogawa, S., Hu, K., Fan, F.-R. F., & Bard, A. J. (1997). Photoelectrochemistry of films
of quantum size lead sulfide particles incorporated in self-assembled monolayers
on gold. The Journal of Physical Chemistry B, 101(29), 5707-5711.
Olshavsky, M. A., Goldstein, A. N., & Alivisatos, A. P. (1990). Organometallic
synthesis of gallium-arsenide crystallites, exhibiting quantum confinement.
Journal of the American Chemical Society, 112(25), 9438-9439.
doi:10.1021/ja00181a080
Oluwafemi, O. S., Revaprasadu, N., & Adeyemi, O. O. (2010). A new synthesis of
hexadecylamine-capped Mn-doped wurtzite CdSe nanoparticles. Materials
Letters, 64(13), 1513-1516.

xxxiv
Orlinskii, S. B., Schmidt, J., Baranov, P. G., Hofmann, D. M., de Mello Donegá, C., &
Meijerink, A. (2004). Probing the wave function of shallow Li and Na donors in
ZnO nanoparticles. Physical review letters, 92(4), 047603.
Pan, D., Zhang, J., Li, Z., & Wu, M. (2010). Hydrothermal route for cutting graphene
sheets into blue-luminescent graphene quantum dots. Adv Mater, 22(6), 734-
738. doi:10.1002/adma.200902825
Paskov, P., Holtz, P.-O., Monemar, B., Garcia, J., Schoenfeld, W., & Petroff, P. M.
(2000). Photoluminescence up-conversion in InAs/GaAs self-assembled
quantum dots. Applied Physics Letters, 77(6), 812-814.
Patel, N. H., Deshpande, M., Bhatt, S. V., Patel, K. R., & Chaki, S. (2014). Structural
and magnetic properties of undoped and Mn doped CdS nanoparticles prepared
by chemical co-precipitation method. Advanced Materials Letters, 5, 671-677.
Pejova, B., & Abay, B. (2011). Nanostructured CdSe films in low size-quantization
regime: Temperature dependence of the band gap energy and sub-band gap
absorption tails. The Journal of Physical Chemistry C, 115(47), 23241-23255.
Peng, X. (2002). Green Chemical Approaches toward High‐Quality Semiconductor
Nanocrystals. Chemistry–A European Journal, 8(2), 334-339.
Peng, X. (2010). Band gap and composition engineering on a nanocrystal (BCEN) in
solution. Accounts of chemical research, 43(11), 1387-1395.
Peng, X., Manna, L., Yang, W., Wickham, J., Scher, E., Kadavanich, A., & Alivisatos,
A. P. (2000). Shape control of CdSe nanocrystals. Nature, 404(6773), 59-61.
Retrieved from http://dx.doi.org/10.1038/35003535
Peng, X., Schlamp, M. C., Kadavanich, A. V., & Alivisatos, A. P. (1997). Epitaxial
Growth of Highly Luminescent CdSe/CdS Core/Shell Nanocrystals with
Photostability and Electronic Accessibility. Journal of the American Chemical
Society, 119(30), 7019-7029. doi:10.1021/ja970754m
Peng, X., Wickham, J., & Alivisatos, A. P. (1998). Kinetics of II-VI and III-V Colloidal
Semiconductor Nanocrystal Growth: “Focusing” of Size Distributions. Journal
of the American Chemical Society, 120(21), 5343-5344. doi:10.1021/ja9805425
Peng, X. G. (2000). Shape control of CdSe nanocrystals. Nature, 404, 59-61. Retrieved
from http://dx.doi.org/10.1038/35003535
Peng, Z. A., & Peng, X. (2001). Formation of High-Quality CdTe, CdSe, and CdS
Nanocrystals Using CdO as Precursor. Journal of the American Chemical
Society, 123(1), 183-184. doi:10.1021/ja003633m

xxxv
Perdew, J. P., Burke, K., & Ernzerhof, M. (1996). Generalized gradient approximation
made simple. Phys. Rev. Lett., 77, 3865-3868. Retrieved from
http://dx.doi.org/10.1103/PhysRevLett.77.3865
Persson, J., Håkanson, U., Johansson, M.-J., Samuelson, L., & Pistol, M.-E. (2005).
Strain effects on individual quantum dots: Dependence of cap layer thickness.
Physical Review B, 72(8), 085302.
Phadnis, C., Sonawane, K. G., Hazarika, A., & Mahamuni, S. (2015). Strain-Induced
Hierarchy of Energy Levels in CdS/ZnS Nanocrystals. The Journal of Physical
Chemistry C, 119(42), 24165-24173.
Plotnichenko, V., & Mityagin, Y. (1977). Investigation of Fundamental Vibrations in
CdSe by Raman Scattering and Infrared Methods. Sov. Phys. Solid State, 19(9),
1584-1586.
Pokrant, S., & Whaley, K. B. (1999). Tight-binding studies of surface effects on
electronic structure of CdSe nanocrystals: the role of organic ligands, surface
reconstruction, and inorganic capping shells. Eur. Phys. J. D, 6(2), 255-267.
Retrieved from http://dx.doi.org/10.1007/s100530050307
Poles, E., Selmarten, D. C., Mićić, O. I., & Nozik, A. J. (1999). Anti-Stokes
photoluminescence in colloidal semiconductor quantum dots. Applied physics
letters, 75(7), 971-973.
Ponomarenko, L. A., Schedin, F., Katsnelson, M. I., Yang, R., Hill, E. W., Novoselov,
K. S., & Geim, A. K. (2008). Chaotic Dirac Billiard in Graphene Quantum Dots.
Science, 320(5874), 356. Retrieved from
http://science.sciencemag.org/content/320/5874/356.abstract
Qian, H., Li, L., & Ren, J. (2005). One-step and rapid synthesis of high quality alloyed
quantum dots (CdSe–CdS) in aqueous phase by microwave irradiation with
controllable temperature. Materials Research Bulletin, 40(10), 1726-1736.
doi:http://dx.doi.org/10.1016/j.materresbull.2005.05.022
Qu, L., & Peng, X. (2002). Control of photoluminescence properties of CdSe
nanocrystals in growth. Journal of the American Chemical Society, 124(9),
2049-2055.
Qu, L., Peng, Z. A., & Peng, X. (2001). Alternative Routes toward High Quality CdSe
Nanocrystals. Nano Letters, 1(6), 333-337. doi:10.1021/nl0155532
Radovanovic, P. V., & Gamelin, D. R. (2001). Electronic absorption spectroscopy of
cobalt ions in diluted magnetic semiconductor quantum dots: demonstration of
an isocrystalline core/shell synthetic method. Journal of the American Chemical
Society, 123(49), 12207-12214.
Rajabi, H. R., Khani, O., Shamsipur, M., & Vatanpour, V. (2013). High-performance
pure and Fe 3+-ion doped ZnS quantum dots as green nanophotocatalysts for the

xxxvi
removal of malachite green under UV-light irradiation. Journal of hazardous
materials, 250, 370-378.
Reed, M. A. (1993). Quantum dots. Scientific American, 268(1), 118-123.
Reed, M. A., Randall, J. N., Aggarwal, R. J., Matyi, R. J., Moore, T. M., & Wetsel, A.
E. (1988). Observation of discrete electronic states in a zero-dimensional
semiconductor nanostructure. Physical Review Letters, 60(6), 535-537.
Retrieved from http://link.aps.org/doi/10.1103/PhysRevLett.60.535
Reiss, P., Bleuse, J., & Pron, A. (2002). Highly Luminescent CdSe/ZnSe Core/Shell
Nanocrystals of Low Size Dispersion. Nano Letters, 2(7), 781-784.
doi:10.1021/nl025596y
Reiss, P., Quemard, G., Carayon, S., Bleuse, J., Chandezon, F., & Pron, A. (2004).
Luminescent ZnSe nanocrystals of high color purity. Materials Chemistry and
Physics, 84(1), 10-13.
Ren, S.-F., Xia, J.-B., Han, H.-X., & Wang, Z.-P. (1994). Electronic structure and
optical properties of [(ZnSe) m (CdSe) n] N-ZnSe multiple quantum wells.
Physical Review B, 50(19), 14416.
Rogach, A. L., Katsikas, L., Kornowski, A., Su, D., Eychmüller, A., & Weller, H.
(1996). Synthesis and characterization of thiol-stabilized CdTe nanocrystals.
Berichte der Bunsengesellschaft für physikalische Chemie, 100(11), 1772-1778.
doi:10.1002/bbpc.19961001104
Sapsford, K. E., Berti, L., & Medintz, I. L. (2006). Materials for fluorescence resonance
energy transfer analysis: beyond traditional donor-acceptor combinations.
Angew Chem Int Ed Engl, 45(28), 4562-4589. doi:10.1002/anie.200503873
Sashchiuk, A., Lifshitz, E., Reisfeld, R., Saraidarov, T., Zelner, M., & Willenz, A.
(2002). Optical and conductivity properties of PbS nanocrystals in amorphous
zirconia sol-gel films. Journal of sol-gel science and technology, 24(1), 31-38.
Scherer, A., Craighead, H. G., & Beebe, E. D. (1987). Gallium arsenide and aluminum
gallium arsenide reactive ion etching in boron trichloride/argon mixtures.
Journal of Vacuum Science & Technology B, 5(6), 1599-1605.
doi:doi:http://dx.doi.org/10.1116/1.583635
Scherrer, P. (1918). The Scherrer Formula for X-Ray Particle Size Determination.
Göttinger Nachrichten, 2, 98-100.
Schumacher, W., Nagy, A., Waldman, W. J., & Dutta, P. K. (2009). Direct Synthesis of
Aqueous CdSe/ZnS-Based Quantum Dots Using Microwave Irradiation. The
Journal of Physical Chemistry C, 113(28), 12132-12139. doi:10.1021/jp901003r

xxxvii
Sethi, R., Kumar, L., Sharma, P. K., & Pandey, A. (2009). Tunable visible emission of
Ag-doped CdZnS alloy quantum dots. Nanoscale research letters, 5(1), 96.
Sharma, J., Yeh, H.-C., Yoo, H., Werner, J. H., & Martinez, J. S. (2011). Silver
nanocluster aptamers: in situ generation of intrinsically fluorescent recognition
ligands for protein detection. Chemical Communications, 47(8), 2294-2296.
Sharma, S. N., Pillai, Z. S., & Kamat, P. V. (2003). Photoinduced charge transfer
between CdSe quantum dots and p-phenylenediamine. The Journal of Physical
Chemistry B, 107(37), 10088-10093.
Shen, J., Zhu, Y., Yang, X., & Li, C. (2012). Graphene quantum dots: emergent
nanolights for bioimaging, sensors, catalysis and photovoltaic devices. Chemical
Communications, 48(31), 3686-3699. doi:10.1039/C2CC00110A
Shen, J., Zhu, Y., Yang, X., Zong, J., Zhang, J., & Li, C. (2012). One-pot hydrothermal
synthesis of graphene quantum dots surface-passivated by polyethylene glycol
and their photoelectric conversion under near-infrared light. New Journal of
Chemistry, 36(1), 97-101. doi:10.1039/C1NJ20658C
Shen, T., Tian, J., Lv, L., Fei, C., Wang, Y., Pullerits, T., & Cao, G. (2016).
Investigation of the role of Mn dopant in CdS quantum dot sensitized solar cell.
Electrochimica Acta, 191, 62-69.
doi:http://dx.doi.org/10.1016/j.electacta.2016.01.056
Shiang, J. J., Kadavanich, A. V., Grubbs, R. K., & Alivisatos, A. P. (1995). Symmetry
of annealed wurtzite CdSe nanocrystals [mdash] assignment to the C3v point
group. J. Phys. Chem., 99, 17417-17422. Retrieved from
http://dx.doi.org/10.1021/j100048a017
Shim, M., & Guyot-Sionnest, P. (2000). n-type colloidal semiconductor nanocrystals.
Nature, 407, 981-983. Retrieved from http://dx.doi.org/10.1038/35039577
Shinae, J., Eunjoo, J., & Youngsu, C. (2006). Alkyl thiols as a sulfur precursor for the
preparation of monodisperse metal sulfide nanostructures. Nanotechnology,
17(19), 4806. Retrieved from http://stacks.iop.org/0957-4484/17/i=19/a=004
Smith, A. M., Mohs, A. M., & Nie, S. (2009). Tuning the optical and electronic
properties of colloidal nanocrystals by lattice strain. Nature nanotechnology,
4(1), 56-63.
Smith, A. M., & Nie, S. (2009). Semiconductor nanocrystals: structure, properties, and
band gap engineering. Accounts of chemical research, 43(2), 190-200.
Smith, A. M., & Nie, S. (2010). Semiconductor Nanocrystals: Structure, Properties, and
Band Gap Engineering. Accounts of Chemical Research, 43(2), 190-200.
doi:10.1021/ar9001069

xxxviii
Spanhel, L., & Anderson, M. A. (1991). Semiconductor clusters in the sol-gel process:
quantized aggregation, gelation, and crystal growth in concentrated zinc oxide
colloids. Journal of the American Chemical Society, 113(8), 2826-2833.
Spanhel, L., Haase, M., Weller, H., & Henglein, A. (1987). Photochemistry of colloidal
semiconductors. 20. Surface modification and stability of strong luminescing
CdS particles. Journal of the American Chemical Society, 109(19), 5649-5655.
Steiner, D., Dorfs, D., Banin, U., Della Sala, F., Manna, L., & Millo, O. (2008).
Determination of band offsets in heterostructured colloidal nanorods using
scanning tunneling spectroscopy. Nano letters, 8(9), 2954-2958.
Stouwdam, J. W., & Janssen, R. A. (2009). Electroluminescent Cu‐doped CdS Quantum
Dots. Advanced Materials, 21(28), 2916-2920.
Stowell, C. A., Wiacek, R. J., Saunders, A. E., & Korgel, B. A. (2003). Synthesis and
characterization of dilute magnetic semiconductor manganese-doped indium
arsenide nanocrystals. Nano Letters, 3(10), 1441-1447.
Su, Y.-T., Lan, G.-Y., Chen, W.-Y., & Chang, H.-T. (2010). Detection of copper ions
through recovery of the fluorescence of DNA-templated copper/silver
nanoclusters in the presence of mercaptopropionic acid. Analytical chemistry,
82(20), 8566-8572.
Sung, Y.-M., Kwak, W.-C., & Kim, T. G. (2008). Coarsening Kinetics of Mn-Doped
CdSe Nanocrystals. Crystal Growth & Design, 8(4), 1186-1190.
doi:10.1021/cg0705005
Sung, Y. M., Lee, Y. J., & Park, K. S. (2006). Kinetic analysis for formation of Cd1-
xZnxSe solid-solution nanocrystals. J. Am. Chem. Soc., 128(28), 9002-9003.
Suri, P., & Mehra, R. M. (2007). Effect of electrolytes on the photovoltaic performance
of a hybrid dye sensitized ZnO solar cell. Solar Energy Materials and Solar
Cells, 91(6), 518-524. doi:http://dx.doi.org/10.1016/j.solmat.2006.10.025
Suyver, J. F., Wuister, S. F., Kelly, J. J., & Meijerink, A. (2000). Luminescence of
nanocrystalline ZnSe:Mn2+. Phys. Chem. Chem. Phys., 2, 5445-5448.
Retrieved from http://dx.doi.org/10.1039/b006950g
Swihart, M. T. (2003). Vapor-phase synthesis of nanoparticles. Current Opinion in
Colloid & Interface Science, 8(1), 127-133.
doi:http://dx.doi.org/10.1016/S1359-0294(03)00007-4
Takagahara, T., & Takeda, K. (1992). Theory of the quantum confinement effect on
excitons in quantum dots of indirect-gap materials. Physical Review B, 46(23),
15578.

xxxix
Talapin, D. V., Mekis, I., Götzinger, S., Kornowski, A., Benson, O., & Weller, H.
(2004). CdSe/CdS/ZnS and CdSe/ZnSe/ZnS core-shell-shell nanocrystals. The
Journal of Physical Chemistry B, 108(49), 18826-18831.
Talapin, D. V., Rogach, A. L., Kornowski, A., Haase, M., & Weller, H. (2001). Highly
Luminescent Monodisperse CdSe and CdSe/ZnS Nanocrystals Synthesized in a
Hexadecylamine−Trioctylphosphine Oxide−Trioctylphospine Mixture. Nano
Letters, 1(4), 207-211. doi:10.1021/nl0155126
Tamang, S., Beaune, G., Texier, I., & Reiss, P. (2011). Aqueous phase transfer of
InP/ZnS nanocrystals conserving fluorescence and high colloidal stability. ACS
nano, 5(12), 9392-9402.
Tang, L., Ji, R., Cao, X., Lin, J., Jiang, H., Li, X., . . . Lau, S. P. (2012). Deep ultraviolet
photoluminescence of water-soluble self-passivated graphene quantum dots.
ACS Nano, 6(6), 5102-5110. doi:10.1021/nn300760g
Thanh, N. T., Maclean, N., & Mahiddine, S. (2014). Mechanisms of nucleation and
growth of nanoparticles in solution. Chemical Reviews, 114(15), 7610-7630.
Thanikaikarasan, S., Shajan, X. S., Dhanasekaran, V., & Mahalingam, T. (2011). X-ray
line broadening and photoelectrochemical studies on CdSe thin films. Journal of
materials science, 46(11), 4034-4045.
Trallero-Giner, C., Debernardi, A., Cardona, M., Menendez-Proupin, E., & Ekimov, A.
(1998). Optical vibrons in CdSe dots and dispersion relation of the bulk
material. Physical Review B, 57(8), 4664.
Trindade, T., Neves, M., & Barros, A. (2000). Preparation and optical properties of
CdSe/polymer nanocomposites. Scripta materialia, 43(6), 567-571.
Tsutsui, K., Hu, E. L., & Wilkinson, C. D. (1993). Reactive ion etched II-VI quantum
dots: dependence of etched profile on pattern geometry. Japanese journal of
applied physics, 32(12S), 6233.
Wang, C., Jiang, Y., Chen, L., Li, S., Li, G., & Zhang, Z. (2009). Temperature
dependence of optical properties and size tunability CdSe quantum dots via non-
TOP synthesis. Materials Chemistry and Physics, 116(2), 388-391.
Wang, J., Zhang, G., Li, Q., Jiang, H., Liu, C., Amatore, C., & Wang, X. (2013). In vivo
self-bio-imaging of tumors through in situ biosynthesized fluorescent gold
nanoclusters. Scientific reports, 3, 1157.
Wang, X., Cao, L., Lu, F., Meziani, M. J., Li, H., Qi, G., . . . Sun, Y.-P. (2009).
Photoinduced electron transfers with carbon dots. Chemical
Communications(25), 3774-3776. doi:10.1039/B906252A

xl
Wang, Y., & Herron, N. (1991). Nanometer-sized semiconductor clusters: materials
synthesis, quantum size effects, and photophysical properties. The Journal of
Physical Chemistry, 95(2), 525-532.
Wang, Y., Herron, N., Moller, K., & Bein, T. (1991). 3-dimensionally confined diluted
magnetic semiconductor clusters: Zn1-xMnxS. Solid State Commun., 77, 33-38.
Retrieved from http://dx.doi.org/10.1016/0038-1098(91)90421-Q
Warren, B., & Averbach, B. (1950). The effect of cold‐work distortion on X‐ray
patterns. Journal of Applied Physics, 21(6), 595-599.
Wei, S.-H., & Zunger, A. (1999). Predicted band-gap pressure coefficients of all
diamond and zinc-blende semiconductors: Chemical trends. Physical Review B,
60(8), 5404.
Williamson, G., & Hall, W. (1953). X-ray line broadening from filed aluminium and
wolfram. Acta metallurgica, 1(1), 22-31.
Wortis, M. (1988). Chemistry and Physics of Solid Surfaces VII.
Xie, Y., Qian, Y., Wang, W., Zhang, S., & Zhang, Y. (1996). A Benzene-Thermal
Synthetic Route to Nanocrystalline GaN. Science, 272(5270), 1926-1927.
doi:10.1126/science.272.5270.1926
Xu, X., Ray, R., Gu, Y., Ploehn, H. J., Gearheart, L., Raker, K., & Scrivens, W. A.
(2004). Electrophoretic Analysis and Purification of Fluorescent Single-Walled
Carbon Nanotube Fragments. Journal of the American Chemical Society,
126(40), 12736-12737. doi:10.1021/ja040082h
Yamamoto, A., Sasao, T., Goto, T., Arai, K., Lee, H. Y., Makino, H., & Yao, T. (2003).
Anti‐Stokes photoluminescence in CdSe self‐assembled quantum dots. physica
status solidi (c)(4), 1246-1249.
Yan, X., Cui, X., Li, B., & Li, L.-s. (2010). Large, Solution-Processable Graphene
Quantum Dots as Light Absorbers for Photovoltaics. Nano Letters, 10(5), 1869-
1873. doi:10.1021/nl101060h
Yang, C., Zhong, Z., & Lieber, C. M. (2005). Encoding electronic properties by
synthesis of axial modulation-doped silicon nanowires. Science, 310(5752),
1304-1307.
Yang, D., Chen, Q., & Xu, S. (2007). Synthesis of CdSe/CdS with a simple non-TOP-
based route. Journal of luminescence, 126(2), 853-858.
Yang, H., & Holloway, P. H. (2003). Enhanced photoluminescence from CdS: Mn/ZnS
core/shell quantum dots. Applied Physics Letters, 82, 1965.

xli
Yang, H., & Holloway, P. H. (2004). Efficient and photostable ZnS‐passivated CdS: Mn
luminescent nanocrystals. Advanced Functional Materials, 14(2), 152-156.
Yang, H., Holloway, P. H., Cunningham, G., & Schanze, K. S. (2004). CdS: Mn
nanocrystals passivated by ZnS: Synthesis and luminescent properties. The
Journal of chemical physics, 121(20), 10233-10240.
Yang, H., Santra, S., & Holloway, P. H. (2005). Syntheses and applications of Mn-
doped II-VI semiconductor nanocrystals. Journal of nanoscience and
nanotechnology, 5(9), 1364-1375.
Yang, H., Yin, W., Zhao, H., Yang, R., & Song, Y. (2008). A complexant-assisted
hydrothermal procedure for growing well-dispersed InP nanocrystals. Journal of
Physics and Chemistry of Solids, 69(4), 1017-1022.
doi:http://dx.doi.org/10.1016/j.jpcs.2007.11.017
Yeh, H.-C., Sharma, J., Han, J. J., Martinez, J. S., & Werner, J. H. (2010). A DNA−
Silver nanocluster probe that fluoresces upon hybridization. Nano letters, 10(8),
3106-3110.
Yeh, H.-C., Sharma, J., Shih, I.-M., Vu, D. M., Martinez, J. S., & Werner, J. H. (2012).
A fluorescence light-up Ag nanocluster probe that discriminates single-
nucleotide variants by emission color. Journal of the American Chemical
Society, 134(28), 11550-11558.
Yong-Ji, L., Tae-Geun, K., & Yun-Mo, S. (2006). Lattice distortion and luminescence
of CdSe/ZnSe nanocrystals. Nanotechnology, 17(14), 3539. Retrieved from
http://stacks.iop.org/0957-4484/17/i=14/a=030
Yong, K.-T., Ding, H., Roy, I., Law, W.-C., Bergey, E. J., Maitra, A., & Prasad, P. N.
(2009). Imaging pancreatic cancer using bioconjugated InP quantum dots. Acs
Nano, 3(3), 502-510.
Yordanov, C., & Minkova, L. (2005). Fractionated crystallization of compatibilized
LDPE/PA6 blends. European polymer journal, 41(3), 527-534.
Yu-Hong, Z., Jian-Hua, Z., Jing-Feng, B., Wei-Zhu, W., Yang, J., Xiao-Guang, W., &
Jian-Bai, X. (2007). Cr-doped InAs self-organized diluted magnetic quantum
dots with room-temperature ferromagnetism. Chinese Physics Letters, 24(7),
2118.
Yu, J., Choi, S., & Dickson, R. M. (2009). Shuttle‐Based Fluorogenic Silver‐Cluster
Biolabels. Angewandte Chemie, 121(2), 324-326.
Yu, J. H., Liu, X., Kweon, K. E., Joo, J., Park, J., Ko, K.-T., . . . Son, J. S. (2010). Giant
Zeeman splitting in nucleation-controlled doped CdSe: Mn2+ quantum
nanoribbons. Nature materials, 9(1), 47-53.

xlii
Yu, W. W., & Peng, X. (2002). Formation of high-quality CdS and other II-VI
semiconductor nanocrystals in noncoordinating solvents: tunable reactivity of
monomers. Angew Chem Int Ed Engl, 41(13), 2368-2371. doi:10.1002/1521-
3773(20020703)41:13<2368::aid-anie2368>3.0.co;2-g
Yu, W. W., Wang, Y. A., & Peng, X. (2003). Formation and stability of size-, shape-,
and structure-controlled CdTe nanocrystals: ligand effects on monomers and
nanocrystals. Chemistry of Materials, 15(22), 4300-4308.
Yupapin, D. P., Pivsa-Art, D. S., Ohgaki, D. H., Wongpisutpaisan, N., Charoonsuk, P.,
Vittayakorn, N., & Pecharapa, W. (2011). 9th Eco-Energy and Materials Science
and Engineering SymposiumSonochemical Synthesis and Characterization of
Copper Oxide Nanoparticles. Energy Procedia, 9, 404-409.
doi:http://dx.doi.org/10.1016/j.egypro.2011.09.044
Zhang, H., Huang, H., Ming, H., Li, H., Zhang, L., Liu, Y., & Kang, Z. (2012). Carbon
quantum dots/Ag3PO4 complex photocatalysts with enhanced photocatalytic
activity and stability under visible light. Journal of Materials Chemistry, 22(21),
10501-10506. doi:10.1039/C2JM30703K
Zherebetskyy, D., Scheele, M., Zhang, Y., Bronstein, N., Thompson, C., Britt, D., . . .
Wang, L. W. (2014). Hydroxylation of the surface of PbS nanocrystals
passivated with oleic acid. Science, 344(6190), 1380-1384.
doi:10.1126/science.1252727
Zhong, X., Han, M., Dong, Z., White, T. J., & Knoll, W. (2003). Composition-Tunable
Zn x Cd1-x Se Nanocrystals with High Luminescence and Stability. Journal of
the American Chemical Society, 125(28), 8589-8594.
Zhou, J., Booker, C., Li, R., Sun, X., Sham, T.-K., & Ding, Z. (2010 (a)).
Electrochemistry and electrochemiluminescence study of blue luminescent
carbon nanocrystals. Chemical Physics Letters, 493(4–6), 296-298.
doi:http://dx.doi.org/10.1016/j.cplett.2010.05.030
Zhou, X., Zhang, Y., Wang, C., Wu, X., Yang, Y., Zheng, B., . . . Zhang, J. (2012 (b)).
Photo-Fenton reaction of graphene oxide: a new strategy to prepare graphene
quantum dots for DNA cleavage. ACS Nano, 6(8), 6592-6599.
doi:10.1021/nn301629v
Zhu, H., Wang, X., Li, Y., Wang, Z., Yang, F., & Yang, X. (2009). Microwave
synthesis of fluorescent carbon nanoparticles with electrochemiluminescence
properties. Chem Commun (Camb)(34), 5118-5120. doi:10.1039/b907612c
Zhu, J., Koltypin, Y., & Gedanken, A. (2000). General Sonochemical Method for the
Preparation of Nanophasic Selenides: Synthesis of ZnSe Nanoparticles.
Chemistry of Materials, 12(1), 73-78. doi:10.1021/cm990380r

xliii
LIST OF PUBLICATIONS
1. Hamizi, N. A., Aplop, F., Haw, H. Y., Sabri, A. N., Wern, A. Y. Y., & Johan,
M. R. (2016). Tunable optical properties of Mn-doped CdSe quantum dots
synthesized via inverse micelle technique. Optical Materials Express, 6(9),
2915-2924.
2. Hamizi, N. A., & Johan, M. R. (2012a). Enhanced ripening behaviour of
cadmium selenide quantum dots (CdSe QDs). Int. J. Electrochem. Sci, 7, 8473-
8480.
3. Hamizi, N. A., & Johan, M. R. (2012b). Optical properties of CdSe quantum
dots via non-TOP based route. International Journal of Electrochemical
Science, 7, 8458-8467.
4. Hamizi, N. A., Ying, C. n. S., & Johan, M. R. (2012). Synthesis with Different
Se Concentrations and Optical Studies of CdSe Quantum Dots via Inverse
Micelle Technique. International Journal Of Electrochemical Science, 7(5),
4727-4734.
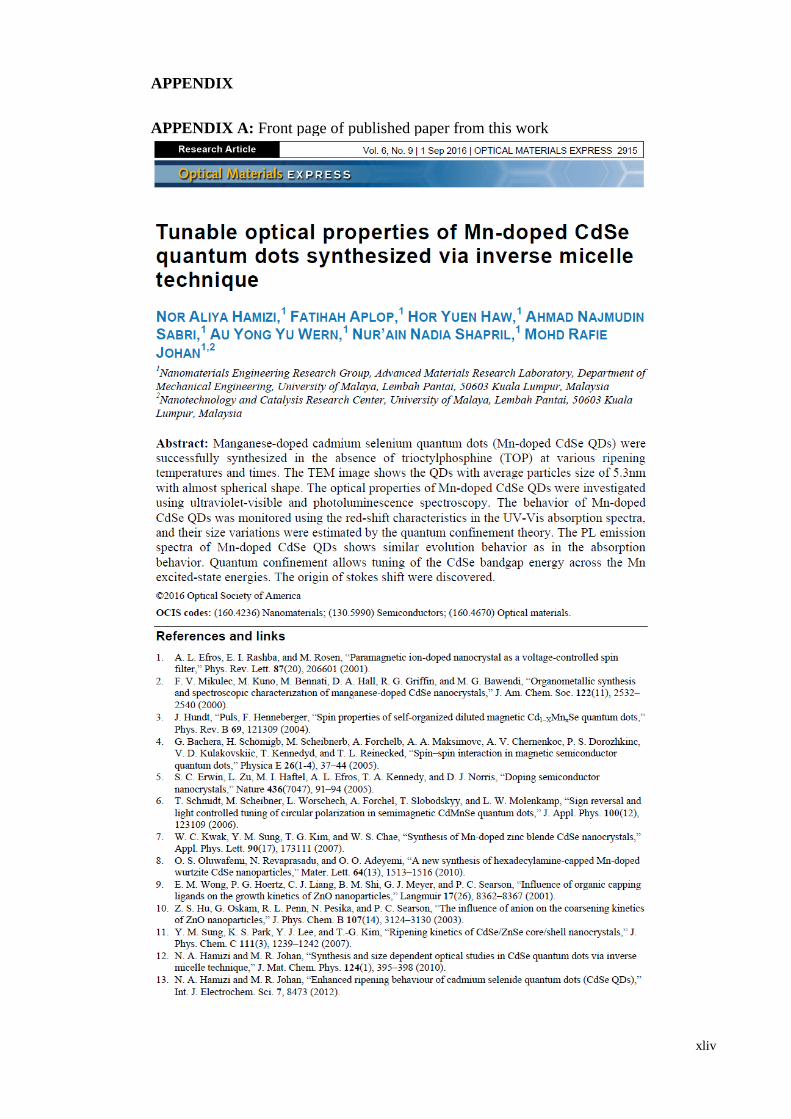
xliv
APPENDIX
APPENDIX A: Front page of published paper from this work

xlv

xlvi

xlvii