Flax Fiber as Reinforcement in Recycled Tire Rubber and Thermoplastics Composite

Vol. 11(2), pp. 10-23, July-December 2020
DOI: 10.5897/JCEMS2019.0340
Articles Number: 9F6F33064245
ISSN 2141-6605
Copyright © 2020
Author(s) retain the copyright of this article
http://www.academicjournals.org/JCEMS
Journal of Chemical Engineering and Materials
Science
Full Length Research Paper
Synthesis and characterization of hemp and flax fiber reinforced geopolymer composites
Elvis Sikapizye* and Adrian Habanyama
Department of Physics, Faculty of Mathematics and Natural Sciences, Copperbelt University, P. O. Box 21692, Jambo Drive, Riverside, Kitwe 10101, Zambia.
Received 12 September, 2019; Accepted 20 January, 2020
Reinforced Ordinary Portland Cement (OPC) has for a long time been a viable binder until the realization of its huge contribution to the excess carbon dioxide emitted in the atmosphere during its fabrication. The aim of this research work is to synthesize and characterize Collie fly ash based geopolymer composites reinforced with flax and hemp fibers. It was shown in this work that fiber reinforced geopolymer composites are possible supplements or substitutes to OPC because of the composites’ high flexural strength, low emissions of carbon dioxide during synthesis and low cost of fabrication. Energy Dispersive Spectroscopy (EDS) was used to determine the elemental composition. Samples were analyzed for fractural strength in vertical and horizontal orientations of the fabrics, with respect to an applied test load. Scanning Electron Microscopy (SEM) was used to study the microstructure. The highest flexural strength achieved in this study was 7.9 ± 0.2 MPa, which was for hemp reinforcement in an orientation where the load was perpendicular to the plain of the reinforcement fabrics (horizontal orientation). This flexural strength is higher than the value of 6.4 MPa reported for OPC by Li et al. Key words: Geopolymer composites, cementitious material, flexural strength.
INTRODUCTION The construction industry requires ecofriendly and ’greener’ materials than Reinforced Ordinary Portland Cement (OPC) because of the huge contribution to the excess carbon dioxide emitted in the atmosphere during its fabrication process. The emitted carbon dioxide is significant in the depletion of the ozone layer and hence has a direct contribution to global warming (Dove, 1996; Wattanasiriwech et al., 2018). This has resulted in the need for supplementary binders that emit less carbon dioxide into the atmosphere. It is for this reason that the fabrication of cementitious geopolymer composites has
attracted attention from researchers (Wattanasiriwech et al., 2018).A composite material is a combination of a matrix material and a different reinforcement material where the matrix acts as a binder for the reinforcement. One such binder material is a geopolymer matrix and the reinforcement could be a fiber material. Good interfacial adhesion is required for the development of strong composite materials.
Geopolymers are inorganic aluminosilicate polymers. Chemically, they consist of amorphous networks of tetrahedral SiO4 and AlO4 units connected with alkali
*Corresponding author. E-mail: [email protected], [email protected]. Tel: +260 962484156.
Author(s) agree that this article remain permanently open access under the terms of the Creative Commons Attribution
License 4.0 International License
Sikapizye and Habanyama 11
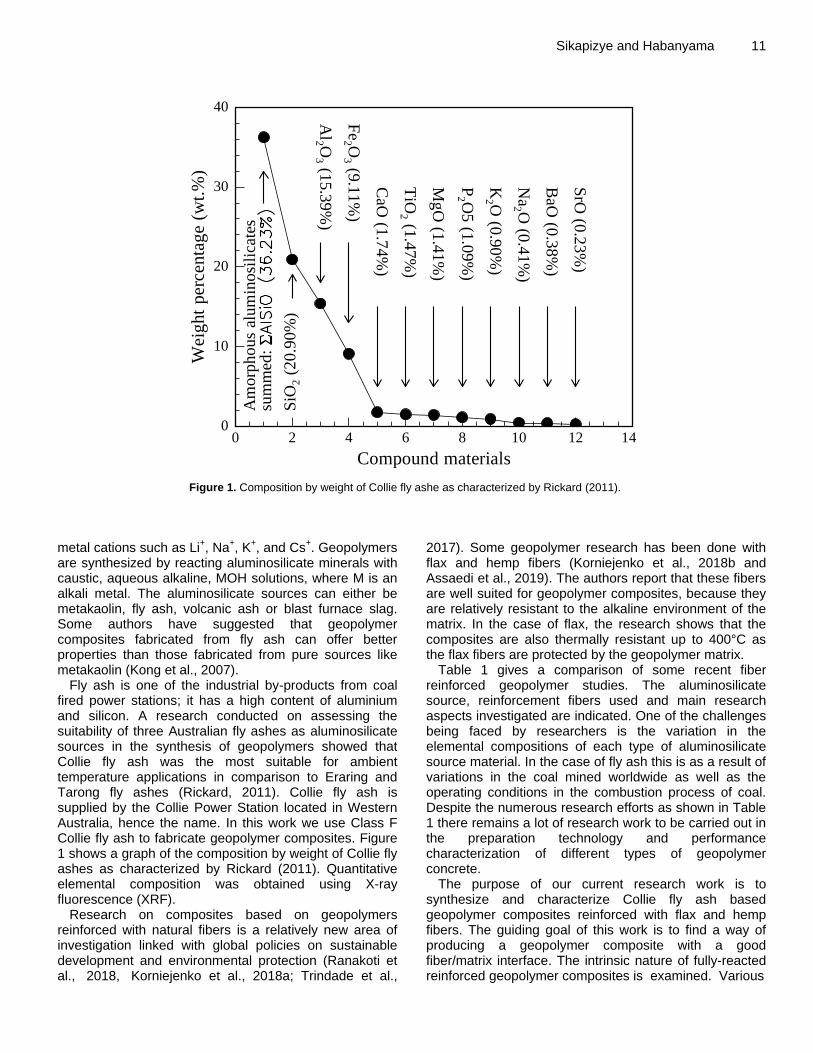
Figure 1. Composition by weight of Collie fly ashe as characterized by Rickard (2011).
metal cations such as Li
+, Na
+, K
+, and Cs
+. Geopolymers
are synthesized by reacting aluminosilicate minerals with caustic, aqueous alkaline, MOH solutions, where M is an alkali metal. The aluminosilicate sources can either be metakaolin, fly ash, volcanic ash or blast furnace slag. Some authors have suggested that geopolymer composites fabricated from fly ash can offer better properties than those fabricated from pure sources like metakaolin (Kong et al., 2007).
Fly ash is one of the industrial by-products from coal fired power stations; it has a high content of aluminium and silicon. A research conducted on assessing the suitability of three Australian fly ashes as aluminosilicate sources in the synthesis of geopolymers showed that Collie fly ash was the most suitable for ambient temperature applications in comparison to Eraring and Tarong fly ashes (Rickard, 2011). Collie fly ash is supplied by the Collie Power Station located in Western Australia, hence the name. In this work we use Class F Collie fly ash to fabricate geopolymer composites. Figure 1 shows a graph of the composition by weight of Collie fly ashes as characterized by Rickard (2011). Quantitative elemental composition was obtained using X-ray fluorescence (XRF).
Research on composites based on geopolymers reinforced with natural fibers is a relatively new area of investigation linked with global policies on sustainable development and environmental protection (Ranakoti et al., 2018, Korniejenko et al., 2018a; Trindade et al.,
2017). Some geopolymer research has been done with flax and hemp fibers (Korniejenko et al., 2018b and Assaedi et al., 2019). The authors report that these fibers are well suited for geopolymer composites, because they are relatively resistant to the alkaline environment of the matrix. In the case of flax, the research shows that the composites are also thermally resistant up to 400°C as the flax fibers are protected by the geopolymer matrix.
Table 1 gives a comparison of some recent fiber reinforced geopolymer studies. The aluminosilicate source, reinforcement fibers used and main research aspects investigated are indicated. One of the challenges being faced by researchers is the variation in the elemental compositions of each type of aluminosilicate source material. In the case of fly ash this is as a result of variations in the coal mined worldwide as well as the operating conditions in the combustion process of coal. Despite the numerous research efforts as shown in Table 1 there remains a lot of research work to be carried out in the preparation technology and performance characterization of different types of geopolymer concrete.
The purpose of our current research work is to synthesize and characterize Collie fly ash based geopolymer composites reinforced with flax and hemp fibers. The guiding goal of this work is to find a way of producing a geopolymer composite with a good fiber/matrix interface. The intrinsic nature of fully-reacted reinforced geopolymer composites is examined. Various
0 2 4 6 8 10 12 14
Compound materials
0
10
20
30
40
Wei
ght
per
centa
ge
(wt.
%)
Composition percentage by weight of Collie fly ash
Am
orp
hous
alum
inosi
lica
tes
sum
med
:
SiO
2(2
0.9
0%
)
Al2 O
3(1
5.3
9%
)
Fe
2 O3
(9.1
1%
)
CaO
(1.7
4%
)
TiO
2(1
.47%
)
Mg
O(1
.41%
)
P2 O
5(1
.09%
)
K2 O
(0.9
0%
)
Na
2 O(0
.41%
)
BaO
(0.3
8%
)
SrO
(0.2
3%
)
12 J. Chem. Eng. Mater. Sci. Table 1. A comparison of fiber reinforced geopolymer studies indicting aluminosilicate sources, reinforcement fibers used and the main research aspects investigated.
Year of publication andreferences
Aluminosilicate source Reinforcement
fibers used
Research aspects
investigated
Korniejenko et al. (2018b)
Fly ash from the Skawina, Poland CHP plant and sand in the ratio 1:1
Flax and hemp Microstructure, compressive strength and flexural strength
Assaedi et al. (2014)
Low calcium fly ash (ASTM class F), collected from the Eraring power station in New South Wales (NSW)
Flax Microstructure, flexural strength, flexural modulus and fracture toughness
Manoj and Baboo (2019
Low calcium fly ash collected from Kahalgaon Thermal Power Plant, Bihar, India
Micro Polypropylene fiber (PPF); this is not a natural fiber, manufactured by Reliance Industry in the name of Recron-3s
Compressive strength, flexural strength, modulus of elasticity, sorptivity and acid resistance
Assaedi et al. (2017)
The nanoclay (NC) with specific gravity of 1.98 provided by Southern Clay Products, USA and low-calcium fly ash (ASTM class F) from the Eraring power station in NSW
Flax
The effect of nano-clay (NC) on the durability of flax fabric in fly ash geocomposites and flexural strength
Assaedi et al. (2019)
Fly ash from Eraring power station of Lake Macquarie, New SouthWales (NSW) in Australia
Flax
Influence of various source contents on the mechanical properties and durability of flax fiber reinforced geopolymer composites. Microstructure and
flexural strength.
Sun et al. (2018)
Fly ash from Fuxin PowerPlant in China and Slag from Fuxin Jinfujiye Concrete Co. Ltd
No reinforcement.
Effect of water-binder ratio, dosage of alkali (%) and sodium silicate modulus on compressive strength
Our present study
Fly ash from the Collie Power Station located in Western Australia, classified as Class F.
Flax, hemp and hybrid (hemp and flax combined).
Elemental (as opposed to compound) composition, horizontal and vertical flexural strength, and microstructure
characterization techniques are employed. Elemental composition is determined using Energy Dispersive Spectroscopy (EDS). The microstructure of the samples is examined using Scanning Electron Microscopy (SEM) and mechanical properties are determined using a three-point universal flexure testing machine.
Experimental methods
Energy Dispersive Spectroscopy (EDS) was used to establish the elemental composition of several samples of the Class F Collie fly ash that was used for the synthesis of the geopolymer composites. The chemical reaction used in the fabrication of geopolymer composites required the presence of an alkaline substance. In this regard, 8M sodium hydroxide was prepared in a fume cupboard. 320 grams of sodium pellets were slowly added to 1 liter of distilled water. The solution was kept in an ice water bath used as a coolant because the chemical reaction between sodium pellets and water is exothermic. Addition of sodium pellets in the distilled water was accompanied by stirring to ensure that all the sodium pellets dissolve completely. The solution was allowed to cool to ambient temperature. Sodium silicate comprising 29.4 wt.% of SiO2, 14.7
wt.% of Na2O and 55.9 wt.% of distilled water was gently mixed with the sodium hydroxide. This was done a day prior to the synthesis of the geopolymer paste. 1 kg of sifted Class F Collie fly ash was gently poured in a Hobart mixer after which 600 grams of the alkaline solution (mixture of sodium hydroxide and sodium silicate) was added. 100 ml of water was immediately added to the solution of sodium hydroxide and sodium silicate to enhance workability. The Hobart mixer had to run at the speed of 7 on a speed ranging from 0 to 14 for 2 min to form a homogeneous geopolymer paste. Hemp, flax and hybrid (hemp and flax combined) fibers were then incorporated as reinforcement for the geopolymer composites before molding. Figure 2 shows optical micrographs of the three fabrics used as reinforcements.
The densities for the fabrics were 1.48, 1.40 and 1.42 g/cm3 for
hemp, flax and hybrid fabrics respectively. All the fabrics were cut to pieces of 20 300 mm to just fit in partitioned molds. Four wooden molds each partitioned in three 20 mm × 20 mm × 300 mm were smeared with grease to facilitate easy removal of the geopolymer blocks during de-molding. The reinforced composites were made by singly soaking the fabric in the geopolymer paste and immediately placing then into the mold. A scoop was used to see to it that the process of laying soaked reinforcement into the molds resulted in the mold being completely full of paste after at least five layers of reinforcement. A metal bar was used to gently

Sikapizye and Habanyama 13
Figure 2. Optical micrographs of the three fabrics used as reinforcements: (a) hemp, (b) flax and (c) hybrid (hemp-flax).
Figure 3. Schematic diagram of the Lloyd three-point flexure testing machine used.
compress the fabrics and geopolymer paste to enhance the interface bond between the fabric and the matrix of the geopolymer. Control samples were also produced with no reinforcement fabrics. The molds were then placed on a vibrator for 30 s to enhance compactness of the particles in the composites and to minimize porosity due the entrained air bubbles. The molds were sealed with plastic and put in an oven which was set at 60°C for curing. The geopolymer composites were removed from the oven after 24 h and allowed to age for 14 days after which flexure tests were conducted.
All samples were polished with sand paper to enhance the application of test loads. Flexure tests were carried out in accordance with standard test method (ASTM) codes (ASTM C78/C78M, 2018). The relevance of the use of ASTM codes is in the need for international compliance of measurements that apply to both pure and reinforced composites. Three bearing forces were applied uniformly and normal to the specimens with maximum
reduction of eccentricity. The test span of the composites was set to three times the thickness of the composites according to ASTM codes (ASTM C78/C78M, 2018). Figure 3 shows a schematic diagram of the Lloyd three-point flexure testing machine used. The machine was set to a pre-load of 50 kN and a cross-head speed of 1 mm/min. The test span for the Lloyd flexure testing machine was adjusted to 60 mm, that is, three times the thickness of the samples. The load was applied until failure strain was observed.
In all mechanical testing, five samples of the control material and each particular geopolymer composite were measured and the mean values were calculated. The tests were carried out for both vertical and horizontal orientations of the reinforcement fabrics, with respect to the direction of the applied cross-head load. In accordance with standard ASTM requirements (ASTM C78/C78M, 2018), the angles subtended by all the bearing blocks to composites were at least 45 degrees and the composites were free the
Span length, L
50 kN
Machine’s
Cross-Head
Sample
14 J. Chem. Eng. Mater. Sci.
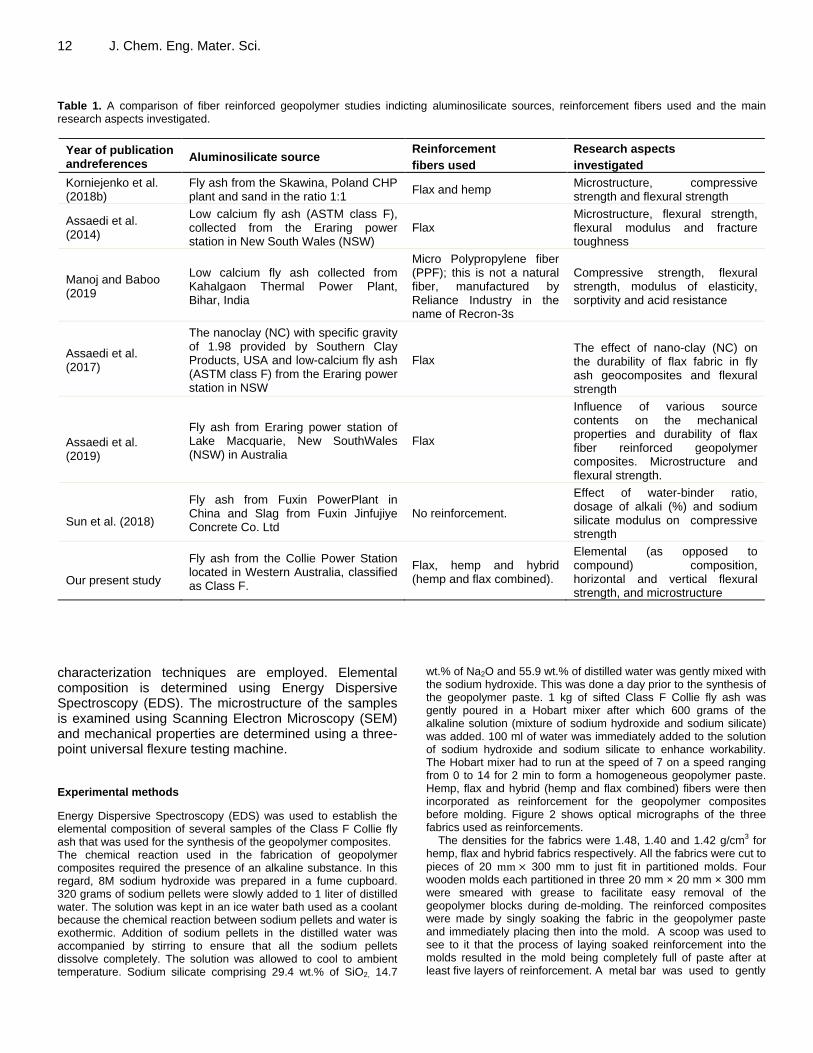
Figure 4. A geopolymer composite undergoes a three-point bending test using a Lloyd flexure testing machine.
from indentation, scars, holes or inscribed identification marks. Cracks were allowed to fully propagate up to the point of failure strain, at which point the cracked composites could no longer restrain the applied force. Figure 4 shows a geopolymer composite undergoing a three-point bending test by a Lloyd flexure testing machine. Flexural strength, which is also referred to as bend strength or modulus of rupture is the stress in a material just before it yields in a flexure test. A Lloyd flexure testing machine has an in built formula that calculates the flexural strength. Flexural strength is determined using the equation,
WD
SPm
F2
3
(1)
where F is the flexural strength (MPa), mP is the maximum load
at crack extension (N), S is the span of the sample (mm), D is the
specimen thickness (mm) and W is the specimen width (mm).
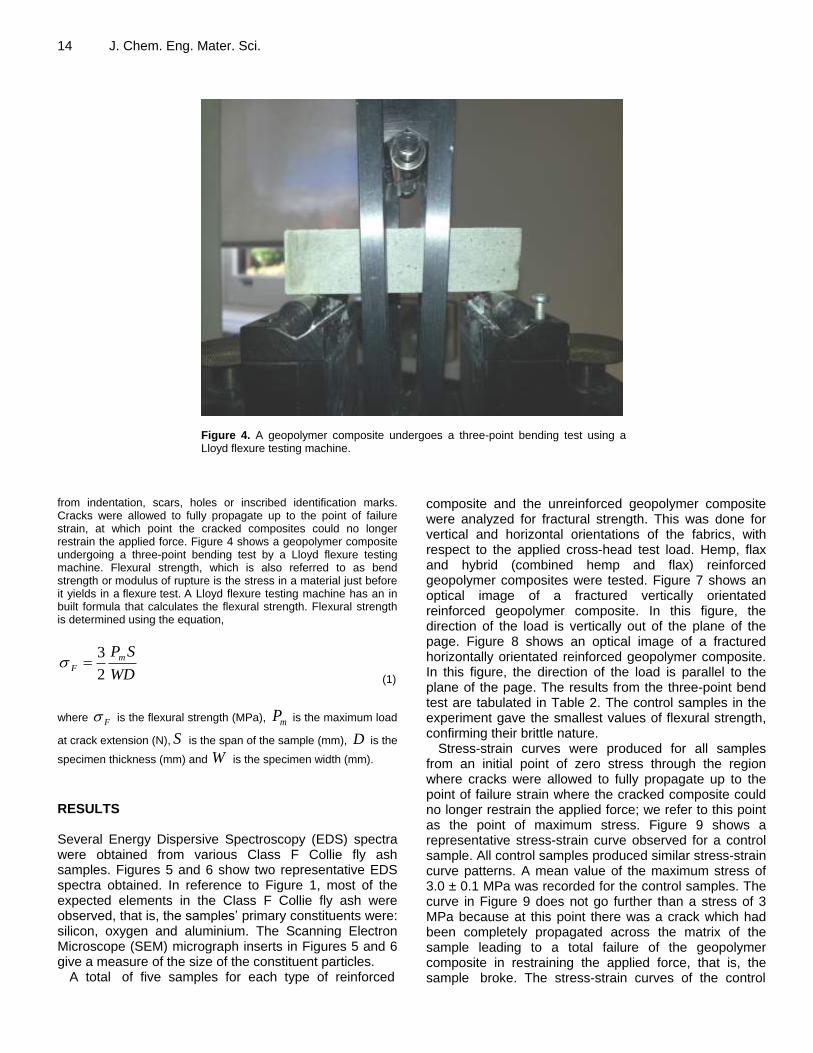
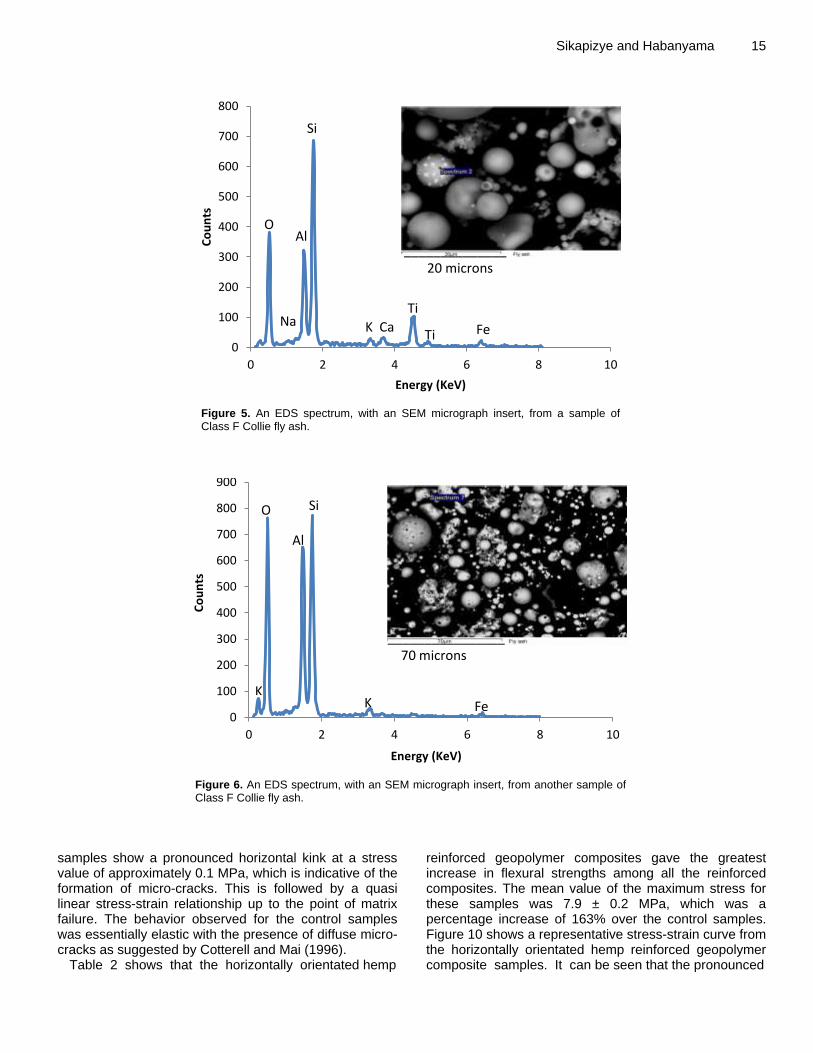
RESULTS Several Energy Dispersive Spectroscopy (EDS) spectra were obtained from various Class F Collie fly ash samples. Figures 5 and 6 show two representative EDS spectra obtained. In reference to Figure 1, most of the expected elements in the Class F Collie fly ash were observed, that is, the samples’ primary constituents were: silicon, oxygen and aluminium. The Scanning Electron Microscope (SEM) micrograph inserts in Figures 5 and 6 give a measure of the size of the constituent particles.
A total of five samples for each type of reinforced
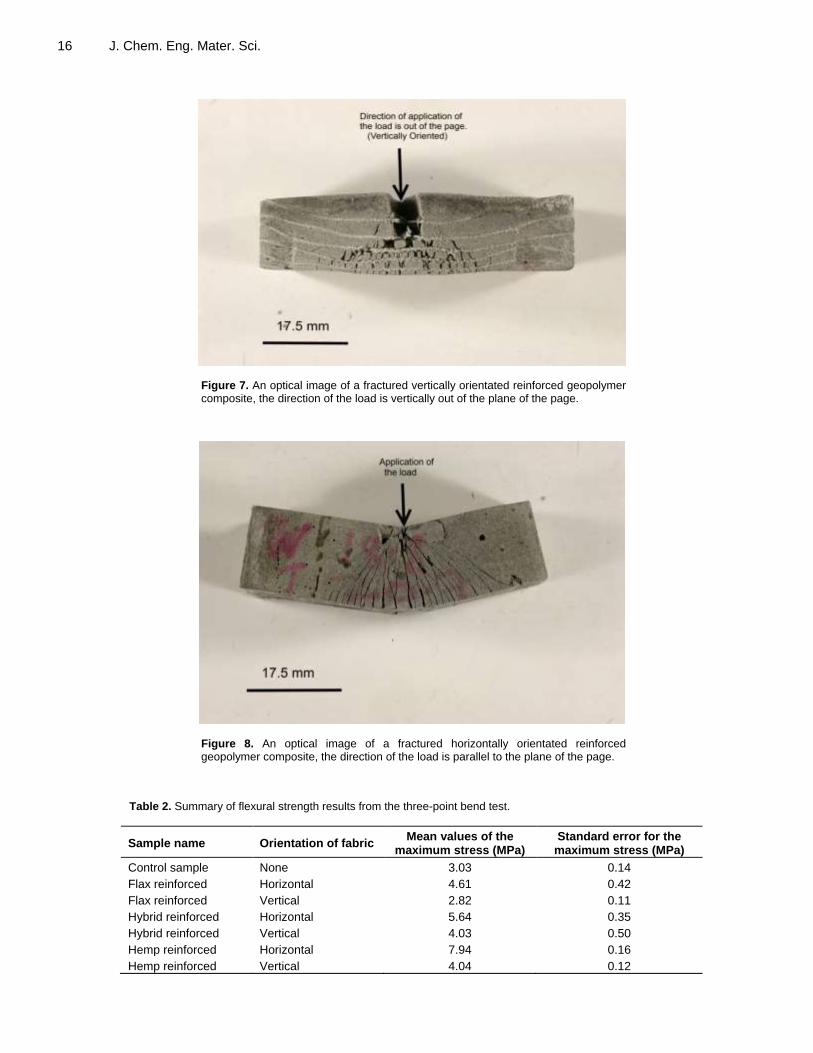
composite and the unreinforced geopolymer composite were analyzed for fractural strength. This was done for vertical and horizontal orientations of the fabrics, with respect to the applied cross-head test load. Hemp, flax and hybrid (combined hemp and flax) reinforced geopolymer composites were tested. Figure 7 shows an optical image of a fractured vertically orientated reinforced geopolymer composite. In this figure, the direction of the load is vertically out of the plane of the page. Figure 8 shows an optical image of a fractured horizontally orientated reinforced geopolymer composite. In this figure, the direction of the load is parallel to the plane of the page. The results from the three-point bend test are tabulated in Table 2. The control samples in the experiment gave the smallest values of flexural strength, confirming their brittle nature.
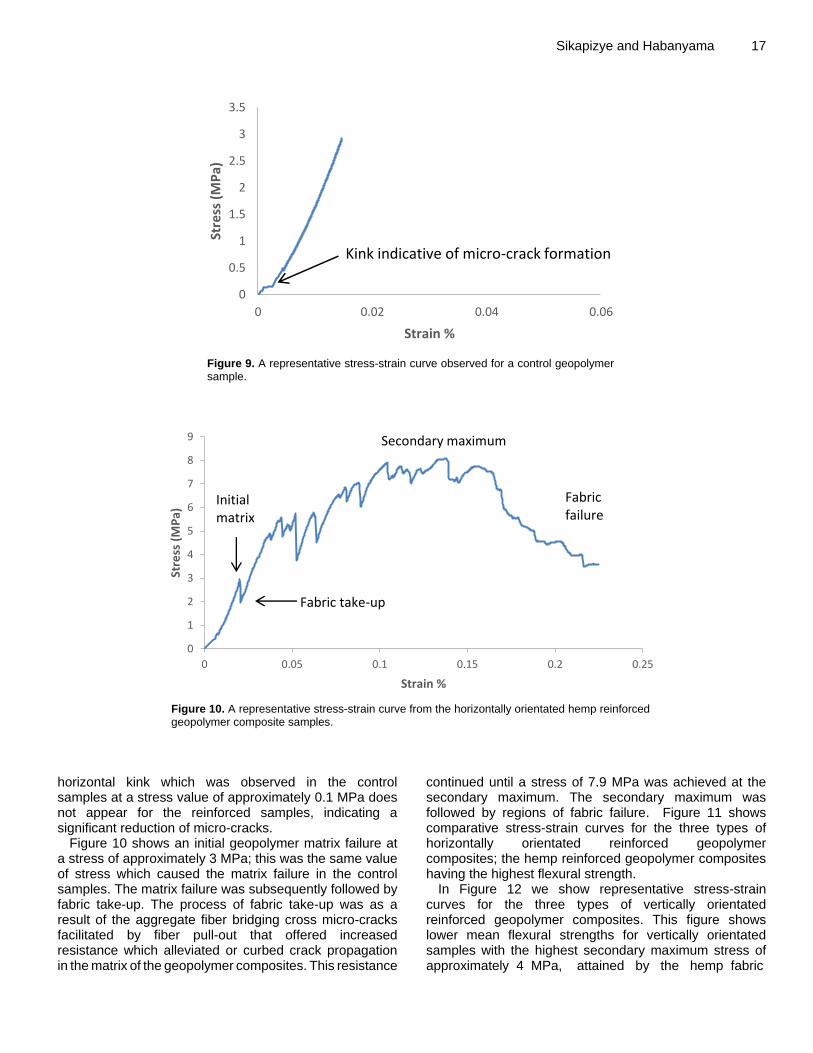
Stress-strain curves were produced for all samples from an initial point of zero stress through the region where cracks were allowed to fully propagate up to the point of failure strain where the cracked composite could no longer restrain the applied force; we refer to this point as the point of maximum stress. Figure 9 shows a representative stress-strain curve observed for a control sample. All control samples produced similar stress-strain curve patterns. A mean value of the maximum stress of 3.0 ± 0.1 MPa was recorded for the control samples. The curve in Figure 9 does not go further than a stress of 3 MPa because at this point there was a crack which had been completely propagated across the matrix of the sample leading to a total failure of the geopolymer composite in restraining the applied force, that is, the sample broke. The stress-strain curves of the control
Sikapizye and Habanyama 15
Figure 5. An EDS spectrum, with an SEM micrograph insert, from a sample of Class F Collie fly ash.
Figure 6. An EDS spectrum, with an SEM micrograph insert, from another sample of Class F Collie fly ash.
samples show a pronounced horizontal kink at a stress value of approximately 0.1 MPa, which is indicative of the formation of micro-cracks. This is followed by a quasi linear stress-strain relationship up to the point of matrix failure. The behavior observed for the control samples was essentially elastic with the presence of diffuse micro-cracks as suggested by Cotterell and Mai (1996).
Table 2 shows that the horizontally orientated hemp
reinforced geopolymer composites gave the greatest increase in flexural strengths among all the reinforced composites. The mean value of the maximum stress for these samples was 7.9 ± 0.2 MPa, which was a percentage increase of 163% over the control samples. Figure 10 shows a representative stress-strain curve from the horizontally orientated hemp reinforced geopolymer composite samples. It can be seen that the pronounced
0
100
200
300
400
500
600
700
800
0 2 4 6 8 10
Co
un
ts
Energy (KeV)
O Al
Si
K Ca
Ti
Ti Fe Na
______________ 20 microns
0
100
200
300
400
500
600
700
800
900
0 2 4 6 8 10
Co
un
ts
Energy (KeV)
K
O
Al
Si
K Fe
________________ 70 microns
16 J. Chem. Eng. Mater. Sci.
Figure 7. An optical image of a fractured vertically orientated reinforced geopolymer composite, the direction of the load is vertically out of the plane of the page.
Figure 8. An optical image of a fractured horizontally orientated reinforced geopolymer composite, the direction of the load is parallel to the plane of the page.
Table 2. Summary of flexural strength results from the three-point bend test.
Sample name Orientation of fabric Mean values of the
maximum stress (MPa) Standard error for the
maximum stress (MPa)
Control sample None 3.03 0.14
Flax reinforced Horizontal 4.61 0.42
Flax reinforced Vertical 2.82 0.11
Hybrid reinforced Horizontal 5.64 0.35
Hybrid reinforced Vertical 4.03 0.50
Hemp reinforced Horizontal 7.94 0.16
Hemp reinforced Vertical 4.04 0.12
Sikapizye and Habanyama 17
Figure 9. A representative stress-strain curve observed for a control geopolymer sample.
Figure 10. A representative stress-strain curve from the horizontally orientated hemp reinforced geopolymer composite samples.
horizontal kink which was observed in the control samples at a stress value of approximately 0.1 MPa does not appear for the reinforced samples, indicating a significant reduction of micro-cracks.
Figure 10 shows an initial geopolymer matrix failure at a stress of approximately 3 MPa; this was the same value of stress which caused the matrix failure in the control samples. The matrix failure was subsequently followed by fabric take-up. The process of fabric take-up was as a result of the aggregate fiber bridging cross micro-cracks facilitated by fiber pull-out that offered increased resistance which alleviated or curbed crack propagation in the matrix of the geopolymer composites. This resistance
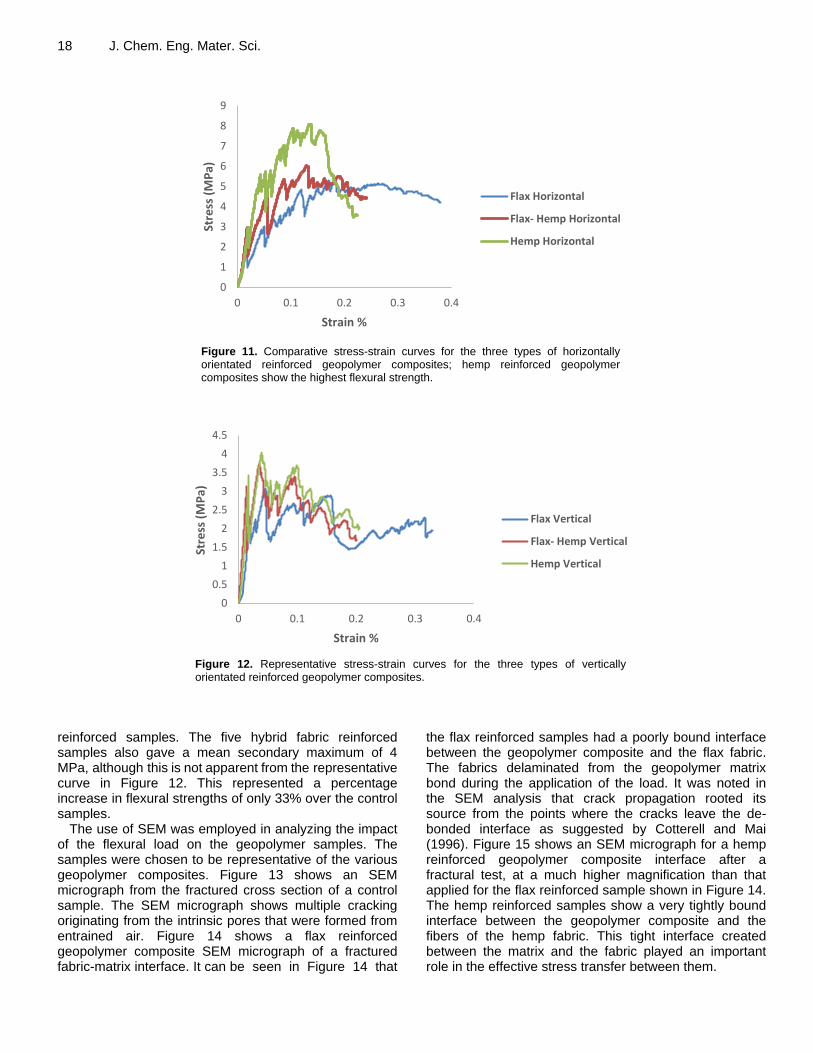
continued until a stress of 7.9 MPa was achieved at the secondary maximum. The secondary maximum was followed by regions of fabric failure. Figure 11 shows comparative stress-strain curves for the three types of horizontally orientated reinforced geopolymer composites; the hemp reinforced geopolymer composites having the highest flexural strength.
In Figure 12 we show representative stress-strain curves for the three types of vertically orientated reinforced geopolymer composites. This figure shows lower mean flexural strengths for vertically orientated samples with the highest secondary maximum stress of approximately 4 MPa, attained by the hemp fabric
0
0.5
1
1.5
2
2.5
3
3.5
0 0.02 0.04 0.06
Stre
ss (
MP
a)
Strain %
Kink indicative of micro-crack formation
0
1
2
3
4
5
6
7
8
9
0 0.05 0.1 0.15 0.2 0.25
Stre
ss (
MP
a)
Strain %
Initial matrix
Fabric take-up
Secondary maximum
Fabric failure
18 J. Chem. Eng. Mater. Sci.
Figure 11. Comparative stress-strain curves for the three types of horizontally orientated reinforced geopolymer composites; hemp reinforced geopolymer composites show the highest flexural strength.
Figure 12. Representative stress-strain curves for the three types of vertically orientated reinforced geopolymer composites.
reinforced samples. The five hybrid fabric reinforced samples also gave a mean secondary maximum of 4 MPa, although this is not apparent from the representative curve in Figure 12. This represented a percentage increase in flexural strengths of only 33% over the control samples.
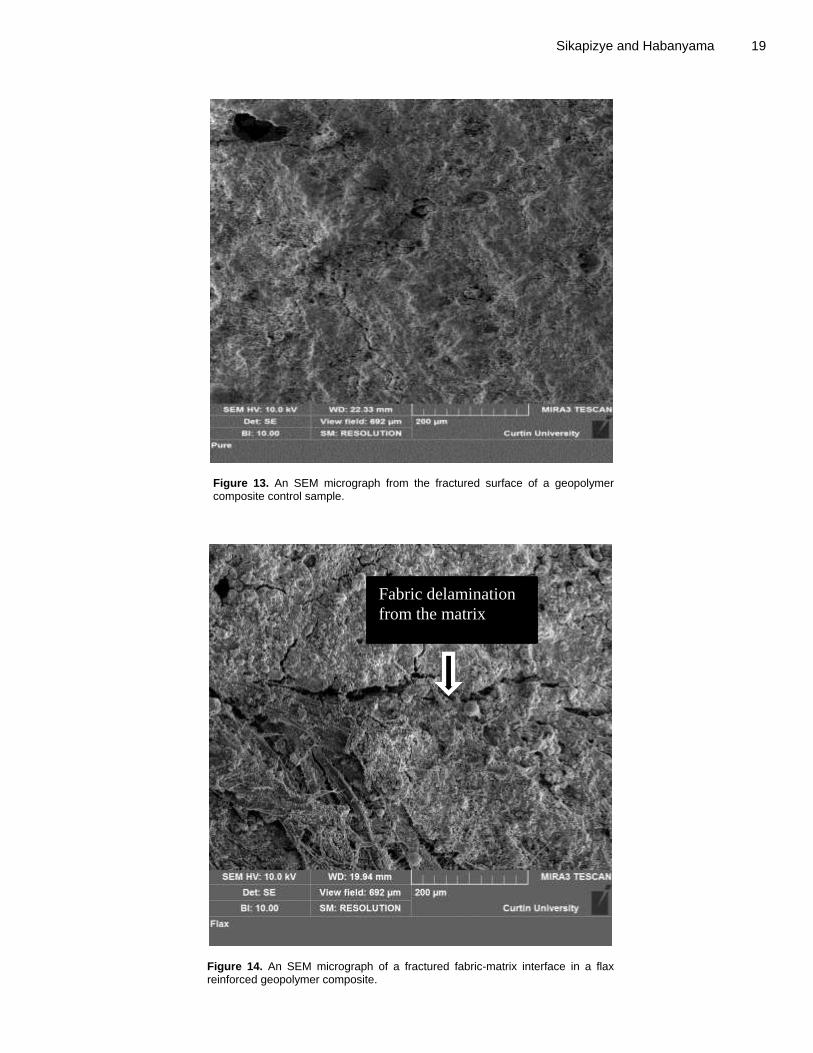
The use of SEM was employed in analyzing the impact of the flexural load on the geopolymer samples. The samples were chosen to be representative of the various geopolymer composites. Figure 13 shows an SEM micrograph from the fractured cross section of a control sample. The SEM micrograph shows multiple cracking originating from the intrinsic pores that were formed from entrained air. Figure 14 shows a flax reinforced geopolymer composite SEM micrograph of a fractured fabric-matrix interface. It can be seen in Figure 14 that
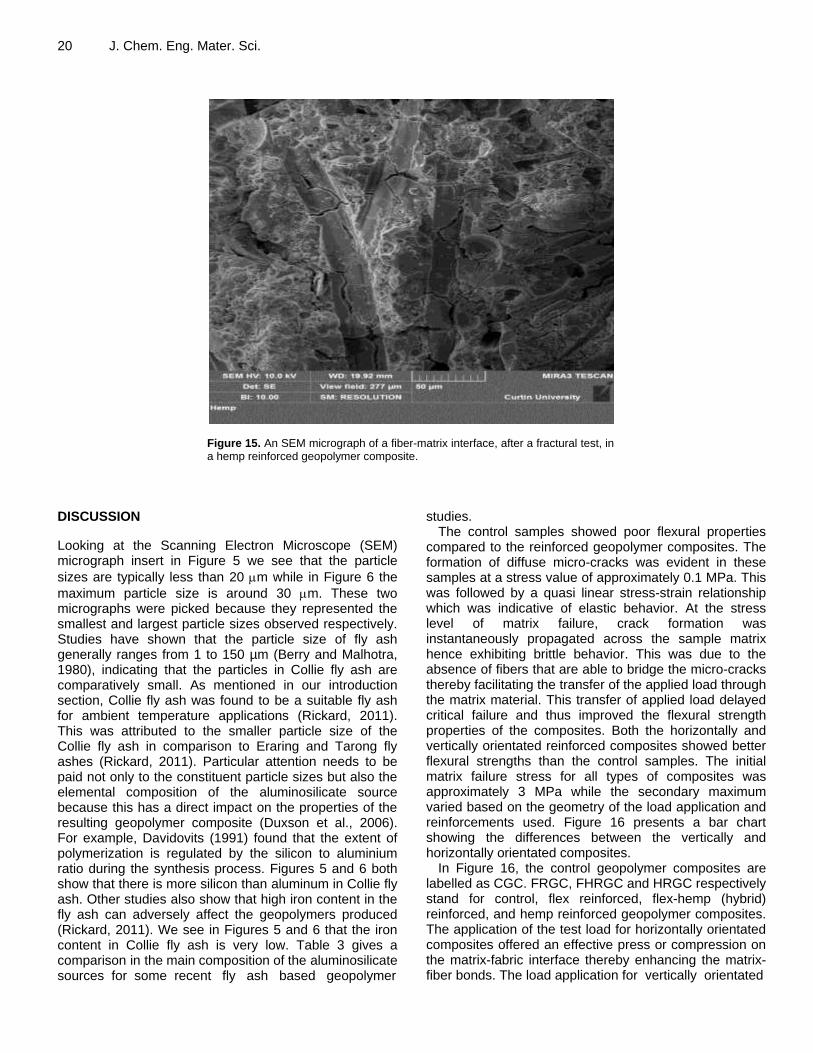
the flax reinforced samples had a poorly bound interface between the geopolymer composite and the flax fabric. The fabrics delaminated from the geopolymer matrix bond during the application of the load. It was noted in the SEM analysis that crack propagation rooted its source from the points where the cracks leave the de-bonded interface as suggested by Cotterell and Mai (1996). Figure 15 shows an SEM micrograph for a hemp reinforced geopolymer composite interface after a fractural test, at a much higher magnification than that applied for the flax reinforced sample shown in Figure 14. The hemp reinforced samples show a very tightly bound interface between the geopolymer composite and the fibers of the hemp fabric. This tight interface created between the matrix and the fabric played an important role in the effective stress transfer between them.
0
1
2
3
4
5
6
7
8
9
0 0.1 0.2 0.3 0.4
Stre
ss (
MP
a)
Strain %
Flax Horizontal
Flax- Hemp Horizontal
Hemp Horizontal
0
0.5
1
1.5
2
2.5
3
3.5
4
4.5
0 0.1 0.2 0.3 0.4
Stre
ss (
MP
a)
Strain %
Flax Vertical
Flax- Hemp Vertical
Hemp Vertical
Sikapizye and Habanyama 19
Figure 13. An SEM micrograph from the fractured surface of a geopolymer composite control sample.
Figure 14. An SEM micrograph of a fractured fabric-matrix interface in a flax reinforced geopolymer composite.
Fabric delamination
from the matrix
20 J. Chem. Eng. Mater. Sci.
Figure 15. An SEM micrograph of a fiber-matrix interface, after a fractural test, in a hemp reinforced geopolymer composite.
DISCUSSION
Looking at the Scanning Electron Microscope (SEM) micrograph insert in Figure 5 we see that the particle
sizes are typically less than 20 m while in Figure 6 the
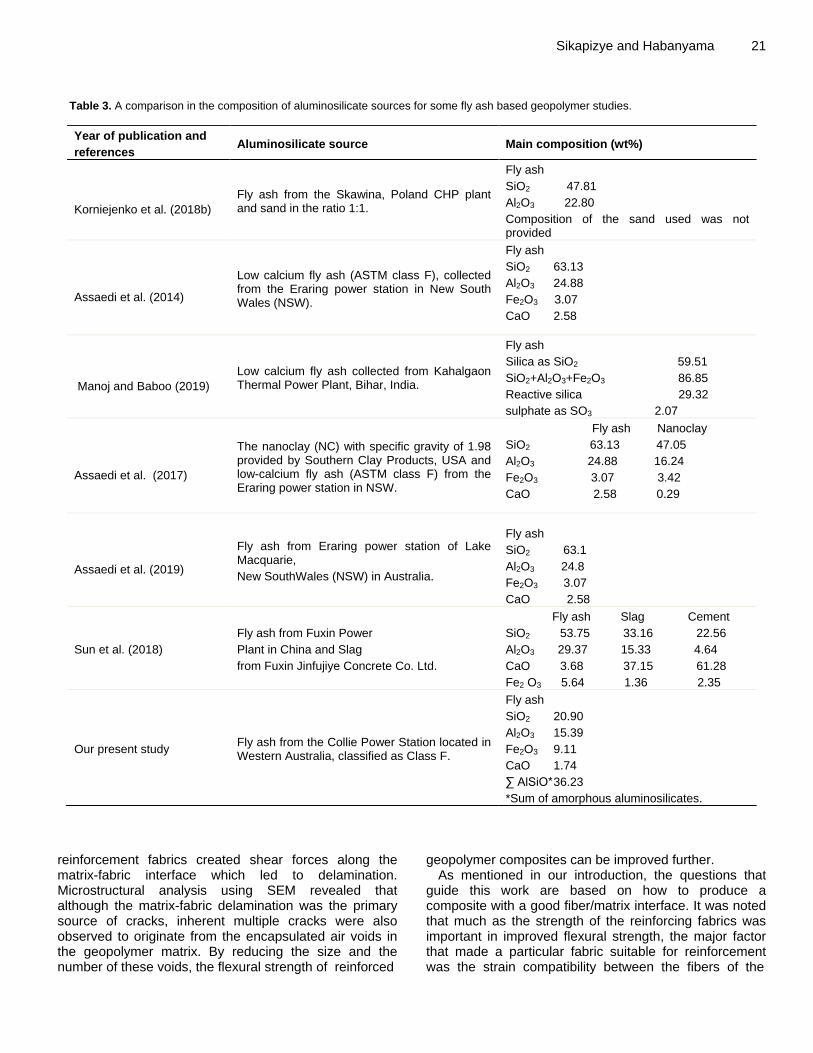
maximum particle size is around 30 m. These two micrographs were picked because they represented the smallest and largest particle sizes observed respectively. Studies have shown that the particle size of fly ash generally ranges from 1 to 150 µm (Berry and Malhotra, 1980), indicating that the particles in Collie fly ash are comparatively small. As mentioned in our introduction section, Collie fly ash was found to be a suitable fly ash for ambient temperature applications (Rickard, 2011). This was attributed to the smaller particle size of the Collie fly ash in comparison to Eraring and Tarong fly ashes (Rickard, 2011). Particular attention needs to be paid not only to the constituent particle sizes but also the elemental composition of the aluminosilicate source because this has a direct impact on the properties of the resulting geopolymer composite (Duxson et al., 2006). For example, Davidovits (1991) found that the extent of polymerization is regulated by the silicon to aluminium ratio during the synthesis process. Figures 5 and 6 both show that there is more silicon than aluminum in Collie fly ash. Other studies also show that high iron content in the fly ash can adversely affect the geopolymers produced (Rickard, 2011). We see in Figures 5 and 6 that the iron content in Collie fly ash is very low. Table 3 gives a comparison in the main composition of the aluminosilicate sources for some recent fly ash based geopolymer
studies. The control samples showed poor flexural properties
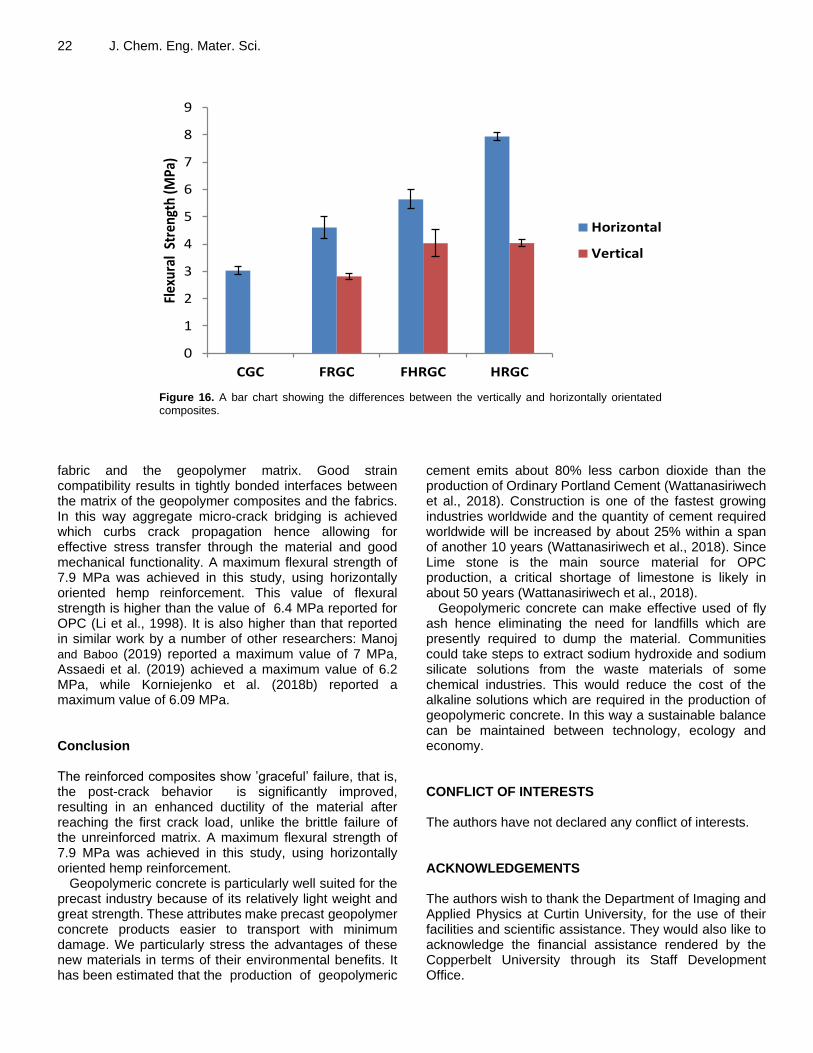
compared to the reinforced geopolymer composites. The formation of diffuse micro-cracks was evident in these samples at a stress value of approximately 0.1 MPa. This was followed by a quasi linear stress-strain relationship which was indicative of elastic behavior. At the stress level of matrix failure, crack formation was instantaneously propagated across the sample matrix hence exhibiting brittle behavior. This was due to the absence of fibers that are able to bridge the micro-cracks thereby facilitating the transfer of the applied load through the matrix material. This transfer of applied load delayed critical failure and thus improved the flexural strength properties of the composites. Both the horizontally and vertically orientated reinforced composites showed better flexural strengths than the control samples. The initial matrix failure stress for all types of composites was approximately 3 MPa while the secondary maximum varied based on the geometry of the load application and reinforcements used. Figure 16 presents a bar chart showing the differences between the vertically and horizontally orientated composites.
In Figure 16, the control geopolymer composites are labelled as CGC. FRGC, FHRGC and HRGC respectively stand for control, flex reinforced, flex-hemp (hybrid) reinforced, and hemp reinforced geopolymer composites. The application of the test load for horizontally orientated composites offered an effective press or compression on the matrix-fabric interface thereby enhancing the matrix-fiber bonds. The load application for vertically orientated
Sikapizye and Habanyama 21
Table 3. A comparison in the composition of aluminosilicate sources for some fly ash based geopolymer studies.
Year of publication and
references Aluminosilicate source Main composition (wt%)
Korniejenko et al. (2018b)
Fly ash from the Skawina, Poland CHP plant and sand in the ratio 1:1.
Fly ash
SiO2 47.81
Al2O3 22.80
Composition of the sand used was not provided
Assaedi et al. (2014)
Low calcium fly ash (ASTM class F), collected from the Eraring power station in New South Wales (NSW).
Fly ash
SiO2 63.13
Al2O3 24.88
Fe2O3 3.07
CaO 2.58
Manoj and Baboo (2019)
Low calcium fly ash collected from Kahalgaon Thermal Power Plant, Bihar, India.
Fly ash
Silica as SiO2 59.51
SiO2+Al2O3+Fe2O3 86.85
Reactive silica 29.32
sulphate as SO3 2.07
Assaedi et al. (2017)
The nanoclay (NC) with specific gravity of 1.98 provided by Southern Clay Products, USA and low-calcium fly ash (ASTM class F) from the Eraring power station in NSW.
Fly ash Nanoclay
SiO2 63.13 47.05
Al2O3 24.88 16.24
Fe2O3 3.07 3.42
CaO 2.58 0.29
Assaedi et al. (2019)
Fly ash from Eraring power station of Lake Macquarie,
New SouthWales (NSW) in Australia.
Fly ash
SiO2 63.1
Al2O3 24.8
Fe2O3 3.07
CaO 2.58
Sun et al. (2018)
Fly ash from Fuxin Power
Plant in China and Slag
from Fuxin Jinfujiye Concrete Co. Ltd.
Fly ash Slag Cement
SiO2 53.75 33.16 22.56
Al2O3 29.37 15.33 4.64
CaO 3.68 37.15 61.28
Fe2 O3 5.64 1.36 2.35
Our present study Fly ash from the Collie Power Station located in Western Australia, classified as Class F.
Fly ash
SiO2 20.90
Al2O3 15.39
Fe2O3 9.11
CaO 1.74
∑ AlSiO* 36.23
*Sum of amorphous aluminosilicates.
reinforcement fabrics created shear forces along the matrix-fabric interface which led to delamination. Microstructural analysis using SEM revealed that although the matrix-fabric delamination was the primary source of cracks, inherent multiple cracks were also observed to originate from the encapsulated air voids in the geopolymer matrix. By reducing the size and the number of these voids, the flexural strength of reinforced
geopolymer composites can be improved further. As mentioned in our introduction, the questions that
guide this work are based on how to produce a composite with a good fiber/matrix interface. It was noted that much as the strength of the reinforcing fabrics was important in improved flexural strength, the major factor that made a particular fabric suitable for reinforcement was the strain compatibility between the fibers of the
22 J. Chem. Eng. Mater. Sci.
Figure 16. A bar chart showing the differences between the vertically and horizontally orientated composites.
fabric and the geopolymer matrix. Good strain compatibility results in tightly bonded interfaces between the matrix of the geopolymer composites and the fabrics. In this way aggregate micro-crack bridging is achieved which curbs crack propagation hence allowing for effective stress transfer through the material and good mechanical functionality. A maximum flexural strength of 7.9 MPa was achieved in this study, using horizontally oriented hemp reinforcement. This value of flexural strength is higher than the value of 6.4 MPa reported for OPC (Li et al., 1998). It is also higher than that reported in similar work by a number of other researchers: Manoj and Baboo (2019) reported a maximum value of 7 MPa, Assaedi et al. (2019) achieved a maximum value of 6.2 MPa, while Korniejenko et al. (2018b) reported a maximum value of 6.09 MPa. Conclusion The reinforced composites show ’graceful’ failure, that is, the post-crack behavior is significantly improved, resulting in an enhanced ductility of the material after reaching the first crack load, unlike the brittle failure of the unreinforced matrix. A maximum flexural strength of 7.9 MPa was achieved in this study, using horizontally oriented hemp reinforcement.
Geopolymeric concrete is particularly well suited for the precast industry because of its relatively light weight and great strength. These attributes make precast geopolymer concrete products easier to transport with minimum damage. We particularly stress the advantages of these new materials in terms of their environmental benefits. It has been estimated that the production of geopolymeric
cement emits about 80% less carbon dioxide than the production of Ordinary Portland Cement (Wattanasiriwech et al., 2018). Construction is one of the fastest growing industries worldwide and the quantity of cement required worldwide will be increased by about 25% within a span of another 10 years (Wattanasiriwech et al., 2018). Since
Lime stone is the main source material for OPC production, a critical shortage of limestone is likely in about 50 years (Wattanasiriwech et al., 2018).
Geopolymeric concrete can make effective used of fly ash hence eliminating the need for landfills which are presently required to dump the material. Communities could take steps to extract sodium hydroxide and sodium silicate solutions from the waste materials of some chemical industries. This would reduce the cost of the alkaline solutions which are required in the production of geopolymeric concrete. In this way a sustainable balance can be maintained between technology, ecology and economy. CONFLICT OF INTERESTS The authors have not declared any conflict of interests. ACKNOWLEDGEMENTS The authors wish to thank the Department of Imaging and Applied Physics at Curtin University, for the use of their facilities and scientific assistance. They would also like to acknowledge the financial assistance rendered by the Copperbelt University through its Staff Development Office.
0
1
2
3
4
5
6
7
8
9
CGC FRGC FHRGC HRGC
Flex
ural
Str
engt
h (M
Pa)
Horizontal
Vertical
REFERENCES Assaedi HS, Alomayri TS, Shaikh FUA, Low IM (2014). Synthesis and
mechanical properties of flax fabric reinforced geopolymer composites. Advances in Materials Research 3(3):151-161.
Assaedi H, Shaikh FUA, Low IM (2017). Effect of nanoclay on durability and mechanical properties of flax fabric reinforced geopolymer composites. Journal of Asian Ceramic Societies 5(1):62-70.
Assaedi H, Alomayri T, Shaikh F, Low IM (2019). Influence of Nano Silica Particles on Durability of Flax Fabric Reinforced Geopolymer Composites. Materials 12:1459. doi:10.3390/ma12091459
ASTM C78/C78M (2018). Standard Test Method for Flexural Strength of Concrete (Using Simple Beam with Third-Point Loading). ASTM International. https://standards.globalspec.com/std/10274120/astm-c78-c78m
Berry EE, Malhotra VM (1980). Fly Ash for Use in Concrete - a Critical Review. Journal Proceedings 77(2):59-73.
Cotterell B, Mai YW (1996). Fracture Mechanics of Cementitious Materials. London, Blackie Academic and Professional Publishers.
Davidovits J (1991). Geopolymers: Inorganic Polymeric New Materials. Journal of Thermal Analysis and Calorimetry 37(8):1633-1656
Dove J (1996). Student Teacher Understanding of the Greenhouse Effect, Ozone Layer Depletion and Acid Rain. Environmental Education Research 2(1):89-100.
Duxson P, Lukey GC, van Deventer JS (2006). Thermal evolution of metakaolin geopolymers: Part 1-Physical evolution. Journal of Non-Crystalline Solids 352(52-54):5541-5555.
Kong DLY, Sanjayan JG, Kwesi SC (2007). Comparative Performance of Geopolymers Made with Metakaolin and Fly Ash after Exposure to Elevated Temperatures. Cement and Concrete Research 37(12):1583-1589.
Korniejenko K, Łach M, Mikuła J (2018a). Mechanical Properties of Raffia Fibres Reinforced Geopolymer Composites. In Advances in Natural Fibre Composites Springer Cham, pp. 135-144.
Korniejenko K, Łach M, Hebdowska-Krupa M, Mikuła J (2018b). The mechanical properties of flax and hemp fibres reinforced geopolymer composites. In IOP Conference Series: Materials Science and Engineering 379(1):012023 IOP Publishing.
Sikapizye and Habanyama 23 Li G, Zhao Y, Pang SS, Huang W (1998). Experimental Study of
Cement-Asphalt Emulsion Composite. Cement and Concrete Research. 28(5):635-641.
Manoj R, Baboo R (2019). Effect of Micro Polypropylene Fibre on the Performance of Fly Ash-Based Geopolymer Concrete. Journal of Applied Engineering Sciences 9(22):97-108.
Ranakoti L, Pokhriyal M, Kumar A (2018). Natural Fibers and Biopolymers Characterization: A future potential composite material. Journal of Mechanical Engineering 68(1):33-50.
Rickard WDA (2011). Assessing the Suitability of Three Australian Fly Ashes as an Aluminosilicate Source for Geopolymers in High Temperature Applications. Materials Science and Engineering: A 528(9):3390-3397.
Sun Q, Zhui H, Li H, Zhu H, Gao M (2018). Application of Response Surface Methodology in the Optimization of Fly Ash Geopolymer Concrete. Romanian Journal of Materials 48(1):45-52.
Trindade ACC, Arêas IOM, Almeida DCT, Alcamand HA, Borges PHR, Silva FA (2017). Mechanical Behavior of Geopolymeric Composites Reinforced with Natural Fibres Strain-Hardening Cement-Based Composites eds. V Mechtcherine, V Slowik, P Kabele P. (Springer, Dordrecht) pp. 383-391.
Wattanasiriwech D, Munmueangkham T, Wattanasiriwech S (2018). Impact Strength and Physical Properties of Geopolymer Composites Reinforced with Bagasse Cellulose Fibers. The 2018 World Congress on Advances in Civil, Environmental, and Materials Research (ACEM18) Songdo Convensia, Incheon, Korea.