OPTICAL STUDIES ON INDIUM OXIDE, TIN OXIDE AND INDIUM TIN OXIDE
ISSN(Online): 2319-8753
ISSN (Print): 2347-6710
International Journal of Innovative Research in Science,
Engineering and Technology (An ISO 3297: 2007 Certified Organization)
Vol. 4, Issue 11, November 2015
Copyright to IJIRSET DOI:10.15680/IJIRSET.2015.0411066 11213
Synthesis and Characterization of Cerium Oxide doped
Polyaniline/Titanium Oxide Nanocomposites for
Supercapacitor Applications
S. Tharani 1, S. Chidambara Vinayagam
2
Ph.D., Scholar, Department of Chemistry, Presidency College (Autonomous), Chennai-600005, India1
Associate Professor, Department of Chemistry, Presidency College (Autonomous), Chennai-600005, India2
ABSTRACT: To report an excellent-performance material for supercapacitor applications, we have prepared
nanocomposites by incorporating cerium oxide with conducting polymer (PANI) and with different wt% of TiO2 via in
situ chemical oxidative polymerization. The morphologies and microstructures of the samples were examined by X-ray
diffraction (XRD) and scanning electron microscopy (SEM). The effect of cerium oxide between PANI and TiO2, and
the thermal stability of the composite were characterized by FT-IR and UV-Vis spectroscopy, thermogravimetric
analysis (TGA) and photoluminescence (PL), respectively. Electrochemical properties were also studied by cyclic
voltammetry. The results indicated that the cerium oxide doped PANI with different wt% of TiO2 nanocomposites
possessed excellent electrochemical properties. We obtained the maximum specific capacitance 582 F/g for 5 wt%
cerium nitrate doped PANI with 7 wt% TiO2 nanocomposites at a scan rate of 5 mV/s shows an enormous improvement
in the electrochemical and cyclic stability.
KEYWORDS: Polyaniline, Cerium oxide, Titanium oxide, Optical spectra, Cyclic voltammetry, Supercapacitance.
I. INTRODUCTION
Supercapacitors, the so called fourth generation capacitors are highly needed as a modern energy storage system
because of their large power density, fast charge/discharge time, long term stability, good operational safety, light
weight, without disposal parts and eco-friendly materials [1, 2]. Supercapacitors are classified into two types namely (i)
Electrochemical double layer capacitor (EDLC), (ii) Pseudocapacitor. In EDLC, the non-faradic charge process takes
place, where there is no transfer of electrons in the electrode interface and the storage of electric charge and energy is
electrostatic, whereas in Pseudocapacitors charge process (i.e. faradic reaction) via electron transfer that develops
changes in the chemical or oxidation state of the electro-active materials in the electrodes. The electrode materials of
EDLCs are composed of CNTs and active carbons but the Pseudocapacitor are mainly made of transition metal oxides
doped on conducting polymers. In many studies, EDLC supercapacitors have lower energy density than
Pseudocapacitors and this instigates many researchers towards the metal oxide doped nanocomposite materials.
In order to exploit the full advantages of composite materials made of one or more materials including metal
oxides, CNTs, active carbons and conducting polymers [3–5] as supercapacitors, electrodes have been studied to
enhance the performance of a device. Transition metal oxides are potential materials for supercapacitor applications
because of their Pseudocapacitive behavior, but some of the transition metal oxides such as RuO2 exhibit high specific
capacitance as high as 1000 F/g in 1 M H2SO4 at room temperature [6] and excellent reversibility. However, the limited
commercial availability and toxicity to the environment divert the researchers towards the other transition metal oxides
such as NiO, MnO2, FeO, TiO2, SnO2, IrO2, V2O5, MoO etc. Doping of transition metal oxides on conducting polymer
enlighten the researchers towards the synthesis of unique material for redox supercapacitor electrode materials.
In recent times, the conducting polymers have been considered as superior electrode material because of their
wide range of applications in the organic field effect transitions, plastic solar cells, sensor, anti corrosive materials and
in molecular electronics due to their unique physical and chemical properties [7, 8]. But conducting polymer faces
some disadvantages like less life cycle stability and poor mechanical properties due to their swelling and shrinkage
characteristics during doping/dedoping processes. Among the conducting polymers, PANI plays a vital role in many

ISSN(Online): 2319-8753
ISSN (Print): 2347-6710
International Journal of Innovative Research in Science,
Engineering and Technology (An ISO 3297: 2007 Certified Organization)
Vol. 4, Issue 11, November 2015
Copyright to IJIRSET DOI:10.15680/IJIRSET.2015.0411066 11214
applications because of its affordable cost, easy process, fast redox reactions, eco-friendly and good electrical
conductivity. PANI combined with inorganic or metal oxide nanoparticles received greater attitude for the
supercapacitor electrode [9, 10]. TiO2 has also been investigated to prepare its composite with conducting polymers
[11–13]. We have also chosen TiO2 because of its unique physical and chemical properties such as abundance in nature,
stability at high electric field, wide gap, large surface area, non-toxicity, dielectric constant, easy synthesis and
environmental friendliness.
In this research work, we have doped rare earth metal oxide (Cerium oxide) with conducting polymer PANI and
added different wt% of TiO2 nanoparticles, expecting unique properties to present a fascinating material for
supercapacitor applications. To highlight, the doping of cerium oxide received great attention due to its peculiar, optical
and catalytic properties arising from the accessibility of the shielded 4f levels, and cerium oxide has strong binding
affinity with the nitrogen lone pair of PANI, which improve the stability of electrode material, act as a redox-active
catalyst and significantly enhance absorbance property and with TiO2 showed an excellent photo-catalytic activity.
II. EXPERIMENTAL SECTION
2.1 Materials and Methods
Aniline was distilled under the protection of high purity N2 and then kept in a refrigerator before use. All the
other chemicals purchased commercially were analytical reagent, and were used without further purification.
Ammonium persulphate and hydrochloric acid were obtained from SD Fine chemicals, India. Titanium metal oxide
(TiO2) and cetyltrimethylammonium bromide (CTAB) were obtained from Sigma Aldrich, USA.
The Fourier transform-infrared (FT-IR) spectra were recorded on a Perkin Elmer 100 FT-IR spectrometer.
Solid samples were embedded in KBr disc. The field emission scanning electron microscopy (FE-SEM) used in this
work was done using a NanoSem 230 microscope. Ultraviolet-Visible (UV-Vis) spectra were obtained on a Varian
Cary 5000 UV-Vis spectrometer. Stock solutions were prepared by dissolving 10 mg of each sample in 1 L of N-
methyl-2-pyrrolidone (NMP). Photoluminescence (PL) measurements were performed using a Varian Cary Eclipse
Fluorescence Spectrometer. The excitation wavelength was that of the UV absorption maximum of each sample.
Powder X-ray diffraction patterns were recorded at room temperature by monitoring the diffraction angle 2(θ) from
10 to 70° as the standard on a Rich Siefert (Model 3000) X-ray powder diffractometer. Thermo gravimetric analysis
was carried out using the DSTA 409 PC analyzer (Netzsch Gerateban GmbH). For electrochemical measurements,
cyclic voltammetry (CV) was carried out using a Versa STAT3 AMETEK Model (Princeton Applied Research, USA)
potentiostat/galvanostat employing a standard three electrode electrochemical cell. This consisted of samples on
glassy carbon (GC) with a diameter of 3 mm as the working electrode, Ag/AgCl reference electrode and platinum
gauze as the counter electrode. Experiments were carried out at room temperature in 1 M H2SO4 electrolyte solution.
Either nitrogen or oxygen gas was used to purge the solution to achieve an oxygen-free or an oxygen-saturated
electrolyte solution, respectively. All potentials are reported relative to Ag/AgCl (in saturated KCl) reference
electrode recorded at a scan rate of 5 mVs−1. The potential window for cycling was confined between −0.2 V and
+1.0 V in acidic electrolyte. The GC electrode was polished with alumina slurry prior to use to obtain a mirror-like
surface. Samples (2.0 mg) were dispersed in NMP (0.2 mL) and aliquots of the suspension (10 µL) were coated on
GC electrodes and dried under reduced pressure (0.5 mmHg) for 24 h at 50 °C. Nafion (5%, 5 µL) in ethanol was
pipetted onto the sample/GC electrode and allowed to dry at laboratory conditions for 2 hrs.
2.2 Synthesis of cerium oxide doped PANI/TiO2 nanocomposites
Initially the effect of cerium oxide on pure PANI was studied by varying the weight% (wt%) of cerium nitrate
with 1, 3, 5 and 7 wt%, respectively. We arrived to a conclusion that 5 wt% cerium nitrate doped PANI exhibited
better absorption as well as emission properties. So in order to achieve emission as well as supercapacitance in the
composite, we extended our work to study the doping effect of TiO2 (1–7 wt%) in the 5 wt% Ce(NO3)3 doped PANI.
Aniline was stirred in 150 mL 1 M HCl and then 5 wt% cerium nitrate was added to the above mixture and stirred for
30 min. In another beaker, calculated weight percentage of TiO2 and CTAB was sonicated in 1 M HCl in order to
avoid agglomeration of TiO2. To this TiO2 solution, aniline and cerium nitrate mixture was added and maintained
ISSN(Online): 2319-8753
ISSN (Print): 2347-6710
International Journal of Innovative Research in Science,
Engineering and Technology (An ISO 3297: 2007 Certified Organization)
Vol. 4, Issue 11, November 2015
Copyright to IJIRSET DOI:10.15680/IJIRSET.2015.0411066 11215
3500 2800 2100 1400 700
5
10
15
20
25
(d)
(c)
(b)
~1480
1295
Wavenumber (), cm1
1571
1233
1119
798
Tra
nsm
itta
nce (
%)
~3475
(a)
under ultra sonication for 30 min. Then ammonium persulfate (APS, 2.5 mmol) in 30 mL of 1 M HCl solution was
slowly added drop by drop into the above mixture with constant stirring. Polymerization of aniline started after about
5 min, and then the reaction was allowed to stir overnight. The mixture was diluted by 200 mL of deionized water.
The precipitated composite was collected by filtration, repeatedly washed with water and ethanol until the filtrate
became colorless and dried at 60 °C for 12 h in a vacuum oven. For comparison, pure PANI was also synthesized
through the aforesaid chemical process without the presence of TiO2 suspension. After having been dried under
vacuum at 60 °C for 12 h, the PANI powder was obtained.
III. RESULTS AND DISCUSSION
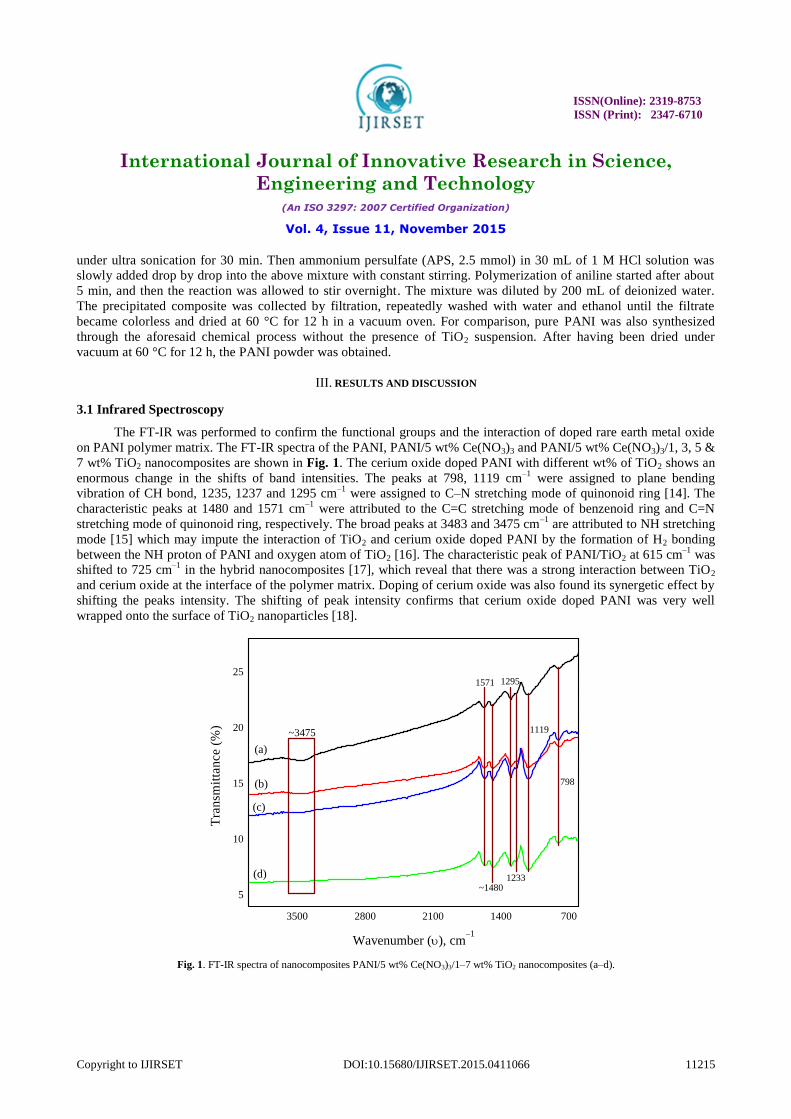
3.1 Infrared Spectroscopy
The FT-IR was performed to confirm the functional groups and the interaction of doped rare earth metal oxide
on PANI polymer matrix. The FT-IR spectra of the PANI, PANI/5 wt% Ce(NO3)3 and PANI/5 wt% Ce(NO3)3/1, 3, 5 &
7 wt% TiO2 nanocomposites are shown in Fig. 1. The cerium oxide doped PANI with different wt% of TiO2 shows an
enormous change in the shifts of band intensities. The peaks at 798, 1119 cm–1
were assigned to plane bending
vibration of CH bond, 1235, 1237 and 1295 cm–1
were assigned to C–N stretching mode of quinonoid ring [14]. The
characteristic peaks at 1480 and 1571 cm–1
were attributed to the C=C stretching mode of benzenoid ring and C=N
stretching mode of quinonoid ring, respectively. The broad peaks at 3483 and 3475 cm–1
are attributed to NH stretching
mode [15] which may impute the interaction of TiO2 and cerium oxide doped PANI by the formation of H2 bonding
between the NH proton of PANI and oxygen atom of TiO2 [16]. The characteristic peak of PANI/TiO2 at 615 cm–1
was
shifted to 725 cm–1
in the hybrid nanocomposites [17], which reveal that there was a strong interaction between TiO2
and cerium oxide at the interface of the polymer matrix. Doping of cerium oxide was also found its synergetic effect by
shifting the peaks intensity. The shifting of peak intensity confirms that cerium oxide doped PANI was very well
wrapped onto the surface of TiO2 nanoparticles [18].
Fig. 1. FT-IR spectra of nanocomposites PANI/5 wt% Ce(NO3)3/1–7 wt% TiO2 nanocomposites (a–d).
ISSN(Online): 2319-8753
ISSN (Print): 2347-6710
International Journal of Innovative Research in Science,
Engineering and Technology (An ISO 3297: 2007 Certified Organization)
Vol. 4, Issue 11, November 2015
Copyright to IJIRSET DOI:10.15680/IJIRSET.2015.0411066 11216
300 450 600 750 9000.00
0.25
0.50
0.75
1.00
(d)
(c)
(b)
Ab
sob
ance
Wavelength (), nm
(a)
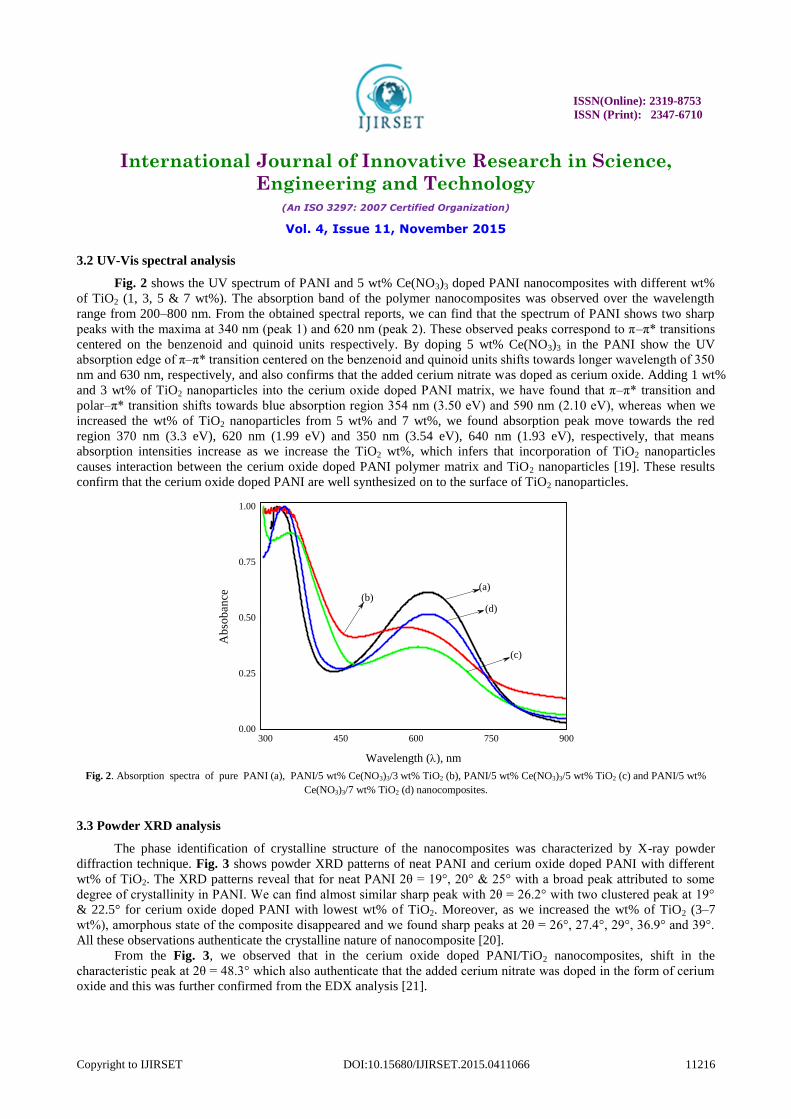
3.2 UV-Vis spectral analysis
Fig. 2 shows the UV spectrum of PANI and 5 wt% Ce(NO3)3 doped PANI nanocomposites with different wt%
of TiO2 (1, 3, 5 & 7 wt%). The absorption band of the polymer nanocomposites was observed over the wavelength
range from 200–800 nm. From the obtained spectral reports, we can find that the spectrum of PANI shows two sharp
peaks with the maxima at 340 nm (peak 1) and 620 nm (peak 2). These observed peaks correspond to π–π* transitions
centered on the benzenoid and quinoid units respectively. By doping 5 wt% Ce(NO3)3 in the PANI show the UV
absorption edge of π–π* transition centered on the benzenoid and quinoid units shifts towards longer wavelength of 350
nm and 630 nm, respectively, and also confirms that the added cerium nitrate was doped as cerium oxide. Adding 1 wt%
and 3 wt% of TiO2 nanoparticles into the cerium oxide doped PANI matrix, we have found that π–π* transition and
polar–π* transition shifts towards blue absorption region 354 nm (3.50 eV) and 590 nm (2.10 eV), whereas when we
increased the wt% of TiO2 nanoparticles from 5 wt% and 7 wt%, we found absorption peak move towards the red
region 370 nm (3.3 eV), 620 nm (1.99 eV) and 350 nm (3.54 eV), 640 nm (1.93 eV), respectively, that means
absorption intensities increase as we increase the TiO2 wt%, which infers that incorporation of TiO2 nanoparticles
causes interaction between the cerium oxide doped PANI polymer matrix and TiO2 nanoparticles [19]. These results
confirm that the cerium oxide doped PANI are well synthesized on to the surface of TiO2 nanoparticles.
Fig. 2. Absorption spectra of pure PANI (a), PANI/5 wt% Ce(NO3)3/3 wt% TiO2 (b), PANI/5 wt% Ce(NO3)3/5 wt% TiO2 (c) and PANI/5 wt%
Ce(NO3)3/7 wt% TiO2 (d) nanocomposites.
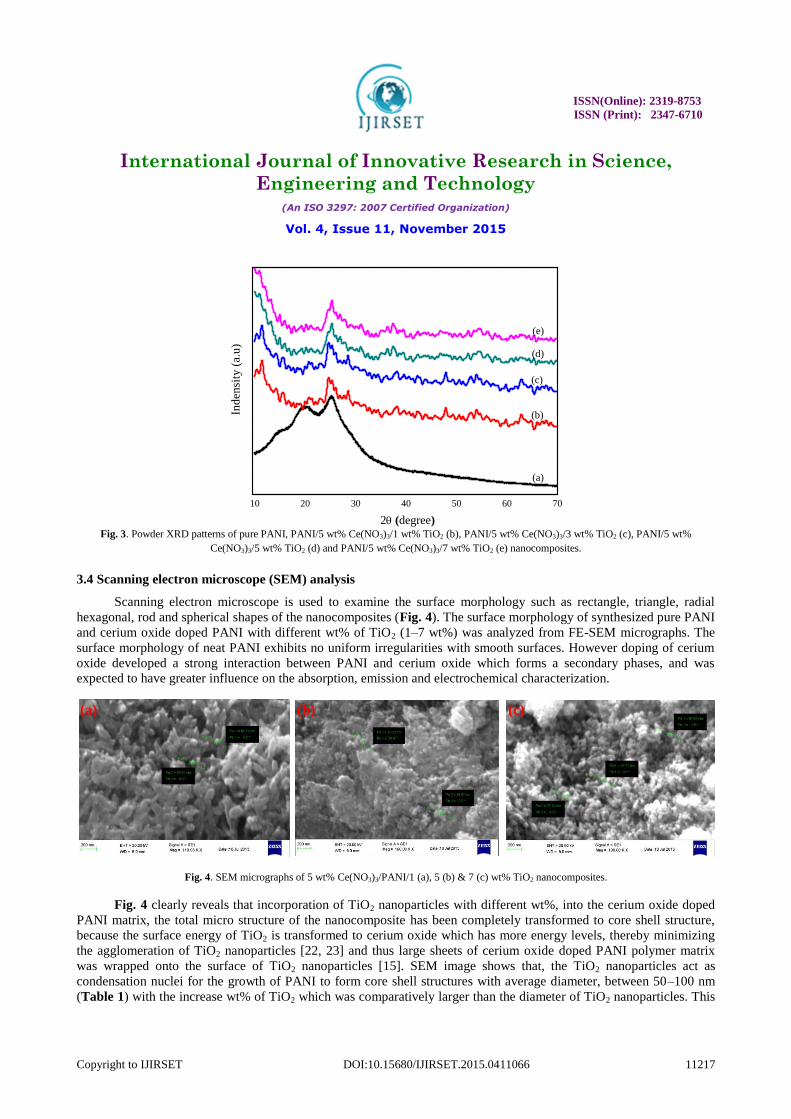
3.3 Powder XRD analysis
The phase identification of crystalline structure of the nanocomposites was characterized by X-ray powder
diffraction technique. Fig. 3 shows powder XRD patterns of neat PANI and cerium oxide doped PANI with different
wt% of TiO2. The XRD patterns reveal that for neat PANI 2θ = 19°, 20° & 25° with a broad peak attributed to some
degree of crystallinity in PANI. We can find almost similar sharp peak with 2θ = 26.2° with two clustered peak at 19°
& 22.5° for cerium oxide doped PANI with lowest wt% of TiO2. Moreover, as we increased the wt% of TiO2 (3–7
wt%), amorphous state of the composite disappeared and we found sharp peaks at 2θ = 26°, 27.4°, 29°, 36.9° and 39°.
All these observations authenticate the crystalline nature of nanocomposite [20].
From the Fig. 3, we observed that in the cerium oxide doped PANI/TiO2 nanocomposites, shift in the
characteristic peak at 2θ = 48.3° which also authenticate that the added cerium nitrate was doped in the form of cerium
oxide and this was further confirmed from the EDX analysis [21].
ISSN(Online): 2319-8753
ISSN (Print): 2347-6710
International Journal of Innovative Research in Science,
Engineering and Technology (An ISO 3297: 2007 Certified Organization)
Vol. 4, Issue 11, November 2015
Copyright to IJIRSET DOI:10.15680/IJIRSET.2015.0411066 11217
10 20 30 40 50 60 70
(e)
(d)
(c)
(b)Ind
en
sity
(a.u
)
2 (degree)
(a)
Fig. 3. Powder XRD patterns of pure PANI, PANI/5 wt% Ce(NO3)3/1 wt% TiO2 (b), PANI/5 wt% Ce(NO3)3/3 wt% TiO2 (c), PANI/5 wt%
Ce(NO3)3/5 wt% TiO2 (d) and PANI/5 wt% Ce(NO3)3/7 wt% TiO2 (e) nanocomposites.
3.4 Scanning electron microscope (SEM) analysis
Scanning electron microscope is used to examine the surface morphology such as rectangle, triangle, radial
hexagonal, rod and spherical shapes of the nanocomposites (Fig. 4). The surface morphology of synthesized pure PANI
and cerium oxide doped PANI with different wt% of TiO2 (1–7 wt%) was analyzed from FE-SEM micrographs. The
surface morphology of neat PANI exhibits no uniform irregularities with smooth surfaces. However doping of cerium
oxide developed a strong interaction between PANI and cerium oxide which forms a secondary phases, and was
expected to have greater influence on the absorption, emission and electrochemical characterization.
(a) (b) (c)
Fig. 4. SEM micrographs of 5 wt% Ce(NO3)3/PANI/1 (a), 5 (b) & 7 (c) wt% TiO2 nanocomposites.
Fig. 4 clearly reveals that incorporation of TiO2 nanoparticles with different wt%, into the cerium oxide doped
PANI matrix, the total micro structure of the nanocomposite has been completely transformed to core shell structure,
because the surface energy of TiO2 is transformed to cerium oxide which has more energy levels, thereby minimizing
the agglomeration of TiO2 nanoparticles [22, 23] and thus large sheets of cerium oxide doped PANI polymer matrix
was wrapped onto the surface of TiO2 nanoparticles [15]. SEM image shows that, the TiO2 nanoparticles act as
condensation nuclei for the growth of PANI to form core shell structures with average diameter, between 50–100 nm
(Table 1) with the increase wt% of TiO2 which was comparatively larger than the diameter of TiO2 nanoparticles. This
ISSN(Online): 2319-8753
ISSN (Print): 2347-6710
International Journal of Innovative Research in Science,
Engineering and Technology (An ISO 3297: 2007 Certified Organization)
Vol. 4, Issue 11, November 2015
Copyright to IJIRSET DOI:10.15680/IJIRSET.2015.0411066 11218
remarkable increase in the diameter of the core shell structure, roughness in the surface morphology confirms the
formation of nanocomposites [24].
SEM image further confirms the strong interaction between TiO2 and cerium doped PANI where cerium oxide
also strongly bonded with TiO2 nanoparticles in between the interfaces as a conducting bridge between PANI and TiO2,
thus forms a Sandwitched structure [20]. The sufficient interaction between the interfaces of TiO2 and cerium oxide
doped PANI matrix furtherance the electron transfer during photo-catalytic reactions.
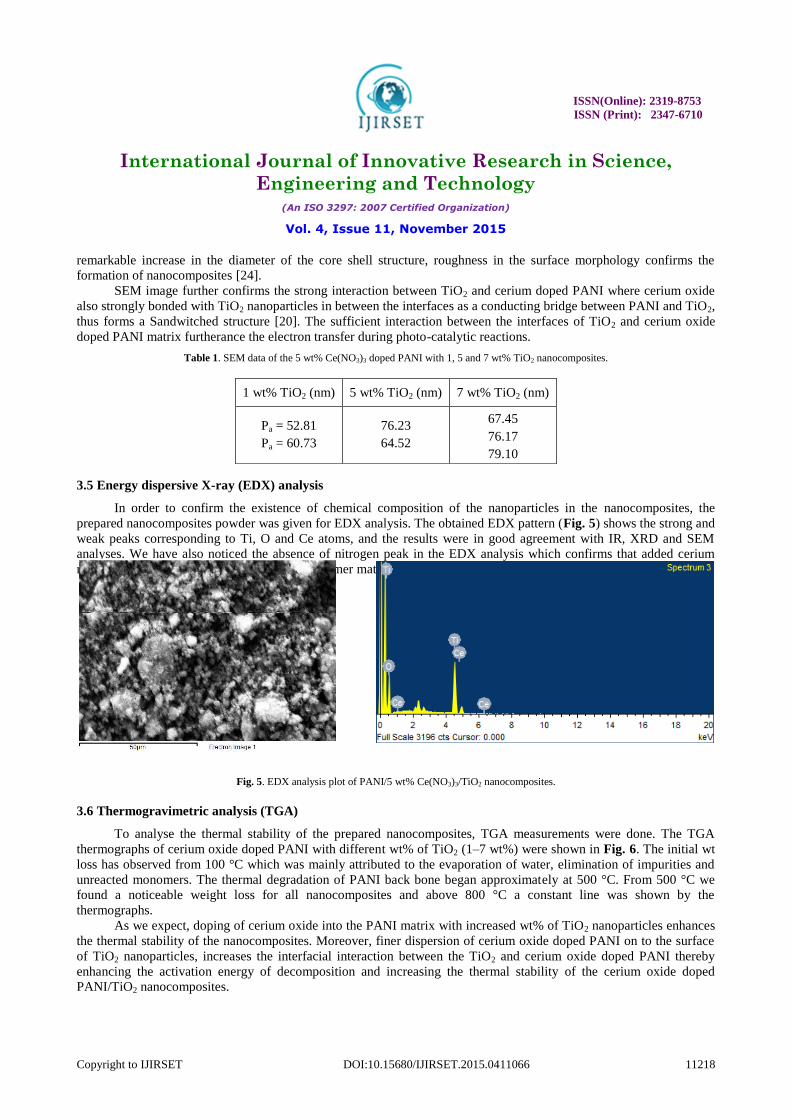
Table 1. SEM data of the 5 wt% Ce(NO3)3 doped PANI with 1, 5 and 7 wt% TiO2 nanocomposites.
3.5 Energy dispersive X-ray (EDX) analysis
In order to confirm the existence of chemical composition of the nanoparticles in the nanocomposites, the
prepared nanocomposites powder was given for EDX analysis. The obtained EDX pattern (Fig. 5) shows the strong and
weak peaks corresponding to Ti, O and Ce atoms, and the results were in good agreement with IR, XRD and SEM
analyses. We have also noticed the absence of nitrogen peak in the EDX analysis which confirms that added cerium
nitrate was doped as cerium oxide in PANI polymer matrix, which was in good agreement with the XRD results.
Fig. 5. EDX analysis plot of PANI/5 wt% Ce(NO3)3/TiO2 nanocomposites.
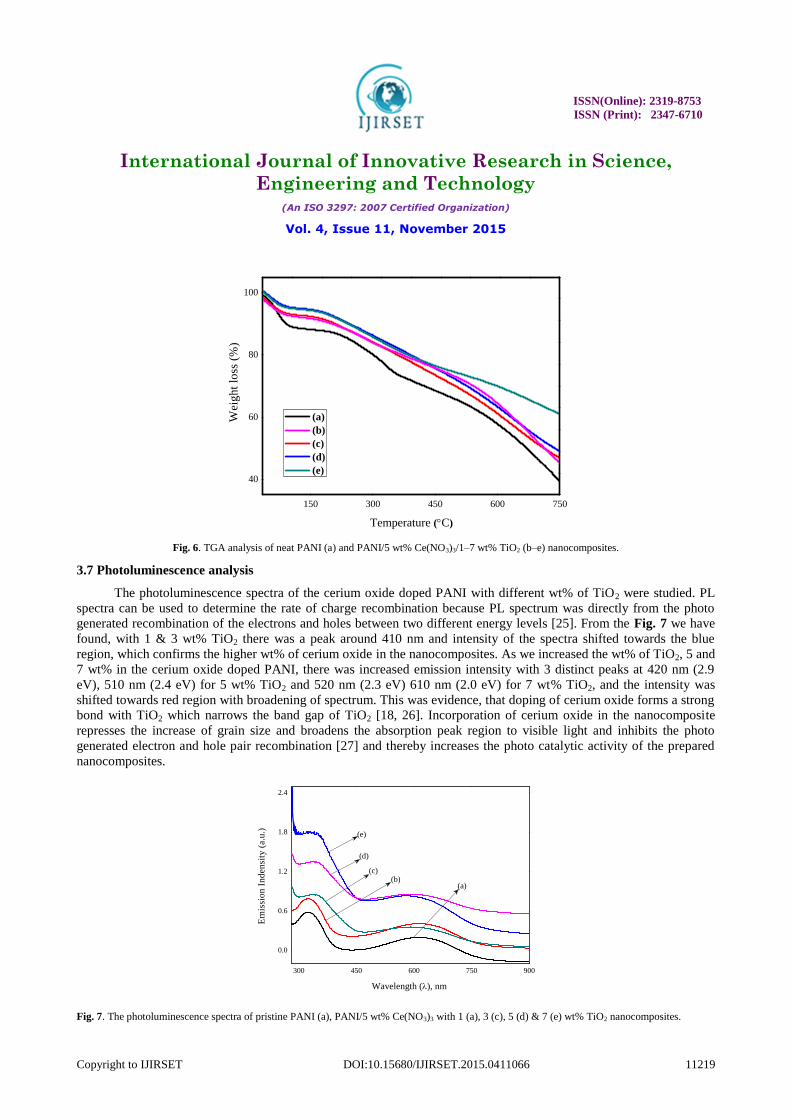
3.6 Thermogravimetric analysis (TGA)
To analyse the thermal stability of the prepared nanocomposites, TGA measurements were done. The TGA
thermographs of cerium oxide doped PANI with different wt% of TiO2 (1–7 wt%) were shown in Fig. 6. The initial wt
loss has observed from 100 °C which was mainly attributed to the evaporation of water, elimination of impurities and
unreacted monomers. The thermal degradation of PANI back bone began approximately at 500 °C. From 500 °C we
found a noticeable weight loss for all nanocomposites and above 800 °C a constant line was shown by the
thermographs.
As we expect, doping of cerium oxide into the PANI matrix with increased wt% of TiO2 nanoparticles enhances
the thermal stability of the nanocomposites. Moreover, finer dispersion of cerium oxide doped PANI on to the surface
of TiO2 nanoparticles, increases the interfacial interaction between the TiO2 and cerium oxide doped PANI thereby
enhancing the activation energy of decomposition and increasing the thermal stability of the cerium oxide doped
PANI/TiO2 nanocomposites.
1 wt% TiO2 (nm) 5 wt% TiO2 (nm) 7 wt% TiO2 (nm)
Pa = 52.81
Pa = 60.73
76.23
64.52
67.45
76.17
79.10
ISSN(Online): 2319-8753
ISSN (Print): 2347-6710
International Journal of Innovative Research in Science,
Engineering and Technology (An ISO 3297: 2007 Certified Organization)
Vol. 4, Issue 11, November 2015
Copyright to IJIRSET DOI:10.15680/IJIRSET.2015.0411066 11219
150 300 450 600 750
40
60
80
100
Wei
gh
t lo
ss (
%)
Temperature (C)
(a)
(b)
(c)
(d)
(e)
300 450 600 750 900
0.0
0.6
1.2
1.8
2.4
(e)
(d)
(c)(b)
Em
issi
on
In
den
sity
(a.u
.)
Wavelength (), nm
(a)
Fig. 6. TGA analysis of neat PANI (a) and PANI/5 wt% Ce(NO3)3/1–7 wt% TiO2 (b–e) nanocomposites.
3.7 Photoluminescence analysis
The photoluminescence spectra of the cerium oxide doped PANI with different wt% of TiO2 were studied. PL
spectra can be used to determine the rate of charge recombination because PL spectrum was directly from the photo
generated recombination of the electrons and holes between two different energy levels [25]. From the Fig. 7 we have
found, with 1 & 3 wt% TiO2 there was a peak around 410 nm and intensity of the spectra shifted towards the blue
region, which confirms the higher wt% of cerium oxide in the nanocomposites. As we increased the wt% of TiO2, 5 and
7 wt% in the cerium oxide doped PANI, there was increased emission intensity with 3 distinct peaks at 420 nm (2.9
eV), 510 nm (2.4 eV) for 5 wt% TiO2 and 520 nm (2.3 eV) 610 nm (2.0 eV) for 7 wt% TiO2, and the intensity was
shifted towards red region with broadening of spectrum. This was evidence, that doping of cerium oxide forms a strong
bond with TiO2 which narrows the band gap of TiO2 [18, 26]. Incorporation of cerium oxide in the nanocomposite
represses the increase of grain size and broadens the absorption peak region to visible light and inhibits the photo
generated electron and hole pair recombination [27] and thereby increases the photo catalytic activity of the prepared
nanocomposites.
Fig. 7. The photoluminescence spectra of pristine PANI (a), PANI/5 wt% Ce(NO3)3 with 1 (a), 3 (c), 5 (d) & 7 (e) wt% TiO2 nanocomposites.
ISSN(Online): 2319-8753
ISSN (Print): 2347-6710
International Journal of Innovative Research in Science,
Engineering and Technology (An ISO 3297: 2007 Certified Organization)
Vol. 4, Issue 11, November 2015
Copyright to IJIRSET DOI:10.15680/IJIRSET.2015.0411066 11220
-0.2 0.0 0.2 0.4 0.6 0.8 1.0
-0.830
-0.415
0.000
0.415
0.830
1.245
(e)(d)
(c)
(b)
Cu
rrre
nt
(mA
)
Potential (V)
(a)
The reasons for largest red shift in the cerium oxide doped PANI/TiO2 nanocomposites, was that the band gap of
TiO2 was decreased with the development of new electronic state and doping of cerium oxide had caused the energy
transfer with TiO2 conduction or valence band due to the transition of the electrons situated in the inner 4f to 5d orbital
(4f–5d transition) or to other 4s orbital (4f–4f transition) [28, 29].
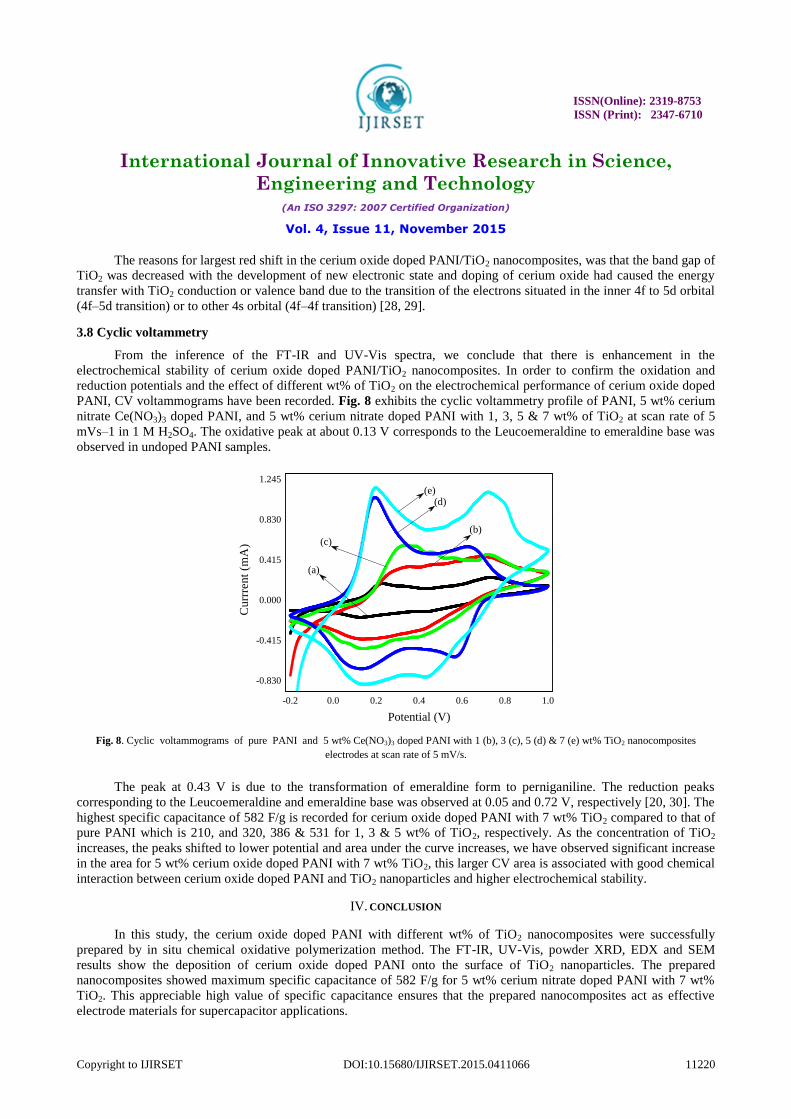
3.8 Cyclic voltammetry
From the inference of the FT-IR and UV-Vis spectra, we conclude that there is enhancement in the
electrochemical stability of cerium oxide doped PANI/TiO2 nanocomposites. In order to confirm the oxidation and
reduction potentials and the effect of different wt% of TiO2 on the electrochemical performance of cerium oxide doped
PANI, CV voltammograms have been recorded. Fig. 8 exhibits the cyclic voltammetry profile of PANI, 5 wt% cerium
nitrate Ce(NO3)3 doped PANI, and 5 wt% cerium nitrate doped PANI with 1, 3, 5 & 7 wt% of TiO2 at scan rate of 5
mVs–1 in 1 M H2SO4. The oxidative peak at about 0.13 V corresponds to the Leucoemeraldine to emeraldine base was
observed in undoped PANI samples.
Fig. 8. Cyclic voltammograms of pure PANI and 5 wt% Ce(NO3)3 doped PANI with 1 (b), 3 (c), 5 (d) & 7 (e) wt% TiO2 nanocomposites
electrodes at scan rate of 5 mV/s.
The peak at 0.43 V is due to the transformation of emeraldine form to perniganiline. The reduction peaks
corresponding to the Leucoemeraldine and emeraldine base was observed at 0.05 and 0.72 V, respectively [20, 30]. The
highest specific capacitance of 582 F/g is recorded for cerium oxide doped PANI with 7 wt% TiO2 compared to that of
pure PANI which is 210, and 320, 386 & 531 for 1, 3 & 5 wt% of TiO2, respectively. As the concentration of TiO2
increases, the peaks shifted to lower potential and area under the curve increases, we have observed significant increase
in the area for 5 wt% cerium oxide doped PANI with 7 wt% TiO2, this larger CV area is associated with good chemical
interaction between cerium oxide doped PANI and TiO2 nanoparticles and higher electrochemical stability.
IV. CONCLUSION
In this study, the cerium oxide doped PANI with different wt% of TiO2 nanocomposites were successfully
prepared by in situ chemical oxidative polymerization method. The FT-IR, UV-Vis, powder XRD, EDX and SEM
results show the deposition of cerium oxide doped PANI onto the surface of TiO2 nanoparticles. The prepared
nanocomposites showed maximum specific capacitance of 582 F/g for 5 wt% cerium nitrate doped PANI with 7 wt%
TiO2. This appreciable high value of specific capacitance ensures that the prepared nanocomposites act as effective
electrode materials for supercapacitor applications.

ISSN(Online): 2319-8753
ISSN (Print): 2347-6710
International Journal of Innovative Research in Science,
Engineering and Technology (An ISO 3297: 2007 Certified Organization)
Vol. 4, Issue 11, November 2015
Copyright to IJIRSET DOI:10.15680/IJIRSET.2015.0411066 11221
REFERENCES
[1] Dunn, B., Kamath, H., and Tarascon, J. -M., “Electrical Energy Storage for the Grid: A Battery of Choices”, Science, vol.334, pp.928–935,
2011.
[2] Liu, R., Duay, J., and Lee, S. B., “Heterogeneous nanostructured electrode materials for electrochemical energy storage”, Chem. Commun.
vol.47, pp.1384–1404, 2011.
[3] Conway, B. E., Birss, V., and Wojtowicz, J., “The role and utilization of pseudocapacitance for energy storage by supercapacitors”, J. Power
Sources, vol.66, pp.1–14, 1997.
[4] Girija, T. C., and Sangaranarayanan, M. V., “Analysis of polyaniline-based nickel electrodes for electrochemical supercapacitors”, J. Power
Sources, vol.156, pp.705–711, 2006.
[5] Li, G. -R., Feng, Z. -P., Zhong, J. -H., Wang, Z. -L., and Tong, Y. -X., “Electrochemical synthesis of polyaniline nanobelts with predominant
electrochemical performances”, Macromolecules, vol.43, pp.2178–2183, 2010.
[6] Sugimoto, W., Iwata, H., Yokoshima K., Murakami, Y., and Takasu, Y., “Proton and Electron Conductivity in Hydrous Ruthenium Oxides
Evaluated by Electrochemical Impedance Spectroscopy: The Origin of Large Capacitance”, J. Phys. Chem. B, vol.109, pp.7330–7338, 2005.
[7] Frackowiak, E., Khomenko, V., Jurewicz, K., Lota, K., and Béguin, F., “Supercapacitors based on conducting polymers/nanotubes
composites”, J. Power Sources, vol.153, pp.413–418, 2006.
[8] Simon, P., and Gogotsi, Y., “Materials for electrochemical capacitors”, Nat. Mater. vol.7, pp.845–854, 2008.
[9] Woo, S. -W., Dokko, K., Nakano, H., and Kanamura, K., “Incorporation of polyaniline into macropores of three-dimensionally ordered macroporous carbon electrode for electrochemical capacitors”, J. Power Sources, vol.190, pp.596–600, 2009.
[10] Kim, B. C., Kwon, J. S., Ko, J. M., Park, J. H., Too, C. O., and Wallace, G. G., “Preparation and enhanced stability of flexible supercapacitor
prepared from Nafion/polyaniline nanofiber”, Synth. Met. vol.160, pp.94–98, 2010.
[11] Ansari, M. O., Khan, M. M., Ansari, S. A., Raju, K., Lee, J., and Cho, M. H., “Enhanced Thermal Stability under DC Electrical Conductivity Retention and Visible Light Activity of Ag/TiO2@Polyaniline Nanocomposite Film”, ACS Appl. Mater. Interfaces, vol.6, pp.8124–8133, 2014.
[12] Kalathil, S., Khan, M. M., Ansari, S. A., Lee, J., and Cho, M. H., “Band gap narrowing of titanium dioxide (TiO2) nanocrystals by electrochemically active biofilms and their visible light activity”, Nanoscale, vol.5, pp.6323–6326, 2013.
[13] Khan, M. M., Ansari, S. A., Amal, M. I., Lee, J., and Cho, M. H., “Highly visible light active Ag@TiO2 nanocomposites synthesized using an electrochemically active biofilm: a novel biogenic approach”, Nanoscale, vol.5, pp.4427–4435, 2013.
[14] Tan, Y., Zhang, Y., and Kan, J., “Synthesis and properties on polyaniline in the presence of nickel chloride”, Express Polym. Lett. vol.3, pp.333–339, 2009.
[15] Xu, J. -C., Liu, W. -M., and Li, H. -L., “Titanium dioxide doped polyaniline”, Mater. Sci. Eng. vol.25, pp.444–447, 2005.
[16] Olad, A., Behboudi, S., and Entezami, A. A., “Preparation, characterization and photocatalytic activity of TiO2/polyaniline core-shell
nanocomposite”, Bull. Mater. Sci. vol.35, pp.801–809, 2012.
[17] Li, X., Chen, W., Bian, C., He, J., Xu, N., and Xue, G., “Surface modification of TiO2 nanoparticles by polyaniline”, Appl. Surface Sci.
vol.217, pp.16–22, 2003.
[18] Deivanayaki, S., Ponnuswamy, V., Ashokan, S., Jayamurugan, P., and Mariappan, R., “Synthesis and characterization of TiO2-doped
Polyaniline nanocomposites by chemical oxidation method”, Mater. Sci. Semicon. Proc. vol.16, pp.554–559, 2013.
[19] Amarnath, C. A., Chang, J. H., Kim, D., Mane, R. S., Han, S. -H., and Sohn, D., “Electrochemical supercapacitor application of electroless
surface polymerization of polyaniline nanostructures”, Mater. Chem. Phys. vol.113, pp.14–17, 2009.
[20] Ghosh, D., Giri, S., Kalra, S., and Das, C. K., “Synthesis and Characterisations of TiO2 Coated Multiwalled Carbon
Nanotubes/Graphene/Polyaniline Nanocomposite for Supercapacitor Applications”, Open J. Appl. Sci. vol.2, pp.70–77, 2012.
[21] Bian, C., Yu, A., and Wu, H., “Fibriform polyaniline/nano-TiO2 composite as an electrode material for aqueous redox supercapacitors”,
Electrochem. Commun. vol.11, pp.266–269, 2009.
[22] Xu, Y. -h., Chen, H. -r., Zeng, Z. -x., and Lei, B., “Investigation on mechanism of photocatalytic activity enhancement of nanometer cerium-
doped titania”, Appl. Surf. Sci. vol.252, pp.8565–8570, 2006.
[23] Xiao, J., Peng, T., Li, R., Peng, Z., and Yan, C., “Preparation, phase transformation and photocatalytic activities of cerium-doped mesoporous
titania nanoparticles”, J. Solid State Chem. vol.179, pp.1161–1170, 2006.
[24] Katoch, A., Burkhart, M., Hwang, T., and Kim, S. S., “Synthesis of polyaniline/TiO2 hybrid nanoplates via a sol–gel chemical method”, Chem.
Engg. J. vol.192, pp.262–268, 2012.
[25] Liqiang, J., Xiaojun, S., Weimin, C., Xiaoqian, L., Honggang, F., Haige, H., and Naiying, F., “Photoluminescence of Ce Doped TiO2 Nanoparticles and Their Photocatalytic Activity”, Acta Chim. Sin. vol.61, pp.1241–1245, 2003.
[26] Chen, S. W., Lee, J. M., Lu, K. T., Pao, C. W., Lee, J. F., Chan, T. S., and Chen, J. M., “Band-gap narrowing of TiO2 doped with Ce probed with x-ray absorption spectroscopy”, Appl. Phys. Lett. vol.97, pp.012104, 2010.
[27] Yan, N., Zhu, Z., Zhang, J., Zhao, Z., and Liu, Q., “Preparation and properties of ce-doped TiO2 photocatalyst”, Mater. Res. Bull. vol.47, pp.1869–1873, 2012.
[28] Liu, J., Li, J., Sedhain, A., Lin, J., and Jiang, H., “Structure and photoluminescence study of TiO2 nanoneedle texture along vertically aligned carbon nanofiber arrays”, J. Phys. Chem. C, vol.112, pp.17127–17132, 2008.

ISSN(Online): 2319-8753
ISSN (Print): 2347-6710
International Journal of Innovative Research in Science,
Engineering and Technology (An ISO 3297: 2007 Certified Organization)
Vol. 4, Issue 11, November 2015
Copyright to IJIRSET DOI:10.15680/IJIRSET.2015.0411066 11222
[29] Mercado, C. C., Knorr, F. J., McHale, J. L., Usmani, S. M., Ichimura, A. S., and Saraf, L. V., “Location of hole and electron traps on nanocrystalline anatase TiO2”, J. Phys. Chem. C, vol.116, pp.10796–10804, 2012.
[30] Gao, B., Li, X., Ma, Y., Cao, Y., Hu, Z., Zhang, X., Fu, J., Huo, K., and Chu, P.K., “MnO2–TiO2/C nanocomposite arrays for high-performance supercapacitor electrodes”, Thin Solid Films, vol.584, pp.61–65, 2015.