SYNTHESIS AND CHARACTERISATION OF BI-METALLIC …
82
SYNTHESIS AND CHARACTERISATION OF BI-METALLIC PROMOTED VANADYL PYROPHOSPHATE CATALYSTS USING ULTRASONIC METHOD ADAM LEONG WENG KAI A project report submitted in partial fulfilment of the requirements for the award of Bachelor of Engineering (Hons.) Chemical Engineering Lee Kong Chian Faculty of Engineering and Science Universiti Tunku Abdul Rahman September 2017
Transcript of SYNTHESIS AND CHARACTERISATION OF BI-METALLIC …

SYNTHESIS AND CHARACTERISATION OF BI-METALLIC PROMOTED
VANADYL PYROPHOSPHATE CATALYSTS USING ULTRASONIC
METHOD
ADAM LEONG WENG KAI
A project report submitted in partial fulfilment of the
requirements for the award of Bachelor of Engineering
(Hons.) Chemical Engineering
Lee Kong Chian Faculty of Engineering and Science
Universiti Tunku Abdul Rahman
September 2017

ii
DECLARATION
I hereby declare that this project report is based on my original work except for
citations and quotations which have been duly acknowledged. I also declare that it has
not been previously and concurrently submitted for any other degree or award at
UTAR or other institutions.
Signature :
Name : Adam Leong Weng Kai
ID No. : 13UEB00728
Date : 25/8/2017

iii
APPROVAL FOR SUBMISSION
I certify that this project report entitled “SYNTHESIS AND
CHARACTERISATION OF BI-METALLIC PROMOTED VANADYL
PYROPHOSPHATE CATALYSTS USING ULTRASONIC METHOD” was
prepared by ADAM LEONG WENG KAI has met the required standard for
submission in partial fulfilment of the requirements for the award of Bachelor of
Engineering (Hons.) Chemical Engineering at Universiti Tunku Abdul Rahman.
Approved by,
Signature :
Supervisor : DR. LEONG LOONG KONG
Date :

iv
The copyright of this report belongs to the author under the terms of the
copyright Act 1987 as qualified by Intellectual Property Policy of Universiti Tunku
Abdul Rahman. Due acknowledgement shall always be made of the use of any material
contained in, or derived from, this report.
© 2017, Adam Leong Weng Kai. All right reserved.

v
ACKNOWLEDGEMENTS
I would like to thank everyone who had contributed to the successful completion of
this project. I would like to express my gratitude to my research supervisor, Dr. Leong
Loong Kong for his time and patience in guiding me and providing me invaluable
advice.
Moreover, I would like to thank my parents for their constant support and my
fellow course mates for being helpful and thoughtful during the entire project. I would
also like to extend my gratitude to Mr. Chin Kah Chun and Ms. Kang Jo Yee for their
guidance in carrying out the research. Without their guidance, this research would not
come to completion.

vi
ABSTRACT
Precursors to produce vanadyl pyrophosphate (VPO) catalyst were prepared via
sesquihydrate route using 1-butanol as reducing agent. Sonochemical technique is used
to synthesise the precursor. Precursor is calcined at 460 °C to produce vanadyl
pyrophosphate catalyst. The catalyst showed amorphous structure in X-ray Diffraction
Analysis (XRD) and Fourier-Transform Infrared (FTIR) is used instead to identify the
identity of the catalyst. The presence of P – O and V = O proved that the catalyst
obtained is attributed to vanadyl pyrophosphate phase. Scanning Electron Microscopy
(SEM) shows blocky structure for undoped VPO catalyst and rod-like structure for
cobalt doped catalyst. Cobalt has more prominent promotional effect than copper in
VPO catalyst as the micrograph bi-metallic doped VPO catalyst features the distinctive
rod-like structure similar to cobalt doped VPO catalyst. P/V atomic ratio determined
from Energy Dispersive X-ray (EDX) and Inductively Coupled Plasma – Optical
Emission Spectroscopy (ICP-OES) are in the range of optimal values in producing
vanadyl pyrophosphate catalysts. Cobalt is also more dominant as can be observed
from P/V atomic ratio, the bi-metallic doped VPO catalyst has a P/V atomic ratio that
is closer to cobalt doped VPO catalyst. In redox titration, it can be observed that cobalt
enhances the promotional effect of copper in bi-metallic VPO catalyst where more V5+
phases are formed. Temperature Programming Reduction (TPR) analysis shows a
lower reduction activation energy for bi-metallic doped VPO catalyst and this may be
the synergistic effect between cobalt and copper dopant in VPO catalyst.
vii
TABLE OF CONTENTS
DECLARATION ii
APPROVAL FOR SUBMISSION iii
ACKNOWLEDGEMENTS v
ABSTRACT vi
TABLE OF CONTENTS vii
LIST OF TABLES x
LIST OF FIGURES xi
LIST OF SYMBOLS / ABBREVIATIONS xiii
LIST OF APPENDICES xiv
CHAPTER
1 INTRODUCTION 1
1.1 Definitions of Catalysis 1
1.2 Catalysed Reactions and Non-Catalysed Reactions 1
1.3 Types of Catalyst 2
1.3.1 Homogeneous Catalyst 2
1.3.2 Heterogeneous Catalyst 3
1.3.3 Biocatalyst 4
1.3.4 Desirable Properties of Catalyst 4
1.3.5 Importance of Catalyst 5
1.4 Problem Statement 5
1.5 Aims and Objectives 6
2 LITERATURE REVIEW 7
2.1 Production of Maleic Anhydride from n-Butane 7
2.2 Vanadyl Pyrophosphate Catalyst 8
2.2.1 Structure of Vanadyl Pyrophosphate Catalyst 8

viii
2.2.2 Mechanism of Vanadyl Pyrophosphate Catalyst on
Oxidation of n-Butane to Maleic Anhydride 10
2.3 Vanadyl Pyrophosphate Catalyst Preparation Route 11
2.3.1 Hemihydrate (Aqueous Route) 11
2.3.2 Hemihydrate (Organic Route) 12
2.3.3 Hemihydrate (Dihydrate Route) 12
2.3.4 Sesquihydrate Route 13
2.4 Sonochemical Synthesis 13
2.5 Parameters of Vanadyl Pyrophosphate Catalyst 14
2.5.1 Calcination Duration 14
2.5.2 Calcination Temperature 15
2.5.3 Calcination Environment 15
2.5.4 Doped System 16
2.5.5 P/V Atomic Ratio 16
3 METHODOLOGY 18
3.1 Materials 18
3.2 Methodology 18
3.3 Preparation of Vanadyl Phosphate Dihydrate Precursor 19
3.4 Preparation of Vanadyl Hydrogen Phosphate Sesquihydrate
Precursor 19
3.5 Calcination 19
3.6 Characterisation of Catalyst 20
3.6.1 X-ray Diffraction Analysis (XRD) 20
3.6.2 Redox Titration 22
3.6.3 Scanning Electron Microscope (SEM) 23
3.6.4 Energy Dispersive X-ray (EDX) 24
3.6.5 Temperature Programmed Reduction (TPR) 25
3.6.6 Inductively Coupled Plasma – Optical Emission
Spectroscopy (ICP-OES) 27
3.6.7 Fourier-Transform Infrared (FTIR) 28
4 RESULTS AND DISCUSSION 30

ix
4.1 Introduction 30
4.2 X-Ray Diffraction (XRD) Analysis 30
4.3 Fourier-Transform Infrared Spectroscopy (FTIR) 31
4.4 Scanning Electron Microscope (SEM) 33
4.5 Energy Dispersive X-ray Spectrometry (EDX) 34
4.6 Inductively Coupled Plasma - Optical Emission Spectroscopy
(ICP-OES) 35
4.7 Redox Titration 36
4.8 Temperature-Programmed Reduction (TPR) 37
5 CONCLUSION AND RECOMMENDATIONS 41
5.1 Conclusion 41
5.2 Recommendations 42
REFERENCES 43
APPENDICES 47

x
LIST OF TABLES
Table 2.1: Comparisons between Fixed bed Reactor and Fluidised
Bed Reactor 8
Table 4.1: Compositions of VPO Samples and the Average P/V
Atomic Ratio 34
Table 4.2: P/V Atomic Ratio from ICP-OES 35
Table 4.3: Average Oxidation Number of Vanadium from Redox
Titration 37
Table 4.4: Total amount of O2 removed from the VPOs catalysts. 38

xi
LIST OF FIGURES
Figure 1.1: Energy Profile for Catalysed and Non-catalysed
Process 2
Figure 1.2: Lock and Key Scheme. 4
Figure 2.1: VO6 and PO4 Crystal Structures (blue is vanadium, red
is oxygen, yellow is phosphate) 9
Figure 2.2: Single Ideal VPO Strand 9
Figure 2.3: Proposed Reaction Mechanism on Oxidation of n-
butane to Maleic Anhydride. 10
Figure 3.1: Set-up of Ultrasound Equipment 19
Figure 3.2: Schematics of the X-ray Diffraction. 20
Figure 3.3: Flowchart on the Working Principle of XRD 21
Figure 3.4: Shidmadzu 6000 XRD 22
Figure 3.5: Hitachi S-3400 24
Figure 3.6: Different Radiation Emission During Excitation of
Electrons 25
Figure 3.7: Thermo Electron TPDRO 1100 26
Figure 3.8: A typical ICP-OES Diagram 27
Figure 3.9: Perkin Elmer Optical Emission Spectrometer Optima
7000 DV 28
Figure 3.10: Nicolet iS 10 FTIR Spectrometer 29
Figure 4.1: XRD Patterns of Undoped and Doped VPO Samples 31
Figure 4.2: FTIR Spectra of VPO Samples Undoped and Doped 32
Figure 4.3: SEM Micrographs of (a) VPOBulk (b) VPOCo1% (c)
VPOCu1% (d) VPOCu1%Co1% at ×10000
magnification 33
Figure 4.4: TPR Profiles of VPOs Catalysts 39

xii
Figure 4.5: Comparison of amount of oxygen removed from
catalyst between V4+ and V5+ phases 40

xiii
LIST OF SYMBOLS / ABBREVIATIONS
o-H3PO4 Ortho-phosphoric acid
NH2OH Hydroxylamine
V2O5 Vanadium pentoxide
VPO Vanadium phosphorous oxide, vanadyl pyrophosphate
VOHPO4·0.5H2O Vanadyl Hydrogen Phosphate Hemihydrate
VOHPO4·1.5H2O Vanadyl Hydrogen Phosphate Sesquihydrate
VOPO4·2H2O Vanadyl Phosphate Dihydrate
V3+ Vanadium at oxidation state of +3
V4+ Vanadium at oxidation state of +4
V5+ Vanadium at oxidation state of +5
𝑉3+ Concentration of V3+
𝑉4+ Concentration of V4+
𝑉5+ Concentration of V5+
𝑉𝐴𝑉 Average oxidation number of vanadium
BET Brunauer-Emmett-Teller Analysis
EDX Energy Dispersive X-ray Spectrometry
SEM Scanning Electron Microscope
TPR Temperature-Programmed Reduction
XRD X-ray Diffraction Analysis
L Average crystallite size
K Shape factor of crystallite. About 0.89 for spherical crystals
λ Wavelength of x-ray
β Full Width at Half Maximum
θ Diffraction angle
Tm Temperature maxima
ER Reduction activation energy

xiv
LIST OF APPENDICES
APPENDIX A: Reactant and Dopants Calculations 47
APPENDIX B: Preparation of Solutions Used in Redox Titration 49
APPENDIX C: Redox Titration Procedure 52
APPENDIX D: Preparation of Solutions Used for ICP-OES 54
APPENDIX E: Procedure for ICP-OES Analysis 60
APPENDIX F: P/V Atomic Ratio from ICP-OES analysis 63
APPENDIX G: Calculation for Average Oxidation State of
Vanadium (VAV) 64
APPENDIX H: Calculation for Reduction Activation Energy (Er)
for TPR Analysis 67
APPENDIX I: Calculation for Amount of Oxygen Removed 68

1
CHAPTER 1
1 INTRODUCTION
1.1 Definitions of Catalysis
The history of catalysis dates back to about 200 years ago where the process is
observed on the conversion of starch to glucose catalysed by concentrated acid and
combining hydrogen and oxygen using platinum catalyst. The term “catalysis” is
derived from Greek words “kata” which means down and “lyein” which means loosen.
Swedish chemist, Jons Berzelius believed that catalysis increases the rate of reaction
of a chemical reaction without actually participating in the reaction. This assumes the
catalyst is not consumed during the chemical reaction. This statement is false as quite
often catalyst is consumed during the reaction but regenerated back to its original state
(Mazur, 2001). From the Gold Book, catalysis refers to a process where the rate of
reaction is increased by a substance without changing the overall standard Gibbs
energy change in the reaction (IUPAC, 2014).
1.2 Catalysed Reactions and Non-Catalysed Reactions
Chemical reaction is a process of bond-breaking and bond-forming of reactants and
products. During bond-breaking process, energy is absorbed to break stable bonds
while during bond-forming process, energy is released to form new bonds. In an
exothermic reaction, the energy of the products is lower than the energy of reactants
as energy is released during the process. However, in an endothermic reaction, as
energy is absorbed, the energy of the products is higher than reactants (Farrauto et al.,
2016).
In a catalysed reaction, catalyst is used to provide an alternative reaction
pathway that requires lower activation energy compared to non-catalysed reaction. It
can be seen from Figure 1.1 that catalysed reaction only requires energy, EMn for the
reaction to occur whereas non-catalysed reaction require high activation energy, ENC
for the reaction to take place (Farrauto et al., 2016).

2
Figure 1.1: Energy Profile for Catalysed and Non-catalysed Process
What differs catalyst from reactants is that catalyst will return to its original
state after the reaction. Although catalyst participates in the chemical reaction, catalyst
only merely interact with the reactants to form intermediate species that will proceed
to form the desired product. Catalyst other hand, returns to its original state (Farrauto
et al., 2016).
1.3 Types of Catalyst
Catalyst comes in a variety of forms and compositions. As catalyst is highly specific
to a particular process, many different types of catalyst has been discovered and
employed. Generally, all catalyst falls into one of the three categories: homogeneous,
heterogeneous and biocatalyst.
1.3.1 Homogeneous Catalyst
Catalysts that has the same phase as reactants are known as homogeneous catalyst.
Homogeneous catalysts have many advantages including high selectivity and high
controllability. This is because when the catalyst is same phase as the reactants,
reactants can easily access all the active site even without a mixing system installed.
Moreover, it is also possible to modify and fine-tune the performance of homogeneous
catalyst to increase its selectivity (Chorendorff and Niemantsverdriet, 2003).
However, homogenous catalyst is not common used in the industries due to
difficulties in separating the catalyst from the product. Many separation units available

3
in the market is based on the volatility of the product and in other words, temperature.
Homogeneous catalysts are often sensitive to temperature and will usually decompose
below 150 °C. This limits the application of homogeneous catalyst in the industry
(Chorendorff and Niemantsverdriet, 2003).
Homogenous catalyst is usually used in production of pharmaceutical
components where a catalyst known as ligand is used to increase the selectivity of
organometallic complexes (Chorendorff and Niemantsverdriet, 2003). Other
commercialised applications of homogeneous catalyst typically involve volatile
products that can be separated at low cost (Cole-Hamilton, 2003).
1.3.2 Heterogeneous Catalyst
Unlike homogeneous catalyst which exist same phase as the reactants, heterogeneous
catalyst exists as solid substances. In general, heterogeneous catalyst can be classified
into two categories: unsupported or supported. In a supported heterogeneous catalyst,
active component from the catalyst is well dispersed into a porous and inert support
whereas unsupported heterogeneous catalyst is not dispersed into a support. The
purpose of this support mainly is to increase the effective surface area and maintain
the dispersion of active phase. As effective surface area is related to the number of
catalytic sites available, increase in effective surface area would increase the number
of catalytic sites as well as the rate of reaction. Support can also increase the durability
of catalyst by reducing the collision among the catalyst. Common materials used as
support are Al2O3, zeolites and SiO2 (Farrauto et al., 2016).
Besides supports, selection of active species and promoter also has an effect on
the performance of the catalyst. It is found that Group 8B elements such as iron, cobalt
and nickel and vanadium from Group 5B show great catalytic properties in their metals
or oxides form. However, it is important to know catalyst used in petrochemical
industry often synthesise their catalyst with specific combinations or formulae to
increase their selectivity on the desired reaction. The active species in a catalyst usually
not present in its elementary state, but may be present as an oxide (Farrauto et al.,
2016).
Promoters are added into the catalyst to facilitate the catalytic reaction by the
active species. Promoters can be further divided into structural and electronic
promoters based on their method of promotion. Structural promoter stabilises the
active species dispersion and as well as introducing intercalation in the catalyst to

4
enhance surface area. Electronic promoters on the other hand, improve the surface
reaction (Farrauto et al., 2016).
1.3.3 Biocatalyst
Biocatalyst or more commonly known as enzymes are catalyst that are naturally
produced by living organism. Biocatalyst are normally highly selective due to the
structure which consists of large molecule of protein that has an active site which will
only bind with specific shape of substrate. The process where the substrates are
bounded by the active site according to their shape is known as a “Lock and Key”
scheme as shown in Figure 1.2. However, biocatalyst is very sensitive to heat and only
able to function within a certain narrow temperature range (Chorendorff and
Niemantsverdriet, 2003).
Figure 1.2: Lock and Key Scheme.
The advantages of biocatalysts compared to homogeneous and heterogeneous
catalysts is biocatalysts do not disturb the thermodynamics of the reaction. In addition,
biocatalysts are highly selective, increasing production of desired product (Johannes
et al., 2006).
1.3.4 Desirable Properties of Catalyst
Although a catalyst can increase the rate of reaction, a high rate of reaction does not
always mean it has a yield of desired product. It is dependent on the selectivity of the
catalysts as well. A high selectivity catalyst means that the main reaction is favoured
5
over the side reaction and thus increasing the yield of the desired product. Catalytic
activity should be at maximum at reaction condition. Besides that, durability and
possibility to regenerate are also important to consider (Bartholomew and Farrauto,
2005).
Durability properties is especially important when the reactor used is a
fluidised bed reactor. This is because in fluidised bed reactor, the rate of collision is
very high and catalyst may be eroded after multiple times of collision. As a result, the
operating cost of the plant increases as maintenance or replacement of catalyst has to
be done frequently. To rectify this issue, normally the catalyst is supported to reduce
the number of collision (Yang, 2003).
Catalyst regeneration is unavoidable in many reactions as catalyst can be
deactivated due to many reasons. Regeneration of catalyst can reduce the operating
cost of the plant as catalyst can be regenerated multiple times (Bartholomew and
Farrauto, 2005).
1.3.5 Importance of Catalyst
Chemical reactions in general depends on temperature, pressure, concentration of
reactant as well as the contact time in the reactor. At higher temperature and pressure,
the reactions not only will take place at higher rate but also increase in production.
However, to achieve reasonable rate of reaction, severe operating conditions may
require and this can contribute to increase in operating cost as well as high difficulty
to control. Besides that, temperature of the reactor cannot be as high as possible due
to thermodynamic limitations to conditions under which the products are formed. For
example, to produce ammonia without catalyst, very high temperature is required to
break the triple bond of nitrogen molecule but if temperature exceeds 600 °C, ammonia
will not be produced anymore (Chorendorff and Niemantsverdriet, 2003).
The use of catalyst can reduce the severe operating conditions significantly.
Without catalyst, chemical industry would still be relying on non-catalysed reactions.
Catalyst enables the reaction to take place with a suitable thermodynamic regime,
making the process more economical (Chorendorff and Niemantsverdriet, 2003).
1.4 Problem Statement
Maleic anhydride is a commodity product that is used to produce unsaturated
polyesters and butanediol. The reaction of oxidation of n-butane to maleic anhydride
6
area amongst the most studied in catalysis. As pointed by Ballarini et al. (2006), latest
patent review reported that the highest selectivity and conversion to maleic anhydride
from n-butane is only about 65 % and 86 % respectively.
The low selectivity of the reaction is due to the presence of parallel side
reactions where n-butane undergoes combustion and maleic anhydride produced
undergoes oxidative degradation to produce acetic acid and acrylic acids. Moreover,
when conversion of n-butane to maleic anhydride increases to about 70-80 %, the
selectivity towards maleic anhydride will decrease dramatically. The highly
exothermic reaction also causes catalyst deactivation issue as sintering of catalyst
occurs (Ballarini et al., 2006).
It was found that doping of vanadyl pyrophosphate (VPO) catalyst can actually
improve the performance of the catalyst in oxidation of n-butane. In this project, the
doped catalyst will be characterised to determine its physical, chemical and reactivity
properties.
1.5 Aims and Objectives
The objectives of this project were:
1. To synthesise bulk VPO catalyst, Cu-doped VPO catalysts, Co-doped VPO
catalysts and Cu-Co doped VPO catalysts using sonochemical technique.
2. To study the effect of Cu and Co towards the physical properties, chemical
properties and also the reactivity properties of the synthesised VPO catalyst.

7
CHAPTER 2
2 LITERATURE REVIEW
2.1 Production of Maleic Anhydride from n-Butane
Transition from using benzene as feedstock to n-butane took roughly 15 years and
many earlier maleic acid production plants maintains an interchangeability of
feedstock feature on their reactor to allow interchange of feedstock depending on
economic conditions. The general chemical equation for the primary reaction (2.1) and
secondary reaction (2.2) of oxidation of n-butane to maleic anhydride can be seen
below (Musa, 2016):
C4H10 + 3.5O2 → C4H2O3 + 4H2O (2.1)
C4H2O3 +(6 −m)
2O2
→ mCO + (4 − m)CO2 + H2O (2.2)
Two most common types of reactor used are fixed bed reactor and fluidised
bed reactor. Almost all maleic anhydride process plants are equipped with reactor, gas
cooler, separator, scrubber, condenser and product column collector. When operating
with fixed bed reactor, hotspots in the reactor and composition of feedstock mixture
are important. Severe hotspots in the reactor can reduce catalyst life, increasing
maintenance cost of the plant while monitoring of feedstock composition is required
to ensure the composition is below the flammability limit in air. On the other hand,
fluidised bed reactor which often operate at 360 °C - 460 °C has lesser hotspot problem.
This is because heat generated during the oxidation process can be removed by steam
coil located inside the reactor efficiently as a result of direct contact with fluidised
solid in the reactor (Musa, 2016). Table 2.1 shows comparisons between a fixed bed
reactor and fluidised bed reactor has been reported by Wellauer (1985) in 1985.
As mentioned by Musa (2016), “VPO is the catalyst that change the maleic
anhydride industry”. The catalyst mentioned here is VPO and this catalyst played an
important role in the oxidation process of n-butane to maleic anhydride.

8
Table 2.1: Comparisons between Fixed bed Reactor and Fluidised Bed Reactor
Fixed bed reactor Fluidised bed reactor
Capital Requirement Large Less significant
Design knowledge Clear Emerging
Pressure Drop Major Minor
Back Mixing Insignificant Challenging
Heat Transfer Not good Good
Regeneration of catalyst
during operation Challenging Minor
2.2 Vanadyl Pyrophosphate Catalyst
The term “VPO” has been widely used to represent vanadyl diphosphate and vanadyl
pyrophosphate where both of this compound has the same chemical formula,
(VO)2P2O7. VPO is a type of vanadium oxide catalyst that contains VO6 and PO4 that
sharing the same oxygen bond. Vanadium oxide can exist in +5, +4, +3, and +2
oxidation states but +5 and +4 oxidation states is the active element in the VPO catalyst
that promote the oxidation of n-butane to maleic anhydride (Musa, 2016).
2.2.1 Structure of Vanadyl Pyrophosphate Catalyst
The structure of VPO catalyst originates from two basic structures: VO6 and PO4. The
structure of VO6 is a distorted octahedron where the central vanadium atom is
coordinated to six oxygen atoms. However, as a stronger double bond is present
between vanadium atom to an oxygen atom, the bond length between the vanadium
atom and the oxygen atom is shorter. This creates a distortion in the octahedron as
three ranges of bond length; short, normal and long are present in the octahedron as
shown in Figure 2.1A. Approximate value for bond lengths of short, normal and long
are 1.6 A, 2 A and 2.3 A, respectively (Musa, 2016).
PO4, on the other hand is tetrahedron where the central phosphate atom is
coordinated to four oxygen atoms as shown in Figure 2.1B. As there is no double bond
or triple bond present in the crystal structure, the crystal structure of PO4 is not
distorted and all the bond lengths are equivalent, approximately 1.5 A (Musa, 2016).

9
Figure 2.1: VO6 and PO4 Crystal Structures (blue is vanadium, red is oxygen, yellow
is phosphate)
To produce VPO crystal structure, two VO6 distorted octahedron are bonded
in a trans-oriented manner, which means the two octahedron are at opposite direction.
The four oxygen atoms with the normal bond length to central vanadium are connected
to the PO4 by sharing the oxygen atoms. Two types of VPO general structure prevail:
one consist of single VO6 distorted octahedron and the other consist of a pair of VO6
distorted octahedron as shown in Figure 2.2. From this single individual strand, a more
complex crystalline sheet can be obtained when multiple strand is connected together.
However, presence of impurities and structural defects makes this ideal VPO strand
impossible to exist in VPO catalyst in the industry (Musa, 2016).
Figure 2.2: Single Ideal VPO Strand

10
2.2.2 Mechanism of Vanadyl Pyrophosphate Catalyst on Oxidation of n-
Butane to Maleic Anhydride
A reaction mechanism for oxidation of n-butane to maleic anhydride catalysed by VPO
catalyst as shown in Figure 2.3 was suggested by Busca and Centi in 1989. It was
suggested that the n-butane reaction can have two routes to form maleic anhydride in
the presence of VPO catalyst. Both routes are believed to have equal selectivity over
one another. However, Route A based on Figure 2.3 have a faster rate of reaction
compared to Route B. This is indicated by the enhanced reactivity in the presence of
gaseous oxygen (Musa, 2016).
Figure 2.3: Proposed Reaction Mechanism on Oxidation of n-butane to Maleic
Anhydride.
In Route A, n-butane is first reacted to form butadiene under high temperature
condition. Butadiene is then converted to dihydrofuran intermediate via oxygen
insertion from V5=O. The two double bonds presence in butadiene will be broken and
bond to the same oxygen atom through a process known as electrophilic addition. The
intermediate can then reacted with oxygen labile species, (O*) to form γ-
crotonolactone. However, it is not necessarily to form dihydrofuran intermediate as
butadiene can also directly forms γ-crotonolactone by bonding with (O*) and insertion
of oxygen from V5=O at the same time. Further oxidation of γ-crotonolactone will
yield maleic anhydride. However, γ-crotonolactone can react with butadiene to from

11
phthalic anhydride if the contact time of the intermediate with butadiene is too long
(Musa, 2016).
The second route, Route B begins similar to Route A where n-butane forms
butadiene and forms dihydrofuran subsequently. In Route B, dihydrofuran undergoes
a dehydrogenation process to form furan(I) intermediate which can then be reacted
with (O*) to produce maleic anhydride. Nevertheless, furan(I) intermediate can also
form crotonaldehyde and carbon oxides. This is due to strong Lewis acid site
interactions at the VPO surface, which causes furan(I) intermediate to acts as hydrogen
transfer agent and promotes other hydrocarbon species present in the reaction (Musa,
2016).
Although there have been many other proposed reaction mechanisms of VPO
on oxidation n-butane to maleic anhydride, researchers have yet to find a definite
answer. Even now, researchers are still striving to improve VPO catalyst performance
by investigating different catalyst preparation techniques and composition to have
better understanding on the mechanism.
2.3 Vanadyl Pyrophosphate Catalyst Preparation Route
VPO catalyst can be synthesised by calcination of two types precursors: vanadyl
hydrogen phosphate hemihydrate, VOHPO4·0.5H2O and vanadyl hydrogen phosphate
sesquihydrate, VOHPO4·1.5H2O. Preparation of hydrogen phosphate hemihydrate can
be further divided into three routes: organic, dihydrate and aqueous route.
2.3.1 Hemihydrate (Aqueous Route)
The first method used to produce VPO catalyst precursor is via the aqueous route.
Hydrochloric acid is used in this route to act as reducing agent by reducing V5+ from
vanadium pentoxide to V4+. Several alternative reducing agents had been proposed
such as oxalic acid, lactic acid, phosphoric acid and NH2OH (Jackson and Hargreaves,
2009).
Vanadium pentoxide is first refluxed with hydrochloric acid before adding
phosphoric acid to allow reaction in Equation 2.3 to take place. It was found that the
VPO catalysts prepared using aqueous route have a cubic morphology and a low
surface area (Jackson and Hargreaves, 2009).

12
V2O5 + H3PO4 +HCl → VOHPO4 ∙ 0.5H2O (2.3)
2.3.2 Hemihydrate (Organic Route)
In organic route, V5+ present in vanadium pentoxide is reduced to by V4+ by with
alcohol such as isobutanol and benzyl alcohol. The alcohol servers as both the reducing
agent and organic solvent. After vanadium pentoxide is added with the alcohol, the
mixture is refluxed for an hour, followed by a reaction with phosphoric acid and finally
yielding VOHPO4·0.5H2O as shown in Equation 2.4 (Jackson and Hargreaves, 2009).
V2O5 + H3PO4 +alcohol → VOHPO4 ∙ 0.5H2O (2.4)
VPO catalysts synthesised via organic route were found to have platelet
crystalline morphology and the size of the platelets are depended on the type of organic
solvent used. For example, using isobutanol as the alcohol will cause platelets to lump
together, forming a rosette morphology while using sec-butyl alcohol allows platelets
to form. Moreover, crystal structure of VOHPO4·0.5H2O is also dependant on the type
of solvent. Using alcohol with large molecule such as benzyl alcohol can induce
stacking faults in the platelets which in turn, improves catalyst performance due to
increase in surface area (Benziger et al., 1997).
2.3.3 Hemihydrate (Dihydrate Route)
Dihydrate route is two step procedure which involves reduction of a dihydrate,
VOPO4·2H2O by alcohol to form hemihydrate, VOHPO4·0.5H2O. Water is used as the
solvent in this route instead of alcohol as compared to organic route. Vanadium
pentoxide is first reacted with phosphoric acid to form VOPO4·2H2O in the presence
of water. VOPO4·2H2O is then recovered and dried before proceeding to the second
step. In the second step, VOPO4·2H2O is refluxed with alcohol to form
VOHPO4·0.5H2O (Jackson and Hargreaves, 2009).
Similar to organic route, the crystal structure and morphology is determined by
the type of alcohol used. Dihydrate reflux with primary alcohol has higher tendency to
form rosette structure in the VPO catalyst which have high surface area whereas
secondary alcohol tends to form thick platelet which have lower surface area. The
reaction is shown in Equation 2.5 (Védrine et al., 2013).
13
V2O5 + H3PO4 +H2O → VOPO4 ∙ 2H2O
alcohol → VOHPO4 ∙ 0.5H2O (2.5)
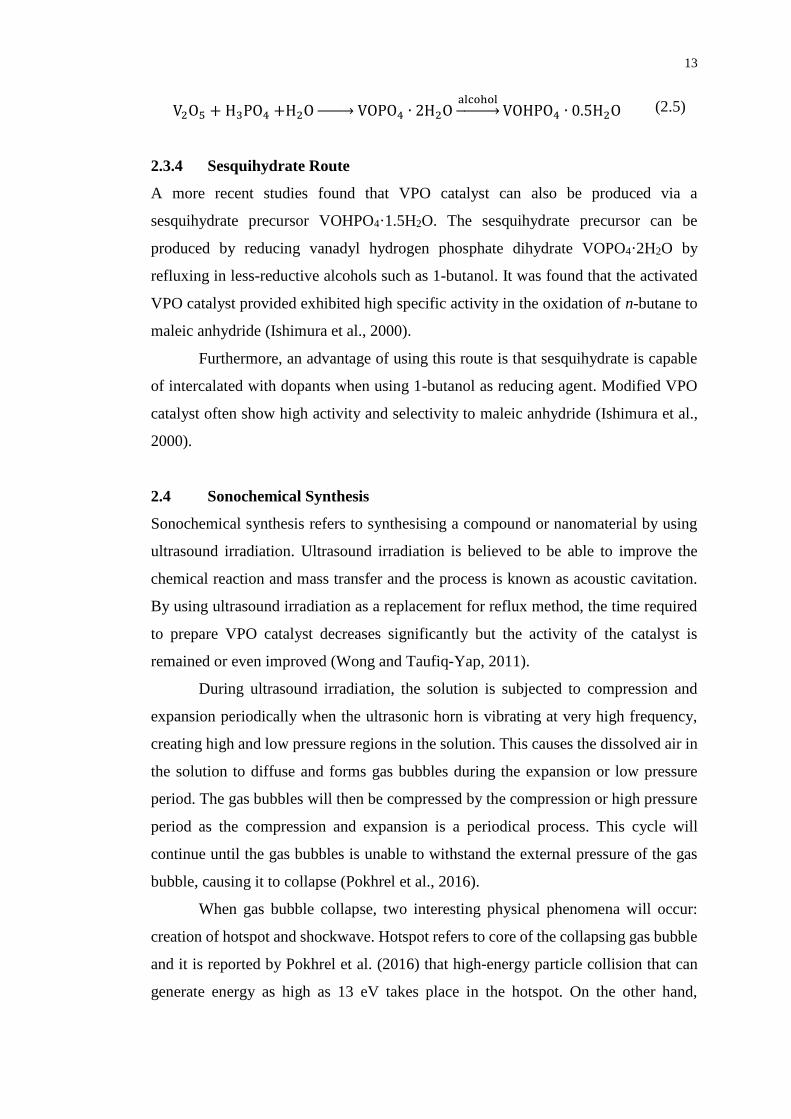
2.3.4 Sesquihydrate Route
A more recent studies found that VPO catalyst can also be produced via a
sesquihydrate precursor VOHPO4·1.5H2O. The sesquihydrate precursor can be
produced by reducing vanadyl hydrogen phosphate dihydrate VOPO4·2H2O by
refluxing in less-reductive alcohols such as 1-butanol. It was found that the activated
VPO catalyst provided exhibited high specific activity in the oxidation of n-butane to
maleic anhydride (Ishimura et al., 2000).
Furthermore, an advantage of using this route is that sesquihydrate is capable
of intercalated with dopants when using 1-butanol as reducing agent. Modified VPO
catalyst often show high activity and selectivity to maleic anhydride (Ishimura et al.,
2000).
2.4 Sonochemical Synthesis
Sonochemical synthesis refers to synthesising a compound or nanomaterial by using
ultrasound irradiation. Ultrasound irradiation is believed to be able to improve the
chemical reaction and mass transfer and the process is known as acoustic cavitation.
By using ultrasound irradiation as a replacement for reflux method, the time required
to prepare VPO catalyst decreases significantly but the activity of the catalyst is
remained or even improved (Wong and Taufiq-Yap, 2011).
During ultrasound irradiation, the solution is subjected to compression and
expansion periodically when the ultrasonic horn is vibrating at very high frequency,
creating high and low pressure regions in the solution. This causes the dissolved air in
the solution to diffuse and forms gas bubbles during the expansion or low pressure
period. The gas bubbles will then be compressed by the compression or high pressure
period as the compression and expansion is a periodical process. This cycle will
continue until the gas bubbles is unable to withstand the external pressure of the gas
bubble, causing it to collapse (Pokhrel et al., 2016).
When gas bubble collapse, two interesting physical phenomena will occur:
creation of hotspot and shockwave. Hotspot refers to core of the collapsing gas bubble
and it is reported by Pokhrel et al. (2016) that high-energy particle collision that can
generate energy as high as 13 eV takes place in the hotspot. On the other hand,

14
implosion of gas bubble will create shock waves that is able to break up particles into
tiny fragments which will further becomes the starting point of further acoustic
cavitation process (Pokhrel et al., 2016).
2.5 Parameters of Vanadyl Pyrophosphate Catalyst
In addition to synthesising catalyst via different routes, various parameters can also
affect the performance of VPO catalyst in the production of maleic anhydride. These
parameters can be modified to improve the activity and selectivity of VPO catalyst.
These parameters include:
Calcination duration
Calcination temperature
Calcination environment
Doped system
P/V atomic ratio
2.5.1 Calcination Duration
Vanadyl phosphate sesquihydrate is a precursor to VPO catalyst. Calcination, a high
temperature heat treatment is required to transform the precursor to the active
component of VPO catalyst, vanadyl pyrophosphate.
Calcination duration is an important parameter because if calcination period is
not sufficiently long, vanadyl phosphate sesquihydrate may not fully transform into
vanadyl pyrophosphate. This can be observed from XRD results where the low
intensity of the peak which signifies low crystallinity structure is obtained. On the
other hand, if the calcination duration is too long, cracking of crystal structure of
catalyst may occur. These problems can result in loss of surface area or catalyst
deactivation (Taufiq-Yap et al., 2012).
The chemical stability of VPO catalyst is also associated with calcination
duration. According to Albonetti et al. (1996), if vanadyl phosphate hemihydrate is
calcined less than 100 hours, it is considered to be non-equilibrated catalyst which is
often poorly crystallised, while equilibrated catalyst which is well crystallised is
obtained if calcined for more than 1000 hours. Non-equilibrated catalyst has not
achieved the minimum Gibbs energy yet, therefore, it is more active than equilibrated
catalyst but selectivity to maleic anhydride from butane is poor (Albonetti et al., 1996).

15
2.5.2 Calcination Temperature
Similar to the calcination duration parameter, calcination temperature should also be
optimum. Calcination at temperature that is too low reduce formation of the active
phase vanadyl pyrophosphate. On the other hand, calcination at temperature that too
high results in sintering of catalyst which decreases the surface area of the catalyst
(Rajan et al., 2014).
The selectivity of VPO catalyst on oxidation of n-butane to maleic anhydride
is dependent on the Lewis acidity of the catalyst. Based on an experiment conducted
by Wang et al. (2010), they have concluded that calcination temperature is associated
with the Lewis acidity of VPO catalyst.
2.5.3 Calcination Environment
According to IUPAC (2014)’s definition of calcination, calcination means heating in
air or oxygen environment. However, this statement is not always true. Calcination
environment can consist of inert or reactive gases. It has been found that calcination
in the presence of mixture of butane and air can yield high performance VPO catalyst
(Cheng and Wang, 1997).
Oxidizing strength of flowing gas is determined by the calcination environment.
It was found that high oxidising strength can increase the vanadium valence of the used
VPO catalyst and in turn, increasing the selectivity of n-butane to maleic anhydride.
Besides that, oxidizing strength is also related to the surface structure of VPO catalyst.
As the oxidising strength of flowing gas increases, the sizes of platelet increases as
well, reducing the surface area. When using inert environment, VPO catalyst can
formed in a short time but do not have good performance in oxidation of n-butane
(Cheng and Wang, 1997).
When calcining non-promoted VPO catalysts, it is recommended to calcined
in a more oxidising environment as non-promoted VPO is less active than promoted
VPO. However, similar to other calcination parameters, oxidation strength should be
intermediate as insufficient oxidation can lead to poor performance VPO while over-
oxidation can decrease number of available V5+ on the surface of the catalyst and
reduce conversion of n-butane (Cheng and Wang, 1997).
16
2.5.4 Doped System
Dopants is an impurity substance that is added on purpose into the compound that have
an effect on the final catalyst either physical, chemical or both. Dopants can be
classified into two categories: promoter and poison. Poison can have negative effect
on the catalyst whereas promoter enhance the properties of the catalyst. VPO catalysts
have been often doped with promoter in order to enhance their performance.
There are three ways in which a promoter can enhance the performance of VPO
catalysts: structural, electronic or both. Structural promotional effects enhance the
performance of VPO catalyst by increasing the surface area of the catalyst. The
promoter prevents the formation of low surface area and inactive phases, VO(H2PO4)2
by acting as a phosphorus scavenger. As pointed by Hutchings (1991), to achieve
optimum performance, the vanadium to phosphorus to promoter atomic ratio should
be within 1:1.15:0.15 to 1:1.20:0.20.
Electronic promotional effects on the other hand do not impose any structural
effect on the catalyst due to low level of promoter in the catalyst structure. The
promotional effects are achieved by a redox mechanism between the bulk and the
surface of VPO catalyst (Hutchings, 1991).
Combination of both structural and electronic promotional effects is possible.
Examples of promoter that exhibit such properties on VPO catalyst is cobalt, iron,
aluminium and lithium. It is observed that VPO catalyst doped with lithium has
increased ionic conductivity properties (Ballarini et al., 2006).
2.5.5 P/V Atomic Ratio
Phosphorus to vanadium, P/V atomic ratio is also another important parameter. It is
found that a small change in P/V atomic ratio can results in different surface nature.
When the P/V atomic ratio is equal to 1:1 and the reaction temperature is 340-400 °C,
highly active phase 𝛼1-VOPO4 is formed over the surface of the catalyst. This highly
active phase has very low selectivity to maleic anhydride. Only at 400-440 °C, the
moderately active phase 𝛿-VOPO4 with good selectivity to maleic anhydride starts to
form. When phosphorus is added in slight excess, the problem will be solved and 𝛿-
VOPO4 forms at 340-440 °C. This is the reason why industrial VPO catalyst for maleic
anhydride production always contains slight excess of phosphorus (Cavani et al., 2010).
According to Bartholomew and Farrauto (2005), the optimal P/V atomic ratio
for VPO catalyst used in oxidation of n-butane should be 1.05. On the other hand,
17
Guliants et al. (1996) concluded that the best VPO catalyst should have P/V atomic
ratio of 1.18. Thus, it is safe to conclude that the optimal P/V atomic ratio should be
within the range of 1.05 to 1.18.

18
CHAPTER 3
3 METHODOLOGY
3.1 Materials
Chemicals involved in the experiment are listed as follows:
1. Vanadium pentoxide (Merck)
2. Ortho-Phosphoric acid
3. 1-butanol
4. Ammonium iron(II) sulphate
5. Sulphur acid
6. Potassium permanganate
7. Diphenylamine
8. Copper(II) nitrate
9. Cobalt(II) nitrate
The gases used are as follows:
1. 0.75 % n-butane in air
2. 99.99 % Purified Nitrogen
3. 99.99 % Purified Helium
4. Liquefied Nitrogen Gas
3.2 Methodology
In this research, performance of bulk VPO, VPO doped with copper, cobalt and both
copper and cobalt was investigated based on their physical characteristics, chemical
properties and reactivity. The VPO catalyst is prepared using sesquihydrate route with
formation of dihydrate as intermediate product. The preparation procedures can be
divided into three stages: preparation of dihydrate, preparation of sesquihydrate and
calcination. Each stage is provided with detailed elaboration on steps taken to prepare
the specimen.

19
3.3 Preparation of Vanadyl Phosphate Dihydrate Precursor
To prepare vanadyl phosphate dihydrate prevursor60.0 g of Vanadium pentoxide,
V2O5 is added with 1440 mL of distilled water and 360 mL of ortho-phosphoric acid,
o-H3PO4 in a 2000 mL beaker and stirred gently using a stirring rod. An ultrasound
probe is then placed into the beaker to provide high intensity of ultrasonic irradiation
to the solution. The ultrasound irradiation will be conducted for a duration of 4 hr. The
resultant yellow precipitate is subjected to centrifugation to recover the yellow solids
from the slurry. The yellow solid is then oven dried at 90 °C for 72 hr. The yellowish
powder obtained is VOPO4·2H2O.
Figure 3.1: Set-up of Ultrasound Equipment
3.4 Preparation of Vanadyl Hydrogen Phosphate Sesquihydrate Precursor
In this stage, VOHPO4·1.5H2O will be synthesised by reducing VOPO4·2H2O in the
presence of reducing agent, 1-butanol. Dopants are added during this stage as well
according to the amount calculated. First, 15.0 g of VOPO4·2H2O from previous stage
are added with 50 mL of 1-butanol and the required amount of dopants in a 100 mL
beaker. The mixture is then stirred before subjected to ultrasound irradiation similar to
previous stage for 4 hr. The resultant blue solids are then centrifuged out from the
slurry and oven dried at 90 °C for 72 hr. The blue solids are VOHPO4·1.5H2O and are
denoted as VPSBulk, VPSCo1%, VPSCu1% and VPSCu1%Co1%.
3.5 Calcination
In this stage, the doped VOHPO4·1.5H2O precursor is placed on 6 boats and a straight
line is carved in at the center of each boat to increase the total surface area in contact

20
with gas. The boats are then arranged onto the holder and placed into a calcination
reactor. Calcination process was conducted for a duration for 24 hr at 460 °C. Vanadyl
pyrophosphate is then collected at the end of calcination process and are denoted as
VPOBulk, VPOCo1%, VPOCu1% and VPOCu1%Co1%
3.6 Characterisation of Catalyst
Various characterisation methods were used to determine the physical, chemical and
reactivity of the synthesised catalyst. The methods used in this research are: X-ray
Diffraction Analysis (XRD), redox titration, Brunauer-Emmett-Teller Analysis (BET),
Scanning Electron Microscope (SEM), Energy Dispersive X-Ray Spectrometry (EDX)
and Temperature-Programmed Reduction (TPR).
3.6.1 X-ray Diffraction Analysis (XRD)
X-ray Diffraction Analysis (XRD) is a high precision x-ray crystallography technique
that allows one to identify the phase composition present in the catalyst. The principle
behind XRD is the interaction between x-ray and crystalline phase in the catalyst,
which produce a diffraction pattern as shown in Figure 3.2. The relationship between
angle of diffraction and atomic distance between crystal lattice can be related through
Bragg Law (Equation 3.1). This technique is a non-destruction method (Stanjek and
Häusler, 2004).
Figure 3.2: Schematics of the X-ray Diffraction.
2𝑑 𝑠𝑖𝑛𝜃 = 𝑛𝜆 (3.1)

21
X-ray diffractometer normally consists of sample holder, x-ray tube and
detector which are mounted on mechanical rotating device known as goniometer. Two
types of goniometer are available: θ:θ and θ:2θ. For θ:θ, the sample holder is fixed
while x-ray tube and detector will move simultaneously to scan over range of θ
specified. On the other hand, in a θ:2θ goniometer mechanical assembly, the x-ray tube
is fixed while sample tube and detector moves. Sample tube rotates with θ while the
detector moves at 2θ as shown in Figure 3.3. The diffracted signal is captured by
detector and processed by a connected computer. The result is presented in a plot of
diffracted intensities versus 2θ. By comparing the peak profile of the sample with
database from Joint Committee on Powder Diffraction Standard (JCPDS), the phase
composition can be determined (Stanjek and Häusler, 2004).
Figure 3.3: Flowchart on the Working Principle of XRD
Average crystallite size inside the particle can be calculated using Scherer’s
Equation (Equation 3.2) (Monshi et al., 2012).
𝐿 =𝐾𝜆
𝛽𝑐𝑜𝑠𝜃
(3.2)
L = Average crystallite size (nm)
K = Shape factor of crystallite. About 0.89 for spherical crystals
λ = Wavelength of x-ray (nm)
β = Full Width at Half Maximum (rad)
θ = Diffraction angle (rad)

22
The XRD equipment used in this project is Shidmadzu 6000 XRD shown in
Figure 3.4. Scanning rate of 1.2 ° per minute with CuKα radiation is used to analyse
the sample. The range of scanning is from 2θ = 2 ° to 60 ° at ambient temperature and
the peak profile of the sample is compared with the JCPDS PDF 1 database version
2.6.
Figure 3.4: Shidmadzu 6000 XRD
3.6.2 Redox Titration
Redox titration is a technique developed in 1982 by Niwa and Murakami to determine
the average oxidation state of vanadium with the assumption that solution contains
only V3+, V4+ and V5+. To be prepare the solution in this research, a known amount of
catalyst is dissolved in sulphuric acid (2M). The solution is then titrated using
potassium permanganate solution. This will cause V3+ and V4+ present in the solution
to oxidise, forming V5+. When the colour of the solution changes from greenish-blue
to pink, end point is reached. The volume of potassium permanganate used was
recorded as V1 (Niwa and Murakami, 1982).
Next, the solution which now contains only V5+ was reduced by titrating with
iron(II) ammonium sulphate. As the solution is colourless, diphenylamine was added
to give the solution purple colour for ease of determining end point. When end point
had reached, the solution is decolourised. At this stage, the solution now contains V4+

23
and V5+. The volume of iron(II) ammonium sulphate used was recorded as V2 (Niwa
and Murakami, 1982).
To determine the original amount of V5+ present in the solution, a fresh solution
is prepared and titrated with iron(II) ammonium sulphate. Similarly, to indicate the
end point, diphenylamine is used to give the solution purple colour. When the solution
colour changes from violet to greenish-blue, end point has reached. This means that
all V5+ have been reduced to V3+ and V4+. The volume of iron(II) ammonium sulphate
used was recorded as V3 (Niwa and Murakami, 1982).
From these three steps, three equations can be obtained and used to determine
the concentration of V3+, V4+ and V5+ (Niwa and Murakami, 1982). A detailed
derivation of the three equations are shown in Appendix B:
V3+ = 20(0.01)V1 − 20(0.01)V2 + 20(0.01)V3 (3.3)
V4+ = 40(0.01)V2 − 40(0.01)V3 − 20(0.01)V1 (3.4)
V5+ = 20(0.01)V3 (3.5)
After the concentration of V3+, V4+ and V5+ is determined, the average
oxidation state of vanadium, VAV can be determined subsequently (Niwa and
Murakami, 1982).
VAV =5V4+ + 4V4+ + 3V3+
V5+ + V4+ + V3+
(3.6)
3.6.3 Scanning Electron Microscope (SEM)
Scanning Electron Microscope (SEM) is widely used to obtain information such as
surface morphology and visual image of different phases composition present in the
sample (Swapp, 2006). Hitachi S-3400N as shown in Figure 3.6 was used in this
research. Prior to SEM analysis, the catalyst powder is required to be coated with
electrically-conducting metal such gold. This is to increase the signal strength by
increasing the amount of secondary electrons detectable in the SEM (Höflinger, 2013).

24
Figure 3.5: Hitachi S-3400
In SEM, a beam of electrons fired from the electron gun is focused onto the
powder surface. Two types of signal will be produced as a result of interaction between
electron beam and sample surface, namely secondary and backscattered electrons.
Secondary electrons that produced from the inelastic collision between incident
electrons with surface electrons are useful in imaging the morphology and topography
of the samples. On the other hand, backscattered electrons that produced from the
elastic collision between incident electrons with surface electrons are useful in
distinguishing different phases with different molecular weight in the catalyst (Egerton,
2005). With the help of detectors in the SEM, signals are generated and the image of
the SEM can be viewed through a monitor attached to the SEM. According to Cheney
(2007), a working distance of 10 mm is generally used to produce an image with both
decent depth of field and resolution.
In this project, Hitachi S-3400N SEM is used to analyse the sample surface
morphology. Prior to SEM analysis, samples are required to be labelled accordingly
and placed in the sputter coater to coat the sample with platinum. Then, the sample can
now be placed into the SEM equipment. Before starting the analysis, the environment
around the sample is vacuumed to remove the air molecules which can interfere with
the observations under microscope. The test condition used to SEM is set at 15 kV and
two pictures is taken for each sample at different magnification.
3.6.4 Energy Dispersive X-ray (EDX)
Energy Dispersive X-ray (EDX) is commonly used to identify the chemical
composition of the catalyst qualitatively and quantitatively by analysing the x-rays

25
energy spectrum produced when an electron beam bombarded the catalyst surface
(Goodge, 2005). EDX is usually coupled with SEM which shares the same electron
gun for element mapping. Point analysis can also be carried out if X-ray detector is
installed in the SEM machine (University of California, 2015).
When high-energy electron beam fired from electron gun interacts with the
surface atoms of the catalyst, an electron is ejected from shell closest to the nucleus.
This will cause movement of electrons from outer shell moves towards the inner shell
to return the atom back to its stable, lowest energy state. The movement of electrons
also releases X-ray, and depending which shell the electrons from, different radiation
is released as shown in Figure 3.7 (Heath, 2015).
Figure 3.6: Different Radiation Emission During Excitation of Electrons
The resulting X-ray produced can be separated into characteristic x-rays of
different elements into an energy spectrum. Since each element has their own unique
energy spectrum, the composition can be identified accordingly. One of the limitations
of EDX is the inability of detecting element lighter than beryllium (University of
California, 2015).
The sample preparation steps for EDX is similar to SEM. The setting used for
the test condition is 30 keV.
3.6.5 Temperature Programmed Reduction (TPR)
Temperature Programmed Reduction (TPR) is a relatively new thermoanalytical
technique that has been widely used in chemical characterisation of catalyst.
Temperature in TPR, as the name suggested can increase or decrease in a
predetermined manner while at the same time the solid catalyst is being reduced by a

26
stream of diluted hydrogen gas. The gain of hydrogen by catalyst can be quantitatively
determined by measuring the change in thermal conductivity of the inlet and outlet
diluted hydrogen gas. The result is presented in the form of a plot of hydrogen
consumed by catalyst versus the temperature. Each peak represents reduction process
by a component in the catalyst. Chemical properties of the component can influence
the position of the peak, while area under the peak represents the concentration of the
component in the catalyst (Jones and McNicol, 1987).
TPR is carried out using Thermo Electron TPDRO 1100 shown in Figure 3.8
where initially, 0.02 g of catalyst is weighed into the reactor and connected to the
preparation port. The catalyst is subjected a two-step pre-treatment process in which
during the first step, a flow of purified nitrogen gas at 20 cm3 min-1 is used to clean the
catalyst for 5 minutes. The second step of pre-treatment involves increasing the
temperature from room temperature to 473 K at 10 K min-1 for 45 min. The objective
of pre-treatment is to remove any contaminant and moisture from the surface of
catalyst.
Figure 3.7: Thermo Electron TPDRO 1100
After the completion of pre-treatment, reactor was switched to analysis port
where a stream of 5.23 % hydrogen diluted in argon gas flows through the reactor.
Temperature in the reactor was increased linearly from room temperature to 1173 K at
5 K min-1. The hydrogen in the gas mixture reacts with the catalyst to form water and

27
removed from the reactor. Thermal conductivity detector measures the thermal
conductivity difference and generates the results. Calculations required to analyse the
result are shown in Appendix H and Appendix I
3.6.6 Inductively Coupled Plasma – Optical Emission Spectroscopy (ICP-OES)
Inductively Coupled Plasma – Optical Emission Spectroscopy (ICP-OES) is one of the
most widely used tools to analyse the compositional information of the sample. This
tool is applicable to solid, liquid and gaseous sample but solid samples are required to
be dissolved in solution as it may clog the channel. Figure 3.9 shows the a typical ICP-
OES instrument set up (Hou and Jones, 2000).
The sample is first introduced into the central plasma via a nebuliser which
spray the sample solution into very fine particles. At the central of inductively coupled
plasma, the temperature could reach up to 10000 K and the fine particles of sample
solution is instantly vaporized. As the analyte elements are now free atoms in gaseous
form, collision between the atoms can cause excitation of the atoms. When the excited
species fall back to ground state, photon is released. Wavelength of the photons release
by the element is unique to that element and be used as qualitative analysis of the
sample. In addition, as the higher the number of photons produced, the higher
concentration of the element present in the sample solution. Thus, ICP-OES can also
be served as a quantitative analysis (Hou and Jones, 2000).
Figure 3.8: A typical ICP-OES Diagram

28
To carried out qualitative analysis using ICP-OES, it is necessary to run
standards of the elements in interest before the sample analysis. The purpose for this
step is to obtain a calibration curve and allow the unknown concentrations of the
elements in the sample to be determined using the calibration curve.
In this research, standard solutions of V, P, Co, Cu were prepared with the
concentration range from 5 ppm to 45 ppm. VPO catalyst were digested in 10 mL of
HNO3 to dissolve the solid completely. All the calculations and procedure involved is
attached in Appendix D and Appendix E respectively. Perkin Elmer Optical Emission
Spectrometer Optima 7000 DV as shown in Figure 3.10 is used in this research to carry
out the ICP-OES analysis.
Figure 3.9: Perkin Elmer Optical Emission Spectrometer Optima 7000 DV
3.6.7 Fourier-Transform Infrared (FTIR)
Fourier-Transform Infrared (FTIR) analysis is commonly used to identify the type of
functional groups and chemical bonding by monitoring the vibrational mode of the
functional groups when exposed to infrared spectrum. Infrared spectrum ranges from
wavelength of 700 nm to 1000000 nm but 2500 nm to 25000 nm is the most interesting
range for chemical analysis. This is because most of the functional groups present in
organic molecules fall within this range (Doyle, 1992).
The process of FTIR analysis is relatively direct. When the functional group or
chemical bonds is exposed to infrared beam, portion of the energy is absorbed by the
at a certain wavenumber and allow the functional group to vibrate in their vibrational
mode. The amount of transmitted infrared beam is detected and the results is present
in a plot of percent transmittance against wavenumber. Wavenumber is the inverse of
wavelength (Doyle, 1992).

29
In this research, FTIR-ATR is used instead of traditional FTIR which uses
potassium bromide (KBr) as the matrix material. The benefits of FTIR-ATR includes
better results reproducibility, minimise sample preparation procedure that could cause
spectral variation and faster sampling. Nicolet iS 10 as shown in Figure 3.11 is used
in this research (Perkin Elmer, 2005).
Figure 3.10: Nicolet iS 10 FTIR Spectrometer
30
CHAPTER 4
4 RESULTS AND DISCUSSION
4.1 Introduction
The samples VPOBulk, VPOCo1%, VPOCu1% and VPOCu1%Co1% that were
collected after the end of calcination process is subjected to various instrumental
analyses to investigate the physical properties and chemical properties of the catalyst.
These instrumental analyses include:
1) X-Ray Diffraction (XRD) Analysis
2) Fourier-Transform Infrared Spectroscopy (FTIR)
3) Scanning Electron Microscope (SEM)
4) Energy Dispersive X-ray Spectrometry (EDX)
5) Inductively Coupled Plasma - Optical Emission Spectroscopy (ICP-OES)
6) Redox Titration
7) Temperature-Programmed Reduction (TPR)
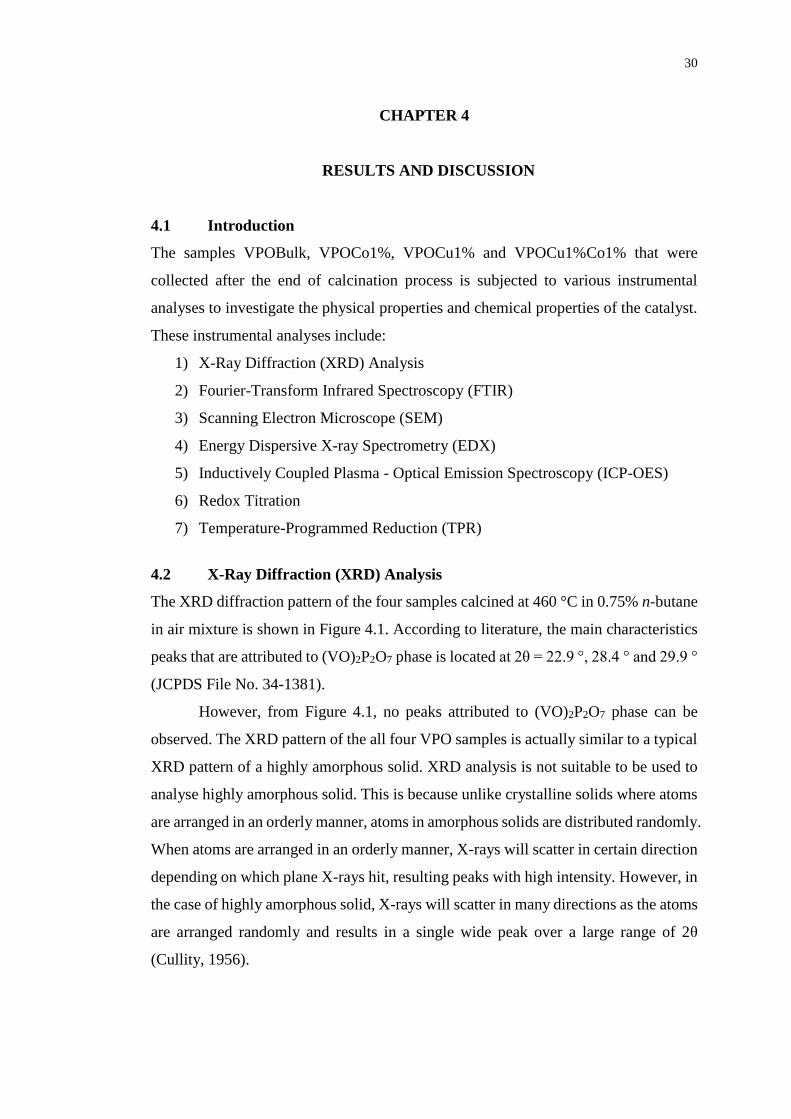
4.2 X-Ray Diffraction (XRD) Analysis
The XRD diffraction pattern of the four samples calcined at 460 °C in 0.75% n-butane
in air mixture is shown in Figure 4.1. According to literature, the main characteristics
peaks that are attributed to (VO)2P2O7 phase is located at 2θ = 22.9 °, 28.4 ° and 29.9 °
(JCPDS File No. 34-1381).
However, from Figure 4.1, no peaks attributed to (VO)2P2O7 phase can be
observed. The XRD pattern of the all four VPO samples is actually similar to a typical
XRD pattern of a highly amorphous solid. XRD analysis is not suitable to be used to
analyse highly amorphous solid. This is because unlike crystalline solids where atoms
are arranged in an orderly manner, atoms in amorphous solids are distributed randomly.
When atoms are arranged in an orderly manner, X-rays will scatter in certain direction
depending on which plane X-rays hit, resulting peaks with high intensity. However, in
the case of highly amorphous solid, X-rays will scatter in many directions as the atoms
are arranged randomly and results in a single wide peak over a large range of 2θ
(Cullity, 1956).

31
Figure 4.1: XRD Patterns of Undoped and Doped VPO Samples
Thus, based on Figure 4.1, it can be deduced that the VPOBulk, VPOCo1%,
VPOCu1% and VPOCu1%Co1% produced are amorphous in nature. As XRD is
unable to analyse amorphous solids, FTIR will be used instead to confirm the identity
of the catalysts produced by determining the presence of characteristic bonds for VPO
catalyst.
4.3 Fourier-Transform Infrared Spectroscopy (FTIR)
FTIR can be used to identify the molecular structure and type of chemical bonds
presence due to their highly characteristic features. The FTIR spectra of the four
samples are depicted in Figure 4.2. All the four VPO sample shows similar FTIR
spectrum. The broad spectra band within the region of 2600-3600 cm-1 indicates the
0
100
200
300
4000 30 60
0
100
200
300
400
0
100
200
300
400
0 30 600
100
200
300
400
VPO Bulk
Inte
nsity
VPO Co
VPO Cu
2Theta
VPO CuCo

32
presence of hydrogen bonded O - H groups while band at 1642 cm-1 is due to stretching
mode of P-OH (Zhao et al., 2016).
Figure 4.2: FTIR Spectra of VPO Samples Undoped and Doped
Spectra within the region of 900 – 1200 cm-1 represents the P - O and V = O
groups. To be in precise, the band in 1160 and 1055 cm-1 is due to bending of PO3, the
band in 1003 cm-1 is due to stretching of V = O and the band in 938 cm-1 is due to
stretching of V - OH. The band located at 642 cm-1 on the other hand, is due to
deformation vibrations of phosphate tetrahedral (Zhao et al., 2016).

33
As all the IR spectra indicates the presence of P - O and V = O bonding in the
samples, it can be affirmed that the VPOBulk, VPOCo1%, VPOCu1% and
VPOCu1%Co1% contained active phase of (VO)2P2O7 in the samples.
4.4 Scanning Electron Microscope (SEM)
The surface morphologies of VPOBulk, VPOCo1%, VPOCu1% and VPOCu1%Co1%
catalysts are shown in Figure 4.3(a)-(d). It can be seen that all the catalysts have a
different shape and sizes due to presence of dopant. Undoped VPO, as can be observed
from Figure 4.3(a) has a blocky crystals structure due to the agglomeration of particles.
These agglomerates of VPO sample often expose the (1 0 0) crystal plane.
(a)
(b)
(c)
(d)
Figure 4.3: SEM Micrographs of (a) VPOBulk (b) VPOCo1% (c) VPOCu1% (d)
VPOCu1%Co1% at ×10000 magnification
Figure 4.3(b) to (d) depicts the surface morphologies for various doped VPO
catalyst. VPO doped with 1% of cobalt has a rod-like crystals structure while VPO
doped with 1% of copper has a grain-like crystal structure. However, when both cobalt
and copper are added into VPO catalyst, it can be observed that the promotional effect

34
from cobalt is the more dominant compared to copper as VPOCu1%Co1% crystal
shape (Figure 4.3(d)) is more similar to rod-like crystal structure.
All the doped catalysts have an average crystallite size of 10 µm while undoped
catalyst has an average crystallite size of 20 µm. Crystallite size is known to be
inversely proportional to the surface area and the activity of the catalyst. A smaller
crystallite size can increase the specific surface area of the catalyst and enhances the
catalytic performance of the catalyst. This is in agreement with literature findings
where copper and cobalt both increase the specific surface area on the catalyst
(Hutchings and Higgins, 1996).
4.5 Energy Dispersive X-ray Spectrometry (EDX)
The compositional data for the VPO samples obtained from EDX is tabulated in Table
4.1. Accuracy of quantitative analysis using EDX can be affected when the sample has
irregular sample surface and non-homogeneous. This is because to produce accurate
quantitative results, all the X-ray produced from the interaction between the electron
beam and the particles must be detected. When the surface is coarse or non-
homogenous, the X-ray produced will be interfered and produce inconsistent reading.
Table 4.1: Compositions of VPO Samples and the Average P/V Atomic Ratio
Catalyst P avg
(At. %)
V avg
(At. %)
O avg
(At. %)
Co avg
(At. %)
Cu avg
(At. %)
Average
P/V
VPOBulk 47.16 37.38 15.56 - - 1.2619
VPOCo1% 38.56 35.21 25.49 0.74 - 1.0951
VPOCu1% 41.14 39.89 18.28 - 0.69 1.0313
VPOCu1%Co1% 40.92 37.93 19.57 0.67 0.92 1.0788
To improve the accuracy of result obtained, elementary compositions at three
points are analysed to obtain an average value. Average P/V atomic ratio is then
calculated by dividing P avg with Vavg.
Based on literature, the optimal range of the P/V atomic ratio should be within
the range of 1.00 – 1.20 (Gulliants, 1996). As can be seen in Table 4.1, the P/V atomic
ratio of undoped catalyst is 1.2619 which is above the optimal range. On the other
hand, the incorporation of dopants in VPOCo1%, VPOCu1% and VPOCu1%Co1%

35
has greatly reduced the P/V atomic ratio of VPO catalyst where all doped catalysts fall
within the optimal range of P/V atomic ratio.
It was suggested that a slight excess of P can promote the stabilisation of V4+
that is responsible for the poor selectivity and high activity of catalyst (Taufiq-Yap et
al., 2011). However, when the P/V atomic ratio is too high, the crystalline phase of the
catalyst will reduce while formation of amorphous VOPO4 phases will increase
(Guliants, Benziger, S. Sundaresan, et al., 1996).
The average P/V atomic ratio for VPO catalyst doped with 1 % Copper and 1 %
Cobalt is 1.0788. This value lies on the in between the P/V atomic ratio of VPOCo1%
and VPOCu.1% but closer towards the VPOCo1% in which the P/V atomic ratio is
1.0951. This is due to more dominant promotional effect as discussed in SEM analysis
where cobalt has a more prominent promotional effect on VPO catalyst than copper.
As EDX analysis is a surface analysis technique where only x-ray generated
from the surface atom up to a few microns thick can be detected. This may reduce the
actual amount of phosphorous detectable by EDX analysis.
4.6 Inductively Coupled Plasma - Optical Emission Spectroscopy (ICP-OES)
To support the results obtained from EDX analysis, ICP-OES is carried out to analyse
the elementary composition of the VPO samples undoped and doped. The results
obtained from ICP-OES is shown in Table 4.2. To improve the accuracy of the results,
each element is analysed three times by the ICP-OES and the average concentration of
the element is calculated.
Table 4.2: P/V Atomic Ratio from ICP-OES
Catalyst P avg
(mg/L)
V avg
(mg/L)
Co avg
(mg/L)
Cu avg
(mg/L)
Average
P/V
VPOBulk 3.380 5.121 - - 1.0855
VPOCo1% 5.919 9.589 0.084 - 1.0153
VPOCu1% 41.14 39.89 - 0.157 0.9342
VPOCu1%Co1% 40.92 37.93 0.068 0.076 0.9577

36
Based on Table 4.2, it can be observed that VPOBulk has a higher P/V atomic
ratio, followed by VPOCo1%, VPOCu1%Co1% and lastly VPOCu1%. The trend is in
agreement with the result obtained from EDX analysis. Thus, it can be said the cobalt
and copper dopant can reduce the average P/V atomic ratio in the VPO catalyst.
However, all the VPO samples have a much lower average P/V atomic ratio in
general compared to the results obtained from EDX analysis. Not only that, all the
doped catalysts even fall out of the optimal range as proposed by Guliants et al. (1996).
The P/V atomic ratio can be related to the oxidation of (VO)2P2O7. A slightly high P/V
atomic ratio can stabilize (VO)2P2O7 phases and prevent oxidation of the phases to V5+
but when P/V atomic ratio is too high, amorphous phases VOPO4 will form. On the
other hand, a low P/V atomic ratio is unable to limit the oxidation of (VO)2P2O7 phases
to VOPO4 as well. V5+ is present in VOPO4 phase and is only desired in VPO catalyst
in a small quantity compared to V4+ as V5+ can decrease the activity of the catalyst and
increase the selectivity (Guliants et al., 1996).
As the average P/V atomic ratio found in EDX are greater than the average P/V
atomic ratio determined from ICP-OES, it can be deduced that most phosphorous is
segregated near the surface of VPO catalyst due to presence of an amorphous
metaphosphate phase near the surface as pointed out by Ruitenbeek (1999). However,
the formation of this metaphosphate phase should be minimum as the P/V ratio found
in EDX is still relatively small compared to the literature findings in which the P/V
atomic ratio is 4.0. Moreover, the results from ICP-OES can also be considered as an
overall composition ratio that include the catalyst bulk and catalyst surface as well.
4.7 Redox Titration
Redox titration is carried out to determine the average oxidation number of vanadium
at the amount of V4+ and V5+ present in the VPO catalyst. VAV is calculated from the
data obtained in redox titration while V4+ and V5+ can be determined from VAV. Table
4.3 shows all the results calculated.
From the Table 4.3, it can be observed that the average oxidation number of
VPOBulk, VPOCo1%, VPOCu1% and VPOCu1%Co1% are 4.2044, 4.1803, 4.2454
and 4.3054 respectively. An interesting difference can be observed where the presence
of cobalt dopant decreases the average oxidation number of the VPO catalyst while
the addition of copper dopant increases the average oxidation number of the VPO

37
catalyst. This former is in fact in agreement with the result obtained by Cornaglia et al.
(2003) where the researchers found that cobalt dopant can reduce the average oxidation
number of the VPO catalyst by promoting phosphorous enrichment and limit the
oxidation of V4+.
Table 4.3: Average Oxidation Number of Vanadium from Redox Titration
Catalyst Average oxidation number of vanadium
V4+ (%) V5+ (%) VAV
VPOBulk 79.56 20.44 4.2044
VPOCo1% 81.94 18.06 4.1803
VPOCu1% 75.46 24.54 4.2454
VPOCu1%Co1% 69.46 30.54 4.3054
On the other hand, the latter, where addition of copper dopant increase the
average oxidation number of VPO catalyst can also observed in EDX analysis and
ICP-OES analysis where VPOCu1% has the lowest P/V ratio among the four samples.
Low P/V atomic ratio will increase the formation of VOPO4 phases which in turn
increase the V5+ present in the VPO catalyst. Thus it can be concluded that addition of
cobalt decreases the average oxidation number while addition of copper increases the
average oxidation number in a VPO catalyst.
When comparing the average oxidation number of VPOCu1%Co1% with other
VPO samples, it was found that the average oxidation number of VPOCu1%Co1%
was higher than the other samples. This may be the result of the synergistic effect
between cobalt and copper dopant where presence of cobalt enhances the promotional
effect of copper dopant. A higher average oxidation number can be translated to higher
number of V5+ present in the VPO catalyst. As high number of V5+ can decrease the
activity of VPO catalyst significantly albeit it increases of selectivity towards
oxidation of n-butane to maleic anhydride, it is undesired in the industry.
4.8 Temperature-Programmed Reduction (TPR)
TPR is used to analyse the redox properties of VPO catalyst by flowing reducing agent,
H2 diluted in inert gas over the catalyst. Before subjecting the sample for TPR analysis,
pre-treatment of the catalyst is carried out to fully oxidised the catalyst and remove

38
any impurities on the catalyst surface. Figure 4.4 depicts the TPR profile for VPOBulk,
VPOCo1%, VPOCu1% and VPOCu1%Co1%. By using the data obtained from Figure
4.4, reduction activation energy (ER) and total amount of oxygen removed from the
VPOs catalysts is calculated and tabulated in Table 4.4.
Table 4.4: Total amount of O2 removed from the VPOs catalysts.
Catalyst Peak Tm
(K)
ER
(kJ/mol)
Amount of
oxygen
removed
(mol/g)
Amount of
oxygen
removed
(atom/g)
Total
oxygen
removal
(atom/g)
VPOBulk 1 703 108.0824 7.67 × 10⁻⁵ 4.62 × 10¹⁹
1.48 × 10²⁰ 2 932 143.2899 1.69 × 10⁻⁴ 1.02 × 10²⁰
VPOCo1% 1 689 105.9300 7.16 × 10⁻⁶ 4.16 × 10¹⁸
1.24 × 10²⁰ 2 948 145.7498 2.00 × 10⁻⁴ 1.20 × 10²⁰
VPOCu1% 1 697 107.1599 6.91 × 10⁻⁶ 4.16 × 10¹⁸
1.17 × 10²⁰ 2 918 141.1374 1.88 × 10⁻⁴ 1.13 × 10²⁰
VPOCu1%
Co1%
1 679 104.3925 5.86 × 10⁻⁶ 3.53 × 10¹⁸ 1.21 × 10²⁰
2 923 141.9062 1.95 × 10⁻⁴ 1.18 × 10²⁰
As can be seen from Figure 4.4, all VPOs catalysts showed two peaks in the
TPR profile while the latter peak has a higher amount of oxygen removed from catalyst.
The temperature at which a peak is located, temperature maxima is relatively similarly
for all the VPOs catalyst. It can be deduced adding cobalt, copper and both cobalt and
copper at the same time do not affect the temperature at which oxygen starts to remove
from the catalyst.
Different oxygen species is removed from the VPO catalyst at different peaks.
The first peak will correspond to the release of selective oxygen species, O2- from the
V5+ phase. On the other hand, the second peak will correspond to the release of
unselective oxygen species, O- from the V4+ phase (Taufiq-Yap et al., 1997). As the
V4+ constitute a larger portion in the VPO catalyst, more oxygen is removed during
the second peak compared to the first peak. Figure 4.5 shows the amount oxygen
removed from V4+ and V5+ respectively. It can be observed all four samples shows

39
similar trend where V4+ phases release more oxygen than V5+ phases. This result is in
consistent with the findings from redox titration where the percentage of V4+ phases
roughly range from 69.46 % to 81.94 %.
Figure 4.4: TPR Profiles of VPOs Catalysts

40
Figure 4.5: Comparison of amount of oxygen removed from catalyst between V4+
and V5+ phases
In terms of total oxygen removed from the VPO catalyst, VPOBulk has the
highest amount of oxygen removed followed by VPOCo1%, VPOCu1%Co1% and
VPOCu1%. This may be related to the surface morphology of doped catalyst where
all three doped catalyst has rod-like structure in SEM which has lower specific surface
area compared to VPOBulk which has a blocky structure.
Based on Table 4.4, it can also be seen that different dopants have different
effect on the reduction activation energy of VPO catalyst. As reduction activation
energy represent the minimum energy required for the redox mechanism to take place
in the VPO catalyst, a lower reduction activation energy is often desired. Addition of
cobalt is found to decrease the ER of V4+ phases but increase the ER of V5+ phases while
addition of copper will reduce ER of both V4+ and V5+ phases. On the other hand, the
ER for VPOCu1%Co1% is reduced compared the VPOBulk and this may be due to the
synergistic effect between cobalt and copper dopant.
0.00E+00
2.00E+19
4.00E+19
6.00E+19
8.00E+19
1.00E+20
1.20E+20
1.40E+20
VPOBulk VPOCo1% VPOCu1% VPOCu1%Co1%Am
ount
of
ox
ygen
rem
oved
(at
om
/g)
Amount of oxygen removed from V4+ and V5+
V4+
V5+
V4+ phases
V5+ phases

41
CHAPTER 5
5 CONCLUSION AND RECOMMENDATIONS
5.1 Conclusion
In this research, preparation of vanadyl phosphate dihydrate precursor is conducted by
ultrasound irradiation for 1 hour followed by preparation of vanadyl phosphate
sesquihydrate precursor which subjected to ultrasound irradiation for 4 hours. The
sesquihydrate precursor is then calcined at 460 °C for 24 hours. Vanadyl
pyrophosphate catalyst obtained at the end of calcination is characterised using various
techniques.
From XRD, it was found that all the four VPOs catalyst has amorphous
structure. FTIR is used instead to identify the identity of the catalyst by determining
the bond present. The presence of P-O and V=O bonding shows that the identity of the
catalyst is indeed VPO catalyst. Thus, it can be concluded that bulk VPO catalyst, Cu-
doped VPO catalysts, Co-doped VPO catalysts and Cu-Co doped VPO catalysts were
successfully synthesised using sonochemical technique.
The P/V atomic ratio from for all doped catalysts are found lower than undoped
catalysts but within the optimal range in EDX analysis. Cobalt has a more prominent
promotional effect on VPO catalyst than copper as bi-metallic doped VPO catalyst has
an intermediate atomic P/V ratio but the value is closer to cobalt doped VPO. This
effect can also be observed in SEM micrographs where cobalt distinctive rod-like
shape is present in the bi-metallic doped VPO catalyst. The trend obtained ICP-OES
is in agreement with EDX analysis, but the value is lower in general. This is due to
formation of small amount of metaphosphate phase in the VPO catalyst.
In addition, it was found from redox titration analysis that addition of cobalt
into the VPO catalyst can decrease the average oxidation number of vanadium and this
is in agreement with Cornaglia et al. (2003) findings. Presence of cobalt dopant will
promote phosphorus enrichment and limit the oxidation of V4+. On the other hand,
addition of copper increases the average oxidation number of vanadium as copper
doped VPO catalyst has a lower P/V atomic ratio which allows more formation of
VOPO4 phases. The results from redox titration is supported by TPR profile of the
catalyst. It can be seen that cobalt doped VPO has more oxygen species from the V4+

42
phase than the copper doped VPO because higher amount of V4+ phase is present in
cobalt doped VPO catalyst.
The synergistic effect between cobalt and copper dopants can be observed in
both redox titration and TPR analysis. In redox titration, cobalt dopant enhances the
promotional effect of copper dopant, producing a bi-metallic doped VPO catalyst with
higher percentage of V5+ present in the catalyst. From TPR analysis, it was found that
the reduction activation energy is reduced and this may be related to the synergistic
effect between cobalt and copper dopant in VPO catalyst.
5.2 Recommendations
For further research:
1) To understand the catalyst produced better, the catalyst should be analysed
using a catalytic reactor to obtain information on actual yield of maleic
anhydride. Yield is one of the key factor to select the optimal catalyst.
2) Different routes can be used to synthesise VPO catalyst, including hemihydrate
and organic route. Research should be done to distinguish the route which is
most suitable to produce catalyst.

REFERENCES
Al-Otaibi, R.L., 2010. Preparation and Characterisation of Vanadium Phosphorus
Oxide Catalysts for Butane Oxidation to Maleic Anhydride. University of Cardiff.
Albonetti, S. et al., 1996. A Comparison of the Reactivity of “Nonequilibrated” and
“Equilibrated” V–P–O Catalysts: Structural Evolution, Surface Characterization, and
Reactivity in the Selective Oxidation of n-Butane andn-Pentane. Journal of Catalysis,
160(1), pp.52–64.
Ballarini, N. et al., 2006. VPO catalyst for n-butane oxidation to maleic anhydride: A
goal achieved, or a still open challenge? Topics in Catalysis, 38(1–3), pp.147–156.
Bartholomew, C.H. and Farrauto, R.J., 2005. Fundamentals of Industrial Catalytic
Processes 2nd ed., John Wiley & Sons, Inc., Hoboken, NJ, USA.
Benziger, J.B., Guliants, V. and Sundaresan, S., 1997. New precursors to vanadium
phosphorus oxide catalysts. Catalysis Today, 33(1–3), pp.49–56.
Brunauer, S., Emmett, P.H. and Teller, E., 1938. Adsorption of Gases in
Multimolecular Layers. Journal of the American Chemical Society, 60(2), pp.309–319.
Available at: http://pubs.acs.org/doi/abs/10.1021/ja01269a023.
Cavani, F. et al., 2010. Surface dynamics of a vanadyl pyrophosphate catalyst for n-
butane oxidation to maleic anhydride: An in situ Raman and reactivity study of the
effect of the P/V atomic ratio. Chemistry - A European Journal, 16(5), pp.1646–1655.
Cheney, B., 2007. Introduction to Scanning Electron Microscopy. , 29(2), pp.29–36.
Available at: http://www.ncbi.nlm.nih.gov/pubmed/3313016.
Cheng, W.-H. and Wang, W., 1997. Effect of calcination environment on the selective
oxidation of n-butane to maleic anhydride over promoted and unpromoted VPO
catalysts. Applied Catalysis A: General, 156(1), pp.57–69.
Chorendorff, I. and Niemantsverdriet, J.W., 2003. Concepts o Modern Catalysis and
Kinetics 2nd ed., Wiley-VCH, Weiheim.
Cole-Hamilton, D.J., 2003. Homogeneous Catalysis--New Approaches to Catalyst
Separation, Recovery, and Recycling. Science, 299(1702). Available at:
http://www.sciencemag.org/cgi/doi/10.1126/science.1081881.
Cornaglia, L. et al., 2003. The beneficial effect of cobalt on VPO catalysts. Catalysis
Today, 78(1–4 SPEC.), pp.291–301.
Cullity, B.D., 1956. Elements of X-ray Diffraction First., Addison-Wesley Publishing
Company, Inc., Massachusetts.
Dollimore, D., Spooner, P. and Turner, A., 1976. The BET method of analysis of gas
adsoprtion and its relevance to the calculation of surface area. Surface Technology, 4,
pp.121–160.
Doyle, W.M., 1992. Principles and applications of Fourier transform infrared ( FTIR )
process analysis. Process Control and Quality, 2, pp.11–41.
Egerton, R.F., 2005. Physical principles of electron microscopy: An introduction to
TEM, SEM, and AEM, Springer, United States.
Farrauto, R.J., Dozario, L. and Bartholomew, C.H., 2016. Introduction to Catalysis
and Industrial Catalytic Processes 1st ed., John Wiley & Sons, Inc., United States.
Goodge, J., 2005, Energy-Dispersive X-Ray Spectroscopy (EDS) [Online]. Available
at: http://serc.carleton.edu/research_education/geochemsheets/eds.html.
Guliants, V.V., Benziger, J.B., Sundaresan, S., et al., 1996. The effect of the phase
composition of model VPO catalysts for partial oxidation of n-butane. Catalysis Today,
28(4), pp.275–295.
Haynes, W.M., 2013. CRC Handbook of Chemistry and Physics 94th ed., CRC Press,
Florida.
Heath, J., 2015. Energy Dispersive Spectroscopy. Essential Knowledge Briefings, (2),
p.32.
Höflinger, G., 2013, Brief Introduction to Coating Technology for Electron
Microscopy [Online]. Available at: http://www.leica-microsystems.com/science-
lab/brief-introduction-to-coating-technology-for-electron-microscopy/.
Hou, X. and Jones, B.T., 2000. Inductively Coupled Plasma-Optical Emission
Spectroscopy, John Wiley & Sons, Inc., Chichester.
Hutchings, G.J., 1991. Effect of promoters and reactant concentration on the selective
oxidation of n-butane to maleic anhydride using vanadium phosphorus oxide catalysts.
Applied Catalysis, 72(1), pp.1–32.
Hutchings, G.J. and Higgins, R., 1996. Effect of promoters on the selective oxidation
of n-butane with vanadium-phosphorus oxide catalysts. Journal of Catalysis, 162(2),
pp.153–168.
Hwang, N. and Barron, a. R., 2011. BET Surface Area Analysis of Nanoparticles. , 1,
pp.1–11.
Ishimura, T., Sugiyama, S. and Hayashi, H., 2000. Vanadyl hydrogenphosphate
sesquihydrate as a precursor for preparation of (VO)2P2O7 and cobalt-incorporated
catalysts. Journal of Molecular Catalysis A: Chemical, 158(2), pp.559–565. Available
at: http://linkinghub.elsevier.com/retrieve/pii/S138111690000145X.
IUPAC, 2014. Compendium of Chemical Terminology Gold Book 2.3.3., IUPAC.
Jackson, S.D. and Hargreaves, J.S.J., 2009. Metal Oxide Catalysis Vol 1 1st ed.
Jackson, S.D. and Hargreaves, J.S.J., (eds.), Wiley-VCH, Weiheim.

Johannes, T.W., Simurdiak, M.R. and Zhao, H., 2006. Biocatalysis. Encyclopedia of
Chemical Processing, pp.101–110.
Jones, A. and McNicol, B.D., 1987. Temperature Programmed Reduction for Solid
Materials Characterization in Chemical Industries, New York.
Leong, L.K., Chin, K.S. and Taufiq-Yap, Y.H., 2011. The effect of Bi promoter on
vanadium phosphate catalysts synthesized via sesquihydrate route. Catalysis Today,
164(1), pp.341–346. Available at: http://dx.doi.org/10.1016/j.cattod.2010.10.029.
Mazur, L., 2001. Catalysts - Real-life applications. Science Clarified: Real-Life
Chemistry, 1. Available at: http://www.scienceclarified.com/everyday/Real-Life-
Chemistry-Vol-2/Catalysts-Real-life-applications.html [Accessed: 23 March 2017].
Monshi, A., Foroughi, M.R. and Monshi, M.R., 2012. Modified Scherrer equation to
estimate more accurately nano-crystallite size using XRD. World J. Nano Sci. Eng.,
2(3), p.154.
Musa, O.M., 2016. Handbook of Maleic Anhydride Based Materials Musa, O.M., (ed.),
Springer, New Jersey.
Niwa, M. and Murakami, Y., 1982. Mechanism of Ammoxidation of Toluene. Journal
of Catalysis, (76), pp.9–16.
Perkin Elmer, 2005. FT-IR Spectroscopy Attenuated Total Reflectance (ATR). Perkin
Elmer Life and Analystical Sciences, pp.1–5. Available at:
http://www.utsc.utoronto.ca/~traceslab/ATR_FTIR.pdf.
Pokhrel, N., Vabbina, P.K. and Pala, N., 2016. Sonochemistry: Science and
Engineering. Ultrasonics Sonochemistry, 29(July 2016), pp.104–128. Available at:
http://dx.doi.org/10.1016/j.ultsonch.2015.07.023.
Rajan, N.P., Rao, G.S., Pavankumar, V. and Chary, K.V.R., 2014. Vapour phase
dehydration of glycerol to acrolein over NbOPO4 catalysts. Journal of Chemical
Technology and Biotechnology, 89(12), pp.1890–1897.
Ruitenbeek, M., 1999. Determination of The Surface Composition of V-P-O Catalysts.
X Ray Photoelectron Spectroscopy, pp.41–56.
Stanjek, H. and Häusler, W., 2004. Introduction To Powder/ Polycrystalline
Diffraction. Hyperfine Interactions, 154, pp.107–119.
Swapp, S., 2006, Scanning Electron Microscopy (SEM) [Online]. Available at:
http://serc.carleton.edu/research_education/geochemsheets/techniques/SEM.html.
Taufiq-Yap, Y.H. et al., 2012. Effect of different calcination duration on
physicochemical properties of vanadium phosphate catalysts. E-Journal of Chemistry,
9(3), pp.1440–1448.
Taufiq-Yap, Y.H., Nurul Suziana, N.M. and Hussein, M.Z., 2011. Influences of the

various metal dopants for the nanosized vanadium phosphate catalysts. Catalysis
Letters, 141(1), pp.136–148.
Taufiq-Yap, Y.H., Sakakini, B.H. and Waugh, K.C., 1997. Investigation of the nature
of the oxidant (selective and unselective) in/on a vanadyl pyrophosphate catalyst.
Catalysis Letters, 48(1/2), pp.105–110.
University of California, 2015. Introduction to Energy Dispersive X-ray Spectrometry
( EDS ). , pp.1–12. Available at: http://cfamm.ucr.edu/documents/eds-intro.pdf.
Védrine, J.C., Hutchings, G.J. and Kiely, C.J., 2013. Molybdenum oxide model
catalysts and vanadium phosphates as actual catalysts for understanding heterogeneous
catalytic partial oxidation reactions: A contribution by Jean-Claude Volta. Catalysis
Today, 217, pp.57–64.
Wang, F., Dubois, J.-L. and Ueda, W., 2010. Catalytic performance of vanadium
pyrophosphate oxides (VPO) in the oxidative dehydration of glycerol. Applied
Catalysis A: General, 376(1), pp.25–32. Available at:
http://dx.doi.org/10.1016/j.apcata.2009.11.031.
Wellauer, T.P., 1985. Optimal Policies in Maleic Anhydride Production Through
Detailed Reactor Modelling, Swiss Federal Institute of Technology.
Wong, Y.C. and Taufiq-Yap, Y.H., 2011. Vanadyl Phosphate Dihydrate and The
Vanadium Phosphate Catalyst Produced by Sonochemical Synthesis. Asian Journal of
Chemistry, 23(9), pp.3853–3858.
Yang, W.-C., 2003. Handbook of Fluidization and Fluid-Particle Systems Yang, W.-
C., (ed.), Marcel Dekker, Inc., United States.
Zhao, H. et al., 2016. Effects of Support for Vanadium Phosphorus Oxide Catalysts on
Vapor-Phase Aldol Condensation of Methyl Acetate with Formaldehyde. Industrial &
Engineering Chemistry Research, 55(50), pp.12693–12702. Available at:
http://pubs.acs.org/doi/abs/10.1021/acs.iecr.6b03079.
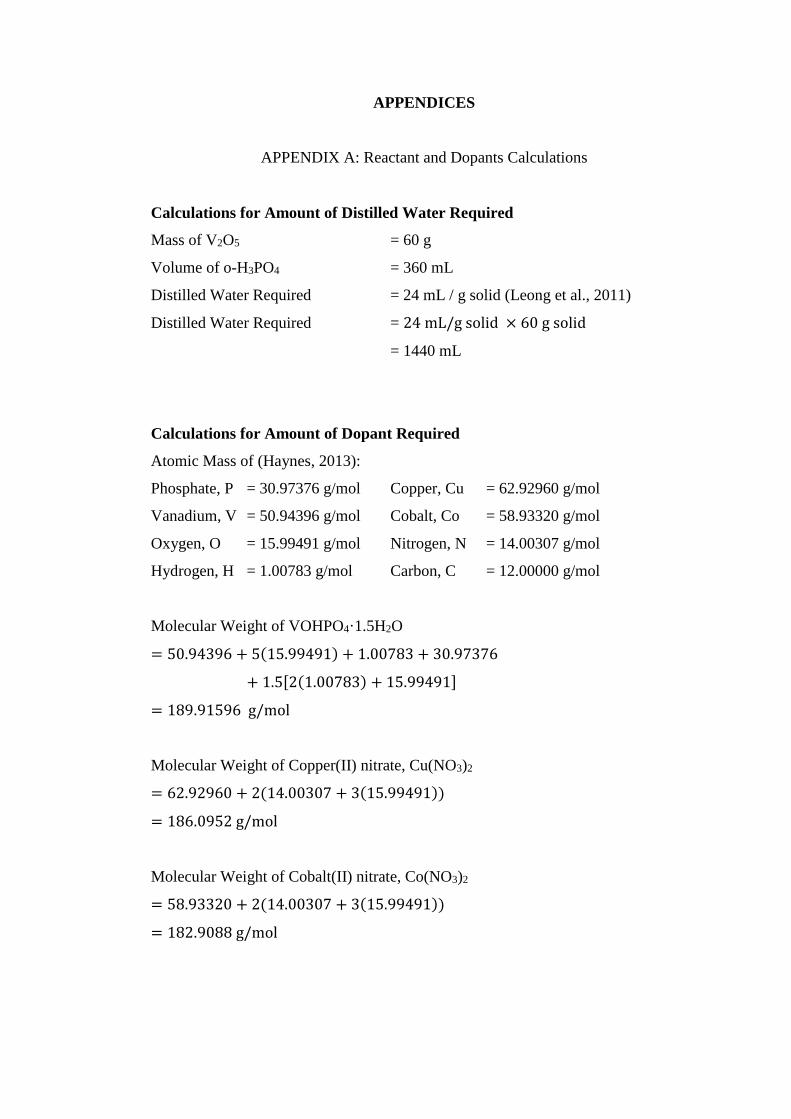
APPENDICES
APPENDIX A: Reactant and Dopants Calculations
Calculations for Amount of Distilled Water Required
Mass of V2O5 = 60 g
Volume of o-H3PO4 = 360 mL
Distilled Water Required = 24 mL / g solid (Leong et al., 2011)
Distilled Water Required = 24 mL/g solid × 60 g solid
= 1440 mL
Calculations for Amount of Dopant Required
Atomic Mass of (Haynes, 2013):
Phosphate, P = 30.97376 g/mol Copper, Cu = 62.92960 g/mol
Vanadium, V = 50.94396 g/mol Cobalt, Co = 58.93320 g/mol
Oxygen, O = 15.99491 g/mol Nitrogen, N = 14.00307 g/mol
Hydrogen, H = 1.00783 g/mol Carbon, C = 12.00000 g/mol
Molecular Weight of VOHPO4·1.5H2O
= 50.94396 + 5(15.99491) + 1.00783 + 30.97376
+ 1.5[2(1.00783) + 15.99491]
= 189.91596 g/mol
Molecular Weight of Copper(II) nitrate, Cu(NO3)2
= 62.92960 + 2(14.00307 + 3(15.99491))
= 186.0952 g/mol
Molecular Weight of Cobalt(II) nitrate, Co(NO3)2
= 58.93320 + 2(14.00307 + 3(15.99491))
= 182.9088 g/mol

Mole for 15 g of VOHPO4·1.5H2O
=15 g
189.91596 g/mol
= 0.07898 mol
Amount of Dopant required for:
Copper(II)nitrate 1% = 0.01 × 0.07898 mol
= 0.0007898 mol
Mass of Copper(II)nitrate = 0.0007898 mol × 186.0952 g/mol
= 0.14698 g
Cobalt(II)nitrate 1% = 0.01 × 0.07898 mol
= 0.0007898 mol
Mass of Cobalt(II)nitrate = 0.0007898 mol × 182.9088 g/mol
= 0.14446 g
Catalyst Amount of copper(II)
nitrate needed (g)
Amount of cobalt(II)
nitrate needed (g)
VPSBulk - -
VPSCu1% 0.14698 -
VPSCo1% - 0.14446
VPSCu1%Co1% 0.14698 0.14446

APPENDIX B: Preparation of Solutions Used in Redox Titration
Preparation of 2 M H2SO4 Solution
Density of H2SO4 = 1.84 g/cm3
Molecular weight of H2SO4 = 98.07 g/mol
Concentration of 95 % - 98 % H2SO4
=1.84 g/cm3
98.07 g/mol×95
100× 1000
= 17.82 M
M1V1 = M2V2
where:
M1 = Concentration of 95 % - 98% H2SO4
V2 = Volume of 95 % - 98 % H2SO4
M2 = Concentration of 2 M H2SO4
V1 = Volume of 2 M H2SO4
(17.82 M)(V1) = (2 M)(1000 cm3)
V1 = 112.23 cm3
Volume of 95 % - 98% H2SO4 required to produce 2M H2SO4 is 112.23 cm3. The
remaining is topped up with deionised water.
Preparation of 0.1 M H2SO4 Solution
M1V1 = M2V2
where:
M1 = Concentration of 95 % - 98% H2SO4
V2 = Volume of 95 % - 98 % H2SO4
M2 = Concentration of 2 M H2SO4
V1 = Volume of 2 M H2SO4

(17.82 M)(V1) = (0.1 M)(1000 cm3)
V1 = 5.61 cm3
Volume of 95 % - 98% H2SO4 required to produce 0.1 M H2SO4 is 5.61 cm3. The
remaining is topped up with deionised water.
Preparation of 0.01 N KMnO4 Solution
Molarity,M (mol/L) =N (eq/L)
n (eq/mol)
MnO4− + 8H+ + 5e− ↔ Mn2+ + 4H2O
Molarity, M
=0.01
5
= 0.002 M
Molecular Weight of KMnO4 is 158.04 g/mol
Weight of KMnO4 in 1000 cm3 of 0.1 M H2SO4
= 0.002 M × 158.04 g/mol
= 0.3161 g
0.3161 g of KMnO4 crystals is dissolved in 0.1 H2SO4 in a 1000 mL volumetric flask.
Preparation of 0.01 N (NH4)2Fe(SO4)2·6H2O Solution
Molarity,M (mol/L) =N (eq/L)
n (eq/mol)
Fe2+ + e− ↔ Fe3+
Molarity, M
=0.01
1
= 0.01 M

Molecular Weight of KMnO4 is 391.99 g/mol
Weight of KMnO4 in 1000 cm3 of 0.1 M H2SO4
= 0.01 M × 391.99 g/mol
= 3.9199 g
3.9199 g of (NH4)2Fe(SO4)2·6H2O is dissolved in 0.1 H2SO4 in a 1000 mL volumetric
flask.
Preparation of Diphenylamine, Ph2NH indicator
1 g of diphenylamine was weighed and dissolved in a 10 mL of concentrated H2SO4.
Then the solution was transferred to a 100 mL volumetric flask and further top up with
concentrated H2SO4.

APPENDIX C: Redox Titration Procedure
Solutions Preparation
1) Preparation of Diphenylamine, Ph2NH indicator
1 g of diphenylamine was weighed and dissolved in a 10 mL of concentrated
H2SO4. Then the solution was transferred to a 100 mL volumetric flask and
further top up with concentrated H2SO4.
2) Preparation of 2 M H2SO4 Solution
Half of 1000 mL volumetric flask is filled with deionised water before adding
113 mL of concentrated H2SO4 into the volumetric flask. The remaining
volume is topped up with deionised water until the meniscus of liquid reached
the 1000 mL calibration mark. The volumetric flask is shaken thoroughly and
allowed to be cooled.
3) Preparation of 0.1 M H2SO4 Solution
Half of 1000 mL volumetric flask is filled with deionised water before adding
5.6 mL of concentrated H2SO4 into the volumetric flask. The remaining volume
is topped up with deionised water until the meniscus of liquid reached the 1000
mL calibration mark. The volumetric flask is shaken thoroughly and allowed
to be cooled.
4) Preparation of 0.01 N (NH4)2Fe(SO4)2·6H2O Solution
3.92 g of (NH4)2Fe(SO4)2·6H2O is weighed and dissolved in 10 mL of
concentrated H2SO4. Half of 1000 mL volumetric flask is filled with 0.1 M
H2SO4 before adding the dissolved (NH4)2Fe(SO4)2·6H2O into the volumetric
flask. The remaining volume is topped up with 0.1 M H2SO4 until the meniscus
of liquid reached the 1000 mL calibration mark. The volumetric flask is shaken
thoroughly and allowed to be cooled.
5) Preparation of 0.01 N KMnO4 Solution
0.3161 g of KMnO4 crystals is weighed and dissolved in 10 mL of concentrated
H2SO4. Half of 1000 mL volumetric flask is filled with 0.1 M H2SO4 before
adding the dissolved KMnO4 crystals into the volumetric flask. The remaining

volume is topped up with 0.1 M H2SO4 until the meniscus of liquid reached the
1000 mL calibration mark. The volumetric flask is shaken thoroughly and
allowed to be cooled.
6) Preparation of Sample Solutions
0.10 g of sample is weighed and dissolved in dissolved in 10 mL of
concentrated H2SO4. Half of 100 mL volumetric flask is filled with 2 M H2SO4
before adding the dissolved sample solution into the volumetric flask. The
remaining volume is topped up with 2 M H2SO4 until the meniscus of liquid
reached the 100 mL calibration mark. The volumetric flask is shaken
thoroughly and allowed to be cooled.
Experiment Set-up and Running Procedure
1) Set-up of Apparatus
- Two burettes are set up using retort stand
- One burette is filled with 0.01 N KMnO4 solution
- The other burette is filled with 0.01 N (NH4)2Fe(SO4)2·6H2O solution
- 100 mL sample solution is transferred to four 50 mL conical flask, each 20
mL.
2) Redox Titration Analysis
- Two conical flask filled with sample solution is titrated with KMnO4
solution and the volume is recorded as V1. Colour changes original solution
colour to pale purple.
- Add two drop of Ph2NH2 indicator into all four conical flasks and gently
shake it. The colour changes from purple to dark purple.
- Two conical flasks that was titrated with KMnO4 is titrated with
(NH4)2Fe(SO4)2·6H2O solution and the volume is recorded as V2. The dark
purple colour changes back to colour of original solution.
- The remaining two conical flasks is titrated with (NH4)2Fe(SO4)2·6H2O
solution and the volume is recorded as V3. Colour changes from dark purple
to colour of original solution.

APPENDIX D: Preparation of Solutions Used for ICP-OES
Preparation of 8 M HNO3 Solution
Density of HNO3 = 1.4090 g/cm3
Molecular weight of HNO3 = 63.0130 g/mol
Concentration of 65 % HNO3
=1.4090 g/cm3
63.0130 g/mol×65
100× 1000
= 14.53 M
M1V1 = M2V2
where:
M1 = Concentration of 65 % HNO3
V2 = Volume of 65 % HNO3
M2 = Concentration of 8 M HNO3
V1 = Volume of 8 M HNO3
(14.53 M)(V1) = (8 M)(1000 cm3)
V1 = 550 cm3
Volume of 65 % HNO3 required to produce 8 M HNO3 is 550 cm3. The remaining is
topped up with deionised water.

Preparation of Stock Solution for Phosphorus (P)
Molecular weight of NH4H2PO4
= 14.0031 + 6(1.0078) + 30.9738 + 4(15.9949)
= 115.0033 g/mol
For concentration of 50 ppm of stock solution for P,
50 ppm = 50mg/L = 0.05 g/L
Number of mole required to produce 50 ppm,
=0.05 g L⁄
30.9738 g mol⁄
= 0.001614 mol/L
Mass of NH4H2PO4 required to produce 50 ppm
= 0.001614mol L⁄ × 115.0033 g/mol
= 0.1856 g L⁄
Therefore, 0.1856 g of NH4H2PO4 is dissolved with deionised water in a 1000 mL
volumetric flask.
Preparation of standard solution of phosphorus (P)
M1V1 = M2V2
where:
M1 = Concentration of P stock solution (50 ppm)
V2 = Volume of P stock solution
M2 = Concentration of standard solution
V1 = Volume of standard solution
Example calculations for standard solution of 45 ppm
( 50 ppm)(V1) = (45 ppm)(100 cm3)
V1 = 50 cm3
Volume of 50 ppm stock solution of P required to produce 45 ppm standard solution
is 90 cm3. The remaining is topped up with deionised water.

Preparation of Stock Solution for Vanadium (V)
Molecular weight of NH4VO3
= 14.0031 + 4(1.0078) + 50.9440 + 3(15.9949)
= 116.963 g/mol
For concentration of 50 ppm of stock solution for V,
50 ppm = 50mg/L = 0.05 g/L
Number of mole required to produce 50 ppm,
=0.05 g L⁄
50.9440 g mol⁄
= 0.0009815 mol/L
Mass of NH4VO3 required to produce 50 ppm
= 0.0009815mol L⁄ × 116.963 g/mol
= 0.1148 g L⁄
Therefore, 0.1148 g of NH4VO3 is dissolved with deionised water in a 1000 mL
volumetric flask.
Preparation of standard solution of vanadium (V)
M1V1 = M2V2
where:
M1 = Concentration of V stock solution (50 ppm)
V2 = Volume of V stock solution
M2 = Concentration of standard solution
V1 = Volume of standard solution
Example calculations for standard solution of 30 ppm
( 50 ppm)(V1) = (30 ppm)(100 cm3)
V1 = 60 cm3
Volume of 50 ppm stock solution of V required to produce 30 ppm standard solution
is 60 cm3. The remaining is topped up with deionised water.

Preparation of Stock Solution for Cobalt (Co)
Molecular weight of Co(NO3)2
= 58.9332 + 2[14.0031 + 3(15.9949)]
= 183.9430 g/mol
For concentration of 50 ppm of stock solution for Co,
50 ppm = 50mg/L = 0.05 g/L
Number of mole required to produce 50 ppm,
=0.05 g L⁄
58.9332 g mol⁄
= 0.0008484 mol/L
Mass of Co(NO3)2 required to produce 50 ppm
= 0.0008484mol L⁄ × 183.9430 g/mol
= 0.1561 g L⁄
Therefore, 0.1561 g of Co(NO3)2 is dissolved with deionised water in a 1000 mL
volumetric flask.
Preparation of standard solution of vanadium (Co)
M1V1 = M2V2
where:
M1 = Concentration of Co stock solution (50 ppm)
V2 = Volume of Co stock solution
M2 = Concentration of standard solution
V1 = Volume of standard solution
Example calculations for standard solution of 15 ppm
( 50 ppm)(V1) = (15 ppm)(100 cm3)
V1 = 50 cm3
Volume of 50 ppm stock solution of Co required to produce 15 ppm standard
solution is 30 cm3. The remaining is topped up with deionised water.
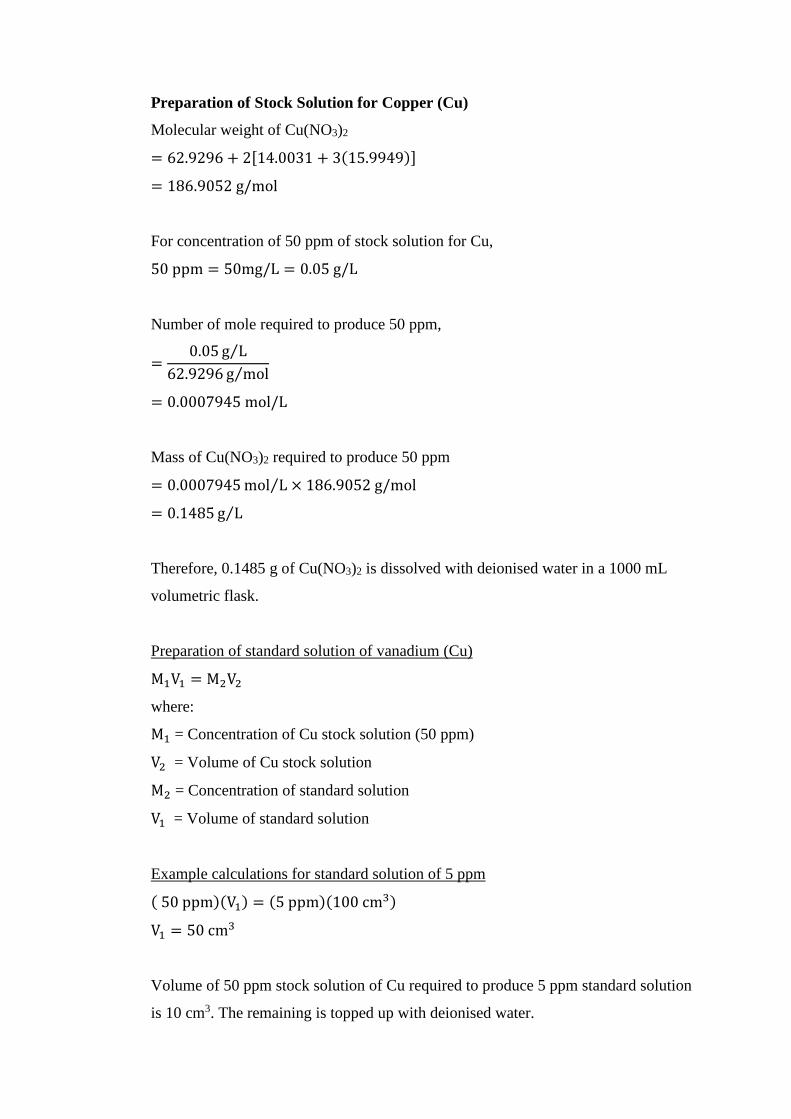
Preparation of Stock Solution for Copper (Cu)
Molecular weight of Cu(NO3)2
= 62.9296 + 2[14.0031 + 3(15.9949)]
= 186.9052 g/mol
For concentration of 50 ppm of stock solution for Cu,
50 ppm = 50mg/L = 0.05 g/L
Number of mole required to produce 50 ppm,
=0.05 g L⁄
62.9296 g mol⁄
= 0.0007945 mol/L
Mass of Cu(NO3)2 required to produce 50 ppm
= 0.0007945mol L⁄ × 186.9052 g/mol
= 0.1485 g L⁄
Therefore, 0.1485 g of Cu(NO3)2 is dissolved with deionised water in a 1000 mL
volumetric flask.
Preparation of standard solution of vanadium (Cu)
M1V1 = M2V2
where:
M1 = Concentration of Cu stock solution (50 ppm)
V2 = Volume of Cu stock solution
M2 = Concentration of standard solution
V1 = Volume of standard solution
Example calculations for standard solution of 5 ppm
( 50 ppm)(V1) = (5 ppm)(100 cm3)
V1 = 50 cm3
Volume of 50 ppm stock solution of Cu required to produce 5 ppm standard solution
is 10 cm3. The remaining is topped up with deionised water.
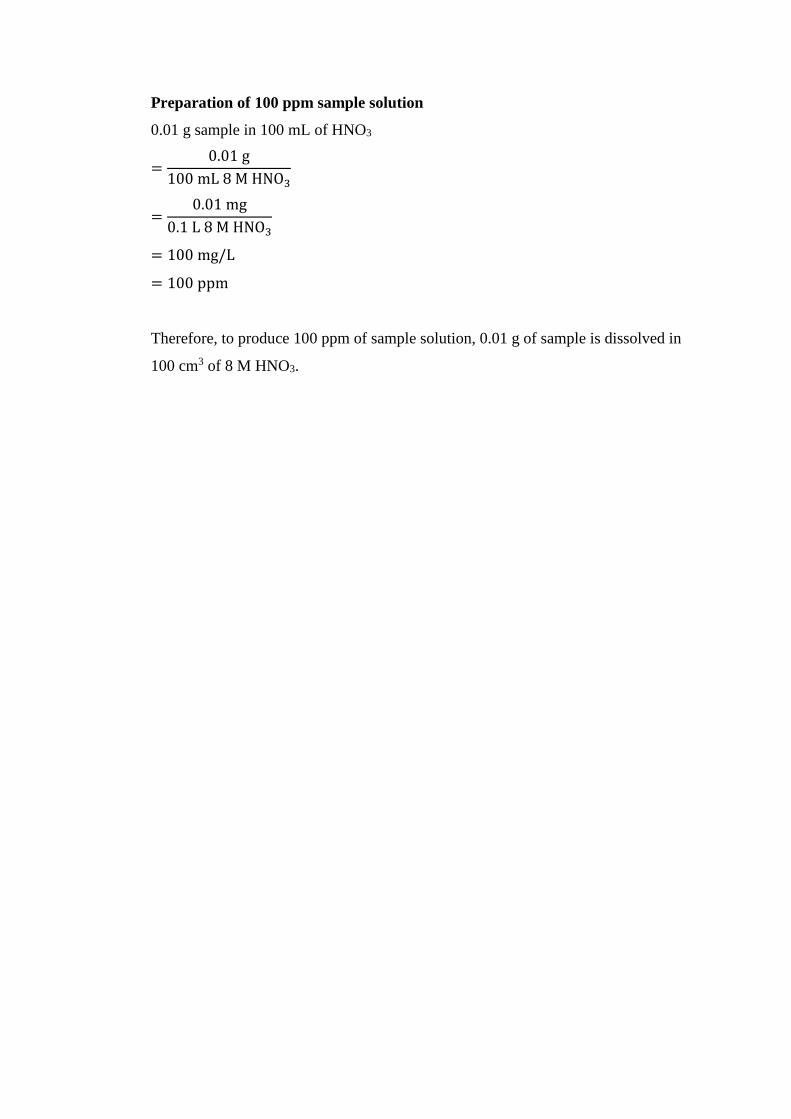
Preparation of 100 ppm sample solution
0.01 g sample in 100 mL of HNO3
=0.01 g
100 mL 8 M HNO3
=0.01 mg
0.1 L 8 M HNO3
= 100 mg/L
= 100 ppm
Therefore, to produce 100 ppm of sample solution, 0.01 g of sample is dissolved in
100 cm3 of 8 M HNO3.

APPENDIX E: Procedure for ICP-OES Analysis
Preparation of 8 M HNO3 Solution
About half of a 1000 cm3 volumetric flask is filled with deionised water and 550 cm3
of 65 % HNO3 is measured and added into the volumetric flask. The volumetric flask
is topped up with deionised water until the meniscus reached the calibration mark.
Preparation of blank HNO3 Solution
10 cm3 of 65 % HNO3 is measured and added into a 100 cm3 volumetric flask. Then,
the volumetric flask is topped up with deionised water until the meniscus reached the
calibration mark.
Preparation of P Standard Solution
0.1856 g of NH4H2PO4 is weighed and added into a 50 cm3 beaker. 10 cm3 of HNO3
and some deionised is added to dissolve the solid crystals. Half of 1000 cm3 volumetric
flask is filled with deionised water before transferring the dissolved sample into the
volumetric flask. The volumetric flask is topped up with deionised water until the
meniscus reached the calibration mark.
Five 100 cm3 volumetric flask is prepared. For first dilution, 90 cm3 of P stock
solution is transferred to the 100 cm3 volumetric flask and the topped up with deionised
water until the calibration mark to produce 45 ppm P standard solution. For second
dilution, 60 cm3 of stock solution is transferred to the 100 cm3 volumetric flask and
the topped up with deionised water until the calibration mark to produce 30 ppm P
standard solution. For third dilution, 30 cm3 of P stock solution is transferred to the
100 cm3 volumetric flask and the topped up with deionised water until the calibration
mark to produce 15 ppm P standard solution. For fourth dilution, 20 cm3 of P stock
solution is transferred to the 100 cm3 volumetric flask and the topped up with deionised
water until the calibration mark to produce 10 ppm P standard solution. For fifth
dilution, 10 cm3 of P stock solution is transferred to the 100 cm3 volumetric flask and
the topped up with deionised water until the calibration mark to produce 5 ppm P
standard solution.

Preparation of V Standard Solution
0.1148 g of NH4VO3 is weighed and added into a 50 cm3 beaker. 10 cm3 of HNO3 and
some deionised is added to dissolve the solid crystals. Half of 1000 cm3 volumetric
flask is filled with deionised water before transferring the dissolved sample into the
volumetric flask. The volumetric flask is topped up with deionised water until the
meniscus reached the calibration mark.
Five 100 cm3 volumetric flask is prepared. For first dilution, 90 cm3 of V stock
solution is transferred to the 100 cm3 volumetric flask and the topped up with deionised
water until the calibration mark to produce 45 ppm V standard solution. For second
dilution, 60 cm3 of V stock solution is transferred to the 100 cm3 volumetric flask and
the topped up with deionised water until the calibration mark to produce 30 ppm V
standard solution. For third dilution, 30 cm3 of V stock solution is transferred to the
100 cm3 volumetric flask and the topped up with deionised water until the calibration
mark to produce 15 ppm V standard solution. For fourth dilution, 20 cm3 of V stock
solution is transferred to the 100 cm3 volumetric flask and the topped up with deionised
water until the calibration mark to produce 10 ppm V standard solution. For fifth
dilution, 10 cm3 of V stock solution is transferred to the 100 cm3 volumetric flask and
the topped up with deionised water until the calibration mark to produce 5 ppm V
standard solution.
Preparation of Co Standard Solution
0.1561 g of Co(NO3)2 is weighed and added into a 50 cm3 beaker. 10 cm3 of HNO3
and some deionised is added to dissolve the solid crystals. Half of 1000 cm3 volumetric
flask is filled with deionised water before transferring the dissolved sample into the
volumetric flask. The volumetric flask is topped up with deionised water until the
meniscus reached the calibration mark.
Five 100 cm3 volumetric flask is prepared. For first dilution, 90 cm3 of Co stock
solution is transferred to the 100 cm3 volumetric flask and the topped up with deionised
water until the calibration mark to produce 45 ppm Co standard solution. For second
dilution, 60 cm3 of Co stock solution is transferred to the 100 cm3 volumetric flask and
the topped up with deionised water until the calibration mark to produce 30 ppm Co
standard solution. For third dilution, 30 cm3 of Co stock solution is transferred to the
100 cm3 volumetric flask and the topped up with deionised water until the calibration
mark to produce 15 ppm Co standard solution. For fourth dilution, 20 cm3 of Co stock

solution is transferred to the 100 cm3 volumetric flask and the topped up with deionised
water until the calibration mark to produce 10 ppm Co standard solution. For fifth
dilution, 10 cm3 of Co stock solution is transferred to the 100 cm3 volumetric flask and
the topped up with deionised water until the calibration mark to produce 5 ppm Co
standard solution.
Preparation of Cu Standard Solution
0.1485 g of Cu(NO3)2 is weighed and added into a 50 cm3 beaker. 10 cm3 of HNO3
and some deionised is added to dissolve the solid crystals. Half of 1000 cm3 volumetric
flask is filled with deionised water before transferring the dissolved sample into the
volumetric flask. The volumetric flask is topped up with deionised water until the
meniscus reached the calibration mark.
Five 100 cm3 volumetric flask is prepared. For first dilution, 90 cm3 of Cu stock
solution is transferred to the 100 cm3 volumetric flask and the topped up with deionised
water until the calibration mark to produce 45 ppm Cu standard solution. For second
dilution, 60 cm3 of Cu stock solution is transferred to the 100 cm3 volumetric flask and
the topped up with deionised water until the calibration mark to produce 30 ppm Cu
standard solution. For third dilution, 30 cm3 of Cu stock solution is transferred to the
100 cm3 volumetric flask and the topped up with deionised water until the calibration
mark to produce 15 ppm Cu standard solution. For fourth dilution, 20 cm3 of Cu stock
solution is transferred to the 100 cm3 volumetric flask and the topped up with deionised
water until the calibration mark to produce 10 ppm Cu standard solution. For fifth
dilution, 10 cm3 of Cu stock solution is transferred to the 100 cm3 volumetric flask and
the topped up with deionised water until the calibration mark to produce 5 ppm Cu
standard solution.
Preparation of Sample Solution
To produce 100 ppm of sample solution, 0.01 g of sample is dissolved in 100 cm3 of
8 M HNO3.

APPENDIX F: P/V Atomic Ratio from ICP-OES analysis
Calculations of P/V atomic ratio using data obtained from ICP-OES analysis
P
V=Concentration of P / Atomic Weight of P
Concentration of V / Atomic Weight of V
Example calculations
For VPOBulk:
Average concentration of P = 3.380 mg/L
Average concentration of V = 5.121 mg/L
Atomic Mass of Phosphate, P = 30.9738 g/mol
Atomic Mass of Vanadium, V = 50.9440 g/mol
P
V=3.380 mg/L ÷ 30.9738 g/mol
5.121 mg/L ÷ 50.9440 g/mol
= 1.0855

APPENDIX G: Calculation for Average Oxidation State of Vanadium (VAV)
Calculations of P/V atomic ratio using data obtained from ICP-OES analysis
According to Niwa and Murakami,
V4+ + 2V3+ = 20 [MnO4-] V1
V5+ + V4+ + V3+ = 20 [Fe2+] V2
V5+ = 20 [Fe2+] V3
[MnO4-] = 0.01 N
[Fe2+] = 0.01 N
V4+ + 2V3+ = 0.2 V1 (1)
V5+ + V4+ + V3+ = 0.2 V2 (2)
V5+ = 0.2 V3 (3)
Equation (2) – (3),
V4+ + V3+ = 0.2 V2 – 0.2 V3
V4+ = 0.2 V2 – 0.2 V3 – V3+ (4)
Substitute Equation (4) in (1) and rearrange,
V3+ = 0.2 V1 – 0.2 V2 + 0.2 V3 (5)
Substitute Equation (5) in (4)
V4+ = 0.4 V2 – 0.4 V3 - 0.2 V1
Thus,
V3+ = 0.2 V1 – 0.2 V2 + 0.2 V3
V4+ = 0.4 V2 – 0.4 V3 - 0.2 V1
V5+ = 0.2 V3
Average Oxidation State:
VAV =3V3+ + 4V4+ + 5V5+
V3+ + V4+ + V5+

Example calculations
For VPOBulk:
Average V1 = 5.45
Average V2 = 6.85
Average V3 = 7.9
V3+ = 0.2 (5.45) – 0.2 (6.85) + 0.2 (7.9) = 1.3
V4+ = 0.4 (6.85) – 0.4 (7.9) - 0.2 (5.45) = 1.51
V5+ = 0.2 (7.9) = 1.58
VAV =3(1.3) + 4(1.51) + 5(1.58)
1.3 + 1.51 + 1.58
= 4.2044
The calculated results are tabulated as table below:
VPOBulk KMnO4
V1
(NH4)2Fe(SO4)2
V2
(NH4)2Fe(SO4)2
V3
1 2 1 2 1 2
Initial (cm3) 0 5.3 0 6.9 0 7.9
Final (cm3) 5.3 10.9 6.9 13.6 7.9 15.8
Volume used (cm3) 5.3 5.6 6.9 6.8 7.9 7.9
Average 5.45 6.85 7.9
VAV = 4.2044 V4+ = 79.56 % V5+ = 20.44 %
VPOCo1% KMnO4
V1
(NH4)2Fe(SO4)2
V2
(NH4)2Fe(SO4)2
V3
1 2 1 2 1 2
Initial (cm3) 0 5.9 0 7.0 0 6.5
Final (cm3) 5.9 11.8 7.0 14.4 6.5 12.9
Volume used (cm3) 5.9 5.9 7.0 7.4 6.5 6.4
Average 5.9 7.2 6.45
VAV = 4.1806 V4+ = 81.94 % V5+ = 18.06 %

VPOCu1% KMnO4
V1
(NH4)2Fe(SO4)2
V2
(NH4)2Fe(SO4)2
V3
1 2 1 2 1 2
Initial (cm3) 0 6.2 0 8.3 16.3 23.5
Final (cm3) 6.2 12.3 8.3 16.3 23.5 30.9
Volume used (cm3) 6.1 6.1 8.3 8.0 7.2 7.4
Average 6.15 8.15 7.3
VAV = 4.2454 V4+ = 75.46 % V5+ = 24.54 %
VPOCu1%Co1% KMnO4
V1
(NH4)2Fe(SO4)2
V2
(NH4)2Fe(SO4)2
V3
1 2 1 2 1 2
Initial (cm3) 0 9.3 0 8.9 0 7.1
Final (cm3) 9.3 18.4 8.9 17.5 7.1 7.2
Volume used (cm3) 5.7 5.9 8.5 8.2 7.1 7.3
Average 5.8 8.35 7.2
VAV = 4.3054 V4+ = 69.46 % V5+ = 30.54 %

APPENDIX H: Calculation for Reduction Activation Energy (Er) for TPR Analysis
Required Formulas to Calculate Reduction Activation Energy (Er)
Ea = Tm × 0.066 where Tm = temperature maxima
χ = Ae(−EaRTm
)
where A = 1 × 10¹³
R = 0.001987 kcal K-1 mol-1
χ = 0.03754 s-1
[H2] =P
RT
where P = Pressure (atm)
T = Ambient temperature (298 K)
R = 82.056 cm3 atm K-1 mol
[H2] = 4.036 × 10⁻⁷ mol cm3
Er = RTm ln [A(H2)
χ] where R = 0.001987 kcal K-1 mol-1
Example Calculations
For VPOBulk,
Peak 1 (Tm = 703 K):
Er = RTm ln [A(H2)
χ]
= (0.001987)(703) ln [(1 × 10¹³)(4.306 × 10⁻⁷)
0.03754]
= 108.0824 kJ/mol
Peak 2 (Tm = 932 K):
Er = RTm ln [A(H2)
χ]
= (0.001987)(932) ln [(1 × 10¹³)(4.306 × 10⁻⁷)
0.03754]
= 143.2899 kJ/mol

APPENDIX I: Calculation for Amount of Oxygen Removed
Formulas Required to Calculate Amount of Oxygen Removed
Amount of oxygen removed
= amount of oxygen (mol/g) × Avogadro′s number (atom/g)
= amount of oxygen (mol/g) × 6.02 × 10²³ atom/g
Example Calculations
For VPOBulk,
Peak 1:
Amount of oxygen removed = 76.74359 μmol/g
= 7.67 × 10⁻⁵ mol/g
= 7.67 × 10⁻⁵ mol/g × 6.02 × 10²³ atom/g
= 4.62 × 10¹⁹ atom/g
Peak 2:
Amount of oxygen removed = 169.48831 μmol/g
= 1.69 × 10⁻⁴ mol/g
= 1.69 × 10⁻⁴ mol/g × 6.02 × 10²³ atom/g
= 1.02 × 10²⁰ atom/g