Synopsis of the Hong Kong Seafood Market - eos.ucs.uri.edu Hong Kong... · to another influx of...
48
Synopsis of the Hong Kong Seafood Market Quentin Fong and Qiujie Zheng Published by Alaska Sea Grant University of Alaska Fairbanks
Transcript of Synopsis of the Hong Kong Seafood Market - eos.ucs.uri.edu Hong Kong... · to another influx of...

Synopsis of the Hong Kong Seafood MarketQuentin Fong and Qiujie Zheng
Published by Alaska Sea GrantUniversity of Alaska Fairbanks
Copyright 2016 Alaska Sea GrantMAB-68
Citation:Fong, Q., and Q. Zheng. 2016. Synopsis of the Hong Kong Seafood Market. Alaska Sea Grant, University of Alaska Fairbanks, MAB-68, Fairbanks. http://doi.org/10.4027/shksm.2016
CreditsAlaska Sea Grant is supported by the US Department of Commerce, NOAA National Sea Grant, grant NA14OAR4170079 (A/152-32) and by the University of Alaska Fairbanks with state funds. Sea Grant is a partnership with public and private sectors combining research, education, and extension. This national network of universities meets changing environ-mental and economic needs of people in coastal, ocean, and Great Lakes regions. Alaska Sea Grant, School of Fisheries and Ocean Sciences, University of Alaska Fairbanks.
Alaska Sea Grant University of Alaska Fairbanks Fairbanks, Alaska 99775-5040 (888) 789-0090 www.alaskaseagrant.org
NAT
ION
AL
OC
EA
NIC AND ATMOSPHERIC ADM
INIS
TR
ATIO
N
U.S. DEPARTMENT OF COMM
ERC
E

Table of Contents
1. Hong Kong Background ...................................................................................1
History .............................................................................................................1
Hong Kong today ........................................................................................... 2
Why Study the Hong Kong seafood market? ................................................. 3
2. Hong Kong’s Food Retail and Food Service Landscape ................................. 4
Food retail establishments ............................................................................. 4
Food service ....................................................................................................7
3. Hong Kong Seafood Trade and Production ...................................................10
Seafood trade with the United States ...........................................................10
Finfish ...........................................................................................................12
Crustaceans .................................................................................................. 20
Aquatic invertebrates other than crustaceans ............................................. 24
4. Hong Kong Seafood Market: Distribution System from Ocean to Plate .......31
Introduction ...................................................................................................31
Frozen seafood ..............................................................................................31
Highlight: sea cucumbers from Alaska ............................................................32
Dried seafood ............................................................................................... 33
Highlight: shark fins .................................................................................... 34
Live and fresh seafood ................................................................................. 36
Highlight: at-sea live finfish distribution in Hong Kong ...............................37
5. Trends Impacting Hong Kong Seafood Sales for US Seafood Producers ..... 40
6. Hong Kong Seafood: Further Reading and Bibliography ..............................43
Acknowledgments ............................................................................................ 44

Synopsis of the Hong Kong Seafood MarketQuentin FongSeafood Marketing Specialist and Associate ProfessorAlaska Sea Grant Marine Advisory ProgramUniversity of Alaska FairbanksKodiak, Alaska
Qiujie Zheng Assistant ProfessorEconomics DepartmentUniversity of Alaska AnchorageAnchorage, Alaska
Using the thorough details about the Hong Kong seafood market in this publication, US seafood exporters, policy makers, and NGOs can make informed decisions on potential trade and marketing of Alaska/US seafood products in Hong Kong. Included are a history of the Hong Kong economy, the current food marketing structure, and seafood import and export statistics with source coun-tries and seafood species. Key information is presented on popular seafood items and product forms, sales and restaurant venues, as well as Hong Kong consumer habits and trends. US seafood products have established a niche in the Hong Kong market because US seafood and food prod-ucts traditionally are perceived as high quality and safe, and often command a price premium that places their products in the high-end markets.

Synopsis of the Hong Kong Seafood Market 1
Hong Kong is located in East Asia bordering the South China Sea (Fig. 1.1). It consists of roughly 200 islands and a penin-sula with an area of approximately 1,100 square kilometers (425 square miles) (Fig. 1.2).
HistoryAs one of the world’s top five financial centers today, Hong Kong was first incorporated into imperial Chinese rule dur-ing the Qin dynasty (221-206 BCE). After that, the island group became more economically developed as people immigrated from northern China; their livelihoods were largely driven by salt production, fishing, and pearl har-vesting. During the Qing dynasty (1644-1911 CE), the last imperial dynasty of China, Hong Kong became a military outpost and trading port, due principally to the desire by European nations for Chinese goods such as silk and por-celain as well as pressure to obtain monetary profits from selling imported commodities including tea and opium to the Chinese. In 1841, Hong Kong became a British colony
after China lost the First Opium War. That conflict stemmed from a Chinese refusal to allow the importation of opium by British profiteers.
Under British rule, Hong Kong underwent major cul-tural, infrastructural, and economic transformations that helped build the foundations of today’s Hong Kong as an international center of commerce and finance. After Hong Kong had become a sovereign part of the British Empire, most of the British-owned businesses in southern China moved there. Moreover, with Hong Kong as a develop-ing trading center, new businesses from England were encouraged to establish offices in Asia. To help facilitate
1. Hong Kong Background
the efficiency of commerce, a Western style education sys-tem was introduced, including universities and schools of Western medicine. Mechanical transportation such as trams, ferries, automobiles, and airlines replaced more traditional modes of transportation: human and animal. Further tech-nological progress included the introduction of commercial energy systems such as electricity and natural gas. Finally, modern financial and banking systems were introduced, led by the Hong Kong and Shanghai Bank Corporation that was established in 1865.
As the British more firmly established themselves in Hong Kong during the late 19th and early 20th century, the Qing dynasty went into decline. Sun Yat Sen helped insti-gate a revolution that overthrew the last Chinese imperial dynasty and deposed the six-year-old emperor Pu Yi in 1911. Following Sun Yat Sen’s brief three month presidency was an era dominated by warlords vying for military control that lasted from 1916 to the 1930s. The mid 1930s also saw the start of the Sino-Japanese conflict, a prelude to World War II. Seeking stability and to escape both war and famine, many refugees fled to Hong Kong seeking greater opportunities. The arrival of new immigrants also brought new capital and manufacturing skills to the British enclave. By 1941, Hong
Figure 1.1. Hong Kong location.
Figure 1.2. The Territory of Hong Kong. Hong Kong is a Special Administrative Region of the People’s Republic of China. It is a city of 7.3 million inhabitants with a land mass of 425 square miles. The majority of Hong Kong’s residents are eth-nic Chinese. Source: University of Texas Libraries.
2 Synopsis of the Hong Kong Seafood Market
Kong’s largest manufacturing industries were shipbuilding, textiles, flashlights, and plastic shoes. At the same time, the banking and financial services industry continued to flour-ish, working closely with import/export operations whose focus was on mainland China.
Japan invaded and occupied Hong Kong from 1941 to 1945. During its World War II occupation, Hong Kong’s manufacturing capacity went into decline and many of its industries were destroyed. After World War II and until the late 1970s, Hong Kong underwent a renewed process of industrialization establishing itself as one of the more nim-ble manufacturing centers in the world. This was largely due to another influx of capital, coupled with cheap and skilled labor from mainland China as a result of the Chinese Civil War between Chiang Kai Shek’s Kuomintang of China and Mao Zedong’s Communist Party of China. The communists won in 1949, leading to the establishment of the People’s Republic of China (PRC). Due to the trade embargo on mainland China stemming from Cold War politics, Hong Kong manufacturers adopted an export oriented strategy. Clothing, electronics, and plastic products became their mainstay. At the same time, the Hong Kong government sup-ported Hong Kong manufacturing enterprises by adopting a free port policy and establishing public housing to ensure lower costs of living and continued inexpensive labor. The government also invested in infrastructure such as ports and harbor facilities to facilitate commerce and, at the same time, induced compulsory free education to the secondary level to support development of a skilled workforce.
In the late 1970s under Deng Xiaoping, the PRC reopened its economy and thus investments. Facing higher labor costs coupled with dwindling land resources and stiff competition from other Asian countries, the so-called paper tigers, Hong Kong manufacturers moved their opera-tions across the border into China, settling around the Pearl River Delta in the Province of Guangdong. As the economy of China continued to open up in subsequent years, Hong Kong transformed itself from its manufacturing roots into a service-based economy as well as re-establishing itself into an an intermediary center of transshipment into China.
On July 1, 1997, the British turned the administration of Hong Kong over to China and Hong Kong became a Special Administrative Region (SAR) of the People’s Republic of China. The city is able to retain much of its autonomy except in defense matters. This means it retains its capitalist busi-ness system, free trade and freedom of speech, independence in the judiciary, and the primacy of the rule of law under the “One Country, Two Systems” arrangement.
Hong Kong todayThe population of Hong Kong today numbers more than 7 million, with 100% of the population living in urban areas. Of Hong Kong residents, 93.1% are ethnic Chinese, 1.9% Filipino, 1.9% Indonesian, and 3% categorized as other.
English and Chinese are the official languages of Hong Kong but Cantonese, a southern Chinese dialect originating from Guangdong Province, is the most prevalent language used for day-to-day communication, though many local Chinese are bilingual with English as their second language.
Hong Kong’s economy is highly dependent on interna-tional finance and trade. In terms of market capitalization, the Hong Kong Stock Exchange is the eighth largest in the world and the fourth largest in Asia. This has been achieved because Hong Kong has established itself as the premier stock market for Chinese firms listing abroad. In 2013, 797 of the listed companies were Chinese, with a total mar-ket capitalization of $3.1 trillion USD. Companies in Hong Kong also assisted in China’s economic growth. Hong Kong–based enterprises accounted for China’s investment in over 100,000 enterprises operating in Guangdong Province alone. Cumulative utilized capital inflow from Hong Kong totaled $832.3 billion USD in 2015, accounting for 50.8% of mainland China’s total. Mainland China is also the leading investor in Hong Kong, amounting to $448 billion USD in 2014, 30.1% of the total investment by countries other than Hong Kong itself.
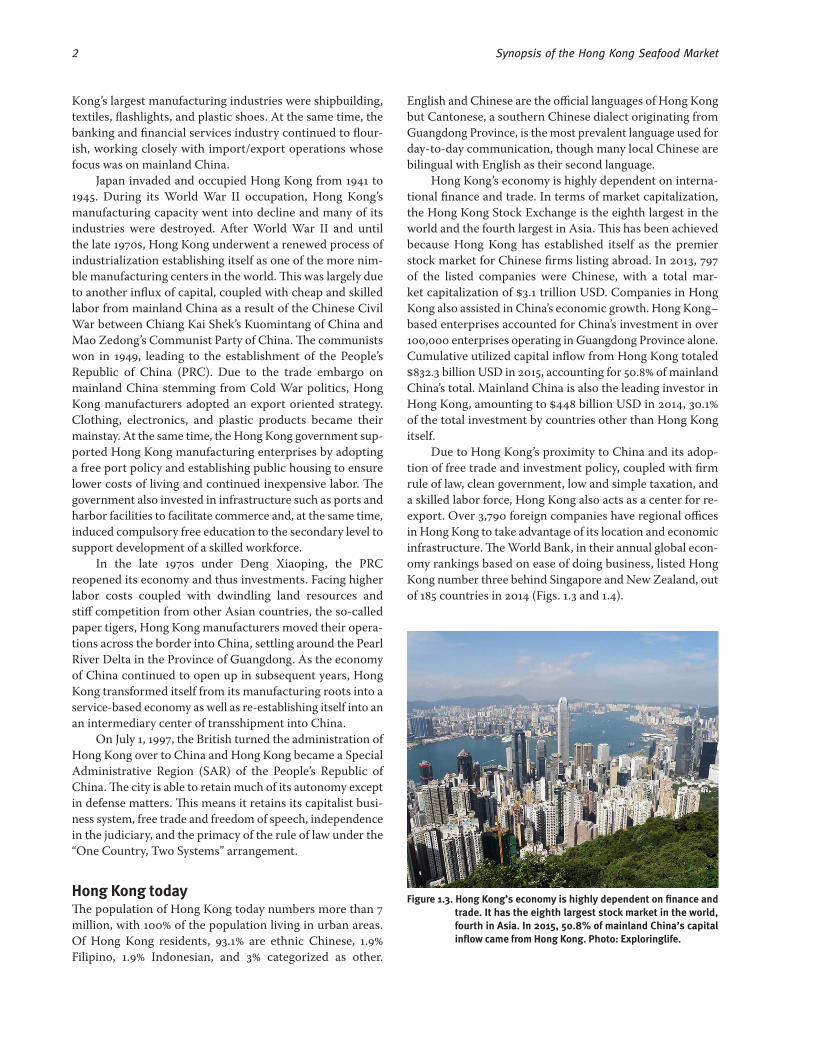
Due to Hong Kong’s proximity to China and its adop-tion of free trade and investment policy, coupled with firm rule of law, clean government, low and simple taxation, and a skilled labor force, Hong Kong also acts as a center for re-export. Over 3,790 foreign companies have regional offices in Hong Kong to take advantage of its location and economic infrastructure. The World Bank, in their annual global econ-omy rankings based on ease of doing business, listed Hong Kong number three behind Singapore and New Zealand, out of 185 countries in 2014 (Figs. 1.3 and 1.4).
Figure 1.3. Hong Kong’s economy is highly dependent on finance and trade. It has the eighth largest stock market in the world, fourth in Asia. In 2015, 50.8% of mainland China’s capital inflow came from Hong Kong. Photo: Exploringlife.

Synopsis of the Hong Kong Seafood Market 3
Why study the Hong Kong seafood market? Why study Hong Kong’s seafood market, since it has a pop-ulation of only 7 million? The Hong Kong seafood market can be viewed as a proxy for the market in China, particu-larly that of the southern region, for the following reasons:
1. When China opened their economy in the late 1970s, one of the first groups of entrepreneurs that estab-lished businesses in mainland China was from Hong Kong. Not only did these entrepreneurs bring their technical and business knowledge to a communist market economy, they also brought their tastes and preferences into China, including food preferences.
2. Even as China’s economy, society, and culture con-tinue opening to outside investment and influence, the Hong Kong culture continues to influence mainland China. For example, Hong Kong singers and movie stars are highly popular in the mainland China mar-ket. In the food business, many mainland Chinese restaurants bill themselves as “Hong Kong style” to differentiate from the competition.
3. Products that are sold in Hong Kong have a reputa-tion of high quality and authenticity. Mainland visitors to Hong Kong do not hesitate to pay higher prices for cosmetics, milk powder, herbal medicine, and traditional dried seafood products to bring back to mainland China. These visitors will also not hesitate to spend money in restaurants knowing what they order will be of good quality. In 2015, visitors spent about
$21.4 billion USD in Hong Kong. Of the 59.3 million visitors, more than 77% (45.8 million) were from the mainland. Mainland Chinese visitors to Hong Kong, by experiencing its culture including food trends, bring their experiences, tastes, and preferences back to China.
4. China is one of the largest seafood producing coun-tries in the world. China also has a significant seafood re-processing industry. For instance, a large portion of the seafood harvested in and around Alaska is sent to China to be reprocessed, and then sold back to the United States and the rest of the world. For example, in 2015 the US exported $1.1 billion USD (444,147 metric tons [t]) of seafood to China. During the same year, the US imported $2.7 billion USD (568,037 t) of seafood from China. Moreover, China imports from Russia some of the same species that Alaska produces (e.g., pink salmon and pollock). Thus based on import and export statistics alone it is nearly impossible to deter-mine how much of the product that the US exported to China remains in China for domestic consumption. On the other hand, Hong Kong is a city state where less than 5% of its land mass is suitable for agricul-ture. Hong Kong also has one of the most expensive real estate markets in the world, constraining the development of large scale food processing and food manufacturing industries. Almost all raw food mate-rials for consumption are imported. Thus most of the food Hong Kong imports is consumed in Hong Kong.
Figure 1.4. Central District, Hong Kong. Hong Kong is a food import–dependent city-state, with 95% of food and beverage prod-ucts imported globally. In 2015 local production accounted for 7.8% of fresh vegetables, 59.5% of live poultry, and 7.1% of live pigs consumed.

4 Synopsis of the Hong Kong Seafood Market
Hong Kong residents spend a high percentage of their house-hold budgets on food. During the survey period of 2014-15 a Household Expenditure Survey conducted by the Hong Kong Census and Statistics Department showed that Hong Kong residents allocated 27% of their total monthly spend-ing to food ($322.26 USD per person), which ranked second to housing (36%). Of the total spent on food, 66% ($212.69 USD) is spent on food away from home, while 34% ($109.57 USD) is spent for food consumed at home.
Aside from the 7.3 million Hong Kong residents, Hong Kong is one of Asia’s premier visitor destinations, both for business and pleasure. In 2015, Hong Kong hosted 59.3 mil-lion visitors, who spent $42.86 billion USD including funds spent on food.
Food retail establishmentsThe overall food retail market is highly competitive. Altogether, there are 15,420 food retail establishments. Of these, 3,660 are supermarkets and grocery stores. The remaining 11,330 establishments are retail stores offering spe-cific product categories such as rice, roasted meat, or bean curd and bean products, and 1,320 convenience stores such as 7-Eleven, Circle K, etc.
In 2015, consumers bought approximately $8.77 billion USD worth of food items in Hong Kong, with $4.44 billion USD (50.62%) spent in supermarkets, and the remainder spent in non-supermarket food retail establishments (Table 2.1). For supermarkets and grocery stores, Hong Kong has
2. Hong Kong’s Food Retail and Food Service Landscape
Table2.1.2015HongKongfoodretailexpenditures.Typeofretailoutlet $USDbillion
AllHongKongretailoutletscombined 61.29Non-supermarketfoodretailoutlets 4.44a.Fish,livestock,andpoultry,freshorfrozen 1.38b.Fruitsandvegetables,fresh 0.31c.Bread,pastry,confectionary,andcookies 1.46d.Otherfood,notclassified 1.28Supermarketsandsupermarketsectionsofdepartmentstores 4.33a.Fresh/chilledmeat,fish,seafood,fruitsandvegetables,andfrozenfood 1.46b.Dairyproductsandeggs,non-alcoholicdrinks,riceandnoodles,andotherfoods 2.87Source:HongKongCensusandStatisticsDepartment
Figure 2.1. Wellcome Supermarket Superstore, part of the Dairy Farm Group in Causeway Bay. Wellcome and Park N Shop are the two dominant supermarket chains in Hong Kong.
Figure 2.2. The retail food market in Hong Kong is highly competitive and differentiated. A Wellcome supermarket is only about 100 feet away from a Kai Bo Food supermarket in the Western District. Market Place by Jasons, which shares the same par-ent company (Dairy Farm Group) with Wellcome, is located only 300 feet away. Jasons caters to ex-patriots and upper middle income Chinese in the district.

Synopsis of the Hong Kong Seafood Market 5
two dominant chains. Wellcome, a chain owned by the Dairy Farm Group (Fig. 2.1), operates 279 stores in Hong Kong, while Park N Shop, a subsidiary of the CK Hutchison Holdings Limited, operates 226 stores throughout the territory.
Supermarkets in Hong Kong are highly competitive, serving different market segments and preferences of Hong Kong residents (Fig. 2.2). The Dairy Farm Group not only owns the Wellcome supermarket chain (Fig. 2.3), but also Oliver’s (1 store), ThreeSixty (1 store), and Market Place by Jasons (31 stores), each of which serves specific market seg-ments. While the Wellcome supermarket business model is to deliver customer value through lower prices and conve-nience, Oliver’s is a high-end food and wine store stocking specialty cheeses, meats, and sauces from around the world. It is located in the Central District at the heart of Hong Kong’s financial center (Fig. 2.4). This location draws many high-income consumers who are particularly amenable to specialty food items. Market Place by Jasons, with 12 stores on Hong Kong Island, 11 in Kowloon, and eight in the New Territories, brands itself as a “lifestyle” supermarket chain (Fig. 2.5). To meet the increasing demand for organic and nat-ural foods, the Dairy Farm Group established the ThreeSixty supermarket that carries an extensive selection of natural food products and environmental/earth friendly household items.
Many retail establishments that sell specific food cate-gories cluster around wet markets. Wet markets are open-air grocery stalls that emphasize freshness and are specialized to a single product category such as seafood, meat, or veg-etables but seldom a combination (Fig. 2.6). In the past, wet
Figure 2.3. A Wellcome supermarket in the Sheung Wan area of Hong Kong. Wellcome caters to middle class local Chinese con-sumers. Of the 279 Wellcome stores throughout Hong Kong, 254 operate as neighborhood grocery outlets stocked with variety of items, with a footprint of around 3,000 to 4,000 square feet. Wellcome also operates 25 stores as “super-stores” offering a greater variety of products and services on a much larger footprint.
Figure 2.4. Oliver’s supermarket, a high-end food and wine store located in the Central District of Hong Kong.
Figure 2.5. Market Place by Jasons is a grocery chain under the Dairy Farm Group that markets itself as a lifestyle supermarket, with a variety of specialty and international products not car-ried in traditional Hong Kong supermarkets. Grocery items are available that cater to a Western palate such as lasagna noodles, cheeses from Oregon (US), and rice milk that are not carried at Wellcome, a sister supermarket brand.

6 Synopsis of the Hong Kong Seafood Market
Figure 2.6. A wet market in the Wan Chai District. Each neighborhood in Hong Kong has its cluster of food retail markets. For the traditional wet markets, a patron would buy fish from a stall that specializes in seafood, tofu from a stall that special-izes in soy products, and vegetables from a vegetable stall.
Figure 2.7. Wet market butcher at North Point. The traditional way of buying groceries in a wet market is to tell the seller what you want, for example two catties (36 ounces) of pork belly for Chinese stew. Then they will pick it out for you. In wet market transactions, personal rapport and the trust that developed through the transaction is part of the culture.
Figure 2.8. Vegetable stalls at the Western Market. The Hong Kong Government built indoor facilities to house and consolidate wet market merchants to ensure food is sold in sanitary and safe conditions, and to provide affordable space for mer-chants to do business since Hong Kong now has some of the most expensive real estate in the world.
Figure 2.9. Seafood stall in the North Point District.
Figure 2.10. Entertaining a foreign guest in a traditional Chinese/Cantonese restaurant. Unlike the Western restaurant style, food is shared and usually the host does all the ordering. For this dinner, not only was the host entertaining a for-eign guest, they were also celebrating a birthday. The dishes were roasted piglet, fried whole chicken, steamed live grou-per, fried shrimp, vegetable stew, stir fried vegetables, noodles (a symbolic dish for longevity), and soup, followed by dessert and fruit. For 12 people the cost was about $425 USD, not including drinks and tips.

Synopsis of the Hong Kong Seafood Market 7
markets were open stalls that lined certain streets but over recent decades, the Hong Kong government built structures to specifically house the wet market stalls. These stalls are mostly family owned and their businesses, in large measure, depend on personal relationships through customer ser-vice and subsequent loyalty. It is not unusual for a stall to sell its products to a customer base spanning multiple gen-erations. For instance, author Quentin Fong’s mother and grandmother have been going to the same vegetable stand, the same butcher, etc., for more than 30 years (Figs. 2.7-2.9). In 2015, 500 retail establishments sold dried or preserved seafood, and 3,150 establishments sold fresh or frozen sea-food or meat.
Food serviceAs an international finance and trading center, Hong Kong offers a wide range of international cuisine for every bud-get. In 2015, there were 14,850 food service establishment in Hong Kong. Of those, 4,830 were Chinese restaurants (Fig. 2.10); 1,290 restaurants served Japanese cuisine (Fig. 2.11); another 1,030 restaurants served other ethnic cuisine such as Korean, Thai, Vietnamese, French, or Italian (Figs. 2.12 and 2.13); and 1,590 were fast food shops. The rest were restau-rants of unspecified type and/or ethnic origin, caterers, stalls at a food court, and takeouts. In terms of restaurant receipts and purchases, consumers, both visitors and residents, spent $13.46 billion USD in Hong Kong restaurants in 2015 (Table 2.2). Out of the billions spent, Chinese restaurants garnered 45% ($6.12 billion USD) of market share. This was followed by non-Chinese restaurants (29%, $3.86 billion USD), and fast-food shops (18%, $2.43 billion USD). Other restaurant establishments made up the remainder, with 8% ($1.04 billion USD). In sum, the Hong Kong food service market is highly differentiated, with a wide variety of cuisines satisfying con-sumers of different ethnicity and income levels (Figs. 2.14 and 2.15). Hong Kong also has many international restaurant franchises familiar to US citizens, including McDonalds (Fig. 2.16), Kentucky Fried Chicken, Subway, Outback Steakhouse, and Starbucks.
In addition to international franchises, locally oper-ated chains have built successful businesses as well. One of the largest food and beverage establishments in Hong Kong, founded by two brothers in 1956, Maxim’s Group operates eight kinds of outlets (e.g., Cantonese, Chiu Chow, Western, bakeries) consisting of 510 outlets and 58 brands (Fig. 2.17, Table 2.3). Café De Coral Holdings Ltd. (Figs. 2.18-2.20) is another notable locally owned food and beverage estab-lishment with a multi-brand quick service and mid-price restaurant food and beverage operation with 242 outlets (Fig. 2.21). Another is Fairwood Holdings Ltd., a quick ser-vice restaurant operator with 117 outlets. These three Hong Kong–owned food and beverage businesses also have estab-lished operations in mainland China.
Figure 2.11. A Japanese sushi restaurant in Hung Hom, Kowloon. Japanese cuisine is very popular in Hong Kong, with close to 1,300 Japanese restaurants.
Figure 2.12. Hong Kong offers a variety of different cuisines. Café Deco is the flagship outlet of Café Deco Group, an Art Deco–themed international restaurant with spectacular views over Hong Kong from Victoria Peak
Figure 2.13. Café Deco’s menu offers a variety of Asian and Western dishes including tandoori specialties, pizzas, barbecue and roasted dishes, fresh pasta and fresh oysters, as well as sushi. The restaurant group partnered with World Wildlife Fund Hong Kong in sourcing sustainable seafood items.

8 Synopsis of the Hong Kong Seafood Market
Table2.2.2015HongKongvalueofrestaurantreceiptsandpurchases.Restauranttype $USDmillion Marketshare
Chineserestaurants 6,120.21 45%Non-Chineserestaurants 3,862.62 29%Fastfoodshops 2,434.69 18%Bars 202.13 2%Other 841.28 6%Total 13,460.92 100%Source:HongKongCensusandStatisticsDepartment
Cuisine Numberofoutlets Numberofbrands
Cantonese 27 13Chiuchow 11 2ProvincialChinese 16 10Western 23 14Japanese 79 6VietnameseandThai 3 3Fastfood 34 7Cakesandbakery 234 2Coffeeshop 83 1Total 510 58Source:Maxim'sGroup,www.maxims.com.hk
Table2.3.NumberofoutletsandbrandsforMaxim'sGroupHongKong.
Figure 2.14. Kornhill Plaza is part of a housing estate development located at Quarry Bay, Hong Kong. The plaza is a shop-ping arcade, the equivalent of a shopping mall. One of their marketing efforts is to highlight the number and variety of restaurants available.
Figure 2.15. At Kornhill Plaza, a wide variety of products and cuisines is available to Hong Kong consumers. Here they can experi-ment and try new foods.
Figure 2.16. East meets West. A McDonald’s restaurant is next to a tradi-tional Chinese bakery in The Wanchai District. On the second floor is a Japanese restaurant.
Figure 2.17. Maxim’s fast food restaurant in the Central District. Like their Western counterpart, they have a breakfast menu and later in the day they change to a lunch/dinner menu.

Synopsis of the Hong Kong Seafood Market 9
Figure 2.18. Café de Coral restaurant in the Western District. Many of the locally owned fast food chains adopted a Western fast food business model serving Chinese food. The Café De Coral Group is a vertically integrated company that includes food manufacturing and processing, catering, as well as restaurants.
Figure 2.19. Café de Coral breakfast Hong Kong style. A breakfast “set” costs between $3.25 and $4.50 USD. An example is stir fried noodles with ham and a glass of soy milk for $3.28 USD.
Figure 2.20. Hanging out. Most Hong Kong fast food chains have attrac-tive modern décor rivaling that of their Western competitors. On the left is a display of Cantonese barbecue items such as roast pork or roast duck. A barbecue rice plate “set” for lunch or dinner includes soup, a drink, the main item—rice with one or two barbecue items, and green vegetables. When an order comes in, a designated cook will take the barbecue item from the display, cut it up into bite-size pieces, then serve it with the rest of the meal.
Figure 2.21. Spaghetti 360° is a subsidiary of the Café de Coral Group that targets the growing market of young adults, young fam-ilies, and students and offers customers a Japanese and Western dining experience.

10 Synopsis of the Hong Kong Seafood Market
Hong Kong has small capture and aquaculture fisheries that contribute to the seafood consumed in Hong Kong. The capture fisheries consist of about 5,050 vessels; 24% of the vessels, which are over 15 meters in length, fish mainly out-side of Hong Kong waters along the northern continental shelf of the South China Sea. Some of these vessels travel far-ther into the central and South Pacific to harvest live fish. The remaining 76% of the fishing vessels fish the coastal waters around Hong Kong. The main species harvested are hair-tail, mackerel, scad, big-eye, pomfret, and croaker, which amounted to $309.6 million USD (145,000 t) in 2015.
For aquaculture, Hong Kong has approximately 1,140 hectares of fish ponds producing freshwater fish consisting mostly of different carp species in combination with tilapia and grey mullet. About 970 establishments are engaged in marine fish culture in 29 fish culture zones. Most species farmed are groupers, snappers, cobia, and pompano. Aside from aquaculture, many of the marine fish farm operators also use the farm sites as holding centers for wild captured live fish. Up to $5.6 million USD (2,001 t) of farmed freshwa-ter fish, and $148 million USD of farmed marine fish, were produced locally in 2014.
To meet seafood demand, Hong Kong imported $21.1 billion USD worth of food products in 2015. This is an increase of more than 300% of the value of foodstuffs into Hong Kong from 2001 ($6.98 billion USD). For seafood, Hong Kong imports increased from $1.8 billion USD in 2001 to $3.5 billion USD in 2015, rising close to 200% (Fig. 3.1). However, the market share of imported seafood in relation to all imported foodstuffs dropped from 23% in 2001 to 17% in 2015.
Some of Hong Kong’s food imports are being re-exported to other countries. From 2001 to 2015, the value of Hong Kong’s re-export of seafood went from $170.2 mil-lion to $459 million USD, an increase of 270% (Fig. 3.1). The value of net import of seafood is also shown on Fig. 3.1. This represents seafood retained in Hong Kong, where it is either consumed or purchased. However, participants in the Hong Kong seafood market note that the re-export values may not be entirely accurate, since a portion of the seafood imported into Hong Kong may be moved on into mainland China and not reported.
Seafood trade with the United StatesWhile Hong Kong seafood imports increased in value more than threefold from 2001 to 2015, Hong Kong imports of US-originated seafood increased more dramatically. From 2001 to 2015, US seafood exports to Hong Kong increased from $29.5 million to $142.1 million USD, growing more
3. Hong Kong Seafood Trade and Production
Figure 3.1. Hong Kong seafood import by value. Source: Hong Kong Census and Statistics Department.
Figure 3.2. US seafood exports to Hong Kong by value. Source: USDOC.
Figure 3.3. US seafood exports to Hong Kong by volume. Source: USDOC.

Synopsis of the Hong Kong Seafood Market 11
than 480% (Fig. 3.2). In terms of volume, Hong Kong sea-food imports from the US totaled 11,286 t in 2015, an increase of 187% from the 2001 total of 6,038 t (Fig. 3.3).
Table 3.1 shows the top 12 seafood products, in terms of value, imported into Hong Kong from the US in 2015. Of these 12, only one is a finfish, namely frozen black cod or sablefish, Anoplopoma fimbria (Figs. 3.4 and 3.5). The rest are shellfish, mainly lobsters, and mollusks (Fig. 3.6). In terms of market share, the total import value of the 12 US products was $117.4 million USD, accounting for 82.7% of the total value of US-originated seafood imported into Hong Kong.
While the US has seen a dramatic increase in the export of seafood to Hong Kong for the past decade and a half, this amounts to a market share of only 4% of total Hong Kong seafood imports. The following sections examine Hong Kong’s imported seafood trade in 2015 based on three sea-food groups—finfish, crustaceans, and aquatic invertebrates other than crustaceans. Each of these three groups is fur-ther subdivided into method of preparation (e.g., live, frozen, fresh/chilled). Finally, for each method of preparation, the top five species or product category (e.g., salmon, unspecified livers, and roes) by value and the five countries that have the largest market share for that species or product category are reported. This gives a good understanding of the dynamism and complexity of Hong Kong’s seafood market. The data presented here are based on those published by the Hong Kong Census and Statistics Department.
Table3.1.2015top12USseafoodexportstoHongKongbyvalue.Seafoodtype Metrictons $USDmillion
Clamgeoducklive/fresh 1,772.4 27.13Lobster(Homarus spp.)live/fresh/dried/salted/brined 1,225.3 19.03Mollusksnonspecifiedfrozen/dried/salted/brined 918.8 13.28Lobsternonspecifiedmeatcookedinairtightcontainers 794.5 11.21Conchlive/fresh 760.9 9.98Seacucumbersfrozen/dried/salted/brined 252.6 7.67Rocklobsternonspecifiedlive/fresh/dried/salted/brined 338.2 7.44Sablefishfrozen 396.5 7.41Oysterslive/fresh 588.4 4.47Lobster(Homarus spp.)frozen 202.2 3.93Rocklobsternonspecifiedfrozen 129.1 3.89Kingcrabfrozen 67.7 1.98Source:USDOC
Figure 3.4. Frozen black cod. The United States exported approximately $7.4 million USD (396.5 t) frozen black cod to Hong Kong in 2015.
Figure 3.5. Black cod served as part of a Korean barbecue dinner for two people in a Korean restaurant in Hong Kong.
Figure 3.6. Geoduck at a Hong Kong retail market. Hong Kong imported $27.1 million USD (1,772.4 t) worth of geoduck from the US in 2015.

12 Synopsis of the Hong Kong Seafood Market
Finfish
I. Finfish—live Hong Kong imported $673.70 million USD (168,011.52 t) of live finfish in 2015. This includes bass, carp, groupers, eel, snook, tilapia, and unspecified freshwater and marine fish. The top five categories imported were carp ($156.2 million USD), groupers ($120.8 million USD), unspecified freshwa-ter fish ($60.5 million USD), unspecified marine fish ($21.9 million USD), and eel ($21.4 million USD) (Table 3.2).
Country of origin and market share for live finfish categories:
A. Carp (Table 3.3)Three countries supplied live carp to Hong Kong. Mainland China was the dominant exporter with 99.3% ($156.2 million USD) of the total. The Philippines and Norway made up the remainder of Hong Kong’s carp imports.
B. Groupers (e.g., Epinephelus spp. and Plectropomus spp.) (Table 3.4)Hong Kong imported groupers from 18 countries. Close to 90.6% ($109.6 million USD) of the import value can be attributed to five countries. The biggest contributor was the Philippines (36.9%), followed by Indonesia (23.6%), Taiwan (12.5%), Malaysia (9.2%), and Australia (8.5%) (Fig. 3.7).
C. Freshwater fish unspecified (Table 3.5)Eight countries provided live unspecified freshwater fish to Hong Kong. China was the dominant supplier, with 97.3% ($58.9 million USD) of the market share.
D. Marine fish unspecified (Table 3.6)Fifteen countries exported unspecified live marine fish to Hong Kong worth $20.9 million USD. China, the largest supplier to the Hong Kong market, produced 76.4% of the total Hong Kong import value. This was followed by Malaysia (7.9%), Thailand (4.8%), Philippines (4.7%), and Japan (1.5%). These five countries represented 95.3% ($20.9 million USD) of the import market share for the unspecified marine fish category.
Table3.2.Topfivelivefinfishspeciesimportedbyvalue.Seafoodtype Metrictons $USDmillionCarp 57,072.95 156.19Grouper 9,094.86 120.81Freshwaterfishunspecified 28,382.71 60.48Marinefishunspecified 3,457.27 21.94Eelotherthanfry(Anguilla spp.) 976.44 21.44
Table3.3.Carp:topfiveimportsourcecountriesbyvalue.Country $USDmillion %totalChina 155.04 99.26%Philippines 1.12 0.72%Norway 0.01 0.02%Total 156.17 100.00%
Table3.4.Groupers:topfiveimportsourcecountriesbyvalue.Country $USDmillion %totalPhilippines 44.63 36.94%Indonesia 28.50 23.59%Taiwan 15.08 12.49%Malaysia 11.12 9.20%Australia 10.23 8.47%Total 109.55 90.68%
Figure 3.7. Live groupers at a Hong Kong retail market. Hong Kong imported $120.8 million USD worth of groupers from 18 countries in 2015.
Country $USDmillion %totalChina 58.86 97.32%Thailand 0.54 0.90%Vietnam 0.52 0.85%Indonesia 0.33 0.54%Bangladesh 0.22 0.36%Total 60.46 100.08%
Table3.5.Freshwaterfishunspecified:topfiveimportsourcecountriesbyvalue.
Country $USDmillion %totalChina 16.76 76.38%Malaysia 1.74 7.93%Thailand 1.05 4.77%Philippines 1.03 4.69%Japan 0.34 1.54%Total 20.91 95.32%
Table3.6.Marinefishunspecified:topfiveimportsourcecountriesbyvalue.

Synopsis of the Hong Kong Seafood Market 13
E. Eel (Anguilla spp.) (Table 3.7)Hong Kong imported live eel from 15 countries. The five countries with the highest import value were China, Australia, Canada, Japan, and Morocco. These countries together accounted for 99.8% ($21.4 million USD) of the mar-ket share; mainland China was the largest supplier with 91.7% ($19.6 million USD) of the import market.
II. Finfish—fresh or chilled, excluding filletsHong Kong imported $276.20 million USD (48,144.85 t) of fresh or chilled finfish in 2015. This includes various species of Pacific and Atlantic salmon, trout, mackerel, sardines, hali-but, sole, butterfish, herring, eel, sea bass, sea bream, turbot, tuna, anchovies, cod livers and roes, plus unspecified marine and freshwater finfish. The five most valuable imports were unspecified marine finfish ($129.4 million USD, salmon ($122.3 million USD), sea bream ($14.2 million USD), tuna ($2.9 million USD), and mackerel ($2.8 million USD) (Table 3.8). These categories dominated all fresh and chilled fin-fish product categories, consisting of 98.3% ($271.5 million USD) of the total fresh or chilled finfish imported into Hong Kong (Fig. 3.8).
Country of origin and market share for fresh or chilled finfish categories:
A. Marine fish unspecified (Table 3.9)Twenty-three countries exported fresh or chilled unspecified marine fish to Hong Kong. China and Japan were the largest exporters to Hong Kong by value, with 66.2% ($85.7 million USD) and 16% ($20.6 million USD) of the total market share respectively. This was followed by Taiwan (6.8%), Philippines (2.5%), and India (1.7%).
B. Salmon (Table 3.10)Twenty-one countries provided fresh and chilled salmon to Hong Kong. The top five countries together provided 98.8% ($120.8 million USD) of the total import value to Hong Kong. Norway was the dominant supplier with a market share of 91.1%, followed by Canada (5.3%), Chile (1%), United Kingdom (0.9%), and Australia (0.5%).
Table3.7.Eel:topfiveimportsourcecountriesbyvalue.Country $USDmillion %totalChina 19.65 91.67%Australia 0.61 2.83%Canada 0.58 2.61%Japan 0.51 2.32%Morocco 0.09 0.41%Total 21.44 99.83%
Seafoodtype Metrictons $USDmillionMarinefishunspecified 29,693.90 129.44Salmon 16,921.98 122.28Seabream 734.103 14.18Tunas 86.92 2.88Mackerel 175.28 2.76
Table3.8.Topfivefreshorchilledfinfishimportbyvalue,excludingfillets,livers,androes.
Figure 3.8. Fresh or chilled finfish aisle in a supermarket. Hong Kong imported $555.6 million USD (92,912.8 t) worth of fresh or chilled finfish in all product forms.
Country $USDmillion %totalChina 85.75 66.24%Japan 20.65 15.95%Taiwan 8.85 6.83%Philippines 3.21 2.48%India 2.20 1.70%Total 120.65 93.21%
Table3.9.Marinefishunspecified:topfiveimportsourcecountriesbyvalue.
Table3.10.Salmon:topfiveimportsourcecountriesbyvalue.Country $USDmillion %totalNorway 111.39 91.09%Canada 6.45 5.28%Chile 1.23 1.01%UnitedKingdom 1.08 0.89%Australia 0.65 0.54%Total 120.81 98.80%

14 Synopsis of the Hong Kong Seafood Market
C. Sea bream (e.g., Sparidae) (Table 3.11)Hong Kong imported fresh or chilled sea bream from six countries totaling $14.2 million USD. The five countries with the highest value that Hong Kong imported from were Japan, France, Korea, Taiwan, and the Netherlands. Japan was the largest supplier with a market share of 91% ($12.9 million USD). France and Korea followed a distant second and third with 7.4% and 1.2% of the market value respectively. Taiwan and the Netherlands each consist of less than 1% of the mar-ket share.
D. Tuna (Table 3.12)Twelve countries exported fresh or chilled tuna to Hong Kong worth $2.9 million USD. The five countries with the largest shares—Japan, Philippines, Spain, Thailand, and Taiwan—made up 98% ($2.8 million USD) of Hong Kong’s total fresh or chilled tuna imports. Japan, the largest supplier to the Hong Kong market, provided 77.5 % of the imports by value.
E. MackerelHong Kong imported fresh or chilled mackerel from four countries with a total value of $2.7 million USD. The biggest supplier was Japan with 96.9% of the import market share.
III. Finfish—fillet or meat, fresh or chilledHong Kong imported $9.1 million USD (1,615.6 t) of fresh or chilled finfish fillet or meat in 2015. This includes cat-fish, salmon, carp, trout, unspecified flatfish, unspecified fish meat, and unspecified fish fillet. The top five categories imported in value were unspecified fish fillet ($5.2 million USD), unspecified fish meat ($2.7 million USD), catfish ($0.8 million USD), fish meat of tilapia, eel, Nile perch, snakehead ($0.2 million USD), and salmon ($0.07 million USD) (Table 3.13). These categories made up 99.3% of the total fresh or chilled finfish fillet and meat value exported to Hong Kong.
Country of origin and market share for fresh or chilled finfish fillet or meat categories:
A. Fish fillet other (Table 3.14)Hong Kong imported fresh or chilled unspecified finfish fillets from 10 countries. The five countries with the high-est import value were Japan, Philippines, New Zealand, Australia, and the Netherlands. These five countries together accounted for 99.2% ($5.1 million USD) of the market share, with Japan as the largest supplier, with 63.3% ($3.3 million USD) of the import market.
B. Fish meat other (Table 3.15)Hong Kong imported fresh or chilled fish meat from 10 coun-tries. More than 99.5% of the import value for this product form can be attributed to five countries with a total value of $2.7 million USD. The biggest contributor was China with 84.1% of the total import value, followed by France (8.8%), Japan (3.3%), New Zealand (2.2%), and Australia (1.1%).
Table3.11.Seabream:topfiveimportsourcecountriesbyvalue.Country $USDmillion %totalJapan 12.90 90.99%France 1.04 7.37%Korea 0.17 1.19%Taiwan 0.04 0.27%Netherlands 0.02 0.15%Total 14.18 99.97%
Table3.12.Tuna:topfiveimportsourcecountriesbyvalue.Country $USDmillion %totalJapan 2.23 77.51%Philippines 0.24 8.19%Spain 0.19 6.71%Thailand 0.08 2.88%Taiwan 0.08 2.74%Total 2.82 98.02%
Seafoodtype Metrictons $USDmillionFishfilletother 240.01 5.16Fishmeatother 604.65 2.70Catfish 474.20 0.85Fishmeatoftilapia,catfish,eel,Nileperch,andsnakehead 260.20 0.21Salmon 4.35 0.07
Table3.13.Topfivefreshorchilledfinfishfilletandfishmeatimportbyvalue.
Country $USDmillion %totalJapan 3.27 63.29%Philippines 1.58 30.68%NewZealand 0.12 2.24%Australia 0.10 2.01%Netherlands 0.05 0.96%Total 5.12 99.19%
Table3.14.Fishfilletother:topfiveimportsourcecountriesbyvalue.
Country $USDmillion %totalChina 2.27 84.10%France 0.24 8.79%Japan 0.10 3.34%NewZealand 0.06 2.19%Australia 0.03 1.12%Total 2.70 99.54%
Table3.15.Fishmeatother:topfiveimportsourcecountriesbyvalue.

Synopsis of the Hong Kong Seafood Market 15
C. Catfish (Table 3.16)All fresh or chilled catfish fillets imported into Hong Kong came primarily from Vietnam, with 94.5% ($0.8 million USD) of the market. Japan and China made up the rest by both con-tributing almost equally to the market.
D. Fish meat of tilapia, catfish, eel, Nile perch, and snakeheadAll imports in this product category were from Indonesia.
E. Salmon (Table 3.17)Hong Kong imported salmon from four countries. The larg-est contributor in value was China (48.3%), followed by New Zealand (25.7%), Italy (24.1%), and Australia (1.8%).
IV. Finfish—frozen, excluding filletsHong Kong imported $279.3 million USD (44,768 t) worth of headed and gutted, whole round, and other forms (e.g., livers and roes) of frozen finfish, excluding fillets, in 2015. The top five fish groups imported were unspecified marine fish ($66.7 million USD), yellow croaker ($54.4 million USD), shark fins ($28.5 million USD), toothfish ($20.4 million USD), and salmon ($19.1 million USD) for a total of $189.2 million USD (Table 3.18). These groups accounted for more than 65% of the total “frozen finfish, excluding fillets” category of imports by value.
Country of origin and market share for frozen finfish categories:
A. Marine fish unspecified (Table 3.19)Forty-two countries exported frozen unspecified marine fish to Hong Kong. Kenya was the largest exporter to Hong Kong by value, with 35.2% of the total. This was followed by China (10.2%), Surinam (9.3%), the US (5.1%), and Indonesia (4.3%).
B. Yellow croaker Three countries provided frozen yellow croaker to Hong Kong—China, Korea, and Indonesia. China was the largest provider in value, taking a market share of 99.7% (Fig. 3.9).
Table3.16.Catfish:topfiveimportsourcecountriesbyvalue.Country $USDmillion %totalVietnam 0.80 94.52%Japan 0.02 2.75%China 0.02 2.73%Total 0.85 100.00%
Table3.17.Salmon:topfiveimportsourcecountriesbyvalue.Country $USDmillion %totalChina 0.03 48.35%NewZealand 0.02 25.70%Italy 0.02 24.11%Australia 0.00 1.84%Total 0.07 100.00%
Seafoodtype Metrictons $USDmillionMarinefishunspecified 9,138.11 66.69Yellowcroaker 12,941.52 54.45Sharkfins 2,723.44 28.54Toothfish 952.79 20.41Salmon 3,702.75 19.07
Table3.18.Topfivefrozenfinfishimportbyvalue,excludingfillets,liversandroes.
Country $USDmillion %totalKenya 23.46 35.17%China 6.79 10.18%Surinam 6.23 9.35%USA 3.37 5.06%Indonesia 2.86 4.29%Total 42.71 64.05%
Table3.19.Marinefishunspecified:topfiveimportsourcecountriesbyvalue.
Figure 3.9. Frozen yellow croaker imported from mainland China.

16 Synopsis of the Hong Kong Seafood Market
C. Shark fin (Table 3.20)Twenty-two countries exported frozen shark fin to Hong Kong with a total value of $25.9 million USD. The five coun-tries with the largest share—Spain, Singapore, US, Argentina, and Senegal—account for 90.7% of the total import market share, with Spain and Singapore the two largest suppliers to the Hong Kong market, providing 42.4% and 35.2% of the total shark fin import value.
D. Toothfish (Table 3.21) Hong Kong imported frozen toothfish from 15 countries. The country contributing the highest value imported into Hong Kong was France, with a market share of 22.9%. This was followed by Argentina (15.6%), New Zealand (12.9%), Chile (10.5%), and Mauritius (8.5%). These five countries together made up approximately 70.5% ($14.4 million USD) of the import market share.
E. Salmon (Table 3.22) Hong Kong imported salmon from 19 countries. Approximately 95% of the import value of salmon can be attributed to five nations. The biggest contributor was Norway with 75.7%, followed by Chile (10.6%), China (6.8%), the US (1.9%), and Japan (0.8%).
V. Finfish—fillet, meat, flour, meals, and pellets, frozenHong Kong imported $97.8 million USD (35,277.5 t) worth of frozen finfish fillet, meat, flour, meals, and pellets in 2015. The top five species were frozen unspecified fish fillets ($44.6 million USD), unspecified fish meat ($12.1 million USD), carp fillet ($10 million USD), catfish fillet ($9.6 million USD), and tuna fillet ($7.4 million USD) (Table 3.23). These five groups accounted for 89% of the total value of frozen finfish fillet supplied to Hong Kong.
Country of origin and market share for frozen finfish fillet categories:
A. Fish fillet other (Table 3.24)Twenty-eight countries exported frozen unspecified fish fillets to Hong Kong. Vietnam was the largest exporter to Hong Kong by value, with 39.9% of the total market share (Fig. 3.10). This was followed by New Zealand (20.6%), China (13.4%), Japan (10.1%), and Taiwan (5%).
Table3.20.Sharkfin:topfiveimportsourcecountriesbyvalue.Country $USDmillion %totalSpain 12.11 42.42%Singapore 10.06 35.25%USA 2.24 7.86%Argentina 0.82 2.87%Senegal 0.65 2.26%Total 25.87 90.66%
Table3.21.Toothfish:topfiveimportsourcecountriesbyvalue.Country $USDmillion %totalFrance 4.68 22.92%Argentina 3.19 15.62%NewZealand 2.64 12.94%Chile 2.15 10.51%Mauritius 1.74 8.52%Total 14.39 70.51%
Table3.22.Salmon:topfiveimportsourcecountriesbyvalue.Country $USDmillion %totalNorway 14.44 75.74%Chile 2.02 10.61%China 1.31 6.85%USA 0.36 1.89%Japan 0.15 0.79%Total 18.28 95.88%
Seafoodtype Metrictons $USDmillionFishfilletother 13,301.60 44.56Fishmeatother 7,199.08 12.06Carpfillet 4,883.13 10.01Catfishfillet 4,902.36 9.57Tunafillet 1,091.08 7.36
Table3.23.Topfivefrozenfinfishfillet,fishmeat,flour,meal,andpelletsimportbyvalue.
Figure 3.10. Frozen fish fillet from Vietnam. In 2015, Vietnam exported more than $25 million USD worth of unspecified frozen cat-fish and fish fillet.
Country $USDmillion %totalVietnam 17.77 39.88%NewZealand 9.18 20.60%China 5.96 13.37%Japan 4.52 10.14%Taiwan 2.24 5.02%
Total 39.66 89.00%
Table3.24.Fishfilletother:topfiveimportsourcecountriesbyvalue.

Synopsis of the Hong Kong Seafood Market 17
B. Fish meat other (Table 3.25)Hong Kong imported frozen fish meat from 11 countries. Approximately 65.6% ($7.9 million USD) of Hong Kong’s fro-zen fish meat supply came from China, followed by Thailand (8.3%), Japan (6.5%), India (5.4%), and Vietnam (5.2%).
C. CarpHong Kong imported frozen carp fillets from four coun-tries. Vietnam and China were the largest suppliers to Hong Kong by value. Together they made up 99.9% (Vietnam 58.9%, China 41%) of the market share, with a combined import value of $10 million USD.
D. Catfish (Table 3.26)Five countries exported frozen catfish fillet to Hong Kong, worth $9.6 million USD. Vietnam dominated this market in Hong Kong, taking more than 94% of the market share.
E. Tuna (Table 3.27)Hong Kong imported frozen tuna fillets from 11 countries. More than 93% of the import value for this product form can be attributed to five countries with a total value of $6.8 mil-lion USD. The biggest contributor was Japan with 59.2% of the total import value, followed by Indonesia (14.8%), China (12.5%), Philippines (4.3%), and India (2.2%).
VI. Finfish—prepared or preservedHong Kong imported $202.4 million USD (52,014.8 t) worth of prepared or preserved finfish meat of 15 categories in 2015. The top five categories make up 94.9% of the total import value (Table 3.28).
Country of origin and market share for prepared or preserved fish categories:
A. Fish unspecified, not whole or in pieces (Table 3.29)Hong Kong imported close to $139.7 million USD of not whole or in pieces, unspecified fish from 23 countries. China made up approximately 59.5% of the import market share, followed by Japan (14.2%), Taiwan (9.6%), Thailand, (9.2%), and Malaysia (4.5%).
B. Fish unspecified, whole or in pieces (Table 3.30)Twenty-three countries provided whole or in pieces unspec-ified fish to Hong Kong. The top five countries together accounted for 92% of the market share, with a value of $21.5 million USD. Mainland China was the largest supplier in terms of value with a market share of 61.4%. This was fol-lowed by New Zealand (11.4%), Japan (10.3%), Taiwan (5.4%), and Thailand (3.4%).
Country $USDmillion %totalChina 7.91 65.58%Thailand 1.00 8.30%Japan 0.78 6.46%India 0.66 5.45%Vietnam 0.63 5.19%Total 10.97 90.99%
Table3.25.Fishmeatother:topfiveimportsourcecountriesbyvalue.
Table3.26.Catfish:topfiveimportsourcecountriesbyvalue.Country $USDmillion %totalVietnam 9.06 94.67%Indonesia 0.37 3.84%China 0.12 1.28%UnitedKingdom 0.02 0.17%Japan 0.00 0.03%Total 9.57 100%
Table3.27.Tuna:topfiveimportsourcecountriesbyvalue.Country $USDmillion %totalJapan 4.36 59.25%Indonesia 1.09 14.82%China 0.92 12.46%Philippines 0.32 4.32%India 0.16 2.19%Total 6.85 93.04%
Table3.28.Topfivepreparedorpreservedfinfishimportbyvalue.Seafoodtype Metrictons $USDmillionFishunspecified 42,344.91 139.73Fishother 3,997.19 23.40Eelswholeorinpieces,notminced 784.60 15.13Tunas,skipjack,andAtlanticbonito 2,517.57 8.54Sardines 1,216.68 5.32
Country $USDmillion %totalChina 83.21 59.55%Japan 19.86 14.21%Taiwan 13.43 9.61%Thailand 12.84 9.19%Malaysia 6.35 4.55%
Total 135.68 97.10%
Table3.29.Fishunspecified,notwholeorinpieces:topfiveimportsourcecountriesbyvalue.
Country $USDmillion %totalChina 14.38 61.45%NewZealand 2.66 11.37%Japan 2.42 10.35%Taiwan 1.27 5.45%Thailand 0.79 3.39%Total 21.53 92.01%
Table3.30.Fishunspecified,wholeorinpieces:topfiveimportsourcecountriesbyvalue.

18 Synopsis of the Hong Kong Seafood Market
C. Eel (Table 3.31)Hong Kong imported prepared or preserved eel from nine countries. China was the largest exporter to Hong Kong with 92.5% of the market. Other countries contributed less than 2% of the market each (Fig. 3.11).
D. Tunas, skipjack, and Atlantic bonito (Table 3.32) Eighteen countries provided prepared or preserved tunas, skipjacks, and Atlantic bonito products to Hong Kong. Thailand was the number one provider with 60.8% of the market. Vietnam came in second with 24.9%, followed by China (6%), Japan 3.6%, and Portugal (2.5%).
E. Sardines (Table 3.33)About $4.7 million USD worth of prepared or preserved sardines was imported into Hong Kong from 17 countries. Malaysia was the largest exporter by value, with 35.3% of the market share, followed by Portugal (19.4%), Thailand (16.2%), Japan (10%), and Philippines (7.1%).
VII. Finfish—dried, salted, and/or smokedHong Kong imported $421.1 million USD worth of dried, salted, and smoked finfish in 2015. This includes edible fish offal, shark fins, fish maws (swim-bladder), heads, tails, salted and dried cod, salted anchovies, yellow croaker, tilapia, dried sea horses, dried pipefish, smoked trout and salmon, and other unspecified dried, salted and/or smoked finfish. The five most valuable imports were fish maws ($267.5 million USD), unprocessed dried shark fins ($98 million USD), unspecified dried fish ($30.4 million USD), smoked salmon ($12.7 million USD), and fish offal ($6.1 million USD). These five categories made up 98.5% of the total dried, salted, and smoked finfish import into Hong Kong (Table 3.34).
Country of origin and market share for dried, salted, and smoked finfish product categories:
A. Fish maws dried (Table 3.35)Hong Kong imported fish maws from 72 countries. The five countries with the largest import market shares were Brazil (22.2%), India (15.5%), China (10.3%), Uganda (10.3%), and Guyana (5.2%). These countries together accounted for approximately 63.5% ($169.8 million USD) of the imported market share for this category (Fig. 3.12).
Table3.31.Eel:topfiveimportsourcecountriesbyvalue.Country $USDmillion %totalChina 14.00 92.55%Japan 0.29 1.92%Thailand 0.22 1.46%Canada 0.14 0.96%Russia 0.14 0.92%Total 14.80 97.81%
Figure 3.11. Roasted unagi (freshwater eel) with tare sauce.
Country $USDmillion %totalThailand 5.19 60.81%Vietnam 2.13 24.94%China 0.52 6.05%Japan 0.31 3.63%Portugal 0.22 2.55%Total 8.37 97.99%
Table3.32.Tunas,skipjack,andAtlanticbonito:topfiveimportsourcecountriesbyvalue.
Table3.33.Sardines:topfiveimportsourcecountriesbyvalue.Country $USDmillion %totalMalaysia 1.88 35.34%Portugal 1.03 19.41%Thailand 0.86 16.17%Japan 0.53 10.02%Philippines 0.38 7.12%Total 4.68 88.05%
Seafoodtype Metrictons $USDmillionFishmawsdried 3,144.06 267.50Sharkfindried 2,805.42 97.96Fishunspecifieddriednotsmoked 1,864.88 30.38Salmonsmoked 1,014.68 12.74Ediblefishoffal 653.094 6.13
Table3.34.Topfivedried,salted,orsmokedfinfishimportbyvalue.
Country $USDmillion %totalBrazil 59.32 22.17%India 41.44 15.49%China 27.63 10.33%Uganda 27.49 10.28%Guyana 13.97 5.22%Total 169.84 63.49%
Table3.35.Fishmawsdried:topfiveimportsourcecountriesbyvalue.

Synopsis of the Hong Kong Seafood Market 19
B. Shark fin dried (Table 3.36)Sixty-five countries provided dried shark fins to Hong Kong. The top five countries together provided 47.8% ($46.8 million USD) of the total import value. Taiwan was the largest pro-vider with a market share of 14.1%, followed by Peru (9.6%), Mexico (9.5%), United Arab Emirates (8.3%), and Singapore (6%).
C. Fish unspecified dried (Table 3.37) Hong Kong imported unspecified dried finfish from 34 coun-tries worth $30.4 million USD. More than 64% of the import value of this item was attributed to five countries, with a total value of $19.5 million USD. The biggest supplier was India with 18.6%, followed by Indonesia (14.9%), Bangladesh (11.2%), Vietnam (11.2%), and Thailand (8.4%).
D. Salmon, smoked (Table 3.38)Seventeen countries exported smoked salmon to Hong Kong, worth $12.7 million USD. The five countries with the larg-est shares—Norway, United Kingdom, China, France, and Sweden—accounted for 93.9% ($6.8 million USD) of Hong Kong’s import market. Norway, the largest supplier, made up 31% of the total Hong Kong import value, followed by the United Kingdom (29.8%), China (22.7%), France (8.2%), and Sweden (2.1%).
E. Edible fish offal (Table 3.39)Twenty-one countries exported dried, salted and/or smoked fish offal to Hong Kong. India was the largest exporter by value, with 34.2% of the total market share of $2.1 million USD. This was followed by Indonesia (32.8%), United Arab Emirates (7.4%), Taiwan (5.4%), and Yemen (4.4%).
Figure 3.12. Fish maws are fish swim bladders. The documented con-sumption of swim bladders dates back to the Han dynasty (206 BCE–220 CE).
Country $USDmillion %totalTaiwan 13.79 14.08%Peru 9.40 9.60%Mexico 9.30 9.50%UAE 8.34 8.51%Singapore 6.02 6.15%Total 46.85 47.83%
Table3.36.Sharkfindried:topfiveimportsourcecountriesbyvalue.
Country $USDmillion %totalIndia 5.65 18.59%Indonesia 4.53 14.92%Bangladesh 3.41 11.23%Vietnam 3.40 11.18%Thailand 2.55 8.38%Total 19.54 64.31%
Table3.37.Fishunspecifieddried:topfiveimportsourcecountriesbyvalue.
Country $USDmillion %totalNorway 3.95 31.01%UnitedKingdom 3.80 29.79%China 2.89 22.66%France 1.05 8.25%Sweden 0.27 2.15%Total 11.96 93.86%
Table3.38.Salmonsmoked:topfiveimportsourcecountriesbyvalue.
Country $USDmillion %totalIndia 2.10 34.24%Indonesia 2.01 32.77%UAE 0.46 7.43%Taiwan 0.33 5.41%Yemen 0.27 4.45%Total 5.17 84.31%
Table3.39.Ediblefishoffal:topfiveimportsourcecountriesbyvalue.

20 Synopsis of the Hong Kong Seafood Market
Crustaceans
I. Crustaceans—live, fresh or chilled, including cooked Hong Kong imported $210.9 million USD (17022.6 t) of live, fresh or chilled crustaceans such as lobsters, shrimp, prawns, and crabs, in 2015. The five most valuable imports were rock lobster and other crawfish ($58.6 million USD), Homarus spp. lobsters ($53.11 million USD), non–cold water marine shrimp and prawns ($39.7 million USD), marine crabs other than swimming crabs ($30.8 million USD), and Chinese mit-ten crabs ($10.9 million USD). These five categories account for 91.6% ($193.2 million USD) of the total live, fresh, chilled crustaceans imported into Hong Kong (Table 3.40).
Country of origin and market share for live, fresh, or chilled crustacean categories:
A. Rock lobster and other crawfish (Table 3.41) Thirty-two countries exported live, fresh, or chilled rock lobster and other crawfish to Hong Kong. The US was the largest exporter with respect to value, with a share of 33.5% ($19.6 million USD) of the total market. This was followed by Australia (27.2%), South Africa (11.6%), Canada (9.7%), and France (4.8%) (Fig. 3.13).
B. Lobster (Homarus spp.) (Table 3.42)Hong Kong imported live, fresh, or chilled Homarus spp. lob-ster from 28 countries. More than 74% of the import value of this item was attributable to five countries, with a total value of $39.8 million USD. The largest supplier was the US with a market share of 31%. This was followed by Canada (25.2%), Portugal (6.3%), South Africa (6.3%), and Australia (6.1%).
C. Marine shrimp and prawns live, not cold water (Table 3.43)Hong Kong imported live, non–cold water marine shrimp and prawns from 12 countries. The five countries with the highest import value into Hong Kong were China, Thailand, US, Vietnam, and Malaysia. These five countries together had a 98% share ($7.4 million USD) of the market, with China being the largest supplier with an 35.3% share (Fig. 3.14).
Seafoodtype Metrictons $USDmillionRocklobsterandothercrawfish 2,224.64 58.63Lobster(Homarus spp.) 2,756.06 53.11Shrimpandprawnsmarinelivenotcoldwater 5,668.12 39.70Marinecrabsotherthanswimmingcrabs 2,784.51 30.85Chinesemittencrabs 435.70 10.94
Table3.40.Topfivelive,fresh,and/orchilledcrustaceansimportbyvalue.
Country $USDmillion %totalUSA 19.63 33.48%Australia 15.98 27.25%SouthAfrica 6.82 11.63%Canada 5.68 9.69%France 2.81 4.79%
Total 50.91 86.84%
Table3.41.Rocklobsterandothercrawfish:topfiveimportsourcecountriesbyvalue.
Figure 3.13. Different species of lobster in a live seafood retail establishment.
Country $USDmillion %totalUSA 16.47 31.01%Canada 13.37 25.17%Portugal 3.36 6.33%SouthAfrica 3.35 6.30%Australia 3.23 6.07%Total 39.77 74.89%
Table3.42.Lobster(Homarus spp.):topfiveimportsourcecountriesbyvalue.
Country $USDmillion %totalChina 14.03 35.33%Thailand 12.05 30.34%USA 8.34 21.01%Vietnam 3.40 8.56%Malaysia 1.11 2.79%Total 38.92 98.03%
Table3.43.Marineshrimpandprawnslive,notcoldwater:topfiveimportsourcecountriesbyvalue.
Synopsis of the Hong Kong Seafood Market 21
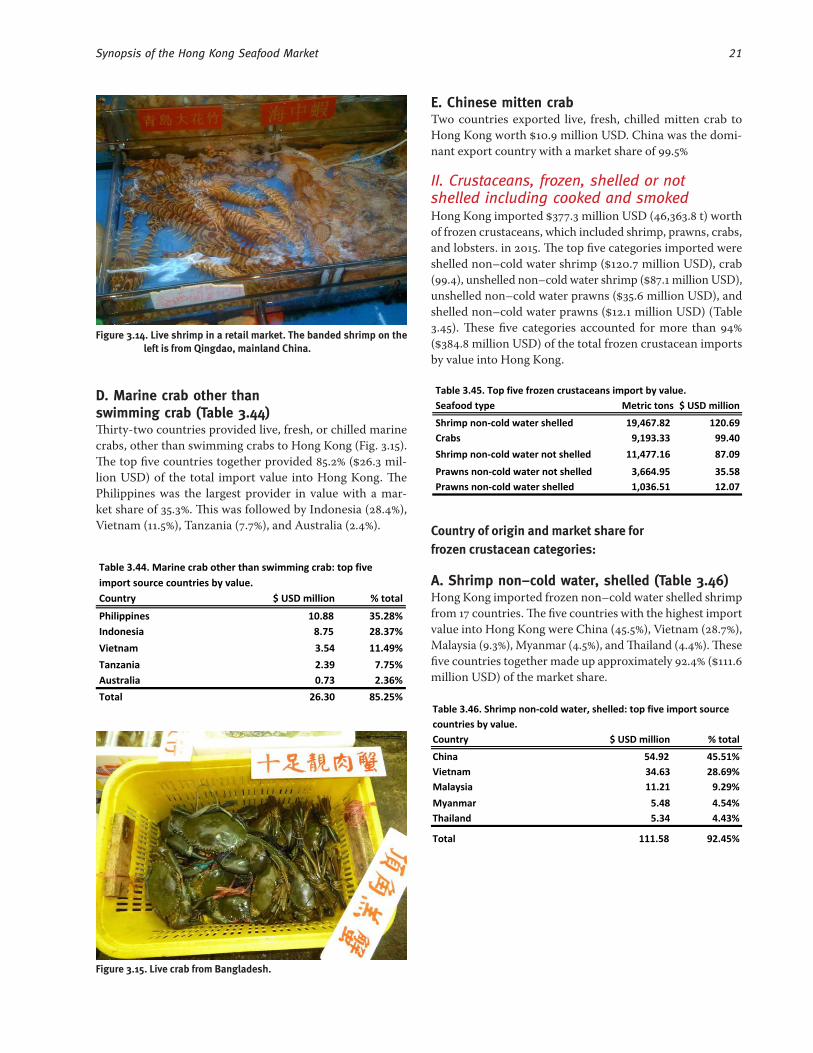
D. Marine crab other than swimming crab (Table 3.44)Thirty-two countries provided live, fresh, or chilled marine crabs, other than swimming crabs to Hong Kong (Fig. 3.15). The top five countries together provided 85.2% ($26.3 mil-lion USD) of the total import value into Hong Kong. The Philippines was the largest provider in value with a mar-ket share of 35.3%. This was followed by Indonesia (28.4%), Vietnam (11.5%), Tanzania (7.7%), and Australia (2.4%).
E. Chinese mitten crab Two countries exported live, fresh, chilled mitten crab to Hong Kong worth $10.9 million USD. China was the domi-nant export country with a market share of 99.5%
II. Crustaceans, frozen, shelled or not shelled including cooked and smokedHong Kong imported $377.3 million USD (46,363.8 t) worth of frozen crustaceans, which included shrimp, prawns, crabs, and lobsters. in 2015. The top five categories imported were shelled non–cold water shrimp ($120.7 million USD), crab (99.4), unshelled non–cold water shrimp ($87.1 million USD), unshelled non–cold water prawns ($35.6 million USD), and shelled non–cold water prawns ($12.1 million USD) (Table 3.45). These five categories accounted for more than 94% ($384.8 million USD) of the total frozen crustacean imports by value into Hong Kong.
Country of origin and market share for frozen crustacean categories:
A. Shrimp non–cold water, shelled (Table 3.46)Hong Kong imported frozen non–cold water shelled shrimp from 17 countries. The five countries with the highest import value into Hong Kong were China (45.5%), Vietnam (28.7%), Malaysia (9.3%), Myanmar (4.5%), and Thailand (4.4%). These five countries together made up approximately 92.4% ($111.6 million USD) of the market share.
Figure 3.14. Live shrimp in a retail market. The banded shrimp on the left is from Qingdao, mainland China.
Country $USDmillion %totalPhilippines 10.88 35.28%Indonesia 8.75 28.37%Vietnam 3.54 11.49%Tanzania 2.39 7.75%Australia 0.73 2.36%Total 26.30 85.25%
Table3.44.Marinecrabotherthanswimmingcrab:topfiveimportsourcecountriesbyvalue.
Table3.45.Topfivefrozencrustaceansimportbyvalue.Seafoodtype Metrictons $USDmillionShrimpnon-coldwatershelled 19,467.82 120.69Crabs 9,193.33 99.40Shrimpnon-coldwaternotshelled 11,477.16 87.09Prawnsnon-coldwaternotshelled 3,664.95 35.58Prawnsnon-coldwatershelled 1,036.51 12.07
Country $USDmillion %totalChina 54.92 45.51%Vietnam 34.63 28.69%Malaysia 11.21 9.29%Myanmar 5.48 4.54%Thailand 5.34 4.43%
Total 111.58 92.45%
Table3.46.Shrimpnon-coldwater,shelled:topfiveimportsourcecountriesbyvalue.
Figure 3.15. Live crab from Bangladesh.

22 Synopsis of the Hong Kong Seafood Market
B. Crab (Table 3.47)Twenty-six countries provided frozen crab to Hong Kong. The top five countries together provided 86.8% of a total value of $86.3 million USD to Hong Kong. China was the largest provider in terms of value with a market share of 72.8%, followed by Japan (5.3%), Canada (2.9%), Indonesia (2.9%), and Malaysia (2.8%).
C. Shrimp non–cold water, not shelled (Table 3.48)Thirty countries exported frozen non–cold water unshelled shrimp to Hong Kong. Vietnam was the largest exporter to Hong Kong by value, with 29.1% of the total market share of $87.1 million USD. This was followed by China (22.7%), India (8.7%), Thailand (6.6%), and Indonesia (6.3%).
D. Prawns non–cold water, not shelled (Table 3.49)Hong Kong imported unshelled non–cold water prawns from 25 countries. About 73.3% of the import value of this item can be attributed to five countries, with a total value of $35.6 mil-lion USD. The largest contributor was Vietnam with a 28.5% share of the import market. This was followed by Australia (24.8%), China (14.2%), Myanmar (12.3%), and Japan (6.1%).
E. Prawns non–cold water, shelled (Table 3.50) Eleven countries exported frozen shelled non–cold water prawns to Hong Kong worth $12.1 million USD. The five countries with the largest shares were the China, Vietnam, Indonesia, Malaysia, and Myanmar, making up a 95.8% ($11.6 million USD) share of the total import market for these prod-ucts. China, the largest supplier, contributed 37.6% of Hong Kong’s total import value with Vietnam supplying 32.8%.
III. Crustaceans—prepared or preservedHong Kong imported $74.5 million USD (6,967.5 t) of pre-pared or preserved crustacean products of five categories in 2015: crab ($39.3 million USD), shrimp and prawns not in air-tight containers ($25.3 million USD), lobsters ($8.9 million USD), shrimp and prawns other than not in airtight con-tainers ($812,614.3 USD), and unspecified crustacean product ($78,952.2 USD) (Table 3.51).
Country of origin and market share for prepared or preserved crustacean categories:
A. Crab (Table 3.52)Twenty-two countries exported prepared or preserved crab to Hong Kong worth $39.3 million USD. The top three coun-tries were China, Japan, and Canada showing market shares of 43.9%, 25.3%, and 7.1% of the total value respectively. Thailand and Indonesia also contributed to a lesser extent with 5.1% and 3.6% respectively.
Table3.47.Crab:topfiveimportsourcecountriesbyvalue.Country $USDmillion %totalChina 72.36 72.79%Japan 5.26 5.29%Canada 2.91 2.93%Indonesia 2.90 2.92%Malaysia 2.84 2.85%Total 86.26 86.78%
Country $USDmillion %totalVietnam 25.34 29.10%China 19.76 22.68%India 7.54 8.66%Thailand 5.71 6.56%Indonesia 5.45 6.26%Total 63.80 73.26%
Table3.48.Shrimpnon-coldwater,notshelled:topfiveimportsourcecountriesbyvalue.
Country $USDmillion %totalVietnam 10.16 28.55%Australia 8.81 24.76%China 5.06 14.21%Myanmar 4.39 12.34%Japan 2.18 6.12%Total 30.59 85.98%
Table3.49.Prawnsnon-coldwater,notshelled:topfiveimportsourcecountriesbyvalue.
Country $USDmillion %totalChina 4.54 37.59%Vietnam 3.96 32.77%Indonesia 1.51 12.53%Malaysia 1.13 9.34%Myanmar 0.44 3.63%Total 11.58 95.86%
Table3.50.Prawnsnon-coldwater,shelled:topfiveimportsourcecountriesbyvalue.
Seafoodtype Metrictons $USDmillionCrab 2,680.46 39.35Shrimpandprawns,notinairtightcontainers 3,305.34 25.32Lobster 737.63 8.90Shrimpandprawns,otherthannotinairtightcontainers 236.30 0.81Crustaceansunspecified 7.81 0.08
Table3.51.Topfivepreparedorpreservedcrustaceansimportbyvalue.

Synopsis of the Hong Kong Seafood Market 23
B. Shrimp and prawns, not in airtight containers (Table 3.53)Hong Kong imported prepared or preserved shrimp and prawns that were not in airtight containers from 19 countries. China was the main supplier, accounting for 43.3% percent of total import value, followed by Vietnam (28.1%), Thailand (13.9%), Japan (4.3%), and Singapore (3.1%).
C. Lobsters (Table 3.54)Seven countries exported prepared or preserved lobsters to Hong Kong worth $8.8 million USD. Canada was the domi-nant import country with a market share of 81.36%.
D. Shrimp and prawns other than not in airtight containers (Table 3.55)Hong Kong imported all of its preserved or prepared shrimp and prawns, other than not in airtight containers, from three countries. China was the main source destined for Hong Kong with 73.8% market share, followed by Japan (21.8%) and Taiwan (4.4%).
E. Crustaceans unspecified (Table 3.56)Thailand and Japan were the only two countries that provided unspecified crustaceans to Hong Kong with market shares of 78.3% and 21.7% respectively.
IV. Crustaceans—dried, salted, or in brine, including smoked and cooked Hong Kong imported $18.4 million USD worth of dried, salted, and brined crustaceans in 2015 (Table 3.57). The three import product categories were dried, salted, or brined unshelled shrimp and prawns ($18.4 million USD), unspecified crustaceans ($14,448 USD), and unspecified crab ($3,354.2 USD).
Country of origin and market share for dried, salted, or in-brine crustacean categories:
A. Shrimp and prawns (Table 3.58) Thirteen countries supplied dried, salted, or brined shrimp and prawns to Hong Kong. China was the largest exporter to Hong Kong by value, with 55.5% ($10.2 million USD) of the total market share. This was followed by Thailand (39.6%), Japan (1.2%), Malaysia (1.2%), and Taiwan (0.6%).
Table3.52.Crab:topfiveimportsourcecountriesbyvalue.Country $USDmillion %totalChina 17.29 43.93%Japan 9.94 25.27%Canada 2.81 7.15%Thailand 2.03 5.15%Indonesia 1.40 3.56%
Total 33.47 85.06%
Country $USDmillion %totalChina 10.98 43.35%Vietnam 7.14 28.18%Thailand 3.52 13.90%Japan 1.09 4.30%Singapore 0.81 3.21%Total 23.54 92.94%
Table3.53.Shrimpandprawns,notinairtightcontainers:topfiveimportsourcecountriesbyvalue.
Table3.54.Lobsters:topfiveimportsourcecountriesbyvalue.Country $USDmillion %totalCanada 7.24 81.36%China 0.54 6.12%Taiwan 0.49 5.54%Japan 0.34 3.87%Cuba 0.22 2.50%Total 8.85 99.38%
Country $USDmillion %totalChina 0.60 73.83%Japan 0.18 21.79%Taiwan 0.04 4.38%Total 0.81 100.00%
Table3.55.Shrimpandprawnsotherthannotinairtightcontainers:topfiveimportsourcecountriesbyvalue.
Country $USDmillion %total
Thailand 0.06 78.26%Japan 0.02 21.74%Total 0.08 100.00%
Table3.56.Crustaceansunspecified:topfiveimportsourcecountriesbyvalue.
Seafoodtype Metrictons $USDmillionShrimpandprawns 2295.22 18.41Crustaceansunspecified 1.16 0.01Crabunspecified 0.29 0.003
Table3.57.Topfivedried,salted,orbrinedincludingsmokedandcookedcrustaceansimportbyvalue.
Country $USDmillion %totalChina 10.22 55.53%Thailand 7.29 39.61%Japan 0.22 1.19%Malaysia 0.21 1.16%Taiwan 0.11 0.62%Total 18.06 98.12%
Table3.58.Shrimpandprawns:topfiveimportsourcecountriesbyvalue.

24 Synopsis of the Hong Kong Seafood Market
B. Crustaceans unspecified (Table 3.59)Two countries exported dried, salted, or in-brine unspecified crustaceans to Hong Kong. China was the largest contribu-tor to Hong Kong’s market, with 88.4% of the market share, followed by Taiwan (11.6%).
C. Crab unspecified (Table 3.60)Hong Kong imported dried, salted, or in-brine unspecified crab from Japan and the Philippines, with 88.4% and 11.6% of the market shares respectively.
Aquatic invertebrates other than crustaceans
I. Aquatic invertebrates, other than crustaceans—live, fresh, and chilledHong Kong imported $181.4 million USD (16,211.9 t) worth of live, fresh, or chilled aquatic invertebrates such as jelly-fish, mussels, scallops, clams, cockles, abalone, sea urchin, oysters, squid, octopus, and sea cucumbers in 2015. The five most valuable imports were unspecified mollusks ($59 million USD), abalone ($42.2 million USD), oysters ($36.5 million USD), scallops ($17.2 million USD), and sea urchins ($7 million USD). These five categories represented 89.2% of the total value of live, fresh, chilled aquatic invertebrates imported into Hong Kong (Table 3.61).
Country of origin and market share for live, fresh, or chilled aquatic invertebrate categories:
A. Mollusks unspecified (Table 3.62)Hong Kong imported live, fresh, or chilled unspecified mol-lusks from 25 countries. More than 93% of the import value of this item was attributable to five countries, for a total value of $55 million USD. The largest supplier was the US with market share of 63.4%, followed by Ireland (10.3%), Canada (8.9%), the United Kingdom (7.1%), and Pakistan (3.4%).
B. Abalone (Table 3.63)Hong Kong imported live, fresh, and chilled abalone from 10 countries (Fig. 3.16). Australia was the largest exporter to Hong Kong in terms of value, with 50.5% ($21.3 million USD) of the total market share. This was followed by South Africa (34.8%), China (14.1%), Japan (0.3%), and Chile (0.1%).
Table3.59.Crustaceansunspecified.Country $USD %totalChina 12,770.05 88.39%Taiwan 1,676.88 11.61%Total 14,446.92 100.00%
Table3.60.Crabunspecified.Country $USD %totalJapan 2,966.78 85.19%Philippines 515.96 14.81%Total 3,482.74 100.00%
Seafoodtype Metrictons $USDmillionMollusksunspecified 4,146.61 59.02Abalone 1,802.74 42.25Oysters 4,346.21 36.51Scallops 2,293.91 17.16Seaurchins 164.11 6.97
Table3.61.Topfivelivefreshand/orchilledaquaticinvertebratesotherthancrustaceansimportsbyvalue.
Country $USDmillion %totalUSA 37.41 63.38%Ireland 6.11 10.35%Canada 5.27 8.93%UK 4.22 7.15%Pakistan 2.00 3.38%Total 55.00 93.20%
Table3.62.Mollusksunspecified:topfiveimportsourcecountriesbyvalue.
Table3.63.Abalone:topfiveimportsourcecountriesbyvalue.Country $USDmillion %totalAustralia 21.33 50.49%SouthAfrica 14.72 34.84%China 5.94 14.07%Japan 0.14 0.34%Chile 0.05 0.11%Total 42.19 99.85%
Figure 3.16. Abalone (center) at a live seafood retail establishment.

Synopsis of the Hong Kong Seafood Market 25
C. Oysters (Table 3.64)Nineteen countries provided live, fresh, and chilled oys-ters to Hong Kong (Fig. 3.17 and 3.18). The top five countries together provided 79.8% ($29.1 million USD) of the total oys-ter import value. France was the largest provider in terms of value with a market share of 28.8%, followed by Canada (22.5%), US (14%), Australia (9.5%), and the United Kingdom (5%).
D. Scallops (Table 3.65)Eleven countries exported live, fresh, and chilled scallops to Hong Kong worth $17.2 million USD. Japan was the dom-inant country with a market share of 82.9% ($14.2 million USD). This was followed by Ireland (5%), China (4.6%), Canada (3.6%), and the United Kingdom (3.5%).
E. Sea urchins (Table 3.66)Hong Kong imported live, fresh, or chilled sea urchins from seven countries (Fig. 3.19). The five countries with the high-est Hong Kong import value were Canada, Mexico, Japan, US, and Chile. These five countries together accounted for 99.2% ($6.9 million USD) of the market share. Canada was the largest supplier with a market share of 36.8%, followed by Mexico (25.8%), Japan (20.2%), US (12.4%), and Chile (4%).
Table3.64.Oysters:topfiveimportsourcecountriesbyvalue.Country $USDmillion %totalFrance 10.50 28.76%Canada 8.20 22.46%USA 5.11 14.00%Australia 3.47 9.50%UK 1.84 5.04%Total 29.12 79.77%
Figure 3.17. Live oysters at a retail operation in Hong Kong. Oysters in the top tray are from France; the bottom two trays are from South Africa.
Table3.65.Scallops:topfiveimportsourcecountriesbyvalue.Country $USDmillion %totalJapan 14.23 82.93%Ireland 0.86 4.99%China 0.78 4.57%Canada 0.61 3.58%UK 0.61 3.55%
Total 17.10 99.63%
Figure 3.18. Fresh shucked oysters on display in a Hong Kong retail market. The oysters in the plastic bag are local, and those in plastic containers are from Canada. Quite a few shucked oysters from the US are sold in plastic containers as well. They cost between $10 and $14 USD per container.
Country $USDmillion %totalCanada 2.56 36.79%Mexico 1.80 25.77%Japan 1.41 20.21%USA 0.87 12.42%Chile 0.28 4.03%Total 6.92 99.22%
Table3.66.Seaurchins:topfiveimportsourcecountriesbyvalue.
Figure 3.19. Fresh sea urchin roe from Canada. Hong Kong imported $6.9 million USD (164.1 t) worth of fresh, live, or chilled sea urchin from seven countries in 2015.

26 Synopsis of the Hong Kong Seafood Market
II. Aquatic Invertebrates, other than crustaceans—frozenHong Kong imported $367.2 million USD of frozen non-crustacean aquatic invertebrates in 2015, which includes oysters, mussels, sea urchins, jellyfish, cuttlefish, abalone, scallops, sea cucumber, snail, squid and various bivalves (clams, cockles, etc.). The top five categories imported were scallops ($91.2 million USD), sea cucumber ($82 million USD), abalone ($49.7 million USD), unspecified mollusks ($38.2 million USD), and squid ($35.8 million USD) (Table 3.67). These five species categories comprised 80.9% of the total frozen non-crustacean aquatic invertebrate imports by value into Hong Kong.
Country of origin and market share for frozen non-crustacean aquatic invertebrate categories:
A. Scallops, including smoked (Table 3.68)Nineteen countries supplied frozen scallops to Hong Kong. Japan was the largest exporter by value, with a 40.3% ($36.8 million USD) share of the total market. This was followed by China (34.9%), Canada (14.6%), US (4.5%), and Australia (4.4%).
B. Sea cucumber (Table 3.69) Hong Kong imported frozen sea cucumber from 23 coun-tries (Fig. 3.20). The five countries with the highest import value into Hong Kong were Japan, Mexico, US, Canada, and Korea. These countries together represented an 80.4% ($65.9 million USD) share of the market, with Japan’s share alone approximately 42.2%.
C. Abalone (Table 3.70) Twelve countries provided frozen abalone to Hong Kong. The top five countries together provided 98% ($48.7 million USD) of the total frozen abalone imports. China was the larg-est supplier in value with a market share of 59.5%, followed by Australia (32.5%), the US (3.4%), South Africa (1.9%), and New Zealand (0.8%).
Seafoodtype Metrictons $USDmillionScallops 6,583.28 91.23Seacucumber 2,678.44 81.97Abalone 1,638.91 49.71Mollusksunspecified 3,698.69 38.24Squid 10,322.47 35.80
Table3.67.Topfivefrozenaquaticinvertebratesotherthancrustaceansimportsbyvalue.
Table3.68.Scallops:topfiveimportsourcecountriesbyvalue.Country $USDmillion %totalJapan 36.78 40.32%China 31.80 34.86%Canada 13.32 14.60%USA 4.15 4.55%Australia 4.02 4.40%Total 90.08 98.74%
Country $USDmillion %totalJapan 34.63 42.24%Mexico 14.50 17.69%USA 7.93 9.67%Canada 4.55 5.55%Korea 4.29 5.23%Total 65.90 80.39%
Table3.69.Seacucumber:topfiveimportsourcecountriesbyvalue.
Figure 3.20. Frozen sea cucumber meat from the northeastern United States or Canadian Maritime Provinces. The meat is sepa-rated from the skin for different markets. The meat is used for stir fry or in Chinese hot pot. The skin is sold dried and is rehydrated and cut in thin strips to be used in stir fry and other dishes.
Table3.70.Abalone:topfiveimportsourcecountriesbyvalue.Country $USDmillion %totalChina 29.57 59.48%Australia 16.17 32.52%USA 1.68 3.38%SouthAfrica 0.92 1.86%NewZealand 0.38 0.76%Total 48.72 98.00%

Synopsis of the Hong Kong Seafood Market 27
D. Mollusks unspecified (Table 3.71) Hong Kong imported frozen unspecified mollusks from 20 countries. More than 90% ($34.5 million USD) of the import value for this item can be attributed to five countries. The big-gest contributor with 59.4% was the US, followed by Canada (13.3%), China (7.9%), Senegal (5.2%), and Mexico (4.3%).
E. Squid (Table 3.72)Twenty-three countries exported frozen squid to Hong Kong. The five countries with the highest value were China, Indonesia, Japan, Philippines, and Thailand, and represented an 87.3% ($31.2 million USD) share of the Hong Kong import market. China, the dominant supplier, accounted for 72% ($25.8 million USD) of the total import value.
III. Aquatic invertebrates, other than crustaceans—prepared or preservedHong Kong imported $148.7 million USD worth of prepared or preserved non-crustacean aquatic invertebrates in 2015. Abalone garnered the largest market share with 65.8% ($97.8 million USD) of Hong Kong’s imports in this category (Table 3.73). This was followed by octopus with 7.2% ($10.8 million USD), cuttlefish and squid with 7.1% ($10.7 million USD), unspecified mollusks with 6.7% ($9.9 million USD), and scal-lops with 3.5% ($5.2 million USD).
Country of origin and market share for prepared or preserved non-crustacean aquatic invertebrates:
A. Abalone (Table 3.74)Hong Kong imported prepared or preserved abalone from 14 countries. The five countries with the highest Hong Kong import value were Australia, China, Taiwan, South Africa, and New Zealand. These countries together represented more than 86% ($84.5 million USD) of the market share, with Australia being the largest supplier with 23.8% of the market. This is followed by China (22.6%), Taiwan (16%), South Africa (14%), and New Zealand (10%).
B. Octopus (Table 3.75)Hong Kong imported prepared or preserved octopus from 12 countries. China had more than 89% of market share, fol-lowed by Japan with 7.3%. All other countries contributed less than 1% each to Hong Kong’s imports.
Country $USDmillion %totalUSA 22.70 59.37%Canada 5.10 13.34%China 3.01 7.88%Senegal 1.99 5.20%Mexico 1.66 4.34%
Total 34.46 90.12%
Table3.71.Mollusksunspecified:topfiveimportsourcecountriesbyvalue.
Table3.72.Squid:topfiveimportsourcecountriesbyvalue.Country $USDmillion %totalChina 25.77 71.99%Indonesia 2.32 6.47%Japan 1.16 3.25%Philippines 1.08 3.01%Thailand 0.92 2.56%Total 31.25 87.28%
Seafoodtype Metrictons $USDmillionAbalone 2,360.94 9778.46%Octopus 1,253.61 1078.01%Cuttlefishandsquid 1,486.14 1074.14%Mollusksunspecified 1,173.71 991.79%Scallops 462.56 516.53%
Table3.73.Topfivepreparedorpreservedaquaticinvertebratesotherthancrustaceansimportbyvalue.
Table3.74.Abalone:topfiveimportsourcecountriesbyvalue.Country $USDmillion %totalAustralia 23.33 23.85%China 22.07 22.57%Taiwan 15.70 16.05%SouthAfrica 13.66 13.97%NewZealand 9.80 10.02%Total 84.55 86.46%
Table3.75.Octopus:topfiveimportsourcecountriesbyvalue.Country $USDmillion %totalChina 9.64 89.41%Japan 0.79 7.29%Malaysia 0.07 0.69%Korea 0.06 0.53%Italy 0.05 0.47%Total 10.61 98.40%

28 Synopsis of the Hong Kong Seafood Market
C. Cuttlefish and squid (Table 3.76)Sixteen countries exported prepared and preserved cuttle-fish and squid to Hong Kong worth $10.7 million USD. The five countries with the largest import share in this category were China, Taiwan, Canada, Chile, and Japan, making up 93.5% ($10 million USD) of market share. China and Taiwan, the two largest suppliers to the Hong Kong market, supplied 29.1% ($3.1 million USD) and 22.1% ($2.4 million) of the total Hong Kong import value. This is followed by Japan (20.2%), Thailand (15.7%), and Philippines (6.4%).
D. Mollusks unspecified (Table 3.77)Fourteen countries provided prepared or preserved unspec-ified mollusks to Hong Kong. China was the largest provider in terms of value with a market share of 73.9%. This was fol-lowed by the Taiwan (6.2%), Canada (5.6%), Chile (5.5%), and Japan (2.8%).
E. Scallops Hong Kong imported $5.2 million USD (452.6 t) worth of prepared or preserved scallops from seven countries. Japan and China supplied the Hong Kong market with 80.9% and 15.6% of total import value respectively, totaling more than 96% of the import market.
IV. Aquatic invertebrates other than crustaceans—dried, salted, or in brineHong Kong imported $479.9 million USD worth of dried, salted, or in-brine aquatic invertebrates that were not crus-taceans in 2015. This included mussels, scallops, abalone, oysters, clams, cockles, snails, squid, and unspecified mol-lusks. The five most valuable imports were sea cucumbers ($190.7 million USD), scallops ($155 million USD), abalone ($83.9 million USD), unspecified mollusks ($21.3 million
USD), and oysters ($15.8 million USD). These five categories accounted for 97.3% of the import value for dried, salted, and in-brine invertebrate products (Table 3.78).
Country of origin and market share for dried, salted, or in-brine aquatic invertebrate other than crustacean product categories:
A. Sea cucumber (Table 3.79)Eighty-two countries supplied dried, salted, or in-brine sea cucumber to Hong Kong. The five countries with the largest shares—Japan, Indonesia, Mexico, Yemen, and China—com-prised 62.8% ($119.8 million USD) of Hong Kong’s import market. Japan, the largest supplier, accounted for a 49.5% share of the total Hong Kong import value (Figs. 3.21 and 3.22).
Country $USDmillion %totalChina 3.13 29.12%Taiwan 2.38 22.14%Japan 2.17 20.18%Thailand 1.68 15.68%Philippines 0.69 6.42%Total 10.05 93.54%
Table3.76.Cuttlefishandsquid:topfiveimportsourcecountriesbyvalue.
Country $USDmillion %totalChina 7.33 73.95%Taiwan 0.62 6.24%Canada 0.56 5.61%Chile 0.55 5.50%Japan 0.28 2.80%
Total 9.33 94.10%
Table3.77.Mollusksunspecified:topfiveimportsourcecountriesbyvalue.
Seafoodtype Metrictons $USDmillionSeacucumber 4,278.42 190.73Scallops 2,251.13 155.02Abalone 368.27 83.94Mollusksunspecified 1,565.27 21.32Squid 1,041.31 15.84
Table3.78.Topfivedried,salted,orbrinedaquaticinvertebratesotherthancrustaceansimportbyvalue.
Country $USDmillion %totalJapan 94.50 49.55%Indonesia 8.46 4.44%Mexico 5.84 3.06%Yemen 5.58 2.93%China 5.45 2.86%Total 119.84 62.83%
Table3.79.Seacucumber:topfiveimportsourcecountriesbyvalue.
Figure 3.21. A dried sea cucumber retail establishment in a Beijing mar-ket. Different species of sea cucumber are perceived to have different qualities, resulting in price differences for sizes and species. The retail setup in Hong Kong is similar. Photo: E. Fong.

Synopsis of the Hong Kong Seafood Market 29
B. Scallops (Table 3.80)Hong Kong imported dried, salted, or in-brine scallops from 10 countries. More than 95% ($148.7 million USD) of the import value of this item can be attributed to five coun-tries. The largest supplier was Japan with a 58.5% share of the import market (Fig. 3.23). This was followed by China (33.3%), Taiwan (3%), Singapore (0.7%), and Indonesia (0.3%).
C. Abalone (Table 3.81)Thirty countries provided dried, salted, or in-brine abalone to Hong Kong. Japan was the largest provider with a mar-ket share of 37.2% (Fig. 3.24). This was followed by South Africa (20.1%), Namibia (13.5%), Zambia (8.9%), and Germany (6.3%).
D. Mollusks unspecified (Table 3.82)Eighteen countries exported dried, salted, or in-brine unspecified mollusks to Hong Kong. China was the largest exporter to Hong Kong in terms of value, with 48.2% ($10.3 million USD) of the total market share, followed by Senegal (7.9%), Chile (3.9%), US (3.3%), and Canada (2.6%).
Figure 3.22. End user view of a sea cucumber. This is a traditional Cantonese Chinese dish of braised sea cucumber and goose feet.
Table3.80.Scallops:topfiveimportsourcecountriesbyvalue.Country $USDmillion %totalJapan 90.73 58.53%China 51.68 33.34%Taiwan 4.66 3.01%Singapore 1.11 0.72%Indonesia 0.50 0.32%Total 148.68 95.91%
Figure 3.23. Dried scallops from Japan on display for the Chinese New Year in 2012. The price was $66.43 USD per pound.
Table3.81.Abalone:topfiveimportsourcecountriesbyvalue.Country $USDmillion %totalJapan 31.20 37.17%SouthAfrica 16.85 20.07%Namibia 11.30 13.46%Zambia 7.44 8.86%Germany 5.28 6.29%Total 72.07 85.85%
Figure 3.24. Dried abalone from Japan costs a consumer $1,053 USD
Country $USDmillion %totalChina 10.27 48.16%Senegal 7.90 37.03%Chile 0.83 3.88%USA 0.70 3.27%Canada 0.55 2.58%
Total 20.24 94.93%
Table3.82.Mollusksunspecified:topfiveimportsourcecountriesbyvalue.

30 Synopsis of the Hong Kong Seafood Market
E. Squid (Table 3.83)Hong Kong imported dried, salted, or in-brine squid from none countries. China was the largest contributor to the import market with 68.9% of the value. This was followed by Thailand (12.2%), Taiwan (10%), Vietnam (6.3%), and Korea (0.7%).
Table3.83.Squid:topfiveimportsourcecountriesbyvalue.Country $USDmillion %totalChina 10.92 68.93%Thailand 1.93 12.22%Taiwan 1.58 9.97%Vietnam 0.99 6.26%Korea 0.12 0.77%Total 15.55 98.15%
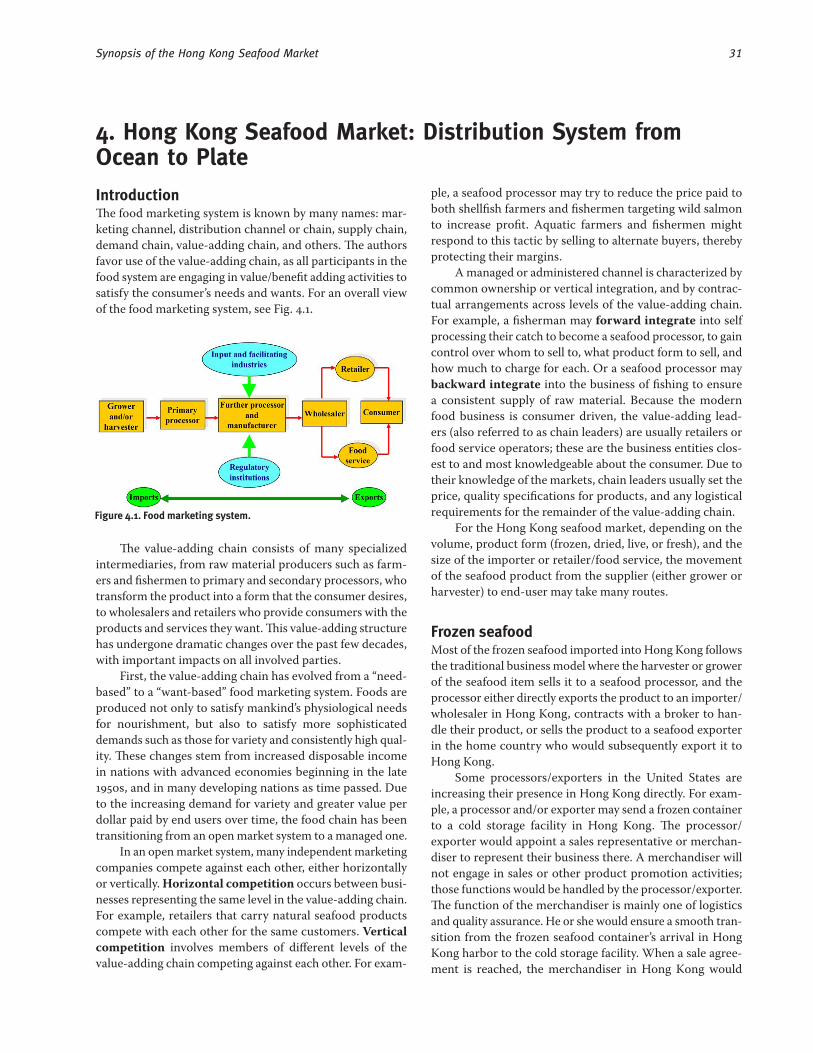
Synopsis of the Hong Kong Seafood Market 31
IntroductionThe food marketing system is known by many names: mar-keting channel, distribution channel or chain, supply chain, demand chain, value-adding chain, and others. The authors favor use of the value-adding chain, as all participants in the food system are engaging in value/benefit adding activities to satisfy the consumer’s needs and wants. For an overall view of the food marketing system, see Fig. 4.1.
The value-adding chain consists of many specialized intermediaries, from raw material producers such as farm-ers and fishermen to primary and secondary processors, who transform the product into a form that the consumer desires, to wholesalers and retailers who provide consumers with the products and services they want. This value-adding structure has undergone dramatic changes over the past few decades, with important impacts on all involved parties.
First, the value-adding chain has evolved from a “need-based” to a “want-based” food marketing system. Foods are produced not only to satisfy mankind’s physiological needs for nourishment, but also to satisfy more sophisticated demands such as those for variety and consistently high qual-ity. These changes stem from increased disposable income in nations with advanced economies beginning in the late 1950s, and in many developing nations as time passed. Due to the increasing demand for variety and greater value per dollar paid by end users over time, the food chain has been transitioning from an open market system to a managed one.
In an open market system, many independent marketing companies compete against each other, either horizontally or vertically. Horizontal competition occurs between busi-nesses representing the same level in the value-adding chain. For example, retailers that carry natural seafood products compete with each other for the same customers. Vertical competition involves members of different levels of the value-adding chain competing against each other. For exam-
ple, a seafood processor may try to reduce the price paid to both shellfish farmers and fishermen targeting wild salmon to increase profit. Aquatic farmers and fishermen might respond to this tactic by selling to alternate buyers, thereby protecting their margins.
A managed or administered channel is characterized by common ownership or vertical integration, and by contrac-tual arrangements across levels of the value-adding chain. For example, a fisherman may forward integrate into self processing their catch to become a seafood processor, to gain control over whom to sell to, what product form to sell, and how much to charge for each. Or a seafood processor may backward integrate into the business of fishing to ensure a consistent supply of raw material. Because the modern food business is consumer driven, the value-adding lead-ers (also referred to as chain leaders) are usually retailers or food service operators; these are the business entities clos-est to and most knowledgeable about the consumer. Due to their knowledge of the markets, chain leaders usually set the price, quality specifications for products, and any logistical requirements for the remainder of the value-adding chain.
For the Hong Kong seafood market, depending on the volume, product form (frozen, dried, live, or fresh), and the size of the importer or retailer/food service, the movement of the seafood product from the supplier (either grower or harvester) to end-user may take many routes.
Frozen seafoodMost of the frozen seafood imported into Hong Kong follows the traditional business model where the harvester or grower of the seafood item sells it to a seafood processor, and the processor either directly exports the product to an importer/wholesaler in Hong Kong, contracts with a broker to han-dle their product, or sells the product to a seafood exporter in the home country who would subsequently export it to Hong Kong.
Some processors/exporters in the United States are increasing their presence in Hong Kong directly. For exam-ple, a processor and/or exporter may send a frozen container to a cold storage facility in Hong Kong. The processor/exporter would appoint a sales representative or merchan-diser to represent their business there. A merchandiser will not engage in sales or other product promotion activities; those functions would be handled by the processor/exporter. The function of the merchandiser is mainly one of logistics and quality assurance. He or she would ensure a smooth tran-sition from the frozen seafood container’s arrival in Hong Kong harbor to the cold storage facility. When a sale agree-ment is reached, the merchandiser in Hong Kong would
4. Hong Kong Seafood Market: Distribution System from Ocean to Plate
Figure 4.1. Food marketing system.

32 Synopsis of the Hong Kong Seafood Market
arrange the transfer of the product from the cold storage in Hong Kong to the buyer, and also would act as a quality assurance representative for the exporting processor/trader. Depending on negotiated arrangements, the sales repre-sentative could also function as a merchandiser and a price negotiator, and conduct sales promotion activities for the seafood exporter/processor.
Some of the retailers in Hong Kong are also directly buying frozen seafood products overseas through overseas consolidators. These are mainly smaller volume purchases to satisfy a niche market such as ex-patriots from the US and other countries. Examples are frozen ready-to-eat meals as shown in Figs. 4.2 and 4.3.
Highlight: sea cucumbers from Alaska—US harvesters to consumers in Hong KongIn Alaska, the red sea cucumber (Parastichopus califor-nicus) is harvested by divers that visit the fishing grounds on smaller boats. As daily harvests reach the boat’s storage capacity, the vessel calls for a tender vessel to pick up their catch and deliver it to the processor (Figs. 4.4 and 4.5). The
Figure 4.2. Frozen ready-to-eat lobster product sold in Hong Kong. These types of products are mainly sold in high-end retail outlets.
Figure 4.3. A frozen ready-to-eat salmon product sold in Hong Kong.
Figure 4.4. In Alaska and many parts of the Pacific Northwest, sea cucumbers (left), sea urchins (right), and geoducks (below) are harvested by divers, usually 30 to 60 feet under water, who are supplied with compressed air from a small boat. Divers harvest sea urchins and sea cucumbers among rocks and put them in their net bags. For geoducks, divers use a hose that shoots a high pressure jet of water to blow away the sand or mud and expose the siphon. The diver quickly grasps the siphon and pulls the giant clam out of the sea-floor. Sea cucumbers are processed into frozen products, sea urchins usually go to market fresh, and geoducks go to market live. Illustrations: Bob Hitz (gear), Sandra Noel and Lisa Peñalver (animals).

Synopsis of the Hong Kong Seafood Market 33
tender weighs the sea cucumber catch as it is brought aboard, ascertains quality, and records these data for later payment when the harvest vessel returns to port (Figs. 4.6 and 4.7). The tender would accept product delivery from several dive boats out on the fishing grounds for transport back to the processing facility. In Alaska fisheries, most sea cucumbers are processed into two primary products—meat and skin (which also includes the connective tissue of the body wall). The meat is scraped off the body wall, vacuum packed and frozen, and shipped to customers in Hong Kong, mainland China, and elsewhere (Fig. 4.8). The skin is generally boiled, and similarly vacuum packed, frozen, and also shipped to Hong Kong, mainland China, and elsewhere. Increasingly, skins from Alaska sea cucumbers are being machine dried at Alaska processors for ease of storage and transport. In Hong Kong, consumers prefer the meat over the skin (Fig. 4.9). The skin product is mainly sold into mainland China where it is primarily used in making soups and stir fry (Figs. 4.10-4.12).
Dried seafoodThere are two avenues of product flow from harvesters to consumers through the value adding chain, depending on species. For products like abalone, sea cucumbers, and scallops, the harvesters/growers sell their products to the processor who performs both primary and secondary value-adding. By the time the product is ready for export, most are ready to directly pass through the Hong Kong import/whole-sale system to the retail level without further value-adding except perhaps some packaging.
For other products such as shark fins and fish maw, harvesters sell their products to a primary processor. The primary processor minimally alters the products and sells them to a Hong Kong importer. The Hong Kong importer may function solely as an importer, or may be vertically inte-
Figure 4.5. From harvest to table: Alaska sea cucumber. This commercial dive fishing vessel is delivering harvested sea cucumber to a tender. The tender, which is either owned or subcontracted by the processing plant, picks up harvested sea cucumbers from different dive vessels.
Figure 4.6. From harvest to table: Alaska sea cucumber. Sea cucumber is offloaded to a tender. The tender stores the sea cucumber in the chilled, plastic-lined gray containers, and then delivers the sea cucumber to the processing plant. Meanwhile, the divers continue fishing out on the fishing grounds.
Figure 4.7. From harvest to table: Alaska sea cucumber. Sea cucumbers are delivered to the processing plants and are processed into two products: meat and skin. Virtually all of the products are exported to Asia. Photo credit: SARDFA (Southeast Alaska Regional Divers Association).
Figure 4.8. From harvest to table: Alaska sea cucumber. The 2 pound retail pack was bought from a retail outlet in Hong Kong in March 2013.

34 Synopsis of the Hong Kong Seafood Market
grated into secondary processing, wholesaling, and/or retail sales. The degree of vertical integration varies. The import-ing enterprises in Hong Kong may own secondary processing plants, which today are generally located outside of Hong Kong in mainland China.
Highlight: shark finsShark fin is one of the most controversial fishery products being traded and consumed in the Hong Kong marketplace. The high demand for shark fins in Asia, particularly in China, has generated concerns regarding the sustainability of shark populations worldwide. These concerns can be attributed to shark life history, which is usually characterized by slow growth, late maturity, relatively few offspring, and long life. These characteristics make shark populations particularly vulnerable to overfishing. Efforts have been made to restrict catches by means of specially designed fishery management plans, by banning shark fin dishes in government-sponsored meals, and through public education designed to reduce demand. Nevertheless, in 2013 Hong Kong imported 2,659 metric tons of dried unprocessed shark fin worth approxi-mately $95 million USD.
Sharks are harvested globally for their fins. In 2013, Hong Kong imported shark fins from 68 countries. The value of the fins is driven principally by the size and length of car-tilaginous fin needles. The larger and longer the fin needles, and the larger the size of the fin, the more value it commands. Moreover, fins from different shark species present different qualities, based on their specific fin needles. For example, tiger and hammerhead shark fins are rated very high in terms of quality, while blue and porbeagle shark fins are rated much lower.
Sharks are caught and the fins are cut off. The com-mercially valuable fins on a shark are the dorsal, the pair of pectoral fins, and the lower lobe of the caudal fin. The fins are sun dried in many parts of the world where there are no frozen storage facilities. Then they are boxed or put in burlap sacks for export to Hong Kong and/or China (Fig. 4.13). Usually, a Chinese buyer/importer/processor would inspect the shark fins, conduct price negotiations, perhaps
Figure 4.9. From harvest to table: Alaska sea cucumber. Stir fried sea cucumber meat with celery and bell peppers served in a Cantonese Chinese restaurant in Hong Kong.
Figure 4.10. From harvest to table: Alaska sea cucumber. Dried skins of different species of sea cucumber for sale in a wholesale/retail market in Beijing, China.
Figure 4.11. From harvest to table: Alaska sea cucumber. These sliced sea cucumber skins, from a retail market in Hong Kong, were sold frozen in the plastic container as shown. Very little product of this type is found in the Hong Kong retail market.
Figure 4.12. These sliced sea cucumber skins, purchased in Hong Kong, were labeled from South America.

Synopsis of the Hong Kong Seafood Market 35
oversee payment, and facilitate packaging and shipping of the fins to their final destination. The shark fins will then be imported into Hong Kong or directly into mainland China to be value added. The dried unprocessed shark fins are soft-ened in water, the skin removed by a wire brush, any meat attached to the fin is removed, and cartilage from the base of the fin and between the fin needles is also removed. The fins are then dried and sold to retailers and restaurants for con-sumption (Figs. 4.14 and 4.15). End users purchase the dried processed fins and rehydrate them, most often for use in tra-ditional soups (Figs. 4.16 and 4.17).
Figure 4.13. Dried unprocessed shark fins being boxed up to be shipped, in 1995. The processor was trying to develop markets for products from the entire shark: dried salted meat as a sub-stitute for salted cod in the Caribbean, jaws for the tourist trade, cartilage to be made into pills, and skin for leather.
Figure 4.14. Processed dried shark fin. This is an assortment of pro-cessed caudal, dorsal, and pectoral fins sold in retail dried seafood markets.
Figure 4.15. Dried processed caudal shark fins in a retail store in 1999. The price was about $200 USD per pound. Above the fins are dried abalone and below are dried scallops.
Figure 4.16. The consumer rehydrates the processed dried shark fins in boiling water with ginger, then discards the water sev-eral times to get rid of a “fishy” odor. These fins are ready to be added to soup.
Figure 4.17. Shark fin soup served at a banquet. The Hong Kong Government now forbids shark fins to be served at gov-ernment-related functions. Private enterprises such as Disneyland Hong Kong have stopped putting shark fins on the menu. Anecdotal information says that the consump-tion of shark fins in China has decreased 50% in the past two years.

36 Synopsis of the Hong Kong Seafood Market
Live and fresh seafoodThe live seafood distribution system is highly sophisticated and complex. The mode of shipment depends on distance, shipping technology, and the length of time live and fresh seafood product has to be out of the water. Products must be moved as quickly as possible to their final destination. For live seafood, in-transit mortality is the major concern. A product that is dead or moribund on arrival is virtually worthless. For fresh seafood any loss of quality is another concern. Transportation can be by air, land, and water or a combination of these. (e.g., Figs. 4.18-4.23).
Figure 4.18. Live seafood by air: harvested geoducks are ready to be boxed and shipped out by air from Mexico. Photo: S. Greenlaw.
Figure 4.19. Geoducks from Mexico are boxed up for air shipment to China or Hong Kong. Photo: S. Greenlaw.
Figure 4.20. In this photo spiny lobsters are unpacked in a wholesale market in Beijing, China. Many different species are shipped by air to destination markets. For example, live finfish are transported by air in styrofoam boxes lined with plastic bags and filled with seawater.
Figure 4.21. Unpacked spiny lobsters are either put into live tanks at the wholesale facility or sent directly to retail markets in Beijing, China.

Synopsis of the Hong Kong Seafood Market 37
Highlight: at-sea live finfish distribution in Hong KongOne mode of live seafood distribution is by water transport. A live seafood distributor in Hong Kong may own one or sev-eral vessels equipped with live fish holds. These vessels collect live seafood from marine fish farms in any of the 29 fish cul-ture zones designated by the Hong Kong Government. Live seafood can also be procured from marine fish farms close by in mainland China, and/or from live fish transport vessels that collect fish from fishermen or middlemen from a variety of foreign countries such as Indonesia and the Philippines, and as far away as Micronesia (Figs. 4.24-4.29).
Once the local Hong Kong distributing vessel has taken receipt of the live products, they are transferred to the land-based distributors either to be held in holding facilities or to be loaded onto live fish trucks equipped with aerators and conditioned water. The live fish are then distributed to retail markets and restaurants until sale (Figs. 4.30-4.34).
Figure 4.22. Live seafood at their retail destination in Hong Kong. Hong Kong and China share the same mode of transportation sys-tem and technologies. From this retail location, consumers purchase the live seafood and either take it home or take it to a nearby restaurant to be cooked.
Figure 4.23. Crab and abalone on the table. The dish in the foreground is braised abalone that was shipped live from northeastern China. The crab were shipped live from Bangladesh. Four people were having dinner—each had abalone and crab and other dishes were shared.
Figure 4.24. At-sea live seafood wholesaler. These boats have seawa-ter wells that hold live seafood. They set out before dawn to collect seafood from fishing vessels/tenders that come back from fishing grounds as far away as Micronesia, as well as from aquaculture operations in mainland China, and from net pen operations in a fish culture zone in Hong Kong. The live seafood wholesaler boats are mainly family operations that may own multiple vessels.

38 Synopsis of the Hong Kong Seafood Market
Figure 4.25. Live fish carrier. Fishermen use different techniques to catch fish for the live reef fish market. Some use hook and line and nets, and others use the highly destructive methods of cyanide or dynamite. Fish are caught and put in pens to a sufficient volume, then are put on the live fish carrier to be transported back to Hong Kong. The increased demand with the rise in income in China, coupled with destructive fishing methods, has generated concerns about habitat destruction and overfishing.
Figure 4.26. Offloading from a live fish carrier. The wholesaler with the red skiff is unloading live reef fish from a live fish car-rier. At the same time this wholesaler is selling his/her fish to another wholesaler.
Figure 4.27. Offloading fish from the live fish carrier. The wholesaler is sorting fish according to species and size.
Figure 4.28. Buying from aquaculture operators. The wholesaler in the white shirt is buying from a net pen operator in one of Hong Kong’s 29 fish culture zones.
Figure 4.29. Delivery. After wholesalers buy live seafood from suppli-ers, they deliver their fish to one of the four Hong Kong Fish Marketing Organization wholesale facilities. The facilities provide infrastructure for onshore live seafood wholesalers to hold inventory and for transportation. The live fish whole-saler is delivering fish to the Kwun Tong facility in Kowloon.
Figure 4.30. Offloading. Live fish are offloaded from the live fish whole-sale vessel to the onshore wholesaler. Fish are weighed, species are identified, and sale price is recorded.

Synopsis of the Hong Kong Seafood Market 39
Figure 4.31. Onshore live fish wholesalers. These wholesalers hold live fish inventory on aerated tanks. They get their live seafood supply from fishing vessels and at-sea wholesalers, as well as by air transportation.
Figure 4.33. Final destination—restaurant. Live seafood is delivered to restaurants or retail establishments, and put into display tanks. This restaurant offers a selection of finfish, abalone, different species of spiny lobsters, and shrimp. The promo-tional poster shows an Australian spiny lobster. The unit price is Hong Kong dollars per teal; a teal is a traditional Chinese weight unit equal to 1.33 ounces.
Figure 4.34. Grouper on the table. Grouper is by far the most popular live reef fish for consumption. As in many Cantonese dishes, the fish is steamed to preserve its subtle flavor. The fish is usually steamed with ginger and green onions, then driz-zled with light soy sauce.
Figure 4.32. Live fish delivery trucks. Live seafood is delivered to retail and/or restaurant establishments by open-top trucks equipped with air hoses to aerate the fish. Fish are put in plastic tubs filled with freshwater or seawater, depending on species.

40 Synopsis of the Hong Kong Seafood Market
In an open and transparent economy such as Hong Kong, the consumers are the drivers of the market, based on their taste and preferences and willingness to pay. A survey of the Hong Kong seafood market that examines the structure of Hong Kong retail and food service, the variety of seafood products imported into Hong Kong, and the channels of distribution for different product categories (dried, fresh, frozen, and live) shows that the Hong Kong seafood mar-ket is mature and sophisticated. In order to stay competitive and remain profitable, seafood businesses from importers to retailers continually source their seafood globally to satisfy price-conscious customers who demand high quality, vari-ety, and novel products (Fig. 5.1).
Given Hong Kong’s unique location and position as a trading hub and financial center, coupled with dependency on imports, Hong Kong consumers are adventurous and eager to experiment with new and different seafood prod-ucts. Moreover, parallel to the trends in other countries, consumers are becoming increasingly health-conscious with natural and organic products picking up in popularity: there has been a gradual shift in what food consumers want in Hong Kong. Fruits and vegetables are gaining in popularity while the importance of meat, especially red meat, are seeing decline. Consumers increasingly look for freshness, health-iness, new varieties, and shorter meal-preparation time for food. Consumers want foods of higher nutritional value, but also increasingly pay attention to food safety and hygiene. In short, the marketing trend is to position food products as healthy, natural, nutritional, and convenient to prepare (Figs. 5.2-5.4).
5. Trends Impacting Hong Kong Seafood Sales for US Seafood Producers
Figure 5.1. Live Alaska king crab in a live seafood retail market. This has been the latest seafood craze for the past two years.
Figure 5.2. Organic food store in Mid-Levels, an affluent area of Hong Kong. The market size for organic packaged food and bev-erages in Hong Kong was $27.4 million USD in 2015, the 33rd largest market and 25th largest spending per capita in the world. Hong Kong has 138 farms, five aquaculture oper-ations, and five food processing and handling companies that are certified by the Hong Kong Organic Resource Center.
Figure 5.3. A local foods market. Just like in the US, there is a movement toward consuming local foods in Hong Kong. While most foods are imported, locally produced and consumed foods include vegetables, poultry, and pigs.

Synopsis of the Hong Kong Seafood Market 41
US seafood products have established a niche in the Hong Kong market and will continue to play a role. This is because US seafood and food products traditionally are generally perceived as high quality and safe. Moreover, due to a consistently high level of air pollution and increasing concerns about the environment and food safety, Hong Kong consumers are embracing natural and organic prod-ucts and they want to know where their products are from. Increasingly, seafood products that are wild-caught are labeled as such, and products from the US and Europe, which are perceived as safe and high quality, are using country of origin as a branding tool and often command a price pre-mium that places their products in the high-end markets (e.g., Figs. 5.5-5.7).
Finally, another trend that may benefit US seafood prod-ucts is the increasing acceptability of frozen food products, including seafood, by Hong Kong consumers. In part this is the result of the outbreak of SARS (severe acute respi-ratory syndrome) and avian flu in the early 2000s, which changed the food marketing structure. Because of avian flu, live chickens were not allowed to be displayed or sold in markets. Importers had to bring in chilled or frozen fowl as a substitute, which in turn changed consumers’ prefer-ences toward frozen food products in a favorable manner. Moreover, the internationalization of the city, which brought back many ex-patriots from other countries as well as Hong Kong Chinese from abroad, and the demand for convenience, helped positively shift the taste and preferences of Hong Kong consumers toward perceiving frozen seafood as high quality (Figs. 5.7 and 5.8).
Figure 5.4. Sushi takeout in a department store. Japanese cuisine is highly popular in Hong Kong with at least 1,290 restaurants. Seafoods that are served raw are considered fresh and high quality. The past decade has seen a proliferation of sushi takeout, first in department stores and lately in takeout shops with the option of sushi made to order.
Figure 5.5. Fresh seafood counter in a high-end supermarket. Affluent consumers in Hong Kong are looking for high quality sea-food and want to know where their fish is coming from. Many retail operations that cater to this market segment have country-of-origin labeling.
Figure 5.6. Braised oysters in chiu chow cuisine (a regional cuisine in Guangdong Province, China). The restaurant serving this dish marketed the oysters as a US product. US shellfish, particularly oysters, have developed a very good reputa-tion in Hong Kong.

42 Synopsis of the Hong Kong Seafood Market
Figure 5.7. Frozen pollock fillet as a local brand. Note the country of ori-gin and wild caught labels.
Figure 5.8. Frozen gutted horsehead as a local brand. It has an “ocean caught” label in Chinese.

Synopsis of the Hong Kong Seafood Market 43
Carroll, J.M. 2007. Concise history of Hong Kong. Rowman and Littlefield Publishers, Landham, MD USA.
Cheung, M. 1995. The complete book of seafood (Hong Kong). Third edition. Wan Li Book Center, Hong Kong. 222 pp. In Chinese.
Hong Kong Census and Statistics Department. 2015. Table EO11: Number of establishments, persons engaged and vacan-cies (other than those in Civil Service) analysed by industry sub-class. http://www.censtatd.gov.hk/hkstat/sub/sp452.jsp?productCode=D5250008
Hong Kong Census and Statistics Department. 2016. 2014/2015 household expenditure survey and the rebasing of the con-sumer price indices. Price Statistics Branch, Census and Statistics Department. Hong Kong SAR, China. www.cen-statd.gov.hk
Hong Kong Census and Statistics Department. Various years. Hong Kong external merchandise trade statistics. Trade Analysis Division, Census and Statistics Department. Hong Kong SAR, China. www.censtatd.gov.hk
Hong Kong Census and Statistics Department. Various years. Hong Kong merchandise trade statistics—imports. Trade Analysis Division, Census and Statistics Department. Hong Kong SAR, China. www.censtatd.gov.hk
Hong Kong Census and Statistics Department. Various years. Hong Kong merchandise trade statistics—re-export. Trade Analysis Division, Census and Statistics Department. Hong Kong SAR, China. www.censtatd.gov.hk
Hong Kong Census and Statistics Department. Various years. Report on monthly retail sales. Hong Kong SAR, China. www.censtatd.gov.hk
Hong Kong Census and Statistics Department. Various years. Report on quarterly survey of restaurant receipts and pur-chases. Hong Kong SAR, China. www.censtatd.gov.hk
Hong Kong Organic Resource Center Certification Ltd. 2016. Certified operations. http://www.hkorc-cert.org/english/elist.htm
Hong Kong Trade Development Council. 2016. Economic and trade information on Hong Kong. http://hong-kong-economy-research.hktdc.com/business-news/article/Market-Environment/Economic-and-Trade-Information-on-Hong-Kong/etihk/en/1/1X48LWJT/1X09OVUL.htm
Organic Trade Association. 2015. Hong Kong—Global organic trade guide. http://www.globalorganictrade.com/country/hong-kong
Subasinghe, S. 1992. Shark fin, sea cucumber and jelly fish—a pro-cessor’s guide. INFOFISH Technical Handbook 6. INFOFISH, Kuala Lumpur Malaysia. 31 pp.
Tsang, S. 2007. A modern history of Hong Kong. I.B. Tauris. London, UK. 352 pp.
USDA Foreign Agriculture Service. 2014. HRI food service sec-tor annual 2014—Hong Kong. USDA FAS Global Agriculture Information Network (GAIN) Report Number HK1416. 23 pp.
USDA Foreign Agriculture Service. 2014. Retail food service sec-tor annual 2014—Hong Kong. USDA FAS Global Agriculture Information Network (GAIN) Report Number HK1415. 23 pp.
USDOC. Various years. Commercial fisheries statistics—US Foreign Trade. NOAA Fisheries, Fisheries Statistics Division. http://www.st.nmfs.noaa.gov/st1/trade/index.html
World Bank. 2015. Doing business 2015: Going beyond effi-ciency. World Bank, Washington, DC. 331 pp. http://doi.org/10.1596/978-1-4648-0351-2.
Yeong, W.X., C.C. Lam, and B.Y. Chew. 1995. The complete book of dried seafood and foodstuffs (Hong Kong). Third edition. Wan Li Book Center, Hong Kong. 246 pp. In Chinese.
6. Hong Kong Seafood: Further Reading and Bibliography
44 Synopsis of the Hong Kong Seafood Market
AcknowledgmentsThe authors would like to thank Quentin Fong’s siblings Edwin Fong, Leona Fong, and Joanna Fong for access to Hong Kong seafood market information and pictures. They made introductions and arranged meetings for the author to talk with stakeholders in the food and hospitality indus-try at all levels. Also many thanks to Tomi Marsh (F/V Savage), Stephen Greenlaw (University of Alaska Fairbanks), Southeast Alaska Regional Diver’s Association, and Dr. Cathy Xu (Fresno State University) for their help in obtaining pho-tos of Alaska sea cucumber dive and tender operations, geoduck packing in Mexico, and seafood wholesale opera-tions in Beijing, China. Scott Smiley, Terry Johnson (Alaska Sea Grant Marine Advisory Program), and Sue Keller (Alaska Sea Grant) provided their editorial prowess, and we are indebted to them. Thanks to all the Alaska seafood industry folks we met and work with for their support and encourage-ment for this endeavor. You are the folks who took the risk to be in this dynamic yet volatile industry. Finally, Quentin would like to thank his wife Beverly and stepdaughter Anna who give him the inspiration and drive to continue to serve our great state of Alaska.