Synergy for Progressive Reforms - bi.go.id · Indonesia Philippines Vietnam Thailand Malaysia...
83
0 Republic of Indonesia November 2016 Synergy for Progressive Reforms
Transcript of Synergy for Progressive Reforms - bi.go.id · Indonesia Philippines Vietnam Thailand Malaysia...
0
Republic of Indonesia
November 2016
Synergy for Progressive Reforms
1
Investor Relations Unit (IRU) of the Republic of Indonesia has been established as a joint effort between Coordinating Ministry of Economic Affairs,
Ministry of Finance and Bank Indonesia since 2005. The main objective of IRU is to actively communicate Indonesian economic policy and to
address concerns of investors, especially financial market investors.
As an important part of its communication measures, IRU maintains a website under Bank Indonesia website which is administered by
International Department of Bank Indonesia. However, day-to-day activities of IRU are supported by all relevant government agencies, among
others: Bank Indonesia, Ministry of Finance, Coordinating Ministry for Economic Affairs, Investment Coordinating Board, Ministry of Trade, Ministry
of State Owned Enterprises, Ministry of Energy and Mineral Resources and Financial Services Authority.
IRU also convenes an investor conference call on a quarterly basis, answers questions through email, telephone and may arrange direct visit of
banks/financial institutions to Bank Indonesia and other relevant government offices.
Published by Investor Relations Unit – Republic of Indonesia
Contact: Wiwit Widyastuti K. (International Department - Bank Indonesia, Phone: +6221 2981 8279)
Dalyono (Fiscal Policy Office - Ministry of Finance)
Farid Arif Wibowo (Directorate General of Budget Financing and Risk Management - Ministry of Finance)
E-mail: [email protected]
About Investor Relations Unit of the Republic of Indonesia
2
Overview
1
2
3
4
5
6
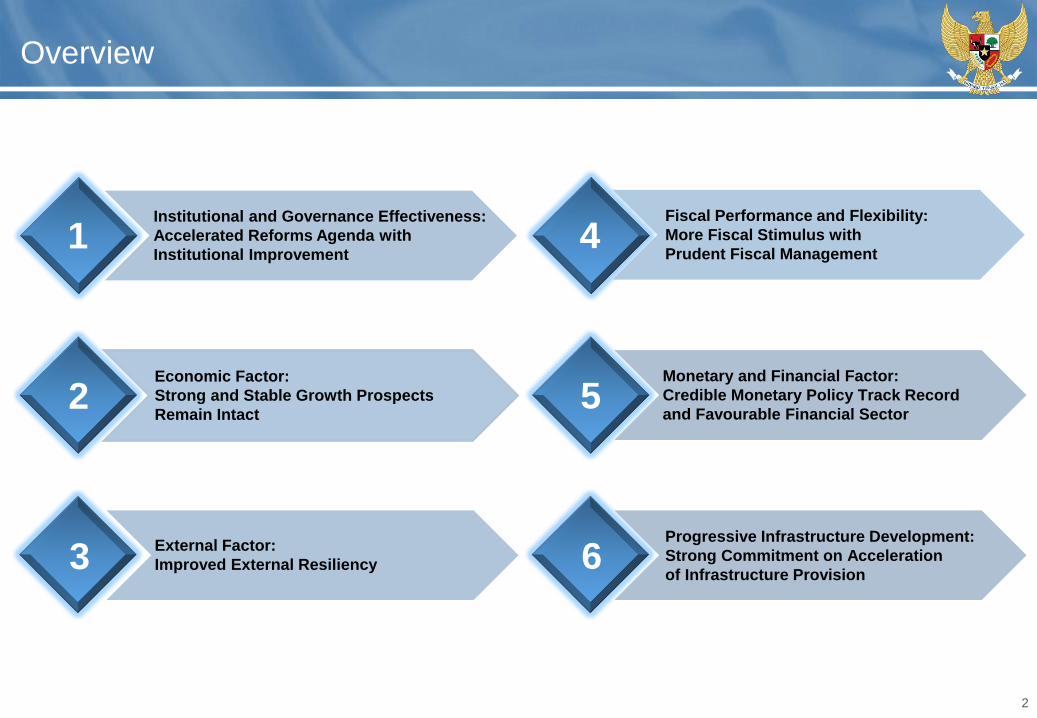
Institutional and Governance Effectiveness:
Accelerated Reforms Agenda with
Institutional Improvement
Economic Factor:
Strong and Stable Growth Prospects
Remain Intact
External Factor:
Improved External Resiliency
Fiscal Performance and Flexibility:
More Fiscal Stimulus with
Prudent Fiscal Management
Monetary and Financial Factor:
Credible Monetary Policy Track Record
and Favourable Financial Sector
Progressive Infrastructure Development:
Strong Commitment on Acceleration
of Infrastructure Provision
Accelerated Reforms Agenda with Institutional Improvement
Institutional and Government Effectiveness:1
4
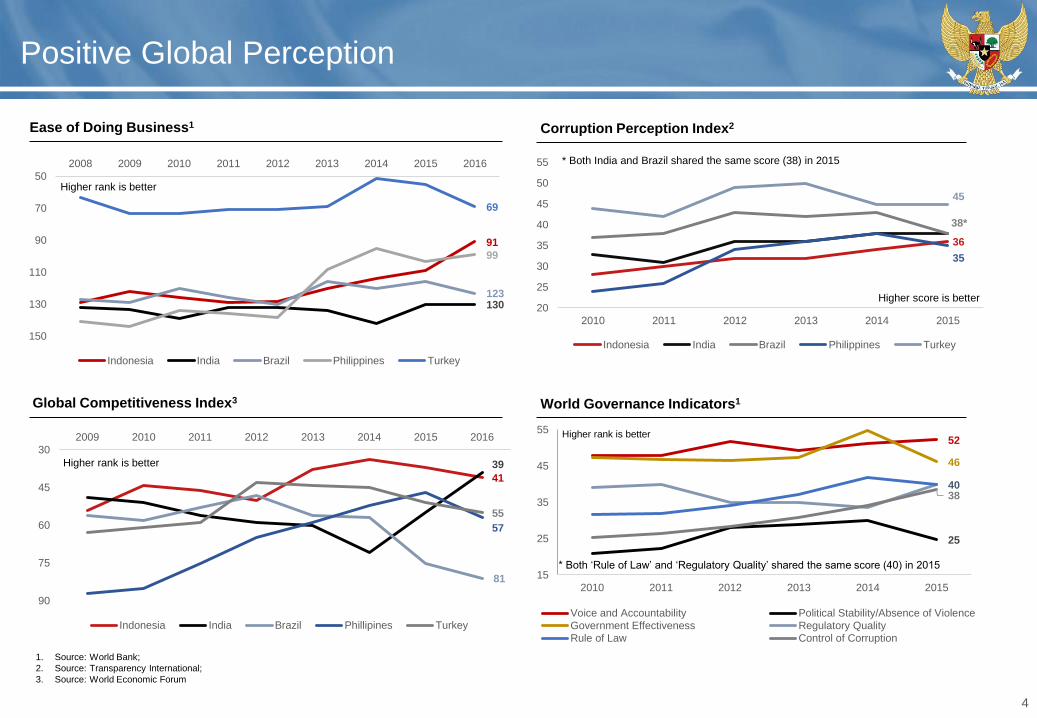
Positive Global Perception
52
25
46
4038
15
25
35
45
55
2010 2011 2012 2013 2014 2015
Voice and Accountability Political Stability/Absence of Violence
Government Effectiveness Regulatory Quality
Rule of Law Control of Corruption
1. Source: World Bank;
2. Source: Transparency International;
3. Source: World Economic Forum
World Governance Indicators1
Ease of Doing Business1
Global Competitiveness Index3
Corruption Perception Index2
Higher rank is better
Higher score is better
36
38*
35
45
20
25
30
35
40
45
50
55
2010 2011 2012 2013 2014 2015
Indonesia India Brazil Philippines Turkey
* Both India and Brazil shared the same score (38) in 2015
Higher rank is better
41
39
81
57
55
30
45
60
75
90
2009 2010 2011 2012 2013 2014 2015 2016
Indonesia India Brazil Phillipines Turkey
Higher rank is better
91
130123
99
69
50
70
90
110
130
150
2008 2009 2010 2011 2012 2013 2014 2015 2016
Indonesia India Brazil Philippines Turkey
* Both ‘Rule of Law’ and ‘Regulatory Quality’ shared the same score (40) in 2015
5
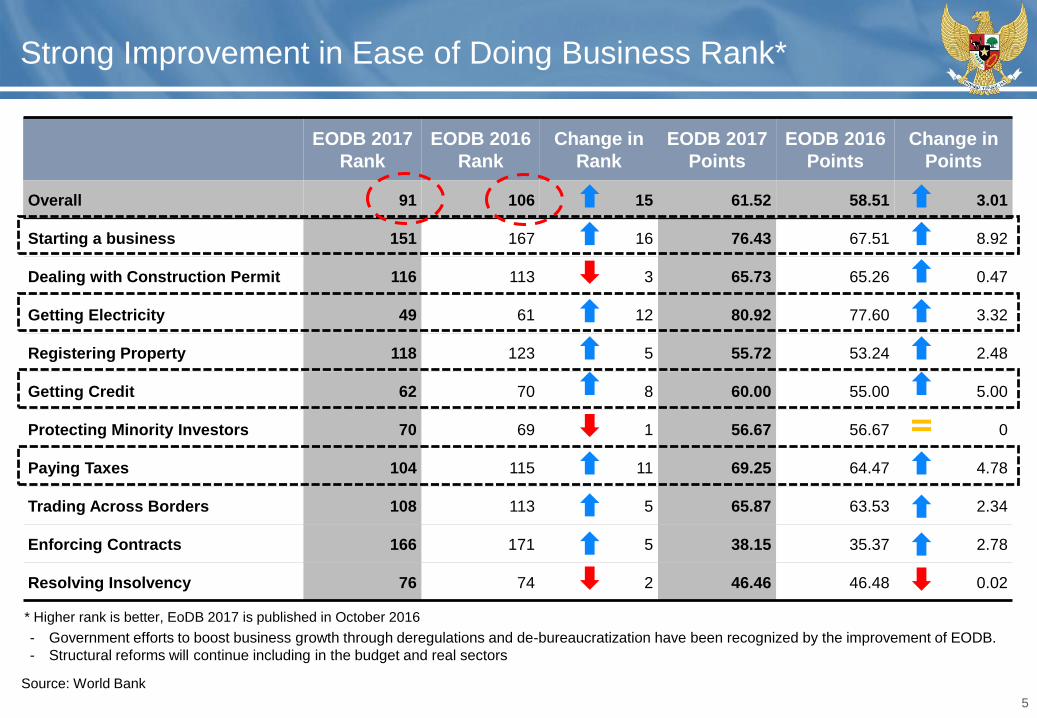
Strong Improvement in Ease of Doing Business Rank*
EODB 2017
Rank
EODB 2016
Rank
Change in
Rank
EODB 2017
Points
EODB 2016
Points
Change in
Points
Overall 91 106 15 61.52 58.51 3.01
Starting a business 151 167 16 76.43 67.51 8.92
Dealing with Construction Permit 116 113 3 65.73 65.26 0.47
Getting Electricity 49 61 12 80.92 77.60 3.32
Registering Property 118 123 5 55.72 53.24 2.48
Getting Credit 62 70 8 60.00 55.00 5.00
Protecting Minority Investors 70 69 1 56.67 56.67 0
Paying Taxes 104 115 11 69.25 64.47 4.78
Trading Across Borders 108 113 5 65.87 63.53 2.34
Enforcing Contracts 166 171 5 38.15 35.37 2.78
Resolving Insolvency 76 74 2 46.46 46.48 0.02
- Government efforts to boost business growth through deregulations and de-bureaucratization have been recognized by the improvement of EODB.
- Structural reforms will continue including in the budget and real sectors
Source: World Bank
* Higher rank is better, EoDB 2017 is published in October 2016
6
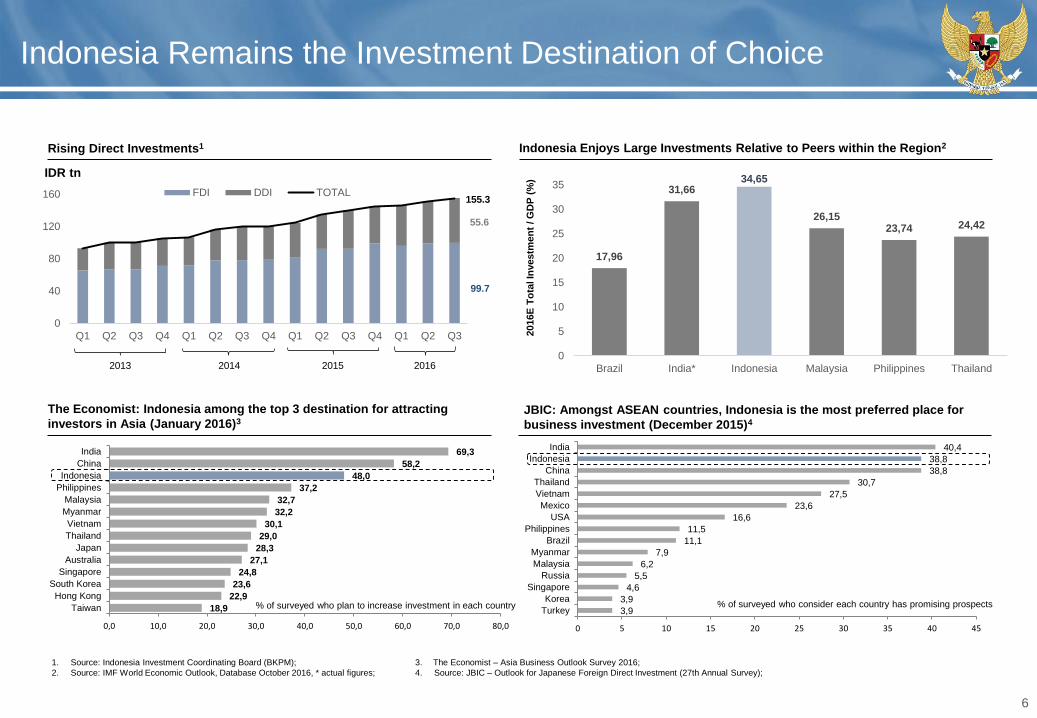
Indonesia Remains the Investment Destination of Choice
3,9
3,9
4,6
5,5
6,2
7,9
11,1
11,5
16,6
23,6
27,5
30,7
38,8
38,8
40,4
0 5 10 15 20 25 30 35 40 45
Turkey
Korea
Singapore
Russia
Malaysia
Myanmar
Brazil
Philippines
USA
Mexico
Vietnam
Thailand
China
Indonesia
India
% of surveyed who consider each country has promising prospects
1. Source: Indonesia Investment Coordinating Board (BKPM);
2. Source: IMF World Economic Outlook, Database October 2016, * actual figures;
3. The Economist – Asia Business Outlook Survey 2016;
4. Source: JBIC – Outlook for Japanese Foreign Direct Investment (27th Annual Survey);
IDR tn
2016E
To
tal In
vestm
en
t / G
DP
(%
)
Indonesia Enjoys Large Investments Relative to Peers within the Region2
JBIC: Amongst ASEAN countries, Indonesia is the most preferred place for
business investment (December 2015)4
The Economist: Indonesia among the top 3 destination for attracting
investors in Asia (January 2016)3
18,9
22,9
23,6
24,8
27,1
28,3
29,0
30,1
32,2
32,7
37,2
48,0
58,2
69,3
0,0 10,0 20,0 30,0 40,0 50,0 60,0 70,0 80,0
Taiwan
Hong Kong
South Korea
Singapore
Australia
Japan
Thailand
Vietnam
Myanmar
Malaysia
Philippines
Indonesia
China
India
% of surveyed who plan to increase investment in each country
155.3
55.6
99.7
2013 2014 2015 2016
Rising Direct Investments1
17,96
31,6634,65
26,1523,74 24,42
0
5
10
15
20
25
30
35
Brazil India* Indonesia Malaysia Philippines Thailand
0
40
80
120
160
Q1 Q2 Q3 Q4 Q1 Q2 Q3 Q4 Q1 Q2 Q3 Q4 Q1 Q2 Q3
FDI DDI TOTAL
7
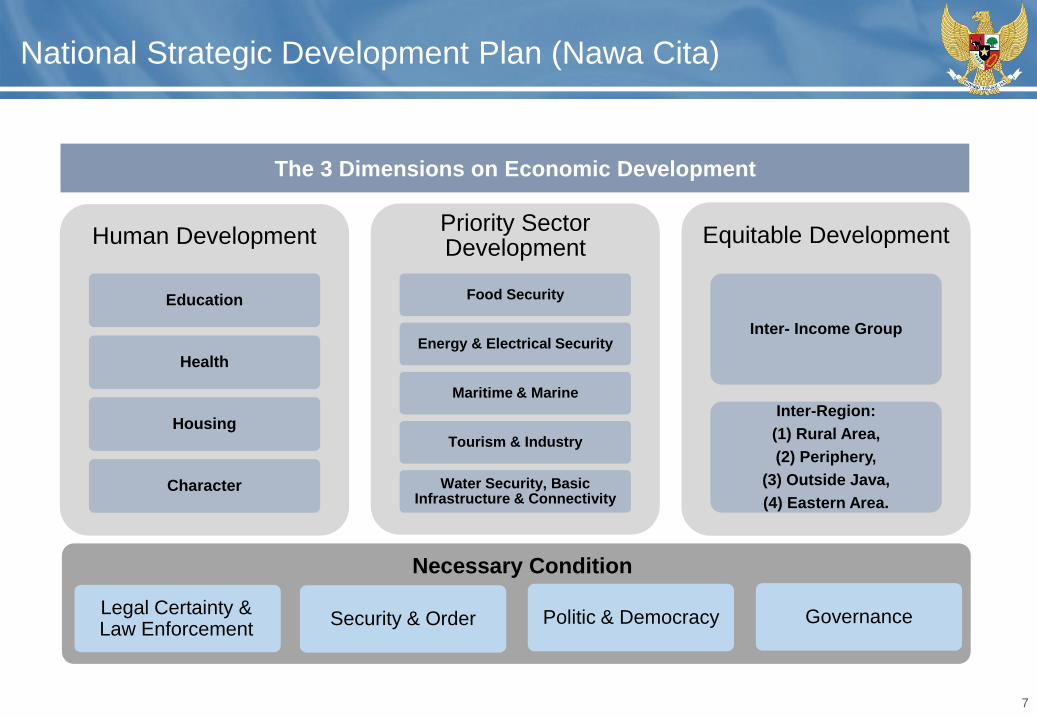
National Strategic Development Plan (Nawa Cita)
Human Development
Education
Health
Housing
Character
Priority Sector Development
Food Security
Energy & Electrical Security
Maritime & Marine
Tourism & Industry
Water Security, Basic Infrastructure & Connectivity
Equitable Development
Inter- Income Group
Inter-Region:
(1) Rural Area,
(2) Periphery,
(3) Outside Java,
(4) Eastern Area.
Security & Order Politic & Democracy Governance
The 3 Dimensions on Economic Development
Necessary Condition
Legal Certainty & Law Enforcement
8
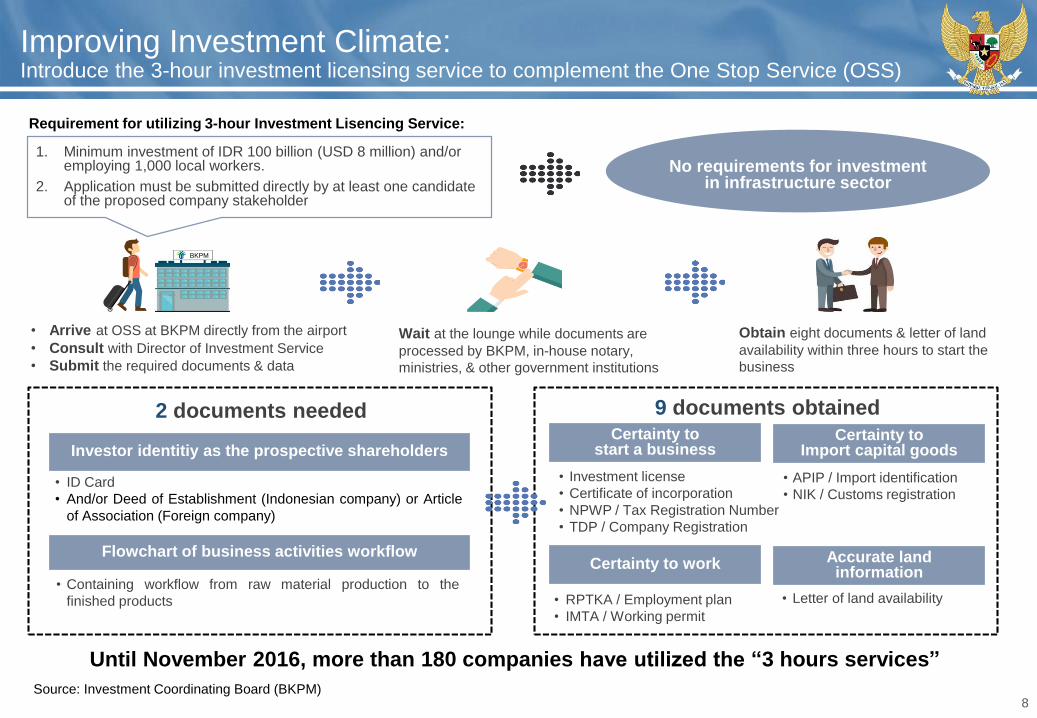
Improving Investment Climate:Introduce the 3-hour investment licensing service to complement the One Stop Service (OSS)
BKPM
• Arrive at OSS at BKPM directly from the airport
• Consult with Director of Investment Service
• Submit the required documents & data
Requirement for utilizing 3-hour Investment Lisencing Service:
No requirements for investment in infrastructure sector
9 documents obtained
Wait at the lounge while documents are
processed by BKPM, in-house notary,
ministries, & other government institutions
Obtain eight documents & letter of land
availability within three hours to start the
business
• RPTKA / Employment plan
• IMTA / Working permit
• Investment license
• Certificate of incorporation
• NPWP / Tax Registration Number
• TDP / Company Registration
• APIP / Import identification
• NIK / Customs registration
• Letter of land availability
Until November 2016, more than 180 companies have utilized the “3 hours services”
Certainty to start a business
Certainty to Import capital goods
Certainty to work Accurate land information
1. Minimum investment of IDR 100 billion (USD 8 million) and/or employing 1,000 local workers.
2. Application must be submitted directly by at least one candidate of the proposed company stakeholder
2 documents needed
• ID Card
• And/or Deed of Establishment (Indonesian company) or Article
of Association (Foreign company)
• Containing workflow from raw material production to the
finished products
Investor identitiy as the prospective shareholders
Flowchart of business activities workflow
Source: Investment Coordinating Board (BKPM)
9
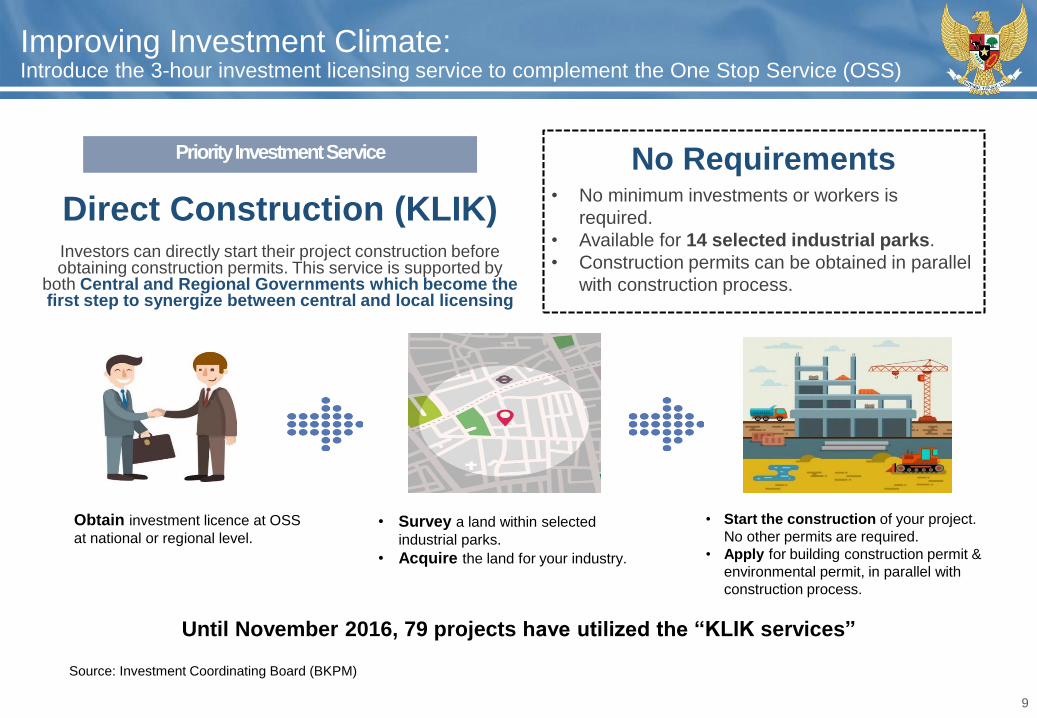
Improving Investment Climate:Introduce the 3-hour investment licensing service to complement the One Stop Service (OSS)
Direct Construction (KLIK)
No Requirements• No minimum investments or workers is
required.
• Available for 14 selected industrial parks.
• Construction permits can be obtained in parallel
with construction process.
Investors can directly start their project construction before obtaining construction permits. This service is supported by
both Central and Regional Governments which become the first step to synergize between central and local licensing
Obtain investment licence at OSS
at national or regional level.• Survey a land within selected
industrial parks.
• Acquire the land for your industry.
• Start the construction of your project.
No other permits are required.
• Apply for building construction permit &
environmental permit, in parallel with
construction process.
Priority Investment Service
Source: Investment Coordinating Board (BKPM)
Until November 2016, 79 projects have utilized the “KLIK services”
10
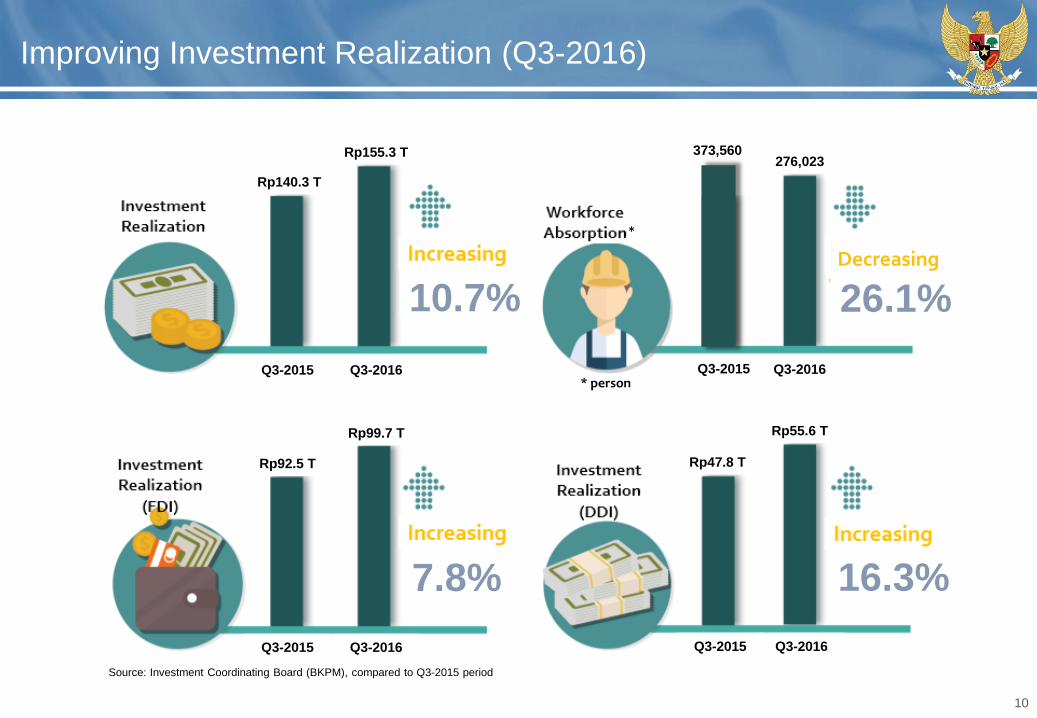
Improving Investment Realization (Q3-2016)
Source: Investment Coordinating Board (BKPM), compared to Q3-2015 period
Rp140.3 T
Rp155.3 T
Rp92.5 T
Rp99.7 T
Rp47.8 T
Rp55.6 T
373,560276,023
10.7% 26.1%
7.8% 16.3%
Q3-2015 Q3-2016
Q3-2015 Q3-2016
Q3-2015 Q3-2016
Q3-2015 Q3-2016
*
* person
Decreasing
11
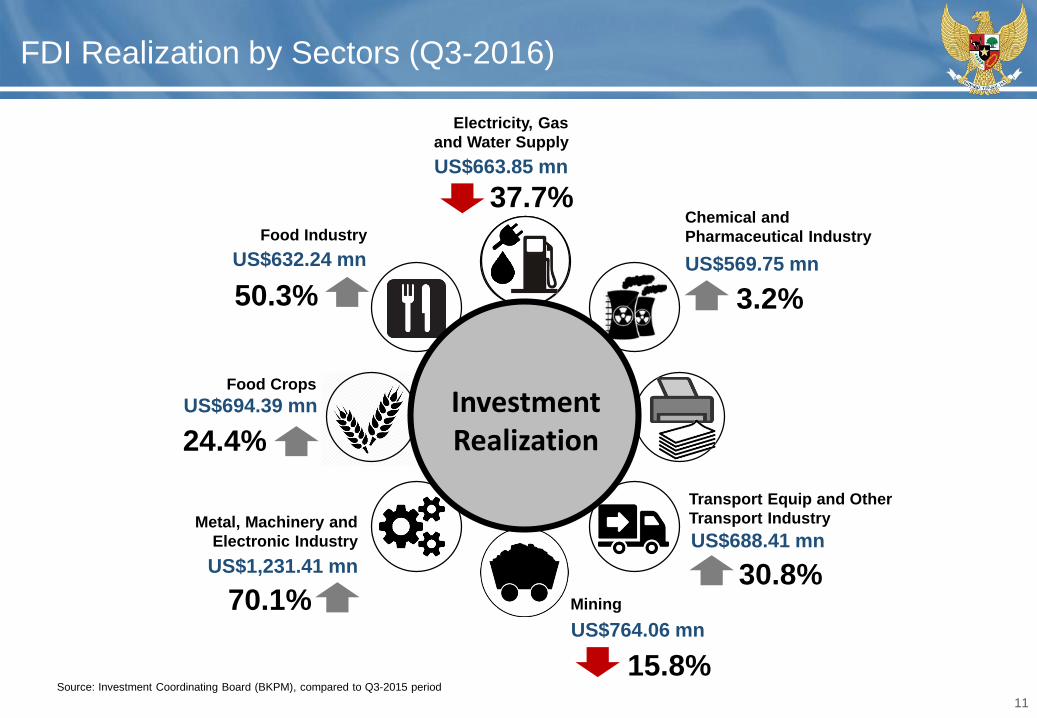
FDI Realization by Sectors (Q3-2016)
Mining
Chemical and
Pharmaceutical Industry
Transport Equip and Other
Transport IndustryMetal, Machinery and
Electronic Industry
Source: Investment Coordinating Board (BKPM), compared to Q3-2015 period
US$569.75 mn
US$663.85 mn
US$688.41 mn
US$764.06 mn
US$1,231.41 mn
US$632.24 mn
Food Industry
50.3%
US$694.39 mnFood Crops
24.4%
70.1%
15.8%
30.8%
3.2%
37.7%
Investment Realization
Electricity, Gas
and Water Supply
12
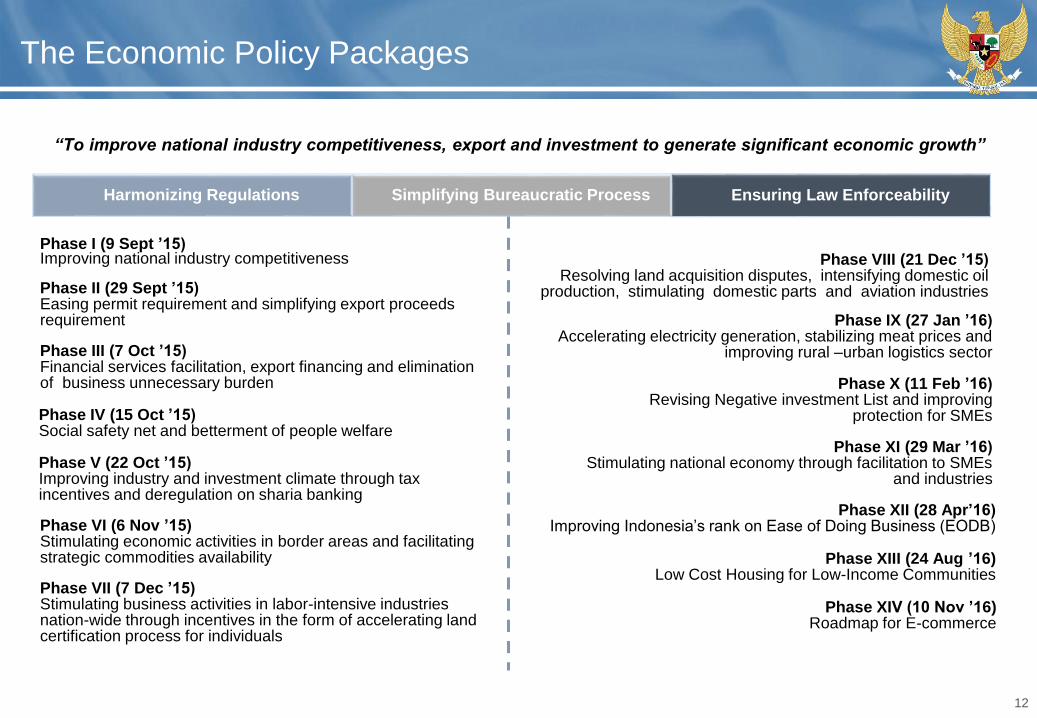
The Economic Policy Packages
“To improve national industry competitiveness, export and investment to generate significant economic growth”
Phase III (7 Oct ’15)Financial services facilitation, export financing and elimination of business unnecessary burden
Phase IV (15 Oct ’15)Social safety net and betterment of people welfare
Phase V (22 Oct ’15)Improving industry and investment climate through tax incentives and deregulation on sharia banking
Harmonizing Regulations Simplifying Bureaucratic Process Ensuring Law Enforceability
Phase VI (6 Nov ’15)Stimulating economic activities in border areas and facilitating strategic commodities availability
Phase I (9 Sept ’15)Improving national industry competitiveness
Phase II (29 Sept ’15)Easing permit requirement and simplifying export proceeds requirement
Phase VII (7 Dec ’15)Stimulating business activities in labor-intensive industries nation-wide through incentives in the form of accelerating land certification process for individuals
Phase VIII (21 Dec ’15)Resolving land acquisition disputes, intensifying domestic oil
production, stimulating domestic parts and aviation industries
Phase IX (27 Jan ’16)Accelerating electricity generation, stabilizing meat prices and
improving rural –urban logistics sector
Phase X (11 Feb ’16)Revising Negative investment List and improving
protection for SMEs
Phase XI (29 Mar ’16)Stimulating national economy through facilitation to SMEs
and industries
Phase XII (28 Apr’16)Improving Indonesia’s rank on Ease of Doing Business (EODB)
Phase XIII (24 Aug ’16)Low Cost Housing for Low-Income Communities
Phase XIV (10 Nov ’16)Roadmap for E-commerce
13
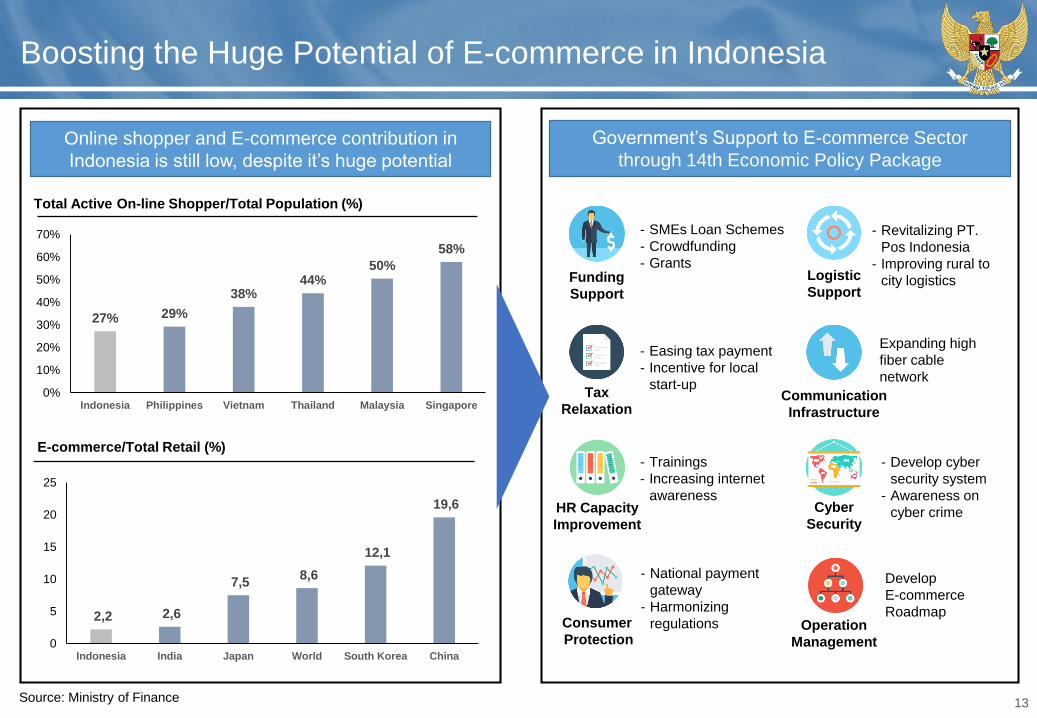
Boosting the Huge Potential of E-commerce in Indonesia
2,2 2,6
7,5 8,6
12,1
19,6
0
5
10
15
20
25
Indonesia India Japan World South Korea China
27% 29%
38%44%
50%
58%
0%
10%
20%
30%
40%
50%
60%
70%
Indonesia Philippines Vietnam Thailand Malaysia Singapore
- SMEs Loan Schemes
- Crowdfunding
- Grants
- Easing tax payment
- Incentive for local
start-up
- National payment
gateway
- Harmonizing
regulations
- Trainings
- Increasing internet
awareness
- Revitalizing PT.
Pos Indonesia
- Improving rural to
city logistics
Expanding high
fiber cable
network
- Develop cyber
security system
- Awareness on
cyber crime
Develop
E-commerce
Roadmap
Total Active On-line Shopper/Total Population (%)
E-commerce/Total Retail (%)
Online shopper and E-commerce contribution in
Indonesia is still low, despite it’s huge potential
Government’s Support to E-commerce Sector
through 14th Economic Policy Package
Consumer
Protection
Communication
Infrastructure
Logistic
Support
HR Capacity
Improvement
Tax
Relaxation
Funding
Support
Cyber
Security
Operation
Management
Source: Ministry of Finance
14
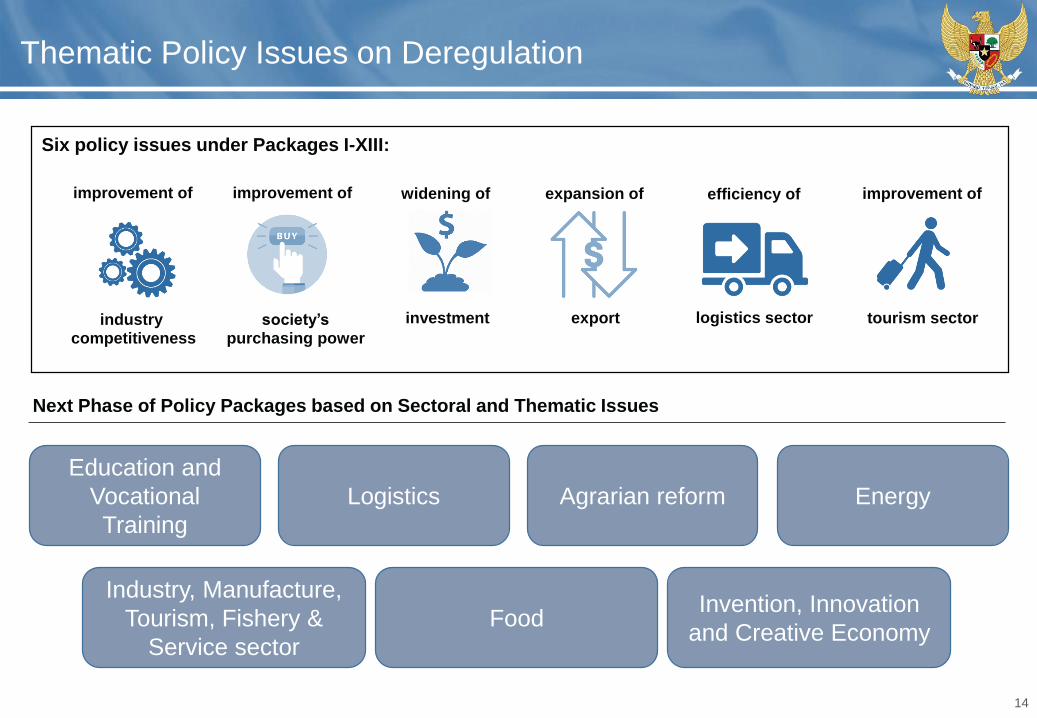
Thematic Policy Issues on Deregulation
Next Phase of Policy Packages based on Sectoral and Thematic Issues
Six policy issues under Packages I-XIII:
improvement of
industry competitiveness
improvement of
society’spurchasing power
widening of
investment
expansion of
export
efficiency of
logistics sector
improvement of
tourism sector
Education and
Vocational
Training
Logistics Agrarian reform Energy
Industry, Manufacture,
Tourism, Fishery &
Service sector
FoodInvention, Innovation
and Creative Economy
15
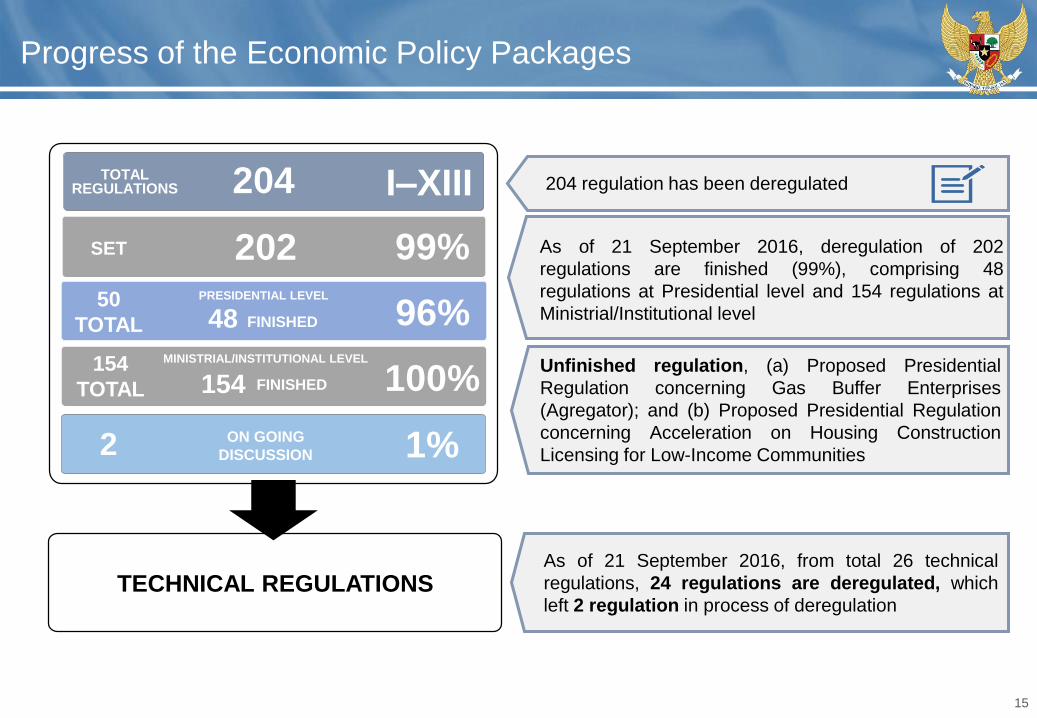
Progress of the Economic Policy Packages
204 regulation has been deregulated
As of 21 September 2016, deregulation of 202
regulations are finished (99%), comprising 48
regulations at Presidential level and 154 regulations at
Ministrial/Institutional level
Unfinished regulation, (a) Proposed Presidential
Regulation concerning Gas Buffer Enterprises
(Agregator); and (b) Proposed Presidential Regulation
concerning Acceleration on Housing Construction
Licensing for Low-Income Communities
As of 21 September 2016, from total 26 technical
regulations, 24 regulations are deregulated, which
left 2 regulation in process of deregulation
I–XII
202SET 99%
204TOTAL REGULATIONS
2 ON GOING
DISCUSSION 1%
154
TOTAL 154MINISTRIAL/INSTITUTIONAL LEVEL
100%
47 42SELESAI
PRESIDENTIAL50
TOTAL 48 FINISHED
PRESIDENTIAL LEVEL
96%
I–XIII
FINISHED
TECHNICAL REGULATIONS
16
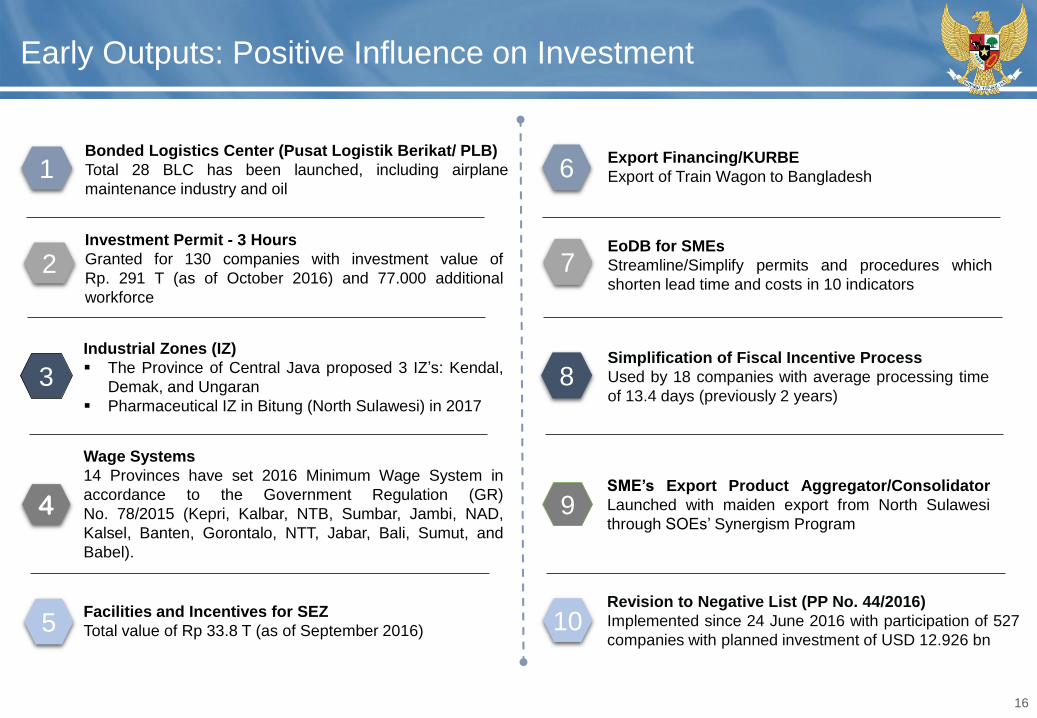
Early Outputs: Positive Influence on Investment
1Bonded Logistics Center (Pusat Logistik Berikat/ PLB)
Total 28 BLC has been launched, including airplane
maintenance industry and oil6
Export Financing/KURBE
Export of Train Wagon to Bangladesh
2Investment Permit - 3 Hours
Granted for 130 companies with investment value of
Rp. 291 T (as of October 2016) and 77.000 additional
workforce
3
Industrial Zones (IZ)
The Province of Central Java proposed 3 IZ’s: Kendal,
Demak, and Ungaran
Pharmaceutical IZ in Bitung (North Sulawesi) in 2017
5Facilities and Incentives for SEZ
Total value of Rp 33.8 T (as of September 2016)
7EoDB for SMEs
Streamline/Simplify permits and procedures which
shorten lead time and costs in 10 indicators
4
Wage Systems
14 Provinces have set 2016 Minimum Wage System in
accordance to the Government Regulation (GR)
No. 78/2015 (Kepri, Kalbar, NTB, Sumbar, Jambi, NAD,
Kalsel, Banten, Gorontalo, NTT, Jabar, Bali, Sumut, and
Babel).
8Simplification of Fiscal Incentive Process
Used by 18 companies with average processing time
of 13.4 days (previously 2 years)
9SME’s Export Product Aggregator/Consolidator
Launched with maiden export from North Sulawesi
through SOEs’ Synergism Program
10Revision to Negative List (PP No. 44/2016)
Implemented since 24 June 2016 with participation of 527
companies with planned investment of USD 12.926 bn
Strong and Stable Growth Prospects Remain Intact
Economic Factor:2
18
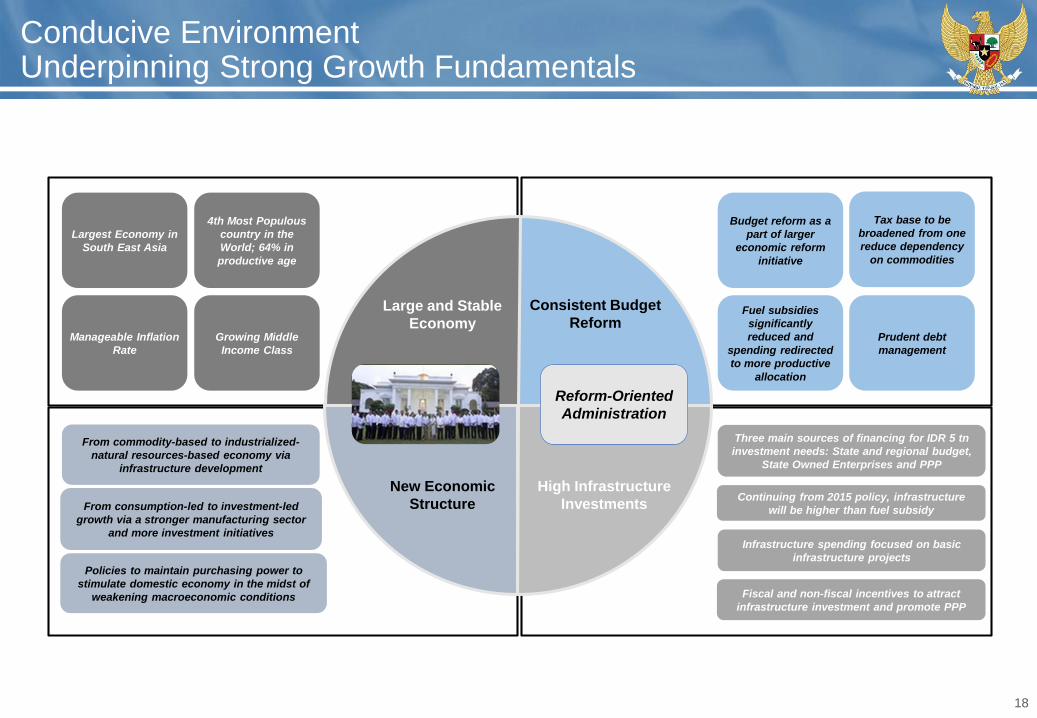
Conducive Environment Underpinning Strong Growth Fundamentals
Largest Economy in
South East Asia
4th Most Populous
country in the
World; 64% in
productive age
Manageable Inflation
Rate
Growing Middle
Income Class
From commodity-based to industrialized-
natural resources-based economy via
infrastructure development
From consumption-led to investment-led
growth via a stronger manufacturing sector
and more investment initiatives
Policies to maintain purchasing power to
stimulate domestic economy in the midst of
weakening macroeconomic conditions
Budget reform as a
part of larger
economic reform
initiative
Tax base to be
broadened from one
reduce dependency
on commodities
Fuel subsidies
significantly
reduced and
spending redirected
to more productive
allocation
Prudent debt
management
Reform-Oriented
Administration
Three main sources of financing for IDR 5 tn
investment needs: State and regional budget,
State Owned Enterprises and PPP
Continuing from 2015 policy, infrastructure
will be higher than fuel subsidy
Fiscal and non-fiscal incentives to attract
infrastructure investment and promote PPP
Infrastructure spending focused on basic
infrastructure projects
Large and Stable
Economy
Consistent Budget
Reform
New Economic
Structure
High Infrastructure
Investments
19
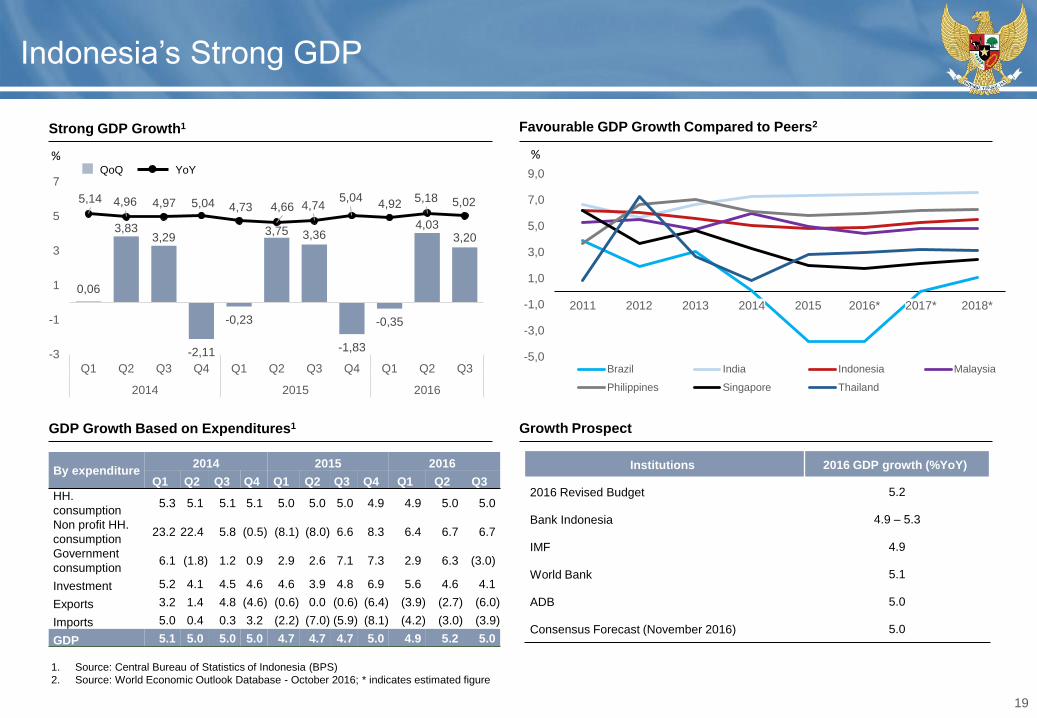
Indonesia’s Strong GDP
Growth ProspectGDP Growth Based on Expenditures1
Strong GDP Growth1
By expenditure2014 2015 2016
Q1 Q2 Q3 Q4 Q1 Q2 Q3 Q4 Q1 Q2 Q3
HH.
consumption5.3 5.1 5.1 5.1 5.0 5.0 5.0 4.9 4.9 5.0 5.0
Non profit HH.
consumption23.2 22.4 5.8 (0.5) (8.1) (8.0) 6.6 8.3 6.4 6.7 6.7
Government
consumption6.1 (1.8) 1.2 0.9 2.9 2.6 7.1 7.3 2.9 6.3 (3.0)
Investment 5.2 4.1 4.5 4.6 4.6 3.9 4.8 6.9 5.6 4.6 4.1
Exports 3.2 1.4 4.8 (4.6) (0.6) 0.0 (0.6) (6.4) (3.9) (2.7) (6.0)
Imports 5.0 0.4 0.3 3.2 (2.2) (7.0) (5.9) (8.1) (4.2) (3.0) (3.9)
GDP 5.1 5.0 5.0 5.0 4.7 4.7 4.7 5.0 4.9 5.2 5.0
%
Institutions 2016 GDP growth (%YoY)
2016 Revised Budget 5.2
Bank Indonesia 4.9 – 5.3
IMF 4.9
World Bank 5.1
ADB 5.0
Consensus Forecast (November 2016) 5.0
-5,0
-3,0
-1,0
1,0
3,0
5,0
7,0
9,0
2011 2012 2013 2014 2015 2016* 2017* 2018*
Brazil India Indonesia Malaysia
Philippines Singapore Thailand
Favourable GDP Growth Compared to Peers2
1. Source: Central Bureau of Statistics of Indonesia (BPS)
2. Source: World Economic Outlook Database - October 2016; * indicates estimated figure
%
0,06
3,833,29
-2,11
-0,23
3,75 3,36
-1,83
-0,35
4,033,20
5,14 4,96 4,97 5,04 4,73 4,66 4,745,04
4,925,18 5,02
-3
-1
1
3
5
7
Q1 Q2 Q3 Q4 Q1 Q2 Q3 Q4 Q1 Q2 Q3
2014 2015 2016
QoQ YoY
20
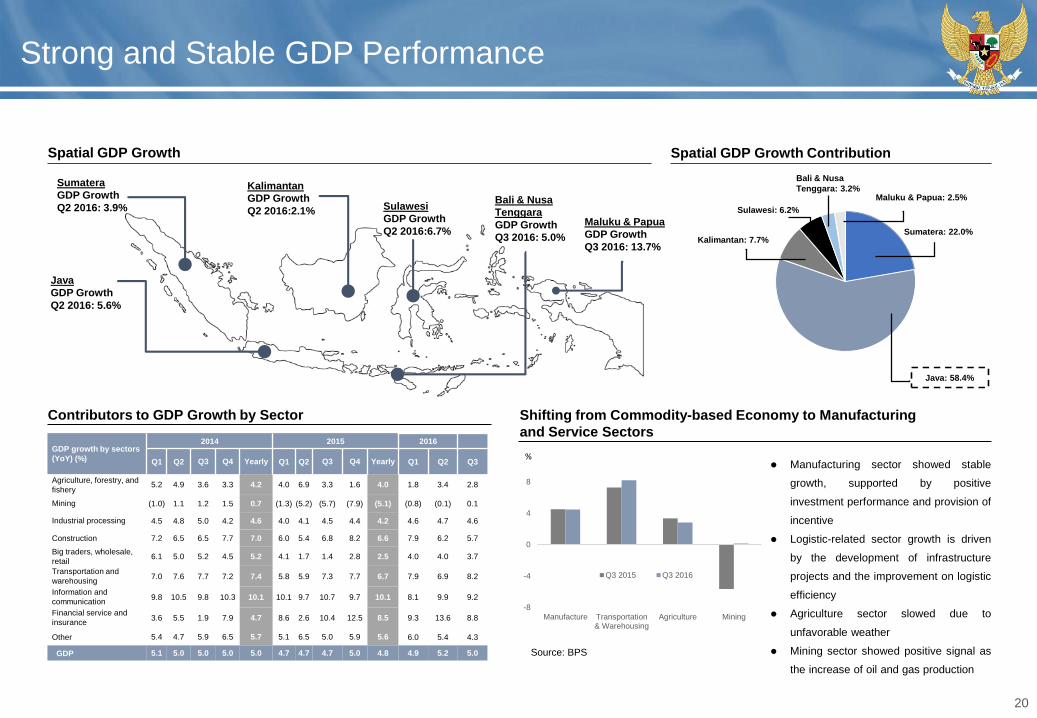
Strong and Stable GDP Performance
Shifting from Commodity-based Economy to Manufacturing
and Service Sectors
Contributors to GDP Growth by Sector
Spatial GDP Growth
Manufacturing sector showed stable
growth, supported by positive
investment performance and provision of
incentive
Logistic-related sector growth is driven
by the development of infrastructure
projects and the improvement on logistic
efficiency
Agriculture sector slowed due to
unfavorable weather
Mining sector showed positive signal as
the increase of oil and gas production
%GDP growth by sectors
(YoY) (%)
2014 2015 2016
Q1 Q2 Q3 Q4 Yearly Q1 Q2 Q3 Q4 Yearly Q1 Q2 Q3
Agriculture, forestry, and
fishery5.2 4.9 3.6 3.3 4.2 4.0 6.9 3.3 1.6 4.0 1.8 3.4 2.8
Mining (1.0) 1.1 1.2 1.5 0.7 (1.3) (5.2) (5.7) (7.9) (5.1) (0.8) (0.1) 0.1
Industrial processing 4.5 4.8 5.0 4.2 4.6 4.0 4.1 4.5 4.4 4.2 4.6 4.7 4.6
Construction 7.2 6.5 6.5 7.7 7.0 6.0 5.4 6.8 8.2 6.6 7.9 6.2 5.7
Big traders, wholesale,
retail6.1 5.0 5.2 4.5 5.2 4.1 1.7 1.4 2.8 2.5 4.0 4.0 3.7
Transportation and
warehousing7.0 7.6 7.7 7.2 7.4 5.8 5.9 7.3 7.7 6.7 7.9 6.9 8.2
Information and
communication9.8 10.5 9.8 10.3 10.1 10.1 9.7 10.7 9.7 10.1 8.1 9.9 9.2
Financial service and
insurance3.6 5.5 1.9 7.9 4.7 8.6 2.6 10.4 12.5 8.5 9.3 13.6 8.8
Other 5.4 4.7 5.9 6.5 5.7 5.1 6.5 5.0 5.9 5.6 6.0 5.4 4.3
GDP 5.1 5.0 5.0 5.0 5.0 4.7 4.7 4.7 5.0 4.8 4.9 5.2 5.0
Java: 58.4%
Sumatera: 22.0%
Maluku & Papua: 2.5%
Sulawesi: 6.2%
Kalimantan: 7.7%
Bali & Nusa
Tenggara: 3.2%
Spatial GDP Growth Contribution
Sumatera
GDP Growth
Q2 2016: 3.9%
Java
GDP Growth
Q2 2016: 5.6%
Kalimantan
GDP Growth
Q2 2016:2.1% Sulawesi
GDP Growth
Q2 2016:6.7%Maluku & Papua
GDP Growth
Q3 2016: 13.7%
Bali & Nusa
Tenggara
GDP Growth
Q3 2016: 5.0%
Source: BPS
-8
-4
0
4
8
Manufacture Transportation& Warehousing
Agriculture Mining
Q3 2015 Q3 2016
Improved External Resiliency
External Factor:3
22
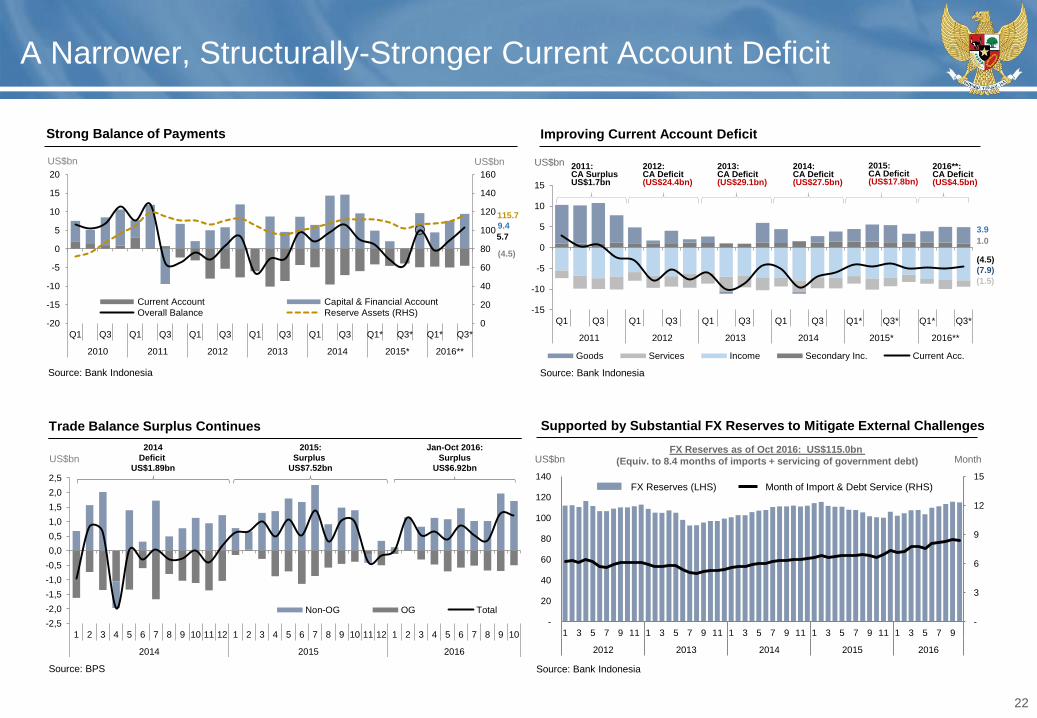
A Narrower, Structurally-Stronger Current Account Deficit
Improving Current Account DeficitStrong Balance of Payments
Supported by Substantial FX Reserves to Mitigate External ChallengesTrade Balance Surplus Continues
Source: Bank IndonesiaSource: Bank Indonesia
US$bn US$bn
115.7
9.4
5.7
(4.5)
2011: CA SurplusUS$1.7bn
2015: CA Deficit(US$17.8bn)
2012: CA Deficit(US$24.4bn)
2013: CA Deficit(US$29.1bn)
2014: CA Deficit(US$27.5bn)
US$bn
(7.9)
(1.5)
3.9
1.0
(4.5)
Source: Bank Indonesia
FX Reserves as of Oct 2016: US$115.0bn
(Equiv. to 8.4 months of imports + servicing of government debt) MonthUS$bn
FX Reserves (LHS) Month of Import & Debt Service (RHS)
2016**: CA Deficit(US$4.5bn)
Source: BPS
2015:
Surplus
US$7.52bn
2014
Deficit
US$1.89bnUS$bn
Jan-Oct 2016:
Surplus
US$6.92bn
0
20
40
60
80
100
120
140
160
-20
-15
-10
-5
0
5
10
15
20
Q1 Q3 Q1 Q3 Q1 Q3 Q1 Q3 Q1 Q3 Q1* Q3* Q1* Q3*
2010 2011 2012 2013 2014 2015* 2016**
Current Account Capital & Financial Account
Overall Balance Reserve Assets (RHS) -15
-10
-5
0
5
10
15
Q1 Q3 Q1 Q3 Q1 Q3 Q1 Q3 Q1* Q3* Q1* Q3*
2011 2012 2013 2014 2015* 2016**
Goods Services Income Secondary Inc. Current Acc.
-
3
6
9
12
15
-
20
40
60
80
100
120
140
1 3 5 7 9 11 1 3 5 7 9 11 1 3 5 7 9 11 1 3 5 7 9 11 1 3 5 7 9
2012 2013 2014 2015 2016
-2,5
-2,0
-1,5
-1,0
-0,5
0,0
0,5
1,0
1,5
2,0
2,5
1 2 3 4 5 6 7 8 9 10 11 12 1 2 3 4 5 6 7 8 9 10 11 12 1 2 3 4 5 6 7 8 9 10
2014 2015 2016
Non-OG OG Total
23
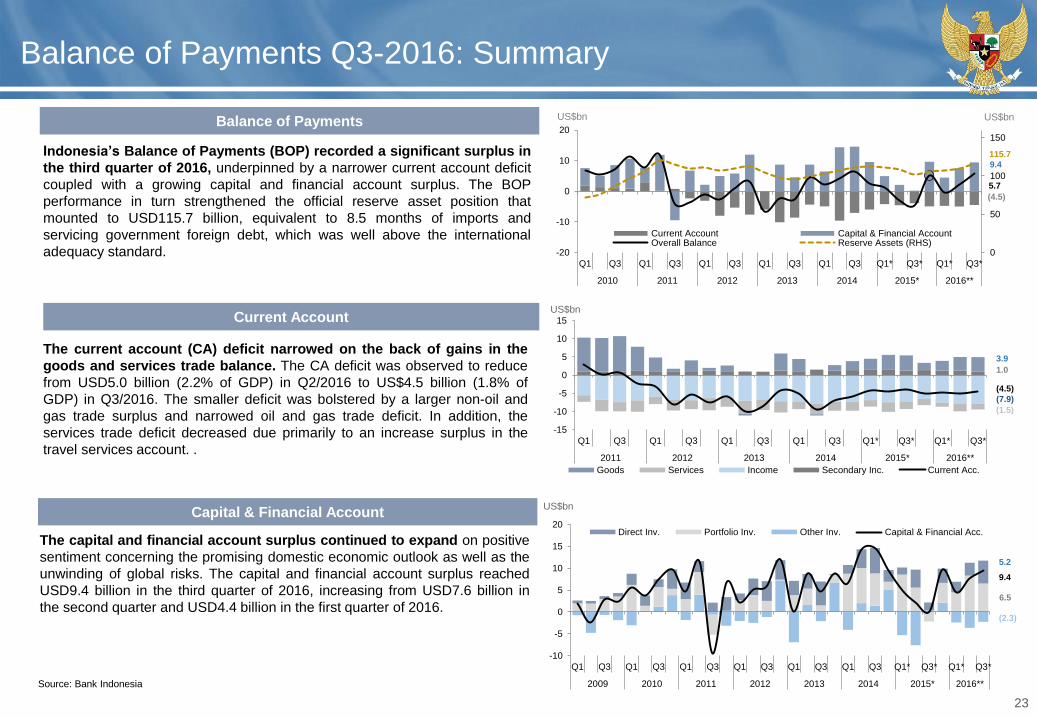
Balance of Payments Q3-2016: Summary
Source: Bank Indonesia
Indonesia’s Balance of Payments (BOP) recorded a significant surplus in
the third quarter of 2016, underpinned by a narrower current account deficit
coupled with a growing capital and financial account surplus. The BOP
performance in turn strengthened the official reserve asset position that
mounted to USD115.7 billion, equivalent to 8.5 months of imports and
servicing government foreign debt, which was well above the international
adequacy standard.
Balance of Payments
The current account (CA) deficit narrowed on the back of gains in the
goods and services trade balance. The CA deficit was observed to reduce
from USD5.0 billion (2.2% of GDP) in Q2/2016 to US$4.5 billion (1.8% of
GDP) in Q3/2016. The smaller deficit was bolstered by a larger non-oil and
gas trade surplus and narrowed oil and gas trade deficit. In addition, the
services trade deficit decreased due primarily to an increase surplus in the
travel services account. .
Capital & Financial Account
The capital and financial account surplus continued to expand on positive
sentiment concerning the promising domestic economic outlook as well as the
unwinding of global risks. The capital and financial account surplus reached
USD9.4 billion in the third quarter of 2016, increasing from USD7.6 billion in
the second quarter and USD4.4 billion in the first quarter of 2016.
Current Account
US$bn US$bn
115.7
9.4
5.7
(4.5)
0
50
100
150
-20
-10
0
10
20
Q1 Q3 Q1 Q3 Q1 Q3 Q1 Q3 Q1 Q3 Q1* Q3* Q1* Q3*
2010 2011 2012 2013 2014 2015* 2016**
Current Account Capital & Financial AccountOverall Balance Reserve Assets (RHS)
US$bn
(7.9)
(1.5)
3.9
1.0
(4.5)
-15
-10
-5
0
5
10
15
Q1 Q3 Q1 Q3 Q1 Q3 Q1 Q3 Q1* Q3* Q1* Q3*
2011 2012 2013 2014 2015* 2016**
Goods Services Income Secondary Inc. Current Acc.
-10
-5
0
5
10
15
20
Q1 Q3 Q1 Q3 Q1 Q3 Q1 Q3 Q1 Q3 Q1 Q3 Q1* Q3* Q1* Q3*
2009 2010 2011 2012 2013 2014 2015* 2016**
Direct Inv. Portfolio Inv. Other Inv. Capital & Financial Acc.
US$bn
(2.3)
5.2
6.5
9.4
24
Balance of Payments Q3-2016: Current Account
Source: Bank Indonesia
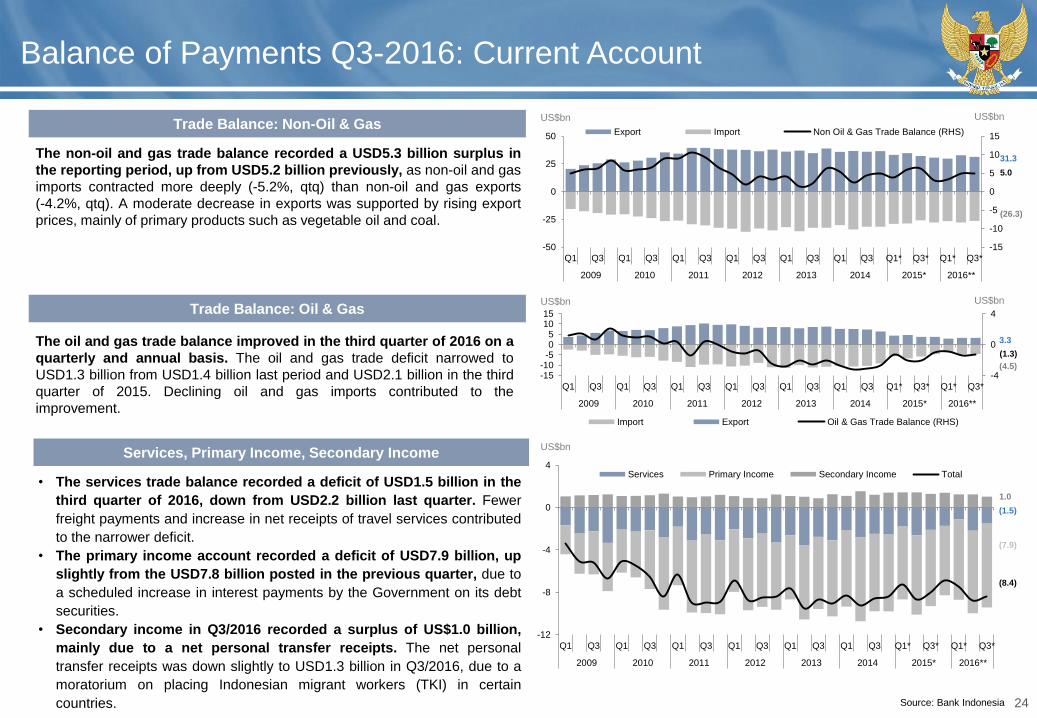
Trade Balance: Non-Oil & Gas
The oil and gas trade balance improved in the third quarter of 2016 on a
quarterly and annual basis. The oil and gas trade deficit narrowed to
USD1.3 billion from USD1.4 billion last period and USD2.1 billion in the third
quarter of 2015. Declining oil and gas imports contributed to the
improvement.
Trade Balance: Oil & Gas
• The services trade balance recorded a deficit of USD1.5 billion in the
third quarter of 2016, down from USD2.2 billion last quarter. Fewer
freight payments and increase in net receipts of travel services contributed
to the narrower deficit.
• The primary income account recorded a deficit of USD7.9 billion, up
slightly from the USD7.8 billion posted in the previous quarter, due to
a scheduled increase in interest payments by the Government on its debt
securities.
• Secondary income in Q3/2016 recorded a surplus of US$1.0 billion,
mainly due to a net personal transfer receipts. The net personal
transfer receipts was down slightly to USD1.3 billion in Q3/2016, due to a
moratorium on placing Indonesian migrant workers (TKI) in certain
countries.
Services, Primary Income, Secondary Income
The non-oil and gas trade balance recorded a USD5.3 billion surplus in
the reporting period, up from USD5.2 billion previously, as non-oil and gas
imports contracted more deeply (-5.2%, qtq) than non-oil and gas exports
(-4.2%, qtq). A moderate decrease in exports was supported by rising export
prices, mainly of primary products such as vegetable oil and coal.
-15
-10
-5
0
5
10
15
-50
-25
0
25
50
Q1 Q3 Q1 Q3 Q1 Q3 Q1 Q3 Q1 Q3 Q1 Q3 Q1* Q3* Q1* Q3*
2009 2010 2011 2012 2013 2014 2015* 2016**
Export Import Non Oil & Gas Trade Balance (RHS)
-4
0
4
-15-10
-505
1015
Q1 Q3 Q1 Q3 Q1 Q3 Q1 Q3 Q1 Q3 Q1 Q3 Q1* Q3* Q1* Q3*
2009 2010 2011 2012 2013 2014 2015* 2016**
Import Export Oil & Gas Trade Balance (RHS)
-12
-8
-4
0
4
Q1 Q3 Q1 Q3 Q1 Q3 Q1 Q3 Q1 Q3 Q1 Q3 Q1* Q3* Q1* Q3*
2009 2010 2011 2012 2013 2014 2015* 2016**
Services Primary Income Secondary Income Total
US$bn US$bn
US$bn US$bn
US$bn
(26.3)
31.3
5.0
(4.5)
3.3
(1.3)
(7.9)
(1.5)
1.0
(8.4)
25
Balance of Payments Q3-2016: Financial Account
Source: Bank Indonesia
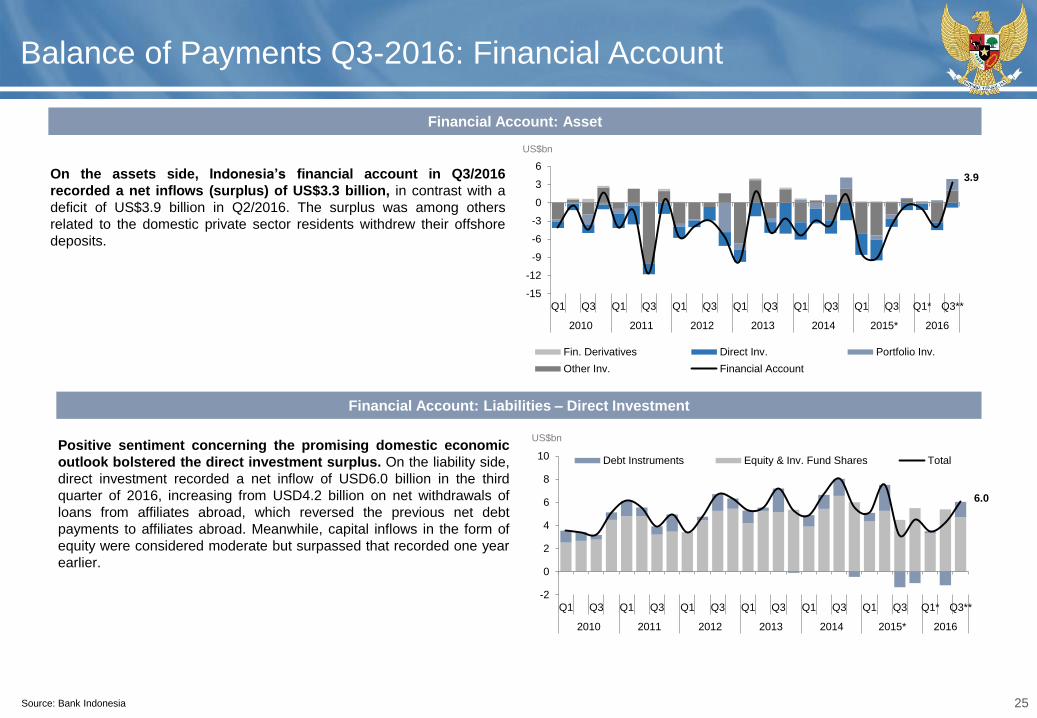
On the assets side, Indonesia’s financial account in Q3/2016
recorded a net inflows (surplus) of US$3.3 billion, in contrast with a
deficit of US$3.9 billion in Q2/2016. The surplus was among others
related to the domestic private sector residents withdrew their offshore
deposits.
Financial Account: Asset
Positive sentiment concerning the promising domestic economic
outlook bolstered the direct investment surplus. On the liability side,
direct investment recorded a net inflow of USD6.0 billion in the third
quarter of 2016, increasing from USD4.2 billion on net withdrawals of
loans from affiliates abroad, which reversed the previous net debt
payments to affiliates abroad. Meanwhile, capital inflows in the form of
equity were considered moderate but surpassed that recorded one year
earlier.
Financial Account: Liabilities – Direct Investment
-2
0
2
4
6
8
10
Q1 Q3 Q1 Q3 Q1 Q3 Q1 Q3 Q1 Q3 Q1 Q3 Q1* Q3**
2010 2011 2012 2013 2014 2015* 2016
Debt Instruments Equity & Inv. Fund Shares Total
-15
-12
-9
-6
-3
0
3
6
Q1 Q3 Q1 Q3 Q1 Q3 Q1 Q3 Q1 Q3 Q1 Q3 Q1* Q3**
2010 2011 2012 2013 2014 2015* 2016
Fin. Derivatives Direct Inv. Portfolio Inv.
Other Inv. Financial Account
3.9
US$bn
US$bn
6.0
26
Balance of Payments Q3-2016: Financial Account
Source: Bank Indonesia
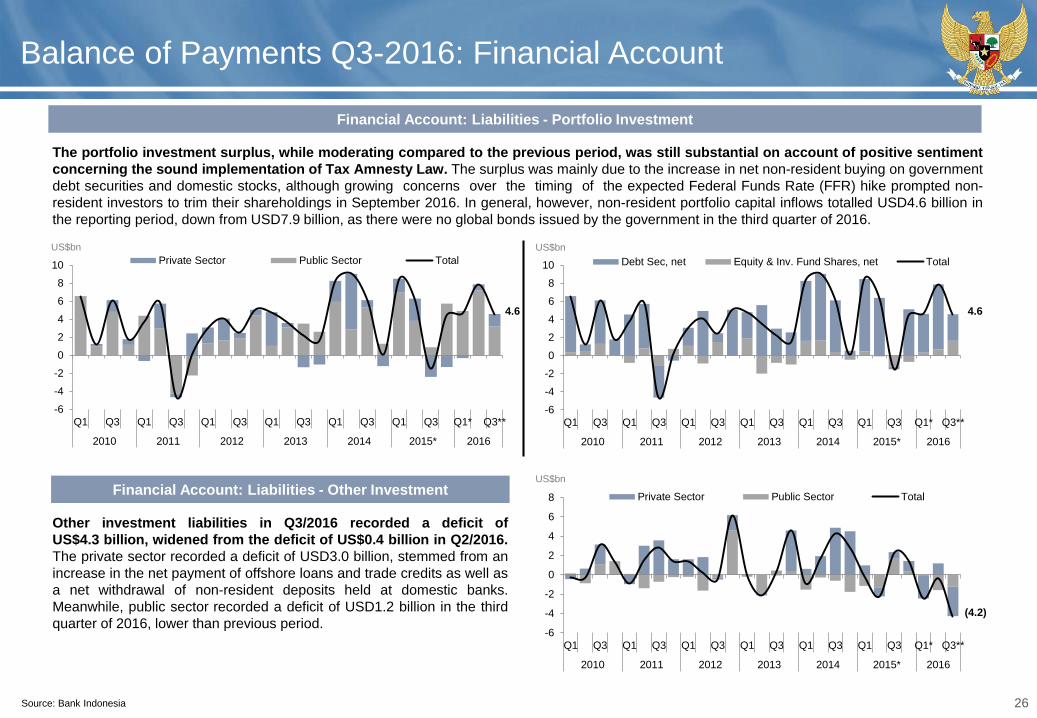
The portfolio investment surplus, while moderating compared to the previous period, was still substantial on account of positive sentiment
concerning the sound implementation of Tax Amnesty Law. The surplus was mainly due to the increase in net non-resident buying on government
debt securities and domestic stocks, although growing concerns over the timing of the expected Federal Funds Rate (FFR) hike prompted non-
resident investors to trim their shareholdings in September 2016. In general, however, non-resident portfolio capital inflows totalled USD4.6 billion in
the reporting period, down from USD7.9 billion, as there were no global bonds issued by the government in the third quarter of 2016.
Financial Account: Liabilities - Portfolio Investment
Other investment liabilities in Q3/2016 recorded a deficit of
US$4.3 billion, widened from the deficit of US$0.4 billion in Q2/2016.
The private sector recorded a deficit of USD3.0 billion, stemmed from an
increase in the net payment of offshore loans and trade credits as well as
a net withdrawal of non-resident deposits held at domestic banks.
Meanwhile, public sector recorded a deficit of USD1.2 billion in the third
quarter of 2016, lower than previous period.
Financial Account: Liabilities - Other Investment
-6
-4
-2
0
2
4
6
8
10
Q1 Q3 Q1 Q3 Q1 Q3 Q1 Q3 Q1 Q3 Q1 Q3 Q1* Q3**
2010 2011 2012 2013 2014 2015* 2016
Debt Sec, net Equity & Inv. Fund Shares, net Total
-6
-4
-2
0
2
4
6
8
10
Q1 Q3 Q1 Q3 Q1 Q3 Q1 Q3 Q1 Q3 Q1 Q3 Q1* Q3**
2010 2011 2012 2013 2014 2015* 2016
Private Sector Public Sector Total
-6
-4
-2
0
2
4
6
8
Q1 Q3 Q1 Q3 Q1 Q3 Q1 Q3 Q1 Q3 Q1 Q3 Q1* Q3**
2010 2011 2012 2013 2014 2015* 2016
Private Sector Public Sector Total
4.6
US$bnUS$bn
4.6
US$bn
(4.2)
27
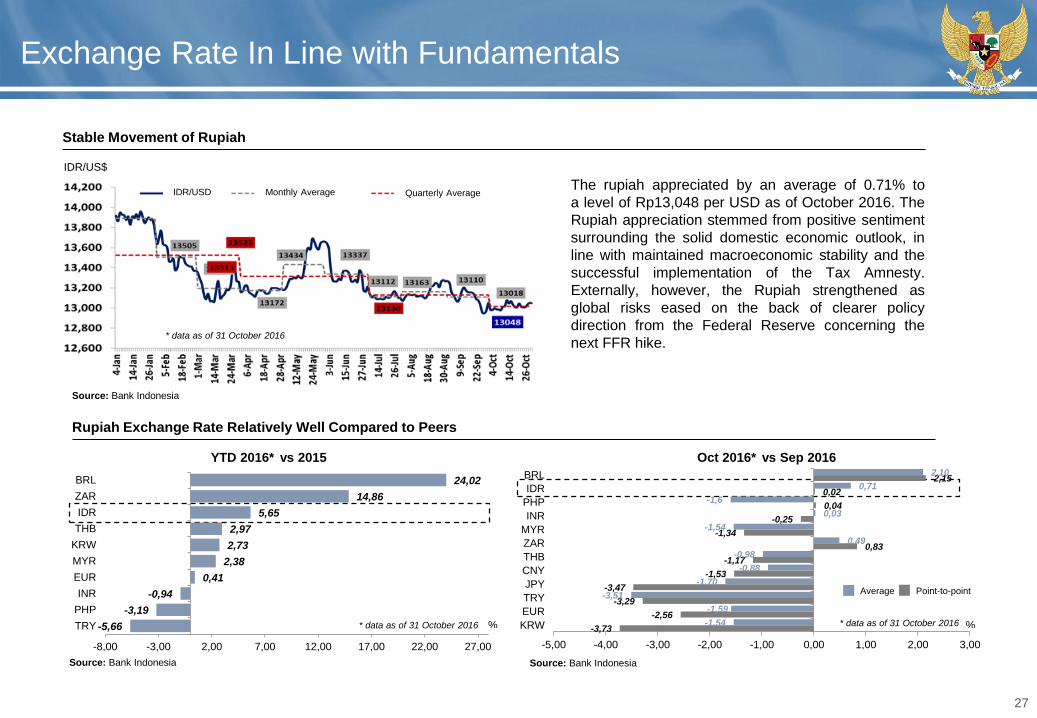
Exchange Rate In Line with Fundamentals
Stable Movement of Rupiah
Source: Bank Indonesia
YTD 2016* vs 2015
Source: Bank Indonesia
Rupiah Exchange Rate Relatively Well Compared to Peers
IDR/US$
The rupiah appreciated by an average of 0.71% to
a level of Rp13,048 per USD as of October 2016. The
Rupiah appreciation stemmed from positive sentiment
surrounding the solid domestic economic outlook, in
line with maintained macroeconomic stability and the
successful implementation of the Tax Amnesty.
Externally, however, the Rupiah strengthened as
global risks eased on the back of clearer policy
direction from the Federal Reserve concerning the
next FFR hike.
Oct 2016* vs Sep 2016
Source: Bank Indonesia
IDR/USD Monthly Average Quarterly Average
* data as of 31 October 2016
* data as of 31 October 2016-5,66
-3,19
-0,94
0,41
2,38
2,73
2,97
5,65
14,86
24,02
-8,00 -3,00 2,00 7,00 12,00 17,00 22,00 27,00
TRY
PHP
INR
EUR
MYR
KRW
THB
IDR
ZAR
BRL
% * data as of 31 October 2016-3,73
-2,56
-3,29
-3,47
-1,53
-1,17
0,83
-1,34
-0,25
0,04
0,02
2,15
-1,54
-1,59
-3,51
-1,70
-0,88
-0,98
0,49
-1,54
0,03
-1,6
0,71
2,10
-5,00 -4,00 -3,00 -2,00 -1,00 0,00 1,00 2,00 3,00
KRW
EUR
TRY
JPY
CNY
THB
ZAR
MYR
INR
PHP
IDR
BRL
%
Average Point-to-point
28
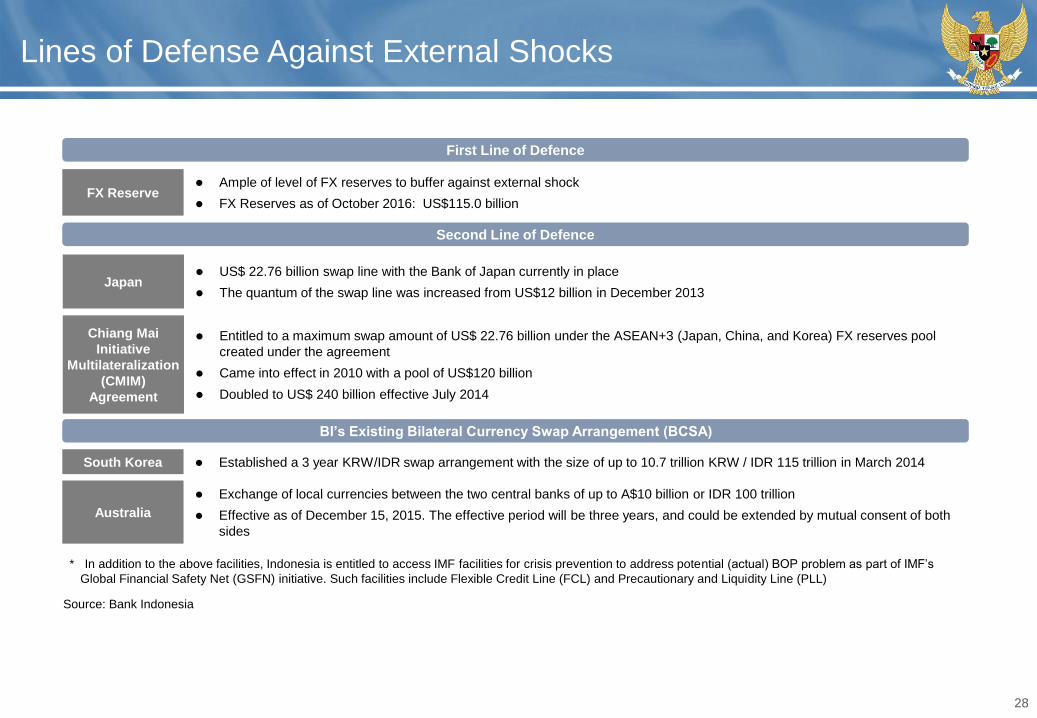
Lines of Defense Against External Shocks
FX Reserve Ample of level of FX reserves to buffer against external shock
FX Reserves as of October 2016: US$115.0 billion
South Korea Established a 3 year KRW/IDR swap arrangement with the size of up to 10.7 trillion KRW / IDR 115 trillion in March 2014
Australia
Exchange of local currencies between the two central banks of up to A$10 billion or IDR 100 trillion
Effective as of December 15, 2015. The effective period will be three years, and could be extended by mutual consent of both
sides
First Line of Defence
Second Line of Defence
BI’s Existing Bilateral Currency Swap Arrangement (BCSA)
* In addition to the above facilities, Indonesia is entitled to access IMF facilities for crisis prevention to address potential (actual) BOP problem as part of IMF’s
Global Financial Safety Net (GSFN) initiative. Such facilities include Flexible Credit Line (FCL) and Precautionary and Liquidity Line (PLL)
Japan US$ 22.76 billion swap line with the Bank of Japan currently in place
The quantum of the swap line was increased from US$12 billion in December 2013
Chiang Mai
Initiative
Multilateralization
(CMIM)
Agreement
Entitled to a maximum swap amount of US$ 22.76 billion under the ASEAN+3 (Japan, China, and Korea) FX reserves pool
created under the agreement
Came into effect in 2010 with a pool of US$120 billion
Doubled to US$ 240 billion effective July 2014
Source: Bank Indonesia
29
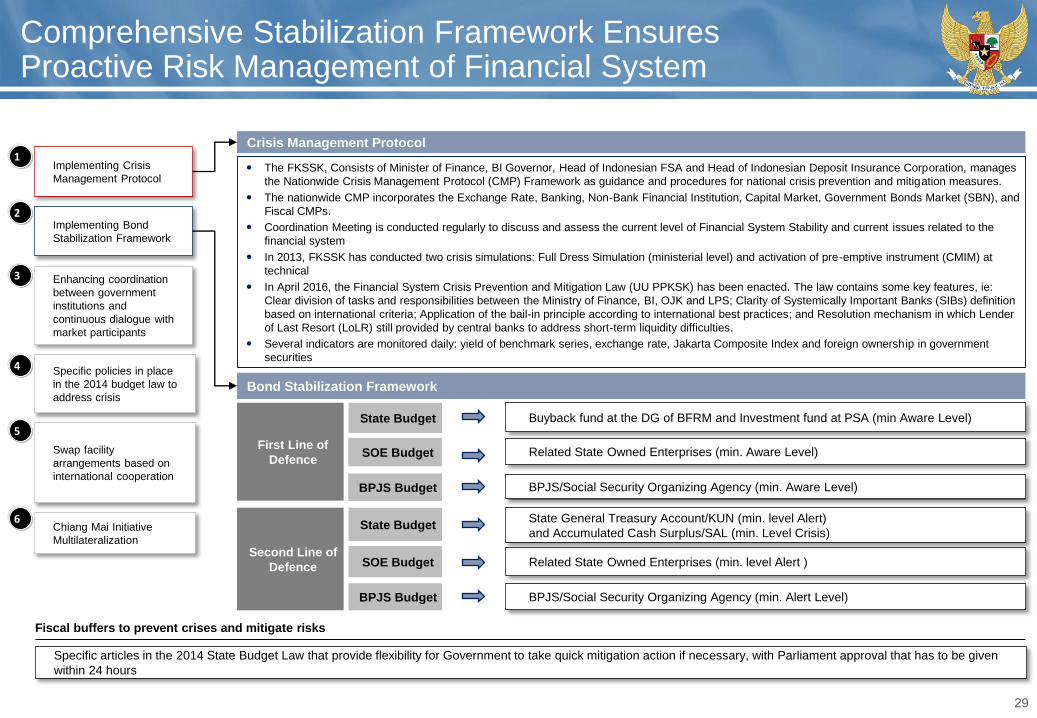
Comprehensive Stabilization Framework Ensures Proactive Risk Management of Financial System
Implementing Crisis
Management Protocol
Implementing Bond
Stabilization Framework
Enhancing coordination
between government
institutions and
continuous dialogue with
market participants
Specific policies in place
in the 2014 budget law to
address crisis
Swap facility
arrangements based on
international cooperation
Chiang Mai Initiative
Multilateralization
Specific articles in the 2014 State Budget Law that provide flexibility for Government to take quick mitigation action if necessary, with Parliament approval that has to be given
within 24 hours
The FKSSK, Consists of Minister of Finance, BI Governor, Head of Indonesian FSA and Head of Indonesian Deposit Insurance Corporation, manages
the Nationwide Crisis Management Protocol (CMP) Framework as guidance and procedures for national crisis prevention and mitigation measures.
The nationwide CMP incorporates the Exchange Rate, Banking, Non-Bank Financial Institution, Capital Market, Government Bonds Market (SBN), and
Fiscal CMPs.
Coordination Meeting is conducted regularly to discuss and assess the current level of Financial System Stability and current issues related to the
financial system
In 2013, FKSSK has conducted two crisis simulations: Full Dress Simulation (ministerial level) and activation of pre-emptive instrument (CMIM) at
technical
In April 2016, the Financial System Crisis Prevention and Mitigation Law (UU PPKSK) has been enacted. The law contains some key features, ie:
Clear division of tasks and responsibilities between the Ministry of Finance, BI, OJK and LPS; Clarity of Systemically Important Banks (SIBs) definition
based on international criteria; Application of the bail-in principle according to international best practices; and Resolution mechanism in which Lender
of Last Resort (LoLR) still provided by central banks to address short-term liquidity difficulties.
Several indicators are monitored daily: yield of benchmark series, exchange rate, Jakarta Composite Index and foreign ownership in government
securities
Crisis Management Protocol
Related State Owned Enterprises (min. Aware Level)
State Budget
SOE Budget
BPJS Budget
Buyback fund at the DG of BFRM and Investment fund at PSA (min Aware Level)
BPJS/Social Security Organizing Agency (min. Aware Level)
Bond Stabilization Framework
1
2
3
4
5
6
Fiscal buffers to prevent crises and mitigate risks
First Line of
Defence
Related State Owned Enterprises (min. level Alert )
State Budget
SOE Budget
BPJS Budget
State General Treasury Account/KUN (min. level Alert)
and Accumulated Cash Surplus/SAL (min. Level Crisis)
BPJS/Social Security Organizing Agency (min. Alert Level)
Second Line of
Defence
30
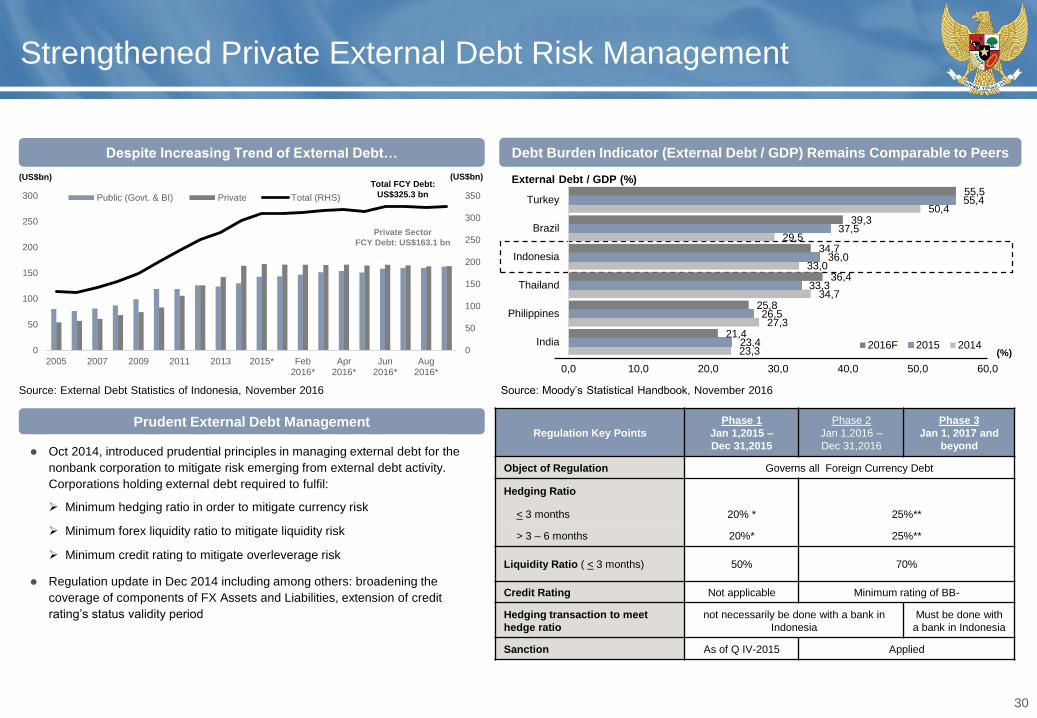
Strengthened Private External Debt Risk Management
(US$bn)
Source: External Debt Statistics of Indonesia, November 2016
(%)
Source: Moody’s Statistical Handbook, November 2016
Despite Increasing Trend of External Debt… Debt Burden Indicator (External Debt / GDP) Remains Comparable to Peers
Regulation Key Points
Phase 1
Jan 1,2015 –
Dec 31,2015
Phase 2
Jan 1,2016 –
Dec 31,2016
Phase 3
Jan 1, 2017 and
beyond
Object of Regulation Governs all Foreign Currency Debt
Hedging Ratio
< 3 months 20% * 25%**
> 3 – 6 months 20%* 25%**
Liquidity Ratio ( < 3 months) 50% 70%
Credit Rating Not applicable Minimum rating of BB-
Hedging transaction to meet
hedge ratio
not necessarily be done with a bank in
Indonesia
Must be done with
a bank in Indonesia
Sanction As of Q IV-2015 Applied
Prudent External Debt Management
External Debt / GDP (%)
Oct 2014, introduced prudential principles in managing external debt for the
nonbank corporation to mitigate risk emerging from external debt activity.
Corporations holding external debt required to fulfil:
Minimum hedging ratio in order to mitigate currency risk
Minimum forex liquidity ratio to mitigate liquidity risk
Minimum credit rating to mitigate overleverage risk
Regulation update in Dec 2014 including among others: broadening the
coverage of components of FX Assets and Liabilities, extension of credit
rating’s status validity period
(US$bn)
0
50
100
150
200
250
300
350
0
50
100
150
200
250
300
2005 2007 2009 2011 2013 2015* Feb2016*
Apr2016*
Jun2016*
Aug2016*
Public (Govt. & BI) Private Total (RHS)
Total FCY Debt:
US$325.3 bn
Private Sector
FCY Debt: US$163.1 bn
23,3
27,3
34,7
33,0
29,5
50,4
23,4
26,5
33,3
36,0
37,5
55,4
21,4
25,8
36,4
34,7
39,3
55,5
0,0 10,0 20,0 30,0 40,0 50,0 60,0
India
Philippines
Thailand
Indonesia
Brazil
Turkey
2016F 2015 2014
31
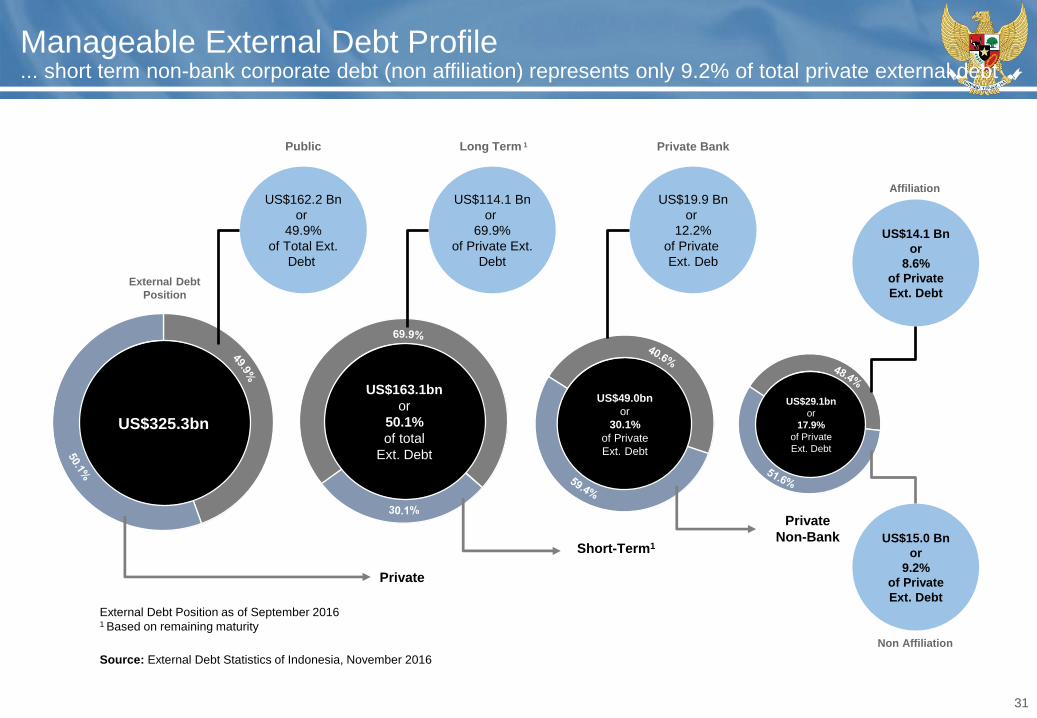
Manageable External Debt Profile... short term non-bank corporate debt (non affiliation) represents only 9.2% of total private external debt
Private
Short-Term1
Private
Non-Bank
External Debt
Position
Affiliation
Non Affiliation
US$162.2 Bn
or
49.9%
of Total Ext.
Debt
US$114.1 Bn
or
69.9%
of Private Ext.
Debt
US$19.9 Bn
or
12.2%
of Private
Ext. Deb
US$14.1 Bn
or
8.6%
of Private
Ext. Debt
US$15.0 Bn
or
9.2%
of Private
Ext. Debt
Public Long Term 1 Private Bank
US$29.1bn
or
17.9%
of Private
Ext. Debt
US$325.3bn
US$163.1bn
or
50.1%
of total
Ext. Debt
US$49.0bn
or
30.1%
of Private
Ext. Debt
External Debt Position as of September 20161 Based on remaining maturity
Source: External Debt Statistics of Indonesia, November 2016
More Fiscal Stimulus with Prudent Fiscal Policy
Fiscal Performance and Flexibility:4
33
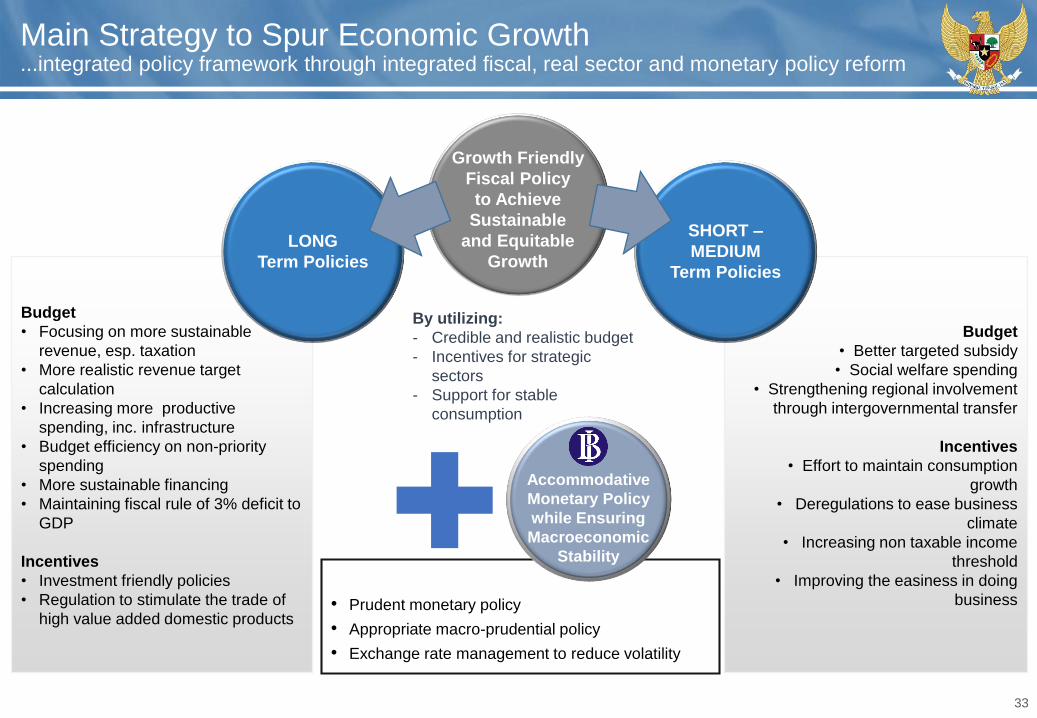
Budget
• Better targeted subsidy
• Social welfare spending
• Strengthening regional involvement
through intergovernmental transfer
Incentives
• Effort to maintain consumption
growth
• Deregulations to ease business
climate
• Increasing non taxable income
threshold
• Improving the easiness in doing
business
Main Strategy to Spur Economic Growth...integrated policy framework through integrated fiscal, real sector and monetary policy reform
• Prudent monetary policy
• Appropriate macro-prudential policy
• Exchange rate management to reduce volatility
Budget
• Focusing on more sustainable
revenue, esp. taxation
• More realistic revenue target
calculation
• Increasing more productive
spending, inc. infrastructure
• Budget efficiency on non-priority
spending
• More sustainable financing
• Maintaining fiscal rule of 3% deficit to
GDP
Incentives
• Investment friendly policies
• Regulation to stimulate the trade of
high value added domestic products
Growth Friendly
Fiscal Policy
to Achieve
Sustainable
and Equitable
Growth
Accommodative
Monetary Policy
while Ensuring
Macroeconomic
Stability
SHORT –
MEDIUM
Term Policies
By utilizing:
- Credible and realistic budget
- Incentives for strategic
sectors
- Support for stable
consumption
LONG
Term Policies
34
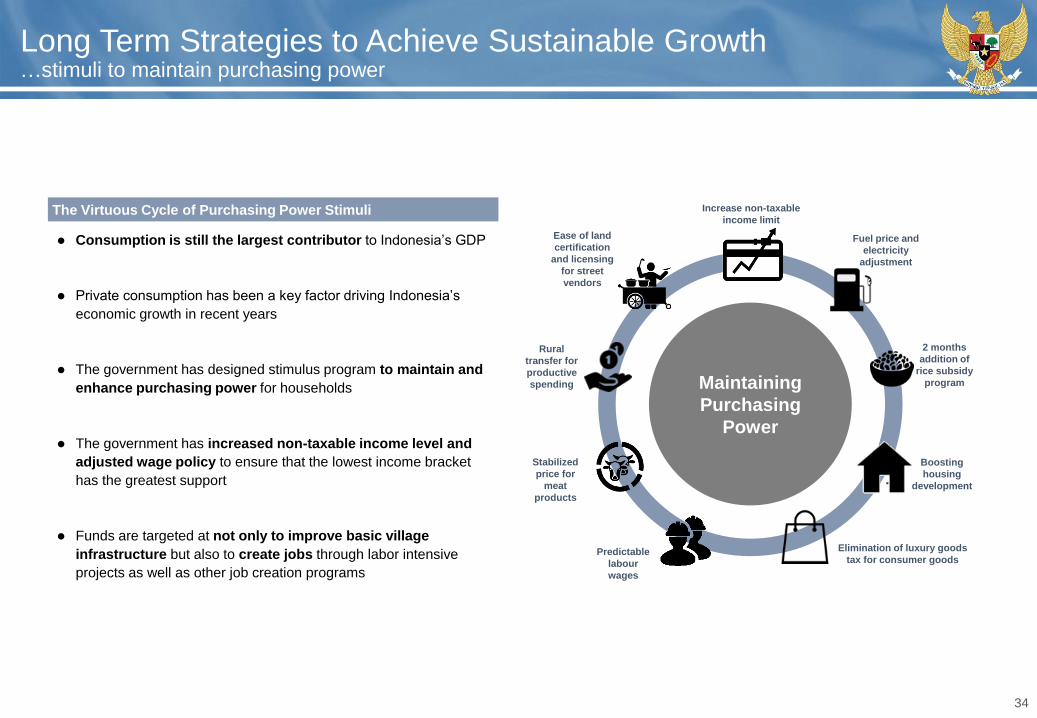
Long Term Strategies to Achieve Sustainable Growth…stimuli to maintain purchasing power
The Virtuous Cycle of Purchasing Power Stimuli
Consumption is still the largest contributor to Indonesia’s GDP
Private consumption has been a key factor driving Indonesia’s
economic growth in recent years
The government has designed stimulus program to maintain and
enhance purchasing power for households
The government has increased non-taxable income level and
adjusted wage policy to ensure that the lowest income bracket
has the greatest support
Funds are targeted at not only to improve basic village
infrastructure but also to create jobs through labor intensive
projects as well as other job creation programs
u
Fuel price and
electricity
adjustment
Predictable
labour
wages
Boosting
housing
development
Elimination of luxury goods
tax for consumer goods
2 months
addition of
rice subsidy
program
Rural
transfer for
productive
spending
Ease of land
certification
and licensing
for street
vendors
Maintaining
Purchasing
Power
Increase non-taxable
income limit
Stabilized
price for
meat
products
35
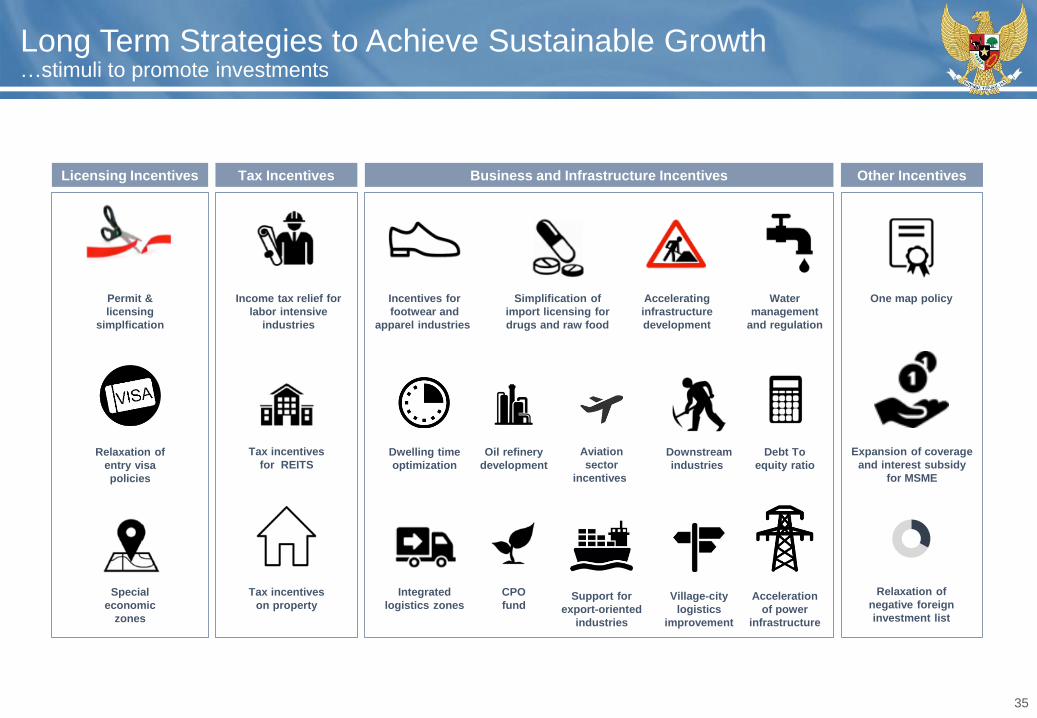
Long Term Strategies to Achieve Sustainable Growth…stimuli to promote investments
Licensing Incentives Tax Incentives Other IncentivesBusiness and Infrastructure Incentives
Tax incentives
on property
Special
economic
zones
Relaxation of
negative foreign
investment list
Integrated
logistics zones
CPO
fundSupport for
export-oriented
industries
Village-city
logistics
improvement
Acceleration
of power
infrastructure
Income tax relief for
labor intensive
industries
Permit &
licensing
simplfication
One map policyIncentives for
footwear and
apparel industries
Simplification of
import licensing for
drugs and raw food
Accelerating
infrastructure
development
Water
management
and regulation
Tax incentives
for REITSRelaxation of
entry visa
policies
Expansion of coverage
and interest subsidy
for MSME
Dwelling time
optimization
Oil refinery
development
Aviation
sector
incentives
Downstream
industries
Debt To
equity ratio
36
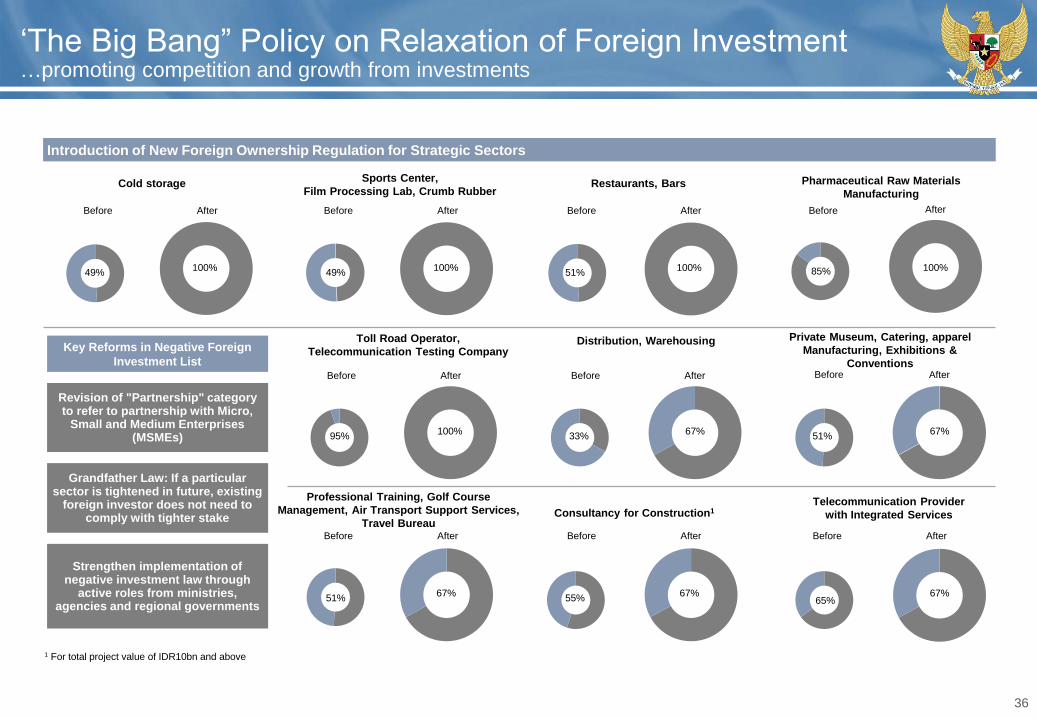
‘The Big Bang” Policy on Relaxation of Foreign Investment…promoting competition and growth from investments
Introduction of New Foreign Ownership Regulation for Strategic Sectors
1 For total project value of IDR10bn and above
Before
Cold storage Restaurants, Bars Pharmaceutical Raw Materials
Manufacturing
Sports Center,
Film Processing Lab, Crumb Rubber
49%
Revision of "Partnership" category to refer to partnership with Micro,
Small and Medium Enterprises (MSMEs)
Grandfather Law: If a particular sector is tightened in future, existing
foreign investor does not need to comply with tighter stake
Key Reforms in Negative Foreign
Investment List
Strengthen implementation of negative investment law through
active roles from ministries, agencies and regional governments
100%49%
100%51%
100% 85% 100%
95%100%
33%67%
51%67%
51%67%
55%67%
65%67%
Distribution, Warehousing Private Museum, Catering, apparel
Manufacturing, Exhibitions &
Conventions
Toll Road Operator,
Telecommunication Testing Company
Consultancy for Construction1Telecommunication Provider
with Integrated Services
Professional Training, Golf Course
Management, Air Transport Support Services,
Travel Bureau
After Before After Before After Before After
Before After Before After Before After
Before After Before After Before After
37
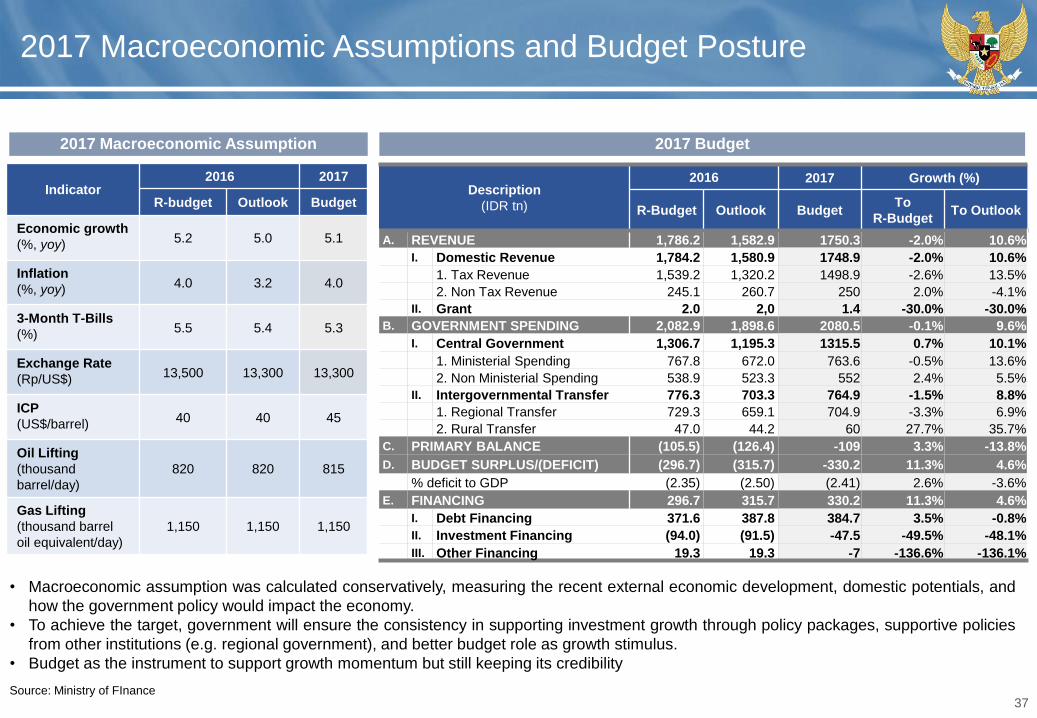
2017 Macroeconomic Assumptions and Budget Posture
Indicator2016 2017
R-budget Outlook Budget
Economic growth
(%, yoy)5.2 5.0 5.1
Inflation
(%, yoy)4.0 3.2 4.0
3-Month T-Bills
(%)5.5 5.4 5.3
Exchange Rate
(Rp/US$)13,500 13,300 13,300
ICP
(US$/barrel)40 40 45
Oil Lifting
(thousand
barrel/day)
820 820 815
Gas Lifting
(thousand barrel
oil equivalent/day)
1,150 1,150 1,150
• Macroeconomic assumption was calculated conservatively, measuring the recent external economic development, domestic potentials, and
how the government policy would impact the economy.
• To achieve the target, government will ensure the consistency in supporting investment growth through policy packages, supportive policies
from other institutions (e.g. regional government), and better budget role as growth stimulus.
• Budget as the instrument to support growth momentum but still keeping its credibility
Source: Ministry of FInance
Description
(IDR tn)
2016 2017 Growth (%)
R-Budget Outlook BudgetTo
R-BudgetTo Outlook
A. REVENUE 1,786.2 1,582.9 1750.3 -2.0% 10.6%
I. Domestic Revenue 1,784.2 1,580.9 1748.9 -2.0% 10.6%
1. Tax Revenue 1,539.2 1,320.2 1498.9 -2.6% 13.5%
2. Non Tax Revenue 245.1 260.7 250 2.0% -4.1%
II. Grant 2.0 2,0 1.4 -30.0% -30.0%
B. GOVERNMENT SPENDING 2,082.9 1,898.6 2080.5 -0.1% 9.6%
I. Central Government 1,306.7 1,195.3 1315.5 0.7% 10.1%
1. Ministerial Spending 767.8 672.0 763.6 -0.5% 13.6%
2. Non Ministerial Spending 538.9 523.3 552 2.4% 5.5%
II. Intergovernmental Transfer 776.3 703.3 764.9 -1.5% 8.8%
1. Regional Transfer 729.3 659.1 704.9 -3.3% 6.9%
2. Rural Transfer 47.0 44.2 60 27.7% 35.7%
C. PRIMARY BALANCE (105.5) (126.4) -109 3.3% -13.8%
D. BUDGET SURPLUS/(DEFICIT) (296.7) (315.7) -330.2 11.3% 4.6%
% deficit to GDP (2.35) (2.50) (2.41) 2.6% -3.6%
E. FINANCING 296.7 315.7 330.2 11.3% 4.6%
I. Debt Financing 371.6 387.8 384.7 3.5% -0.8%
II. Investment Financing (94.0) (91.5) -47.5 -49.5% -48.1%
III. Other Financing 19.3 19.3 -7 -136.6% -136.1%
2017 Macroeconomic Assumption 2017 Budget
38
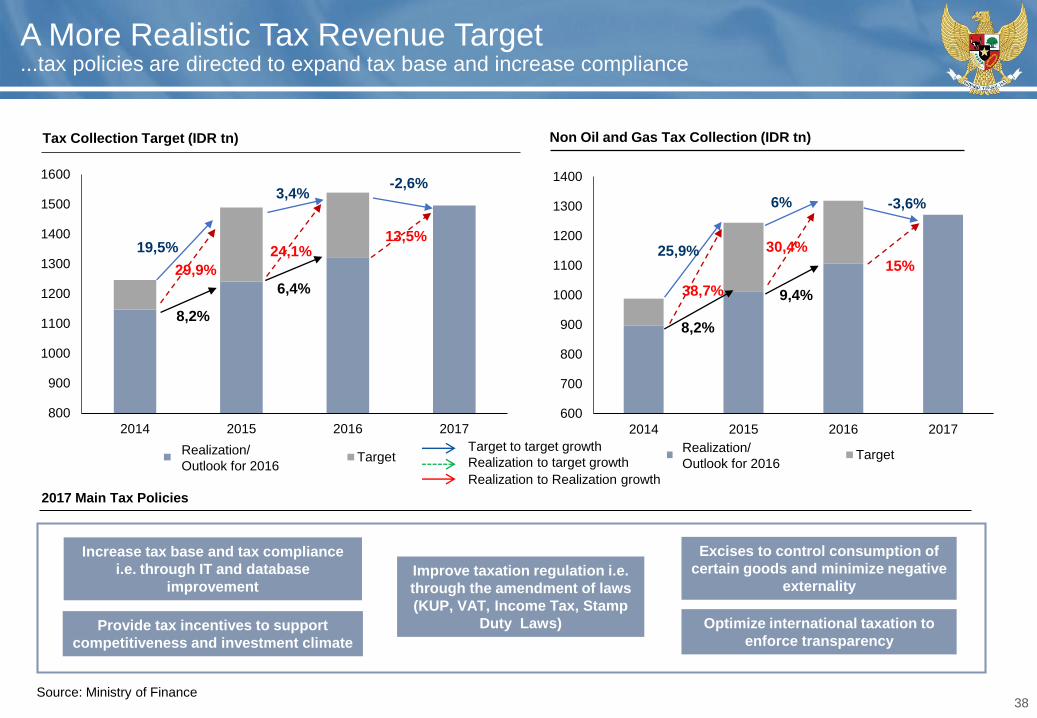
A More Realistic Tax Revenue Target...tax policies are directed to expand tax base and increase compliance
800
900
1000
1100
1200
1300
1400
1500
1600
2014 2015 2016 2017
Realisasi Target
600
700
800
900
1000
1100
1200
1300
1400
2014 2015 2016 2017
Realisasi Target
Source: Ministry of Finance
19,5%
8,2%
29,9%
3,4%
6,4%
24,1%
-2,6%
13,5%25,9%
38,7%
8,2%
6%
30,4%
9,4%
-3,6%
15%
Realization/
Outlook for 2016
Realization/
Outlook for 2016
Target to target growth
Realization to target growth
Realization to Realization growth
Increase tax base and tax compliance
i.e. through IT and database
improvement
Provide tax incentives to support
competitiveness and investment climate
Improve taxation regulation i.e.
through the amendment of laws
(KUP, VAT, Income Tax, Stamp
Duty Laws)
Excises to control consumption of
certain goods and minimize negative
externality
Optimize international taxation to
enforce transparency
Tax Collection Target (IDR tn) Non Oil and Gas Tax Collection (IDR tn)
2017 Main Tax Policies
39
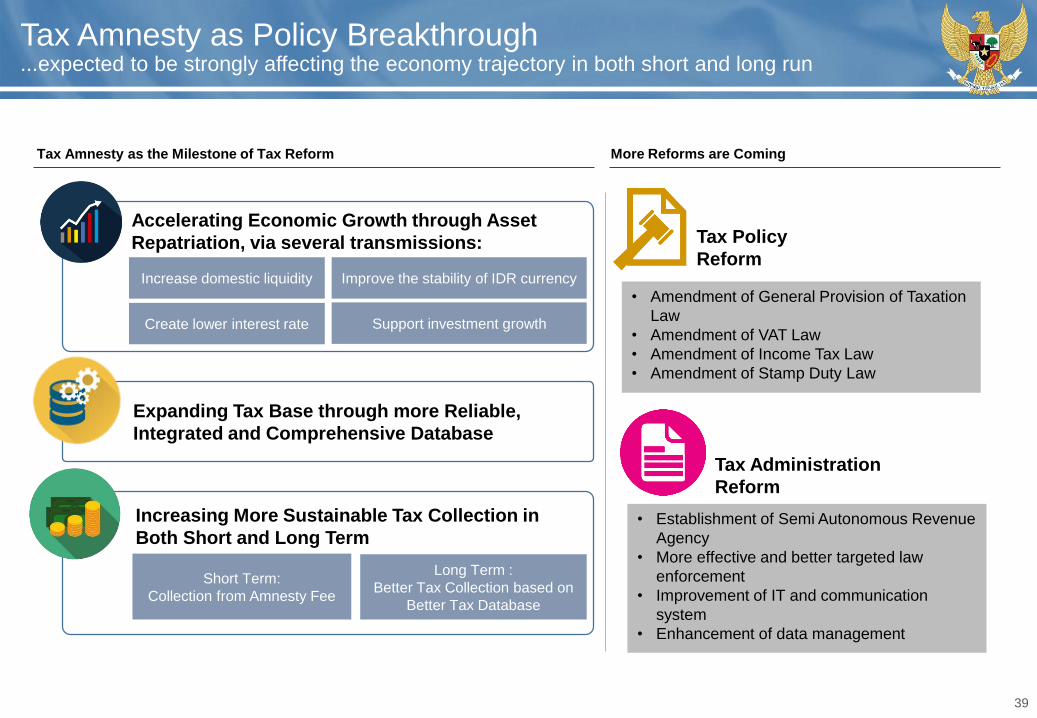
Tax Amnesty as Policy Breakthrough...expected to be strongly affecting the economy trajectory in both short and long run
Expanding Tax Base through more Reliable,
Integrated and Comprehensive Database
Increasing More Sustainable Tax Collection in
Both Short and Long Term
Tax Policy
Reform
Tax Administration
Reform
• Establishment of Semi Autonomous Revenue
Agency
• More effective and better targeted law
enforcement
• Improvement of IT and communication
system
• Enhancement of data management
• Amendment of General Provision of Taxation
Law
• Amendment of VAT Law
• Amendment of Income Tax Law
• Amendment of Stamp Duty Law
Tax Amnesty as the Milestone of Tax Reform More Reforms are Coming
Accelerating Economic Growth through Asset
Repatriation, via several transmissions:
Increase domestic liquidity Improve the stability of IDR currency
Create lower interest rate Support investment growth
Short Term:
Collection from Amnesty Fee
Long Term :
Better Tax Collection based on
Better Tax Database
40
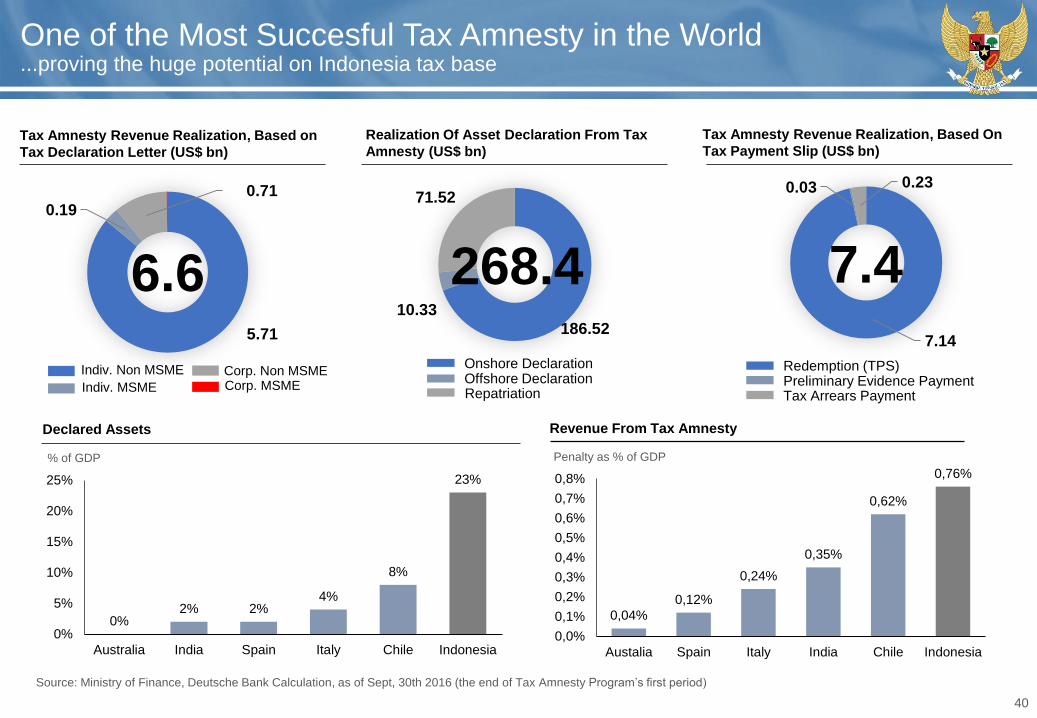
One of the Most Succesful Tax Amnesty in the World...proving the huge potential on Indonesia tax base
Indiv. Non MSME
Indiv. MSME
Corp. Non MSMECorp. MSME
0,04%
0,12%
0,24%
0,35%
0,62%
0,76%
0,0%
0,1%
0,2%
0,3%
0,4%
0,5%
0,6%
0,7%
0,8%
Austalia Spain Italy India Chile Indonesia
0%2% 2%
4%
8%
23%
0%
5%
10%
15%
20%
25%
Australia India Spain Italy Chile Indonesia
% of GDP Penalty as % of GDP
Source: Ministry of Finance, Deutsche Bank Calculation, as of Sept, 30th 2016 (the end of Tax Amnesty Program’s first period)
7.14
0.03 0.23
7.4186.52
10.33
71.52
268.45.71
0.19
0.71
6.6
Tax Amnesty Revenue Realization, Based On
Tax Payment Slip (US$ bn)Tax Amnesty Revenue Realization, Based on
Tax Declaration Letter (US$ bn)
Realization Of Asset Declaration From Tax
Amnesty (US$ bn)
Repatriation
Onshore DeclarationOffshore Declaration
Tax Arrears Payment
Redemption (TPS)Preliminary Evidence Payment
Declared Assets Revenue From Tax Amnesty
41
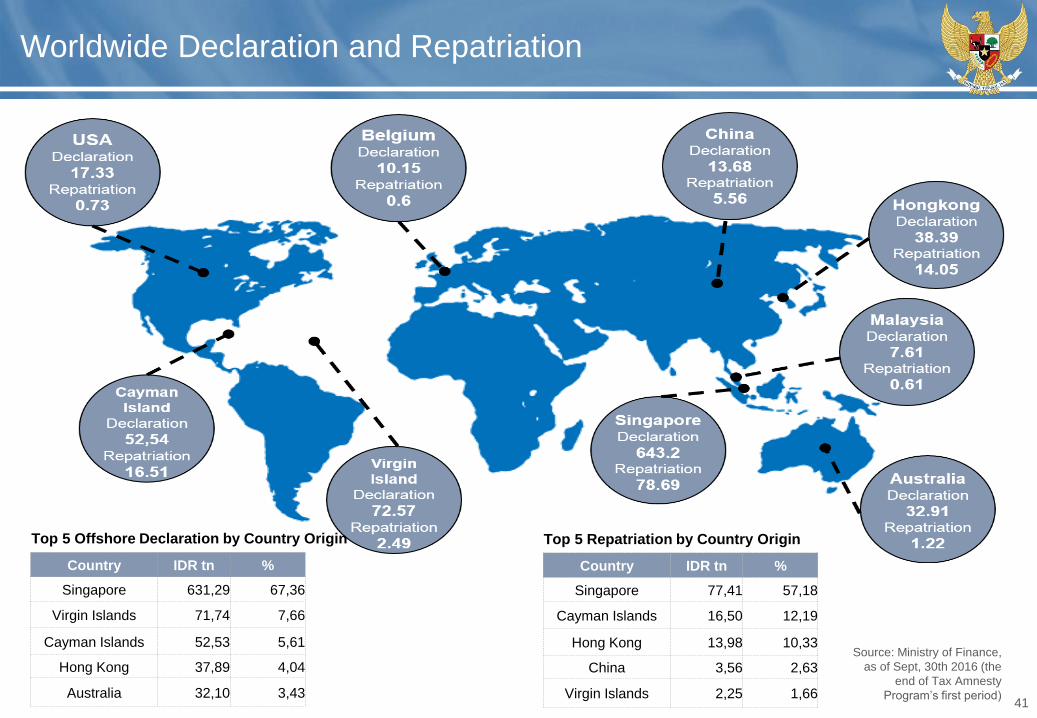
Worldwide Declaration and Repatriation
Top 5 Repatriation by Country Origin
Country IDR tn %
Singapore 631,29 67,36
Virgin Islands 71,74 7,66
Cayman Islands 52,53 5,61
Hong Kong 37,89 4,04
Australia 32,10 3,43
Country IDR tn %
Singapore 77,41 57,18
Cayman Islands 16,50 12,19
Hong Kong 13,98 10,33
China 3,56 2,63
Virgin Islands 2,25 1,66
Top 5 Offshore Declaration by Country Origin
Source: Ministry of Finance,
as of Sept, 30th 2016 (the
end of Tax Amnesty
Program’s first period)
42
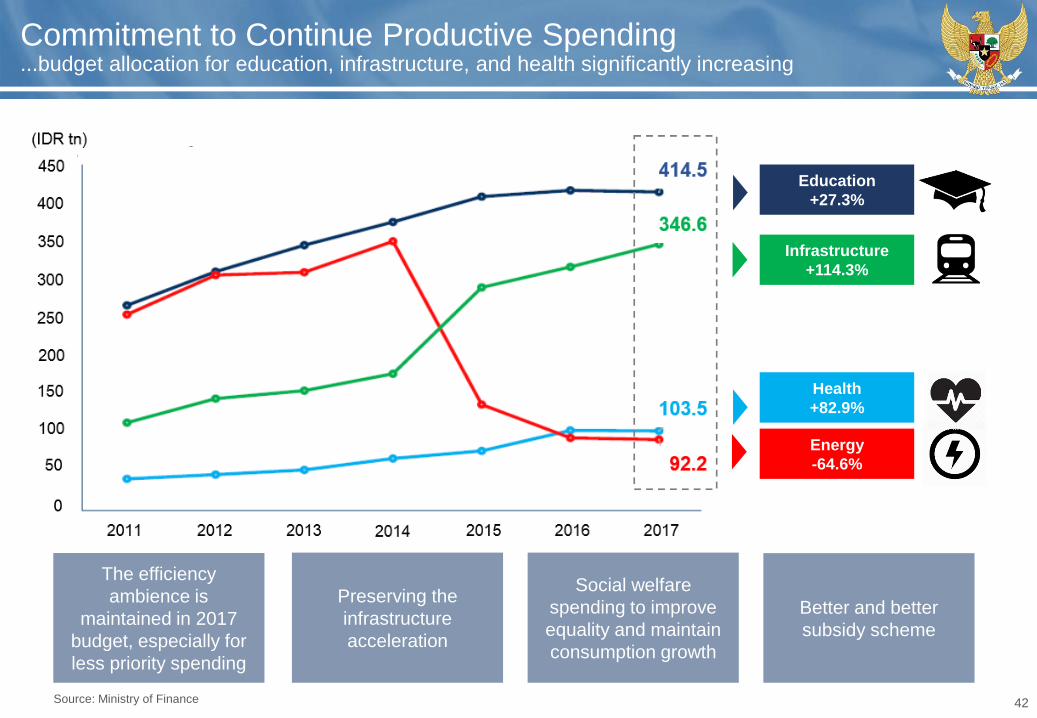
Commitment to Continue Productive Spending...budget allocation for education, infrastructure, and health significantly increasing
Energy
-64.6%
Education
+27.3%
Infrastructure
+114.3%
Health
+82.9%
The efficiency
ambience is
maintained in 2017
budget, especially for
less priority spending
Preserving the
infrastructure
acceleration
Social welfare
spending to improve
equality and maintain
consumption growth
Better and better
subsidy scheme
Source: Ministry of Finance
43
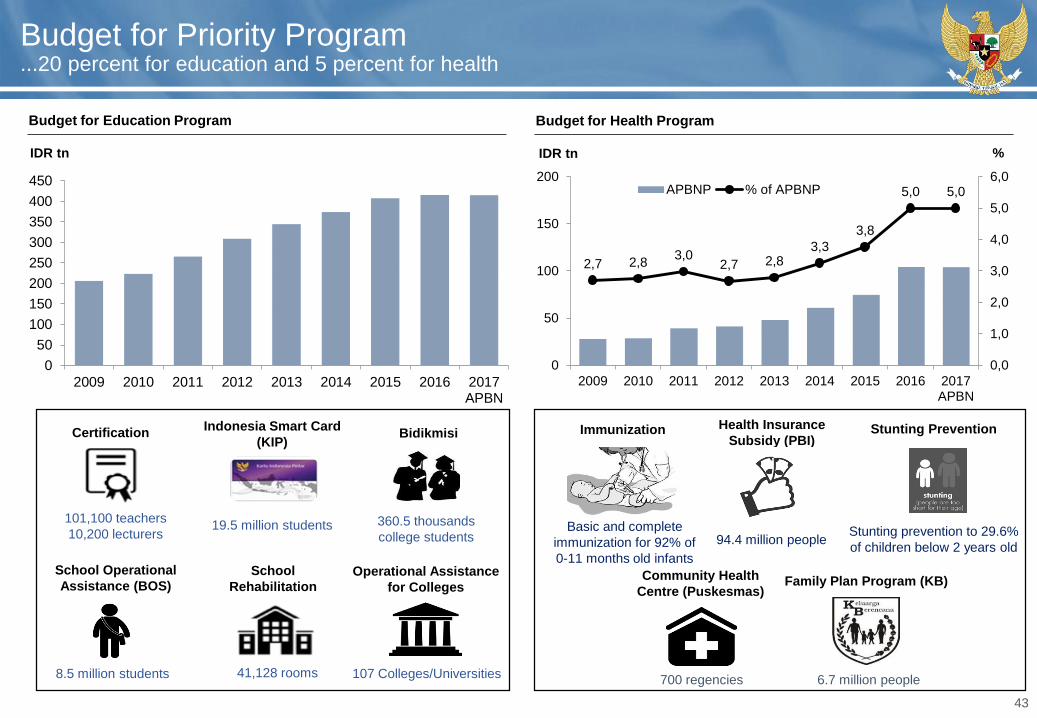
Budget for Priority Program...20 percent for education and 5 percent for health
Bidikmisi
0
50
100
150
200
250
300
350
400
450
2009 2010 2011 2012 2013 2014 2015 2016 2017APBN
IDR tn
2,7 2,83,0
2,7 2,83,3
3,8
5,0 5,0
0,0
1,0
2,0
3,0
4,0
5,0
6,0
0
50
100
150
200
2009 2010 2011 2012 2013 2014 2015 2016 2017APBN
APBNP % of APBNP
IDR tn %
Basic and complete
immunization for 92% of
0-11 months old infants
Immunization
94.4 million people
Health Insurance
Subsidy (PBI)
Stunting prevention to 29.6%
of children below 2 years old
Stunting Prevention
700 regencies
Community Health
Centre (Puskesmas)
6.7 million people
Family Plan Program (KB)
Budget for Education Program Budget for Health Program
360.5 thousands
college students19.5 million students
Indonesia Smart Card
(KIP)
101,100 teachers
10,200 lecturers
Certification
School
Rehabilitation
41,128 rooms8.5 million students
School Operational
Assistance (BOS)
107 Colleges/Universities
Operational Assistance
for Colleges
44
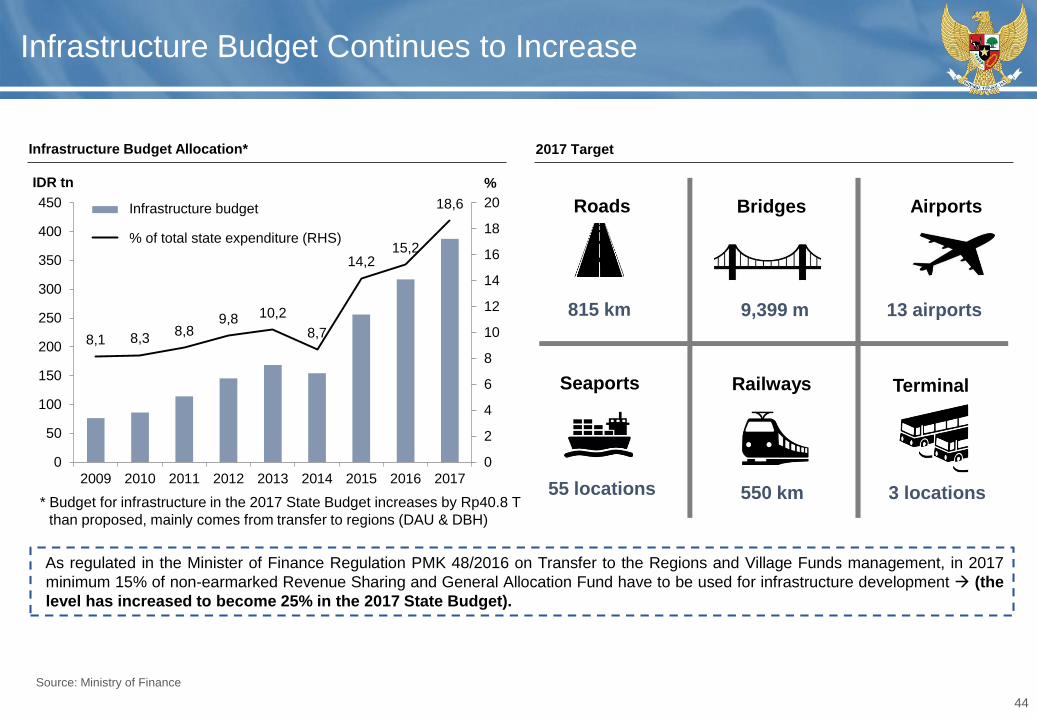
Infrastructure Budget Continues to Increase
* Budget for infrastructure in the 2017 State Budget increases by Rp40.8 T
than proposed, mainly comes from transfer to regions (DAU & DBH)
8,1 8,38,8
9,8 10,2
8,7
14,215,2
18,6
0
2
4
6
8
10
12
14
16
18
20
0
50
100
150
200
250
300
350
400
450
2009 2010 2011 2012 2013 2014 2015 2016 2017
%IDR tn
Anggaran Infrastruktur
% thd Belanja Negara (RHS)
815 km
Roads
9,399 m
Bridges
550 km
Railways
13 airports
Airports
55 locations
Seaports Terminal
3 locations
As regulated in the Minister of Finance Regulation PMK 48/2016 on Transfer to the Regions and Village Funds management, in 2017
minimum 15% of non-earmarked Revenue Sharing and General Allocation Fund have to be used for infrastructure development (the
level has increased to become 25% in the 2017 State Budget).
Infrastructure budget
% of total state expenditure (RHS)
Infrastructure Budget Allocation* 2017 Target
Source: Ministry of Finance
45
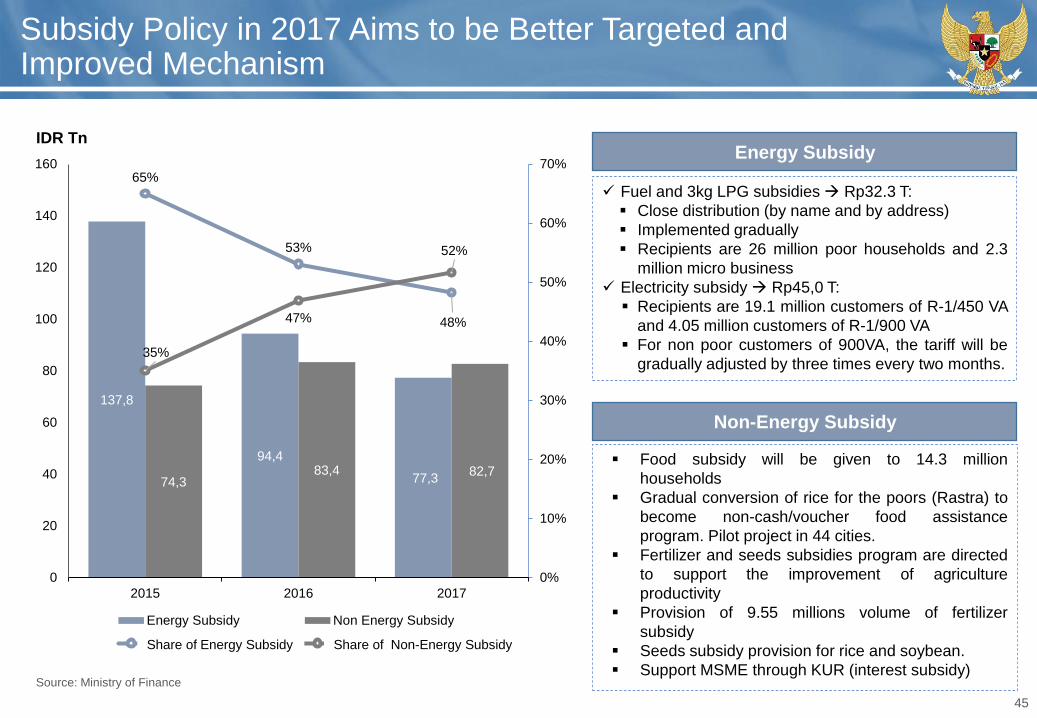
Subsidy Policy in 2017 Aims to be Better Targeted and Improved Mechanism
137,8
94,4
77,3 74,383,4 82,7
65%
53%
48%
35%
47%
52%
0%
10%
20%
30%
40%
50%
60%
70%
0
20
40
60
80
100
120
140
160
2015 2016 2017
Energy Subsidy Non Energy Subsidy
Portion of Ener. Subs Portion of Non Ener. Subs
IDR Tn
Fuel and 3kg LPG subsidies Rp32.3 T:
Close distribution (by name and by address)
Implemented gradually
Recipients are 26 million poor households and 2.3
million micro business
Electricity subsidy Rp45,0 T:
Recipients are 19.1 million customers of R-1/450 VA
and 4.05 million customers of R-1/900 VA
For non poor customers of 900VA, the tariff will be
gradually adjusted by three times every two months.
Food subsidy will be given to 14.3 million
households
Gradual conversion of rice for the poors (Rastra) to
become non-cash/voucher food assistance
program. Pilot project in 44 cities.
Fertilizer and seeds subsidies program are directed
to support the improvement of agriculture
productivity
Provision of 9.55 millions volume of fertilizer
subsidy
Seeds subsidy provision for rice and soybean.
Support MSME through KUR (interest subsidy)
Share of Energy Subsidy Share of Non-Energy Subsidy
Energy Subsidy
Non-Energy Subsidy
Source: Ministry of Finance
46
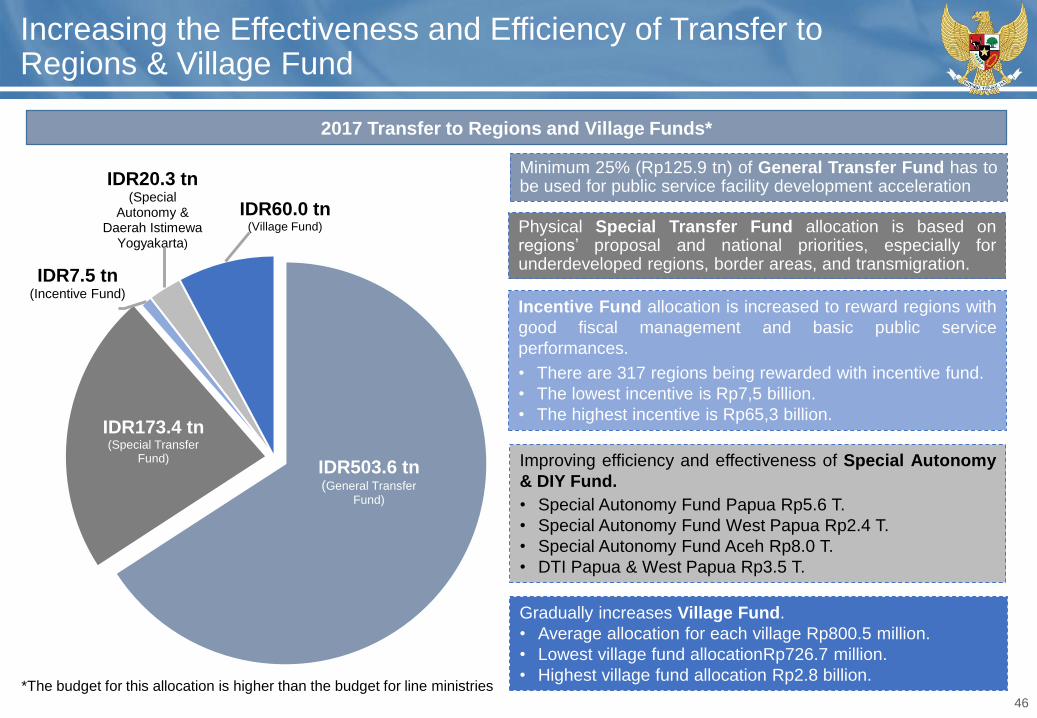
Increasing the Effectiveness and Efficiency of Transfer to Regions & Village Fund
IDR503.6 tn(General Transfer
Fund)
IDR173.4 tn(Special Transfer
Fund)
IDR7.5 tn(Incentive Fund)
IDR20.3 tn(Special
Autonomy & Daerah Istimewa
Yogyakarta)
IDR60.0 tn(Village Fund)
Minimum 25% (Rp125.9 tn) of General Transfer Fund has tobe used for public service facility development acceleration
Physical Special Transfer Fund allocation is based onregions’ proposal and national priorities, especially forunderdeveloped regions, border areas, and transmigration.
Incentive Fund allocation is increased to reward regions with
good fiscal management and basic public service
performances.
• There are 317 regions being rewarded with incentive fund.
• The lowest incentive is Rp7,5 billion.
• The highest incentive is Rp65,3 billion.
Improving efficiency and effectiveness of Special Autonomy
& DIY Fund.
• Special Autonomy Fund Papua Rp5.6 T.
• Special Autonomy Fund West Papua Rp2.4 T.
• Special Autonomy Fund Aceh Rp8.0 T.
• DTI Papua & West Papua Rp3.5 T.
Gradually increases Village Fund.
• Average allocation for each village Rp800.5 million.
• Lowest village fund allocationRp726.7 million.
• Highest village fund allocation Rp2.8 billion.*The budget for this allocation is higher than the budget for line ministries
2017 Transfer to Regions and Village Funds*
47
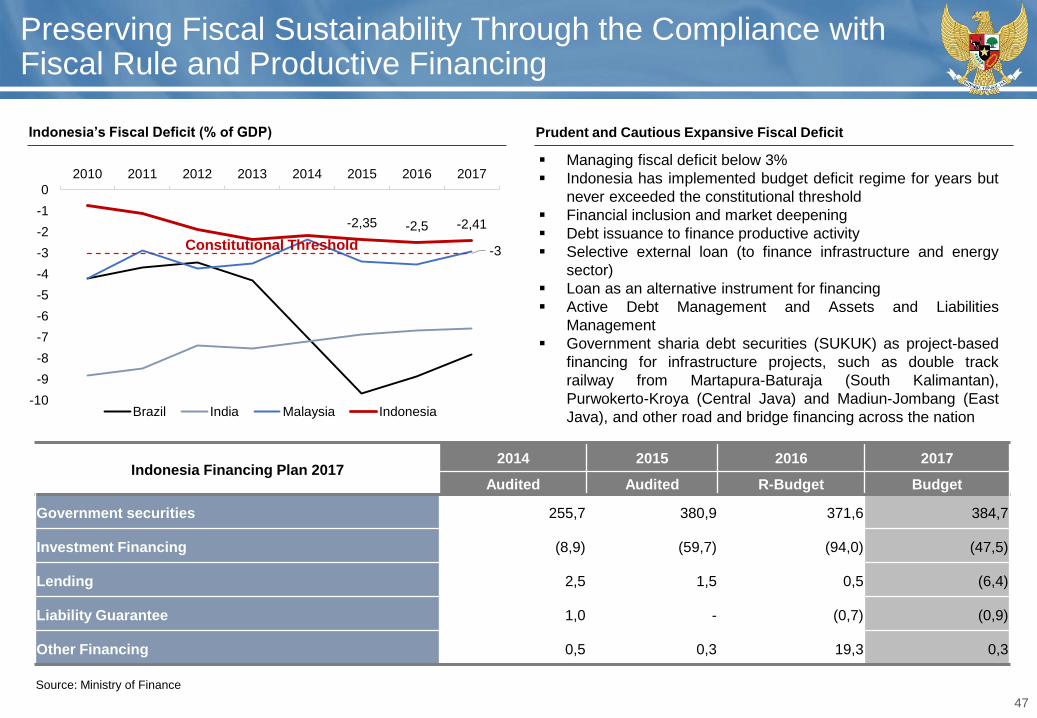
Preserving Fiscal Sustainability Through the Compliance with Fiscal Rule and Productive Financing
-2,35 -2,5 -2,41
-3
-10
-9
-8
-7
-6
-5
-4
-3
-2
-1
0
2010 2011 2012 2013 2014 2015 2016 2017
Brazil India Malaysia Indonesia
Constitutional Threshold
Indonesia Financing Plan 20172014 2015 2016 2017
Audited Audited R-Budget Budget
Government securities 255,7 380,9 371,6 384,7
Investment Financing (8,9) (59,7) (94,0) (47,5)
Lending 2,5 1,5 0,5 (6,4)
Liability Guarantee 1,0 - (0,7) (0,9)
Other Financing 0,5 0,3 19,3 0,3
Indonesia’s Fiscal Deficit (% of GDP) Prudent and Cautious Expansive Fiscal Deficit
Source: Ministry of Finance
Managing fiscal deficit below 3%
Indonesia has implemented budget deficit regime for years but
never exceeded the constitutional threshold
Financial inclusion and market deepening
Debt issuance to finance productive activity
Selective external loan (to finance infrastructure and energy
sector)
Loan as an alternative instrument for financing
Active Debt Management and Assets and Liabilities
Management
Government sharia debt securities (SUKUK) as project-based
financing for infrastructure projects, such as double track
railway from Martapura-Baturaja (South Kalimantan),
Purwokerto-Kroya (Central Java) and Madiun-Jombang (East
Java), and other road and bridge financing across the nation
48
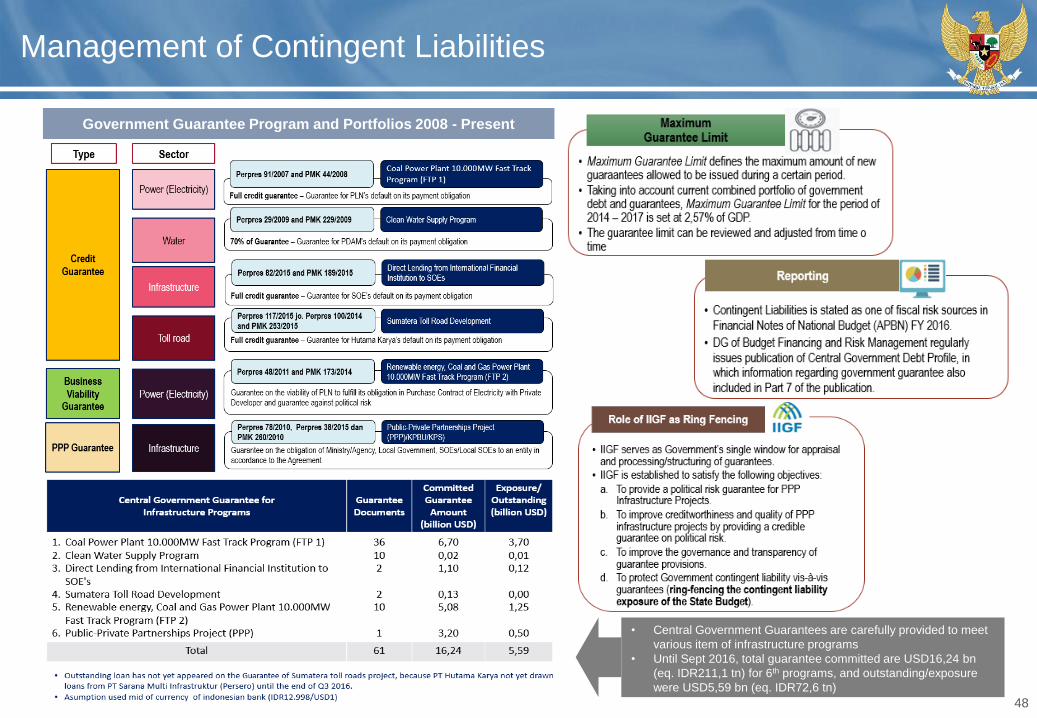
Management of Contingent Liabilities
Government Guarantee Program and Portfolios 2008 - Present
• Central Government Guarantees are carefully provided to meet
various item of infrastructure programs
• Until Sept 2016, total guarantee committed are USD16,24 bn
(eq. IDR211,1 tn) for 6th programs, and outstanding/exposure
were USD5,59 bn (eq. IDR72,6 tn)
49
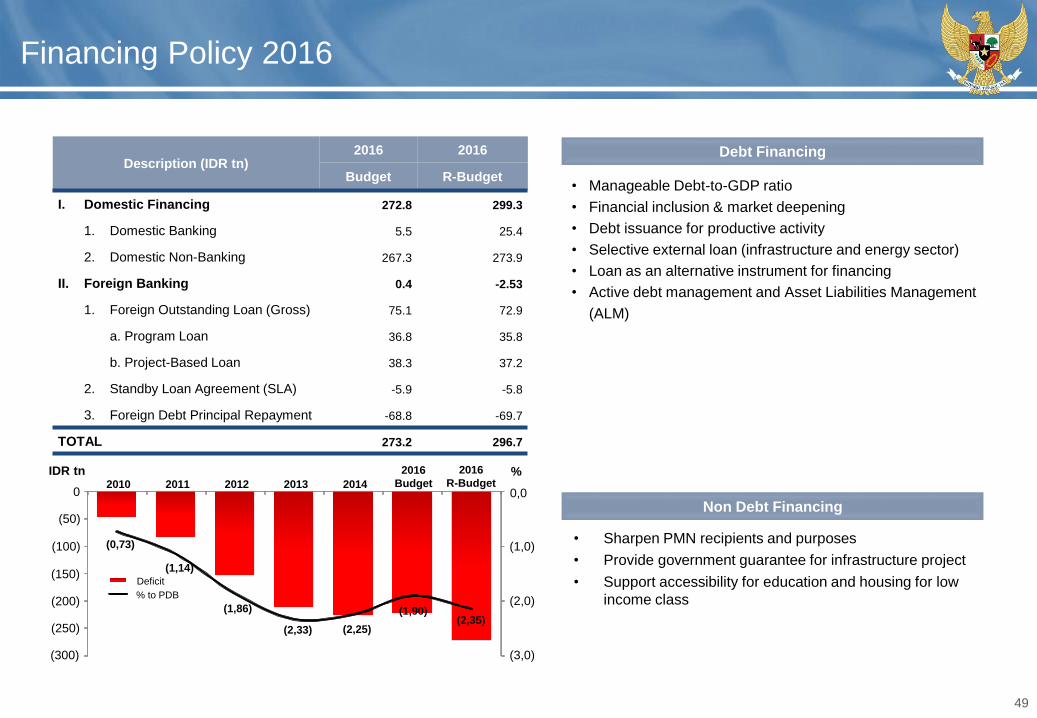
Financing Policy 2016
Description (IDR tn)2016 2016
Budget R-Budget
I. Domestic Financing 272.8 299.3
1. Domestic Banking 5.5 25.4
2. Domestic Non-Banking 267.3 273.9
II. Foreign Banking 0.4 -2.53
1. Foreign Outstanding Loan (Gross) 75.1 72.9
a. Program Loan 36.8 35.8
b. Project-Based Loan 38.3 37.2
2. Standby Loan Agreement (SLA) -5.9 -5.8
3. Foreign Debt Principal Repayment -68.8 -69.7
TOTAL 273.2 296.7
(0,73)
(1,14)
(1,86)
(2,33) (2,25)
(1,90)(2,35)
(3,0)
(2,0)
(1,0)
0,0
(300)
(250)
(200)
(150)
(100)
(50)
0 2010 2011 2012 2013 2014
2016
Budget
2016
R-Budget%IDR tn
Deficit
% to PDB
• Manageable Debt-to-GDP ratio
• Financial inclusion & market deepening
• Debt issuance for productive activity
• Selective external loan (infrastructure and energy sector)
• Loan as an alternative instrument for financing
• Active debt management and Asset Liabilities Management
(ALM)
• Sharpen PMN recipients and purposes
• Provide government guarantee for infrastructure project
• Support accessibility for education and housing for low
income class
Debt Financing
Non Debt Financing
50
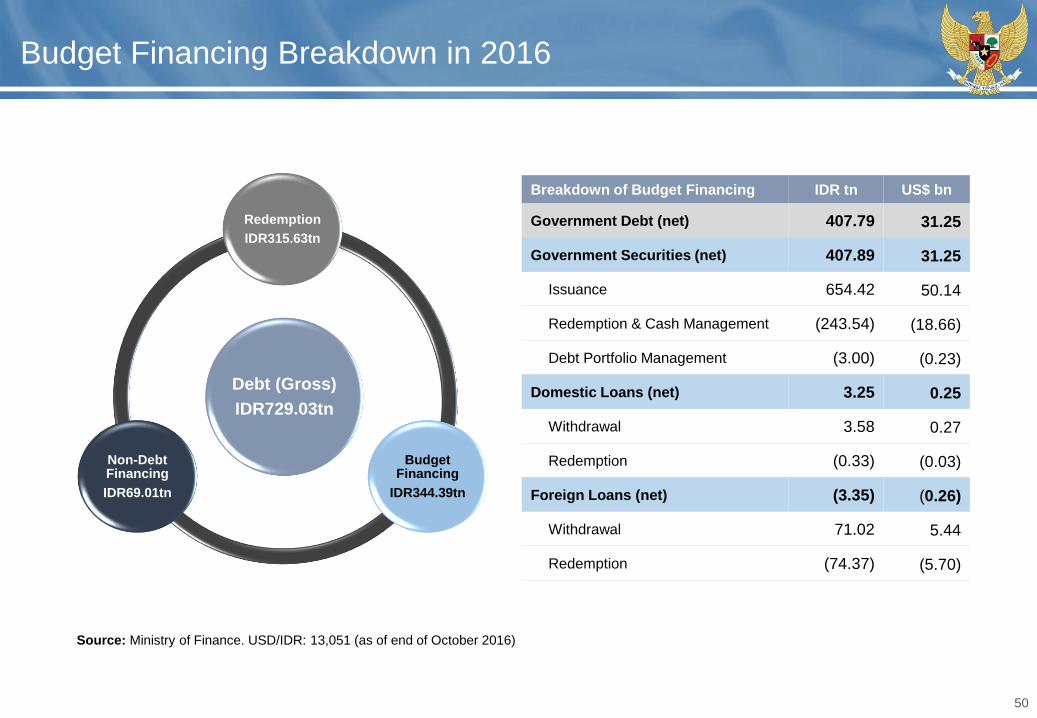
Budget Financing Breakdown in 2016
Debt (Gross)
IDR729.03tn
Redemption
IDR315.63tn
Budget Financing
IDR344.39tn
Non-Debt Financing
IDR69.01tn
Breakdown of Budget Financing IDR tn US$ bn
Government Debt (net) 407.79 31.25
Government Securities (net) 407.89 31.25
Issuance 654.42 50.14
Redemption & Cash Management (243.54) (18.66)
Debt Portfolio Management (3.00) (0.23)
Domestic Loans (net) 3.25 0.25
Withdrawal 3.58 0.27
Redemption (0.33) (0.03)
Foreign Loans (net) (3.35) (0.26)
Withdrawal 71.02 5.44
Redemption (74.37) (5.70)
Source: Ministry of Finance. USD/IDR: 13,051 (as of end of October 2016)
51
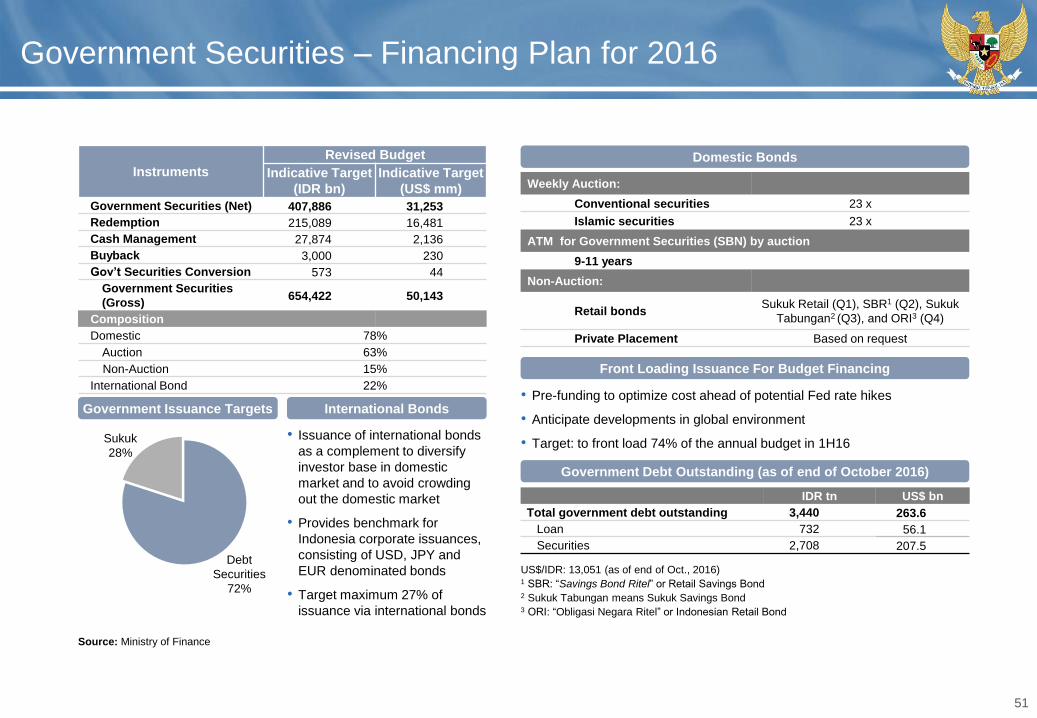
Government Securities – Financing Plan for 2016
Instruments
Revised Budget
Indicative Target
(IDR bn)
Indicative Target
(US$ mm)
Government Securities (Net) 407,886 31,253
Redemption 215,089 16,481
Cash Management 27,874 2,136
Buyback 3,000 230
Gov’t Securities Conversion 573 44
Government Securities
(Gross)654,422 50,143
Composition
Domestic 78%
Auction 63%
Non-Auction 15%
International Bond 22%
Government Issuance Targets International Bonds
• Issuance of international bonds
as a complement to diversify
investor base in domestic
market and to avoid crowding
out the domestic market
• Provides benchmark for
Indonesia corporate issuances,
consisting of USD, JPY and
EUR denominated bonds
• Target maximum 27% of
issuance via international bonds
Source: Ministry of Finance
Domestic Bonds
Weekly Auction:
Conventional securities 23 x
Islamic securities 23 x
ATM for Government Securities (SBN) by auction
9-11 years
Non-Auction:
Retail bondsSukuk Retail (Q1), SBR1 (Q2), Sukuk
Tabungan2 (Q3), and ORI3 (Q4)
Private Placement Based on request
Front Loading Issuance For Budget Financing
• Pre-funding to optimize cost ahead of potential Fed rate hikes
• Anticipate developments in global environment
• Target: to front load 74% of the annual budget in 1H16
Government Debt Outstanding (as of end of October 2016)
IDR tn US$ bn
Total government debt outstanding 3,440 263.6
Loan 732 56.1
Securities 2,708 207.5 Debt
Securities
72%
Sukuk
28%
US$/IDR: 13,051 (as of end of Oct., 2016)1 SBR: “Savings Bond Ritel” or Retail Savings Bond2 Sukuk Tabungan means Sukuk Savings Bond3 ORI: “Obligasi Negara Ritel” or Indonesian Retail Bond
52
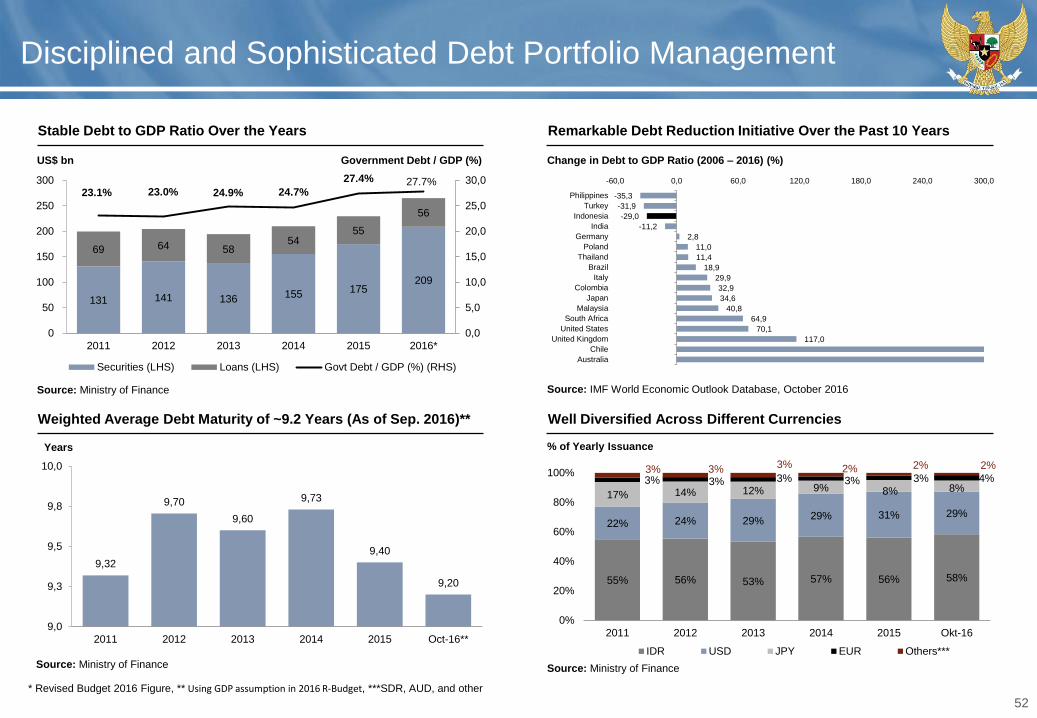
Disciplined and Sophisticated Debt Portfolio Management
Stable Debt to GDP Ratio Over the Years
Weighted Average Debt Maturity of ~9.2 Years (As of Sep. 2016)**
US$ bn
Remarkable Debt Reduction Initiative Over the Past 10 Years
Change in Debt to GDP Ratio (2006 – 2016) (%)
Source: IMF World Economic Outlook Database, October 2016
Well Diversified Across Different Currencies
% of Yearly Issuance
Government Debt / GDP (%)
Source: Ministry of Finance
Source: Ministry of Finance Source: Ministry of Finance
(1)
Years
131 141 136 155 175209
69 64 5854
55
56
23.1% 23.0% 24.9% 24.7%
27.4% 27.7%
0,0
5,0
10,0
15,0
20,0
25,0
30,0
0
50
100
150
200
250
300
2011 2012 2013 2014 2015 2016*
Securities (LHS) Loans (LHS) Govt Debt / GDP (%) (RHS)
* Revised Budget 2016 Figure, ** Using GDP assumption in 2016 R-Budget, ***SDR, AUD, and other
-35,3
-31,9
-29,0
-11,2
2,8
11,0
11,4
18,9
29,9
32,9
34,6
40,8
64,9
70,1
117,0
-60,0 0,0 60,0 120,0 180,0 240,0 300,0
Philippines
Turkey
Indonesia
India
Germany
Poland
Thailand
Brazil
Italy
Colombia
Japan
Malaysia
South Africa
United States
United Kingdom
Chile
Australia
9,32
9,70
9,60
9,73
9,40
9,20
9,0
9,3
9,5
9,8
10,0
2011 2012 2013 2014 2015 Oct-16**
55% 56% 53% 57% 56% 58%
22% 24% 29%29% 31% 29%
17% 14% 12% 9% 8% 8%3% 3% 3% 3% 3% 4%3% 3% 3% 2% 2% 2%
0%
20%
40%
60%
80%
100%
2011 2012 2013 2014 2015 Okt-16
IDR USD JPY EUR Others***
53
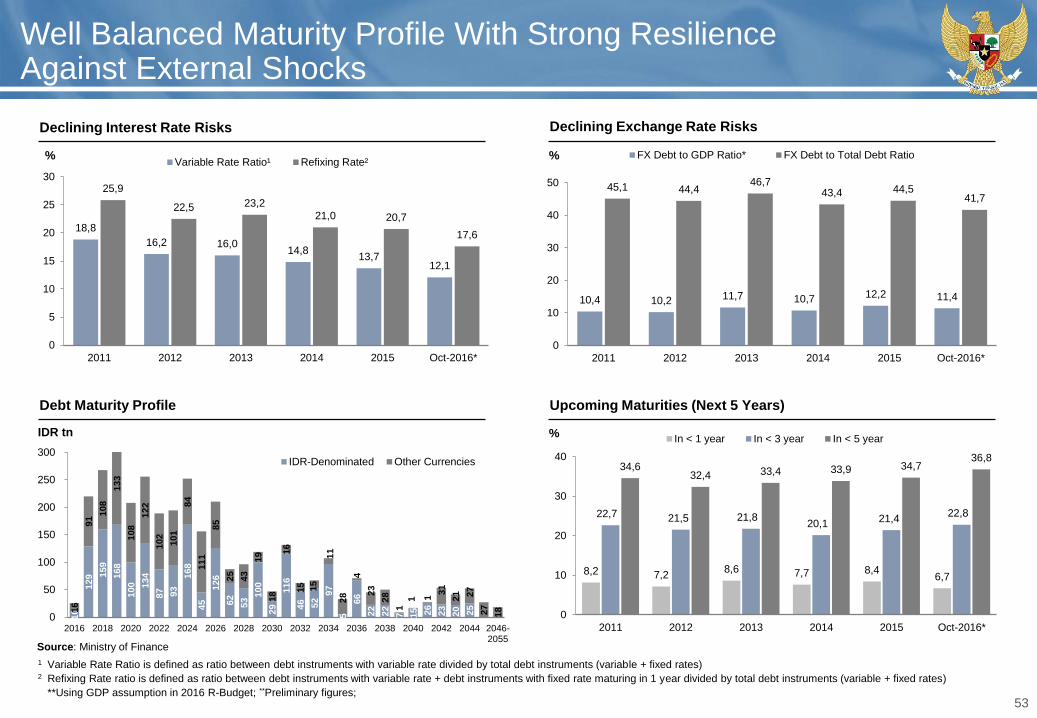
Well Balanced Maturity Profile With Strong Resilience Against External Shocks
Source: Ministry of Finance
1 Variable Rate Ratio is defined as ratio between debt instruments with variable rate divided by total debt instruments (variable + fixed rates)2 Refixing Rate ratio is defined as ratio between debt instruments with variable rate + debt instruments with fixed rate maturing in 1 year divided by total debt instruments (variable + fixed rates)
**Using GDP assumption in 2016 R-Budget; **Preliminary figures;
Debt Maturity Profile
% %
Upcoming Maturities (Next 5 Years)
%IDR tn
18,8
16,2 16,014,8
13,712,1
25,9
22,5 23,2
21,0 20,7
17,6
0
5
10
15
20
25
30
2011 2012 2013 2014 2015 Oct-2016*
Variable Rate Ratio¹ Refixing Rate²
10,4 10,2 11,7 10,7 12,2 11,4
45,1 44,446,7
43,4 44,541,7
0
10
20
30
40
50
2011 2012 2013 2014 2015 Oct-2016*
FX Debt to GDP Ratio* FX Debt to Total Debt Ratio
8,2 7,28,6 7,7 8,4
6,7
22,7 21,5 21,820,1 21,4
22,8
34,632,4 33,4 33,9 34,7
36,8
0
10
20
30
40
2011 2012 2013 2014 2015 Oct-2016*
In < 1 year In < 3 year In < 5 year
10
129 1
59
168
100 134
87 93
168
45
126
62
53
100
29
116
46 52
97
5
66
22
22
7 15 26
23
20 2516
91
108
133
108
122
102
101
84
111
85
25
43
19
18
16
15 15
11
28
4
23
28
1
1 1
31
21 27
27
18
0
50
100
150
200
250
300
2016 2018 2020 2022 2024 2026 2028 2030 2032 2034 2036 2038 2040 2042 2044 2046-2055
IDR-Denominated Other Currencies
Declining Interest Rate Risks Declining Exchange Rate Risks
54
30,80 32,98 32,54 38,13 38,12 38,98 38,28 39,39 38,87 39,16 38,4
32,58 30,49 33,7630,83
37,85 30,48 34,05 32,49 35,02 39,77 37,72
36,63 36,53 33,70 31,0423,95 30,53 27,63 28,12 26,11 21,07 23,88
0
20
40
60
80
100
Dec-11 Dec-12 Dec-13 Dec-14 Dec-15 Feb-16 May-16 Jul-16 Aug-16 Sep-16 Okt-16
Foreign Holder Domestic Non Banks Domestic Banks
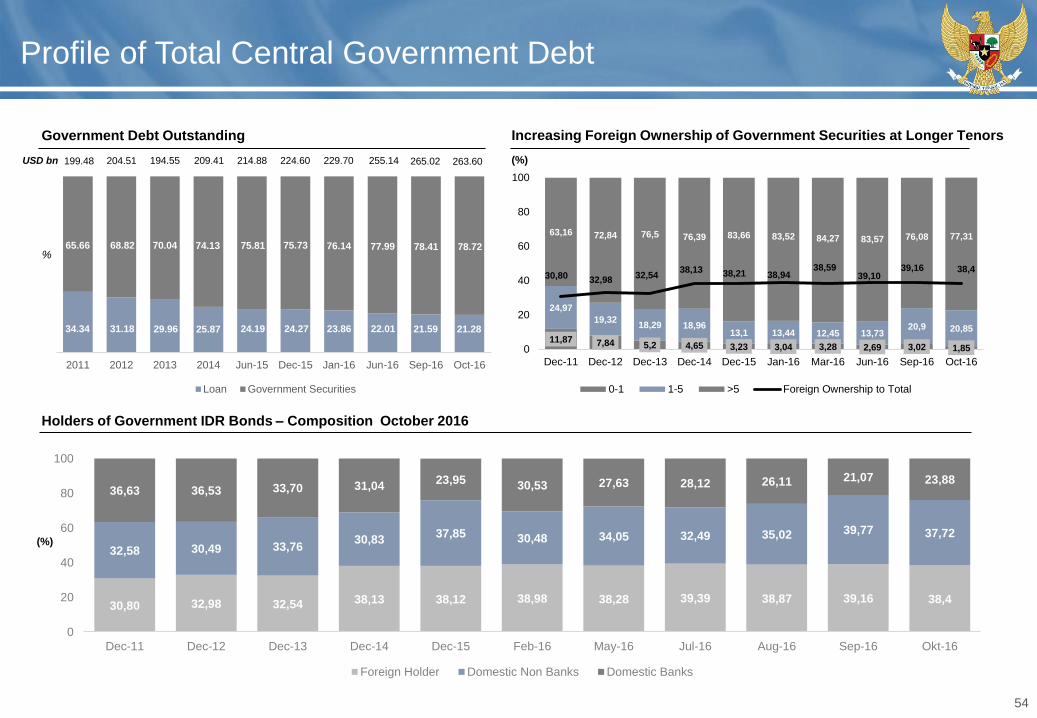
Profile of Total Central Government Debt
Increasing Foreign Ownership of Government Securities at Longer Tenors
(%)
Holders of Government IDR Bonds – Composition October 2016
USD bn 209.41199.48 204.51 194.55 214.88 224.60 229.70 263.60255.14 (%)265.02
2011 2012 2013 2014 Jun-15 Dec-15 Jan-16 Jun-16 Sep-16 Oct-16
Loan Government Securities
%74.1368.82 70.04 75.81 75.73 76.14 77.9965.66 78.41 78.72
25.8734.34 31.18 29.96 24.27 23.8624.19 22.01 21.59 21.2811,87 7,84 5,2 4,65 3,23 3,04 3,28 2,69 3,02 1,85
24,97
19,3218,29 18,96
13,1 13,44 12,45 13,7320,9 20,85
63,16 72,84 76,5 76,39 83,66 83,52 84,27 83,57 76,08 77,31
30,80 32,9832,54
38,13 38,21 38,9438,59
39,1039,16 38,4
0
20
40
60
80
100
Dec-11 Dec-12 Dec-13 Dec-14 Dec-15 Jan-16 Mar-16 Jun-16 Sep-16 Oct-16
0-1 1-5 >5 Foreign Ownership to Total
Government Debt Outstanding
55
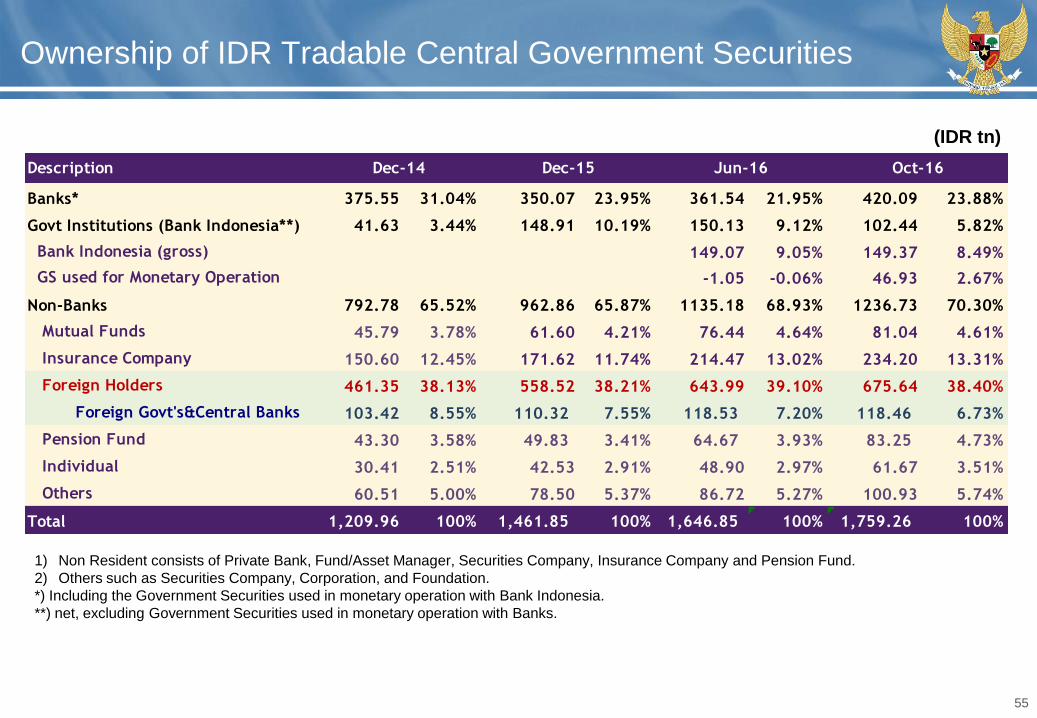
Ownership of IDR Tradable Central Government Securities
Description
Banks* 375.55 31.04% 350.07 23.95% 361.54 21.95% 420.09 23.88%
Govt Institutions (Bank Indonesia**) 41.63 3.44% 148.91 10.19% 150.13 9.12% 102.44 5.82%
Bank Indonesia (gross) 149.07 9.05% 149.37 8.49%
GS used for Monetary Operation -1.05 -0.06% 46.93 2.67%
Non-Banks 792.78 65.52% 962.86 65.87% 1135.18 68.93% 1236.73 70.30%
Mutual Funds 45.79 3.78% 61.60 4.21% 76.44 4.64% 81.04 4.61%
Insurance Company 150.60 12.45% 171.62 11.74% 214.47 13.02% 234.20 13.31%
Foreign Holders 461.35 38.13% 558.52 38.21% 643.99 39.10% 675.64 38.40%
Foreign Govt's&Central Banks 103.42 8.55% 110.32 7.55% 118.53 7.20% 118.46 6.73%
Pension Fund 43.30 3.58% 49.83 3.41% 64.67 3.93% 83.25 4.73%
Individual 30.41 2.51% 42.53 2.91% 48.90 2.97% 61.67 3.51%
Others 60.51 5.00% 78.50 5.37% 86.72 5.27% 100.93 5.74%
Total 1,209.96 100% 1,461.85 100% 1,646.85 100% 1,759.26 100%
Dec-14 Dec-15 Jun-16 Oct-16
1) Non Resident consists of Private Bank, Fund/Asset Manager, Securities Company, Insurance Company and Pension Fund.
2) Others such as Securities Company, Corporation, and Foundation.
*) Including the Government Securities used in monetary operation with Bank Indonesia.
**) net, excluding Government Securities used in monetary operation with Banks.
(IDR tn)
56
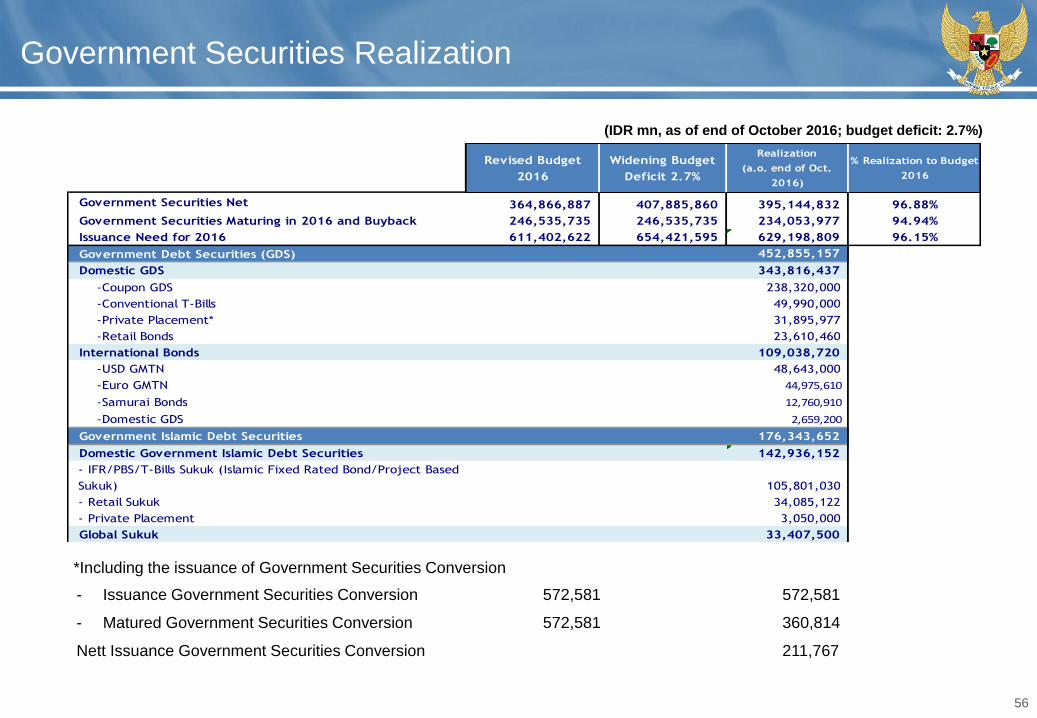
Government Securities Realization
- Issuance Government Securities Conversion 572,581 572,581
- Matured Government Securities Conversion 572,581 360,814
Nett Issuance Government Securities Conversion 211,767
(IDR mn, as of end of October 2016; budget deficit: 2.7%)
Revised Budget
2016
Widening Budget
Deficit 2.7%
Realization
(a.o. end of Oct.
2016)
% Realization to Budget
2016
Government Securities Net 364,866,887 407,885,860 395,144,832 96.88%
Government Securities Maturing in 2016 and Buyback 246,535,735 246,535,735 234,053,977 94.94%
Issuance Need for 2016 611,402,622 654,421,595 629,198,809 96.15%
Government Debt Securities (GDS) 452,855,157
Domestic GDS 343,816,437
-Coupon GDS 238,320,000
-Conventional T-Bills 49,990,000
-Private Placement* 31,895,977
-Retail Bonds 23,610,460
International Bonds 109,038,720
-USD GMTN 48,643,000
-Euro GMTN 44,975,610
-Samurai Bonds 12,760,910
-Domestic GDS 2,659,200
Government Islamic Debt Securities 176,343,652
Domestic Government Islamic Debt Securities 142,936,152
- IFR/PBS/T-Bills Sukuk (Islamic Fixed Rated Bond/Project Based
Sukuk) 105,801,030
- Retail Sukuk 34,085,122
- Private Placement 3,050,000
Global Sukuk 33,407,500
*Including the issuance of Government Securities Conversion
- Issuance Government Securities Conversion 572,581 572,581
- Matured Government Securities Conversion 572,581 360,814
Nett Issuance Government Securities Conversion - 211,767
*Including the issuance of Government Securities Conversion
Credible Monetary Policy Track Record and Favourable Financial Sector
Monetary and Financial Factor:5
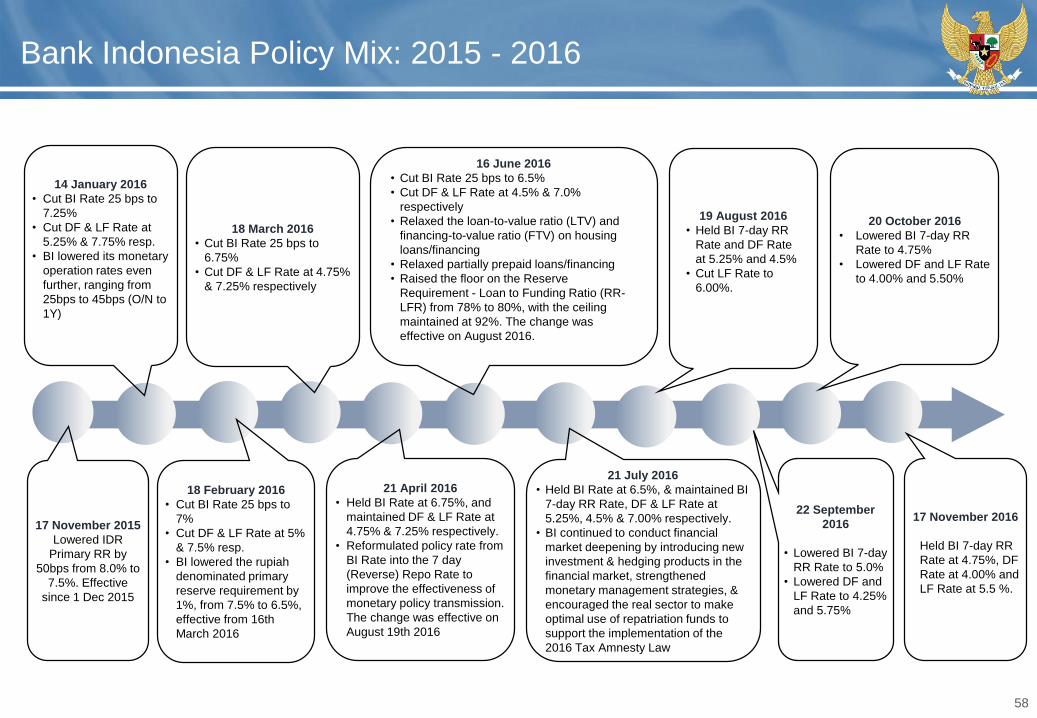
58
Bank Indonesia Policy Mix: 2015 - 2016
18 March 2016
• Cut BI Rate 25 bps to
6.75%
• Cut DF & LF Rate at 4.75%
& 7.25% respectively
18 February 2016
• Cut BI Rate 25 bps to
7%
• Cut DF & LF Rate at 5%
& 7.5% resp.
• BI lowered the rupiah
denominated primary
reserve requirement by
1%, from 7.5% to 6.5%,
effective from 16th
March 2016
16 June 2016
• Cut BI Rate 25 bps to 6.5%
• Cut DF & LF Rate at 4.5% & 7.0%
respectively
• Relaxed the loan-to-value ratio (LTV) and
financing-to-value ratio (FTV) on housing
loans/financing
• Relaxed partially prepaid loans/financing
• Raised the floor on the Reserve
Requirement - Loan to Funding Ratio (RR-
LFR) from 78% to 80%, with the ceiling
maintained at 92%. The change was
effective on August 2016.
21 April 2016
• Held BI Rate at 6.75%, and
maintained DF & LF Rate at
4.75% & 7.25% respectively.
• Reformulated policy rate from
BI Rate into the 7 day
(Reverse) Repo Rate to
improve the effectiveness of
monetary policy transmission.
The change was effective on
August 19th 2016
14 January 2016
• Cut BI Rate 25 bps to
7.25%
• Cut DF & LF Rate at
5.25% & 7.75% resp.
• BI lowered its monetary
operation rates even
further, ranging from
25bps to 45bps (O/N to
1Y)
19 August 2016
• Held BI 7-day RR
Rate and DF Rate
at 5.25% and 4.5%
• Cut LF Rate to
6.00%.
21 July 2016
• Held BI Rate at 6.5%, & maintained BI
7-day RR Rate, DF & LF Rate at
5.25%, 4.5% & 7.00% respectively.
• BI continued to conduct financial
market deepening by introducing new
investment & hedging products in the
financial market, strengthened
monetary management strategies, &
encouraged the real sector to make
optimal use of repatriation funds to
support the implementation of the
2016 Tax Amnesty Law
17 November 2015
Lowered IDR
Primary RR by
50bps from 8.0% to
7.5%. Effective
since 1 Dec 2015
22 September
2016
• Lowered BI 7-day
RR Rate to 5.0%
• Lowered DF and
LF Rate to 4.25%
and 5.75%
20 October 2016
• Lowered BI 7-day RR
Rate to 4.75%
• Lowered DF and LF Rate
to 4.00% and 5.50%
17 November 2016
Held BI 7-day RR
Rate at 4.75%, DF
Rate at 4.00% and
LF Rate at 5.5 %.
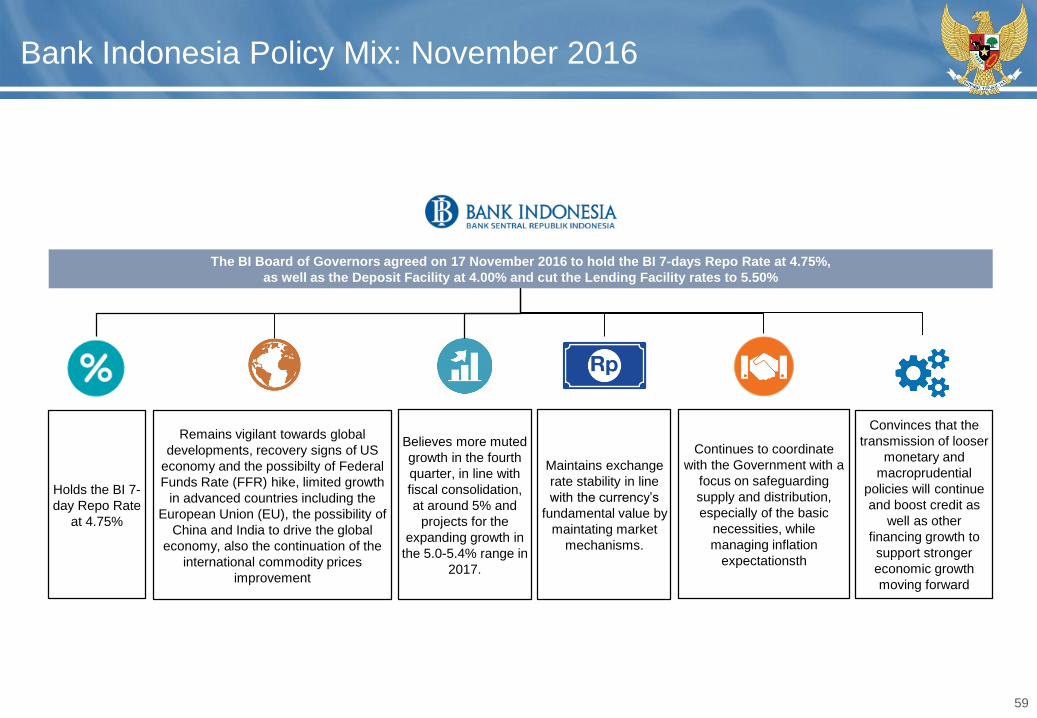
59
Bank Indonesia Policy Mix: November 2016
The BI Board of Governors agreed on 17 November 2016 to hold the BI 7-days Repo Rate at 4.75%,
as well as the Deposit Facility at 4.00% and cut the Lending Facility rates to 5.50%
Holds the BI 7-
day Repo Rate
at 4.75%
Convinces that the
transmission of looser
monetary and
macroprudential
policies will continue
and boost credit as
well as other
financing growth to
support stronger
economic growth
moving forward
Remains vigilant towards global
developments, recovery signs of US
economy and the possibilty of Federal
Funds Rate (FFR) hike, limited growth
in advanced countries including the
European Union (EU), the possibility of
China and India to drive the global
economy, also the continuation of the
international commodity prices
improvement
Continues to coordinate
with the Government with a
focus on safeguarding
supply and distribution,
especially of the basic
necessities, while
managing inflation
expectationsth
Maintains exchange
rate stability in line
with the currency’s
fundamental value by
maintating market
mechanisms.
Believes more muted
growth in the fourth
quarter, in line with
fiscal consolidation,
at around 5% and
projects for the
expanding growth in
the 5.0-5.4% range in
2017.
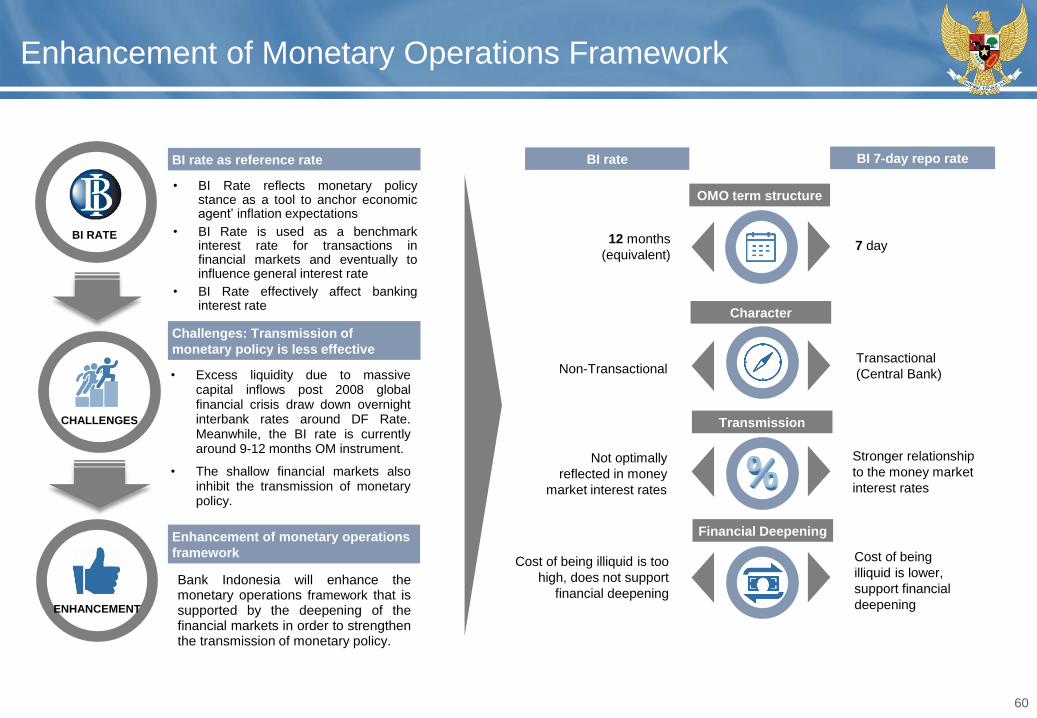
60
Enhancement of Monetary Operations Framework
Bank Indonesia will enhance themonetary operations framework that issupported by the deepening of thefinancial markets in order to strengthenthe transmission of monetary policy.
BI RATE
• BI Rate reflects monetary policystance as a tool to anchor economicagent’ inflation expectations
• BI Rate is used as a benchmarkinterest rate for transactions infinancial markets and eventually toinfluence general interest rate
• BI Rate effectively affect bankinginterest rate
• Excess liquidity due to massivecapital inflows post 2008 globalfinancial crisis draw down overnightinterbank rates around DF Rate.Meanwhile, the BI rate is currentlyaround 9-12 months OM instrument.
• The shallow financial markets alsoinhibit the transmission of monetarypolicy.
CHALLENGES
ENHANCEMENT
BI rate as reference rate
Challenges: Transmission of
monetary policy is less effective
Enhancement of monetary operations
framework
12 months
(equivalent)7 day
Non-TransactionalTransactional
(Central Bank)
Not optimally
reflected in money
market interest rates
Stronger relationship
to the money market
interest rates
Cost of being
illiquid is lower,
support financial
deepening
BI rate BI 7-day repo rate
OMO term structure
Character
Transmission
Financial Deepening
Cost of being illiquid is too
high, does not support
financial deepening
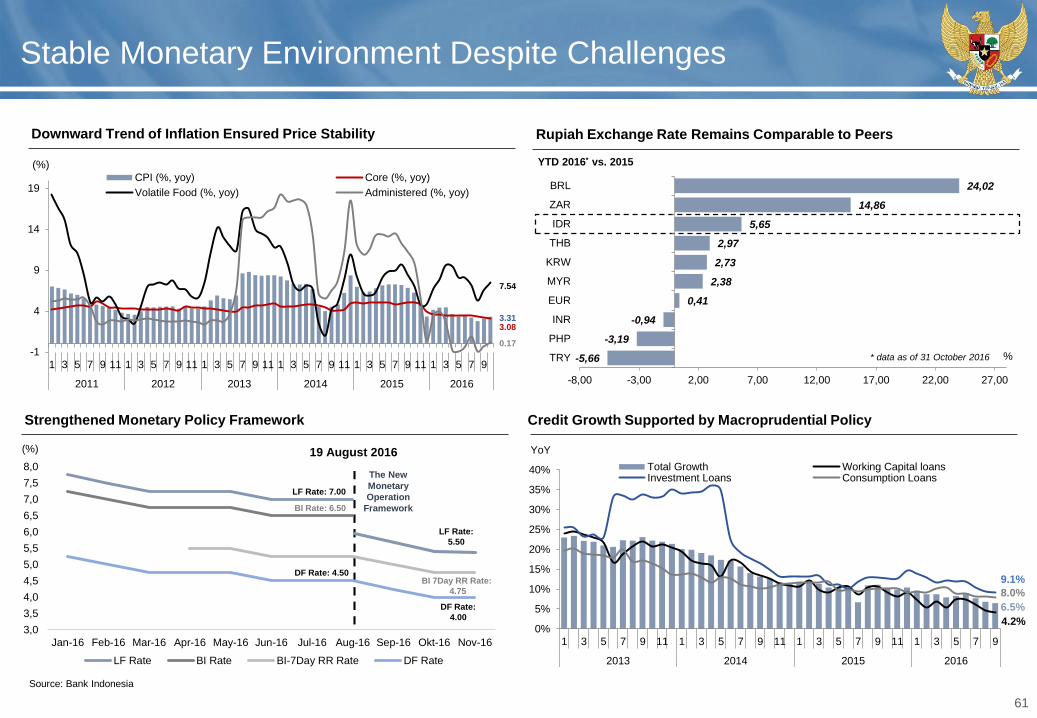
61
Stable Monetary Environment Despite Challenges
Source: Bank Indonesia
Rupiah Exchange Rate Remains Comparable to Peers
YTD 2016* vs. 2015
Strengthened Monetary Policy Framework
(%)
Credit Growth Supported by Macroprudential Policy
Downward Trend of Inflation Ensured Price Stability
8.0%
4.2%
6.5%
9.1%
YoY
LF Rate: 7.00
LF Rate:
5.50
BI Rate: 6.50
BI 7Day RR Rate:
4.75
DF Rate: 4.50
DF Rate:
4.00
19 August 2016
The New
Monetary
Operation
Framework
* data as of 31 October 2016-5,66
-3,19
-0,94
0,41
2,38
2,73
2,97
5,65
14,86
24,02
-8,00 -3,00 2,00 7,00 12,00 17,00 22,00 27,00
TRY
PHP
INR
EUR
MYR
KRW
THB
IDR
ZAR
BRL
%
3.31
0.17
(%)
3.08
7.54
-1
4
9
14
19
1 3 5 7 9 11 1 3 5 7 9 11 1 3 5 7 9 11 1 3 5 7 9 11 1 3 5 7 9 11 1 3 5 7 9
2011 2012 2013 2014 2015 2016
CPI (%, yoy) Core (%, yoy)
Volatile Food (%, yoy) Administered (%, yoy)
0%
5%
10%
15%
20%
25%
30%
35%
40%
1 3 5 7 9 11 1 3 5 7 9 11 1 3 5 7 9 11 1 3 5 7 9
2013 2014 2015 2016
Total Growth Working Capital loansInvestment Loans Consumption Loans
3,0
3,5
4,0
4,5
5,0
5,5
6,0
6,5
7,0
7,5
8,0
Jan-16 Feb-16 Mar-16 Apr-16 May-16 Jun-16 Jul-16 Aug-16 Sep-16 Okt-16 Nov-16
LF Rate BI Rate BI-7Day RR Rate DF Rate
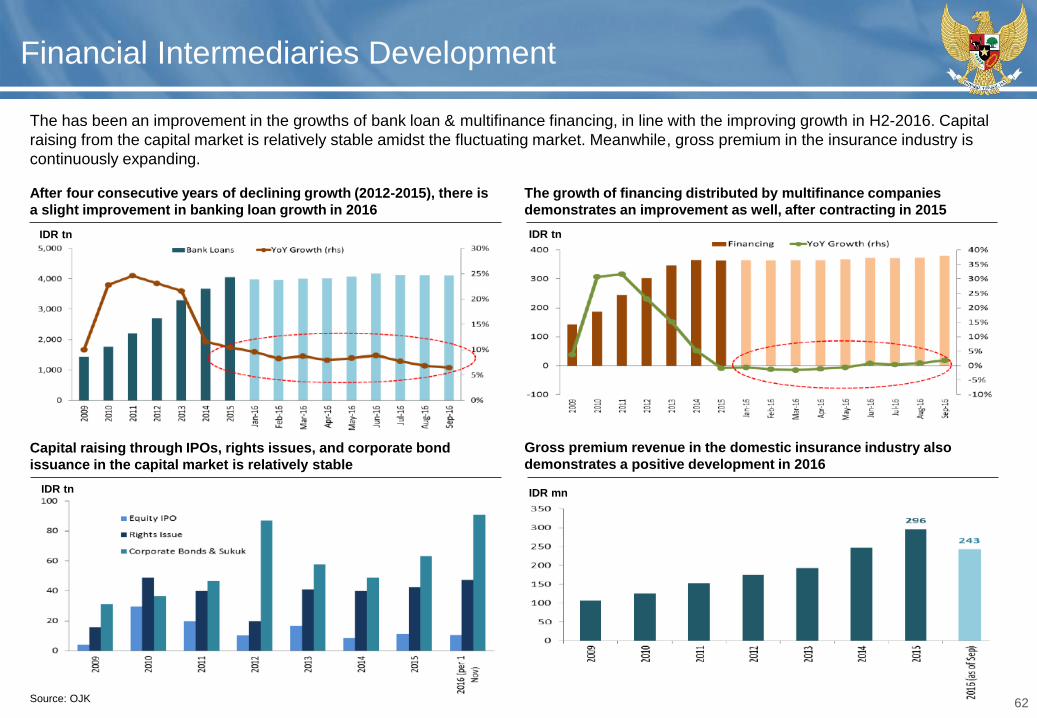
62
Financial Intermediaries Development
The has been an improvement in the growths of bank loan & multifinance financing, in line with the improving growth in H2-2016. Capital
raising from the capital market is relatively stable amidst the fluctuating market. Meanwhile, gross premium in the insurance industry is
continuously expanding.
Source: OJK
The growth of financing distributed by multifinance companies
demonstrates an improvement as well, after contracting in 2015
Gross premium revenue in the domestic insurance industry also
demonstrates a positive development in 2016Capital raising through IPOs, rights issues, and corporate bond
issuance in the capital market is relatively stable
After four consecutive years of declining growth (2012-2015), there is
a slight improvement in banking loan growth in 2016
IDR tn IDR tn
IDR tn IDR mn
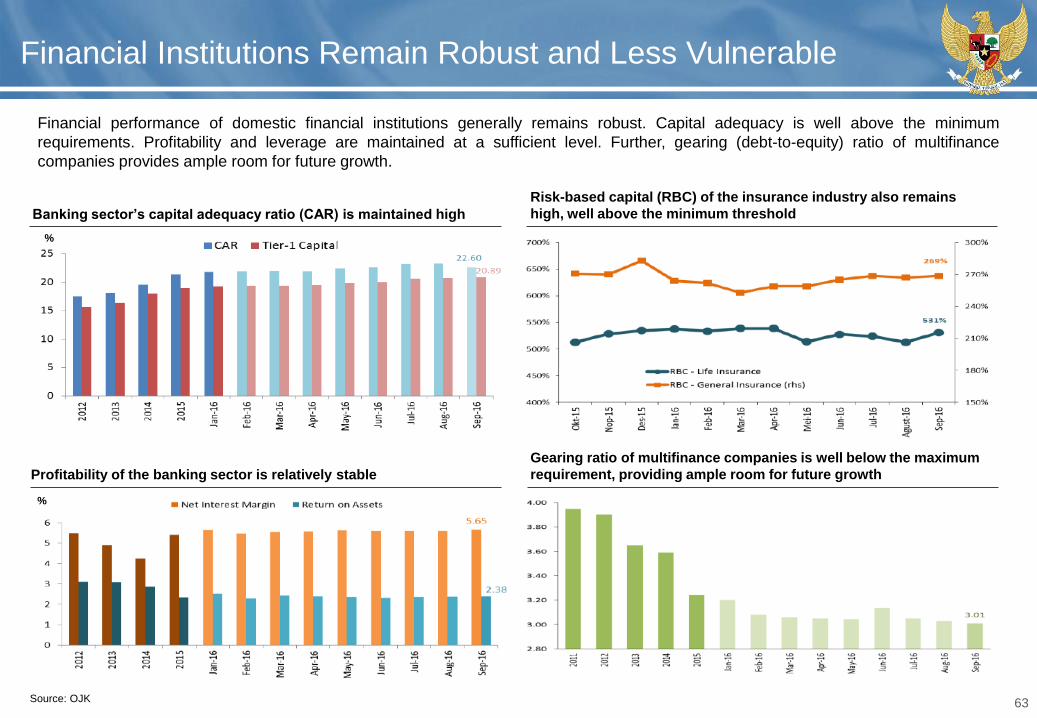
63
Financial Institutions Remain Robust and Less Vulnerable
Source: OJK
Banking sector’s capital adequacy ratio (CAR) is maintained high
Risk-based capital (RBC) of the insurance industry also remains
high, well above the minimum threshold
Gearing ratio of multifinance companies is well below the maximum
requirement, providing ample room for future growthProfitability of the banking sector is relatively stable
Financial performance of domestic financial institutions generally remains robust. Capital adequacy is well above the minimum
requirements. Profitability and leverage are maintained at a sufficient level. Further, gearing (debt-to-equity) ratio of multifinance
companies provides ample room for future growth.
%
%
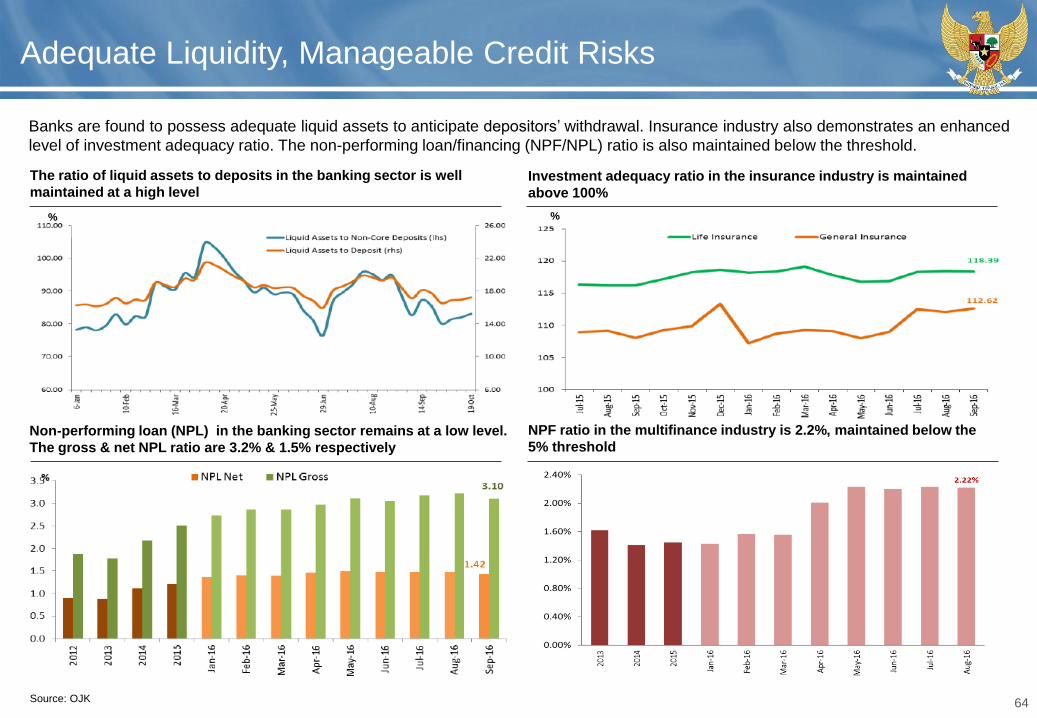
64
Adequate Liquidity, Manageable Credit Risks
Source: OJK
Banks are found to possess adequate liquid assets to anticipate depositors’ withdrawal. Insurance industry also demonstrates an enhanced
level of investment adequacy ratio. The non-performing loan/financing (NPF/NPL) ratio is also maintained below the threshold.
The ratio of liquid assets to deposits in the banking sector is well
maintained at a high level
Non-performing loan (NPL) in the banking sector remains at a low level.
The gross & net NPL ratio are 3.2% & 1.5% respectively
NPF ratio in the multifinance industry is 2.2%, maintained below the
5% threshold
Investment adequacy ratio in the insurance industry is maintained
above 100%
% %
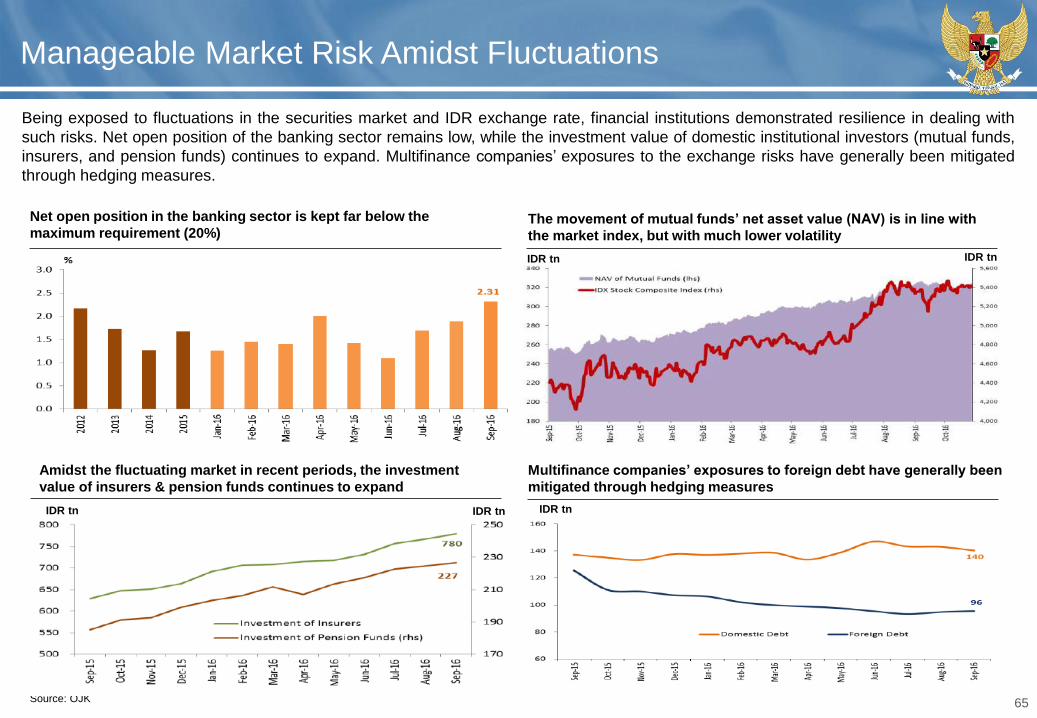
65
Manageable Market Risk Amidst Fluctuations
Source: OJK
Being exposed to fluctuations in the securities market and IDR exchange rate, financial institutions demonstrated resilience in dealing with
such risks. Net open position of the banking sector remains low, while the investment value of domestic institutional investors (mutual funds,
insurers, and pension funds) continues to expand. Multifinance companies’ exposures to the exchange risks have generally been mitigated
through hedging measures.
Net open position in the banking sector is kept far below the
maximum requirement (20%)
Amidst the fluctuating market in recent periods, the investment
value of insurers & pension funds continues to expand
Multifinance companies’ exposures to foreign debt have generally been
mitigated through hedging measures
The movement of mutual funds’ net asset value (NAV) is in line with
the market index, but with much lower volatility
IDR tn
IDR tnIDR tnIDR tn
IDR tn
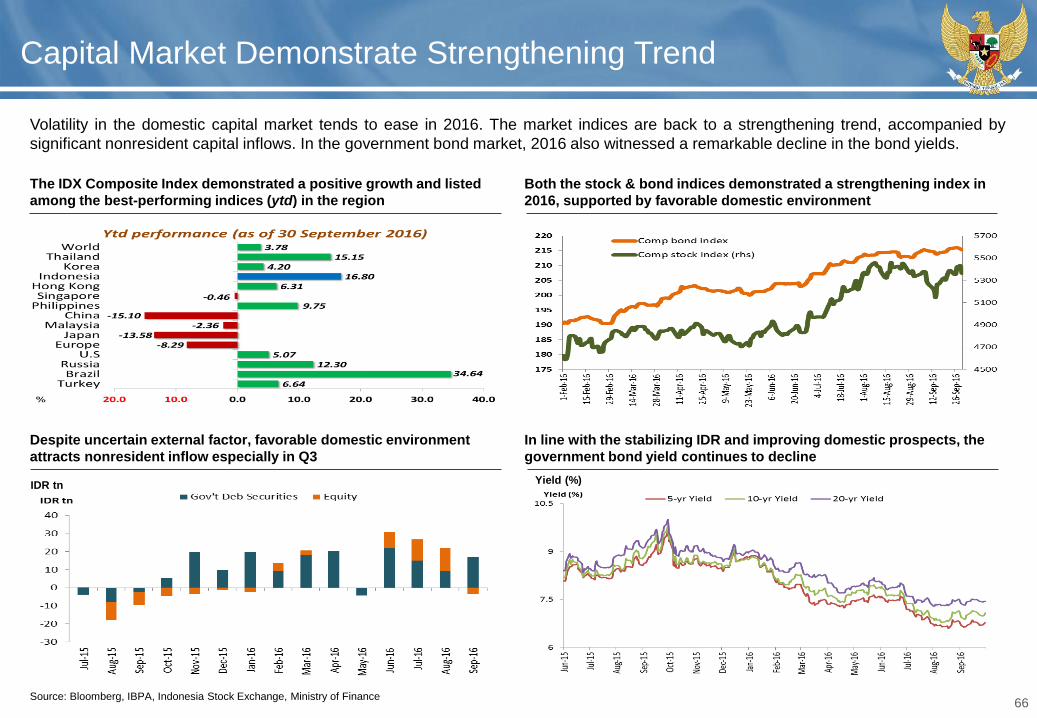
66
Capital Market Demonstrate Strengthening Trend
Volatility in the domestic capital market tends to ease in 2016. The market indices are back to a strengthening trend, accompanied by
significant nonresident capital inflows. In the government bond market, 2016 also witnessed a remarkable decline in the bond yields.
Source: Bloomberg, IBPA, Indonesia Stock Exchange, Ministry of Finance
Both the stock & bond indices demonstrated a strengthening index in
2016, supported by favorable domestic environment
In line with the stabilizing IDR and improving domestic prospects, the
government bond yield continues to decline
Despite uncertain external factor, favorable domestic environment
attracts nonresident inflow especially in Q3
The IDX Composite Index demonstrated a positive growth and listed
among the best-performing indices (ytd) in the region
Yield (%)IDR tn
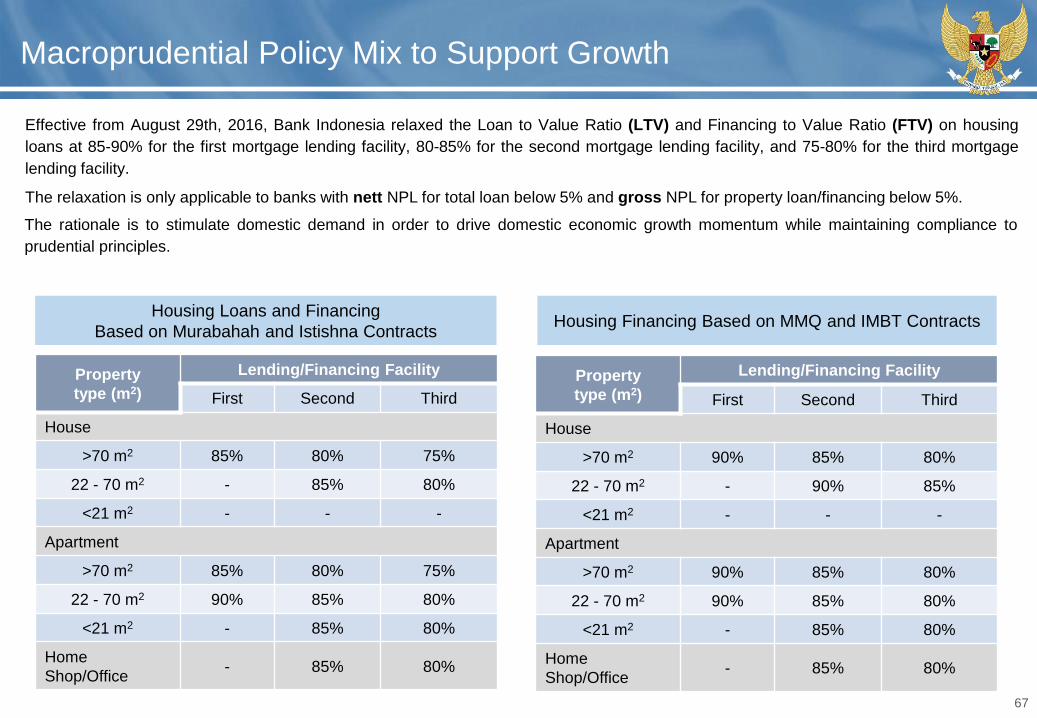
67
Macroprudential Policy Mix to Support Growth
Effective from August 29th, 2016, Bank Indonesia relaxed the Loan to Value Ratio (LTV) and Financing to Value Ratio (FTV) on housing
loans at 85-90% for the first mortgage lending facility, 80-85% for the second mortgage lending facility, and 75-80% for the third mortgage
lending facility.
Housing Loans and Financing
Based on Murabahah and Istishna Contracts
Property
type (m2)
Lending/Financing Facility
First Second Third
House
>70 m2 85% 80% 75%
22 - 70 m2 - 85% 80%
<21 m2 - - -
Apartment
>70 m2 85% 80% 75%
22 - 70 m2 90% 85% 80%
<21 m2 - 85% 80%
Home
Shop/Office- 85% 80%
Housing Financing Based on MMQ and IMBT Contracts
Property
type (m2)
Lending/Financing Facility
First Second Third
House
>70 m2 90% 85% 80%
22 - 70 m2 - 90% 85%
<21 m2 - - -
Apartment
>70 m2 90% 85% 80%
22 - 70 m2 90% 85% 80%
<21 m2 - 85% 80%
Home
Shop/Office- 85% 80%
The relaxation is only applicable to banks with nett NPL for total loan below 5% and gross NPL for property loan/financing below 5%.
The rationale is to stimulate domestic demand in order to drive domestic economic growth momentum while maintaining compliance to
prudential principles.
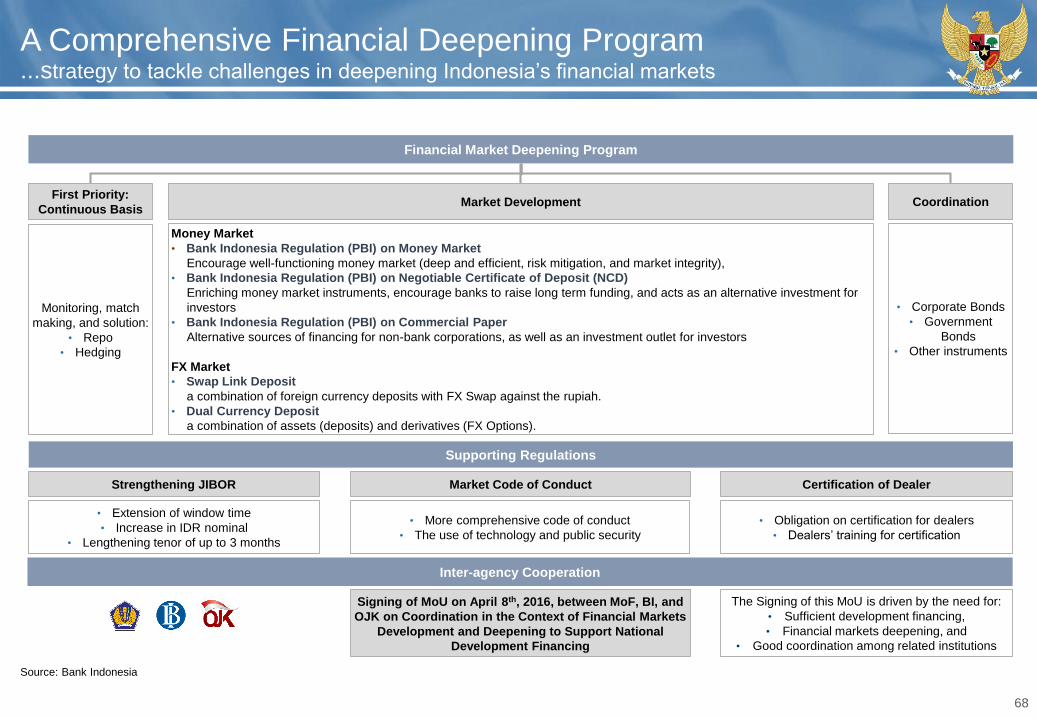
68
A Comprehensive Financial Deepening Program...strategy to tackle challenges in deepening Indonesia’s financial markets
Source: Bank Indonesia
Financial Market Deepening Program
First Priority:
Continuous BasisMarket Development Coordination
Monitoring, match
making, and solution:
• Repo
• Hedging
Money Market
• Bank Indonesia Regulation (PBI) on Money Market
Encourage well-functioning money market (deep and efficient, risk mitigation, and market integrity),
• Bank Indonesia Regulation (PBI) on Negotiable Certificate of Deposit (NCD)
Enriching money market instruments, encourage banks to raise long term funding, and acts as an alternative investment for
investors
• Bank Indonesia Regulation (PBI) on Commercial Paper
Alternative sources of financing for non-bank corporations, as well as an investment outlet for investors
FX Market
• Swap Link Deposit
a combination of foreign currency deposits with FX Swap against the rupiah.
• Dual Currency Deposit
a combination of assets (deposits) and derivatives (FX Options).
• Corporate Bonds
• Government
Bonds
• Other instruments
Supporting Regulations
Market Code of Conduct Certification of DealerStrengthening JIBOR
• More comprehensive code of conduct
• The use of technology and public security
• Obligation on certification for dealers
• Dealers’ training for certification
• Extension of window time
• Increase in IDR nominal
• Lengthening tenor of up to 3 months
Inter-agency Cooperation
Signing of MoU on April 8th, 2016, between MoF, BI, and
OJK on Coordination in the Context of Financial Markets
Development and Deepening to Support National
Development Financing
The Signing of this MoU is driven by the need for:
• Sufficient development financing,
• Financial markets deepening, and
• Good coordination among related institutions
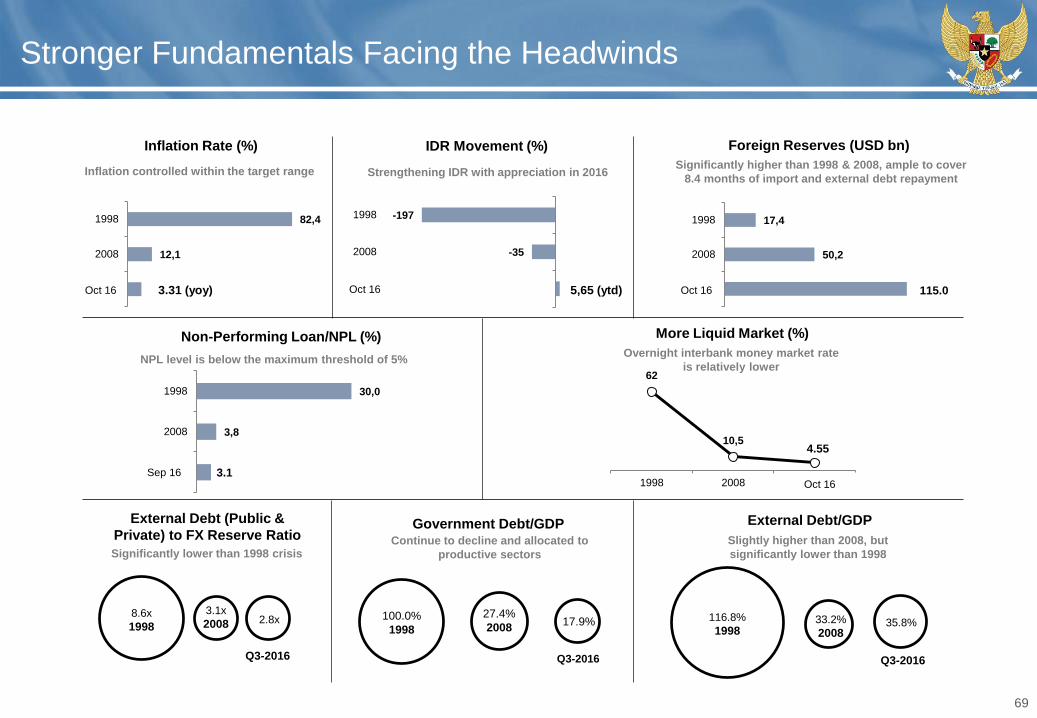
69
Stronger Fundamentals Facing the Headwinds
-197
-35
5,62
1998
2008
Sep 16
82,4
12,1
6,8
1998
2008
Sep-15
30,0
3,8
2,8
1998
2008
Agu-15
17,4
50,2
1998
2008
Sep-15
Inflation Rate (%) IDR Movement (%)
Non-Performing Loan/NPL (%)
Government Debt/GDP
Foreign Reserves (USD bn)
100.0%
1998
27.4%
200817.9%
Q3-2016
8.6x
1998
3.1x
2008 2.8x
Q3-2016
116.8%
199833.2%
200835.8%
Q3-2016
More Liquid Market (%)
External Debt (Public &
Private) to FX Reserve RatioExternal Debt/GDP
Inflation controlled within the target range Strengthening IDR with appreciation in 2016
NPL level is below the maximum threshold of 5%
Continue to decline and allocated to
productive sectors
Significantly higher than 1998 & 2008, ample to cover
8.4 months of import and external debt repayment
Significantly lower than 1998 crisisSlightly higher than 2008, but
significantly lower than 1998
Oct 16 115.0Oct 16 3.31 (yoy)
Sep 16 3.1
62
10,55,7
1998 2008 Jul-15
Overnight interbank money market rate
is relatively lower
Oct 16
4.55
5,65 (ytd)Oct 16
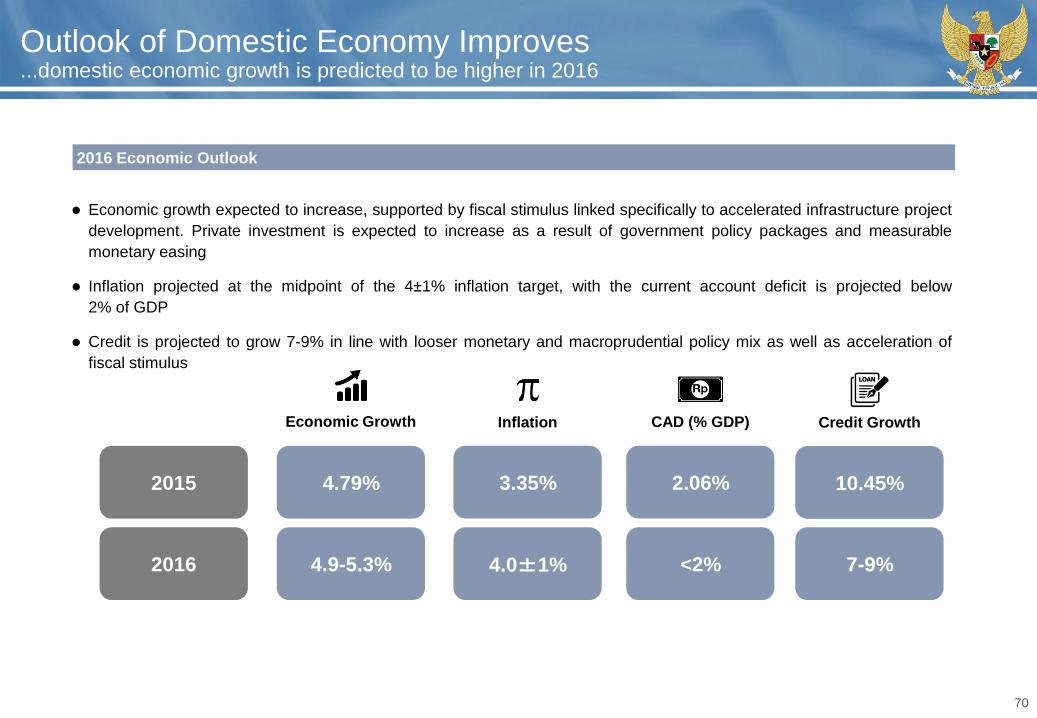
70
Outlook of Domestic Economy Improves...domestic economic growth is predicted to be higher in 2016
2016 Economic Outlook
Economic growth expected to increase, supported by fiscal stimulus linked specifically to accelerated infrastructure project
development. Private investment is expected to increase as a result of government policy packages and measurable
monetary easing
Inflation projected at the midpoint of the 4±1% inflation target, with the current account deficit is projected below
2% of GDP
Credit is projected to grow 7-9% in line with looser monetary and macroprudential policy mix as well as acceleration of
fiscal stimulus
2015
2016
4.79%
Economic Growth
4.9-5.3%
Inflation
3.35%
4.0±1%
CAD (% GDP)
2.06%
<2%
Credit Growth
10.45%
7-9%
Strong Commitment on Acceleration of Infrastructure Provision
Progressive Infrastructure Development:6
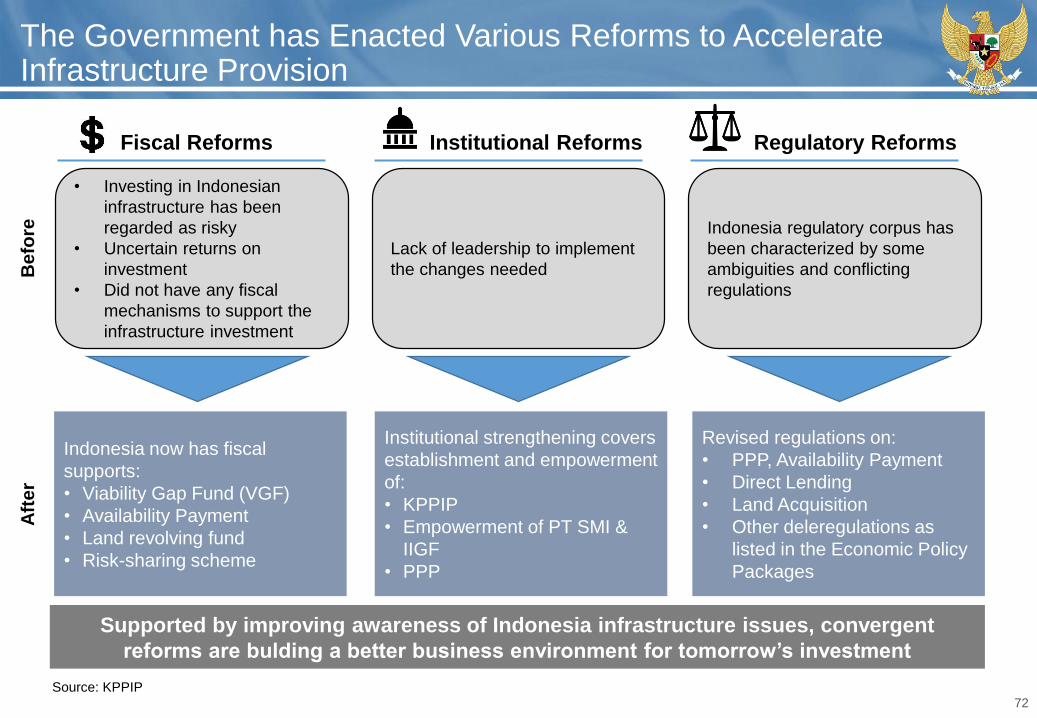
72
The Government has Enacted Various Reforms to Accelerate Infrastructure Provision
• Investing in Indonesian
infrastructure has been
regarded as risky
• Uncertain returns on
investment
• Did not have any fiscal
mechanisms to support the
infrastructure investment
Lack of leadership to implement
the changes needed
Indonesia regulatory corpus has
been characterized by some
ambiguities and conflicting
regulations
Fiscal Reforms Institutional Reforms Regulatory Reforms
Indonesia now has fiscal
supports:
• Viability Gap Fund (VGF)
• Availability Payment
• Land revolving fund
• Risk-sharing scheme
Revised regulations on:
• PPP, Availability Payment
• Direct Lending
• Land Acquisition
• Other deleregulations as
listed in the Economic Policy
Packages
Institutional strengthening covers
establishment and empowerment
of:
• KPPIP
• Empowerment of PT SMI &
IIGF
• PPP
Supported by improving awareness of Indonesia infrastructure issues, convergent
reforms are bulding a better business environment for tomorrow’s investment
Be
fore
Aft
er
Source: KPPIP
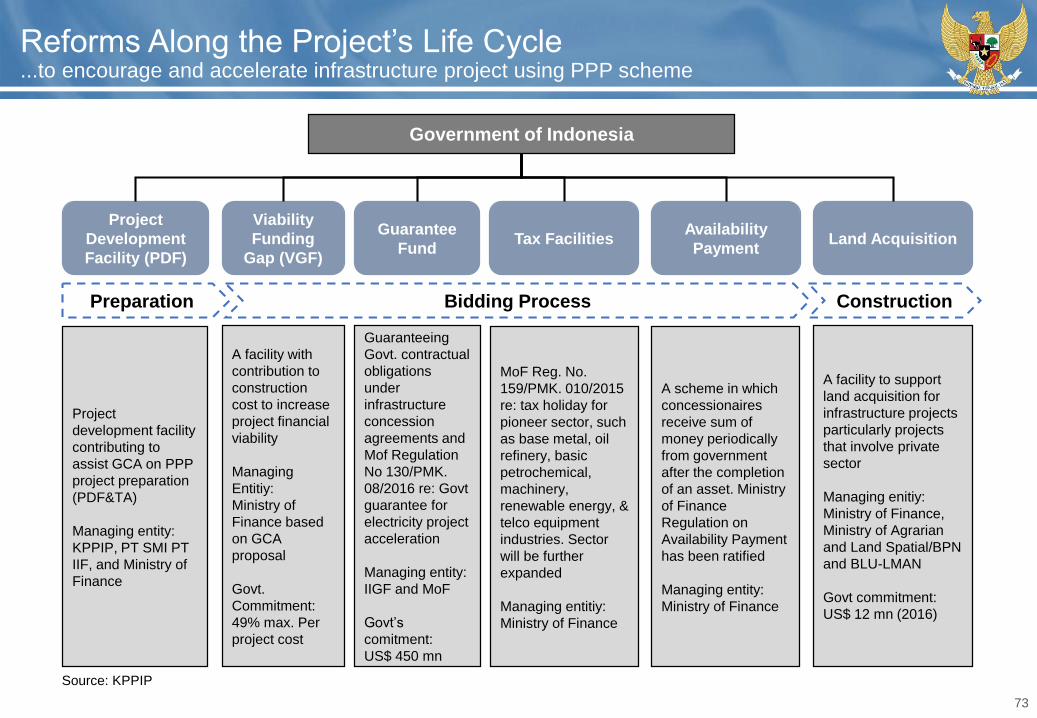
73
Reforms Along the Project’s Life Cycle...to encourage and accelerate infrastructure project using PPP scheme
Government of Indonesia
Project
Development
Facility (PDF)
Viability
Funding
Gap (VGF)
Guarantee
FundTax Facilities
Availability
PaymentLand Acquisition
Preparation Bidding Process Construction
Project
development facility
contributing to
assist GCA on PPP
project preparation
(PDF&TA)
Managing entity:
KPPIP, PT SMI PT
IIF, and Ministry of
Finance
A facility with
contribution to
construction
cost to increase
project financial
viability
Managing
Entitiy:
Ministry of
Finance based
on GCA
proposal
Govt.
Commitment:
49% max. Per
project cost
Guaranteeing
Govt. contractual
obligations
under
infrastructure
concession
agreements and
Mof Regulation
No 130/PMK.
08/2016 re: Govt
guarantee for
electricity project
acceleration
Managing entity:
IIGF and MoF
Govt’s
comitment:
US$ 450 mn
MoF Reg. No.
159/PMK. 010/2015
re: tax holiday for
pioneer sector, such
as base metal, oil
refinery, basic
petrochemical,
machinery,
renewable energy, &
telco equipment
industries. Sector
will be further
expanded
Managing entitiy:
Ministry of Finance
A scheme in which
concessionaires
receive sum of
money periodically
from government
after the completion
of an asset. Ministry
of Finance
Regulation on
Availability Payment
has been ratified
Managing entity:
Ministry of Finance
A facility to support
land acquisition for
infrastructure projects
particularly projects
that involve private
sector
Managing enitiy:
Ministry of Finance,
Ministry of Agrarian
and Land Spatial/BPN
and BLU-LMAN
Govt commitment:
US$ 12 mn (2016)
Source: KPPIP
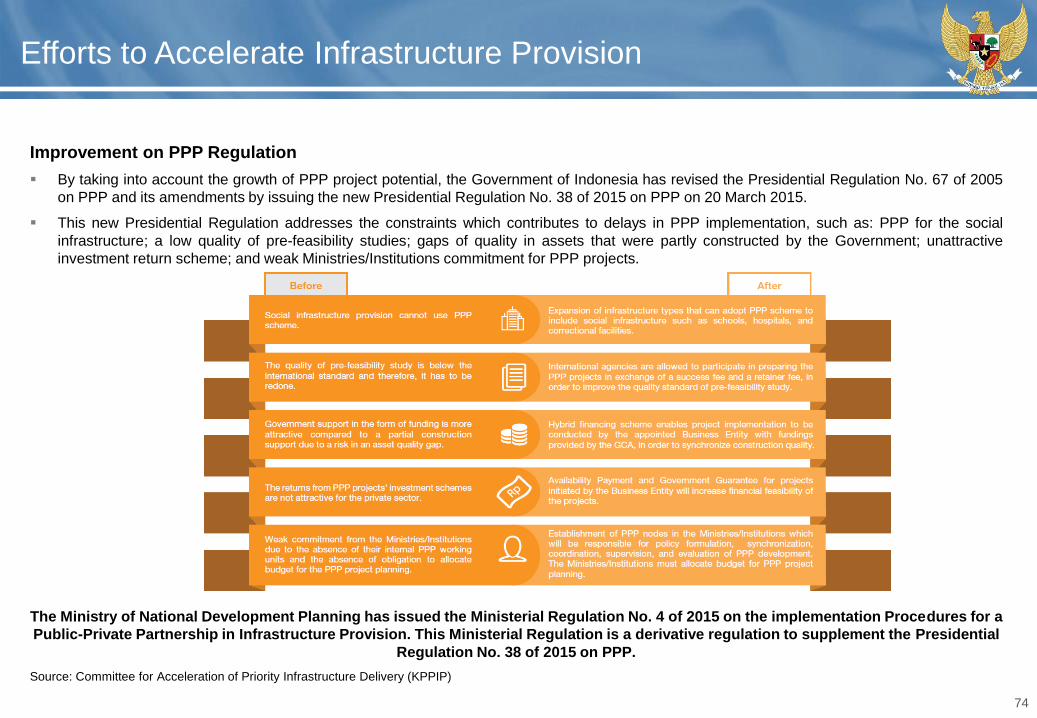
74
Efforts to Accelerate Infrastructure Provision
Improvement on PPP Regulation
By taking into account the growth of PPP project potential, the Government of Indonesia has revised the Presidential Regulation No. 67 of 2005
on PPP and its amendments by issuing the new Presidential Regulation No. 38 of 2015 on PPP on 20 March 2015.
This new Presidential Regulation addresses the constraints which contributes to delays in PPP implementation, such as: PPP for the social
infrastructure; a low quality of pre-feasibility studies; gaps of quality in assets that were partly constructed by the Government; unattractive
investment return scheme; and weak Ministries/Institutions commitment for PPP projects.
The Ministry of National Development Planning has issued the Ministerial Regulation No. 4 of 2015 on the implementation Procedures for a
Public-Private Partnership in Infrastructure Provision. This Ministerial Regulation is a derivative regulation to supplement the Presidential
Regulation No. 38 of 2015 on PPP.
Source: Committee for Acceleration of Priority Infrastructure Delivery (KPPIP)
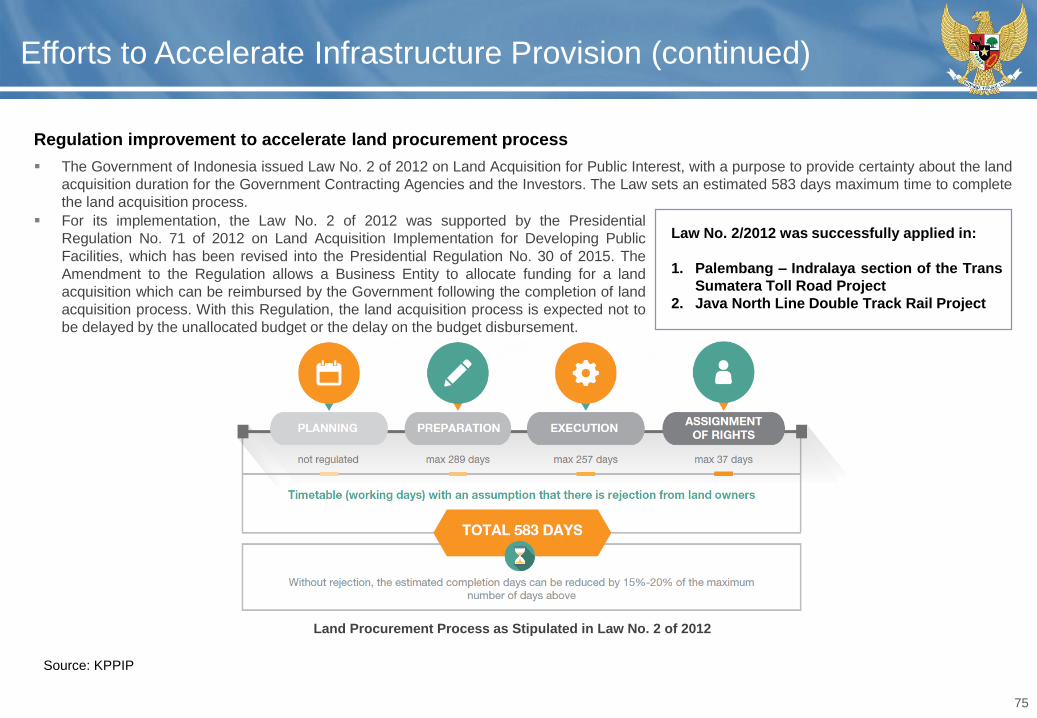
75
Efforts to Accelerate Infrastructure Provision (continued)
Regulation improvement to accelerate land procurement process
The Government of Indonesia issued Law No. 2 of 2012 on Land Acquisition for Public Interest, with a purpose to provide certainty about the land
acquisition duration for the Government Contracting Agencies and the Investors. The Law sets an estimated 583 days maximum time to complete
the land acquisition process.
For its implementation, the Law No. 2 of 2012 was supported by the Presidential
Regulation No. 71 of 2012 on Land Acquisition Implementation for Developing Public
Facilities, which has been revised into the Presidential Regulation No. 30 of 2015. The
Amendment to the Regulation allows a Business Entity to allocate funding for a land
acquisition which can be reimbursed by the Government following the completion of land
acquisition process. With this Regulation, the land acquisition process is expected not to
be delayed by the unallocated budget or the delay on the budget disbursement.
Land Procurement Process as Stipulated in Law No. 2 of 2012
Source: KPPIP
Law No. 2/2012 was successfully applied in:
1. Palembang – Indralaya section of the Trans
Sumatera Toll Road Project
2. Java North Line Double Track Rail Project
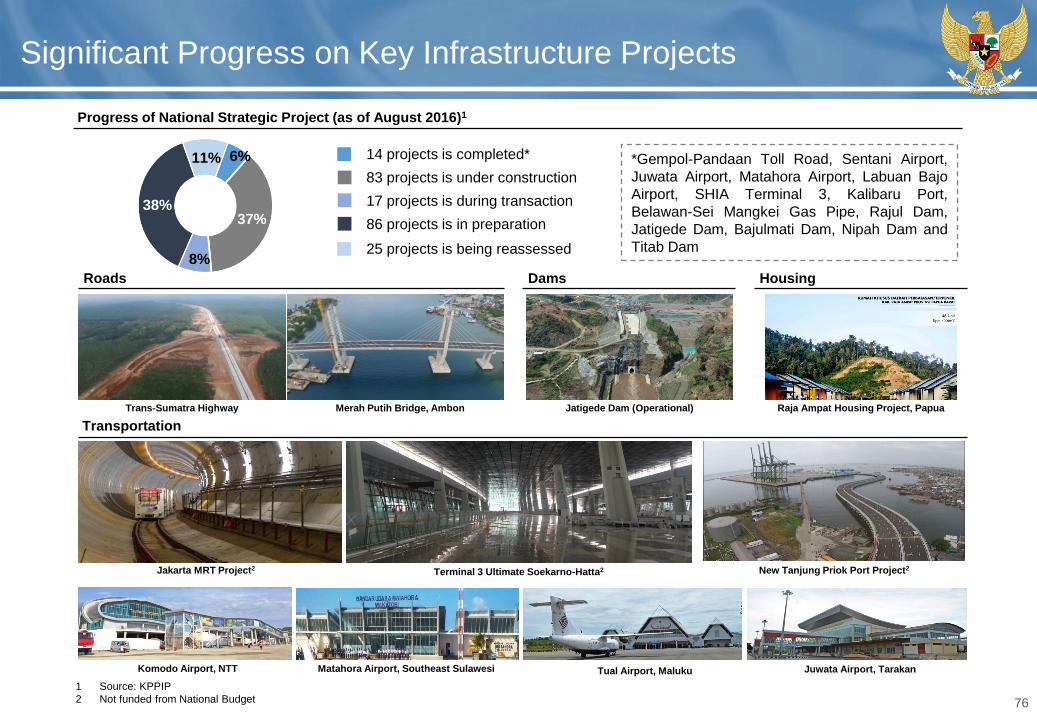
76
Significant Progress on Key Infrastructure Projects
Roads Dams Housing
Trans-Sumatra Highway Merah Putih Bridge, Ambon Jatigede Dam (Operational) Raja Ampat Housing Project, Papua
Transportation
Jakarta MRT Project2 Terminal 3 Ultimate Soekarno-Hatta2 New Tanjung Priok Port Project2
Komodo Airport, NTT Matahora Airport, Southeast Sulawesi Tual Airport, Maluku Juwata Airport, Tarakan
1 Source: KPPIP
2 Not funded from National Budget
Progress of National Strategic Project (as of August 2016)1
38%37%
11% 6%
8%25 projects is being reassessed
14 projects is completed*
83 projects is under construction
17 projects is during transaction
86 projects is in preparation
*Gempol-Pandaan Toll Road, Sentani Airport,
Juwata Airport, Matahora Airport, Labuan Bajo
Airport, SHIA Terminal 3, Kalibaru Port,
Belawan-Sei Mangkei Gas Pipe, Rajul Dam,
Jatigede Dam, Bajulmati Dam, Nipah Dam and
Titab Dam
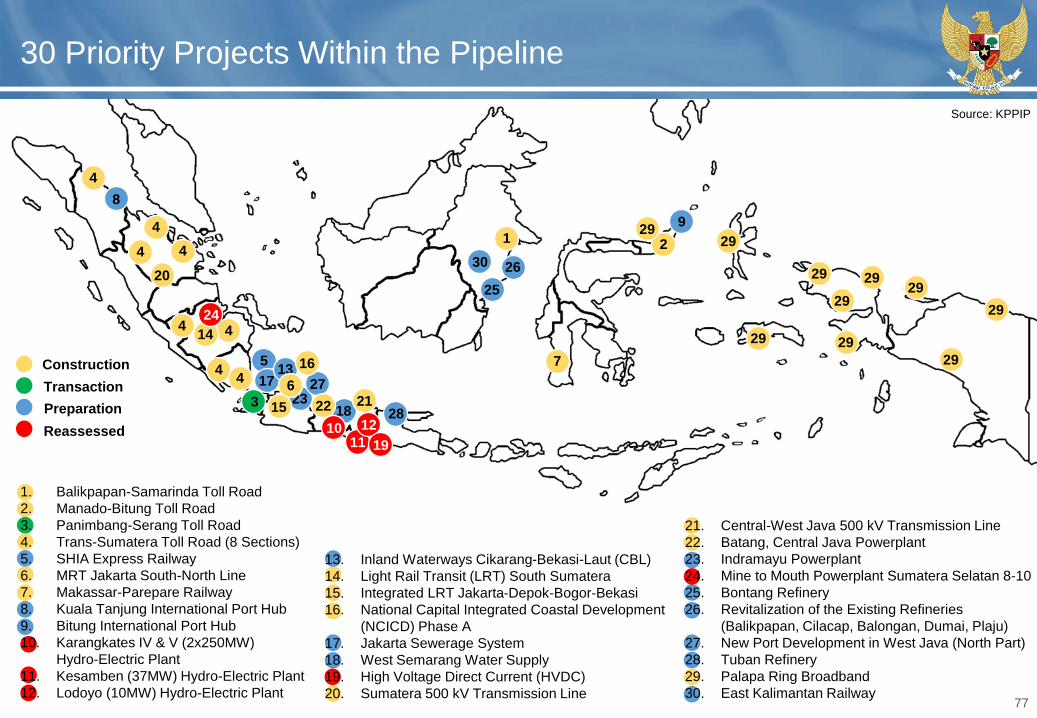
77
30 Priority Projects Within the Pipeline
Source: KPPIP
1. Balikpapan-Samarinda Toll Road
2. Manado-Bitung Toll Road
3. Panimbang-Serang Toll Road
4. Trans-Sumatera Toll Road (8 Sections)
5. SHIA Express Railway
6. MRT Jakarta South-North Line
7. Makassar-Parepare Railway
8. Kuala Tanjung International Port Hub
9. Bitung International Port Hub
10. Karangkates IV & V (2x250MW)
Hydro-Electric Plant
11. Kesamben (37MW) Hydro-Electric Plant
12. Lodoyo (10MW) Hydro-Electric Plant
13. Inland Waterways Cikarang-Bekasi-Laut (CBL)
14. Light Rail Transit (LRT) South Sumatera
15. Integrated LRT Jakarta-Depok-Bogor-Bekasi
16. National Capital Integrated Coastal Development
(NCICD) Phase A
17. Jakarta Sewerage System
18. West Semarang Water Supply
19. High Voltage Direct Current (HVDC)
20. Sumatera 500 kV Transmission Line
21. Central-West Java 500 kV Transmission Line
22. Batang, Central Java Powerplant
23. Indramayu Powerplant
24. Mine to Mouth Powerplant Sumatera Selatan 8-10
25. Bontang Refinery
26. Revitalization of the Existing Refineries
(Balikpapan, Cilacap, Balongan, Dumai, Plaju)
27. New Port Development in West Java (North Part)
28. Tuban Refinery
29. Palapa Ring Broadband
30. East Kalimantan Railway
Construction
Transaction
Preparation
Reassessed
8
5
9
18
1713
23
25
26
27
28
30
16
10
1
3
2
4
6
7
4
44
44
44
15
14
20
2122
29
29
29
29 29
29
29
29
2929
11
12
19
24
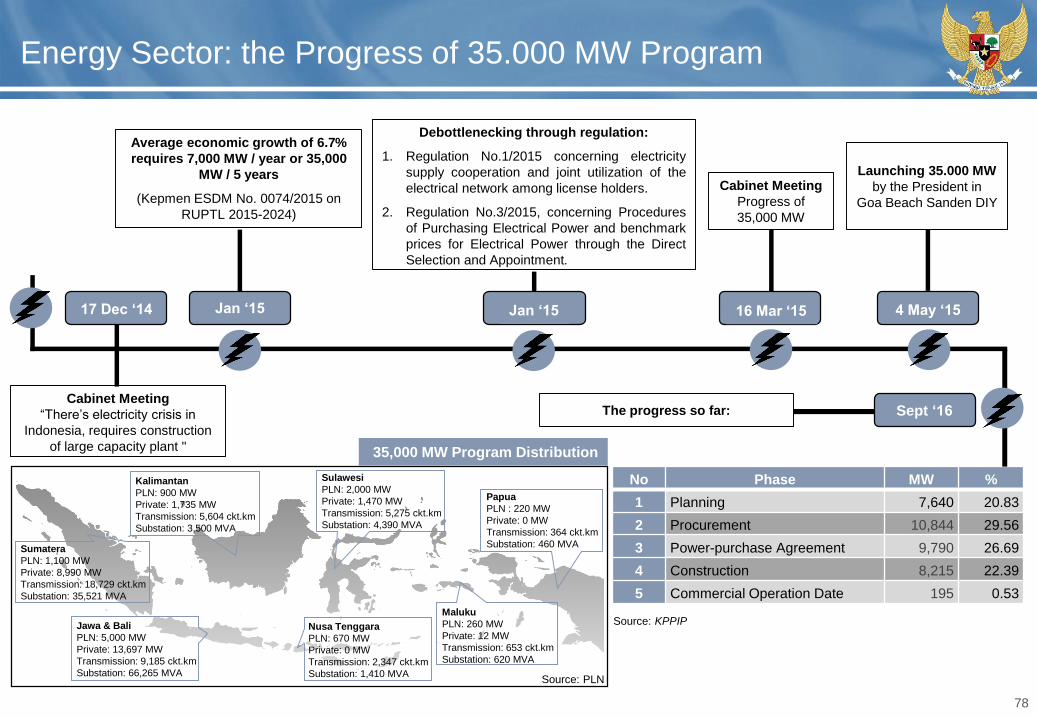
78
Energy Sector: the Progress of 35.000 MW Program
No Phase MW %
1 Planning 7,640 20.83
2 Procurement 10,844 29.56
3 Power-purchase Agreement 9,790 26.69
4 Construction 8,215 22.39
5 Commercial Operation Date 195 0.53
17 Dec ‘14
Cabinet Meeting
“There’s electricity crisis in
Indonesia, requires construction
of large capacity plant "
Jan ‘15
Average economic growth of 6.7%
requires 7,000 MW / year or 35,000
MW / 5 years
(Kepmen ESDM No. 0074/2015 on
RUPTL 2015-2024)
Jan ‘15
Debottlenecking through regulation:
1. Regulation No.1/2015 concerning electricity
supply cooperation and joint utilization of the
electrical network among license holders.
2. Regulation No.3/2015, concerning Procedures
of Purchasing Electrical Power and benchmark
prices for Electrical Power through the Direct
Selection and Appointment.
16 Mar ‘15 4 May ‘15
Sept ‘16
Cabinet Meeting
Progress of
35,000 MW
Launching 35.000 MW
by the President in
Goa Beach Sanden DIY
The progress so far:
Source: KPPIP
Sulawesi
PLN: 2,000 MW
Private: 1,470 MW
Transmission: 5,275 ckt.km
Substation: 4,390 MVA
Maluku
PLN: 260 MW
Private: 12 MW
Transmission: 653 ckt.km
Substation: 620 MVA
Papua
PLN : 220 MW
Private: 0 MW
Transmission: 364 ckt.km
Substation: 460 MVA
Kalimantan
PLN: 900 MW
Private: 1,735 MW
Transmission: 5,604 ckt.km
Substation: 3,500 MVA
Nusa Tenggara
PLN: 670 MW
Private: 0 MW
Transmission: 2,347 ckt.km
Substation: 1,410 MVA
Sumatera
PLN: 1,100 MW
Private: 8,990 MW
Transmission: 18,729 ckt.km
Substation: 35,521 MVA
Jawa & Bali
PLN: 5,000 MW
Private: 13,697 MW
Transmission: 9,185 ckt.km
Substation: 66,265 MVA
35,000 MW Program Distribution
Source: PLN
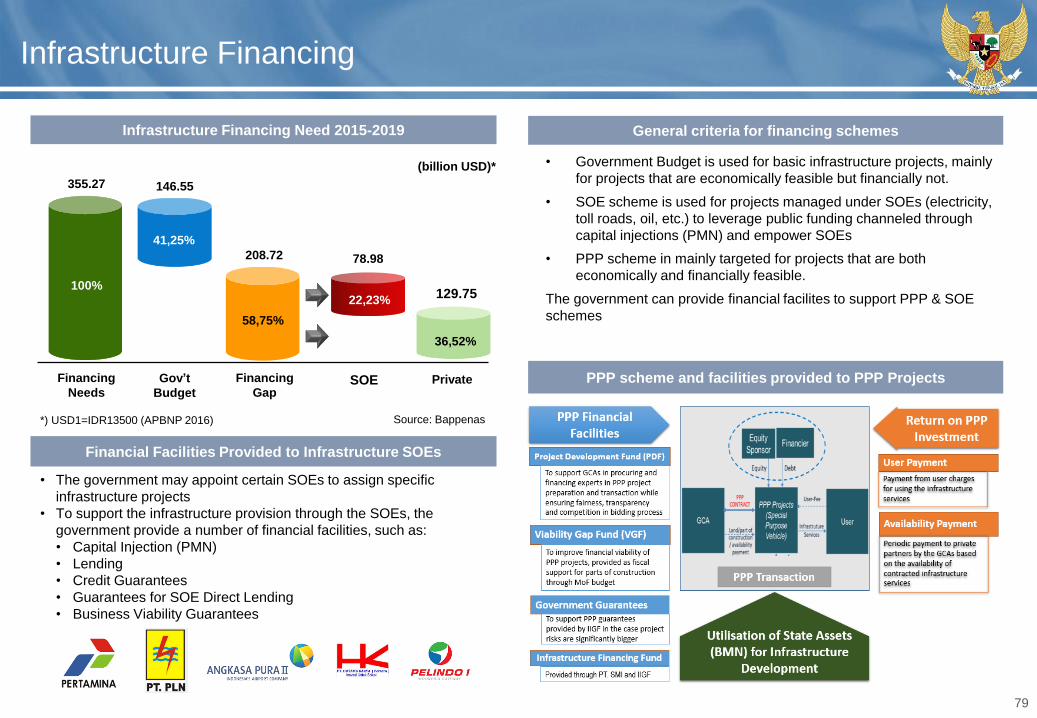
79
Infrastructure Financing
79
Source: Bappenas
129.75
SOE Private
208.72 78.98
Financing
Needs
Gov’t
Budget
Financing
Gap
355.27 146.55
(billion USD)*
41,25%
58,75%
22,23%
36,52%
100%
Infrastructure Financing Need 2015-2019 General criteria for financing schemes
• Government Budget is used for basic infrastructure projects, mainly
for projects that are economically feasible but financially not.
• SOE scheme is used for projects managed under SOEs (electricity,
toll roads, oil, etc.) to leverage public funding channeled through
capital injections (PMN) and empower SOEs
• PPP scheme in mainly targeted for projects that are both
economically and financially feasible.
The government can provide financial facilites to support PPP & SOE
schemes
*) USD1=IDR13500 (APBNP 2016)
PPP scheme and facilities provided to PPP Projects
• The government may appoint certain SOEs to assign specific
infrastructure projects
• To support the infrastructure provision through the SOEs, the
government provide a number of financial facilities, such as:
• Capital Injection (PMN)
• Lending
• Credit Guarantees
• Guarantees for SOE Direct Lending
• Business Viability Guarantees
Financial Facilities Provided to Infrastructure SOEs
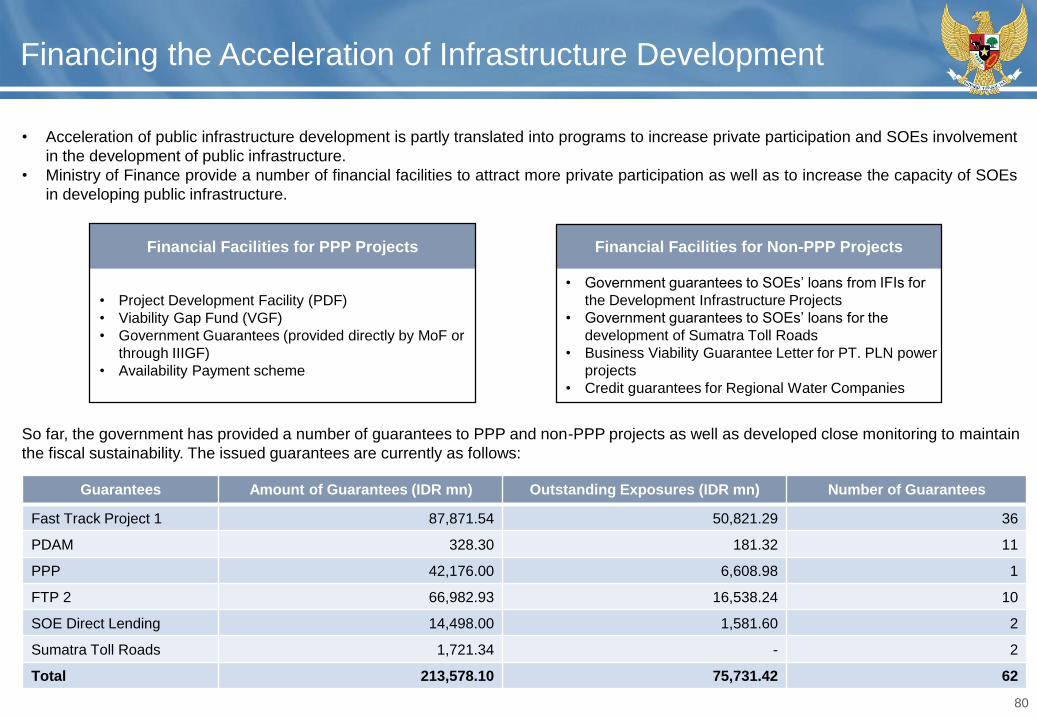
80
Financing the Acceleration of Infrastructure Development
• Acceleration of public infrastructure development is partly translated into programs to increase private participation and SOEs involvement
in the development of public infrastructure.
• Ministry of Finance provide a number of financial facilities to attract more private participation as well as to increase the capacity of SOEs
in developing public infrastructure.
Guarantees Amount of Guarantees (IDR mn) Outstanding Exposures (IDR mn) Number of Guarantees
Fast Track Project 1 87,871.54 50,821.29 36
PDAM 328.30 181.32 11
PPP 42,176.00 6,608.98 1
FTP 2 66,982.93 16,538.24 10
SOE Direct Lending 14,498.00 1,581.60 2
Sumatra Toll Roads 1,721.34 - 2
Total 213,578.10 75,731.42 62
Financial Facilities for PPP Projects Financial Facilities for Non-PPP Projects
• Project Development Facility (PDF)
• Viability Gap Fund (VGF)
• Government Guarantees (provided directly by MoF or
through IIIGF)
• Availability Payment scheme
• Government guarantees to SOEs’ loans from IFIs for
the Development Infrastructure Projects
• Government guarantees to SOEs’ loans for the
development of Sumatra Toll Roads
• Business Viability Guarantee Letter for PT. PLN power
projects
• Credit guarantees for Regional Water Companies
So far, the government has provided a number of guarantees to PPP and non-PPP projects as well as developed close monitoring to maintain
the fiscal sustainability. The issued guarantees are currently as follows:
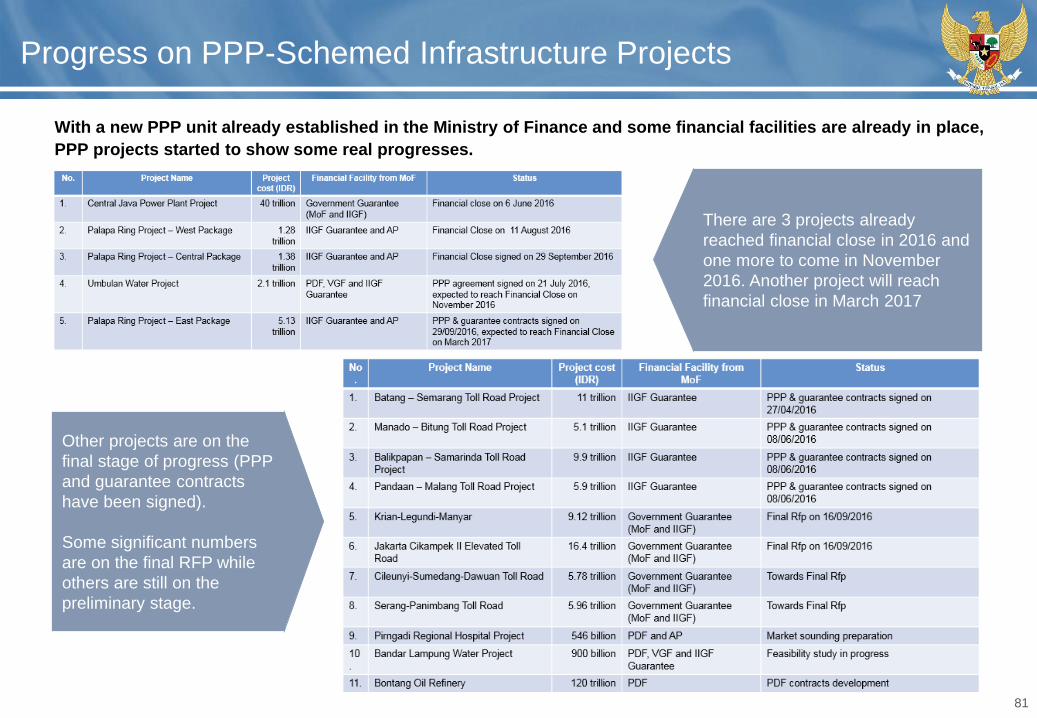
81
Progress on PPP-Schemed Infrastructure Projects
With a new PPP unit already established in the Ministry of Finance and some financial facilities are already in place,
PPP projects started to show some real progresses.
There are 3 projects already
reached financial close in 2016 and
one more to come in November
2016. Another project will reach
financial close in March 2017
Other projects are on the
final stage of progress (PPP
and guarantee contracts
have been signed).
Some significant numbers
are on the final RFP while
others are still on the
preliminary stage.
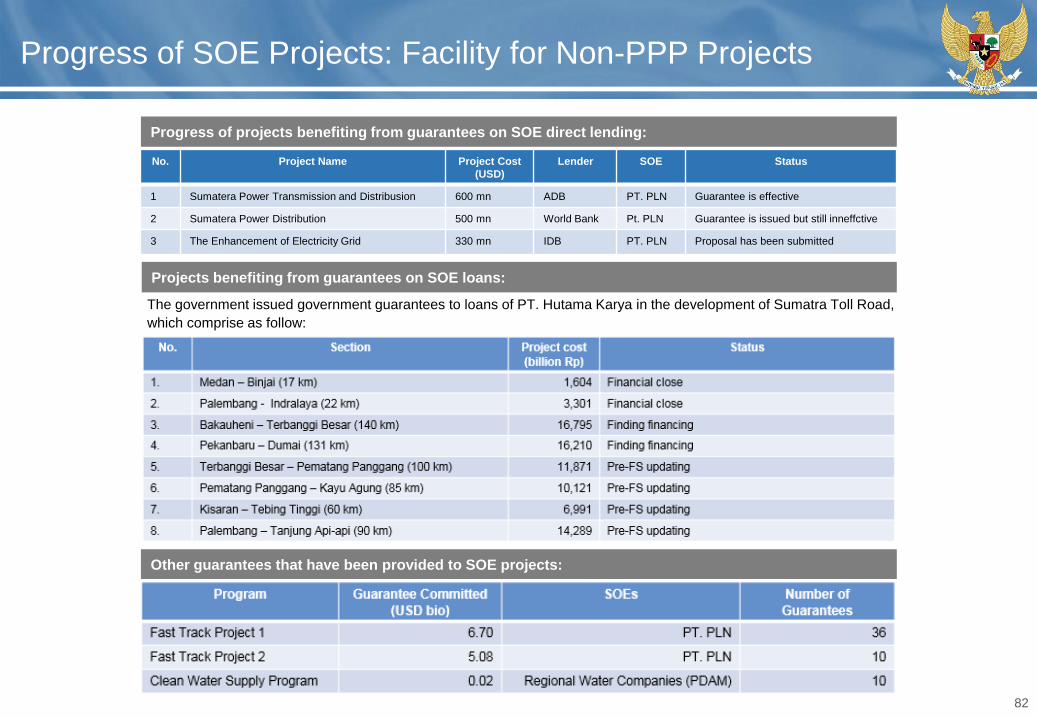
82
Progress of SOE Projects: Facility for Non-PPP Projects
The government issued government guarantees to loans of PT. Hutama Karya in the development of Sumatra Toll Road,
which comprise as follow:
Progress of projects benefiting from guarantees on SOE direct lending:
Projects benefiting from guarantees on SOE loans:
Other guarantees that have been provided to SOE projects:
No. Project Name Project Cost
(USD)
Lender SOE Status
1 Sumatera Power Transmission and Distribusion 600 mn ADB PT. PLN Guarantee is effective
2 Sumatera Power Distribution 500 mn World Bank Pt. PLN Guarantee is issued but still inneffctive
3 The Enhancement of Electricity Grid 330 mn IDB PT. PLN Proposal has been submitted