Synergy. Collaboration. Opportunities.
168
ANNUAL REPORT 2019 Synergy. Collaboration. Opportunities.
Transcript of Synergy. Collaboration. Opportunities.

ANNUAL REPORT
2019
Synergy.Collaboration. Opportunities.


CONTENTSABOUT METROBANK CARD CORPORATION 2
FINANCIAL HIGHLIGHTS 4
MESSAGE FROM THE CHAIRMAN 7
PRESIDENT’S REPORT 8
PRODUCTS AND SERVICES 10
CORPORATE GOVERNANCE 26
RISK MANAGEMENT 38
FINANCIAL STATEMENTS SUMMARY 49
CORPORATE SOCIAL RESPONSIBILITY 50
LEADERSHIP 56
BOARD OF DIRECTORS 58
BOARD OFFICERS 60
ORGANIZATIONAL STRUCTURE 61
MANAGEMENT COMMITTEE 62
SENIOR VICE PRESIDENTS 64
FIRST VICE PRESIDENTS 65
VICE PRESIDENTS 66
SENIOR ASSISTANT VICE PRESIDENTS 67
ASSISTANT VICE PRESIDENTS 69
CORPORATE INFORMATION 72
FINANCIAL STATEMENTS 74
Metrobank Card Corporation 1
2 Metrobank Card Corporation
Metrobank Card Corporation (A Finance Company and General Insurance Agency) [MCC] was established in August 1985, known then as Unibancard Corporation. Its maiden product was called Unicard, a single currency credit card accepted in key establishments in the Philippines. Over the years, Unicard evolved from a locally accepted card to an internationally recognized credit card when it rode on the Mastercard scheme in 1994 and the Visa scheme in 1998.
MCC changed its name to Metrobank Card Corporation after a merger with AB Card and Solid Card on June 4, 2002. In 2003, a joint venture was formed between Metropolitan Bank and Trust Company (Metrobank) and Australia and New Zealand Funds Pty. Ltd. (ANZ), holding 60% and 40% stake of the business, respectively. The partnership has created a lot of value for both parties as it transformed MCC into a market leader with more than 1.5 Million cards-in-force, offering diverse products on payment solutions. Since then, MCC has already tripled its cardholder base, re-launched its existing credit card products and also ventured into acquiring, prepaid cards, as well as insurance businesses.
In November 2015, MCC further diversified its product suite with the introduction of the YAZZ
Prepaid Card, a general purpose Prepaid VISA Card that is reloadable and made available at the retail environment.
In June 2018, MCC was granted by the Insurance Commission its license to sell various life and non-life insurance products; thus, MCC became a Finance Company and General Insurance Agency.
On September 4, 2018, MCC became a 100% wholly-owned subsidiary of Metrobank. This development is supportive of Metrobank’s growth strategy to maximize operational efficiencies between Metrobank and MCC, and to further expand on opportunities for collaboration, especially within the Metrobank Group, while remaining fully committed to deliver superior products and services to existing and new customers.
In March 2019, the respective Board of Directors and stockholders of MCC and Metrobank approved and ratified the merger between MCC and Metrobank, which was set for the following year.
MCC retains its operations and place of business in its current location at Metrobank Card Center, 6778 Ayala Avenue Makati City, Philippines.
ABOUT METROBANK CARD CORPORTATION
Financial Highlights
Metrobank Card Corporation 3
VISIONOur vision is to be the Philippines’ leading payment solutions provider – dedicated to our customers, devoted to our people and their development, committed to fulfilling our responsibility to the community, and consistent in delivering maximized shareholder value.
MISSIONWe pledge to:•Be the primary payment solutions provider to our customers by delivering superior key indicators: •a dominant market share in the middle-to high-end segment; •the best bottom line achievement (Net Profit After Tax and Efficiency Ratio); •a high level of client engagement and customer satisfaction, resulting in superior, relevant products with innovative benefits, convenient access, and unparalleled customer service;•Create a conducive working environment for our people by being the employer of choice, a home for first-class talent, and a preferred place to work;•Be a good corporate citizen by taking part in community development in every place we do business;•Achieve and sustain the most profitable performance for our shareholders. VALUESMCC employees live the TEAM MCC & I values:•TEAMwork. We work together to accomplish common goals. We are quick to offer assistance and support each other to succeed. •Making a Difference. We uphold and extend the Bayanihan spirit by caring about our co-workers and the company, and by bringing value to our work each day.
•Continuous Improvement. We continue to seek new ways to improve our products, services, and processes, while maintaining a strong work-life balance.•Customer Focus. We provide superior service at every point of contact and exceed customers’ expectations, as we strive for meaningful and enduring relationships.•Integrity. We conduct ourselves with the highest level of professionalism in the presence of colleagues, clients, and business partners. We base our decisions on merit and value, and avoid conflicts of interest.
MODELOur business model rests on the four pillars:•Sustainable Revenue and Profit Growth, which is driven by customer acquisition and cross-selling across the Metrobank Group, tempered by prudent risk management;•High Customer Satisfaction, which is driven by our excellent, unparalleled customer service;•Staying Ahead, which is driven by our continuous digitalization;•Being an Employer of Choice, which is supported by our people-focused agenda and high employee engagement.
DISTINCTION MCC is a part of the Metrobank Group, whose leadership in the financial services industry is proven by a track record of consistent success and market share. Our diverse sales and payment channels, coupled with nationwide coverage, give us commanding capability and presence across the markets we serve. Our wide suite of products and services, catering to various demographics and lifestyles, allows us to consistently satisfy every customer need.

4 Metrobank Card Corporation
FINANCIAL HIGHLIGHTS

Metrobank Card Corporation 5

2 Metrobank Bank Corporation 6 Metrobank Card Corporation

Metrobank Card Corporation 7
MESSAGE FROMTHE CHAIRMANTo our dear stakeholders,
Improvement and innovation have been the theme for Metrobank Card Corporation (MCC) in 2019, and it gives me great pride to report that we have turned the tide and came out bigger and stronger.
The vision we had for years had started to come to fruition, and now we will begin to reap the benefits we have been looking forward to. We welcomed the year with MCC finally becoming an entity fully and proudly owned by Metrobank, unifying the brands into a more powerful and formidable structure, and marking one of the most significant milestones for both corporations.
This dynamic synergy has pushed MCC further in the industry by aligning with Metrobank’s growth strategy, and has likewise allowed Metrobank to utilize the vital strengths of MCC. This new accord helped maximize the operational efficiencies of both parties, further expanding on opportunities for collaboration while remaining fully committed to delivering superior products and services to existing and new customers.
As the year ends, we round it up with a remarkable and highly anticipated union, a prosperous transformation, and an enhanced quality of service. I am proud to impart our achievements in 2019 with all of you, and I am hopeful for another year of successful accomplishments marked by a strengthened commitment as one Metrobank in 2020.
Mabuhay!
FABIAN S. DEECHAIRMAN OF THE BOARD

8 Metrobank Card Corporation
PRESIDENT’S REPORT
I am pleased to report another strong year for Metrobank Card Corporation (MCC)—new business innovat ions and f lour ish ing expansion have led to excellent financial results for the year 2019.
In 2019, MCC posted a P4.91 billion Net Profit After Tax (NPAT) with an annualized Return on Equity (ROE) of 28.6%. MCC’s cards-in-force ended at 1,520,205 which yielded an 17% growth in billings and 23% growth in receivables. MCC’s total assets grew by 13.29% to P94 billion, with a Return on Assets (ROA) of 5.6%.
This year, MCC also sustained its leadership position in terms of total number of Cards in Force (CIF), Merchant Acquiring Billings, and Receivables – proof that our commitment to customer service e x c e l l e n c e h a s r e s u l t e d i n continued business growth.
MAXIMIZED BUSINESS SYNERGIES AND INNOVATIONS
In the early part of 2019, the Board of Metropolitan Bank and Trust Company (Metrobank) approved the proposal to merge MCC into the Parent Bank, Metrobank. Nevertheless, MCC continued to innovate to keep up with the evolving needs of its customers.
M C C l a u n c h e d M e t r o b a n k Interactive Assist (MIA) in

Metrobank Card Corporation 9
PRESIDENT’S REPORTSeptember 2019. It is Metrobank Card’s new facility that allows users to easily apply for a credit card through Facebook Messenger. MIA is also being developed to accommodate more features on credit card services.
In October, MCC launched the all-new Metrobank Vantage Card, the Metrobank Titanium Mastercard, and the Metrobank Rewards Plus Visa. During the same month, MCC also launched the new NCCC Mastercard at the NCCC Mall Buhangin in Davao City together with representatives from NCCC and GHL Systems Philippines, Inc., which is NCCC’s acquiring partner.
As for prepaid cards, MCC expanded its partnerships with four new White Label Prepaid Cards. MCC partnered with Ardeur World Marketing Corporation, JAC Liner, WeEvolve, and KNM Uniprint Corp. MCC also enhanced its Merchant Acquiring facilities through Dynamic Currency Conversion, Mastercard Payment Gateway S e r v i c e s , a n d M C C O n l i n e Installment.
ESTABLISHED AWARD -WINNING ACHIEVEMENTS
MCC proudly won both local and regional awards in 2019 for its successful initiatives.
First, MCC was awarded the People Program of the Year - NCR (Private Sector) by the People Management Associationof the Philippines (PMAP) forits Employee Engagement Champion (E-Champ) Model during the 646th PMAP General Membership Meeting on May 29, 2019 at Dusit Thani Hotel Makati.
Additionally, at the 5th Customer Experience Asia Excellence Awards on September 24, 2019 at Marina Bay Sands Hotel, Singapore, MCC was awarded the Bronze Award for “Best Brand Experience” for the re-launch of its premium credit card, Metrobank World Mastercard, from the previous year.
Finally, the Digital Banker awarded MCC at the 2nd Annual Global Retail Banking Innovation Awards 2019 on September 26, 2019 at the Carlton Hotel Singapore with two accolades. MCC was recognized as the Winner for “Best Social Media Marketing Initiative” for its well-received Social Media Influencers Campaign of
Co-Branded Cards, and as the Highly Acclaimed for “Outstanding Digital Marketing Initiative” for its annual and customer-desired McDonald’s National Usage Program. METROBANK CREDIT CARDS IN GOOD HANDS
2019 was a year full of accomplishments and welcome changes for MCC. As we look back and share our history and achievements, we also look forward to continuing our business ventures as we merge with Metrobank in 2020.
Ramon Jaime L.V. Del RosarioPresident

2 Metrobank Bank Corporation
OURPRODUCTSAND SERVICES
Our products and services always place the customer at the center of business. By delivering our services with a superior quality at every point of contact, we aim to set the standard for customer and partner satisfaction, while constantly seeking to nurture and deepen our relationships.
10 Metrobank Card Corporation

Metrobank Card Corporation 11

12 Metrobank Card Corporation
Metrobank Card Corporation offers a range of credit card products suitable to meet the needs of the Philippine Market. Cardholders enjoy increased spending power and international purchasing convenience with acceptance in over 40 million establishments worldwide. Our credit card products offer perks and privileges that allow cardholders to get maximum value for their money.
CREDIT CARDS
METROBANK VANTAGE CARDTurn your Vantage into real advantage. The Metrobank Vantage Mastercard or Metrobank Vantage Visa provides you with all the perks, pleasures and privileges of the metro.
The most rewarding feeling you can get in a credit card. The Metrobank Rewards Plus Visa gives you greater rewards on gadgets and electronics, telecommunications and transportation, and online spend.
Find yourself in your element. The Metrobank Titanium Mastercard incorporates retail essentials by rewarding you with 2X Rewards Points on dining, department store, and online spend.
METROBANK REWARDS PLUS VISA
METROBANK REWARDS PLUS VISA
The Metrobank Femme Visa offers the perks and privileges that a woman deserves, including exclusive offers at shopping, beauty, and wellness establishments.
METROBANK FEMME VISA
M FREE MASTERCARD
The M Free Mastercard is an annual fee-free credit card. It offers worldwide acceptance and convenience with perks and privileges.
M LITE MASTERCARD METROBANK ON INTERNET MASTERCARDThe M Lite Mastercard is a low
interest rate (2.49%) credit card loaded with built-in card features and privileges.
The Metrobank ON Internet Mastercard enables cardholders to shop more securely online. It is designed for non-face-to-face transactions, and offers greater security and peace of mind.

Metrobank Card Corporation 13

14 Metrobank Card Corporation

The Metrobank Travel Platinum Visa is Metrobank Card’s first complete travel card that allows cardholders to earn 1 mile for every P17 spent overseas, including airlines and hotels. It also lets them enjoy unlimited airport lounge access, free travel insurance of up to P5 million coverage, and special travel offers.
METROBANK TRAVEL PLATINUM VISA
The Metrobank Femme Signature Visa is the first local Signature Visa and this is the credit card targeted exclusively for women. It offers a most exclusive and rewarding experience for its premium cardholders.
METROBANK FEMME SIGNATURE VISA
The Metrobank World Mastercard is the most premium credit card in the market, offering a credit limit that nearly sets no borders. It offers exclusive access, global discounts and premium privileges through Mastercard Airport Experiences and Mastercard Traveler Rewards.
METROBANK WORLD MASTERCARD
The Metrobank Platinum Dollar Mastercard allows cardholders to be charged in US dollars regardless of the currency transacted.
METROBANK DOLLAR MASTERCARD
The Toyota Mastercard was launched through a partnership between Metrobank and Toyota Motor Philippines. Offering discounts at Toyota dealers, fuel rebates from Petron, and Rewards Points for all card spending, the Toyota Mastercard is indeed the country’s first complete motorist card.
TOYOTA MASTERCARD
The Metrobank Peso Platinum Mastercard offers access to a wide-range of world-class privileges. It offers an exclusive 24/7 VIP Customer Service hotline, concierge service, and 50% OFF at participating hotels and restaurants.
METROBANK PESO PLATINUM MASTERCARD
PSBANK CREDIT MASTERCARDThe PSBank Credit Mastercard is a card with no annual fee for life, which was launched through a partnership between Metrobank and Philippine Savings Bank. It offers flexible payment schemes, installment programs, and exclusive perks and privileges, providing Filipinos an affordable financial tool that helps take care of simple needs and manage expenses.
NCCC MASTERCARDThe NCCC Mastercard was launched through a partnership with Metrobank and Davao’s homegrown retail and shopping mall operator, New City Commercial Center (NCCC) to provide its customers more convenient payment options. With worldwide acceptance, the card can be used at NCCC-affiliated stores, at partner merchants of Metrobank, in online booking or bills payment, and at all local and global Mastercard-affiliated stores.
Metrobank Card Corporation 15

16 Metrobank Card Corporation
PROGRAMS AND FACILITIESMetrobank Card Corporation offers a range of services that allow its cardholders to enjoy exclusive discounts, flexible payment schemes, various installment programs, and convenient digital platforms.
M HEREM Here highlights the presence of Metrobank Card Corporation in leading establishments and caters to the urban and trendy lifestyle of its cardholders. It offers perks, privileges, discounts and freebies to all Metrobank Cardholders.
NATIONAL ACQUISITION PROGRAMNational Acquisition Program provides an incentive for new customers applying for a Metrobank credit card. It allows cardholders to enjoy a special welcome gift upon approval of their new Metrobank credit card.
E-COMMERCEE-commerce offers perks, privileges, and discounts to Metrobank credit cardholders at local and international E-commerce merchants.
0% INSTALLMENTThe 0% Installment allows financial flexibility with no added cost. It offers cardholders the opportunity to purchase products on installment up to 24 months with no additionalinterest.
NATIONAL USAGE PROGRAMThe National Usage Program encourages and rewards existing cardholders to use their Metrobank credit card for their everyday spend anywhere through partnerships with prominent brands.
OVERSEAS AND ONLINE SPENDOverseas and Online Spend incentivize Metrobank credit cardholders who reach a minimum accumulated spend.

Metrobank CardCorporation 17

18 Metrobank Card Corporation

Metrobank Card Corporation 19
CASH2GOCash2Go allows cardholders to convert their unused credit limit to cash and pay in installments at low interest rates per month in 3 to 60-month terms.
BALANCE CONVERSIONBalance Conversion lets cardholders convert their billed straight purchases into monthly installments.
M ONLINEM Online is Metrobank Card’s website that lets cardholders get instant information on their Metrobank Card. It allows cardholders to view their Statement of Account, pay their card bill, find out about the latest promos, learn more about their card’s features, and apply for a new Metrobank credit card.
BALANCE TRANSFERBalance Transfer lets cardholders move their outstanding balance from their non-Metrobank Card to their Metrobank Card and pay at a lower interest rate in 6 to 24-month terms.
BILLS2PAYBills2Pay allows Metrobank Cardholders enjoy hassle-free utility payments. They can enroll their Meralco, PLDT, Globe Telecom, SMART, SUN, and Sky Cable Network in Bills2Pay and their monthly bills will be automatically charged to their credit cards.
METROBANK CARD MOBILE APP
The Metrobank Card mobile app allows Metrobank cardholders to know more about Metrobank Card’s ongoing promos and apply for a new Metrobank Card from their mobile devices. It is both available on iOS and Android platforms.

20 Metrobank Card Corporation
MERCHANT ACQUIRING
Metrobank Card offers its partner merchants a portfolio of payment solutions.
POINT-OF-SALE (POS) TERMINALSMetrobank Card’s cutting-edgePOS terminal fleet allows partner merchants to process Mastercard, Visa, JCB, UnionPay International, BancNet Debit cards, WeChat Pay and Alipay transactions in a matter of seconds. Each is a one-stop shop terminal, integrated with the following up-to-date features:
• EMV (EUROPAY, MASTERCARD, AND V ISA) CERTIF IED AND CONTACTLESS. Metrobank Card’s POS terminals are equipped with compliant EMV chip card readers for additional fraud and chargeback protection. The POS terminal’s secure contactless payment capability enhances overall customer experience foreveryday purchases.
•MCC INSTALLMENT ACCEPTANCE. Payment flexibility through the
various installment options such as 0% installment and Shop Now, Pay Later.
•ALIPAY AND WECHAT PAY. MCC has partnered with China’s top digital payment providers, Alipay and WeChat Pay, in enabling local merchants using MCC’s payment platform to accept QR based mobile payments.
•MOBILE POINT-OF-SALE SOLUTION. It is a secure, low-cost and industry-compliant payment platform that provides a protected, cashless environment for merchants and customers. It cuts across the different market segments—from small and traditional retail, to corporate wholesale.
•ANDROID POS TERMINAL. Compact and mobile tablet payment device powered by the Android operating platform. A wide range ofadvanced connectivity options are supported and comes with a large high definition tablet color display to maximize screen usage for customer facing transactions.
•LOYALTY CARD AND GIFT CARD ACCEPTANCE.Our terminals can support merchant loyalty programs suchas points earning, redemptionand inquiry.
•3G-ENABLED. Equipped with mobile and wireless capability, Metrobank Card’s 3G POS terminals provide a seamless and faster payment experience.

Metrobank Bank Corporation 19
•ECR (ELECTRONIC CASH REGISTER) INTEGRATION.End-to-end integration from merchant ECR machines to Metrobank Card POS terminals.
•DYNAMIC CURRENCY CONVERSION (DCC).A value added service that offers international cardholders the option to pay for their purchases in local currency (Php) or their home currency (card billing currency) at the point of sale. The DCC service is applicable on Mastercard andVisa transactions via Metrobank POS terminals.
•POS CASH OUT.A new, extended point-of-saleservice that allows pesowithdrawal transactions usingMetrobank’s BancNet-certified POS terminals with cash dispensing done by the partnermerchant.
INTERNET PAYMENT SOLUTIONThe Internet Payment Solution facility enables Metrobank Cardmerchants to accept card payments for online transactions via the following payment solutions:
•MASTERCARD PAYMENT GATEWAY SERVICES. Provides acquiring banks and partners with a white labeltechnology product for payment processing and fraud prevention,enabling their merchant customers to easily and securely accept global digital payments.
•METROBANK ONLINE INSTALLMENT.Allows e-commerce merchantsto offer Metrobank cardholders
flexible payment options. By making online installment available to its merchants, Metrobank can help increase sales conversion for high ticket items, encourage customer loyalty, and promote Metrobank card usage.
RECURRING PAYMENT SOLUTIONThe Recurring Payment Solution facility provides Metrobank Card merchants the ability to set up automatic and scheduled payment arrangements with
their customers. It allows the collection of monthly recurring fees and charges such as memberships, subscriptions, insurance premiums, and utility bills.
MAIL ORDER TELEPHONE ORDER (MOTO)The MOTO payment facility allows credit card acceptance for purchases made over the phone or by mail. It gives access and convenience to a wider customerbase for card-not-present transactions.
Metrobank Card Corporation 21
22 Metrobank Card Corporation
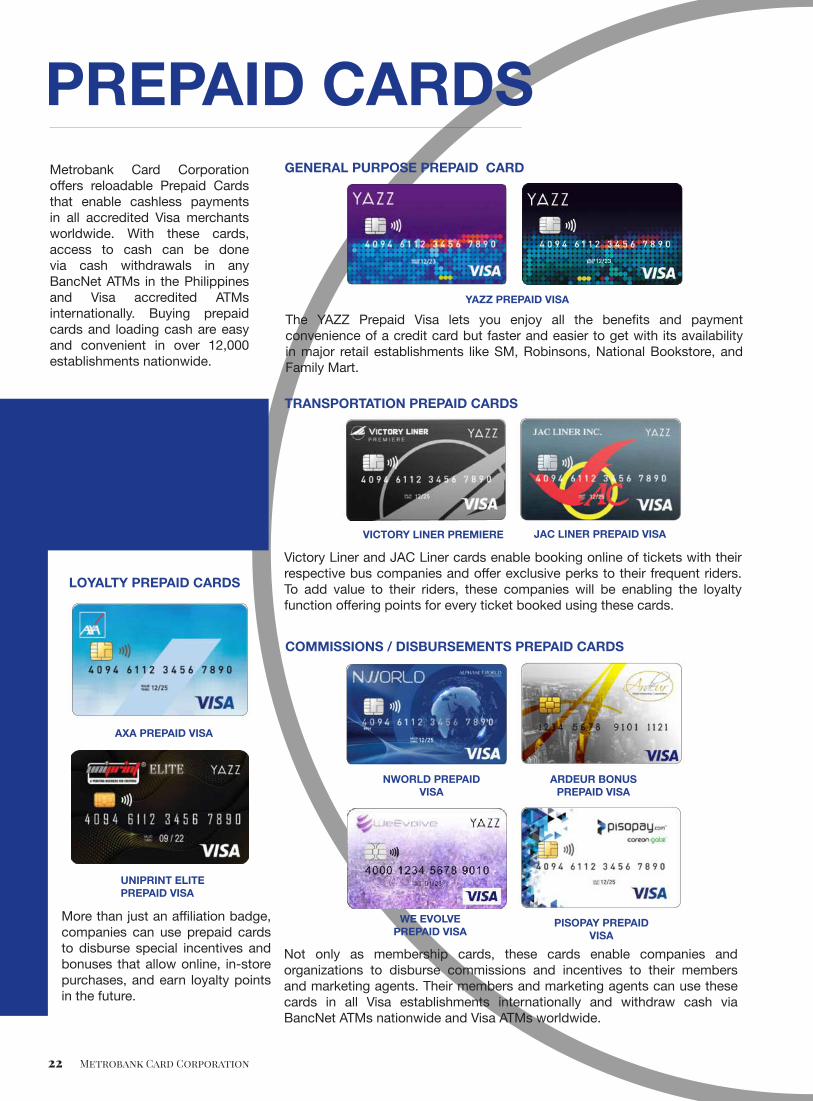
Metrobank Card Corporation offers reloadable Prepaid Cards that enable cashless payments in all accredited Visa merchants worldwide. With these cards, access to cash can be done via cash withdrawals in anyBancNet ATMs in the Philippinesand Visa accredited ATMs internationally. Buying prepaid cards and loading cash are easy and convenient in over 12,000establishments nationwide.
PREPAID CARDS
More than just an affiliation badge, companies can use prepaid cards to disburse special incentives and bonuses that allow online, in-store purchases, and earn loyalty points in the future.
LOYALTY PREPAID CARDS
GENERAL PURPOSE PREPAID CARD
The YAZZ Prepaid Visa lets you enjoy all the benefits and payment convenience of a credit card but faster and easier to get with its availability in major retail establishments like SM, Robinsons, National Bookstore, and Family Mart.
YAZZ PREPAID VISA
Victory Liner and JAC Liner cards enable booking online of tickets with their respective bus companies and offer exclusive perks to their frequent riders. To add value to their riders, these companies will be enabling the loyalty function offering points for every ticket booked using these cards.
TRANSPORTATION PREPAID CARDS
VICTORY LINER PREMIERE
AXA PREPAID VISA
UNIPRINT ELITE PREPAID VISA
JAC LINER PREPAID VISA
COMMISSIONS / DISBURSEMENTS PREPAID CARDS
Not only as membership cards, these cards enable companies andorganizations to disburse commissions and incentives to their members and marketing agents. Their members and marketing agents can use these cards in all Visa establishments internationally and withdraw cash via BancNet ATMs nationwide and Visa ATMs worldwide.
NWORLD PREPAID VISA
WE EVOLVE PREPAID VISA
ARDEUR BONUS PREPAID VISA
PISOPAY PREPAID VISA

Metrobank Card Corporation 23

24 Metrobank Card Corporation
Having a license of being a General Insurance Agency, Metrobank Card Corporation offers AXA products for protection, health, education, retirement, investments and non-life insurance products to its cardholder base. Aside from having a secured future, cardholders also enjoy the convenience of paying the premium of their insurance products using a Metrobank Credit Card. All insurance products sold are by AXA Philippines Inc.
INSURANCE
PROTECTION AND HEALTH Protection and Health Insurance products allow policyholders to protect themselves and their family from financial worries caused by unexpected health issues.
CREDIT LIFE PLUSMEDISHIELD PLUSCREDIT PROTECT
HEALTH MAXGLOBAL HEALTH ACCESS
FLEXI PROTECT
INVESTMENT & RETIREMENTInvestment & Retirement Insurance products allow policyholders to secure their future through secure investments and allow them to enjoy the retirement they planned for. These products provide: (a) Death Benefit and (b) Investment yield as measured by the fund’s asset value at the time of redemption.
RETIRE SMARTASSET MASTERMY AMBITION
LIFE BASIXAXELERATOR
ACADEMIX
LIFESTYLELifestyle Insurance products allow policyholders to pursue and enjoy their passion without worrying on expenses they might incur due to unforeseen events.
SMART TRAVELLERMOTOR INSURANCE
PERSONAL ACCIDENT

Metrobank Card Corporation 25

2 Metrobank Bank Corporation
CORPORATE GOVERNANCE
Our sterling corporate governance has shaped our identity and forged our leadership in the industry through the years. Principles and policies guide the pillars of our brand and govern all aspects of our business and corporate culture.
26 Metrobank Card Corporation

Metrobank Card Corporation 27

28 Metrobank Card Corporation
CORPORATE GOVERNANCE
The Board of Directors and Senior Management of MCC are firmly committed to good corporate governance and are cognizant of the fact that it is the foundation of safe and sound operations. The view that creation and maintenance of shareholder value can only be achieved if sound corporate governance is in place is strongly espoused by the Company. MCC believes that it is essential to have an effective compliance program to promote the total commitment of the stockholders, Board of Directors, and Senior Management to compliance. It is equally believed that through good corporate governance, protection of the rights of all stakeholders can be ensured. MCC Board and Management adhere to the basic principles of accountability, fairness, integrity and transparency for the safe and sound operations of the company. MCC Board and Management believe that accountability should permeate the entire organization starting with its directors and officers all the wayto its staff. There should also be integrity in every action and more importantly, transparency in all its business dealings.
All Board members have undergone training in corporate governance and have been duly certified therefor. The Board is composed of professionals from various fields of expertise such as banking, law, general business and finance. MCC is assured that each director is capable of adding value and formulating sound corporate policies.
BOARD OF DIRECTORSThe overall vision, strategic objectives, key policies, and the monitoring and evaluation of the management performance are set by the Board of Directors. It is part of the Board’s mandate to ensure the adequacy of internal controls and risk management practices, accuracy, and reliability of financial reporting, and compliance with applicable laws and regulations.
The roles of the Chairman and the CEO or President are separate to establish accountability and ensure Board independence from management. Of the 7 members of the Board, only the President or CEO is an executive director. The Chairman on the other hand, though assumes a non-executive function, provides leadership in the Board who ensures effective functioning thereof including maintaining a relationship of trust with and among Board members. The Chairman likewise ensures a sound decision making process who promotes critical discussions in the company’s top collegial body which is the Board.

Metrobank Card Corporation 29
1. EXECUTIVE COMMITTEE. The Executive Committee acts on behalf of the Board and has the general power and competence to perform any act or make any decision (or authorize the performance of any act or the making of any decision) with the general competence and authority of the Board subject to the limitations stated in the By-Laws of the Company.
Anjanette Ty Dy Buncio ChairpersonRichard Benedict S. So MemberRamon Jaime Lardizabal Vivencio Del Rosario Member
2. AUDIT COMMITTEE. The Audit Committee provides oversight of the internal and external audit functions and ensures both the independence from management of internal audit activities as well as the compliance with theregulations governing accounting standards on financial reporting. It approves the annual audit plan, the annual audited financial statements, and the analysis of results of operations as submitted by the Internal and External Auditor. It also evaluates strategic issues relating to plans and policies, financial and system controls, and methods of operation for adequacy and improvements.
Francisco S. Magsajo, Jr. (Independent Director) ChairpersonBenedicto Jose R. Arcinas (Independent Director) MemberRichard Benedict S. So Member
3. NOMINATION COMPENSATION & REMUNERATION COMMITTEE. The NCR Committee leads the process for identifying and recommending candidates for appointment to the key positions in the institution taking into full consideration the succession planning and the leadership and skills needed in MCC. It provides oversight on the compensation and remuneration of matters of the entire organization.
Anjanette Ty Dy Buncio ChairpersonAngelica H. Lavares (Independent Director) MemberFrancisco S. Magsajo, Jr. (Independent Director) Member
BOARD COMMITTEES
BOARD MEMBER TYPE NO. OF YRS % SHARES
Fabian S. Dee Non-executive 13 0.00001 Anjanette T. Dy Buncio Non-executive 16 0.00001
Ramon Jaime Lardizabal Executive (5 months) 0.00001Vivencio Del Rosario
Francisco S. Magsajo, Jr Independent 4 0.00001
Richard Benedict S. So Non-executive 9 0.00001
Angelica H. Lavares Non-executive 2 0.00001
Benedicto Jose R. Arcinas Non-executive 2 0.00001
The Board of Directors is supported by seven (7) Board Committees with their respective mandates as follows:

30 Metrobank Card Corporation
4. CORPORATE GOVERNANCE COMMITTEE. The Corporate Governance Committee is tasked primarily to assist the Board in formulating the policies and overseeing the implementation of MCC’s corporate governance practices. It conducts annually the performance self-evaluation of the Board of Directors and its committees. It also oversees the implementation of the orientation of newly-elected Directors. An annual performance review of the Board as a whole, the Committees, individual directors and the President is conducted using assessment questionnaires that measure their effectiveness.
Angelica H. Lavares (Independent Director) ChairpersonRichard Benedict S. So MemberFrancisco S. Magsajo, Jr. (Independent Director) Member
5. RISK OVERSIGHT COMMITTEE. The Risk Management Committee is responsible for the development of MCC’s risk policies and defining the appropriate strategies for identifying, quantifying, managing and controlling risk exposures including preventing and/or minimizing the impact of losses to the organization. It oversees the implementation and review of the enterprise wide risk management plan and system of limits of management’s discretionary authority delegated by the Board. It is also responsible for reassessing the continued relevance, comprehensiveness, and effectiveness of the risk management plan, and introduces revisions thereto as needed.
Benedicto Jose R. Arcinas ChairpersonAngelica H. Lavares (Independent Director) MemberRichard Benedict S. So Member
6. RELATED-PARTY TRANSACTIONS COMMITTEE. The Related-Party Transactions Committee ensures that transactions with related parties (including internal Group transactions) of MCC are reviewed to assess the risks, are subject to appropriate restrictions to ensure that such are conducted at arm’s-length terms and that corporate or business resources are not misappropriated or misapplied.
Angelica H. Lavares (Independent Director) ChairpersonRichard Benedict S. So MemberFrancisco S. Magsajo, Jr. (Independent Director) Member
7. IT STEERING COMMITTEE. The IT Steering Committee is tasked to regularly review, endorse/approve, monitor and report to the Board MCC’s Annual review of the IT Strategic Plan, IT Projects and initiatives, and related risks, IT Operations and Performance, Information Security Program and Policies (IT-specific), IT Outsourcing activities and IT Policies, Procedures and Standards. The Committee also reviews, approves and endorses for Board’s approval outsourcing to cloud environment and the provision of electronic services to customers.
Richard Benedict S. So ChairpersonRamon Jaime L. Vivencio Del Rosario Co-ChairpersonHead of Business Technology MembersHead of OperationsHead of Credit OperationsChief Financial OfficerHead of Merchant AcquiringChief Risk Officer AdvisersInternal Audit HeadHead of LegalHead of Decisions ManagementHead of Human ResourcesMBTC IT Resource

DIRECTORS’ ATTENDANCE AT BOARD AND COMMITTEE MEETINGS AS OF DECEMBER 31, 2019
NAME OF DIRECTORS
1. FABIAN S. DEE
2. ANJANETTE T. DY BUNCIO
4. RICHARD BENEDICT S. SO
TOTAL NUMBER OF MEETINGS HELD DURING THE YEAR
5. BENEDICTO JOSE R. ARCINAS
6. ANGELICA H. LAVARES
7. FRANCISCO S. MAGSAJO, JR.
3. PRADEEP PANT (RESIGNED EFFECTIVE 05 JULY 2019)
8. RAMON JAIME L. VIVENCIO DEL ROSARIO (ELECTED EFFECTIVE 01 JULY 2019)
ATTE
NDE
D
ATTE
NDE
D
ATTE
NDE
D
ATTE
NDE
D
ATTE
NDE
D
ATTE
NDE
D
ATTE
NDE
D
ATTE
NDE
D
% % % % % % % %
11
11 11 4
3 3 3
4
9
4
44
4
5
4
4
4
4
11 6
7
8
8 4 4 4 4 10
11
10
9
11
11 11
4 5
7 6
100
100 100 100
75 75 75
80
90
100
100100
100
100
100
100
100
100
100 75
87.50
100
100 100 100 100 100 100
100100
100
100
100 100
100 100
90.90
81.81
BOAR
D #
OF
MEE
TIN
GS
EXEC
UTI
VE
CO
MM
ITTE
E #
OF
MEE
TIN
GS
NC
R C
OM
MIT
TEE
# O
F M
EETI
NG
S
RISK
OVE
RSIG
HT
CO
MM
ITTE
E #
OF
MEE
TIN
GS
RELA
TED
PART
Y C
OM
MIT
TEE
# O
F M
EETI
NG
S
IT S
TEER
ING
CO
MM
ITTE
E #
OF
MEE
TIN
GS
CO
RPO
RATE
GO
VERN
ANC
E C
OM
MIT
TEE
# O
F M
EETI
NG
S
AUDI
T C
OM
MIT
TEE
# O
F M
EETI
NG
S
NOT APPLICABLE
Metrobank Card Corporation 31

32 Metrobank Card Corporation
MCC’S EXECUTIVE OFFICERS
Anna Therese Rita D. Cuenco Senior Vice President-Treasurer
Senior Vice President-Head of Operations
Senior Vice President-Chief Finance Officer
Senior Vice President-Head of Credit Operations
Senior Vice President-Head of Human Resources
Senior Vice President-Head of Credit Card Sales, Alliances and Other Channels
Senior Vice President-Head of Prepaid Cards and Insurance BusinessAloysius C. Alday Jr.
Harrison Chua Gue
Cesar P. Nicolasora Jr.
Hiroko M. Castro
Jocelyn Lim-Bata
Marie Anthonette L. Santiago
PERFORMANCE ASSESSMENT PROGRAMIt is a major objective of the Company to be able to monitor the performance of the Board through an annual self-assessment. A comprehensive self-assessment process was put in place by the Board since 2010 and has since been consistently implemented. This process is administered in the form of a formal questionnaire that is answered by each member of the Board individually and where members of the Board are able to rate their individual performance and that of the Board as a whole. The results are collated and compiled by the Compliance Officer, and are submitted to the Board for discussion and when needed, appropriate action.
ORIENTATION AND EDUCATION PROGRAMAll Board members have undergone training in corporate governance and have been duly certified therefore. All first-time directors have attended a special seminar on corporate governance for the board of directors conducted or accredited by the BSP. They are also furnished with a copy of the general responsibility and specific duties and responsibilities of the Board and of a director. As required under regulations, directors are made to certify under oath that they have received copies and fully understand and accept the general responsibility and specific duties accompanying membership in the Board; this certification is eventually submitted to BSP together with a certification that he or she has all the prescribed qualifications and none of the disqualifications of a duly elected director.
The Board is composed of professionals from various fields of expertise such as banking, law, general business and finance. MCC is assured that each director is capable of adding value and formulating sound corporate policies.

Metrobank Card Corporation 33
RETIREMENT AND SUCCESSION POLICYRetirement from service in MCC shall be compulsory upon the employee’s attainment of his/her fifty-fifth (55th) birthday or thirty (30) years of service, whichever comes first, but MCC has the option to extend his/her retirement period up to his/her sixtieth (60th) birthday. Any member who attains the age of fifty (50) and has completed ten (10) years of service, may opt to retire and shall be paid an amount equivalent to a percentage of his final monthly basic salary for every year of service in accordance with the schedule under Voluntary Separation Benefit.
The Talent Management Program (TMP) or Succession Policy covers the following:
1. Administration-spearheaded by the President, in partnership with the candidates’ immediate superiors and division heads, and support of the Human Resources Division (HR).
2. Coverage: a. Key-Man-Risk b. Selected Department/Unit Heads c. Critical and hard-to-find positions as identified by HR d. Top high performing and high potential employees of MCC
3. Eligibility & criteria of all identified successors
4. Implementation Phases & Strategies-from preparation i.e. identification of Line of Succession and prioritization, assessment, developments & programs, regular talent management reviews, final evaluation, presentation, approvals & deployment of successors.
5. Other initiatives and strategies
REMUNERATION POLICYThe Compensation Policy of MCC includes the following factors used in determining the appropriate compensation of an employee:
1. Hiring rate 2. Promotional increase 3. Upgrade increase 4. Structural Adjustments 5. Acting Capacity Allowance 6. Guaranteed & Performance Bonuses 7. Merit Increase 8. Other salary adjustments
In determining the remuneration of senior management, there are three (3) critical factors that are being considered: (1) External Benchmarking; (2) Internal Equity Analysis wherein Human Resource Compensation & Benefits (C&B) uses salary

34 Metrobank Card Corporation
review, comparative ratio, and C&B financial metrics; and lastly, (3) Salary Structure which reflects the total rewards strategy of MCC and the sole basis in doing salary recommendations across all employees.
To ensure MCC’s competitiveness against the market, it is crucial that the salary structure is reviewed annually and also in instances whenever there are regulatory salary adjustments as mandated by DOLE.
All Compensation strategies and initiatives in the policy are subject for analysis and validation of the Compensation & Benefits Head with the approval of Head of Human Resources, the President, NCR Committee and Board of Directors for Senior Officers.
RELATED-PARTY TRANSACTIONSThe Related-Party Transactions Committee ensures that transactions with related parties (including internal Group transactions) of MCC are reviewed to assess the risks, are subject to appropriate restrictions to ensure that such are conducted at arm’s-length terms and that corporate or business resources are not misappropriated or misapplied.
Policies and guidelines on related party transactions (RPT) are in place in MCC and the company undertakes to implement these in order to provide guidance on RPTs and to ensure that the highest ethical standards consistent with the principles for enhancing corporate risk governance are properly observed. Transactions between and among related parties create financial, commercial and economic benefits to Metrobank Card Corporation (MCC) and to the entire conglomerate, Metrobank Group, where it belongs. In this regard, related party transactions are generally allowed provided that these are done on an arm’s length basis. MCC’s implementation is pursuant to and consistent with BSP Circular 895, Guidelines on Related Party Transactions which recognizes the financial, commercial and economic benefits created by RPTs to individual institutions and the group to which it belongs.
COMPLIANCE & INTERNAL AUDITMCC has built a robust compliance program focused on enforcement of the Corporate Governance Manual, Money Laundering & Terrorist Financing Prevention Program (MLPP), Code of Business Conduct & Ethics, and other regulatory requirements.
MCC Compliance reports directly to the Board Corporate Governance Committee and the Chairman of the Board. The Compliance Office ensures timely submission of reports, issues advisories on new regulations or amendments, initiates policy pronouncements and implementation, engages regulators on their onsite and offsite reviews, provides training to employees and reports on significant compliance issues to the management and the Board.
The MCC Internal Audit function forms an integral part

Metrobank Card Corporation 35
of the Company’s corporate governance framework. It assists the Board in discharging its corporate governance responsibilities through ensuring adequate oversight of internal controls. Specifically, Internal Audit provides an independent, objective assurance and consulting function established to examine, evaluate, and improve the effectiveness of internal control, risk management, and governance systemsand process of MCC which helps management and the board of directors in protecting the institution and its reputation.
It is part of the Board’s mandate to ensure the adequacy of internal controls and risk management practices, accuracy, and reliability of financial reporting, and compliance with applicable laws and regulations.
DIVIDEND POLICYMCC’s BOD is responsible for generating all resolutions on the declaration and payment of dividends. It may declare dividends out of the company’s unrestricted or free retained earnings and undivided profits as of the calendar year-end immediately preceding the date of the dividend declaration, unless an appropriation of its retained earnings is specifically made for this purpose. Dividends may be payable in cash or in stock and the amount is based on a sound accounting system and loss provisioning processes under existing regulations, which takes into account relevant capital adjustments including losses, bad debts, and unearned profits or income.
By policy, MCC may only declare cash dividends provided that its capitalization will not fall below the minimum required combined capital accounts of the BSP or below the minimum risk-based capital ratios, including capital conservation buffer requirements and higher loss absorbency requirements as stipulated in the BSP’s existing capital adequacy framework. For the year 2019, MCC did not declare any dividends.
CONSUMER PROTECTIONMCC adheres to consumer protection standards relating to disclosure and transparency, protection of client information, fair treatment, effective recourse, and financial education and awareness in its dealings with financial consumers. These are embedded into the corporate culture of MCC, enhancing further its defined governance framework while addressing conflicts that are inimical to the interests of its customers.
The Board of Directors (Board) is ultimately responsible in ensuring that consumer protection practices are embedded in MCC’s business operations. The Board and Senior Management are responsible for developing MCC’s consumer protection strategy and establishing an effective oversight over MCC’s consumer protection programs. The Board is primarily responsible for approving and overseeing the implementation of MCC’s consumer protection policies as well as the mechanism to ensure compliance with said policies. While Senior Management is responsible for the implementation of the consumer protection policies approved by the Board, the latter is responsible for monitoring and overseeing the performance of Senior Management in

36 Metrobank Card Corporation
managing the day to day consumer protection activities of MCC.
MCC has adopted a Consumer Protection Risk Management System (CPRMS) in 2015 as part of its corporate-wide Risk Management System. The CPRMS is a means by which consumer protection risks inherent in MCC’s operations are identified, measured, monitored and controlled. These include both risks to the financial consumer and MCC. MCC’s CPRMS provides the foundation for ensuring MCC’s adherence to consumer protection standards of conduct and compliance with consumer protection laws, rules and regulations, thus ensuring that MCC’s consumer protection practices address and prevent identified risks to MCC and associated risk of financial harm or loss to consumers.
As prescribed by Bangko Sentral ng Pilipinas Circulars 857 and 1048, MCC adopts a Consumer Protection Manual which defines the general framework of MCC’s consumer protection policy and stance. This manual aims to promote clarity and consistency of approach in relation to MCC’s commitment in ensuring the following: •Protection of its customers against deceptive, unfair and unconscionable sales acts and practices; •Protection of client information; •Provision of adequate rights and means of redress; •Provision on information and consumer education.
The risk management activities include the following: •Risk identification and classification •Risk analysis and measurement of likelihood and consequences as indicated in MCC’s Enterprise Risk Management Manual •Risk management and mitigation strategies through risk assessment, establishing controls, improvement of business processes and policies, incident reporting and regular operating risk review and self-assessment •Risk monitoring and review through ongoing monitoring, review and reporting to ensure changing circumstances are managed in line with the risk. This may involve testing of control’s effectiveness to ensure suitability, adequacy and effectiveness.
These risk management tools are enforced to ensure adherence to consumer protection standards.
MCC adopts a Consumer Assistance Management System (CAMS) that serves as an avenue for consumers to air out their grievances in the products and services of MCC. MCC has established the consumer assistance channels for customers to provide their feedback and these are throughMCC’s hotlines and emails. The information on filing a complaint can be accessed in its website at

Metrobank Card Corporation 37
https://www.metrobankcard.com/feedback and is likewisedisplayed in MCC’s office premises at the lobby. MCC designated its Service Quality and Delivery Department as the independent unit that will handle the following functions under the supervision of its head who simultaneously designated as Consumer Assistance Officer:
•Monitor consumer assistance process; •Keep track, identify, and analyze the nature of complaints and recommend solutions to avoid recurrence; •Report to senior management the complaints received on a monthly basis •Ensure immediate escalation of any significant complaint
The consumer assistance channels are tasked with the following:
•Receive and acknowledge customer concerns •Record inquiries, requests and complaints in the MCC System •Review and investigation of concerns •Address concerns and provide official response to the customer within the prescribed processing time •Escalate customer concerns based on the escalation process
The end-to-end handling of customer concerns are recorded in the MCC System and controls are implemented on the quality of resolution provided to the customer based on existing policies of MCC.
MCC is committed in ensuring that it delivers excellent service to its customers. MCC has general service standards and key service metrics to measure the complaintsmanagement performance. In 2019, MCC’s Resolution Rate is at 97.86% and 0.06% for Overdue Bucket Rate. The complaints management performance is reinforced by trainings and workshops provided to its personnel. As part of MCC’s affirmative action to ensure financial awareness and education to its customers, MCC has utilized its website and social media channels to provide information to cardholders on tips on how to manage credit cards. Comparative information about key features, benefits and risks, and associated fees and charges of different card products of MCC are likewise provided in the website.
MCC endeavors to maintain the low valid rate of complaints against CIF through continuous enhancement of processes by utilizing customer feedback received across all consumer assistance channels.

2 Metrobank Bank Corporation
Our leadership comes from our exceptional risk management which serves as an important foundation for our success. Defining the company’s risk appetite framework and operating under this rubric involves a continuous refinement process that is always in step with our sustained growth, expansion, and innovation.
RISK MANAGEMENT
38 Metrobank Card Corporation

Metrobank Card Corporation 39

40 Metrobank Card Corporation
RISK MANAGEMENT
The Company faces a broad range of risks reflecting its thrust to continue to be the top credit card and payment solutions provider in the Philippines. These risks include those resulting from its responsibilities in the areas of financial stability and profitability, credit policy as well as its day-to-day operational activities. As the company continues to expand to different channels and segments, credit risk is controlled while maintaining profit targets with different test programs. MCC is also exposed to risks that are relevant to Information Technology and the business processes it supports. Exposure to financial risk is limited to capital planning, company loans and liquidity. MCC makes resources available to control process risks to acceptable levels. These processes are continuously being improved to control various risks faced by the company and to minimize loss, if not eliminated, resulting from such exposures. The company is guided with a clearly defined board-approved corporate risk appetite framework structured based on the identified risks in financial, infrastructure, operational and marketplace. The corporate risk appetite framework is set to balance opportunities for business development and growth in areas of potentially high risks while maintaining risk-reward tradeoff and maximizing returns.
RISK PHILOSOPHY AND GUIDING PRINCIPLES
RISK MANAGEMENT STRUCTURE
RISK OVERSIGHT COMMITTEE
CHIEF RISK OFFICER
BUSINESS INFORMATION
SECURITY
MARKET AND LIQUIDITY
RISK
OPERATIONAL RISK & BUSINESS CONTINUITY PLAN
RISK MANAGEMENT
ANALYTICS
CREDIT RISK ACQUISITION &
STRATEGY MANAGEMENT
PORTFOLIO RISK
MANAGEMENT

Metrobank Card Corporation 41
RISK PHILOSOPHY AND GUIDING PRINCIPLES
MCC continues to assume a number of risks in pursuit of meeting its strategic growth, financial stability and viability to sustain its development efforts. The framework through which these risks are controlled and managed is overseen by MCC Risk Governance which comprises the Board and the Risk Oversight Committee. Its responsibility resides in all levels of the organization from setting the overall corporate governance strategy and overall risk appetite to upholding risk awareness, acceptance, management and mitigation.
The Risk Oversight Committee, composed of a chairperson and two committee members, is responsible for appropriate oversight of risk management strategies, policies, and processes that have potential impact to the business. It is responsible for measuring and controlling credit and strategic risks, market and liquidity risks, operational and reputational risks, and information security along with adhering to any regulatory requirements from a risk perspective. These types of risks are being assessed and managed to a level that is consistent with the company’s corporate risk appetite. Together with the Audit Committee, the Risk Oversight Committee are responsible for monitoring the company’s compliance with regulatory requirements, risk management policies and procedures, and for reviewing theadequacy of these policies and procedures in regard to the risks faced by the Company. Both Committees are supported in these functions by the Risk Management Division (RMD), Finance, Compliance, and Internal Audit, through the Executive and Management Committees.
In addition to the Risk Oversight Committee, the MCC Senior Management Team (SMT) consisting of key executive members and/or heads of business play an integral role in the oversight of the effectiveness of risk management policies and processes in the business. The SMT includes the Head of Risk Management.
Their primary responsibility is to assist in fulfilling governance responsibilities by establishing and maintaining a robust risk management program that allows for timely identification, analysis, and rectification of risk issues in addition to day-to-day risk management within the business.
The Company ensures that all risks are identified, monitored, controlled, and reported to appropriate senior management.
CREDIT RISKIn a business where exposure to credit risk is inherent, it is very crucial for the Company to manage the risk effectively. In order to achieve this, the Company ensures that sound credit risk management practices are implemented. This is achieved by having adequate controls and operating within sensible and well-defined credit-granting criteria.
MCC has continuously focused on process improvement, investments in new technology and enhancement in management information systems (MIS). The Company has also developed and continuously enhances an internal credit scoring system to have a more robust credit risk assessment. Through these efforts, the Company believes that the portfolio can be well-managed, quality of customer base will be improved, and sustainability of the business is ensured.

42 Metrobank Card Corporation
The Company manages credit risk guided by the following principles:
•Strict compliance to credit policies. •Credit policies should be in consultation with business units and, where appropriate, supported by MIS reports. This covers credit assessment and process, compliance and regulatory requirements and account management. •Minimize losses by establishing robust credit policies and processes. •Approval of credit facilities should be based on authorization limits approved by the BOD. •Expansion to new markets is controlled through credit testing and full use of avail able credit scoring facilities and credit bureau information. •Management of portfolio through regular monitoring and analysis of acquisition, line management and usage programs with the goal of controlling exposure to bad accounts while maximizing revenue through effective line management and usage campaigns. •Delinquent accounts are managed by implementing robust collection strategies and efficient management of collection resources. •A conscious effort to continuously challenge existing strategies and processes to adapt to changes in the market and maintain the Company’s competitiveness. •To track the performance of the portfolio, Risk Management implements and reviews the credit strategies, policies, models, processes and MIS.
In 2019, Risk Management focused on the validation of the expected credit loss (ECL) models, in compliance to the new accounting standards (PFRS 9), which took effect last January 2018. Several initiatives were implemented aimed at model improvements and a more accurate credit risk classification and provisioning. MARKET RISKMarket risk is the risk to earnings or capital arising from adverse movements in factors that affect the market value of financial instruments. The Company focuses on two market risk areas such as interest rate risk and foreign currency risk.
INTEREST RATE RISKThe Treasury unit is primarily responsible in managing the liquidity, as well as, the interest rate risk of the Company. They ensure borrowings from various sources of funds are availed at the cheapest possible cost at acceptable terms. In measuring interest rate risk, the Company employs gap analysis wherein, an interest rate gap report is prepared by breaking down the balance sheet accounts according to contractual maturities/repricing dates, whichever is applicable. The difference in the amount of assets and liabilities maturing or being repriced in any pre-specified time band would be treated as an indicator of the Company’s exposure to the risk of potential changes in net interest income.
To manage interest rate risk, the RMD uses a quantitative risk model on interest rate risk called the Earnings-at-Risk (EaR). EaR is used to measure any mismatch between assets and liabilities in terms of interest rate repricing and an EaR limit is set over a 1-year period. The limit is established to reduce the potential exposure of earnings and/or capital from changes in interest rates. Such method of measuring and controlling interest rate risk is applied during the year. The BOD approved EaR limit for 2019 as the difference between the 2019 budgeted net interest income and 2018 actual net interest income which amounts to P1.0 billion.
FOREIGN CURRENCY RISKForeign exchange risk (also known as FX risk or currency risk) is defined as the risk

Metrobank Card Corporation 43
to earnings or capital that may arise from movements in foreign exchange rates. It refers to the risk that exchange rate fluctuations may have direct or indirect impact to the firm’s cash flow or to the value of its assets and liabilities and in turn, its profit and capital position.
LIQUIDITY RISK AND FUNDING MANAGEMENTThe Company is continuously working on developing diversified funding sources to support its asset growth, as well as to minimize liquidity and interest rate risks. The Treasury unit, on a daily basis, monitors the cash position of the Company. They ensure that the Company has ample liquidity to settle financial obligations that are due as of a given period. The Treasury unit employs various liquidity/funding tools to determine the expected funding requirements for a particular period.
The RMD prepares the monthly Maximum Cumulative Outflow (MCO) report to measure the liquidity mismatch risk as of a given period. The MCO report provides quantitative information on the potential liquidity risk exposure based on pre-specified time bands. Aside from the MCO report, the RMD also prepares monthly Liquidity Stress testing to augment in measuring potential liquidity risk exposures under different stress scenarios.
CAPITAL MANAGEMENTThe primary objectives of the Company’s capital management are to ensure that it complies with externally imposed capital requirements and to maintain strong credit ratings and healthy capital ratios in order to support its business and to maximize stockholders’ value.
REGULATORY QUALIFYING CAPITALUnder existing BSP regulations, the determination of the Company’s compliance with regulatory requirements and ratios is based on the amount of the Company’s ‘unimpaired capital’ (regulatory net worth) as reported to the BSP, which is determined on the basis of regulatory accounting policies which differs from PFRS in some respects.
In addition, the risk-based capital adequacy ratio (CAR) of the Company with quasi-banking operations, expressed as a percentage of qualifying capital to risk-weighted assets, should not be less than 10.0%.
Risk-weighted assets consist of total assets less cash on hand, amounts due from BSP, loans covered by hold-out or assignment of deposits, loans or acceptances under letters of credit to the extent covered by margin deposits and other non-risk items determined by the Monetary Board (MB) of the BSP. Under BSP Circular No. 360, effective July 1, 2003, the CAR is to be inclusive of a market risk charge.
On January 15, 2013, the BSP issued Circular No. 781, Basel 3 Implementing Guidelines on Minimum Capital Requirements. The guidelines revised the risk-based capital adequacy framework and introduced other minimum capital ratios such as Common Equity Tier 1 (CET1) ratio and Tier 1 Capital ratio of 6.0% and 7.5%, respectively. A capital conservation buffer of 2.5% comprised of CET1 shall also be imposed. BSP Circular No. 781 took effect on January 1, 2014. Last November 29, 2018, the BSP released a circular implementing the Basel III Counter cyclical Capital Buffer (CCyB). Current CCyB is zero percent (0%) subject to upward adjustment as determined by the Monetary Board when systemic conditions warrant up to a maximum of 2.5%.

44 Metrobank Card Corporation
As of December 31, 2019 MCC’s CAR stood at 15.99%, well within the regulatory requirement of 10.0%. Total qualifying capital for the years ended 2019 and 2018 were P18.41 Billion and P14.32 Billion, respectively.

Metrobank Card Corporation 45
Reconciliation of all regulatory capital elements back to the balance sheet in the audited financial statements are as follows (in PhP Millions):
Tier 1 Capital is comprised of common stock, additional paid-in capital, and capital surplus. Common Equity Tier 1 (CET1) represents ordinary share capital, share premium, and retained earnings, including cumulative translation adjustment.Common Equity Tier 1 Capital, Tier 1 Capital, Qualifying Capital, and Risk-WeightedAssets are computed in accordance with BSP regulations. Risk-weighted assets are determined based on standardized regulatory approach for credit risk (both on-and-off balance sheet exposures) and market risk, while operational risks are based on the Basic Indicator Approach (BIA).
The total capital adequacy ratio (CAR) is calculated by dividing the sum of its Tier 1 and Tier 2 capital, as defined under BSP regulations, by the total Risk Weighted Assets (RWA).
OPERATIONAL RISKThe Operational Risk Management facilitates and monitors the implementation of effective risk management practices by operational management and assists risk owners in defining the target risk exposure and reporting adequate risk-related information throughout the organization.
The operational risk management process adopted by MCC consists of a staged approach involving: establishing the context, identification, analysis, treatment, monitoring, review, and reporting of risks.
RISK AND CONTROL SELF-ASSESSMENTRisk and Control Self-Assessment (RCSA) forms an integral element of the overall

46 Metrobank Card Corporation
operational risk framework of MCC, as it provides an excellent opportunity for a firm to integrate and coordinate its risk identification and risk management efforts and generally to improve the understanding, control, and oversight of its operational risks.
INCIDENT REPORTINGIncident Reporting is another process of MCC’s risk management process. The business ensures that incidents, which may have either financial impact and/or reputational damage are escalated promptly. The collection and analysis of incident data provides management information which can be fed back into the operational risk management and mitigation process. Ultimately the database of incidents built up over time will also provide the basis for quantitative modeling and the calculation of capital or reserves allocation, where required.
KEY RISK INDICATORSKey Risk Indicators (KRIs) act as early warning signals by providing the capability to indicate changes in an organization’s risk profile. KRIs are a fundamental component of a full-featured risk and control framework and sound risk management practice. Their usefulness stems from potentially helping the business to reduce losses and prevent exposure by proactively dealing with a risk situation before an event actually occurs.
INFORMATION SECURITY RISK The Business Information Security Office is responsible for overseeing conduct of independent risk assessment and governance of MCC’s information security program, including oversight of information technology risk. This includes establishing, implementing, monitoring and improving controls to ensure protection of MCC information assets, as well as maintaining and improving the overall information security awareness of the organization.
The unit also oversees the overall implementation and compliance of MCC to the Payment Card Industry Data Security Standards (PCI DSS), as mandated by the payment brands. The PCI DSS compliance program aims to pursue certification in the near future and maintain full compliance thereafter. In coordination with Internal Audit, annual compliance reviews are performed and results are submitted to Visa and Mastercard.
COMPLIANCE RISKCompliance risk refers to the risk of legal or regulatory sanctions, financial loss, and loss of reputation that MCC may suffer as a result of its failure to comply with applicable laws, regulations, Codes of Conduct and standards of good practice. This risk exposes the institution to fines, civil money penalties, payment of damages, and the voiding of contracts.
Compliance risk can lead to diminished reputation, reduced franchise value, limited business opportunities, reduced expansion potential, and an inability to enforce contracts.
All business units of MCC are primarily responsible for managing compliance risk of the company. The Compliance Unit, on the other hand, will be responsible for guiding every business unit on the proper implementation of laws, rules and regulations, and directives.

Metrobank Card Corporation 47
To aid in ensuring the organization adhere to laws, rules and regulations of the Bangko Sentral ng Pilipinas (BSP), Anti-Money Laundering Council (AMLC), and Securities Exchange Commission (SEC) and other relevant regulatory agencies, the company has established appropriate Compliance Program Manual which is based on BSP Circular 747 and Memorandum No. M-2013-023.
The Compliance unit was created to oversee and coordinate the implementation of the Compliance Program. Its function includes the identification, monitoring and controlling of compliance risk. This unit reports to and under the direct supervision of the Corporate Governance Committee.
LEGAL RISKLegal risk is the risk of financial or reputational loss arising from legal or regulatory action; disputes for or against the company; failure to properly document, enforce or adhere to contractual arrangements; inadequate management of non-contractual rights; or inability to meet non-contractual obligations.
Legal risk is managed by the Legal Department which is under the Office of the President. It is mandated to provide legal services, assistance, support, initiatives, strategies and action plans on all areas affecting the business and operations of MCC. This includes legal risk assessment, legal risk management and tax compliance.
REPUTATIONAL RISKReputational risk as the current and prospective impact on earnings or capital arising from negative public opinion. This can adversely affect the organization’s ability to maintain existing, or establish new business relationships and continued access to sources of funding. Consequently, it may expose the organization to litigation, financial loss, or a decrease in customer base.
Reputation is considered as a valuable intangible asset, it is an indicator of past performance and future prospects. Damage to this may result in loss of trust and confidence from stakeholders and will eventually adversely affect the organization in sustaining a profitable business. It does not matter whether the event is real or not, it is the perception that counts.
In measuring the reputational risk, each cause / source are appraised based on the categories of likelihood and Consequence indicated under Risk Analysis Section of the Enterprise Risk Management Manual. Historical occurrences and control adequacy in place are considered in evaluating the likelihood of such risk.
STRATEGIC RISKStrategic risk is the potential loss that may arise from: (1) inappropriate, insufficient, or wrong strategy; (2) failed or inadequate strategy and implementation & (3) adverse change in business environment excluding changes in regulation. Being a business risk, strategic risk excludes operation, Information Security and IT Strategies.
MCC’s Board of Directors, together with the Senior Management provides the general direction of the Company and where the business plans of the Business Units are anchored upon. Periodic review of actual performance versus Plan is conducted by the Senior Management with the Board of Directors.

48 Metrobank Card Corporation
ANTI-MONEY LAUNDERINGCompliance to AML laws and regulations, and the identification and prevention of risks related to laundering and terrorist financing activities, are the very objectives of the Anti-Money Laundering/Combating of Terrorist Financing program of MCC. Through its AML program, it seeks to ensure that the business is at all times conducted in conformity with high ethical standards to protect its safety and soundness as well as the integrity of the national banking and financial system. MCC ensures that laws and regulations are always adhered to, and that services are not provided where there is good reason to believe that transactions are associated with money laundering and terrorist financing activities.
Compliance and/or adherence to anti-money laundering principles and regulations is a shared responsibility amongst all employees with Senior Management being vested with the crucial responsibility of ensuring an effective system of internal controls for AML/Terrorist Financing suppression. The Compliance Office has the primary task of managing the implementation of MCC’s Money Laundering Prevention Program. To ensure the independence of the Office, it shall have a direct reporting line to the Board of Directors or to the Corporate Governance Committee on all matters related to AML and terrorist financing compliance and the management of risks associated thereto.
Under the Compliance Office, is the AML Compliance Officer who is a senior officer and is the lead implementer of the MLPP. The AML Compliance Officer is the liaison between MCC, the BSP and the AMLC in matters relating to the MCC’s AML compliance. The Chief Compliance Officer of MCC assumes the concurrent role of AML Officer.

Metrobank Bank Corporation 3Metrobank Card Corporation 49

2 Metrobank Bank Corporation
Our passion for being a responsible and responsive corporate citizen runs parallel with our drive for business excellence. Our relationship with the communities we serve reflects our constant desire to serve Filipinos throughout the different aspects of their lives.
CORPORATE SOCIAL RESPONSIBILITY
50 Metrobank Card Corporation

Metrobank Card Corporation 51

2 Metrobank Bank Corporation 52 Metrobank Card Corporation

Metrobank Card Corporation 53
CORPORATE SOCIAL RESPONSIBILITY
Metrobank Card Corporation (MCC) has always envisioned to be an organization committed to fulfilling its responsibility to the community. The year 2019 allowed MCC and its employees to give back to various beneficiaries in many ways.
SHARING GIFTS OF HOPEMCC has been a partner Make-A-Wish Philippines for over a decade in giving hope and joy by granting the wishes of children with critical illnesses. In 2019, MCC granted the wish items of 30 wish kids — 22 of which spent time with about a hundred employee volunteers for a total of around 300 volunteer hours. Together, they spent three memorable afternoons doing fun activities, such as learning how to make a pizza at Shakey’s, creating do-it-yourselves projects like binoculars and ornaments, and celebrating the holidays with games and a guest Santa Claus at Metrobank Card Center.
GIVING BACK TO COMMUNITIESMCC gathered volunteers at an org-wide level for initiatives of various partner organizations, such as Metrobank Foundation’s Bags of Blessings, Manila Tytana Colleges’ Founder’s Run, and Manila Doctors Hospital’s adopted schools for Brigada Eskwela.
Several departments of MCC also organized their respective CSR activities where they devoted their time to help various groups. These include a house building initiative with Gawad Kalinga, a clean-up drive for Sta. Ana E lementary school, a relief operations repacking initiative for typhoon-stricken communities with the Department of Social Welfare and Development – National Resource Operations Center, as well as feeding programs for San Pedro Calungsod Parish Sanctuary of Padre Pio and San Lorenzo Home for the Elderly.
MCC employees also had fundraising efforts for cash and in-kind donations. Beneficiaries include the Little Sisters of the Abandoned Elderly, Sta. Ana Elementary School, White Cross, Inc., the Good Shepherd Convent, Manila Doctors Hospital’s in-house surgical programs and its adopted tree park, the Arroceros Park, and the Missionaries of the Poor Divine Mercy Monastery and Apostolate Center through the help of the Philippine Air

54 Metrobank Card Corporation
Force – 520th Air Base Wing.
Overall, the various initiatives of MCC had a combined total of about 900 attendees with over 4,000 volunteer hours. HONORING EXTRAORDINARY SERVICEIn 2019, MCC has awarded Metrobank Foundation’s 10 Outstanding Filipinos – Teachers, Police Officers, and Soldiers – with exclusivelycustomized Metrobank credit cards to salute them for their service. Through these cards, MCC aims to empower these modern-day Filipino heroes as they continue to serve as an inspiration to many Filipinos.
MCC also supported Metrobank Foundation and DepEd in their National Teachers’ Month celebrations through internal activities such as having employees to wear yellow and post org-wide photos or messages to thank their teachers on the working day near National Teachers’ Day.
ADVOCATING FOR BREAST CANCER AWARENESSMCC continues to extend its cause for breast cancer awareness to its cardholders through the Metrobank Femme-ICanServe Visa, a credit card partnership with ICanServe (ICS) Foundation, which is a nationwide network of cancer survivors who help and give hope to women with breast cancer. Metrobank Femme-ICanServe Visa cardholders have the option to donate to ICS by converting earned Rewards Points. Plus, they can participate in its Breast Cancer Awareness Month catalogue promotion – wherein MCC donates P100 to ICS for every P2,000 cardholder spend at select merchants. Since the partnership launched in 2012, MCC has donated an accumulated total of about P200,000 through this yearly promotion, which helped fund the information campaigns and breast cancer screenings of the foundation.

Metrobank Card Corporation 55

2 Metrobank Bank Corporation
The core of Metrobank Card Corporationrelies on passion, purpose, collaboration, and customer-centric efforts. These traits, guided by our mission, vision, and values, have helped shape us into the industry-leading organization that we are today.
LEADERSHIP
56 Metrobank Card Corporation

Metrobank Card Corporation 57

58 Metrobank Card Corporation
BOARD OF DIRECTORS
FABIAN S. DEEChairmanFilipino, 57
President, Metropolitan Bank and Trust Company | Chairman, Metro Remittance Singapore Pte Ltd. | Trustee, Metrobank Foundation, Inc. | Director, Bankers Association of the Philippines | Former Chairman, SMBC Metro Investment Corporation | Former Director, Bancnet, Inc. | Acting Chairman, LGU Guarantee Corporation | Former Director, FMIC Equities, Inc. | Former Senior Vice President, Executive Vice President, Adviser, and Director, Metropolitan Bank and Trust Company | Former Adviser, Metropolitan Bank (Bahamas) | Former Director, SMBC Metro Investment Corporation | Former Consultant, First Metro Investment Corporation | Former Vice Chairman, Toyota Manila Bay | Former Senior Vice President, Middle Market, Security Bank Corporation
ANJANETTE T. DY BUNCIO Vice ChairpersonFilipino, 52
Treasurer, GT Capital Holdings, Inc. | Vice President and Treasurer, Global Treasure Holdings, Inc. | Vice President and Treasurer, Grand Titan Capital Holdings, Inc. | Director, Treasurer, Former Corporate Secretary, Former First Vice President and Former Vice President, Federal Land, Inc. | Treasurer and Corporate Secretary, Bonifacio Landmark Realty Development Corp. | Corporate Secretary, Bonifacio Landmark Hotel Management Corp. | Treasurer and Corporate Secretary, North Bonifacio Landmark Realty and Development Inc. | Treasurer, Adviser, and Former Director, Cathay International Resources | Treasurer, Federal Land Orix Corporation | Director, Treasurer, and Senior Vice President, Horizon Land Property Development Corp. | Director, Treasurer, and President, Federal Homes, Inc. | Director, Treasurer, Senior Vice President, and Former First Vice President, Philippine Securities Corp. | Director and President, Inter Par Philippines Resources | Director, Treasurer, and Vice President, Great Mark Resources Corp | Director, President, and Former Executive Vice President, Tytana Corporation | President and Director, Neiman Rhodes Holdings, Inc. | Corporate Secretary and Former Senior Vice President, Metrobank Foundation, Inc. | Board of Trustee and Vice President, GT Foundation Inc. | Treasurer, Manila Medical Services Inc., | Executive Vice President and Corporate Secretary, Proline Sports Center, Inc. | Treasurer, Integra Development Corp. | Executive Vice President and Corporate Secretary, Corporate Secretary Pro Oil Corp. | Former Director, Treasurer, and Adviser, Property Company of Friends, Inc. | Former Treasurer, Omni Orient Management Corp. | Former Senior Vice President, Treasurer, Corporate Secretary, and Assistant Treasurer, Global Business Power Corp. | Former Director, Federal Brent Retail Inc. | Former Director, Bonifacio Landmark Realty Development Corp. | Former Vice President, Senior Manager, Manager, Asst. Manager, Metropolitan Bank & Trust Company | Former Director and Corporate Secretary, Phil. AXA Life Insurance Corp. | Former Asst. Treasurer and Asst. Corporate Secretary, Thomas Cook Phils. Inc. | Former Asst. to the President (seconded), First Metro Investment Corp | Former Trader, Berliner Handels und Frankfurter

Metrobank Card Corporation 59
RAMON JAIME L. VIVENCIO DEL ROSARIO President / DirectorFilipino, 43
SVP/Cards and Personal Credit Sector Head, Metropolitan Bank and Trust Company | Former Director, Cards & Loans Business Indonesia, Citibank N.A. | Former Consultant, Cards and Loans Head Indonesia, Citibank N.A. | Former SVP, Cards Product Management Philippines, Citibank N.A. | Former VP, Partnerships and Business Development Philippines, Citibank N.A. | Former AVP, Marketing Citibank India, Citibank N.A. | Former AVP, Risk Management Citibank India, Citi, Citibank N.A. | Former AVP, Portfolio Management Philippines, Citibank N.A. | Former Marketing Manager, Cards Citi Philippines, Citibank N.A. | Former Cards Product Manager, Cards Citi Philippines, Citibank N.A.
RICHARD BENEDICT S. SO DirectorFilipino, 54
Executive Vice President and Head, Branch Banking – Countryside, and Executive Vice President and Segment Head, Transaction Banking Segment, Metropolitan Bank and Trust Company | Chairman, Metro Remittance (Hong Kong) Limited | Chairman, First Metro InternationalInvestment (Hong Kong) |Chairman, MetroRemittance Center, Inc. (U.S.A.) | Chairman, MB Remittance Center (Hawaii), Ltd. | Chairman, Metro Remittance (Canada) Inc. | Chairman, Metro Remittance (U.S.A.), Inc. (formerly MFCCI) | Chairman, Metro Remittance (UK) Limited |Chairman, Metro Remittance(Italia) SpA | Vice Chairman, Metro Remittance Singapore Pte. Ltd. | Director, Metropo l i tan Bank (Bahamas) L td . | Corporate Secretary, Metropolitan Bank (China) Ltd. | Former Senior Vice President – Deputy Group Head, Metropolitan Bank and Trust Company | Former Senior Vice President, BDO Unibank, Inc. | Former Vice President and Senior Vice President, Equitable PCI Bank, Inc. | Former Assistant Vice President and Vice President, Equitable Bank | Former Staff-Manager, Far East Bank and Trust Co. | Former Chairman, Metro Remittance (Spain) S.A. | Former Director, MBTC Services

60 Metrobank Card Corporation
FRANCISCO S. MAGSAJO, JR.Independent DirectorFilipino, 72
ANNA THERESE RITA D. CUENCOTreasurer
MA. LOURDES C. PLATA-ABELLAR
Corporate Secretary
MARIA SOFIA A. LOPEZAssistant Corporate
Secretary
ATTY. ANGELICA H. LAVARES Independent DirectorFilipino, 67
BENEDICTO JOSE R. ARCINAS DirectorFilipino, 64
Director, Philippine Veterans Bank | Director, HFM Investment, Inc. | Director, ABR Integrated Farms Corporation | Former President and CEO, Rizal Commercial Banking Corporation |Former President and CEO, RCBC Savings Bank | Former Executive Vice President, Philippine National Bank | Former Managing Director, PNB International Finance Ltd., HK | Former Director, Batangas Sugar Central | Former Director, Bulawan Mining Corp. | Former President and CEO, PhilEXIM
Independent Director, Metropolitan Bank and Trust Company | Independent Director, Inter-Asia Development Bank | Consultant, Bank of Commerce | Fellow, Institute of Corporate Directors | President, Araneta Hernandez Lavares Consultancy Inc. | Former IndependentDirector, Williamton Financing Corporation | Former Executive Vice President, Bank of Commerce | Former Senior Vice President and Compliance Officer, Metropolitan Bank and Trust Company | Former First Vice President, UCPB | Former Vice President, Filinvest Land, Inc. | Former General Manager, M. Greenfiled, Inc. and Bernard Chaus, Inc. | Former Special Asst. to the Commissioner, Bureau of Customs | Former OIC, Garments & Textile Export Board
President & General Manager, Arcinas Freres, Inc. | Independent Director, Philippine Savings Bank | Former Executive Vice President and Treasurer, Export and Industry Bank | Former Director, Asia Pacific Recoveries (SPV-AMC), Asia Special Situations (SPV-AMC) | Founder and Former Managing Director, Structured Solutions, Inc. | Managing Director, ATR-Kim Eng Fixed Income, Inc. | Former Director, Peregrine Fixed Income Ltd., HK | Former Executive Vice President,Chief Investment Officer and Head, Finance Sector, Government Service Insurance System (GSIS)
BOARD OF DIRECTORS
BOARD OFFICERS

Metrobank Card Corporation 61
ORGANIZATIONAL STRUCTURE
RAMON JAIME L. VIVENCIO DEL ROSARIO
President
RISK AUDITIT
STEERING NOMINATION,
COMPENSATION &REMUNERATION
EXECUTIVE COMMITTEE
CORPORATE GOVERNANCE
RELATEDPARTY
TRANSACTIONS
ROWEL S. ANDAYARisk Management
HARRISON C. GUEOperations
CESAR P. NICOLASORA, JR.
Finance
MARY GRACE L. NAVARRO
Decision Management
JOSE CAESAR B. PLOFINO
Merchant Acquiring
ATTY. ROMMEL T. OQUENDO
Legal
PAMELA I. JIMENEZ
Compliance, AML & Internal Audit
JOCELYN L. BATACredit Card Sales, Alliances, & Other
Channels•Business
Information Security
•Market and Liquidity Risk Management•Operating
Risk and BCP•Portfolio
and Analytics•Risk
Acquisition and Strategy Management
•Risk Management Analytics
•Card Operations•Customer Service
& Telesales (Anti-Attrition,
Insurance, Acquisition &
Portfolio Action)•Shared Services
•Systems Fulfillment and MIS
•Financial Accounting•Financial
Planning and Analytics
•Finance Systems, Quality and
Control•Reconc i l i a t ion
and Settlement•Treasury•Treasury
Operations
•Strategic Business Analytics•Data and
Information Management
•Merchant Acquiring
Sales•Business
Support and Services
•Legal•Data Privacy
•Compliance•Internal Audit
•Branch Sales•Territory Sales
•Channel Enabler•Direct Sales•Sales MI and Governance•Training and Development
•SalesOperations
and Business Support
ALOYSIUS C. ALDAY, JR.Prepaid Card &
Insurance
HIROKO M. CASTRO
Credit Operations
SHAHLENA G. JAVIER
Service Quality
FRANCIS ANDRE Z. DE LOS SANTOS
Business Technology
MARIE ANTHONETTE L. SANTIAGO
Human Resources
FRANCIS RAMON L. TIOSECOCredit Card Marketing
•Prepaid Cards•Insurance
•Authorizations, Fraud and
Chargeback•Credit
Acquisition•Collections
and Recoveries
•Service Quality•Project Management
Office, Quality Assurance
and Business
Development•Business Solutions
•Technology Infrastructure
•IT Quality Review•IT Security•Systems Control
and IT Service Desk•Acquiring Technical Solutions
•Employee Relations & Engagement
•HRIS, Compensation and
Benefits•Learning and Development
•Talent Acquisition•Internal
Communications and Corporate
Social Responsibility
•Acquisition•Product
Management•Usage and
Portfolio Management
•Marketing Services and Corporate
Communications
EXECUTIVE OFFICE
BOARD OF DIRECTORS
BOARD COMMITTEES

62 Metrobank Card Corporation
MANAGEMENT COMMITTEE
RAMON JAIME L.V. DEL ROSARIO.
President
HIROKO M. CASTROHead of Credit Operations
Senior Vice President
ALOYSIUS C. ALDAY, JR
Head of Prepaid and Insurance Business
Senior Vice President
HARRISON C. GUEHead of Operations
Senior Vice President
JOCELYN L. BATA
Head of Credit Card Sales, Alliances & Other Channels
Senior Vice President
CESAR P. NICOLASORA, JR.Chief Finance OfficerSenior Vice President
MARIE ANTHONETTE L. SANTIAGOHead of Human Resources
& Metrobank HR Shared ServicesSenior Vice President

ROWEL S. ANDAYA
Chief Risk OfficerFirst Vice President
MARY GRACE L. NAVARROHead of Business &
Customer IntelligenceFirst Vice President
FRANCIS ANDRE Z. DE LOS SANTOS
Chief Business Technology OfficerFirst Vice President
JOSE CAESAR B. PLOFINOHead of Merchant Acquiring BusinessFirst Vice President
PAMELA I. JIMENEZ
Compliance & AML Officer and Head of Internal Audit
First Vice President
FRANCIS RAMON L. TIOSECOHead of Usage &
Portfolio ManagementFirst Vice President
ATTY. ROMMEL T. OQUENDOHead of LegalVice President
Metrobank Card Corporation 63

64 Metrobank Card Corporation
SENIOR VICE PRESIDENTS
ALOYSIUS C. ALDAY, JR.
Head of Prepaid and Insurance BusinessFilipino, 50
JOCELYN L. BATA
Head of Credit Card Sales, Alliances & Other Channels
Filipino, 45
HIROKO M. CASTROHead of Credit Operations
Filipino, 50
ANNA THERESE RITA D. CUENCO Head of Consumer Lending Group
(seconded to MBTC)Filipino, 46
Former Head of Prepaid Card Business, Head of Sales, Head of Business Development, Alliances and Channels, Head of Services and Support, and Head of Marketing and Sales, Metrobank Card Corporation | Former Vice President - Cards Marketing and Sales, Assistant Vice President - Personal Financial Services Credit Risk Management, Assistant Vice President - Credit Risk Management, Manager - Marketing and Product Development, and Management Trainee, The Hongkong and Shanghai Banking Corporation Ltd. | Former Commodities Trader, Mitsubishi Corporation | Former Financial Analyst, NCR Corporation (US Headquarters) | Undergraduate degree: BS Business Administration, University of the Philippines - Diliman
Former Senior Vice President - Citigold Priority Channel Head, Vice President - Sales & Distribution Head, Vice President - Affluent Sales Head, Vice President - Telesales Acquisitions Unit Head - Cards, Assistant Vice President - TelesalesAcquisitions Channel Team Leader - Cards, Telesales Acquisitions Channel Team Leader - Cards, Telesales Acquisitions Channel Manager - Cards, Telesales Acquisitions Channel Manager - Ready Credit, and Citigold Relationship Officer, Citibank N.A. | Former Senior Vice President - Branch Network Head, Citibank Savings Inc. | Former Assistant Manager - Telesales Head, The Hongkong and Shanghai Banking Corporation Ltd. | Undergraduate degree: BS Tourism, University of the Philippines - Diliman
Former Head of Credit Risk, and Head of CreditAcquisitions, Metrobank Card Corporation | Former Acceptance Manager, Credit Acquisitions Group, Credit Acquisitions Maintenance Unit Head, and Credit Officer, Citibank N.A. | Former Account Executive, Fujitsu Philippines, Inc.| Undergraduate degree: BS Management Engineering, Ateneo de Manila University
Former Deputy Cards Head, Head of Sales, Marketing, & Portfolio Management, Head of Credit Risk, Head of Collections, Metrobank Card Corporation Former In-House Collections Head, Assistant Manager Recoveries, Collections Staff, and Collection Officer, The Hongkong and Shanghai Banking Corporation Ltd. | Undergraduate degree: AB Management Economics, Ateneo de Manila University

Metrobank Card Corporation 65
FIRST VICE PRESIDENTS
HARRISON C. GUE
Head of OperationsFilipino, 54
ROWEL S. ANDAYA
FRANCIS ANDRE Z. DE LOS SANTOS
PAMELA I. JIMENEZ
ELMER K. MERCADO
CESAR P. NICOLASORA, JR.
Chief Finance OfficerFilipino, 45
MARIE ANTHONETTE L. SANTIAGO
Head of Human ResourcesFilipino, 46
Former Head of Operations & Technology, Metrobank Card Corporation | Former Vice President - Head of Credit Initiation, Citibank N.A. | Former First Vice President - Head of Operations, Banco De Oro – EPCI Universal Bank | Former First Vice President - Head of Operations, Equitable Card Network, Inc. | Former Manager - Merchant Banking Group, Equitable Banking Corporation | Former Assistant Manager, China Banking Corporation| Former Technical Staff – Researcher/Programmer, SGV & Co | MBA Degree: Asian Institute of Management | Undergraduate degree: BS Commerce, De La Salle University
Former Business Finance Head, and Consumer Lending Finance Head, EastWest Banking Corporation | Former Consumer Bank Financial Planning & Analysis Head, and Credit Cards Financial Planning & Analysis Head, Citibank N.A. | Former Finance Planning Head, and Planning & Accounting Head, Me-trobank Card Corporation | Former Business Finance Manager, Standard Chartered Bank | Former Senior Manager, and Manager, SB Cards Corporation | Former Account Officer, and Officership Training Program, BPI | MBA Degree: DLSU Graduate School of Business | Undergraduate degree: BS Business Administration & Accountancy, University of the Philippines - Diliman
Former HR Manager and ER Manager, Convergys Phils. Services Corp. | Former Training/OD Manager & ER Manager, DHL Worldwide Express (Phils.) Corp. | Former HR Officer & Recruitment/Training Officer, Belle Corporation | Former Recruitment & Career Management Assistant, Nissan Motor Phils, Inc. | MS Degree in Human Resource: University of Santo Tomas | Undergraduate degree: BA Behavioral Science, University of Santo Tomas

66 Metrobank Card Corporation
FIRST VICE PRESIDENTS
VICE PRESIDENTS
MARY GRACE L. NAVARRO
JOSE JULIAN E. BADURIA, JR.
ATTY. ROMMEL T. OQUENDO
ALBERT ARNOLD A. TOM
JOSE CAESAR B. PLOFINO
THOMAS WILFRIDO R. BILBAO
MARIA CRISTINE D. REYES
SHEILA P. UMALI
FRANCIS RAMON L. TIOSECO
ION EDMOND A. DE GUZMAN
JAY S. TATEL
TRICIA H. VALERIO

Metrobank Bank Corporation 64
SENIOR ASSISTANT VICE PRESIDENTS
ANNA LISSA C. AÑO
REUBEN RINALDI Y. COBANKIAT
MICHAEL R. GABRIEL
AL-JALIL B. BANDALI
EMMA R. DE PANO
RAFAEL B. GAMAD, JR.
MIGUEL PAOLO L. BELTRAN
IVAN DRIETER D. EUSEBIO
FRANCES LEA C. GUINO
Metrobank Card Corporation 67

68 Metrobank Card Corporation
SENIOR ASSISTANT VICE PRESIDENTS
WELLINGTON M. JAVELLANA, JR.
JOHN OLIVER T. KO
ALBERT ROY D. NAVARRETE
SHAHLENA G. JAVIER
ANDRO JOSE M. LAGMAN
JANYLOU M. ROMARAOG
ELVIRA S. ZABLAN
ATTY. APOLONIO C. JUAN II
ANNE KRISTEN Y. MACALLAN
WINNIE VIC G. VENTURA

Metrobank Card Corporation 69
ASSISTANT VICE PRESIDENTS
MALVIN B. BALLARTA
SHEILA MONICA Y. BAUTISTA
ABIGAEL LILY C. CHIO
BERNAL S. BANTILAN
MARY GRACE D. BERAÑA
RAFAEL D. DURENDEZ
PEACE E. IBARRA
MICHAEL C. BAUTISTA
GERLY ANNE G. BERNISCA
NOLAN CARLO U. EMPALMADO

70 Metrobank Card Corporation
ASSISTANT VICE PRESIDENTS
JOHANN THERESE L. JAYME
FREDERICK V. PIEDAD
MATIAS A. MAITIM
NADJA CECILIA R. MARQUEZ
EMMANUEL MA. E. JOSE
AILEEN B. MALCO
RONALDO T. PAHATI
HELEN A. PANLILIO
MARIA KARENIÑA R. LOPEZ
JOSEPH VINCENT L. PANGILINAN

Metrobank Card Corporation 71
LIEZL O. ROGANDO
KHAREN S. SEROTE
MARIA SHIELA E. PUNSALAN
JAMIE ROSE D. ROMUALDEZ
ALVIN T. SERRANO CARLSTEN A. TERROBIAS
CHRISTIAN PATRICK B. RAMIREZ
GAIL JOSEPH S. SANTOS
FRANCIS L. TAN

2 Metrobank Bank Corporation
CORPORATEINFORMATION

Metrobank Card Corporation 73
Metrobank Card Corporation (A Finance Company and General Insurance Agency) [MCC] is a 100% whol ly-owned subsidiary of Metropol i tan Bank and Trust Company (Metrobank), which is one of the largest banks in the Phi l ippines.
MCC is one of the leading payment solut ions providers in the country issuing credit cards, prepaid cards, acquir ing services, insurance and other products with dist inct advantages to i ts customers.
METROBANK CARD CENTER6778 Ayala Avenue, Makati City, Philippines 1226
MCC METROPARKMetropolitan Technological Park Building, Metropolitan Park corner Metrobank Avenue, EDSA Extension, Pasay City, Philippines 1308
MCC CEBUMetrobank Plaza Building, Osmeña Boulevard, Cebu City, Philippines 6000
MCC DAVAOMetrobank Davao Center Branch, Ramon Magsaysay Avenue corner J. Dela Cruz St., Davao City 8000
CONTACT INFORMATION
24/7 Contact Center: Metro Manila: (632) 88-700-900
Customer Service: (632) 88-700-700
Domestic Toll Free: 1-800-1888-5775
MCC Websitewww.metrobankcard.com
MCC Social Media@metrobankcardph
Facebookwww.facebook.com/MetrobankCardPH
Instagramwww.instagram.com/MetrobankCardPH
Twitterwww.twitter.com/MetrobankCardPH
YAZZ Websitewww.yazzcard.com
YAZZ Social Media@yazzcardPH
Facebookwww.facebook.com/yazzcardPH
Instagramwww.instagram.com/yazzcardph
Twitterwww.twitter.com/yazzcardPH

FINANCIALSTATEMENTS
74 Metrobank Card Corporation

Metrobank Card Corporation 75
Metrobank Card Corporation(A Finance Company and
General Insurance Agency)
(A Wholly Owned Subsidiary of
Metropolitan Bank and Trust Company)
Financial Statements
December 31, 2019 and 2018
And
Independent Auditor’s Report

*SGVFS038854*
INDEPENDENT AUDITOR’S REPORT
The Stockholders and the Board of DirectorsMetrobank Card Corporation
Report on the Audit of the Financial Statements
Opinion
We have audited the financial statements of Metrobank Card Corporation (A Finance Company and
General Insurance Agency) (the Company), which comprise the statements of financial position as atDecember 31, 2019 and 2018, and the statements of income, statements of comprehensive income,statements of changes in equity and statements of cash flows for the years then ended, and notes to thefinancial statements, including a summary of significant accounting policies.
In our opinion, the accompanying financial statements present fairly, in all material respects, the financialposition of the Company as at December 31, 2019 and 2018, and its financial performance and its cashflows for the years then ended in accordance with Philippine Financial Reporting Standards (PFRSs).
Basis for Opinion
We conducted our audits in accordance with Philippine Standards on Auditing (PSAs). Ourresponsibilities under those standards are further described in the Auditor’s Responsibilities for the Auditof the Financial Statements section of our report. We are independent of the Company in accordancewith the Code of Ethics for Professional Accountants in the Philippines (Code of Ethics) together with theethical requirements that are relevant to our audit of the financial statements in the Philippines, and wehave fulfilled our other ethical responsibilities in accordance with these requirements and the Code ofEthics. We believe that the audit evidence we have obtained is sufficient and appropriate to provide abasis for our opinion.
Responsibilities of Management and Those Charged with Governance for the Financial Statements
Management is responsible for the preparation and fair presentation of the financial statements inaccordance with PFRSs, and for such internal control as management determines is necessary to enablethe preparation of financial statements that are free from material misstatement, whether due to fraud orerror.
In preparing the financial statements, management is responsible for assessing the Company’s ability tocontinue as a going concern, disclosing, as applicable, matters related to going concern and using thegoing concern basis of accounting unless management either intends to liquidate the Company or to ceaseoperations, or has no realistic alternative but to do so.
SyCip Gorres Velayo & Co.6760 Ayala Avenue1226 Makati CityPhilippines
Tel: (632) 891 0307Fax: (632) 819 0872ey.com/ph
BOA/PRC Reg. No. 0001, October 4, 2018, valid until August 24, 2021SEC Accreditation No. 0012-FR-5 (Group A), November 6, 2018, valid until November 5, 2021
A member firm of Ernst & Young Global Limited

*SGVFS038854*
- 2 -
Those charged with governance are responsible for overseeing the Company’s financial reporting process.
Auditor’s Responsibilities for the Audit of the Financial Statements
Our objectives are to obtain reasonable assurance about whether the financial statements as a whole arefree from material misstatement, whether due to fraud or error, and to issue an auditor’s report thatincludes our opinion. Reasonable assurance is a high level of assurance, but is not a guarantee that anaudit conducted in accordance with PSAs will always detect a material misstatement when it exists.Misstatements can arise from fraud or error and are considered material if, individually or in theaggregate, they could reasonably be expected to influence the economic decisions of users taken on thebasis of these financial statements.
As part of an audit in accordance with PSAs, we exercise professional judgment and maintainprofessional skepticism throughout the audit. We also:
· Identify and assess the risks of material misstatement of the financial statements, whether due to fraudor error, design and perform audit procedures responsive to those risks, and obtain audit evidence thatis sufficient and appropriate to provide a basis for our opinion. The risk of not detecting a materialmisstatement resulting from fraud is higher than for one resulting from error, as fraud may involvecollusion, forgery, intentional omissions, misrepresentations, or the override of internal control.
· Obtain an understanding of internal control relevant to the audit in order to design audit proceduresthat are appropriate in the circumstances, but not for the purpose of expressing an opinion on theeffectiveness of the Company’s internal control.
· Evaluate the appropriateness of accounting policies used and the reasonableness of accountingestimates and related disclosures made by management.
· Conclude on the appropriateness of management’s use of the going concern basis of accounting and,based on the audit evidence obtained, whether a material uncertainty exists related to events orconditions that may cast significant doubt on the Company’s ability to continue as a going concern.If we conclude that a material uncertainty exists, we are required to draw attention in our auditor’sreport to the related disclosures in the financial statements or, if such disclosures are inadequate, tomodify our opinion. Our conclusions are based on the audit evidence obtained up to the date of ourauditor’s report. However, future events or conditions may cause the Company to cease to continueas a going concern.
· Evaluate the overall presentation, structure and content of the financial statements, including thedisclosures, and whether the financial statements represent the underlying transactions and events in amanner that achieves fair presentation.
We communicate with those charged with governance regarding, among other matters, the planned scopeand timing of the audit and significant audit findings, including any significant deficiencies in internalcontrol that we identify during our audit.
A member firm of Ernst & Young Global Limited

*SGVFS038854*
- 3 -
Report on the Supplementary Information Required Under Revenue Regulations 15-2010
Our audits were conducted for the purpose of forming an opinion on the basic financial statements takenas a whole. The supplementary information required under Revenue Regulations 15-2010 in Note 28 tothe financial statements is presented for the purpose of filing with the Bureau of Internal Revenue and isnot a required part of the basic financial statements. Such information is the responsibility of themanagement of Metrobank Card Corporation. The information has been subjected to the auditingprocedures applied in our audit of the basic financial statements. In our opinion, the information is fairlystated, in all material respects, in relation to the basic financial statements taken as a whole.
SYCIP GORRES VELAYO & CO.
Veronica Mae A. ArcePartnerCPA Certificate No. 0117208SEC Accreditation No. 1740-A (Group A), February 7, 2019, valid until February 6, 2022Tax Identification No. 234-282-413BIR Accreditation No. 08-001998-135-2018, December 17, 2018, valid until December 16, 2021PTR No. 8125206, January 7, 2020, Makati City
February 19, 2020
A member firm of Ernst & Young Global Limited

*SGVFS038854*
METROBANK CARD CORPORATION(A Finance Company and General Insurance Agency)
(A Wholly Owned Subsidiary of Metropolitan Bank and Trust Company)
STATEMENTS OF FINANCIAL POSITION
December 31
2019 2018
ASSETS
Current Assets
Cash and cash equivalents (Notes 6 and 21) P=743,566,359 P=1,082,125,457Due from Bangko Sentral ng Pilipinas (Notes 6 and 12) 5,994,131,053 9,526,731,502Interbank loans receivable (Notes 6 and 21) 174,919,590 2,200,000,000Accounts receivable (Notes 7 and 21) 72,058,281,654 58,455,080,198Prepaid expenses and other current assets (Notes 10 and 21) 290,750,056 137,620,981
79,261,648,712 71,401,558,138
Noncurrent Assets
Accounts receivable (Notes 7 and 21) 11,163,937,178 8,338,446,930Property and equipment (Note 9) 713,202,096 645,335,011Equity instruments at fair value through other comprehensive income
(FVOCI) (Note 10) 28,157,760 28,157,760Deferred tax assets (Note 20) 2,087,849,967 1,927,572,853Intangibles and other assets (Note 10) 501,804,221 460,716,696Right-of-use assets (Notes 18 and 21) 52,593,546 –
14,547,544,768 11,400,229,250
P=93,809,193,480 P=82,801,787,388
LIABILITIES AND EQUITY
LIABILITIES
Current Liabilities
Accounts payable (Notes 11 and 21):Merchants P=2,134,218,822 P=1,525,460,186Others 921,777,274 920,509,565
3,055,996,096 2,445,969,751Bills payable (Notes 12 and 21) 40,794,454,390 20,998,410,202Notes payable (Notes 12 and 21) 15,898,866,703 20,481,873,027Derivative liabilities (Notes 8 and 21) 307,312,884 99,372,282Deferred revenue (Note 13) 1,119,502,772 1,068,800,101Lease liabilities (Notes 18 and 21) 27,175,140 –Provisions (Note 23) 775,778,673 915,675,612Income tax payable 607,688,809 713,512,283Accrued interest, taxes and other expenses (Notes 15 and 21) 1,477,685,634 1,091,695,882
64,064,461,101 47,815,309,140
Noncurrent Liabilities
Bills payable (Notes 12 and 21) 1,911,288,634 7,987,465,461Notes payable (Notes 12 and 21) 6,784,617,588 10,835,553,040Subordinated debt (Note 14) 1,165,701,077 1,164,611,135Lease liabilities (Notes 18 and 21) 28,311,826 –Retirement liability (Note 19) 374,400,266 172,936,609
10,264,319,391 20,160,566,245
74,328,780,492 67,975,875,385
(Forward)

*SGVFS038854*
- 2 -
December 31
2019 2018
EQUITY
Capital stock (Note 16) P=1,000,000,000 P=1,000,000,000Additional paid-in capital 76,071,752 76,071,752Retained earnings (Note 16):
Unappropriated 5,770,229,732 7,858,744,448Appropriated 13,000,000,000 6,000,000,000
Remeasurement losses on retirement plan (Note 19) (294,840,141) (125,608,514)Net fair value gains on equity instruments at FVOCI 19,700,689 19,700,689Cash flow hedge reserve (Note 8) (90,749,044) (2,996,372)
19,480,412,988 14,825,912,003
P=93,809,193,480 P=82,801,787,388
See accompanying Notes to Financial Statements

*SGVFS038854*
METROBANK CARD CORPORATION(A Finance Company and General Insurance Agency)
(A Wholly Owned Subsidiary of Metropolitan Bank and Trust Company)
STATEMENTS OF INCOME
Years Ended December 31
2019 2018
REVENUES
Interest and penalties (Note 7) P=15,882,214,105 P=14,252,800,043Discounts earned (Notes 13 and 21) 2,877,594,157 2,411,581,701Membership fees and dues (Note 13) 907,180,596 882,661,306Recoveries of accounts written-off (Note 13) 530,501,759 540,579,528Awards revenue (Note 13) 81,003,543 67,890,112Interest income from banks (Notes 6 and 21) 9,618,276 17,670,497Miscellaneous (Notes 13, 17 and 21) 1,063,983,795 932,110,429
21,352,096,231 19,105,293,616
EXPENSES
Provision for credit losses (Note 7) 5,153,457,368 4,548,755,634Interest expense (Notes 12, 14 and 21) 3,299,334,545 2,210,757,921Compensation and fringe benefits (Notes 15, 19 and 21) 1,871,133,868 1,706,822,678Taxes, duties and license fees (Note 15) 1,552,899,025 1,236,680,286Advertising and promotions (Note 15) 494,511,418 444,107,219Communications (Notes 15 and 21) 383,307,244 393,274,599Rent, light and water (Notes 18 and 21) 228,937,488 249,130,354Loyalty expense (Note 13) 220,252,752 180,158,557Amortization of intangible assets (Note 10) 206,280,154 181,508,945Depreciation of property and equipment and right-of-use assets
(Notes 9, 18 and 21) 123,549,574 101,120,953Distribution costs (Note 21) 105,024,336 99,799,521Stationery, office supplies and printing 91,033,109 71,196,684Computer-related expenses (Note 21) 40,085,882 48,892,362Security, messengerial and janitorial (Note 21) 23,138,046 22,310,740Management and professional fees (Notes 15 and 21) 18,570,860 26,161,146Transportation and travel 7,203,513 7,650,084Entertainment, amusement and recreation (Note 20) 1,303,284 1,627,980Miscellaneous (Notes 17 and 21) 515,669,929 472,130,849
14,335,692,395 12,002,086,512
INCOME BEFORE INCOME TAX 7,016,403,836 7,103,207,104
PROVISION FOR (BENEFIT FROM) INCOME TAX (Note 20)Corporate 2,192,148,128 2,296,078,462Deferred (87,749,274) (165,743,966)Final 519,698 509,063
2,104,918,552 2,130,843,559
NET INCOME P=4,911,485,284 P=4,972,363,545
See accompanying Notes to Financial Statements.

*SGVFS038854*
METROBANK CARD CORPORATION(A Finance Company and General Insurance Agency)
(A Wholly Owned Subsidiary of Metropolitan Bank and Trust Company)
STATEMENTS OF COMPREHENSIVE INCOME
Years Ended December 31
2019 2018
NET INCOME P=4,911,485,284 P=4,972,363,545
OTHER COMPREHENSIVE INCOME (LOSS)
Item that recycle to profit or loss in subsequent periods:
Changes in fair value from cash flow hedge (497,165,681) (99,372,282)Reclassification to the income statement from cash flow hedge 409,413,009 96,375,910
(87,752,672) (2,996,372)
Items that do not recycle to profit or loss in subsequent periods:
Net change in fair value of equity instruments at FVOCI – 23,177,281Income tax effect (Note 20) – (3,476,592)
– 19,700,689
Remeasurement gains (losses) on retirement plan (Note 19) (241,759,467) 84,512,744Income tax effect (Note 20) 72,527,840 (25,353,823)
(169,231,627) 59,158,921
OTHER COMPREHENSIVE INCOME (LOSS), NET OF TAX (256,984,299) 75,863,238
TOTAL COMPREHENSIVE INCOME, NET OF TAX P=4,654,500,985 P=5,048,226,783
See accompanying Notes to Financial Statements.

*SGVFS038854*
ME
TR
OB
AN
K C
AR
D C
OR
PO
RA
TIO
N(A
Fin
an
ce Com
pan
y a
nd
Gen
eral In
sura
nce A
gen
cy)
(A W
holly
Ow
ned
Su
bsid
iary
of M
etrop
olita
n B
an
k a
nd
Tru
st Com
pan
y)
ST
AT
EM
EN
TS
OF
CH
AN
GE
S IN
EQ
UIT
Y
Rem
easu
rem
ent
Net F
air V
alu
e
Ca
pita
l Sto
ck
(No
te 16
)A
dd
ition
al
Pa
id-in
Ca
pita
l
Reta
ined
Ea
rn
ing
sL
osse
s on
Retire
men
t Pla
n
(No
te 19
)
Ga
ins o
n E
qu
ity
Instru
men
ts
at F
VO
CI
Ca
sh F
low
Hed
ge R
eserv
e
(No
te 8)
To
tal
Un
ap
pro
pria
ted
(No
te 16
)A
pp
rop
riate
d
(No
te 16
)
Ba
lan
ce at J
an
ua
ry 1
, 20
19
P=1
,00
0,0
00
,00
0P=
76
,07
1,7
52
P=7
,85
8,7
44
,44
8P=
6,0
00
,00
0,0
00
(P=1
25
,60
8,5
14
)P=
19
,70
0,6
89
(P=2
,99
6,3
72
)P=
14
,82
5,9
12
,00
3
To
tal com
preh
ensiv
e inco
me fo
r the y
ear−
−4
,91
1,4
85
,28
4−
(16
9,2
31
,62
7)
−(8
7,7
52
,67
2)
4,6
54
,50
0,9
85
Net ap
pro
priatio
ns (N
ote 1
6)
−−
(7,0
00
,00
0,0
00
)7
,00
0,0
00
,00
0−
−−
−B
ala
nce a
t Dec
emb
er 31
, 20
19
P=1
,00
0,0
00
,00
0P=
76
,07
1,7
52
P=5
,77
0,2
29
,73
2P=
13
,00
0,0
00
,00
0(P=
29
4,8
40
,14
1)
P=1
9,7
00
,68
9(P=
90
,74
9,0
44
)P=
19
,48
0,4
12
,98
8
Balan
ce as atJan
uary
1, 2
01
8P=
1,0
00
,00
0,0
00
P=7
6,0
71
,75
2P=
4,2
61
,38
0,9
03
P=6
,60
0,0
00
,00
0(P=
18
4,7
67
,43
5)
P=−P=−
P=1
1,7
52
,68
5,2
20
To
tal com
preh
ensiv
e inco
me fo
r the y
ear−
−4
,97
2,3
63
,54
5−
59
,15
8,9
21
19
,70
0,6
89
(2,9
96
,37
2)
5,0
48
,22
6,7
83
Net ap
pro
priatio
ns (N
ote 1
6)
−−
60
0,0
00
,00
0(6
00
,00
0,0
00
)−
−−
−D
ivid
end
s (No
te 16
)−
−(1
,97
5,0
00
,00
0)
−−
−−
(1,9
75
,00
0,0
00
)
Balan
ce at Decem
ber 3
1, 2
01
8P=
1,0
00
,00
0,0
00
P=7
6,0
71
,75
2P=
7,8
58
,74
4,4
48
P=6
,00
0,0
00
,00
0(P=
12
5,6
08
,51
4)
P=1
9,7
00
,68
9(P=
2,9
96
,37
2)
P=1
4,8
25
,91
2,0
03
See a
ccom
panyin
g N
otes to
Fin
ancia
l Sta
tem
ents.

*SGVFS038854*
METROBANK CARD CORPORATION(A Finance Company and General Insurance Agency)
(A Wholly Owned Subsidiary of Metropolitan Bank and Trust Company)
STATEMENTS OF CASH FLOWS
Years Ended December 31
2019 2018
CASH FLOWS FROM OPERATING ACTIVITIES
Income before income tax P=7,016,403,836 P=7,103,207,104Adjustments for:
Provision for credit losses (Note 7) 5,153,457,368 4,548,755,634Amortization of:
Intangible assets (Note 10) 206,280,154 181,508,945Debt issuance costs (Notes 12 and 14) 149,297,957 114,496,848Interest expense on lease liabilities (Note 18) 4,291,929 –
Retirement expense (Note 19) 136,604,190 172,963,847Depreciation of:
Property and equipment (Note 9) 96,166,111 101,120,953Right-of-use assets (Note 18) 27,383,464 –
Unrealized foreign exchange (gain) loss (Note 17) (288,251,446) 36,653,455Gain on sale of property and equipment (Note 17) (2,709,383) (1,804,243)Loss on retirement of intangible assets (Note 17) 1,214,671 –Changes in operating assets and liabilities:
Decrease (increase) in the amounts of:Accounts receivable (21,582,149,072) (13,450,120,189)Prepaid expenses and other assets (153,129,075) (56,192,257)Other noncurrent assets (579,106) 7,097,104
Increase (decrease) in the amounts of:Bills payable 13,696,281,499 (5,116,677,475)Accounts payable 610,026,345 (34,022,336)Provisions (139,896,939) –Deferred revenue 50,702,671 (58,492,361)Accrued interest, taxes and other liabilities 385,989,752 260,724,164
Net cash provided by (used in) for operations 5,367,384,926 (6,190,780,807)Income taxes paid (2,298,491,300) (2,240,393,203)Contribution to the retirement plan (Note 19) (176,900,000) (143,600,000)
Net cash provided by (used in) operating activities 2,891,993,626 (8,574,774,010)
CASH FLOWS FROM INVESTING ACTIVITIES
Proceeds from sale of property and equipment (Note 9) 80,627,065 8,395,287Acquisitions of:
Intangible assets (Note 10) (248,003,244) (147,968,149)Property and equipment (Note 9) (241,950,878) (94,159,659)
Net cash used in investing activities (409,327,057) (233,732,521)
CASH FLOWS FROM FINANCING ACTIVITIES
Proceeds from availments of notes payable 112,976,811,515 35,927,294,874Payments of:
Notes payable (121,362,687,515) (25,332,448,413)Principal portion of lease liabilities (Note 18) (28,781,973) –
Dividends (Note 16) – (1,975,000,000)
Net cash provided by (used in) financing activities (8,414,657,973) 8,619,846,461
(Forward)

*SGVFS038854*
- 2 -
Years Ended December 31
2019 2018
EFFECT OF CHANGE IN FOREIGN EXCHANGE
RATES ON CASH AND CASH EQUIVALENTS P=35,751,447 (P=59,568,491)
NET DECREASE IN CASH AND CASH EQUIVALENTS (5,896,239,957) (248,228,561)
CASH AND CASH EQUIVALENTS AT
BEGINNING OF YEAR (Note 6)Cash and cash equivalents 1,082,125,457 1,809,031,449Due from Bangko Sentral ng Pilipinas 9,526,731,502 10,948,054,071Interbank loans receivable 2,200,000,000 300,000,000
12,808,856,959 13,057,085,520
CASH AND CASH EQUIVALENTS AT
END OF YEAR (Note 6)Cash and cash equivalents 743,566,359 1,082,125,457Due from Bangko Sentral ng Pilipinas 5,994,131,053 9,526,731,502Interbank loans receivable 174,919,590 2,200,000,000
P=6,912,617,002 P=12,808,856,959
OPERATING CASH FLOWS FROM INTERESTS
Interest received P=15,715,269,037 P=13,645,570,678Interest paid (3,065,877,970) (2,063,014,660)
P=12,649,391,067 P=11,582,556,018
See accompanying Notes to Financial Statements.

*SGVFS038854*
METROBANK CARD CORPORATION(A Finance Company and General Insurance Agency)
(A Wholly Owned Subsidiary of Metropolitan Bank and Trust Company)
NOTES TO FINANCIAL STATEMENTS
1. Corporate Information
Metrobank Card Corporation (A Finance Company and General Insurance Agency) (the Company)was initially incorporated in the Philippines as a credit card company on August 6, 1985, asUnibancard Corporation, with a corporate life of fifty (50) years from the date of incorporation. OnJune 4, 2002, the Company changed its name to Metrobank Card Corporation after its merger withAB Card and Solid Card. On March 27, 2008, the Company received its license from the Securitiesand Exchange Commission (SEC) to operate as a finance company. On June 5, 2008, the BangkoSentral ng Pilipinas (BSP) issued a quasi-banking license to the Company, which allows borrowingsfrom more than 19 lenders for the purpose of funding working capital.
On June 1, 2018, the Insurance Commission (IC) issued a license to the Company authorizing to actas a general life insurance agent of Philippine AXA Life Insurance Corporation (AXA) valid untilDecember 2020. On September 17, 2018, the IC issued a license to the Company authorizing to actas an ordinary non-life insurance agent of Charter Ping An Insurance Corporation (Charter Ping An)(now fully-owned and operated by AXA) valid until December 31, 2020.
The Company offers and issues credit cards branded as Metrobank Visa, Metrobank Mastercard,Philippine Savings Bank (PSBank) Credit Mastercard, Toyota Mastercard, and Bistro Group VISA;as well as prepaid cards – branded as YAZZ Reloadable Prepaid Visa, Victory Liner PremierePrepaid Visa, NWorld Cash Card, and Pisopay.com Prepaid Visa, AXA Prepaid Visa, Ardeur BonusCard, and JAC Liner My Ride Card. The Company also offers its partner merchants a portfolio ofacquiring services and payment solutions, including Internet Payments, Recurring Payments, MailOrder Telephone Orders, Installment Payment Plans for Metrobank credit cards, and DynamicCurrency Conversion for non-domestic issued credit cards; as well as Point-of-Sale (POS) Terminalsthat process Mastercard, Visa, JCB, UnionPay International, BancNet Debit cards, WeChat Pay andAlipay transactions.
Prior to December 28, 2017, the Company is 60.0%-owned by Metropolitan Bank and TrustCompany (Metrobank or the Ultimate Parent Company) and 40.0%-owned by Australia and NewZealand Funds Pty. Ltd. (ANZ). On December 28, 2017, the BSP approved the Ultimate ParentCompany’s acquisition of the remaining 40.0% ownership interest of the Company from ANZ. Withthe BSP’s approval, and in accordance with the agreement between the Ultimate Parent Company andANZ, the acquisition of the first half of the 40.0% ownership interest of ANZ in the Company wasdeemed completed for accounting purposes, thus, increasing the Ultimate Parent Company’sownership interest in the Company to 80.0% as of December 31, 2017. On September 4, 2018, theParent Company obtained 200,000,000 common shares of ANZ, representing the remaining 20.0%ownership interest of ANZ in the Company. Effective September 4, 2018, the Company became awholly owned subsidiary of the Ultimate Parent Company.
This development is supportive of the Ultimate Parent Company’s growth strategy to maximizeoperational efficiencies between the Ultimate Parent Company and the Company, and to furtherexpand on opportunities for collaboration, especially within the Metrobank Group (the Group), whileremaining fully committed to deliver superior products and services to existing and new customers.

- 2 -
*SGVFS038854*
In March 2019, the respective Board of Directors (BOD) of the Company and Metrobank haveapproved and ratified the merger between the Company and the Ultimate Parent Company.
Last October 2019, the BSP approved the merger of Metrobank with the Company.
On January 3, 2020, the Certificate of Merger was issued by the SEC, which signifies the finality ofthe merger (Note 25).
The merger will unlock the value of the Company and help realize the following objectives:(1) enhance synergy, (2) increase profitability and improve capital efficiency, and (3) enable theCompany to continue to grow and expand its business, thus becoming more competitive in themarket.
2. Summary of Significant Accounting Policies
Basis of PreparationThe accompanying financial statements of the Company have been prepared on a historical cost basis,except for equity instruments carried at fair value through other comprehensive income (FVOCI) andderivatives, which are both measured at fair value. The Company’s financial statements are presentedin Philippine peso (PHP or P=), the Company’s functional currency, and all values are rounded to thenearest PHP, except when otherwise indicated.
Statement of compliance
The accompanying financial statements of the Company have been prepared in accordance withPhilippine Financial Reporting Standards (PFRSs).
Offsetting of financial instruments
Financial assets and financial liabilities are offset and the net amount reported in the statement offinancial position only when there is a legally enforceable right to offset the recognized amounts andthere is an intention to settle on a net basis, or to realize the assets and settle the liabilitysimultaneously. The Company assesses that it has a currently enforceable right of offset if the right isnot contingent on a future event, and is legally enforceable in the normal course of business, event ofdefault, and event of insolvency or bankruptcy of the Company and all of the counterparties.
Income and expenses are not offset in the statement of income unless required or permitted by anyaccounting standard or interpretation, and as specifically disclosed in the accounting policies of theCompany.
Changes in Accounting Policies and DisclosuresThe following are the new standards, amendments and interpretation effective as of January 1, 2019adopted by the Company. The Company did not early adopt any other standard, amendment orinterpretation that has been issued but is not yet effective.

- 3 -
*SGVFS038854*
The Company applies, for the first time, PFRS 16, Leases, and Philippine Interpretation IFRIC-23,Uncertainty over Income Tax Treatments, effective January 1, 2019. The nature and effect of thesechanges are discussed below.
· PFRS 16, Leases
PFRS 16 supersedes PAS 17, Leases, IFRIC 4, Determining whether an Arrangement Contains aLease, SIC-15, Operating Leases-Incentives, and SIC-27, Evaluating the Substance of
Transactions involving the Legal Form of a Lease. The standard sets out the principles for therecognition, measurement, presentation and disclosure of leases and requires lessees to accountfor most leases under a single on-balance sheet model.
Lessor accounting under PFRS 16 is substantially unchanged from PAS 17. Lessors willcontinue to classify leases as either operating or finance leases using similar principles as inPAS 17.
The Company adopted PFRS 16 using the modified retrospective approach with the date of initialapplication of January 1, 2019, specifically where the right-of-use assets are recognized as anamount equal to their corresponding liability. Accordingly, comparative information for priorperiod has not been restated and does not reflect the requirements of PFRS 16. The Companyelected to use the transition practical expedient allowing the standard to be applied only tocontracts that were previously identified as leases applying PAS 17 at the date of initialapplication. The Company also elected to use the recognition exemptions for lease contracts,that, at the commencement date, have a lease term of 12 months or less and do not contain apurchase option (‘short-term leases’), and lease contracts for which the underlying asset is of lowvalue (‘low-value assets’).
The effect of the adoption of PFRS 16 as at January 1, 2019 is as follows:
Increase (Decrease)
Total assets
Right-of-use assets (Note 18) P=73,105,988
Total liabilities
Lease liability (Note 18) P=73,105,988
Nature of the effect of the adoption of PFRS 16The Company recognized right-of-use assets and lease liabilities for leases previously classifiedas operating leases, except for short-term leases and leases of low-value assets. The right-of-useassets for most leases were recognized based on the amount equal to the lease liability, adjustedfor any related prepaid and accrued lease payments previously recognized. Lease liabilities wererecognized based on the present value of the remaining lease payments, discounted using theincremental borrowing rate at the date of initial application.
The lease liability as at January 1, 2019 can be reconciled to the operating lease commitments asof December 31, 2018, as follows:
Operating lease commitments as at December 31, 2018 (Note 18) P=225,163,424Weighted average incremental borrowing rate as at January 1, 2019 6.14%
Discounted operating lease commitments as at January 1, 2019 192,679,261Commitments relating to short-term and low-value assets leases (119,573,273)
Lease liability as at January 1, 2019 P=73,105,988

- 4 -
*SGVFS038854*
Summary of new accounting policies
Summarized below are the new accounting policies of the Company upon adoption of PFRS 16,which have been applied from the date of initial application:
Right-of-Use AssetsThe Company recognized right-of-use assets at the commencement date of the lease (that is, thedate the underlying asset is available for use). Right-of-use assets are measured at cost, lessaccumulated depreciation, and adjusted for any remeasurement of lease liabilities. The cost ofright-of-use assets includes the amount of lease liabilities recognized, initial direct costs incurred,and lease payments made at or before the commencement date less any lease incentives received.Unless the Company is reasonably certain to obtain ownership of the leased asset at the end of thelease term, the recognized right-of-use assets are depreciated on a straight-line basis over thelease term. Right-of-use assets are subject to impairment.
Lease LiabilitiesAt the commencement date of the lease, the Company recognized the lease liabilities measured atthe present value of lease payments to be made over the lease term. The lease payments includefixed payments (including in-substance fixed payments, if any) less any lease incentivesreceivable, variable lease payments that depend on an index or a rate, and amounts expected to bepaid under residual value guarantees, if any. The lease payments also include the exercise priceof a purchase option reasonably certain to be exercised by the Company, if any, and payments ofpenalties for terminating a lease, if the lease term reflects the Company exercising the option toterminate.
In calculating the present value of lease payments, the Company uses the incremental borrowingrate at the lease commencement date if the interest rate implicit in the lease is not readilydeterminable. After the commencement date, the amount of lease liabilities is increased to reflectthe accretion of interest and reduced for the lease payments made. In addition, the carryingamount of lease liabilities is remeasured if there is a modification, a change in the lease term, achange in the in-substance fixed lease payments or a change in the assessment to purchase theunderlying asset.
Leases previously classified as operating leasesThe Company recognized right-of-use assets and lease liabilities for those leases previouslyclassified as operating leases, except for short-term leases and leases of low-value assets. Theright-of-use assets were recognized based on the amount equal to the lease liabilities, adjusted forany related prepaid and accrued lease payments recognized. Lease liabilities were recognizedbased on the present value of the remaining lease payments, discounted using the incrementalborrowing rate at the date of initial application.
The Company also applied practical expedient wherein it applied the short-term leasesexemptions to leases with lease term that ends within 12 months from the date of initialapplication.
Determining the lease term of contracts with renewal optionsThe Company determines the lease term as the non-cancellable term of the lease, together withany periods covered by an option to extend the lease if it is reasonably certain to be exercised, orany periods covered by an option to terminate the lease, if it is reasonably certain not to beexercised.

- 5 -
*SGVFS038854*
After the commencement date, the Company reassesses the lease term if there is a significantevent or change in circumstances that are within its control and affects its liability to exercise(or not to exercise) the option to renew (e.g., a change in business strategy).
Short-Term Leases and Leases of Low-Value AssetsThe Company applies the short-term lease recognition exemption to its short-term leases ofmachinery and equipment (that is, those leases that have a lease term of 12 months or less fromthe commencement date and do not contain a purchase option). It also applies the lease of low-value assets recognition exemption to leases of office equipment that are considered low value(that is below P=250,000). Lease payments on short-term leases and leases of low-value assets arerecognized as expense on a straight-line basis over the lease term.
· Philippine Interpretation IFRIC-23, Uncertainty over Income Tax Treatments
The interpretation addresses the accounting for income taxes when tax treatments involveuncertainty that affects the application of PAS 12, Income Taxes. It does not apply to taxes orlevies outside the scope of PAS 12, nor does it specifically include requirements relating tointerest and penalties associated with uncertain tax treatment. The interpretation specificallyaddresses the following:§ Whether an entity considers uncertain tax treatments separately§ The assumptions an entity makes about the examination of tax treatments by the tax authority§ How an entity determines taxable profit (tax loss), tax bases, unused tax losses, unused tax
credits and tax rates§ How an entity considers changes in facts and circumstances
An entity has to determine whether to consider each uncertain tax treatment separately or togetherwith one or more other uncertain tax treatments. The approach that better predicts the resolutionof the uncertainty needs to be followed. The entity shall assume that the taxation authority willexamine the amounts that it has a right to examine and have full knowledge of all relatedinformation when making those examinations. If an entity concludes that it is not probable thatthe taxation authority will accept an uncertain tax treatment, it shall reflect the effect of theuncertainty for each uncertain tax treatment using the method the entity expects to better predictthe resolution of the uncertainty.
Upon the adoption of the interpretation, the Company considered whether it has any uncertain taxpositions. The Company applies significant judgment in identifying uncertainties over its incometreatments. The interpretation did not have an impact on the financial statements of the Companyas it has determined that its current tax treatments are in accordance with the rules and regulationsof the taxation authorities.
The adoption of the following pronouncements did not have any significant impact on the Company’sfinancial position or performance:
· Amendments to PFRS 9, Financial Instruments, Prepayment Features with Negative
Compensation
· Amendments to PAS 19, Employee Benefits, Plan Amendment, Curtailment or Settlement
· Amendments to PAS 28, Investment in Associates and Joint Ventures, Long-term Interests in
Associates and Joint Ventures
· Annual Improvements to PFRSs 2015-2017 Cycle- Amendments to PFRS 3, Business Combinations, and PFRS 11, Joint Arrangements,
Previously Held Interest in a Joint Operation
- Amendments to PAS 12, Income Taxes, Income Tax Consequences of Payments on
Financial Instruments Classified as Equity- Amendments to PAS 23, Borrowing Costs, Borrowing Costs Eligible for Capitalization

- 6 -
*SGVFS038854*
Significant Accounting Policies
Current and Noncurrent ClassificationThe Company presents assets and liabilities in the statement of financial position based on currentand noncurrent classification.
An asset or liability is current when it is:
· expected to be realized or intended to be sold or consumed or settled in the normal operatingcycle;
· held primarily for the purpose of trading; and
· expected to be realized or due to be settled within twelve (12) months after the statement offinancial position date.
An asset is also current when it is cash or cash equivalent, unless restricted from being exchanged orused to settle a liability for at least twelve (12) months after the statement of financial position date.A liability is also current when there is no unconditional right to defer the settlement of the liabilityfor at least twelve (12) months after the statement of financial position date.
All other assets or liabilities are classified as noncurrent. Deferred tax assets and liabilities areclassified as noncurrent assets and liabilities.
Foreign Currency TranslationsTransactions and balances
Transactions in foreign currency-denominated are initially recorded at the functional currency rate ofexchange ruling at the date of the transaction.
The Company translates its foreign currency-denominated monetary assets and liabilities using theBankers Association of the Philippines (BAP) closing rate, provided by Bloomberg, prevailing at thestatement of financial position date; income and expenses are translated at BAP weighted averagerates prevailing at transaction dates.
Exchange differences arising from reporting foreign currency monetary items at rates different fromthose at which they were previously recorded, as well as foreign exchange gains or losses arisingfrom foreign currency transactions are credited to or charged against current statement of income inthe year on which the rates changed.
Nonmonetary items that are measured in terms of historical cost in a foreign currency are translatedusing the exchange rates as at the dates of the initial transactions. Nonmonetary items measured atfair value in a foreign currency are translated using the exchange rates at the date when the fair valuewas determined.
Fair Value MeasurementFair value is the price that would be received to sell an asset or paid to transfer a liability in an orderlytransaction between market participants at the measurement date. The fair value measurement isbased on the presumption that the transaction to sell the asset or transfer the liability takes placeeither:
· in the principal market for the asset or liability; or
· in the absence of a principal market, in the most advantageous market for the asset or liability.
The principal or the most advantageous market must be accessible to the Company.

- 7 -
*SGVFS038854*
The fair value of an asset or a liability is measured using assumptions that market participants woulduse when pricing the asset or liability, assuming that market participants act in their economic bestinterest.
A fair value measurement of a nonfinancial asset takes into account a market participant’s ability togenerate economic benefits by using the asset in its highest and best use or by selling it to anothermarket participant that would use the asset in its highest and best use.
The Company uses valuation techniques that are appropriate in the circumstances and for whichsufficient data are available to measure fair value, maximizing the use of relevant observable inputsand minimizing the use of unobservable inputs.
All assets and liabilities for which fair value is measured or disclosed in the financial statements arecategorized within the fair value hierarchy, described as follows, based on the lowest level input thatis significant to the fair value measurement as a whole:
· Level 1 - Quoted (unadjusted) market prices in active markets for identical assets or liabilities;
· Level 2 - Valuation techniques for which the lowest level input that is significant to the fair valuemeasurement is directly or indirectly observable; and
· Level 3 - Valuation techniques for which the lowest level input that is significant to the fair valuemeasurement is unobservable.
If an asset or a liability measured at fair value has a bid price and an ask price, the price within thebid - ask spread that is most representative of fair value in the circumstances shall be used to measurefair value regardless of where the input is categorized within the fair value hierarchy.
For assets and liabilities that are recognized in the financial statements on a recurring basis, theCompany determines whether transfers have occurred between levels in the hierarchy by re-assessingcategorization (based on the lowest level input that is significant to the fair value measurement as awhole) at the end of each statement of financial position date.
For the purpose of fair value disclosures, the Company has determined classes of assets and liabilitieson the basis of the nature, characteristics and risks of the asset or liability and the level of the fairvalue hierarchy (Note 5).
Financial Instruments - Initial RecognitionDate of recognition
Purchases or sales of financial assets that require delivery of assets within the time frame establishedby regulation or convention in the marketplace are recognized in the settlement date - the date that anasset is delivered to or by the Company. Derivatives are recognized on trade date basis. Amountsdue to banks and customers and loans are recognized when cash is received by the Company oradvanced to the borrowers.
Initial recognition of financial instruments
All financial assets are initially measured at fair value. Except for financial assets and liabilitiesvalued at FVTPL, the initial measurement of financial instruments includes transaction costs.
‘Day 1’ profit or loss
Where the transaction price in a non-active market is different from the fair value of other observablecurrent market transactions in the same instrument or based on a valuation technique whose variablesinclude only data from an observable market, the Company recognizes the difference between the

- 8 -
*SGVFS038854*
transaction price and fair value (a ‘Day 1’ profit or loss) in the statement of income under‘Miscellaneous income or expense’ unless it qualifies for recognition as some other type of asset.
In cases where use is made of data which is not observable, the difference between the transactionprice and model value is only recognized in the statement of income when the inputs becomeobservable or when the instrument is derecognized. For each transaction, the Company determinesthe appropriate method of recognizing the ‘Day 1’ profit or loss amount.
Financial Instruments - Classification and Subsequent MeasurementThe Company classifies its financial assets in the following categories: financial assets at FVTPL,financial assets at FVOCI, and financial assets at amortized cost while financial liabilities areclassified as financial liabilities at FVTPL and financial liabilities at amortized cost. Theclassification of financial instruments depends on the contractual terms and the business model formanaging the instruments.
The Company determines its business model based on reasonably expected scenarios without taking‘worst case’ or ‘stress case’ scenarios into account. If cash flows after initial recognition are realizedin a way that is different from the Company’s original expectations, the Company does not changethe classification of the remaining financial assets held in that business model, but incorporates suchinformation when assessing newly originated or newly purchased financial assets going forward.
As part of its classification process, the Company assesses the contractual terms of financial assets toidentify whether they meet the ‘solely payments of principal and interest’ (SPPI) test. For thepurpose of the SPPI test, principal is defined as the fair value of the financial asset at initialrecognition and may change over the life of the financial asset (e.g., if there are repayments ofprincipal or amortization of premium or discount). The most significant elements of interest within alending arrangement are typically the consideration for the time value of money and credit risk. Incontrast, contractual terms that introduce a more that de minimis exposure to risks or volatility in thecontractual cash flows that are solely payments of principal and interest on the amount outstanding.In such cases, the financial asset is required to be measured at FVTPL.
Financial assets at FVTPL
a. Derivatives recorded at FVTPL
The Company uses cross-currency interest rate swaps to hedge its foreign currency and interestrate risks. Such derivative financial instruments are initially recognized at fair value on the dateon which a derivative contract is entered into and are subsequently remeasured at fair value.Derivatives are carried as financial assets when the fair value is positive and as financialliabilities when the fair value is negative.
Hedge accounting
For the purpose of hedge accounting, hedges are classified as:
· fair value hedges when hedging the exposure to changes in the fair value of a recognizedasset or liability or an unrecognized firm commitment;
· cash flow hedges when hedging the exposure to variability in cash flows that is eitherattributable to a particular risk associated with a recognized asset or liability or a highlyprobable forecast transaction or the foreign currency risk in an unrecognized firmcommitment; and
· hedges of a net investment in a foreign operation.
At the inception of a hedge relationship, the Company formally designates and documents thehedge relationship to which it wishes to apply hedge accounting and the risk managementobjective and strategy for undertaking the hedge.

- 9 -
*SGVFS038854*
The documentation includes identification of the hedging instrument, the hedged item, the natureof the risk being hedged and how the Company will assess whether the hedging relationshipmeets the hedge effectiveness requirements, including the analysis of sources of hedgeineffectiveness and how the hedge ratio is determined. A hedging relationship qualifies for hedgeaccounting if it meets all of the following effectiveness requirements:
· There is ‘an economic relationship’ between the hedged item and the hedging instrument.
· The effect of credit risk does not ‘dominate the value changes’ that result from that economicrelationship.
· The hedge ratio of the hedging relationship is the same as that resulting from the quantity ofthe hedged item that the Company actually hedges and the quantity of the hedging instrumentthat the Company actually uses to hedge that quantity of hedged item.
Cash flow hedges
The effective portion of the gain or loss on the hedging instrument is recognized in OCI in the‘Cash flow hedge reserve’, while any ineffective portion is recognized immediately in thestatement of income.
The Company uses cross-currency interest rate swaps as hedges of its exposure to foreigncurrency risk in peso-denominated loans. There is no ineffective portion relating to the cross-currency interest rate swaps recognized during the year. Refer to Note 8 for details.
Financial assets at FVOCI
Financial assets at FVOCI include equity instruments. Equity instruments at FVOCI are those thatthe Company made an irrevocable election to present in the OCI subsequent changes in fair value.
After initial measurement, these financial assets are subsequently measured at fair value. Gains andlosses arising from changes in fair value are recognized in OCI and accumulated in ‘Net fair valuegains on equity instruments at FVOCI’ in the statement of financial position. When the asset isdisposed of, the cumulative gain or loss previously recognized in ‘Net fair value gains on equityinstruments at FVOCI’ is not reclassified to statement of income, but is reclassified to ‘Retainedearnings’.
The Company has designated its equity instruments as at FVOCI.
Financial assets at amortized costFinancial assets at amortized cost are debt financial assets that meet both of the following conditions:
· the asset is held within a business model whose objective is to hold financial assets in order tocollect contractual cash flows; and
· the contractual terms of the financial asset give rise on specified dates to cash flows that are SPPIon the outstanding principal amount.
This accounting policy relates to the Company’s ‘Cash and cash equivalents’ (excluding cash onhand), ‘Due from BSP’, ‘Interbank loans receivable’, ‘Accounts receivable’ and refundable depositsunder ‘Other assets’.
Accounts receivable include purchases made by the Company’s cardholders which are collected oninstallments and are recorded at the cost of the items purchased plus interest covering the installmentperiod which is initially credited to unearned interest income, shown as a deduction from ‘Accountsreceivable’.

- 10 -
*SGVFS038854*
Deferred acquisition cost, which is presented as part of ‘Accounts receivable’, represents capitalizedexpenses related to incremental direct cost associated with the successful origination of credit cardfacilities, which are amortized over two (2) years, the average relationship life with customers, on astraight-line basis.
After initial measurement, these financial assets at amortized cost are subsequently measured atamortized cost using the effective interest rate (EIR) method, less allowance for expected creditlosses. Amortized cost is calculated by taking into account any discount or premium on acquisitionand fees and costs that are an integral part of the EIR. The amortization is included in ‘Interest andpenalties’ in the statement of income. The expected credit losses are recognized in the statement ofincome under ‘Provision for credit losses’.
Impairment of Financial AssetsThe Company recognizes the allowance for expected credit losses (ECL) for all loans and otherreceivables, including unused credit lines.
Overview of the ECL principles
The ECL allowance is based on the credit losses expected to arise on 12-month duration if there wasno significant increase in credit risk (SICR) of the financial asset since initial recognition. Otherwise,if a SICR is observed, then, expected credit loss estimation is extended until the end of the life of thefinancial asset.
The 12-month ECL represents losses resulting from default events on a financial asset, which mayhappen within twelve (12) months after the statement of financial position date. The lifetime ECL, onthe other hand, represents losses resulting from default events on a financial asset which may happenover its life. When estimating the lifetime ECL for unused credit lines, the Company estimates theexpected portion of the loan commitment that will be drawn down over its expected life.
Both lifetime ECL and 12-month ECL are calculated on an account-level.
Definition of ‘default’
The Company defines default when the borrower becomes at least 90 days past due (dpd) or if theaccount is restructured, or if the account is tagged pending to close.
Definition of ‘write-off’The Company determines the accounts receivable for write-off as those that have reached 180 dpd,except for those that are tagged as rewrite and Directors, Officers, Stockholders, and Related Interests(DOSRI). Rewrite accounts are automatically written-off when it reached 90 dpd, while accountsclassified as DOSRI are written-off upon receipt of approval from the BOD. Write-off of receivablesfrom cardholders, loans and other credit accommodations are subject to the approval of the ExecutiveCommittee (EXECOM).
The Company also determines early write-off on its accounts receivable that have not yet reached180 dpd but has been evaluated by its Collection Division to be subjected to early write-off. Theseaccounts generally include those from deceased cardholders or accounts with negative skip tracingresults.

- 11 -
*SGVFS038854*
SICR
The criteria for determining whether credit risk has increased significantly includes quantitativechanges in probabilities of default and qualitative factors. The credit risk of a particular exposure isdeemed to have increased significantly since initial recognition if, based on the Company’s internalscorecards, the borrower or counterparty is determined to have well-defined credit weaknesses. Forexposures without internal scorecards, if contractual payments are more than a specified days pastdue threshold, the credit risk is deemed to have increased significantly since initial recognition. Dayspast due is determined by counting the number of days since the earliest elapsed due date from whichpayment of amount due, whether in partial or in full, has not been received. In subsequent reportingperiods, if the credit risk of the financial instrument improves such that there is no longer a SICRsince initial recognition, the Company shall revert to recognizing a 12-month ECL.
Given that there is a cut-off score upon origination, it is assumed that all booked accounts havesatisfied the Company’s risk appetite.
In order to determine if an account is subject to 12-month ECL or lifetime ECL, the Companyevaluates whether there has been a SICR since initial recognition. The Company uses the credit scoreto determine whether the loan has significant increase in credit risk and to estimate the ECL. In 2018,an exposure is considered to have SICR when it has entered the lowest scoreband. In 2019, due tomodel enhancements, an exposure is considered to also have SICR when it has reached at least 30days past due.
ECL parameters and methodologies
ECL is a function of the probability of default (PD), loss given default (LGD) and exposure at default(EAD), with the timing of the loss also considered, estimated by incorporating forward-lookingeconomic information and through the use of experienced credit judgment.
The PD represents the likelihood that a credit exposure will not be repaid and will go into defaultwithin either a 12-month horizon for Stage 1 or lifetime horizon for Stage 2. The PD for eachindividual instrument is modelled based on historical data and is estimated based on current marketconditions and reasonable and supportable information about future economic conditions. TheCompany segmented its credit exposures based on homogenous risk characteristics and developed acorresponding PD methodology.
LGD is the amount that may not be recovered in the event of default and is modelled based onhistorical cash flow recovery and reasonable and supportable information about future economicconditions, where appropriate.
EAD is modelled on historical data and represents an estimate of the outstanding amount of creditexposure at the time a default may occur. For unused credit lines, EAD includes an estimate of anyfurther amount to be drawn at the time of default.
The Company offers credit card facilities, in which the Company has the right to cancel and/or reducethe facilities with one (1) day notice. The Company does not limit its exposure to credit losses to thecontractual notice period, but instead, calculates ECL over a period that reflects the Company’sexpectations of the customer behavior, its likelihood of default and the Company’s future riskmitigation procedures, which could include reducing or cancelling the facilities. Based on pastexperience and the Company’s expectations, the period over which the Company calculates ECL forthese products is two (2) years.
The Company used EIR in discounting the costs and recoveries on its credit card receivables.

- 12 -
*SGVFS038854*
Forward-looking information
The Company incorporates forward-looking information in both of its assessment of whether thecredit risk of an instrument has increased significantly since its initial recognition and itsmeasurement of ECL. A broad range of forward-looking information are considered as economicinputs. Correlations among variables are evaluated and the final list of variables for the model arethen determined.
The inputs and models used for calculating ECL may not always capture all characteristics of themarket at the date of the financial statements. To reflect this, qualitative adjustments or overlays areoccasionally made as temporary adjustments when such differences are significantly material.
Probability-weighted scenariosECLs are probability-weighted estimate of credit losses over the expected life of the asset. Under theECL model, the Company estimates possible defaults over three (3) various scenarios namely:baseline scenario, upside scenario, and downside scenario, where each scenario would have its ownset of economic forecasts for the ECL components. The Company’s probability-weighted ECLreflects management’s estimate of 70% as the weight for the base case scenario and 15% chance ofoccurrence for both the upside and downside scenarios.
Derecognition of financial instrumentsFinancial asset
A financial asset (or, when applicable, a part of a financial asset or part of a group of financial assets)is derecognized (that is, removed from the Company’s statement of financial position) when:
· the rights to receive cash flows from the asset have expired; or
· the Company has transferred its rights to receive cash flows from the asset or has assumed anobligation to pay the received cash flows in full without material delay to a third party under a‘pass-through’ arrangement; and either:a. the Company has transferred substantially all the risks and rewards of the asset; orb. the Company has neither transferred nor retained substantially all the risks and rewards of the
asset, but has transferred control of the asset.
When the Company has transferred its rights to receive cash flows from an asset and has neithertransferred nor retained substantially all the risks and rewards of the asset nor transferred control overthe asset, the asset is recognized to the extent of the Company’s continuing involvement in the asset.In that case, the Company also recognizes an associated liability. The transferred asset and theassociated liability are measured on a basis that reflects the rights and obligations that the Companyhas retained.
Continuing involvement that takes the form of a guarantee over the transferred asset is measured atthe lower of the original carrying amount of the asset and the maximum amount of consideration thatthe Company could be required to repay.
Financial liability
A financial liability is derecognized when the obligation under the liability is discharged or cancelledor has expired. When an existing financial liability is replaced by another from the same lender onsubstantially different terms, or the terms of an existing liability are substantially modified, such anexchange or modification is treated as a derecognition of the original liability and the recognition of anew liability, and the difference in the respective carrying amounts is recognized in the statement ofincome.

- 13 -
*SGVFS038854*
Cash and cash equivalentsFor purposes of reporting cash flows, cash and cash equivalents include cash on hand and in banks,amounts due from BSP and interbank loans receivable with original maturities of three (3) months orless from dates of placements and that are subject to insignificant risk of changes in value. Due fromBSP includes statutory reserves required by the BSP for debt obligations considered as depositsubstitutes.
Property and equipmentDepreciable properties such as building, furniture, fixtures and equipment, transportation equipment,building and leasehold improvements are carried at cost less accumulated depreciation andamortization and accumulated impairment in value, if any. Land is carried at cost less anyimpairment loss.
The initial cost of property and equipment consists of its purchase price, including import duties,taxes and any directly attributable costs of bringing the asset to its working condition and location forits intended use. Expenditures incurred after the property and equipment have been put intooperation, such as repairs and maintenance, are normally charged against statement of income in the
year in which the costs are incurred. In situations where it can be clearly demonstrated that theexpenditures have resulted in an increase in the future economic benefits expected to be obtainedfrom the use of an item of property and equipment beyond its originally assessed standard ofperformance, the expenditures are capitalized as an additional cost of property and equipment.
When property and equipment are retired or otherwise disposed of, the cost and the relatedaccumulated depreciation and amortization and accumulated impairment in value, if any, are removedfrom the accounts and any resulting gain or loss is credited to or charged against current statement ofincome.
Depreciation is computed using the straight-line method over the estimated useful lives of the assets.The annual depreciation and amortization rates follow:
Building 3.3%Furniture, fixtures and equipment 20.0% to 33.0%Transportation equipment 20.0%Building improvements 20.0% or the life of the building, whichever is shorterLeasehold improvements 20.0% or the term of the lease, whichever is shorter
An item of property and equipment, and any significant part initially recognized, is derecognizedupon disposal or when no future economic benefits are expected from its use or disposal. Any gain orloss arising on derecognition of the asset (calculated as the difference between the net disposalproceeds and the carrying amount of the asset) is included in the statement of income when the assetis derecognized.
The estimated useful lives and the depreciation and amortization method are reviewed periodically toensure that the period and the method of depreciation and amortization are consistent with theexpected pattern of economic benefits from items of property and equipment.
Fully depreciated property and equipment are retained in the accounts until these are no longer used,no further depreciation and amortization is charged to statement of income.
The carrying value of property and equipment is reviewed for impairment when events or changes incircumstances indicate that the carrying value may not be recoverable (see accounting policy onimpairment of nonfinancial assets).

- 14 -
*SGVFS038854*
Intangible assetsIntangible assets acquired separately, such as license fees and capitalized software, are initiallyrecognized at cost. Following initial recognition, these assets are carried at cost less accumulatedamortization and accumulated impairment losses, if any. Internally generated intangible assets,excluding capitalized development costs, are not capitalized and the expenditure is reflected in thestatement of income in the year in which the expenditure is incurred.
The useful lives of intangible assets are assessed to be either finite or indefinite. As of December 31, 2019and 2018, the Company does not have intangible assets with indefinite useful lives.
Intangible assets with finite lives are amortized over the useful economic life and assessed forimpairment whenever there is an indication that the intangible assets may be impaired. Theamortization period and method for an intangible asset with a finite useful life are reviewed at least ateach financial year-end. Changes in the expected useful life or the expected pattern of consumptionof future economic benefits embodied in the asset is accounted for by changing the amortizationperiod or method, as appropriate, and treated as changes in accounting estimates. The amortizationexpense on intangible assets with finite lives is recognized in the statement of income.
The useful lives of the Company’s intangible assets are summarized as follows:
License fees Capitalized software
Useful lives 3 to 5 years 2 to 5 yearsAmortization method Amortized on a straight-line basis
over the related terms of thecontracts
Amortized on a straight-line basis over its useful economic life
Gains or losses arising from the derecognition of an intangible asset are measured as the differencebetween the net disposal proceeds and the carrying amount of the asset and are recognized in thestatement of income when the asset is derecognized.
Project in progress
Research costs are expensed as incurred. Development expenditures on an individual project arerecognized when the Company can demonstrate:a. the technical feasibility of completing the intangible asset so that the asset will be available for
use or sale;b. its intention to complete and its ability and intention to use or sell the asset;c. how the asset will generate future economic benefits;d. the availability of resources to complete the asset; ande. the ability to measure reliably the expenditure during development.
Upon completion of development, the project cost is reclassified to ‘Capitalized software’.Amortization of the asset begins when development is complete and the asset is available for use. Itis amortized over the period of expected future benefit.
Impairment of nonfinancial assetsProperty and equipment and intangible assetsAt statement of financial position date, or more frequently if events or changes in circumstancesindicate that the carrying values may not be recoverable, the carrying values of property andequipment and intangible assets are reviewed for impairment. If any such indication exists and wherethe carrying values exceed the estimated recoverable amounts, the assets or cash-generating units(CGUs) are written down to their recoverable amounts. The recoverable amount of the asset is thegreater of fair value less costs of disposal and value in use. In assessing value in use, the estimated

- 15 -
*SGVFS038854*
future cash flows are discounted to their present value using a pre-tax discount rate that reflectscurrent market assessments of the time value of money and the risks specific to the asset. For an assetthat does not generate largely independent cash inflows, the recoverable amount is determined for theCGU to which the asset belongs. Impairment losses are recognized in the statement of income. Apreviously recognized impairment loss is reversed by a credit to current statement of income to theextent that it does not restate the asset to a carrying amount in excess of what would have beendetermined (net of any accumulated depreciation and amortization) had no impairment loss beenrecognized for the asset in prior years.
EquityCapital stock is measured at par value for all shares issued and outstanding. When the shares are soldat a premium, the difference between the proceeds and the par value is credited to ‘Additional paid-incapital’.
Retained earnings represent all current and prior period results of operations as reported in thestatements of income, reduced by the amounts of dividends declared.
Dividends on common sharesDividends on common shares are recognized as liability and deducted from equity when they areapproved by the Company’s BOD. Interim dividends are deducted from equity when they aredeclared and no longer at the discretion of the Company.
Dividends for the year that are approved by the Company’s BOD after the statement of financialposition date are disclosed as events after the statement of financial position date.
Debt issuance costsIssuance and other related expenses incurred in connection with the issuance of debt instruments(other than debt instruments designated at FVTPL) are deferred and amortized over the terms of theinstruments using the EIR method. Unamortized debt issuance costs are included in the measurementof the related carrying value of the debt instruments in the statement of financial position.
Revenue recognitionRevenue is measured based on the consideration specified in a contract with a customer. TheCompany recognizes revenue when it transfers control over a good or service to a customer.
Discounts earned
Discounts are charges arising from credit availments by the Company’s cardholders and other creditcompanies’ cardholders when the Company is acting as an acquirer. These discounts are computedbased on certain agreed rates. This account also includes interchange income from transactionsprocessed by other acquirers through VISA Inc. (Visa) and MasterCard Incorporated (MasterCard)and fees from cash advance transactions of cardholders. Discounts/interchange fees are recognized asrevenue point-in-time when services related to credit card use are being provided.
Membership fees and dues
Membership fees are periodically charged to cardholders upfront. Membership fees are deferred andrecorded under ‘Deferred revenue’ and recognized on a straight-line basis over the period the feeentitles the cardholders to use the card.

- 16 -
*SGVFS038854*
Awards revenue
The Company operates a loyalty points program, which allows a customers to accumulate pointswhen they purchase from member establishments using the issued card of the Company. The pointsaccumulate and do not expire. The Company allocates a portion of the consideration received frominterchange fees from credit cards to the reward points. This allocation is based on the estimatedstand-alone selling prices. The amount allocated to the customer loyalty program is deferred, and isrecognized as revenue when loyalty points are redeemed or the likelihood of the customer redeemingthe loyalty points becomes remote. The contract liability is included in ‘Deferred revenue’.
Miscellaneous income
Miscellaneous income mainly relates to service fees and transaction processing fees. Invoices forthese services are issued on a monthly basis and are usually payable within 30 days. These arerecognized as revenue over time as the services are provided.
Expense recognitionExpenses are recognized when it is probable that a decrease in future economic benefit related to adecrease in an asset or an increase in liability has occurred and the decrease in economic benefits canbe measured reliably. Revenues and expenses that relate to the same transaction or other event arerecognized simultaneously.
Operating expenses
Operating expenses constitute costs which arise in the normal course of business and are recognizedwhen incurred.
Loyalty expenseCosts of rewards are recognized as expense and recorded under ‘Loyalty expense’ when the relatedloyalty points are redeemed by the cardholder.
Taxes, duties and license feesThis includes all other taxes, local and national, including gross receipt taxes (GRT), documentarystamp taxes (DST), fringe benefit taxes (FBT), license and permit fees that are recognized whenincurred.
LeasesPolicies applicable beginning January 1, 2019The Company assesses at contract inception whether a contract is, or contains, a lease. That is, if thecontract conveys the right to control the use of an identified asset for a period of time in exchange forconsideration.
Company as a lessee
The Company applies a single recognition and measurement approach for all leases, except for short-term leases and leases of low-value assets. The Company recognizes lease liabilities to make leasepayments and right-of-use assets representing the right to use the underlying assets.
i. Right-of-use assetsThe Company recognizes right-of-use assets at the commencement date of the lease (i.e., thedate the underlying asset is available for use). Right-of-use assets are measured at cost, lessany accumulated depreciation and impairment losses, and adjusted for any remeasurement oflease liabilities. The cost of right-of-use assets includes the amount of lease liabilitiesrecognized, initial direct costs incurred, and lease payments made at or beforecommencement date less any lease incentives received. Right-of-use assets are depreciatedon a straight-line basis over the shorter of the lease term and the estimated useful lives of the

- 17 -
*SGVFS038854*
asset. The right-of-use assets of the Company include office spaces, which have estimateduseful lives ranging from 2 to 3 years.
ii. Lease liabilities
At the commencement date of the lease, the Company recognizes lease liabilities measured atthe present value of lease payments to be made over the lease term. The lease paymentsinclude fixed payments (including in-substance fixed payments) less any lease incentivesreceivable, variable lease payments that depend on an index or a rate, and amounts expectedto be paid under residual value guarantees. The lease payments also include the exerciseprice of a purchase option reasonably certain to be exercised by the Company and payment ofpenalties for terminating a lease, if the lease term reflects the Company exercising the optionto terminate. Variable lease payments that do not depend on an index or a rate are recognizedas expense (unless they are incurred to produce inventories) in the period which the event orcondition that triggers the payment occurs.
In calculating the present value of lease payments, the Company uses its incrementalborrowing rate at the lease commencement date because the interest rate implicit in the leaseis not readily determinable. After the commencement date, the amount of lease liabilities isincreased to reflect the accretion of interest and reduced for the lease payments made. Inaddition, the carrying amount of lease liabilities is remeasured if there is a modification, achange in the lease term, a change in the lease payments (e.g., changes to future paymentsresulting from a change in an index or rate used to determine such lease payments) or achange in the assessment of an option to purchase the underlying asset.
iii. Short-term leases and leases of low-value assets
The Company applies the short-term lease recognition exemption to its short-term leases ofoffice equipment (i.e., those leases that have a lease term of 12 months or less from thecommencement date and do not contain a purchase option). It also applies the lease of low-value assets recognition exemption to leases of Point-of-Sale (POS) terminals that areconsidered low-value (i.e. P=250,000 and below). Lease payments on short-term leases andleases of low-value assets are recognized as expense on a straight-line basis over the leaseterm.
In an operating lease, the lease property was not capitalized and the lease payments wererecognized as rent expense under ‘Rent, light and water’ in the statement of income on astraight-line basis over the lease term. Any prepaid rent and accrued rent were recognizedunder ‘Prepayments and other current assets’ and ‘Accrued interest, taxes and otherexpenses’, respectively.
Company as a lessorLeases in which the Company does not transfer substantially all the risks and rewards incidental toownership of an asset are classified as operating leases. Rental income is accounted for on a straight-line basis over the lease terms and is included in ‘Miscellaneous income’ in the statement of income.Initial direct costs incurred in negotiating and arranging an operating lease are added to the carryingamount of the leased asset and recognized over the lease term on the same basis as rental income.Contingent rents are recognized as revenue in the period in which they are earned.

- 18 -
*SGVFS038854*
Policies applicable prior to January 1, 2019
The determination of whether an arrangement is, or contains a lease is based on the substance of thearrangement and requires an assessment of whether the fulfillment of the arrangement is dependenton the use of a specific asset or assets and the arrangement conveys a right to use the asset. Areassessment is made after inception of the lease only if one of the following applies:a. there is a change in contractual terms, other than a renewal or extension of the arrangement;b. a renewal option is exercised or extension granted, unless that term of the renewal or extension
was initially included in the lease term;c. there is a change in the determination of whether fulfillment is dependent on a specified asset; ord. there is a substantial change to the asset.
Where a reassessment is made, lease accounting shall commence or cease from the date when thechange in circumstances gives rise to the reassessment for scenarios (a), (c) or (d) above, and at thedate of renewal or extension period for scenario (b).
Company as lessee
Leases which do not transfer to the Company substantially all the risks and benefits incidental toownership of the leased items are operating leases. Operating lease payments are recognized as anexpense in the statement of income on a straight-line basis over the lease term. Contingent rentalpayable is recognized as an expense in the period in which these are incurred.
Company as lessorLeases where the Company does not transfer substantially all the risks and benefits of ownership ofthe asset are classified as operating leases. Initial direct costs incurred in negotiating operating leasesare added to the carrying amount of the leased asset and recognized over the lease term on the samebasis as rental income. Contingent rents are recognized as revenue in the period in which these areearned.
Retirement benefitsThe Company operates a defined benefit retirement plan, which requires contributions to be made to aseparately administered fund. The cost of providing benefits under the defined benefit retirementplan is actuarially determined using the projected unit credit method.
The net retirement liability is the aggregate of the present value of the defined benefit obligation atthe end of the statement of financial position date reduced by the fair value of plan assets, adjusted forany effect of limiting a net defined benefit asset to the asset ceiling. The asset ceiling is the presentvalue of any economic benefits available in the form of refunds from the plan or reductions in futurecontributions to the plan.
Retirement expense comprise of service cost and net interest on the net retirement liability.
Service costs which include current service costs, past service costs and gains or losses on non-routine settlements are recognized as expense in statement of income. Past service costs arerecognized when plan amendment or curtailment occurs. These amounts are calculated periodicallyby an independent qualified actuary.
Net interest on the net retirement liability or asset is the change during the year in the net retirementliability or asset that arises from the passage of time which is determined by applying the discountrate based on government bonds to the net retirement liability or asset. Net interest on the netretirement liability or asset is recognized as expense or income in the statement of income.

- 19 -
*SGVFS038854*
Remeasurements comprising actuarial gains and losses, return on plan assets and any change in theeffect of the asset ceiling (excluding net interest on defined benefit liability) are recognizedimmediately in OCI in the period in which they arise. Remeasurements are not reclassified tostatement of income in subsequent years.
Plan assets are assets that are held by a long-term employee benefit fund. Plan assets are notavailable to the creditors of the Company, nor can they be paid directly to the Company. Fair valueof plan assets is based on market price information. When no market price is available, the fair valueof plan assets is estimated by discounting expected future cash flows using a discount rate thatreflects both the risk associated with the plan assets and the maturity or expected disposal date ofthose assets (or, if they have no maturity, the expected period until the settlement of the relatedobligations). If the fair value of the plan assets is higher than the present value of the defined benefitobligation, the measurement of the resulting retirement asset is limited to the present value ofeconomic benefits available in the form of refunds from the plan or reductions in future contributionsto the plan.
The Company’s right to be reimbursed of some or all of the expenditure required to settle a definedbenefit obligation is recognized as a separate asset at fair value when and only when reimbursement isvirtually certain.
Employee leave entitlement
Employee entitlements to annual leave are recognized as a liability when they are accrued to theemployees. The undiscounted liability for leave expected to be settled wholly before twelve (12)months after the end of the annual statement of financial position date is recognized for servicesrendered by employees up to the end of the statement of financial position date.
Provisions and contingenciesProvisions are recognized when the Company has a present obligation (legal or constructive) where,as a result of a past event, it is probable that an outflow of resources embodying economic benefitswill be required to settle the obligation and a reliable estimate can be made of the amount of theobligation. If the effect of the time value of money is material, provisions are determined bydiscounting the expected future cash flows at a pre-tax rate that reflects current market assessments ofthe time value of money and, where appropriate, the risks specific to the liability.
Where discounting is used, the increase in the provision due to the passage of time is recognized as aninterest expense.
Contingent assets are not recognized but are disclosed in the notes to financial statements when aninflow of economic benefits is probable. Contingent liabilities are not recognized but are disclosed inthe notes to financial statements unless the possibility of an outflow of resources embodyingeconomic benefits is remote.
Income taxesIncome tax on profit and loss for the year comprises current and deferred taxes. Income tax isdetermined in accordance with tax laws and is recognized in the statement of income, except to theextent that it relates to items directly recognized in OCI.
Current tax
Current tax assets and liabilities for the current year are measured at the amount expected to berecovered from or paid to the tax authority. The tax rates and tax laws used to compute the amountare those that have been enacted or substantially enacted at the statement of financial position date.

- 20 -
*SGVFS038854*
Deferred tax
Deferred tax is provided, using the balance sheet liability method, on all temporary differences at thestatement of financial position date between the tax bases of assets and liabilities and their carryingamounts for financial reporting purposes.
Deferred tax assets are recognized for all deductible temporary differences to the extent that it isprobable that taxable profit will be available against which the deductible temporary differences canbe utilized. Deferred tax, however, is not recognized when it arises from the initial recognition of anasset or liability in a transaction that is not a business combination and, at the time of the transaction,affects neither the accounting profit nor taxable profit or loss.
The carrying amount of deferred tax assets is reviewed at each statement of financial position dateand reduced to the extent that it is no longer probable that sufficient taxable profit will be available toallow all or part of the deferred income tax asset to be utilized. Unrecognized deferred tax assets arereassessed at each statement of financial position date and are recognized to the extent that it hasbecome probable that future taxable profit will allow the deferred tax asset to be recovered.Deferred tax liabilities are recognized for all taxable temporary differences.
Deferred tax assets and liabilities are measured at the tax rates that are applicable to the year when theasset is realized or the liability is settled, based on tax rates (and tax laws) that have been enacted orsubstantively enacted at the statement of financial position date.
Current tax and deferred tax relating to items recognized directly in OCI are also recognized in OCIand not in the statement of income.
Deferred tax assets and deferred tax liabilities are offset if a legally enforceable right exists to offsetcurrent tax assets against current tax liabilities and deferred taxes related to the same taxable entityand the same taxation authority.
Events after the statement of financial position datePost year-end events that provide additional information about the Company’s position at thestatement of financial position date (adjusting events) are reflected in the financial statements. Postyear-end events that are not adjusting events are disclosed in the notes to the financial statementswhen material.
3. Significant Accounting Judgments, Estimates and Assumptions
The preparation of the financial statements in compliance with PFRS requires the Company to makeestimates and assumptions that affect the reported amounts of assets, liabilities, income and expensesand the disclosures of contingent assets and contingent liabilities. Future events may occur whichwill cause the judgments and assumptions used in arriving at the estimates to change. The effects ofany change in judgments and estimates are reflected in the financial statements as these becomereasonably determinable.
Judgments, estimates and assumptions are continuously evaluated and are based on historicalexperience and other factors, including expectations of future events that are believed to bereasonable under the circumstances. The following are the critical judgments and key assumptionsthat have a significant risk of material adjustment to the carrying amounts of assets and liabilitieswithin the next financial year:

- 21 -
*SGVFS038854*
Judgmentsa. Contingencies
The Company is currently involved in various legal proceedings. The estimate of the probablecost for the resolution of claims has been developed in consultation with the outside legal counselhandling the Company’s legal proceedings and is based upon an analysis of potential results.Management does not believe that the outcome of these matters will significantly affect thefinancial performance of the Company (Note 23).
b. Fair values of financial instruments
When the fair values of financial assets and financial liabilities recorded in the statement offinancial position cannot be measured based on quoted prices in active markets, their fair value ismeasured using valuation techniques including the discounted cash flow model. The inputs tothese models are taken from observable markets where possible, but where this is not feasible, adegree of judgment is required in establishing fair values. Judgments include considerations ofinputs such as liquidity risk, credit risk and volatility for longer-dated derivatives and discountrates, prepayments and default rates assumptions. Changes in assumptions about these factorscould affect the reported fair value of financial instruments.
The fair values of the Company’s financial instruments are disclosed in Note 5.
c. Uncertainty over income tax treatment
The Company applies significant judgment in identifying uncertainties over income taxtreatments. Since the Company operates in a highly regulated environment, it assessed whetherthe interpretation had an impact on its financial statements.
The Company applies significant judgment whether it is probable that a particular uncertainincome treatment will be acceptable to the taxation authority. The Company considers thefollowing:
· Past experience related to similar tax treatments
· Legal advice or case law related to other entities
· Practice guidelines published by the taxation authority that are applicable to the case
The interpretation did not have an impact on the financial statements of the Company as it hasdetermined that its current tax treatments are in accordance with the rules and regulations of thetaxation authorities.
Estimates and Assumptionsa. Estimation of allowance for credit losses on loans and other receivables, including loan
commitments
The Company’s ECL calculations are outputs of complex models with a number of underlyingassumptions that are considered accounting judgments and estimates include the following:
· The internal scorecards, which assigns PD to the different scorebands;
· The criteria for assessing if there is a SICR and therefore, allowances for these financialassets should be measured on a lifetime ECL;
· The expected life used for revolving credit facilities;
· The development of the ECL models, including the various formulas and the choice ofinputs;
· The selection of forward-looking macroeconomic scenarios to derive the economic inputsinto the ECL models;
· The use of five-year historical data in determining the recoveries in computing for LGD; and

- 22 -
*SGVFS038854*
· The probability weights used to consider three (3) various scenarios namely: baselinescenario, upside scenario, and downside scenario.
The provision for credit losses on accounts receivable is disclosed in more detail in Note 7.
b. Revenue recognition for customer loyalty programThe Company estimates the stand-alone price as the fair value of the points awarded under thecustomer loyalty program. This is derived by getting the discount that the credit cardholder willobtain when points are used, adjusted for both other discount/benefit that the customer willreceive without using the points, and the likelihood that usage will be exercised.
As points issued under the program do not expire, such estimates are subject to significantuncertainty. The estimated liability for unredeemed points is disclosed in Note 13.
c. Estimation of retirement liability
The cost of the Company’s defined benefit retirement plan is determined using an actuarialvaluation, which involve various assumptions. These assumptions include the determination ofdiscount rates and future salary increase rates. The defined benefit obligation is highly sensitiveto changes in underlying assumptions due to the complexity of the valuation and its long-termnature.
In determining the appropriate discount rate, management considers the market yields onPhilippine government bonds with terms consistent with the expected employee benefit payoutsas of the statement of financial position date.
Future salary increases are based on expected future inflation rates in the Philippines.
All assumptions are reviewed at each statement of financial position date. The details ofassumptions used in the actuarial valuation and amounts of retirement liability as ofDecember 31, 2019 and 2018 are disclosed in Note 19.
d. Estimation of incremental borrowing rate for leases
The Company cannot readily determine the interest rate implicit in the lease, therefore, it uses itsincremental borrowing rate (IBR) to measure lease liabilities. The IBR is the rate of interest thatthe Company would have to pay to borrow over a similar term, and with a similar security, thefunds necessary to obtain an asset of a similar value to the right-of-use asset in a similareconomic environment. The IBR therefore reflects what the Company ‘would have to pay’,which requires estimation when no observable rates are available or when they need to beadjusted to reflect the terms and conditions of the lease. The Company estimates the IBR usingobservable inputs when available and is required to make certain entity-specific estimates.
4. Financial Risk and Capital Management
Risk is inherent in the Company’s operations but is managed through a process of ongoingidentification, measurement and monitoring of various risk management parameters, limits and othercontrols. This process of risk management is critical to the Company’s going concern and theCompany’s management is aware and responsible for the risk exposures relating to the Company’sbusiness activities that include, but are not limited to, the following areas:
· Credit risk
· Market risk
· Liquidity risk

- 23 -
*SGVFS038854*
· Operational risk
· Information security risk
The independent risk control process does not include business risks such as changes in theenvironment, technology and industry. They are monitored through the Company’s strategicplanning process.
Risk Management FrameworkThe Company’s BOD has overall responsibility for the oversight of the Company’s risk managementprocess. Supporting the BOD in this function are BOD-level committees such as the AuditCommittee, Risk Oversight Committee (ROC), EXECOM and Management Committee.The Audit Committee and the ROC are responsible for monitoring the Company’s compliance withregulatory requirements, risk management policies and procedures, and for reviewing the adequacy ofthese policies and procedures in regard to the risks faced by the Company. Both Committees aresupported in these functions by the Risk Management, Finance, Compliance and Internal Audit,through the Executive and Management Committees.
The Audit Committee and the ROC are each composed of at least three (3) members of the BOD, atleast two (2) of whom are independent directors, including the Chairman, with accounting, auditingor related financial management expertise or experience.
The principal responsibilities of the Audit Committee include annual review and reporting to theBOD on its own performance and to provide oversight of internal, compliance and external auditfunctions. The ROC is required to identify major credit, operating, liquidity, market risks and otherrisk issues and shall assess the probability of each risk becoming a reality, estimate its possible effectand cost, and prioritize areas of concern where those risks will most likely occur. Moreover, the ROCensures that all risk management strategies and policies for all types of risk are developed, properlydocumented, implemented and effectively communicated to the Company.
The ROC oversees the Risk Management Division (RMD) in strengthening the Company’s policiesand procedures.
The RMD of the Company is composed of the Head of Acquisition Risk and Strategy Management,Head of Portfolio Risk, Head of Risk Management Analytics (RMA), Head of Operating Risk, Headof Liquidity Risk, and the Business Information Security Officer (BISO), all of whom report to theHead of Risk Management, who then reports directly to the ROC.
The risk management process involves the following:
Chief Financial Officer (CFO)
The CFO oversees all financial aspects of the business operation, which includes directing andoverseeing all financial activities of the Company, including preparation of current financial reports,as well as summaries and forecasts for future business growth and general economic outlook. TheCFO provides leadership and coordination in the accounting, business planning, managementinformation and budgeting efforts of the Company.
Risk Management HeadThe Risk Management Head is accountable for ensuring the efficient and effective governance ofsignificant risks and related opportunities of the business. The Risk Management Head manages anddevelops a comprehensive process for assessing, identifying, monitoring and reducing pertinentbusiness risks such as credit, market, liquidity and operations that could interfere with the Company’sobjectives and goals. It is usually the Risk Management Head’s responsibility to ensure that the

- 24 -
*SGVFS038854*
Company is in substantial compliance with its internal operating policies and procedures and anyexternal legal, regulatory or contractual requirements.
Credit RiskCredit risk is the risk that one party to a financial instrument will fail to discharge an obligation andcause the other party to incur a financial loss. The Company manages credit risk by setting limits forindividual borrowers, and groups of borrowers and industry segments. The Company also monitorscredit exposures, and continuously assesses the creditworthiness of counterparties.
The Company has established the Credit Risk Unit (CRU), composed of Acquisitions Risk andPortfolio Risk, which continues to modernize and streamline the Company’s Credit RiskManagement practices and processes. The CRU is responsible for establishing credit policies andprocesses to minimize losses while ensuring the sustainability of the business.
The Credit Risk team is responsible for managing the portfolio through regular monitoring ofacquisition, line management and usage programs with the goal of limiting exposure to bad accountswhile maximizing revenue. The Credit Risk team is also involved in monitoring and managing thequality of the credit card portfolio through its oversight functions over Fraud, Authorizations, andCollections.
Management Information Systems (MIS) play an integral part in credit risk management. RegularMIS from Credit Risk help the business identify possible sources of risks. Credit policies, whichshould always be in consultation with business unit, must be supported by MIS reports.
The Company manages credit risk guided by the following principles:
· Strict compliance to credit policies;
· Credit policies should be in consultation with business units and, where appropriate, supported byMIS reports. This covers credit assessment and process, compliance and regulatory requirementsand account management;
· Minimize losses by establishing robust credit policies and processes;
· Approval of credit facilities should be based on authorization limits approved by the BOD;
· Expansion to new markets is controlled through credit testing and full use of available creditscoring facilities and credit bureau information;
· Management of portfolio through regular monitoring and analysis of acquisition, linemanagement and usage programs with the goal of controlling exposure to bad accounts whilemaximizing revenue through effective line management and usage campaigns;
· Delinquent accounts are managed by implementing robust collection strategies and efficientmanagement of collection resources;
· A conscious effort to continuously challenge existing strategies and processes to adapt to changesin the market and maintain the Company’s competitiveness; and
· To track the performance of the portfolio, CRU develops, implements and reviews the creditstrategies, policies, models, processes and MIS.

- 25 -
*SGVFS038854*
a. Credit risk exposure
Maximum exposure to credit risk after collateral held or other credit enhancementsThe tables below provide the analysis of the maximum exposure to credit risk of the Company’sfinancial instruments, excluding those where the carrying values as reflected in the statements offinancial position and related notes already represent the financial instrument’s maximumexposure to credit risk, before and after taking into account collateral held or other creditenhancements:
2019
Gross
Maximum
Exposure
Fair Value
of Collateral
or Credit
Enhancement Net Exposure
Financial
Effect
of Collateral
or Credit
Enhancement
Accounts receivable:
Fully secured cardholders’ receivables P=173,796,551 P=173,796,551 P=− P=173,796,551
2018
GrossMaximumExposure
Fair Value
of Collateralor Credit
Enhancement Net Exposure
FinancialEffect
of Collateralor Credit
Enhancement
Accounts receivable:Fully secured cardholders’ receivables P=175,667,078 P=175,667,078 P=− P=175,667,078
Collateral and other credit enhancements
The fair value of hold-out cash deposits, that serve as collateral for certain customers,approximate their carrying value due to their short-term maturities.
Offsetting of financial instrumentsThe Company does not have financial instruments that can be offset under enforceable masternetting agreement or similar agreements.
b. Concentration riskConcentrations arise when a number of counterparties belong to a group controlled by a family ora conglomerate or are engaged in similar business activities or activities in the same geographicalregion, or have some similar economic, political, or other conditions. Concentrations indicatethe relative sensitivity of the Company’s performance to developments affecting a particularindustry or geographical location.
While concentration of credit risks are inherent in the Company’s business and cannot be totallyeliminated, they are limited and reduced through the Company’s risk control and diversificationstrategies. Safeguarding against credit risk concentrations is an important component of theCompany’s risk management system.
The BOD is responsible for establishing and monitoring compliance with policies governinglarge exposures and credit risk concentrations of the Company. The BOD reviews these policiesregularly (at least annually) to ensure that they remain adequate and appropriate for the Company.Subsequent changes to the established policies are approved by the BOD.

- 26 -
*SGVFS038854*
Concentration of risks of financial assets with credit risk exposure
An analysis of concentration of risk at the statement of financial position date based on thecarrying amount of financial instruments is shown below:
2019
Loans and
Receivables
Loans and
Advances to
Banks* Others** Total
Concentration by industry:
Personal activities P=93,937,786,634 P=− P=209,765,892,623 P=303,703,679,257
Philippine government − 6,169,050,643 − 6,169,050,643
Financial intermediaries 12,962,269 743,553,859 211,658,525 968,174,653
93,950,748,903 6,912,604,502 209,977,551,148 310,840,904,553
Unearned interest and other deferred income (6,119,735,171) − − (6,119,735,171)
Allowance for ECL (4,608,794,900) – – (4,608,794,900)
P=83,222,218,832 P=6,912,604,502 P=209,977,551,148 P=300,112,374,482
Concentration by location:
Metro Manila P=42,403,159,160 P=6,912,604,502 P=92,677,353,309 P=141,993,116,971
Luzon (except Metro Manila) 31,323,681,031 − 71,279,258,646 102,602,939,677
Visayas 10,387,965,778 − 23,638,553,168 34,026,518,946
Mindanao 9,835,942,934 − 22,382,386,025 32,218,328,959
93,950,748,903 6,912,604,502 209,977,551,148 310,840,904,553
Unearned interest and other deferred income (6,119,735,171) − − (6,119,735,171)
Allowance for ECL (4,608,794,900) – – (4,608,794,900)
P=83,222,218,832 P=6,912,604,502 P=209,977,551,148 P=300,112,374,482
*Comprised of Cash in banks, Due from BSP and Interbank loans receivable
**Comprised of Commitments and contingencies, FVOCI investments, Variation marginal deposit and Refundable deposits
2018
Loans andReceivables
Loans and
Advances toBanks* Others** Total
Concentration by industry:
Personal activities P=75,199,438,156 P=− P=185,595,765,004 P=260,795,203,160Philippine government − 11,726,731,502 − 11,726,731,502Financial intermediaries 26,004,304 1,082,259,131 14,307,109 1,122,570,544
75,225,442,460 12,808,990,633 185,610,072,113 273,644,505,206Unearned interest and other deferred income (4,330,117,097) − − (4,330,117,097)Allowance for ECL (4,101,798,235) (146,174) − (4,101,944,409)
P=66,793,527,128 P=12,808,844,459 P=185,610,072,113 P=265,212,443,700
Concentration by location:Metro Manila P=34,471,059,510 P=12,808,990,633 P=83,695,355,373 P=130,975,405,516Luzon (except Metro Manila) 25,108,778,259 − 62,789,664,294 87,898,442,553
Visayas 8,142,466,156 − 20,361,911,328 28,504,377,484Mindanao 7,503,138,535 − 18,763,141,118 26,266,279,653
75,225,442,460 12,808,990,633 185,610,072,113 273,644,505,206
Unearned interest and other deferred income (4,330,117,097) − − (4,330,117,097)Allowance for ECL (4,101,798,235) (146,174) − (4,101,944,409)
P=66,793,527,128 P=12,808,844,459 P=185,610,072,113 P=265,212,443,700
*Comprised of Cash in banks, Due from BSP and Interbank loans receivable
**Comprised of Commitments and contingencies, FVOCI investments and Refundable deposits

- 27 -
*SGVFS038854*
c. Credit quality of financial assets
Accounts receivableReceivables of the Company include those due from cardholders and other receivables.
The Company classifies and measures the quality of its receivables, together with itscorresponding unused credit line, using their existing internal credit rating grade as follows:
i. ExcellentThese are customers that have exhibited the best payment behavior and are generally thosewithout history of past due which have been paying the outstanding balance in full over aperiod of twelve (12) months.
ii. Very satisfactoryThese are customers that have exhibited the good payment behavior and are generally thosewithout history of past due but could have revolved over a period of twelve (12) months.
iii. SatisfactoryThese are customers that have shown history of past due but not impaired, and are stillwithin the average level of the credit card portfolio which remains to be profitable.
iv. PoorThese are customers that are past due but not yet impaired and could still be cured bycollection mitigation strategies.
v. DefaultThese are customers that are already impaired. Recovery strategies are needed to reduceexposure to these customers.
Loans and advances to banks and other assetsFinancial instruments other than credit card receivables for which the Company has not yetestablished a credit rating system are classified as unrated. These financial assets include:
a) Cash and cash equivalentsCash and cash equivalents include deposits with various banks and interbank loansreceivable, and deposit accounts with the BSP. There is a high assurance of timely paymentof interest and principal. The Company classifies and measures the quality of its cash andcash equivalents by the internal credit rating grade as follows:
i. Highest qualityThis rating is given to counterparties with very low probability of going into default andwith high degree of stability and very strong debt service capacity. The counterpartyexhibits highest quality under virtually all economic conditions. This is given tocounterparties with very satisfactory track record and has long-time business relations withthe Company.
ii. Good qualityThis rating is given to counterparties with low probability of going into default in thecoming year and has comfort degree of stability and strong market and financial position,with a history of successful performance. The counterparty is also well capitalized and hasa good track record and existing business relations with the Company.

- 28 -
*SGVFS038854*
iii. AverageThis rating is given to smaller banks/financial institutions. While probability of default islow, it bears characteristics of some degree of stability and substance. Risk elements aresufficiently pronounced although the counterparty should still be able to withstand normalbusiness cycles. This is given to counterparties with average track record and withrelatively new business relations with the Company.
iv. Below averageThis rating is given to counterparties that have specific risk factors which represent aconcern. Operating performance and financial strength may be marginal. The counterpartymay find it hard to cope with any significant economic downturn and a default is more thana possibility. This is given to counterparties with below average organizationalmanagement and track record.
v. Poor qualityThis rating is given to high-risk banks/financial institutions with poor financialperformance and organizational management. The Company does not recommend thatlines be established for counterparties with this rating.
b) Other assetsThis account consists of FVOCI investments, variation marginal deposit and refundabledeposits.
The following tables show the credit quality of the Company’s financial assets as ofDecember 31, 2019 and 2018 (amounts in thousands):
2019
Internal rating grade Stage 1 Stage 2 Stage 3 Total
Accounts receivable
Excellent P=53,187,058 P=– P=– P=53,187,058Very satisfactory 15,592,245 – – 15,592,245Satisfactory 7,066,160 – – 7,066,160Poor 6,051,160 6,397,733 – 12,448,893Default – – 4,162,476 4,162,476
P=81,896,623 P=6,397,733 P=4,162,476 P=92,456,832
2019
Internal rating grade Stage 1 Stage 2 Stage 3 Total
Allowance for credit losses
Excellent P=234,810 P=– P=– P=234,810Very satisfactory 286,310 – – 286,310Satisfactory 324,667 – – 324,667Poor 546,634 1,682,556 – 2,229,190Default – – 1,505,931 1,505,931
P=1,392,421 P=1,682,556 P=1,505,931 P=4,580,908
2019
Internal rating grade Stage 1 Stage 2 Stage 3 Total
Unused credit lines
Excellent P=171,744,375 P=– P=– P=171,744,375Very satisfactory 19,900,189 – – 19,900,189Satisfactory 7,534,496 – – 7,534,496Poor 6,068,434 2,846,928 – 8,915,362Default – – 1,671,471 1,671,471
P=205,247,494 P=2,846,928 P=1,671,471 P=209,765,893

- 29 -
*SGVFS038854*
2019
Internal rating grade Stage 1 Stage 2 Stage 3 Total
Provisions
Excellent P=171,036 P=– P=– P=171,036Very satisfactory 99,909 – – 99,909Satisfactory 124,880 – – 124,880Poor 184,009 195,945 – 379,954Default – – – –
P=579,834 P=195,945 P=– P=775,779
2018
Internal rating grade Stage 1 Stage 2 Stage 3 Total
Accounts receivableExcellent P=42,807,057 P=– P=– P=42,807,057Very satisfactory 12,312,866 – – 12,312,866Satisfactory 5,321,320 – – 5,321,320Poor 5,186,802 5,519,320 – 10,706,122Default – – 3,517,958 3,517,958
P=65,628,045 P=5,519,320 P=3,517,958 P=74,665,323
2018
Internal rating grade Stage 1 Stage 2 Stage 3 Total
Allowance for credit lossesExcellent P=137,243 P=– P=– P=137,243Very satisfactory 162,261 – – 162,261Satisfactory 173,245 – – 173,245Poor 444,148 1,841,462 – 2,285,610Default – – 1,327,724 1,327,724
P=916,897 P=1,841,462 P=1,327,724 P=4,086,083
2018
Internal rating grade Stage 1 Stage 2 Stage 3 Total
Unused credit linesExcellent P=153,537,815 P=– P=– P=153,537,815Very satisfactory 16,587,100 – – 16,587,100Satisfactory 5,780,810 – – 5,780,810Poor 6,882,745 2,660,690 – 9,543,435Default – – 146,605 146,605
P=182,788,470 P=2,660,690 P=146,605 P=185,595,765
2018
Internal rating grade Stage 1 Stage 2 Stage 3 Total
ProvisionsExcellent P=88,256 P=– P=– P=88,256Very satisfactory 104,343 – – 104,343Satisfactory 111,407 – – 111,407Poor 285,613 326,057 – 611,670Default – – – –
P=589,619 P=326,057 P=– P=915,676
d. Impairment assessment
Internal scorecards and PD estimation process
· Credit cardsPart of the Company’s policy on acceptance of each loan is based on the likelihood of acustomer to turn delinquent. The Company uses internal rating to estimate quantitatively thelikelihood of a customer to turn delinquent.

- 30 -
*SGVFS038854*
The Company uses an Application Scorecard and assigns a score for each credit cardapplication based on the customer’s tendency to go “bad”. Once approved, an account’sbehavior through its usage, payment history, and other performance indicators is monitored.These indicators are then utilized to assess a customer’s risk specifically its propensity tomiss payment and go delinquent through the computation of the Behavioral Score (BScore).
The Company’s Point-in-time (PiT) PD estimates leverages on the Company’s existinginternal scorecards wherein each score has a corresponding PD depending on the scoreband.For unscored segments, special PD rates based on historical performance, adjusted withforward-looking macroeconomic variable, are assigned. The PiT PDs are then adjusted forPFRS 9 ECL calculations to incorporate forward-looking information.
· Treasury exposuresThe Company’s treasury counterparties comprise financial services institutions and banks.For these relationships, the Company analyzes publicly available information, such asfinancial information and other external data.
LGD
LGD is defined as the amount of loss incurred from a defaulted account expressed as a percentageof loss exposure at the time of default. An LGD model was developed by collecting historicalinformation on defaulted accounts and the observed cash flows, including recoveries and costs,for a five-year period after default. The Company then segments its portfolio based oncharacteristics that are relevant to the estimation of future cash flows.
The Company uses the EIR as discounting factor to obtain the present value of recoveries andcost, which are used to consider the time value of money in determining the LGD per account.
EAD
EAD represents the amount that the borrower owes to the Company at the time of default. Thisamount also addresses both the borrower’s ability to increase its exposure while approachingdefault and potential payments. The Company segments its credit card portfolio based on keycharacteristics that predict the probability to use the unused credit limit or the Credit ConversionFactor (CCF). EAD is then calculated based on the factor applied to the unused credit line.
To calculate the EAD for a Stage 1 exposure, the Company assesses the possible default eventswithin twelve (12) months for the calculation of the 12-months ECL. For Stage 2 and Stage 3,the EAD is considered for events over the lifetime of the financial instruments.
Credit risk at initial recognition
The Company uses internal credit assessment and approvals at various levels to determine thecredit risk of exposures at initial recognition. Assessment can be quantitative or qualitative anddepends on the materiality of the facility or the complexity of the portfolio to be assessed.
Forward-looking information
PFRS 9 requires the use of forward-looking assumptions, aside from historical experiences, inmeasuring ECL. The overlay model was used to adjust the PD calculated from the internalscorecards to a forward-looking PiT PD.
Forecasts of key drivers may be derived by or acquired from affiliated units who monitor suchmacroeconomic variables, from publicly available forecasts, or from statistical forecasts usinghistorical data.

- 31 -
*SGVFS038854*
In determining the appropriate macroeconomic variables used as forward-looking information,the Company used Single Factor Analysis (SFA). Further, the Company also used Multi-FactorAnalysis (MFA) to further identify the macroeconomic variable with the most significant impacton PD. The inputs and models used for calculating ECL may not always capture allcharacteristics of the market at the date of the financial statements. To address this, quantitativeadjustments or overlays are occasionally made as temporary adjustments when such differencesare significantly material.
In 2018, the Company incorporated forward-looking information to its ECL estimation using thefollowing economic inputs:
· Gross Domestic Product (GDP) (current) growth
· London Interbank Offered Rate (LIBOR)
· PHP / United States Dollar (USD) exchange rate
In 2019, after model reviews and validation, the Company relies on the following as economicinputs in measuring ECL:
· Treasury bill rates
· Philippine Stock Exchange (PSE) All Shares Index
· GDP growth
· External Debt
· PSE Financials Index
· GDP Financial Intermediation
· Government expenditure
Where modelling of a parameter is carried out on a collective basis, the financial assets aregrouped on the basis of shared risk characteristics, which include product type, basis of approval,market segment, vintage and geographical location. The groupings are subject to regular reviewto ensure that exposures within a particular group remain appropriately homogenous.
Probability-weighted scenarios
ECLs are probability-weighted estimate of credit losses over the expected life of the asset. Underthe ECL model, the Company estimates possible defaults over three (3) various scenarios namely:baseline scenario, upside scenario, and downside scenario, where each scenario would have itsown set of economic forecasts for the ECL components. The Company’s probability-weightedECL reflects management’s estimate of 70% as the weight for the base case scenario and 15%chance of occurrence for both the upside and downside scenarios.
12-month ECL and lifetime ECL
12-month ECL is defined as a portion of the lifetime ECL that results from default events on afinancial instrument that are possible within twelve (12) months after the reporting date. A12-month ECL will be provided for accounts with low credit risk or if no significant deteriorationwas observed.
In the staging criteria, the priority is to categorize the accounts with Stage 2 and Stage 3 ECLwhich will have lifetime ECL, and all others will have a 12-month ECL.
For credit exposures where there has been a SICR, a loss allowance is required under lifetimeECL. An entity needs to determine the expected life for each instrument, defined as:
· the maximum contractual period (including extensions) over which the entity is exposed tocredit risk; and

- 32 -
*SGVFS038854*
· the entire period that it is expected to be exposed to credit risk and the credit riskmanagement actions that an entity expects to take once the credit risk on the financialinstrument has increased.
The Company assessed the expected life of its credit card portfolio as the period over whichcumulative default rate has stabilized, establishing the life of its credit card portfolio attwo (2) years or 24 months, which is the period over which cumulative default rate has stabilized.
In 2018, an account is said to enter Stage 2 or Stage 3, if account has a B-Score of 345 and belowor is tagged as default (see SICR), respectively.
In 2019, due to model enhancements, an additional criterion for an account to enter stage 2 iswhen it has reached at least 30 days past due (see SICR).
Change control policy
Any changes in the ECL model shall be subject to the approval of the following depending on thenature and the impact of the changes:
· President
· Chief Risk Officer (CRO)
· ROC / BOD
The inputs and models used for calculating ECL may not always capture all characteristics of theeconomy, the market, or other factors not addressed by the models. To reflect this, post-modelling qualitative adjustments or overlays may be made which may increase or decrease theECL.
Management subjects its ECL model for review and validation at least annually to ensure that thefactors within the model are up to date and relevant to the Company’s goals and objectives.
The RMD reports the required allowance for ECL on a monthly basis to the CRO. The CROassesses whether the allowance is adequate and within management’s estimate by determining thereasonableness for the increase (decrease) in the allowance. Once approved by the CRO, the finalfigures of the allowance for ECL is reported monthly to Senior Management and EXECOM, aswell as quarterly during ROC meetings.
The Company has an internal validation team from its Business Intelligence Unit (BIU) andFinancial Accounting Unit (FAU) to regularly validate the effectiveness of the model anddetermine appropriate controls over the process. Refinements in the model depend on theassessment of the internal validation team.
Written off accounts
As a policy, all accounts receivable shall be written-off upon reaching 180 dpd except for thosetagged as Rewrite and DOSRI. Rewrite accounts are automatically written-off when it reaches90 dpd.
Aside from contractual write-off which occurs at 180 dpd, early write-off is considereddepending on the circumstances as evaluated by Collections Division. Accounts of deceasedcardholders or accounts with negative skip tracing results are endorsed for early write-off.

- 33 -
*SGVFS038854*
Other receivables may be endorsed for write-off upon reaching 180 dpd. These loans and othercredit accommodations which are considered uncollectible or worthless shall be considered as aloss subject to approval of the EXECOM.
Write-off shall be taken up in the books within the month when the accounts are tagged aswrite-off or upon the receipt of list of write-off for the month. In the case of accounts classifiedas DOSRI, write-off in the books shall be upon receipt of the approval from the Board.
Market RiskMarket risk is the risk to earnings or capital arising from adverse movements in factors that affect themarket value of financial instruments. The Company focuses on two market risk areas, which areinterest rate risk and foreign currency risk.
a. Interest rate risk
Interest rate risk is the risk that changes in market interest rates will reduce current or futureearnings and/or the economic value. The Company’s borrowings consist of a mix of fixed ratenotes and monthly repriceable loans, in order to ensure that any adverse effects of interest ratefluctuations are minimized.
The Treasury Unit is primarily responsible in managing the liquidity, as well as the interest raterisk of the Company. The Treasury Unit ensures borrowings from various sources of funds areavailed at the cheapest possible cost at acceptable terms. In measuring interest rate risk, theCompany employs gap analysis wherein an interest rate gap report is prepared by breaking downthe statements of financial position accounts according to their contractual maturities or repricingdates, whichever is applicable. The difference in the amount of assets and liabilities maturing orbeing repriced in any pre-specified time band would be treated as an indicator of the Company’sexposure to the risk of potential changes in net interest income.
A funding policy guides the Company’s management in determining appropriate levels of termfunding that addresses, among other things, interest rate risk, maturity concentration and fundingdiversification.
The following tables demonstrate the sensitivity to a reasonably possible change in interest rates,with all other variables held constant, of the Company’s income before income tax (amounts inmillions):
2019
Changes in interest rates (in basis points)
(100) (50) 100 50
Change in income before income tax P=654.0 P=327.0 (P=654.0) (P=327.0)
As percentage of the Company’sincome before income tax 9.3% 4.7% (9.3%) (4.7%)
2018
Changes in interest rates (in basis points)(100) (50) 100 50
Change in income before income tax P=603.0 P=301.5 (P=603.0) (P=301.5)As percentage of the Company’s
income before income tax 8.5% 4.2% (8.5%) (4.2%)
This sensitivity analysis is performed for risk management purposes and assumes no otherchanges in the repricing structure and loan volumes. Actual changes in net income will vary fromthe model.

- 34 -
*SGVFS038854*
Other than the potential impact on the Company’s income before income tax, there is no othereffect in equity.
The RMD prepares a quantitative risk model on interest rate risk called the Earnings-at-Risk(EaR). The EaR is used to measure any mismatch between assets and liabilities in terms ofinterest rate repricing. The RMD developed EaR limit over a 1-year period. The limit isestablished to reduce the potential exposure of earnings and/or capital from changes in interestrates. Such method of measuring and controlling interest rate risk is applied during the year. TheBOD approved EaR limit for 2019 as the difference between the 2019 budgeted net interestincome and 2018 actual net interest income which amounts to P=1.0 billion.
b. Foreign currency riskForeign currency risk arises on financial instruments that are denominated in a foreign currency,which is the currency other than the functional currency in which the Company is measured.
Information on the Company’s USD-denominated monetary assets and liabilities as ofDecember 31, 2019 and 2018 and their PHP equivalents are as follows (amounts in thousands):
2019 2018
USD PHP Equivalent USD PHP Equivalent
Financial assets
Cash in banks US$1,203 P=60,914 US$2,618 P=137,658Accounts receivable 7,143 361,688 6,473 340,350
8,346 422,602 9,091 478,008
Financial liabilities
Notes payable 18,000 911,430 5,700 299,706Accrued interest payable 8 405 13 706
18,008 911,835 5,713 300,412
Net foreign currency-denominated
assets (liabilities) (US$9,662) (P=489,233) US$3,378 P=177,596
Financial liabilities above do not include the dollar-denominated floating rate loans hedged intopeso fixed rate loans since the cash flow hedge manages the Company’s exposure to foreigncurrency risk (Note 8).
The following tables demonstrate the sensitivity to a reasonably possible change in the USDexchange rate, with all other variables held constant, of the Company’s income before income tax(amounts in millions):
2019
Changes in foreign exchange rates
(1.0%) (0.5%) 1.0% 0.5%
Change in income before income tax P=489.2 P=244.6 (P=489.2) (P=244.6)
As percentage of the Company’snet income before income tax 7.0% 3.5% (7.0%) (3.5%)
2018
Changes in foreign exchange rates
(1.0%) (0.5%) 1.0% 0.5%
Change in income before income tax (P=177.6) (P=88.8) P=177.6 P=88.8As percentage of the Company’s
net income before income tax (2.5%) (1.3%) 2.5% 1.3%

- 35 -
*SGVFS038854*
Liquidity Risk and Funding ManagementLiquidity risk and funding management is the ability of the Company to meet financial obligations asthey fall due. Liquidity risk is the current and prospective risk to earnings or capital arising from theCompany’s inability to meet its financial obligations as they fall due.
Liquidity risk and funding management involves setting a strategy, ensuring effective board andsenior management oversight, as well as operating under a sound process for measuring, monitoringand controlling liquidity risk. It requires the Company not only to measure its liquidity position on anongoing basis but also to examine how funding requirements are likely to evolve under variousscenarios, including adverse conditions.
A strong liquidity management system in particular is characterized by an effective analysis of netfunding requirements under alternative scenarios and diversification of funding sources.
The Company is continuously working on developing diversified funding sources to support its assetgrowth, as well as to minimize liquidity and interest rate risks.
The Treasury Unit, on a daily basis, monitors the cash position of the Company. The Treasury Unitensures that the Company has ample liquidity to settle financial obligations that are due as of a givenperiod. The Treasury Unit employs various liquidity or funding tools to determine the expectedfunding requirements for a particular period.
The RMD prepares the monthly Maximum Cumulative Outflow (MCO) report to measure theliquidity mismatch risk as of a given period. The MCO report provides quantitative information onthe potential liquidity risk exposure based on pre-specified time bands. The Company has establishedMCO limit to aid in controlling liquidity risk. Effective June 2018, the MCO limit is equal to thefunding capacity which is equal to total available bank lines. Prior to this change, the MCO limit isequal to the total wholesale borrowing limit less utilized borrowing limit. As of December 31, 2019and 2018, the Company reported positive MCO limit of P=31.9 billion and P=35.2 billion correspondingto the total funding and P=21.0 billion and P=10.8 billion corresponding to 80.0% of the total wholesaleborrowing limit less utilized borrowing limit, respectively.
Aside from the MCO report, the RMD also prepares monthly Liquidity Stress testing to augment inmeasuring potential liquidity risk exposures under different stress scenarios.
The tables below show the MCO report of the Company as of December 31, 2019 and 2018 (amountsin millions):
2019
Up to
1 Month
1 to 2
Months
2 to 3
Months
3 to 6
Months
6 to 12
Months
Beyond
1 Year Total
Assets P=10,359 P=7,569 P=6,786 P=14,823 P=16,183 P=34,654 P=90,374
Liabilities 16,957 18,678 2,784 5,351 7,998 21,072 72,840
Periodic Gap (P=6,598) (P=11,109) P=4,002 P=9,472 P=8,185 P=13,582 P=17,534
Cumulative Gap (P=6,598) (P=17,707) (P=13,705) (P=4,233) P=3,952 P=17,534
2018
Up to1 Month
1 to 2Months
2 to 3Months
3 to 6Months
6 to 12Months
Beyond1 Year Total
Assets P=10,662 P=6,227 P=5,636 P=12,072 P=12,713 P=32,166 P=79,476Liabilities 13,928 6,646 2,485 9,560 5,949 27,423 65,991
Periodic Gap (P=3,266) (P=419) P=3,151 P=2,512 P=6,764 P=4,743 P=13,485
Cumulative Gap (P=3,266) (P=3,685) (P=534) P=1,978 P=8,742 P=13,485

- 36 -
*SGVFS038854*
The Company includes committed credit line and net cash flows from cross-currency swap interestrate swaps amounting to P=1.0 billion and P=126.1 million, respectively, in determining the periodicgap during the year.
The tables below summarize the maturity profile of the undiscounted remaining contractual maturitiesof the Company’s financial assets and liabilities as of December 31, 2019 and 2018 (amounts inthousands):
2019
Up to
1 Month
1 to 3
Months
3 to 6
Months
6 to 12
Months
Beyond
1 Year Total
Financial Assets
Cash and cash equivalents P=743,566 P=– P=– P=– P=– P=743,566
Due from BSP 5,994,131 – – – – 5,994,131
Interbank loans receivable 174,920 – – – – 174,920
Accounts receivable:Cardholders 8,696,409 48,215,403 6,483,314 16,159,679 12,902,027 92,456,832
Others 1,249,234 – – – – 1,249,234
Other current assets 168,615 – – – – 168,615
17,026,875 48,215,403 6,483,314 16,159,679 12,902,027 100,787,298
Financial Liabilities
Accounts payable:Merchants 2,134,219 – – – – 2,134,219
Others 921,777 – – – – 921,777
3,055,996 – – – – 3,055,996
Bills payable 16,212,353 17,292,681 5,863,492 5,306,199 2,289,018 46,963,743
Notes payable 6,715,126 9,231,586 – – 6,909,702 22,856,414
Derivative liabilitiesGross contractual receivable – 3,308,965 12,208 23,889 1,921,498 5,266,560
Gross contractual payable – (3,440,284) (33,801) (67,234) (2,083,978) (5,625,297)
Subordinated debt – 18,164 18,164 18,164 1,403,855 1,458,347
Lease liabilities 2,217 2,885 7,523 14,808 31,636 59,069
Accrued interest and other expenses:Accrued interest payable 118,714 270,711 48,152 35,368 33,491 506,436
Accrued advertising 239,504 – – – – 239,504
Accrued other expenses 731,746 – – – – 731,746
27,075,656 26,684,708 5,915,738 5,331,194 10,505,222 75,512,518
Net undiscounted financial assets
(liabilities) (P=10,048,781) P=21,530,695 P=567,576 P=10,828,485 P=2,396,805 P=25,274,780
2018
Up to1 Month
1 to 3 Months
3 to 6 Months
6 to 12 Months
Beyond1 Year Total
Financial AssetsCash and cash equivalents P=1,082,272 P=– P=– P=– P=– P=1,082,272Due from BSP 9,526,732 – – – – 9,526,732Interbank loans receivable 2,200,000 – – – – 2,200,000Accounts receivable:
Cardholders 14,397,970 33,615,864 7,885,348 9,359,121 9,407,020 74,665,323Others 392,222 – – – – 392,222
27,599,196 33,615,864 7,885,348 9,359,121 9,407,020 87,866,549
Financial LiabilitiesAccounts payable:
Merchants 1,525,460 – – – – 1,525,460Others 599,282 – – – 599,282
2,124,742 – – – – 2,124,742Bills payable 9,736,726 5,537,080 2,842,998 3,081,933 8,661,079 29,859,816Notes payable 6,827,983 4,309,551 7,810,679 1,748,599 10,836,180 31,532,992Derivative liabilities
Gross contractual receivable – 67,283 73,470 5,401,276 2,072,927 7,614,956Gross contractual payable – (123,305) (130,936) (5,575,392) (2,218,625) (8,048,258)
Subordinated debt – 18,164 18,164 18,164 1,476,431 1,530,923Accrued interest and other expenses:
Accrued interest payable 187,983 136,786 50,998 20,740 25,770 422,277Accrued advertising 115,999 – – – – 115,999Accrued other expenses 553,420 – – – – 553,420
19,546,853 9,945,559 10,665,373 4,695,320 20,853,762 65,706,867
Net undiscounted financial assets(liabilities) P=8,052,343 P=23,670,305 (P=2,780,025) P=4,663,801 (P=11,446,742) P=22,159,682

- 37 -
*SGVFS038854*
Basel III Leverage Ratio
BSP Circular Nos. 881 and 990 cover the implementing guidelines on the Basel III Leverage Ratio(BLR) framework designed to act as a supplementary measure to the risk-based capital requirementsand shall not be less than 5.0%. The monitoring period has been set every quarter startingDecember 31, 2014 and extended until June 30, 2018. Effective July 1, 2018, the monitoring of theleverage ratio was implemented as a Pillar I minimum requirement.
The details of the BLR, as reported to the BSP, as of December 31, 2019 and 2018 follow:
2019 2018
Tier 1 Capital P=16,808,528,939 P=12,412,865,801Exposure Measure 116,371,606,794 100,743,378,831
BLR 14.4% 12.3%
Liquidity Coverage Ratio
On March 10, 2016, the BSP continued its operation of Basel III reforms in its issuance of CircularNo. 905 requiring banks to comply with the Liquidity Coverage Ratio (LCR). In 2019, the BSPextended the observation period to December 31, 2019 with a minimum requirement of 70% forsubsidiary banks and quasi-banks and 100% effective January 1, 2020. As of December 2019, theCompany’s LCR dropped to 93.4% as it has been keeping its borrowings short-term in preparation forthe merger with the Parent Company. In BOD Resolution No. 1480, the Company requested from theBSP to be exempted from complying with the LCR of 70% floor limit and to maintain at least 50%floor limit instead until the effectivity of the merger. The BSP approved the Resolution onSeptember 27, 2019.
The details of the LCR, as reported to BSP, as of December 31, 2019 and 2018 follow:
2019 2018
High Quality Liquid Assets (HQLA) P=6,169,143,029 P=9,526,731,503Total Net Cash Outflows P=6,606,839,730 P=5,646,633,507
LCR 93.4% 168.7%
As of December 31, 2019 and 2018, the Company met and complied with the LCR requirements set bythe BSP
Net Stable Funding RatioOn June 6, 2018, the BSP issued Circular No. 1007, Implementing Guidelines on the adoption of theBasel III Framework on Liquidity Standards - Net Stable Funding Ratio (NSFR). The NSFR limitsoverreliance on short-term wholesale funding and promotes enhanced assessment of funding riskacross all on and off-balance sheet accounts. The NSFR complements the LCR, which promotesshort term resilience of the Company’s liquidity profile. The covered supervised financial institutionshall maintain an NSFR of at least 100% at all times. Compliance with this requirement was phased-in effectively July 1, 2018, with full implementation of the minimum NSFR on January 1, 2019. InBOD Resolution No. 1480, the Company requested from the BSP to be exempted from complyingwith the NSFR of 100% floor limit and to maintain at least 50% floor limit instead until theeffectivity of the merger. The BSP approved the Resolution on September 27, 2019.

- 38 -
*SGVFS038854*
The details of the NSFR, as reported to BSP, as of December 31, 2019 and 2018 follow:
2019 2018
Available Stable Funding P=38,529,087,577 P=40,362,769,921Required Stable Funding 57,948,412,457 38,083,312,599
NSFR 66.5% 106.0%
As of December 31, 2019 and 2018, the Company met and complied with the NSFR requirements setby the BSP.
a. Liquidity risk management and control
As part of a sound liquidity risk management process and at the same time, to adhere to its policythat is, to maintain adequate liquidity at all times, the Company has established liquidity risklimits. These limits are used to control the risk emanating from the funding activities of theCompany. These limits are recommended by the RMD, in coordination with Treasury Unit,reviewed and approved by ALCO and BOD through ROC.
These limits are reviewed periodically, at least annually, to assess its suitability andreasonableness given the current market and economic conditions.
Below are the current Liquidity Risk Limits utilized by the Company in 2019:
MCO Limit 80.0% of aggregate Wholesale Borrowing Limit(WBL) net of unutilized WBL
Current Ratio 1:1Debt-to-Equity Ratio 7.5:1Commitment Guidelines Less than or equal to 10.0% of the aggregate
available credit limits granted to its cardholderReserve Requirementsmandated by the BSP
18.0% of total deposit substitutes(liabilities)/16.0% (implemented in tranchesbeginning May 2019)/ 14.0% (effectiveDecember 2019)
Actual figures are compared with the above liquidity risk limits and any breaches areimmediately escalated or reported to the head of Treasury and CFO, as well as, to the ALCO.The Treasury Unit will explain or justify any breaches and likewise recommend correctivemeasures within a specified period.
Aside from the established limits mentioned above, the Company has adopted a ContingencyFunding Plan (CFP) for handling liquidity crisis. The CFP outlines the policies and proceduresthat shall be followed at the onset, during and after the liquidity crisis. It also providesinformation on the types of events that may trigger to activate the plan, the roles andresponsibilities of members of the crisis management team and critical business units, sources ofcontingency funds, and communication plan.
The CFP helps the Company to ensure sufficient liquidity is maintained even in times of liquiditycrisis. The CFP is reviewed and, if necessary, updated annually.
The Company has various credit line and interbank call loan (IBCL) facilities that it can access tomeet liquidity needs. Access to sources of funding is sufficiently available and debt maturingwithin 12 months may be rolled over with existing lenders. As of December 31, 2019 and 2018,

- 39 -
*SGVFS038854*
the Company has available credit and IBCL lines amounting to P=43.8 billion and P=35.2 billion,respectively.
Liquidity stress testing
The Company also employs different stress scenarios in evaluating the liquidity position as of agiven cut-off date. Stress scenarios applied involves the following stress assumptions andparameters:a. Level of pre-termination of retail promissory notes;b. Significant decrease in the payment levels of cardholders due to increase in delinquencies; andc. Decrease in the level of funding access from wholesale market.
Analysis of the resulting gaps serves as an additional tool in managing exposure in case aliquidity stress scenario should happen.
Stress testing report is also prepared monthly by RMD in addition to the MCO reports andliquidity ratios.
Below are the Stress Scenarios currently being employed by Risk Management:a. 25.0% of Retail PN holders (MD> 30 days) pre-terminates; 25.0% of WBL from other banks
not accessible. PDR increases to 12.0% at end of one year, resulting to decrease in monthlycollections
b. 50.0% of Retail PN holders (MD> 30 days) pre-terminates; 50.0% of WBL from other banksnot accessible. PDR increases to 16.0% at end of one year, resulting to decrease in monthlycollections
c. 75.0% of Retail PN holders (MD> 30 days) pre-terminates; 75.0% of WBL from other banksnot accessible. PDR increases to > 16.0% at end of one year, resulting to decrease in monthlycollections
Capital ManagementCapital management pertains to utilizing efficient processes and/or measures to ensure adequatecapital is maintained at all times.
The Company’s capital management objectives are:
· to maintain sufficient capital, at all times, to meet the minimum regulatory capital requirementsset by the BSP;
· to maintain adequate capital that will support the Company’s business growth;
· to maintain an adequate capital buffer, at all times, to cover for risk from potential stress eventsand to attain the desired internal capital adequacy ratio; and
· to ensure that the Company meets the debt to equity ratio as required in the Omnibus NotesFacility Agreement.
As a financial institution, the Company is required to meet the minimum capital adequacy ratio andmaintain adequate capital commensurate to the risk of its business and operations.
Accordingly, the Company should likewise be adequately capitalized to enable it to effectivelydischarge its functions and withstand any foreseeable problems. In addition, as one of the principalobjectives of supervision is the protection of cardholders and creditors, banking regulators monitorthe adequacy of capital of the Company to ensure that capital recognized in capital adequacymeasures is readily available for those creditors.

- 40 -
*SGVFS038854*
The BOD ensures that the above objectives are met by the Company in any given time while themanagement ensures BOD-approved capital management policies are adhered to.
Regulatory qualifying capital
Under existing BSP regulations, the determination of the Company’s compliance with regulatoryrequirements and ratios is based on the amount of the Company’s ‘unimpaired capital’ (regulatory networth) as reported to the BSP, which is determined on the basis of regulatory accounting policieswhich differ from PFRS in some respects.
In addition, the risk-based capital adequacy ratio (CAR) of the Company with quasi-bankingoperations, expressed as a percentage of qualifying capital to risk-weighted assets, should not be lessthan 10.0%. Qualifying capital and risk-weighted assets are computed based on BSP regulations.
Risk-weighted assets consist of total assets less cash on hand, amounts due from BSP, loans coveredby hold-out or assignment of deposits, loans or acceptances under letters of credit to the extentcovered by margin deposits and other non-risk items determined by the Monetary Board (MB) of theBSP. Under BSP Circular No. 360, effective July 1, 2003, the CAR is to be inclusive of a market riskcharge.
On January 15, 2013, the BSP issued Circular No. 781, Basel III Implementing Guidelines onMinimum Capital Requirements. The guidelines revised the risk-based capital adequacy frameworkand introduced other minimum capital ratios such as CET1 ratio and Tier 1 Capital ratio of 6.0% and7.5%, respectively. A capital conservation buffer of 2.5% comprised of CET1 shall also be imposed.BSP Circular No. 781 took effect on January 1, 2014. On November 29, 2018, the BSP released acircular implementing the Basel III Counter Cyclical Capital Buffer (CCyB). Current CCyB is zeropercent (0%) subject to upward adjustment as determined by the Monetary Board when systemicconditions warrant up to a maximum of 2.5%.
The CAR of the Company as reported to BSP is shown in the table below (amounts in millions,except for ratio):
2019 2018
CET1 capital P=16,809 P=12,413
Tier 1 capital P=16,809 P=12,413Tier 2 capital 1,599 1,911
Gross qualifying capital P=18,408 P=14,324
Credit risk-weighted assets P=87,343 P=74,622Operational risk-weighted assets 27,741 24,328
Total risk weighted assets P=115,084 P=98,950
CET1 ratio 14.6% 12.5%
Capital conservation buffer 8.6% –
Tier 1 ratio 14.6% 12.5%
Risk-based CAR 16.0% 14.5%
The regulatory qualifying capital of the Company consists of Tier 1 (core) and Tier 2 (supplementary)capital. Tier 1 capital comprise paid-up common stock, unappropriated retained earnings includingcurrent year profit, appropriated retained earnings less required deductions such as unsecured creditaccommodations to DOSRI. Tier 2 is composed of Fixed-Rate Unsecured Subordinated Notes(Note 14).

- 41 -
*SGVFS038854*
As of December 31, 2019 and 2018, the Company met and complied with the CAR requirements setby the BSP.
The issuance of BSP Circular No. 639 covering the Internal Capital Adequacy Assessment Process(ICAAP) in 2009 supplements the BSP’s risk-based capital adequacy framework under BSP CircularNo. 538. In compliance with this new circular, the Group has adopted and developed its ICAAPframework to ensure that appropriate level and quality of capital are maintained by the Group. Underthis framework, the assessment of risks extends beyond the Pillar 1 set of credit, market andoperational risks and onto other risks deemed material by the Group. The level and structure ofcapital are assessed and determined in light of the Group’s business environment, plans, performance,risks and budget; as well as regulatory pronouncements. The Company follows the Group’s ICAAPframework and submits the result of its assessment to the Ultimate Parent Company. The BSPrequires submission of an ICAAP document on a group-wide basis every March 31.
The Company maintains strong credit standings and capital ratios in order to support its business andmaximize stockholder value. The Company is required to maintain a maximum debt-to-equity ratio(total liabilities over equity) of 7.5 times based on the audited financial statements as required in theCompany’s Omnibus Notes Facility Agreement with various banks. Debt-to-equity ratio of theCompany as of December 31, 2019 and 2018 is computed as follows (in millions, except for ratios):
2019 2018
Total Liabilities (TL) P=74,329 P=67,976
Total Equity (TE) P=19,480 P=14,826
Debt-to-Equity Ratio (TL/TE) 3.8 4.6
The Company, as a finance company, is also subject to the capital requirement under Sections 2(b)and 6(c) of Republic Act (RA) No. 8556 (The Financing Company Act of 1998). RA No. 8556prescribes finance companies that at least forty percent (40.0%) of the voting stock of the corporationshall be owned by citizens of the Philippines and should maintain a minimum paid up capital ofP=10.0 million for financing companies located in Metro Manila.
In case the finance company has a branch, agency extension office or unit, additional paid up capitalwill be required as follows:
Location of a Branch, Agency Extension Office or UnitAdditional Capital
Requirement
Metro Manila and other 1st class cities P=1,000,000
Other classes of cities 500,000
Municipalities 250,000
As of December 31, 2019 and 2018, the Company is one hundred percent (100.0%) owned byMetrobank, a wholly owned Filipino company. For both years, the Company has a paid-up capital ofP=1.0 billion, which already covers the additional capital requirement for its extension office in CebuCity, Davao City and Pasay City. As of December 31, 2019 and 2018, the Company is in fullcompliance with the capital requirements of RA No. 8556.
Operational RiskOperational risk is the risk arising from day-to-day operational activities which may result frominadequate or failed internal processes, people and systems or from external events, including legaland reputational risks but excludes strategic risks.

- 42 -
*SGVFS038854*
The Operating Risk Head is responsible for:a. The overall management of operational risk that may pose threat to the Company’s business,
profitability, reputation, customers, and staff;b. The effective operational risk management of all business initiatives, inter and intra department
processes;c. The development of an appropriate risk management environment and structure for the Company;
andd. The effectiveness of the areas of business continuity management.
The operational risk management process consists of a staged approach involving establishing thecontext, risk identification, risk analysis, risk management and mitigation strategies and riskmonitoring and review.
Establishing the context provides the Company strategic organizational context of the local businessenvironment. This will assist in determining the appropriate resources for risk management activities,ensuring compliance with the law and enable alignment of the Company’s strategies, so the risks thatpresent the greatest risk or impact to the Company are identified and managed effectively.
Risk identification allows the Company to identify the end-to-end risks facing the business. It isimportant to understand operational risks relative to the area, process, business initiative, product,service or project being examined. Risks identified need to be analyzed in terms of likelihood andconsequence of their occurrence.
Where risks are acceptable, the Company records risk acceptance and indicates requirements fortesting and monitoring of controls. Where the outcome of the risk analysis step reveals anunacceptable risk, the Company implements risk mitigation and control strategies to eliminate orminimize the risk within acceptable limits.
Risk monitoring and review is the final stage of the risk assessment process where ongoingmonitoring, review and reporting are done to ensure changing circumstances are managed in line withrisk priorities. This includes the ongoing review of the risk management program to ensure itscontinued suitability, adequacy, and effectiveness.
Information Security RiskThe Business Information Security Office is responsible for overseeing conduct of independent riskassessment and governance of the Company’s information security program, including oversight ofinformation technology risk. This includes establishing, implementing, monitoring and improvingcontrols to ensure protection of the Company’s information assets, as well as maintaining andimproving the overall information security awareness of the organization.
The unit also oversees the overall implementation and compliance of the Company to the PaymentCard Industry Data Security Standards (PCI DSS) as mandated by the payment brands. The PCI DSScompliance program aims to pursue certification in the near future and maintain full compliancethereafter. In coordination with Internal Audit, annual compliance reviews are performed and resultsare submitted to Visa and MasterCard.

- 43 -
*SGVFS038854*
5. Fair Value Measurement
The methods of assumptions used by the Company in estimating the fair value of its financialinstruments are as follow:
Cash and Cash Equivalents (includes Cash, Due from BSP and Interbank Loans Receivable)Carrying amounts approximate fair values in view of the relatively short-term maturities of theseinstruments.
Accounts Receivable - CardholdersThe fair values of accounts receivable from straight payment transactions and short-term installmentapproximate carrying amounts, net of allowance, while the fair values of long-term installmentreceivables are estimated using the discounted cash flow methodology using current incrementallending rates for similar types of receivables.
Accounts Receivable - Others, Other Assets, Accounts Payable and Accrued Interest PayableThe carrying amounts, net of allowance, approximate their fair values due to either the demandfeature or the relatively short-term maturities of these receivables and payables. Refundable depositsare carried at cost and are not significant to the Company’s portfolio of assets.
Equity Instruments at Fair Value through Other Comprehensive IncomeThe fair value of the unquoted shares is estimated using the guideline publicly-traded companymethod, which utilizes publicly available information from publicly-traded comparable companiesthat are the same or similar to the unlisted company being valued.
Bills Payable, Notes Payable, Lease Liabilities and Subordinated DebtThe carrying value approximates fair value for borrowings with relatively short maturities. Forcertain borrowings which are long-term in nature, fair values are estimated using the discounted cashflow methodology, using current incremental lending rates for similar types of borrowings.
Derivative InstrumentsFair values are estimated based on discounted cash flow technique. The Company used variousobservable market inputs including the foreign exchange spot and forward rates, interest rate curvesand forward rate curves. As of December 31, 2019 and 2018, the fair value of derivative liabilitypositions is net of a credit valuation adjustment attributable to derivative counterparty default risk.
The following tables summarize the carrying amount and fair values of the financial assets andliabilities, analyzed based on the following hierarchy for determining and disclosing the fair value offinancial instruments by valuation technique (amounts in thousands):
2019
Carrying
Value Level 1 Level 2 Level 3
Total
Fair Value
Financial assets for which fair values
are disclosed:
Accounts receivable:
Cardholders P=81,756,188 P=– P=– P=86,142,456 P=86,142,456
Financial asset measured at fair value:
Equity instruments at FVOCI 28,158 – – 28,158 28,158
P=81,784,346 P=– P=– P=86,170,614 P=86,170,614
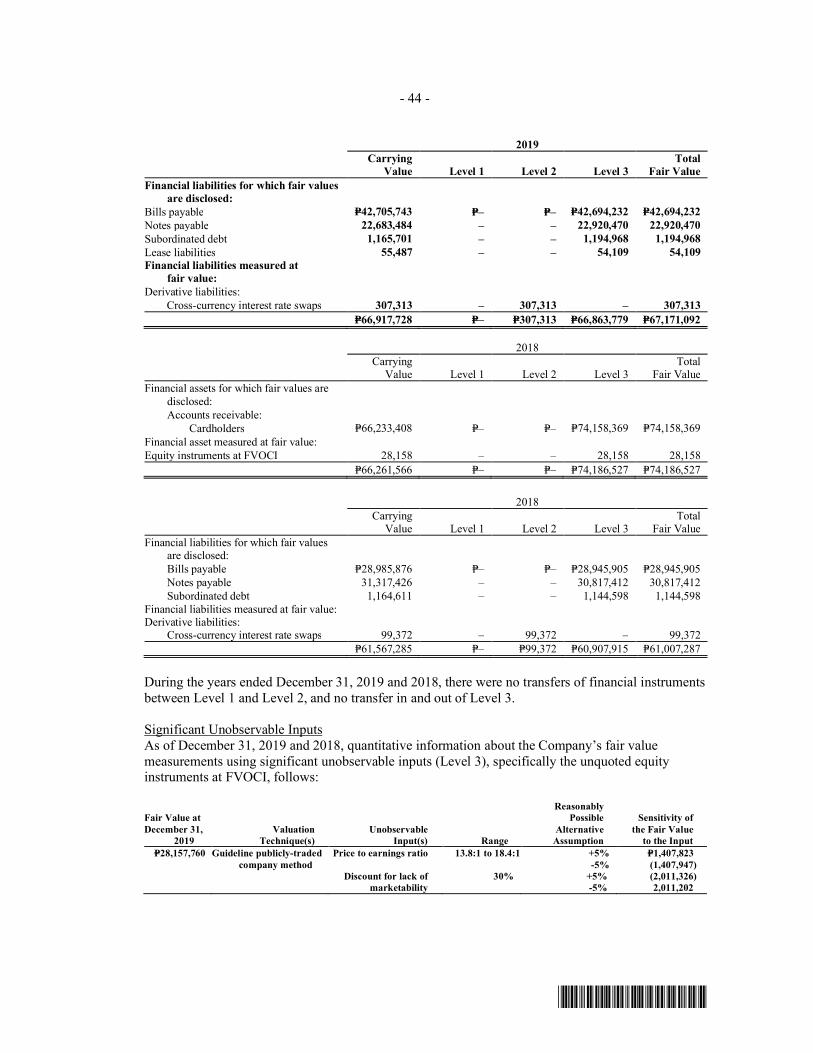
- 44 -
*SGVFS038854*
2019
Carrying
Value Level 1 Level 2 Level 3
Total
Fair Value
Financial liabilities for which fair values
are disclosed:
Bills payable P=42,705,743 P=– P=– P=42,694,232 P=42,694,232
Notes payable 22,683,484 – – 22,920,470 22,920,470
Subordinated debt 1,165,701 – – 1,194,968 1,194,968
Lease liabilities 55,487 – – 54,109 54,109
Financial liabilities measured at
fair value:
Derivative liabilities:
Cross-currency interest rate swaps 307,313 – 307,313 – 307,313
P=66,917,728 P=– P=307,313 P=66,863,779 P=67,171,092
2018
CarryingValue Level 1 Level 2 Level 3
TotalFair Value
Financial assets for which fair values aredisclosed:
Accounts receivable:
Cardholders P=66,233,408 P=– P=– P=74,158,369 P=74,158,369
Financial asset measured at fair value:
Equity instruments at FVOCI 28,158 – – 28,158 28,158
P=66,261,566 P=– P=– P=74,186,527 P=74,186,527
2018
CarryingValue Level 1 Level 2 Level 3
TotalFair Value
Financial liabilities for which fair valuesare disclosed:
Bills payable P=28,985,876 P=– P=– P=28,945,905 P=28,945,905
Notes payable 31,317,426 – – 30,817,412 30,817,412
Subordinated debt 1,164,611 – – 1,144,598 1,144,598Financial liabilities measured at fair value:Derivative liabilities:
Cross-currency interest rate swaps 99,372 – 99,372 – 99,372
P=61,567,285 P=– P=99,372 P=60,907,915 P=61,007,287
During the years ended December 31, 2019 and 2018, there were no transfers of financial instrumentsbetween Level 1 and Level 2, and no transfer in and out of Level 3.
Significant Unobservable InputsAs of December 31, 2019 and 2018, quantitative information about the Company’s fair valuemeasurements using significant unobservable inputs (Level 3), specifically the unquoted equityinstruments at FVOCI, follows:
Fair Value at
December 31,
2019
Valuation
Technique(s)
Unobservable
Input(s) Range
Reasonably
Possible
Alternative
Assumption
Sensitivity of
the Fair Value
to the Input
P=28,157,760 Guideline publicly-traded
company method
Price to earnings ratio 13.8:1 to 18.4:1 +5%
-5%
P=1,407,823
(1,407,947)
Discount for lack of
marketability
30% +5%
-5%
(2,011,326)
2,011,202

- 45 -
*SGVFS038854*
Fair Value at
December 31,2018
ValuationTechnique(s)
UnobservableInput(s) Range
Reasonably Possible
AlternativeAssumption
Sensitivity of
the Fair Valueto the Input
P=28,157,760 Guideline publicly-tradedcompany method
Price to earnings ratio 13.8:1 to 18.4:1 +5%-5%
P=1,407,823(1,407,947)
Discount for lack of
marketability
30% +5%
-5%
(2,011,326)
2,011,202
The Company estimates the fair value of the unquoted equity instruments using the ‘benchmarkmultiples’ of comparable publicly-traded companies. The identification of comparable companiesconsiders the similarities between the subject company being valued and the guideline companies interms of industry, market, product line or service type, growth, etc. The Company also determines anappropriate discount adjustment for the lack of marketability of these unquoted equity shares basedon empirical evidence gathered from available public market research.
The use of reasonably possible alternative assumptions in the significant unobservable inputs willaffect the fair value of the unquoted equity instruments and the OCI (before tax) as presented above.
6. Cash and Cash Equivalents
This account consists of:
2019 2018
Cash on hand P=12,500 P=12,500Cash in banks (Note 21) 743,553,859 1,082,259,131
743,566,359 1,082,271,631Due from BSP (Note 12) 5,994,131,053 9,526,731,502Interbank loans receivable 174,919,590 2,200,000,000
6,912,617,002 12,809,003,133Allowance for credit losses – (146,174)
P=6,912,617,002 P=12,808,856,959
Cash in banks include time deposit accounts, current and savings deposit accounts and foreigncurrency deposits with various counterparties and related parties (Note 21). In 2019 and 2018, timedeposit, savings account and foreign currency deposits bear annual interest rates of 0.3% to 1.5%.
Due from BSP is a noninterest-bearing demand deposit account. In compliance with existing BSPregulations, the Company maintains a required statutory reserve for its debt obligations considered asdeposit substitutes. As of December 31, 2019 and 2018, the total statutory reserves, as reported to theBSP, amounted to P=6.0 billion and P=9.5 billion, respectively (Note 12).
In 2019 and 2018, interbank loans receivable have terms of 1 to 6 days and 1 to 5 days, respectively.In 2019 and 2018, interbank loans receivable bears annual interest rates of 3.5% to 4.0% and 2.5% to5.0%, respectively.
The allowance for credit losses recognized under ‘Cash and cash equivalents’ pertain only to ‘Cash inbanks’. No allowance for credit losses were recognized for ‘Due from BSP’ and ‘Interbank loansreceivable’ as of December 31, 2019 and 2018.

- 46 -
*SGVFS038854*
As of December 31, 2019 and 2018, an analysis of changes in the gross carrying amount and thecorresponding allowance for credit losses for cash in bank is as follows:
2019 2018
Gross carrying amount
Balance at beginning of year P=1,082,259,131 P=1,809,018,949Movements in receivable balance
(excluding write-offs) (338,705,272) (726,759,818)
Balances at end of year P=743,553,859 P=1,082,259,131
Allowance for credit losses
Balance at beginning of year P=146,174 P=–Provision (reversal) during the year (146,174) 146,174
Balance at end of year P=– P=146,174
There were no transfers to stages 2 and 3 in 2019 and 2018.
Interest income earned on cash and other cash items, included under ‘Interest income from banks’ inthe statements of income follow:
2019 2018
Short-term deposits P=8,065,906 P=14,134,658Interbank loans receivable 1,439,603 3,433,758Deposits with banks 112,767 102,081
P=9,618,276 P=17,670,497
7. Accounts Receivable
This account consists of receivables from:
2019 2018
Cardholders P=92,456,831,723 P=74,665,323,027Others (Note 21) 1,249,233,797 392,222,447
93,706,065,520 75,057,545,474Deferred acquisition cost 244,683,383 167,896,986Unearned interest and other deferred income (6,119,735,171) (4,330,117,097)
87,831,013,732 70,895,325,363Allowance for credit losses (4,608,794,900) (4,101,798,235)
P=83,222,218,832 P=66,793,527,128
Total accounts receivable as shown in the statements of financial position follow:
2019 2018
Current portion P=72,058,281,654 P=58,455,080,198Noncurrent portion 11,163,937,178 8,338,446,930
P=83,222,218,832 P=66,793,527,128
As of December 31, 2019 and 2018, the Company has outstanding installment credit card receivablesand unearned interest income amounting to P=47.3 billion and P=37.0 billion, and P=6.1 billion andP=4.3 billion, respectively.

- 47 -
*SGVFS038854*
The Company recognized interest income from regular and installment credit card receivablesamounting to P=9.1 billion and P=6.3 billion in 2019, respectively, and P=8.7 billion and P=5.0 billion in2018, respectively.
Credit card receivables include past due accounts amounting to P=3.8 billion and P=3.5 billion as ofDecember 31, 2019 and 2018, respectively.
Deferred acquisition cost represents capitalized commissions paid to third-party brokers forsuccessfully originated credit card accounts. These are amortized over two (2) years, which is theaverage relationship life with customers, on a straight-line basis. Deferred acquisition costs as atDecember 31 are as follows:
2019 2018
Balances at beginning of the year P=167,896,986 P=116,466,325Acquisition during the year 285,557,412 186,921,270Amortization during the year (208,771,015) (135,490,609)
Balances at end of year P=244,683,383 P=167,896,986
Others include accrued interest receivables, advances to officers and employees and receivables fromthe Ultimate Parent Company (Note 21).
BSP Reporting
The BSP considers that loan concentration of credit risk exists when the total loan exposure to aparticular industry or economic sector exceeds 30.0% of total loan portfolio. As of December 31, 2019and 2018, 100.0% of the Company’s accounts receivable are classified under personal activities.
As of December 31, 2019 and 2018, nonperforming loans (NPLs) not fully covered by allowance forcredit losses follow:
2019 2018
Total NPLs P=1,509,286,164 P=1,186,074,196Less: NPLs fully covered by allowance for credit
losses 161,731 161,731
P=1,509,124,433 P=1,185,912,465
NPLs are classified as impaired and refer to loans or receivables whose principal and/or interest isunpaid for 90 days or more after due date.

- 48 -
*SGVFS038854*
Allowance for Credit LossesAs of December 31, 2019 and 2018, an analysis of changes in the gross carrying amount and thecorresponding allowance for credit losses for the following exposures is as follows:
2019
Receivables from Cardholders
Stage 1 Stage 2 Stage 3 Total
Gross carrying amount
Balance at beginning of year P=65,628,044,777 P=5,519,320,489 P=3,517,957,761 P=74,665,323,027
New exposures 2,092,148,528 – – 2,092,148,528
Transfers to Stage 1 4,221,988,407 (4,216,800,877) (5,187,530) –
Transfers to Stage 2 (10,693,415,912) 10,734,536,701 (41,120,789) –
Transfers to Stage 3 (838,308,076) (5,871,705,619) 6,710,013,695 –
Movements in receivables balance
(excluding write-offs) 21,486,165,050 232,382,549 (1,261,286,536) 20,457,261,063
Accounts written-off – – (4,757,900,895) (4,757,900,895)
Balance at end of year P=81,896,622,774 P=6,397,733,243 P=4,162,475,706 P=92,456,831,723
Allowance for ECL
Balance at beginning of year P=916,896,431 P=1,841,462,415 P=1,327,724,238 P=4,086,083,084
New exposures 58,824,037 – – 58,824,037
Transfers to Stage 1 1,385,685,222 (1,383,040,160) (2,645,062) –
Transfers to Stage 2 (568,757,397) 589,439,399 (20,682,002) –
Transfers to Stage 3 (69,304,282) (1,994,628,556) 2,063,932,838 –
Movements in receivables balance
(excluding write-offs) (10,107,020) (93,314,242) (107,328,478) (210,749,740)
Accounts written-off – – (4,757,900,895) (4,757,900,895)
Impact on year-end ECL of exposures
transferred during the year (320,815,341) 2,722,636,973 3,002,830,280 5,404,651,912
Balance at end of year P=1,392,421,650 P=1,682,555,829 P=1,505,930,919 P=4,580,908,398
2018
Receivables from Cardholders
Stage 1 Stage 2 Stage 3 Total
Gross carrying amountBalance at beginning of year P=56,276,961,989 P=5,146,054,773 P=2,685,984,514 P=64,109,001,276New exposures 1,556,803,763 – – 1,556,803,763Transfers to Stage 1 4,110,364,625 (4,098,235,789) (12,128,836) –Transfers to Stage 2 (9,324,540,651) 9,392,140,427 (67,599,776) –Transfers to Stage 3 (667,511,909) (5,001,340,980) 5,668,852,889 –Movements in receivables balance
(excluding write-offs) 13,675,966,960 80,702,058 (777,586,377) 12,979,082,641Accounts written-off – – (3,979,564,653) (3,979,564,653)
Balance at end of year P=65,628,044,777 P=5,519,320,489 P=3,517,957,761 P=74,665,323,027
Allowance for ECLBalance at beginning of year P=835,255,803 P=1,738,824,428 P=1,058,771,919 P=3,632,852,150New exposures 22,474,365 – – 22,474,365Transfers to Stage 1 1,407,883,725 (1,401,208,164) (6,675,561) –Transfers to Stage 2 (498,398,744) 532,674,021 (34,275,277) –Transfers to Stage 3 (47,874,780) (1,673,201,194) 1,721,075,974 –Movements in receivables balance
(excluding write-offs) 388,939,557 43,331,258 (90,065,151) 342,205,664Accounts written-off – – (3,979,564,653) (3,979,564,653)Impact on year-end ECL of exposures
transferred during the year (1,191,383,495) 2,601,042,066 2,658,456,987 4,068,115,558
Balance at end of year P=916,896,431 P=1,841,462,415 P=1,327,724,238 P=4,086,083,084

- 49 -
*SGVFS038854*
2019
Other Receivables
Stage 1 Stage 2 Stage 3 Total
Gross carrying amount
Balance at beginning of year P=181,740,486 P=– P=210,481,961 P=392,222,447New exposures 1,302,969,188 – – 1,302,969,188Transfers to Stage 3 (25,719,035) – 25,719,035 –Amounts written off – – (28,602,921) (28,602,921)Movements in receivables balance
(excluding write-offs) (236,705,151) – (180,649,766) (417,354,917)
Balance at end of year P=1,222,285,488 P=– P=26,948,309 P=1,249,233,797
Allowance for ECL
Balance at beginning of year P=– P=– P=15,715,151 P=15,715,151Movements in receivables balance
(excluding write-offs) – – 15,055,237 15,055,237Impact on year-end ECL of exposures
transferred during the year – – 25,719,035 25,719,035Amounts written off – – (28,602,921) (28,602,921)
Balance at end of year P=– P=– P=27,886,502 P=27,886,502
2018
Other Receivables
Stage 1 Stage 2 Stage 3 Total
Gross carrying amountBalance at beginning of year P=976,369,804 P=– P=– P=976,369,804New exposures 596,948 – – 596,948Transfers to Stage 3 (596,948) – 596,948 –Amounts written off – – (29,985,270) (29,985,270)Movements in receivables balance
(excluding write-offs) (794,629,318) – 239,870,283 (554,759,035)
Balance at end of year P=181,740,486 P=– P=210,481,961 P=392,222,447
Allowance for ECLBalance at beginning of year P=– P=– P=14,380,256 P=14,380,256Movements in receivables balance
(excluding write-offs) – – 30,723,217 30,723,217Impact on year-end ECL of exposures
transferred during the year – – 596,948 596,948Amounts written off – – (29,985,270) (29,985,270)
Balance at end of year P=– P=– P=15,715,151 P=15,715,151
For the year ended December 31, 2019 and 2018, the Company recognized provision for credit losseson accounts receivables from cardholders and other receivables amounting to P=5.1 billion andP=40.8 million, and P=4.4 billion and P=31.5 million, respectively.
At the current level of allowance for credit losses, management believes that the Company hassufficient allowance to cover any losses that may be incurred from the non-collection or non-realization of its accounts receivable.
Section 9(f) of RA No. 8556 requires that a 100.0% allowance for credit losses should be set up forthe following:
a. Clean loans and advances past due for a period of more than six months;b. Past due loans secured by collateral such as inventories, receivables, equipment and other chattels
that have declined in value by more than 50.0%, without the borrower offering additionalcollateral for the loans;
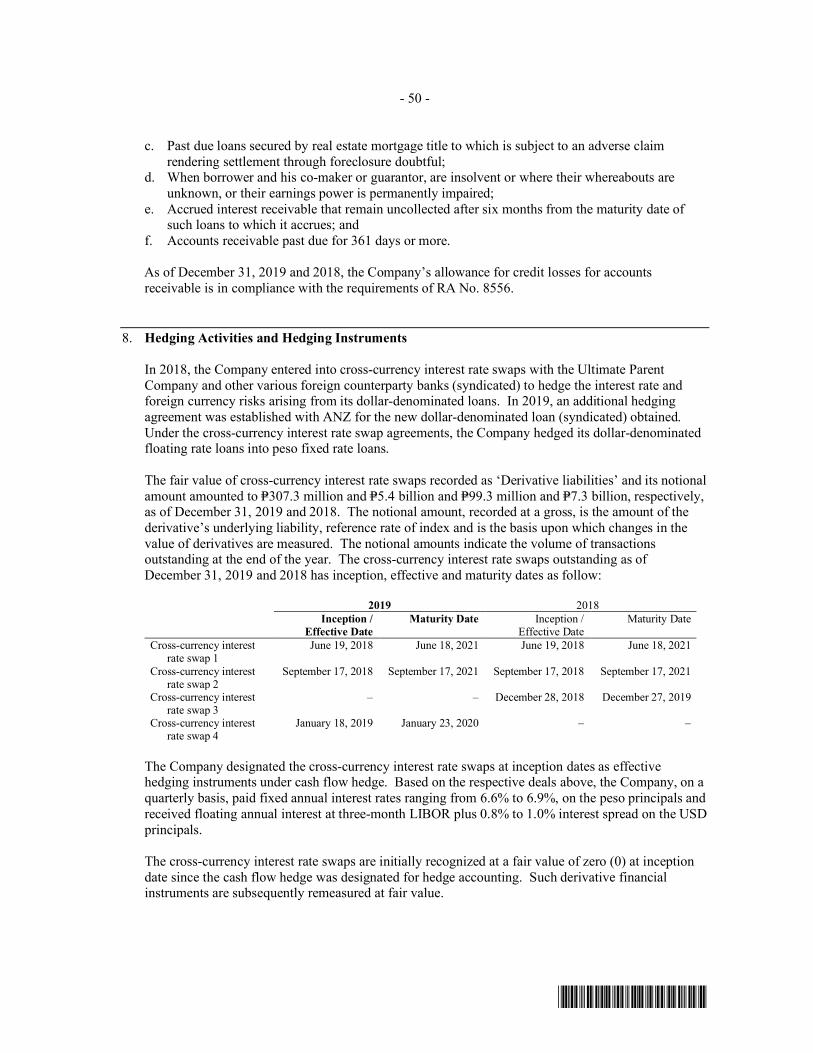
- 50 -
*SGVFS038854*
c. Past due loans secured by real estate mortgage title to which is subject to an adverse claimrendering settlement through foreclosure doubtful;
d. When borrower and his co-maker or guarantor, are insolvent or where their whereabouts areunknown, or their earnings power is permanently impaired;
e. Accrued interest receivable that remain uncollected after six months from the maturity date ofsuch loans to which it accrues; and
f. Accounts receivable past due for 361 days or more.
As of December 31, 2019 and 2018, the Company’s allowance for credit losses for accountsreceivable is in compliance with the requirements of RA No. 8556.
8. Hedging Activities and Hedging Instruments
In 2018, the Company entered into cross-currency interest rate swaps with the Ultimate ParentCompany and other various foreign counterparty banks (syndicated) to hedge the interest rate andforeign currency risks arising from its dollar-denominated loans. In 2019, an additional hedgingagreement was established with ANZ for the new dollar-denominated loan (syndicated) obtained.Under the cross-currency interest rate swap agreements, the Company hedged its dollar-denominatedfloating rate loans into peso fixed rate loans.
The fair value of cross-currency interest rate swaps recorded as ‘Derivative liabilities’ and its notionalamount amounted to P=307.3 million and P=5.4 billion and P=99.3 million and P=7.3 billion, respectively,as of December 31, 2019 and 2018. The notional amount, recorded at a gross, is the amount of thederivative’s underlying liability, reference rate of index and is the basis upon which changes in thevalue of derivatives are measured. The notional amounts indicate the volume of transactionsoutstanding at the end of the year. The cross-currency interest rate swaps outstanding as ofDecember 31, 2019 and 2018 has inception, effective and maturity dates as follow:
2019 2018
Inception /
Effective Date
Maturity Date Inception /Effective Date
Maturity Date
Cross-currency interestrate swap 1
June 19, 2018 June 18, 2021 June 19, 2018 June 18, 2021
Cross-currency interestrate swap 2
September 17, 2018 September 17, 2021 September 17, 2018 September 17, 2021
Cross-currency interestrate swap 3
– – December 28, 2018 December 27, 2019
Cross-currency interestrate swap 4
January 18, 2019 January 23, 2020 – –
The Company designated the cross-currency interest rate swaps at inception dates as effectivehedging instruments under cash flow hedge. Based on the respective deals above, the Company, on aquarterly basis, paid fixed annual interest rates ranging from 6.6% to 6.9%, on the peso principals andreceived floating annual interest at three-month LIBOR plus 0.8% to 1.0% interest spread on the USDprincipals.
The cross-currency interest rate swaps are initially recognized at a fair value of zero (0) at inceptiondate since the cash flow hedge was designated for hedge accounting. Such derivative financialinstruments are subsequently remeasured at fair value.

- 51 -
*SGVFS038854*
The credit risk standing of the Company and the counterparty-banks are both good, and at reportingdate, there are no known or significant events or circumstances that would adversely affect the creditrisk standings of both counter parties. The terms of the hypothetical derivative match the criticalterms of the hedged item.The Company identified the possible sources of ineffectiveness:
· the timing of the interest payments wherein actual interest payments for the underlying loan andthe swap does not match; and
· the maturity date of the underlying loan does not coincide with the maturity date of the cross-currency interest rate swaps or non-renewal of the cross-currency interest rate swaps.
The Company does neither foresee nor intend to change the timing of the interest payments. Also,non-renewal of cross-currency interest rate swaps shall only transpire if and only if the marketconditions on renewal date becomes favorable to the Company. There were no other sources ofineffectiveness in these hedge relationships as of December 31, 2019 and 2018.
An economic relationship exists between the hedged items and hedging instrument as the criticalterms of the loan and the derivative match.
Hedge effectiveness is assessed at inception of the hedge, at each reporting date, and upon asignificant change in the circumstances affecting the hedge effectiveness. At reporting date, hedgeratio is calculated for the hedging instrument. As of the inception and reporting date, the hedge ratiois 1:1 or 100.0%.
As of December 31, 2019 and 2018, the Company has the following instruments with maturities of1 to 5 years to hedge exposures to changes in interest rates and foreign exchange currency rates:
Cross-currency interest rate swaps 2019 2018
Nominal amount P=5,396,900,000 P=7,316,000,000Average foreign exchange rate 50.6 53.0Average fixed interest rate 6.8% 6.9%
The Company has pre-terminated its CCS (cross-currency interest rate swap 3) with ANZ lastDecember 27, 2019, with the following details:
USD PHP
Calculation period September 30 to December 27, 2019 (88 days)Fixed rate – 7.2%Floating rate 2.1% –Spread 1.0% –Notional amount 100,000,000 5,316,000,000Interest payment amount 758,848 92,911,867Net amount 100,758,848 5,408,911,867
The amounts relating to items designated as hedging instruments and hedge ineffectiveness in as ofand for the year ending December 31, 2019 and 2018 were as follows:
2019
Cross-currency interest
rate swaps
NominalAmount
CarryingAmount
Changesin Fair Values
Changes in the
Value of theHedging
Instrument
Recognizedin OCI
HedgeIneffectiveness
Recognized
in Statementof Income
Amount
Reclassifiedfrom the ‘Cash
flow reserve’
to Statementof Income
December 31, 2019 P=5,396,900,000 (P=307,312,884) (P=497,165,681) (P=87,752,672) P=– P=409,413,009

- 52 -
*SGVFS038854*
2018
Cross-currency interestrate swaps
NominalAmount
CarryingAmount
Changesin Fair Values
Changes in theValue of the
Hedging
InstrumentRecognized
in OCI
HedgeIneffectiveness
Recognizedin Statement
of Income
AmountReclassified
from the ‘Cash
flow reserve’to Statement
of Income
December 31, 2018 P=7,316,000,000 (P=99,372,282) (P=99,372,282) (P=2,996,372) P=– P=96,375,910
The Company’s financial instruments designated as hedged items in cash flow hedge relationshipsfollow:
2019 2018
Change in
Value used for
Calculating Hedge
Ineffectiveness
Cash Flow
Hedge Reserve
Change inValue used for
Calculating HedgeIneffectiveness
Cash FlowHedge Reserve
Floating rate dollar-denominated notes (P=409,413,009) (P=90,749,044) (P=96,375,910) (P=2,996,372)
The hedged items are recorded under ‘Notes payable’ (Note 12).

- 53 -
*SGVFS038854*
9.
Pro
per
ty a
nd
Eq
uip
men
t
The
com
ponen
ts o
f an
d m
ovem
ents
in t
his
acc
ount
are
as f
oll
ow
s:
20
19
La
nd
Bu
ild
ing
Bu
ild
ing
Im
pro
vem
ents
Fu
rnit
ure
,
Fix
ture
s a
nd
Eq
uip
men
t
Tra
nsp
ort
ati
on
Eq
uip
men
t
Lea
seh
old
Imp
rov
emen
tsT
ota
l
Co
st
Bal
ance
s at
beg
inn
ing
of
yea
rP=
28
3,4
10
,97
4P=
22
2,7
45
,92
5P=
13
8,2
51
,03
9P=
42
4,5
06
,61
2P=
24
2,5
90
,25
6P=
75
,04
5,0
88
P=1
,38
6,5
49
,89
4
Acq
uis
itio
ns
––
40
,05
4,0
83
78
,62
5,7
81
12
2,9
93
,64
02
77
,37
42
41
,95
0,8
78
Dis
po
sals
––
(12
,16
7,8
95
)(2
44
,49
4,9
12
)(5
4,3
80
,24
5)
(81
9,1
01
)(3
11
,86
2,1
53
)
Bal
ance
s at
en
d o
f y
ear
28
3,4
10
,97
42
22
,74
5,9
25
16
6,1
37
,22
72
58
,63
7,4
81
31
1,2
03
,65
17
4,5
03
,36
11
,31
6,6
38
,61
9
Accu
mu
late
d d
epre
cia
tio
n a
nd
am
ort
iza
tio
n
Bal
ance
s at
beg
inn
ing
of
yea
r–
81
,00
4,5
78
12
3,0
30
,03
53
32
,28
7,9
46
13
1,6
65
,47
87
3,2
26
,84
67
41
,21
4,8
83
Dep
recia
tio
n a
nd
am
ort
izat
ion
–7
,42
4,8
64
6,0
88
,18
13
3,4
35
,45
34
8,3
66
,68
58
50
,92
89
6,1
66
,11
1
Dis
po
sals
––
(11
,48
7,8
48
)(1
76
,92
0,2
78
)(4
4,9
12
,72
8)
(62
3,6
17
)(2
33
,94
4,4
71
)
Bal
ance
s at
en
d o
f y
ear
−8
8,4
29
,44
21
17
,63
0,3
68
18
8,8
03
,12
11
35
,11
9,4
35
73
,45
4,1
57
60
3,4
36
,52
3
Net
bo
ok
va
lue
at
end
of
yea
rP=
28
3,4
10
,97
4P=
13
4,3
16
,48
3P=
48
,50
6,8
59
P=6
9,8
34
,36
0P=
17
6,0
84
,21
6P=
1,0
49
,20
4P=
71
3,2
02
,09
6
20
18
Lan
dB
uil
din
gB
uil
din
g I
mp
rov
emen
ts
Fu
rnit
ure
, F
ixtu
res
and
Eq
uip
men
tT
ran
spo
rtat
ion
Eq
uip
men
tL
ease
ho
ldIm
pro
vem
ents
To
tal
Co
stB
alan
ces
at b
egin
nin
g o
fy
ear
P=2
83
,41
0,9
74
P=2
22
,74
5,9
25
P=1
30
,47
2,8
76
P=4
25
,66
1,2
47
P=2
13
,09
1,0
77
P=7
5,2
95
,60
9P=
1,3
50
,67
7,7
08
Acq
uis
itio
ns
––
7,7
78
,16
32
7,9
26
,23
45
8,1
30
,61
63
24
,64
69
4,1
59
,65
9
Dis
po
sals
––
–(2
9,0
80
,86
9)
(28
,63
1,4
37
)(5
75
,16
7)
(58
,28
7,4
73
)
Bal
ance
s at
en
d o
f y
ear
28
3,4
10
,97
42
22
,74
5,9
25
13
8,2
51
,03
94
24
,50
6,6
12
24
2,5
90
,25
67
5,0
45
,08
81
,38
6,5
49
,89
4
Acc
um
ula
ted
dep
reci
atio
n a
nd
am
ort
izat
ion
Bal
ance
s at
beg
inn
ing
of
yea
r–
73
,57
9,7
14
11
6,0
70
,24
53
17
,70
3,7
14
11
1,3
89
,22
77
3,0
47
,45
96
91
,79
0,3
59
Dep
recia
tio
n a
nd
am
ort
izat
ion
–7
,42
4,8
64
6,9
59
,79
04
3,6
56
,68
84
2,3
25
,05
77
54
,55
41
01
,12
0,9
53
Dis
po
sals
––
–(2
9,0
72
,45
6)
(22
,04
8,8
06
)(5
75
,16
7)
(51
,69
6,4
29
)
Bal
ance
s at
en
d o
f y
ear
−8
1,0
04
,57
81
23
,03
0,0
35
33
2,2
87
,94
61
31
,66
5,4
78
73
,22
6,8
46
74
1,2
14
,88
3
Net
bo
ok
val
ue
at e
nd
of
yea
rP=
28
3,4
10
,97
4P=
14
1,7
41
,34
7P=
15
,22
1,0
04
P=9
2,2
18
,66
6P=
11
0,9
24
,77
8P=
1,8
18
,24
2P=
64
5,3
35
,01
1
As
of
Dec
ember
31, 2019 a
nd 2
018, th
e C
om
pan
y h
as f
ull
y d
epre
ciat
ed p
roper
ty a
nd e
quip
men
t th
at a
re s
till
in u
se w
ith o
rigin
al c
ost
am
ounti
ng t
oP=
380.5
mil
lion a
nd P=
463.5
mil
lion,
resp
ecti
vel
y. G
ain o
n s
ale
of
pro
per
ty a
nd e
quip
men
t am
ounte
d t
o P=
2.7
mil
lion a
nd P=
1.8
mil
lion i
n 2
019 a
nd 2
018,
resp
ecti
vel
y (
Note
17).

- 54 -
*SGVFS038854*
10. Intangibles, Equity Instrument at FVOCI and Other Assets
This account consists of:
2019 2018
Intangible assets P=475,749,793 P=435,241,375Refundable deposits 14,886,215 14,307,109Miscellaneous 11,168,213 11,168,212
P=501,804,221 P=460,716,696
The composition of and movements of intangible assets are as follows:
2019
Capitalized
Software and
License Fees
Project in
Progress Total
Cost
Balances at beginning of year P=995,869,111 P=54,948,222 P=1,050,817,333
Acquisitions 138,410,112 109,593,132 248,003,244
Reclassifications 159,815,751 (159,815,751) –
Write-offs (3,137,344) – (3,137,344)
Balance at end of year 1,290,957,630 4,725,603 1,295,683,233
Accumulated amortization
Balances at beginning of year 615,575,958 – 615,575,958
Amortization 206,280,154 – 206,280,154
Write-offs (1,922,672) – (1,922,672)
Balances at end of year 819,933,440 – 819,933,440
Net book value at end of year P=471,024,190 P=4,725,603 P=475,749,793
2018
Capitalized Software andLicense Fees
Project inProgress Total
CostBalances at beginning of year P=921,887,305 P=103,677,992 P=1,025,565,297Acquisitions 134,999,425 12,968,724 147,968,149Reclassifications 61,698,494 (61,698,494) –Write-offs (122,716,113) – (122,716,113)
Balance at end of year 995,869,111 54,948,222 1,050,817,333
Accumulated AmortizationBalances at beginning of year 490,175,011 – 490,175,011Amortization 181,508,945 – 181,508,945Write-offs (56,107,998) – (56,107,998)
Balances at end of year 615,575,958 – 615,575,958
Net book value at end of year P=380,293,153 P=54,948,222 P=435,241,375
Capitalized Software and License FeesCapitalized software includes costs related to software purchased by the Company for use inoperations. License fees represent the amount paid for the privilege to use software modules andmanuals.
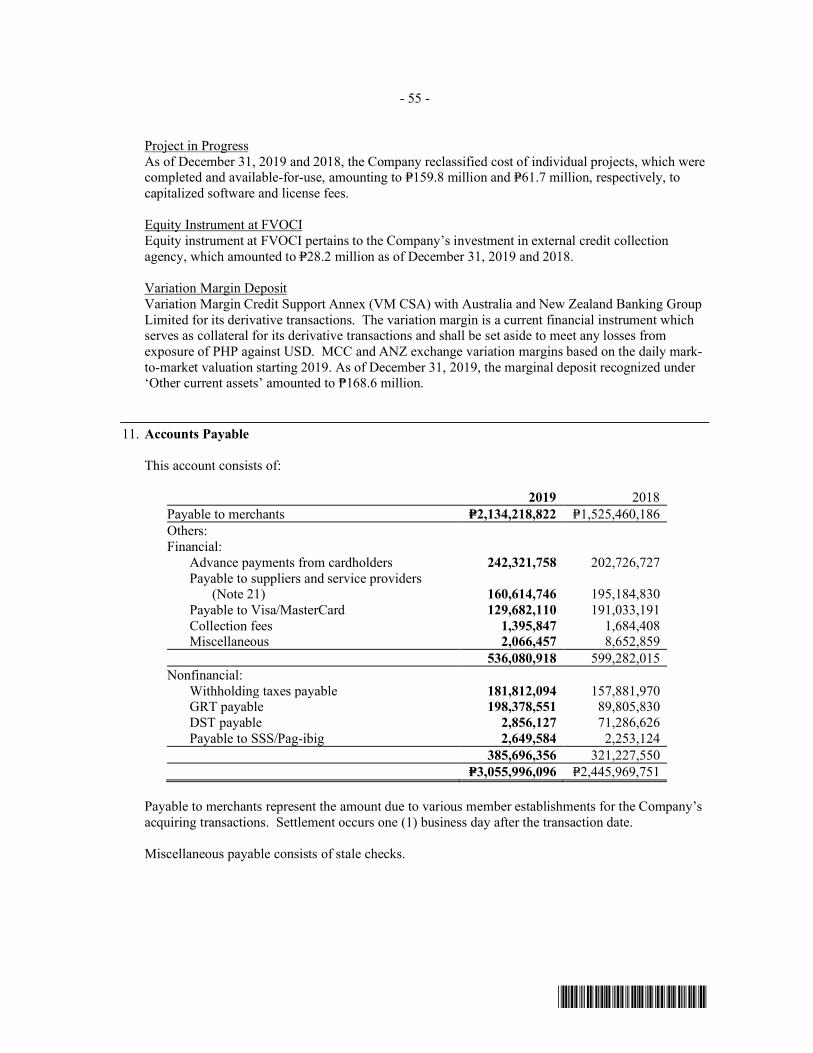
- 55 -
*SGVFS038854*
Project in ProgressAs of December 31, 2019 and 2018, the Company reclassified cost of individual projects, which werecompleted and available-for-use, amounting to P=159.8 million and P=61.7 million, respectively, tocapitalized software and license fees.
Equity Instrument at FVOCIEquity instrument at FVOCI pertains to the Company’s investment in external credit collectionagency, which amounted to P=28.2 million as of December 31, 2019 and 2018.
Variation Margin DepositVariation Margin Credit Support Annex (VM CSA) with Australia and New Zealand Banking GroupLimited for its derivative transactions. The variation margin is a current financial instrument whichserves as collateral for its derivative transactions and shall be set aside to meet any losses fromexposure of PHP against USD. MCC and ANZ exchange variation margins based on the daily mark-to-market valuation starting 2019. As of December 31, 2019, the marginal deposit recognized under‘Other current assets’ amounted to ₱168.6 million.
11. Accounts Payable
This account consists of:
2019 2018
Payable to merchants P=2,134,218,822 P=1,525,460,186
Others:Financial:
Advance payments from cardholders 242,321,758 202,726,727 Payable to suppliers and service providers
(Note 21) 160,614,746 195,184,830Payable to Visa/MasterCard 129,682,110 191,033,191Collection fees 1,395,847 1,684,408Miscellaneous 2,066,457 8,652,859
536,080,918 599,282,015
Nonfinancial:Withholding taxes payable 181,812,094 157,881,970GRT payable 198,378,551 89,805,830DST payable 2,856,127 71,286,626Payable to SSS/Pag-ibig 2,649,584 2,253,124
385,696,356 321,227,550
P=3,055,996,096 P=2,445,969,751
Payable to merchants represent the amount due to various member establishments for the Company’sacquiring transactions. Settlement occurs one (1) business day after the transaction date.
Miscellaneous payable consists of stale checks.

- 56 -
*SGVFS038854*
12. Bills and Notes Payable
Bills PayableBills payable consists of deposit substitutes amounting to P=42.7 billion and P=29.0 billion as ofDecember 31, 2019 and 2018, respectively.
The total bills payable as shown in the statements of financial position follow:
2019 2018
Current portion of promissory notes issued to:Consumers P=25,191,320,174 P=14,169,804,813Corporates 15,603,134,216 6,776,021,938
40,794,454,390 20,945,826,751Interbank loans payable – 52,583,451
40,794,454,390 20,998,410,202
Noncurrent portion of promissory notes issued to:Consumers 1,683,967,055 3,942,279,863Corporates 227,321,579 4,045,185,598
1,911,288,634 7,987,465,461
P=42,705,743,024 P=28,985,875,663
As of December 31, 2019 and 2018, deposit substitutes have maturities of 3 days to 3 years, and2 days to 7 years, respectively. Deposit substitutes bear annual interest rates ranging from 0.9% to6.5% and 0.9% to 7.0% in 2019 and 2018, respectively.
Under the existing BSP regulations, the Company’s deposit substitutes are subject to statutoryreserves of 14.0% in 2019 and 18.0% 2018, respectively. The total statutory reserves maintained bythe Company, as reported to the BSP, are disclosed in Note 6.
Interbank loans payable bear annual interest rates ranging from 2.5% to 5.3% and 0.9% to 7.0% in2019 and 2018, respectively.
As of December 31, 2019 and 2018, the unamortized issuance costs on bills payable amounted toP=47.0 million and P=70.6 million, respectively.
Amortization of issuance costs amounting to P=23.6 million and P=57.6 million in 2019 and 2018,respectively, were charged to ‘Interest expense’ in the statements of income.
Notes Payable
This account consists of:
Maturities Interest Rates 2019 2018
Current interest-bearing notes (net ofunamortized issuance costs):
Peso-denominated notes:
Omnibus notes from local banks:P=12.9 billion loan facility 2020 4.0% to 5.5% P=12,891,080,136 P=–P=16.9 billion loan facility 2019 3.9% to 5.8% – 16,870,278,329P=1.4 billion loan facility 2019 5.3% to 5.3% – 1,432,618,316P=1.9 billion loan facility 2019 6.3% – 1,879,270,382
(Forward)

- 57 -
*SGVFS038854*
Maturities Interest Rates 2019 2018Loans from local banks:5Y bilateral loans 2020 4.8% P=499,682,713 P=–5Y bilateral loans 2020 4.8% 599,144,031 –5Y bilateral loans 2020 5.0% 997,749,179 –Dollar-denominated notes:
Loans from ANZ:US$13.6 million credit facility agreement 2020 3.0% 688,471,790 –US$5.0 million credit facility agreement 2019 3.3% – 184,030,000Loans from MUFG:US$4.4 million short-term loan 2020 2.5% 222,738,854 –US$2.2 million short-term loan 2019 3.3% – 115,676,000
15,898,866,703 20,481,873,027
Noncurrent interest-bearing notes (net ofunamortized issuance costs):
Peso-denominated notes:
Loans from local banks:5Y bilateral loans 2020 4.8% – 500,000,0005Y bilateral loans 2021 4.8% 698,982,202 1,300,000,0005Y bilateral loans 2021 5.5% 947,290,411 960,000,0007Y bilateral loans 2022 5.0% – 1,000,000,000Dollar-denominated notes:
Loans from MBTC:US$37.3.0 million credit facility agreement 2021 6.6% to 6.9% 1,881,108,219 1,948,661,826Syndicated loans from ANZ:US$65.0 million credit facility agreement 2021 3.8% 3,257,236,756 –US$100.0 million credit facility agreement 2021 7.2% – 5,126,891,214
6,784,617,588 10,835,553,040
P=22,683,484,291 P=31,317,426,067
Unamortized issuance costs amounted to P=58.3 million and P=182.9 million as of December 31, 2019and 2018, respectively. In 2019 and 2018, amortization of issuance costs amounting toP=124.6 million and P=165.3 million, respectively, were charged to ‘Interest expense’ in the statementsof income.
Following are the significant terms and conditions of the Company’s peso- and dollar-denominatednotes payable:
Bilateral loans
Interests are due upon maturity and monthly for short-term notes and quarterly to semi-annually forlong-term notes, respectively. The principal is due upon maturity of the notes. All loans areunsecured and subject to the following standard default provisions that would make the loan due anddemandable upon:
· technical defaults, subject to curing period; or
· default in payment, loan is immediately due and demandable.
Loans from Metrobank
Unsecured loans with quarterly interest payments subject to the following standard default provisionsthat would make the loan due and demandable upon:
· use of proceeds other than purpose; or
· default in payment.
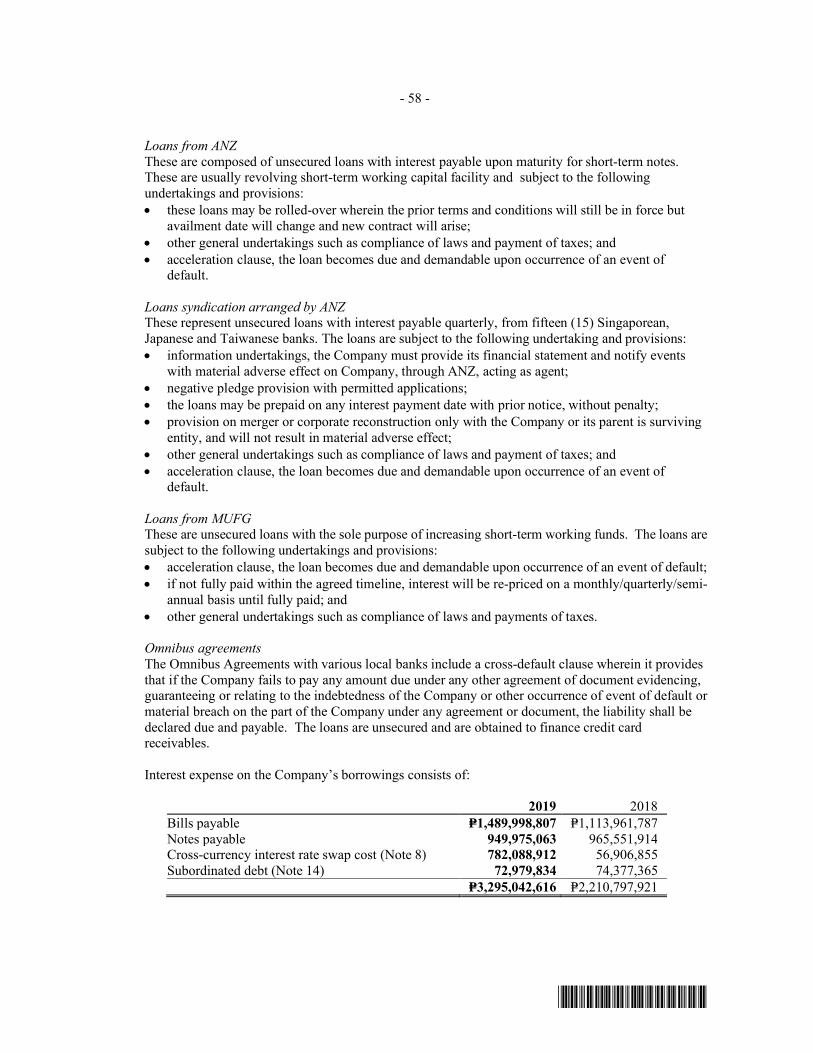
- 58 -
*SGVFS038854*
Loans from ANZ
These are composed of unsecured loans with interest payable upon maturity for short-term notes.These are usually revolving short-term working capital facility and subject to the followingundertakings and provisions:
· these loans may be rolled-over wherein the prior terms and conditions will still be in force butavailment date will change and new contract will arise;
· other general undertakings such as compliance of laws and payment of taxes; and
· acceleration clause, the loan becomes due and demandable upon occurrence of an event ofdefault.
Loans syndication arranged by ANZThese represent unsecured loans with interest payable quarterly, from fifteen (15) Singaporean,Japanese and Taiwanese banks. The loans are subject to the following undertaking and provisions:
· information undertakings, the Company must provide its financial statement and notify eventswith material adverse effect on Company, through ANZ, acting as agent;
· negative pledge provision with permitted applications;
· the loans may be prepaid on any interest payment date with prior notice, without penalty;
· provision on merger or corporate reconstruction only with the Company or its parent is survivingentity, and will not result in material adverse effect;
· other general undertakings such as compliance of laws and payment of taxes; and
· acceleration clause, the loan becomes due and demandable upon occurrence of an event ofdefault.
Loans from MUFGThese are unsecured loans with the sole purpose of increasing short-term working funds. The loans aresubject to the following undertakings and provisions:
· acceleration clause, the loan becomes due and demandable upon occurrence of an event of default;
· if not fully paid within the agreed timeline, interest will be re-priced on a monthly/quarterly/semi-annual basis until fully paid; and
· other general undertakings such as compliance of laws and payments of taxes.
Omnibus agreements
The Omnibus Agreements with various local banks include a cross-default clause wherein it providesthat if the Company fails to pay any amount due under any other agreement of document evidencing,guaranteeing or relating to the indebtedness of the Company or other occurrence of event of default ormaterial breach on the part of the Company under any agreement or document, the liability shall bedeclared due and payable. The loans are unsecured and are obtained to finance credit cardreceivables.
Interest expense on the Company’s borrowings consists of:
2019 2018
Bills payable P=1,489,998,807 P=1,113,961,787Notes payable 949,975,063 965,551,914Cross-currency interest rate swap cost (Note 8) 782,088,912 56,906,855Subordinated debt (Note 14) 72,979,834 74,377,365
P=3,295,042,616 P=2,210,797,921

- 59 -
*SGVFS038854*
13. Revenue from Contracts with Customers
Set out below is the disaggregation of the Company’s revenue from contracts with customers:
2019 2018
Point-in-time Over time Total Point-in-time Over time Total
Discounts earned P=2,877,594,157 P=– P=2,877,594,157 P=2,411,581,701 P=– P=2,411,581,701Membership fees and dues – 907,180,596 907,180,596 – 882,661,306 882,661,306
Awards revenue 81,003,543 – 81,003,543 67,890,112 – 67,890,112Miscellaneous income 1,063,983,795 – 1,063,983,795 932,110,429 – 932,110,429
P=4,022,581,495 P=907,180,596 P=4,929,762,091 P=3,411,582,242 P=882,661,306 P=4,294,243,548
The transaction price allocated to the remaining performance obligations (unsatisfied or partiallyunsatisfied) as at December 31, 2019 and 2018 are as follows:
2019 2018
Within one year P=287,503,403 P=346,661,795More than a year 831,999,369 722,138,306
P=1,119,502,772 P=1,068,800,101
The remaining performance obligations expected to be recognized in more than one year relate to thecustomer loyalty program. The customer loyalty points have no expiration and redemptions can gobeyond one year. All other remaining performance obligations, which include membership fees anddues, are expected to be recognized within one year.
In 2019 and 2018, the cost of redemption of loyalty points, recognized under ‘Loyalty expense’,amounted to P=220.3 million and P=180.2 million, respectively.
The changes and movements in contract liabilities are as follows:
2019
Awards
Revenue
Membership
Fees and Dues
Recoveries
from Debt Sale Others Total
Balance at beginning of year P=722,138,306 P=346,149,365 P=– P=512,430 P=1,068,800,101
Deferred during the year 190,864,606 841,480,634 – 7,315,156 1,039,660,396
Recognized to income during the
year (81,003,543) (907,180,596) – (773,586) (988,957,725)
Balances at end of year P=831,999,369 P=280,449,403 P=– P=7,054,000 P=1,119,502,772
2018
AwardsRevenue
MembershipFees and Dues
Recoveriesfrom Debt Sale Others Total
Balance at beginning of year P=627,520,074 P=381,453,995 P=118,318,393 P=– P=1,127,292,462Deferred during the year 162,508,344 847,356,676 – 512,430 1,010,377,450Recognized to income during
the year (67,890,112) (882,661,306) (118,318,393) – (1,068,869,811)
Balances at end of year P=722,138,306 P=346,149,365 P=– P=512,430 P=1,068,800,101
On October 1, 2017, the Company entered into a Debt Sale Agreement with Collectius AG c/o Stena(Switzerland) AG (Collectius) to sell its written-off receivables for P=394.4 million. The agreementincludes a provision for buy-back period until December 31, 2018 in an amount not exceeding 30% ofthe selling price as a result of certain conditions as enumerated in the agreement.
As of December 31, 2017, the Company deferred 30% of the selling price. For the year endingDecember 31, 2018, such conditions were satisfied and the deferred selling price amounting toP=118.3 million were recognized as revenue under ‘Recoveries of accounts written-off.’

- 60 -
*SGVFS038854*
14. Subordinated Debt
On February 28, 2013, the Company’s BOD approved the issuance of P=1.17 billion worth of Fixed-Rate Unsecured Subordinated Notes Eligible as Tier 2 Capital due 2023, callable in 2018 (the Notes)pursuant to the BSP Circular No. 280 and No. 781, Series of 2001 and 2013, as amended.
Among the significant terms and conditions of the issuance of the Notes pursuant to the authoritygranted by the BSP to the Company on October 22, 2013 follow:a. Issue price at 100.0% of face value.
b. The Notes bear interest at 6.21% per annum from and including December 20, 2013 andthereafter. Interest will be payable quarterly in arrears at the end of each interest period onMarch 20, June 20, September 20 and December 20 in each year, except for the last interestperiod which will end on the maturity date.
Unless previously redeemed, the Notes will be redeemed at their principal amount on the maturitydate of December 20, 2023.
c. The Notes will constitute direct, unsecured and subordinated obligations of the Company, andwill, at all times, rank pari passu and without any preference among themselves and at leastequally with all other present and future unsecured and subordinated obligations of the Company,except obligations mandatorily preferred by law.
d. Noteholders are prohibited by the BSP from having the Notes redeemed at their option prior to itsmaturity. Noteholders, may sell their Notes in the secondary market, however, this is subject tothe limitation that the Notes shall be sold only to qualified buyers. Any sale or transfer of theNotes in the secondary market is then subject to market prices and the limitation on the number ofallowable holders.
e. The Notes contain provisions relating to loss absorption upon the occurrence of a non-viabilitytrigger event of the Company or Metrobank as determined by the BSP, pursuant to which theCompany may be required immediately and irrevocably (without the need for the consent of theholders of the Notes) to effect a write-off in whole or in part of the outstanding principal andaccrued and unpaid interest in respect of the Notes or, in the case of non-viability of Metrobank,the Notes may be converted to such number of common shares of the Company.
f. If a non-viability trigger event occurs, a Noteholder will have no claim against the Company at allin respect of any Notes or any portion of the Notes that have been written down and/orterminated.
The Notes shall not be used as collateral for any loan made by the Company or any of its affiliates.
As of December 31, 2019 and 2018, the unamortized issuance costs on the subordinated debtamounted to P=4.3 million and P=5.4 million, respectively.
Amortization of issuance costs amounting to P=1.1 million in 2019 and 2018 were charged to ‘Interestexpense’ in the statements of income (Note 12).

- 61 -
*SGVFS038854*
15. Accrued Interest, Taxes and Other Expenses
This account consists of:
2019 2018
Accrued interest (Note 21) P=506,435,756 P=422,277,137Accrued advertising 239,503,593 115,998,622Accrued taxes 80,127,762 20,939,322Accrued rewards 23,185,035 12,194,405Accrued other expenses 628,433,488 520,286,396
P=1,477,685,634 P=1,091,695,882
The table below shows the breakdown of accrued other expenses:
2019 2018
Compensation and fringe benefits (Note 21) P=238,339,899 P=202,306,607Service fee 185,954,688 119,442,437Communications expense (Note 21) 110,386,143 84,268,993Rental and office-related expenses (Note 21) 49,250,518 61,673,662Computer-related expenses (Note 21) 27,717,481 21,997,322Management and professional fees (Note 21) 8,180,589 8,174,377Maintenance cost 7,293,041 8,229,332Membership fees 30,000 6,941,681Miscellaneous expenses 1,281,129 7,251,985
P=628,433,488 P=520,286,396
16. Equity
The details of the Company’s capital stock as of December 31, 2019 and 2018 are as follows:
Shares Amount
Capital stock - P=1.0 par valueAuthorized 2,000,000,000 P=2,000,000,000Issued and outstanding
Balance at beginning and end of year 1,000,000,000 1,000,000,000
Retained EarningsUnder the Corporation Code of the Philippines (the Code), a stock corporation is prohibited fromretaining surplus profits in excess of 100.0% of its paid-in capital stock, except when:a. Justified by definite corporate expansion projects or programs approved by the BOD; orb. The corporation is prohibited under any loan agreement with any financial institution or creditor,
whether local or foreign, from declaring dividends without its or his consent, and such consenthas not yet been secured; or
c. It can be clearly shown that such retention is necessary under special circumstances obtaining inthe corporation, such as when there is need for special reserve for probable contingencies.
The Company retains profit in line with its capital management policy (see Note 4).

- 62 -
*SGVFS038854*
Appropriations
On March 1, 2018, the BOD approved the net appropriation of retained earnings in the amount ofP=11.6 billion for the following:
· Appropriation of retained earnings as capital reserves amounting to P=3.8 billion. Theappropriation, in line with the capital management policy (Note 4), is aimed at strengthening theCompany’s capital to comply with the debt to equity ratio of 7.5:1 per loan covenants and to meetthe CAR with due consideration of the impact of adopting the ECL model under PFRS 9.
· Appropriation of retained earnings for the issuance of cash dividends in 2018 amounting toP=1.8 billion.
· Appropriation of retained earnings for the issuance of stock dividends in 2018 amounting toP=6.0 billion.
On December 14, 2018, the BOD approved the re-appropriation of retained earnings in the amount ofP=6.0 billion for the planned issuance of stock dividends in 2019, meet the requirements set by SEC oncapital retention in excess of paid-up capital, the BSP on capital ratios set under Basel III rules, andexisting creditors on maintaining debt-to-equity ratio of 7.5:1 per loan covenant.
The issuance of stock dividends did not transpire in 2019 as planned and disclosed in 2018. This isdue to the planned merger of the Company with MBTC which took effect on January 3, 2020.
On March 8, 2019, the BOD approved an additional appropriation of retained earnings in the amountof P=7.0 billion as capital reserves. The appropriation, in line with the capital management policy, willensure that the Company will meet requirements set by the SEC on capital retention, the BSP oncapital ratios, and existing loan covenants on maintaining debt-to-equity ratio to be within themaximum of 7.5:1.
· Appropriation of retained earnings for capital retention on the Tier 2 notes in compliance withBSP’s capital adequacy ratio amounting to P=1.0 billion.
· Appropriation of retained earnings for compliance with BASEL III net stable funding ratioamounting to P=5.5 billion.
· Appropriation of retained earnings for capital expenditure projects amounting to P=500.0 million,which are expected to be completed within the next two (2) years.
Capital ratios set under BASEL III and debt-to-equity ratio required by existing creditor-banks werecomplied during the year.
Metrobank has acquired the Company in a merger transaction with effective date on January 3, 2020(Note 25). As a result of this merger, no further appropriations were made by the Company on itsretained earnings as the Company’s assets and liabilities will be absorbed by the Ultimate ParentCompany.
Cash dividendsNo cash dividends were declared and paid in 2019.
The following cash dividends were declared and paid in 2018.
Dividend
Date of Declaration Per Share Total Amount Record Date Amount Paid Payment Date
June 29, 2018 P=1.975 P=1,975,000,000 June 29, 2018 P=1,975,000,000 August 29, 2018
The computation of retained earnings available for dividend declaration in accordance with SECMemorandum Circular No. 11, issued in December 2008, differs to a certain extent as compared withthe computation per BSP guidelines.

- 63 -
*SGVFS038854*
17. Miscellaneous Income and Expenses
Miscellaneous income consists of:
2019 2018
Gross international fees P=435,403,283 P=374,980,756Over credit limit fees 302,321,809 245,278,028Service fees 184,245,439 145,249,363Transaction processing fees 71,998,739 62,633,175Foreign exchange gain 35,751,447 59,568,491Rental income (Notes 18 and 21) 19,551,117 30,285,556Business process outsourcing fees 3,032,100 2,565,459Gain on sale of fixed assets (Notes 9 and 10) 1,494,712 1,804,243Others 10,185,149 9,745,358
P=1,063,983,795 P=932,110,429
Gross international fees represent fees arising from foreign currency transactions of cardholders.
Over credit limit fees represent charges to cardholders when their outstanding balance exceeded thecredit limit allowed by the Company.
Service fees represent income arising from other services performed by the Company in fulfillingcardholder’s request such as re-printing of statement of accounts (SOAs), card replacements, retrievalof transaction receipts and other fees not directly associated to credit card transactions.
Transaction processing fees represent income from processing maintaining accounts, ‘Cash 2 Go’availments and redemption of rewards.
Others include interest income on employee loans various income generating charges.
Miscellaneous expenses consist of:
2019 2018
Maintenance costs (Note 21) P=200,743,619 P=151,958,296Collection fees 185,579,004 168,006,078Verification costs 72,346,262 78,707,883Membership fees (Note 21) 6,102,491 5,032,435Insurance (Note 21) 6,094,582 4,946,400Recruitment costs 4,526,532 4,627,707Employee relations expenses 3,054,783 3,149,213Others 37,222,656 55,702,837
P=515,669,929 P=472,130,849
Collection fees pertain to expenses incurred for the services rendered by collection agencies in thecollection of payments from delinquent and written-off accounts that were endorsed to the collectionagency partners of the Company.
Verification costs represents expenses incurred for the credit investigation procedures, such as ocularverification, encoding services, cost of enquiries for potential cardholders and merchants that areoutsourced by the Company from third party agencies.

- 64 -
*SGVFS038854*
Others consists of unrealized foreign exchange losses, engagement expenses, retail transaction fees,fines, penalties and other charges, operating losses, Philpass charges and software licenses.
18. Leases
Company as LesseeThe Company entered into three (3) lease agreements with its Ultimate Parent Company. Theseleases cover the use of office premises in three strategic locations:
· Metropolitan Park in Pasay City – lease contract for five (5) years which will end onDecember 31, 2021 (with annual escalation of 5.0%)
· Metrobank-Cebu – lease contract for three (3) years which will end on September 15, 2020 (withannual escalation of 5.0%)
· Metrobank-Davao – lease contract three (3) years which will end on December 31, 2021 (withannual escalation of 5.0%)
The Company also entered into lease agreements for photocopiers and cars, both with terms of three(3) years, which will end on April 25, 2021 and September 30, 2021, respectively.
Set out below are the Company’s right-of-use assets and lease liabilities and the movements duringthe period:
Right-of-Use Assets Lease Liabilities
As at January 1, 2019 P=73,105,988 P=73,105,988Additions 6,871,022 6,871,022Depreciation expense (27,383,464) –Interest expense – 4,291,929Payments – (28,781,973)
As at December 31, 2019 P=52,593,546 P=55,486,966
Set out below are the amounts recognized in the statement of income for the period ended:
2019
Depreciation expense of right-of-use assets P=27,383,464Interest expense on lease liabilities 4,291,929Rent expense – leases of low-value assets 211,929,234Rent expense – short-term leases 7,084,773
P=250,689,400
The Company also entered into lease agreements to lease units of point-of-sale terminals forminimum period of three (3) to five (5) years. These are cancellable and can be terminated after thespecified period stated in the lease agreements.
The future minimum lease commitments under operating lease are as follows as of December 31,2019 and 2018:
2019 2018
Within one year P=127,309,903 P=104,803,766After one year but not more than five years 124,959,796 120,359,658
P=252,269,699 P=225,163,424

- 65 -
*SGVFS038854*
For the year ended December 31, 2019 and 2018, rental expense amounted to P=219.0 million andP=234.1 million which is included under ‘Rent, light and water’ in the statement of income. Therewere no direct costs incurred in relation to these leases.
Company as LessorFor the year ended December 31, 2019 and 2018, rental income from the lease agreement wereincluded under ‘Miscellaneous income’ amounted to P=19.6 million and P=12.7 million, respectively.There were no direct costs incurred in relation to these leases.
19. Retirement Liability
The Company has a funded noncontributory defined benefit retirement plan covering all of its officersand regular employees. The funds are being administered by the Trust Banking Group (TBG) ofMetrobank under the supervision of the Retirement Committee.
The Retirement Committee is responsible for giving direction to the Trustee on the investment of theassets of the fund. The Retirement Committee defines the investment strategy as often as necessary,at least annually, especially in the case of significant market developments or changes to the structureof the plan participants.
When defining the investment strategy, the Retirement Committee takes into account the plans’objectives, benefit obligations and risk capacity. The investment strategy is defined in the form of along-term target structure or investment policy.
The Retirement Committee delegates the implementation of the investment policy in accordance withthe investment strategy, as well as various principles and objectives to an Investment Committee,which also consists of members of the Board of Trustees, a Director and a Controller. The Controlleroversees the entire investment process.
Under the existing regulatory framework, Republic Act No. 7641, Retirement Pay Law, requires aprovision for retirement pay to qualified private sector employees in the absence of any retirementplan in the entity, provided however, that the employee’s retirement benefits under any collectivebargaining and other agreements shall not be less than those provided under the law. The law doesnot require minimum funding of the plan.
The principal actuarial assumptions used in determining the retirement liability for the Company’sretirement plan as of December 31, 2019 and 2018 are as follow:
2019 2018
Discount rate 4.9% 7.3%Future salary increases:
For officers 8.0% 8.0%For staff P=1,993 P=1,993
Average years of service 8.3 years 8.0 yearsAverage remaining working life 10.0 years 10.0 yearsRetirement age 55.0 years 55.0 years

- 66 -
*SGVFS038854*
The ch
anges in
retiremen
t liability
, presen
t valu
e of d
efined
ben
efit oblig
ation an
d fair v
alue o
f plan
assets follo
w:
20
19
Retirem
ent E
xp
ense
Rem
easu
remen
t Losses o
n R
etirem
ent P
lan
Ja
nu
ary
1,
20
19
Cu
rrent
Serv
ice Co
st
Pa
st
Serv
ice Co
stN
et Inter
estS
ub
tota
l*
Retu
rn o
n
Pla
n A
ssets
(Ex
clud
ing
Am
ou
nt
Inclu
ded
in
Net In
terest)
Actu
aria
l
Ch
an
ges
Arisin
g fro
m
Exp
erience
Ad
justm
ents
Actu
aria
l
Ch
an
ges
Arisin
g
fro
m C
han
ges
in F
ina
ncia
l
Assu
mp
tion
sS
ub
tota
l B
enefits P
aid
Co
ntrib
utio
n
by E
mp
loy
er
Decem
ber 3
1,
20
19
Presen
t valu
e of d
efined
ben
efit ob
ligatio
nP=
97
4,1
12
,48
5P=
12
3,2
14
,74
6P=
–P=
68
,793,7
77
P=1
92
,00
8,5
23
P=–
P=2
1,9
89,9
20
P=2
75
,98
6,9
54
P=2
97
,97
6,8
74
(P=2
2,9
53
,39
7)
P=–
P=
1,4
41
,14
4,4
85
Fair v
alue o
f plan
assets(8
01
,175,8
76)
––
(55
,40
4,3
33
)(5
5,4
04
,33
3)
(56
,21
7,4
07
)–
–(5
6,2
17
,40
7)
22
,953,3
97
(176
,900,0
00)
(1,0
66,7
44
,219)
Net
defin
ed b
enefit liab
ilityP=
17
2,9
36
,60
9P=
12
3,2
14
,74
6P=
–P=
13
,389,4
44
P=1
36
,60
4,1
90
(P=5
6,2
17
,40
7)
P=2
1,9
89,9
20
P=2
75
,98
6,9
54
P=2
41
,75
9,4
67
P=–
(P=
176
,900,0
00)
P=3
74
,40
0,2
66
* P
resented
un
der ‘C
om
pen
satio
n a
nd frin
ge b
en
efits’ in th
e sta
temen
ts of in
com
e.
20
18
Retirem
ent E
xp
ense
Rem
easurem
ent L
osses o
n R
etiremen
t Plan
January
1,
20
18
Curren
tS
ervice C
ost
Past
Serv
ice Cost
Net In
terestS
ub
total*
Retu
rn o
n
Plan
Assets
(Ex
clud
ing
Am
oun
t
Inclu
ded
inN
et Interest)
Actu
arialC
han
ges
Arisin
g fro
m
Ex
perien
ceA
dju
stmen
ts
Actu
arial
Chan
ges
Arisin
g
from
Ch
anges
in F
inan
cialA
ssum
ptio
ns
Sub
total
Ben
efits Paid
Con
tribu
tion
by
Em
plo
yer
Decem
ber 3
1,
20
18
Presen
t valu
e of d
efined
ben
efit ob
ligatio
nP=
93
9,7
57
,44
1P=
10
6,2
13
,76
7P=
54
,692,3
29
P=5
2,9
91,5
56
P=2
13
,89
7,6
52
P=–
P=1
9,1
88,2
91
(P=1
71
,765,3
33)
(P=1
52
,577,0
42)
(P=2
6,9
65
,56
6)
P=–
P=9
74
,11
2,4
85
Fair v
alue o
f plan
assets(7
11
,671,9
34)
––
(44
,02
0,7
65
)(4
4,0
20
,76
5)
68
,064,2
98
––
68
,064,2
98
30
,052,5
25
(143
,600,0
00)
(801
,175,8
76)
Net d
efined
ben
efit liability
P=2
28
,08
5,5
07
P=1
06
,21
3,7
67
P=5
4,6
92,3
29
P=8
,97
0,7
91
P=1
69
,87
6,8
87
P=6
8,0
64,2
98
P=1
9,1
88,2
91
(P=1
71
,765,3
33)
(P=8
4,5
12
,74
4)
P=3
,08
6,9
59
(P=1
43
,600,0
00)
P=1
72
,93
6,6
09
* P
resented
un
der ‘C
om
pen
satio
n a
nd frin
ge b
en
efits’ in th
e sta
temen
ts of in
com
e.
The C
om
pan
y ex
pects to
contrib
ute P=
178.8
millio
n to
its defin
ed b
enefit retirem
ent p
lan in
2020.

- 67 -
*SGVFS038854*
The major categories of plan assets and their corresponding percentage to the fair values of total planassets follow:
2019 2018
Amount % Amount %
Deposits in bank P=168,499,119 15.8 P=122,163,234 15.3Equity securities 150,000 – 147,000 –Debt securities:
Government 676,613,177 63.4 519,091,547 64.8Private 118,060,180 11.1 85,900,075 10.7
Unit investment trust funds 93,790,669 8.8 61,672,810 7.7Loans – – 5,940,000 0.7Others 9,631,074 0.9 6,261,210 0.8
P=1,066,744,219 100.0 P=801,175,876 100.0
All equity and debt securities held have quoted prices in active market while the fair value of unitinvestment trust funds is based on its corresponding published Net Asset Value (NAV). The fairvalue of other assets and liabilities, which include accrued interest receivable and trust fee payables,approximate their carrying amount due to the short-term nature of these accounts.
The sensitivity analysis below has been determined based on reasonably possible changes of eachsignificant assumption on the defined benefit obligation as of the end of the statement of financialposition date, assuming all other assumptions were held constant:
Increase (Decrease)
Possible fluctuations 2019 2018
Discount rate1.0% (P=132,218,205) (P=83,172,299)
(1.0%) 151,671,248 94,964,781
Future salary increase rate1.0% 121,182,562 77,708,444
(1.0%) (113,514,226) (73,331,371)
Turnover rate2.2% (39,594,003) (14,403,185)(2.2%) 43,057,311 15,605,650
Shown below is the maturity analysis of undiscounted benefits payments:
2019 2018
Less than one year P=57,608,376 P=32,572,855More than one year to five years 354,478,292 273,547,226More than five years to 10 years 1,025,313,868 866,995,714More than 10 years to 15 years 1,432,023,672 1,204,121,916More than 15 years to 20 years 1,933,624,308 1,918,362,854More than 20 years 1,122,795,882 1,123,523,559
The average duration of the defined benefit obligation as of December 31, 2019 and 2018 is14.3 years and 14.8 years, respectively.

- 68 -
*SGVFS038854*
20. Income Taxes
Income taxes include corporate income tax, as discussed below, and final taxes paid at the rate of20.0% and 7.5% on peso-denominated and foreign currency-denominated cash in banks, respectively,which is a final withholding tax on gross interest income.
The Regular Corporate Income Tax (RCIT) rate is 30.0% and interest allowed as deductible expenseis reduced by 33.0% of interest income subjected to final tax.
The National Internal Revenue Code (NIRC) of 1997 also provides for rules on the imposition ofMinimum Corporate Income Tax (MCIT) of 2.0% on the gross income as of the end of the taxableyear beginning on the fourth (4th) taxable year immediately following the taxable year in which theCompany commenced its business operations. Any excess MCIT over the RCIT can be carriedforward on an annual basis and credited against the RCIT for the three immediately succeedingtaxable years.
In addition, the NIRC of 1997 allows the Company to deduct from its taxable income for the currentyear its accumulated net operating losses for the immediately preceding three consecutive taxableyears.
Current tax regulations also provide for the ceiling on the amount of entertainment, amusement andrecreation (EAR) expense that can be claimed as a deduction against taxable income. Under theregulation, EAR expense allowed as a deductible expense for a service company is limited to theactual EAR paid or incurred but not to exceed 1.0% of net revenue. In 2019 and 2018, EAR expensesamounted to P=1.3 million and P=1.6 million, respectively.
Deferred Tax Assets - NetThe components of net deferred tax assets follow:
2019 2018
Deferred tax assets on:
Allowance for credit losses (Note 7) P=1,382,638,470 P=1,226,363,991Provision for credit losses (Note 23) 232,733,602 274,702,684Deferred revenue (Note 13) 335,850,831 320,500,410Retirement liability (Note 19) 112,320,080 51,880,983Accrued expenses 33,477,632 47,970,510Unamortized past service cost 61,001,005 49,003,927Unrealized foreign exchange loss 6,709,954 10,996,036
2,164,731,574 1,981,418,541
Deferred tax liabilities on:
Unrealized gain from equity instruments (3,476,592) (3,476,592)Deferred acquisition cost (Note 7) (73,405,015) (50,369,096)
(76,881,607) (53,845,688)
P=2,087,849,967 P=1,927,572,853
Management believes that the current level of deferred tax assets will be utilized in the future.

- 69 -
*SGVFS038854*
A reconciliation of the Company’s statutory income tax to effective income tax follows:
2019 2018
Statutory income tax P=2,104,921,151 P=2,130,962,131Tax effects of:
Nondeductible expenses 257,250 135,959Income subjected to final tax (259,849) (254,531)
Effective income tax P=2,104,918,552 P=2,130,843,559
21. Related Party Transactions
Parties are considered to be related if one party has the ability, directly or indirectly, to control theother party or exercise significant influence over the other party in making financial and operatingdecisions. The Company’s related parties include:
· Ultimate Parent Company:§ Metropolitan Bank and Trust Company
· Affiliates or other related parties, which are associates, subsidiaries, and joint ventures of theParent Company. Affiliates with which the Company has related party transactions in 2019 and2018 follow:§ Charter Ping An Insurance Corporation§ Federal Land, Inc.§ First Metro Investment Corporation§ Metro Remittance Center, Inc.§ Metro Remittance (Hongkong) Ltd.§ Metro Remittance (Italia), S.p.A.§ Metro Remittance (Japan) Co. Ltd.§ Metro Remittance (Singapore) Pte. Ltd.§ Metro Remittance (UK) Ltd.§ Metro Remittance (USA), Inc.§ ORIX Metro Leasing and Finance Corporation§ Philippine AXA Life Insurance Corporation§ Philbancor Venture Capital Corporation§ Philippine Savings Bank§ SMBC Metro Investment Corporation§ Taal Land, Inc.§ Toyota Cubao, Inc.§ Toyota Financial Services Philippines Corporation§ Toyota Manila Bay Corporation§ Toyota Motor Philippines Corporation
· Post-employment benefit plans for the benefit of the Company’s employees.
· Key management personnel, close family members of key management personnel and entitieswhich are controlled, significantly influenced by or for which significant voting power is held bykey management personnel or their close family members.

- 70 -
*SGVFS038854*
The Company has several business relationships with related parties. Transactions with such partiesare made in the ordinary course of business and on substantially same terms, including interest andcollateral, as those prevailing at the time for comparable transactions with other parties. Thesetransactions also did not involve more than the normal risk of collectability or present otherunfavorable conditions.
The Company has a Related Party Committee (RPC) which is created to assist the BOD in ensuringthat transactions with related parties are reviewed to assess risks and are subjected to appropriaterestrictions to ensure that these are conducted at arm’s-length terms and that business resources of theCompany are not misappropriated or misapplied. After appropriate review, the RPC discloses allinformation and endorses to the BOD with recommendations, the proposed related party transactions.The members of the RPC are appointed annually by the BOD. Currently, the RPC is composed oftwo (2) independent directors (including the Chairman of the Committee); two (2) regular directors;and the head of Compliance and Internal Audit (as Secretary). The RPC meets on a quarterly basis oras the need arises.
The RPC’s review of proposed related party transactions covers the following:a. Identity of the parties involved in the transaction or relationship;b. Terms of the transaction or relationship and whether these are no less favorable than terms
generally available to an unrelated third party under the same circumstances;c. Business purpose, timing, rationale and benefits of the transaction or relationship;d. Approximate monetary value of the transaction and the approximate monetary value of the
related party’s interest in the transaction;e. Valuation methodology used and alternative approaches to valuation of the transaction;f. Information concerning potential counterparties in the transaction;g. Whether the proposed transaction includes any potential reputational risk issues that may arise as
a result of or in connection with the transaction;h. Impact to a director’s independence; andi. Extent that such transaction or relationship would present an improper conflict of interest.
In the ordinary course of business, the Company has transactions with Metrobank and other relatedcompanies. The major transactions include availments of loans, short-term cash placements and otherregular banking transactions. The branch network of Metrobank and PSBank also acts as servicingunits of the Company for the acceptance of payments from cardholders. Metrobank and PSBankcharge the Company for every payment and processing of transaction which are recorded under‘Distribution costs’ and ‘Computer-related expenses’ in the statements of income, respectively.
The following table presents the balances of material intercompany transactions of the Company as ofand for the years ended December 31, 2019 and 2018 (amounts in thousands):
December 31, 2019
Category
Amount/
Volume
Outstanding
Balance Nature, Terms and Conditions
Ultimate Parent Company
Cash and cash equivalents P=427,635 Current and savings account, and foreign currencydeposits with annual interest rates of 0.5% and0.1%, respectively.
Deposits P=884,719,443
Withdrawals (884,760,043)
Short-term placements 278,873
Placements 227,704,266 Short-term deposits with annual interest rate of1.5% and term of 5 daysMaturities (227,425,393)
Interbank loans receivables – Various overnight placements with terms of 1 to 15days and bear annual interest rates ranging from2.0% to 4.0%
Placements 25,700,000
Maturities (25,700,000)

- 71 -
*SGVFS038854*
December 31, 2019
Category
Amount/
Volume
Outstanding
Balance Nature, Terms and Conditions
Accounts receivable (P=13,042,035) P=12,962
Billings on merchant discount subsidy, outsourcing
fees, Point-of-Sale (POS) rentals and charges for use of Visa Banking Identification Number (BIN)
Accounts payable 4,189 4,189 Service fees on availments of bills payable
Right-of-use assets 44,636
Capitalized leases on the Company’s office spaceswith lease contract term ranging from 3 to 5
years and with annual escalation of 5%
Accrued expense payable 50,362 5,587
Accrual of expenses from rentals, membership fees, distribution cost, utilities and other
maintenance costsAccrued interest payable 15,339 15,339 Accrued interest payable on interest-bearing notesBills payable – Overnight borrowings with annual interest rates
ranging from 2.5% to 5.3% and terms of1 to 5 days.
Availments 18,460,000
Maturities (18,460,000)
Notes payable −Interest-bearing note with an annual interest rate of
3.9% to 5.7% and term of 1 to 3 years.Availments 47,395,000
Maturities (47,395,000)
Derivative liabilities (167,266) (167,266)
Cross-currency interest rate swaps with annual fixed
interest rates ranging from 6.6% to 6.9% andterms of 3 years.
Lease liabilities 52,849
Obligation from capitalized leases with termranging from 3 to 5 years and interest rates
ranging from 6.9% to 7.0%
Interest income 4,479
Interest earned on bank deposits and overnight lending
Merchant discount 4,544 Income earned on merchant discount subsidy
Miscellaneous income 3,032
Income earned on outsourcing fees, overlimit fees,transaction processing fees, gross international
fees
Interest expense 401,765
Interest expense, service fees and facility agent fees on interbank loans payable, interest-
bearing notes and lease liabilities
Rent, light and water 12,378
Rentals and utility expenses from leased premises at Metropolitan Park and Metrobank Plaza
Computer-related expense 24,493 Transaction processing chargesCommunications − Telephone and courier card delivery charges
Depreciation of right-of-use assets 24,664
Depreciation expense of capitalized right-of-use
assets
Distribution cost 3,836
Over-the-counter charges for the accommodation of cardholder payments
Security, messengerial and janitorial 39 Administrative expenses
Miscellaneous expense 69,249
Other membership and maintenance fees, collectionand maintenance fees, recruitment and
verification cost and employee relations expense
Affiliates
Cash and cash equivalents (10,071) Current and savings account, and foreign currency deposits with annual interest rates of 0.5% and 0.1%, respectively.
Deposits 5,838,963
Withdrawals (5,894,034)
Short-term placements − Short-term deposits and various overnight placements with terms of 1 to 3 days and bear annual interest rates ranging from
4.6% to 5.2%.
Placements 132,973,000
Maturities (132,973,000)
Accounts receivable 6,206 5,400
Accounts receivable from corporate credit card transactions
Prepaid expenses and other currentassets 5,275 804 Advance payment for insurance premiums
Bills payable 229,601 Overnight borrowings with annual interest rate
ranging from 1.9% to 6.3% and terms of1 to 6 days.
Availments 135,460,000
Maturities (135,230,399)
Notes payable − Interest-bearing note with an interest ranging from
1.6% to 6.3% and term of 5 years (gross ofunamortized issuance cost)
Availments −Maturities −
Accrued interest payable 3,254 3,254
Accrued interest payable on deposit substitutes
and interest-bearing notes

- 72 -
*SGVFS038854*
December 31, 2019
Category
Amount/
Volume
Outstanding
Balance Nature, Terms and Conditions
Accrued expense payable P=1,569 P=–
Over-the-counter charges for the accommodation
of cardholder payments and other accruedexpenses
Interest income 1,569
Interest earned on bank deposits and overnight
lendingMembership fees and dues − Annual membership fee for corporate credit cards
Interest expense 35,102
Interest expense on interbank loans payable,
deposit substitutes and interest-bearing notes
Distribution cost 3,254
Over-the-counter charges for the accommodation of cardholder payments
Rent, light and water − Rentals and utility expensesInsurance expense 6,094 Insurance expensesMiscellaneous expenses 371 Donations and other expenses
December 31, 2018
Category
Amount/
Volume
Outstanding
Balance Nature, Terms and Conditions
Ultimate Parent CompanyCash and cash equivalents P=468,235 Current and savings account, and foreign currency
deposits with annual interest rates of 0.5% and0.1%, respectively.
Deposits P=927,566,357Withdrawals (928,493,406)
Short-term placements –
Placements 15,538,000 Short-term deposits with annual interest rate of1.5% and term of 5 daysMaturities (15,538,000)
Interbank loans receivable – Various overnight placements with terms of 1 to 3
days and bear annual interest rates ranging from3.0% to 4.9%
Placements –Maturities –
Accounts receivable (70,419,748) 26,004
Billings on merchant discount subsidy, outsourcing
fees, Point-of-Sale (POS) rentals and charges for use of Visa Banking Identification Number (BIN)
Accounts payable − − Service fees on availments of bills payable
Accrued expense payable 1,820 2,375
Accrual of expenses from rentals, membership fees, distribution cost, utilities and other
maintenance costsAccrued interest payable (20,524) 22,633 Accrued interest payable on interest-bearing notesBills payable − Overnight borrowings with annual interest rates
ranging from 2.6% to 5.1% and terms of1 to 5 days.
Availments 6,711,000Maturities (6,711,000)
Notes payable (6,860,624)
Interest-bearing note with an annual interest rate of3.4% to 4.3% and term of 1 to 3 years.
Availments 5,461,624Maturities (8,399,000)
Derivative liabilities (28,510) (28,510)
Cross-currency interest rate swaps with annual fixed
interest rates ranging from 6.6% to 6.9% andterms of 3 years.
Interest income 4,229
Interest earned on bank deposits and overnight
lendingMerchant discount 10,621 Income earned on merchant discount subsidyMiscellaneous income 12,775 Income earned on outsourcing fees
Interest expense 186,929
Interest expense, service fees and facility agent fees on interbank loans payable and interest- bearing notes
Rent, light and water 39,889Rentals and utility expenses from leased premises
at Metropolitan Park and Metrobank PlazaComputer-related expense 28,433 Transaction processing charges
Communications − Telephone and courier card delivery charges
Distribution cost 56,785Over-the-counter charges for the accommodation of cardholder payments
Security, messengerial and janitorial 37 Administrative expensesMiscellaneous expense 8,358 Other membership and maintenance feesAffiliates
Cash and cash equivalents 48,895 Current and savings account, and foreign currency deposits with annual interest rates of 0.5% and 0.1%, respectively.
Deposits 5,693,432Withdrawals (5,696,852)
Short-term placements − Short-term deposits and various overnight placements with terms of 1 to 3 days and bear annual interest rates ranging from
2.5% to 3.0%.
Placements −
Maturities −

- 73 -
*SGVFS038854*
December 31, 2018
Category
Amount/Volume
OutstandingBalance Nature, Terms and Conditions
Accounts receivable P=1,950 P=4,717
Accounts receivable from corporate credit card
transactionsPrepaid expenses and other current
assets 131,400 82,176 Advance payment for insurance premiums
Bills payable 346,632 Overnight borrowings with annual interest rate ranging from 3.0% to 5.0% and terms of 1 to 6 days.
Availments 10,392,111Maturities (39,562,000)
Notes payable − Interest-bearing note with an interest of 8.5% and term of 5 years (gross of unamortized issuance cost)
Availments 39,562,000Maturities (39,562,000)
Accrued interest payable 801 1,434Accrued interest payable on deposit substitutes
and interest-bearing notes
Accrued expense payable (418) 873
Over-the-counter charges for the accommodation
of cardholder payments and other accruedexpenses
Interest income 11,166
Interest earned on bank deposits and overnight
lendingMembership fees and dues 1,635 Annual membership fee for corporate credit cards
Interest expense 30,216Interest expense on interbank loans payable, deposit substitutes and interest-bearing notes
Distribution costOver-the-counter charges for the accommodation
of cardholder paymentsRent, light and water 835 Rentals and utility expenses
Insurance expense 5,388 Insurance expenses
Terms and Conditions of Transactions with Related PartiesOutstanding balances as of December 31, 2019 and 2018 are unsecured and settlement occurs in cash.There have been no guarantees provided or received for any related party receivables or payables. Animpairment assessment is undertaken each financial year through a review of the financial position ofthe related party and the market in which the related party operates.
In 2019 and 2018, no provisions for credit losses were provided for receivables from related parties.
Transactions with Post-Employment Benefit PlanIncluded in the Company’s retirement plan assets are time deposits with Metrobank and investmentsin unit investment trust fund that are being managed by the TBG of Metrobank.
The total carrying value and fair value of the retirement plan assets as of December 31, 2019 and2018 are disclosed in Note 19.
Remuneration of Directors and Other Key Management PersonnelThe remuneration of directors and key management personnel (included under ‘Compensation andfringe benefits’ in the statements of income) are as follow:
2019 2018
Salaries and wages and other short-term benefits P=224,822,441 P=205,416,623Retirement benefits 22,896,922 26,965,566Directors fees 10,252,000 6,140,000
P=257,971,363 P=238,522,189
The Company’s key management personnel include vice-presidents and above.
There is no agreement between the Company and any of its directors and key officers providing forbenefits upon termination of employment, except for such benefits to which they may be entitledunder the Company’s retirement plan.

- 74 -
*SGVFS038854*
BSP Regulatory ReportingIn the ordinary course of business, the Company has various transactions with its affiliates and withcertain DOSRI. These transactions usually arise from normal banking activities such as lending,borrowing, deposit arrangements and trading of securities, among others. Under existing policies ofthe Company, these transactions are made substantially on the same terms as with other individualsand businesses of comparable risks.
Under current banking regulations, the amount of individual loans to DOSRI, of which 70.0% mustbe secured, should not exceed the amount of their respective unencumbered deposits and book valueof their respective investments in the Company. In the aggregate, loans to DOSRI generally shouldnot exceed the lower of the Company’s total regulatory capital or 15.0% of the total loan portfolio.
On March 15, 2004, the BSP issued BSP Circular No. 423 which provides for the amended definition
of DOSRI accounts. The following table shows information relating to DOSRI loans as reported to
the BSP:
2019 2018
Total outstanding DOSRI loans P=103,387,552 P=101,242,492Percent of DOSRI loans to total loans 0.12% 0.14%Percent of unsecured DOSRI loans to total DOSRI loans 0.16% 0.16%Percent of past due DOSRI loans to total DOSRI loans 0.16% 0.16%Percent of nonperforming DOSRI loans to total DOSRI
loans 0.16% 0.16%
Under BSP Circular No. 423, loans and other credit accommodations and guarantees secured byassets are considered as non-risk by the MB and therefore, excluded from DOSRI individual andaggregate ceilings.
BSP Circular No. 560 provides that the total outstanding loans, other credit accommodation andguarantees to each of the bank’s/quasi-bank’s subsidiaries and affiliates shall not exceed 10.0% of thenet worth of the lending bank/quasi-bank, provided that the unsecured portion of which shall notexceed 5.0% of such net worth. Further, the total outstanding loans, credit accommodations andguarantees to all subsidiaries and affiliates shall not exceed 20.0% of the net worth of the lendingbank/quasi-bank; and the subsidiaries and affiliates of the lending bank/quasi-bank are not relatedinterest of any director, officer and/or stockholder of the lending institution, except where suchdirector, officer or stockholder sits in the BOD or is appointed officer of such corporation asrepresentative of the bank/quasi-bank. As of December 31, 2019 and 2018, the total outstandingloans, other credit accommodations and guarantees to each of the Company’s affiliates and certainDOSRI did not exceed 10.0% of the net worth of the Company, and the unsecured portion of whichdid not exceed 5.0% of such net worth.
22. Financial Performance
As of December 31, 2019 and 2018, the basic ratios which measure the financial performance of theCompany are as follows:
2019 2018
Return on average equity 28.6% 34.9%Net interest margin on average earning assets 13.5% 14.0%Return on average assets 5.6% 6.3%

- 75 -
*SGVFS038854*
23. Commitments and Contingencies
In the normal course of operations, the Company has outstanding commitments to extend credit tocredit cardholders, which are not reflected in the financial statements. Even though these obligationsare not recognized on the statement of financial position, they contain credit risk and, therefore,formed part of the overall risk of the Company.
As of December 31, 2019 and 2018, credit cardholders’ unused credit lines amounted toP=209.8 billion and P=185.6 billion, respectively.
An analysis of changes in the gross carrying amount and the corresponding provision arising fromunused credit lines is as follows:
2019
Unused Credit Lines
Stage 1 Stage 2 Stage 3 Total
Outstanding exposure
Exposure at beginning of year P=182,788,470,469 P=2,660,689,690 P=146,604,845 P=185,595,765,004New exposures 21,683,554,741 – – 21,683,554,741Transfers to Stage 1 4,059,721,655 (4,044,516,985) (15,204,670) –Transfers to Stage 2 (5,739,015,893) 5,754,138,680 (15,122,787) –Transfers to Stage 3 (2,038,792,411) (367,599,009) 2,406,391,420 –Movements in unused credit lines 4,493,555,417 (1,155,784,201) (851,198,338) 2,486,572,878
Exposure at end of year P=205,247,493,978 P=2,846,928,175 P=1,671,470,470 P=209,765,892,623
Provisions
Exposure at beginning of year P=589,618,682 P=326,056,930 P=– P=915,675,612New exposures 229,553,710 – – 229,553,710Transfers to Stage 1 547,193,417 (547,193,417) – –Transfers to Stage 2 (82,627,505) 82,627,505 – –Movements in unused credit lines (51,853,559) (74,758,236) – (126,611,795)Impact on year-end ECL of exposures
transferred during the year (652,051,430) 409,212,576 – (242,838,854)
Exposure at end of year P=579,833,315 P=195,945,358 P=– P=775,778,673
2018
Unused Credit Lines
Stage 1 Stage 2 Stage 3 Total
Outstanding exposureExposure at beginning of year P=155,104,351,896 P=2,524,664,180 P=342,568,701 P=157,971,584,777New exposures 19,503,230,867 – – 19,503,230,867Transfers to Stage 1 4,033,736,864 (3,995,637,301) (38,099,563) –Transfers to Stage 2 (5,321,847,427) 5,353,297,952 (31,450,525) –Transfers to Stage 3 (559,610,336) (315,998,815) 875,609,151 –Movements in unused credit lines 10,028,608,605 (905,636,326) (1,002,022,919) 8,120,949,360
Exposure at end of year P=182,788,470,469 P=2,660,689,690 P=146,604,845 P=185,595,765,004
ProvisionsExposure at beginning of year P=522,949,780 P=308,232,125 P=– P=831,181,905New exposures 181,609,089 – – 181,609,089Transfers to Stage 1 508,647,214 (508,647,214) – –Transfers to Stage 2 (87,551,710) 87,551,710 – –Movements in unused credit lines (59,313,524) 68,478,643 – 9,165,119Impact on year-end ECL of exposures
transferred during the year (476,722,167) 370,441,666 – (106,280,501)
Exposure at end of year P=589,618,682 P=326,056,930 P=– P=915,675,612
Various suits and claims by the Company against cardholders, and vice-versa remain unsettled as ofDecember 31, 2019 and 2018. The estimates of the probable cost for the resolution of claims havebeen developed in consultation with the aid of the outside legal counsel handling the Company’s

- 76 -
*SGVFS038854*
defense in these matters and are based upon analysis of potential results. Management does notbelieve that the outcome of these matters will affect the results of operations. It is probable, however,that future results of operations could be materially affected by changes in the estimates or in theeffectiveness of the strategies relating to these proceedings.
24. Standards Issued but Not Yet Effective
Pronouncements issued but not yet effective are listed below. The Company intends to adopt thefollowing pronouncements when they become effective. The adoption of these pronouncements isnot expected to have a significant impact on the Company’s financial statements unless otherwiseindicated.
Effective beginning on or after January 1, 2020
· Amendments to PFRS 3, Definition of a Business
· Amendments to PAS 1, Presentation of Financial Statements, and PAS 8, Accounting Policies,
Changes in Accounting Estimates and Errors; Definition of Material
Effective beginning on or after January 1, 2021
· PFRS 17, Insurance Contracts
Deferred Effectivity
· Amendments to PFRS 10, Consolidated Financial Statements and PAS 28, Sale or Contributionof Assets between an Investor and its Associate or Joint Venture
25. Subsequent Event
Merger with MetrobankOn January 3, 2020, the Certificate of Merger was issued by SEC to the Company. This representsthe approval of the plan of merger, which was unanimously approved by the respective BOD andratified by the respective stockholders of the Company and Metrobank, last March 2019. Subsequentto the effective date of merger, all liabilities, transactions, and obligations of the Company shall betransferred to and become liabilities and obligations of Metrobank.
26. Approval of Release of Financial Statements
The accompanying comparative financial statements of the Company were authorized and approvedfor issuance by the BOD on February 19, 2020.

- 77 -
*SGVFS038854*
27. Notes to the Statements of Cash Flows
The changes in liabilities arising from financing activities in 2019 and 2018 are as follows:
January 1, 2019 Cash flows
Non-cash changes
December 31, 2019Amortization
Foreign
exchange
movement/
Acquisition
Notes payable P=31,317,426,067 (P=8,385,876,000) P=124,622,153 (P=372,687,929) P=22,683,484,291
Subordinated debt 1,164,611,135 – 1,089,942 – 1,165,701,077
Lease liabilities 73,105,988 (28,781,973) 4,291,929 6,871,022 55,486,966
January 1, 2018 Cash flows
Non-cash Changes
December 31, 2018Amortization
Foreignexchange
movement
Notes payable P=20,774,613,897 P=10,594,846,461 P=7,534,200 (P=59,568,491) P=31,317,426,067Subordinated debt 1,163,519,811 – 1,091,324 – 1,164,611,135
28. Supplementary Information Required Under Revenue Regulations 15-2010
In 2019, the Company reported and/or paid the following taxes which are included under ‘Taxes,duties and license fees’ in the statement of income:
GRT P=1,069,769,980DST 335,295,784Local taxes 33,062,124Fringe benefit tax 19,728,456License fee 9,902,750Others 85,139,931
P=1,552,899,025
Withholding TaxesAs of December 31, 2019, total remittances and balance of withholding taxes are as follows:
Total Remittances Balance
Expanded withholding tax P=634,616,346 P=79,143,216Withholding tax on compensation and benefits 210,384,171 11,115,935Withholding value-added tax 4,559,429 290,059Final withholding tax 284,345,875 91,262,884
P=1,133,905,821 P=181,812,094

The core of Metrobank Card Corporation relies on passion, purpose, collaboration, and customer-centric efforts. These traits, guided by our mission, vision, and values, have helped shape us into the industry-leading organization that we are today.