Synergies and competition in bioenergy systems
104
IEA Bioenergy: T41(1): 2008:01 SYNERGIES AND COMPETITION IN BIOENERGY SYSTEMS IEA Bioenergy Task 41, Project 1: Project Leader: Dr Sven-Olov Ericson, Sweden Operating Agent: Dr Bjorn Telenius, Sweden The final report from the above project consists of three separate components, viz. • ‘Summary and Conclusions’ by Sven-Olov Ericson, Project Leader • ‘Identifying Synergies and Competition in Forest-based Bioenergy in Selected Countries’ by Bengt Nippe Hylander, ÅF-Process, Sweden; and Sten Nilsson, International Institute for Applied Systems Analysis, Austria • ‘Bioenergy – Competition and Synergies: Agricultural Sector’ by Daniela Thrän and Thilo Seidenberger, Institut für Energetik und Umwelt gGmbH; and Jürgen Zeddies, Universität Hohenheim, Germany
-
Upload
alois-clemens -
Category
Documents
-
view
218 -
download
1
description
bioenergie and competition
Transcript of Synergies and competition in bioenergy systems
IEA Bioenergy: T41(1): 2008:01
SYNERGIES AND COMPETITION IN
BIOENERGY SYSTEMS
IEA Bioenergy Task 41, Project 1: Project Leader: Dr Sven-Olov Ericson, Sweden Operating Agent: Dr Bjorn Telenius, Sweden
The final report from the above project consists of three separate components, viz.
• ‘Summary and Conclusions’ by Sven-Olov Ericson, Project Leader • ‘Identifying Synergies and Competition in Forest-based Bioenergy
in Selected Countries’ by Bengt Nippe Hylander, ÅF-Process, Sweden; and Sten Nilsson, International Institute for Applied Systems Analysis, Austria
• ‘Bioenergy – Competition and Synergies: Agricultural Sector’ by
Daniela Thrän and Thilo Seidenberger, Institut für Energetik und Umwelt gGmbH; and Jürgen Zeddies, Universität Hohenheim, Germany
Page 1
SYNERGIES AND COMPETITION IN BIOENERGY SYSTEMS
Summary and Conclusions
Sven-Olov Ericson, Project Leader, IEA Bioenergy INTRODUCTION The use of renewable energy sources in general, and bioenergy in particular, is rapidly expanding in response to the ambitions of governments around the world to meet environmental and energy security objectives. Among the various renewable energy sources, bioenergy provides the most diverse group of technologies, offering a range of options in different conditions. The potential negative effects of the expansion of bioenergy are frequently discussed, especially competition for feedstock or production resources, such as land or water. However, much less attention has been given to the synergies which may exist with other production alternatives. To consider these issues more fully, Task 41 contracted two independent groups to analyse the synergies and competition between bioenergy in the agriculture and forestry sectors. The work related to the forestry sector was contracted to ÅF-Process (Dr Bengt Nippe Hylander, Sweden, and Professor Sten Nilsson, Forestry Program, International Institute for Applied Systems Analysis in Austria). The agriculture sector was considered by The Institut für Energetik und Umwelt with assistance from Professor J Zeddies, Universität Hohenheim, Germany. The participants of Task 41, Project 1 greatly appreciate the efforts of these two groups of experts. The reports of this work, which represent the opinion of the authors, are included with this final report. This summary report represents the considered views of the Task participants on these issues, informed by the contractors work. BIOENERGY - GENERAL CONSIDERATIONS Most renewable energies generate one or two specific energy carriers from one particular source. Hydro, wind, and solar PV generate electricity, while solar thermal can provide either electricity or heating and cooling. The situation for bioenergy is more complex. Bioenergy concerns not just one energy technology, but a matrix of processes converting a multitude of biological raw materials for heating and or cooling, or for the production of electricity or various fuels for the transportation sector. Bioenergy systems also use the same types of biomass traditionally used for food, fodder, and raw material for industrial processes. Questions have been raised about the economic viability of using these materials for energy purposes rather than for these conventional uses. Nevertheless it should be noted that bioenergy is the largest and most rapidly growing renewable energy source. Bioenergy covers the whole spectrum of applications from economically competitive and mature technologies (such as heat production from industrial by-products in forest industries) through to higher cost and less technically mature options (such as farm scale electricity production in gas engines using biogas from dedicated energy crops). Such
Page 2
diverse systems operate under very different conditions and interact with completely different sectors. Not only do feedstocks, conversion technologies and end-uses differ, but so too do the policy drivers and the incentives which create the conditions under which they can develop and commercialise. At present, most bioenergy used in the world is for traditional local use, outside the market economy. A significant fraction of this does not fulfil basic sustainability criteria. The local wood resource can be over exploited and so detrimental to soil preservation, water management, and biodiversity. Small-scale combustion is also often poorly controlled, leading to toxic components in the smoke which are detrimental to health. At present there is widespread discussion about sustainability criteria for bioenergy with many organisations actively working in the field. However this work covers only a few selected aspects of possible synergies between bioenergy and sustainability. Biofuels can be categorised according to the origin of the feedstock – from agriculture, forestry or from waste sources. From a global energy perspective, the use of woody based (lingo-cellulosic) bioenergy currently by far exceeds that from both agricultural and waste based sources. The future potential is also likely to come primarily from lignocellulosic materials, including by-products like bagasse and straw from the agricultural system. In countries where bioenergy plays a substantial role in the energy system, production is usually based on forestry feedstocks, with energy supply from these sources well integrated with the production of other forestry products. Compared to forestry, agriculture is generally much more labour and capital intensive. Therefore high value products such as food or fodder are generally required to cover the production costs associated with the relatively high intensity system. In developed countries, conventional agricultural crops are usually too expensive to be profitable for the energy market. Production of bioenergy from these sources has been supported by various policy incentives. The rationale for providing this support is often purported to be to ensure security of supply and to provide environmental benefits. However, often the main reason is to support agricultural and rural development policy objectives. The situation is completely different in countries like Brazil where climatic and socio-economic conditions are such that a profitable bioenergy industry has developed, providing a positive example for countries with similar conditions. CHANGING CONDITIONS The context which influences the synergies and competition between bioenergy and other systems is currently undergoing rapid change. In particular there are increasing demands for feedstocks (both liquid and solid) for conventional uses, and the price of transportation fuels and food products have both been rising rapidly. The basic drivers for a political push for more bioenergy in the EU are climate policy and ambitions to guarantee a secure supply of energy services. This is illustrated by the EU Biofuels directive which is demanding 5.75 % of biofuel in transport fuels by 2010. The directive on renewable energy currently being negotiated includes a binding burden sharing corresponding to a three fold increase in renewable energy services by 2020. Within agricultural policy the long term objective is to reduce agricultural subsidies. Agricultural production in Europe is in a transition from a regulated to a market oriented regime. Traditionally farmers were assured of a price within a narrow band. The price was not allowed to increase in response to shortages in supply, nor to fall in situations when production far exceeded demand. The farmers gave up the option of taking the full benefit from times when world market prices were high so as to avoid having to suffer the full effect of plummeting world market
Page 3
prices. This system was seen as very detrimental for less affluent countries as surplus agricultural products flooded the world market, so making local production less economically viable. This transition of agriculture into a market oriented regime, along with policies designed to rapidly increase the use of bioenergy, may have a major impact on conditions for the production of transportation fuels from conventional annual crops. Increasing demand and rising prices for transportation fuels have stimulated interest in new production capacity, particularly in developing countries. The detailed design of policy measures can lead to situations where the demand for food crops for biofuel production contributes to escalating prices, in situations where supplies are short. Such developments are intolerable when 15 – 20% of the world population is so poor that they cannot cope with grain price volatility and in particular the high grain prices which prevail when supply is short. However a balanced volume of biofuel production from agricultural food crops can complement food production. For example ethanol can be produced from any quality of grain including material from harvests severely damaged by wet conditions. Thus biofuels can actually provide stability to the grain markets, providing market outlets for low quality harvests which occur occasionally. Studies illustrate that competition between food and fuel most often causes problems when changes occur but are not handled well by market actors and policy makers. In particular the introduction of a wide range of policy measures designed to stimulate the rapid development of bioenergy may lead to rapid changes in the volumes and types of biomass which are required, or in the energy products which are in demand. After this initial transition phase, market actors able to adapt to the new conditions can take advantage of the new opportunities and synergies with conventional production. An increased use of biomass for energy purposes also means that more and more biomass is internationally traded, in a similar way to fossil fuels. This development is highly advantageous and a prerequisite for the expansion of bioenergy. However, as the volumes of biomass for energy being traded internationally grow, so the impact on the trade of other products also increases, with increased scope for both synergy and competition. FORESTRY SYSTEMS Forest based bioenergy systems are the best developed, and in most countries are also the least dependent on subsidies. Consequently the woody biomass sector provides the most obvious examples of both synergies and competition. Heat and electricity production in the forestry industry is a good example of strong synergy. Forest by-products and residues have low alternative values and are utilised profitably for energy purposes, able to take advantage of logistical advantages and a stable demand for heat. Up to now this interaction has been almost entirely beneficial for both sectors, even in countries with the highest utilisation of forest biomass for energy. In the Nordic countries the early establishment of an efficient market for solid biofuels resulted in an unexpected decrease in the biofuel price which lasted for more than a decade, despite a steady increase in demand for biofuels. Only when demand reached very high levels did the price move up. Substantial quantities of cheap feedstock can be readily mobilised once an efficient market is established. Globally there are still substantial quantities of un-used forest biomass, but in some countries with the most intensive bioenergy utilisation, the price of biofuels has only now reached the level at which the first signs of competition can be seen.
Page 4
Generally these beneficial synergies are most pronounced in countries with a demand for renewable energy, driven by policy incentives, and with a strong value adding industry, able to absorb significant volumes of wood. Some organisations representing the forest industry have warned governments about the negative effects of policy instruments which increase the demand for biofuels on their industry. These warnings seem heavily exaggerated and are not based on experiences from countries with the most intensive forest bioenergy sectors. Policy instruments which create value for forest residues and by-products have little impact on the availability of raw material for timber or pulp. The ÅF-Process study stresses how important it is that the forestry and timber industries, along with the pulp and paper industries, develop visions and coherent strategies with respect to bioenergy. Too frequently the industry has adopted reactive or defensive attitudes to economic policy instruments designed to stimulate increased bioenergy. The early movers in the industry have demonstrated the viability of a proactive approach. Some companies have grasped the new opportunities and are marketing bioenergy products (electricity, heating, solid biofuels, liquid biofuels, and chemical products which provide substitutes for petrochemicals). These are produced within their industry from what could traditionally have been wastes (for example, bark which may have been landfilled) or a residue with little or no economic value. In some countries, the forest industry has major difficulties in buying raw material at a competitive price. However these problems are not often caused by bioenergy but by other factors. In many countries with a well developed bioenergy and forest industry sector, green electricity and forest by-products contribute substantially to the profitability of these industries. The various forest industry sectors are affected differently by competition and synergies with bioenergy. Chemical pulping is the obvious winner. This industry can take advantage of many synergies and already some companies are generating some 30% of their net profits from bioenergy. In chemical pulping the fibres of the pulp wood are separated from the rest of the wood. When bark and logging residues are included, more than 50% of any tree is available for upgrading, for example to bioenergy products. Sawmills are also prime winners. Timber is traded at a price which is normally not much affected by any market for solid biofuels. Bioenergy policies lead to an increased market value for bark, wood chips and sawdust (and the possibility to upgrade this residue to pellets). In contrast, mechanical pulping is disadvantaged. In these processes, the fibres are not separated, but lignin and fibres form the pulp/paper. The amount of available bio-residues is therefore much less. These processes are also very energy intensive, particularly as far as electrical energy is concerned, using some 2 kWh electricity per kg of wood and so suffer from the effect of the European Emissions Trading Scheme on electricity price. The ÅF-Process study demonstrates that potential competition is not only influenced by the natural maximum growth rates and yield. Considering the long lead times in forestry, the scope for competition and imbalance between supply and demand is determined by many factors including: traditions, political interventions, the existing legal system related to forest management, and by forestry infrastructure. The beneficial development of solid biofuel markets in Sweden has benefited from more than 100 years of modern forest legislation mandating active sustainable forestry, so promoting growth and yield increases, and developing an effective road infrastructure. The report presents an analysis of differences between the countries which have been studied, and concludes that the near term possibilities of developing bioenergy systems
Page 5
without competition are country specific and determined by policies, traditions and the legal and industrial infrastructure. AGRICULTURAL SYSTEMS Agricultural bioenergy systems have been dominated by conventional food products used for the production of transportation fuels. Energy crops for production of heat and electricity (short rotation coppice, energy grasses etc) have been part of the long term energy research, primarily in Europe. However commercial cultivation is still insignificant compared to the use of food crops for fuel production. Large-scale harvesting of straw as a by-product of grain cultivation for energy purposes has been developed, particularly in Denmark, where some projects involve large-scale use of straw as a fuel for base load power plants. The strategy of using agriculture as a source of biomass for large-scale production of fuels has been developed in a situation where agricultural commodities have been available in surplus at prices which do not cover their cultivation costs. Where countries and regions have strongly supported agricultural biofuels, the main policy drivers have often been agricultural considerations and rural economic development ambitions. In recent years these policies have also been justified by security of energy supply objectives. The production and use of biofuels as a way to reduce green house gas emissions is primarily a European strategy. There is a substantial potential area of land which is, theoretically, immediately available for cultivation of biomass for energy. This surplus area of agricultural land is partly set-aside and is partly used for extensive agriculture. The growing world population, coupled to economic growth, which results in an increase in per capita consumption, has recently resulted in an annual growth in demand for food of 1% per year. This increase in demand has not been met by production increases, since the worldwide growth in yield over the last 15 years has only reached 0.5% per year. This trend has resulted in a fairly insecure supply situation. The severity of this situation was dramatically demonstrated this year when drought in major production areas led to a shortages, resulting in marked and unanticipated price rises for most agricultural commodities. The extent to which the use of grain and vegetable oils for energy purposes contributed to this ‘explosion’ of market price has been widely debated. No exact answer can be given but Task 41 believes that it is most reasonable to conclude that biofuel policies have played a very minor role. Tentatively 10% of the price increase might be attributable to biofuel production. The impact on corn in Mid West USA was probably higher, but there was hardly any contribution from biofuels to the increase in rice price. In fact the price of rice showed an even more dramatic increase than the price of wheat or corn. Rice is not used as a raw material for fuel, and no fuel raw material is cultivated on land used for rice production, so reinforcing the conclusion that biofuels have not been a major contributor to prices rises. In 2006 the harvest from 25 million hectares, (3% of the total acreage used for cultivation of grain and oil seed) was used in fuel production. Allowing for the fact that both grain and oil seed, when used in fuel production, supply a significant amount of protein fodder it is hard to imagine any major impact on grain price. However this situation where there is full utilisation of DDGS and rape cake is limited by the potential market for these products. For industrial countries this limit corresponds to the production of just a few percentage points of the energy
Page 6
used in transportation. It would therefore not be possible to replace a significant fraction of the present demand for fuel under these favourable conditions. One aspect not discussed in depth is the analysis of the market price volatility and how this relates on the one hand to activities on the futures market, and on the other hand to the conditions for the growing number of urban poor. It seems possible that the recent dramatic increase in speculative positions on the agricultural grain commodity markets have contributed to the acute rise in prices even more than the demand from biofuel production. One conclusion that can be drawn from last year experience is that in the present situation, global food supply needs more security. Peaks in prices are unacceptable when there are roughly one billion very poor people. The challenge is to design policies which lead to a gradual increase of biofuel use while at the same time meeting demand for food. The fine detail of the design of renewable fuel regulations can be important in the interaction between the food and fuel markets. For example, if policies include a banking or trading mechanism, and quantitative obligations with a buy-out price, then the fuel market could secure agricultural raw material at low prices in years with good harvest, and so avoid contributing to price peaks following bad harvests. Another potential benefit from carefully designed regulations is that the quality criteria for grain for ethanol production are slightly different from those for the food or fodder market. Grain of low quality can be used as a raw material for fuel production to the benefit of all parties involved. If current trends continue, with an annual increase in population and an increase of almost 1% in per capita consumption, then the present reserve of agricultural land will be used entirely for the production of food stuffs by 2020. Bioenergy produced from agriculture can lead to competition for limited resources such as land and water. Conditions have changed rapidly over the last few years, from a situation in which there was a costly oversupply of agricultural products and low product prices, to a position where food prices are high and there are potential shortages. The Institut für Energetik und Umwelt study on agriculture and bioenergy was finalised a few months before the prices of grain and plant oils peaked earlier this year. However the report still presents the underlying facts and mechanisms and in no way contradicts the later development of commodity prices and the relevant explanations. . So in the longer term, a significant expansion of dedicated agricultural energy crops will be dependent on increased production intensity and higher yields and on the expansion of the proportion of productive land in active cultivation. Theoretically this is perfectly possible. However such a development will have to compete with ambitions to develop agriculture with higher levels of sustainability as far as water and soil management are concerned. Large areas of potentially productive agricultural land might also need to be conserved in order to meet rapidly developing objectives to preserve biodiversity. The combined effect seems likely to lead to competition for limited areas of productive agricultural land, should biofuel production be developed beyond the political quantitative targets which have already been announced. An important issue which restricts the scope for synergy between the biofuels and agricultural sectors is the lack of a mature supply chain through which new agricultural herbaceous fuels can be more easily introduced into existing energy systems. Woody species such as willow or poplar from short rotation forestry provide an exception, since they can easily be introduced into existing fuel markets.
Page 7
CONCLUSIONS Synergies between the bioenergy sector and other related sectors have been vital in most countries and regions which have developed successful bioenergy industries. When compared to alternative uses for biomass feedstocks, bioenergy is a relatively low value product which requires feedstocks produced in low cost production systems. The most successful synergies have developed where there are high value-adding systems closely linked to a bioenergy end-use sector, such as the forest industry. So far there are few examples of serious competition for feedstock between energy and other sectors, even in countries with the most intensive utilisation of bioenergy. The impact of bioenergy on global forest products and on food prices has been limited. It is the opinion of IEA Bioenergy Task 41 that substantial additional volumes of low cost feedstock for energy purposes can be made available globally without adverse effects on the forest industry. In a few countries, such as Sweden, where large quantities of raw material are already utilised for energy, the potential for additional utilisation of traditional energy fractions of the tree may be limited. However, silviculture and harvest practices have not yet changed much in response to the increasing price and demand for bioenergy feedstock. It also seems likely that in countries such as Sweden there is potential for changes in silviculture and harvest methods which could lead both to higher total forest production and new feedstock assortments. The global need for food and fodder is likely to continue to increase, and this will probably lead to higher production in response to normal market mechanisms. However, the same increases may apply to liquid biofuels produced from agricultural land. Where, and to what extent, increasing competition for land or water may impact on the availability of food for the developing world is difficult to say. It may be good to remember that until recently the price of food was low and falling in real terms for a long time. Many developed countries had a costly overproduction from a subsidised agriculture, thus generating surplus which was exported at prices which did not cover production costs. This was very detrimental to agriculture in many developing countries, since they faced unfair competition. In many countries the artificially low world market prices meant that neither yield increases nor potential increases in area could be exploited fully. At the same time not enough food reached the needs of the poor in developing countries. In the bioenergy debate, there is a tendency for the discussion to become too theoretical, focusing on the analysis of the conditions and effects that may apply when bioenergy gets close to its physical potential. The situation is very far from that today. Bioenergy is by far the largest renewable energy source. A sustainable increase in the use of bioenergy, even when far below its theoretical physical potential, will still make a contribution which far exceeds other renewables in the near and midterm. It is therefore more relevant to debate the opportunities and effects of further incremental steps from today’s level. Given today’s level of feedstock production for energy purposes it seems logical to conclude that increasing demand for fuel opens positive opportunities for many developing countries to develop an industrial biofuel capacity. Realising this possibility in a sustainable way is a challenge. Sustainability criteria, including voluntary certification schemes, are being developed, advocated, and promoted by many relevant stakeholders. These schemes illustrate the necessity for sustainable development in society as a whole if sustainable production of biomass for export is to be possible. Bioenergy therefore has an important potential role as a catalyst for the
Page 8
necessary sustainable development (environmental, economical, and social) in developing countries which are potentially big suppliers of bioenergy. In all countries, ambitious utilisation of all waste streams involving biomass can offer important niche solutions. For example it is possible to digest sludge from almost every sewage system, including many industrial systems, thus generating biogas. This production of biogas can be used for many different purposes. If used for transportation it can generate 1-2 % of the energy needs for transportation in an industrial country. The development of the technology for the so-called ‘second generation’ liquid biofuels is vital. This group of technologies will enable production of transport fuels from a whole range of raw materials, instead of restricting the feedstock to high value food products. An important aspect of these technologies is that they often are able to utilise and develop the same type of synergies which for example currently exist between the forest industry and CHP-production. Furthermore, it should be possible to integrate both agricultural and forestry products in a biorefinery. Heat plays a major role in many bioenergy applications where synergies have been successfully utilised. Although normally the lowest valued product in a cascade, often the commercial demand for heat limits production of higher value energy products. Hence industrial process integration, linking heat-demanding and heat-producing processes is often crucial for the profitability of the production of bioenergy based electricity, transport fuels or pellets. The importance of heat demand for bioenergy technologies may be somewhat overlooked in the debate on technology choice or R&D priorities. While many countries acknowledge the need for the development of the various technical components it is less common to find R&D strategies which build on the value of utilising heat demand to optimise values and efficiency. Energy production from waste materials is another example where synergies with other policy areas have been essential to the development seen in many countries. Municipal solid waste and other types of waste materials have few competing commercial uses. Although utilised in large quantities as fuel, development so far has been restricted to countries with strong policy incentives aimed at preventing the disposal of waste in landfills. Waste materials are particularly valuable as fuel in densely populated areas where the options for local feedstock production are limited. Although there is no competition for the feedstock itself, the use of waste material may be restricted by limitations in heat demand. Because of its fuel properties, municipal solid waste is technically difficult to utilise with the same efficiency in electricity production as conventional wood fuels. If wastes are used to supply heat and power, at the same time replacing biomass based systems, then careful consideration must be given to ensure optimal efficiency in the use of the materials. Bioenergy provides a diverse group of technologies, offering a range of options in different conditions which can contribute to energy, environment, and rural development goals. The potential negative effects of the expansion of bioenergy such as potential for competition for feedstock or production resources, such as land or water, must be carefully considered. However, there are also situations where bioenergy options have strong synergies with existing systems for producing forestry and food products and for managing wastes. These situations provide immediate opportunities to produce energy sustainably and should lead to a continuing rapid growth in the contribution from bioenergy.
Report 1 (22)
ÅF-Process Fleminggatan 7, PO Box 8309, SE-104 20 Stockholm, Sweden. Phone +46 10 505 00 00. Fax +46 8 651 53 22. www.afconsult.com VAT No SE556101738401. Registered office Stockholm. U-Rapport GE.dot -9
Unr
: Err
or!
Unk
now
n do
cum
ent
prop
erty
nam
e.
Upp
drag
snam
n: E
rror
! Unk
now
n do
cum
ent p
rope
rty
nam
e.
Ver
sion
: Err
or! U
nkno
wn
docu
men
t pro
pert
y na
me.
S
kapa
t dat
um: E
rror
! U
nkno
wn
docu
men
t pr
oper
ty n
ame.
D
okum
ent i
d: E
rror
! U
nkno
wn
docu
men
t pr
oper
ty n
ame.
S
para
t dat
um: 2
009-
03-0
2
Please refer to
Bengt Nippe Hylander Date
23 April 2008 Order No
xxxxxx Phone +46 (0)10 5051194 Mobile +46 70 5936392 Fax +46 (0)10 505 2757 [email protected]
Att Sven-Olov Ericson Näringsdepartementet
Final Draft
IEA Bioenergy Task 41
Identifying Synergies and Competitions in forest based Bioenergy in Selected Countries Bengt Nippe Hylander Professor Sten Nilsson Technical Director Deputy Director, and ÅF-PROCESS Leader, Forestry Program Stockholm International Institute for Applied Sweden Systems Analysis Laxenburg Austria
Report 2 (22) April 23, 2008
U-Rapport GE.dot -9
Unr
: Err
or!
Unk
now
n do
cum
ent
prop
erty
nam
e.
Upp
drag
snam
n: E
rror
! Unk
now
n do
cum
ent p
rope
rty
nam
e.
Ver
sion
: Err
or! U
nkno
wn
docu
men
t pro
pert
y na
me.
S
kapa
t dat
um: E
rror
! U
nkno
wn
docu
men
t pr
oper
ty n
ame.
D
okum
ent i
d: E
rror
! U
nkno
wn
docu
men
t pr
oper
ty n
ame.
S
para
t dat
um: 2
009-
03-0
2
Table of Contents
1 Summary 3
2 General Challenges and Conflicts 6
3 The Nordic Case history - and some examples 8
4 Germany 14
5 The UK 17
6 The US 19
7 Issues Hindering Development of the Wood Fuel Sector 21
Report 3 (22) April 23, 2008
U-Rapport GE.dot -9
Unr
: Err
or!
Unk
now
n do
cum
ent
prop
erty
nam
e.
Upp
drag
snam
n: E
rror
! Unk
now
n do
cum
ent p
rope
rty
nam
e.
Ver
sion
: Err
or! U
nkno
wn
docu
men
t pro
pert
y na
me.
S
kapa
t dat
um: E
rror
! U
nkno
wn
docu
men
t pr
oper
ty n
ame.
D
okum
ent i
d: E
rror
! U
nkno
wn
docu
men
t pr
oper
ty n
ame.
S
para
t dat
um: 2
009-
03-0
2
Summary
The increasing ambitions to substitute more fossil fuels with bioenergies put strong challenges for the forest industries since this opens up for considerable synergies but also considerable competitive threats. The situation today as well as the potential evolvement however look quite different in different countries depending on a number of underlying country specific conditions and factors like the structure of the forest industry, the forest ownership, the silvicultural and harvesting practices, the energy consumption structure and national policies&incentive systems for bioenergy use (district heating, heat&power, waste recovery, green certificates, promotion of green automotive fuels etc). The Nordic case – synergies now turning into conflicts? The Nordic countries may illustrate several of the synergy opportunities as well as conflicts that may confront other countries since systematic stimulation of bioenergy use was initiated already following the first oil crisis in the 70´s. Introduction of a range of economic instruments stimulated energy efficiency measures, utilisation of surplus heat by large expansions of district heating and tax exemptions for bioenergy use for heating – for industry as well as public utilities. During the first phases the feared competitive conflicts did not really occur – instead improved efficiencies and synergies (“win-win”) between players dominated. In fact, the increased demand led to a somewhat non-expected outcome for most players - the gradual establishment of an efficient market place for bioenergies led to steadily decreasing bioenergy prices for more than a decade despite the continuous and substantial demand increase. During the last 3-4 years prices have however risen rapidly (almost 50%) up to a level (today16-20 EUR/MWh for forest residues free delivered) so that non-marginal quantities of pulpwood is now being diverted for heating purposes which greatly worries the pulp&paper industry facing tough competition from quickly expanding low cost planted eucalyptus pulp mills in the Southern hemisphere. During the last few years we have witnessed a strong increase in both demand and prices also all over the rest of Europe. The cheapest bioenergy sources (recycled wooden products and other waste products) are already largely utilized. This has put many countries in a new situation about how to better utilise the forests. This poses new challenges which are however quite different in different countries.
Report 4 (22) April 23, 2008
U-Rapport GE.dot -9
Unr
: Err
or!
Unk
now
n do
cum
ent
prop
erty
nam
e.
Upp
drag
snam
n: E
rror
! Unk
now
n do
cum
ent p
rope
rty
nam
e.
Ver
sion
: Err
or! U
nkno
wn
docu
men
t pro
pert
y na
me.
S
kapa
t dat
um: E
rror
! U
nkno
wn
docu
men
t pr
oper
ty n
ame.
D
okum
ent i
d: E
rror
! U
nkno
wn
docu
men
t pr
oper
ty n
ame.
S
para
t dat
um: 2
009-
03-0
2
Germany – other industries driving? Characteristic for Germany compared the Nordic countries is: -higher wood prices due to smaller wood lots, small scale harvesting and a very explicit nature conservationist opinion - a substantial unutilised forest and forest residue potential – and in a longer perspective - energy crop and alternative land use potential - a relatively weaker pulp&paper industry but - a strong chemical, refinery and auto industry interested in “green fuel” (in particular bio-diesel) from lingo-cellulose. Thus compared to the Nordic countries, in Germany the chemical industry may be more important as a driver to develop the biorefineries. That may lead to more of conflicts and less of synergies, although also the pulp&paper industry very well can and probably will have to become an involved partner. The UK – a forest sector lacking commercial drive? -The forest sector is a sector without strong commercial drive. Only 39% of the annual increment is harvested. - Of the ~9 M “green tonnes”harvested only 0,35 is wood fuel, so biomass for energy has so far played a small role. - Commercial forestry means Scotland with a bit of North East England and North Wales. The principal forest owner, The Forestry Commission (50%) has chosen to support small saw and panel mills with low prices, thereby squeezing private forest owners. - In the absence of strong, high value added industry “bioenergy” can easily step in and competitively take volumes. There are five power stations in the planning with capacities for 1.5 million green tonnes. A strong incentive is the ROC´s (Renewable Obligation Certificates) today giving large subsidies for electricity generation (£ 45/MWh). - This is expected to cause serious competition/conflicts in the market. Environmental constraints on commercial forest production accentuate this competition. North America – historically low prices on wood and fossil fuels! The US differs from Europe in a number of different respects, in particular lower wood costs and cheap energy due to small or no fossil taxes. Wood bioenergy has hitherto been of little importance (except for industrial residues or by-products) with little or no direct harvesting of forest residues. The last few years has led to strong strategic initiatives in alternatives to oil – in particular for the most vulnerable area transportation fuels, where the first immediate actions have been massive programs for ethanol from corn (complemented by new programs for R&D into ethanol from wood).
Report 5 (22) April 23, 2008
U-Rapport GE.dot -9
Unr
: Err
or!
Unk
now
n do
cum
ent
prop
erty
nam
e.
Upp
drag
snam
n: E
rror
! Unk
now
n do
cum
ent p
rope
rty
nam
e.
Ver
sion
: Err
or! U
nkno
wn
docu
men
t pro
pert
y na
me.
S
kapa
t dat
um: E
rror
! U
nkno
wn
docu
men
t pr
oper
ty n
ame.
D
okum
ent i
d: E
rror
! U
nkno
wn
docu
men
t pr
oper
ty n
ame.
S
para
t dat
um: 2
009-
03-0
2
Also the forest bio-fuel market is now starting to emerge on the West Coast with prices around $40-50/dry ton (~5 MWh/dry ton) for wood residues or saw dust, which is far below the much higher prices for forest residues in Sweden today (EUR 16-20/MWh). The potential conflict between industrial or energy uses is mostly seen as an interesting and important topic, but just beginning to emerge as an issue for study and analysis. The North American forest industry has lost much of the vitality of the 70´s and 80´s (in particular in the US South), peaking in volume approx 10 years ago, so many within the industry are now increasingly talking about the vision of bioenergy and biorefinery as a necessary “3rd leg” for both forestry and industry. So far little has been implemented but several new R&D-programs as well as commercial feasibility studies have been initiated. Comments on the joint European paper industry warning The risk that the EU targets may jeopardize the pulp&paper industry is strongly driven by CEPI (Confederation of European Paper Industries) having commissioned a study on the availability of wood in perspective of the EU 20/20/20 ambition. CEPI strongly warns that the high EU ambition would result in a 200-260 M m3 gap in wood resources, which will seriously hurt a higher value added industry. Therefore measures and policies have to be taken very cautiously in order not to severely damage the forest industry but it is also strongly underlined that the forest industry is one of the key “enablers” in meeting the renewables targets. The CEPI conclusions are by some critics seen as exaggerated: The analysis is seen as “static”. In response there will develop larger potential opportunities to “easen” the bioenergy over-demand due to:
- improved silvicultural and harvesting methods increasing both the growth and the economic utilisation of the available biomass potential
- increased energy efficiency in industry which is more than just marginal, thus leading to “freeing” of own bioenergy need,
- utilisation of surplus heat as well as other industrial residues (sludges etc)
- specific initiatives taken by individual Forest Products companies to develop the “Biorefinery concept” with high energy efficiency for multi-product production incl fuel pellets production but also new, 2nd generation automotive fuels
- a yet underutilised potential for increased fibre recycling or energy recovery of wood products (construction wood, furniture etc) in the order of 10 -20M m3
- a potential to utilise for paper production at least a part of the volumes today exported out of Europe (a price and relative cost issue), corresponding to some 10-20 Mm3.
Report 6 (22) April 23, 2008
U-Rapport GE.dot -9
Unr
: Err
or!
Unk
now
n do
cum
ent
prop
erty
nam
e.
Upp
drag
snam
n: E
rror
! Unk
now
n do
cum
ent p
rope
rty
nam
e.
Ver
sion
: Err
or! U
nkno
wn
docu
men
t pro
pert
y na
me.
S
kapa
t dat
um: E
rror
! U
nkno
wn
docu
men
t pr
oper
ty n
ame.
D
okum
ent i
d: E
rror
! U
nkno
wn
docu
men
t pr
oper
ty n
ame.
S
para
t dat
um: 2
009-
03-0
2
General Challenges and Conflicts
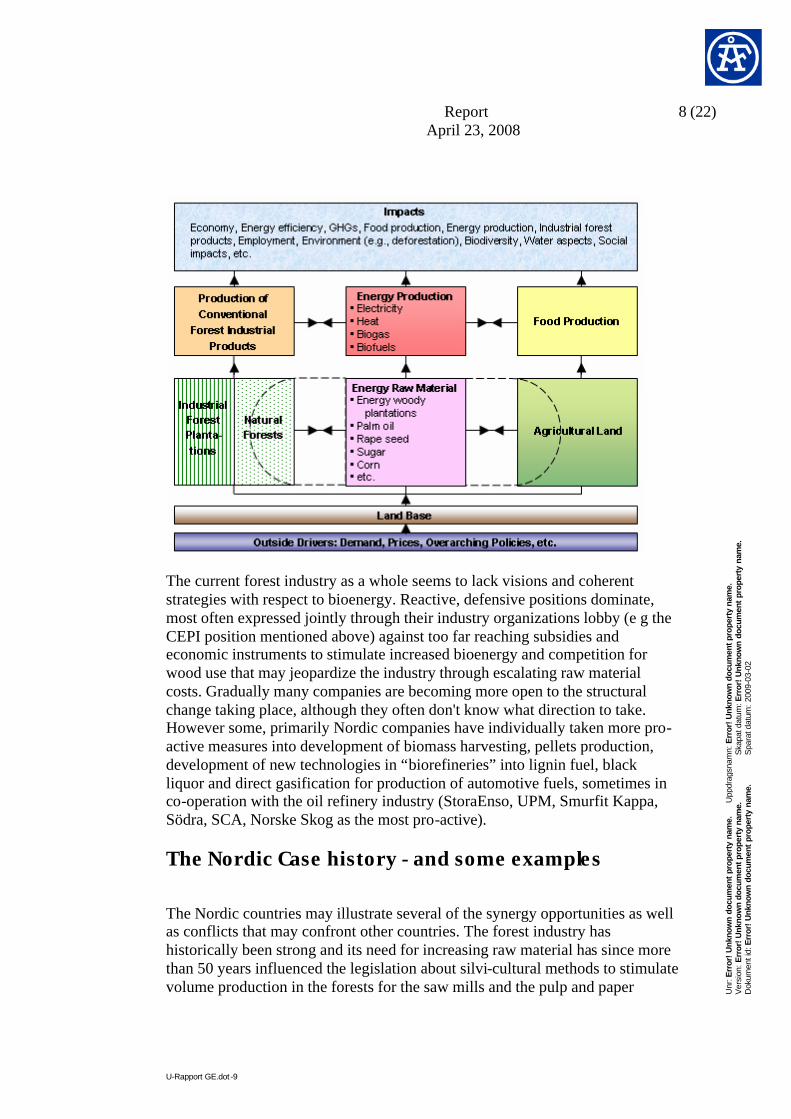
Challenges and Conflicts with Bioenergy There are a number of common facts on bioenergy that are coming through independent of which region you study. The biomass energy generation is rather inefficient. Technical solar energy conversion generates some 50 W/m2 (photovoltaics) in practice. Forest biomass energy generation is about 0.5 W/m2 in practice and agriculture biomass is about 0.35 W./m2. Therefore, an overall challenge is to increase the production of biomass per area unit and energy efficiency. This will also help solve some of the overall "conflicts" perceived in Europe, namely that there is not enough wood to satisfy all conflicting demands on wood and land for the increased biomass production. This leads to a conceptual view on how to look into bioenergy issues, which is common independent of the region studied (see attached Figure 1). This concept leads to a number of overall challenges:
• The bioenergy issue has to be considered from the standpoint of global-national-regional dynamics.
• Greater horisontal integration is required between food, forests and fuel (The 3 Fs).
• Rather than seeing the different sectors as antagonistic, their linkages should be stressed (in land use and in processes).
• A degree of intersectorial and territorial coordination is required. • Develop the competitiveness of the three sectors as one system. • Stronger links between rural and urban economics economies have to be
established. • A new set of intersectorial agents and instruments are required. • New institutions (in a broad sense) have to be established and a number
of old ones have to be replaced.
With respect to Europe, it can be concluded that the demand for wood is growing and competition between sectors is increasing with increased prices as a result. Therefore, it is strongly perceived that the base for wood supply has to be broadened and increased through more intensive use of existing forest resources, including:
• the use of wood assortments that are not currently used; • the use of uncollected forest-based and related and industry residues; • expansion of the harvested forest area;
Report 7 (22) April 23, 2008
U-Rapport GE.dot -9
Unr
: Err
or!
Unk
now
n do
cum
ent
prop
erty
nam
e.
Upp
drag
snam
n: E
rror
! Unk
now
n do
cum
ent p
rope
rty
nam
e.
Ver
sion
: Err
or! U
nkno
wn
docu
men
t pro
pert
y na
me.
S
kapa
t dat
um: E
rror
! U
nkno
wn
docu
men
t pr
oper
ty n
ame.
D
okum
ent i
d: E
rror
! U
nkno
wn
docu
men
t pr
oper
ty n
ame.
S
para
t dat
um: 2
009-
03-0
2
• the greater use of woody biomass from outside the forest; • the wider use of post-consumer recovered wood products; • the development of additional non-wood biomass for energy purposes; • the development of short-rotation, woody biomass crops on agricultural
land; • expansion of the forest area (changed land-use); • enhancements in the productivity of forest resources, including genetic
innovations.
It is not yet well known how much wood can be mobilized in Europe. This includes the dynamics of forest growth and harvesting, the accuracy of existing forest inventories, forest ownership structures (attitudes, goals and motivations), the likely size and structure of demand, lack of reliable information on all sources of woody biomass (biomass outside forests), wood from agricultural lands, etc. In the current supply situation in Europe, there are signs that there will be a strongly increased wood import of different assortments. There is a need to have equity in the treatment between imported and domestic wood in terms of regulatory, technical and other requirements, as well as between forest and agricultural products for the biomass-based energy market. The current situation presents, on the one hand, challenges in determining the way the factors mentioned above interact, but on the other hand, opportunities to find constructive "win-win" solutions for stakeholders in the three sectors involved (see Figure 1). In doing this, it is crucial to develop policies and strategies, which are holistic and inclusive, coordinated with frameworks for other sectors and address issues at the appropriate level. These policies and strategies should aim at high energy, emission and resource efficiency. All of this will require substantial investments in knowledge development. The bioenergy strategies have to especially take into consideration:
• Food vs energy; • Economic competitiveness; • Trade implications; • Sustainability issues; • Climate change.
Report 8 (22) April 23, 2008
U-Rapport GE.dot -9
Unr
: Err
or!
Unk
now
n do
cum
ent
prop
erty
nam
e.
Upp
drag
snam
n: E
rror
! Unk
now
n do
cum
ent p
rope
rty
nam
e.
Ver
sion
: Err
or! U
nkno
wn
docu
men
t pro
pert
y na
me.
S
kapa
t dat
um: E
rror
! U
nkno
wn
docu
men
t pr
oper
ty n
ame.
D
okum
ent i
d: E
rror
! U
nkno
wn
docu
men
t pr
oper
ty n
ame.
S
para
t dat
um: 2
009-
03-0
2
The current forest industry as a whole seems to lack visions and coherent strategies with respect to bioenergy. Reactive, defensive positions dominate, most often expressed jointly through their industry organizations lobby (e g the CEPI position mentioned above) against too far reaching subsidies and economic instruments to stimulate increased bioenergy and competition for wood use that may jeopardize the industry through escalating raw material costs. Gradually many companies are becoming more open to the structural change taking place, although they often don't know what direction to take. However some, primarily Nordic companies have individually taken more pro-active measures into development of biomass harvesting, pellets production, development of new technologies in “biorefineries” into lignin fuel, black liquor and direct gasification for production of automotive fuels, sometimes in co-operation with the oil refinery industry (StoraEnso, UPM, Smurfit Kappa, Södra, SCA, Norske Skog as the most pro-active).
The Nordic Case history - and some examples
The Nordic countries may illustrate several of the synergy opportunities as well as conflicts that may confront other countries. The forest industry has historically been strong and its need for increasing raw material has since more than 50 years influenced the legislation about silvi-cultural methods to stimulate volume production in the forests for the saw mills and the pulp and paper

Report 9 (22) April 23, 2008
U-Rapport GE.dot -9
Unr
: Err
or!
Unk
now
n do
cum
ent
prop
erty
nam
e.
Upp
drag
snam
n: E
rror
! Unk
now
n do
cum
ent p
rope
rty
nam
e.
Ver
sion
: Err
or! U
nkno
wn
docu
men
t pro
pert
y na
me.
S
kapa
t dat
um: E
rror
! U
nkno
wn
docu
men
t pr
oper
ty n
ame.
D
okum
ent i
d: E
rror
! U
nkno
wn
docu
men
t pr
oper
ty n
ame.
S
para
t dat
um: 2
009-
03-0
2
industry needs so that the standing forest stock now is now more than 50% higher than some 50 years ago with the present annual cuttings close to but still a little bit below the long term sustainable level. The intensified interest in forest bioenergy took off already following the first oil crisis in the 70´s. Introduction of economic instruments to minimise oil consumption stimulated energy efficiency measures, utilisation of surplus heat by large expansions of district heating and tax exemptions for bioenergy for heating – for industry as well as public utilities. Initially the strongly increased energy efficiency measures in industry did not make it necessary to intensify removals of forest residues until the early 90´s when several forest companies perceived forest residues as a potentially profitable “3rd leg” of the forestry operations. They started special bioenergy operations to systematically sell to the external bioenergy market, developing new modified harvesting methods and silvi-cultural operations incl studies of the need for ash recirculation for sustainability. Contrary to what most people believed the continued strong increase of demand did not lead to steadily increasing prices – instead the gradual establishment of an efficient market place for biofuels (not any longer only local and marginal) led to steadily decreasing bioenergy prices! Part of that was due to systematic import of cheap biofuels (primarily industrial and agricultural wastes from W Europe but also forest fuels from E Europe). During the last 3-4 years the interest and the demand have risen in most countries. Prices have risen rapidly up to such a level that non-marginal quantities of pulpwood are now being diverted for heating purposes. So far these volumes have been marginal but the increased prices of pulpwood (>30% within just a few years) greatly worry the pulp&paper industry facing tough competition from quickly expanding low cost planted eucalyptus pulp mills in the Southern hemisphere. In order to better understand how synergies may turn into conflicts and conflicts into synergies it may be worthwhile to discuss around how power has shifted over the years and how initiatives have been taken by some of the main active players. Historically the saw mills were the initiators of the forest industry with the pulp mills gradually following and growing up utilising the residues from the saw mills. With time the pulp&paper industry (often having been formed from saw mill companies through mergers and acquisitions) came to enjoy higher market growth and were also considerably more capital intensive with increasing scale economies. This lead to an “oligopoly” behaviour where the big pulp&paper companies (often also being large forest owners) had the power to negotiate relatively higher saw log prices and relatively lower pulp wood prices (for a long period the profitability of the saw mill industry has been much lower than that of the pulp&paper industry – also within the large forest industry groups). Until the advent of the oil crisis the pulp&paper industry was the “only” commercial user of wood residues and prices were “kept” low compared to oil
Report 10 (22) April 23, 2008
U-Rapport GE.dot -9
Unr
: Err
or!
Unk
now
n do
cum
ent
prop
erty
nam
e.
Upp
drag
snam
n: E
rror
! Unk
now
n do
cum
ent p
rope
rty
nam
e.
Ver
sion
: Err
or! U
nkno
wn
docu
men
t pro
pert
y na
me.
S
kapa
t dat
um: E
rror
! U
nkno
wn
docu
men
t pr
oper
ty n
ame.
D
okum
ent i
d: E
rror
! U
nkno
wn
docu
men
t pr
oper
ty n
ame.
S
para
t dat
um: 2
009-
03-0
2
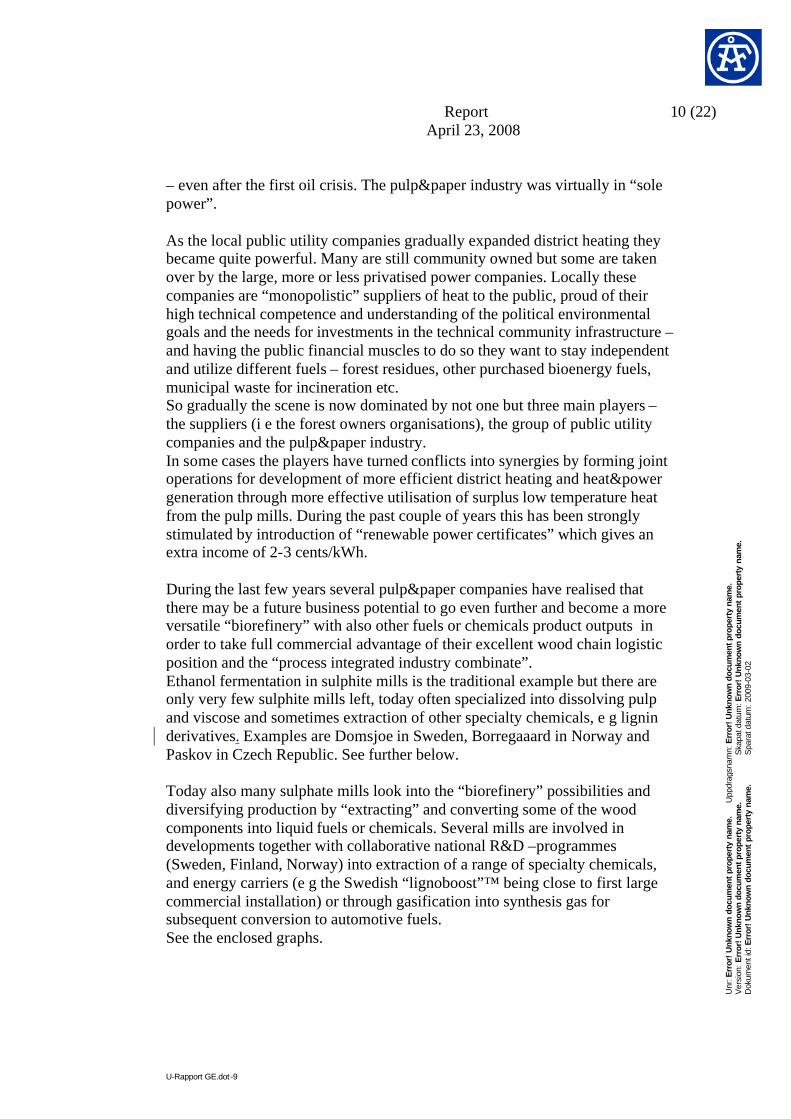
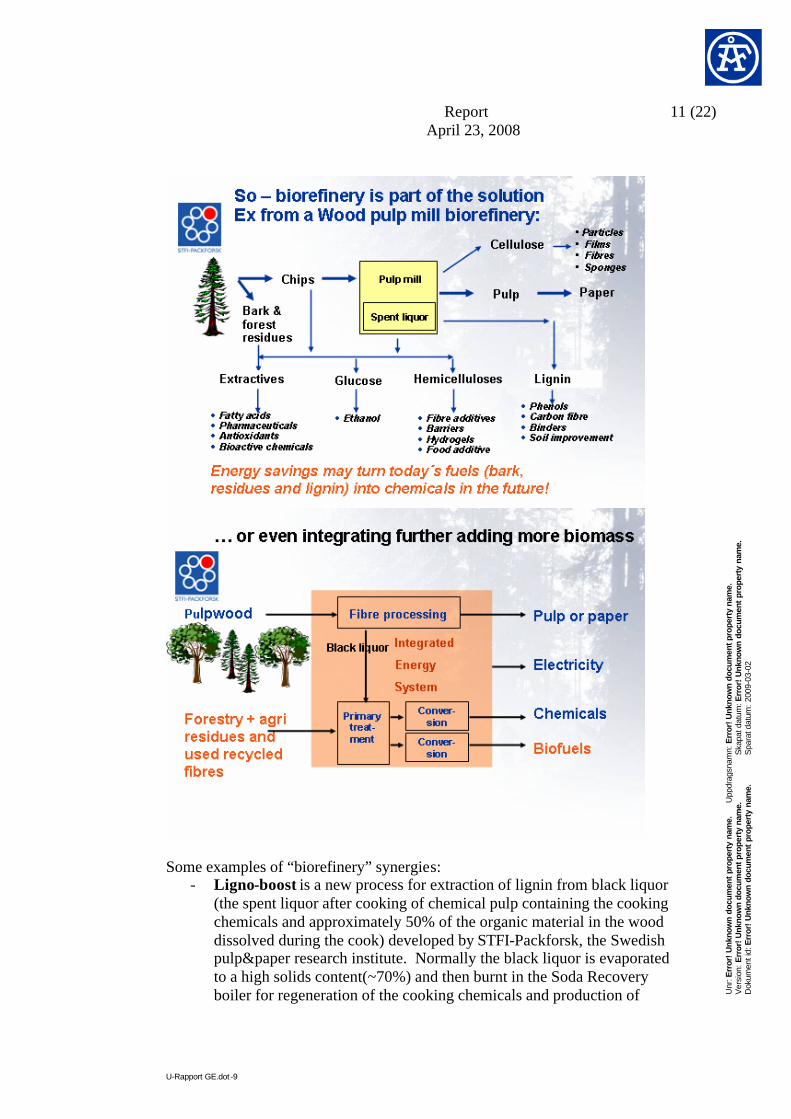
– even after the first oil crisis. The pulp&paper industry was virtually in “sole power”. As the local public utility companies gradually expanded district heating they became quite powerful. Many are still community owned but some are taken over by the large, more or less privatised power companies. Locally these companies are “monopolistic” suppliers of heat to the public, proud of their high technical competence and understanding of the political environmental goals and the needs for investments in the technical community infrastructure – and having the public financial muscles to do so they want to stay independent and utilize different fuels – forest residues, other purchased bioenergy fuels, municipal waste for incineration etc. So gradually the scene is now dominated by not one but three main players – the suppliers (i e the forest owners organisations), the group of public utility companies and the pulp&paper industry. In some cases the players have turned conflicts into synergies by forming joint operations for development of more efficient district heating and heat&power generation through more effective utilisation of surplus low temperature heat from the pulp mills. During the past couple of years this has been strongly stimulated by introduction of “renewable power certificates” which gives an extra income of 2-3 cents/kWh. During the last few years several pulp&paper companies have realised that there may be a future business potential to go even further and become a more versatile “biorefinery” with also other fuels or chemicals product outputs in order to take full commercial advantage of their excellent wood chain logistic position and the “process integrated industry combinate”. Ethanol fermentation in sulphite mills is the traditional example but there are only very few sulphite mills left, today often specialized into dissolving pulp and viscose and sometimes extraction of other specialty chemicals, e g lignin derivatives. Examples are Domsjoe in Sweden, Borregaaard in Norway and Paskov in Czech Republic. See further below. Today also many sulphate mills look into the “biorefinery” possibilities and diversifying production by “extracting” and converting some of the wood components into liquid fuels or chemicals. Several mills are involved in developments together with collaborative national R&D –programmes (Sweden, Finland, Norway) into extraction of a range of specialty chemicals, and energy carriers (e g the Swedish “lignoboost”™ being close to first large commercial installation) or through gasification into synthesis gas for subsequent conversion to automotive fuels. See the enclosed graphs.
Report 11 (22) April 23, 2008
U-Rapport GE.dot -9
Unr
: Err
or!
Unk
now
n do
cum
ent
prop
erty
nam
e.
Upp
drag
snam
n: E
rror
! Unk
now
n do
cum
ent p
rope
rty
nam
e.
Ver
sion
: Err
or! U
nkno
wn
docu
men
t pro
pert
y na
me.
S
kapa
t dat
um: E
rror
! U
nkno
wn
docu
men
t pr
oper
ty n
ame.
D
okum
ent i
d: E
rror
! U
nkno
wn
docu
men
t pr
oper
ty n
ame.
S
para
t dat
um: 2
009-
03-0
2
Some examples of “biorefinery” synergies:
- Ligno-boost is a new process for extraction of lignin from black liquor (the spent liquor after cooking of chemical pulp containing the cooking chemicals and approximately 50% of the organic material in the wood dissolved during the cook) developed by STFI-Packforsk, the Swedish pulp&paper research institute. Normally the black liquor is evaporated to a high solids content(~70%) and then burnt in the Soda Recovery boiler for regeneration of the cooking chemicals and production of
Report 12 (22) April 23, 2008
U-Rapport GE.dot -9
Unr
: Err
or!
Unk
now
n do
cum
ent
prop
erty
nam
e.
Upp
drag
snam
n: E
rror
! Unk
now
n do
cum
ent p
rope
rty
nam
e.
Ver
sion
: Err
or! U
nkno
wn
docu
men
t pro
pert
y na
me.
S
kapa
t dat
um: E
rror
! U
nkno
wn
docu
men
t pr
oper
ty n
ame.
D
okum
ent i
d: E
rror
! U
nkno
wn
docu
men
t pr
oper
ty n
ame.
S
para
t dat
um: 2
009-
03-0
2
steam and electricity to be used in the process. By extracting the lignin the pulp production can be increased (“boosted”) without having to enlarge or build a new recovery boiler, often the mill bottle neck and one of the most expensive units in a pulp mill. The lignin is taken out and dried to a high grade pelletized fuel for sale or for own use (e g to substitute oil or forest residues in the lime kiln or for the energy needed for paper production in an integrated pulp&paper mill). A pilot plant is in operation since a few years and a first commercial unit is expected before long. For a market chemical pulp mills this is an efficient way to take out the potential excess energy that a modern energy efficient chemical pulp mill can generate – and that in a high value–added form.
- The Chemrec process for Black Liquor Gasification (BLG) is long
term more far reaching, aiming at not only “boosting” pulp production but eventually be an alternative to the Soda recovery boiler by producing a synthesis gas(H2 + CO) which can either be fired in a gas-combi cycle and generate >50% more electrical power than only the traditional steam turbine or be synthesized to liquid automotive fuels like methanol or DME (dimethyleter - a gas fuel, liquid under moderate pressure, for extremely clean combustion in diesel engines) or possibly further converted to Fischer-Tropsch diesel. Since a few years there is a pilot gasifier at the Energy Technology Centre (ETC R&D centre) next to the Smurfit Kappa kraftliner mill in Piteå, N Sweden. Feasibility studies are under way for first semi-commercial demo-projects in Sweden and the US. Long term the impact can potentially be substantial. It has been estimated that if all the chemical pulp mills in Sweden would eventually convert to BLG, approx 20 TWh or 20% of the consumption of automotive fuels in Sweden could be covered. And the economics look promising indicating a 4-5 year pay-back (as an alternative to reinvestments in new soda recovery boilers) – provided that BLG can guarantee to attain the very high availability required by the integration with continuously operating pulp mills. Linked to ETC there are also a range of related projects - a pilot DME synthesis plant and a 100 000 tpa FAME bio-diesel from tall oil, both planned for construction start during 2008-09.
- The Domsjoe biorefinery combinate, developing around a 250 000 tpa
speciality sulphite mill for viscose pulp, speciality chemicals (lignosulfonates to substitute fossil based chemicals e g for concrete) and ethanol in close cooperation with the local heat&power plant and the SEKAB ethanol pilot plant (R&D into 2nd generation enzymatic hydrolysis of wood and pentose fermentation to increase yield for pentose rich hardwood, of particular relevance for fast growing energy forest plantations – in Sweden and for technology export).
Report 13 (22) April 23, 2008
U-Rapport GE.dot -9
Unr
: Err
or!
Unk
now
n do
cum
ent
prop
erty
nam
e.
Upp
drag
snam
n: E
rror
! Unk
now
n do
cum
ent p
rope
rty
nam
e.
Ver
sion
: Err
or! U
nkno
wn
docu
men
t pro
pert
y na
me.
S
kapa
t dat
um: E
rror
! U
nkno
wn
docu
men
t pr
oper
ty n
ame.
D
okum
ent i
d: E
rror
! U
nkno
wn
docu
men
t pr
oper
ty n
ame.
S
para
t dat
um: 2
009-
03-0
2
These are all examples of synergies with the forest industry. However there are also several projects going on that may potentially be conflicting with the traditional forest industry:
- The CHRISGAS-project in Värnamo, S Sweden, an EU demo-project (planned rebuild of an existing large pilot/demo of 18 MWth) for direct gasification of wood into syngas (similar to BLG but starting from wood instead of from black liquor). To utilise process and energy integration such a plant is thought be co-located with a municipal heat&power plant for district heating or – potentially even better – with an oil refinery having the option to produce DME, methanol, F-T diesel or methane(as a potential ”green low-blend” into natural gas). If so it would compete for wood with the traditional forest industry – but it also conceivable to co-locate it with a pulp&paper mill and thus realize synergies.
- There are also several ethanol-from-wood projects , planned for 50 -100 000 tpa ethanol, in different parts of Sweden but most of them have recently been put on hold or postponed both due to uncertainty about future automotive fuel policies and economic incentives and due to estimated high costs of production (close to 1 EUR/ gasoline equivavlent) even if well integrated into heat&power plants and with biogas production from the distillation residues. Such ethanol plants definitely would compete for wood with the forest industry with the exception of a few locations with substantial surplus of forest residues and rather far(> some 200 km) from large pulp&paper mills.
Comparing Sweden and Finland To show the impact of even rather small different national energy conditions and energy policies it may be illustrative to compare with the somewhat different case history of Finland: - Historically Finland has had higher electricity prices than Sweden (due to less hydropower and less nuclear energy). High power production in pulp mills (higher pressures in recovery boilers) and more combined heat&power plants have therefore been high in priority. So – Finland compared to Sweden has a “power-to-heat” ratio that is almost twice as high, i e the share of electricity produced in back pressure turbines per heat unit based on biomass. - The greater shortage of wood (>20% imported, primarily from Russia) and slightly higher wood prices than Sweden led to an early development of cost-efficient systems for harvesting and logistics for forest residues. One example is the system for compaction in the forest to “green-residue –logs”, giving lower transportation costs and efficient direct feed into the power boiler. - Prices for forest residues have been somewhat lower(seen more as a silvi-cultural service to the small private forest owners (less company owned forest than in Sweden) by the forest industries - Peat has played a large role as bioenergy supply - The forest industry(relatively stronger and more homogeneous than in Sweden) has been very keen not to encourage competition for the pulp wood -
Report 14 (22) April 23, 2008
U-Rapport GE.dot -9
Unr
: Err
or!
Unk
now
n do
cum
ent
prop
erty
nam
e.
Upp
drag
snam
n: E
rror
! Unk
now
n do
cum
ent p
rope
rty
nam
e.
Ver
sion
: Err
or! U
nkno
wn
docu
men
t pro
pert
y na
me.
S
kapa
t dat
um: E
rror
! U
nkno
wn
docu
men
t pr
oper
ty n
ame.
D
okum
ent i
d: E
rror
! U
nkno
wn
docu
men
t pr
oper
ty n
ame.
S
para
t dat
um: 2
009-
03-0
2
like ethanol- but also black liquor gasification (for power production),partly because Finland is world leader in recovery boiler equipment, partly because the industry favour electricity from non-wood competing nuclear power, where they involved themselves in the consortium for the new plant under construction. - However during the last few years the “race got started” when the two biggest Finnish pulp&paper companies decided to start projects for direct gasification of forest residues however with different technology partners - UPM with Carbona/Andritz (not yet decided) and StoraEnso with Neste Oil. The StoraEnso project in Varkaus , S Finland aims at substitution of oil in the own lime kiln and involves a cooperation with Neste oil refinery for demo development of conversion of the excess into “waxes” at the pulp mill, which will then be converted to F-T-diesel at the oil refinery.
Germany
Germany has a long and proud tradition in forestry, saw milling, pulp and paper making – and not the least in the machine and chemical supplier industry as well as the downstream converting industry (e g packaging and packaging machinery, printing and printing machinery).This is also reflected in a vital R&D and technical and trade publications. Over the past several decades chemical pulping has stagnated and not renewed itself (as the Nordic pulp industry) with one recent noteworthy exception , the Stendahl greenfield pulp mill in former Eastern Germany realised with large investment subsidies. The stagnation is partly linked to the fact that it was almost exclusively sulphite based (sulphate for long having been banned for emissions reasons). However, paper production has been vital (in fact larger in volume than e g that of Sweden) and in particular recycled fibre pulping, for several decades having been a forerunner driven by strong national recycling ambitions. Wood costs have for long stayed on top in Europe reflecting a scattered ownership and small wood lots. This in combination with a strong conservationist opinion has delayed cost rationalisation in silvi-culture and harvesting (trees are – if not sacred at least worshiped as a symbol). Unlike in the Nordic countries so far harvesting of forest residues have not yet taken off. It has mostly been “bush-fighting” in urban and semi-urban areas. So with increasing bioenergy prices there is a substantial so far unutilised potential opening up for potential synergies as well as competitive conflicts with in particular the pulping and the particle board industries. The increased purchasing power for forest bioenergy may very well stimulate increased rationalisation and mechanisation in harvesting, yielding a totally higher yield from the forests in timber, pulpwood as well as forest residues for
Report 15 (22) April 23, 2008
U-Rapport GE.dot -9
Unr
: Err
or!
Unk
now
n do
cum
ent
prop
erty
nam
e.
Upp
drag
snam
n: E
rror
! Unk
now
n do
cum
ent p
rope
rty
nam
e.
Ver
sion
: Err
or! U
nkno
wn
docu
men
t pro
pert
y na
me.
S
kapa
t dat
um: E
rror
! U
nkno
wn
docu
men
t pr
oper
ty n
ame.
D
okum
ent i
d: E
rror
! U
nkno
wn
docu
men
t pr
oper
ty n
ame.
S
para
t dat
um: 2
009-
03-0
2
bioenergy for the benefit of the saw milling and pulping industries. In the longer run this will also stimulate improved silvi-culture with more thinnings and early thinnings, resulting in a long term higher forest yield. The cutting restrictions due to conservationist opinions may also be weakened by ambitions to reconcile the wish for increased removals through development of more “responsible and sustainable” forest practices. Saw mills will also benefit from increased prices of their surplus by-products (sawdust, bark and chips). The particle board industry largely depending on saw dust will be the big loser being squeezed by low cost competition from import and being unable to compete for saw dust, which is the “perfect” raw material for biofuel pellets production. This development can be compared with the Nordic particle board industry which has almost disappeared having lived under these conditions during the last couple of decades. The pulp industry faces a more complex situation. In particular in the short run it may suffer from increasing saw mill chip prices and pulp wood prices - even losing some of “their” volumes to biofuels. Even if prices of forest biofuel is lower than for pulp wood it may on the margin sometimes be more cost effective in harvesting and transport to sort out only timber and not also separate out both a pulp wood and a and energy fraction. On the other hand with increasing energy prices pulp mills further intensify energy savings so that a modern stand alone market pulp mills (but not mills integrated into papermaking) actually can be a net exporter of energy in the form of heat (district heating), electricity, bark or pellets. So for all chemical pulp mills the increased electricity prices (historically always relatively high in Germany) have made it profitable to invest in larger turbines and increased pressure. Although it could have been quite a possible trend to follow for German pulp mills little has happened. The German pulp&paper industry has (successfully) since the 70´s focussed much more on increasing paper production , in particular based on waste paper stimulated by recycling laws. So far the bio-fuels market in Germany has largely been a local market. But as the experience from Sweden shows, as the market has grown it has also become a more efficient market place,leading to more cost-efficient solutions in particular in logistics. Now the pulp industry is not the sole player in developing the “biorefinery concept”. Other players have so far been more actice. The German company CHOREN is presently building a semi-commercial 45 MW BTL-plant (Biomass-to-Liquid) in Freiberg, based on gasification of wood to synthesis gas to be converted into Fischer-Tropsch diesel in co-operation with German auto industry and the Shell corporation. And it is planned to be followed in some 5 years by a large 6-700 MW unit. Theoretically such units can be integrated with
Report 16 (22) April 23, 2008
U-Rapport GE.dot -9
Unr
: Err
or!
Unk
now
n do
cum
ent
prop
erty
nam
e.
Upp
drag
snam
n: E
rror
! Unk
now
n do
cum
ent p
rope
rty
nam
e.
Ver
sion
: Err
or! U
nkno
wn
docu
men
t pro
pert
y na
me.
S
kapa
t dat
um: E
rror
! U
nkno
wn
docu
men
t pr
oper
ty n
ame.
D
okum
ent i
d: E
rror
! U
nkno
wn
docu
men
t pr
oper
ty n
ame.
S
para
t dat
um: 2
009-
03-0
2
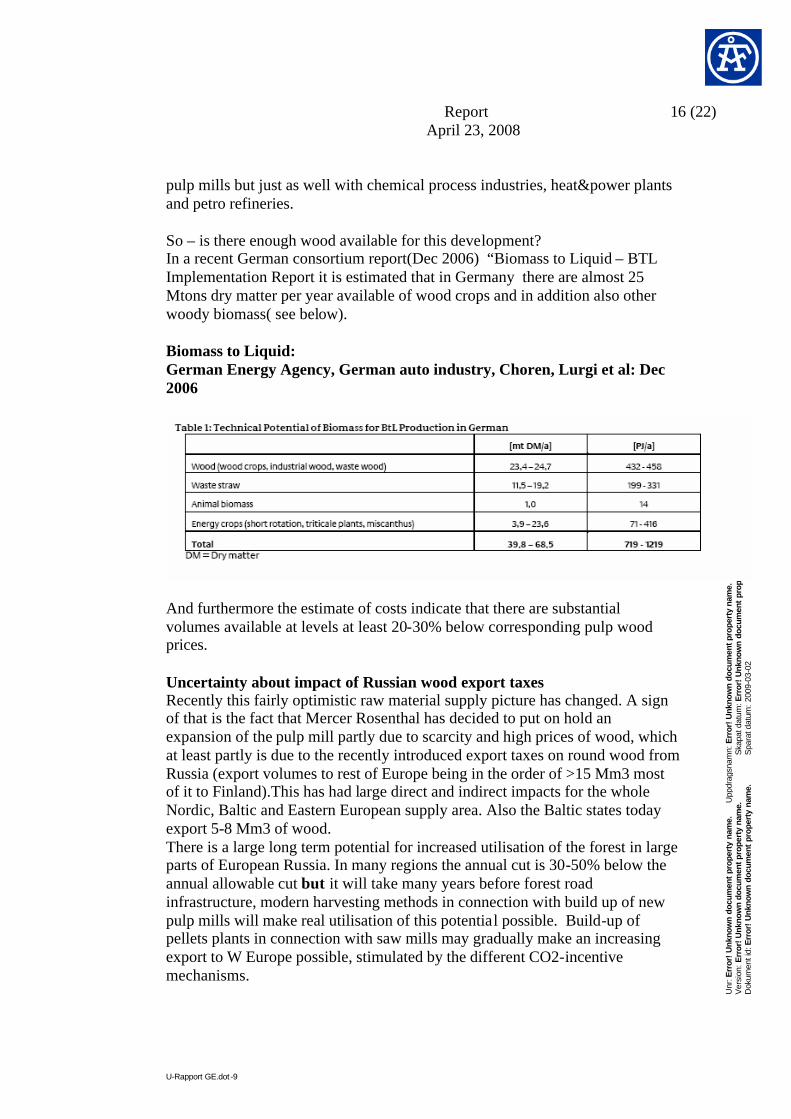
pulp mills but just as well with chemical process industries, heat&power plants and petro refineries. So – is there enough wood available for this development? In a recent German consortium report(Dec 2006) “Biomass to Liquid – BTL Implementation Report it is estimated that in Germany there are almost 25 Mtons dry matter per year available of wood crops and in addition also other woody biomass( see below). Biomass to Liquid: German Energy Agency, German auto industry, Choren, Lurgi et al: Dec 2006
And furthermore the estimate of costs indicate that there are substantial volumes available at levels at least 20-30% below corresponding pulp wood prices. Uncertainty about impact of Russian wood export taxes Recently this fairly optimistic raw material supply picture has changed. A sign of that is the fact that Mercer Rosenthal has decided to put on hold an expansion of the pulp mill partly due to scarcity and high prices of wood, which at least partly is due to the recently introduced export taxes on round wood from Russia (export volumes to rest of Europe being in the order of >15 Mm3 most of it to Finland).This has had large direct and indirect impacts for the whole Nordic, Baltic and Eastern European supply area. Also the Baltic states today export 5-8 Mm3 of wood. There is a large long term potential for increased utilisation of the forest in large parts of European Russia. In many regions the annual cut is 30-50% below the annual allowable cut but it will take many years before forest road infrastructure, modern harvesting methods in connection with build up of new pulp mills will make real utilisation of this potential possible. Build-up of pellets plants in connection with saw mills may gradually make an increasing export to W Europe possible, stimulated by the different CO2-incentive mechanisms.
Report 17 (22) April 23, 2008
U-Rapport GE.dot -9
Unr
: Err
or!
Unk
now
n do
cum
ent
prop
erty
nam
e.
Upp
drag
snam
n: E
rror
! Unk
now
n do
cum
ent p
rope
rty
nam
e.
Ver
sion
: Err
or! U
nkno
wn
docu
men
t pro
pert
y na
me.
S
kapa
t dat
um: E
rror
! U
nkno
wn
docu
men
t pr
oper
ty n
ame.
D
okum
ent i
d: E
rror
! U
nkno
wn
docu
men
t pr
oper
ty n
ame.
S
para
t dat
um: 2
009-
03-0
2
The UK
Biomass Energy has played a small role so far in the UK Biomass energy currently provides about 2% of the UK's electricity generation. The corresponding number for heat produced by biomass is 1%. The total UK wood production(deliveries) is 8,5 M “green tonnes” softwood and 0,5M “green tonnes” hardwood(2006) expected to increase to ~11,5 Mt total in 10 years (<5% more in m3 under bark). Of the present 9 Mt only about 350 000 t are estimated as “wood fuel”. (Forestry Commission 2007). A forest sector without strong commercial drive The complexity (or disorganization) of the UK forestry sector, including multipurpose forestry, beyond timber production, presents management problems and makes future yields difficult to predict. The sector in England is only harvesting 39% of the annual increment. Only about 14% of the total Great Britain broadleaved woodlands are harvested today. When discussing modern commercial forestry it can be restricted to Scotland and parts of North East England and North Wales. Afforestation plantations particularly in Scotland have resulted in a growing raw material base. Much of the increasing potential is gradually being absorbed by the panel/fiber board industry and the saw mills. An extension of the Fort William saw mill will ultimately bring up the lumber production to > 500 000 m3 sawn wood (comparable to top European producers). It has also attracted several feasibility studies for pulp and paper mills – however so far no mill has been implemented. And presently there are no chemical pulp mills and only 2 larger chemi-mechanical pulp mills – Caledonian (owned by Finnish UPM) and Workington (owned by Swedish Holmen). Some 50% of all forests are owned by The Forestry Commission. They are politically managed, only partially commercial and ultimately publicly funded. The Forestry Commission, which was originally formed to create a commercial forest for the UK, has to ensure that a certain amount of harvesting and replanting goes on - otherwise sustainability is at danger and may bring the UK back to the 1920’s when there literally were no commercial forests left in the UK. Thus, a situation where the main player can and operate with limited commercial constraints will cause severe problems for the private forest owners trying to make enough money on their forests to be able to afford replanting and proper forest management. It is estimated that only some 30% of all wood deliveries go to commercially competitive saw mills, panel mills and pulp&paper mills.
Report 18 (22) April 23, 2008
U-Rapport GE.dot -9
Unr
: Err
or!
Unk
now
n do
cum
ent
prop
erty
nam
e.
Upp
drag
snam
n: E
rror
! Unk
now
n do
cum
ent p
rope
rty
nam
e.
Ver
sion
: Err
or! U
nkno
wn
docu
men
t pro
pert
y na
me.
S
kapa
t dat
um: E
rror
! U
nkno
wn
docu
men
t pr
oper
ty n
ame.
D
okum
ent i
d: E
rror
! U
nkno
wn
docu
men
t pr
oper
ty n
ame.
S
para
t dat
um: 2
009-
03-0
2
The rest of the wood goes to small saw mills and chipboard industry which all struggle to make any sort of money and would be largely bankrupt if charged with the full European commercial price today. The principal forest owner, The Forestry Commission has chosen to support these marginal industries and basically charge them with what they can afford. This creates an artificially low price level which then bounces back to the private owners, faced with the dilemma to finance proper forest management or just leave it – as expressed by an industrialist. So, generally speaking the forest industry in the UK is seen as lacking commercial drive with no clear central point from which wood can be procured. A key issue appears to be lack of communication and cooperation across the wood chain. In the absence of high value added industry willing to invest and the small, low value added users, barely surviving a “vacuum” is formed where “bioenergy” can easily step in. In the UK there are five power stations in the planning or construction stage with capacities of a total intake of woody biomass of 1.5 million green tonnes. Added to this are several hundred non-domestic heating or combined heat and power plants. A strong incentive is the ROC´s (Renewable Obligation Certificates) today giving large subsidies for electricity generation (£ 45/MWh). The long term reliability of such incentives is however a debated issue. The UK wood bioenergy strategy is therefore seeking measures to deliver 2 million green tonnes to the UK wood energy industry. This compares to the current home-grown delivery of 8.1 million green tonnes to the UK wood processing industry. The pulp and paper industry could have a key role having the interest and the need to use wood both for industrial products and for process heat and power generation. A modern large greenfield stand alone pulp mill (500 000 tpa +) could be built to export even above 100 MW power while an integrated pulp&paper mill normally would need that power itself but still be able to export surplus heat e g for district heating. Now the UK pulp&paper industry on the whole is stagnant since decades, having lagged behind in the technology development and in economies of scale – and little self-confidence and/or ability to convince the financial sector. E g industry statistics show that of the 12,3 Mt of paper and board consumed (in fact shrinking from the peak 12,9 Mt in 2000) only 5,6 Mt is produced domestically (down from the peak of 6,6 Mt in 2000), approximately 65 % of which is based on recycled fiber, 26% on imported pulp and only 6% on ”home produced pulp”. The lack of confidence in building new modern capacity also reveals itself by the fact that the UK is one of few European countries with a large recycled fiber export, in the past 4-5 years having rapidly increased from 1 to 4 Mt.
Report 19 (22) April 23, 2008
U-Rapport GE.dot -9
Unr
: Err
or!
Unk
now
n do
cum
ent
prop
erty
nam
e.
Upp
drag
snam
n: E
rror
! Unk
now
n do
cum
ent p
rope
rty
nam
e.
Ver
sion
: Err
or! U
nkno
wn
docu
men
t pro
pert
y na
me.
S
kapa
t dat
um: E
rror
! U
nkno
wn
docu
men
t pr
oper
ty n
ame.
D
okum
ent i
d: E
rror
! U
nkno
wn
docu
men
t pr
oper
ty n
ame.
S
para
t dat
um: 2
009-
03-0
2
The saw mill industry is largely small scale but there are a couple of mills with an internationally competitive scale and one or two further large scale projects planned. Since investment costs in saw milling are much lower (and less risky) than in pulp&paper, the saw mill industry appears to take advantage of the growing stock of wood – perhaps at least hoping that increasing bioenergy prices will give them a reasonably safe-guarded income from the >40% volume by-products (bark and chips) even if much of the chips goes to the panel/particle board industry. The bio-energy revolution increases the demand on wood in the UK. Studies in the UK demonstrate that available wood resources is much less than the expected demand, which will cause serious competition/conflicts in the market. Environmental constraints on production accentuate this competition. Areas available for wood supply may decrease, due to increasing demands to set aside forests for other functions like biodiversity conservation, recreation and protective functions. Increasing bio-energy and wood markets provide the opportunity to expand conventional forestry to timber-belts, parklands, hedgerow-trees, urban forests, wood pastures, and silvoarable systems. A drawback is that the financial viability of forest management is currently marginal and possibilities to increase profitability may be several years away. The sector is poorly organized and the wood chain is disjointed. More information on the identity and motivations of private woodland owners and the resource is required, hand-in-hand with coordinated procurement and marketing initiatives. This effects both wood processing industry and the bio-energy sector. Currently the sector is unable to develop an effective wood chain due to the fact that the amount and quality of available wood for conversion is rather unknown. The sector will not be able to market its wood if it does not know who owns it and how much/and what there is and when it may be available.
The US
The US differs from Europe in a number of different respects, in particular due to – historically- an abundance of wood and low wood costs(in particular in the US South) and cheap energy due to small or no fossil taxes. Thus, wood bioenergy has hitherto been of little importance (except industrial residues or by-products) with little or no direct harvesting of forest residues. Given the last few years rapidly increasing fuel prices and the strong interest also in the US for alternatives to oil there is a substantial potential but so far an undeveloped market within the forest sector, a potential both in unutilised forest residues but also as energy improvements within the forest industry.
Report 20 (22) April 23, 2008
U-Rapport GE.dot -9
Unr
: Err
or!
Unk
now
n do
cum
ent
prop
erty
nam
e.
Upp
drag
snam
n: E
rror
! Unk
now
n do
cum
ent p
rope
rty
nam
e.
Ver
sion
: Err
or! U
nkno
wn
docu
men
t pro
pert
y na
me.
S
kapa
t dat
um: E
rror
! U
nkno
wn
docu
men
t pr
oper
ty n
ame.
D
okum
ent i
d: E
rror
! U
nkno
wn
docu
men
t pr
oper
ty n
ame.
S
para
t dat
um: 2
009-
03-0
2
A forest bio-fuel market is now starting to emerge on the West Coast with prices around $40-50/dry ton (~5 MWh/dry ton) for wood residues or saw dust, i e approx half, or lately even less than the rapidly escalating prices for forest residues in Sweden today (EUR 16-20/MWh). Another expression of the different conditions on the two sides of the Atlantic is that there is a growing saw dust pellets production in Canada – competitive for export to Europe but so far not North America. A third factor is that the North American Pulp&Paper industry has lost much of the momentum and expansion it still had in the 70´s and 80´s (in particular in the South) and is now on the defense –showing low growth, little renewal and not being attractive on the capital market. Therefore the forest industry is increasingly looking at bioenergy from the forests as a 3rd leg and at the pulp mills as potential biorefineries to produce complementary value added products. Since a few years there is much focus on that in industry research agendas (Agenda 2020) and in the technical industry press. However so far little has been realised although there have been several R&D projects and demo plants in Black Liquor Gasification (BLG) supported by DOE and recently some renewed feasibility studies on semi-commercial BLG-applications. Finally the strong focus on ethanol from corn (pushed by the Bush administration) has also increased research to improve the ethanol yield from woody biomass, i e the lingo-cellulose residues from corn as well as forest based cellulose. However there has so far been only a limited discussion about the resource "conflicts" between the conventional wood industry and the bio-energy industry as has been the case for food crops like corn or rape-seed. It is an emerging topic of discussion, but not much has been written about it (and just in the popular press or trade journals). For example, there was an article in the June 2007 (vol. 13, no. 6) issue of "International Woodfiber Report" (a RISI publication) that discussed announced wood pellet and biomass energy operations, and indicated that those announced operations could consume just over one million green tons per year of wood. That can be compared with the reported "energy chip receipts" (wood biomass consumption for energy) at U.S. pulp and paper mills, which was over 24 million green tons per year in 2005 according to the Forest Resources Association (Annual Pulpwood Statistics Summary Report), or total pulpwood receipts at U.S. pulp mills which were 231 million green tons in 2005 (Ibid.). Thus the consumption of wood for bioenergies and wood pellets is still rather small in comparison to other industrial uses of wood biomass for energy, or pulpwood consumption. Moreover, the consumption of pulpwood in the United States declined by nearly 30 million green tons from its peak in 1997 to the
Report 21 (22) April 23, 2008
U-Rapport GE.dot -9
Unr
: Err
or!
Unk
now
n do
cum
ent
prop
erty
nam
e.
Upp
drag
snam
n: E
rror
! Unk
now
n do
cum
ent p
rope
rty
nam
e.
Ver
sion
: Err
or! U
nkno
wn
docu
men
t pro
pert
y na
me.
S
kapa
t dat
um: E
rror
! U
nkno
wn
docu
men
t pr
oper
ty n
ame.
D
okum
ent i
d: E
rror
! U
nkno
wn
docu
men
t pr
oper
ty n
ame.
S
para
t dat
um: 2
009-
03-0
2
recent low point in 2002, and in 2005 still remained almost 20 million green tons below the 1997 peak (Ibid.). In the longer term, if cellulosic bioenergies become more economical, it's possible (and certainly likely) that competition will arise between bio-energy uses and other uses of lower-value timber (such as pulpwood or wood fuel). Many long-range forecasting studies indicate that oil production will peak globally in the period from 2020 to 2040, and that biomass energy will come to play a much more significant role in total energy production. That is apparent for example in the IPCC scenarios, or projections done by the National Intelligence Council (see e.g. the findings of the NIC 2020 project and the "international futures" projections via the following website: www.dni.gov/nic/NIC_2020_project.html). Although such reports indicate that biomass will assume a much larger role as an energy resource in the future, it remains uncertain whether most of the biomass would come from forests or from agricultural sources (e.g. natural forests versus dedicated biomass energy crops), possibly more from dedicated crops, but that is really dependent on developments of potential biomass feedstock costs, volumes of supply, etc. The potential conflict between industrial or energy uses is mostly seen as an interesting and important topic, but just beginning to emerge as an issue for study and analysis. What is being viewed more as a "conflict" already in Europe - e g shown by the strong interest of CEPI (Confederation of European Paper Industry) and others in the topic as related to pulpwood supply and prices which always has been important in Europe) - is more subdued in North America. Some see Europe as being ahead in this area of discussion and that North America should likewise intensify bioenergy impact assessments in general. A possible indication is that there will be a symposium on wood energy development at the AAAS meeting in Boston in 2008, and the leading industry trade association (AF&PA) is developing a position paper on the topic.
Issues Hindering Development of the Wood Fuel Sector
Thus, there are different conditions for the development of the wood fuel sector in different countries. But there seems to be a couple of commonalities with respect to the future development of the sector. These are:
• Competition between different users of the forest raw material and how to reach a sustainable demand and supply of wood fibers.
• Conservation among the major stakeholders of the traditional forest sector.
Report 22 (22) April 23, 2008
U-Rapport GE.dot -9
Unr
: Err
or!
Unk
now
n do
cum
ent
prop
erty
nam
e.
Upp
drag
snam
n: E
rror
! Unk
now
n do
cum
ent p
rope
rty
nam
e.
Ver
sion
: Err
or! U
nkno
wn
docu
men
t pro
pert
y na
me.
S
kapa
t dat
um: E
rror
! U
nkno
wn
docu
men
t pr
oper
ty n
ame.
D
okum
ent i
d: E
rror
! U
nkno
wn
docu
men
t pr
oper
ty n
ame.
S
para
t dat
um: 2
009-
03-0
2
• Lack of inter-linkage of sub-sectors of the wood utilizing sector. • Lack of active participation by local stakeholders.
At a subordinated level the following can be identified as common bottlenecks (Euroforenet, 2007): Environmental Benefits
• There are multiple environmental benefits of increased utilization of wood fuel not being economically rewarded.
Economic Concerns
• Wood fuel development is not fully accepted by the market. • Lack of awareness among decision-makers about the potentials. • Logistic problems (including long transport distances) with the wood
fuel supply. • Lack of data on available biomass potential (a special concern is
biomass outside forests). • Uncertainties in legislation and subsidies. • Difficulties to generate an efficient international market due to different
development stages in different countries.
Social Concerns
• Land ownership fragmentation and lack of horizontal and vertical integration.
• Lack of knowledge by the general public.
Threats There are a number of threats with the development of the wood fuel sector on a large scale:
• Increased pressure on biodiversity, soils and landscape. • Market resistance and increased competition. • Lack of steady policies and market conditions. • Lack of mobilization of fuel wood raw material.
Institut für Energetik und Umwelt gemeinnützige GmbH
Institute for Energy and Environment
Geschäftsführer: Prof. Dr. Martin Kaltschmitt Deutsche Kreditbank AG Stadt- und Kreissparkasse Leipzig Handelsregister: Amtsgericht Leipzig HRB 8071 (BLZ 120 30 000) (BLZ 860 555 92) Sitz und Gerichtsstand Leipzig Konto-Nr.: 1364280 Konto Nr.: 1100564876 Zert.-Nr. 1210010564/1
Report
Bioenergy – Competition and Synergies
Part B: Agricultural Sector
Daniela Thrän
Thilo Seidenberger
Jürgen Zeddies

principal:
International Energy Agency - IEA
Task 41
Mr. Sven-Oloc Ericson
agent: Institut für Energetik und Umwelt gGmbH (IE)
Torgauer Str. 116
04347 Leipzig
Department Bioenergysystems
Universität Hohenheim (UHOH)
Institut für Landwirtschaftliche Betriebslehre
Schloss-Osthof-Süd
70599 Stuttgart Hohenheim
processor: Dr. Daniela Thrän
Tel.: +49 / (0)341 / 2434-435
Thilo Seidenberger
Prof. Jürgen Zeddies
Leipzig, Okt. 2007
Index - I -
INDEX
1 BACKGROUND AND AIM 6
2 BIOMASS PROVISION FROM AGRICULTURE 8
2.1 Drivers for the future food and feedstock demand 9
2.2 Land availability and energy crop potential in the selected countries 11
2.2.1 Methodology and data base 11
2.2.2 Development of food consumption in the investigated countries 11
2.2.3 Land availability 14
2.2.4 Energy crop potential 21
2.2.5 Conclusion fort the energy crop potential till 2020 23
2.3 Potential of residues and by-products from agriculture 24
2.3.1 Straw 25
2.3.2 Excrements and litter 26
2.3.3 Bioenergy potential of the residues 26
2.4 Long-term outlook of the development of land availability for energy crop production till 2050 27
2.4.1 Energy crops 27
2.4.2 Residues 29
2.4.3 Overall potential 29
3 BIOMASS USE FOR ENERGY 31
3.1 Frame conditions for the future bioenergy demand 31
3.1.1 Energy policies 33
3.1.2 Agricultural policies 36
3.2 Expected biomass flows and markets (demand development) 38
3.2.1 Tradability of biomass and bioenergy 38
3.2.2 Heat and Electricity 40
3.2.3 Substitutes for Gasoline 40
3.2.4 Substitutes for Diesel 44
3.2.5 Energy crops 48
4 COMPETITION AND SYNERGIES 51
4.1.1 General balance of biomass supply and demand 51

Index - II -
4.2 Export-/Import balances and subsequently on external trade of agricultural commodities 54
4.3 Expected price effects 56
4.3.1 Price effects on agricultural goods 56
4.3.2 Price effects on energy carriers 62
5 Conclusions and recommendations 64
Bibliography VI
List of tables - III -
LIST OF TABLES
Table 1: Developing of the most important variables in the investigated countries, own calculations ..........................................................................................................12
Table 2: Potential of agricultural land for bioenergy production, own calculations..............15 Table 3: Technical potential of manure worldwide, /37/ .........................................................26 Table 4: Political sectors, objectives and their significance in the observed countries .........32 Table 5: Rate of renewabels and national targets, /28/, /29/ ...................................................35 Table 6: General tradeability of different biomass sources, according /1/ .............................39 Table 7: Export-/Importbalances of the investigated countries, own calculations ................55 Table 8: Bio-fuel potential and share of consumption.............................................................56 Table 9: Portion of bio-fuels of diesel and petrol consumption for an “aggressive”
bio-fuel scenario and changes of world prices for agricultural products for the scenarios /54/ .........................................................................................................60
Table 10: Percentage Changes in World Prices of Feedstock Crops under three scenarios, copered with baseline /54/ .........................................................................60
List of figures - IV -
LIST OF FIGURES
Figure 1: Interrelationships and drivers of the biomass potential for energy crops /1/,
adapted ......................................................................................................................10 Figure 2: Agricultural land for energy crops in the investigated countries, according........20 Figure 3: Potential of arable land and grassland in the investigated countries.....................20 Figure 4: Potential of “equivalent arable land”; calculated from potentials of arable
land, grassland and the country specific production factors of grassland ............20 Figure 5: Area yield of currently available bio-fuels in the countries under
observation, according to /28/ .................................................................................21 Figure 6: Corridor of energy potential according the data of the “equivalent arable
land” ..........................................................................................................................22 Figure 7: Straw potential in the investigated countries, according /37/, /58/ .......................25 Figure 8: Development of agricultural acreage until 2050 /4/ ...............................................28 Figure 9: Biomass potentials till 2100 according to different prognoses, /49/ .....................30 Figure 10: Influence from the international, european and national politics on the
production of bioenergy and energy crops .............................................................33 Figure 11: Biofuel targets of the investigated countries in 2015/2020 ...................................36 Figure 12: Energy density of different biomass sources and biofuels, /1/ ..............................39 Figure 13: Bioethanol production worldwide in 2006 /55/ ......................................................41 Figure 14: Most important bioethanol producer worldwide in 2006 /55/ ...............................41 Figure 15: Sugar cane production in Brazil /53/ .......................................................................42 Figure 16: International comparison of bioethanol production costs /53/ ..............................43 Figure 17: Outlook of global biofuel production, /30/ .............................................................44 Figure 18: Global production of vegetable oil in mn t, according /24/ ...................................45 Figure 19: Development of Biodiesel production, /31/ ............................................................47 Figure 20: World projected consumption on vegetable oils, /32/............................................47 Figure 21: Market implementation of BtL-fuels in Europe in case of efficient
technical development, own calculations ...............................................................48 Figure 22: Energy crop use till 2016 according /48/ ................................................................49 Figure 23: Produced bio-fuels (1st generation) from the expected energy crop use
according /48/ ...........................................................................................................50 Figure 24: Comparison of demand and supply of biofuels under different frame
conditions, according Table 1, /28/ and own caculations (Conversion rate for FT-Diesel and ethanol (cellulose): 50%; the production of FT-Diesel in 2003 is a )..................................................................................................................51
Figure 25: Comparision of the actual rapseed cultivation area with the need of area required by national biodiesel targets in 2005 and 2010 for the EU27 countries /28/ ............................................................................................................53
Figure 26: Comparision of the area requirements of rapseed and soja in 2005 with the cultivation areas of these cultures, according /28/. ................................................53
List of figures - V -
Figure 27: Comparision of the area requirements of sugar beet, sugar cane, maize and wheat in 2005 with the cultivation areas of these cultures, according /28/. .........53
Figure 28: Historical and expected price developpment of plant oils on world market /27/ .............................................................................................................................57
Figure 29: Fuel prices in Brazil /53/ ..........................................................................................58 Figure 30: Maximum payable sugar beet price in relation to the bioethanol price (ex-
works) /53/ ................................................................................................................59 Figure 31: Expected prices of cereals /27/ ................................................................................61 Figure 32: Expected prices of vegetable oil /27/ ......................................................................62 Figure 33: Typical break-even points for the most relevant biofuels, based on the
prices for agricultural goods in 2005 ......................................................................63
Error! Style not defined. - 6 -
1. Background and aim
Bioenergy can be produced from different feedstocks and used in various applications (heat,
power and fuels). Also many reasons are given for developing bioenergy systems (security of
energy supply, reduction of greenhouse gas emission, development of rural regions etc.). Crop
based bioenergy can be an important and increasing factor for the energy supply, if the
agricultural sector is able to provide mass-produced energy crops. One relevant factor
presently limiting the development of bioenergy systems based on energy crops is the
availability of land for biomass production and the dependence on adaptation of agricultural
policies. So competitions of bioenergy production with other activities and ambitions which
could limit the realistic bioenergy potential are expected. On the other hand there might be
synergies, multiple benefits, and added values that bioenergy could offer relative to other
current conventional practices.
Based on this background the IEA task 41 to start a system analysis of the current situation
and the relevant drivers for future development related to agriculture. The focus is intended to
be on strategic aspects of competition and synergies most relevant in policymaking aiming at
increasing the use of bioenergy parallel to food production and other demands. The work on
agriculture will aim at analysing the availability of land with a specific production capacity
and cost range and thus present the volume of biofuels possible to produce without an
unacceptable competition threatening the security of food/fodder supply and environmental
restrictions. More specifically the work will take the present situation as a starting point;
agricultural land and present productivity present a surplus of land and also basically a surplus
production of food/fodder. The effect of this is depressed prices in some countries not
covering the full production costs. As a temporary solution government subsidies are applied
as well as set aside schemes where part of the land is taken out of production.
With regard to competition the most relevant drivers are analysed, i.e. population growth, per-
capita consumption productivity/intensity in farming, sustainable water supply, global
warming, environmental ambitions relating to preservation of biodiversity, surface and
ground water management (soil erosion) and limited acceptance of pesticide application
The analysis will include agricultural products, agricultural wastes, and by-products and focus
on the situation in North America and Europe with special emphasis on the UK, Germany and
Error! Style not defined. - 7 -
Sweden. To estimate effects of international and intercontinental trade certain countries with
agricultural importance are analysed additionally (Brasil, China, India, Australia, Russia and
Ukraine)1. In those countries about 50 % of the agricultural land is located. Due to high
productivity of that land more than 60 % of the world’s population is provided with food from
those countries. For each relevant country the actual policy objectives will be determined and
considered in the future food and feedstock balance. The timeframe is 2005 till 2020; an
outlook of the longer term perspective (till 2050) is given with regard to the performance of
the relevant drivers (population, per-capita consumption etc.) in different regions.
The work is suggested to present the best estimates of how market mechanisms presently
form prices on products and land and with this analysis as a starting point analyse how
increasing production of biomass for energy purposes will gradually affect the prices on land
and traditional crops and eventually reach a situation where there is strong competition for
land and security of food supply is put at risk. The analysis distinguish between multipurpose
energy crops (grain possible to use as either food or fodder or energy), dedicated annual
energy crops (hemp), energy crops with fodder as by-product (rape) and perennial energy
crops (SRC willow).
1 Australia as representative of highly developed industrial countries with large resources for agricultural raw
materials; Russia and the Ukraine as representatives of transformation countries, also with large resources for agricultural raw materials but with dramatic reduction in population numbers in the transformation process; Brazil, China and India as significant agricultural threshold countries, with high population growth and with a strong increase in per capita consumption.
Error! Style not defined. - 8 -
2. Biomass provision from agriculture
Biomass from agriculture includes energy crops, residues and wastes. Energy crops can be
produced and used as bioenergy sources in rotation with traditional agricultural energy crops.
The most important biomass streams from agriculture are:
Ø annual energy crops, which can be
- food crops (i.e. oil seeds, grain, grain maize, sugar cane, sugar beet)
- fodder crops (i.e. silage maize, soybeans)
- crops for renewable materials (i.e. hemp, oil seeds, starch crops)
- “pure” energy crops (i.e. energy maize)
Ø perennial energy crops (i.e. short rotation crops, energy grass, jatropha)
Ø straw
Ø manure
Additionally, relevant masses of biomass by-products are produced within the food and
fodder processing industry (husks, shells, stones, press cake, sewage sludge etc.), but those
residues will not be included in the following.
The supply of biomass refers to the share of total available biomass that can be used under
given technical restrictions This technical fuel potential refers to the share of the total
available biomass that can be used taking into account given technical restrictions.2). It takes
into account the available utilisation technologies, their efficiency, availability of sites also in
terms of competing uses, as well as “insurmountable” structural, ecological (e.g. nature
conservation areas) and other non-technical restrictions. The supply of biomass is calculated
2 The potential of the different bioenergy sources to be used for energy can be categorised as theoretical, technical, economic and realisable potential /1/. Ø The theoretical potential is derived from the physical supply (all phytomass and zoomass) and
represents a theoretical limit. It is therefore essentially irrelevant when assessing the actual usability of the renewable energy supply.
Ø The technical potential, however, refers to the percentage of theoretical potential that can be used given current technical possibilities.
Ø The economic potential of an option of using renewable energy refers to the percentage of the technical potential that can be used economically in the context of given basic energy industry conditions. It is affected by conventional energy systems and the prices of energy sources.
Ø The realisable potential refers to the expected actual contribution of an option for using renewable energy sources. It is also determined by various and changing frame condition.
Error! Style not defined. - 9 -
from the potentials of agricultural areas or the energy crop potentials derived from those
areas, and the potentials of agricultural residues /1/.
With regard to the biomass potential from agriculture, energy crops are expected to become
much more important in the near future, so the focus of the analysis will be given to them in
the following. Energy crops are produced on agricultural land, so the land availability is the
key factor for the energy crops potential. The drivers determining land availability will be
described in chapter 0. The effects on those drivers will be figured out for the most relevant
countries till 2020 in chapter 0 and more general with regard to the long term future (2050) on
a global scale in chapter 0. In chapter 0 the biomass residue potentials from agriculture are
summarised additionally.
2.1 Drivers for the future food and feedstock demand
The land availability for energy crop production depends on the overall amount of available
agricultural land and the demand of land for the food and fodder production. There are
various drivers which influence the actual and future food and feedstock demand. Their
influence varied partly subject to the climate zone, the soil quality or local conditions. But the
main factors are universally valid in a global context. In the following an overview of the
main influencing factors is given.
Influencing factors:
1. Development of the global population
2. Per-Capita consumption of food (global per-capita consumption of food changes
slowly but increasingly; production of animal products needs more acreage than
production of plant products (at least by factor 6))
3. Increase of harvests by increase of specific yields by breeding successes
4. Increase of yields by improving the state of the art (real situation in agriculture; i.e.
assimilation of production systems particularly in Africa and Asia)
5. Climate change influences both, the availability of acreage and the development of the
yields
6. Loss of agricultural acreage by soil degradation (erosion, salinisation) and additional
need of areas for non-agricultural purposes (infrastructure, restrictions of use etc.)
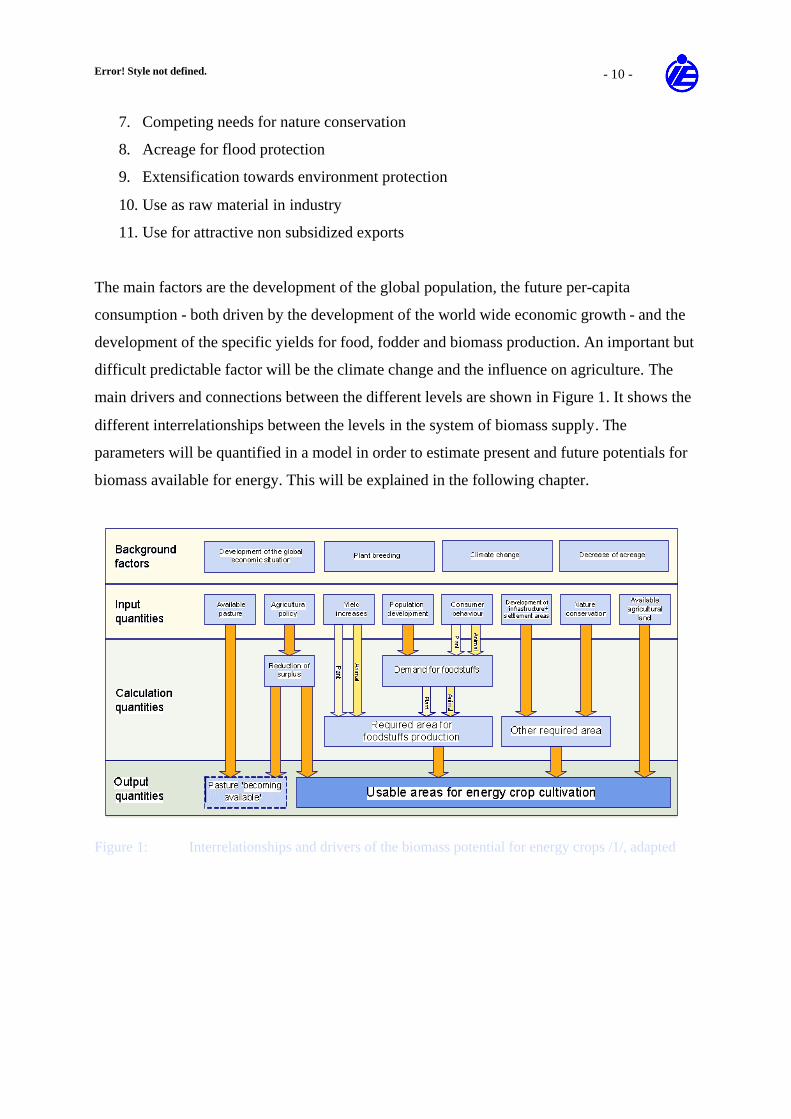
Error! Style not defined. - 10 -
7. Competing needs for nature conservation
8. Acreage for flood protection
9. Extensification towards environment protection
10. Use as raw material in industry
11. Use for attractive non subsidized exports
The main factors are the development of the global population, the future per-capita
consumption - both driven by the development of the world wide economic growth - and the
development of the specific yields for food, fodder and biomass production. An important but
difficult predictable factor will be the climate change and the influence on agriculture. The
main drivers and connections between the different levels are shown in Figure 1. It shows the
different interrelationships between the levels in the system of biomass supply. The
parameters will be quantified in a model in order to estimate present and future potentials for
biomass available for energy. This will be explained in the following chapter.
Figure 1: Interrelationships and drivers of the biomass potential for energy crops /1/, adapted
Error! Style not defined. - 11 -
2.2 Land availability and energy crop potential in the selected countries
2.2.1 Methodology and data base
The potentials of agricultural land for biomass production will be quantify in the following for
countries with worldwide agricultural importance (EU, Brazil, China, India, Australia, Russia,
Ukraine and the USA). The timeframe is 2000 to 2020. The calculation of the potential areas
will consider the following factors:
Ø Fallow land: It is assumed that 100% of fallow land is available for energy crop
cultivation.
Ø Reduction of surplus production of market regulation products provides additional
areas for energy crop cultivation 3
Ø Changes in food consumption due to the demographic development and changes in per
capita consumption. Higher consumption decreases and lower consumption increases
the available potentials for bioenergy sources.
Ø Expected redesignation of previously agricultural land for residential building, traffic
and other purposes. This redesignation of land reduces the potential for bioenergy
sources
Ø Increases in the yield and performance of crop and animal production. These increases
make potentials from agricultural land and grassland available for bioenergy sources.
A differentiation between arable land and grassland takes place. On the basis of these
potential areas the producible quantity of biomass for energy production is calculated. The
calculation of these potentials based on the data from /5/ and /6/ which are calculated by
consistent methods.
2.2.2 Development of food consumption in the investigated countries
Table 1 shows the development of the variables essentially determining the potential in the
individual countries is shown, i.e. population, per capita consumption, self-sufficiency
portion, development of agriculturally utilized area and area yield. The self-sufficiency
portion was calculated from the self-sufficiency portion of the most important foods, weighted
by its proportion of the entire food consumption in grain units. 3 It is assumed, that the domestic production of this overproduction takes place to the highest value of self-
sufficiency of food. Furthermore, the products can be used for export and bioenergy production.
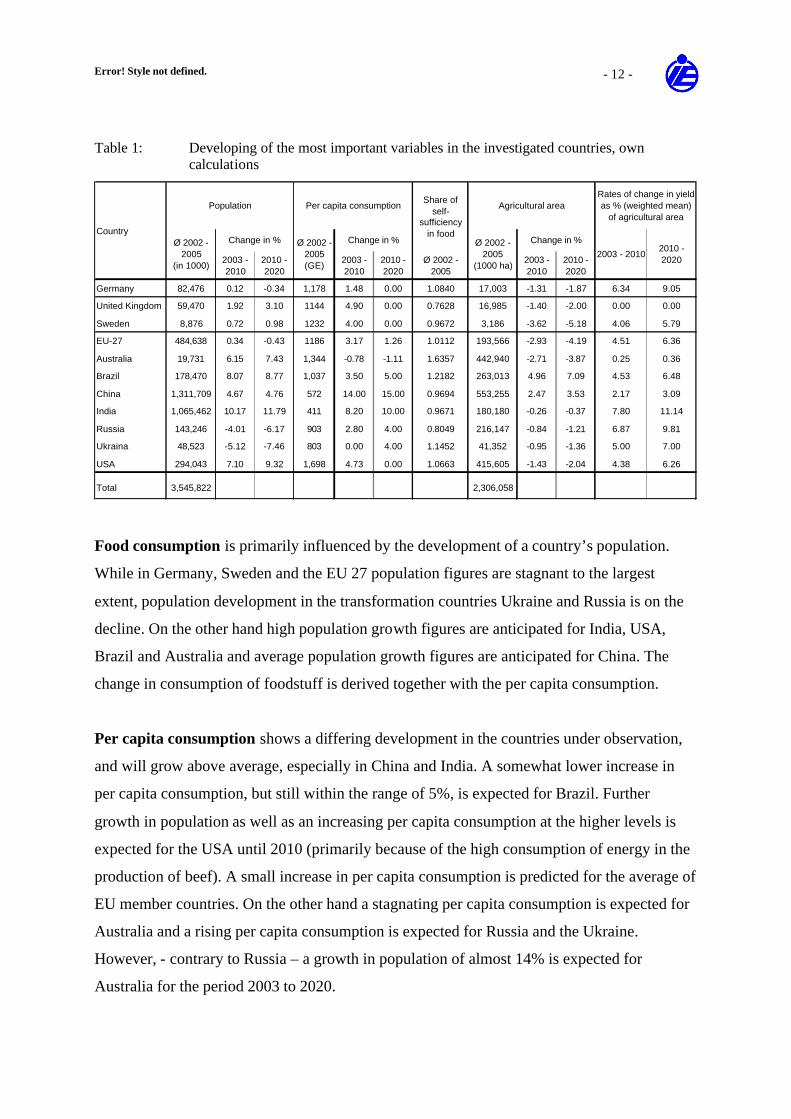
Error! Style not defined. - 12 -
Table 1: Developing of the most important variables in the investigated countries, own calculations
2003 - 2010
2010 - 2020
2003 - 2010
2010 - 2020
Ø 2002 - 2005
2003 - 2010
2010 - 2020
Germany 82,476 0.12 -0.34 1,178 1.48 0.00 1.0840 17,003 -1.31 -1.87 6.34 9.05
United Kingdom 59,470 1.92 3.10 1144 4.90 0.00 0.7628 16,985 -1.40 -2.00 0.00 0.00
Sweden 8,876 0.72 0.98 1232 4.00 0.00 0.9672 3,186 -3.62 -5.18 4.06 5.79
EU-27 484,638 0.34 -0.43 1186 3.17 1.26 1.0112 193,566 -2.93 -4.19 4.51 6.36
Australia 19,731 6.15 7.43 1,344 -0.78 -1.11 1.6357 442,940 -2.71 -3.87 0.25 0.36
Brazil 178,470 8.07 8.77 1,037 3.50 5.00 1.2182 263,013 4.96 7.09 4.53 6.48
China 1,311,709 4.67 4.76 572 14.00 15.00 0.9694 553,255 2.47 3.53 2.17 3.09
India 1,065,462 10.17 11.79 411 8.20 10.00 0.9671 180,180 -0.26 -0.37 7.80 11.14
Russia 143,246 -4.01 -6.17 903 2.80 4.00 0.8049 216,147 -0.84 -1.21 6.87 9.81
Ukraina 48,523 -5.12 -7.46 803 0.00 4.00 1.1452 41,352 -0.95 -1.36 5.00 7.00
USA 294,043 7.10 9.32 1,698 4.73 0.00 1.0663 415,605 -1.43 -2.04 4.38 6.26
Total 3,545,822 2,306,058
CountryØ 2002 -
2005(in 1000)
Ø 2002 - 2005(GE)
Change in % Change in % Ø 2002 - 2005
(1000 ha)
Change in %
Population Per capita consumptionRates of change in yield as % (weighted mean)
of agricultural area
Share of self-
sufficiency in food
2010 - 2020
Agricultural area
2003 - 2010
Food consumption is primarily influenced by the development of a country’s population.
While in Germany, Sweden and the EU 27 population figures are stagnant to the largest
extent, population development in the transformation countries Ukraine and Russia is on the
decline. On the other hand high population growth figures are anticipated for India, USA,
Brazil and Australia and average population growth figures are anticipated for China. The
change in consumption of foodstuff is derived together with the per capita consumption.
Per capita consumption shows a differing development in the countries under observation,
and will grow above average, especially in China and India. A somewhat lower increase in
per capita consumption, but still within the range of 5%, is expected for Brazil. Further
growth in population as well as an increasing per capita consumption at the higher levels is
expected for the USA until 2010 (primarily because of the high consumption of energy in the
production of beef). A small increase in per capita consumption is predicted for the average of
EU member countries. On the other hand a stagnating per capita consumption is expected for
Australia and a rising per capita consumption is expected for Russia and the Ukraine.
However, - contrary to Russia – a growth in population of almost 14% is expected for
Australia for the period 2003 to 2020.
Error! Style not defined. - 13 -
The self-sufficiency portion of individual countries is different. While Australia has a degree
of self-sufficiency regarding foodstuffs of more than 160%, Brazil only has got 120%, despite
its huge agricultural potential. The EU-274, China, India and the USA are within a range of
balanced self-sufficiency, while Russia on the other hand is still in a range of deficiency with
80% of self-sufficiency.
Agriculturally utilised area shows differing direction and magnitude of change in the
countries. It is estimated based on the so-called “Agricultural Area” of the FAO statistics of
1991 – 2002 /6/. Agriculturally utilised area is decreasing in industrial countries like
Australia, USA, Russia and the EU, while in threshold countries like Brazil and China an
increase could be observed due to increased utilisation of previously un-utilised agriculturally
usable areas, and to a certain extent of rain forest areas, and this trend is expected to continue
in the coming years until 2020. It has not been taken into consideration that the global change
in climate can lead to a gain in areas (Northern Europe) or to a loss of areas (Southern
Sahara). These effects will, however, not yet be able to be confirmed by 2020.
The assumptions regarding future development of yield are of cardinal importance for the
result of the estimation of potential. Linear regression coefficients were calculated for the
period 1994 - 20025 for the relevant cultivars (grain, oil crops, root crops, sugar cane and
sugar beet, starchy root crops and agricultural feed crops [Silage maize and similar] for
purposes of estimation. For strongly deviating trends within time series, change rates were
oriented on plausibility criteria.
Only very fragmentary data is available for area yield of grasslands and their development6. In
order not to over-estimate the potential of energy crops, it was assumed for all countries, that
no yield increases were to be expected for grasslands for the period until 20207.
4 Within the EU, Great Britain shows a traditionally low degree of self-sufficiency. Sweden and Germany are
close to being self-sufficient.
5 The growth rate per year is established from the regression coefficients with reference to the average yield level of the past three years. In Germany, for instance, it is 1.29% for grain. The average improvement rate per year, weighted with the area proportions of all cultures, is 0.97%; this result in a growth of 6.35% for the period 2003 – 2010, based on 2003. Based on this increase in yield, the improvement rate for the decade 2010 – 2020 with constant absolute increase in yield per year is 9.07%, based on 2010.
6 For example, the yield of permanent grasslands in Germany rose from 73.7 dt dry hay mass/ha in 1992 to 82.5 dt dry hay mass/ha in 2001. The rate of change of yield for Germany therewith was only 1%/year, compared to about 1.5% for agricultural market crops.
7 Arguments for both more optimistic and more pessimistic assumption (decreasing absolute yield gain) can be tabled. In view of higher yield increase rates in case of the bio-energy option by virtue of a stronger focus on
Error! Style not defined. - 14 -
In those countries dominating world trade with agricultural products, like for instance USA,
Brazil, the EU-27, and here especially their large agricultural area states France, Germany and
Poland, yields are characterized by sustained significant increases. Noteworthy increases in
yield were achieved in the past, even in the most densely populated countries of the world,
China and India, and further increases in yield can be expected. In Russia and the Ukraine
yield increases were initially negative or only slightly positive directly after the political
turnaround. During the past years they achieved average values, however, still at a low yield
level.
For areas with specific and apparently increasing drought, like Australia, yield increases were
negative. They are quite frequently ascribed to the results of climatic change in this respect.
Changes in climate will not only result in increased limitation of growth in yield as a result of
temperature increases and rainfall deficits in arid areas, but also in growth impulses due to
higher CO2 concentrations and increased temperatures in other areas. However, these effects
appear to be limited and insignificant until 2020.
2.2.3 Land availability
For the estimation of area potential for bio-mass for generating energy, a consistent method
was used to calculate results for all countries presented. Table 2 shows the potential for the
basis (2002 till 2005), which is defined as fallow land and surplus production of subsidized
commodities. Negative values for milk and beef in several countries indicate the need of
imports. Only land areas with positive value can be used for energy crops. On the other hand
areas with negative values indicate land occupation abroad for imports, due to comparative
cost advantages. Thus it was not deducted from the domestic potential area for bio-energy.
The figures in Error! Reference source not found. show that even the United Kingdom as a
country with large deficits in domestic food supply has a small potential for bio-energy from
fallow land and crop production surpluses. China is importing milk and beef products, but it
can use small export quantities of specific crops for conversion to bio-energy. As total
potential area of a country only the figures with positive sign are add up. At the button of the
table areas with positive and negative sign are balanced in order to show a net potential for
plant cultivation for higher energy yields in future, area-specific cultivation and better management, the selected approach seems to be rather pessimistic.
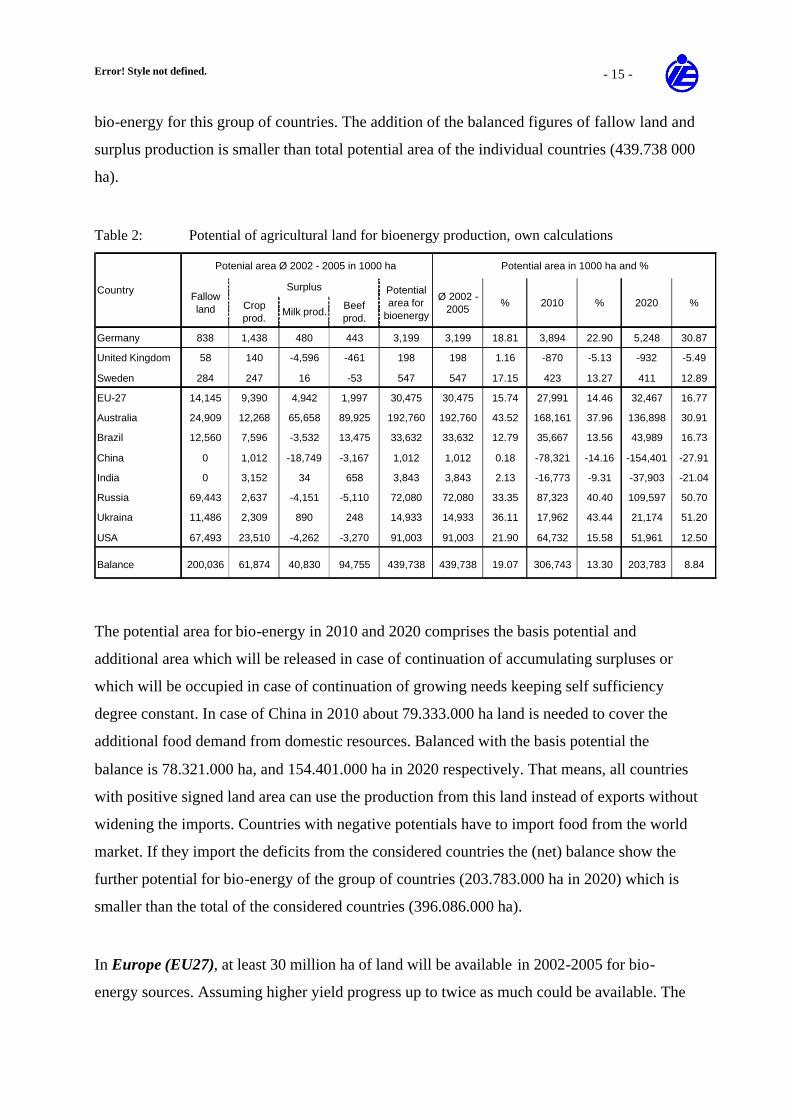
Error! Style not defined. - 15 -
bio-energy for this group of countries. The addition of the balanced figures of fallow land and
surplus production is smaller than total potential area of the individual countries (439.738 000
ha).
Table 2: Potential of agricultural land for bioenergy production, own calculations
Crop prod.
Milk prod.Beef prod.
Germany 838 1,438 480 443 3,199 3,199 18.81 3,894 22.90 5,248 30.87
United Kingdom 58 140 -4,596 -461 198 198 1.16 -870 -5.13 -932 -5.49
Sweden 284 247 16 -53 547 547 17.15 423 13.27 411 12.89
EU-27 14,145 9,390 4,942 1,997 30,475 30,475 15.74 27,991 14.46 32,467 16.77
Australia 24,909 12,268 65,658 89,925 192,760 192,760 43.52 168,161 37.96 136,898 30.91
Brazil 12,560 7,596 -3,532 13,475 33,632 33,632 12.79 35,667 13.56 43,989 16.73
China 0 1,012 -18,749 -3,167 1,012 1,012 0.18 -78,321 -14.16 -154,401 -27.91
India 0 3,152 34 658 3,843 3,843 2.13 -16,773 -9.31 -37,903 -21.04
Russia 69,443 2,637 -4,151 -5,110 72,080 72,080 33.35 87,323 40.40 109,597 50.70
Ukraina 11,486 2,309 890 248 14,933 14,933 36.11 17,962 43.44 21,174 51.20
USA 67,493 23,510 -4,262 -3,270 91,003 91,003 21.90 64,732 15.58 51,961 12.50
Balance 200,036 61,874 40,830 94,755 439,738 439,738 19.07 306,743 13.30 203,783 8.84
2020 %%Country
Ø 2002 - 2005
%
Potential area in 1000 ha and %Potenial area Ø 2002 - 2005 in 1000 ha
Fallow land
Potential area for
bioenergy
Surplus
2010
The potential area for bio-energy in 2010 and 2020 comprises the basis potential and
additional area which will be released in case of continuation of accumulating surpluses or
which will be occupied in case of continuation of growing needs keeping self sufficiency
degree constant. In case of China in 2010 about 79.333.000 ha land is needed to cover the
additional food demand from domestic resources. Balanced with the basis potential the
balance is 78.321.000 ha, and 154.401.000 ha in 2020 respectively. That means, all countries
with positive signed land area can use the production from this land instead of exports without
widening the imports. Countries with negative potentials have to import food from the world
market. If they import the deficits from the considered countries the (net) balance show the
further potential for bio-energy of the group of countries (203.783.000 ha in 2020) which is
smaller than the total of the considered countries (396.086.000 ha).
In Europe (EU27), at least 30 million ha of land will be available in 2002-2005 for bio-
energy sources. Assuming higher yield progress up to twice as much could be available. The
Error! Style not defined. - 16 -
proportion of land made available accounted for grassland is almost zero, because an increase
of yields on grassland was not assumed. . The example countries Germany, Sweden and Great
Britain show significant differences in both initial potential and development: While the
potential in Germany almost doubles from ca. 3 million ha/a in 2003 to ca. 5 million ha/a in
2020, and then almost comprises 20% of the total potential of the EU-27, no area potential is
envisaged for Great Britain for the cultivation of energy crops and in Sweden only a
stagnating potential of 0.4 – 0.5 million ha/a is predicted (Table 2). These differing trends can
be reduced to differing population trends and differences in the current and future dedication
of agricultural areas.
Besides the USA, Australia is one of the countries with the highest grain export surplus. With
more than 440 million ha of agriculturally utilized area, more than 20 ha of agricultural area
per capita is available. However, the trend in this respect has been strongly regressive in the
past years.8. If this trend continues, it is expected that the significant area potential available
in 2003 for bio-energy (almost 193 million ha), compared to 137 million ha in 2020 is
markedly regressive, because a strong growth in population coincides with a reduction in
agriculturally utilised area and yield. 9
The USA disposes of an agriculturally utilized area of comparable size to Australia. However,
only 1.4 ha of agriculturally usable land per capita is available. Noteworthy successes in a
further increase in yield per ha have been achieved and will still be achieved in future. A
significant expansion of yield-effective cultivation of maize and a consistent utilization of
genetically modified cultivars is expected to play a major role here. With an area potential of
91 million ha (extending beyond domestic supply for the population), the USA disposes over
large area and production potential, based on high average yields. Area potential also results
from a significant scope of fallow areas and extensive irrigation and dual-crop areas.
8 Since yields have also been slightly regressive, structural changes could also be ascribed to influences of
climatic change besides numerous economic factors.
9 Australia has about 443 mn ha of agricultural land which consist out of 43 mn ha arable land and 400 mn ha grassland. Arable land is allocated to cereals about 20 mn ha with an average yield of only 1.73 t per ha. Whereas yield of crops on arable land were slightly increasing last years (0.3 %/year) yields on grassland did decrease. Of course among arable land there is a fraction of irrigated land with high and another fraction of rain fed land with low productivity. Water availability is a serious problem in Australia causing small harvests in the last three years.
Error! Style not defined. - 17 -
However, all developments point to the area potential for bio-energy in the USA to be
regressive over time.
Brazil currently is one of the big agricultural exporters of the world, and at the same time
Brazil is one of the largest exporters of ethanol world-wide. The agriculturally utilised area
has been expanded significantly during the past ten years, and at the same time average yield
could be increased, comparably to the scope of increases achieved in the EU-27 and the USA.
Available area potential for bio-energy of about 33 million ha as a base line, will be increased
only marginally until 2010, but then stronger until 2020 up to 44 million ha (while retaining
the currently high proportion of utilising agricultural raw materials for bio-energy [especially
bio-ethanol]).
China can currently still provide enough food for itself, however only about 0.4ha
agriculturally used area is available per capita. And this number is decreasing rapidly. On the
other hand it was possible to increase yield, even more than in highly developed industrial
countries, and it is expected that this will be possible until 2020. An evaluation of
developments shows that only about 1 million ha are available for bio-energy cultivation.
Domestically produced dairy products and beef are short in supply and are being imported. If
the additionally required foodstuffs for 2010 are to be produced domestically, which is an
assumption of the estimation method, then an area potential of 78 million ha will be short in
2010 and 154 million ha in 2020. This requirement of area is calculated on the basis of the
less productive grasslands in the north and west of the country. China will, however, not
satisfy the growing demand for dairy products and beef by utilizing these areas, but will rather
produce with highly productive Lucerne and maize cultivation systems, which results in only
a fraction of the required area, displayed in the table. The indicated figures are therefore
highly over-estimated. All the same, it is obvious: only through major political efforts will it
be possible to counteract the trend of growing imports of foodstuffs.
India has got only 0.17 ha of area per capita. This area is utilised intensively by multiple
crops and a significant increase in yield could already be achieved by increased cultivar yields
and an acceleration of the cropping index. The trends indicate an increasing requirement for
import of foodstuffs, but that it would be possible to feed the population from own resources
Error! Style not defined. - 18 -
with a lot of effort. If this is not achieved, continued trends will lead to a deficit of 38 million
ha of area potential in 2020 in this country.
Russia disposes of a huge agriculturally usable area of 216 million ha. About 1.5 ha of
agriculturally utilised area is available per capita. The level of productivity was exceptionally
low for 2002 – 2005. During the first years of transformation it declined, but has shown
strong growth since a few years. Russia therefore disposes of significant area potential to
increase the production of foodstuffs. These are mainly situated in fallow areas, which are
currently not being utilised. It must be assumed that the extremely low level of production
will increase significantly more than during the time period on which the regression analysis
is based, due to the renovation of agricultural technology, which started years ago. In the
medium term Russian agriculture will profit significantly from the climatic change. With
increasing agricultural prices, an area potential of more than 100 million ha can be made
available for the generation of bio-energy.
In the Ukraine the same trends have shown up during the transformation process as for
Russia. The Ukraine is a country with an agricultural surplus. Contrary to Russia, it has not
yet been possible to convert increases in productivity into a positive development of yield
through modernisation of agriculture. Growing area and production potential can in future,
however, result in comparatively similar orders of magnitude as in Russia. Decreasing per
capita consumption trends and yield change rates will not continue. The estimation leads to
growing area potential for bio-energy sources in the order of ca. 20 million ha.
A summation of area potential of the countries under observation shows that basically the
countries under observation dispose of a much larger area potential for agricultural surpluses
or bio-energy – almost 440 million ha, which will decrease to 200 million ha by 2020 due to
an increase in the demand for foodstuffs. It has to be taken into consideration, that an
excessive area demand of at least 100 million ha has been assumed for China. Besides this,
two important countries with agricultural surpluses, Argentina and Canada, have not been
taken into consideration, and only area potential has been estimated, rather than production
potential. The development does, however, show that less potential is available for providing
foodstuffs and for servicing world agricultural trade. Of all the countries taken into
consideration, only the EU, Brazil, Russia and the Ukraine show a growing area potential in
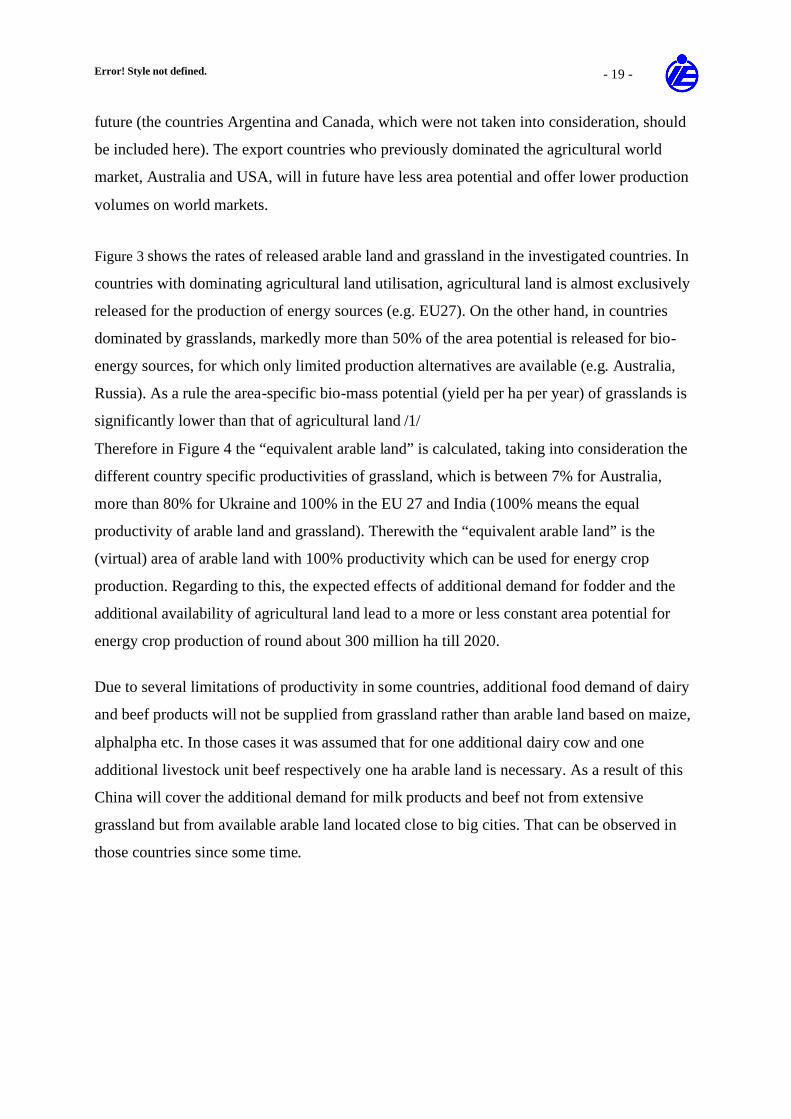
Error! Style not defined. - 19 -
future (the countries Argentina and Canada, which were not taken into consideration, should
be included here). The export countries who previously dominated the agricultural world
market, Australia and USA, will in future have less area potential and offer lower production
volumes on world markets.
Figure 3 shows the rates of released arable land and grassland in the investigated countries. In
countries with dominating agricultural land utilisation, agricultural land is almost exclusively
released for the production of energy sources (e.g. EU27). On the other hand, in countries
dominated by grasslands, markedly more than 50% of the area potential is released for bio-
energy sources, for which only limited production alternatives are available (e.g. Australia,
Russia). As a rule the area-specific bio-mass potential (yield per ha per year) of grasslands is
significantly lower than that of agricultural land /1/
Therefore in Figure 4 the “equivalent arable land” is calculated, taking into consideration the
different country specific productivities of grassland, which is between 7% for Australia,
more than 80% for Ukraine and 100% in the EU 27 and India (100% means the equal
productivity of arable land and grassland). Therewith the “equivalent arable land” is the
(virtual) area of arable land with 100% productivity which can be used for energy crop
production. Regarding to this, the expected effects of additional demand for fodder and the
additional availability of agricultural land lead to a more or less constant area potential for
energy crop production of round about 300 million ha till 2020.
Due to several limitations of productivity in some countries, additional food demand of dairy
and beef products will not be supplied from grassland rather than arable land based on maize,
alphalpha etc. In those cases it was assumed that for one additional dairy cow and one
additional livestock unit beef respectively one ha arable land is necessary. As a result of this
China will cover the additional demand for milk products and beef not from extensive
grassland but from available arable land located close to big cities. That can be observed in
those countries since some time.
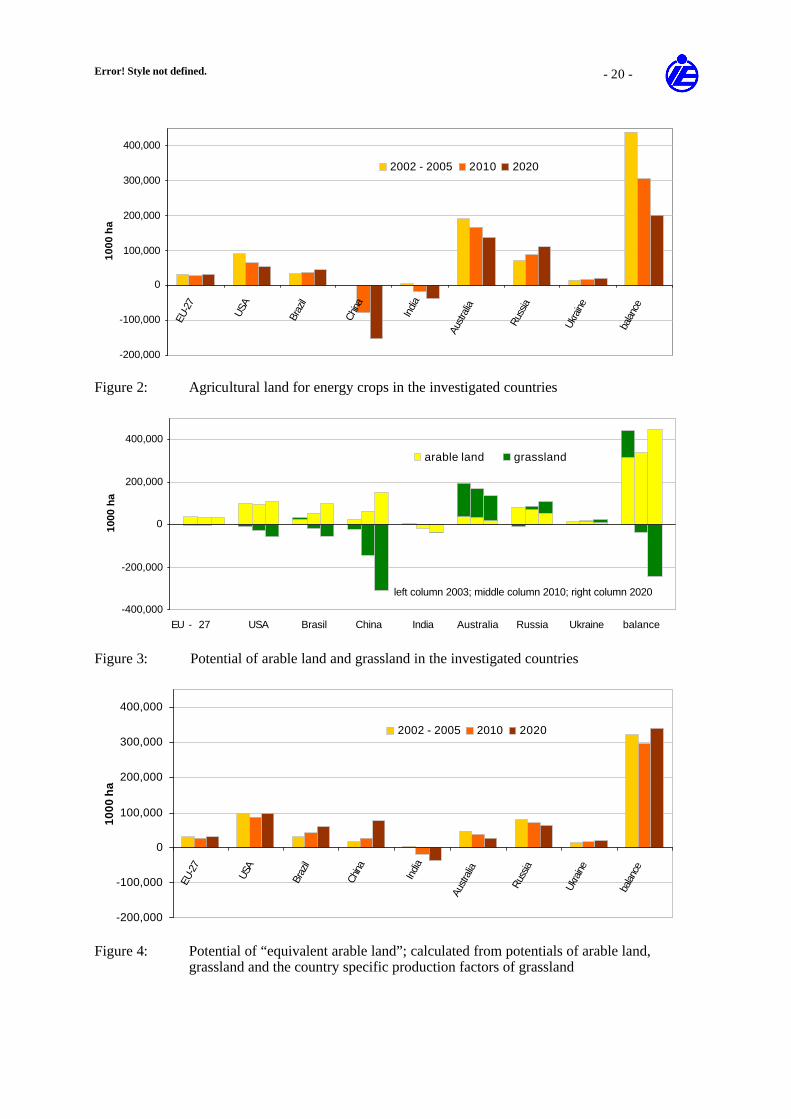
Error! Style not defined. - 20 -
-200,000
-100,000
0
100,000
200,000
300,000
400,000
EU-2
7
USA
Braz
il
China India
Austr
alia
Russ
ia
Ukra
ine
balan
ce
1000
ha
2002 - 2005 2010 2020
Figure 2: Agricultural land for energy crops in the investigated countries
left column 2003; middle column 2010; right column 2020
-400,000
-200,000
0
200,000
400,000
EU - 27 USA Brasil China India Australia Russia Ukraine balance
1000
ha
arable land grassland
Figure 3: Potential of arable land and grassland in the investigated countries
-200,000
-100,000
0
100,000
200,000
300,000
400,000
EU-2
7
USA
Braz
il
China India
Austr
alia
Russ
ia
Ukra
ine
balan
ce
1000
ha
2002 - 2005 2010 2020
Figure 4: Potential of “equivalent arable land”; calculated from potentials of arable land,
grassland and the country specific production factors of grassland
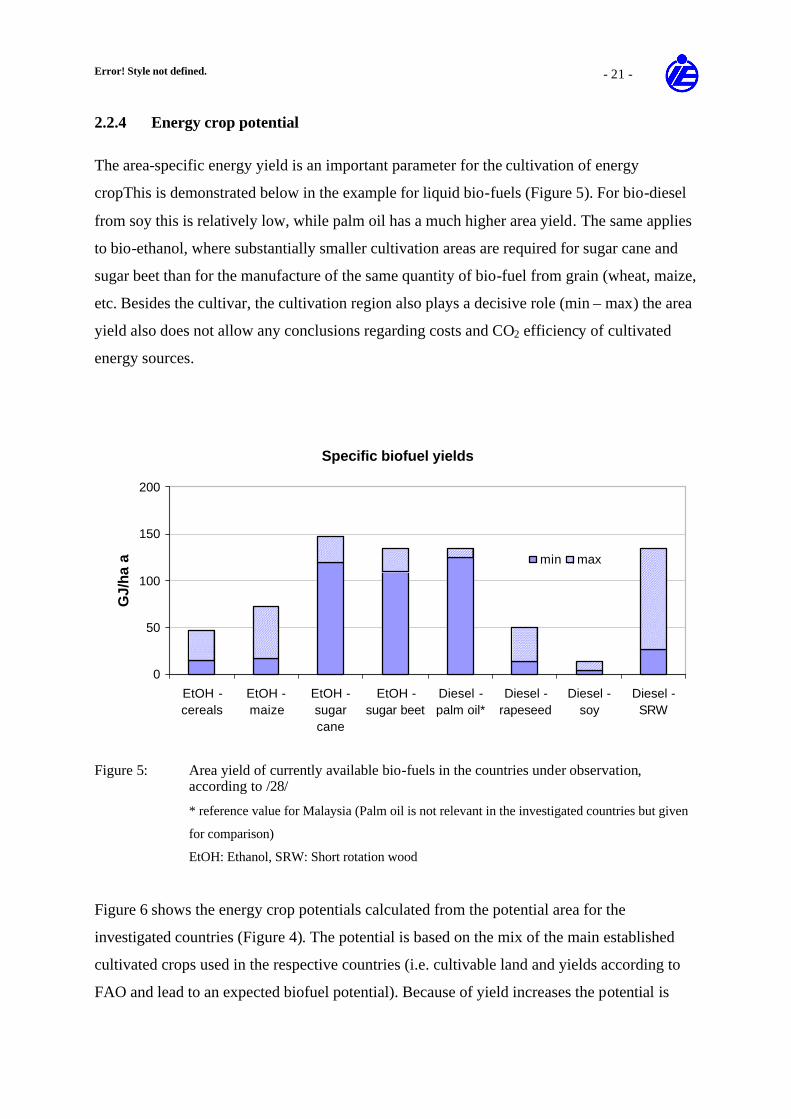
Error! Style not defined. - 21 -
2.2.4 Energy crop potential
The area-specific energy yield is an important parameter for the cultivation of energy
cropThis is demonstrated below in the example for liquid bio-fuels (Figure 5). For bio-diesel
from soy this is relatively low, while palm oil has a much higher area yield. The same applies
to bio-ethanol, where substantially smaller cultivation areas are required for sugar cane and
sugar beet than for the manufacture of the same quantity of bio-fuel from grain (wheat, maize,
etc. Besides the cultivar, the cultivation region also plays a decisive role (min – max) the area
yield also does not allow any conclusions regarding costs and CO2 efficiency of cultivated
energy sources.
Specific biofuel yields
0
50
100
150
200
EtOH -cereals
EtOH -maize
EtOH -sugarcane
EtOH -sugar beet
Diesel -palm oil*
Diesel -rapeseed
Diesel -soy
Diesel -SRW
GJ/
ha a min max
Figure 5: Area yield of currently available bio-fuels in the countries under observation,
according to /28/
* reference value for Malaysia (Palm oil is not relevant in the investigated countries but given
for comparison)
EtOH: Ethanol, SRW: Short rotation wood
Figure 6 shows the energy crop potentials calculated from the potential area for the
investigated countries (Figure 4). The potential is based on the mix of the main established
cultivated crops used in the respective countries (i.e. cultivable land and yields according to
FAO and lead to an expected biofuel potential). Because of yield increases the potential is
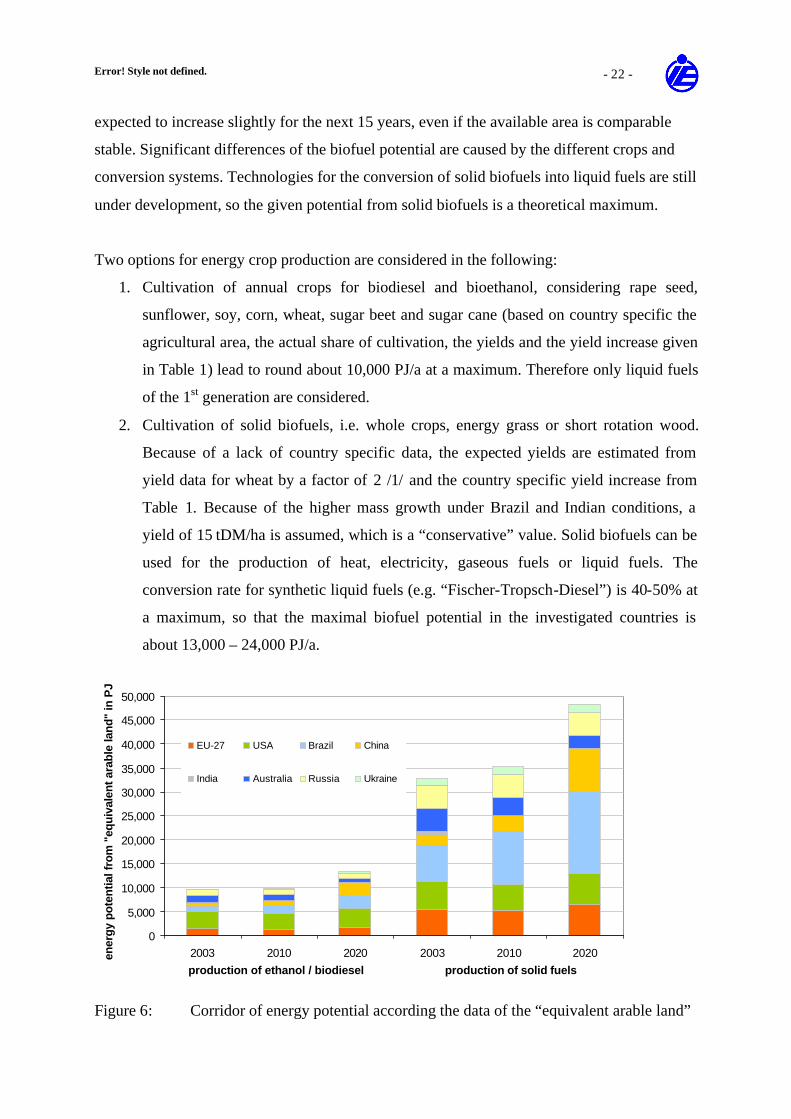
Error! Style not defined. - 22 -
expected to increase slightly for the next 15 years, even if the available area is comparable
stable. Significant differences of the biofuel potential are caused by the different crops and
conversion systems. Technologies for the conversion of solid biofuels into liquid fuels are still
under development, so the given potential from solid biofuels is a theoretical maximum.
Two options for energy crop production are considered in the following:
1. Cultivation of annual crops for biodiesel and bioethanol, considering rape seed,
sunflower, soy, corn, wheat, sugar beet and sugar cane (based on country specific the
agricultural area, the actual share of cultivation, the yields and the yield increase given
in Table 1) lead to round about 10,000 PJ/a at a maximum. Therefore only liquid fuels
of the 1st generation are considered.
2. Cultivation of solid biofuels, i.e. whole crops, energy grass or short rotation wood.
Because of a lack of country specific data, the expected yields are estimated from
yield data for wheat by a factor of 2 /1/ and the country specific yield increase from
Table 1. Because of the higher mass growth under Brazil and Indian conditions, a
yield of 15 tDM/ha is assumed, which is a “conservative” value. Solid biofuels can be
used for the production of heat, electricity, gaseous fuels or liquid fuels. The
conversion rate for synthetic liquid fuels (e.g. “Fischer-Tropsch-Diesel”) is 40-50% at
a maximum, so that the maximal biofuel potential in the investigated countries is
about 13,000 – 24,000 PJ/a.
0
5,000
10,000
15,000
20,000
25,000
30,000
35,000
40,000
45,000
50,000
2003 2010 2020 2003 2010 2020ener
gy p
oten
tial f
rom
"eq
uiva
lent
ara
ble
land
" in
PJ
EU-27 USA Brazil China
India Australia Russia Ukraine
production of ethanol / biodiesel production of solid fuels
Figure 6: Corridor of energy potential according the data of the “equivalent arable land”
Error! Style not defined. - 23 -
2.2.5 Conclusion fort the energy crop potential till 2020
The calculations in the previous chapters, for estimating the potential of energy sources, are
based on assumptions about the political basic conditions and the development of future
trends. It is assumed that the policy of the countries could in future be aligned towards
relinquishing subsidised exports of agricultural products and instead to use the instrument of
market introduction programmes to use these as regenerative raw materials for the production
of bio-energy sources. This is the route taken in the USA and in the EU. The targets for the
proportion of bio-mass of the total energy consumption as well as support of bio-energy
production have been set so high, that the potentials established in the calculations above can
be used for the production of bio-energy in the medium term. In the other countries taken into
observation, especially Russia and the Ukraine, a diversion of agricultural raw materials to the
production of bio-energy is unlikely. At the same time further development of agricultural
production in these countries is of major importance for meeting the world demand for
foodstuffs.
For the estimation of area potential it was assumed that 100% of fallow land can be utilised
for the production of foodstuffs or energy crops. These agricultural areas are agriculturally
utilised areas, which were previously used for the cultivation of agricultural crops until they
were laid fallow as a result of politically initiated abandonment obligations. Depending on the
political measures, low yield areas were laid fallow wherever possible. As a result, the
assumption of a 100% re-utilisation of the areas leads to an over-estimation of the potential.
But since this only applies to less than 10% of the agricultural area, and because a yield
expectation on these areas is only marginally lower, the effect should be minor.
For the estimation of potentials it was further assumed, that yield improvement of the past 15
years could be sustained linearly, with the exception of Russia, Ukraine and some of the
recently joined EU countries. This assumption appears to be rather pessimistic. On the one
hand countries with lucrative promotion programmes for bio-energy source cultivars,
substitute high yield maize for wheat and even lower yield grains, and on the other hand a
substantially higher potential can be achieved, both in the cultivation and in the development
of energy crops. In parallel with increasing utilisation of regenerative raw materials for bio-
energy sources and the associated shortage of foodstuffs, an increase in the price of
agricultural products is expected, which is strongly demonstrated since 2006 especially in the
Error! Style not defined. - 24 -
EU, but also world-wide. This price effect will lead to the mobilisation of multiple reserve
offers for agricultural products. They are contained in a higher utilisation of yield-enhancing
operation material for securing and improving yield, in re-introduction of irrigation in low
rainfall areas, in multiple utilisation of suitable areas for a second crop, e.g. as green crop for
bio-gas plants. The effects of these offers, which have not been taken into consideration in the
estimates, will more than compensate for the rather optimistic assumption regarding
utilisation of fallow areas.
Adjustment of utilisation of grasslands without an increase in yield leads to reduced bio-mass
potentials, which – according to investigations of the EU27 – will in any case have a
significant influence10. Overall, the estimation results should therefore rather be judged to be
pessimistic.
2.3 Potential of residues and by-products from agriculture
Potential of residues include residues, by-products and waste resulting from agriculture, wood
and food processing and the end of the production chain. In general the global potentials of
residues have a considerable less importance in comparison to the potentials of energy crops;
agricultural residues include round about one Third of the global potential of biomass residues
/37/. The specific fractions of the residues from a region are especially dependent on the
population, the economic status and the technical level in agriculture and forestry. The
available biomass is that which is not intended for use as a material and/or biomass resulting
as waste from use as a material. The most relevant residues from agriculture are straw and
manure/excrements. In addition to straw, beet and potato leaves are the primary harvest
residues from agriculture that can be used to produce biogas, but this biomass potential is
comparable low and depends on the regional frame condition /1/, so it is not taken into
account here.
10 In an earlier study (/1/), a potential corridor of 30 to 60 mn ha was indicated for the EU27, based on two scenarios. The basic assumptions taken here are rather in the region of cautious scenarios, i.e. in the lower range of the corridor. I
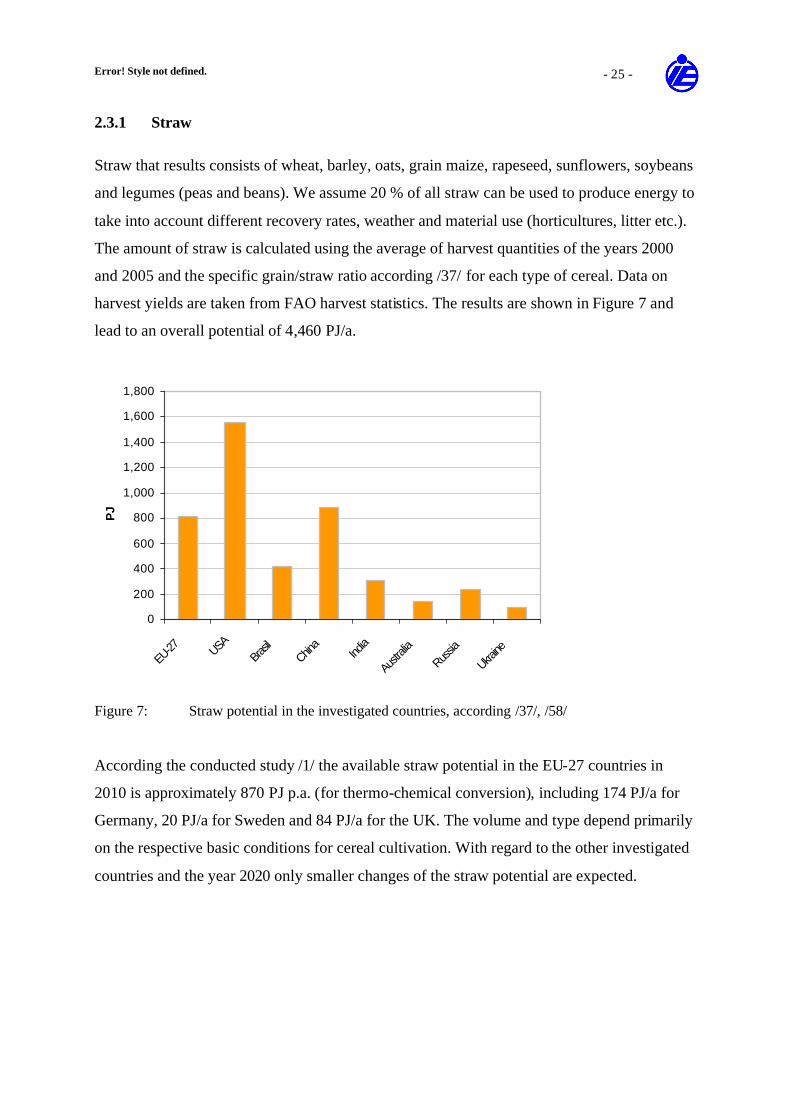
Error! Style not defined. - 25 -
2.3.1 Straw
Straw that results consists of wheat, barley, oats, grain maize, rapeseed, sunflowers, soybeans
and legumes (peas and beans). We assume 20 % of all straw can be used to produce energy to
take into account different recovery rates, weather and material use (horticultures, litter etc.).
The amount of straw is calculated using the average of harvest quantities of the years 2000
and 2005 and the specific grain/straw ratio according /37/ for each type of cereal. Data on
harvest yields are taken from FAO harvest statistics. The results are shown in Figure 7 and
lead to an overall potential of 4,460 PJ/a.
0
200
400
600
800
1,000
1,200
1,400
1,600
1,800
EU-27 USA
Brasil
China
India
Austra
lia
Russia
Ukraine
PJ
Figure 7: Straw potential in the investigated countries, according /37/, /58/
According the conducted study /1/ the available straw potential in the EU-27 countries in
2010 is approximately 870 PJ p.a. (for thermo-chemical conversion), including 174 PJ/a for
Germany, 20 PJ/a for Sweden and 84 PJ/a for the UK. The volume and type depend primarily
on the respective basic conditions for cereal cultivation. With regard to the other investigated
countries and the year 2020 only smaller changes of the straw potential are expected.
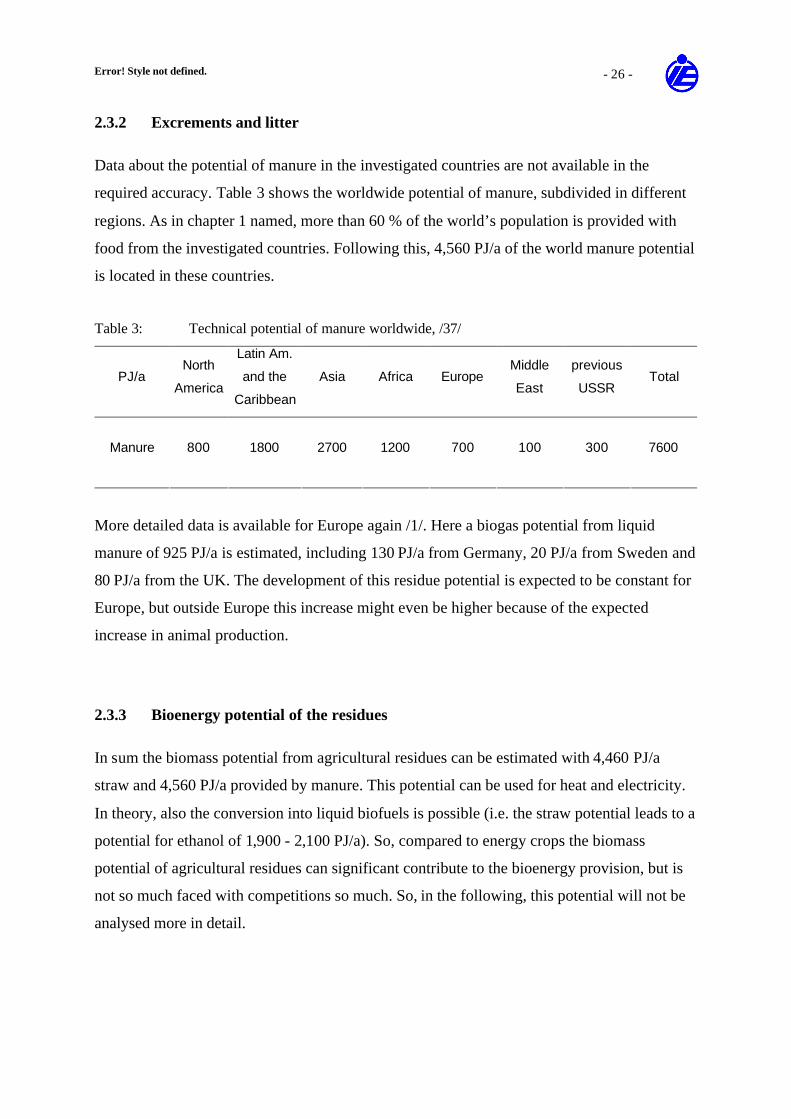
Error! Style not defined. - 26 -
2.3.2 Excrements and litter
Data about the potential of manure in the investigated countries are not available in the
required accuracy. Table 3 shows the worldwide potential of manure, subdivided in different
regions. As in chapter 1 named, more than 60 % of the world’s population is provided with
food from the investigated countries. Following this, 4,560 PJ/a of the world manure potential
is located in these countries.
Table 3: Technical potential of manure worldwide, /37/
PJ/a North
America
Latin Am.
and the
Caribbean
Asia Africa Europe Middle
East
previous
USSR Total
Manure 800 1800 2700 1200 700 100 300 7600
More detailed data is available for Europe again /1/. Here a biogas potential from liquid
manure of 925 PJ/a is estimated, including 130 PJ/a from Germany, 20 PJ/a from Sweden and
80 PJ/a from the UK. The development of this residue potential is expected to be constant for
Europe, but outside Europe this increase might even be higher because of the expected
increase in animal production.
2.3.3 Bioenergy potential of the residues
In sum the biomass potential from agricultural residues can be estimated with 4,460 PJ/a
straw and 4,560 PJ/a provided by manure. This potential can be used for heat and electricity.
In theory, also the conversion into liquid biofuels is possible (i.e. the straw potential leads to a
potential for ethanol of 1,900 - 2,100 PJ/a). So, compared to energy crops the biomass
potential of agricultural residues can significant contribute to the bioenergy provision, but is
not so much faced with competitions so much. So, in the following, this potential will not be
analysed more in detail.
Error! Style not defined. - 27 -
2.4 Long-term outlook of the development of land availability for energy crop
production till 2050
2.4.1 Energy crops
The Institute for Energy and Environment compared different studies which deal with the
theme of worldwide potential for agricultural biomass production, i.e. the potentials of
residues and energy crops. The energy crop potential is the most important but also a variable
biomass fraction. The results of the most comprehensible studies were compared and shown
in the following. They describe the effects in a corridor till 2050 (2100) of the different
influencing factors by using the following presumptions which have primary an effect of the
energy crop potential /4/:
1. Global population between 7.7 and 10.6 billion people till 2050 (UNEP; 2005: 6.5
billion people).
2. Per-capita food consumption between 3,186 and 3,600 kcal/d till 2050 (2000: 2,789
kcal/d). This means that the food consumption will increase between 18 % and 28 %.
3. Increase of crop yields by breeding until 2030 by 1,2 % p.a. (FAO), afterwards
between 0.5 and 2.2 % p.a. Therewith a corridor between +60 and +120 % is given.
4. Increase of crop yields by agricultural management between 6.3 and 9.1 t/(ha a) (2000:
3.5 to 5.0 t/(ha a)). Therewith a corridor between +80 and +160 % is given which
shows, that the factor of agricultural management is an uncertainty factor. Essential
for the development of this factor will be the future situation in Africa and Asia as
regions with insecure conditions and unsettled developments.
5. Loss of the agricultural land by climate change between 0 and -7 % till 2025. In these
data no abrupt changes like different atmospheric circulations are taken into account.
After 2025 no figures are available yet.
It is also unclear if the climate change will have positive bearings on the cultivation of
energy crops.
6. Loss of arable land by soil degradation (erosion, salinisation) between 5 and 12
million ha/a from 13 billion ha of agricultural acreage; additional need of areas for
non-agricultural purposes (infrastructure, restrictions of use etc.) until 2040 between
1 % and 4 %. Therewith a corridor between -2 and -9 % is given
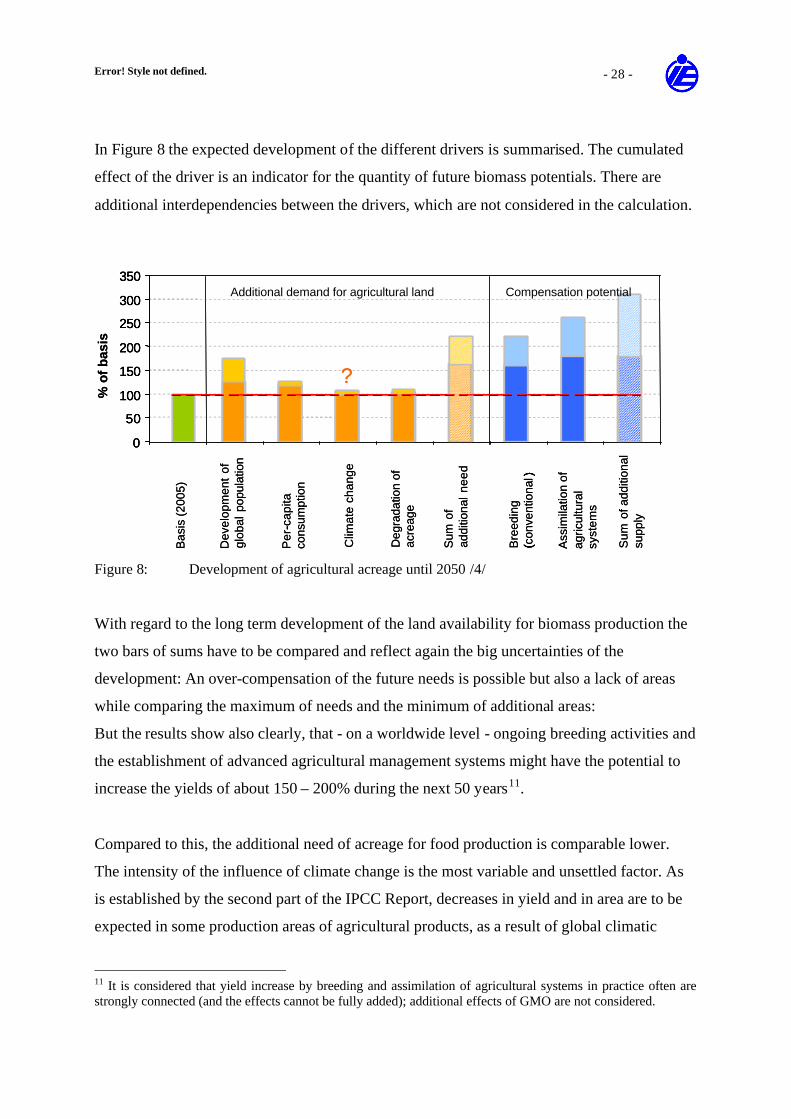
Error! Style not defined. - 28 -
In Figure 8 the expected development of the different drivers is summarised. The cumulated
effect of the driver is an indicator for the quantity of future biomass potentials. There are
additional interdependencies between the drivers, which are not considered in the calculation.
0
50
100
150
200
250
300
350
Bas
is (
2005
)
Bre
edin
g(c
onve
ntio
nal)
Ass
imila
tion
of
agric
ultu
ral
syst
ems
Sum
of a
dditi
onal
su
pply
()
% o
f b
asis
Dev
elop
men
tof
gl
obal
pop
ulat
ion
Per
-cap
itaco
nsum
ptio
n
Clim
ate
chan
ge
Deg
rada
tion
of
acre
age
Sum
of
addi
tiona
l nee
d
?
-
0
50
100
150
200
250
300
350
0
50
100
150
200
250
300
350
Bas
is (
2005
)
Bre
edin
g(c
onve
ntio
nal)
Ass
imila
tion
of
agric
ultu
ral
syst
ems
Sum
of a
dditi
onal
su
pply
()
% o
f b
asis
Dev
elop
men
tof
gl
obal
pop
ulat
ion
Per
-cap
itaco
nsum
ptio
n
Clim
ate
chan
ge
Deg
rada
tion
of
acre
age
Sum
of
addi
tiona
l nee
d
?
-
Figure 8: Development of agricultural acreage until 2050 /4/
With regard to the long term development of the land availability for biomass production the
two bars of sums have to be compared and reflect again the big uncertainties of the
development: An over-compensation of the future needs is possible but also a lack of areas
while comparing the maximum of needs and the minimum of additional areas:
But the results show also clearly, that - on a worldwide level - ongoing breeding activities and
the establishment of advanced agricultural management systems might have the potential to
increase the yields of about 150 – 200% during the next 50 years11.
Compared to this, the additional need of acreage for food production is comparable lower.
The intensity of the influence of climate change is the most variable and unsettled factor. As
is established by the second part of the IPCC Report, decreases in yield and in area are to be
expected in some production areas of agricultural products, as a result of global climatic
11 It is considered that yield increase by breeding and assimilation of agricultural systems in practice often are strongly connected (and the effects cannot be fully added); additional effects of GMO are not considered.
Additional demand for agricultural land Compensation potential
Error! Style not defined. - 29 -
changes. This applies specifically to tropical areas and regions with seasonal droughts. On the
other hand, areas with a large agricultural potential like Canada and Northern Europe, will
experience a significant increase in yield potential due to the extension of the vegetation
period and the fertilizer effect of higher CO2 concentrations. It will be decisive for the balance
of the production effects, how high the global rise in temperature will be. If it exceeds 2 –
3°C, yield potentials could decrease globally. This can be expected with certainty for a global
temperature rise of 6°C.
2.4.2 Residues
Overall the global potentials of residues have a considerably less importance than the
potentials of energy crops. The part of each residue fraction can vary in the different regions
and is mainly dependent on the population, the living standard and the methods and intensity
of the agricultural and forestal production in that region. There are several studies available
analysing the long term residue potential in detail, but a direct comparability of the studies is
not possible, because different assumptions were used. But by most of the authors, the global
residue potential is expected to develop much more stable and in the range of 40 till 80 PJ/a in
2050 (according /38/ and own examinations).
2.4.3 Overall potential
Because of the described uncertainties, especially in the field of energy crops, the available
studies on the long term biomass potential vary in a wide range between 20 and 450 EJ/a
(Figure 9) Some newer studies expect even a higher biomass potential of 500 EJ/a and above
(i.e. /38/, /46/, /47/). From the current point of view it is very difficult to decide, which
scenarios are the most realistic – this is caused by the different options for the development of
the drivers, already described in chapter 2.2.5 and 2.4.1 as well.
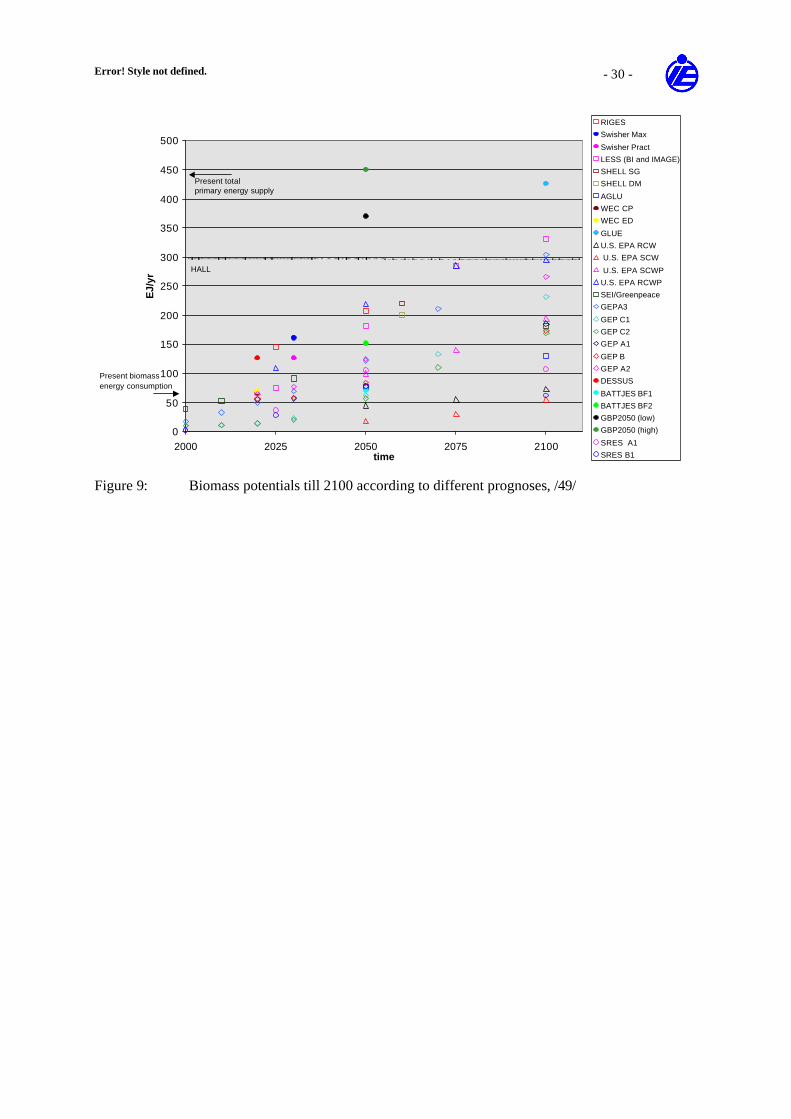
Error! Style not defined. - 30 -
Figure 9: Biomass potentials till 2100 according to different prognoses, /49/
0
50
100
150
200
250
300
350
400
450
500
2000 2025 2050 2075 2100time
EJ/
yr
RIGES
Swisher Max
Swisher Pract
LESS (BI and IMAGE)
SHELL SG
SHELL DM
AGLU
WEC CP
WEC ED
GLUE
U.S. EPA RCW
U.S. EPA SCW
U.S. EPA SCWP
U.S. EPA RCWP
SEI/Greenpeace
GEPA3
GEP C1
GEP C2
GEP A1
GEP B
GEP A2
DESSUS
BATTJES BF1
BATTJES BF2
GBP2050 (low)
GBP2050 (high)
SRES A1
SRES B1
HALL
Present total primary energy supply
Present biomass energy consumption
Error! Style not defined. - 31 -
3. Biomass use for energy
During energy recovery of bio-mass, renewable fuels from vegetable materials are directly
converted into usable heat and electrical energy or into other energy sources like fuel or
methane. In comparison to other renewable energies like water and wind, geothermal energy
or solar energy, bio-mass has got the advantage of being able to be stored. Besides the
utilisation of bio-mass from wood residues, the production of energy crops is of high
significance.
3.1 Frame conditions for the future bioenergy demand
An ever increasing number of countries frame declarations like biomass action plans or adopt
acts to increase the part of renewable energy in their country. These political targets in the
considered countries are the main drivers for the development of biomass usage for energy
production and are described in the following.
In view of the utilisation of bio-energy and the production of energy crops, various political
sectors with differing objectives collude. Table 4 shows a simplified schematic overview of
the basic objectives and points of departure of these policies as well as the basic entrenchment
of the objectives in the observed policies. It becomes clear that the basic objectives of the
various policies are contradictory in part and that the entrenchment of the objectives in the
policies of the observed countries differs significantly: For instance, the aspect of security of
supply is of very high importance in all observed countries, while climatic policy aspects have
primarily been formulated in the European Union and have been furnished with
corresponding instruments, while they are only positioned or stated programme wise in non-
European countries.
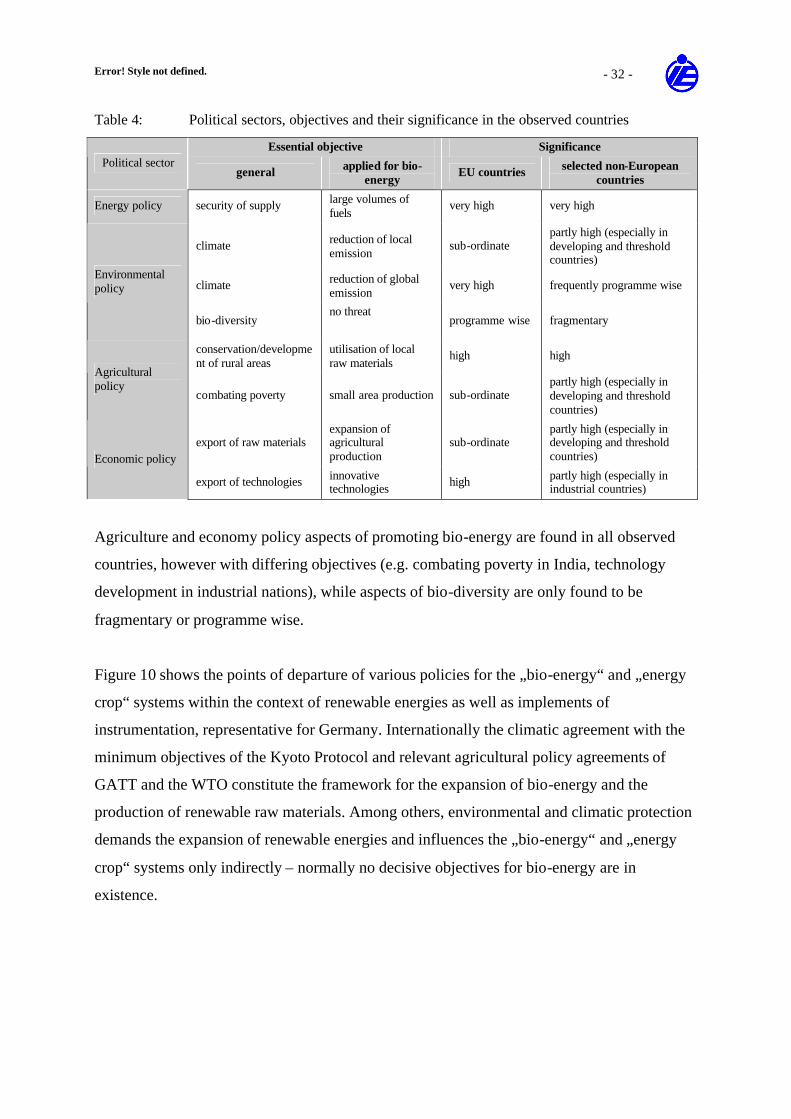
Error! Style not defined. - 32 -
Table 4: Political sectors, objectives and their significance in the observed countries
Essential objective Significance Political sector
general applied for bio-energy EU countries selected non-European
countries
Energy policy security of supply large volumes of fuels very high very high
climate reduction of local emission sub-ordinate
partly high (especially in developing and threshold countries)
climate reduction of global emission very high frequently programme wise
Environmental policy
bio-diversity no threat
programme wise fragmentary
conservation/development of rural areas
utilisation of local raw materials high high
Agricultural policy
combating poverty small area production sub-ordinate partly high (especially in developing and threshold countries)
export of raw materials expansion of agricultural production
sub-ordinate partly high (especially in developing and threshold countries) Economic policy
export of technologies innovative technologies high partly high (especially in
industrial countries)
Agriculture and economy policy aspects of promoting bio-energy are found in all observed
countries, however with differing objectives (e.g. combating poverty in India, technology
development in industrial nations), while aspects of bio-diversity are only found to be
fragmentary or programme wise.
Figure 10 shows the points of departure of various policies for the „bio-energy“ and „energy
crop“ systems within the context of renewable energies as well as implements of
instrumentation, representative for Germany. Internationally the climatic agreement with the
minimum objectives of the Kyoto Protocol and relevant agricultural policy agreements of
GATT and the WTO constitute the framework for the expansion of bio-energy and the
production of renewable raw materials. Among others, environmental and climatic protection
demands the expansion of renewable energies and influences the „bio-energy“ and „energy
crop“ systems only indirectly – normally no decisive objectives for bio-energy are in
existence.
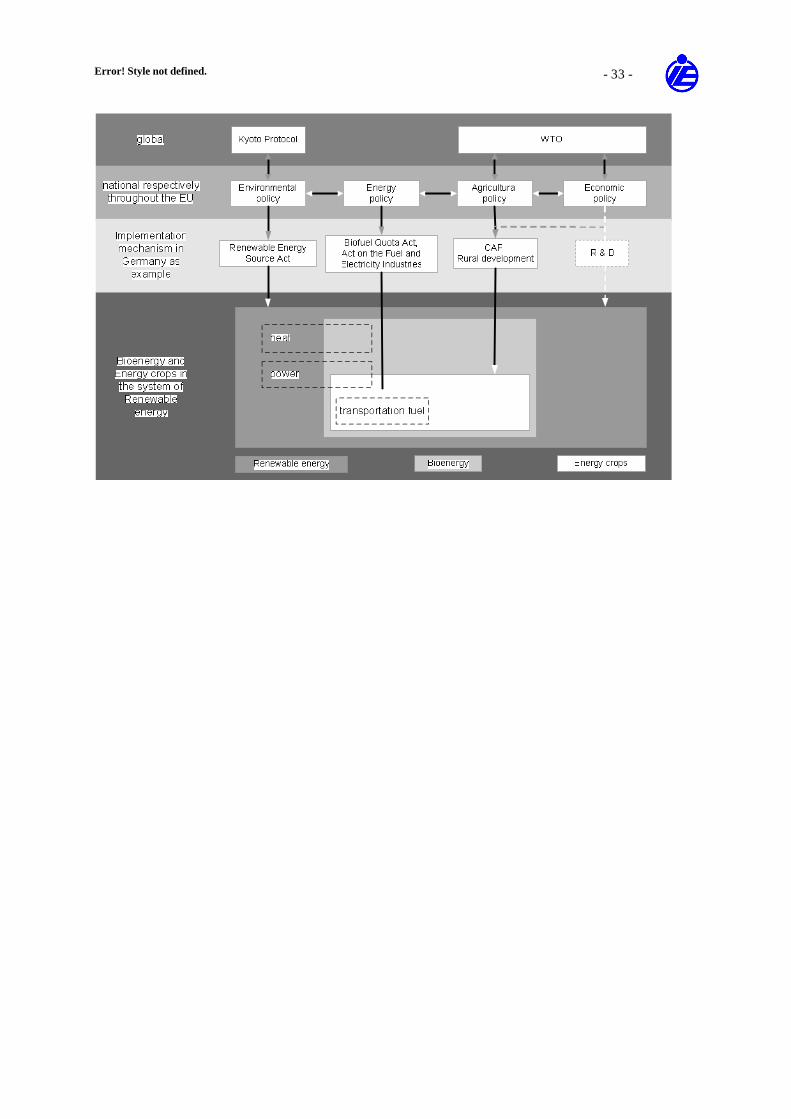
Error! Style not defined. - 33 -
Figure 10: Influence from the international, european and national politics on the production of
bioenergy and energy crops
Taking into consideration technical options, fuels are based entirely and heat is based
primarily on biogenic raw materials, while a mix of energy sources can be found in the sector
of electrical energy. This results in a differing degree of general promotion of renewable
energies for the energy sources, electricity, heat and fuel, on the bio-energy system.
Cultivation of energy crops thereby is influenced directly by agricultural policy on the one
hand and on the other hand implementation of the objectives of the energy policy results in a
promotion of fuel provision, which currently – due to technical reasons – can only be
implemented through the utilisation of energy crops. Promotion of bio-fuels thereby also
represents a strong promotion of energy crops.
3.1.1 Energy policies
At the beginning of 2007, the European Union made a binding commitment, that the emission
of greenhouse gases should be reduced by 20% compared to 1990 by 2020 and at the same
time to increase the portion of renewable energies to 20% on average by 2020 /11/. The

Error! Style not defined. - 34 -
enquiry shows that only the EU define targets especially for the usage of biomass. Whereas
other countries define general targets for the percentage of renewable energies. Because of
this, the following Table 5 provides an overview on the targets for renewable energies in
general.
In the EU-25 the portion of renewable energies for primary consumption in 2004 was 6.3%
/12/. The occasional double-figure portions for power generation generally result from the
utilisation of hydro power. Implementation in the 25 member states and in the various sectors
of renewable energies differs significantly. For an average annual growth rate of 0.13% at
European level over the past 15 years, the objectives can only be achieved with further
supportive measures in all sectors (power, heat, fuel). For the selected non-European
countries, a much differentiated situation is manifested, just as for the European member
states. The portion of renewable energies is between 4.5% and 40.7%. For non-European
countries with a double-figure portion of renewable energies, this primarily originates from
hydro power. For Brazil, China, India and Russia the portion of hydro power is at 93 – 99%.
Table 5 summarises the targets on renewable energies in the investigated countries. Most of
them have already defined middle term targets for bio-fuels, which might be provided by
energy crops. The most important demand is expected from USA, followed by China, Europe
and India. Regarding to those targets, the bio-fuel demand in 2015/2020 consists of round
about 7,000 - 8,000 PJ/a (Figure 11), what is about 10% of the expected fuel demand of those
countries12. With regard to the overall it comes out clearly that with the expected use of 7,000
to 8,000 PJ/a bio-fuels in 2020 the increase of fuel consumption in the transport sector of the
investigated countries of about 20,000 PJ/a is not even compensated.
Considering, that many countries elaborated and/or increased their bio-fuel targets during the
last 20 months, the actual expected bio-fuel demand in 2020 might be a minimum13.
Additionally, in Europe the most relevant increase of renewable energy supply is expected in
the field of bio-energy for both, heat and electricity and bio-fuels as well /51/. But with the
12 The transport energy demand of the investigated countries is proposed to increase from ca. 60.000 PJ/a in
2004 to ca. 80.000 PJ/a in 2020. /50/
13 Also in Europe increased biofuel targets of 10% or 14% till 2020 are currently discussed but not yet set.
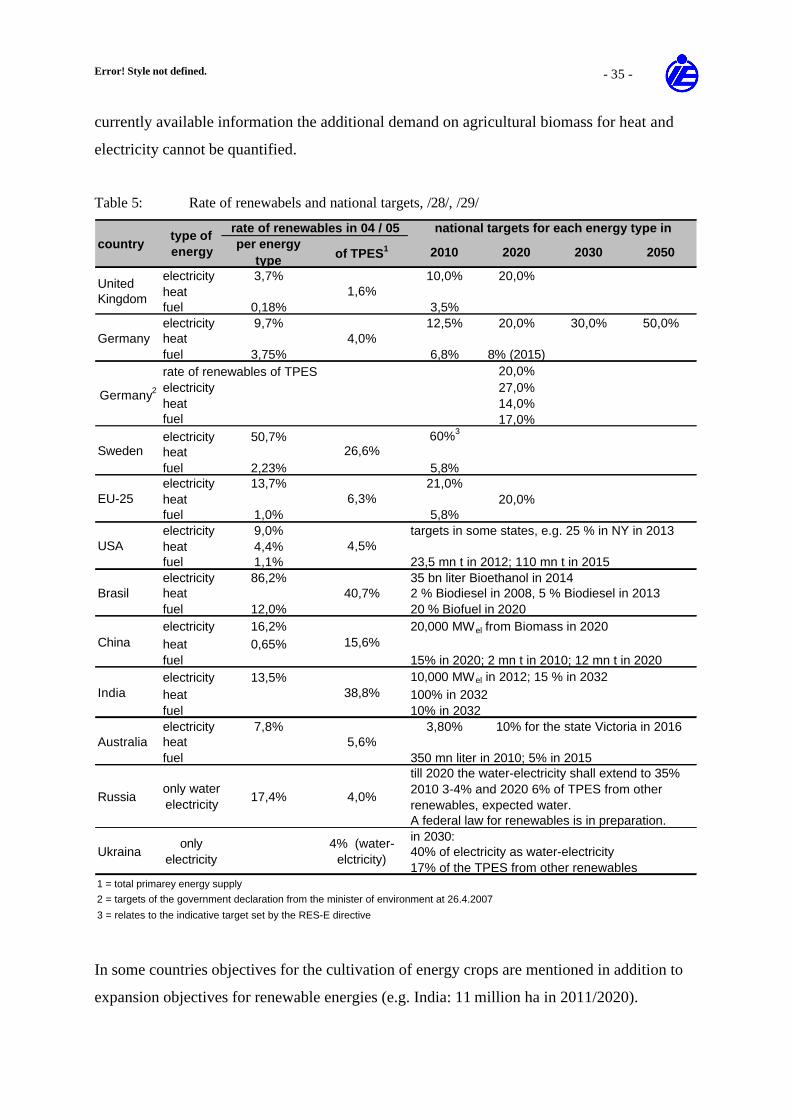
Error! Style not defined. - 35 -
currently available information the additional demand on agricultural biomass for heat and
electricity cannot be quantified.
Table 5: Rate of renewabels and national targets, /28/, /29/
per energy type of TPES1 2010 2020 2030 2050
electricity 3,7% 10,0% 20,0%heatfuel 0,18% 3,5%electricity 9,7% 12,5% 20,0% 30,0% 50,0%heatfuel 3,75% 6,8% 8% (2015)rate of renewables of TPES 20,0%electricity 27,0%heat 14,0%fuel 17,0%electricity 50,7% 60%3
heatfuel 2,23% 5,8%electricity 13,7% 21,0%heat 20,0%fuel 1,0% 5,8%electricity 9,0%heat 4,4%fuel 1,1%electricity 86,2%heatfuel 12,0%electricity 16,2%heat 0,65%fuelelectricity 13,5% 10,000 MWel in 2012; 15 % in 2032heat 100% in 2032fuel 10% in 2032electricity 7,8% 3,80%heatfuel
till 2020 the water-electricity shall extend to 35%2010 3-4% and 2020 6% of TPES from other renewables, expected water. A federal law for renewables is in preparation.
1 = total primarey energy supply2 = targets of the government declaration from the minister of environment at 26.4.2007
3 = relates to the indicative target set by the RES-E directive
Germany2
only water electricity 17,4% 4,0%
only electricity
4% (water-elctricity)Ukraina
targets in some states, e.g. 25 % in NY in 2013
23,5 mn t in 2012; 110 mn t in 201535 bn liter Bioethanol in 20142 % Biodiesel in 2008, 5 % Biodiesel in 201320 % Biofuel in 202020,000 MWel from Biomass in 2020
15% in 2020; 2 mn t in 2010; 12 mn t in 2020
350 mn liter in 2010; 5% in 2015
10% for the state Victoria in 2016
Russia
China
country
United Kingdom
Germany
national targets for each energy type in
1,6%
rate of renewables in 04 / 05type of energy
4,0%
Sweden
EU-25
USA
Brasil
India
Australia
40,7%
4,5%
in 2030:40% of electricity as water-electricity17% of the TPES from other renewables
6,3%
26,6%
5,6%
38,8%
15,6%
In some countries objectives for the cultivation of energy crops are mentioned in addition to
expansion objectives for renewable energies (e.g. India: 11 million ha in 2011/2020).
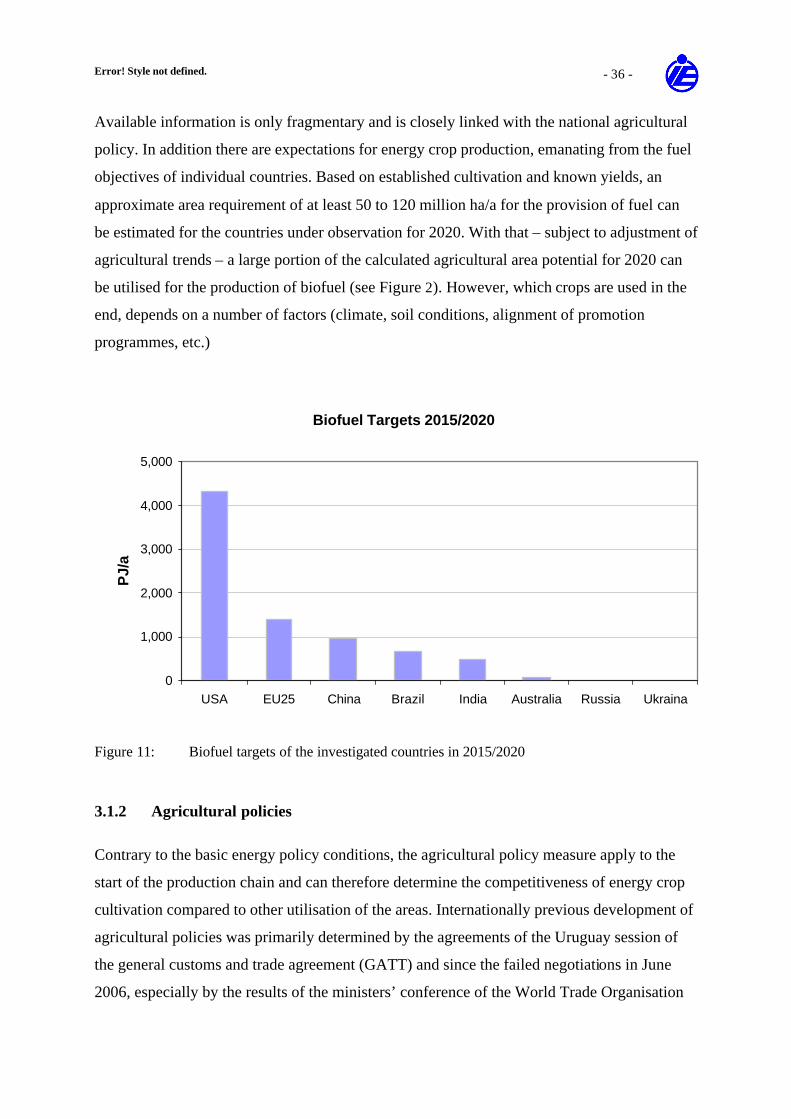
Error! Style not defined. - 36 -
Available information is only fragmentary and is closely linked with the national agricultural
policy. In addition there are expectations for energy crop production, emanating from the fuel
objectives of individual countries. Based on established cultivation and known yields, an
approximate area requirement of at least 50 to 120 million ha/a for the provision of fuel can
be estimated for the countries under observation for 2020. With that – subject to adjustment of
agricultural trends – a large portion of the calculated agricultural area potential for 2020 can
be utilised for the production of biofuel (see Figure 2). However, which crops are used in the
end, depends on a number of factors (climate, soil conditions, alignment of promotion
programmes, etc.)
Biofuel Targets 2015/2020
0
1,000
2,000
3,000
4,000
5,000
USA EU25 China Brazil India Australia Russia Ukraina
PJ/
a
Figure 11: Biofuel targets of the investigated countries in 2015/2020
3.1.2 Agricultural policies
Contrary to the basic energy policy conditions, the agricultural policy measure apply to the
start of the production chain and can therefore determine the competitiveness of energy crop
cultivation compared to other utilisation of the areas. Internationally previous development of
agricultural policies was primarily determined by the agreements of the Uruguay session of
the general customs and trade agreement (GATT) and since the failed negotiations in June
2006, especially by the results of the ministers’ conference of the World Trade Organisation
Error! Style not defined. - 37 -
(WTO) in Doha. The agreements are aimed at a cutback of domestic support, a reduction of
export subsidies and an opening of the market for third countries. Accordingly, extensive
agricultural reforms were implemented in many countries of the world.
The joint agricultural policy of the EU (CAP), is based on the two pillars market organisation
and rural development. The biggest portion of expenses can, however, be assigned to the first
pillar of market organisation and the associated agricultural subsidies. The reform of the joint
agricultural policy currently initiates a paradigm shift towards more market orientation and
efficiency, because the subsidy of agriculture according to the new concept is effect in the
form of an annual payment to individual operations or as a regional premium per hectare.
Furthermore an energy crop premium of € 45 per ha for the cultivation of renewable raw
materials for purposes of energy utilisation of base areas (i.e. not fallow areas) is paid
additionally, however, without showing any noteworthy effect /28/. An additional link
between the payment of premiums and the compliance with specific standards (among others
environmental and animal protection, food and feed security, preservation of permanent
grasslands) was defined with Cross Compliance. The implementation of the European
Agricultural Fund for the Development of the Rural Environment (“ELER”), by means of
which a financing instrument exists since 2007, led to a substantial strengthening of rural
development.
The agricultural policy of the countries under observation is frequently characterised by the
requirements of the WTO, which is aimed at a cutback of protected agricultural markets and
specific agricultural subsidies. Existing mechanisms of agricultural subsidies can especially
be found in the USA (e.g. direct payment for selected cultures like wheat /20/). No across the
board promotion of energy crops (comparable to the European energy crop premium) could
be found in non-European countries, however, internationally accessible information in this
sector is limited. The expansion objectives for bio-fuels are partially transformed into area
requirements (e.g. India, Brazil) in the programmes motivated by energy policies.
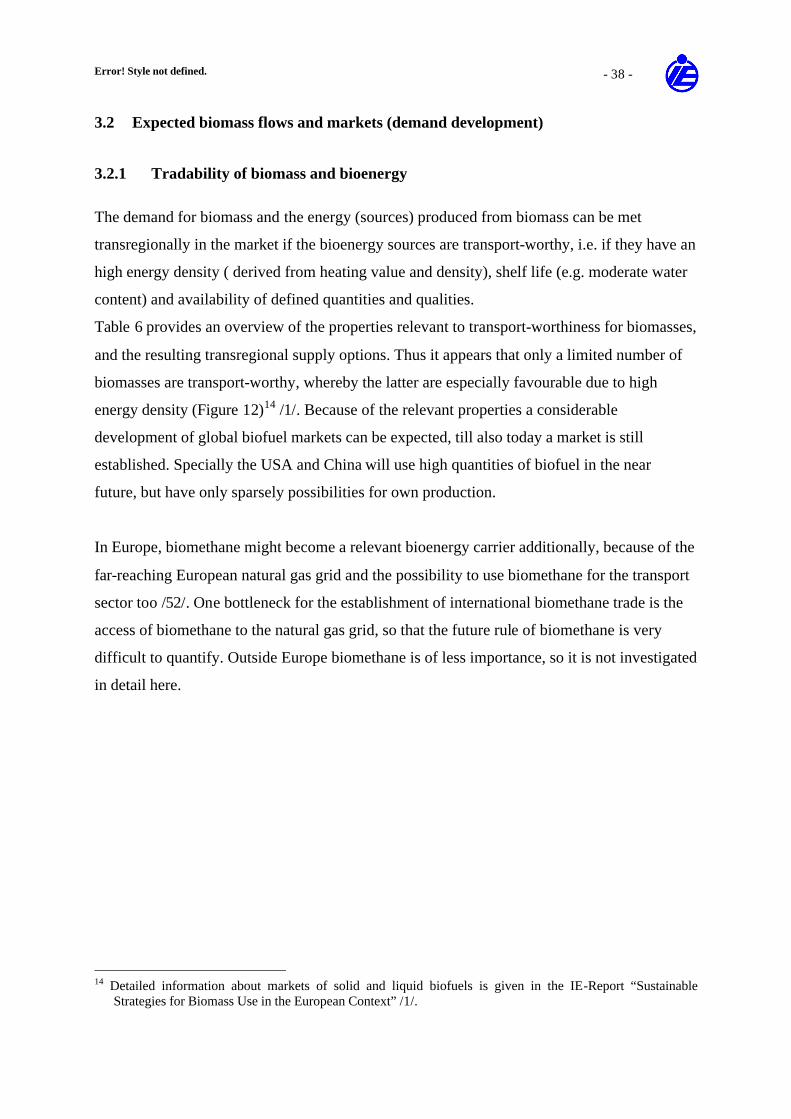
Error! Style not defined. - 38 -
3.2 Expected biomass flows and markets (demand development)
3.2.1 Tradability of biomass and bioenergy
The demand for biomass and the energy (sources) produced from biomass can be met
transregionally in the market if the bioenergy sources are transport-worthy, i.e. if they have an
high energy density ( derived from heating value and density), shelf life (e.g. moderate water
content) and availability of defined quantities and qualities.
Table 6 provides an overview of the properties relevant to transport-worthiness for biomasses,
and the resulting transregional supply options. Thus it appears that only a limited number of
biomasses are transport-worthy, whereby the latter are especially favourable due to high
energy density (Figure 12)14 /1/. Because of the relevant properties a considerable
development of global biofuel markets can be expected, till also today a market is still
established. Specially the USA and China will use high quantities of biofuel in the near
future, but have only sparsely possibilities for own production.
In Europe, biomethane might become a relevant bioenergy carrier additionally, because of the
far-reaching European natural gas grid and the possibility to use biomethane for the transport
sector too /52/. One bottleneck for the establishment of international biomethane trade is the
access of biomethane to the natural gas grid, so that the future rule of biomethane is very
difficult to quantify. Outside Europe biomethane is of less importance, so it is not investigated
in detail here.
14 Detailed information about markets of solid and liquid biofuels is given in the IE-Report “Sustainable
Strategies for Biomass Use in the European Context” /1/.
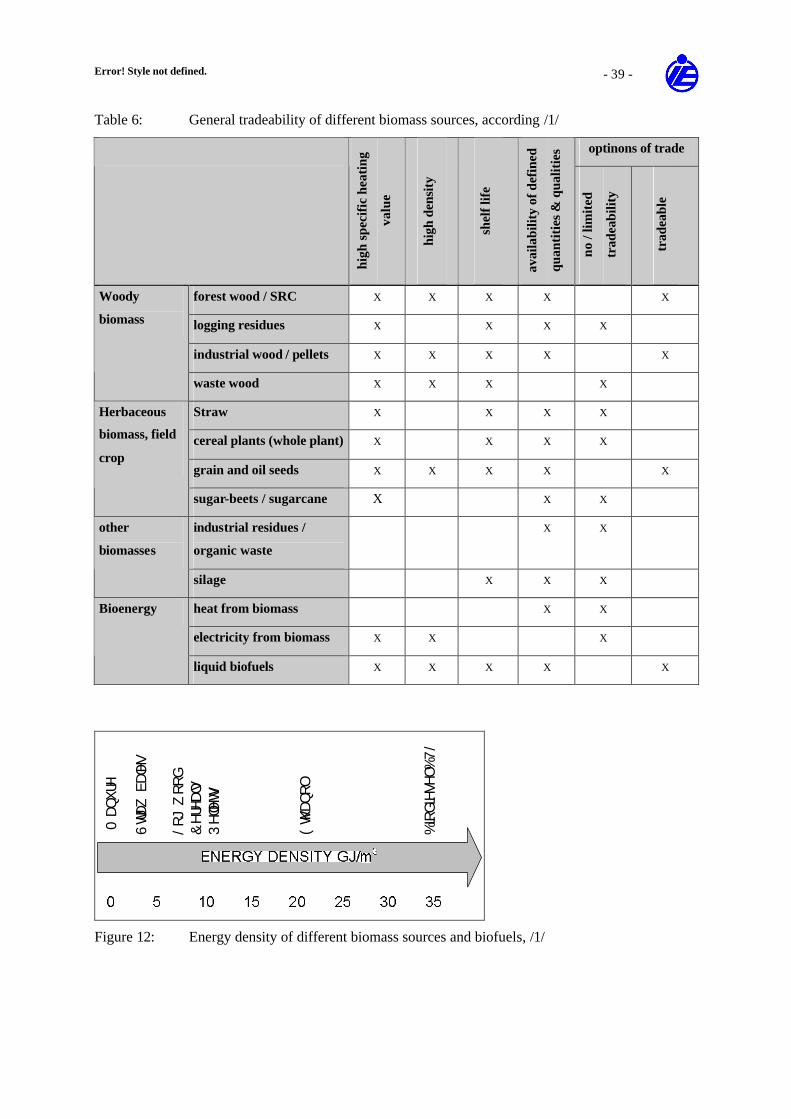
Error! Style not defined. - 39 -
Table 6: General tradeability of different biomass sources, according /1/
optinons of trade
high
spe
cifi
c he
atin
g
valu
e
high
den
sity
shel
f lif
e
avai
labi
lity
of d
efin
ed
quan
titi
es &
qua
litie
s
no /
limit
ed
trad
eabi
lity
trad
eabl
e
forest wood / SRC X X X X X
logging residues X X X X
industrial wood / pellets X X X X X
Woody
biomass
waste wood X X X X
Straw X X X X
cereal plants (whole plant) X X X X
grain and oil seeds X X X X X
Herbaceous
biomass, field
crop
sugar-beets / sugarcane X X X
industrial residues /
organic waste
X X other
biomasses
silage X X X
heat from biomass X X
electricity from biomass X X X
Bioenergy
liquid biofuels X X X X X
0DQ
XUH
6WU
DZED
OHV
/RJ
ZRR
G&
HUHD
OV3
HOOH
WV
(WK
DQRO
%LR
GLHV
HO%
7/
Figure 12: Energy density of different biomass sources and biofuels, /1/
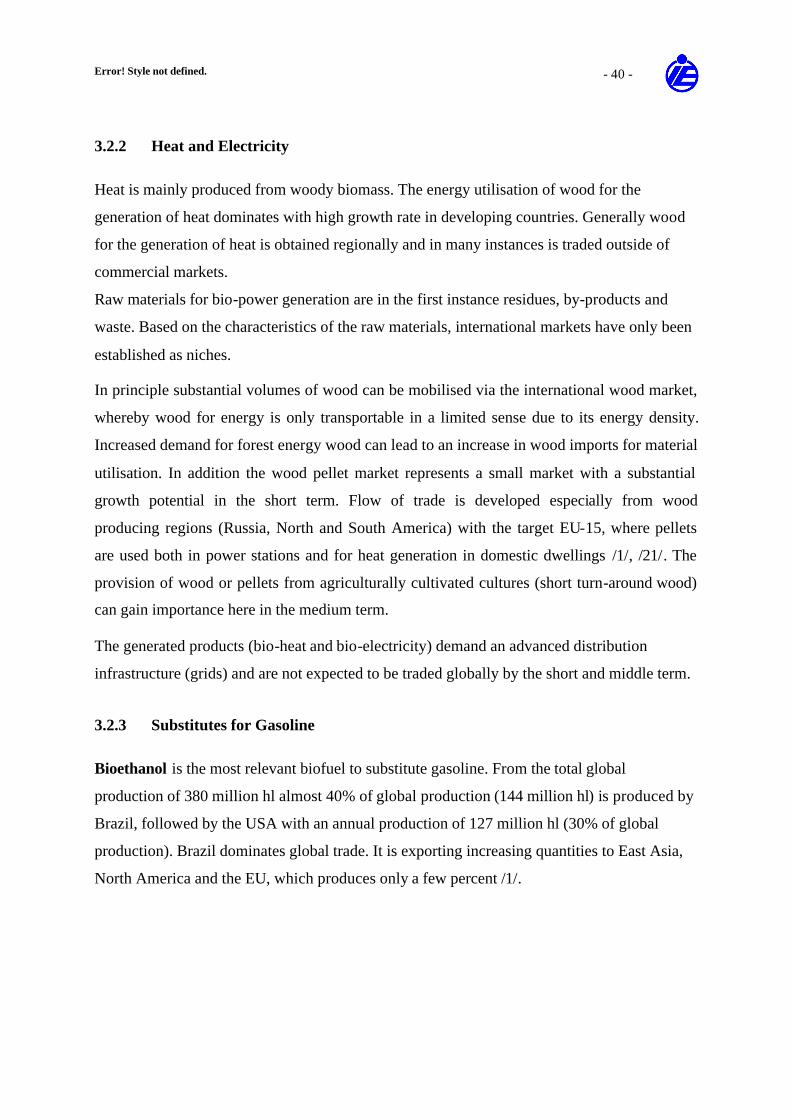
Error! Style not defined. - 40 -
3.2.2 Heat and Electricity
Heat is mainly produced from woody biomass. The energy utilisation of wood for the
generation of heat dominates with high growth rate in developing countries. Generally wood
for the generation of heat is obtained regionally and in many instances is traded outside of
commercial markets.
Raw materials for bio-power generation are in the first instance residues, by-products and
waste. Based on the characteristics of the raw materials, international markets have only been
established as niches.
In principle substantial volumes of wood can be mobilised via the international wood market,
whereby wood for energy is only transportable in a limited sense due to its energy density.
Increased demand for forest energy wood can lead to an increase in wood imports for material
utilisation. In addition the wood pellet market represents a small market with a substantial
growth potential in the short term. Flow of trade is developed especially from wood
producing regions (Russia, North and South America) with the target EU-15, where pellets
are used both in power stations and for heat generation in domestic dwellings /1/, /21/. The
provision of wood or pellets from agriculturally cultivated cultures (short turn-around wood)
can gain importance here in the medium term.
The generated products (bio-heat and bio-electricity) demand an advanced distribution
infrastructure (grids) and are not expected to be traded globally by the short and middle term.
3.2.3 Substitutes for Gasoline
Bioethanol is the most relevant biofuel to substitute gasoline. From the total global
production of 380 million hl almost 40% of global production (144 million hl) is produced by
Brazil, followed by the USA with an annual production of 127 million hl (30% of global
production). Brazil dominates global trade. It is exporting increasing quantities to East Asia,
North America and the EU, which produces only a few percent /1/.
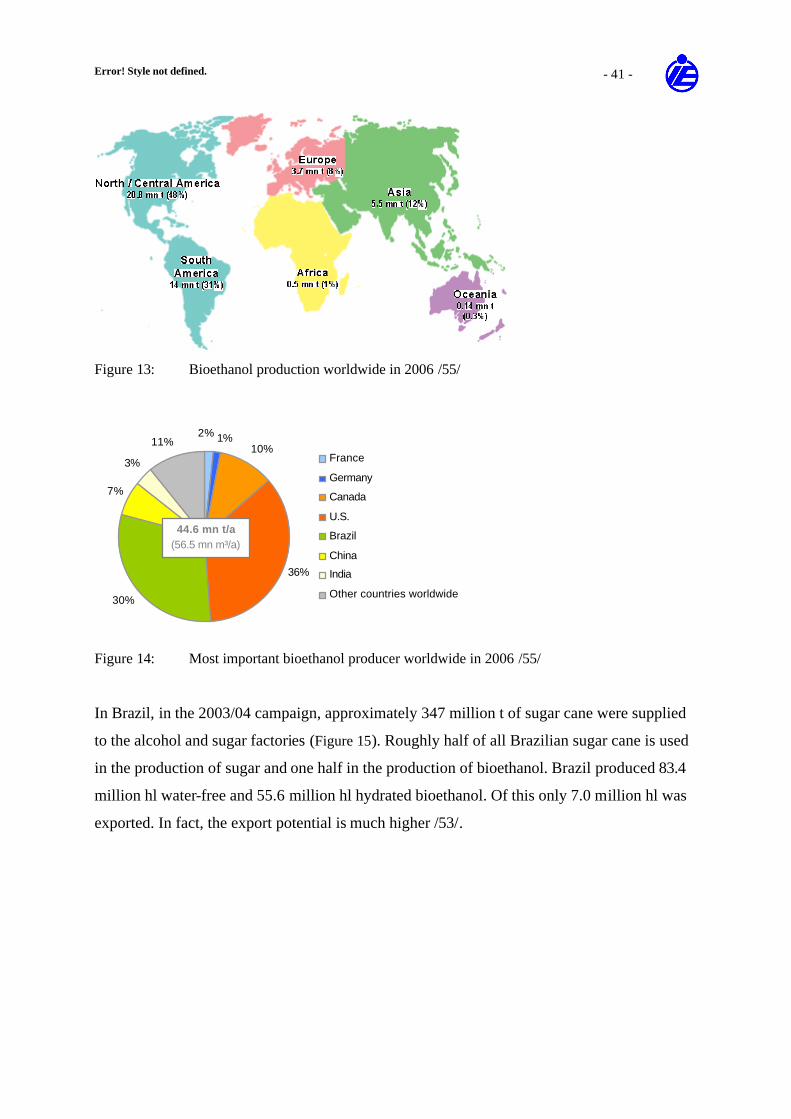
Error! Style not defined. - 41 -
Figure 13: Bioethanol production worldwide in 2006 /55/
10%
36%
30%
7%
3%
11% 1%2%
France
Germany
Canada
U.S.
Brazil
China
India
Other countries worldwide
44.6 mn t/a(56.5 mn m³/a)
Figure 14: Most important bioethanol producer worldwide in 2006 /55/
In Brazil, in the 2003/04 campaign, approximately 347 million t of sugar cane were supplied
to the alcohol and sugar factories (Figure 15). Roughly half of all Brazilian sugar cane is used
in the production of sugar and one half in the production of bioethanol. Brazil produced 83.4
million hl water-free and 55.6 million hl hydrated bioethanol. Of this only 7.0 million hl was
exported. In fact, the export potential is much higher /53/.
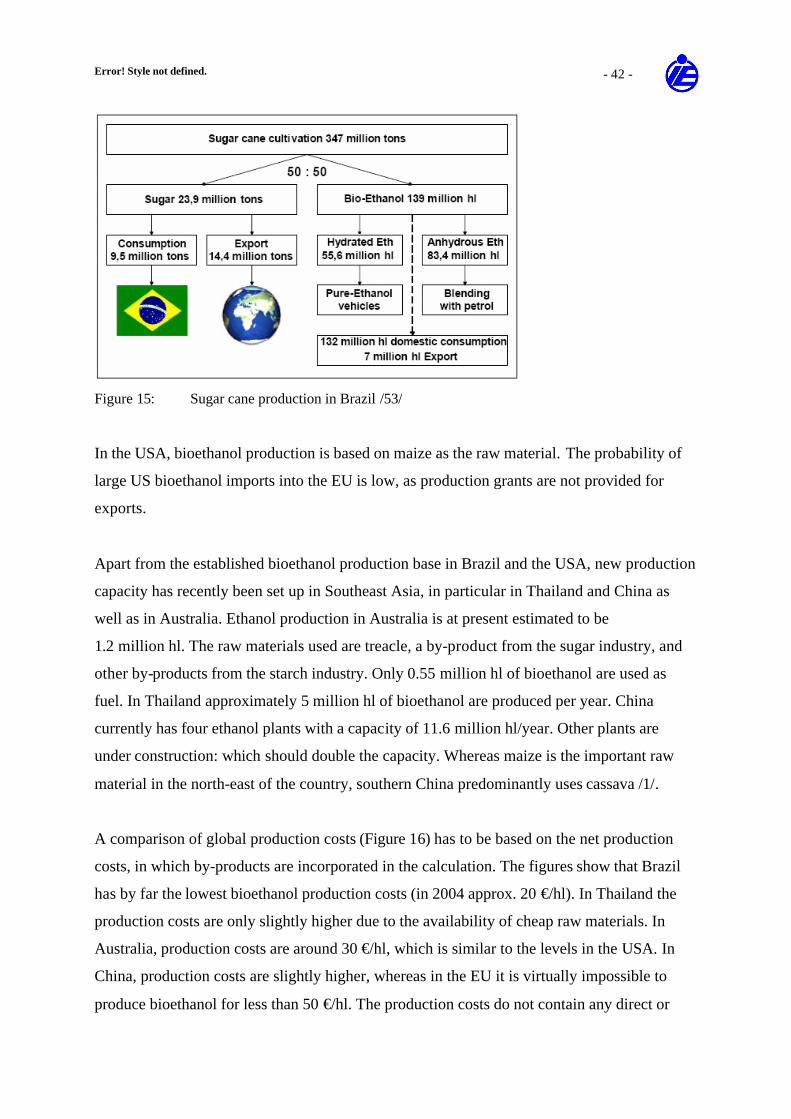
Error! Style not defined. - 42 -
Figure 15: Sugar cane production in Brazil /53/
In the USA, bioethanol production is based on maize as the raw material. The probability of
large US bioethanol imports into the EU is low, as production grants are not provided for
exports.
Apart from the established bioethanol production base in Brazil and the USA, new production
capacity has recently been set up in Southeast Asia, in particular in Thailand and China as
well as in Australia. Ethanol production in Australia is at present estimated to be
1.2 million hl. The raw materials used are treacle, a by-product from the sugar industry, and
other by-products from the starch industry. Only 0.55 million hl of bioethanol are used as
fuel. In Thailand approximately 5 million hl of bioethanol are produced per year. China
currently has four ethanol plants with a capacity of 11.6 million hl/year. Other plants are
under construction: which should double the capacity. Whereas maize is the important raw
material in the north-east of the country, southern China predominantly uses cassava /1/.
A comparison of global production costs (Figure 16) has to be based on the net production
costs, in which by-products are incorporated in the calculation. The figures show that Brazil
has by far the lowest bioethanol production costs (in 2004 approx. 20 €/hl). In Thailand the
production costs are only slightly higher due to the availability of cheap raw materials. In
Australia, production costs are around 30 €/hl, which is similar to the levels in the USA. In
China, production costs are slightly higher, whereas in the EU it is virtually impossible to
produce bioethanol for less than 50 €/hl. The production costs do not contain any direct or
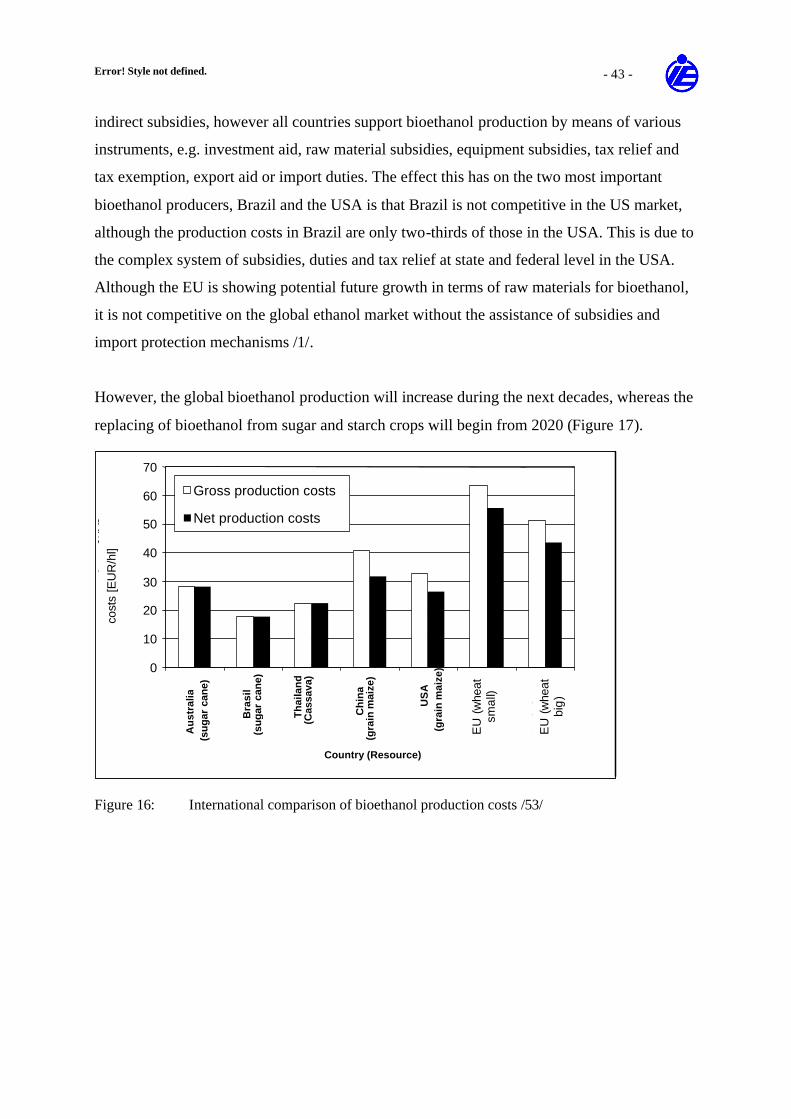
Error! Style not defined. - 43 -
indirect subsidies, however all countries support bioethanol production by means of various
instruments, e.g. investment aid, raw material subsidies, equipment subsidies, tax relief and
tax exemption, export aid or import duties. The effect this has on the two most important
bioethanol producers, Brazil and the USA is that Brazil is not competitive in the US market,
although the production costs in Brazil are only two-thirds of those in the USA. This is due to
the complex system of subsidies, duties and tax relief at state and federal level in the USA.
Although the EU is showing potential future growth in terms of raw materials for bioethanol,
it is not competitive on the global ethanol market without the assistance of subsidies and
import protection mechanisms /1/.
However, the global bioethanol production will increase during the next decades, whereas the
replacing of bioethanol from sugar and starch crops will begin from 2020 (Figure 17).
0
10
20
30
40
50
60
70
Au
stra
lia(s
ug
ar c
ane)
Bra
sil
(su
gar
can
e)
Th
aila
nd
(Cas
sava
)
Ch
ina
(gra
in m
aize
)
US
A
(gra
in m
aize
)
EU
(Wh
aet,
kl)
EU
(Wh
aet,
gr)
Country (Resource)
Co
sts
[€/h
l]
Gross production costs
Net production costs
EU
(w
heat
smal
l)
EU
(w
heat
big
)
cost
s[E
UR
/hl]
Figure 16: International comparison of bioethanol production costs /53/
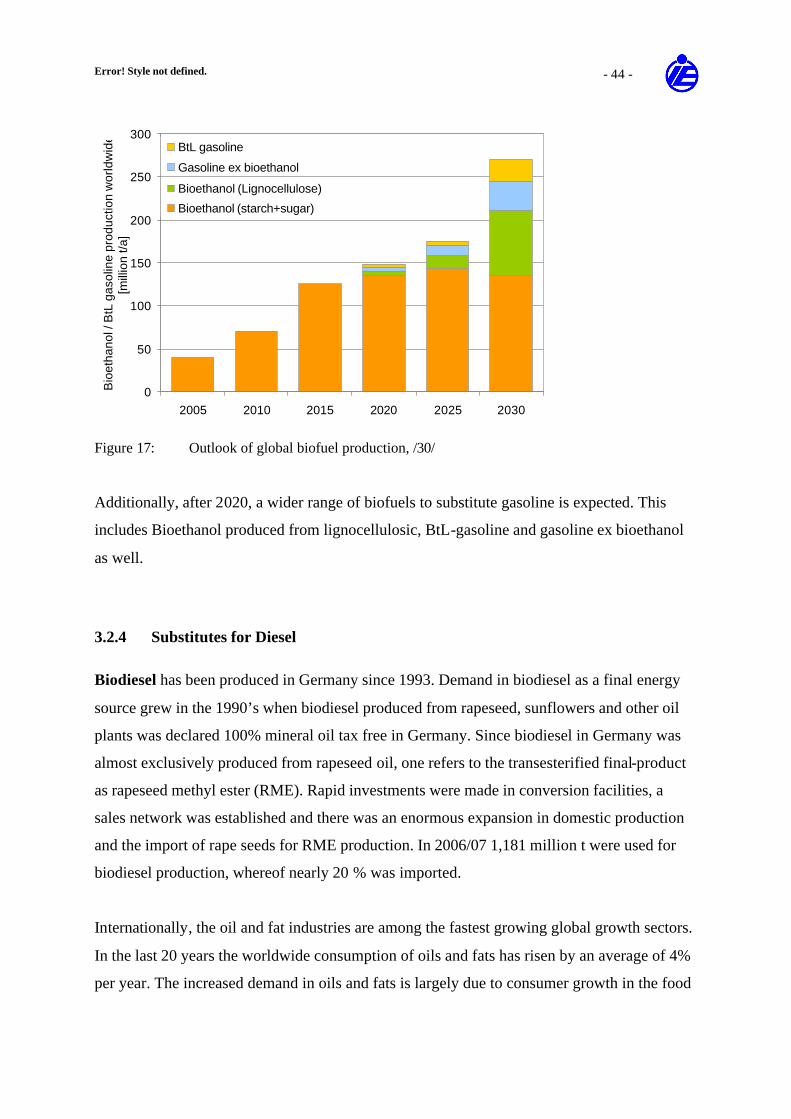
Error! Style not defined. - 44 -
0
50
100
150
200
250
300
2005 2010 2015 2020 2025 2030
Bio
etha
nol /
BtL
gas
olin
e pr
oduc
tion
wor
ldw
ide
[mill
ion
t/a]
BtL gasoline
Gasoline ex bioethanol
Bioethanol (Lignocellulose)
Bioethanol (starch+sugar)
Figure 17: Outlook of global biofuel production, /30/
Additionally, after 2020, a wider range of biofuels to substitute gasoline is expected. This
includes Bioethanol produced from lignocellulosic, BtL-gasoline and gasoline ex bioethanol
as well.
3.2.4 Substitutes for Diesel
Biodiesel has been produced in Germany since 1993. Demand in biodiesel as a final energy
source grew in the 1990’s when biodiesel produced from rapeseed, sunflowers and other oil
plants was declared 100% mineral oil tax free in Germany. Since biodiesel in Germany was
almost exclusively produced from rapeseed oil, one refers to the transesterified final-product
as rapeseed methyl ester (RME). Rapid investments were made in conversion facilities, a
sales network was established and there was an enormous expansion in domestic production
and the import of rape seeds for RME production. In 2006/07 1,181 million t were used for
biodiesel production, whereof nearly 20 % was imported.
Internationally, the oil and fat industries are among the fastest growing global growth sectors.
In the last 20 years the worldwide consumption of oils and fats has risen by an average of 4%
per year. The increased demand in oils and fats is largely due to consumer growth in the food
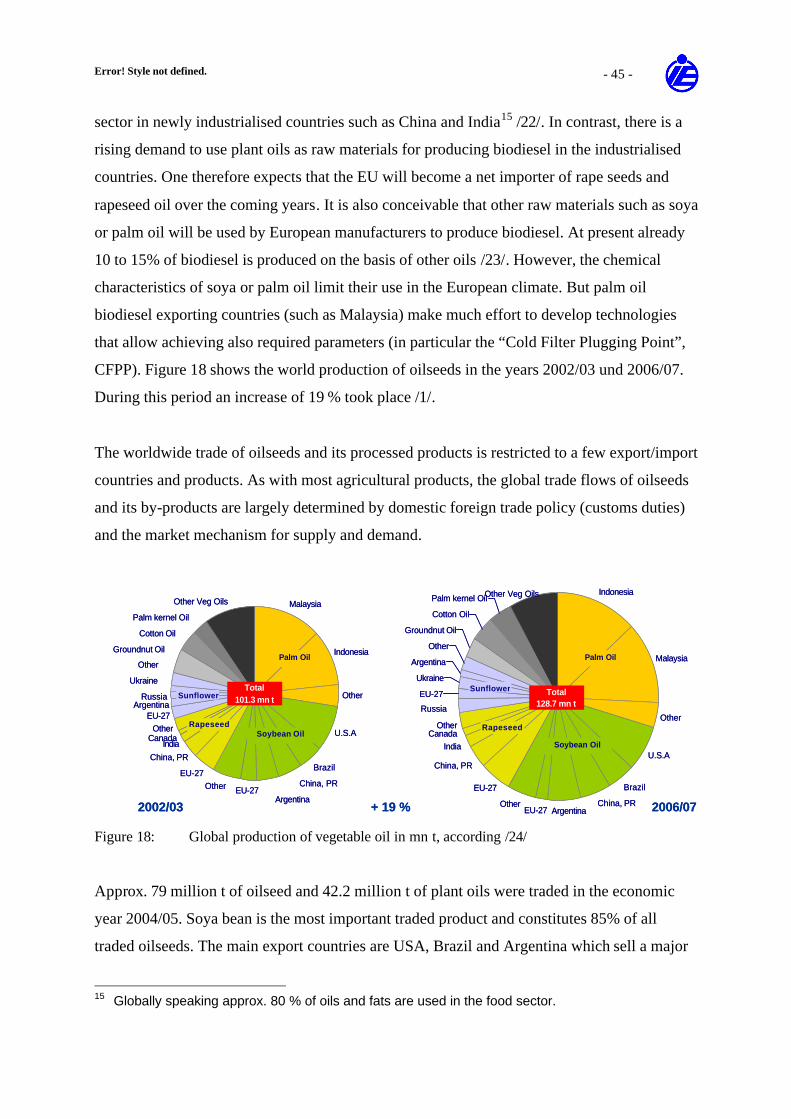
Error! Style not defined. - 45 -
sector in newly industrialised countries such as China and India15 /22/. In contrast, there is a
rising demand to use plant oils as raw materials for producing biodiesel in the industrialised
countries. One therefore expects that the EU will become a net importer of rape seeds and
rapeseed oil over the coming years. It is also conceivable that other raw materials such as soya
or palm oil will be used by European manufacturers to produce biodiesel. At present already
10 to 15% of biodiesel is produced on the basis of other oils /23/. However, the chemical
characteristics of soya or palm oil limit their use in the European climate. But palm oil
biodiesel exporting countries (such as Malaysia) make much effort to develop technologies
that allow achieving also required parameters (in particular the “Cold Filter Plugging Point”,
CFPP). Figure 18 shows the world production of oilseeds in the years 2002/03 und 2006/07.
During this period an increase of 19 % took place /1/.
The worldwide trade of oilseeds and its processed products is restricted to a few export/import
countries and products. As with most agricultural products, the global trade flows of oilseeds
and its by-products are largely determined by domestic foreign trade policy (customs duties)
and the market mechanism for supply and demand.
Malaysia
Indonesia
Other
U.S.A
Brazil
China, PR
ArgentinaEU-27Other
EU-27
China, PR
IndiaCanadaOther
EU-27Argentina
Russia
Ukraine
Other
Groundnut Oil
Cotton Oil
Palm kernel Oil
Other Veg Oils
Total101.3 mn t
Palm Oil
Soybean Oil
Sunflower
Rapeseed
Indonesia
Malaysia
Other
U.S.A
Brazil
China, PRArgentinaEU-27
Other
Other
EU-27
Ukraine
Argentina
Other
Groundnut Oil
Cotton Oil
Palm kernel Oil
Russia
CanadaIndia
EU-27
China, PR
Other Veg Oils
Palm Oil
Soybean Oil
Total128.7 mn t
Rapeseed
Sunflower
2002/03 2006/07+ 19 %
Malaysia
Indonesia
Other
U.S.A
Brazil
China, PR
ArgentinaEU-27Other
EU-27
China, PR
IndiaCanadaOther
EU-27Argentina
Russia
Ukraine
Other
Groundnut Oil
Cotton Oil
Palm kernel Oil
Other Veg Oils
Total101.3 mn t
Palm Oil
Soybean Oil
Sunflower
Rapeseed
Indonesia
Malaysia
Other
U.S.A
Brazil
China, PRArgentinaEU-27
Other
Other
EU-27
Ukraine
Argentina
Other
Groundnut Oil
Cotton Oil
Palm kernel Oil
Russia
CanadaIndia
EU-27
China, PR
Other Veg Oils
Palm Oil
Soybean Oil
Total128.7 mn t
Rapeseed
Sunflower
2002/03 2006/07+ 19 % Figure 18: Global production of vegetable oil in mn t, according /24/
Approx. 79 million t of oilseed and 42.2 million t of plant oils were traded in the economic
year 2004/05. Soya bean is the most important traded product and constitutes 85% of all
traded oilseeds. The main export countries are USA, Brazil and Argentina which sell a major
15 Globally speaking approx. 80 % of oils and fats are used in the food sector.
Error! Style not defined. - 46 -
part of their produced seeds in PR China (27 million t) and the EU-25 (15.2 million t). On the
one hand, the PR China has a large processing capacity; however, the available land for the
further expansion of cultivation areas is limited. /25/.
Canada is the leading rape seed or canola respectively exporter (3.5 million t), whereby
Canadian rape seeds are mainly exported to Japan and Mexico. The USA also mainly meets
its rapeseed demand through imports from Canada. Canadian rapeseed is characterised by a
high GMO-content, which prevents any exports to the EU as the use of GMO rapeseed in the
food industry is prohibited by law16. The second largest global rapeseed exporter is Australia
with 1.1 million t of rapeseed mainly exported to Japan and Pakistan. India, a further large
rapeseed producer, hardly exports any of its produce /26/.
Prognoses expect an increase of 5,500,000t/a in 2006 to more than 18,000,000 t/a in 2010 for
the world-wide production of bio-diesel. Europe will remain the biggest producer of bio-
diesel. The Asia-Pacific region and North and South America will become further essential
production regions (Figure 19). As a result of these prognoses, a distinct expansion of
production capacities in the main producing countries is already expected for next year.
Expansion of capacities will in certain cases exceed 100%. However, compared to the overall
consumption of vegetable oils this effect is comparable low (Figure 20).
16 The use of genetically modified rape seeds for biodiesel production in the EU is also not conceivable, as the
cost-effective production of biodiesel is determined by the sale of extracted rapeseed meal; the use of GMO rapeseed meal as feed is also forbidden in the EU.
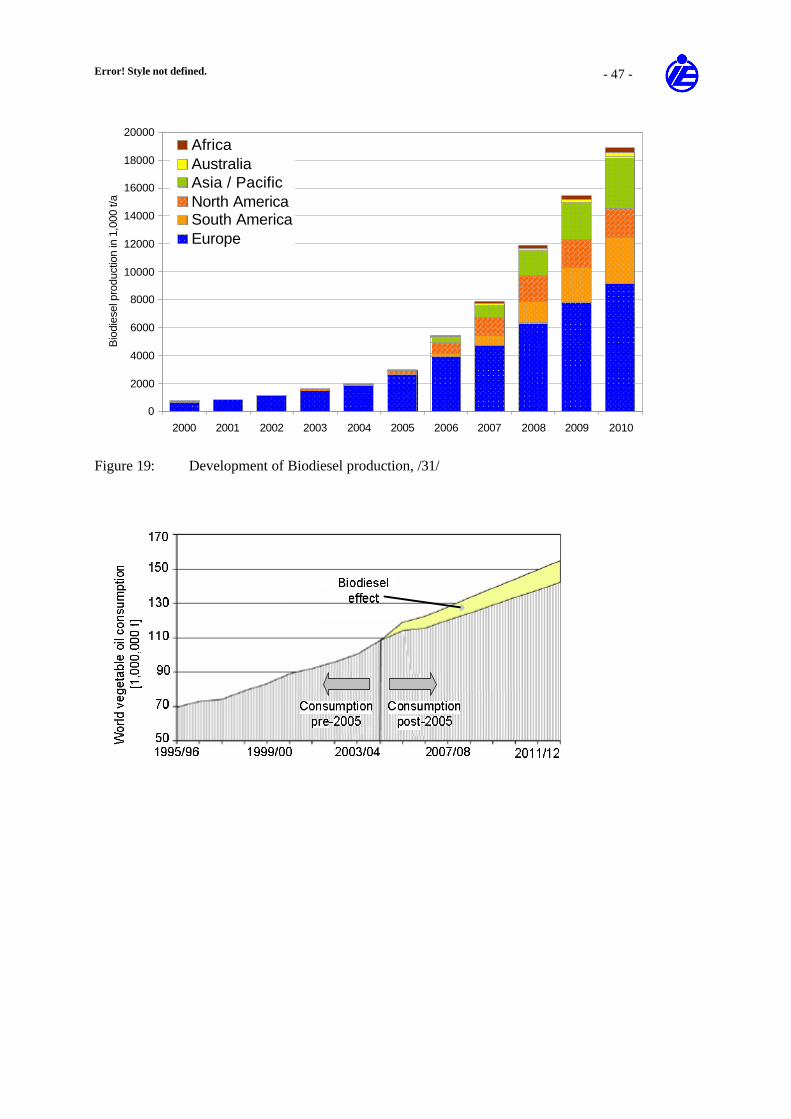
Error! Style not defined. - 47 -
0
2000
4000
6000
8000
10000
12000
14000
16000
18000
20000
2000 2001 2002 2003 2004 2005 2006 2007 2008 2009 2010
Bio
dies
el p
rodu
ctio
n in
1,0
00 t/
a
AfricaAustraliaAsia / PacificNorth AmericaSouth AmericaEurope
Figure 19: Development of Biodiesel production, /31/
Figure 20: World projected consumption on vegetable oils, /32/
FT-Diesel (Fischer-Tropsch-Diesel) from biomass is one of the most promissing BtL-fuel
fort he substitution of Diesel. Currently, there are ongoing R&D activities in this field, so that
the first large scale production plant can be expected in 2010 or 2011. However, till 2020 the
market share of those products will be comparable low (Figure 21). For the EU-25 it is
estimated that the total BtL-production cannot exceed 300 PJ/a, what is less than 2% of the
expected total fuel demand for road transports of the EU.
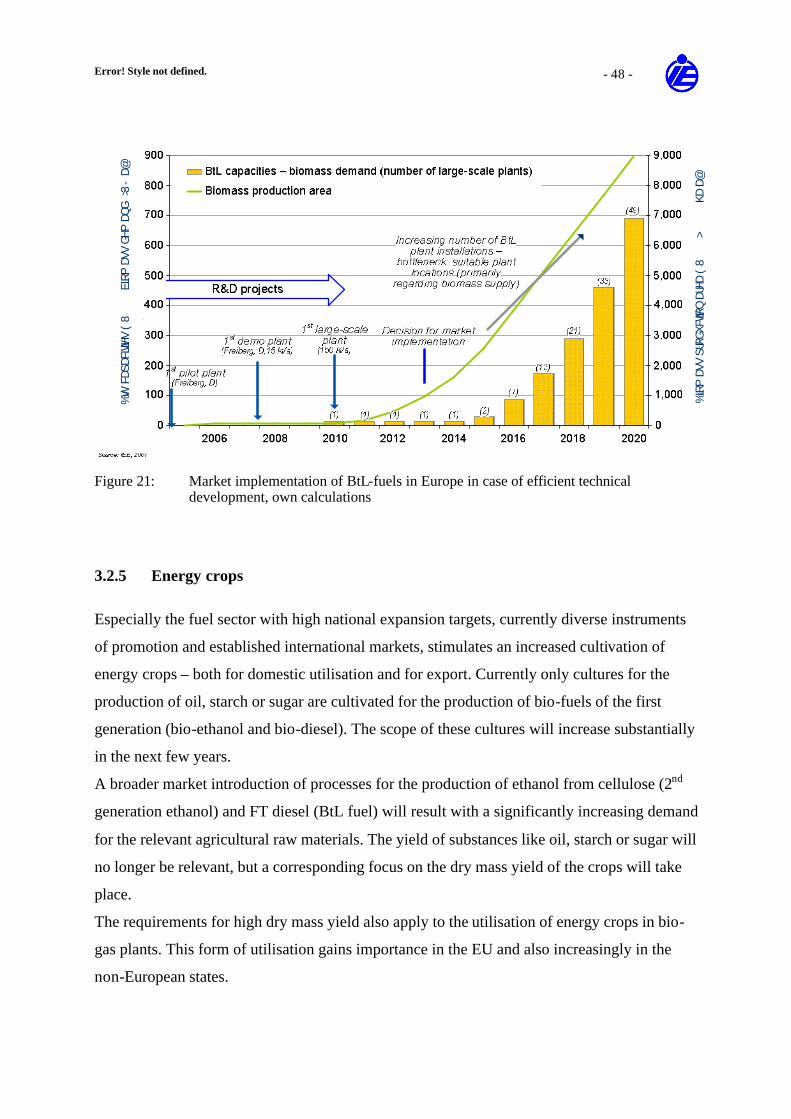
Error! Style not defined. - 48 -
0
100
200
300
400
500
600
700
800
900
2005 2008 2011 2014 2017 2020
BtL
pro
duct
ion
capa
citie
s E
U-2
5 (b
iom
ass
dem
and)
[m
ax. P
J/a]
-
1.000
2.000
3.000
4.000
5.000
6.000
7.000
8.000
9.000
Bio
mas
s pr
oduc
tion
area
EU
-25
[1,0
00 h
a/a]
BtL capacities - biomass demand (number of large-scale plants)
Biomass production capacities
%LR
PDV
VSU
RGXF
WLRQ
DUHD
(8
>KD
D@
%W/
FDSD
FLWLH
V(
8EL
RPDV
VGH
PDQ
G>3
-D@
Figure 21: Market implementation of BtL-fuels in Europe in case of efficient technical
development, own calculations
3.2.5 Energy crops
Especially the fuel sector with high national expansion targets, currently diverse instruments
of promotion and established international markets, stimulates an increased cultivation of
energy crops – both for domestic utilisation and for export. Currently only cultures for the
production of oil, starch or sugar are cultivated for the production of bio-fuels of the first
generation (bio-ethanol and bio-diesel). The scope of these cultures will increase substantially
in the next few years.
A broader market introduction of processes for the production of ethanol from cellulose (2nd
generation ethanol) and FT diesel (BtL fuel) will result with a significantly increasing demand
for the relevant agricultural raw materials. The yield of substances like oil, starch or sugar will
no longer be relevant, but a corresponding focus on the dry mass yield of the crops will take
place.
The requirements for high dry mass yield also apply to the utilisation of energy crops in bio-
gas plants. This form of utilisation gains importance in the EU and also increasingly in the
non-European states.
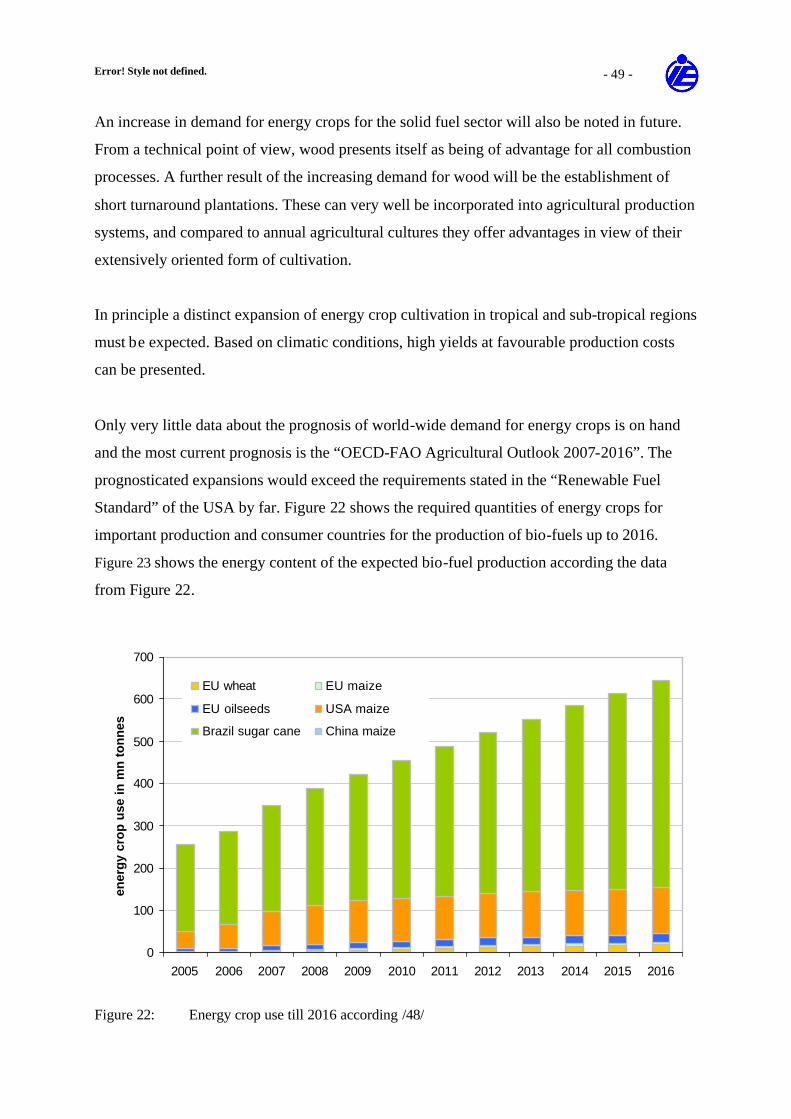
Error! Style not defined. - 49 -
An increase in demand for energy crops for the solid fuel sector will also be noted in future.
From a technical point of view, wood presents itself as being of advantage for all combustion
processes. A further result of the increasing demand for wood will be the establishment of
short turnaround plantations. These can very well be incorporated into agricultural production
systems, and compared to annual agricultural cultures they offer advantages in view of their
extensively oriented form of cultivation.
In principle a distinct expansion of energy crop cultivation in tropical and sub-tropical regions
must be expected. Based on climatic conditions, high yields at favourable production costs
can be presented.
Only very little data about the prognosis of world-wide demand for energy crops is on hand
and the most current prognosis is the “OECD-FAO Agricultural Outlook 2007-2016”. The
prognosticated expansions would exceed the requirements stated in the “Renewable Fuel
Standard” of the USA by far. Figure 22 shows the required quantities of energy crops for
important production and consumer countries for the production of bio-fuels up to 2016.
Figure 23 shows the energy content of the expected bio-fuel production according the data
from Figure 22.
0
100
200
300
400
500
600
700
2005 2006 2007 2008 2009 2010 2011 2012 2013 2014 2015 2016
ener
gy
cro
p u
se in
mn
to
nn
es
EU wheat EU maize
EU oilseeds USA maize
Brazil sugar cane China maize
Figure 22: Energy crop use till 2016 according /48/
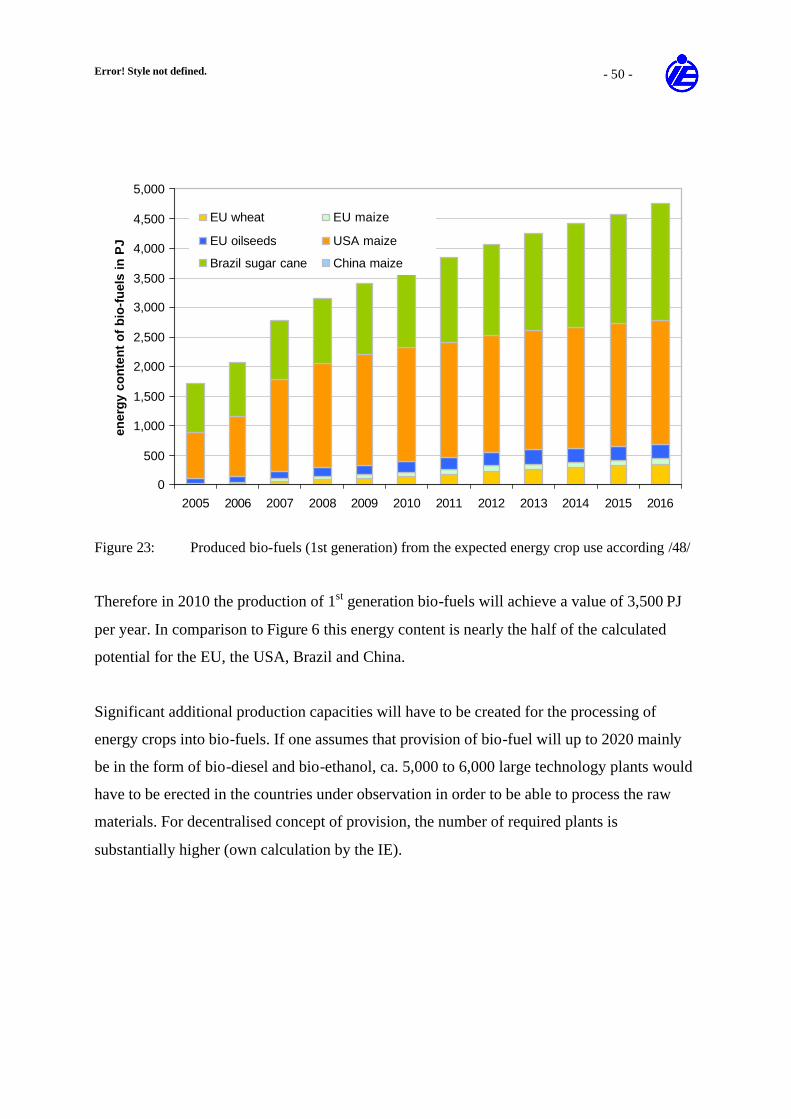
Error! Style not defined. - 50 -
0
500
1,000
1,500
2,000
2,500
3,000
3,500
4,000
4,500
5,000
2005 2006 2007 2008 2009 2010 2011 2012 2013 2014 2015 2016
ener
gy
con
ten
t o
f b
io-f
uel
s in
PJ
EU wheat EU maize
EU oilseeds USA maize
Brazil sugar cane China maize
Figure 23: Produced bio-fuels (1st generation) from the expected energy crop use according /48/
Therefore in 2010 the production of 1st generation bio-fuels will achieve a value of 3,500 PJ
per year. In comparison to Figure 6 this energy content is nearly the half of the calculated
potential for the EU, the USA, Brazil and China.
Significant additional production capacities will have to be created for the processing of
energy crops into bio-fuels. If one assumes that provision of bio-fuel will up to 2020 mainly
be in the form of bio-diesel and bio-ethanol, ca. 5,000 to 6,000 large technology plants would
have to be erected in the countries under observation in order to be able to process the raw
materials. For decentralised concept of provision, the number of required plants is
substantially higher (own calculation by the IE).
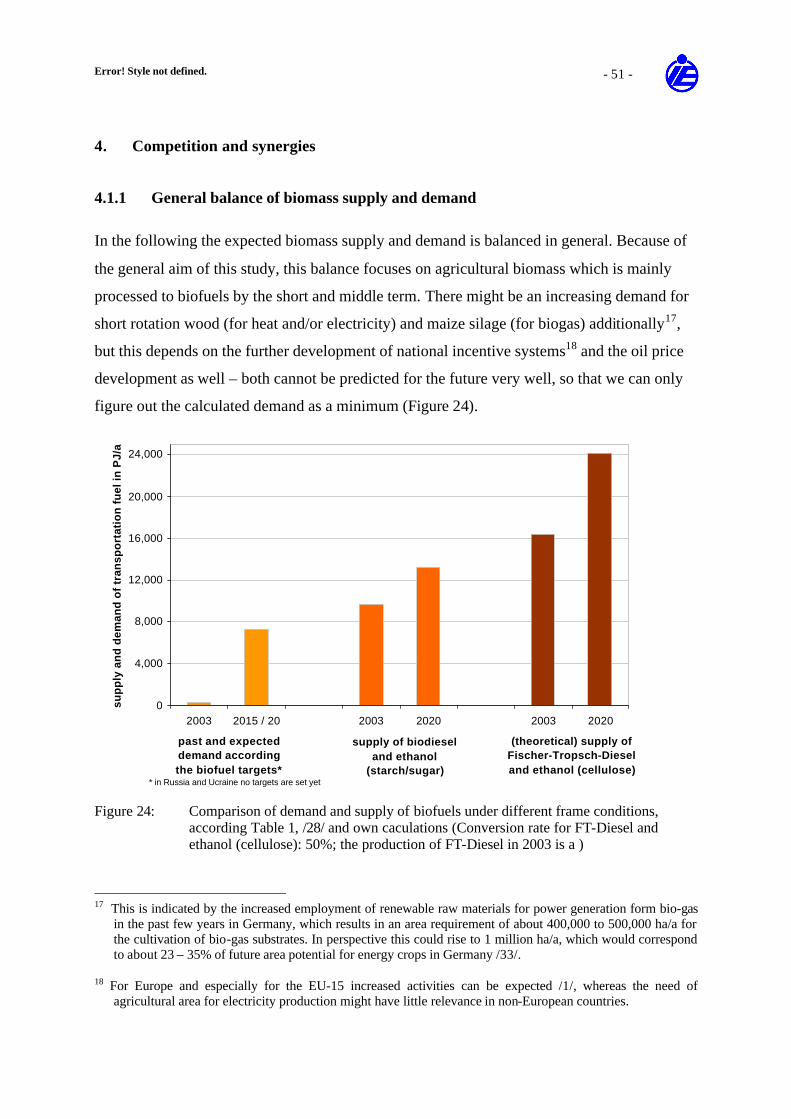
Error! Style not defined. - 51 -
4. Competition and synergies
4.1.1 General balance of biomass supply and demand
In the following the expected biomass supply and demand is balanced in general. Because of
the general aim of this study, this balance focuses on agricultural biomass which is mainly
processed to biofuels by the short and middle term. There might be an increasing demand for
short rotation wood (for heat and/or electricity) and maize silage (for biogas) additionally17,
but this depends on the further development of national incentive systems18 and the oil price
development as well – both cannot be predicted for the future very well, so that we can only
figure out the calculated demand as a minimum (Figure 24).
0
4,000
8,000
12,000
16,000
20,000
24,000
2003 2015 / 20 2003 2020 2003 2020
sup
ply
an
d d
eman
d o
f tr
ansp
ort
atio
n f
uel
in P
J/a
past and expected demand according the biofuel targets*
supply of biodiesel and ethanol
(starch/sugar)
(theoretical) supply of Fischer-Tropsch-Diesel and ethanol (cellulose)
* in Russia and Ucraine no targets are set yet Figure 24: Comparison of demand and supply of biofuels under different frame conditions,
according Table 1, /28/ and own caculations (Conversion rate for FT-Diesel and ethanol (cellulose): 50%; the production of FT-Diesel in 2003 is a )
17 This is indicated by the increased employment of renewable raw materials for power generation form bio-gas
in the past few years in Germany, which results in an area requirement of about 400,000 to 500,000 ha/a for the cultivation of bio-gas substrates. In perspective this could rise to 1 million ha/a, which would correspond to about 23 – 35% of future area potential for energy crops in Germany /33/.
18 For Europe and especially for the EU-15 increased activities can be expected /1/, whereas the need of agricultural area for electricity production might have little relevance in non-European countries.
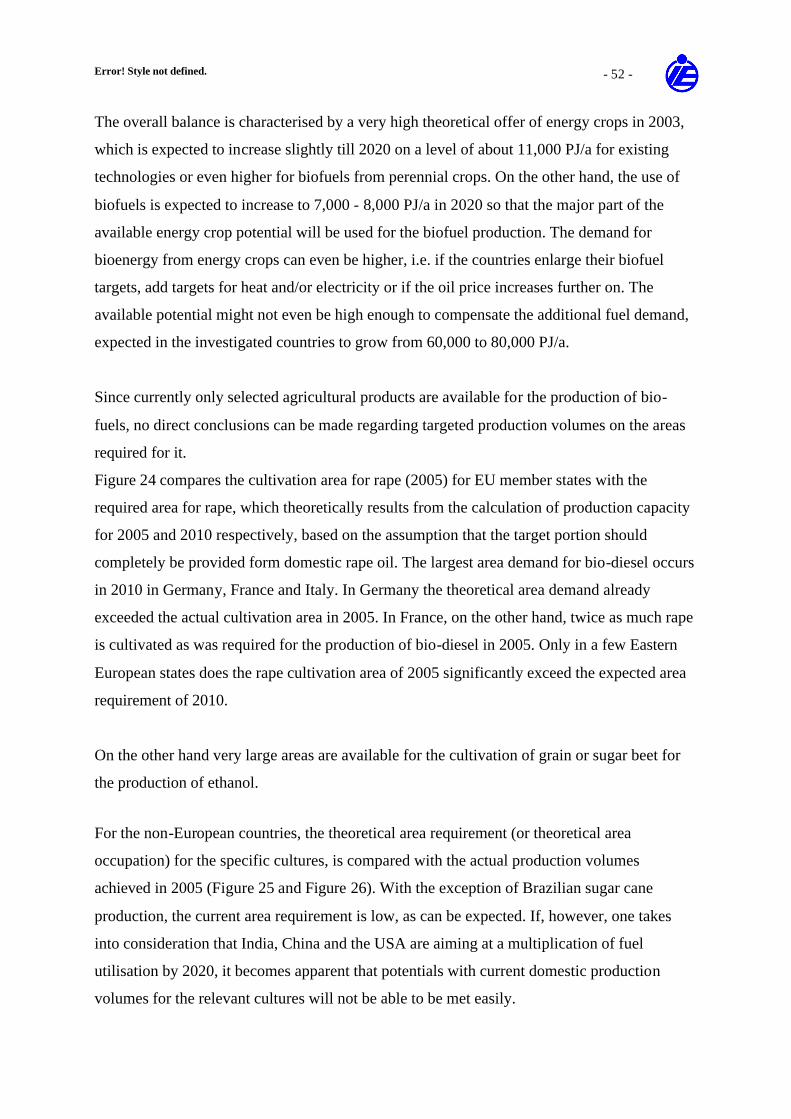
Error! Style not defined. - 52 -
The overall balance is characterised by a very high theoretical offer of energy crops in 2003,
which is expected to increase slightly till 2020 on a level of about 11,000 PJ/a for existing
technologies or even higher for biofuels from perennial crops. On the other hand, the use of
biofuels is expected to increase to 7,000 - 8,000 PJ/a in 2020 so that the major part of the
available energy crop potential will be used for the biofuel production. The demand for
bioenergy from energy crops can even be higher, i.e. if the countries enlarge their biofuel
targets, add targets for heat and/or electricity or if the oil price increases further on. The
available potential might not even be high enough to compensate the additional fuel demand,
expected in the investigated countries to grow from 60,000 to 80,000 PJ/a.
Since currently only selected agricultural products are available for the production of bio-
fuels, no direct conclusions can be made regarding targeted production volumes on the areas
required for it.
Figure 24 compares the cultivation area for rape (2005) for EU member states with the
required area for rape, which theoretically results from the calculation of production capacity
for 2005 and 2010 respectively, based on the assumption that the target portion should
completely be provided form domestic rape oil. The largest area demand for bio-diesel occurs
in 2010 in Germany, France and Italy. In Germany the theoretical area demand already
exceeded the actual cultivation area in 2005. In France, on the other hand, twice as much rape
is cultivated as was required for the production of bio-diesel in 2005. Only in a few Eastern
European states does the rape cultivation area of 2005 significantly exceed the expected area
requirement of 2010.
On the other hand very large areas are available for the cultivation of grain or sugar beet for
the production of ethanol.
For the non-European countries, the theoretical area requirement (or theoretical area
occupation) for the specific cultures, is compared with the actual production volumes
achieved in 2005 (Figure 25 and Figure 26). With the exception of Brazilian sugar cane
production, the current area requirement is low, as can be expected. If, however, one takes
into consideration that India, China and the USA are aiming at a multiplication of fuel
utilisation by 2020, it becomes apparent that potentials with current domestic production
volumes for the relevant cultures will not be able to be met easily.
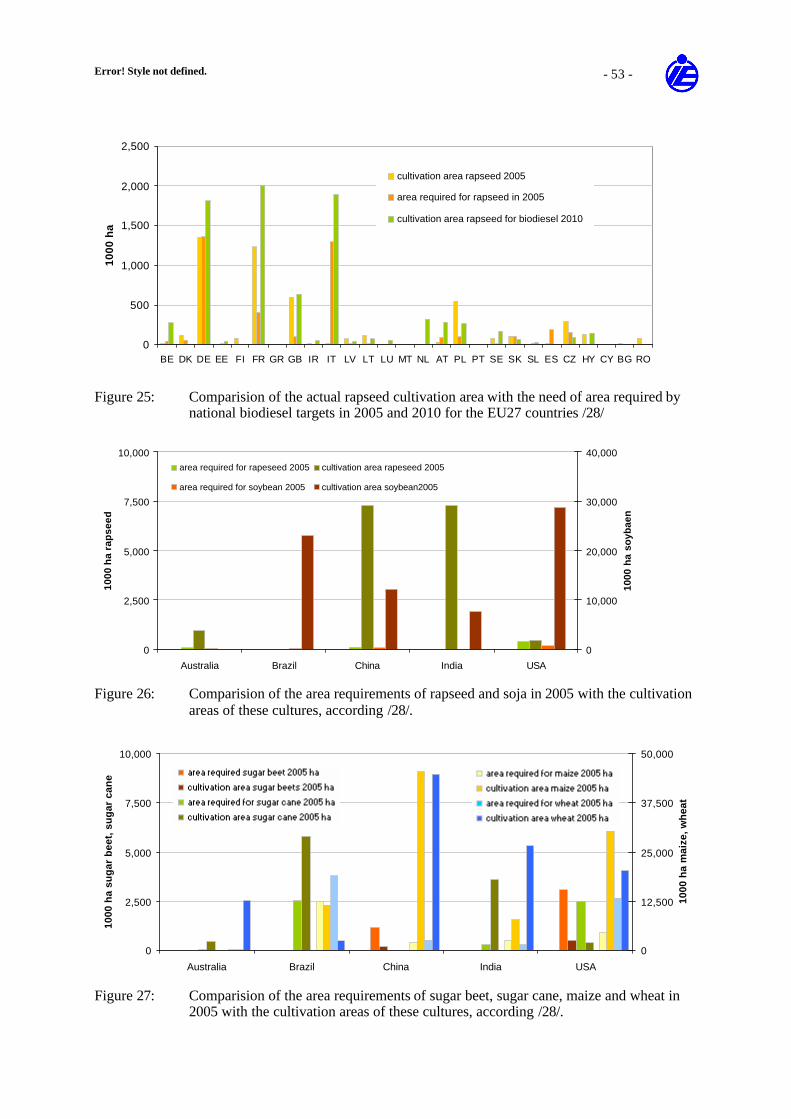
Error! Style not defined. - 53 -
0
500
1,000
1,500
2,000
2,500
BE DK DE EE FI FR GR GB IR IT LV LT LU MT NL AT PL PT SE SK SL ES CZ HY CY BG RO
1000
ha
cultivation area rapseed 2005
area required for rapseed in 2005
cultivation area rapseed for biodiesel 2010
Figure 25: Comparision of the actual rapseed cultivation area with the need of area required by
national biodiesel targets in 2005 and 2010 for the EU27 countries /28/
0
2,500
5,000
7,500
10,000
Australia Brazil China India USA
1000
ha
rap
seed
0
10,000
20,000
30,000
40,000
1000
ha
soyb
aen
area required for rapeseed 2005 cultivation area rapeseed 2005
area required for soybean 2005 cultivation area soybean2005
Figure 26: Comparision of the area requirements of rapseed and soja in 2005 with the cultivation
areas of these cultures, according /28/.
0
2,500
5,000
7,500
10,000
Australia Brazil China India USA
1000
ha
sug
ar b
eet,
su
gar
can
e
0
12,500
25,000
37,500
50,000
1000
ha
mai
ze, w
hea
t
Figure 27: Comparision of the area requirements of sugar beet, sugar cane, maize and wheat in 2005 with the cultivation areas of these cultures, according /28/.
Error! Style not defined. - 54 -
4.2 Export-/Import balances and subsequently on external trade of agricultural
commodities
Due to the fact that the assessments of bio-fuel potential above is just a technical rather than
an economical approach the share can not be estimated how much feedstock will be used for
domestic bio-fuel and/or how much for exports. This short excursus shows for the individual
countries the export-/import balance if bio-fuels will not be supported and therefore not
produced.
Based on estimated availability of area for wet and dry bio-mass, the export-import changes to
be expected in future can be calculated, subject to the assumption of an unchanged cultivation
situation and taking into consideration the trends of domestic consumption as well as trends of
domestic supply. In the EU, an above average growth is experienced in France, Poland, the
Czech Republic, Hungary and Spain, while other member states show either no potential or a
below average growth (Denmark, Latvia, Lithuania, and others). An increasing production
surplus of cereals will appear which can be used for export or bio-ethanol under the provision
that the national food supply will not become deficits. In contrary oilseeds and vegetable oil
will not be available to a higher extend for bio-diesel in the EU 27.
The joining countries Romania and Bulgaria are potential surplus countries for agricultural
products, offering additional potential. In Table 7 the import/export balances of the countries
under observation are listed, which are based on data from Table 1.
Of the countries under observation for this study, more than half of the population and
production of the world, has been captured with a total of ca. 3.5 billion people and
2.3 billion ha of agriculturally utilised area. As mentioned above, the calculation of
import/export balances is based on the hypothetical assumption that the countries presented,
relinquish a further expansion of bio-energy, whereby additionally produced agricultural
products as a result of the utilisation of available production potentials (including fallow areas
and yield increases), will only be used for the provision of foodstuffs and export. Then grain
surpluses for export show a significant increase in the EU-27. In this way grain exports could
increase by almost 19 million t to about 78 million t in 2020. At the same time existing oil
seed import deficits of 20 million t could remain virtually unchanged, while the import gap
for plant oils would increase slightly according to the trend.
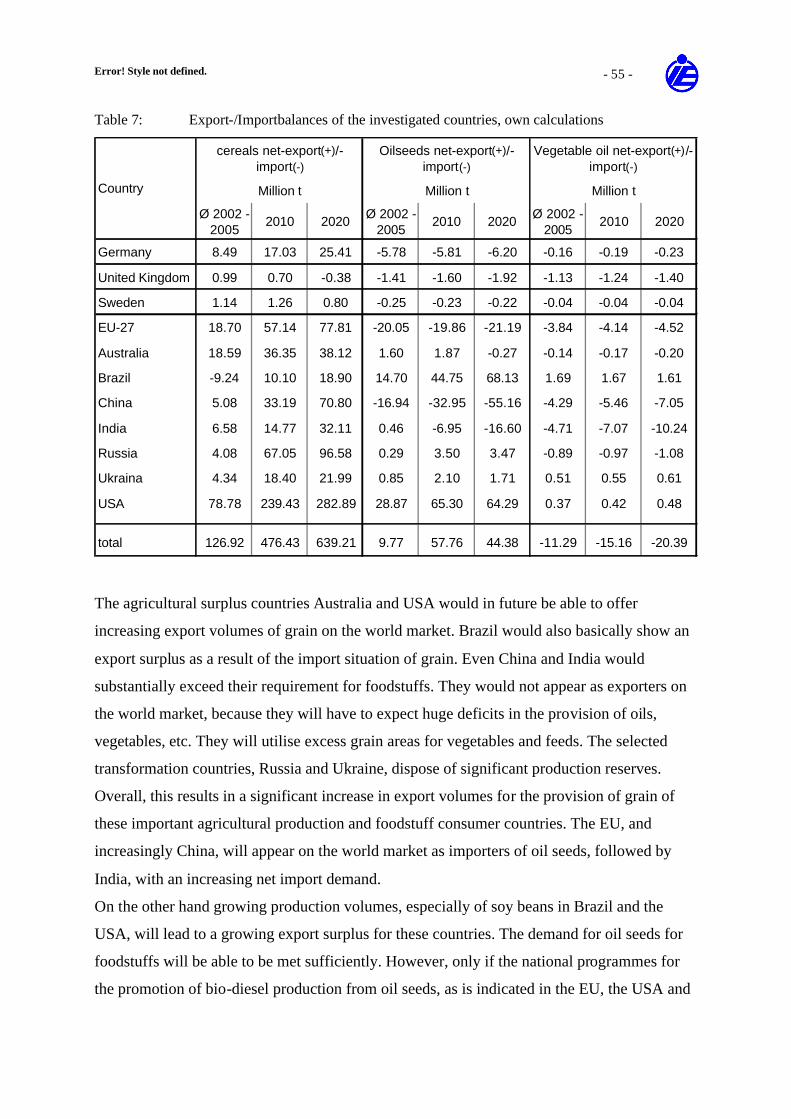
Error! Style not defined. - 55 -
Table 7: Export-/Importbalances of the investigated countries, own calculations
Ø 2002 - 2005
2010 2020 Ø 2002 - 2005
2010 2020 Ø 2002 - 2005
2010 2020
Germany 8.49 17.03 25.41 -5.78 -5.81 -6.20 -0.16 -0.19 -0.23
United Kingdom 0.99 0.70 -0.38 -1.41 -1.60 -1.92 -1.13 -1.24 -1.40
Sweden 1.14 1.26 0.80 -0.25 -0.23 -0.22 -0.04 -0.04 -0.04
EU-27 18.70 57.14 77.81 -20.05 -19.86 -21.19 -3.84 -4.14 -4.52
Australia 18.59 36.35 38.12 1.60 1.87 -0.27 -0.14 -0.17 -0.20
Brazil -9.24 10.10 18.90 14.70 44.75 68.13 1.69 1.67 1.61
China 5.08 33.19 70.80 -16.94 -32.95 -55.16 -4.29 -5.46 -7.05
India 6.58 14.77 32.11 0.46 -6.95 -16.60 -4.71 -7.07 -10.24
Russia 4.08 67.05 96.58 0.29 3.50 3.47 -0.89 -0.97 -1.08
Ukraina 4.34 18.40 21.99 0.85 2.10 1.71 0.51 0.55 0.61
USA 78.78 239.43 282.89 28.87 65.30 64.29 0.37 0.42 0.48
total 126.92 476.43 639.21 9.77 57.76 44.38 -11.29 -15.16 -20.39
Country
Vegetable oil net-export(+)/-import(-)
Million t
Oilseeds net-export(+)/-import(-)
Million t
cereals net-export(+)/-import(-)
Million t
The agricultural surplus countries Australia and USA would in future be able to offer
increasing export volumes of grain on the world market. Brazil would also basically show an
export surplus as a result of the import situation of grain. Even China and India would
substantially exceed their requirement for foodstuffs. They would not appear as exporters on
the world market, because they will have to expect huge deficits in the provision of oils,
vegetables, etc. They will utilise excess grain areas for vegetables and feeds. The selected
transformation countries, Russia and Ukraine, dispose of significant production reserves.
Overall, this results in a significant increase in export volumes for the provision of grain of
these important agricultural production and foodstuff consumer countries. The EU, and
increasingly China, will appear on the world market as importers of oil seeds, followed by
India, with an increasing net import demand.
On the other hand growing production volumes, especially of soy beans in Brazil and the
USA, will lead to a growing export surplus for these countries. The demand for oil seeds for
foodstuffs will be able to be met sufficiently. However, only if the national programmes for
the promotion of bio-diesel production from oil seeds, as is indicated in the EU, the USA and
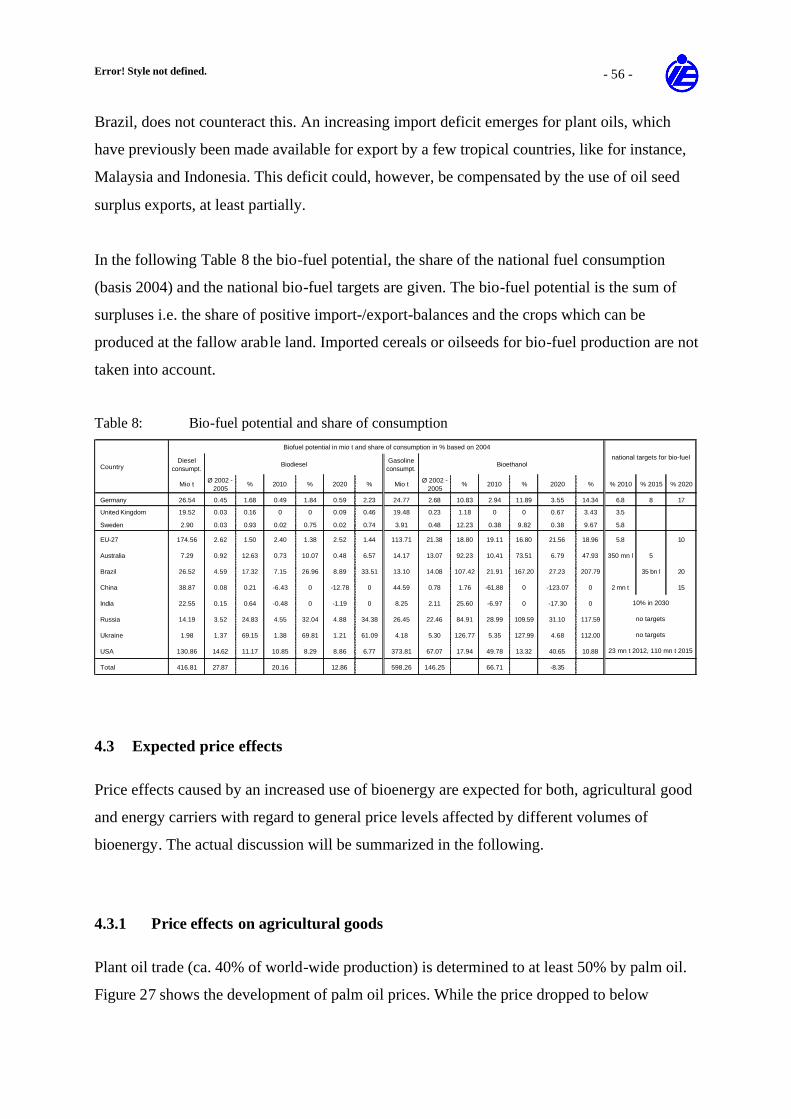
Error! Style not defined. - 56 -
Brazil, does not counteract this. An increasing import deficit emerges for plant oils, which
have previously been made available for export by a few tropical countries, like for instance,
Malaysia and Indonesia. This deficit could, however, be compensated by the use of oil seed
surplus exports, at least partially.
In the following Table 8 the bio-fuel potential, the share of the national fuel consumption
(basis 2004) and the national bio-fuel targets are given. The bio-fuel potential is the sum of
surpluses i.e. the share of positive import-/export-balances and the crops which can be
produced at the fallow arable land. Imported cereals or oilseeds for bio-fuel production are not
taken into account.
Table 8: Bio-fuel potential and share of consumption
Diesel consumpt.
Gasoline consumpt.
Mio t Ø 2002 - 2005
% 2010 % 2020 % Mio t Ø 2002 - 2005
% 2010 % 2020 % % 2010 % 2015 % 2020
Germany 26.54 0.45 1.68 0.49 1.84 0.59 2.23 24.77 2.68 10.83 2.94 11.89 3.55 14.34 6.8 8 17
United Kingdom 19.52 0.03 0.16 0 0 0.09 0.46 19.48 0.23 1.18 0 0 0.67 3.43 3.5
Sweden 2.90 0.03 0.93 0.02 0.75 0.02 0.74 3.91 0.48 12.23 0.38 9.82 0.38 9.67 5.8
EU-27 174.56 2.62 1.50 2.40 1.38 2.52 1.44 113.71 21.38 18.80 19.11 16.80 21.56 18.96 5.8 10
Australia 7.29 0.92 12.63 0.73 10.07 0.48 6.57 14.17 13.07 92.23 10.41 73.51 6.79 47.93 350 mn l 5
Brazil 26.52 4.59 17.32 7.15 26.96 8.89 33.51 13.10 14.08 107.42 21.91 167.20 27.23 207.79 35 bn l 20
China 38.87 0.08 0.21 -6.43 0 -12.78 0 44.59 0.78 1.76 -61.88 0 -123.07 0 2 mn t 15
India 22.55 0.15 0.64 -0.48 0 -1.19 0 8.25 2.11 25.60 -6.97 0 -17.30 0
Russia 14.19 3.52 24.83 4.55 32.04 4.88 34.38 26.45 22.46 84.91 28.99 109.59 31.10 117.59
Ukraine 1.98 1.37 69.15 1.38 69.81 1.21 61.09 4.18 5.30 126.77 5.35 127.99 4.68 112.00
USA 130.86 14.62 11.17 10.85 8.29 8.86 6.77 373.81 67.07 17.94 49.78 13.32 40.65 10.88
Total 416.81 27.87 20.16 12.86 598.26 146.25 66.71 -8.35
Country
Biofuel potential in mio t and share of consumption in % based on 2004
Biodiesel Bioethanol
23 mn t 2012, 110 mn t 2015
national targets for bio-fuel
10% in 2030
no targets
no targets
4.3 Expected price effects
Price effects caused by an increased use of bioenergy are expected for both, agricultural good
and energy carriers with regard to general price levels affected by different volumes of
bioenergy. The actual discussion will be summarized in the following.
4.3.1 Price effects on agricultural goods
Plant oil trade (ca. 40% of world-wide production) is determined to at least 50% by palm oil.
Figure 27 shows the development of palm oil prices. While the price dropped to below
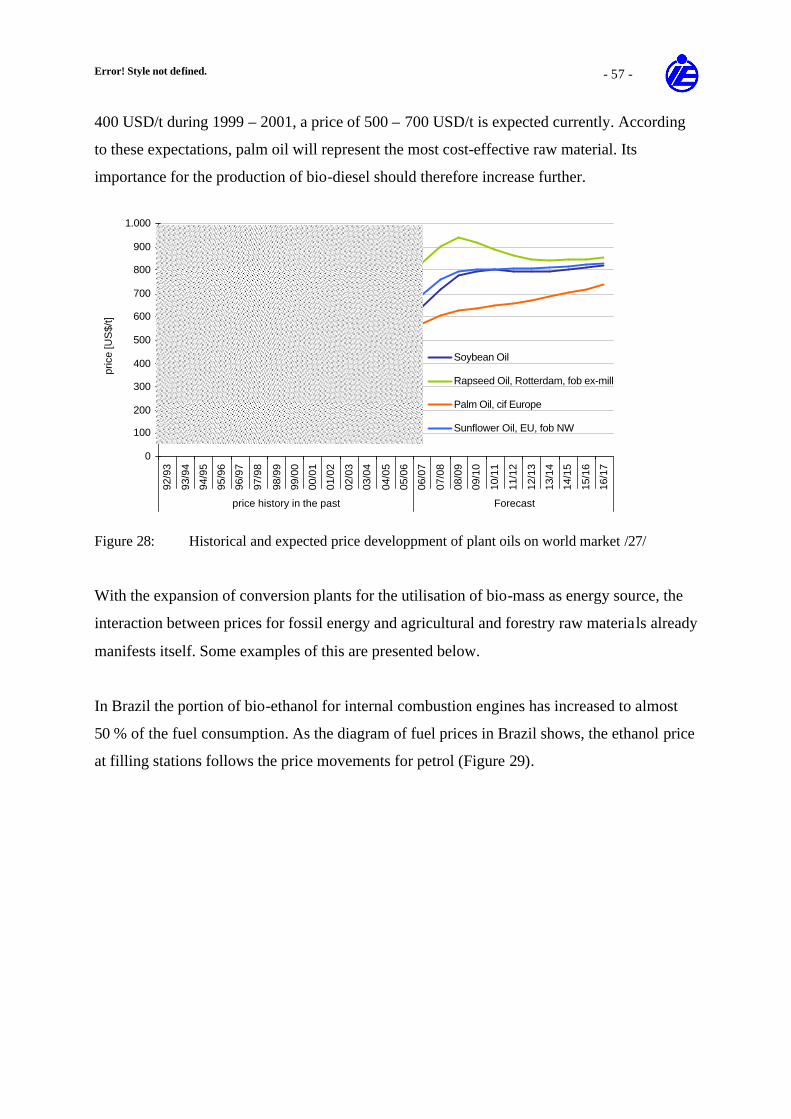
Error! Style not defined. - 57 -
400 USD/t during 1999 – 2001, a price of 500 – 700 USD/t is expected currently. According
to these expectations, palm oil will represent the most cost-effective raw material. Its
importance for the production of bio-diesel should therefore increase further.
0
100
200
300
400
500
600
700
800
900
1.000
92/9
3
93/9
4
94/9
5
95/9
6
96/9
7
97/9
8
98/9
9
99/0
0
00/0
1
01/0
2
02/0
3
03/0
4
04/0
5
05/0
6
06/0
7
07/0
8
08/0
9
09/1
0
10/1
1
11/1
2
12/1
3
13/1
4
14/1
5
15/1
6
16/1
7
price history in the past Forecast
pric
e [U
S$/
t]
Soybean Oil
Rapseed Oil, Rotterdam, fob ex-mill
Palm Oil, cif Europe
Sunflower Oil, EU, fob NW
Figure 28: Historical and expected price developpment of plant oils on world market /27/
With the expansion of conversion plants for the utilisation of bio-mass as energy source, the
interaction between prices for fossil energy and agricultural and forestry raw materials already
manifests itself. Some examples of this are presented below.
In Brazil the portion of bio-ethanol for internal combustion engines has increased to almost
50 % of the fuel consumption. As the diagram of fuel prices in Brazil shows, the ethanol price
at filling stations follows the price movements for petrol (Figure 29).
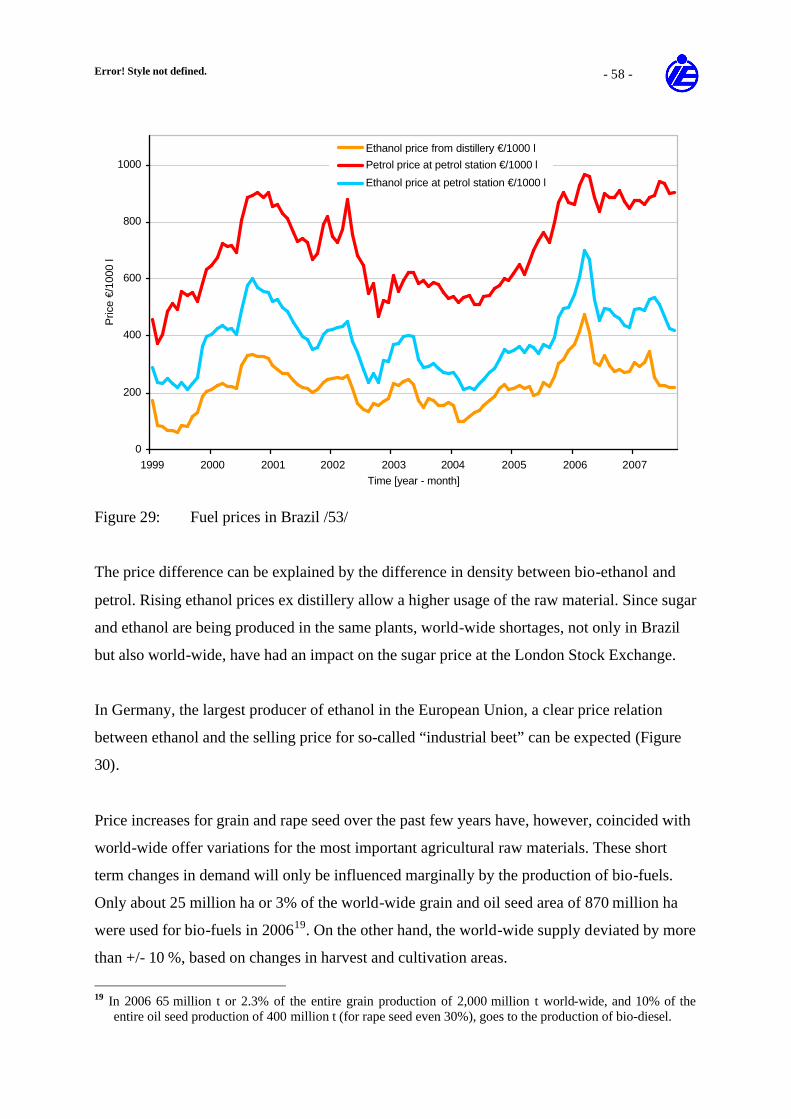
Error! Style not defined. - 58 -
0
200
400
600
800
1000
1999 2000 2001 2002 2003 2004 2005 2006 2007Time [year - month]
Pric
e €/
1000
l
Ethanol price from distillery €/1000 lPetrol price at petrol station €/1000 l
Ethanol price at petrol station €/1000 l
Figure 29: Fuel prices in Brazil /53/
The price difference can be explained by the difference in density between bio-ethanol and
petrol. Rising ethanol prices ex distillery allow a higher usage of the raw material. Since sugar
and ethanol are being produced in the same plants, world-wide shortages, not only in Brazil
but also world-wide, have had an impact on the sugar price at the London Stock Exchange.
In Germany, the largest producer of ethanol in the European Union, a clear price relation
between ethanol and the selling price for so-called “industrial beet” can be expected (Figure
30).
Price increases for grain and rape seed over the past few years have, however, coincided with
world-wide offer variations for the most important agricultural raw materials. These short
term changes in demand will only be influenced marginally by the production of bio-fuels.
Only about 25 million ha or 3% of the world-wide grain and oil seed area of 870 million ha
were used for bio-fuels in 200619. On the other hand, the world-wide supply deviated by more
than +/- 10 %, based on changes in harvest and cultivation areas.
19 In 2006 65 million t or 2.3% of the entire grain production of 2,000 million t world-wide, and 10% of the
entire oil seed production of 400 million t (for rape seed even 30%), goes to the production of bio-diesel.
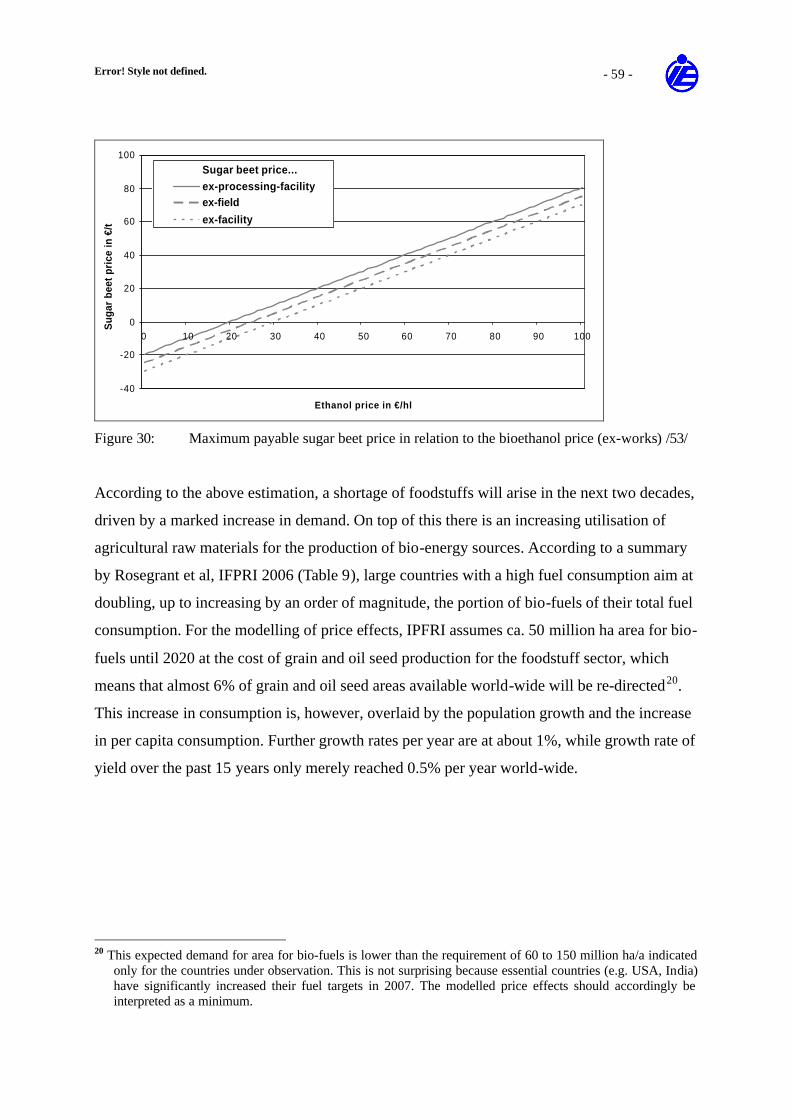
Error! Style not defined. - 59 -
-40
-20
0
20
40
60
80
100
0 10 20 30 40 50 60 70 80 90 100
Ethanol price in €/hl
Sug
ar b
eet
pric
e in
€/t
Sugar beet price...ex-processing-facilityex-field
ex-facility
Figure 30: Maximum payable sugar beet price in relation to the bioethanol price (ex-works) /53/
According to the above estimation, a shortage of foodstuffs will arise in the next two decades,
driven by a marked increase in demand. On top of this there is an increasing utilisation of
agricultural raw materials for the production of bio-energy sources. According to a summary
by Rosegrant et al, IFPRI 2006 (Table 9), large countries with a high fuel consumption aim at
doubling, up to increasing by an order of magnitude, the portion of bio-fuels of their total fuel
consumption. For the modelling of price effects, IPFRI assumes ca. 50 million ha area for bio-
fuels until 2020 at the cost of grain and oil seed production for the foodstuff sector, which
means that almost 6% of grain and oil seed areas available world-wide will be re-directed20.
This increase in consumption is, however, overlaid by the population growth and the increase
in per capita consumption. Further growth rates per year are at about 1%, while growth rate of
yield over the past 15 years only merely reached 0.5% per year world-wide.
20 This expected demand for area for bio-fuels is lower than the requirement of 60 to 150 million ha/a indicated
only for the countries under observation. This is not surprising because essential countries (e.g. USA, India) have significantly increased their fuel targets in 2007. The modelled price effects should accordingly be interpreted as a minimum.
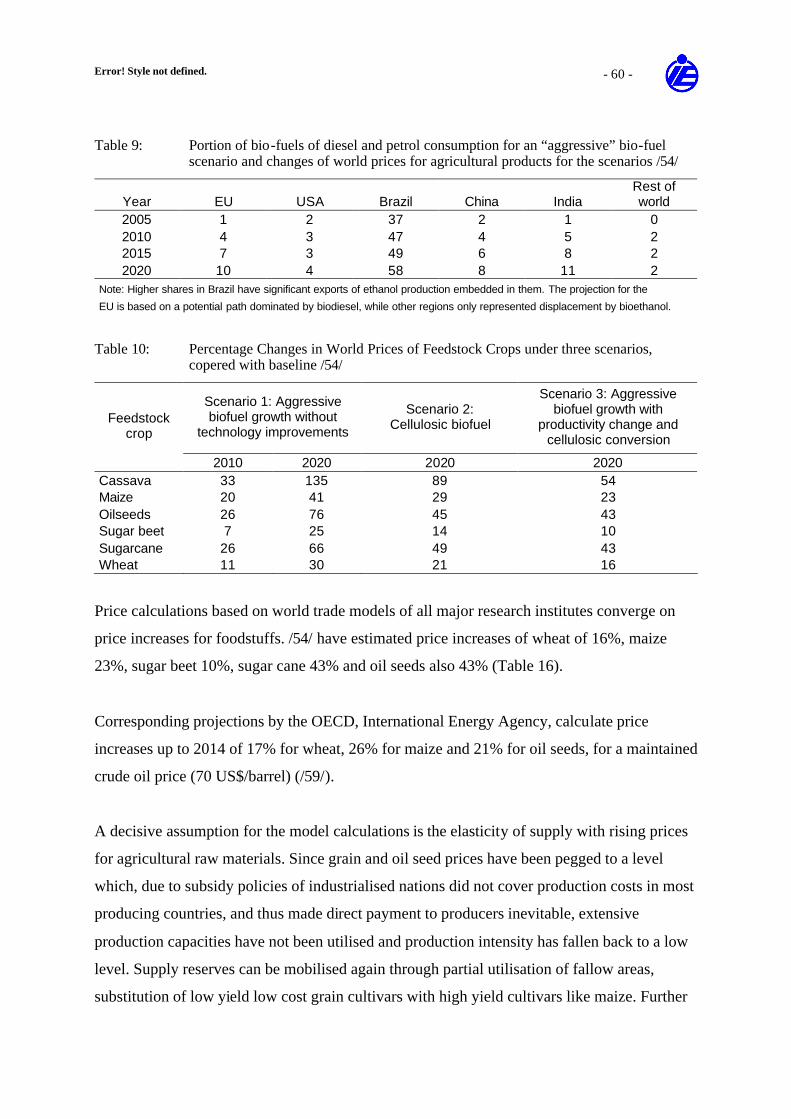
Error! Style not defined. - 60 -
Table 9: Portion of bio-fuels of diesel and petrol consumption for an “aggressive” bio-fuel scenario and changes of world prices for agricultural products for the scenarios /54/
Year EU USA Brazil China India Rest of world
2005 1 2 37 2 1 0 2010 4 3 47 4 5 2 2015 7 3 49 6 8 2 2020 10 4 58 8 11 2
Note: Higher shares in Brazil have significant exports of ethanol production embedded in them. The projection for the
EU is based on a potential path dominated by biodiesel, while other regions only represented displacement by bioethanol.
Table 10: Percentage Changes in World Prices of Feedstock Crops under three scenarios, copered with baseline /54/
Scenario 1: Aggressive biofuel growth without
technology improvements
Scenario 2: Cellulosic biofuel
Scenario 3: Aggressive biofuel growth with
productivity change and cellulosic conversion
Feedstock crop
2010 2020 2020 2020 Cassava 33 135 89 54 Maize 20 41 29 23 Oilseeds 26 76 45 43 Sugar beet 7 25 14 10 Sugarcane 26 66 49 43 Wheat 11 30 21 16
Price calculations based on world trade models of all major research institutes converge on
price increases for foodstuffs. /54/ have estimated price increases of wheat of 16%, maize
23%, sugar beet 10%, sugar cane 43% and oil seeds also 43% (Table 16).
Corresponding projections by the OECD, International Energy Agency, calculate price
increases up to 2014 of 17% for wheat, 26% for maize and 21% for oil seeds, for a maintained
crude oil price (70 US$/barrel) (/59/).
A decisive assumption for the model calculations is the elasticity of supply with rising prices
for agricultural raw materials. Since grain and oil seed prices have been pegged to a level
which, due to subsidy policies of industrialised nations did not cover production costs in most
producing countries, and thus made direct payment to producers inevitable, extensive
production capacities have not been utilised and production intensity has fallen back to a low
level. Supply reserves can be mobilised again through partial utilisation of fallow areas,
substitution of low yield low cost grain cultivars with high yield cultivars like maize. Further
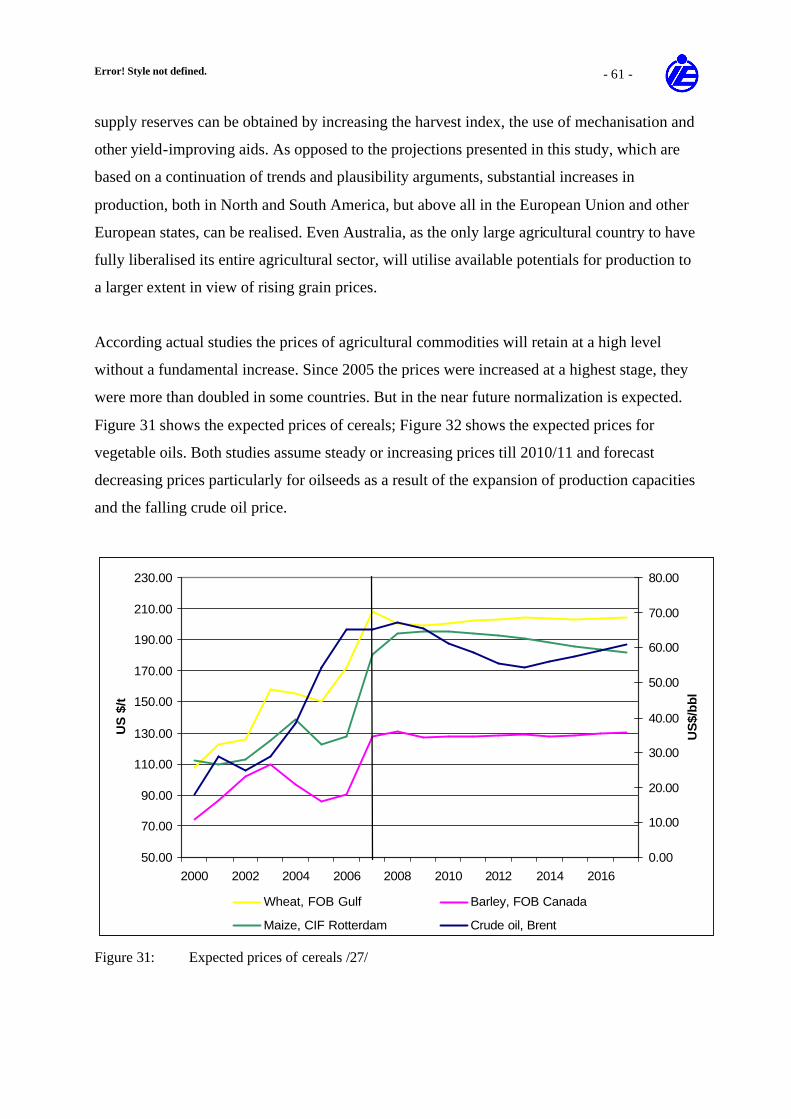
Error! Style not defined. - 61 -
supply reserves can be obtained by increasing the harvest index, the use of mechanisation and
other yield-improving aids. As opposed to the projections presented in this study, which are
based on a continuation of trends and plausibility arguments, substantial increases in
production, both in North and South America, but above all in the European Union and other
European states, can be realised. Even Australia, as the only large agricultural country to have
fully liberalised its entire agricultural sector, will utilise available potentials for production to
a larger extent in view of rising grain prices.
According actual studies the prices of agricultural commodities will retain at a high level
without a fundamental increase. Since 2005 the prices were increased at a highest stage, they
were more than doubled in some countries. But in the near future normalization is expected.
Figure 31 shows the expected prices of cereals; Figure 32 shows the expected prices for
vegetable oils. Both studies assume steady or increasing prices till 2010/11 and forecast
decreasing prices particularly for oilseeds as a result of the expansion of production capacities
and the falling crude oil price.
50.00
70.00
90.00
110.00
130.00
150.00
170.00
190.00
210.00
230.00
2000 2002 2004 2006 2008 2010 2012 2014 2016
US
$/t
0.00
10.00
20.00
30.00
40.00
50.00
60.00
70.00
80.00
US
$/b
bl
Wheat, FOB Gulf Barley, FOB Canada
Maize, CIF Rotterdam Crude oil, Brent
Figure 31: Expected prices of cereals /27/
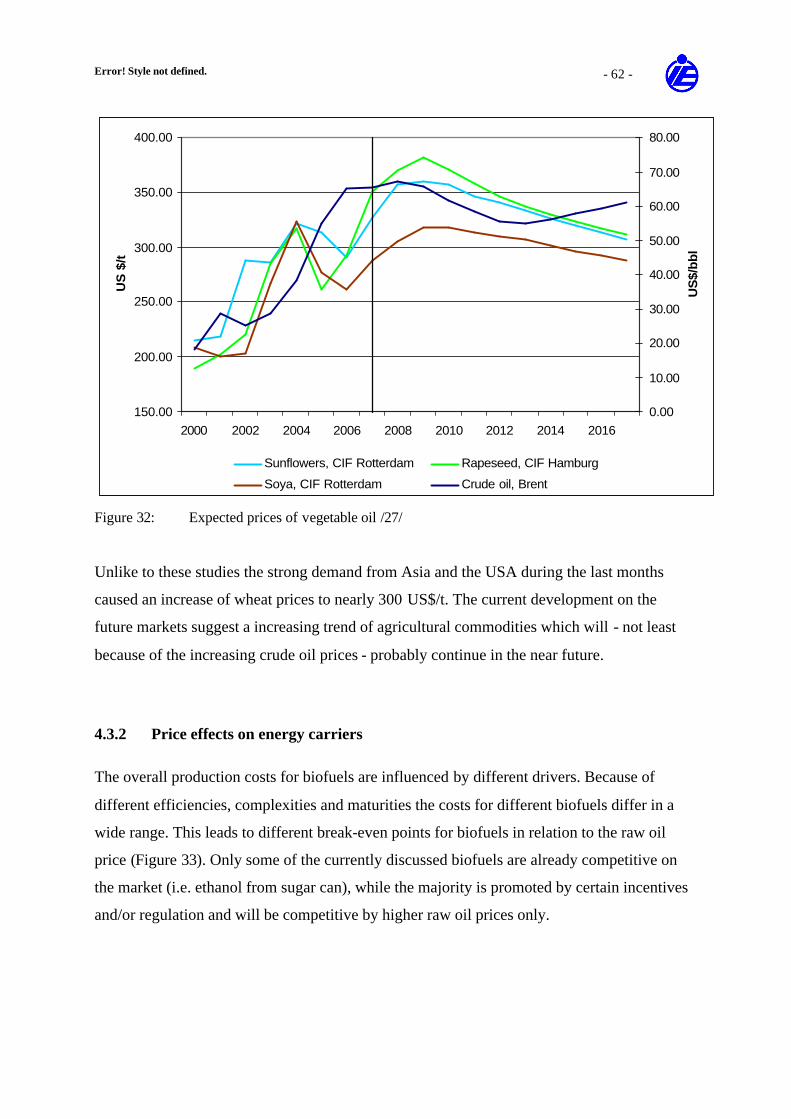
Error! Style not defined. - 62 -
150.00
200.00
250.00
300.00
350.00
400.00
2000 2002 2004 2006 2008 2010 2012 2014 2016
US
$/t
0.00
10.00
20.00
30.00
40.00
50.00
60.00
70.00
80.00
US
$/b
bl
Sunflowers, CIF Rotterdam Rapeseed, CIF Hamburg
Soya, CIF Rotterdam Crude oil, Brent
Figure 32: Expected prices of vegetable oil /27/
Unlike to these studies the strong demand from Asia and the USA during the last months
caused an increase of wheat prices to nearly 300 US$/t. The current development on the
future markets suggest a increasing trend of agricultural commodities which will - not least
because of the increasing crude oil prices - probably continue in the near future.
4.3.2 Price effects on energy carriers
The overall production costs for biofuels are influenced by different drivers. Because of
different efficiencies, complexities and maturities the costs for different biofuels differ in a
wide range. This leads to different break-even points for biofuels in relation to the raw oil
price (Figure 33). Only some of the currently discussed biofuels are already competitive on
the market (i.e. ethanol from sugar can), while the majority is promoted by certain incentives
and/or regulation and will be competitive by higher raw oil prices only.
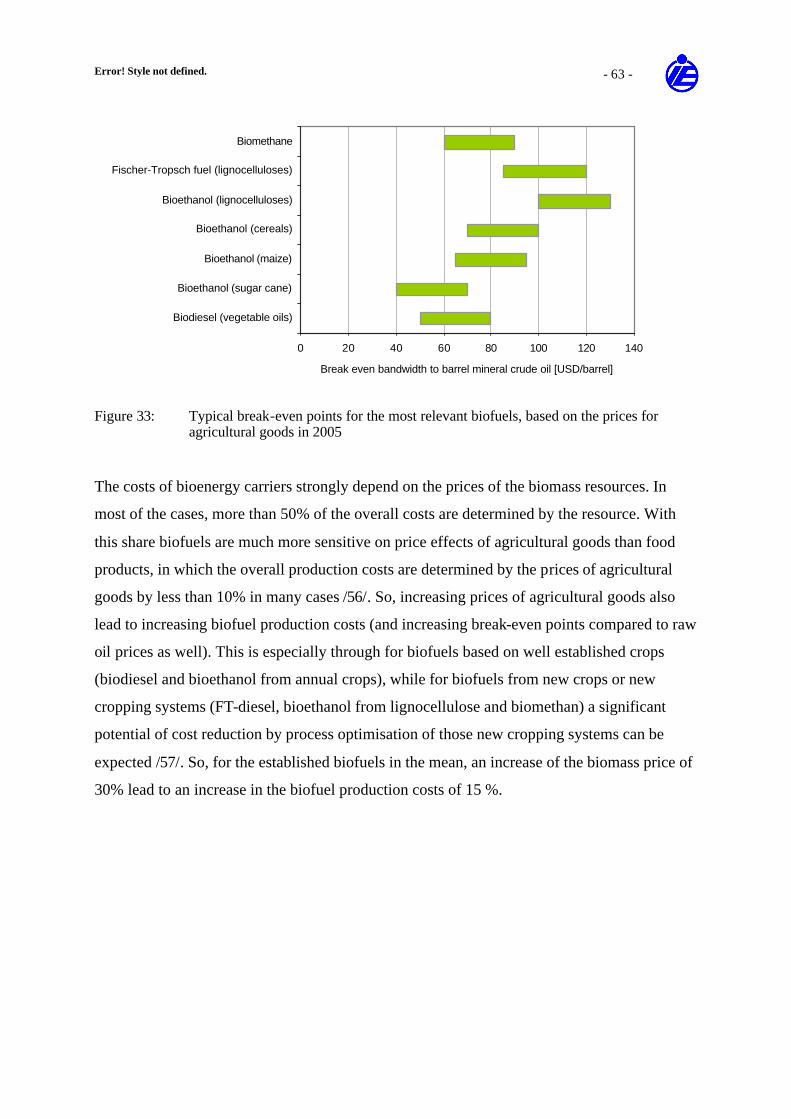
Error! Style not defined. - 63 -
0 20 40 60 80 100 120 140
Biodiesel (vegetable oils)
Bioethanol (sugar cane)
Bioethanol (maize)
Bioethanol (cereals)
Bioethanol (lignocelluloses)
Fischer-Tropsch fuel (lignocelluloses)
Biomethane
Break even bandwidth to barrel mineral crude oil [USD/barrel]
Figure 33: Typical break-even points for the most relevant biofuels, based on the prices for
agricultural goods in 2005
The costs of bioenergy carriers strongly depend on the prices of the biomass resources. In
most of the cases, more than 50% of the overall costs are determined by the resource. With
this share biofuels are much more sensitive on price effects of agricultural goods than food
products, in which the overall production costs are determined by the prices of agricultural
goods by less than 10% in many cases /56/. So, increasing prices of agricultural goods also
lead to increasing biofuel production costs (and increasing break-even points compared to raw
oil prices as well). This is especially through for biofuels based on well established crops
(biodiesel and bioethanol from annual crops), while for biofuels from new crops or new
cropping systems (FT-diesel, bioethanol from lignocellulose and biomethan) a significant
potential of cost reduction by process optimisation of those new cropping systems can be
expected /57/. So, for the established biofuels in the mean, an increase of the biomass price of
30% lead to an increase in the biofuel production costs of 15 %.
Error! Style not defined. - 64 -
5. Conclusions and recommendations
Potential estimations for bio-energy sources can be performed according to different
approaches. Theoretical and technical potentials either don’t take into consideration utilisation
concurrence with the sectors of foodstuffs and feed production, nature conservation and other
area demands, or only take insufficient consideration thereof. Prognoses of economical
potential assume that usable price prognoses for agricultural raw materials, energy sources
and prognosis models are available, which simultaneously correctly display utilisation
concurrence and willingness to invest in conversion plants. Generally this is only possible for
individual countries with complex models, but not for large economic areas, like for instance
the EU 15 or EU 27. Therefore, in the example on hand a largely simplified approach is
selected, which establishes the so-called exploitable area potentials with rigorous
assumptions, which are comprehensible for political decision makers, based on available
statistics, using simple regression calculations and plausibility considerations. Special
attention is given to the relationship between area demands for the production of foodstuffs
(including feed production), dwelling, industry and nature conservation. According to the
assignment, seven additional countries of importance for world nutrition are considered
besides the EU 27.
Taking into consideration the yield improvements, the results show that substantial
agricultural potentials could be utilised before acute price reactions and provision
dependencies will arise for foodstuffs and feeds:
1. In the countries under observation, substantial area potentials of about 450 million ha/a
are available for the production of energy crops. The essential starting points for the
exhaustion of utilisable potentials are in the relinquishment of partially obligatory laying
fallow of areas and in the substitution of low yield energy crops with high yield energy
crops for energy sources. However – with a continuation of the current trends in
foodstuffs – an increasing demand for area, especially for an increasing production of
milk and meat products is expected until 2020 for some countries (previously produced
mainly on grasslands), derived from an annual increase in world population of almost 1%
until 2020 and an increase of almost 1% in per capita consumption. The area potentials
available in 2003 will be used entirely for the production of foodstuffs in 2020 –
Error! Style not defined. - 65 -
especially milk and meat production – if the trends of the past few years continue
unabated.
2. It is anticipated, that the essential demand for bio-energy from agriculture will come from
the fuel sector. This results both within the framework of security of supply and (at least
partially) in view of protection of the climate. The calculated area potentials in the
countries under observation offer a fuel potential of 10,000 – 24,000 PJ/a (until 2020).
Currently this is compared to the formulated fuel objectives of at least 7,000 – 8,000 PJ/a,
whereby this is only a snapshot (probably a lower limit), because the objectives are
currently being discussed and adapted in the short term in many countries, and generally
will be pegged higher. Furthermore it must be taken into consideration that currently
formulated fuel objectives should not compensate the expected increases in consumption
of ca. 20,000 PJ/a until 2020.
3. At the same time the grain segment shows clearly increasing availability for the future,
which can be utilised for the production of fuels, if the increasing demand for area can be
compensated by other means.
4. The analysis of import-export balances for the partial grain segment shows clearly
increasing availability for the future, which can be utilised for the production of fuels, if
the increasing demand for area can be compensated by other means. The supply potential
of foodstuffs, provided at expected higher agricultural prices, is difficult to estimate. The
estimate on hand does not take this into consideration. At the same time it seems to be
substantial, because export subsidies of some industrialised countries have for decades
effected such low world market prices, that yield increase and area potentials could not be
exploited fully in the most important agricultural countries. Therefore significant
compensation options are to be expected both in industrialised and in developing countries
for continued higher agricultural prices.
5. Such price-induced measures could, for instance, be:
a. Change of land utilisation in line with future price developments, mainly towards
higher yield cultivars and a waiver of fallow ground
b. Higher import of milk and meat from countries with comparative cost advantages
and a surplus of grasslands
c. Increase of general area productivity (cropping index, irrigation, breeding,
substitution of cultivars, etc.)
Error! Style not defined. - 66 -
6. Compensation options should and will be aligned to the challenges of millennium
objectives and will become especially attractive if sustainable profitable prices can be
expected for products. According to the present state of knowledge, these can be expected
not only despite the increased utilisation of agriculturally produced sources of bio-energy,
but also because of a changed demand structure for foodstuffs. Currently a lot of
uncertainty exists here.
7. Additionally the residue potential from agriculture consists of round about 9,000 PJ/a, but
this is expected to be used on a more local and regional level and affects the synergies and
competition much fewer.
8. Among others, the following are challenges for the intensification of agricultural
production:
a. ensure rights of food for everybody
b. participation of all in the process of adding value
c. improve environmental standards for high nature value areas
d. increase efficiencies in energy crop production and bio-fuel production as well
Problems can not only be solved in the energy sector, but require a paradigm shift in
agriculture.
9. Especially the energy policy for the promotion of fuels is decisive for the demand for
agriculturally produced bio-energy. Without promotion, bio-fuels can only be competitive
in the market if oil prices remain high. Until 2020 established food crops will provide a
decisive supply contribution. After that new cultivars, especially short rotation wood and
efficient cropping systems for bio-gas, will experience further expansion. The availability
of suitable and cost-effective conversion technologies (i.e. for FT diesel, SNG, ethanol
from cellulose) and sufficient security for planning by adapted regulation (i.e. to feed in
green gas into the natural gas grid), will be decisive for the demand of these new energy
crops.
10. At least the short and medium term necessity of promotion also offers the opportunity of
shaping policies in view of product and production standards.
11. In summary, the following synergies can be achieved if suitable basic conditions are set:
a. The demand for bio-energy which occupies only less then 5 % of the agricultural
acreage seems to have a price-increasing effect on agricultural products and
therefore a stabilising effect on agriculture. This happens independently from the
political instruments which are used for the stimulation of bio-fuel demand.
Error! Style not defined. - 67 -
b. New cultivation systems with a high productivity and favourable environmental
effects and local added value become economically attractive (e.g. perennial
cultivars). This would result in a significant contribution towards multi-
functionality in the rural environment.
c. Sustainability standards in view of environmentally compliant production of bio-
mass are set, complied with and utilised, for instance in the implementation of the
production of energy crops.
d. A world-wide promotion of agricultural policies, land rights and improvement of
agricultural infrastructure, especially in developing countries, which would
improve the security of supply and combat poverty overall.
e. The bio-energy debate across the entire process chain is augmented with a debate
on energy efficiency.
f. These synergies are supported with a continuing harmonisation of promotion
policies for bio-fuels with power and heat generation from bio-mass.
12. The effects of climatic change on agricultural potentials on the one hand and the further
development of agricultural production on the other hand will be decisive for the potential
of bio-mass in the long term (until 2050). In the past a high demand for agricultural
products had a positive effect on the latter.
In conclusion it must be emphasized again, that this study does not constitute a prognosis of
energy crop production and utilisation for the next decade, but merely allows estimation based
on a continuation of observed trends and the resulting exploitable area potential for foodstuff
imports or energy crops. The estimated bio-mass potential as energy source for the EU- 15/27
and other important countries is huge. However, the question of how long it will be able to be
utilised for bio-energy, and not again be used for food or feed provision, due to market
reaction within the EU and world-wide in a changed world market situation, is still open. A
comprehensive consideration of all bio-energy sources, i.e. also of bio-energy from forest
residual wood and biogenic residues and waste is necessary for a comprehensive estimate of
the opportunities and limits of the utilisation of bio-energy.
Error! Style not defined. - VI -
Bibliography
/1/ Thrän, D., M. Weber, A. Scheuermann, N. Fröhlich, J. Zeddies, A. Henze, C. Thoroe, J. Schweinle, U. Fritsche, W. Jenseit, L. Rausch, K. Schmidt (2006): Nachhaltige Biomassenutzungsstrategien im europäischen Kontext. Erstellt im Auftrag des Bundesministeriums für Umwelt, Naturschutz und Reaktorsicherheit, BMU, Berlin. http://www.ie-leipzig.de
/2/ Kaltschmitt, M.; Wiese, A.; Streicher, W. (Hrsg.): Erneuerbare Energien - Systemtechnik, Wirtschaftlichkeit, Umweltaspekte; Springer, Berlin, Heidelberg, 2003, 3. Auflage
/3/ Holm-Müller, K. und Breuer, T., 2006: Potenzialkonzepte für Energiepflanzen. In: Bioenergie: Zukunft für ländliche Räume. Bundesamt für Bauwesen und Raumordnung 2006 (1/2).
/4/ Thrän, D.; Piepenbrink, M.; Kicherer, A.; Kaltschmitt, M. 2007: Kriterienmatrix zur stofflichen und energetischen Nutzung nachwachsender Rohstoffe. Deutsche Bundesstiftung Umwelt, Osnabrück. Veröffentlichung in Vorbereitung.
/5/ EUROSTAT Datenbank NewCronos: Landwirtschaftliche Erzeugnisse – Versorgungsbilanzen - Weinbilanz (Wirtschaftsjahr). Verwendbare Erzeugung 2000, 01.04.2004.
/6/ FAOSTAT: Agricultural data, Crops primary. http://faostat.fao.org/faostat/form?collection=Production.Crops.Primary&Domain=Production&servlet=1&hasbulk=0&version=ext&language=EN, 30.04.2004.
/7/ Zeddies, J. (2006): Rohstoffverfügbarkeit für die Produktion von Biokraftstoffen in Deutschland und in der EU- 25. Forschungsbericht 6/2006, Universität Hohenheim, Institut für Landwirtschaftliche Betriebslehre.
/8/ DLR/IFEU/WI: Ökologisch optimierter Ausbau der Nutzung erneuerbarer Energien in Deutschland. 2004
/9/ Fritsche, U. R. u.a. 2004: Stoffstromanalyse zur nachhaltigen energetischen Nutzung von Biomasse: Verbundprojekt unter Leitung des Öko-Instituts, wissenschaftliche Partner FhI-UMSICHT, IE Leipzig, IFEU Heidelberg, IZES Saarbrücken, TU Braunschweig und TU München, gefördert vom Bundesministerium für Umwelt, Naturschutz und Reaktorsicherheit; Projektergebnisse (Broschüre, Endbericht, Datenbasis, Infoblätter usw.) siehe www.oeko.de/service/bio
/10/ Gömann, U., 2007: Deutschland- Energie-Corn-Belt Europas? In: Agrarwirtschaft, Jahrgang 56 (2007) S. 263 ff
/11/ COM(2006) 848 final Communication from the Commission of 10.1.2007 to the council and the European Parliament. Renewable energy road map. Renewable energies in the 21st century: building a more sustainable future.
/12/ COM(2004) 366 final of 26.5.2004 Communication from the Commission to the Council and the European Parliament. The share of renewable energy in the EU.
/13/ COM(2005) 627 final Communication from the Commission of 7.12.2005 on the support of electricity from renewable energy sources
Error! Style not defined. - VII -
/14/ Rural Affairs, Section G: Energy Crops. A&Q, Department for Environment, Food and Rural Affairs (DEFRA), London. www.defra.gov.uk, Zugriff: 23.5.2007
/15/ England Rural Development Programme, Energy Crops Scheme. Kurzmitteilung, Department for Environment, Food and Rural Affairs (DEFRA), London. www.defra.gov.uk. Zugriff 23.5.2007
/16/ England Rural Development Programme, Energy Crops Scheme – Establishment grants. Department for Environment, Food and Rural Affairs (DEFRA), London. www.defra.gov.uk, Zugriff: 23.5.2007
/17/ Terms and Conditions of the Bioenergy Scheme for Willow and Miscanthus. Department of Agriculture and Food, Dublin. www.agriculture.gov.ie, Zugriff: 23.5.2007
/18/ Bioenergy Action Plan for Ireland. Department of Communications, Marine and Natural Ressources, Dublin. www.dcmnr.gov.ie, Zugriff: 24.5.2007
/19/ Application for Bioenergy Scheme hit first year target of 1.400 hectares. Kurzmitteilung April 2007, Department of Agriculture and Food, Dublin. www.agriculture.gov.ie, Zugriff: 23.5.2007
/20/ Economic Research Service. Webseite: http://www.ers.usda.gov. Link: http://www.ers.usda.gov/Briefing/FarmPolicy/BasicsOfPolicy.htm. Washington, USA. Mai 2005
/21/ Witt, J.: Europäischer Pelletmarkt, Teil 1+2. Brennstoffspiegel, 01/02 2007
/22/ Koizumi, T.; Ohga, K.: biofuel policies in asia: trade effects on world agricultural and biofuels trade. USDA agricultural outlook forum, März 2007
/23/ Töpfer International: Market report October 2005
/24/ Ista Mielke Gmbh: Oil World Database March 2007. Hamburg, 2007
/25/ Haumann, A.: Ölsaaten und Eiweißsaaten Landesanstalt für Entwicklung der Landwirtschaft und der ländlichen Räume:; Agrarmärkte 2005.
/26/ Canola - Canada and Australia Update, Tuesday May 24, 2005 http://www.openi.co.uk/h050524.htm
/27/ Food and Agricultural Policy Research Institute at Iowa State University: FAPRI Agricultural Outlook 2007. Iowa, Illinois, USA, 2007. URL: http://www.fapri.iastate.edu/outlook2007/ (Zugriff: Mai, 2007)
/28/ Thrän, D.; Schreiber, K.; Seidenberger, T.; Thierbach, E.; Weiske, A. 2007: Zielvorgaben und Förderpolitiken zu Bioenergie (insbesondere Energiepflanzen) im internationalen Vergleich. Unveröffentlichter Endbericht, Institut für Energetik und Umwelt, Leipzig.
/29/ Kisliakova, N.; Pavliska, O.; Mtibelashvili, T. 2006: Umwelttechnikmärkte in Russland, der Ukraine und Georgien. http://wko.at/up/enet/OEGUT_Studie_UTMaerkte RusslandUkraineGeorgien.pdf (Zugriff: Juli, 2007)
/30/ Nexant 2006: Liquid Biofuels: Substituting for Petroleum, A global Techno-Economic and Market Evaluation. Nexant Chem Systems, New York.
/31/ F.O. Licht: World Ethanol & Biofuels Report. ISSN 1478-5765, Vol. 5, No. 14. Ratzeburg, Germany, March 2007
Error! Style not defined. - VIII -
/32/ Institute for Energy and Environment gGmbH: Internal data, updated continuously. Leipzig, 2007
/33/ Kaltschmitt, M.; Thrän, D.: Konkurrenzen bei der Bioenergieerzeugung – Hemmnis oder Anreiz für den weiteren Ausbau?. Zeitschrift für Energiewirtschaft, 01/2007
/34/ Institut für Energetik und Umwelt Leipzig gGmbH: Monitoring zur Wirkung des novellierten Erneuerbare-Energien-Gesetzes (EEG) auf die Entwicklung der Stromerzeugung aus Biomasse. i.A. des BMU. Leipzig Februar 2007
/35/ Institut für Energetik und Umwelt Leipzig gGmbH: Working paper on market implementation. Within Renew-project, deliverable 5.3.10, Oktober 2006 (Veröffentlichung nach Projektabschluss 12/2007)
/36/ FAO Statistics Division 2007. Webseite: http://faostat.fao.org Link: http://faostat.fao.org/site/377/DesktopDefault.aspx?PageID=377. Zugriff 13 Juni 2007
/37/ Kaltschmitt, M.; Hartmann, H. (Hrsg.): Energie aus Biomasse – Grundlagen, Techniken und Verfahren, Springer, Heidelberg, 2001.
/38/ Hoogwijk, M. (2004b): On the global and regional potential of renewable energy sources. Chapter Three: Potential of biomass under four land-use scenarios. Part A: The geographical and technical potential. Proefschrift Universiteit Utrecht.
/39/ Hall, D. O., F. Rosillo-Calle, R. H. Williams, and J. Woods (1993): Biomass for Energy: Supply Prospects. In: Renewable energy. Sources for fuels and electricity, Eds: T. B. Johansson, H. Kelly, A. K. N. Reddy and R. H. Williams, Washington, Island Press, p. 593 – 651.
/40/ Williams, R. H. (1995): Variants of a low CO2-emitting energy supply system (LESS) for the world. Prepared for the IPCC Second Assessment Report Working Group Iia, Energy Supply Mitigation Options, Richland, Pacific Northwest Laboratories, p.39.
/41/ Dessus, B., F. Devin, and F. Pharabed (1992): World Potential of Renewable Energies. Actually Accessible in the Nineties and Environmental Impact Analysis. La Huille Blanche No. 1, Paris.
/42/ Yamamoto, H., K. Yamaji, and J. Fujino (1999): Evaluation of bioenergy resources with a global land use and energy model formulated with SD technique. Applied Energy, 63, p. 101 – 113.
/43/ Fischer, G. and L. Schrattenholzer (2001): Global Bioenergy Potentials through 2050. Biomass and Bioenergy: 20, p. 151-159.
/44/ Johansson, T. B., H. Kelly, A. K. N. Reddy, and R. H. Williams (1993): A renewable-intensive global energy scenario (appendix to Chapter 1), In: Renewable Energy: Sources for Fuels and Electricity, Eds: T. B. Johansson, H. Kelly, A. K. N. Reddy and R. H. Williams, Washington, Island Press, p. 1071 – 1143.
/45/ Swisher, J. and D. Wilson (1993): Renewable energy potentials, Energy, 18(5), pp: 437 – 459.
/46/ Smeets, E., A. Faaij, and I. Lewandowski (2004): A quickscan of global bio-energy potentials to 2050. An analysis of the regional availability of biomass resources for export in relation to the underlying factors. Report NWS-E_2004-109, ISBN 90-393-3909-0, Utrecht.
Error! Style not defined. - IX -
/47/ Hoogwijk, M. (2004a): On the global and regional potential of renewable energy sources. Chapter Two: Exploration of the ranges of the global potential of biomass for energy. Proefschrift Universiteit Utrecht.
/48/ OECD / FAO 2007: OECD-FAO Agricultural Outlook 2007-2016, ISBN 978-92-64-02509-7
/49/ Faaij, A.: Large Scale International Bio-energy Trade – Perspectives, Possibilities and Criteria; introduction to a workshop. PowerPoint Presentation. Department of Science, Technology & Society 2005, Utrecht University, The Netherlands.
/50/ IEA: World energy outlook 2006, Paris
/51/ EU 2005: Biomass action plan. Commission of the European Communities, Brussels.
/52/ Thrän, D.; Seiffert, M.; Müller-Langer, F.; Plättner, A.; Vogel, A. 2007: Möglichkeiten einer europäischen Biogaseinspeisungsstrategie. Leipzig. Auftraggeber: Bündnis 90/Die Grünen, Fachverband Biogas, Stadtwerke Aachen.
/53/ Henniges, O. 2007: Die Bioethanolproduktion. JOSEF EUL VERLAG, Lohmar.
/54/ Rosegrant, M.W.and S.Msangi, T.Sulser, R. Valmonte-Santo 2006: Bioenergy and Agriculture: Promises and Challenges- Biofuel and the Global Food Balance. IFPRI 2020, FOCUS 14.
/55/ RENEWABLE FUEL ASSOCIATION (RFA) 2007: Ethanol industry outlook – Building new horizons, Washington, DC.
/56/ Dachverband Agrarforschung, DAF 2007: agrar spectrum: Energie aus Biomasse – weltwirtschaftliche, ressourcenökonomische und produktionstechnische Perspektiven. Band 40, DLG-Verlags GmbH, Frankfurt a. M.
/57/ IE 2007: Renew project, internal report, Leipzig.
/58/ Data of FAO-Statistics. Available under http://faostat.fao.org (11.9.2007).
/59/ OECD 2006: Agricultural market impacts of future growth in the production of biofuels. Working party on agricultural policies and markets, OECD.