
SYMC BUY REC
25
Symantec Corporation Jozsef Nemeth
-
Upload
jozsef-nemeth -
Category
Documents
-
view
124 -
download
0
Transcript of SYMC BUY REC

Symantec Corporation Jozsef Nemeth

[Jozsef Nemeth]
Student Research This report is published for educational purposes
only for the Roland George Investments
Program.
Industry: Software
Sector: Information Technology
Ticker: SYMC (NASDAQ) Recommendation: Buy
Price: $ 24.82 (as of 10/31/2014)
Fair Value: 29.11$
Undervalued by: 17.68%
Earnings/Share Jun. Sep. Dec. Mar. Year P/E Ratio
2011 $0.40 $0.39 $0.42 $0.38 $1.59 24.30
2012 0.43 0.45 0.45 0.44 1.77 11.78
2013 0.44 0.50 0.51 0.47 1.92 23.24
2014A/E* 0.44
0.45 0.48 0.57 1.94 15.01
2015E 0.50 0.48 0.54 0.53 2.04 14.26
Highlights
De-Merger: Symantec announced the de-merger of the company’s security and information management
segments, with completion expected in December 2015. They seek to create two companies that are better
able to pursue individualized growth opportunities that arise in their individual industries. Additionally,
many of the difficulties of splitting up sales teams and shared contracts has already been resolved as the
company began to optimize their company for margins. Management went as far as to say these
transitions are roughly 60% complete, and the December deadline will remain solely on SEC approval.
New Strategic Direction: Symantec’s new management team spent 2013 reviewing every aspect of the
company to improve growth in the fast evolving industry. By the end of the year Symantec announced
their new goal to target 30% operating margins and 5% organic growth by FY2015, something the
company has never done before. With a history of growing through acquisition, the new strategic
direction has shown to be much more effective in growing revenue as the company reported 50% revenue
growth year-over-year in Q1 2015.
Global Intelligence Network 2.0: Symantec collects telemetry about security threats at nearly 200,000
rows a second, in the largest privately run global intelligence network. Symantec has begun to use the
information collected in the global intelligence network to provide advance threat protection in all the
companies’ key products. This will make Symantec’s security products the standard of the industry and
thus increasing the company’s market share.
Dominating Information Management Industry: Symantec has maintained a market leading position
in the information management segment, as they capture over half of the Fortune 500 companies.
Additionally the information management segment has seen the recent release of innovative products that
will help spur growth for the segment in the future.
Stock Valuation: Due to their new strategic direction, dominating market position, and value of a de-
merged company, I estimate that Symantec stock has an expected return of 7.16%. Further, Symantec is
undervalued by 17.68% with a fair value of $29.21. The total return suggests that it is an attractive buy.
Date: 11/3/2014
$17.95-$25.53
5,143,560
0.99
690.31M
17.13 B
92.30%
0.25%
27%
15.11%
Institutional Holdings
Insider Holdings
Debt to Total Capital
Return on Equity
Market Profile
52-Week Price Range
Average Daily Volume
Beta
Shares Outstanding
Market Capitalization
SYMC
S&P 500
Industry

01/8/14 Roland George Investment Program
Stetson University Student Research
2
Exhibit 1: The Company
Exhibit 2: Product Revenue Breakdown
Exhibit 3: Segment Operating Margin
Exhibit 4: Segment Revenue Growth
Business Description
Company: Symantec Corp. (NASDAQ: SYMC) was founded in 1982 and has since become one of the
largest software companies in the world, with over 18,500 employees in more than 50 countries (Exhibit 1).
Headquartered in Mountain View, CA Symantec’s products and services protect people and information in
any environment from mobile devices and enterprise data centers to cloud-based systems. Symantec’s
recently announced a de-merger of their security and information management businesses, which will create
two market leading companies.
Products: Through its stores and resellers, the company offers the following products (% of all revenue):
Consumer Security (31%): Norton solutions, endpoint security and management, encryption and mobile
offerings.
Enterprise Security (31%): Endpoint security, endpoint management, encryption, mobile, secure socket
layers certificate, user authentication, mail, web and data center security, data loss prevention, hosted
security and managed security services.
Information Management (38%): Backup and recovery, archiving and eDiscovery, storage and high
availability solutions.
Over the past three years the revenue breakdown of Symantec has remained relatively stable, where the
largest source of revenue, Information Management, has the lowest operating margin of 23% (Exhibit 2). On
the other hand, Consumer Security, which has the highest operating margin of 45%, has the lowest revenue
share.
Growth Strategies: Symantec has four main growth strategies:
Manage Product Portfolio for Margin: Symantec has begun to optimize their businesses based on
growth potential and lifecycle. The company recognizes some businesses are ideal for achieving the
targeted 30% operating margins, while others will drive future growth (Exhibit 3). Symantec started by
optimizing their Norton brand, Storage Foundation, and Cluster Offerings segments for higher margins.
The first change was the creation of the new consumer segment for the Norton brand, with specialized
staff to improve product know-how. Norton brand product offerings were additionally simplified with the
release of Norton Security and Norton Security with backup, an all in one Norton Security software,
leading to less confusion for customers during product selection. Norton Small Business was released as
the first Norton solution for small businesses, which were the target of 30% of all cyber-attacks in 2013.
Meanwhile, Symantec has begun to streamline their channel strategy by exiting certain high cost and
unprofitable retail markets and OEM deals to improve their Storage Foundation segment. By streamlining
low growth segments for margins, Symantec is able to generate higher levels of free cash flow to invest in
high growth segments.
Focused R&D on High Growth Segments: To spur organic revenue growth Symantec’s has been
moving R&D dollars to backup appliances and selected security business (Exhibit 4). Symantec’s backup
appliances grew 35% year-over-year as they doubled the capacity of backup from 76-terabytes to 148-
terabytes, allowing for the targeting of the upper mid-market of the enterprise segments, essentially
doubling the company’s addressable market. Under backup appliances Symantec recently released
NetBackup 7.6 providing the first enterprise level backup product on the market, in a time when
enterprises are moving to software-defined data center architecture. In the security segment Symantec has
begun to leverage their four trillion threat indicators from millions of endpoints to reduce false positives,
which seriously compromised the value for customers. Symantec launched their managed Advance
Threat Protection (ATP) service that triangulates threat indicators to provide best in class comprehensive
threat detection. Symantec has additionally been launching multiple new services targeting enterprises
such as Incident Response, Managed Adversary, and Threat Intelligence. In addition to focusing on
organic growth, Symantec is considering making multiple acquisitions in technologies that strengthen
their capabilities or add new capabilities that fit growth objectives.
Reduce Cost and Improve Efficiency: Symantec is pursuing eight initiatives to grow revenue and
improve cost-efficiency. Symantec has recognized revenue inefficiencies in new customer acquisition
along with their renewal rates, requiring two initiatives targeting these shortfalls. Symantec has thus
created two dedicated teams to focus on renewals and new customers allowing for better coordination
among the sales groups. The third revenue efficiency initiative put in place is improving license
compliance, reducing complexity for customers so they do not fall out of compliance. The final revenue
efficiency initiative is pricing optimization, which incorporates customer feedback and market dynamics
Headquarters Mountain View, CA
Year Founded 1982
IPO Date 1989
No. of Employees 18,500
No. of Countries 50
No. of Patents 2,700
Consumer Security
Enterprise Security
Information Management
Consumer Security
Enterprise Security
Information Management

01/8/14 Roland George Investment Program
Stetson University Student Research
3
Exhibit 8: Security Industry Revenue
Exhibit 10: Information Management
Industry Revenue
Exhibit 9: Mobile Security Industry Revenue
Exhibit 5: Technology Revenue
Growth vs. GDP Growth
Exhibit 7: SYMC Revenue Growth vs.
GDP Growth
Exhibit 6: Revenue Growth Comparison
into more transparent pricing policies and more efficient selling processes. These four revenue initiatives
should help drive top line growth and support margin expansion.
The first cost-efficiency initiative is to optimize the Norton business, by streamline their product offerings
and supporting Symantec’s first growth strategy. Additionally, the sales and support teams have been
divided into security and information management, allowing for better product specialization and support
times, improving customer feedback. Symantec has also been reducing their global footprint, reducing
redundant positions and consolidating data centers. The final cost-efficiency Symantec plans to pursue
performance based incentives for sales and R&D teams.
Attract Top Talent: Symantec has seen a relatively high level of upper management turnover in the last
year, with a new CEO, CIO, CFO, and two new board members. Symantec announced the appointment of
CEO Michael Brown in September after an extensive search of over 100 candidates. Brown had been
serving as interim president and CEO since March 2013. Since Browns appointment as interim CEO
Symantec has returned to positive year-over-year revenue growth and consistently been exceeding
margins. In January Sheila Jordan was announced as Symantec’s CIO, with the focus of building and
supporting the global Information Technology effort at Symantec. Jordan joins Symantec after nine years
at Cisco where she managed IT services for Cisco’s global workforce. Symantec CFO Thomas Seifert
joined the company in April and has a long career as CFO for other technology companies such as
Brightstar and Advance Micro Devices. The newly appointed upper management and board provide the
Symantec with new direction and focus helping lead the company to grow revenue and improve operating
margins.
Competitors: Due to Symantec's two distinct operating segments of information management and security
the company does not have any direct competitors. However, Symantec may be compared to Gemalto (GTO),
a Netherlands based mid cap growth company that provides solutions & services related to mobile
communication, machine-to-machine, and secure transactions and security. Gemalto has a global reach in 44
different countries, supported by their 12,000 employees. Additional competitors to Symantec include
Microsoft along with newly listed companies such as Palo Alto Networks and FireEye.
Industry and Peer Group Overview
Symantec operates in the Technology industry, providing primarily software to their customers. The
technology industry revenue growth has a 93% correlation with GDP growth (Appendix 6, Exhibit 5).
Additionally, the software segment has an 83% correlation to the Technology industry revenue growth
(Appendix 7, Exhibit 6). This shows that as the economy continues to improve into 2015, so will the revenue
growth of the industry. I then ran a regression of Symantec’s revenue growth since 1988 compared to GDP
growth and found no significant correlation (Appendix 8, Exhibit 7). I attribute this to the revenue growth the
company being much more volatile than the industry, in addition to the extremely high growth the company
saw in its early years.
The Security market, of the technology industry, is an extremely fragmented industry that is evolving rapidly
with the recent influx of security company IPO's. The security market total revenue in 2013 was $23 billion
and is expected to expending to $38 billion in 2018, with a projected compounded annual growth rate or
CAGR of 10% (Exhibit 8). The combination of high growth and fragmented markets provides a ripe
opportunity for continued innovation. The three main trends Gartner sees forming in the security industry
moving forward are; mobile security, big data, and advance targeted attacks. Over the last year there has been
a 91% increase in targeted attacks with attacks lasting three times as long. Meanwhile, 38% of mobile users
have become victims of cyber crime, which will likely increase as Bring Your Own Device (BYOD) mega
trend continues in the workplace. In the last year hackers have been able to expose 552 million identities, in
coordinated mega breaches, proving cybercrime remains a real and damaging threat to consumers and
businesses alike. Thus with the rise of mega breaches there has been a shift toward managed security
services. This segment of the security market is projected to be a $10 billion market by 2018, growing at a
30% CAGR for 2013 to 2018 (Exhibit 9).
The Information Management market is a mature market that still has tremendous opportunity. The
Information Management market total revenue was $11 billion in 2013 expanding to $16 billion by 2018,
with a CAGR of 7% (Exhibit 10). Major trends of the market include mobile, virtualization, hybrid clouds
and now the Internet of Things, helping to drive exponential growth for the industry. However, as
organizations are adding more storage, virtualizing workloads, and adopting cloud solutions it is becoming
more challenging to find the right information making the need for technology to manage information even
more vital.
in billions
in billions
in billions
Technology
GDP Growth
Technology
Software
SYMC
GDP Growth

01/8/14 Roland George Investment Program
Stetson University Student Research
4
Exhibit 12: Time Line of Data Breach, 2013
Exhibit 11: Impact of Data Breach
Exhibit 13: De-Merger Benefit
Antivirus is Dead
A recent article came out saying with the increased sophistication of cybercriminals it has become apparent
that antivirus software is dead. However, antivirus is not dead, according to Symantec Antivirus software
captures 45% of all threats and is a key part to multi-layered Endpoint security. Companies that are able to
provide effective multi-layered security products will capture growth opportunity leading to increased market
share in the consumer segment.
Cybercriminals Innovation
The security segment is constantly facing evolving threats for hackers. In 2012 the majority of security
threats targeted small business and manufacturers in cyber espionage in an attempt to capture intellectual
property. Small business were targeted due to their weak security and ultimately as a way to reach larger
companies via “watering hole” techniques. Manufactures were targeted as the supply chain for large
companies tend to hold valuable intellectual property. In 2013 cybercriminals unleashed the most damaging
series of cyber-attacks in history, with 8 mega breaches in the span of 2 months (Exhibit 11). This significant
shift in cybercriminal behavior revealed that criminals are plotting for months before pulling off huge heists –
instead of executing quick hits with smaller rewards (Exhibit 12). One mega breach can be worth 50 smaller
attacks and with the great success of these attacks and potential for huge paydays means that large-scale
attacks are here to stay. The best way to help prevent the mega breaches comes from training employees
about security, track company data and implement a strong security infrastructure. Symantec already is
offering or will be offering services and products to meet all the needs of companies to protect against the
new era of mega attacks.
Competitive Positioning
De-Merger of Security and Information Management Segments
In 2005, Symantec acquired Veritas Software, an Information Management company, for $13.52 billion. On
October 09, 2014 Symantec’s CEO announced the company would be separating into a Security company
and Information Management Company, with a tax-free distribution to Symantec shareholders of 100% of
the Information Management businesses new publicly traded stock, with expected completion in December
2015. The separation comes after the newly appointed management reviewed both businesses for achieving
their four strategies for growth. As the growth for both markets has drastically accelerated both companies
require distinct strategies and dedicated investments along different core competencies. By creating two
industry leading companies Symantec positions itself well in the industry to capture growth. On an Enterprise
Revenue value splitting the company and achieving industry average EV/Sales will result in an increase of
$6,218 (Exhibit 13). The de-merger of Symantec will add value to shareholders and capture future growth in
the following three ways:
Improve Strategic Focus: A separation will allow each company to more effectively focus on its unique
growth opportunities and allow for tailored R&D investments, improving go to market capabilities. These
improvements should help each company grow their market share and capture more future growth. The
Symantec security company will focus on the growth opportunities in three areas: unified security,
cybersecurity services and a best in class portfolio. Unified security will deliver a security platform that uses
big data for superior threat detection. A focus on cybersecurity services includes the launch of capabilities to
span managed security, incident response, threat adversary intelligence, and simulation based training.
Symantec also plans to optimize their portfolio offerings by integrating diverse capabilities into their security
products.
The Information Management business will focus on resilient foundational products, reduced total cost of
ownership (TCO), and Information Fabric. A focus on resilient products will allow the business to deliver
Information Management capabilities in an ever changing environment to customers through software, cloud,
or integrated appliances. The Information Management business will focus on delivering solutions that
reduce the TCO by helping customers reduce the unmanaged proliferation of redundant and unused data. The
last focus of the Information Management business will be on creating an information fabric that enables
visibility, management, and control of organizations entire information landscape as a map.
Reduce Operational Complexity: With Symantec’s current merged business there is an immense amount
of complexity caused by the breadth of their product offerings. Sales, R&D, and management teams all faced
difficulties in communication, creating issues with getting product offerings to customers, lower customer
feedback scores, slower R&D go to market times, and increase difficulty delivering strategic plans. By de-
merging the company Symantec will be able to streamline these processes and simplify each organization
operations, in turn improving communication. This will make it easier for customers to do business with the
individual companies, with separate product offerings and improved specialization by sales and support
teams.
Incidents
Identities Exposed
Number of
Breaches
Total
Identities
Exposed
in million in thousand
in
million
Current De-Merged
Security $4,618.24 $5,195.52
Information
Managemetn $8,006.24 $13,647.00
Enterprise Value $12,624.48 $18,842.52
01/8/14 Roland George Investment Program
Stetson University Student Research
5
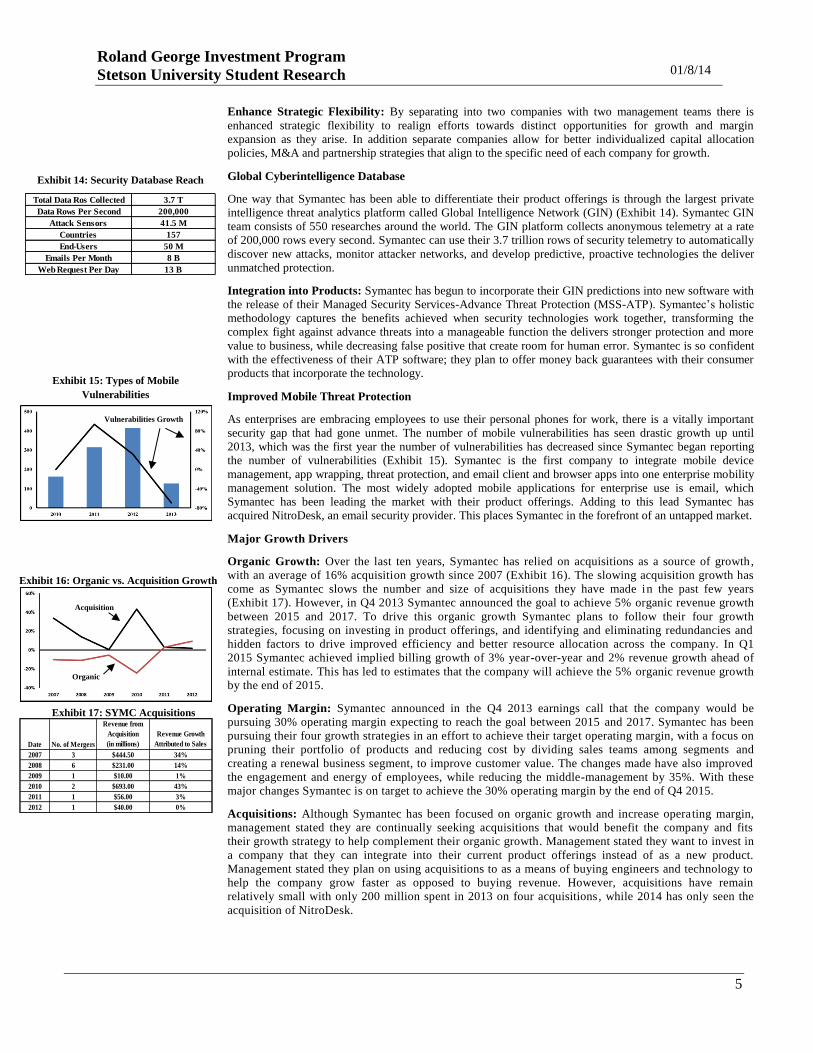
Exhibit 14: Security Database Reach
Exhibit 15: Types of Mobile
Vulnerabilities
Exhibit 16: Organic vs. Acquisition Growth
Exhibit 17: SYMC Acquisitions
Enhance Strategic Flexibility: By separating into two companies with two management teams there is
enhanced strategic flexibility to realign efforts towards distinct opportunities for growth and margin
expansion as they arise. In addition separate companies allow for better individualized capital allocation
policies, M&A and partnership strategies that align to the specific need of each company for growth.
Global Cyberintelligence Database
One way that Symantec has been able to differentiate their product offerings is through the largest private
intelligence threat analytics platform called Global Intelligence Network (GIN) (Exhibit 14). Symantec GIN
team consists of 550 researches around the world. The GIN platform collects anonymous telemetry at a rate
of 200,000 rows every second. Symantec can use their 3.7 trillion rows of security telemetry to automatically
discover new attacks, monitor attacker networks, and develop predictive, proactive technologies the deliver
unmatched protection.
Integration into Products: Symantec has begun to incorporate their GIN predictions into new software with
the release of their Managed Security Services-Advance Threat Protection (MSS-ATP). Symantec’s holistic
methodology captures the benefits achieved when security technologies work together, transforming the
complex fight against advance threats into a manageable function the delivers stronger protection and more
value to business, while decreasing false positive that create room for human error. Symantec is so confident
with the effectiveness of their ATP software; they plan to offer money back guarantees with their consumer
products that incorporate the technology.
Improved Mobile Threat Protection
As enterprises are embracing employees to use their personal phones for work, there is a vitally important
security gap that had gone unmet. The number of mobile vulnerabilities has seen drastic growth up until
2013, which was the first year the number of vulnerabilities has decreased since Symantec began reporting
the number of vulnerabilities (Exhibit 15). Symantec is the first company to integrate mobile device
management, app wrapping, threat protection, and email client and browser apps into one enterprise mobility
management solution. The most widely adopted mobile applications for enterprise use is email, which
Symantec has been leading the market with their product offerings. Adding to this lead Symantec has
acquired NitroDesk, an email security provider. This places Symantec in the forefront of an untapped market.
Major Growth Drivers
Organic Growth: Over the last ten years, Symantec has relied on acquisitions as a source of growth,
with an average of 16% acquisition growth since 2007 (Exhibit 16). The slowing acquisition growth has
come as Symantec slows the number and size of acquisitions they have made in the past few years
(Exhibit 17). However, in Q4 2013 Symantec announced the goal to achieve 5% organic revenue growth
between 2015 and 2017. To drive this organic growth Symantec plans to follow their four growth
strategies, focusing on investing in product offerings, and identifying and eliminating redundancies and
hidden factors to drive improved efficiency and better resource allocation across the company. In Q1
2015 Symantec achieved implied billing growth of 3% year-over-year and 2% revenue growth ahead of
internal estimate. This has led to estimates that the company will achieve the 5% organic revenue growth
by the end of 2015.
Operating Margin: Symantec announced in the Q4 2013 earnings call that the company would be
pursuing 30% operating margin expecting to reach the goal between 2015 and 2017. Symantec has been
pursuing their four growth strategies in an effort to achieve their target operating margin, with a focus on
pruning their portfolio of products and reducing cost by dividing sales teams among segments and
creating a renewal business segment, to improve customer value. The changes made have also improved
the engagement and energy of employees, while reducing the middle-management by 35%. With these
major changes Symantec is on target to achieve the 30% operating margin by the end of Q4 2015.
Acquisitions: Although Symantec has been focused on organic growth and increase operating margin,
management stated they are continually seeking acquisitions that would benefit the company and fits
their growth strategy to help complement their organic growth. Management stated they want to invest in
a company that they can integrate into their current product offerings instead of as a new product.
Management stated they plan on using acquisitions to as a means of buying engineers and technology to
help the company grow faster as opposed to buying revenue. However, acquisitions have remain
relatively small with only 200 million spent in 2013 on four acquisitions, while 2014 has only seen the
acquisition of NitroDesk.
Total Data Ros Collected 3.7 T
Data Rows Per Second 200,000
Attack Sensors 41.5 M
Countries 157
End-Users 50 M
Emails Per Month 8 B
Web Request Per Day 13 B
Vulnerabilities Growth
Organic
Acquisition
Date No. of Mergers
Revenue from
Acquisition
(in millions)
Revenue Growth
Attributed to Sales
2007 3 $444.50 34%
2008 6 $231.00 14%
2009 1 $10.00 1%
2010 2 $693.00 43%
2011 1 $56.00 3%
2012 1 $40.00 0%

01/8/14 Roland George Investment Program
Stetson University Student Research
6
Exhibit 18: Antivirus Market Share
Exhibit 19: Geographic Revenue Source
Exhibit 20: Dividend Yield
Potential Improvements in Market Share
Antivirus: The antivirus market has become more fragmented in the past few years. In 2013 the top ten
antivirus software made up 74% of the market share, while in 2014 the top ten companies only accounted for
62% of the entire market share (Exhibit 18). The top two companies Microsoft (23%) and Avast (15.9%)
offer free antivirus software, which leads to their high market share. Symantec is in 5th place for market share
with 8% trailing behind AVG and ESET by 1% and 0.1% respectively. However, Symantec has recently
streamlined their nine core Norton product offerings into on flagship product called Norton Security, which
will boost sales and market share for the company in the antivirus market.
Leading Information Management Market: Symantec’s Information management business has a become a
market leader with #1 market share in backup with 30% market share, reaching 75% of Fortune 500
companies through their availability solutions. The business also has leading market share in enterprise
backup and storage management products, with their NetBackup appliance products achieving 36% market
share, which grew 27% year over year. With the positive market position and growth it is expected Symantec
Geographical Growth: In 2013 Symantec achieved rigorous foreign government certifications, allowing the
company to offer additional security products in two key regions; Russia and China. Symantec Endpoint
Protection Small Business Edition was added to the list of three previously approved products in Russia.
Currently the EMEA (E.U, Middle East, and Africa) makes up 29% of Symantec revenue however, it has
been growing as a percentage of sales since 2011 (Exhibit 19). In addition, thirteen products achieved
certification for China’s Ministry of Public Safety and the Ministry of Public Security of the People’s
Republic of China. 2013 marked the first year Symantec recognized the Asian Pacific and Japan as an
individual segment, and by Q1 2015 17%of Symantec’s revenues came from this segment. The global
segments have substantial growth potential and Symantec has assurance from government certifications to
provide confidence in companies and people as Symantec expands.
Leading Data Center
Symantec released their Storage Foundation software, which enables enterprises to leverage Solid State
Drives (SSDs) in their data centers. This will allow customers to access applications and data 400% faster
than traditional storages used, making it the only offering to provide this benefit. The software will also be
the only software that does not require enterprises to switch to a full SSD data center as the software detects
key data to store on the SSD, drastically reducing the cost of incorporating the software into current
infrastructure. This will help the Information Management segment of Symantec to continue to grow and
capture more market share into the future.
Returning Cash to Shareholders
Symantec’s management has remained committed to returning cash to shareholders. Symantec began paying
dividends in June 2013, with a $0.15 dividend per share. In June quarter Symantec paid a $0.15 dividend per
share, with a yield of 2.5%. The company dividend yield has been relatively in-line with the industry, only
outperforming in the last two quarters (Exhibit 20). Cash dividends totaled $104 million and were financed
directly through cash flow. Additionally, Symantec will continue to buy back shares as part of a $1 billion
dollar share repurchase program, of which $533 million remains. The company has been buying shares back
at an average quarterly amount of $125 million, or 6 million shares.
Investment Summary
De-Merging of Core Segments: In an effort to improve shareholder value Symantec is de-merging their
security and information management business. By separating into two companies it will allow for
improved strategic focus, reduced operational complexity, and enhanced flexibility. Operating as separate
companies will allow Symantec to better meet customers’ needs. As a result, the company will see positive
growth through renewed contracts and new customer acquisition. The separation will also allow Symantec
to reduce redundant positions and make doing business with the company more simplistic.
Exceeding Strategic Turnaround Timeline: In 2013 Symantec announced their strategic turnaround plan
to return the company to positive revenue growth and improved operating margins of 30%, with an estimated
completion in FY2015 - 2017. Since then the company has exceeded estimates and reported positive revenue
growth and improved operating margins in Q1 2015, ahead of internal estimates. This trend should continue
into the rest of the year as Symantec tend to have the best two quarters in Q3 and Q4. Thus Symantec is set to
reach 5% revenue growth and 30% operating margins by the end of FY2015.
Industry Growth: Symantec operates in two fast growing segments in the technology industry. The
technology industry as a whole has expected to grow at 6.2% annually for the next two years. The Security
segment is expected to achieve 10% annual growth, while the Information Management segment is expected
SYMC
Industry

01/8/14 Roland George Investment Program
Stetson University Student Research
7
Exhibit 21: Revenue Growth
Exhibit 22: EPS Growth
Exhibit 24: Earnings Growth
Exhibit 23: Earnings Surprise
to grow at 7% annually over the same period. Symantec is poised to capture this growth as they leverage their
market leading product line and improve their strategic focus under their new strategies for growth.
Capitalize on Intelligence Network: In an effort to improve growth in the security segment, Symantec has
begun to leverage their Global Intelligence Network to improve all their product offerings. In 2014 Symantec
incorporated their GIN predictions into Norton Small Business, Norton Security, and MSS-ATP, with
improved threat detection and a money back guarantee if you receive a virus. Symantec’s improved products
have helped drive their 7% revenue growth in enterprise security segment. The consumer segment is
estimated to receive roughly a 5% revenue growth driven by increase subscriptions for Norton Security.
Leverage Mature Market Cash Flow: In an effort to improve profit margin and promote growth,
Symantec management is focusing on leveraging their low growth and high cash flow products lines. This
is accomplished by shifting R&D away from mature markets and into high growth segments such as
enterprise security and services. This will allow Symantec to use the high cash flow of their mature
products to invest in future growth for 2015 and beyond, helping achieve the targeted 5% organic growth.
Meanwhile, spending less R&D in mature markets will grow operating margin for these products, helping
to achieve the targeted 30% operating margin for the company.
Attractive Valuation Indicates a BUY: The various valuations we performed reveal a consensus that
Symantec’s stock is undervalued. Our fair value estimate is around $29.21, which suggests an undervaluation
of the current stock price by 17.68%. Furthermore, Symantec is in the process of de-merging their Security
and Information Management businesses, providing substantial growth opportunity. The easiest way for
individuals to invest in future growth is to buy Symantec stock.
Financial Analysis
Revenue and Earnings
Revenue: Symantec reported record revenue of $1.74 billion in Q1 2015, up 2% year-over-year, and the first
quarter or positive revenue growth since the reorganization of the company’s sales force in 2013. Revenue
growth was driven by a 3% implied billing growth year-over-year. Enterprise subscription grew 7% year-
over-year accounting for 16% of total revenue. Symantec’s consumer product revenue increased by 1.79%
driven primarily by growth of Information Security segment that saw revenue increases 2% year-over-year,
with revenue of $345 million. Information Management revenue was flat year-over-year at $650 million.
Since 2011 Symantec has been growing revenue at an annual rate of 2.55% (Exhibit 21). In fiscal 2014
Symantec delivered revenue of $6.7 billion at the high end of guidance, a year-over-year decline of 3%, as
the company completed and implemented their go-to market changes. In 2014, productivity & protection
segment declined 3 % to $2.87 billion, driven by weakness in endpoint management offset by strength in
mobile and enterprise solutions. The Information Security segment increase 1% to $1.13 billion as there was
continued growth in authentication and data loss prevention. The Information Management segment declined
4% to 2.5 billion due to weakness in Backup Exec ahead of a new release.
In 2015 Symantec was forecasted to achieve 7.19% revenue growth, as their growth strategies begin to affect
earnings. Growth is expected to be driven primarily through their organic growth, with Consumer security
expected to increase 9.4% as Symantec streamlines their product offerings and begins to target the untapped
small business market. Enterprise security is expected to closely follow as a driver of revenue growth with an
expected year-over-year growth of 8.33%, attributed to new service and product offerings. Information
Management is forecasted to achieve 4.42% revenue growth for the year of 2015, primarily attributed to
growth of NetBackup and improved renewal activity.
Earnings: The Software industry has experienced relatively high earnings growth over the past 3 years with
average annual earnings per share growth of 6.35%. However, in the past three years Symantec has been
outpacing the industry with an average annual EPS growth of 8.2% (Exhibit 22).When looking at the last four
quarters Symantec has shown strength in growing EPS with an average quarterly growth of 8.3% showing
improving revenue growth. Additionally, Symantec has developed a reputation for regularly beating earnings
with an average EPS surprise of 3.22% in the last 5 quarters (Exhibit 23). The improving EPS growth is
attributed to record Q1 revenue of $330 million, driven by the company’s strategies of increase operating
margins and improving organic growth.
Earnings for Symantec have also see improving growth, as the company has experienced an average annual
earnings growth of 16.44% since 2010, compared to the industry average of 11.58% (Exhibit 24). For 2014
Symantec reported net profit of $898, an 18.9% increase year-over-year. The trend of high earnings growth
has continued into 2015, with Q1 net profit of $236 million, or a 50.32% increase year-over-year. Looking
forward, I am optimistic in terms of earnings growth as Symantec’s efforts to focus on operating margins and
organic growth have begun gain momentum and begin to positively affect earnings growth. Looking forward,
SYMC
SYMC
SYMC
Industry
SYMC
Industry
Industry
Industry

01/8/14 Roland George Investment Program
Stetson University Student Research
8
Exhibit 25: Operating Margin
Exhibit 26: Profit Margin
Exhibit 27: Gross Margin
Exhibit 28: Return on Equity
Exhibit 29: Return on Assets
2016
Q1 Q2 Q3 Q4 FY 2014 Q1 Q2 Q3 Q4 FY 2015 Q1
Net Sales (Projected)
Consumer Security $524 $518 $517 $504 $2,063 $533 $548 $572 $604 $2,257 $563
Enterprise Security $544 $517 $528 $511 $2,100 $552 $568 $580 $592 $2,292 $596
Information Management $641 $602 $660 $610 $2,513 $650 $654 $658 $662 $2,624 $658
Total Revenue $1,709 $1,637 $1,705 $1,625 $6,676 $1,735 $1,770 $1,810 $1,858 $7,173 $1,817
Cost of Goods Sold $300 $284 $283 $282 $1,149 $309 $289 $281 $260 $1,139 $254
Gross Profit $1,409 $1,353 $1,422 $1,343 $5,527 $1,426 $1,481 $1,529 $1,598 $6,034 $1,563
Operating Expenses $979 $903 $913 $919 $3,714 $999 $1,027 $1,021 $1,026 $4,073 $1,086
Operating Income
Consumer Security $224 $225 $224 $255 $928 $268 $281 $307 $336 $1,192 $293
Enterprise Security $58 $80 $107 $69 $314 $70 $80 $104 $135 $389 $91
Information Management $148 $145 $178 $100 $571 $89 $93 $97 $101 $380 $93
Total Operating Income $430 $450 $509 $424 $1,813 $427 $454 $508 $572 $1,961 $477
Reconciling Items
Stock based compensation $39 $38 $34 $43 $154 $43 $35 $36 $37 $151 $36
Amortization of intangible assets $86 $42 $41 $41 $210 $42 $43 $44 $46 $175 $45
Restructuring and transition $81 $122 $29 $32 $264 $20 $17 $18 $14 $69 $12
Other Expenses $4 -$3 $18 $10 $29 $17 $9 $9 $10 $45 $9
Taxes/Expense $63 $10 $104 $81 $258 $69 $43 $73 $83 $268 $69
Net Profit $157 $241 $283 $217 $898 $236 $307 $328 $382 $1,253 $306
EPS $0.44 $0.50 $0.51 $0.47 $1.92 $0.44 $0.45 $0.48 $0.57 $1.94 $0.46
2014 2015
I am optimistic in terms of earnings growth with FY2015 forecasted to grow earnings 39.71% with annual
earnings of $1.245 billion.
Pro Forma
Based on the assumptions that (1) the company revenue will achieve 5% organic growth by the end of
FY2015, (2) the operating margin will be improve to 30%, (3) acquisitions will account for 1-2% growth, I
estimate the Q2 2015 EPS to be $0.45, beating earnings estimates of $0.44 (Appendix 1D). For the fiscal
year 2015, EPS is expected to be $1.94, a 40% increase from 2014. Keeping with this upward trend, earnings
are expected to grow by an average of 15.54 % per quarter in 2015 and 29.66% year-over-year in Q1 2016.
Following previous sections, for 2014, we attribute 7.44% of EPS growth to revenue growth and 8.1% to
margin expansion.
Profitability
Operating Margin: The operating margin for Symantec has steadily been increasing over the past four years
at an annual rate of 9.57%, while the industry has seen operating margins decrease an average -4.1% annually
(Exhibit 25). In the past four years Symantec's operating margin increased from 15.6% to 24.6%, as the
company targets 30% operating margin by the end of FY2015. The increasing operating margin has been
attributed to increased improved efficiency, lower sales and marketing costs, and improved R&D allocation.
As Symantec continues to pursue their growth strategies the company will remain ahead of the industry
operating margin of 16.6% in 2013. Profit Margin: In 2013 the profit margin for Symantec was 10.9%, which is slightly lower than the industry
average of 13.13%. This is due in part to Symantec information management segment that produces a few
physical products that provide much lower operating margins. However, as the company focuses on
improved operating margin it will improve profit margin in the years to come. Additionally Symantec has
shown more stable profit margin compared to the industry, which has become negative in 2014 (Exhibit 26).
Gross Margin: Since 2010, gross margin in the technology industry have been relatively flat growing an
average -0.34% year-over-year. Although gross margins have been on decline for the industry Symantec has
been growing their gross margins and 0.62% annually. As of 2014 Symantec had a gross margin of 83%,
much higher than the industry average of 77.2% (Exhibit 27). As Symantec streamlines their product
offerings and focuses R&D on key growth opportunities their gross margins should be positively impacted.
Return on Equity: The current return on equity for Symantec is 15.11%, which is above the industry
average of -8.54% (Exhibit 28). Since 2011, Symantec's return on equity has been growing at an average rate
of 8.5%, outpacing the industry average growth of -3.88%. The growth of Symantec's ROE is expected to
continue to improve as the company recognizes the benefits of the strategic changes that have made in the
past year, and continue to leverage R&D into their high growth segments.
Return on Assets: In 2013 Symantec had a return on assets of 7.3%, which is slightly lower than the
industry average of 7.68. In 2014 Symantec is estimated to outperform the industry with an ROA of 8.2%,
compared to the industry average of -3.46% (Exhibit 29). However, over the past 4 years Symantec has been
able to grow their ROA at an average rate 13.08%, compared to the industries negative growth of 0.99%.
This shows that Symantec has again been able to leverage their product line and brand name to improve their
return when compared with the industry.
SYMC
SYMC
SYMC
SYMC
SYMC
Industry
Industry
Industry
Industry
Industry

01/8/14 Roland George Investment Program
Stetson University Student Research
9
Exhibit 30: Free Cash Flow Growth
Cash Flow
Total Net Cash Flow: Since the economic recession Symantec has experienced operating cash flow decrease
at an annual rate of -3.07%, due primarily to a decrease of the amount of depreciation accounted for each
year. When not accounting for the change in depreciation levels Symantec was able to grow operating cash
flow at an average 5.45% annually. Cash flow from financing activities for 2013 was $-1.7 billion, which was
negatively impacted by the enactment of the company’s first dividend payout, along with an enormous $1.18
billion long-term debt repayment. Cash flow from investment activities was negative $583 million for 2013,
as Symantec has been spending an average $278 million on purchases of property and equipment. Although
the company has been experiencing a period of negative cash flow growth, in FY2015 the company is
estimated to have positive year-over-year growth. This will be driven by the improved revenue and lower
costs associated with restructuring the company for the new growth strategies.
Free Cash Flow: Symantec had free cash flow of $201 million in Q1 2015, down 18.77% year-over-year
slightly above the industry decrease of -34.81% (Exhibit 30). The drastic decrease in year-over-year free cash
flow was driven primarily from a one-time tax deposit of $104 million, related to the previous year IRS audit.
However, the company offset some of the one-time expense with improved collections driven by the new
sales team structure. This positions the company to experience substantial free cash flow growth in the
following year, as they have fewer expenses and higher net income.
Debt
Debt to Equity: Currently, Symantec has $2.1 billion in long-term debt outstanding. Compared with the Peer
Group, Symantec carries a significantly higher amount of long-term debt, with and peer average of only $371
million. In 2013, Symantec’s debt to equity ratio was 0.56, while the Peer Group was 0.43. This shows that
although Symantec has a much larger amount of debt the company also is competing against much smaller
companies. Additionally, the majority of the debt issued was to fund the Veritas merger, which the company
is now de-merging from. As the de-merger completes in December it will be likely that Symantec will be
able to lower their debt level, while maintaining their investment grade rating.
Debt to EBITDA: More importantly, it is informative to look at Symantec’s debt-to-EBITDA ratio because
it shows the amount of time it will take the company to pay off its debt. Symantec’s current debt to EBITDA
is 1.08, compared to the industry average of 2.15. The debt to EBITDA suggests that the company is less
capable of paying its debts compared to their peers.
Solvency: Symantec’s first term loan facility of $600 million will come due in 2017. Symantec historically
has relied on free cash flow to satisfy liquidity needs. In Q4 2014 Symantec had cash equivalents and short-
term investments of $4 billion. Additionally Symantec has an unused revolving credit facility of $1 billion,
amended to extend into 2017. This provides Symantec with a liquidity position of roughly $5 billion, which
is plenty of cash to meet any loan facilities.
Valuations
In this section, I estimate the fair values of Symantec’s stock. It should be noted that all input data were
derived from historical company data and pro forma estimates.
Growth Duration Model: The Growth Duration valuation, a relative P/E model, is often used to compare a
company with significant growth potential to its stable industry. It is a relevant model for Symantec because
they have experienced a higher volatility in growth compared with the average firm in the Industry Peer
Group. Using earnings growth rates between 5% and 11% in the simulation, the median fair value for
Symantec is estimated to be $31.11, undervalued by 25.34% (Appendix 3).
Franchise Value Model: The Franchise valuation is often used when dealing with companies that are able to
produce significant franchise value, i.e. repeating its business model at a higher return on equity. This model
distinguishes between a company’s current return on equity and the return on equity that can be derived from
future opportunities. The underlying assumption for Symantec’s is that it will be able to improve its return
on equity by leveraging their current technological know-how, reputation, and existing intangibles. Using its
current return on equity of 15.11% and our expected future return on equity of 17.24%, I determined the
median fair value for Symantec to be $29.52, undervalued by 18.92% (Appendix 4).
Residual Income Model: The residual income model uses a combination of a company’s current book value
per share and expected future residual income. This is a relevant model for Symantec because they have
negative historical cash flow growth in the past and will likely not pay dividends in their information
management business. The median fair value for Symantec is $27, which shows that Symantec is
undervalued by 8.79% (Appendix 5).
SYMC
Industry

01/8/14 Roland George Investment Program
Stetson University Student Research
10
Average Fair Value: The summary estimates a fair value of $29.21, undervalued by 17.68%, which is
derived from the combined simulation results. This information recommends a strong position to BUY
Symantec.
Investment Risk
Inherent Risk in De-Merger: With Symantec's announcement of a planned demerger there is inherent risk
involved. First by demerging Security and Information Management Symantec faces potential changes in
taxation, which could make the demerger for the company uneconomical. Demergers also raise risk of
operational difficulties related to staffing and more importantly the potential loss of synergies. The last major
risk associated with a de-merger is the cost associated with the process. Costs of de-mergers can be separated
into one-time cost and ongoing cost. Ongoing costs associated with de-merger are essentially the additional
costs associated with the loss in synergies.
Potential Loss of Sales and Distribution Channels: Symantec sells products to customers around the world
through multi-tiered sales and distribution networks. Sales through each different channel involve distinct
risks. Direct Sales is a significant portion of enterprise product revenue, however, tends to consist of longer
sales cycles and difficulties in hiring and training new employees. Indirect Sales Channels is a significant
portion of revenue especially in end-user products. This distribution method provides Symantec with little
control over product delivery, minimum sale requirements, and preventing distribution of competing
products. Additionally, with the consolidation of the electronics retailer market, Symantec has seen a
decrease in their negotiating power. Finally, the OEM Sales channels raises the risk that revenues from this
segment could decrease if demand for OEM products decrease as well. Additionally, OEM agreements may
require Symantec to engage in additional product development, which could become costly for the company.
Dependency on Non-Contractual Revenue: A large portion of Symantec’s revenue is derived from
arrangements for maintenance, subscriptions, managed security services, and SaaS offerings, yet existing
customers have no contractual obligation to purchase additional solutions after the initial subscription or
contract time. Additionally, given the short operating history under these revenue sources it is difficult to
accurately predict customer’s renewal rates. Symantec’s customers’ renewal rates may decline or fluctuate as
a result of a number of factors, including the level of their satisfaction with the company’s customer support,
customer budgets and the pricing of the company’s solutions compared with the solutions offered by
competitors, any of which may cause the company’s revenue to grow more slowly than expected.
Accordingly, the company must invest significant time and resources in providing ongoing value to their
customers, or risk losing renewals.
Additional Acquisition Equals Additional Risk: Since in the past acquisitions has been a major source of
growth for Symantec a number of risks could arise from future acquisitions of other businesses, business
units and technologies. Specific risks associated with acquisitions include; complexity in integrating the
acquired businesses, diversion of management attention, assumption of liabilities, and potential dilution of
stock ownership. In the worst situation the acquired business would be unsuccessfully integrated leading to
additional unseen costs.
Exposure to International Risk: Symantec derives a substantial portion of revenues from customers located
outside of the U.S. and has multiple operations outside of the U.S. As the company continues to target
expansion into international regions they increase the risk associated with international operations. The risks
associated with international operations for Symantec include loss of intellectual property due to less
protective laws in foreign countries. International operations also increase the cost for the company as they
must provide support and products in multiple languages. However, the largest risk associated with
international operations is currency exchange fluctuations, which could decrease profits or increase costs of
doing business.

11
Table of Contents
Appendix 1A: Income Statement 12
Appendix 1B: Balance Sheet 13
Appendix 1C: Statement of Cash Flow 14
Appendix 1D: Income Statement Pro Forma 15
Appendix 2: Capital Asset Pricing Model 16
Appendix 3: Residual Income Model 17
Appendix 4: Growth Duration Model 18
Appendix 5: Franchise Value Model 19
Appendix 6: Technology Revenue Growth vs GDP Growth 20
Appendix 7: Software Revenue vs GDP Growth 21
Appendix 8: SYMC Revenue Growth vs. GDP Growth 22

12
Appendix 1A: Historic Income Statements Source: Yahoo Finance
4-Jul-14 28-Mar-14 27-Dec-13 27-Sep-13
1,735,000 1,625,000 1,705,000 1,637,000
309,000 282,000 283,000 284,000
1,426,000 1,343,000 1,422,000 1,353,000
Research Development 308,000 277,000 252,000 247,000
Selling General and Administrative 747,000 699,000 705,000 705,000
Non Recurring 20,000 33,000 32,000 124,000
Others 29,000 28,000 28,000 29,000
Total Operating Expenses 1,104,000 1,037,000 1,017,000 1,105,000
322,000 306,000 405,000 248,000
Total Other Income/Expenses Net 4,000 11,000 2,000 23,000
Earnings Before Interest And Taxes 326,000 317,000 407,000 271,000
Interest Expense 21,000 19,000 20,000 20,000
Income Before Tax 305,000 298,000 387,000 251,000
Income Tax Expense 69,000 81,000 104,000 10,000
Minority Interest - - - -
Net Income From Continuing Ops 236,000 217,000 283,000 241,000
Discontinued Operations - - - -
Extraordinary Items - - - -
Effect Of Accounting Changes - - - -
Other Items - - - -
236,000 217,000 283,000 241,000
- - - -
236,000 217,000 283,000 241,000
Net Income
Preferred Stock And Other Adjustments
Net Income Applicable To Common Shares
Operating Income or Loss
Income from Continuing Operations
Period EndingTotal Revenue
Cost of Revenue
Gross Profit
Operating Expenses
Non-recurring Events

13
Appendix 1B: Historic Balance Sheets Source: Yahoo Finance
4-Jul-14 28-Mar-14 27-Dec-13 27-Sep-13
Cash And Cash Equivalents 3,067,000 3,707,000 3,813,000 3,727,000
Short Term Investments 982,000 377,000 77,000 105,000
Net Receivables 834,000 1,149,000 1,062,000 747,000
Inventory 11,000 14,000 13,000 16,000
Other Current Assets 394,000 405,000 351,000 375,000
5,288,000 5,652,000 5,316,000 4,970,000
- - - -
1,140,000 1,116,000 1,110,000 1,091,000
5,871,000 5,858,000 5,856,000 5,859,000
735,000 768,000 809,000 852,000
- - - -
112,000 124,000 138,000 114,000
18,000 21,000 29,000 28,000
13,164,000 13,539,000 13,258,000 12,914,000
Accounts Payable 563,000 647,000 644,000 561,000
Short/Current Long Term Debt - - - -
Other Current Liabilities 3,416,000 3,659,000 3,505,000 3,346,000
3,979,000 4,306,000 4,149,000 3,907,000
2,095,000 2,095,000 2,094,000 2,094,000
218,000 335,000 316,000 284,000
1,034,000 1,006,000 941,000 972,000
- - - -
- - - -
7,326,000 7,742,000 7,500,000 7,257,000
- - - -
- - - -
- - - -
7,000 7,000 7,000 7,000
-912,000 -1,148,000 -1,316,000 -1,599,000
- - - -
6,547,000 6,744,000 6,885,000 7,066,000
196,000 194,000 182,000 183,000
5,838,000 5,797,000 5,758,000 5,657,000
-768,000 -829,000 -907,000 -1,054,000
Total Stockholder Equity
Net Tangible Assets
Preferred Stock
Common Stock
Retained Earnings
Treasury Stock
Capital Surplus
Other Stockholder Equity
Total Liabilities
Stockholders' Equity
Misc Stocks Options Warrants
Redeemable Preferred Stock
Total Current Liabilities
Long Term Debt
Other Liabilities
Deferred Long Term Liability Charges
Minority Interest
Negative Goodwill
Total Assets
Liabilities
Current Liabilities
Property Plant and Equipment
Goodwill
Intangible Assets
Accumulated Amortization
Other Assets
Deferred Long Term Asset Charges
Period Ending
Assets
Current Assets
Total Current Assets
Long Term Investments

14
Appendix 1C: Historic Statement of Cash Flows Source: Yahoo Finance
4-Jul-14 28-Mar-14 27-Dec-13 27-Sep-13236,000 217,000 283,000 241,000
117,000 115,000 111,000 111,000
61,000 79,000 -11,000 39,000
308,000 -115,000 -320,000 180,000
-446,000 206,000 257,000 -437,000
3,000 -1,000 3,000 2,000
14,000 -52,000 6,000 55,000
293,000 449,000 329,000 191,000
-92,000 -77,000 -65,000 -57,000
-613,000 -298,000 27,000 -67,000
-19,000 - - -17,000
-724,000 -375,000 -38,000 -141,000
-104,000 -104,000 -104,000 -105,000
-102,000 -74,000 -102,000 -19,000
-18,000 - - -
5,000 -13,000 -2,000 -5,000
-216,000 -187,000 -208,000 -125,000
7,000 7,000 3,000 53,000
-640,000 -106,000 86,000 -22,000
Other Cash Flows from Financing Activities
Total Cash Flows From Financing Activities
Effect Of Exchange Rate Changes
Change In Cash and Cash Equivalents
Total Cash Flows From Investing Activities
Financing Activities, Cash Flows Provided By or Used In
Dividends Paid
Sale Purchase of Stock
Net Borrowings
Investing Activities, Cash Flows Provided By or Used In
Capital Expenditures
Investments
Other Cash flows from Investing Activities
Changes In Accounts Receivables
Changes In Liabilities
Changes In Inventories
Changes In Other Operating Activities
Total Cash Flow From Operating Activities
Period EndingNet Income
Operating Activities, Cash Flows Provided By or Used In
Depreciation
Adjustments To Net Income

15
Appendix 1D: Pro Forma Income Statement Source: Personal Estimates

16
Appendix 2: Capital Asset Pricing Model Source: Reuters, Internal Student Estimates
( )
Rf Risk Free Rate 2.28%
Rm Market Return 7%
Β Beta 1.03
Required Rate of Return: 7.16%

Appendix 3: Residual Income Model Source: Reuters, Internal Student Estimates
BPS Current book value per share $8.34
k Current required rate of return 7.16%
G Current BPS growth rate 3.6%
ROE ROE Symantec 2014 15.11%
P* Fair value of Symantec using BPS $27.00
Undervalued by: 8.79%

18
Appendix 4: Growth Duration Model Source: Reuters, Internal Student Estimates
System Software Gemalto
P/E 16.3 P/E 16.15
Estimated Growth Next Year 13.00% Estimated Growth Next Year 7.29%
Dividend Yield 1.50% Dividend Yield 0.62%
SYMC Est. EPS Fiscal $1.93 SYMC Est. EPS Fiscal $1.93
Pessimistic Scenario Pessimistic Scenario
SYMC Earnings Growth 5.78% SYMC Earnings Growth 5.78%
P/E SYMC 1 +.0578 + 0.025 P/E SYMC 1 +.0578 + 0.025
P/E Sector 1 + .13 + 0.015 P/E Gemalto 1 + .0729 + 0.0062
SYMC Fair P/E = (0.9457)(16.3) = 15.4147 SYMC Fair P/E = (1.0034)(16.15) = 16.2056
Fair Value = (15.4147)(1.93) = $29.75 Fair Value = (16.2056)(1.93) = $31.28
Anticipated Scenario Anticipated Scenario
SYMC Earnings Growth 7.44% SYMC Earnings Growth 7.44%
P/E SYMC 1 + .0744 + 0.025 P/E SYMC 1 + .0744 + 0.025
P/E Sector 1 + .13 + .015 P/E Gemalto 1 + .0729 + 0.0062
SYMC Fair P/E = (.9602)(16.3) = 15.6505 SYMC Fair P/E = (1.0188)(16.15) = 16.4535
Fair Value = (15.6505)(1.93) = $30.21 Fair Value = (16.4535)(1.93) = $31.76
Optimistic Scenario Optimistic Scenario
SYMC Earnings Growth 10.07% SYMC Earnings Growth 10.07%
P/E SYMC 1 + .1007 + 0.025 P/E SYMC 1 + .1007 + 0.025
P/E Sector 1 + .13 + .015 P/E Gemalto 1 + .0729 + 0.0062
SYMC Fair P/E = (0.9832)(16.3) = 16.0257 SYMC Fair P/E = (1.0432)(16.15) = 16.8479
Fair Value = (16.0257)(1.93) = $30.93 Fair Value = (16.8479)(1.93) = $32.52
Average Fair Price vs. Sector = $30.33 Average Fair Price vs. Sector = $31.89
Average Fair Price for Symantec Corporation $30.33 Average Fair Price for Symantec Corporation $31.89
Undervalued by: 22.21% Undervalued by: 28.48%
Competitor
= = 0.9457 = = 1.0034
= = 0.9832 = = 1.0432
= = 0.9602 = = 1.0188
Sector
Fair Value: $31.11
Undervalued By: 25.34%

19
Appendix 5: Franchise Value Mode Source: Bloomberg, Internal Student Estimates
(
) (
)
g Growth of book value per share 3.6% k Required rate of return 7.16% BPS Current book value per share $8.34 ROE Current return on equity 15.11% R New business return on equity 17.24%
P* Fair value for the stock $29.52
Undervalued By: 18.92%

20
Appendix 6: Technology Revenue Growth vs GDP Growth Source: Internal Student Estimates
SUMMARY OUTPUT
Regression Statistics
Multiple R 0.934225047
R Square 0.872776438
Adjusted R Square 0.847331726
Standard Error 0.009199663
Observations 7
ANOVA
df SS MS F Significance F
Regression 1 0.002903015 0.002903015 34.30089628 0.002056496
Residual 5 0.000423169 8.46338E-05
Total 6 0.003326184
Coefficients Standard Error t Stat P-value Lower 95% Upper 95% Lower 95.0% Upper 95.0%
Intercept 0.001769885 0.005686334 0.311252345 0.768167591 -0.012847301 0.01638707 -0.012847301 0.01638707
X Variable 1 0.555219793 0.094800844 5.856696704 0.002056496 0.311526464 0.798913122 0.311526464 0.798913122

21
Appendix 7: Software Revenue Growth vs GDP Growth Source: Internal Student Estimates
SUMMARY OUTPUT
Regression Statistics
Multiple R 0.892937434
R Square 0.79733726
Adjusted R Square 0.756804713
Standard Error 0.018532711
Observations 7
ANOVA
df SS MS F Significance F
Regression 1 0.006756411 0.006756411 19.6715307 0.006794745
Residual 5 0.001717307 0.000343461
Total 6 0.008473718
Coefficients Standard Error t Stat P-value Lower 95% Upper 95% Lower 95.0% Upper 95.0%
Intercept -0.022999729 0.016446263 -1.398477517 0.220832821 -0.065276193 0.019276736 -0.065276193 0.019276736
X Variable 1 0.997152905 0.224824006 4.435259936 0.006794745 0.4192244 1.575081411 0.4192244 1.575081411

22
Appendix 8: SYMC Revenue Growth vs. GDP Growth Source: Internal Student Estimates
SUMMARY OUTPUT
Regression Statistics
Multiple R 0.282024473
R Square 0.079537803
Adjusted R Square 0.037698613
Standard Error 0.019217537
Observations 24
ANOVA
df SS MS F Significance F
Regression 1 0.000702079 0.000702079 1.901035895 0.181821427
Residual 22 0.008124902 0.000369314
Total 23 0.008826981
Coefficients Standard Error t Stat P-value Lower 95% Upper 95% Lower 95.0% Upper 95.0%
Intercept 0.041039529 0.00561152 7.313442432 2.53237E-07 0.029401949 0.05267711 0.029401949 0.05267711
X Variable 1 0.022838181 0.016564043 1.378780583 0.181821427 -0.011513542 0.057189905 -0.011513542 0.057189905

23
Sources:
Reuters
Baseline
Bloomberg
Morningstar
Yahoo Finance
Google Finance
Symantec 10-Q
Symantec 10-K
Symantec Announcements
Symantec Transcripts
Symantec Conference Calls
Disclosures:
Ownership and material conflicts of interest: The author(s), or a member of their household, of this report does not hold a financial interest in the securities of this company.
The author(s), or a member of their household, of this report does not know of the existence of any conflicts of interest that might
bias the content or publication of this report.
Receipt of compensation: Compensation of the author(s) of this report is not based on investment banking revenue.
Position as a officer or director: The author(s), or a member of their household, does not serve as an officer, director or advisory board member of the subject company.
Market making:
The author(s) does not act as a market maker in the subject company’s securities.
Disclaimer: The information set forth herein has been obtained or derived from sources generally available to the public and believed by the author(s)
to be reliable, but the author(s) does not make any representation or warranty, express or implied, as to its accuracy or completeness. The information is not intended to be used as the basis of any investment decisions by any person or entity. This information does not constitute
investment advice, nor is it an offer or a solicitation of an offer to buy or sell any security. This report should not be considered to be a recommendation by any indi vidual affiliated with CFA Society of Orlando, CFA Institute or the CFA Institute Research Challenge with
regard to this company’s stock.