
SYLLABUS Subject Information Technology B.B.A. I...
97
B.B.A. 1 st Sem. Subject- Information Technology 45, Anurag Nagar, Behind Press Complex, Indore (M.P.) Ph.: 4262100, www.rccmindore.com 1 B.B.A. I SEM SYLLABUS Subject – Information Technology UNIT – I Introduction to Computer Hardware: Input / Output devices, storage devices and memory. Software: System and Application Software, Compilers, Interpreters and Assemblers. Computer Languages: Levels of languages, generation and their features. Generation of Computer (Phases of development of computers). Number System: Introduction to number system, binary, decimal, hexadecimal and their inter conversions and their uses in computer system. HTML:-Basics of HTML Tags UNIT – II Operating Systems: DOS: External and Internal Commands and Features. WINDOWS 7: Basic Operations, utilities and features. UNIT – III UNIX: Introduction, features and basic commands (like: pwd, cp, cd, rm, mv, ls, cat, mkdir, ch mod, rmdir, who, who am I, banner, date, kill, etc.). UNIT – IV MS Word 2007: Word basics, formatting text and documents, working with headers, footers and footnotes, tabs, tables and sorting, working with graphics, templates, wizards and sample documents, introduction to mail merge and macros. MS Access 2007: Database creation, screen/form design, report generation using wizard UNIT – V MS Excel 2007: Excel basics, rearranging worksheets, excel formatting tips and techniques, introduction to functions, Excel’s chart features, working with graphics, using worksheet as databases, automating “what-if” projects. MS PowerPoint 2007: PowerPoint basics, creating presentation the easy way, working with text in PowerPoint, working with graphics in power point UNIT – VI Information Technology: Introduction to IT and its development, Impact and Future of IT in Business Organisation, Overview of the following: 4 GL, Image processing, Virtual Reality, Video Conferencing, Decision Support System, Expert System, Artificial Intelligence, and Information Super Highways. UNIT–VII TALLY: Basic functions & Overview
Transcript of SYLLABUS Subject Information Technology B.B.A. I...

B.B.A. 1st Sem. Subject- Information Technology
45, Anurag Nagar, Behind Press Complex, Indore (M.P.) Ph.: 4262100, www.rccmindore.com 1
B.B.A. I SEM
SYLLABUS
Subject – Information Technology
UNIT – I Introduction to Computer Hardware: Input / Output devices, storage devices and memory. Software: System and Application Software, Compilers, Interpreters and Assemblers. Computer Languages: Levels of languages, generation and their features. Generation of Computer (Phases of development of computers). Number System: Introduction to number system, binary, decimal, hexadecimal and their inter conversions and their uses in computer system. HTML:-Basics of HTML Tags
UNIT – II Operating Systems: DOS: External and Internal Commands and Features. WINDOWS 7: Basic Operations, utilities and features.
UNIT – III UNIX: Introduction, features and basic commands (like: pwd, cp, cd, rm, mv, ls, cat, mkdir, ch mod, rmdir, who, who am I, banner, date, kill, etc.).
UNIT – IV MS Word 2007: Word basics, formatting text and documents, working with headers, footers and footnotes, tabs, tables and sorting, working with graphics, templates, wizards and sample documents, introduction to mail merge and macros. MS Access 2007: Database creation, screen/form design, report generation using wizard
UNIT – V MS Excel 2007: Excel basics, rearranging worksheets, excel formatting tips and techniques, introduction to functions, Excel’s chart features, working with graphics, using worksheet as databases, automating “what-if” projects. MS PowerPoint 2007: PowerPoint basics, creating presentation the easy way, working with text in PowerPoint, working with graphics in power point
UNIT – VI Information Technology: Introduction to IT and its development, Impact and Future of IT in Business Organisation, Overview of the following: 4 GL, Image processing, Virtual Reality, Video Conferencing, Decision Support System, Expert System, Artificial Intelligence, and Information Super Highways.
UNIT–VII TALLY: Basic functions & Overview
B.B.A. 1st Sem. Subject- Information Technology
45, Anurag Nagar, Behind Press Complex, Indore (M.P.) Ph.: 4262100, www.rccmindore.com 2
Computer is an electronic device that transforms data into meaningful information. Data can be anything like marks obtained by you in various subjects. It can also be name, age, sex, weight, height, etc. of all the students in a class. Computer System is an electronic data processing device, which does the following:
Accept an input data. Stores an input data. Process the data input. Retrieve the stored data as and when required and Print the result in desired format
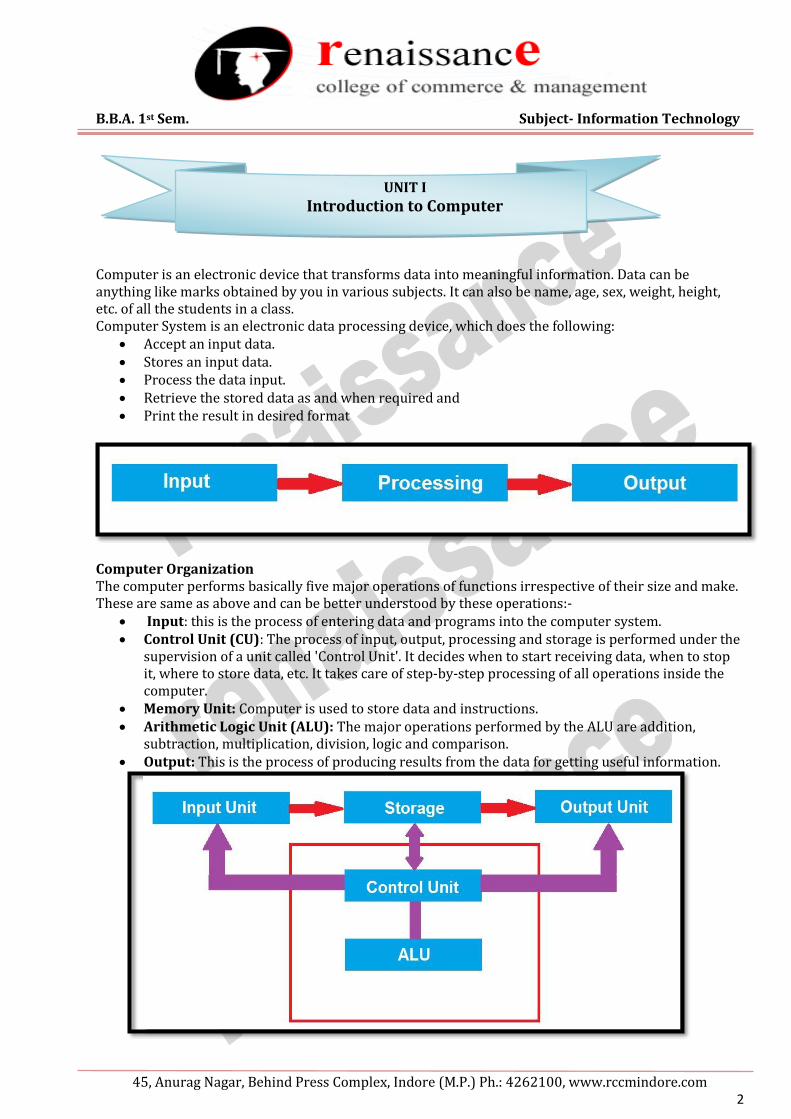
Computer Organization The computer performs basically five major operations of functions irrespective of their size and make. These are same as above and can be better understood by these operations:-
Input: this is the process of entering data and programs into the computer system. Control Unit (CU): The process of input, output, processing and storage is performed under the
supervision of a unit called 'Control Unit'. It decides when to start receiving data, when to stop it, where to store data, etc. It takes care of step-by-step processing of all operations inside the computer.
Memory Unit: Computer is used to store data and instructions. Arithmetic Logic Unit (ALU): The major operations performed by the ALU are addition,
subtraction, multiplication, division, logic and comparison. Output: This is the process of producing results from the data for getting useful information.
UNIT I
Introduction to Computer

B.B.A. 1st Sem. Subject- Information Technology
45, Anurag Nagar, Behind Press Complex, Indore (M.P.) Ph.: 4262100, www.rccmindore.com 3
High speed Accuracy Storage capability Diligence Versatility
Reliability Automation Reduction in paper work Reduction in cost
NO IQ Dependency Environment No feeling
Computer is basically divided into two parts:-
Computer Hardware Computer Software
Advantages
High speed
Accuracy
Storage capability
Diligence
Reduction in cost
Reduction in paper work
Reliability
Automation
Versatility
Hardware
Disadvantages of Computers
Software
B.B.A. 1st Sem. Subject- Information Technology
45, Anurag Nagar, Behind Press Complex, Indore (M.P.) Ph.: 4262100, www.rccmindore.com 4
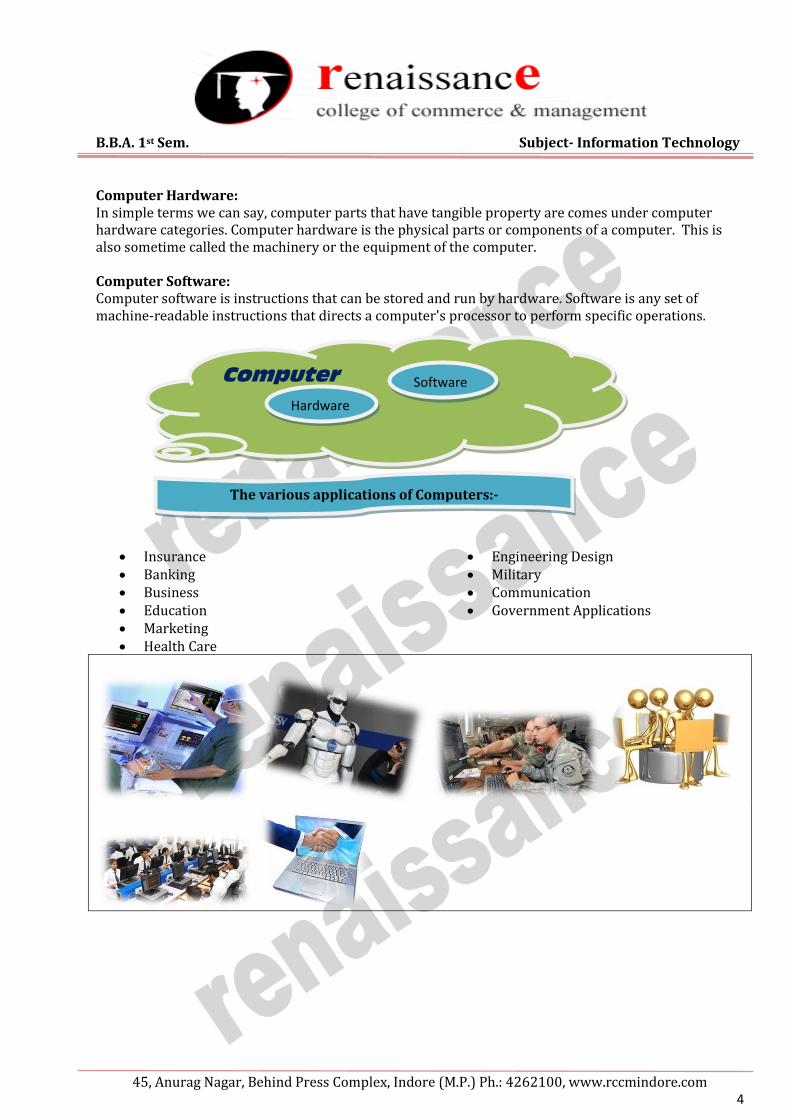
Computer Hardware: In simple terms we can say, computer parts that have tangible property are comes under computer hardware categories. Computer hardware is the physical parts or components of a computer. This is also sometime called the machinery or the equipment of the computer. Computer Software: Computer software is instructions that can be stored and run by hardware. Software is any set of machine-readable instructions that directs a computer's processor to perform specific operations.
Insurance Banking Business Education Marketing Health Care
Engineering Design Military Communication Government Applications
The various applications of Computers:-
Computer Software
Hardware

B.B.A. 1st Sem. Subject- Information Technology
45, Anurag Nagar, Behind Press Complex, Indore (M.P.) Ph.: 4262100, www.rccmindore.com 5
Input devices
Input devices
An input device is an electromechanical device as it utilizes both electronic and mechanical power. It aims in receiving data from external world. The input devices are responsible for converting data into a form that is understood by the computer. An input device is a peripheral device that converts symbols that people understand into bits that computers can process Basic working of input devices:-
Accept the data. Convert it into the machine understandable form.
Different Types of input devices:-
Keyboard Mouse Joystick Light pen Track Ball Scanner
Graphic Tablet Microphone Magnetic Ink Card Reader (MICR) Optical Character Reader (OCR) Bar Code Reader Optical Mark Reader
Keyboard Keyboard is one of the most commonly used input devices to input the date into the computer. It is like the traditional typewriter, although there are some additional keys provided for performing some additional functions. Keyboards are of two sizes 84 keys or 101/102 keys, but now 104 keys or 108 keys.
Keyboard is an input device used to enter data in to computer by pressing one key at one time. It has its own processor and circuitry that carries information to the processor. When you press a key, it presses a switch, completing the circuit and allowing a tiny amount of
current to flow through. It tells the processor the position of each key what each keystroke or combination of keystrokes
represents.
Computer Hardware -
Input devices Output devices
Storage device Processor

B.B.A. 1st Sem. Subject- Information Technology
45, Anurag Nagar, Behind Press Complex, Indore (M.P.) Ph.: 4262100, www.rccmindore.com 6
Despite the development of alternative input devices, such as mouse, touch screen, light pen, the
keyboard remains the most commonly used and most versatile device used for direct (human) input into computers.
One factor determining the size of a keyboard is the presence of duplicate keys, such as a separate numeric keyboard, for convenience.
Another factor determining the size of a keyboard is the size and spacing of the keys.
Generally the keyboards contain the following keys, they are:- Alphabets Arithmetic operators such as +, -, *, / Numeric digits 0–9 Cursor arrow keys Navigation keys such as Home, End, PgUp, PgDown, etc. Num Lock button, used to enable or disable the numeric pad. Enter key
The following are the different layouts of the keyboards, they are as follows
QWERTY QWERTZ AZERTY DVORAK
Mouse: The mouse is used to point to a particular place on the screen and select to perform one or more action. The pointing device may point to the menu, commands, size windows, starts programs etc. The most conventional kind of mouse has two buttons on top: the left one being used most frequently then right one. A mouse is a pointing device that functions by detecting 2D motion relative to its supporting surface. The mouse's motion typically translates into the motion of a pointer on a display, which allows for fine control of a graphical user interface Mouse Actions
Left Click Double Click
Right Click Drag and Drop

B.B.A. 1st Sem. Subject- Information Technology
45, Anurag Nagar, Behind Press Complex, Indore (M.P.) Ph.: 4262100, www.rccmindore.com 7
Types of mouse:-
Mechanical mouse: Houses a hard rubber ball that rolls as the mouse is moved. Sensors inside the mouse body detect the movement and translate it into information that the computer interprets.
Optical mouse: Uses an LED sensor to detect tabletop movement and then sends off that information to the computer for merry munching.
Cordless 3-D mouse: This kind of mouse can be pointed at the computer screen like a TV remote
Wireless Mouse: Wireless mouse works via radio frequencies commonly referred to as RF. RF wireless mouse requires two components to work properly – a radio transmitter and a radio receiver. RF Transmitter: A radio frequency (RF) transmitter is usually integrated inside the mouse. The mouse records its movements and buttons that are clicked and then sends this information via radio signals to the receiver. RF Receiver: The radio frequency (RF) receiver usually connects to the computer’s peripheral mouse input. It receives these RF signals, decodes them, and then sends these signals directly to the computer as normal.
Mechanical Mouse Wireless Mouse Track ball: This is also a pointing device. Track ball is an input device that is mostly used in notebook or laptop computer, instead of a mouse. This is a ball, which is half inserted and by moving fingers on ball, pointer can be moved. Since the whole device is not moved, a track ball requires less space than a mouse. A track ball comes in various shapes like a ball, a button and a square. Compared with a mouse, a trackball has no limits on effective travel; at times, a mouse can reach an edge of its working area while the operator still wishes to move the screen pointer farther. With a trackball, the operator just continues rolling, whereas a mouse would have to be lifted and re-positioned.

B.B.A. 1st Sem. Subject- Information Technology
45, Anurag Nagar, Behind Press Complex, Indore (M.P.) Ph.: 4262100, www.rccmindore.com 8
Joystick:- The joystick is handheld stick. This stick can rotate about one end transmitting its angle to the computer in two or three dimensions. It typically has a button on top that is used to select the option pointed by the cursor. Joysticks are often used to control video games, and usually have one or more push-buttons whose state can also be read by the computer. Elements in a Joystick
Stick Base Trigger Extra button
Autofire switch
Throttle Hat switch Suction cup
Digitizing Tablet: An input device that permits drawing of images and graphics is called a digitizing tablet. They give feeling of drawing images with pencil and paper. The graphics tablet has two major parts that are:-
A flat surface on which the image is drawn. Stylus that helps in drawing.
Scanners An input device capable to read text or illustrations printed on a paper and interpret it in a form that can be used by a computer is known as a scanner. It converts the document image into digital form so that it can be fed into the computer. Capturing information like this reduces the possibility of errors typically experienced during large data entry. Digital Camera A digital camera can store many more pictures than an ordinary camera. Pictures taken using a digital camera are stored inside its memory and can be transferred to a computer by connecting the camera to it. A digital camera takes pictures by converting the light passing through the lens at the front into a digital image. There are several categories in which the cameras can be classified:-
Video camera Professional video cameras Camcorders used by amateurs. webcams
Digital camera Live-preview digital cameras Compact digital cameras Bridge cameras

B.B.A. 1st Sem. Subject- Information Technology
45, Anurag Nagar, Behind Press Complex, Indore (M.P.) Ph.: 4262100, www.rccmindore.com 9
Magnetic Ink Character Recognition:
MICR is also an input device is commonly used in banks because of a large number of cheques to be processed. The bank's code number and cheque number are printed on the cheques with a special type of ink that contains particles of magnetic material that are machine readable. This reading process is called Magnetic Ink Character Recognition (MICR). Magnetic Ink Character Recognition is a character recognition system that uses special ink and characters. When a document that contains this ink needs to be read, it passes through a machine, which magnetizes the ink and then translates the magnetic information into characters. MICR technology is used by banks. Numbers and characters found on the bottom of checks (usually containing the check number, sort number, and account number) are printed using Magnetic Ink. To print Magnetic Ink need, you need a laser printer that accepts MICR toner. MICR provides a secure, high-speed method of scanning and processing information. Optical character Reader:- Optical character Reader is an input device that is use to read a printed text. The OCR scans text optically character by character, converts them into a computer readable code and stores the text on the system memory. Optical Mark Reader:- Optical mark reader is also known as optical mark recognition that is same as the scanner which reads on specific areas of the page. Thus OMR can be defined as the process of scanning paper-based documents and identify data or marks in a location defined previously. It is specially used for checking the answer sheets of examinations having multiple choice questions. Bar Code Reader:-
An electronic device used to read barcodes printed on various surfaces is called barcode reader. It is also known as barcode scanner. Bar Code Reader scans a bar code image, converts it into an alphanumeric value, which is then fed to the computer to which bar code reader is connected. Bar coded data is generally used in labeling goods, numbering the books, etc. It may be a hand-held scanner or may be embedded in a stationary scanner.
Voice Recognition System:- Voice recognition systems are alternatively known as voice data entry or audio data entry terminals. This method of input enables a programmer to instruct the computer with spoken words instead of a written program

B.B.A. 1st Sem. Subject- Information Technology
45, Anurag Nagar, Behind Press Complex, Indore (M.P.) Ph.: 4262100, www.rccmindore.com 10
Light Pen:- Light pen is also an input device used as pointing device, which is similar to a pen. It is used to select a displayed menu item or draw pictures on the monitor screen. It consists of a photocell and an optical system placed in a small tube. When light pen's tip is moved over the monitor screen and pen button is pressed, its photocell sensing element detects the screen location and sends the corresponding signal to the CPU.
A light pen is a computer input device used in conjunction with a computer's CRT display.
It allows the user to point to displayed objects or draw on the screen in a similar way to a touch screen but with greater positional accuracy.
A light pen detects a change of brightness of nearby screen pixels when scanned by cathode ray tube electron beam and communicates the timing of this event to the computer.
Because the user is required to hold his arm in front of the screen for long period of time, the light pen fell out of use as a general purpose input device.
Touch screen:- An input device that permits users to operate a PC by simply touching the display screen is called a touch screen. The touch screen is as easy to use as trackballs or touchpad’s. Three major components form a basic touch screen they are as follows:-
Touch sensor Controller Software driver

B.B.A. 1st Sem. Subject- Information Technology
45, Anurag Nagar, Behind Press Complex, Indore (M.P.) Ph.: 4262100, www.rccmindore.com 11
An output is an electromechanical device that receives output from a computer in binary coded form and converts it into human understandable form and transmits to the user. An output device is any peripheral that receives data from a computer, usually for display, projection, or physical reproduction.
Monitor / Visual Display Unit Printer Plotter Speaker
Monitor:
Monitor is the most common and the most popular output device. It forms images from tiny dots, called pixels that are arranged in a rectangular form. The sharpness of the image depends upon the number of the pixels. There are two types of viewing screen used for monitors:
Cathode-Ray Tube (CRT): The CRT display is made up of small picture elements called pixels. The smaller the pixels, the better the image clarity, or resolution. It takes more than one illuminated pixel to form whole character, such as the letter ‘e’ in the word help.
There are some disadvantages of CRT: Large in Size High power consumption Flat-Panel Display Monitor The flat-panel display refers to a class of video devices that have reduced volume, weight and power requirement in comparison to the CRT. You can hang them on walls or wear them on your wrists.
Current uses of flat-panel displays include calculators, video games, monitors, laptop computer, graphics display. The flat-panel display is divided into two categories:
Emissive Displays - The emissive displays are devices that convert electrical energy into light. Example are plasma panel and LED(Light-Emitting Diodes).
Non-Emissive Displays - The Non-emissive displays use optical effects to convert sunlight or light from some other source into graphics patterns. Example is LCD(Liquid-Crystal Device)
Classification- Based on Signals:
Digital Monitor Analog Monitor
Output devices:

B.B.A. 1st Sem. Subject- Information Technology
45, Anurag Nagar, Behind Press Complex, Indore (M.P.) Ph.: 4262100, www.rccmindore.com 12
Classification- Based on Picture Quality VGA SVGA XGA
Printer:- A printer is an output device that is used in a computer to print alphanumeric characters on papers. It converts the electronic signals from the computer into human readable form or hardcopy to produce a print out of the result of data processed in the computers. Printers are broadly classified in to two categories:-
Impact printers: An impact printer has mechanisms resembling those of a typewriter. It forms characters or images by striking a mechanism such as a print hammer or wheel against an inked ribbon, leaving an image on paper.
Character Printer:-
Impact printers are dying out; however, you may still come in contact with a dot-matrix
printer. A dot-matrix printer contains a print head of small pins that strike an inked
ribbon, forming characters or images. Print heads are available with 9, 18, or 24 pins; the 24-
pin head offers the best print quality.
Dot-matrix printers permit a choice between output of draft quality; a coarser-looking 72 dots
per inch vertically, which may be acceptable for drafts of papers and reports, and near-letter-
quality, a crisper-looking 144 dots per inch vertically, which is more suitable for a finished
product to be shown to other people.
Dot-matrix printers print about 40-300 characters per second (cps) and can print some
graphics, although the reproduction quality is poor. Color ribbons are available for limited use
of color. Dot-matrix printers are noisy, inexpensive, and they can print through multipart forms,
creating several copies of a page at the same time,
Dot-Matrix Printer Daisy-Wheel Printer
Line printer Drum Printer Chain Printer
Non-Impact printers Ink-Jet Printer Laser Printer
Plotter:- A plotter is a vector graphics printing device that connects to a computer. It draws pictures on paper based on commands from computer. A plotter is a very versatile tool. Types of plotters:-

B.B.A. 1st Sem. Subject- Information Technology
45, Anurag Nagar, Behind Press Complex, Indore (M.P.) Ph.: 4262100, www.rccmindore.com 13
Drum plotter Flat-Bed plotter
Sound Cards:- Sound cards are a important part of computer, without sound cards you will have no music, no effects and no voices. Sound card is also referred as a sound board or an audio card, a sound card is an expansion card or integrated circuit that provides a computer with the ability to produce sounds that can be heard by the user either over speakers or headphones. Sound card connections are as follows:-
Digital out Sound in or line in Microphone or Mic Sound out or line out Fire wire MIDI or Joystick
Speakers:- A hardware device that is connected to a computer's sound card that outputs sounds generated by the computer is referred as speaker. Speakers are rated in Frequency response, Total Harmonic Distortion, and Watts.
Storage:-
Computer data storage is often known as storage or memory refers to computer components and recording media that retain digital data used for computing for some interval of time. A memory is just like a human brain. It is used to store data and instructions. Computer memory is the storage space in computer where data is to be processed and instructions required for processing are stored. Memory is primarily of two types:
Primary Memory/Main Memory Secondary Memory
Primary memory:- Primary memory holds only those data and instructions on which computer is currently working. It has limited capacity and data gets lost when power is switched off. It is generally made up of semiconductor device. These memories are not as fast as registers. The data and instructions required to be processed earlier reside in main memory. Primary memory is divided into two categories they are as follows:-
RAM ROM.
RAM:- Full form of RAM random access memory (RAM). A RAM constitutes the internal memory of the CPU for storing data, program and program result. It is read/write memory. Since access time in RAM is independent of the address to the word that is, each storage location inside the memory is as easy to reach as other location & takes the same amount of time RAM is volatile, i.e., data stored in it is lost when we there is a power failure. Hence, a backup uninterruptible power system (UPS) is often used with

B.B.A. 1st Sem. Subject- Information Technology
45, Anurag Nagar, Behind Press Complex, Indore (M.P.) Ph.: 4262100, www.rccmindore.com 14
computers. RAM is small, both in terms of its physical size and in the amount of data it can hold. There are two types of RAM they are as follows:-
Static RAM (SRAM) Dynamic RAM (DRAM)
Static RAM (SRAM)
The word static indicates that the memory retains its contents as long as power remains applied.
Data is lost when the power gets down due to volatile nature. SRAM chips use a matrix of 6-transistors and no capacitors. Transistors do not require power to prevent leakage, so SRAM need not have to be refreshed on
a regular basis. Because of the extra space in the matrix, SRAM uses more chips than DRAM for the same
amount of storage space, thus making the manufacturing costs higher. Static RAM is used as cache memory needs to be very fast and small.
Characteristic of the Static RAM
It has long data lifetime There is no need to refresh Faster Used as cache memory Large size Expensive High power consumption
Dynamic RAM (DRAM)
DRAM must be continually refreshed in order to maintain the data. This is done by placing the memory on a refresh circuit that rewrites the data several hundred
times per second. DRAM is used for most system memory because it is cheap and small. All DRAMs are made up of memory cells. These cells are composed of one capacitor and one transistor.
Characteristic of the Dynamic RAM
It has short data lifetime Need to refresh continuously Slower as compared to SRAM Used as RAM lesser in size Less expensive Less power consumption
ROM:- ROM is Read Only Memory. ROM are the memories on which it is not possible to write the data when they are online to the computer. They can only be read. It is a permanent in built in the computer at the time of its production. It is also known as firmware. It stores the set of instructions permanently which instructs the computer how to work. The ROM can be used in storing micro programs, system

B.B.A. 1st Sem. Subject- Information Technology
45, Anurag Nagar, Behind Press Complex, Indore (M.P.) Ph.: 4262100, www.rccmindore.com 15
programs, subroutines. Types of ROM are as follows:-
PROM EPROM EEPROM
MROM (Masked ROM)
The very first ROMs were hard-wired devices that contained a pre-programmed set of data or instructions.
These kinds of ROMs are known as masked ROMs. It is inexpensive ROM.
PROM (Programmable Read only Memory) PROM is read-only memory that can be modified only once by a user. The user buys a blank PROM and enters the desired contents using a PROM programmer. Inside the PROM chip there are small fuses which are burnt open during programming. It can be programmed only once . It is not erasable.
EPROM(Erasable and Programmable Read Only Memory)
The EPROM can be erased by exposing it to ultra-violet light for duration of up to 40 minutes. During programming an electrical charge is trapped in an insulated gate region. The charge is retained for more than ten years because the charge has no leakage path. For erasing this charge, ultra-violet light is passed through a quartz crystal window (lid). This exposure to ultra-violet light dissipates the charge. During normal use the quartz lid is sealed with a sticker.
EEPROM(Electrically Erasable and Programmable Read Only Memory)
The EEPROM is programmed and erased electrically. It can be erased and reprogrammed about ten thousand times. Both erasing and programming take about 4 to 10 ms (milli second). In EEPROM, any location can be selectively erased and programmed. EEPROMs can be erased one byte at a time, rather than erasing the entire chip. Hence, the process of re-programming is flexible but slow.
UVEPROM(Ultra Violet Erasable and Programmable Read Only Memory)
The UVEPROM is programmed and erased using ultra Violet rays. It can be erased and reprogrammed about ten thousand times. Both erasing and programming take about 4 to 10 ms (milli second).
Advantages of ROM
Non-volatile in nature These cannot be accidentally changed Cheaper than RAMs Easy to test More Reliable than RAMs These are static and do not require refreshing Its contents are always known and can be verified
Secondary memory:-

B.B.A. 1st Sem. Subject- Information Technology
45, Anurag Nagar, Behind Press Complex, Indore (M.P.) Ph.: 4262100, www.rccmindore.com 16
Secondary memory is also known as external memory or non-volatile. It is slower than primary memory. These are used for storing Data/Information permanently the data one stored will not be erased as the power is switched off. CPU directly does not access these memories, instead they are accessed via input-output routines. Contents of secondary memories are first transferred to main memory and then CPU can access it. Types of secondary memory are as follows:-
Magnetic tapes Magnetic disk
Magnetic tapes:- Magnetic tape is the most commonly used device for storing large data. It is sequential access device. Magnetic tape is a strip or ribbon of plastic which is coated with Ferro magnetic oxides. It is generally 80-2400 feet long and ½ inch wide, in size. Magnetic Disk:- A magnetic disk is a circular plate constructed of metal or plastic coated with magnetized material. Both sides of the disk are used and several disks may be stacked on one spindle with read/write heads available on each surface. Bits are stored in magnetized surface in spots along concentric circles called tracks. Tracks are commonly divided into sections called sectors. Disk that are permanently attached and cannot removed by occasional user are called hard disks. A disk drive with removable disks is called a floppy disk drive. Types of magnetic disk:-
Hard disk Floppy disk Compact disk Video CD DVD
Other Memories:-
Flash memory Virtual memory Cache Memory
Software
Software is a set of program which performs desired task. Software runs on hardware. Software is a sequence of instructions written to solve a particular problem. There are two types of software’s:
System Software Application Software
System Software:- System Software performs the basic functions necessary to start and operate a computer. It refers to all programs that make computer work. It controls and monitors the various resources of a computer such as processor, input-output devices and communication links. System software is divided into three categories:-
System management software System support software System development software

B.B.A. 1st Sem. Subject- Information Technology
45, Anurag Nagar, Behind Press Complex, Indore (M.P.) Ph.: 4262100, www.rccmindore.com 17
Application Software:- Application software refers to the programs which help the computer to work effectively for specific applications. Application software is of two types:-
General purpose program Application specific program
Other software’s are as follows:- Compiler - Compiler is a system program which translates a high-level language program into machine language program is called a compiler. Compiler also checks error of the program to be executed. Features of the compiler: Compiler is more powerful than assembler. Limitation of the compiler:
Take longer time to produce result. It occupies more memory space. Low speed and low efficiency of memory utilization.
Interpreter - It is also a translator which translates a high-level language program into object code, statement wise. It doesn’t translate the entire program at a time. It takes up one statement of a high-level language program at a time, translates it and then executes it and then takes up the next statement and repeats the whole process till end. Features of the Interpreter:
Interpreter is cheaper than compiler. It occupies less memory space.
Limitations of the Interpreter:
Slower than compiler. Suitable only for small programs.
Linker: In high level languages, some built in header files or libraries are stored. These libraries are predefined and these contain basic functions which are essential for executing the program. These functions are linked to the libraries by a program called Linker.

B.B.A. 1st Sem. Subject- Information Technology
45, Anurag Nagar, Behind Press Complex, Indore (M.P.) Ph.: 4262100, www.rccmindore.com 18
If linker does not find a library of a function then it informs to compiler and then compiler generates an error. The compiler automatically invokes the linker as the last step in compiling a program. Not built in libraries, it also links the user defined functions to the user defined libraries. Usually a longer program is divided into smaller subprograms called modules. And these modules must be combined to execute the program. The process of combining the modules is done by the linker.
Loader: Loader is a program that loads machine codes of a program into the system memory. In Computing, a loader is the part of an Operating System that is responsible for loading programs. It is one of the essential stages in the process of starting a program. Because it places programs into memory and prepares them for execution. Loading a program involves reading the contents of executable file into memory. Once loading is complete, the operating system starts the program by passing control to the loaded program code. All operating systems that support program loading have loaders. In many operating systems the loader is permanently resident in memory.
Languages of Computer:- In order to communicate with the computer user also needs to have a language that should be understood by the computer. For this purpose, different languages are developed for performing different types of work on the computer. Basically, There are three types of computer languages they are as follows:-
Low level language Assembly level language High level language
Low level language:- Low level language is also known as Machine level language. The low level language is directly understood by the computer. in other words, the binary language is machine language(0s and 1s). any instruction given in the machine language has two parts:-
OPCODE OPERAND
Assembly level language:-

B.B.A. 1st Sem. Subject- Information Technology
45, Anurag Nagar, Behind Press Complex, Indore (M.P.) Ph.: 4262100, www.rccmindore.com 19
The major drawback of machine language lead to the introduction of a new language called assembly level language. A program written in symbolic language is called an assembly code or a symbolic program. Assembler translates the assembly code into machine code, it also “assembles” the machine code into the main memory of the computer and makes it ready for execution. High Level Language:- To overcome the difficulties of low level language such as machine dependency, difficult to understand etc. high level languages are classified into two types- general and specific purpose high level language.
Generations of Computers:- Generation in computer terminology is a change in technology a computer is/was being used. Initially, the generation term was used to distinguish between varying hardware technologies. But nowadays, generation includes both hardware and software, which together make up an entire computer system. There are totally five computer generations known till date. Each generation has been discussed in detail along with their time period, characteristics. We've used approximate dates against each generation which are normally accepted.
First Generation: - 1946-1956. Vacuum tube based. Second Generation: - 1959-1965. Transistor tube based. Third Generation: - 1965-1971. Integrated circuit tube based. Fourth Generation: - 1971-1980.VLSI microprocessor based. Fifth Generation: - 1980-onwards. ULSI based.

B.B.A. 1st Sem. Subject- Information Technology
45, Anurag Nagar, Behind Press Complex, Indore (M.P.) Ph.: 4262100, www.rccmindore.com 20

B.B.A. 1st Sem. Subject- Information Technology
45, Anurag Nagar, Behind Press Complex, Indore (M.P.) Ph.: 4262100, www.rccmindore.com 21
Number system:- Number system are generally divided into two types:-
Non-positional number system Positional number system
Non-Positional Number System: Earlier these types of number systems were used. They were based on additive approach which was used for counting and other kinds of arithmetical work. Positional Number System: Positional Number System was affected by the position of symbols. Any value was represented by a predefined set of symbols in which every symbol has its position in a number. Each symbol was called a digit. The idea of positional number system depends on the principles of “Base and Power Position”. The following are the types of positional number system:-
Binary Number System Decimal Number System Octal Number System Hexadecimal Number System
Binary Number System Binary Number System is based on two digits 0 and 1. . The base of Binary Number System is 2 because there are two digits. Decimal Number System Decimal Number System makes use of ten digits. These digits are represented from 0 to 9. The base of Decimal Number System is 10 because there are ten decimal digits. Hexadecimal Number System Hexadecimal Number System makes use of sixteen symbols. These digits are represented from 0 to 9 while the remaining six are A, B, C, D, E, F representing decimal value of 10, 11, 12, 13, 14, and 15. The base of Hexadecimal Number System is 16. Octal Number System Octal Number System makes use of eight digits. These digits are represented from 0 to 7. The base of Octal Number System is 8 because there are eight decimal digits.
Conversion of Number system:-
Conversion from any base to decimal Step 1 - Determine the column (positional) value of each digit (this depends on the position of
the digit and the base of the number system). Step 2 - Multiply the obtained column values (in Step 1) by the digits in the corresponding
columns. Step 3 - Sum the products calculated in Step 2. The total is the equivalent value in decimal.
Conversion from decimal to any base Step 1 - Divide the decimal number to be converted by the value of the new base. Step 2 - Get the remainder from Step 1 as the rightmost digit (least significant digit) of new base
number. Step 3 - Divide the quotient of the previous divide by the new base. Step 4 - Record the remainder from Step 3 as the next digit (to the left) of the new base number. Repeat Step 3 and 4, getting remainders from right to left, until the quotient becomes zero in
Step 3. The last remainder thus obtained will be the most significant digit (MSD) of the new base
number.

B.B.A. 1st Sem. Subject- Information Technology
45, Anurag Nagar, Behind Press Complex, Indore (M.P.) Ph.: 4262100, www.rccmindore.com 22
There are different set of steps to covert the fractional portion of decimal to any other base:- To convert fractional portion of a decimal number into given base
Multiply the fractional part with converting base Store the integer part before the decimal point. Repeat the task of multiplication either five times or getting same fractional part or zero,
whatever comes first Conversion from any base to non decimal base
Step 1 - Convert the original number to a decimal number (base 10). Step 2 - Convert the decimal number so obtained to the new base number.
Other Operations on Number system:-
Addition of Binary Numbers Subtraction of Binary Numbers
1’s complement 2’s complement
Multiplication of Binary Numbers Division of Binary Numbers
HTML HTML is abbreviated form of Hyper Text Markup Language. This language is a case-insensitive language. This language is used to create WebPages. The extensive use of tags makes it to be popularly known as the language of tags. The tags can be referred as special HTML codes kept in angle brackets (<>). These tares show their effect over the text written between opening and closing tags.
HTML stands for Hyper Text Markup Language, which is the most widely used language on Web to develop web pages.
Hypertext refers to the way in which Web pages (HTML documents) are linked together. History of HTML
HTML was created by Berners-Lee in late 1991 but "HTML 2.0" was the first standard HTML specification which was published in 1995.
HTML 4.01 was a major version of HTML and it was published in late 1999. Though HTML 4.01 version is widely used but currently we are having HTML-5 version which is an extension to HTML 4.01, and this version was published in 2012.
HTML markup tags are usually called HTML tags. HTML tags are keywords (tag names) surrounded by angle brackets like <html> HTML tags normally come in pairs like <p> and </p> The first tag in a pair is the start tag, the second tag is the end tag The end tag is written like the start tag, with a slash before the tag name Start and end tags are also called opening tags and closing tags
HTML Headings
HTML headings are defined with the <h1> to <h6> tags. The <hr> tag creates a horizontal line in an HTML page HTML Paragraphs

B.B.A. 1st Sem. Subject- Information Technology
45, Anurag Nagar, Behind Press Complex, Indore (M.P.) Ph.: 4262100, www.rccmindore.com 23
Paragraphs are defined with the <p> tag. Use the <br> tag if you want a line break (a new line) without starting a new paragraph: <p>This is<br>a para<br>graph with line breaks</p>
HTML Text Formatting
<b>Defines bold text <em>Defines emphasized text <i>Defines a part of text in an alternate voice or mood <small>Defines smaller text <strong>Defines important text <sub>Defines subscripted text <sup>Defines superscripted text
Comment tags
Comment tags <!-- and --> are used to insert comments in HTML. Link Tag
The HTML <a> tag defines a hyperlink. Syntax <a href="url">Link text</a> Example <a href="http://www.google.com/" target="_blank">Visit W3Schools!</a>
HTML Head The <head> element is a container for all the head elements. The following tags can be added to the head section: <title>, <style>, <meta>, <link>, <script>,
<noscript>, and <base>. The HTML <title> Element
HTML Images
In HTML, images are defined with the <img> tag. The <img> tag is empty, which means that it contains attributes only, and has no closing tag. <img src="url" alt="some_text"> Src stands for "source“ Alt is for alternate text for an image The height and width attributes are used to specify the height and width of an image.
HTML Tables Tables are defined with the <table> tag. A table is divided into rows with the <tr> tag. (tr stands for table row) A row is divided into data cells with the <td> tag. (td stands for table data) A row can also be divided into headings with the <th> tag. (th stands for table heading) The <td> elements are the data containers in the table. The <td> elements can contain all sorts of HTML elements like text, images, lists, other tables, etc.
Common Tags of HTML:-
1. HTML:- denoted by <html></html> represents the beginning of html code 2. Head:- denoted by <head></head> provide the meta data of Webpage

B.B.A. 1st Sem. Subject- Information Technology
45, Anurag Nagar, Behind Press Complex, Indore (M.P.) Ph.: 4262100, www.rccmindore.com 24
3. Title :- denoted by <title></title> represents the title of Webpage 4. Body:- denoted by <body></body> represents content of Webpage 5. Bold :- denoted by <b></b> represents the body text of Webpage 6. Italic:- denoted by<i></i> represents the italic text 7. Heading: - denoted by<hn></hn> n ranges from 1 to 6. It can display headings
HTML tags for different list:- Ordered list <ol> <li>Coffee</li> <li>Milk</li> </ol>
Output: 1. Coffee 2. Milk
Unordered list <ul> <li>Coffee</li> <li>Milk</li> </ul>
Output: Coffee Milk
Definition list <dl> <dt>Coffee</dt> <dd>- black hot drink</dd> <dt>Milk</dt> <dd>- white cold drink</dd> </dl>
Output: Coffee
- black hot drink Milk
- white cold drink
Frame Tags Frameset Frame
<html> <frameset cols="25%,*,25%"> <frame src="frame_a.htm"> <frame src="frame_b.htm"> <frame src="frame_c.htm"> </frameset> </html>

B.B.A. 1st Sem. Subject- Information Technology
45, Anurag Nagar, Behind Press Complex, Indore (M.P.) Ph.: 4262100, www.rccmindore.com 25
UNIT-II Disk Operating System
DOS is a Disk Operating System. It works as an interpreter between user and computer. We give English like commands and it converts it into machine language and after the computer has processed the information, returns the results to you in English. MS-DOS consists of four essentials programs and a set of additional utilities. Four main programs are
Boot Record IO.SYS MSDOS.SYST COMMAND.COM
Types of Dos:- MS-DOS PC-DOS
DOS command divided into 2 parts. Internal Commands or Memory-Resident Commands External Command or Disk-Residence Commands
Functions of DOS: File Management Device Management Disk Management Function Management Process management Error management Security management
Internal Commands or Memory-Resident Commands These commands are automatic loaded into the memory when operating system is loaded into the memory. Thus these are also called memory-resident commands. The command available is all combined together and are stored in Command.com file, which is an executable command file. These internal commands are as follows. General purpose commands 1. CLS:- This command is used to clear the screen or wipe out everything written on the screen. Syntax: - C:\> CLS and press Enter 2. DIR:- Dir command is used for listing files and directories present in the current disk. Syntax:- C:\> DIR 3. VER:- Version numbers indicates that which edition of DOS we are working on. Syntax:- C:\> VER press enter
Output:- C:\>VER

B.B.A. 1st Sem. Subject- Information Technology
45, Anurag Nagar, Behind Press Complex, Indore (M.P.) Ph.: 4262100, www.rccmindore.com 26
Windows 98 [Version 4.10.2222] 4. VOL:- Displays the disk volume label and serial number, if it exist. Syntax:- C:\> VOL press enter Output:-C:\>VOL Volume in drive C is JAI Volume Serial Number is 3E42-1907 5. DATE: - Display the current Date Syntax:- C:\> DATE C:\>DATE Current date is Fri 02-15-2002 Enter new date (mm-dd-yy): 6. TIME:- Display current time Syntax:- C:\> TIME C:\>TIME Current time is 8:38:47.70a Enter new time: File related commands 7. COPY CON:- This command gives the facility to create a new text file. Syntax:- C:\> COPY CON <Filename> C:\>COPY CON Rose.txt Anything u can write the data will be saved in a particular file^Z 1 file(s) copied 8. TYPE:- This command is used to display the contents or text of any file to the display device. Syntax:- C:\> TYPE <Filename> A:\>TYPE GULAB.TXT Anything u can write the data will be saved in a particular file 9. COPY :- Copy command is used for copy any file to another location or to copy the files to another directory. This command may also be used for copying any file to another disk with different file name. Syntax:- C:\> COPY <Source filename> <Target file name> C:\>COPY ROSE.TXT ROSE.MSG 1 file(s) copied 10. REN:- This command is used to change the name of any file or directory. Syntax:- C:\> REN <Source filename> <Target filename> C:\>REN ROSE.TXT GULBAL.TXT 11. DEL:- This command is used for erasing any file from the disk. Syntax:- C:\> DEL <Filename> C:\>DEL LOTUS.TXT Directory related commands 12. MD:- This command allows to create a new directory.

B.B.A. 1st Sem. Subject- Information Technology
45, Anurag Nagar, Behind Press Complex, Indore (M.P.) Ph.: 4262100, www.rccmindore.com 27
Syntax:- C:\> MD <Dirname> C:\> MD REPORT C:\> 13. CD:- We can enter or exit from any directory using this command. Syntax:- To access any directory C:\> CD <Directory name> C:\> CD REPORT C:\REPORT> 14. RD:- This command is used when we want to remove any unusable directory form our disk. Syntax:- C:\> RD <Directory name> C:\> RD REPORT 15. PATH:- This command is used for display or sets directories for executable files. Synatx:- C:\> PATH This command display current path settings. C:\> PATH=C:\WINDOWS\COMMAND;C:\WINDOWS\;C:\TC External commands External commands are known as Disk residence commands. Because they can be store with DOS directory or any disk, which is used for getting these commands. Theses commands help to perform some specific task. These are stored in a secondary storage device. Some important external commands are given below- 1. MORE:-Using TYPE command we can see the content of any file. But if length of file is greater than 25 lines then remaining lines will scroll up. To overcome through this problem we uses MORE command. Using this command we can pause the display after each 25 lines. Syntax:- C:\> TYPE <File name> | MORE C:\> TYPE ROSE.TXT | MORE or C:\> DIR | MORE 2. MEM:-This command displays free and used amount of memory in the computer. Syntax:- C:\> MEM the computer will display the amount of memory. 3. SYS:- This command is used for copy system files to any disk. The disk having system files are known as Bootable Disk, which are used for booting the computer. Syntax:- C:\> SYS [Drive name] C:\> SYS A: System files transferred This command will transfer the three main system files COMMAND.COM, IO.SYS, MSDOS.SYS to the floppy disk. 4. XCOPY:- When we need to copy a directory instant of a file from one location to another the we uses xcopy command. This command is much faster than copy command. Syntax:- C:\> XCOPY < Source dirname > <Target dirname> C:\> XCOPY TC TURBOC 5. MOVE:- Move command is used for moving one file or multiple files from one location to another location or from one disk to another disk. Syntax:- C:\> MOVE <file name> <path name> C:\SONGS> MOVE *.MP3 C:\ SONGS\OLD SONGS\ 6. FC:-This command is capable for comparing two set of files and display difference between two files.

B.B.A. 1st Sem. Subject- Information Technology
45, Anurag Nagar, Behind Press Complex, Indore (M.P.) Ph.: 4262100, www.rccmindore.com 28
Syntax:- C:\> FC <First set of file> <Second set of file> C:\> FC ROSE.TXT GULAB.TXT 7.CHKDSK:-- This command is used to check the status of a disk and show the report of result status. Syntax:- C:\> CHKDSK 8. SORT:- This command is useful when we want to sort a file. When we run this command the result can be get to display device or file. Syntax:- C:\> SORT /R < Input file name> <output file name> 9. FIND:- The FIND command is used to search a file for a text string. Syntax:- C:\> FIND "String to search" <File name> C:\TEST>find "office" gulab.txt ---------- gulab.txt Anything u can write the data will be saved in a particular file 10. DISKCOPY:- DISKCOPY copies the contents of a floppy disk to another. Syntax:- C:\> DISKCOPY <Drive1> <Drive2> C:\> DISKCOPY A: B: This command will be copy all contents of A drive to B drive. 11. ATTRIB:- Sets the various type of attribute to a file. Like Read only, Archive, Hidden and System attribute. Syntax:- C:\> ATTRIB [± r] [± a] [± h] [± s] <File name> here r - for read only, a- for archive, h - for hidden, s - for hidden attribute. C:\> ATTRIB +r Gulab.txt This command will change the attribute of file gulab.txt to read only mode. To remove the read only attribute we will follow this command. C:\> ATTRIB -r Gulab.txt 12. LABEL:- If you are not happy with the volume label of hard disk, you can change it. Syntax:- C:\> LABEL C:\>LABEL Volume in drive C is JAI Volume Serial Number is 3E42-1907 Volume label (11 characters, ENTER for none)? INFOWAY 13. DOSKEY:- Once we install doskey , our dos will star to memorize all commands we uses. We can recall those commands using up or down arrow keys. It also gives the facility to create macros, which creates a short key for long keyword or command. Syntax:- C:\> DOSKEY DOSKey installed 14. FORMAT:- This command creates new Track & Sectors in a disk. Every Syntax:- C:\> FORMAT [drive name] [/S] C:\> FORMAT A: this command will create new track & sectors. C:\> FORMAT A: /S This command will transfer system files after formatting the disk
Windows 7 Windows 7 is an operating system produced by Microsoft. It is used for use on personal computers; including home and business desktops, laptops, notebooks, tablet PCs, and media center PCs. It was released to manufacturing on July 22, 2009, and became generally available for retail worldwide on October 22, 2009, less than three years after the release of its predecessor, Windows Vista. Basic operations:-

B.B.A. 1st Sem. Subject- Information Technology
45, Anurag Nagar, Behind Press Complex, Indore (M.P.) Ph.: 4262100, www.rccmindore.com 29
Login and Logoff Creating a user account: -
To create a new user account move to the control panel then click create a new account, type the name. You will find two options that is the type of user they are standard and administrator.
Select the type then click create account. Changing user accounts
Once you create an account you can make changes in it, according to your need. Changes like:-
To change the account type Password-protecting an account
Using user accounts:- Every user has its own private document, pictures, music, video folders and also has
email account and internet favorites for storing files Introducing help and support : -
Windows 7 has built in help and support facility to provide the information when you need it.
To get help when you are in a program such as photo gallery, media player or other click help at the upper right corner of the screen.
If the program has menu bar , click help or press F1. Using the personalization page:-
You have many ways to personalize the page they are as follows: Right-click the desktop and choose personalize Press window key, type pers and click personalization In welcomecenter, double-click personalize windows. Click the start button and click control panel -> Appearance and
personalization-> personalization. Choosing a theme:-
A theme is collection of appearance settings that determine how things look on your screen.
To choose a theme, open the personalization window from the control panel. Select the one that attracts you.
Personalizing desktop back-ground:- You can also change your desktop background. In the personalization window click desktop background to open the desktop
background page and select the open Personalizing desktop icons
You can change the desktop icons. Just by clicking in the personalization window on change desktop icon (left column).
Select the check box for the one you want to see on desktop else deselect the other click ok.
Creating your own desktop icons You are free to create your own desktop icons. Most desktop icons are actually just
shortcuts to other places. Shortcut icons are unique in a couple of ways. Submenu:-
The open with submenu contains several options to open a file in various programs. Adjusting the font size:-
You can change the font size of the text or other items on the display to make the screen more readable.

B.B.A. 1st Sem. Subject- Information Technology
45, Anurag Nagar, Behind Press Complex, Indore (M.P.) Ph.: 4262100, www.rccmindore.com 30
To change text size, open a display item from the control panel or right click the desktop, choose screen resolution and then click make text and other items larger or smaller.
Personalizing the start menu:- The start button is the gateway to every program currently installed on your
computer. The start menu also provides easy access to commonly used folders such as
documents, computer, control panel and any other. The window 7 menu is split into two columns with icons for programs on the left and
icons for folders and other places on right. Opening taskbar and start menu properties:-
Use the start menu tab of the taskbar and start menu properties dialog box to personalize the appearance of your start menu and some of the options it displays. The ways you can open the dialog box are as follows:-
Right click the start button and choose properties Click the start menu type and click taskbar and start menu Click the start button and choose control panel->appearance- and
personalization->customize the start menu. Viewing your computer’s drives:-
There are different disk drives in the computer it is represented by the icons in the computer folder.
There are different ways to open the particular disk drives. The drives have different properties. The properties contain the name of the disk, the disk capacity, the free space available, the used disk and other.
You can change the disk name by right-click the drive and go to the properties. About folders About files
Utilities: Communication Utilities:-
Fishbowl Google talk Pidgin Skype Trillion
File Management:- 7-Zip Auslogics Disk Defrag Filezilla
Image and Video Utilities:- GIMP VLC Media Player IrfanView
Miscellaneous utilities:- 7stacks Adobe AIR Google Earth Windows Live Application
Music Utilities

B.B.A. 1st Sem. Subject- Information Technology
45, Anurag Nagar, Behind Press Complex, Indore (M.P.) Ph.: 4262100, www.rccmindore.com 31
iTunes Tagscanner Winamp
Productivity Utilities Ditto Notepad++ OpenOffice
Safety And Security Utilities:- Avira AntiVir Personal Edition Eraser KeePass Password Safe Malwarebytes anti-Malware
Web Browsers
Chrome Firefox Flock Opera Safari
Features:- The new features included in windows 7 are advancements in touch, speech and handwriting recognition, support for virtual hard disks, support for additional file formats improved performance of multi-care processors, improved boot performance and kernel improvements.
Theme Desktop Slideshow Start Menu The windows 7 taskbar Jump List Notification Area Aero Peek Libraries View Available Networks BranchCache Virtualization Enhancements HomeGroup

B.B.A. 1st Sem. Subject- Information Technology
45, Anurag Nagar, Behind Press Complex, Indore (M.P.) Ph.: 4262100, www.rccmindore.com 32
UNIT III UNIX
UNIX is an operating system. The operating system is the one manages the various parts of the computer like the processor, the on-board memory, the disk drives, keyboards, video monitors, etc. to perform the tasks. The operating system is the one that administrators, programmers, and users. When you want the computer to do something for you, like start a program, copy a file, or display the contents of a directory, it is the operating system that must perform those tasks for you. UNIX was created in the 1969, to provide a multiuser, multitasking system for use by programmers. The philosophy behind the design of UNIX was to provide simple, yet powerful utilities that could be pieced together in a flexible manner to perform a wide variety of tasks. History of Unix:- n late 1960’s Bell Lab had partnered with the Massachusetts Institute of Technology (MIT) and General Electric in a project to develop the first interactive, multi-user or multitasking OS for implementation on General Electric (GE) mainframe computer. This OS was named MULTICS (Multiplexed Information and Computing Services). The UNIX operating system consists of three parts:
The kernel The kernel of UNIX is the hub of the operating system. it is responsible to allocates time
and memory to programs and also handles the file store and communications in response to system calls.
The shell The shell acts as an interface between the user and the kernel. When a user logs in, the
login program checks the username and password, and then starts another program called the shell.
The shell is a command line interpreter (CLI). It interprets the commands the user types in and arranges for them to be carried out. The commands are themselves programs: when they terminate, the shell gives the user another prompt (% on our systems).
There are different shell program they are tch shell, korn shell, bash shell etc The standard utility programs file management (rm, cat, ls, rmdir, mkdir) user management (passwd, chmod, chgrp) process management (kill, ps) printing (lpr)

B.B.A. 1st Sem. Subject- Information Technology
45, Anurag Nagar, Behind Press Complex, Indore (M.P.) Ph.: 4262100, www.rccmindore.com 33
To ensure security and organization on a system with many users, UNIX machines employ a system of user accounts. The user accounting features of UNIX provide a basis for analysis and control of system resources, preventing any user from taking up more than his or her share, and preventing unauthorized people from accessing the system. Every user of a UNIX system must get permission by some access control mechanism. Types of Unix:- The most popular varieties of UNIX are Sun Solaris, GNU/Linux, and MacOS X. File and process:- All data in UNIX is organized into files. All files are organized into directories. These directories are organized into a tree-like structure called the filesystem. When you work with UNIX, one way or another you spend most of your time working with files. This tutorial would teach you how to create and remove files, copy and rename them, create links to them etc. In UNIX there are three basic types of files: 1. Ordinary file 2. Directory file 3. Fifo files 4. Special files ORDINARY FILE: A file consists of a stream of data that reside on magnetic media. It is also referred to as a regular file or an ordinary file. Unix system does not insist on any format. It includes binary programs, source code file and document files. All text files are also belonging to this type. Any text file in Unix contains a sequence of lines, with each line terminate by the LF (line feed) character (ASCII octal value ) or new line character. Generally , it is created by press enter key. Example: login, getty, init DIRECTORY FILE:

B.B.A. 1st Sem. Subject- Information Technology
45, Anurag Nagar, Behind Press Complex, Indore (M.P.) Ph.: 4262100, www.rccmindore.com 34
These are nodes that bind the file structure together. These look like branches in the tree. A directory file has a predefined format. A directory file contains two fields the name of file and pointer to a separate disk area, which contains the file’s attributes. For example, if a directory contains ten files, then there will be ten such entries in the directory file. These entries belong to the users file operations such as creation, deletion, modification, renaming and so on. When a file is created or removed the kernel automatically updates the directory file with the relevant information about the file. Example: usr,bin,etc,dev FIFO Files: These are typically used in applications where the communication path is in, or one direction, where several processes need to communicate with a single process, often called a Daemon process. These allow unrelated processes to communicate with one another. These look like leaves in the tree. Each process writes a message to the FIFO file, and the Unix system guarantees that each message will not be overwritten by messages from other processes. The Daemon process is reads from the FIFO file. SPECIAL FILES: These include I/O devices connected with Unix OS. These look likes leaves in the trees. The device file is special in the sense that any output directed to it will be reflected onto the respective i/o device associated with the filename when a process writes to a special file the data written is sent to the associated physical device. File names and device names may be used interchangeably. Devices are represented as files, file protections also apply to devices. Example: tape, disk, floppy drive, cd, and printer
1. Ordinary Files: An ordinary file is a file on the system that contains data, text, or program instructions. In this tutorial, you look at working with ordinary files.
2. Directories: Directories store both special and ordinary files. For users familiar with Windows or Mac OS, UNIX directories are equivalent to folders.
3. Special Files: Some special files provide access to hardware such as hard drives, CD-ROM drives, modems, and Ethernet adapters. Other special files are similar to aliases or shortcuts and enable you to access a single file using different names.
Everything in UNIX is either a file or a process. A process is an executing program identified by a unique PID (process identifier). A file is a collection of data. They are created by users using text editors, running
compilers etc. Characteristics of the Unix file system:- The following list describes the characteristics of the Unix file system. Hierarchical structure: Allows grouping of related information and efficient manipulation of these groups. Dynamic file growth: Files grow as needed, no advanced decisions have to be made about file sizes. Disk space is not wasted since only the amount required to store the current contents of the file is used. Structureless files: There is no internal structure imposed on the contents of a file. Any structure desired by the user can be used. Security: Un authorized users can be restricted from accessing a file. Device Independence: Input and Output from a device is processed as if it were in a file. Therefore, programs that process data in a file can also process data to and from a device. Examples of files:

B.B.A. 1st Sem. Subject- Information Technology
45, Anurag Nagar, Behind Press Complex, Indore (M.P.) Ph.: 4262100, www.rccmindore.com 35
a document (report, essay etc.) the text of a program written in some high-level programming language instructions comprehensible directly to the machine and incomprehensible to a casual
user, for example, a collection of binary digits (an executable or binary file); a directory, containing information about its contents, which may be a mixture of other
directories (subdirectories) and ordinary files. The Directory System: All the files are grouped together in the directory structure. The file-system is arranged in a hierarchical structure, like an inverted tree. The top of the hierarchy is traditionally called root. This is written as a slash /.
The full path to the file report.doc is "/home/its/ug1/ee51vn/report.doc"
Unix Command Syntax:- Commands are short two or three character names, and accept additional options that control their actions. • all commands have a similar format • commands are generally two or three characters long • commands are case sensitive (use lowercase) • options always proceed filenames • options are prefixed using a - symbol • the man command can be used to display the correct syntax UNIX Commands:- This is a very brief introduction to some useful UNIX commands.
Command Meaning
pwd display the path of the current directory
cp file1 file2 copy file1 and call it file2
cd directory change to named directory
cd change to home-directory
cd .. change to parent directory
cd ~ change to home-directory
rm file remove a file
B.B.A. 1st Sem. Subject- Information Technology
45, Anurag Nagar, Behind Press Complex, Indore (M.P.) Ph.: 4262100, www.rccmindore.com 36
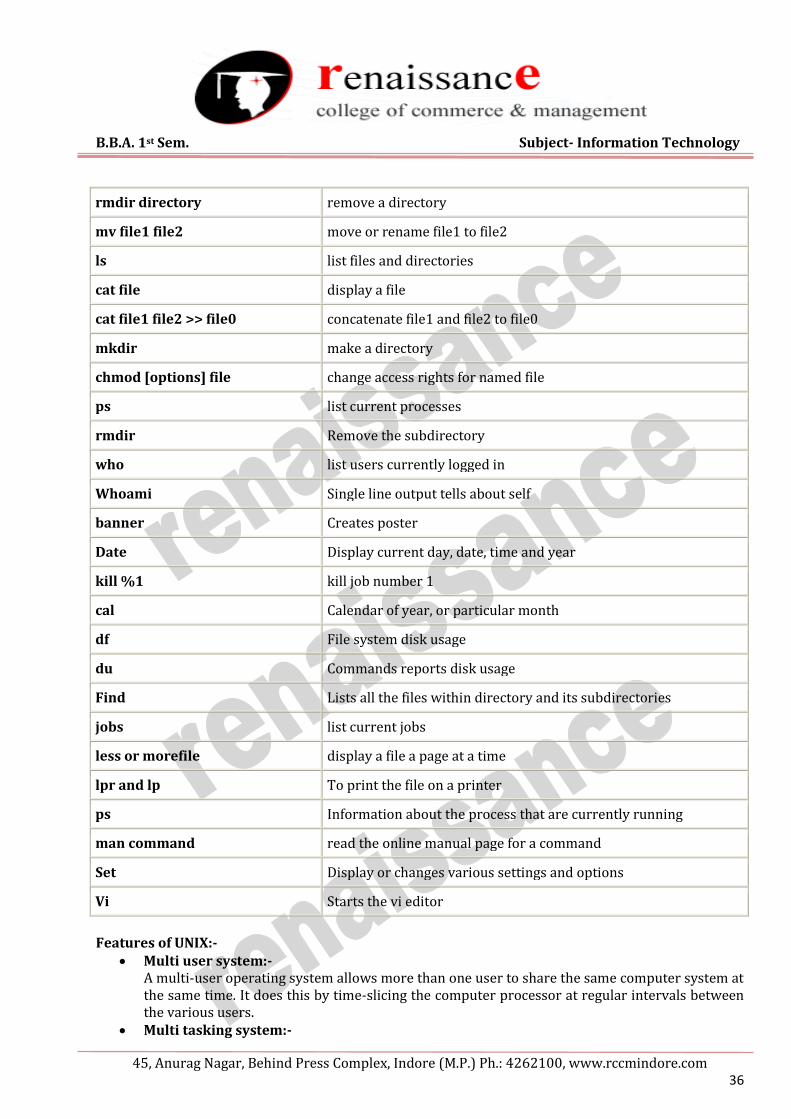
rmdir directory remove a directory
mv file1 file2 move or rename file1 to file2
ls list files and directories
cat file display a file
cat file1 file2 >> file0 concatenate file1 and file2 to file0
mkdir make a directory
chmod [options] file change access rights for named file
ps list current processes
rmdir Remove the subdirectory
who list users currently logged in
Whoami Single line output tells about self
banner Creates poster
Date Display current day, date, time and year
kill %1 kill job number 1
cal Calendar of year, or particular month
df File system disk usage
du Commands reports disk usage
Find Lists all the files within directory and its subdirectories
jobs list current jobs
less or morefile display a file a page at a time
lpr and lp To print the file on a printer
ps Information about the process that are currently running
man command read the online manual page for a command
Set Display or changes various settings and options
Vi Starts the vi editor
Features of UNIX:-
Multi user system:- A multi-user operating system allows more than one user to share the same computer system at the same time. It does this by time-slicing the computer processor at regular intervals between the various users.
Multi tasking system:-

B.B.A. 1st Sem. Subject- Information Technology
45, Anurag Nagar, Behind Press Complex, Indore (M.P.) Ph.: 4262100, www.rccmindore.com 37
Multi-tasking operating systems permit the use of more than one program to run at once. It does this in the same way as a multi-user system, by rapidly switching the processor between the various programs.
Security:- Unix has 3 inherent provisions for protecting data. i) Assign passwords and login name to users area. ii) Provide read, write and execute permission to each file. iii) Encrypt files into an unreadable format, and decrypting the file is also possible.
Portable:- Unix is a highly portable OS. It can be ported to a variety of hardware platforms. It is the only system which has been ported across various hardware platforms of major vendors such as IBM, DEC, HP and SUN. Most OSs are written for one specific machine or platform only.
Pattern matching:- A number of UNIX text-editing utilities let you search for, and in some cases change, text patterns rather than fixed strings.
The tool kit Programming facility System calls and libraries Windowing system

B.B.A. 1st Sem. Subject- Information Technology
45, Anurag Nagar, Behind Press Complex, Indore (M.P.) Ph.: 4262100, www.rccmindore.com 38
UNIT-IV Microsoft Word
Word processor A word processor is an electronic device or computer application software that performs word processing: the composition, editing, formatting and sometimes printing of any sort of written material. Word processing can also refer to advanced shorthand techniques, sometimes used in specialized contexts with a specially modified typewriter. The word processor emerged as a stand-alone office machine in the 1970s and 1980s, combining the keyboard text-entry and printing functions of an electric typewriter with a dedicated computer processor for the editing of text. Characteristics Word processing typically implies the presence of text manipulation functions that extend beyond a basic ability to enter and change text, such as automatic generation of:
batch mailings using form letter template and an address database (also called mail merging); indices of keywords and their page numbers; tables of contents with section titles and their page numbers; tables of figures with caption titles and their page numbers; cross-referencing with section or page numbers; footnote numbering; New versions of a document using variables (e.g. model numbers, product names, etc.)
Examples of different word processing software are:
WordPerfect Microsoft Word WordMark
Lotus WordPro Procedure Write
Types of word processor:-
Dedicated word processor Standard word processor software packages Word processing packages on minicomputer
Microsoft office Word:- Microsoft Office Button :- After clicking you get the Menu to create, open, save and perform other operations The Ribbon:- The Ribbon is the panel at the top portion of the document. It has seven tabs: Home, Insert, Page Layout, References, Mailings, Review, and View that contain many new and existing features of Word. Each of the tabs contains the following tools:
Home: Clipboard, Fonts, Paragraph, Styles, and Editing. Insert: Pages, Tables, Illustrations, Links, Header & Footer, Text, and Symbols Page Layout: Themes, Page Setup, Page Background, Paragraph, Arrange References: Table of Contents, Footnote, Citation & Bibliography, Captions, Index, and Table of
Authorities Mailings: Create, Start Mail Merge, Write & Insert Fields, Preview Results, Finish Review: Proofing, Comments, Tracking, Changes, Compare, Protect View: Document Views, Show/Hide, Zoom, Window, Macros

B.B.A. 1st Sem. Subject- Information Technology
45, Anurag Nagar, Behind Press Complex, Indore (M.P.) Ph.: 4262100, www.rccmindore.com 39
Ruler: - Can use to change the format of your document quickly. Text area: - The area for writing the document is called Text Area. Status Bar: - appears at the very bottom of your window and provides the information about the current page and number of words in your document. Scroll Bar: - you have two types of scroll bar i.e. horizontal and vertical scroll bar to move the document.
Formatting Features of Ms Word:-

B.B.A. 1st Sem. Subject- Information Technology
45, Anurag Nagar, Behind Press Complex, Indore (M.P.) Ph.: 4262100, www.rccmindore.com 40
The commonly used are as follows:- Bold and italic Underlined Font style Font size
Text color Indent Alignment
To format font size:
Select the text you wish to modify. Left-click the drop-down arrow next to the font size box on the Home tab. The font size drop-
down menu appears. Move your cursor over the various font sizes. A live preview of the font size will appear in the
document. Left-click the font size you wish to use. The font size will change in the document.
To format font style:
Select the text you wish to modify. Left-click the drop-down arrow next to the font style box on the Home tab. The font style
drop-down menu appears. Move your cursor over the various font styles. A live preview of the font will appear in the
document. Left-click the font style you wish to use. The font style will change in the document.
To format font color:
Select the text you wish to modify. Left-click the drop-down arrow next to the font color box on the Home tab. The font color
menu appears. Move your cursor over the various font colors. A live preview of the color will appear in the
document. Left-click the font color you wish to use. The font color will change in the document.
To use the bold, italic, and underline commands:
Select the text you wish to modify. Click the bold, italic, or underline command in the Font group on the Home tab.
To change the text case:
Select the text you wish to modify. Click the Change Case command in the Font group on the Home tab. Select one of the case options from the list.
To change text alignment:
Select the text you wish to modify. Select one of the four alignment options from the Paragraph group on the Home tab.
o Align Text Left: Aligns all of the selected text to the left margin. o Center: Aligns text an equal distance from the left and right margins. o Align Text Right: Aligns all of the selected text to the right margin. o Justify: Justified text is equal on both sides and lines up equally to the right and left
margins. Traditionally, many books, newsletters, and newspapers use full justification.

B.B.A. 1st Sem. Subject- Information Technology
45, Anurag Nagar, Behind Press Complex, Indore (M.P.) Ph.: 4262100, www.rccmindore.com 41
Working with text:- To insert text:
Move your mouse to the location you wish text to appear in the document. Left-click the mouse. The insertion point appears. Type the text you wish to appear.
To delete text:
Place your cursor next to the text you wish to delete. Press the Backspace key on your keyboard to delete text to the left of the cursor. Press the Delete key on your keyboard to delete text to the right of the cursor.
To select text:
Place the insertion point next to the text you wish to select. Left-click your mouse and while holding it down, drag your mouse over the text to select it. Release the mouse button. You have selected the text. A highlighted box will appear over the
selected text. When you select text or images in Word, a hover toolbar with formatting options appears. This makes formatting commands easily accessible, which can save you time. To copy and paste text:
Select the text you wish to copy. Click the Copy command on the Home tab. Place your insertion point where you wish the text to appear. Click the Paste command on the Home tab. The text will appear.
To drag and drop text:
Select the text you wish to copy. Left-click your mouse, and drag the text to the location you wish it to appear. The cursor will
have a text box underneath it to indicate that you are moving text.

B.B.A. 1st Sem. Subject- Information Technology
45, Anurag Nagar, Behind Press Complex, Indore (M.P.) Ph.: 4262100, www.rccmindore.com 42
Word Art Word Art are styles that can be applied to text to create a visual effect. To apply Word Art:-
Select text Click insert tab Click word Art Choose the Word Art
Select the Word Art Click the format tab from the drawing
tools Click Word Art button
Working with Header, Footers and Footnotes The header is a section of the document that appears in the top margin, while the footer is a section of the document that appears in the bottom margin. Headers and footers generally contain information such as page number, date, and document name. Header: - Header consists of text and graphics appears at the top of every page of a document. Footers: - Footers appears at the bottom of every page in the same document. For e.g.: - you can date page number, the time and date, a company logo, the document title. Steps to insert header and footers:- There are different options to inset header and footer they are as follows:-
Insert the same header or footer on each page Insert predefined header and footer Insert custom header and footer Make the first page header or footer different from the rest of the pages. Make the header or footer different for odd and even pages. Make the header or footer different in each section or chapter Use documents section breaks to vary the header or footer. Use the same header or footer across section boundaries Change the contents of a header or footer Insert a page number
To insert a header or footer:
Select the Insert tab. Click either the Header or Footer command. A menu appears with a list of built-in options you
can use. Left-click one of the built-in options, and it will appear in the document.
OR
Left-click Blank to select it.

B.B.A. 1st Sem. Subject- Information Technology
45, Anurag Nagar, Behind Press Complex, Indore (M.P.) Ph.: 4262100, www.rccmindore.com 43
The Design tab with Header and Footer tools is active.
Type information into the header or footer.
To insert the date or time into a header or footer: With the header or footer section active, click the Date & Time command.

B.B.A. 1st Sem. Subject- Information Technology
45, Anurag Nagar, Behind Press Complex, Indore (M.P.) Ph.: 4262100, www.rccmindore.com 44
Select a date format in the dialog box that appears. Click OK. The date and time now appear in the document.
Other header and footer options There are many other header and footer options you can use to design these sections of your document. From the Header and Footer Tools Design tab, you can see all of your design options. Footnotes and end notes:-
A footnote or an endnote consists of two linked parts — the note reference mark (note reference mark: A number, character, or combination of characters that indicates that additional information is contained in a footnote or endnote.) and the corresponding note text.
When you add, delete, or move notes that are automatically numbered, Word renumbers the footnote and endnote reference marks.
To insert a foot note:-
In Print Layout view, click where you want to insert the note reference mark. On the References tab, in the Footnotes group, click Insert Footnote or Insert Endnote. To make changes to the format of footnotes or endnotes, click the Footnotes Dialog Box
Launcher, and do one of the following: In the Number format box, click the format that you want. To use a custom mark instead of a traditional number format, click Symbol next to Custom
mark, and then choose a mark from the available symbols. Click Insert. Type the note text. Double-click the footnote or endnote number to return to the reference mark in the document.
Tables:- A table is a grid of cells arranged in rows and columns. Tables can be customized and are useful for various tasks such as presenting text information and numerical data. To convert existing text to a table:
Select the text you wish to convert. Select the Insert tab. Click the Table command. Select Convert Text to Table from the menu. A dialog box appears.

B.B.A. 1st Sem. Subject- Information Technology
45, Anurag Nagar, Behind Press Complex, Indore (M.P.) Ph.: 4262100, www.rccmindore.com 45
Choose one of the options in the Separate text at: section. This is how Word knows what text to
put in each column.
Click OK. The text appears in a table. To add a row above an existing row:
Place the insertion point in a row below the location where you wish to add a row. Right-click the mouse. A menu appears. Select Insert Insert Rows Above.
A new row appears above the insertion point. You can also add rows below the insertion point. Follow the same steps, but select Insert Rows Below from the menu. To add a column:
Place the insertion point in a column adjacent to the location where you wish the new column to appear.
Right-click the mouse. A menu appears. Select Insert Insert Columns to the Left or Insert Columns to the Right. A new column
appears. To delete a row or column:
Select the row or column. Right-click your mouse, and a menu appears. Select Delete Columns or Delete Rows.
To apply a table style:
Select the table. A Table Tools Design tab now appears on the Ribbon. Select the Design tab to access all of the Table Styles and Options. Click through the various styles in the Table Styles section. Left-click a style to select it. The table style will appear in the document.
You can modify which table styles are displayed. In the Table Styles Options, you can select and deselect various table options To insert a blank table:
Place your insertion point in the document where you want the table to appear.

B.B.A. 1st Sem. Subject- Information Technology
45, Anurag Nagar, Behind Press Complex, Indore (M.P.) Ph.: 4262100, www.rccmindore.com 46
Select the Insert tab. Click the Table command. Drag your mouse over the diagram squares to select the number of columns and rows in the
table. Left-click your mouse, and the table appears in the document. Enter text into the table.
Modify a table using the layout tab When you select a table in Word 2007, Design and Layout tabs appear under Table Tools on the Ribbon. Using commands on the Layout tab, you can make a variety of modifications to the table, including:
Adding and deleting columns Adding and deleting rows Changing the cell size
Aligning cell text Changing text direction Merging and splitting cells
Other Table handling Features:
Insert tables by insert table. Drawing a table Adding text into the table Formatting text within a table
Selecting a part of table Align table Inserting rows, columns, and cells
To insert a picture:
Place your insertion point where you want the image to appear. Select the Insert tab. Click the Picture command in the Illustrations group. The Insert Picture dialog box appears.
Select the image file on your computer. Click Insert, and it will appear in your document.

B.B.A. 1st Sem. Subject- Information Technology
45, Anurag Nagar, Behind Press Complex, Indore (M.P.) Ph.: 4262100, www.rccmindore.com 47
Left-click a corner sizing handle, and while holding down the mouse button resize the image. The image retains its proportions. To wrap text around an image:
Select the image. Select the Picture Tools Format tab. Click the Text Wrapping command in the Arrange group.
Left-click a menu option to select it. In this example, we selected Tight. Move the image around to see how the text wraps for each setting. The Position button has predefined text wrapping settings. The Position button is to the left of
the Text Wrapping button. Click the Position button, and a drop-down list of text wrapping options will appear. Hover over
an option to see what it does. If you can’t get your text to wrap the way you wish, click the Text Wrapping command, and select More Layout Options from the menu. You can make more precise changes in the Advanced Layout dialog box that appears. To crop an image:
Select the image. Select the Format tab. Click the Crop command. The black cropping handles appear. Left-click and move a handle to crop an image. Click the Crop command to deselect the crop tool. Corner handles will crop the image proportionally.
To compress a picture:
Select the picture. Select the Format tab. Click the Compress Pictures command in the Adjust group. A dialog box appears. Click the Options button to access the Compression Setting dialog box. Choose the target output. Change any of the default picture settings you wish. Click OK in the Compression Settings dialog box. Click OK in the Compress Pictures dialog box. You need to monitor the file size of your images and documents that include images, especially if you send them via email. Cropping and resizing an image doesn’t decrease the image file size, but compression does.
Other picture tools
There are many other things you can do to modify a picture. From the Format tab, some of the other useful commands include: Change Picture command: Selects a new picture from your computer. Reset Picture command: Reverts to original image. Brightness command: Adjusts the brightness of the image. Color command: Adjusts the contrast of the image from light to dark. Recolor command: Modifies the color in a variety of ways, including black and white,
sepia, pink, and purple.

B.B.A. 1st Sem. Subject- Information Technology
45, Anurag Nagar, Behind Press Complex, Indore (M.P.) Ph.: 4262100, www.rccmindore.com 48
To change the shape of a picture: Select the picture. Select the Format tab. Click the Picture Shape icon. A menu appears. Left-click a shape to select it.
To apply a picture style:
Select the picture. Select the Format tab. Click the More drop-down arrow to display all of the picture styles. Hover over a picture style to display a Live Preview of the style in the document. Left-click a style to select it.
To add a border to a picture manually:
Select the picture. Select the Format tab. Left-click the Picture Border commands, and selects a color. OR Select Weight from the menu and choose a line weight.
Adding clip art:
Select the Insert tab. Click the Clip Art command in the Illustrations group.
The Clip Art options appear in the task pane on the right. Enter keywords in the Search for: fields that are related to the image you wish to insert. Click the drop-down arrow next to the Search in: field. Select Everywhere to ensure that Word searches your computer and its online resources for an
image that meets your criteria. Click the drop-down arrow in the Results should be: field. Deselect any types of images you do not wish to see.

B.B.A. 1st Sem. Subject- Information Technology
45, Anurag Nagar, Behind Press Complex, Indore (M.P.) Ph.: 4262100, www.rccmindore.com 49
Click Go.
To insert Clip Art: Review the results from a Clip Art search. Place your insertion point in the document where you wish to insert the Clip Art. Left-click an image in the task pane. It will appear in the document.
OR Left-click the arrow next to an image in the task pane. Select Insert, Copy, or any of the other options on the list.

B.B.A. 1st Sem. Subject- Information Technology
45, Anurag Nagar, Behind Press Complex, Indore (M.P.) Ph.: 4262100, www.rccmindore.com 50
Adding Shapes: Click insert tab Click the shape button Choose the shape
Click on the document Drag the cursor to expand the shape.
Adding SmartArt:
Click insert tab Click SmartArt button Choose the Smartart
Click the SmartArt. Drag it to the desired location in
document Using a Template A template is a predesigned document you can use to create new documents with the same formatting. With a template, many of the big document design decisions such as margin size, font style and size, and spacing are predetermined. To insert a template:
Click the Microsoft Office Button. Select New. The New Document dialog box appears. Select Installed Templates to choose a template on your computer.
Review the available templates. Left-click a template to select it. Click Create, and the template opens in a new window.
Macros Macros are advanced features that can speed up editing or formatting you may perform often in a Word document. They record sequences of menu selections that you choose so that a series of actions can be completed in one step. Recording a Macro To record a Macro:
Click the View Tab on the Ribbon Click Macros Click Record Macro

B.B.A. 1st Sem. Subject- Information Technology
45, Anurag Nagar, Behind Press Complex, Indore (M.P.) Ph.: 4262100, www.rccmindore.com 51
Enter a name (without spaces) Click whether you want it assigned to a button (on the Quick Access Toolbar) or
the keyboard (a sequence of keys) To assign the macro a button on the Quick Access Toolbar:
Click Button Under the Customize Quick Access Toolbar, select the document for which you want
the Macro available Under Choose Commands: Click the Macro that you are recording Click Add Click OK to begin Recording the Macro Perform the actions you want recorded in the Macro Click on Macros Click on Stop Recording Macros
To assign a macro button to a keyboard shortcut: Click Keyboard In the Press New Shortcut Key box, type the key sequence that you want and
click Assign Click Close to begin recording the Macro Perform the actions you want recorded in the Macro Click on Macros Click on Stop Recording Macros
Running a Macro running a macro depends on whether it’s been added to the Quick Access Toolbar or if it’s been given a Keyboard Shortcut.
To run a Macro from the Quick Access Toolbar, simply click the Macro Icon To run a Macro from the Keyboard shortcut, simply press the keys that you have programmed
to run the Macro. Mail Merge Mail Merge is used to create and print letters and other documents, such as a form letter that is sent to many customers. Each letter has the same kind of information, yet the content is unique. For example, in letters to your customers, each letter can be personalized to address each customer by name. The unique information in each letter comes from entries in a data source. The mail merge process entails the following overall steps:
Set up the main document: - The main document contains the text and graphics that are the same for each version of the merged document — for example, the return address or salutation in a form letter.
Connect the document to a data source:-A data source is a file that contains the information to be merged into a document. For example, the names and addresses of the recipients of a letter.
Refine the list of recipients or items. Microsoft Office Word generates a copy of the main document for each item, or record, in your data file. If your data file is a mailing list, these items are probably recipients of your mailing. If you want to generate copies for only certain items in your data file, you can choose which items (records) to include.
Add placeholders, called mail merge fields, to the document. When you perform the mail merge, the mail merge fields are filled with information from your data file.
Preview and complete the merge. You can preview each copy of the document before you print the whole set.

B.B.A. 1st Sem. Subject- Information Technology
45, Anurag Nagar, Behind Press Complex, Indore (M.P.) Ph.: 4262100, www.rccmindore.com 52
You use commands on the Mailings tab to perform a mail merge. You can also perform a mail merge by using the Mail Merge task pane, which leads you step by step through the process. To use the task pane, in the Start Mail Merge group on the Mailings tab, click Start Mail Merge, and then click Step by Step Mail Merge Wizard.
Steps 1-3 Choose the type of document you wish to create. In this example, select Letters. Click Next: Starting document to move to Step 2. Select Use the current document. Click Next: Select recipients to move to Step 3. Select the Type a new list button. Click Create to create a data source. The New Address List dialog box appears.
o Click Customize in the dialog box. The Customize Address List dialog box appears. o Select any field you do not need and click Delete. o Click yes to confirm that you wish to delete the field. o Continue to delete any unnecessary fields. o Click Add. The Add Field dialog box appears. o Enter the new field name. o Click OK. o Continue to add any fields necessary. o Click OK to close the Customize Address List dialog box.
To Customize the New Address List: Enter the necessary data in the New Address List dialog box. Click New Entry to enter another record. Click Close when you have entered all your data records. Enter the file name you wish to save the data list as. Choose the location you wish to save the file. Click Save. The Mail Merge Recipients dialog box appears and displays all the data records in
the list. Confirm the data list is correct and click OK. Click Next: Write your letter to move to Step 4.
Steps 4-6
Write a letter in the current Word document, or use an open, existing document. To Insert Recipient Data from the List:
o Place the insertion point in the document where you wish the information to appear. o Select Address block, Greeting line, or Electronic postage from the task pane. A dialog box
with options will appear based on your selection. OR
o Select More Items. The Insert Merge Field dialog box will appear. o Select the field you would like to insert in the document. o Click Insert. Notice that a placeholder appears where information from the data record will
eventually appear. o Repeat these steps each time you need to enter information from your data record.
Click Next: Preview your letters in the task pane once you have completed your letter. Preview the letters to make sure the information from the data record appears correctly in the
letter. Click Next: Complete the merge. Click Print to print the letters. Click All.

B.B.A. 1st Sem. Subject- Information Technology
45, Anurag Nagar, Behind Press Complex, Indore (M.P.) Ph.: 4262100, www.rccmindore.com 53
Click OK in the Merge to Printer dialog box. Click OK to send the letters to the printer.
The Mail Merge wizard allows you to complete the mail merge process in a variety of ways. MS ACCESS 2007 Access 2007 is the database software in the Microsoft 2007 Office Suite. It allows you to order, manage, search, and report large amounts of information. What is a Database? A database is a collection of related data. The database stores information. This information can be manipulated and viewed in many different ways. A Database Management program such as Access stores information in tables that are related to each other. It is primarily designed for two main purposes:
To store, add, delete, and update the data in the database. To provide various ways to view the data in the database. For example, you can display data on
your screen in a form or print out a report. Some examples are:
Store and/or query information on applicants, training or programs. Query or extract information on donors and donations made to the college and produce reports. Store a list of students, addresses for a mail merge. Personnel database with separate but related tables for employees, departments and payroll
information. Databases allow us to organize, manipulate, analyze information and create reports. Getting Started with Microsoft Access 2007
1. Go to Start- All Programs-Microsoft Office-Microsoft Access 2007. 2. Create a New Blank database, choose from a Template, or open an existing database. The Blank Database choice allows you to create your own database from scratch. 3. Open Recent Databases displays a list of currently opened databases from which you can choose, or select “More” to navigate and select a database in the Open dialog box.
The database can be created using following:-
Using Blank database Using a templates

B.B.A. 1st Sem. Subject- Information Technology
45, Anurag Nagar, Behind Press Complex, Indore (M.P.) Ph.: 4262100, www.rccmindore.com 54
The steps to create the database using blank database:- 1. Start Microsoft Access. 2. To create a new database, click the Blank Database button. 3. Click the Create button.
The steps to create the database using template- 1. Start Microsoft Access. 2. To create a new database, click in the Template Categories pane. 3. Click the Create button.
Access Database Objects The following table describes the objects you can have in an Access database. Tables A Table stores a collection of related information organized in columns (fields) and
rows (records). Queries A query is used to extract specific information from your table(s). A Query takes
information from the selected tables and displays a subset of data that meets your criteria.
Forms A form is a graphical representation used to enter or view data into a table. Reports Presents data from a query or table and places it in neat, organized and readable form.
Creating a Table When we open a new database, the first table will be created automatically. To insert another new table: • Select the Create tab • Click the Table button Access has two main working views:
Design View is used to construct the framework of the database, e.g. specifying field names, defining queries and creating forms
Datasheet View is used to manipulate the database, e.g. to add or edit data, view records or run queries
To switch between views: Right-click on the name at the top of the table and select the view that is required.
Adding field categories In Design View, the first column is for your field names, for example surname, first name, address etc. These will appear across the top of your database table. The second column refers to Data Type. You must define the type of data that the field will hold, e.g. text, number, date etc. The third column is for providing a description of the field. This is optional, but it can be useful to provide more information about expected data types or format.

B.B.A. 1st Sem. Subject- Information Technology
45, Anurag Nagar, Behind Press Complex, Indore (M.P.) Ph.: 4262100, www.rccmindore.com 55
To add fields to a table:
1. Click the Add New Field column label. 2. Activate the Datasheet tab. 3. Click Rename in the Fields & Columns group. 4. Type the field name. 5. Press Enter. Access creates the field. 6. Type the next field name. Access creates the field. Continue until you have created all of the
fields in your table. 7. Press Enter without entering a field name to end your entries.
Or 1. Right-click the Add New Field column label. A menu appears. 2. Click Rename Column. 3. Type the field name. 4. Press Enter. Access creates the field. 5. Type the next field name. Access creates the field. Continue until you have created all of the
fields in your table. Name and Save a Table After you create a table, you must name and save it. To name and save a table:
1. Click the Save button on the Quick Access toolbar. The Save As dialog box appears. 2. Type the name you want to give your table. 3. Click OK. Access names your table.

B.B.A. 1st Sem. Subject- Information Technology
45, Anurag Nagar, Behind Press Complex, Indore (M.P.) Ph.: 4262100, www.rccmindore.com 56
To create a form:
1. Open the Navigation pane. 2. Click the table or query on which you want to base your form. 3. Activate the Create tab. 4. Click Form in the Forms group. Access creates a form.
To save a form:
1. Click the Save button on the Quick Access toolbar. Access saves the form unless you are saving for the first time. If you are saving for the first time, the Save As dialog box appears.
2. Type the name you want to give the form. 3. Click OK. Access saves the form. You can now access the form by using the Navigation pane.
To create a split form:
1. Open the Navigation pane. 2. Click the table or query on which you want to base your form.
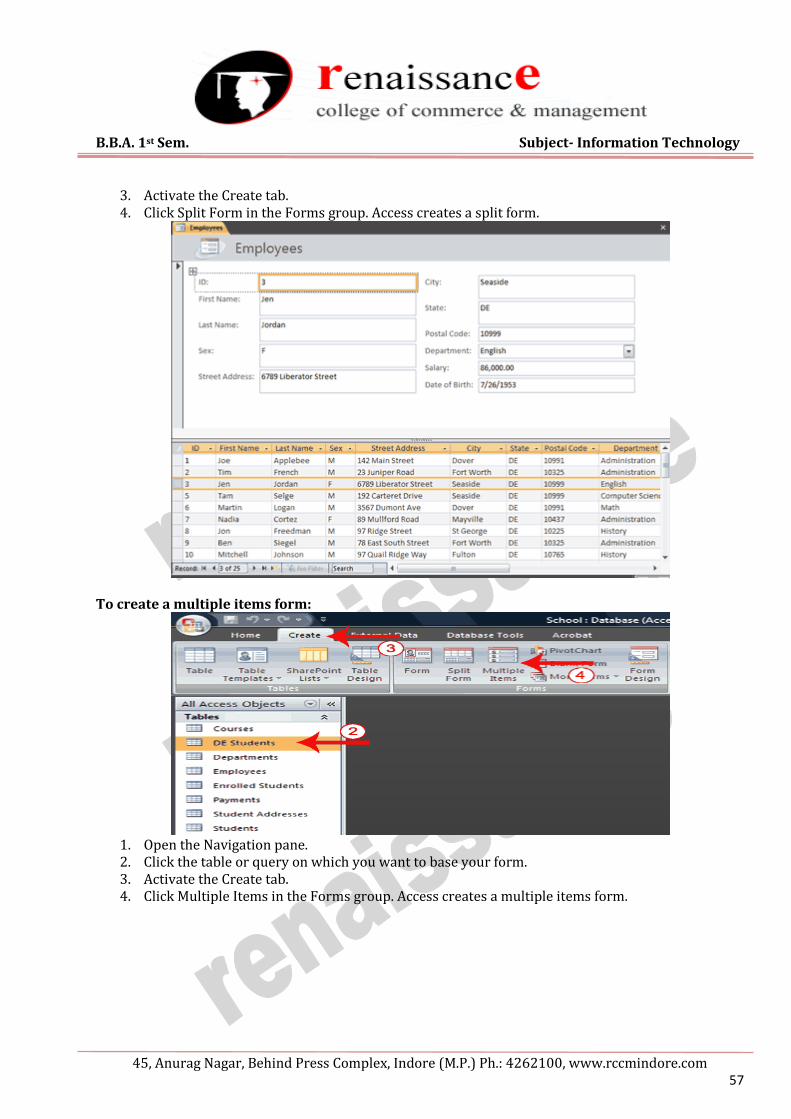
B.B.A. 1st Sem. Subject- Information Technology
45, Anurag Nagar, Behind Press Complex, Indore (M.P.) Ph.: 4262100, www.rccmindore.com 57
3. Activate the Create tab. 4. Click Split Form in the Forms group. Access creates a split form.
To create a multiple items form:
1. Open the Navigation pane. 2. Click the table or query on which you want to base your form. 3. Activate the Create tab. 4. Click Multiple Items in the Forms group. Access creates a multiple items form.
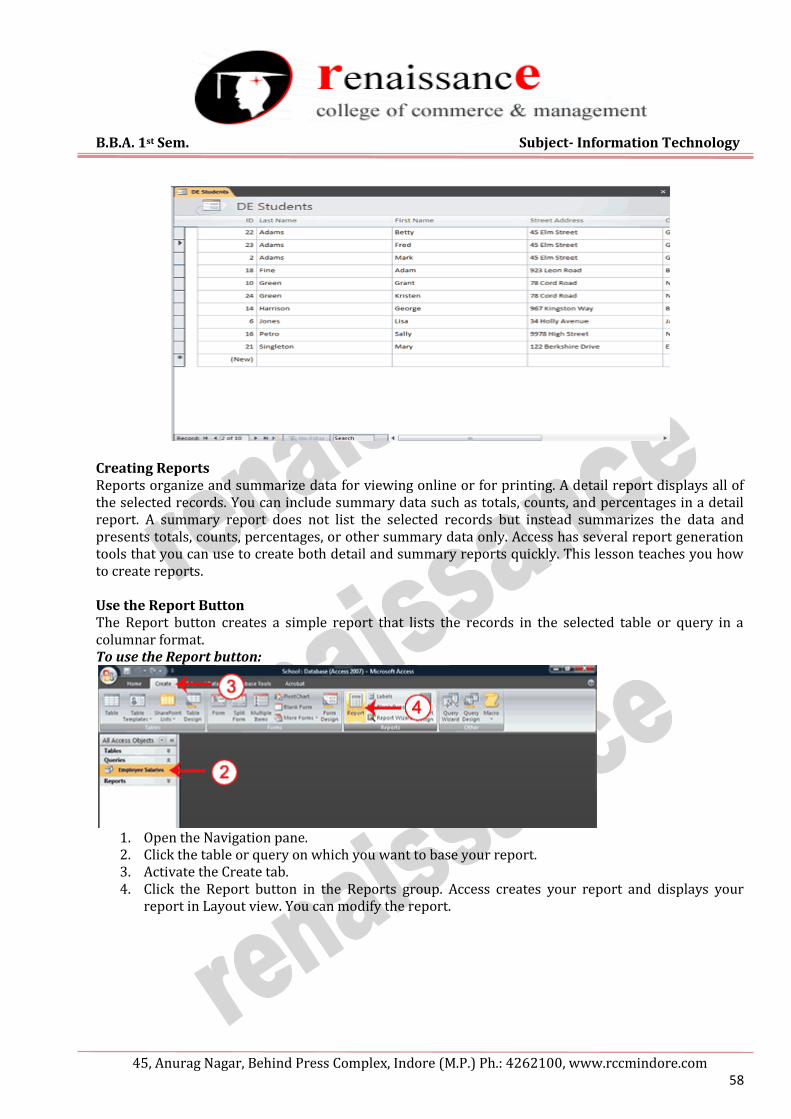
B.B.A. 1st Sem. Subject- Information Technology
45, Anurag Nagar, Behind Press Complex, Indore (M.P.) Ph.: 4262100, www.rccmindore.com 58
Creating Reports Reports organize and summarize data for viewing online or for printing. A detail report displays all of the selected records. You can include summary data such as totals, counts, and percentages in a detail report. A summary report does not list the selected records but instead summarizes the data and presents totals, counts, percentages, or other summary data only. Access has several report generation tools that you can use to create both detail and summary reports quickly. This lesson teaches you how to create reports. Use the Report Button The Report button creates a simple report that lists the records in the selected table or query in a columnar format. To use the Report button:
1. Open the Navigation pane. 2. Click the table or query on which you want to base your report. 3. Activate the Create tab. 4. Click the Report button in the Reports group. Access creates your report and displays your
report in Layout view. You can modify the report.

B.B.A. 1st Sem. Subject- Information Technology
45, Anurag Nagar, Behind Press Complex, Indore (M.P.) Ph.: 4262100, www.rccmindore.com 59
Use the Report Wizard You can also use the Report Wizard to create a report. The Report Wizard provides you with more flexibility than you get by using the Report button. You can choose the tables and fields, group the data, sort the data, summarize the data, choose a layout and orientation, apply a style, and title your report. Follow the steps shown here to create a report by using the Report Wizard: To create a report by using the Report Wizard: Open the Report Wizard
1. Activate the Create tab. 2. Click Report Wizard in the Reports group. The Report Wizard appears.
Select tables, queries and fields When using the Report Wizard, you can use fields from multiple tables and/or queries if the tables/queries have a relationship.

B.B.A. 1st Sem. Subject- Information Technology
45, Anurag Nagar, Behind Press Complex, Indore (M.P.) Ph.: 4262100, www.rccmindore.com 60
1. Click the down-arrow next to the Table/Queries field and then click the table from which you want to select fields.
2. Click a field and then click the single-right arrow to select a single field, click the double-right arrows to select all fields, click a field and then click the single-left arrow to deselect a single field, or click the double-left arrow to deselect all fields.
3. Repeat steps 1 and 2 for each table from which you want to select fields. 4. Click Next. The Report Wizard moves to the next page.
Group When using the Report Wizard, you can group data. Grouping puts all of the values in a field into a group based on the field’s value. For example, if your data is grouped by the Department field and the records in the Department field have values such as Administration, Computer Science, and English. Access will group all of the data for the Administration department together, all of the data for the Computer Science department together, and all of the data for the English department together.
1. Click to select the field by which you want to group your data. You may not see this page of the
wizard if you are selecting data from a single table. 2. Click Next. The Report Wizard moves to the next page.

B.B.A. 1st Sem. Subject- Information Technology
45, Anurag Nagar, Behind Press Complex, Indore (M.P.) Ph.: 4262100, www.rccmindore.com 61
3. Click a field you want to group by. 4. Click the right-arrow to select a field; click a field and then click the left arrow to deselect a field.
Use the up- and down-arrows to change the order of the groupings. If you are only using one table, this may be your first opportunity to select a field to group by.
5. Repeat steps 3 and 4 for each field you want to group by. 6. Click Next. The Report Wizard moves to the next page.

B.B.A. 1st Sem. Subject- Information Technology
45, Anurag Nagar, Behind Press Complex, Indore (M.P.) Ph.: 4262100, www.rccmindore.com 62
UNIT-V MS Excel 2007
Excel Basics:- Excel 2007 is the spreadsheet software in the Microsoft 2007 Office Suite. It allows you to store, organize, and analyze numerical and text data. Ribbons Located where taskbars used to be, ribbons graphically display the changing features as you click on the menu-bar tabs. It may be take you time to adjust to the new locations of familiar options, but ribbons may expose you to new commands and tools. The Ribbon provides you the below tabs:-
Home:- Change the Font, Paragraph and Heading styles and view the clipboard and editing options
Insert:- Insert pages, tables, illustrations, links, headers, footers, text and symbols Page Layout:- Alter page setup, background, themes, paragraph properties, and arrangement of
document Formulas:- Insert functions and create custom formulas. Data:- Get external data, sort, filter, and outline existing. Review:- Use proofing techniques, insert comments, track changes, compare and protect
documents View:- Change document and window layout, show/hide thumbnails, and view/record macros Add-Ins:- Customize toolbars
Above the Ribbon in the upper-left corner is the Microsoft Office Button. From here, you can access important options such as New, Save, Save As, and Print. By default, the Quick Access Toolbar is pinned next to the Microsoft Office Button and includes commands such as Undo and Redo. At the bottom-left area of the spreadsheet, you will find worksheet tabs. By default, three worksheet tabs appear each time you create a new workbook. On the bottom-right area of the spreadsheet you will find page view commands, the zoom tool, and the horizontal scrolling bar.
To change page views:
Locate the Page View options in the bottom-right corner. The Page View options are Normal, Page Layout, and Page Break.
Left-click an option to select it.
“The default is Normal View.” To add commands to the Quick Access Toolbar:
Click the arrow to the right of the Quick Access Toolbar. Select the command you wish to add from the drop-down list. It will appear in the Quick Access
Toolbar. Spreadsheets and Workbooks A spreadsheet is a grid of data divided into numbered rows and lettered columns. Each block in this grid is called a cell, and it can hold an individual piece of text or data. In Excel, a file/document is considered a spreadsheet, although it is commonly referred to as a workbook.

B.B.A. 1st Sem. Subject- Information Technology
45, Anurag Nagar, Behind Press Complex, Indore (M.P.) Ph.: 4262100, www.rccmindore.com 63
Worksheets The worksheet is a page of data in your spreadsheet (or workbook) that is organized by the labeled tabs displayed at the bottom of the Excel window. • Your spreadsheet can contain as many worksheets as you want. By default, however, all newly opened Excel spreadsheets have three worksheets. • To view the contents of a worksheet, click on its tab. Create or delete an Excel table in a worksheet A worksheet consists of cells that are organized into columns and rows; a worksheet is always stored in a workbook. The primary document that you use in Excel is to store and work with data. It is also called a spreadsheet. You can manage and analyze the data in that table independently of data outside the table Create a table You can use one of two ways to create a table. You can either insert a table in the default table style or you can format your data as a table in a style that you choose. Insert a table
1. On a worksheet, select the range of cells that you want to include in the table. The cells can be empty or can contain data.
2. On the Insert tab, in the Tables group, click Table. Keyboard shortcut:- You can also press CTRL+L or CTRL+T.
3. If the selected range contains data that you want to display as table headers, select the My table has headers check box.
Format data as a table
1. On the worksheet, select a range of empty cells or cells that contain the data that you want to quickly format as a table.
2. On the Home tab, in the Styles group, click Format as Table. 3. Under Light, Medium, or Dark, click the table style that you want to use.
Convert a table to a range of data
1. Click anywhere in the table. 2. On the Design tab, in the Tools group, click Convert to Range. Delete a table
On a worksheet, select a table. Press DELETE.
To create a new, blank workbook:
Left-click the Microsoft Office Button. Select New:- The New Workbook dialog box opens, and Blank Workbook is highlighted
by default. Click Create:- A new, blank workbook appears in the window.

B.B.A. 1st Sem. Subject- Information Technology
45, Anurag Nagar, Behind Press Complex, Indore (M.P.) Ph.: 4262100, www.rccmindore.com 64
To insert text: Left-click a cell to select it. Each rectangle in the worksheet is called a cell. As you select a cell,
the cell address appears in the Name Box. Enter text into the cell using your keyboard. The text appears in the cell and in the formula bar.
Cell addresses Each cell has a name, or a cell address, based on the column and row where it is located. For example, this cell is C3 because it is where column C and row 3 intersect.
To edit or delete text:
Select the cell. Press the Backspace key on your keyboard to delete text and make a correction. Press the Delete key to delete the entire contents of a cell.
To save the workbook: Left-click the Microsoft Office Button. Select Save or Save As. Save As allows you to name the file and choose a location to save the spreadsheet. Choose Save
As if you'd like to save the file for the first time or if you'd like to save the file as a different name.
Select Save if the file has already been named. Formatting Your Spreadsheet
Inserting Columns Inserting Rows Deleting Columns Deleting Rows Resizing Columns Resizing rows
Excel formatting tips and techniques:- There are many formatting tools some are explained below:- To format text in bold or italics:
Left-click a cell to select it, or drag your cursor over the text in the formula bar to select it. Click the Bold or Italics command.
To format text as underlined:
Select the cell or cells you want to format.

B.B.A. 1st Sem. Subject- Information Technology
45, Anurag Nagar, Behind Press Complex, Indore (M.P.) Ph.: 4262100, www.rccmindore.com 65
Click the drop-down arrow next to the Underline command. Select the Single Underline or Double Underline option.
To change the font style
Select the cell or cells you want to format. Left-click the drop-down arrow next to the Font Style box on the Home tab. Select a font style from the list.
To change the font size:
Select the cell or cells you want to format. Left-click the drop-down arrow next to the Font Size box on the Home tab. Select a font size from the list.
To change the text color:
Select the cell or cells you want to format. Left-click the drop-down arrow next to the Text Color command. A color palette will appear. Select a color from the palette.
Introduction to functions:- A function is a predefined formula that performs calculations using specific values in a particular order. While you may think of formulas as being short mathematical equations, like 2+2 or F2*C2, they can actually be very lengthy and involve complex mathematical calculations. One of the key benefits of functions is that they can save you time because you do not have to write the formula yourself. For example, you could use an Excel function called Average to quickly find the average of a range of numbers or the Sum function to find the sum of a cell range. The parts of a function: Each function has a specific order, called syntax, which must be strictly followed for the function to work correctly. Syntax order:
1. All functions begin with the = sign. 2. After the = sign, define the function name (e.g., Sum). 3. Then there will be an argument. An argument is the cell range or cell references that are
enclosed by parentheses. If there is more than one argument, separate each by a comma. An example of a function with one argument that adds a range of cells, A3 through A9:
An example of a function with more than one argument that calculates the sum of two cell ranges: Excel's different functions There are many different functions in Excel 2007. Some of the more common functions include: Statistical functions: SUM: Adds a range of cells together AVERAGE: Calculates the average of a range of cells COUNT: Counts the number of chosen data in a range of cells MAX: Identifies the largest number in a range of cells

B.B.A. 1st Sem. Subject- Information Technology
45, Anurag Nagar, Behind Press Complex, Indore (M.P.) Ph.: 4262100, www.rccmindore.com 66
MIN: Identifies the smallest number in a range of cells Financial functions: Interest rates Loan payments Depreciation amounts Date and time functions: DATE: Converts a serial number to a day of the month Day of Week DAYS360: Calculates the number of days between two dates based on a 360-day year TIME: Returns the serial number of a particular time HOUR: Converts a serial number to an hour MINUTE: Converts a serial number to a minute TODAY: Returns the serial number of today's date MONTH: Converts a serial number to a month YEAR: Converts a serial number to a year Chart:- A chart is a tool you can use in Excel to communicate your data graphically. Charts allow your audience to more easily see the meaning behind the numbers in the spreadsheet, and to make showing comparisons and trends much easier. In this lesson, you will learn how to insert and modify Excel charts and see how they can be an effective tool for communicating information. Creating a chart Charts can be a useful way to communicate data. When you insert a chart in Excel, it appears in the selected worksheet with the source data by default. To create a chart:
Select the cells you want to chart, including the column titles and row labels. Click the Insert tab. Select one of the Chart options. Select a type of chart from the list that appears. The chart appears in the worksheet.
The real power in Excel lies in its ability to perform multiple mathematical calculations for you. One of the tools in Excel that you can use to perform these calculations is a Data tool called what-if analysis also known as Goal Seek. What-if analysis allows you to see the effect different values have in formulas. What-If Analysis Tools There are three What-If analysis tools that you can use. To access these, select the Data tab and locate the What-If Analysis command. If you click this command, a menu with three options appears. Goal seek is useful if you know the needed result but need to find the input value that will give you the

B.B.A. 1st Sem. Subject- Information Technology
45, Anurag Nagar, Behind Press Complex, Indore (M.P.) Ph.: 4262100, www.rccmindore.com 67
desired result. In this example, we know the desired result (a $400 monthly payment) and are seeking the input value (the interest rate). Goal Seek To Use Goal Seek to Determine an Interest Rate:
Select the Data tab. Locate the Data Tools group. Click the What-If Analysis command. A list of three options appears.
Select Goal Seek. A small dialog box appears. Select the cell that you want to set to a specific value. In this example, we want to set B5, the
Payment cell.
Insert the cursor in the next field. Enter a value in the value field. In this example, type -$400. Since we’re making a payment that
will be subtracted from our loan amount, we have to enter the payment as a negative number.

B.B.A. 1st Sem. Subject- Information Technology
45, Anurag Nagar, Behind Press Complex, Indore (M.P.) Ph.: 4262100, www.rccmindore.com 68
Insert the cursor in the next field. Select the cell that you want to change. This will be the cell that tries various input values. In this
example, select cell B4, which is the interest rate.
Click OK. Then, click OK again. The interest rate appears in the cell. This indicates that a 7% interest rate
will give us a $400 a month payment on a $20,000 loan that is paid off over five years, or 60 months.
Working with graphic:- Microsoft Office Excel 2007 gives you the tools to create a variety of graphic objects—boxes, lines, circles, ovals, arcs, freeform polygons, text boxes, buttons, and a wide assortment of complex predefined shapes, clip art, and the new SmartArt graphics. Using the Shapes tools The Excel graphics tool chest contains many of the powerful capabilities of dedicated illustration programs. Using only the tools in the Shapes palette on the Ribbon, you can create lines, rectangles, and ovals; smooth and freeform curves; linked objects using connectors; basic and not-so-basic shapes, such as pentagons and lightning bolts; a variety of straight, curved, three-dimensional (3-D), and multiheaded arrows; stars, emblems, and banners; and even a variety of callouts. Creating WordArt The WordArt button on the Insert tab opens a palette containing a number of fancy text styles you can employ to create impressive logos and headings. After you click the effect you want in the palette, a new WordArt graphic object appears on the worksheet. You can then type your text and modify the WordArt object using controls on the Format tab under Drawing Tools; this tab appears on the Ribbon when you select the WordArt object.

B.B.A. 1st Sem. Subject- Information Technology
45, Anurag Nagar, Behind Press Complex, Indore (M.P.) Ph.: 4262100, www.rccmindore.com 69
Creating SmartArt The SmartArt button on the Insert tab represents a significant new set of features in the 2007 Microsoft Office system. SmartArt replaces the Organization Chart feature with all that and more—a comparative cornucopia of new functionality and graphic complexity. SmartArt graphics are prepackaged sets of graphic objects designed to address a variety of presentation tasks, such as creating timelines and decision trees, illustrating procedural steps and relationships, and, yes, even creating organizational charts.
MS POWERPOINT 2007
Microsoft Office Button: The Microsoft Office button appears in the top left corner of the window and includes basic file functions such as New, Open, Save, and Print. Tabs: The many buttons and menu options required to create and edit presentations are grouped into seven distinct categories and accessible from tab-like buttons which appear across the top of the window. Ribbon: The ribbon contains the buttons and menu options specific to each tab for creating and editing presentations. Current Slide: The current slide appears in the middle of the screen and contains the contents of a particular PowerPoint slide. Outline or Slides Tab: The Slides tab displays thumbnails of all slides in a presentation. The Outline tab displays an automatically generated outline of the presentation. Help button: The help button in the top right corner of the window provides access to an index of help topics as well as a key-word search of the extensive help files.
Lower Toolbar: The lower toolbar allows easy toggling between viewing options and also displays the number of the slide currently on screen.
Tabs and the Ribbon The ribbon includes seven tabs to choose from. After selecting a tab, the ribbon will automatically update to display the appropriate menu options and buttons. The menu options and buttons are grouped by functional category into distinct toolbars.

B.B.A. 1st Sem. Subject- Information Technology
45, Anurag Nagar, Behind Press Complex, Indore (M.P.) Ph.: 4262100, www.rccmindore.com 70
More Options button to display a pop-up window with the full set of menu options and buttons for that category. The More Options button is square-shaped with an arrow.
Home Tab The Home tab includes basic functions for creating and manipulating a presentation. The toolbars that make up the Home tab include Clipboard, Slides, Font, Paragraph, Drawing, and Editing. Example menu and button options include copying and pasting, adding a new slide, adjusting fonts and paragraph formatting, and basic drawing features.
Insert Tab Use the Insert tab to add a wide variety of content into a presentation including tables, charts, images, links, text boxes, audio, and video. The toolbars that make up the Insert tab include Tables, Illustrations, Links, Text, and Media Clips.
Design Tab The Design tab provides a variety of options for designing and formatting a presentation. Use the Design tab to manipulate the page setup, color themes, and backgrounds of a presentation. The toolbars that make up the Design tab include Page Setup, Themes, and Background.
Animations Tab Use the Animations tab to add, customize, and preview animations and transitions between slides. The toolbars that make up the Animations tab include Preview, Animations, and Transition to This Slide.
Slide Show Tab Manage the settings for showing a presentation with the Slide Show tab. The toolbars that make up the Slide Show tab include Start Slide Show, Set Up, and Monitors.

B.B.A. 1st Sem. Subject- Information Technology
45, Anurag Nagar, Behind Press Complex, Indore (M.P.) Ph.: 4262100, www.rccmindore.com 71
Review Tab The Review tab provides access to proofing features like spell check and also allows for embedding comments in a presentation. The toolbars that make up the Review tab include Proofing and Comments.
View Tab The View tab presents a number of options to specify how to view a presentation such as hiding or displaying notes, hiding or displaying gridlines, zooming in and out, displaying in gray scale, and more. The toolbars that make up the View tab include Presentation Views, Show/Hide, Zoom, Color/Grayscale, Window, and Macros.
Create a New Presentation To create a new presentation,
Click the Microsoft Office button and select New. The New Presentation pop-up window will appear, Choose to start with one of Microsoft’s Installed Templates, Installed Themes, or a Blank presentation to create a customized presentation.
Click the Installed Themes menu option to browse through the available graphical themes. Select one that will work for the presentation.
Click the Create button in the lower right-hand corner. Or To create a completely custom-designed presentation,
Select the Blank and recent menu option. Click the Blank Presentation button and then the Create button in the lower right-hand
corner.

B.B.A. 1st Sem. Subject- Information Technology
45, Anurag Nagar, Behind Press Complex, Indore (M.P.) Ph.: 4262100, www.rccmindore.com 72
Design a Presentation PowerPoint includes a number of ready-made design themes. These themes serve as the basis for the graphic design of a presentation. Each theme consists of a background design, placeholder layouts, a color palette, and font styles. To browse through the available themes, click the Design tab in the ribbon.. Click a particular theme to apply it to the presentation.
To skip the ready-made themes in order to create a custom-designed presentation,
Select the Design tab in the ribbon. Click the Background Styles menu to choose the background. Click the Colors, Fonts, and Effects menus in the Themes toolbar to customize the design of the
presentation. To customize a ready-made theme, click an element within a slide. Select the Design tab and then choose from the various options available from the Colors, Fonts,
and Effects menus in the Themes toolbar. Adjust the Background using the Background Styles menu in the Background toolbar.
Insert a New Slide To insert a new slide into a presentation,
Click the Home tab in the ribbon. In the Slides toolbar, select the New Slide button

B.B.A. 1st Sem. Subject- Information Technology
45, Anurag Nagar, Behind Press Complex, Indore (M.P.) Ph.: 4262100, www.rccmindore.com 73
Save the Presentation To save a presentation, Click the Microsoft Office button and choose Save As.
Charts Charts and graphs are an effective way to present information than a simple list of numbers. PowerPoint 2007 is fully integrated with the spreadsheet tools of Excel 2007, making it very easy to create a chart from scratch or to import data from an existing spreadsheet. Creating Charts
1. Select the slide where you want the chart to appear.
2. In the Insert tab, under the Illustrations group, click on CHART to open the Insert Chart dialog.
3. Select the type of chart from the category list on the left, or simply scroll through the gallery on
the right to view all the available charts. Once you have made your selection, click OK. 4. The chart will appear on your slide, and Excel will open as a split screen with dummy data
already filled in. 5. Add your data and labels to the Excel spreadsheet and the chart will be automatically updated
on your slide.
6. When finished, click the in the upper right hand corner of Excel to close the worksheet.. Animation PowerPoint allows you to animate objects or specific content within a slide and also to add animated transitions between slides. Transitions are a common and easy way to liven up a presentation. Add Transitions To add a consistent transition between each slide throughout the presentation, follow these instructions. 1. Click the View tab and click the Slide Master button. 2. In the left-hand Slides tab, select the first slide which is numbered “1.” 3. Click the Animations tab. 4. In the Transition to This Slide toolbar, browse through the transition options and click the appropriate choice. Place the mouse over each option to preview the transition within the slide currently on screen.

B.B.A. 1st Sem. Subject- Information Technology
45, Anurag Nagar, Behind Press Complex, Indore (M.P.) Ph.: 4262100, www.rccmindore.com 74
5. When satisfied with the transition, click the Slide Master tab and then the Close Master View button.
Add Animation With PowerPoint, you can animate virtually any object or specific content that appears on a slide.
To animate an object or content, select it. Click the Animations tab. Select from the menus and buttons available in the Animations toolbar. After selecting the appropriate animation settings, use the Preview button to see the animation
in.
Audio To add audio to a presentation 1. Click the Insert tab. 2. Then click the Sound button. 3. Navigate to the correct audio clip and select it. 4. A pop-up window will ask if the audio should play Automatically or When Clicked. 5. An audio icon will automatically appear on the slide. To preview the audio, right click the audio icon and select Preview.
Inserting and Format Picture Tab:- You can even insert the image in your presentation. To insert click on insert option and then on picture, a window will open you can insert the picture from any desired location. After you insert an image the Picture Tools - Format tab will automatically appear.
Adjust Picture Settings The Adjust group on the Picture Tools tab allows you to adjust the brightness and contrast of your image. You can also use the recoloring options to change the tint of your picture. Borders and Effects
With the Picture Styles group you can add some interesting effects to your images, including regular borders and shaped borders, shadows and reflections, and 3-D rotation options. PowerPoint comes with a number of built-in options, or you can customize your own using the drop down Picture Shape, Picture Border, and Picture Effects menus on the right. Arranging, Aligning & Grouping Images
Arranging PowerPoint allows you to overlap objects, so that for example you could have a text box or a callout over an image, or two images that overlap each other, or several solid shapes and lines arranged to make an interesting background on a slide master.

B.B.A. 1st Sem. Subject- Information Technology
45, Anurag Nagar, Behind Press Complex, Indore (M.P.) Ph.: 4262100, www.rccmindore.com 75
Aligning You can always move objects by clicking and dragging them, but if you want to be more exact with your placement, use the options under the Align menu. You can use this to place objects to the right, left, top, bottom, and center of the slide, make sure the object is both horizontally or vertically centered by using the distribute options, or display a grid to help with your manual placements. Grouping The final option in the Arrange section is the Group button. This button is used to combine objects into one so that they can be moved and edited all at once. Cropping & Resizing Images
You can also use the Crop tool to remove unnecessary parts of your images. Cropping resizes an image by hiding horizontal or vertical edges. To crop an image, click the Crop button. Inserting animated pictures
1. On the Insert menu, point to Movies and Sounds, click Movie from File, locate the folder that contains the file you want, and then double-click the file.
(A movie or .gif file that you've added to Clip Organizer is found in the Clip Organizer folder within the My Pictures folder on your hard disk. Or, go to the original location for these files.)
2. When a message is displayed, do one of the following: To play the movie or GIF automatically when you go to the slide, click automatically. To play the movie or GIF only when you click it, click When Clicked.
Inserting Sounds: PowerPoint 2007 provides some videos and sound clips that are free to use in the Clip Manager. You can also use clips from other sources, such as the Web, a CD of sound effects, or sounds you create yourself. You can insert sound using following:-
Inserting sounds using the Clip Organizer Inserting sounds from a file Recording your own sounds
Adding Notes There are two ways to insert notes in PowerPoint. 1. To insert short notes: In the Normal view, click on the Notes box at the bottom of your screen and type your text.
2. To insert longer notes: Click on the View tab. Under Presentation Views select the Notes Page button. Type your notes in the space that appears below your slide.
Inserting Headers & Footers To add a header and footer, click on the Insert tab, then on the Header & Footer button. The Date & Time and Slide Number buttons will bring up the same dialog box.

B.B.A. 1st Sem. Subject- Information Technology
45, Anurag Nagar, Behind Press Complex, Indore (M.P.) Ph.: 4262100, www.rccmindore.com 76
1. Fixed and Automatic Dates - PowerPoint gives you the option to add either a fixed date and time, which will remain the same, or a date and time that automatically update. If you choose to have a date and time that automatically update, the date and time will always match the date and time that you run your slide show. 2. Slide Number - Check this box to show the slide number. 3. Footer - Check the Footer box and add text to have text appear at the bottom of the slide. 4. Apply/Apply To All - To insert your chosen elements into your slide, select Apply to have the information appear only on your current slide, or Apply To All to have it appear on every slide. If any of the information is repeated on the title slide, check the Don't show on title slide box to avoid repeating the information. 5. Preview - The Preview box shows you where on your slide the information will appear. You can not change this from within this screen, but once you insert the information you can click and drag the box anywhere in your slide, just like any other text box. Note: If you chose to Apply To All, moving the text box in one slide will not effect the placement of the information in the rest of your slides. 6. Notes and Handouts - Under this tab, you can choose your header and footer preferences for your handouts.
WordArt overview WordArt allows you to add special text effects to your document. For example, you can stretch a title, skew text, make text fit a preset shape, or apply a gradient fill. This WordArt becomes an object that you can move or position in your document to add decoration or emphasis. You can modify or add to the text in an existing WordArt object whenever you want.
Layering Art Objects:- There are two main reasons you may want to layer objects in a PowerPoint presentation.

B.B.A. 1st Sem. Subject- Information Technology
45, Anurag Nagar, Behind Press Complex, Indore (M.P.) Ph.: 4262100, www.rccmindore.com 77
1. Layering objects gives you the freedom to arrange your presentation the way we want it to look.
2. Layering lets you take advantage of all of the white space in your presentation. Text boxes in particular take up a lot of room. By layering objects, you can use all of the space on a slide without changing the position of other objects.
Layering Objects in PowerPoint Suppose you add four boxes to your PowerPoint presentation; first a red one, then green, then blue, then yellow. Each box represents an object. When you add a new object to a PowerPoint presentation, the application automatically places the newest objects on top of older objects. If you add the boxes in the order mentioned above, the layering of the objects will look like this:
In the Drawing section, locate and click on the button titled Arrange to arrange it according to you.
There are four options titled:
1. Bring to Front 2. Send to Back 3. Bring Forward 4. Send Backward

B.B.A. 1st Sem. Subject- Information Technology
45, Anurag Nagar, Behind Press Complex, Indore (M.P.) Ph.: 4262100, www.rccmindore.com 78
UNIT VI INFORMATION TECHNOLOGY
Information Technology covers a broad spectrum of hardware and software solutions that enable organizations to gather, organize, and analyze data that helps them achieve their goals. It also details technology-based workflow processes that expand the capacity of an organization to deliver services that generate revenue. The four main focuses of IT personnel are :
Business computer network and database management, Information security, Business software development, and Computer tech support
The necessity for information technology is king. With the emerging popularity of the Cloud technology, many organizations are taking this up as an alternative to actual hardware using up space. Cloud computing service providers manage IT infrastructure and platforms, and provide businesses with access to remote data storage and software packages.
Another reason for the rise of IT careers is the need to defend our information systems from countless attacks. Networking In the world of computers,networking is the practice of linking two or more computing devices together for the purpose of sharing data. Networks are built with a mix of computer hardware and computer software. Area Networks Networks can be categorized in several different ways. One approach defines the type of network according to the geographic area it spans. Local area networks (LANs) , for example, typically span a single home, school, or small office building, whereas wide area networks (WANs) , reach across cities, states, or even across the world. TheInternet is the world's largest public WAN. Network Design Computer networks also differ in their design. The two basic forms of network design are called client/server and peer-to-peer . Client-server networks feature centralized server computers that store email, Web pages, files and or applications. On a peer-to-peer network, conversely, all computers tend to support the same functions. Client-server networks are much more common in business and peer-to-peer networks much more common in homes. A network topology represents its layout or structure from the point of view of data flow. In so-called bus networks, for example, all of the computers share and communicate across one common conduit, whereas in a star network, all data flows through one centralized device. Common types of network topologies include bus, star, ring networks and mesh networks. Information System Information storage and retrieval, the systematic process of collecting and cataloging data so that they can be located and displayed on request. Computers and data processing techniques have made possible the high-speed, selective retrieval of large amounts of information for government, commercial, and academic purposes. There are several basic types of information-storage-and-retrieval systems. Document-retrieval systems store entire documents, which are usually retrieved by title or by key words associated with the document. In some systems, the text of documents is stored as data. This

B.B.A. 1st Sem. Subject- Information Technology
45, Anurag Nagar, Behind Press Complex, Indore (M.P.) Ph.: 4262100, www.rccmindore.com 79
permits full text searching, enabling retrieval on the basis of any words in the document. In others, a digitized image of the document is stored, usually on a write-once optical disc. Database systems store the information as a series of discrete records that are, in turn, divided into discrete fields (e.g., name, address, and phone number); records can be searched and retrieved on the basis of the content of the fields (e.g., all people who have a particular telephone area code). The data are stored within the computer, either in main storage or auxiliary storage, for ready access. Reference-retrieval systems store references to documents rather than the documents themselves. Such systems, in response to a search request, provide the titles of relevant documents and frequently their physical locations. Such systems are efficient when large amounts of different types of printed data must be stored. They have proven extremely effective in libraries, where material is constantly changing. IT Applications in Bussiness:
Customer Service Workplace efficiency Planning & controlling operations Marketing Finance and accounting E-commerce Collaboration & Outsourcing Banking and payments
E-Commerce Transacting or facilitating business on the Internet is called ecommerce. Ecommerce is short for "electronic commerce." Popular examples of ecommerce revolve around buying and selling online. But the ecommerce universe contains other types of activities as well. Any form of business transaction conducted electronically is ecommerce. Examples of Ecommerce
Online Shopping Buying and selling goods on the Internet is one of the most popular examples of ecommerce. Sellers create storefronts that are the online equivalents of retail outlets. Buyers browse and purchase products with mouse clicks. Though Amazon.com is not the pioneer of online shopping, it is arguably the most famous online shopping destination.
Electronic Payments When you are buying goods online, there needs to be a mechanism to pay online too. That is where payment processors and payment gateways come into the picture. Electronic payments reduce the inefficiency associated with writing and mailing checks. It also does away with many of the safety issues that arise due to payment made in currency notes.
Online Auctions When you think online auction, you think eBay. Physical auctions predate online auctions, but the Internet made auctions accessible to a large number of buyers and sellers. Online auctions are an efficient mechanism for price discovery. Many buyers find the auction shopping mechanism much interesting than regular storefront shopping.

B.B.A. 1st Sem. Subject- Information Technology
45, Anurag Nagar, Behind Press Complex, Indore (M.P.) Ph.: 4262100, www.rccmindore.com 80
Internet Banking Today it is possible for you to perform the entire gamut of banking operations without visiting a physical bank branch. Interfacing of websites with bank accounts, and by extension credit cards, was the biggest driver of ecommerce.
Online Ticketing
Air tickets, movie tickets, train tickets, play tickets, tickets to sporting events, and just about any kind of tickets can be booked online. Online ticketing does away with the need to queue up at ticket counters.
Types of Ecommerce Ecommerce can be classified based on the type of participants in the transaction:
Business to Business (B2B) B2B ecommerce transactions are those where both the transacting parties are businesses, e.g., manufacturers, traders, retailers and the like.
Business to Consumer (B2C)
When businesses sell electronically to end-consumers, it is called B2C ecommerce.
Consumer to Consumer (C2C) Some of the earliest transactions in the global economic system involved barter -- a type of C2C transaction. But C2C transactions were virtually non-existent in recent times until the advent of ecommerce. Auction sites are a good example of C2C ecommerce.
4 GL A fourth-generation programming language (4GL) is a computer programming language envisioned as a refinement of the style of languages classified as third-generation programming language(3GL). Each of the programming language generations aims to provide a higher level of abstraction of the internal computer hardware details, making the language more programmer-friendly, powerful and versatile. While the definition of 4GL has changed over time, it can be typified by operating more with large collections of information at once rather than focus on just bits and bytes. Languages claimed to be 4GL may include support for database management, report generation, mathematical optimization, GUI development, or web development. Fourth-generation languages have often been compared to domain-specific languages (DSLs). Some researchers state that 4GLs are a subset of DSLs. The concept of 4GL was developed from the 1970s through the 1990s, overlapping most of the development of 3GL TYPES OF 4 GL A number of different types of 4GLs exist: Table-driven (codeless) programming, usually running with a runtime framework and libraries.
Instead of using code, the developer defines his logic by selecting an operation in a pre-defined list of memory or data table manipulation commands. A good example of this type of 4GL language is PowerBuilder. These types of tools can be used for business application development usually consisting in a package allowing for both business data manipulation and reporting, therefore they come with GUI screens and report editors. They usually offer integration with lower level DLLs generated from a typical 3GL for when the need arise for more hardware/OS specific operations.
Report-generator programming languages take a description of the data format and the report to generate and from that they either generate the required report directly or they generate a program to generate the report.

B.B.A. 1st Sem. Subject- Information Technology
45, Anurag Nagar, Behind Press Complex, Indore (M.P.) Ph.: 4262100, www.rccmindore.com 81
Forms generators manage online interactions with the application system users or generate programs to do so.
Data management 4GLs such as SAS, SPSS and provide sophisticated coding commands for data manipulation, file reshaping, case selection and data documentation in the preparation of data for statistical analysis and reporting.
Image processing Is any form of signal processing for which the input is an image, such as a photographer video frame; the output of image processing may be either an image or a set of characteristics or parameters related to the image. Most image-processing techniques involve treating the image as a two-dimensional signal and applying standard signal-processing techniques to it.
Image processing usually refers to digital image processing, but optical and analog image processing also are possible. This article is about general techniques that apply to all of them. The acquisition of images (producing the input image in the first place) is referred to as imaging.
Closely related to image processing are computer graphics and computer vision. In computer graphics, images are manually made from physical models of objects, environments, and lighting, instead of being acquired (via imaging devices such as cameras) from natural scenes, as in most animated movies. Computer vision, on the other hand, is often considered high-level image processing out of which a machine/computer/software intends to decipher the physical contents of an image or a sequence of images (e.g., videos or 3D full-body magnetic resonance scans).
Features of image processing Plug-ins Algorithms to manipulate images are externally implemented as plug-ins. The framework provides an interface to manipulate plug-ins. Plug-ins are loaded in run-time via reflection. It provides an easy-way to extensibility and allows plug-ins integration. A plug-in to show a gray scale histogram, for example, uses the gray scale plug-in before the histogram generation. Video Capturing Video capturing is provided via Java Media Framework and allows developers to work with real-time video processing. For the plug-ins, the interface to work with videos and images are the same. In the case of videos, plug-ins can store past frames to analize multiple frames. Multi-threading Marvin allows the processing of multiple images at the same time or the same image processed by multiple threads. Image processing plug-ins receive an image to be processed and a mask containing what pixels must be considered. Thus, different threads can work in the same image in different image´s segment, Performance Meter Many image processing algorithms can be divided in few processes. Each process has a different computational cost and the performance meter allows developers to analyze the performance of the entire algorithm and their processes individually, considering the number of steps and the execution spent time. Thus, it is possible a better understanding of the algorithm performance and facilitates optimizations, since is visible what algorithm processes are costly and most interesting to be optimized.

B.B.A. 1st Sem. Subject- Information Technology
45, Anurag Nagar, Behind Press Complex, Indore (M.P.) Ph.: 4262100, www.rccmindore.com 82
Another performance meter application is to determine the complexity of an algorithm, Big-O notation, analyzing the number of steps executed for different image resolution. GUI API The plug-ins can have user specified attributes that determines how it works and the Marvin framework provides features to integrate a GUI (Graphical User Interface) with these attributes. The Plug-in developer sets the relation between the plug-in attributes and the interface components, added to the plug-in window. When the component value is changed, the associated attribute value is changed automatically Two horizontal sliders are added to that windows, one associated with the attribute brightness and the other with contrast. Virtual Reality Virtual reality is an artificial environment that is created with software and presented to the user in such a way that the user suspends belief and accepts it as a real environment. On a computer, virtual reality is primarily experienced through two of the five senses: sight and sound. The simplest form of virtual reality is a 3-D image that can be explored interactively at a personal computer, usually by manipulating keys or the mouse so that the content of the image moves in some direction or zooms in or out. Virtual reality can be divided into: The simulation of a real environment for training and education. The development of an imagined environment for a game or interactive story. Popular products for creating virtual reality effects on personal computers include Bryce, Extreme 3D, Ray Dream Studio, trueSpace, 3D Studio MAX, and Visual Reality. The Virtual Reality Modelling Language (VRML) allows the creator to specify images and the rules for their display and interaction using textual language statements. Applications of VR Virtual Reality is practically used in8 major fields: architecture, manufacturing, entertainment, education & training, augmented reality, art and medicine. Architecture Architecture is probably one of the best real applications for VR. It can effectively be used to enhance the experience of walking inside or around a structure that does not exist. Blueprints only give a 2D representation of the building and 3D renderings on an ordinary computer screen convey the spatial relation of a building in a very crude manner. VR enables us to experience the building in an immersive way that gives an almost real-life representation. Manufacturing VR is extensively used in manufacturing to visualize and prototype different types of objects for one simple reason – it is a lot cheaper to test a machine e.g. a plane or a car in a virtual environment instead of building a real prototype. This of course does not eliminate the need for real prototypes but it does enable the manufacturer to construct more complete prototypes. The automotive industry for example has adapted Virtual Reality into its development cycle and uses it to test the aerodynamic design and ergonomic elements of a car. Entertainment The entertainment industry was one of the first to utilize virtual reality technology in real-world applications and it has probably produced the most hype about the technology. The idea of entering animmersive virtual environment where anything is

B.B.A. 1st Sem. Subject- Information Technology
45, Anurag Nagar, Behind Press Complex, Indore (M.P.) Ph.: 4262100, www.rccmindore.com 83
possible gives game designers a whole new dimension to work with. It can make games look and feel more like the “real” thing which is for many gamers the ultimate goal. There are two different markets for VR gaming systems – arcades and home users. The latter has not gained much popularity due to the high costs associated with quality VR systems but as computers become increasingly faster and their components cheaper this is bound to change. VR gaming systems in theme parks and arcades on the other hand are quite popular. Education & Training Some of the most effective applications of VR are in the field of education and training. Different kinds of VR simulators have been developed to safely train people for real-life situations. Airplane pilots train extensively on VR simulators before they take the controls of a real plane. In addition to flight simulators virtual reality is also used to simulate combat situations, sea navigation, space exploration, truck driving, fire fighting, medical surgeries etc. Simulators used for education and training provide a more detailed virtual environment and are more complex than those used for entertainment purposes. This also makes training simulators a lot more expensive. The military has been one of the more avid users of VR simulators and thanks to extensive research funding has aided development of this technology. One of the more recent innovations for VR simulators is the VirtuSphere which enables unrestricted physical movement in a virtual world. Medicine There are several practical VR application in the medical industry including training, surgery, diagnostics and rehabilitation. VR visualization particularly creates new possibilities for future doctors to perfect their life-saving skills. Immersive VR is also being used more and more frequently for rehabilitation purposes and the treatment of anxiety disorders or phobias. Pros: 1- It is a great social way, users may find a common interests across the world. 2- communication and learning will be more effective, productive, and more enjoyable. 3- It enable users to interface with each other using a three dimensional environment through sight, sound, and touch. 4- It will improve some users' skills without causing any mistakes in real world. 5- It helps patients recover from strokes, phobias and other illnesses. Cons: 1- It will decrease human interaction in the real world. 2- The cost of creating a virtual reality system is too high. 3- Training with a VR environment does not have the same results as training in the real world. 4- Programmers are still grappling with how to interact with virtual environments. 5- If the virtual environments became much higher quality, they will become attractive to those wishing to escape real life. Video Conferencing Videoconferencing (or video conference) means to conduct a conference between two or more participants at different sites by using computer networks to transmit audio and video data. For example, a point-to-point (two-person) video conferencing system works much like a video telephone. Each participant has a video camera, microphone, and speakers mounted on his or her computer. As the two participants speak to one another, their voices are carried over the network and delivered to the

B.B.A. 1st Sem. Subject- Information Technology
45, Anurag Nagar, Behind Press Complex, Indore (M.P.) Ph.: 4262100, www.rccmindore.com 84
other's speakers, and whatever images appear in front of the video camera appear in a window on the other participant's monitor. Multipoint videoconferencing allows three or more participants to sit in a virtual conference room and communicate as if they were sitting right next to each other. Until the mid 90s, the hardware costs made videoconferencing prohibitively expensive for most organizations, but that situation is changing rapidly. Many analysts believe that videoconferencing will be one of the fastest-growing segments of the computer industry in the latter half of the decade. The Advantages of Video Conferencing
Save time by not travelling to meetings Reduce your travel costs by working remotely Increase productivity through collaborative working Share presentations, data and media in an instant Use it in the office, on the move or at home Delivers a tangible return on investment
Decision Support System (DSS) Decision support systems are interactive software-based systems intended to help managers in decision making by accessing large volume of information generated from various related information systems involved in organizational business processes, like, office automation system, transaction processing system etc. DSS uses the summary information, exceptions, patterns and trends using the analytical models. Decision Support System helps in decision making but does not always give a decision itself. The decision makers compile useful information from raw data, documents, personal knowledge, and/or business models to identify and solve problems and make decisions. Types of DSS There are two types of decisions –
1. Programmed 2. Non-programmed decisions.
Programmed decisions Programmed decisions are basically automated processes, general routine work, where: • These decisions have been taken several times • These decisions follow some guidelines or rules For example, selecting a reorder level for inventories, is a programmed decision Non-programmed decisions Non-programmed decisions occur in unusual and non-addressed situations, so: • It would be a new decision • There will not be any rules to follow • These decisions are made based on available information • These decisions are based on the manger's discretion, instinct, perception and judgment For example,investing in a new technology is a non-programmed decision Decision support systems generally involve non-programmed decisions.Therefore,there will be no exact report,content or format for these systems.Reports are generated on the fly. Attributes of DSS • Adaptability and flexibility

B.B.A. 1st Sem. Subject- Information Technology
45, Anurag Nagar, Behind Press Complex, Indore (M.P.) Ph.: 4262100, www.rccmindore.com 85
• High level of Interactivity • Ease of use • Efficiency and effectiveness • Complete control by decision-makers. • Ease of development • Extendibility • Support for modeling and analysis • Support for data access • Standalone, integrated and Web-based Characteristics of a DSS • Support for decision makers in semi structured and unstructured problems. • Support for managers at various managerial levels, ranging from top executive to line managers. • Support for individuals and groups. Less structured problems often requires the involvement of
several individuals from different departments and organization level. • Support for interdependent or sequential decisions. • Support for intelligence, design, choice, and implementation. • Support for variety of decision processes and styles • DSSs are adaptive over time. Benefits of DSS • Improves efficiency and speed of decision making activities • Increases the control, competitiveness and capability of futuristic decision making of the
organization • Facilitates interpersonal communication • Encourages learning or training • Since it is mostly used in non-programmed decisions, it reveals new approaches and sets up
new evidences for an unusual decision • Helps automate managerial processes Components of DSS Following are the components of the Decision Support System: • Database Management System (DBMS) : To solve a problem the necessary data may come
from internal or external database.In an organization,internal data are generated by a system such as TPS and MIS.External data come from a variety of sources such as newspapers,online data services,databases (financial, marketing,human resources).
• Model Management system: It stores and accesses models that managers use to make decisions. Such models are used for designing manufacturing facility, analyzing the financial health of an organization. Forecasting demand of a product or service etc.
Support Tools:Support tools like online help; pull down menus, user interfaces, graphical analysis, error correction mechanism, facilitates the user interactions with the system. Classification of DSS There are several ways to classify DSS. Hoi Apple and Whinstone classify DSS in following: • Text Oriented DSS: It contains textually represented information that could have a bearing on
decision.It allows documents to be electronically created,revise and viewed as needed • Database Oriented DSS: Database plays a major role here;it contains organized and highly
structured data.

B.B.A. 1st Sem. Subject- Information Technology
45, Anurag Nagar, Behind Press Complex, Indore (M.P.) Ph.: 4262100, www.rccmindore.com 86
• Spreadsheet Oriented DSS: it contains information in spread sheets that allows create,view,modify procedural knowledge and also instruct the system to execute self-contained instructions.The most popular tool is Excel and Lotus 1-2-3.
• Solver Oriented DSS: it is based on a solver,which is an algorithm or procedure written for performing certain calculations and particular program type.
• Rules Oriented DSS: It follows certain procedures adopted as rules. Export system is the example.
• Compound DSS: It is built by using two or more of the five structures explained above Artificial intelligence It is the science and engineering of making intelligent machines, especially intelligent computer programs. It is related to the similar task of using computers to understand human intelligence The field of artificial intelligence (AI) encompasses the study of how to apply computers to problem domains that have traditionally been handled by humans only. A good example of such a problem domain is natural language. Current research in AI is attempting to find ways to use computers to automatically perform natural language translation and to recognize spoken words and convert them into written language. Characteristics of A.I. Programs
Symbolic Reasoning: reasoning about objects represented by symbols, and their properties and relationships, not just numerical calculations.
Knowledge: General principles are stored in the program and used for reasoning about novel situations.
Search: a ``weak method'' for finding a solution to a problem when no direct method exists. Problem: combinatoric explosion of possibilities.
Flexible Control: Direction of processing can be changed by changing facts in the environment. Symbolic Processing Most of the reasoning that people do is non-numeric. AI programs often do some numerical calculation, but focus on reasoning with symbols that represent objects and relationships in the real world.
Objects. Properties of objects. Relationships among objects. Rules about classes of objects.
Knowledge Representation It is necessary to represent the computer's knowledge of the world by some kind of data structures in the machine's memory. Traditional computer programs deal with large amounts of data that are structured in simple and uniform ways. A.I. programs need to deal with complex relationships, reflecting the complexity of the real world. Several kinds of knowledge need to be represented:
Factual Data: Known facts about the world. General Principles: ``Every dog is a mammal.'' Hypothetical Data: The computer must consider hypotheticals in order to reason about the
effects of actions that are being contemplated. Search
Search programs find a solution for a problem by trying different sequences of actions ( operators) until a solution is found.

B.B.A. 1st Sem. Subject- Information Technology
45, Anurag Nagar, Behind Press Complex, Indore (M.P.) Ph.: 4262100, www.rccmindore.com 87
Advantage: Many kinds of problems can be viewed as search problems. To solve a problem using search, it is only necessary to code the operators that can be used; search will find the sequence of actions that will provide the desired result. For example, a program can be written to play chess using search if one knows the rules of chess; it isn't necessary to know how to play good chess.
Disadvantage: Most problems have search spaces so large that it is impossible to search the whole space. Chess has been estimated to have 10120 possible games. The rapid growth of combinations of possible moves is called the combinatoric explosion problem.
How Search Fits Into A.I. Search seems to arise in nearly every area of A.I. In part, this is because A.I. attempts to model human intelligence (which is highly parallel) on serial machines.
Logic: A theorem prover searches for a sequence of proof steps that will prove a desired conclusion.
Natural Language: A parser searches for the best ways of assigning structure and meaning to sentences that are ambiguous.
Planning: A planner searches for a sequence of actions that will accomplish a goal. Perception: The raw input is often ambiguous; the perception program searches for a
consistent set of interpretations of parts of the input. Learning: A learning program searches for a compact description of a set of training instances. Expert Systems: Search finds rules applicable to the current problem.
Technologies of Artificial Intelligence
Perception o Machine vision o Speech understanding o Touch sensation
Robotics Natural Language Processing
o Natural Language Understanding o Speech Understanding o Language Generation o Machine Translation
Planning Expert Systems Machine Learning Theorem Proving Symbolic Mathematics Game Playing
Domains of AI
1. Computer Science 2. Cognitive Science 3. Engineering 4. Ethics 5. Linguistics 6. Logic
7. Mathematics 8. Natural Sciences 9. Philosophy 10. Physiology 11. Psychology 12. Statistics
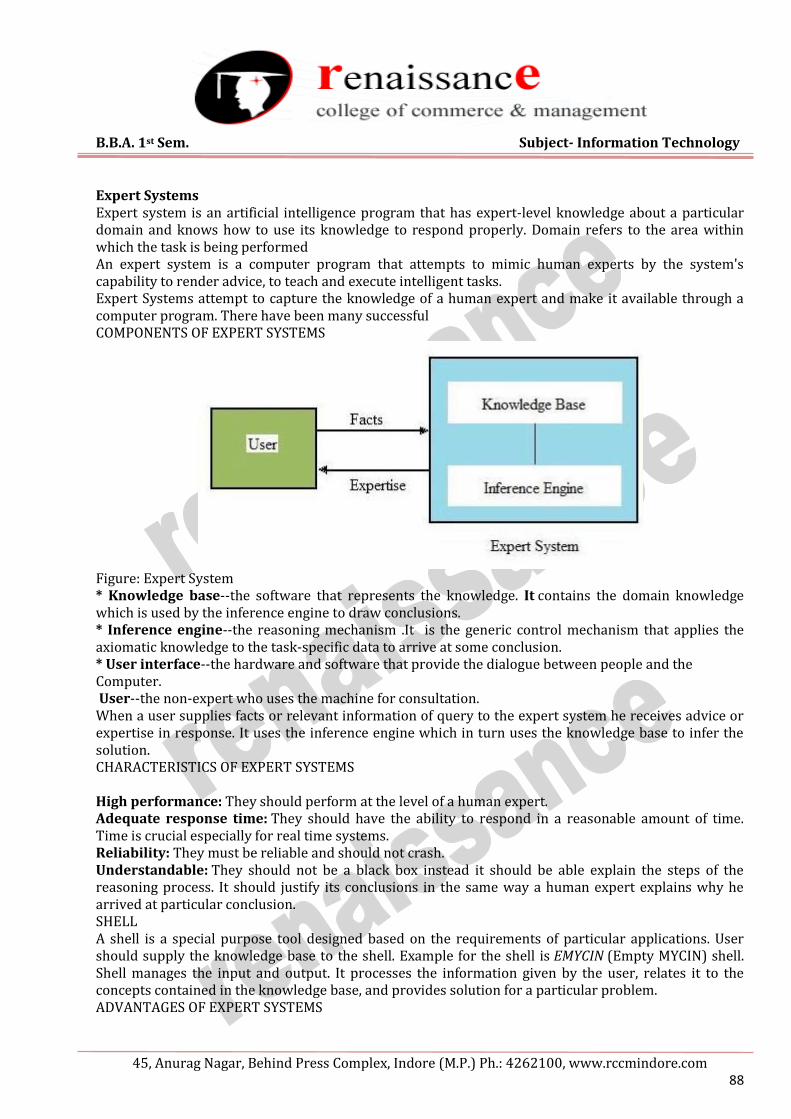
B.B.A. 1st Sem. Subject- Information Technology
45, Anurag Nagar, Behind Press Complex, Indore (M.P.) Ph.: 4262100, www.rccmindore.com 88
Expert Systems Expert system is an artificial intelligence program that has expert-level knowledge about a particular domain and knows how to use its knowledge to respond properly. Domain refers to the area within which the task is being performed An expert system is a computer program that attempts to mimic human experts by the system's capability to render advice, to teach and execute intelligent tasks. Expert Systems attempt to capture the knowledge of a human expert and make it available through a computer program. There have been many successful COMPONENTS OF EXPERT SYSTEMS
Figure: Expert System * Knowledge base--the software that represents the knowledge. It contains the domain knowledge which is used by the inference engine to draw conclusions. * Inference engine--the reasoning mechanism .It is the generic control mechanism that applies the axiomatic knowledge to the task-specific data to arrive at some conclusion. * User interface--the hardware and software that provide the dialogue between people and the Computer. User--the non-expert who uses the machine for consultation. When a user supplies facts or relevant information of query to the expert system he receives advice or expertise in response. It uses the inference engine which in turn uses the knowledge base to infer the solution. CHARACTERISTICS OF EXPERT SYSTEMS High performance: They should perform at the level of a human expert. Adequate response time: They should have the ability to respond in a reasonable amount of time. Time is crucial especially for real time systems. Reliability: They must be reliable and should not crash. Understandable: They should not be a black box instead it should be able explain the steps of the reasoning process. It should justify its conclusions in the same way a human expert explains why he arrived at particular conclusion. SHELL A shell is a special purpose tool designed based on the requirements of particular applications. User should supply the knowledge base to the shell. Example for the shell is EMYCIN (Empty MYCIN) shell. Shell manages the input and output. It processes the information given by the user, relates it to the concepts contained in the knowledge base, and provides solution for a particular problem. ADVANTAGES OF EXPERT SYSTEMS

B.B.A. 1st Sem. Subject- Information Technology
45, Anurag Nagar, Behind Press Complex, Indore (M.P.) Ph.: 4262100, www.rccmindore.com 89
Availability: Expert systems are available easily due to mass production software. Cheaper: The cost of providing expertise is not expensive. Reduced danger: They can be used in any risky environments where humans cannot work with. Permanence: The knowledge will last long indefinitely. Multiple expertise: It can be designed to have knowledge of many experts. Explanation: They are capable of explaining in detail the reasoning that led to a conclusion. Fast response: They can respond at great speed due to the inherent advantages of computers over humans. Unemotional and response at all times: Unlike humans, they do not get tense, fatigue or panic and work steadily during emergency situations. LIMITATIONS OF ES.
Knowledge is not always readily available. It can be difficult to extract expertise from humans. There are frequently multiple correct assessments. Time pressures. Users have cognitive limits. ES works well only within a narrow domain of knowledge. Most experts do not have an independent means to validate results. Vocabulary is often limited and difficult to understand. Help from knowledge engineers is difficult to obtain and costly. Potential for lack of trust on the part of the end-users. Knowledge transfer is subject to biases.
Information superhighway The global information and communications network that includes the Internet and other networks and switching systems such as telephonenetworks, cable television networks, and satellite communication networks. It is a term coined by Vice President Albert Gore when giving a speech January 11, 1994 describing the future of computers accessing and communicating over a world-wide network. Internet-type global network of computers that, potentially, will connect most of world's individuals, firms, and organizations. It is envisioned to provide very high speed access to information in all forms (text, graphics, audio, video) via a telephone or wireless connection. CONCEPT AND BENEFITS The term "information superhighway" has many different meanings, depending on the context. The superhighway consists of three key elements in addition to the communications infrastructure (the telephone and cable systems) that permit two-way communication. These elements are: THE SOFTWARE that permits the easy use of the services and information available on the highway; INFORMATION APPLIANCES, such as TVs, telephones and computers, and new products combining all three; INFORMATION PROVIDERS – local broadcasters, digital libraries, information services (where most of the new jobs are anticipated), and millions of individuals. The development and integration of all the components will produce the total system.

B.B.A. 1st Sem. Subject- Information Technology
45, Anurag Nagar, Behind Press Complex, Indore (M.P.) Ph.: 4262100, www.rccmindore.com 90
TECHNOLOGIES FOR DELIVERING INFORMATION Communications technology has evolved from the basic voice telephone into a complicated system – one that includes cellular phones, faxes and video conferencing – on which we will depend for the delivery of information in the future. The three major types of technological innovation that have driven fundamental changes in the communications sector are:
Digital communication (particularly digital switching), Wireless communication, and Fibre-optic transmission.
Digital Communication The first digital switching equipment was introduced in the late 1970s. It consists of digital switches, essentially specialized computers that allow networks to be customized and reconfigured through relatively simple software changes. This digital technology makes possible such services as caller identification. Developed countries like Canada have been moving rapidly to adopt digital technology in their telephone networks. Wireless Communication In parallel with the swift growth of hard-wired delivery technology, innovations in wireless communication, particularly cellular telephones, have also progressed very quickly. The cellular network began its first full year of operation in Canada in 1986. Both Canada and the United States have experienced very high growth rates in this field and the number of users is expected to increase rapidly as quality improves and costs decrease still further. These changes will be brought about in part by the switch from conventional analog to digital radio transmissions which began in 1994. Most carriers are not expected to go digital until 1995 or later. In developing countries, it is quite possible that cellular networks will supersede conventional land-based networks by the late 1990s. Fibre-Optic Transmission The major virtue of optical fibre is its huge capacity to carry information. This can be illustrated by a comparison of the relative amount of information each type of line can carry: Telephone wire 1 to 24, Coaxial cable 1,000, Fibre-optic cable 10,000. Fibre-optic transmission also offers several other advantages: Signals are of very high quality and noise-free. This corresponds to very low error rates for data communications. The signals are free from the disruptive environmental interferences that often degrade copper or wireless communications. Fibre-optic cables can operate reliably in electrically noisy environments without requiring shielding. Fibre-optic cables do not emit radiation and thus do not cause external interference. Moreover, they are relatively secure as the fibres are very difficult to tap without being detected. At a few cents per metre, the cables are less expensive, lighter and smaller than copper cable; they are thus cheaper and easier to install.

B.B.A. 1st Sem. Subject- Information Technology
45, Anurag Nagar, Behind Press Complex, Indore (M.P.) Ph.: 4262100, www.rccmindore.com 91
UNIT-7 TALLY
Tally is a complete accounting and inventory software. It is developed by Tally Solution Ltd. It is recognized accounting and inventory package worldwide. Since its launch in 1986, many versions of tally are released. Latest version of Tally is Tally 9. Versions of Tally:- Tally 4.5 : Tally was started with this first version Tally 4.5, which was a DOS based program. This program was very light weight and very fast in operation. Tally 5.4 : The next version was 5.4 which was graphic interface version. It became popular in the masses- Its pirated copy made it most popular accounting software. Tally 6.3 : Next version was tally 6.3 which was truly windows based version which could support fast printing and with VAT implemented. Tally 6.3 came with water tight security in terms of piracy. With its dongle it was almost impossible to crack. Although crack of software were available but Tally's policy of frequent upgrades and newer releases does the trick. Tally 7.2 : Next version of Tally was Tally 7.2. It was also fast version with lots of new feature like statutory compliant versions. Different VAT rules for different states were included with this version. Tally 8.1: Tally 8.1 was developed with new data structure of Tally. A module of POS and Payroll was added to it. It could not live up to the expectations with the people was full of bugs. Company rectified many but the version could not become popular and company has to abort it before time and launch new version. Tally 9: This is the latest version of Tally which has maximum features. All other versions have been declared end of life period by Tally company. Tally 9 has advance features like Excise for Dealers, Payroll, FBT, TDS, e-TDS filing facility etc along will its regular features related to accounting and inventory management. Types of Tally • Tally Silver - It is the single user accounting package. • Tally Gold - It is the multi user accounting package. Features of Tally Main features of Tally are as follows: Financial Accounting: Tally enables users to record all types of accounting transactions including receipts and payments, income and expenses, sales and purchases, debit notes and credit notes, memorandum journals and reversing journals. Transactions in Tally are recorded through unique vouchers in very easy manner. Financial Reports: Tally let users to instantly obtain the financial reports such as Trading and Profit & loss statements, Balance Sheet, etc. Basic and Advance Financial Management: Tally let users to instantly obtain financial management reports such as cash and funds flows, ratio analysis and others required reports. Inventory Accounting: Tally tracks all stock movement and gives you instant stock reports for each item. Tally maintains Multi - Godown Inventory, Multi - Unit Inventory, Multi-Valuation Inventory, Batch-wise or lot-wise Inventory with Expiry dates, Purchase & Sales Order Processing and Bills of Materials. Multi Year Reports: Tally can keep data of any number of years. Tally allows flexible financial year facility. If you want to view the sale trend for last three years, you may get it with Tally instantly.

B.B.A. 1st Sem. Subject- Information Technology
45, Anurag Nagar, Behind Press Complex, Indore (M.P.) Ph.: 4262100, www.rccmindore.com 92
Security Control: Tally enables users to define various security levels for access control. Using Tally vault user can encrypt data and make it unreadable by others. At the time of creation or alteration of company;, Administrator can be created which can manage Tally. Powerful Audit Capabilities: Tally allows administrators to track changes done by users. Administrator can accept or reject changes while viewing them. Interest Calculation: Tally provides facility to calculate interest on dues, loans etc., based on certain set of criteria or specified date and time periods. Multi-lingual capability: Tally supports many Indian and international languages. Data can be entered in any one language and viewed in any other. Voucher and Cheque Printing : Tally provides the facility to print any voucher that has been entered. The user can print the voucher as soon as it is entered or later. Tally also provides cheque printing facility. When user create payment voucher Tally may ask to print cheque immediately or user can print it later. Import and export of data: Tally provides facility to export data in various formats such as in plain text, Excel, XML, HTML etc. formats. Tally also allows to import data. Tally can import only XML files. Value Added Tax (VAT): Tally simplified every aspect of VAT. It manages VAT to state specific VAT classification. Tally also maintains inbuilt rates. It generates VAT computation for the desired period, along with Input VAT and output VAT. It automatically generates VAT returns for a given period Tax Deduction at Source (TDS): In Tally user can configure TDS by specifying the nature of payment. It automatically deducts TDS, based on pre-defined rates. It can generate challans and Form-16A certificate also. BASIC SCREEN OF TALLY The basic screen is separated into four sections – 1) Main Area 2) Gateway of Tally
3) Calculator Area 4) Button toolbar
Main Area: This is the Left side part of basic screen which gives information. The components of main area are: • Current Period: The financial period of currently selected company. • Current Date : The date of the last voucher entry of the selected company. • List of Opened Companies : This displays the name of the selected company and the
Companies opened in the memory of Tally. Gateway of Tally: When user selects any company in Tally, Tally provides vertical menu based interface, this interface is called as the Gateway of tally. Gateway of Tally provides a very easy way to user to perform all tasks in tally. Besides the menu, The Gateway of Tally also provides button toolbar for quick and easy access to options for managing companies, vouchers etc. 1. Masters : This is for creation of accounting masters, inventory masters and payroll masters. 2. Transactions : This is for creation of accounting vouchers, inventory vouchers and payroll vouchers. 3. Import: This is used to import data to masters and vouchers. 4. Reports : This is for viewing and printing accounting, inventory, payroll and statutory reports using the information given in masters and transactions. Calculator Area: Tally provides calculator option also to user for fast and easy of calculation. To operate calculator user has to press Ctrl + N. Button toolbar : There are two types of button toolbars, Vertical and Horizontal. Main options of horizontal button toolbar are available with almost all vouchers and reports.
B.B.A. 1st Sem. Subject- Information Technology
45, Anurag Nagar, Behind Press Complex, Indore (M.P.) Ph.: 4262100, www.rccmindore.com 93
The options of vertical button toolbar changes with screens types. Underline character on button denotes shortcut key for that button. User can access option by pressing underlined character with Alt key in case of single underline or with Ctrl key in case of double underline. PROCESS OF CREATING A COMPANY IN TALLY A company in tally represents an actual firm or organization for which masters and transaction records are maintained. Physical and logical storage and display of all the data managed under the company. Each company's data is stored in common folder which is named after company's code assigned by tally. After installation when tally is run for the first time, it display the option for create the company. Once a company is created user can select it from company's list for recording the transactions or viewing the reports. Whenever user needs to create a company, option can be selected from company Info menu which can be activated by selecting it from vertical button toolbar or by pressing ALT+F3 key. Company creation screen accepts basic details like company name, address, contact details, security options etc. following main options are available on company creation form. Directory: This box is used to view and set path of data folder which stores the data belongs to company. By default data is stored under Data folder in the Tally program folder i.e. at C:\Tally\Data but user can change the location. Name (Mandatory): This box is used to set name of the company for which transaction will be maintained. Mailing Name and Address (Optional): These fields are used to specify mailing name and address of company. Maintain (Mandatory): Tally provides facilities for both account and inventory management. User can select type of books to be maintained with company i.e. only account or account with inventory using this field. Financial Year From (Mandatory): This box is used to specify starting date of financial year of company from when company started transactions. Books Beginning From (Mandatory): This box is used to specify actual opening date of company. This date may be differ from financial year opening date. TallyVauIt Password (Optional): TallyVault is an enhanced security system, which encrypts the data of company. Data is decrypted only when right vault password is provided. Use Security Control (Mandatory): This option is a logical option i.e. it may be either Yes or No. Setting this option to Yes allows providing administrator name and password. This option is used to avoid unauthorized access and to control operations of other users. Use Tally Audit Features (Mandatory) : This option is a logical option i.e. it may be either Yes or No. Tally Audit allows the administrator and audit profile users to track changes in accounting information. This feature is used only by Administrator. During creation of company tally also accepts currency related information like currency symbol, formal name of currency, no of decimal places with currency, symbol for decimal portion, etc.
ACCOUNTING MASTERS IN TALLY (Groups and Ledgers)
Tally allows users to create masters for accounts and inventory. Once master is created, it is available in list during the vouchers entry. User can create master from Masters Menu option of Gateway of Tally. Accounts info option is used to create ledger group and ledgers. Inventory Info option is used to create item groups, items and units of measure. Tally also provides option to create or alter voucher types. Group: Tally allows the users to manage accounts under single ledger concept of accounting. Every type of transaction is entered using ledgers or account heads. Ledger accounts are created to identify

B.B.A. 1st Sem. Subject- Information Technology
45, Anurag Nagar, Behind Press Complex, Indore (M.P.) Ph.: 4262100, www.rccmindore.com 94
transactions. Groups in Tally classify and identify account heads according to their nature. This makes generation of summarized information quite easier. At topmost level of group accounts are classified into assets, liabilities, income and expenditure. Tally also allows users to create subgroup. A subgroup is created under a group and acts like a group. Groups are created in hierarchical structure. The main group of accounts that determine the entire accounting and their presentation are the asset, liability, income or the expenditure.. Main groups determine that a ledger affects to profit and loss or balance sheet. A Group is not important by itself, but because it controls the usage of Ledger accounts. A wrong classification would affect the treatment of the ledger account in final statements and during voucher entry. To create a group or subgroup, Group Creation form is used. To open Group Creation form select Accounts Info —> Groups —>Create from Gateway of Tally Following fields are appear in group creation screen:
Name : Name field is used to specify name of group. Alias : This specify alternate or short name for the group. Under : This field allows to select main group for the new group.
Ledgers: A Ledger is the actual account head which is used in any transaction. In Tally all accounting vouchers uses Ledgers. During the voucher entry Tally displays list of all ledgers from which, user can select appropriate ledger. Tally provides two ledger accounts automatically when user creates a new company. These are Cash and Profit and Loss Account. User need to create all other accounts heads. Tally do not enforce any restrictions in maxi¬mum numbers of ledger user can create. To create a ledgers Led¬ger Creation form is used. Ledger Creation form can be accessed from Accounts Info —> Ledgers —>Create from Gateway of Tally Ledger form generally displays following fields while creating a ledger: Name : This field is used to accept the name of the ledger account. Tally itself checks for duplicate entry and raise error message in front of the user. Alias : Alias field is used to provide alternate name or short name for ledger. User can access the ledgers using the original name or the alias name. Under : All accounts must be created under their appropriate Groups. This group can be selected from list of groups. Alt+C key can be used to create a new group from this field. Opening Balance : This field is used to .specify opening balance of ledger as on company opening date. Depending upon type of group or selected features, fields on ledger creation form may vary greatly. For example for sundry debtors and creditors it also shows fields for default credit period or displays fields to select TDS settings if TDS feature is activated. VOUCHERS TYPES In tally, the financial transactions are recorded through vouchers. For every transaction, user can use appropriate Tally Voucher to enter the details which affects the ledgers. Vouchers in tally can be broadly divided into two categories, accounting and inventory. Tally provides following main predefined vouchers.

B.B.A. 1st Sem. Subject- Information Technology
45, Anurag Nagar, Behind Press Complex, Indore (M.P.) Ph.: 4262100, www.rccmindore.com 95
Voucher Type Function Shortcut Key
Contra It is used to record the transactions between Cash to Bank, Bank to Cash or Bank to Bank. Tally provide single entry and double entry mode for contra vouchers also. The cash and bank ledgers are only displayed in the ledger list of this voucher.
F4
Payment It is used to record the payment transactions. Tally provides single entry as well as double entry mode for payment voucher.
F5
Receipt
It is used to record the money received either by cash or by bank. Tally provides single entry as well as double entry mode for receipt voucher.
F6
Journal It is used to record the transactions between ledgers, when there is no cash or bank is included. The cash and bank ledgers are not displayed in the ledger list.
F7
Sales
It is used to enter the transaction of sales. The sales voucher has two formats: As Invoice and As Voucher. If As invoice is selected then the invoice format is displayed on the screen and if As voucher is selected then debit-credit format is displayed.
F8
Purchase It is used to record the transactions of purchase. The purchase voucher has two formats: As Invoice and As Voucher. If As invoice is selected then the invoice format is displayed on the screen and if As voucher is selected then Debit-Credit format is displayed.
F9
Memo Voucher It is used as memorandum voucher. It does not affect the account books.
Ctrl + F10
Reversing Journal
Special vouchers that are automatically reversed after a specified date. F10
Stock Journal It is used to record stock transfers from one location to another. Alt + F7
Physical Stock It is used for recording actual stock physically verified or counted. Alt + F10
Delivery Notes It is used for recording goods delivered to a customer. Alt + F8
Credit Notes It is used to enter sales returns transactions. Ctrl + F8
Debit Notes It is used to enter purchase returns transactions. Ctrl + F9
VOUCHER CREATION IN TALLY A Voucher is a document that contains details of a financial transaction. For every transaction, user can use appropriate Tally voucher to enter the details into the ledgers. Tally provides very easy way to enter a transaction in any voucher. All vouchers works on almost same pattern. The main fields of voucher are as follows:

B.B.A. 1st Sem. Subject- Information Technology
45, Anurag Nagar, Behind Press Complex, Indore (M.P.) Ph.: 4262100, www.rccmindore.com 96
Voucher Type : This field displays voucher type. Voucher type can be changed using appropriate button on vertical button toolbar or by using shortcut key for desired type. No. : This field shows voucher number for a voucher. The voucher number option is a unique identification of a voucher. Tally automatically generates voucher number but user can set option for manual voucher number also. Date : This field is used to accept date of voucher. Tally automatically picks date mentioned as entry date- To change entry date F2 key can be used. If this date is not within financial period then it will create error and not save the voucher. Particulars : This field accepts ledger name and Dr/Cr for ledger. Ledger name can be selected from ledger list displayed. When user types first few characters of ledger name, Taliy highlights all ledgers containing these characters and then user can select desired ledger. User can also create new ledger using Alt+C key. Amount : In voucher different column for debit and credit amount is displayed. User can enter amount in appropriate col¬umn. Tally saves voucher only when total of both the columns are equal. Narration : This field is used to provide any comment about the voucher. This field is optional. ACCOUNT REPORTS IN TALLY Books of accounts and final statements from vouchers entered by user are automatically created by Tally. Account books can be viewed from Display menu of Gateway of Tally. Final statements are available directly from Gateway of Tally. Some commonly used repots are - • Ledger • Day Book • Cash Book • Bank Book • Trial Balance • Profit and Loss A/c • Balance Sheet Ledger: To view a particular ledger select Display > Account Books > Ledger from Gateway of Tally. Tally displayed list of ledgers created in the selected company. Select desired ledger from list and press enter. To view detail of entry, select it and press enter. Cash/Bank book: To view a cash and bank book Select Display > Account Books> Cash/Bank Book(s) from Gateway of Tally. Tally Displays summary of cash and bank ledgers. Select any ledger and press enter to view monthly summary. Select desired month from list and press enter to view further details. Day book: Day book displays all transaction performed for a particular date or during a period. By default, it displays transaction of last voucher entry date. To view day book select display > Day Book from Gateway of Tally. Trail Balance: Trial Balance displays all account balances for the company in order of group i.e. it is report that comprising main groups and their closing balances. As Tally puts restriction of equal balance of debit and credit amount during the voucher entry, trial bal¬ance is always balanced in tally. To view trial balance select Display > Trial Balance from Gateway of Tally Profit and loss Ac¬count: The Profit and Loss account displays the operational results over a given period. It lists out the incomes and expenditures based on the primary groups of Tally. The Profit & Loss Account in Tally get up¬dated instantly with ev¬ery transaction voucher entry. To open Profit and Loss account, select it from menu of Gateway of Tally. Balance Sheet:A balance sheet is statement of financial position for a particular period. To review balance sheet select it from menu of Gateway of Tally. Tally provides many other accounting inventory reports also. Other reports includes stock summary, cash flow, fund flow, outstanding list etc.

B.B.A. 1st Sem. Subject- Information Technology
45, Anurag Nagar, Behind Press Complex, Indore (M.P.) Ph.: 4262100, www.rccmindore.com 97
LEDGER EDITING To edit a ledger in Tally following steps are followed : Step 1:- Select the option to edit the ledger from :-Gateway of Tally > Accounts Info > Ledgers > Alter Step 2:- After selecting the option a list of ledgers is displayed from where a ledger is selected which is to be edit. Step 3:- After Selecting the ledger from the list of ledger a "Ledger Alteration" screen will appear from where you can alter the details of ledgers. In the above Ledger Alteration Screen you can edit the particular ledger and accept it.


