Swiss Agriculture - Federal Council
36
Neuchâtel, 2015 Swiss Agriculture Pocket Statistics 2015 International Year of Soils 07 Agriculture and Forestry 1112-1500
Transcript of Swiss Agriculture - Federal Council
Neuchâtel, 2015
Swiss AgriculturePocket Statistics 2015
International Year of Soils
07Agriculture and Forestry
1112-1500

GLOSSARY
The terms listed in the glossary are indicated in the text with an asterisk (*).Gross value added (GVA)Gross value added is the increase in the value of goods resulting from the production process. In the National Accounts, the gross value added is obtained by subtracting the intermediate con-sumption from the output.Livestock unit (LSU)The livestock unit allows different types of live-stock to be compared with one another. One LSU corresponds to the feed eaten and solid and liq-uid manure produced by a 650 kg cow. On this basis, conversion factors which depend on the age and sex of the animal are used (for example, a sheep which is more than 1 year old is equiva-lent to 0.17 LSU).Annual work unit (AWU)The annual work unit corresponds to the work of one full-time job over a year (based on 280 work-ing days).AgricultureThe term is used in a strict sense and does not include small production units.Utilised agricultural area (UAA)Area used for crop production, excluding summer pastures and woods.FarmAll the workers, equipment and means of produc-tion used to produce agricultural products. On the basis of the FSO’s agriculture census, one farm corresponds to the following minimum standards: 1 hectare of UAA* or 30 ares under specialised cultivation or 10 ares of crops grown under protec-tion or 8 sows or 80 fattening pigs or 300 poultry.OutputThe value of the goods and services produced for sale or for private final consumption (by producer households), for intermediate consumption on the farm (for example, forage for milk production) or for the production of fixed assets (plantations or livestock). Changes in stock are also taken into account.
NOTES
IndicesThe indices are produced by dividing an annual figure by the figure for the reference year and multiplying it by 100. This enables completely different figures to be compared, provided that the same reference year is used (for example, 1996=100).
Rounded figuresFigures are rounded up or down, which means that when the figures are added together they may differ from the total.
SourcesEurostat: Statistical office of the European Union
FOEN: Federal Office for the Environment
FSO: Federal Statistical Office
FSVO: Federal Food Safety and Veterinary Office
SCA: Swiss Customs Administration
SFU: Swiss Farmers’ Union

3
For several years agriculture in Switzerland has been in a state of upheaval. The figures in this pocket statistics give an overview of the status and the changes in individual areas of Swiss agriculture.
Context Page 4
Changes in agriculture are closely linked with events in other sectors of the economy, international trade, the policies of the Swiss Confederation and consumption.
Structures Page 9
The structures characterise the types of agriculture performed in Switzerland.
Production, yields and income Page 18
From food production to farm incomes: an overview of an economic sector in a state of upheaval.
Social factors Page 26
The specific working conditions in the agricultural industry influence the living conditions of the people working in this sector.
Effects on the environment Page 29
More than one third of the overall area of Switzerland is used for agriculture. As a result, agriculture has a major influence on the environment.
International comparisons Page 32
Agriculture in Switzerland compared with neighbouring countries.
Key figures at a glance Page 34
Ten key figures which summarise current trends.
CONTENTS

4
The agricultural and alpine agricultural areas together account for more than one third of the total area of Switzerland and therefore have a significant influence on the landscape. Between 1985 and 2009, 1.1 m2 of this land disappeared every second. The agricultural and alpine agricultural areas shrank by 5.4% (850 km2), equivalent to the size of the canton of Jura. While in the lowlands, 80% of the former agricul-tural area changed to permanent settlement and urban areas, in mountain areas, the overgrowing of alpine agricultural areas by shrubs and forests dominated. According to the latest survey, 9.3% of the alpine agricultural areas are overgrown.
Context
© FSO, Neuchâtel 2015
Land use1
1 Areas surveyed between 2004 and 2009The total area of Switzerland is 41,290 km2
Forest and woodsUnproductive areas (lakes, rivers, scrub vegetation, wetlands, rocks, scree, glaciers and perpetual snow)
Agricultural areas (excl. alpine agricultural areas)
Alpine agricultural areasSettlement and urban areas
31.3%
25.3%
23.4%
12.4%
7.5%
Source: FSO – Swiss Land Use Statistics (NOAS04)
© FSO, Neuchâtel 2015
Alpine agricultural areas 1
1 Areas surveyed between 2004 and 2009The alpine agricultural area is 5,139 km2
Favourable pastures in the Alp and Jura mountainsAlpine sheep-grazing pasturesOvergrown pastures in the Alp and Jura mountainsStony pastures in the Alp and Jura mountainsAlpine meadows
67.8%
11.2%
9.3%
6.2%5.4%
Source: FSO – Swiss Land Use Statistics (NOAS04)

5
Between 1995 and 2013, agriculture’s share in the gross value added* of the Swiss economy fell from 1.5% to 0.7%. Within the primary sector, agriculture’s share in the gross value added amounted to 91%. In 2013, the Swiss Confederation spent CHF 3.7 billion on the agricultural and food sectors. Of this amount, 78% was paid to eligible farms in the form of direct payments and social contributions.
© FSO, Neuchâtel 2015
Gross value added (GVA*) of agriculture and the Swiss economyAt current prices
Index 1995 = 100
40
60
80
100
120
140
160
180
1995 2000 2005 2010
Gross value addedof agriculture
Gross value added of the entire economy
2013: provisional
CHF 635 billion
CHF 4 billion
Sources: FSO – National accounts, branch accounts for the primary sector
2013
© FSO, Neuchâtel 2015
Federal expenditure on agriculture and food
In CHF billions
0
1
2
3
4
5
1990 1995 2000 2005 2010
Direct payments andsocial measures
Production and sales
Improving the production base
Administration, implemen-tation and monitoring
Source: FFA – Federal budget
2013

6
In 2013, 159,000 people worked in agriculture, less than half as many as in 1975. Of these, 55% worked part time. Out of every 5 people working in agriculture, 4 are family members. Over the past 20 years, 60% of food consumption (in terms of usable energy) was covered by domestic production. Self-sufficiency levels were highest for animal prod-ucts, particularly for milk.
© FSO, Neuchâtel 2015
Farm workers1 and resident population
In thousands of farm workers
0
50
100
150
200
250
300
350
400
1975 1980 1985 1990 1995 2000 2005
Family employees
Non-family employees
1 Pursuant to the definition for farms applicable since 1996
Sources: FSO – Farm structure survey, ESPOP and STATPOP
2013
In millions of inhabitants
0
1
2
3
4
5
6
7
8
9
Population permanentlyresident in Switzerland
© FSO, Neuchâtel 2015Source: SFU – Food statement
Self-sufficiency rate
In %, by usable energy
0
20
40
60
80
100
120
1990 1994 1998 2002 20061 2010 2012
Gross foodstuffs of animalorigin
Net foodstuffs of animalorigin2
Gross total foodstuffs
Net total foodstuffs2
Foodstuffs of plant origin
1 New calculation method since 20082 Excluding animal products manufactured from imported feed

7
In 2013, fruit and vegetables were the most commonly imported agricultural prod-ucts in terms of value. Drinks containing water were the most common exports (in the “drinks and alcoholic beverages” category) as well as coffee (in the “coffee, tea and spices” category). Imports of cheese (including quark) have grown significantly since 2006. This can be attributed to the liberalisation of the cheese trade between Switzerland and the EU. Between 2002 and 2007, customs duties and export subsidies were gradually abol-ished on both sides. The cheese trade has been fully liberalised since 1 June 2007.
© FSO, Neuchâtel 2015
–2500 –1500 –500 0 500 1500 2500
Fats and oilsFeed
Milk, eggs, honeyMiscellaneous food preparations
Coffee, tea, spicesSugar, confectionary and cocoa
Cereals, prod. of the milling industry and their prep.Meat, fish, crustaceans, molluscs and their prep.
Drinks and alcoholic liquidsFruit, vegetables and their preparations
Imports Exports
Imports and exports of the most important foodstuffs, 2013
Source: SCA – Swiss foreign trade statistics
In CHF millions
© FSO, Neuchâtel 2015
–80 000
–60 000
–40 000
–20 000
0
20 000
40 000
60 000
1990 1995 2000 2005 2010 2013
Imports and exports of cheese
Source: SCA – Swiss foreign trade statistics
In tonnes
Imports Exports

8
In 2012, households spent roughly 12% of their budgets on food, i.e. an average of CHF 1,200 a month, including meals and drinks in restaurants. At approximately CHF 141 a month, meat was the largest food expenditure item. In 2012, approximately 870 kg of food were consumed per person. Of this, 540 kg were from crop and 330 kg from animal production.
© FSO, Neuchâtel 2015Source: FSO – Household Budget Survey
Household expenditure, 2012Proportion of gross household income
Compulsory expenditure (taxes, social security contributions,basic health insurance)Housing and energyTransportEntertainment, leisure and cultureFood and non-alcoholic beveragesRestaurants and hotelsAlcoholic beverages and tobaccoSavingsOther expenditure
Average number of persons per household: 2.2
14.9%6.3%
1.1%
17.1%
8.0%6.4%
5.4%
13.1%
27.6%
© FSO, Neuchâtel 2015
0 50 100 150 200 250 300
Oil seedsPulses, nuts, chestnuts
StimulantsPlant-based oils and fats
Sugar and honeyPotatoes and starch
CerealsAlcoholic beverages
VegetablesFruit
Butter and animal fatsFish and shellfish
EggsMeat
Milk and dairy products (excluding butter)
Food consumption1, 2012
Source: SFU – Food statement
In kg of raw product per head1 Does not represent quantities actually consumed as losses (e.g. unsold or spoilt food) are not recorded completely.
Food from crop production:
Food from animal production:

9
The number of farms* declined from 79,500 in 1996 to 55,200 in 2013. Compared with the previous year, around 1,400 farms closed down, which equates to 4 farms a day. The opposite trend was observed among organic farms, the number of which increased by more than 150 between 2012 and 2013. Between 1996 and 2013, the average utilised agricultural area per farm grew by 5.4 hectares to reach 19 hectares, which equates to an increase of 40%.
Structures
60
80
100
120
140
160
180
200
1996 1998 2000 2002 2004 2006 2008 2010 2013
6,000 organic farms
19 hectares per farm
© FSO, Neuchâtel 2015Source: FSO – Farm structure survey
Farms and utilised agricultural area
Number of organic farms
Utilised agricultural area* per farm
Number of farms*
Figures from 2013
Index 1996 = 100
55,200 farms
© FSO, Neuchâtel 2015Source: FSO – Farm structure survey
Number of farms by size category
Index 1996 = 100
0
50
100
150
200
250
1996 1998 2000 2002 2004 2006 2008 2010 2013
0 – <1010 – <2020 – <5050 +
ha of utilised agricultural area*
10
BS
BE
AG
FR
GE
SO
VD
TI
VS
SG
ZH
GR
NE
BLJU
LU
ZG
NW
OWUR
SH
TG
AIAR
SZGL
< 10.0 10.0 – 14.9 15.0 – 19.9 20.0 – 24.9 ≥ 25.0 CH: 15.2 %
Proportion of farms with direct sale on the total number of farms, in %
by canton
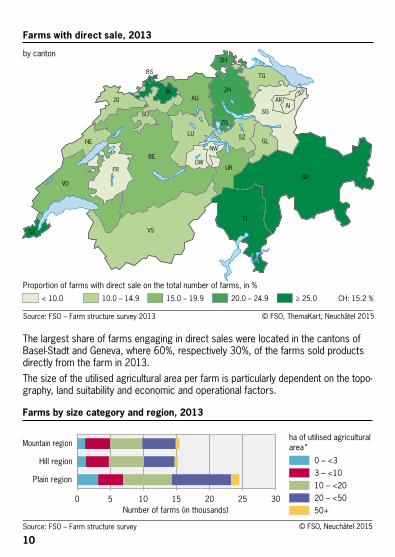
Farms with direct sale, 2013
Source: FSO – Farm structure survey 2013 © FSO, ThemaKart, Neuchâtel 2015
© FSO, Neuchâtel 2015Source: FSO – Farm structure survey
0 5 10 15 20 25 30
Plain region
Hill region
Mountain region
0 – <33 – <1010 – <2020 – <5050+
Farms by size category and region, 2013
Number of farms (in thousands)
ha of utilised agricultural area*
The largest share of farms engaging in direct sales were located in the cantons of Basel-Stadt and Geneva, where 60%, respectively 30%, of the farms sold products directly from the farm in 2013. The size of the utilised agricultural area per farm is particularly dependent on the topo-graphy, land suitability and economic and operational factors.

11
Up until 2005, farms converting to organic farming were mostly found in the moun-tain region. Between 2006 and 2010, however, these farms also showed the largest decline. Since then, the number of organic farms has increased again in all three re-gions. The majority of farms specialise in grazing livestock. This made up 60% of all farms in 2013. Between 2012 and 2013, the largest structural change was observed among farms specialising in permanent crops, such as vineyards and fruit cultiva-tion. The decline amounted to 5%.
© FSO, Neuchâtel 2015Source: FSO – Farm structure survey
Organic farms by region
Number of farms (in thousands)
0
500
1000
1500
2000
2500
3000
3500
4000
1990 1995 2000 2005 2010
Plain regionHill region
Mountain region
2013
© FSO, Neuchâtel 2015Source: FSO – Farm structure survey
Farms by type of farming, 2013
Specialist grazing livestockMixed crops – livestockSpecialist field cropsSpecialist permanent cropsSpecialist granivores1
Specialist horticulture
Total farms = 55,200
59.9%19.6%
7.7%
3.9%7.1%
1.8%
1 Mainly pig and poultry farming

12
Since 2000, cattle numbers have stabilised at between 1.5 and 1.6 million head. The number of pigs peaked in 2006 and has shown a downward trend ever since. The number of poultry has seen a continual increase.
Numbers of livestockIn thousands1, in May
2003 2008 2013
Cattle 1 570 1 600 1 560 of which cows 700 730 700Horses 50 60 60Sheep 440 450 410Goats 70 90 90Pigs 1 530 1 540 1 480Poultry 7 440 8 470 10 000
1 Rounded
Source: FSO -– Farm structure survey © FSO, Neuchâtel 2015
© FSO, Neuchâtel 2015Source: FSO – Farm structure survey
Numbers of livestock
Index 1996 = 100
80
90
100
110
120
130
140
150
160
170
1996 1998 2000 2002 2004 2006 2008 2010 2013
CattleCowsSheepPigsGoatsChickens

13
Between 2012 and 2013, the number of dairy cows fell by 4,600. During the same period, the number of other cows, which mainly includes suckler cows, increased by 2,450.The trend towards meat production using suckler cows therefore continued.In 1990, the majority of sheep were reared in part-time farms. The number of these sheep fell by more than half between 1990 and 2013, whereas the number of sheep reared in full-time farms doubled. The overall sheep population has been in decline since 2006. In 2013, around 22% of sheep were reared on organic farms.
© FSO, Neuchâtel 2015Source: FSO – Farm structure survey
Cow numbers
in thousands
0
100
200
300
400
500
600
700
800
1999 2001 2003 2005 2007 2009 2011 2013
Dairy cowsOther cows
© FSO, Neuchâtel 2015
Sheep farming
In thousands
0
100
200
300
400
500
1990 1996 2000 2005 2010
Sheep in full-time farms
Sheep in part-time farms
Pursuant to the definition for farms applicable since 1996
Source: FSO – Farm structure survey
2013

14
The total utilised agricultural area decreased by 22,600 hectares between 2000 and 2013. 70.6% of the utilised agricultural area* consisted of grassland (artificial and permanent meadows, pastures).In 2013, 22,200 farms* grew cereal crops. The area under cereals shrank by a quar-ter compared to 1996. Bread cereals are now grown over an area of 84,500 hectares, and fodder cereals over an area of 63,000 hectares.
© FSO, Neuchâtel 2015Source: FSO – Farm structure survey
Use of utilised agricultural area, 2013Excluding alpine areas
GrasslandCerealsOther arable landPotatoes, sugar and fodder beetOilseedsPermanent cropsOther utilised agricultural area
Total area = 1,050,000 ha
70.6%
14.0%
6.3%
2.6%3.0%
1.3%
2.3%
© FSO, Neuchâtel 2015Source: FSO – Farm structure survey
Area under cereals
In thousands of hectares
0
40
80
120
160
200
1996 1998 2000 2002 2004 2006 2008 2010 2013
WheatBarleyOatsGrain maizeOther cereals

15
Sunflower oil is mainly imported, while most rapeseed oil is produced in Switzerland. The increasing rapeseed growing areas have been cultivated by around 6,600 farms in the last five years. The planting of Christmas trees as a niche production continued to develop between 1996 and 2013. The cultivation area has more than doubled. In 2013, 600 farms cultivated on average one hectare each.
© FSO, Neuchâtel 2015Source: FSO – Farm structure survey
Area under oil seeds for edible production oil
In hectares
0
5 000
10 000
15 000
20 000
25 000
30 000
1996 1998 2000 2002 2004 2006 2008 2010 2013
Rapeseed for edible oil production
Sunflowers for edible oil production
© FSO, Neuchâtel 2015Source: FSO – Farm structure survey
Christmas trees
In hectares
0
100
200
300
400
500
600
700
0
100
200
300
400
500
600
700
1996 1998 2000 2002 2004 2006 2008 2010
Christmas tree cultivationarea
Farms with christmas trees
2013
Number of farms

16
Canton figures, 2013
Farms Jobs Utilised agricultural area*
Cattle Dairy cows Pigs
In thousands In thousands of ha In thousands In thousands In thousands
ZH 3 708 11.1 74 93 36 39
BE 11 250 33.3 190 312 123 256
LU 4 833 13.7 77 150 62 414
UR 608 1.6 7 11 4 2
SZ 1 680 4.3 24 43 17 18
OW 674 1.7 8 18 8 10
NW 474 1.3 6 12 5 11
GL 387 1.0 7 11 5 2
ZG 583 1.7 11 28 9 18
FR 2 973 8.7 76 133 52 80
SO 1 482 4.1 32 43 16 27
BL/BS 952 3.2 22 28 10 10
SH 595 1.8 16 17 3 20
AR 758 1.7 12 22 10 20
AI 497 1.1 7 14 6 22
SG 4 268 11.3 72 136 59 178
GR 2 476 6.6 55 72 17 5
AG 3 493 10.2 61 87 27 95
TG 2 785 8.6 50 73 39 186
TI 1 134 2.9 14 10 4 3
VD 3 841 12.9 109 111 34 43
VS 3 446 9.2 37 31 11 1
NE 847 2.2 32 41 15 8
GE 402 1.7 11 3 0 1
JU 1 061 3.0 40 59 16 14
Switzerland 55 207 158.9 1 050 1 557 587 1 485
ZH: Zurich, BE: Bern, LU: Lucerne, UR: Uri, SZ: Schwyz, OW: Obwalden, NW: Nidwalden, GL: Glarus, ZG: Zug, FR: Fribourg, SO: Solothurn, BS: Basel Stadt, BL: Basel Landschaft, SH: Schaffhausen, AR: Appenzell Ausserrhoden, AI: Appenzell Innerrhoden, SG: St. Gallen, GR: Graubünden, AG: Aargau, TG: Thurgau, TI: Ticino, VD: Vaud, VS: Valais, NE: Neuchâtel, GE: Geneva, JU: Jura
Sources: FSO – Farm structure survey, Regional accounts for agriculture

17
Canton figures, 2013 (continuation)
Proportion of grassland in the UAA*
Proportion of organically managed UAA*
Output of agriculture Subsidies1
In % In % In CHF2 per ha In CHF2 per ha
ZH 56 10 10 700 2 400
BE 74 10 9 000 2 900
LU 80 7 12 600 3 100
UR 98 13 5 500 3 700
SZ 93 11 6 700 3 300
OW 98 30 9 000 4 100
NW 98 17 8 300 3 600
GL 98 24 6 000 3 500
ZG 80 14 10 100 3 000
FR 68 5 9 600 2 800
SO 67 11 7 400 2 500
BL/BS 71 14 8 400 2 500
SH 32 4 9 000 2 300
AR 98 18 8 300 3 100
AI 97 5 10 200 3 300
SG 89 11 10 400 3 100
GR 94 59 4 300 3 800
AG 54 7 10 700 2 500
TG 60 11 16 300 2 700
TI 84 15 9 600 3 100
VD 44 5 9 900 2 600
VS 77 19 13 300 3 200
NE 85 7 6 200 2 400
GE 24 4 18 800 2 100
JU 73 11 5 400 2 700
Switzerland 71 12 9 700 2 900
1 Data according to regional accounts for agriculture. They are mainly comprised of direct payments.2 Rounded to the nearest hundred
© FSO, Neuchâtel 2015

18
Between 2003 and 2013, meat production increased by 8%. Once again, a noticea-ble increase was seen for poultry meat. Since 2008, more than 4 billion kg of milk have been produced every year. In 2013, the milk yield fell by around 2% compared with the previous year. Just over a third of the milk yield was used to make cheese in 2013. Butter manufacture grew from 37,000 tonnes in 2000 to 47,000 tonnes in 2013. Surplus butter was ex-ported.
Production, yields and incomeAnimal production1
In thousands of tonnes
2003 2008 2013
Meat2
Cattle 137 135 143 Pigs 230 231 235 Sheep 6 5 5 Poultry 56 64 80Cow’s milk 3885 4071 40033
Chicken’s eggs 36 37 48
1 Gross domestic production Source: SFU – Animal production2 Usable output, carcass weight © FSO, Neuchâtel 20153 Provisional
© FSO, Neuchâtel 2015
Milk processing, 2013
CheeseFodder for animalsButterDrinking milkDurable dairy goodsCreamYoghurtOther uses, weight loss
13.4%
8.1%
7.1%
4.0%
11.4%
36.8%
5.4%
Source: SFU – Milk statistics
13.7%

19
According to the livestock feed balance, the majority of animal feed consisted of grass and hay in 2012. 77% of feed was from domestic fodder crops. 12% of the total feed was imported. The number of animal welfare convictions has risen dramatically since the revised Animal Welfare Act came into force in September 2008. In 2013, the offences primarily concerned domestic animals (mainly dogs), while a third related to farm animals, which mainly involved cattle
Animal feed balance sheet, 2012Domestic production and imports
Forage (grass, hay, green maize, root crops etc.)
Feedstuffs of vegetable origin (cereals, rice, potatoes, vegetable fats and oils etc.)
By-products of processing (milling, brewing, starch and sugar production, oil cake)Feedstuffs of animal origin (animal fats and oils, milk products etc.)
Other feedstuffs (vegetables, fruit etc.)
Total quantity = 8.4 millions of tonnes of dry matter
Source: SFU – Animal feed balance
77.6%
11.4%
8.3%
2.0%0.7%
© FSO, Neuchâtel 2015
© FSO, Neuchâtel 2015
Animal welfareConvictions
0200400600800
1000120014001600
2006 2007 2008 2009 2010 2011 2012 2013
Domestic animalsFarm animalsOther animals
Source: FSVO – Statistics on criminal proceedings

20
Crop yields are largely dependent on the weather. The cold and wet spring in 2013 caused delays in crop cultivation. Some crops, such as potatoes and sugar beet, were unable to make up for the lag. However, the sunny and warm summer ensured good vegetable yields. From 1990 to 2013, the number of tractors increased by 14% to 136,000. The trend towards heavier tractors continued. Around 1,400 or 1% of tractors were equipped with a particle filter.
Crop production1
In thousands of tonnes
2003 2008 2013
Cereals 847 1002 838Potatoes 458 473 341Sugar beet 1257 1625 1376Vegetables 293 326 381Fruit and berries 338 322 291
2013: provisional Source: SFU – Crop production1 Gross production minus losses in the field and on the farm © FSO, Neuchâtel 2015
© FSO, Neuchâtel 2015
0
20 000
40 000
60 000
80 000
100 000
120 000
140 000
1990 1995 2000 2005 2010
up to 1.5 tfrom 1,501 to 2.5 tfrom 2,501 to 5 tfrom 5,001 to 10 tover 10 t
Source: FSO – Road Motor Vehicle Statistics
1 with green registration plates, including forestry tractors
Agricultural tractors1 by total weight
Number of tractors
2013

21
The total output of agriculture in 2014 was estimated at CHF 10.6 billion. This was an increase of 3.7% compared to the previous year. The increase in crop harvests and delivered milk yields as well as the higher milk prices are the main reasons be-hind this growth.Between 1985 and 2013, the area under cereals decreased by 20%. The decline in volume amounted to 6%. Due to a fall in prices, the estimated output fell even more sharply, amounting to CHF 379 million in 2014, which was only a third of the value in 1985.
Output*
© FSO, Neuchâtel 2015Source: FSO – Economic accounts for agriculture
0
2000
4000
6000
8000
1985 1990 1995 2000 2005 2010
Crop productionAnimal production
In CHF million, at current basic prices
2013: provisional2014: estimate
2014
© FSO, Neuchâtel 2015
Cereals production and output*
Thou
sand
tonn
es
0
200400
600800
10001200
14001600
0
200400
600800
10001200
14001600
1985 1990 1995 2000 2005 2010
Production volume Output (at current prices)
2013: provisional, 2014: estimate
CHF
milli
on
Source: FSO – Economic accounts for agriculture
2014
22
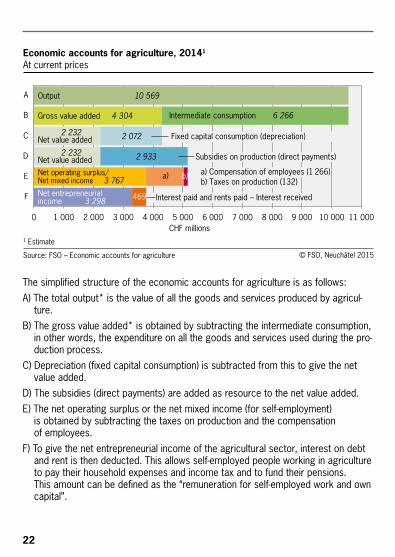
The simplified structure of the economic accounts for agriculture is as follows:A) The total output* is the value of all the goods and services produced by agricul-
ture.B) The gross value added* is obtained by subtracting the intermediate consumption,
in other words, the expenditure on all the goods and services used during the pro-duction process.
C) Depreciation (fixed capital consumption) is subtracted from this to give the net value added.
D) The subsidies (direct payments) are added as resource to the net value added.E) The net operating surplus or the net mixed income (for self-employment)
is obtained by subtracting the taxes on production and the compensation of employees.
F) To give the net entrepreneurial income of the agricultural sector, interest on debt and rent is then deducted. This allows self-employed people working in agriculture to pay their household expenses and income tax and to fund their pensions. This amount can be defined as the “remuneration for self-employed work and own capital”.
© FSO, Neuchâtel 2015
Economic accounts for agriculture, 20141
At current prices
0 1 000 2 000 3 000 4 000 5 000 6 000 7 000 8 000 9 000 10 000 11 000
F
E
D
C
B
A
CHF millions
Net value added
Net value added
Net operating surplus/Net mixed income
Net entrepreneurialincome
Gross value added 4 304
Output 10 569
Intermediate consumption 6 266
Fixed capital consumption (depreciation)
Subsidies on production (direct payments)
a) Compensation of employees (1 266)b) Taxes on production (132)
Interest paid and rents paid – Interest received
1 Estimate
2 232 2 072
2 232 2 933
3 767 a) b)
3 298 469
Source: FSO – Economic accounts for agriculture

23
Output from animal production was estimated at CHF 5.2 billion in 2014. The de-velopment was shaped in particular by the fall in prices for milk, cattle and pigs during the 1990s. 38% of intermediate consumption was spent on animal feed (including feed pro-duced on farms for their own needs). Specialised processes such as soil cultiva-tion, harvesting with special machinery, artificial insemination etc., were increas-ingly contracted out to third parties (agricultural services). The share of these costs in intermediate consumption rose from 6% (1990) to 11% (2014 estimation).
© FSO, Neuchâtel 2015Source: FSO – Economic accounts for agriculture
Details of output of animal products
In CHF millions, at current basic prices
0
1000
2000
3000
4000
1985 1990 1995 2000 2005 2010
MilkCattlePigsPoultry and chicken's eggsOther animals and animal products
2013: provisional2014: estimate
2014
© FSO, Neuchâtel 2015
Intermediate consumption in agriculture
0
1000
2000
3000
4000
5000
6000
7000
1990 1995 2000 2005 2010 2014Other goods and servicesAgricultural services
Maintenance of buildings and machinery
FeedstuffsVet and medicinesEnergy
Seeds, plants, fertiliser and plant protection products
2014: estimate
In CHF millions, at current prices
Source: FSO – Economic accounts for agriculture

24
Production costs continued to rise between 1990 and 2014, although the prices of many agricultural products fell. Thanks to improved labour productivity and the intro-duction of direct payments, the average remuneration paid for labour in agriculture (at current prices) increased from the early 2000s.The output per hectare showed a downward trend in the 1990s. Since then it has fluctuated at around CHF 10,000/hectare. It particularly depends on milk prices, yields and slaughter markets for cattle and pigs.
© FSO, Neuchâtel 2015
Output, income and subsidies in agriculture per work unitIn CHF thousands per annual work unit (AWU*), at current prices
2014: Estimate0
20
40
60
80
100
120
140
160
1990 1995 2000 2005 2010 2014
Total outputIntermediate consumption and fixed capital consumptionCompensation of employ-ees and net entrepreneurial incomeSubsidies on production (direct payments)
Source: FSO – Economic accounts for agriculture
Output, income and subsidies in agriculture per hectareIn CHF thousands per hectare, at current prices
0
2
4
6
8
10
12
14
1990 1995 2000 2005 2010 2014
© FSO, Neuchâtel 2015
2014: Estimate
Source: FSO – Economic accounts for agriculture
Total outputIntermediate consumption and fixed capital consumptionCompensation of employ-ees and net entrepreneurial incomeSubsidies on production (direct payments)

25
The agricultural income per farm amounted to CHF 61,000 in 2013. The average yearly income per (full-time) family member was CHF 47,000 on average. A farming household earned almost a third of its total income outside of agriculture. Up until 2008, food became increasingly expensive for consumers. This was followed by a decline in the national consumer prices index until 2012, and a subsequent rise in 2013. Producer prices are heavily influenced by the milk and pig market. These prices fell, particularly between 2009 and 2012, and recovered in 2013.
© FSO, Neuchâtel 2015
Total income per farm
In CHF thousands, at current prices
0102030405060708090
1990 1995 2000 2005 2010
Agricultural income
Non-farm income
Source: Agroscope – Farm Accountancy Data Network
2013
© FSO, Neuchâtel 2015
Price indices linked to agriculture
Index 1994 = 100
70
80
90
100
110
120
1994 1998 2002 2006 2010
Producer price index for agricultural products
Purchase price index for means of agricultural production
National consumer price index for food and non-alcoholic beverages
Sources: FSO – Swiss Consumer Price Index; SFU
2013

26
In 2013, a total of 903 apprentices obtained a federal VET diploma in farming, 120 of whom were women. This was 83 more diplomas than in the previous year. Further-more, 134 people successfully completed the federal certificate in agriculture, which was introduced in 2011. Between 2000 and 2013, the age pyramid of farmers has shifted to the right. In 2013, more than half of farms were managed by individuals aged over 50.
Social factors
© FSO, Neuchâtel 2015Source: FSO – Farm structure survey
0%
5%
10%
15%
20%
< 25 25–29 30–34 35–39 40–44 45–49 50–54 55–59 60–64 > 64Age
200020102013
Farmers by age group1
1 As % of farmers whose age is known (approx. 90%)
0200400600800
1000120014001600
1985 1990 1995 2000 2005 2010
Farmers with federal voca-tional education certificate
Farmers with advanced diploma
Federal farm household management certificate
Farmers with federal PET diplomaFarmers with federal VET certificate
Number
Education in agricultureVocational qualifications
© FSO, Neuchâtel 2015Source: FSO – Statistics on basic vocational education
2013

27
In 2013, agricultural work was mainly carried out by farmers and their wives or part-ners. 4,100 farms were managed by women. Almost 8% of employees were sons of the family running the farm.For farm work, one third of family members received no salary. 65% of the approx-imately 30,000 wives/partners were not paid, but had a share in the income from self-employment.
© FSO, Neuchâtel 2015Source: FSO – Farm structure survey, complementary survey 2013
Workers on family farms, 2013
Total workers: 154,000including family members: 130,000
Farmers (male)Farmers (female)Wife/husband, partnerParents/in-lawsSonsDaughtersOther relativesWorkers from outside the family
2.7%
32.4%
19.2%10.3%
7.9%
3.0%
8.6%
15.8%
© FSO, Neuchâtel 2015Source: FSO – Farm structure survey, complementary survey 2013
Income1 from employment of family members for agricultural work, 2013
Total family members: 130,0001 Mixed income or salary
Male farmers with mixed incomeFemale farmers with mixed incomeFamily members with salaryWife/husband, partner without salaryOther women without a salarySons without a salaryOther men without a salaryFamily members not stated
3.2%
38.5%
18.0%
14.7%
7.3%
6.0%
4.6%7.6%

28
In 2013, 37% of farmers had an occupational pension and 57% had a private pension in addition to AHV (old age and survivors’ insurance). The normal weekly hours worked by employees and self-employed persons who work full-time in agriculture and forestry are above the average level for all economic sectors.
Sole owner
Joint owner
Occupationalpension
(2nd pillar)
Private pension(3rd pillar)
Farmer’s property and pensions1, 2013
© FSO, Neuchâtel 2015Source: FSO – Farm structure survey, complementary survey 2013
1 Level of employment not taken into account
confidence interval (95%)
0% 10% 20% 30% 40% 50% 60% 70%
0 10 20 30 40 50 60 70
Normal weekly working hours for full-time employed people, 2013
1
© FSO, Neuchâtel 2015Source: FSO – Swiss Labour Force Survey
Agriculture and forestry
All economic branches
Hours per week
Self
Including self-employed people and employees in their own company (joint stock company and limited-liability company).
Empl
oyee
s
All economic branches
Agriculture and forestry

29
In 2013, around 130,000 hectares of ecological compensation areas were eligible for subsidies. That amounts to 12.4% of the utilised agricultural area. This area in-creased by around 3,600 hectares compared to the previous year. Most of the eco-logical compensation areas are extensively managed pastures. In order to promote natural biodiversity, the Swiss Confederation supports ecological compensation areas demonstrating particular biological quality. These areas equate to 4.1% of the utilised agricultural area.
Effects on the environmentEcological compensation areasAreas eligible for subsidies1
In thousands of hectares
© FSO, Neuchâtel 2015Source: Federal Office for Agriculture
020406080
100120140
1999 2001 2003 2005 2007 2009 2011 2013
Plain regionHill regionMountain region
1 The number of standard fruit trees is converted into units of area. One tree corresponds to one are.
© FSO, Neuchâtel 2015
Extensively managed grassland, less intensively managed grassland, litter meadowsExtensively managed pasture land, wood pasturesHedges, copses in fields and on river banksOrchards with trees on standard rootstock1
Vineyards with natural biodiversity
19.7%
75.5%
Ecological compensation areas of particular biological quality, 2013According to the Swiss Ecological Quality Ordinance
Source: Federal Office for Agriculture
Ecological compensation areas of particular biological quality: 44,000 hectares
2.3%1.6% 1.0%
1 The number of standard fruit trees is converted into units of area. One tree corresponds to one are.

30
Nitrogen inputs and their uptake by crop production led to a nitrogen surplus in the agricultural area (including alpine meadows) of 57 kg/hectare in 2012. Half of these inputs came from farmyard manure. Nitrogen can become a pollutant in the environ-ment (as ammonia in the air or as nitrate in groundwater). Although water quality in Swiss lakes, rivers and streams has been constantly im-proving over recent years, nitrate concentrations still remain too high in agricultural areas.
© FSO, Neuchâtel 2015
1 According to the Organisation for Economic Co-operation and Development (OECD) method.
Nitrogen balance of agricultural land, 20121
Amounts of nitrogen inputs and uptake from agricultural soil
In thousands of tonnes
–200
–100
0
100
200
300
Input Output Balance
Nitrogen uptake from forage crops
from other crops
Manure Nitrogen surplus = 88 000 tonnes
Source: FSO – Nitrogen balance
Inorganic and organic fertilisers (excluding manure)Biological fixationAtmospheric deposition
© FSO, Neuchâtel 2014
Maximum nitrate concentration in groundwater, 2012According to land use in catchment areas
0%
20%
40%
60%
80%
100%
Arable land(93 measu-
rement stations)
> 40 mg/l 25–40 mg/l10–25 mg/l< 10 mg/l
Prop
ortio
n of
mea
sure
men
t sta
tions
Source: FOEN – NAQUA National Groundwater Monitoring
The Swiss Federal Ordinance on protection of lakes and rivers requires concentrations of nitrate in groundwaterto be at the most 25 milligrammes per litre.
Grass and livestockfarming(142)
Summer pastureland and
unproductiveareas (35)
All measurementstations, including
settlements, transport, forest (533)

31
The share of Switzerland’s greenhouse gas emissions caused by agriculture de-creased between 1990 and 2012 from 11.3% to 10.2%, despite a trend towards growing emissions in the economy as a whole.All Swiss breeding bird populations have shown a positive trend since 1990. How-ever, this trend is predominantly limited to species that are already common. As part of the “Environmental Objectives for Agriculture” (2008), the Federal Offices for Envi-ronment and for Agriculture classified 46 “target species and indicator species”. Despite temporary increases, their numbers have shown a negative trend since 1990.
Agriculture, forestry and fishing
Other economic sectors
Households
© FSO, Neuchâtel 2015Source: FSO – Environmental accounts
Greenhouse gas emissions1
In CO equivalents in thousand tonnes
1 CO2, CO2 of the biomass, N2O, CH4 and synthetic gases
2
0
10 000
20 000
30 000
40 000
50 000
60 000
70 000
1990 1995 2000 2005 2010 2012
© FSO, Neuchâtel 2015
Population of breeding birds
Index 1990 = 100Birds breeding regularly (173 species)
Species characteristic of agricultural land (38 species)
Target species in Environmental objectives in agriculture (46 species)
Source: Swiss Ornithological Institute Sempach – Swiss Bird Index®
5060708090
100110120130
1990 1994 1998 2002 2006 2010 2013

32
Compared to other European countries, Switzerland has a rather low level of structural change in agriculture, compared to Poland, which has seen a decline in over 35% of farms in the space of 5 years. The size of farms depends on their legal status, the type of crop or animal production and the climatic and topographic conditions.
Internationale Vergleiche
–45% –40% –35% –30% –25% –20% –15% –10% –5% 0%
Trend in number of farms between 2007–2010
In %
© FSO, Neuchâtel 2015Source: Eurostat – Agricultural census 2010
PolandGermanyUnited KingdomAustriaHungaryNetherlandsDenmarkSpainSwitzerlandItalyFrance
0 10 20 30 40 50 60 70 80 90
ItalyHungary
PolandSwitzerland
AustriaSpain
NetherlandsFrance
GermanyDenmark
United Kingdom
Utilised agricultural area by holding, 2010
In hectares
© FSO, Neuchâtel 2015Source: Eurostat – Agricultural census 2010

33
Open cropland as a percentage of total utilised agricultural area (UAA) in Switzerland is low compared to other European countries and is below the average in the EU-27 countries. The utilised agricultural area by inhabitant depends on many factors, including the land area, population density and the intensity of agricultural use. For example, Spain’s utilised agricultural area per person was five times higher than that of the Netherlands, where intensive agricultural production is carried out.
0% 10% 20% 30% 40% 50% 60% 70% 80% 90% 100%
United KingdomSwitzerland
SpainAustria
ItalyNetherlands
FranceGermany
PolandHungary
Denmark
Proportion of arable land in the utilised agricultural area, 2010
In %
© FSO, Neuchâtel 2015Source: Eurostat – Agricultural census 2010
0 1000 2000 3000 4000 5000 6000
NetherlandsSwitzerland
GermanyItaly
United KingdomAustriaPolandFrance
HungaryDenmark
Spain
Utilised agricultural area per inhabitant, 2010
m2 per inhabitant
© FSO, Neuchâtel 2015Source: Eurostat – Agricultural census 2010

34
Key figures at a glanceTrends of the past 10 years according to a selection of 10 key figures:
Key figure Page Trend1 2004–2013
Trend1 2012–2013
Social factors
Total income per farm 25
Normal weekly working hours 28
Economy
Number of farms 9
Number of jobs 6
Gross value added 5
Producer price index 25
Environment
Organic area 9
Ecological compensation areas 29
Nitrogen input2 30
Populations of breeding birds in agricultural areas
31
1 When the difference in the key figure average between 2004/2006 and 2011/2013 or between 2012 and 2013 is greater than +/–3%, we speak of an increase or decrease. Otherwise the indicator is indicated as stable.
2 Trends for 2003–2012 and 2011–2012
© FSO, Neuchâtel 2015

35
Visit our website: www.statistics.admin.chTopic: Agriculture, forestry
Publisher: Federal Statistical Office (FSO), Neuchâtel, Switzerland
This brochure is available in PDF format in English, German, French, and Italian at: www.bfs.admin.ch
Concept and editing: Sibylle Meyre, FSO
Layout and graphics: DIAM Section, Prepress / Print
Translation: FSO Language Services
Cover graphics: FSO; Concept: Netthoevel & Gaberthüel, Biel Photograph: © Florian Kohler, FSO
Additional information: Telephone: +41 (0)58 467 24 [email protected]
Ordering from the FSO:Order number: 1112-1500Telephone: +41 (0)58 463 60 60Fax: +41 (0)58 463 60 [email protected]
© FSO 2015
Would you like to find out about our most recent publications?Subscribe to our newsmail: http://bfs.admin.internetgalerie.ch
Additional information is also available from:www.foag.admin.ch (Federal Office for Agriculture)www.environment-switzerland.ch (Federal Office for the Environment)www.sbv-usp.ch (Swiss Farmers’ Union)
Would you like more information?
IMPRINT