Sweetpotato in China: Economic Aspects and Utilization in ...
80
Sweetpotato in China: Economic Aspects and Utilization in Pig Production Jikun Huang, Jun Song, Fanbin Qiao, and Keith O. Fuglie International Potato Center East, Southeast Asia and Pacific Region (CIP-ESEAP) Kebun Percobaan Muara Jalan Raya Ciapus Bogor 16610 Indonesia
Transcript of Sweetpotato in China: Economic Aspects and Utilization in ...

Sweetpotato in China: Economic Aspects
and Utilization in Pig Production
Jikun Huang, Jun Song, Fanbin Qiao, and Keith O. Fuglie
International Potato Center East, Southeast Asia and Pacific Region (CIP-ESEAP)
Kebun Percobaan Muara Jalan Raya Ciapus
Bogor 16610 Indonesia

2
The International Potato Center (CIP) seeks to reduce poverty and to achieve food security on a sustained basis in developing countries through scientific research and related activities on potato, sweetpotato and other root and tuber crops and on the improved management of natural resources in the Andes and other mountain areas. CIP is a Future Harvest Center supported by the Consultative Group on International Agricultural Research (CGIAR).

3
Sweetpotato in China: Economic Aspects
and Utilization in Pig Production
Jikun Huang, Jun Song, Fanbin Qiao, and Keith O. Fuglie *
International Potato Center
East, Southeast Asia and Pacific Region (CIP-ESEAP) Kebun Percobaan Muara
Jalan Ra ya Ciapus Bogor 16610
Indonesia
_________________________________________________ * Jikun Huang, Jun Song, Fanbin Qiao are with the Center for Chinese Agricultural Policy, Chinese Academy of Sciences, Beijing, China. Keith O. Fuglie is with Internat ional Potato Center and is based in Bogor, Indonesia.

4
Acknowledgements: This report is based on a project entitled “Efficiency of Sweetpotato as Substitute for Maize as Feed in Pig Production in China, ” supported by the International Potato Center. The authors would like to thank Dinghua Hu, Yanmei Lu, Xuemei Zhang, Jun Qiu, Jinxia Wang, Yuying Wang, and Junqi Rui for assistance with the farm household surveys, Ninghui Li, Cunhui Fan, and Ping Qin for the excellent assistance in the various stages of data analysis, and Gregory Scott, Scott Rozelle, and Thomas S. Walker for their valuable suggestions and support during the course of this study. Correct citation:
Jikun Huang, Jikun, Jun Song, Fanbin Qiao, and Keith O. Fuglie. Sweetpotato in China: Economic Aspects and Utilization in Pig Production. International Potato Center (CIP), Bogor, Indonesia, 2003.
A publication of:
International Potato Center, East, Southeast Asia and the Pacific Region (CIP -ESEAP), P.O. Box 929, Bogor 16309, Indonesia.
Press run: 300 Printed in Indonesia May, 2003

5
Table of Contents Executive Summary 3 1. Introduction and Overview of the Study 6
1.1 Introduction 6 1.2 Objectives of the Study 9 1.3 Structure of the Report 9
2. Sweetpotato Production and Utilization in China 11
2.1 Sweetpotato Production 11 2.2 Sweetpotato Utilization 19 2.3 Sweetpotato Food Balance Sheet 24
3. Sweetpotato Production and Utilization in Major Pig Producing Areas 27
3.1 Data and Samples 27 3.2 Sweetpotato Production and Utilization 34 3.3 Linkage of Pig and Sweetpotato Production 38 3.4 Farmers' Perceptions of Sweetpotato Production and Utilization 44
4. Financial Profitability of Sweetpotato, Maize and Other Competing Crops 46
4.1 Background Data 46 4.2 Financial Profitability Based on Secondary Time Series Data 48 4.3 Financial Profitability Based on Primary Household Survey Data 51
5. Efficient Use of Sweetpotato and Maize as Feed in Pig Production 55
5.1 Notes on the Methodology 55 5.2 Data and Policy Description 57 5.3 Results of PAM Analyses 61
6. Conclusions and Implications 67 References 69 Appendix Tables 72
6
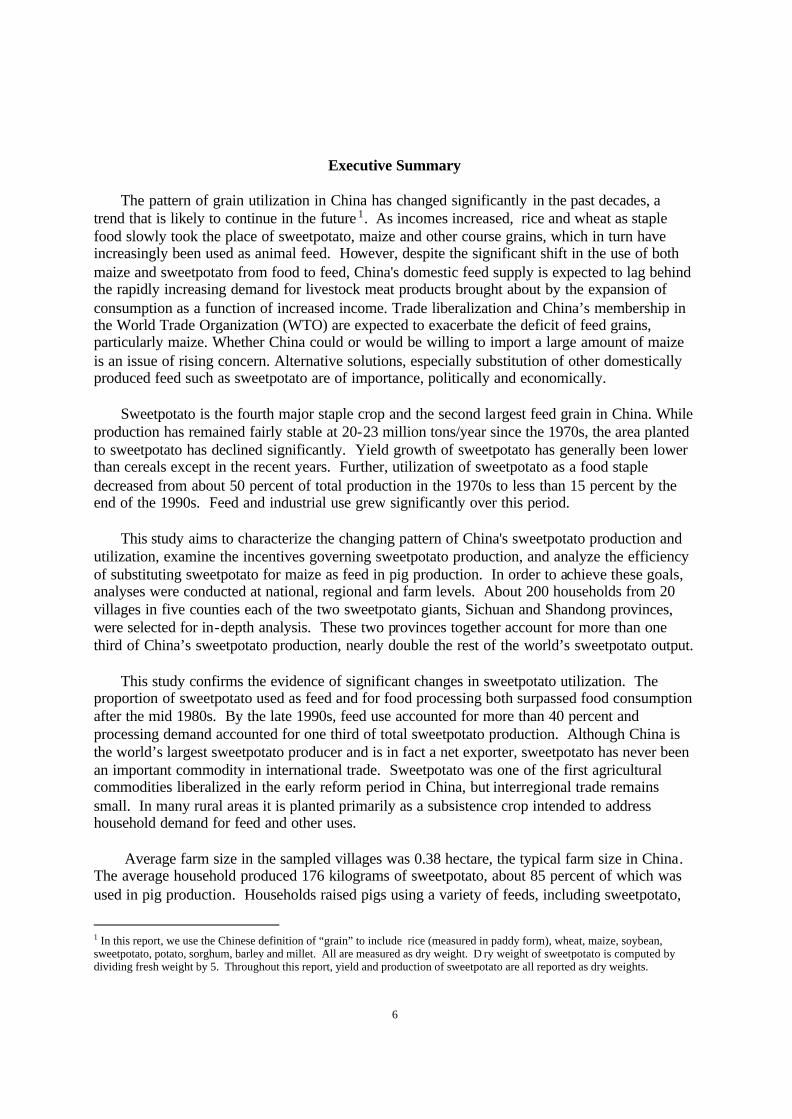
Executive Summary
The pattern of grain utilization in China has changed significantly in the past decades, a
trend that is likely to continue in the future 1. As incomes increased, rice and wheat as staple food slowly took the place of sweetpotato, maize and other course grains, which in turn have increasingly been used as animal feed. However, despite the significant shift in the use of both maize and sweetpotato from food to feed, China's domestic feed supply is expected to lag behind the rapidly increasing demand for livestock meat products brought about by the expansion of consumption as a function of increased income. Trade liberalization and China’s membership in the World Trade Organization (WTO) are expected to exacerbate the deficit of feed grains, particularly maize. Whether China could or would be willing to import a large amount of maize is an issue of rising concern. Alternative solutions, especially substitution of other domestically produced feed such as sweetpotato are of importance, politically and economically.
Sweetpotato is the fourth major staple crop and the second largest feed grain in China. While production has remained fairly stable at 20-23 million tons/year since the 1970s, the area planted to sweetpotato has declined significantly. Yield growth of sweetpotato has generally been lower than cereals except in the recent years. Further, utilization of sweetpotato as a food staple decreased from about 50 percent of total production in the 1970s to less than 15 percent by the end of the 1990s. Feed and industrial use grew significantly over this period.
This study aims to characterize the changing pattern of China's sweetpotato production and
utilization, examine the incentives governing sweetpotato production, and analyze the efficiency of substituting sweetpotato for maize as feed in pig production. In order to achieve these goals, analyses were conducted at national, regional and farm levels. About 200 households from 20 villages in five counties each of the two sweetpotato giants, Sichuan and Shandong provinces, were selected for in-depth analysis. These two provinces together account for more than one third of China’s sweetpotato production, nearly double the rest of the world’s sweetpotato output.
This study confirms the evidence of significant changes in sweetpotato utilization. The
proportion of sweetpotato used as feed and for food processing both surpassed food consumption after the mid 1980s. By the late 1990s, feed use accounted for more than 40 percent and processing demand accounted for one third of total sweetpotato production. Although China is the world’s largest sweetpotato producer and is in fact a net exporter, sweetpotato has never been an important commodity in international trade. Sweetpotato was one of the first agricultural commodities liberalized in the early reform period in China, but interregional trade remains small. In many rural areas it is planted primarily as a subsistence crop intended to address household demand for feed and other uses.
Average farm size in the sampled villages was 0.38 hectare, the typical farm size in China. The average household produced 176 kilograms of sweetpotato, about 85 percent of which was used in pig production. Households raised pigs using a variety of feeds, including sweetpotato,
1 In this report, we use the Chinese definition of “grain” to include rice (measured in paddy form), wheat, maize, soybean, sweetpotato, potato, sorghum, barley and millet. All are measured as dry weight. D ry weight of sweetpotato is computed by dividing fresh weight by 5. Throughout this report, yield and production of sweetpotato are all reported as dry weights.

7
maize, other grains, meals and forage from home -produced crops. Most of households that raised pigs were typical backyard producers. Nearly two-thirds raised less than three pigs per year. Only five households out of the 200 in our survey raised more than 10 at a time.
Household sweetpotato production was positively associated with pig production up to three heads and then declined with further increases in the number of pigs raised. The results indicate that expanding the scale of pig production with the use of backyard-grown sweetpotato as feed is not ideal because of the limited land area and the need to include other uses in land allocation. Given a declining share of backyard pig production over time and feed use as a primary reason for farmers to plant sweetpotato, the prospects for growing sweetpotato as feed is not promising, unless new sweetpotato feed processing technologies emerge.
Financial analysis based on time series data shows that although sweetpotato once was
relatively more profitable than its competing crops such as maize and wheat, its relative profitability appears to have declined since the mid 1980s. This is due to unfavorable terms of trade and the slow progress in generating production technologies, the latter being closely related to public investment in sweetpotato research. Financia l profitability analysis based on our primary household survey shows that the farmers in Sichuan province had a negative profit from sweetpotato in 1997.
Although Shandong netted positive profit from sweetpotato production, incentives for
substituting other crops for sweetpotato are emerging. In particular, the horticulture sector has been growing rapidly since the early 1990s, providing opportunities for farmers to reallocate land to higher valued crops. Meanwhile, regional market integration favors increased use of traded feed such as maize and compound feed in pig production. The opportunity cost of agricultural labor in many coastal counties in Shandong province is relatively high and is still growing, disfavoring low-value, labor- intensive crops like sweetpotato.
Break-even analysis demonstrates that expanding sweetpotato production will depend highly
on future gains in farm productivity. Rising sweetpotato yields due to technology progress since the mid 1990s is an encouraging trend. If China wants to help farmers increase their income from sweetpotato production, increased investments in sweetpotato research and extension are essential. Labor -saving technology will also become critical in rural areas where employment in sweetpotato farms have diminished in value with the increasing opportunities for off-farm employment.
Further analysis based on a Policy Analysis Matrix (PAM) confirmed the above results and showed several other interesting findings. There was a large divergence between the social and private profitability of sweetpotato production. Sweetpotato would be more profitable if all policy interventions were removed. In Shandong, profit per hectare may increase from 790 to 1350 Yuan. Although social profit was still negative in Sichuan, the removal of all distortions would reduce the loss by 320 Yuan per hectare. Comparisons among crops showed that policies penalize sweetpotato while protecting maize production, particularly in Sichuan. Removing the policy distortions would ma ke sweetpotato even more profitable than maize in Shandong and as profitable as maize in Sichuan.

8
The nominal protection rate of output shows that the policies taxed production of both sweetpotato and maize, but the extent of taxation was higher for sweetpotato than maize. Policies had the effect of lowering sweetpotato domestic prices by about 15 percent, about twice as much as for maize. Careful examination reveals that the distortions mainly come from the overvaluation of the Chinese currency. Policy interventions in input markets also favored maize more than sweetpotato. For the relative comparative advantage of sweetpotato and maize production, the estimated domestic resource cost (DRC) for these two crops were very similar. The similarity of DRCs of sweetpotato and maize implies that under trade liberalization, we do not expect to see much substitution of sweetpotato for maize in animal feed, unless further technological progress is made in sweetpotato production and utilization.
Sensitivity ana lyses further validate the key role of research and technology investment in increasing the competitiveness of sweetpotato as an animal feed in China. Since it is a labor -intensive crop, labor-saving technology would increase its relatively private and social profitability while lowering the domestic resource cost. Public investment in labor-saving technology, especially in sweetpotato production, reflects a pro-poor bias on the government’s part since sweetpotato is primarily a crop grown by marginal farms. Given that poverty alleviation is a policy objective, this provides further justification for additional public support for sweetpotato. Finally, if the exchange rate were devalued to represent the true value of domestic currency, both sweetpotato and maize would become more competitive in the domestic and world markets.
In sum, the results from this study show that both sweetpotato and maize producers are
facing great challenges. Policy distortions have penalized sweetpotato and protected maize production. The social profitability of sweetpotato is at least as high as maize in both Sichuan and Shandong, if not higher. The extent to which sweetpotato can substitute for maize in pig feed will highly depend on the direction of future policies and technology developments affecting the two crops. If productivity growth in sweetpotato continues to lag behind that of maize and other feed crops, we can expect to see the use of sweetpotato for feed gradually decline, even in backyard livestock production. Therefore, increased investment in sweetpotato research and extension and removal of the current policy distortions are critical to realize sweetpotato’s full potential in China’s agricultural economy.
9
I. Introduction and Overview of the Study
1.1 Intro duction
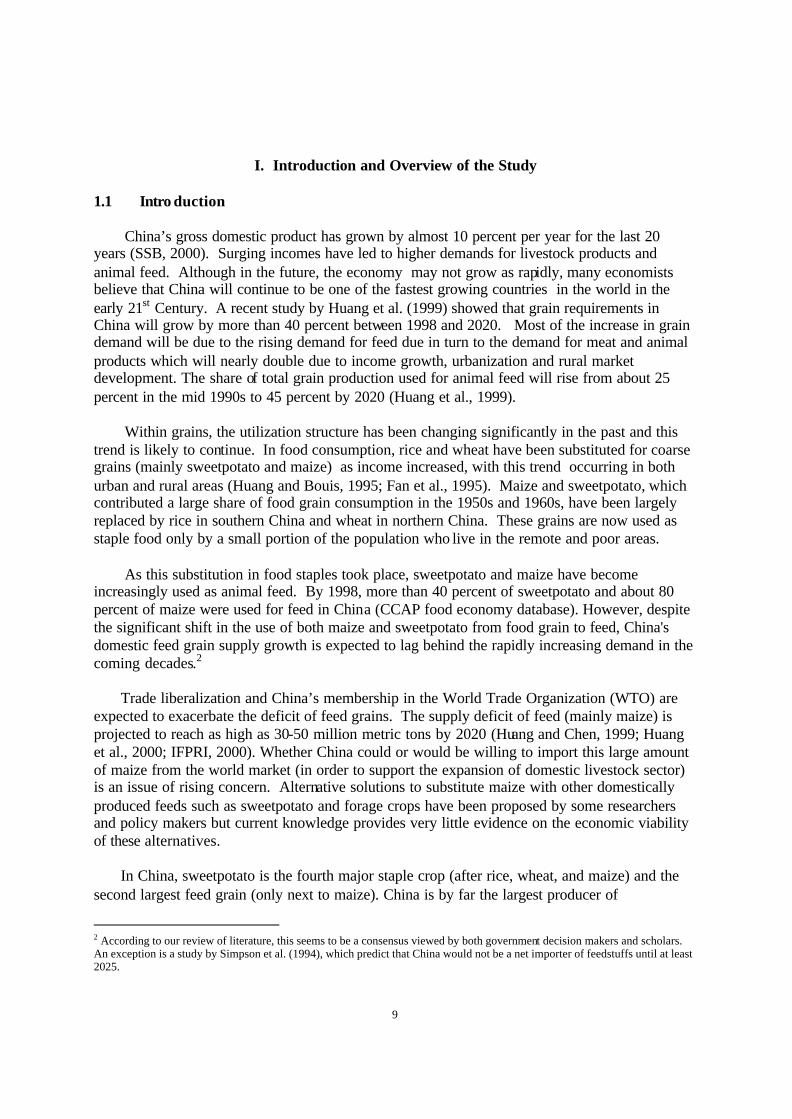
China’s gross domestic product has grown by almost 10 percent per year for the last 20 years (SSB, 2000). Surging incomes have led to higher demands for livestock products and animal feed. Although in the future, the economy may not grow as rapidly, many economists believe that China will continue to be one of the fastest growing countries in the world in the early 21st Century. A recent study by Huang et al. (1999) showed that grain requirements in China will grow by more than 40 percent between 1998 and 2020. Most of the increase in grain demand will be due to the rising demand for feed due in turn to the demand for meat and animal products which will nearly double due to income growth, urbanization and rural market development. The share of total grain production used for animal feed will rise from about 25 percent in the mid 1990s to 45 percent by 2020 (Huang et al., 1999).
Within grains, the utilization structure has been changing significantly in the past and this
trend is likely to continue. In food consumption, rice and wheat have been substituted for coarse grains (mainly sweetpotato and maize) as income increased, with this trend occurring in both urban and rural areas (Huang and Bouis, 1995; Fan et al., 1995). Maize and sweetpotato, which contributed a large share of food grain consumption in the 1950s and 1960s, have been largely replaced by rice in southern China and wheat in northern China. These grains are now used as staple food only by a small portion of the population who live in the remote and poor areas.
As this substitution in food staples took place, sweetpotato and maize have become
increasingly used as animal feed. By 1998, more than 40 percent of sweetpotato and about 80 percent of maize were used for feed in China (CCAP food economy database). However, despite the significant shift in the use of both maize and sweetpotato from food grain to feed, China's domestic feed grain supply growth is expected to lag behind the rapidly increasing demand in the coming decades.2
Trade liberalization and China’s membership in the World Trade Organization (WTO) are
expected to exacerbate the deficit of feed grains. The supply deficit of feed (mainly maize) is projected to reach as high as 30-50 million metric tons by 2020 (Huang and Chen, 1999; Huang et al., 2000; IFPRI, 2000). Whether China could or would be willing to import this large amount of maize from the world market (in order to support the expansion of domestic livestock sector) is an issue of rising concern. Alternative solutions to substitute maize with other domestically produced feeds such as sweetpotato and forage crops have been proposed by some researchers and policy makers but current knowledge provides very little evidence on the economic viability of these alternatives.
In China, sweetpotato is the fourth major staple crop (after rice, wheat, and maize) and the second largest feed grain (only next to maize). China is by far the largest producer of
2 According to our review of literature, this seems to be a consensus viewed by both government decision makers and scholars. An exception is a study by Simpson et al. (1994), which predict that China would not be a net importer of feedstuffs until at least 2025.
10
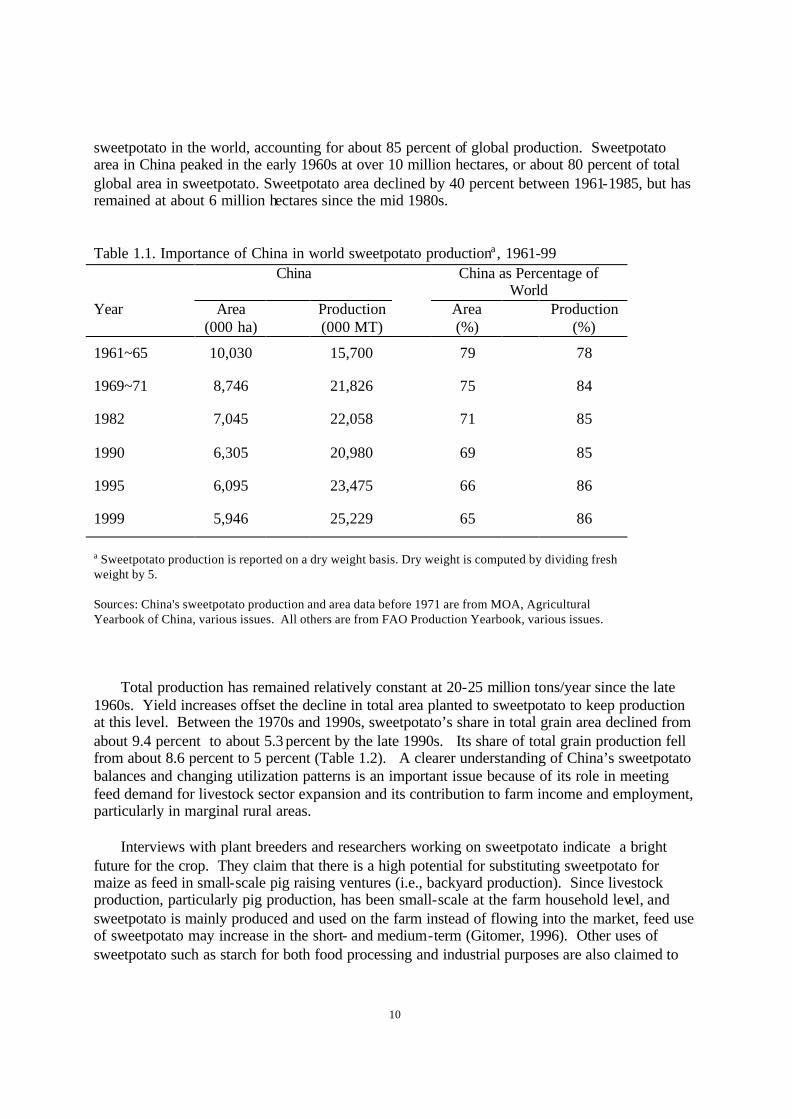
sweetpotato in the world, accounting for about 85 percent of global production. Sweetpotato area in China peaked in the early 1960s at over 10 million hectares, or about 80 percent of total global area in sweetpotato. Sweetpotato area declined by 40 percent between 1961-1985, but has remained at about 6 million hectares since the mid 1980s. Table 1.1. Importance of China in world sweetpotato productiona , 1961-99 China China as Percentage of
World Year Area
(000 ha) Production
(000 MT) Area
(%) Production
(%)
1961~65 10,030 15,700 79 78
1969~71 8,746 21,826 75 84
1982 7,045 22,058 71 85
1990 6,305 20,980 69 85
1995 6,095 23,475 66 86
1999 5,946 25,229 65 86
a Sweetpotato production is reported on a dry weight basis. Dry weight is computed by dividing fresh weight by 5. Sources: China's sweetpotato production and area data before 1971 are from MOA, Agricultural Yearbook of China, various issues. All others are from FAO Production Yearbook, various issues.
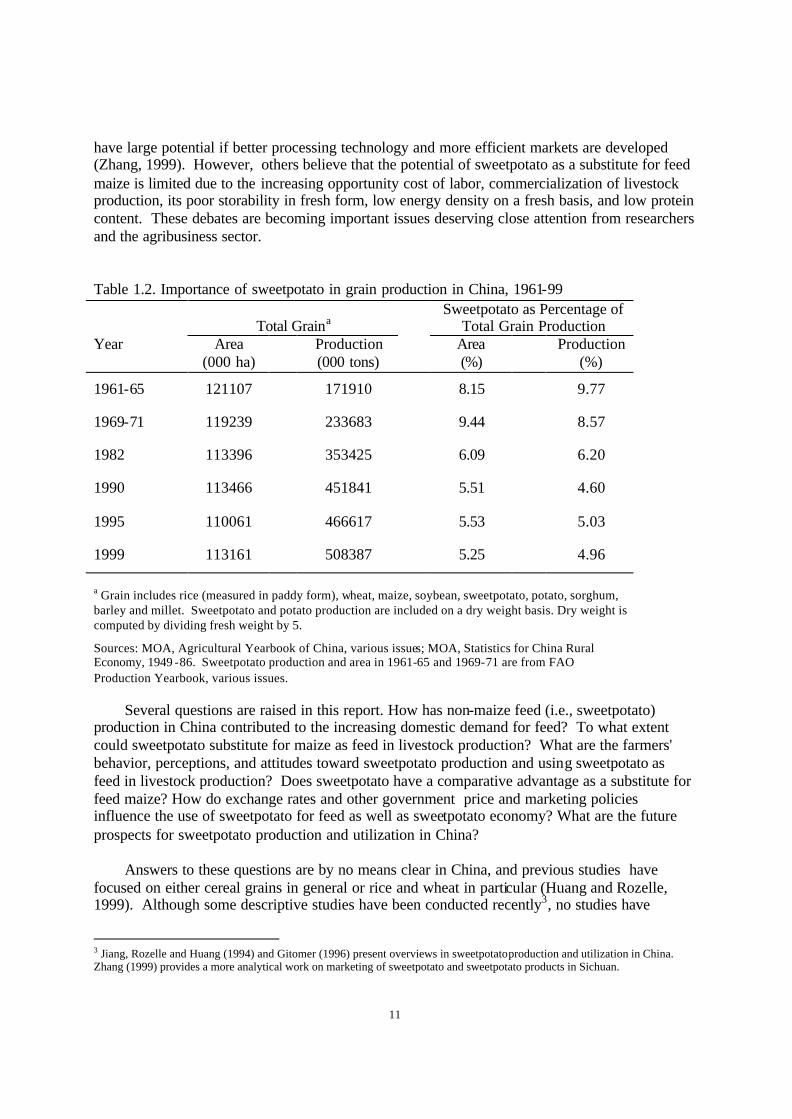
Total production has remained relatively constant at 20-25 million tons/year since the late 1960s. Yield increases offset the decline in total area planted to sweetpotato to keep production at this level. Between the 1970s and 1990s, sweetpotato’s share in total grain area declined from about 9.4 percent to about 5.3 percent by the late 1990s. Its share of total grain production fell from about 8.6 percent to 5 percent (Table 1.2). A clearer understanding of China’s sweetpotato balances and changing utilization patterns is an important issue because of its role in meeting feed demand for livestock sector expansion and its contribution to farm income and employment, particularly in marginal rural areas.
Interviews with plant breeders and researchers working on sweetpotato indicate a bright future for the crop. They claim that there is a high potential for substituting sweetpotato for maize as feed in small-scale pig raising ventures (i.e., backyard production). Since livestock production, particularly pig production, has been small-scale at the farm household level, and sweetpotato is mainly produced and used on the farm instead of flowing into the market, feed use of sweetpotato may increase in the short- and medium-term (Gitomer, 1996). Other uses of sweetpotato such as starch for both food processing and industrial purposes are also claimed to
11
have large potential if better processing technology and more efficient markets are developed (Zhang, 1999). However, others believe that the potential of sweetpotato as a substitute for feed maize is limited due to the increasing opportunity cost of labor, commercialization of livestock production, its poor storability in fresh form, low energy density on a fresh basis, and low protein content. These debates are becoming important issues deserving close attention from researchers and the agribusiness sector. Table 1.2. Importance of sweetpotato in grain production in China, 1961-99
Total Graina Sweetpotato as Percentage of
Total Grain Production Year Area
(000 ha) Production
(000 tons) Area
(%) Production
(%)
1961-65 121107 171910 8.15 9.77
1969-71 119239 233683 9.44 8.57
1982 113396 353425 6.09 6.20
1990 113466 451841 5.51 4.60
1995 110061 466617 5.53 5.03
1999 113161 508387 5.25 4.96
a Grain includes rice (measured in paddy form), wheat, maize, soybean, sweetpotato, potato, sorghum, barley and millet. Sweetpotato and potato production are included on a dry weight basis. Dry weight is computed by dividing fresh weight by 5.
Sources: MOA, Agricultural Yearbook of China, various issues; MOA, Statistics for China Rural Economy, 1949 -86. Sweetpotato production and area in 1961-65 and 1969-71 are from FAO Production Yearbook, various issues.
Several questions are raised in this report. How has non-maize feed (i.e., sweetpotato) production in China contributed to the increasing domestic demand for feed? To what extent could sweetpotato substitute for maize as feed in livestock production? What are the farmers' behavior, perceptions, and attitudes toward sweetpotato production and using sweetpotato as feed in livestock production? Does sweetpotato have a comparative advantage as a substitute for feed maize? How do exchange rates and other government price and marketing policies influence the use of sweetpotato for feed as well as sweetpotato economy? What are the future prospects for sweetpotato production and utilization in China?
Answers to these questions are by no means clear in China, and previous studies have focused on either cereal grains in general or rice and wheat in particular (Huang and Rozelle, 1999). Although some descriptive studies have been conducted recently3, no studies have
3 Jiang, Rozelle and Huang (1994) and Gitomer (1996) present overviews in sweetpotato production and utilization in China. Zhang (1999) provides a more analytical work on marketing of sweetpotato and sweetpotato products in Sichuan.

12
systematically examined most of the questions raised on the economics of sweetpotato in China’s agriculture.
Answers to these questions require knowledge on the relative profitability of sweetpotato production compared with other feed crops at various locations, relative price trends of competing crops, demand for various uses of sweetpotato, farmers’ practices of crop and livestock production, and efficiency of livestock production under different production scales and types of feed. 1.2 Objectives of the Study
The overall goals of this study are to characterize the changing pattern of China's sweetpotato production and utilization, examine the farm incentives governing sweetpotato production, and analyze efficiency of substituting sweetpotato for maize as feed in swine production. In order to achieve these general goals, the following six objectives were pursued:
1) Examine the changing role of sweetpotato in the economy and trends in sweetpotato production and productivity in China;
2) Examine the changing patterns of sweetpotato utilization over time in major sweetpotato producing regions;
3) Identify and examine major macro-economic factors (i.e., exchange rates, off-farm employment and trade liberalization), price and non-price policies which affect the incentive structure of sweetpotato and competing crops (i.e., maize);
4) Examine the efficiency of sweetpotato as a substitute for maize as feed in pig production; and
5) Improve our understanding of sweetpotato production and utilization in the future.
1.3 Structure of the Report
Chapter 2 describes trends in sweetpotato area, yield, production and utilization as well as current consumption patterns. This chapter also provides new, comprehensive information on China's sweetpotato utilization. Chapter 3 focuses on sweetpotato production, its linkage with household pig production, and utilization in our study areas in Sichuan and Shandong provinces. It starts by describing the study sites, including the sampling procedure and the local agricultural production, and is then followed by a detailed examination of relationships between sweetpotato and pig production, farmers' production practices and their perceptions on sweetpotato production and utilization.
Chapter’s 4 and 5 present the main analytical results of the report, including some answers to the questions raised above. Here we examine input, output, the productivity of sweetpotato, and the financial profitability of sweetpotato production. Chapter 5 presents the results of a Policy Analysis Matrix (PAM) that examines the social profitability of sweetpotato and maize production as feed for livestock production. Domestic resource costs and othe r measures of
13
maize and sweetpotato profitability are compared under alternative policies. These results provide useful information for policy makers in designing more conducive policies to enhance the role of sweetpotato for livestock sector expansion. The final section of this report summarizes the major findings and policy implications.

14
II. Sweetpotato Production and Utilization in China 2.1 Sweetpotato Production Overall Production Growth
The growth of agricultural production in China since the 1950s has been one of the main accomplishments of the nation's development policies. Except during the famine years of the late 1950s and early 1960s, the country has enjoyed rates of production growth that have outpaced the rise in population (Table 2.1) . Even in the 1970s, prior to the reform period, agricultural gross domestic product in real terms and grain production, respectively, grew at 2.7 percent and 2.8 percent per annum (Table 2.1). Except for grain and oil crops, horticulture, livestock and fishery sectors have been growing at accelerated rates since the reform started in 1979, with average annual growth rate of between 7 and 14 percent (Table 2.1). For grain production, after accelerating to 4.7 percent per year in the early reform period, 1978-84, its growth slowed to about 1.8 percent in 1985-99, but even this rate is higher than population growth. Table 2.1 The annual growth rates (%) of China’s agricultural economy, 1970-99.
Reform period Pre-reform 1970-78 1979-84 1985-95 1996-99
Gross domestic products (GDP) 4.9 8.5 9.7 8.0
Agriculture GDP 2.7 7.1 4.0 3.6
Grain production 2.8 4.7 1.7 1.9
Oil crops 2.1 14.9 4.4 3.4
Fruits 6.6 7.2 12.7 9.4
Red meats 4.4 9.1 8.8 9.2 Pork 4.2 9.2 7.9 9.0
Fishery 5.0 7.9 13.7 10.4
Population 1.80 1.40 1.37 0.97 Per capita GDP 3.1 7.1 8.3 7.0
Note: Figure for GDP in 1970-78 is the growth rate of national income in real terms. Growth rates are computed using regression method. Growth rates of individual and groups of commodities are based on production data; sectoral growth rates refer to value added in real terms. Growth rate of sweetpotato production in 1970-78 includes both sweetpotato and potato.
Source: SSB, Statistical Yearbook of China, various issues; MOA, Agricultural Yearbook of China, various issues.
Before the 1980s, sweetpotato had been one of the most important food crops in China's agricultural economy, with area planted reaching a historical high of over 11 million hectares in 1970 and accounted for 9.4 percent of total grain area (Table 1.2). But its importance in grain
15
production has since declined. By 1999, its share of area sown to grain was only 5.3 percent and its share of total grain production was just under 5 percent. .
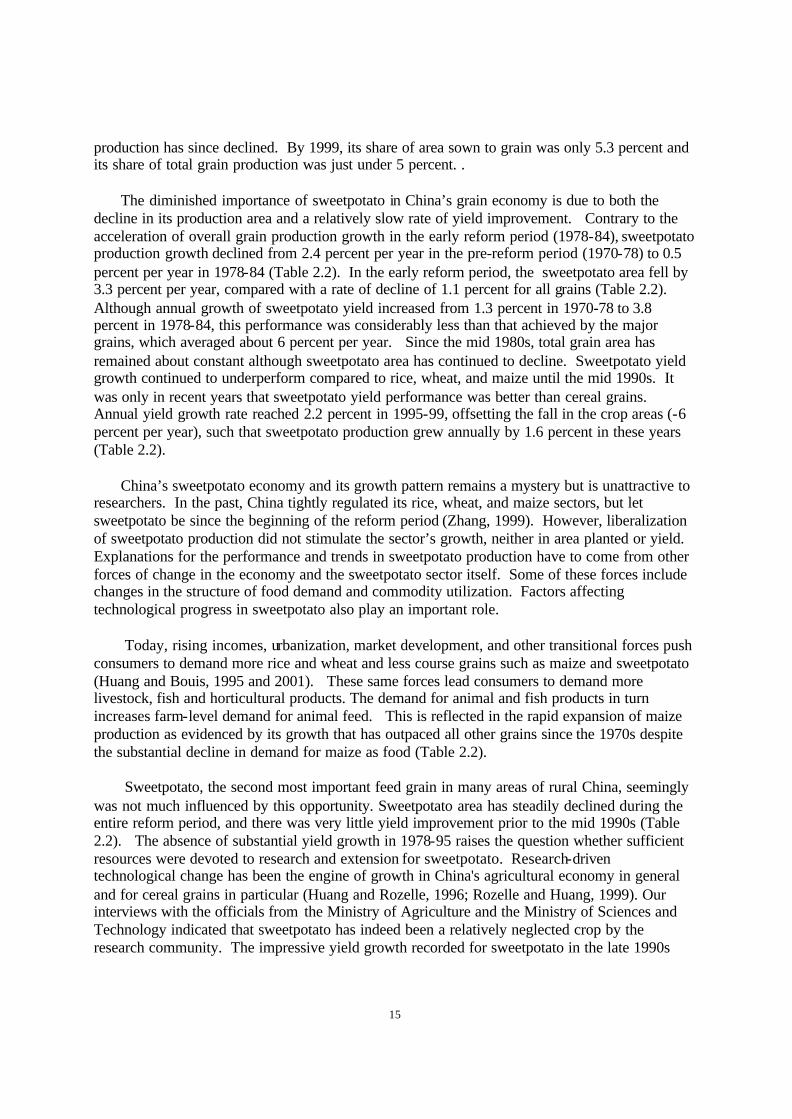
The diminished importance of sweetpotato in China’s grain economy is due to both the
decline in its production area and a relatively slow rate of yield improvement. Contrary to the acceleration of overall grain production growth in the early reform period (1978-84), sweetpotato production growth declined from 2.4 percent per year in the pre-reform period (1970-78) to 0.5 percent per year in 1978-84 (Table 2.2). In the early reform period, the sweetpotato area fell by 3.3 percent per year, compared with a rate of decline of 1.1 percent for all grains (Table 2.2). Although annual growth of sweetpotato yield increased from 1.3 percent in 1970-78 to 3.8 percent in 1978-84, this performance was considerably less than that achieved by the major grains, which averaged about 6 percent per year. Since the mid 1980s, total grain area has remained about constant although sweetpotato area has continued to decline. Sweetpotato yield growth continued to underperform compared to rice, wheat, and maize until the mid 1990s. It was only in recent years that sweetpotato yield performance was better than cereal grains. Annual yield growth rate reached 2.2 percent in 1995-99, offsetting the fall in the crop areas (-6 percent per year), such that sweetpotato production grew annually by 1.6 percent in these years (Table 2.2).
China’s sweetpotato economy and its growth pattern remains a mystery but is unattractive to researchers. In the past, China tightly regulated its rice, wheat, and maize sectors, but let sweetpotato be since the beginning of the reform period (Zhang, 1999). However, liberalization of sweetpotato production did not stimulate the sector’s growth, neither in area planted or yield. Explanations for the performance and trends in sweetpotato production have to come from other forces of change in the economy and the sweetpotato sector itself. Some of these forces include changes in the structure of food demand and commodity utilization. Factors affecting technological progress in sweetpotato also play an important role.
Today, rising incomes, urbanization, market development, and other transitional forces push
consumers to demand more rice and wheat and less course grains such as maize and sweetpotato (Huang and Bouis, 1995 and 2001). These same forces lead consumers to demand more livestock, fish and horticultural products. The demand for animal and fish products in turn increases farm-level demand for animal feed. This is reflected in the rapid expansion of maize production as evidenced by its growth that has outpaced all other grains since the 1970s despite the substantial decline in demand for maize as food (Table 2.2).
Sweetpotato, the second most important feed grain in many areas of rural China, seemingly was not much influenced by this opportunity. Sweetpotato area has steadily declined during the entire reform period, and there was very little yield improvement prior to the mid 1990s (Table 2.2). The absence of substantial yield growth in 1978-95 raises the question whether sufficient resources were devoted to research and extension for sweetpotato. Research-driven technological change has been the engine of growth in China's agricultural economy in general and for cereal grains in particular (Huang and Rozelle, 1996; Rozelle and Huang, 1999). Our interviews with the officials from the Ministry of Agriculture and the Ministry of Sciences and Technology indicated that sweetpotato has indeed been a relatively neglected crop by the research community. The impressive yield growth recorded for sweetpotato in the late 1990s
16
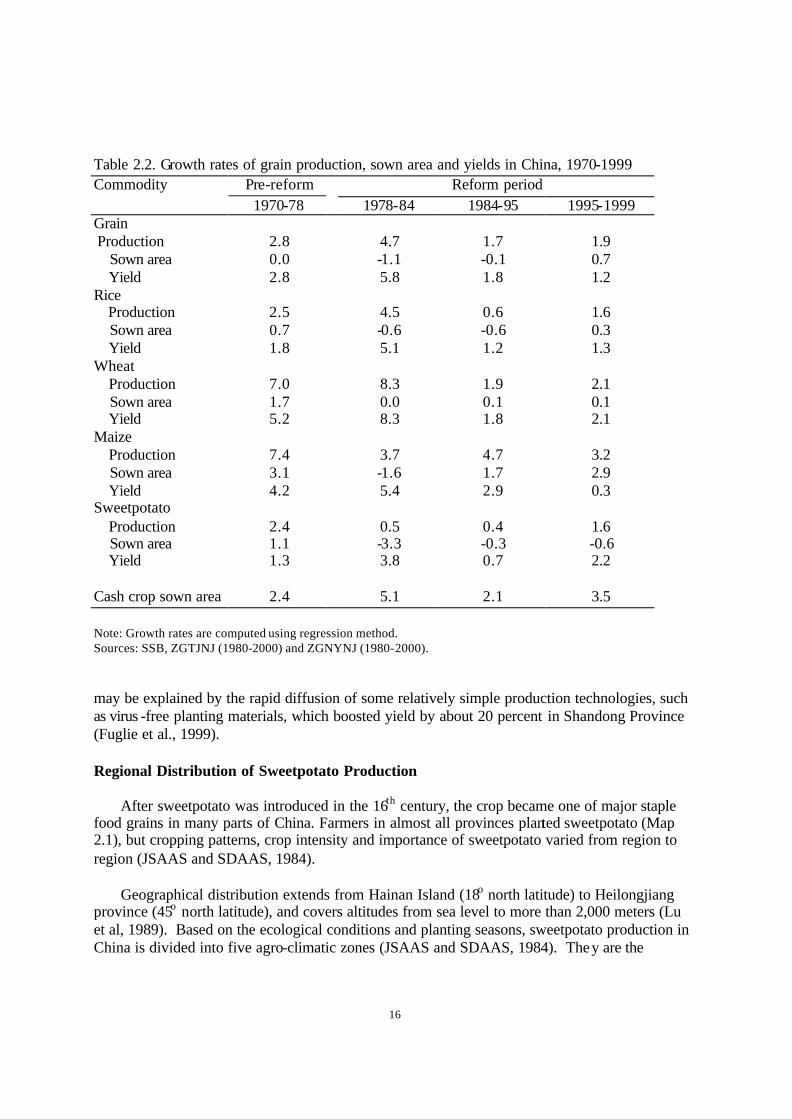
Table 2.2. Growth rates of grain production, sown area and yields in China, 1970-1999 Commodity Pre-reform Reform period 1970-78 1978-84 1984-95 1995-1999 Grain Production
2.8
4.7
1.7
1.9
Sown area 0.0 -1.1 -0.1 0.7 Yield 2.8 5.8 1.8 1.2 Rice Production 2.5 4.5 0.6 1.6 Sown area 0.7 -0.6 -0.6 0.3 Yield 1.8 5.1 1.2 1.3 Wheat Production 7.0 8.3 1.9 2.1 Sown area 1.7 0.0 0.1 0.1 Yield 5.2 8.3 1.8 2.1 Maize Production 7.4 3.7 4.7 3.2 Sown area 3.1 -1.6 1.7 2.9 Yield 4.2 5.4 2.9 0.3 Sweetpotato Production 2.4 0.5 0.4 1.6 Sown area 1.1 -3.3 -0.3 -0.6 Yield 1.3 3.8 0.7 2.2 Cash crop sown area 2.4 5.1 2.1 3.5 Note: Growth rates are computed using regression method. Sources: SSB, ZGTJNJ (1980-2000) and ZGNYNJ (1980-2000).
may be explained by the rapid diffusion of some relatively simple production technologies, such as virus -free planting materials, which boosted yield by about 20 percent in Shandong Province (Fuglie et al., 1999). Regional Distribution of Sweetpotato Production
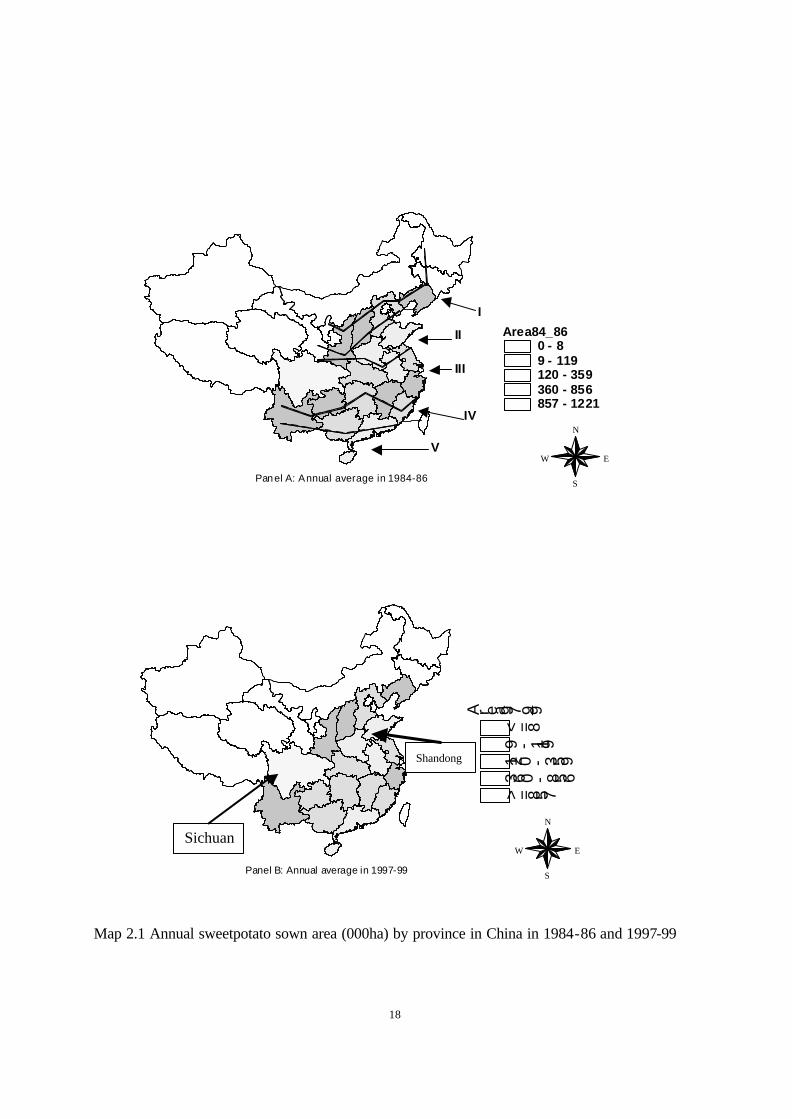
After sweetpotato was introduced in the 16th century, the crop became one of major staple food grains in many parts of China. Farmers in almost all provinces planted sweetpotato (Map 2.1), but cropping patterns, crop intensity and importance of sweetpotato varied from region to region (JSAAS and SDAAS, 1984).
Geographical distribution extends from Hainan Island (18o north latitude) to Heilongjiang
province (45o north latitude), and covers altitudes from sea level to more than 2,000 meters (Lu et al, 1989). Based on the ecological conditions and planting seasons, sweetpotato production in China is divided into five agro-climatic zones (JSAAS and SDAAS, 1984). They are the
17
Northern Spring Sweetpotato Region (I), the Huang-Huai Basin Spring and Summer Sweetpotato Region (II), the Yangzi River Basin Summer Sweetpotato Region (III), the Southern Summer and Fall Sweetpotato Region (IV), and the Southern Fall and Winter Sweetpotato Region (V).
The Northern Spring Sweetpotato Region or Region I is a humid or semi-humid monsoon
temperate and cold temperate zone. In this region, sweetpotato is planted in both plain and hilly or mountainous areas. Because the temperate is low and the growing season is short in the regions, sweetpotato is a very minor crop (Map 2.1).
18
Area84_860 - 89 - 119120 - 359360 - 856857 - 1221
I
II
III
IV
V
Panel A: Annual average in 1984-86
N
EW
S
N
EW
S
A r e a 9 7 _ 9 9
< = 89 - 1 1 9
1 2 0 - 3 5 9
3 6 0 - 8 5 6
> = 8 5 7
Panel B: Annual average in 1997-99
Map 2.1 Annual sweetpotato sown area (000ha) by province in China in 1984-86 and 1997-99
Sichuan
Shandong

19
The Huang-Huai Basin Spring and Summer Sweetpotato Region (Region II) shows the most significant decline in sweetpotato area and production since the mid 1980s (Maps 2.1 and 2.3). The region accounted for more than 20 percent of sweetpotato area and nearly 30 percent of production in the early 1980s, but both area and production shares declined significantly over time. By the late 1990s, the region’s share in China’s sweetpotato area and production fell to less than 15 percent and 20 percent, respectively. While all provinces in the region showed a decline in the crop area, most of the decline in sweetpotato area occurred in Shandong province, from about 1 million hectares in the early 1980s to less than 500,000 hectares in the late 1990s (Map 2.1 and Appendix Table 1).
It is interesting to note that this significant decline of sweetpotato area occurred in one of the
highest sweetpotato yielding regions in China and in a region with significant increase in yield (Map 2.3). From the ecological point of view, the region located in Huang-Huai basin has favorable climatic conditions for sweetpotato production. It is a temperate semi-humid monsoon area with large differences between day and night temperatures, and often has dry sunny days with sunlight sufficient for high photosynthetic efficiency. Our field interviews with farmers and local agricultural officials provided several hypotheses on the reasons underlying the decline of sweetpotato production. These include the changing pattern of sweetpotato utilization, relative decline in sweetpotato profitability compared with other crops, and a loosening of the linkage between sweetpotato and pig production (see Sections 3-5).
The Yangzi River Basin Summer Sweetpotato Region (Region III) is the most widespread
sweetpotato production region (Maps 2.1 and 2.2). The region includes almost all the Yangzi River Basin such as Jiangsu, Anhui, and Henan provinces, south of the Huai River, the most southern part of Shaanxi province, most of the Guizhou province, the northern parts of Hunan, Jiangxi, and Yunnan provinces, and the entire Sichuan Basin. The climate in the region is characterized by the northern monsoon subtropical humid. Solar radiation and sunlight are the lowest among all the regions. Because of the large number of rivers in the upper and middle reaches of the Yangzi River, high evaporation, heavy clouds, and fog all tend to affect sweetpotato cultivation adversely. Sweetpotato is primarily planted in hilly areas on loess and red soils. The growing season in this region is 140-170 days, beginning in late April to June with harvesting in late October and November. The main production area is Sichuan Basin. Sweetpotato production in this region has been rising (Map 2.2) such that in the late 1990s, the region accounted for about 60 percent of national sweetpotato production (Appendix Table 2).
The other two regions, the Southern Summer and Fall Sweetpotato Region (Region IV) and the Southern Fall and Winter Sweetpotato Region (Region V) are located in southern China. Region IV includes a long and narrow strip just north of the tropic of Cancer in the south and central parts of the monsoon semitropical humid climate region. This includes the southern parts of Fujian, Jiangxi, and Hunan, the northern parts of Guangdong and Guangxi, central Yunnan and a small part of southern Guizhou (Map 2.1). Summer sweetpotato is sown in May and harvested between August and October. An autumn crop of sweetpotato is planted between early July and early August and harvested between late November and early December. Sweetpotato in this region is mainly distributed in hilly areas on red, yellow and crimson soils. Region V includes the south of Guangdong, Guangxi, Hainan, Yunnan, Taiwan, and the South China Sea
20
P r o d u c t i o n 8 4 _ 8 6
< = 8 9
9 0 - 2 5 4
2 5 5 - 1 1 7 0
1 1 7 1 - 2 4 4 7
> = 2 4 4 8
Panel A: Annual average in 1984-86
N
EW
S
P r o d u c t i o n 9 7 _ 9 9
< = 8 9
9 0 - 2 5 4
2 5 5 - 1 1 7 0
1 1 7 1 - 2 4 4 7
> = 2 4 4 8
Panel B: Annual avera ge in 1997-99
N
EW
S
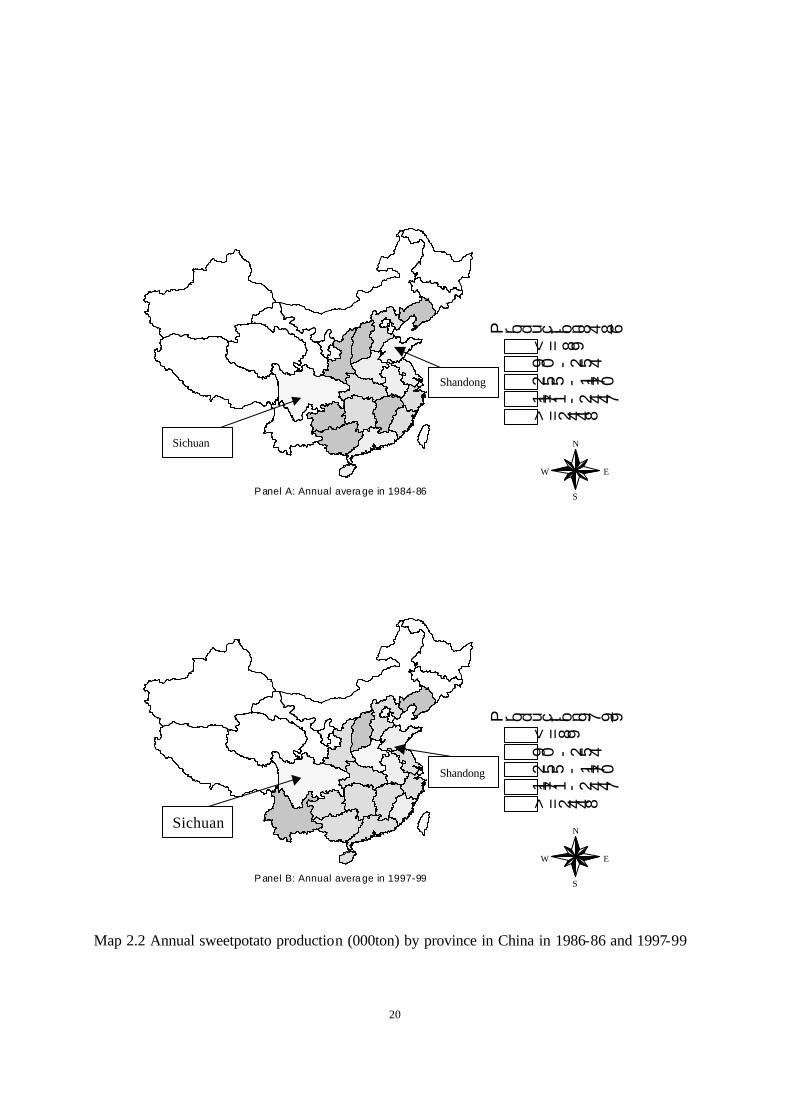
Map 2.2 Annual sweetpotato production (000ton) by province in China in 1986-86 and 1997-99
Sichuan
Shandong
Sichuan
Shandong
21
Y i e l d 8 4 _ 8 6< 1
1 - 23
4 - 5
> = 6
Panel A: Annual average in 1984-86
N
EW
S
Y i e l d 9 7 _ 9 9
< 11 - 2
34 - 5
> = 6
Panel B: Annual average in 1997-99
N
EW
S
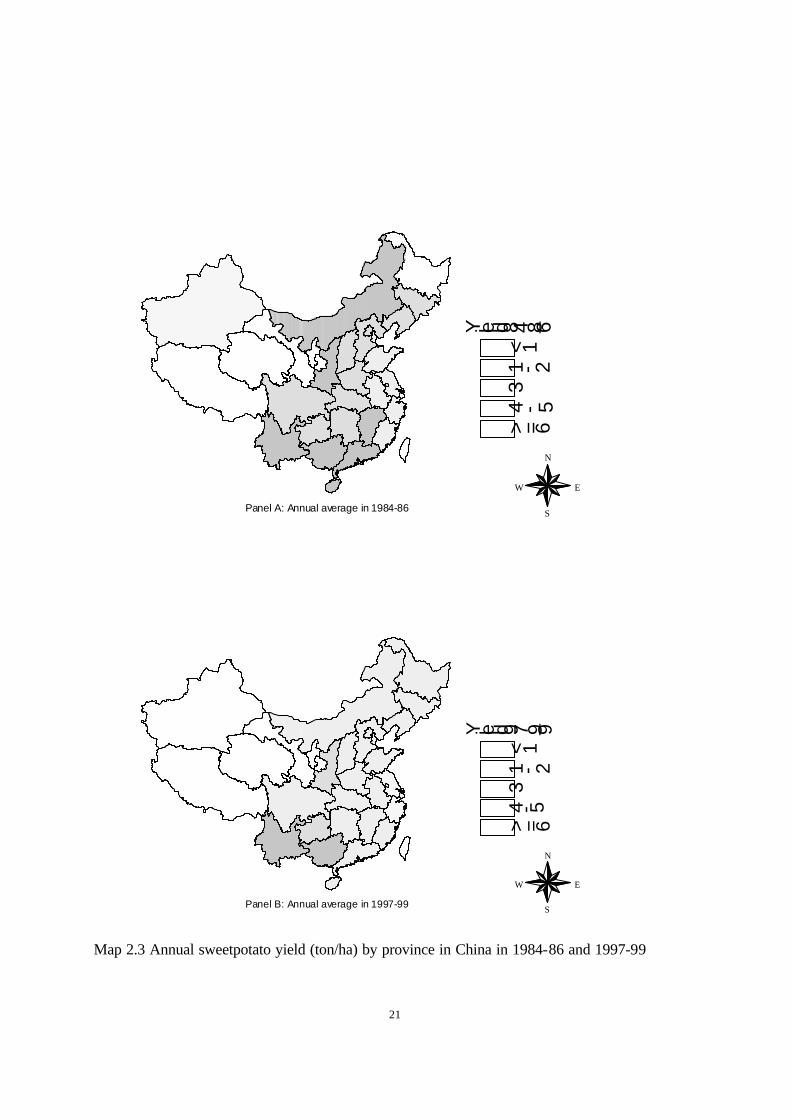
Map 2.3 Annual sweetpotato yield (ton/ha) by province in China in 1984-86 and 1997-99
22
islands. It belongs to humid tropical monsoon climate area with a hot season of 8-10 months long and the lowest day and night temperature differential in China. Although sweetpotato can be grown year-round, farmers plant it mostly in autumn and winter months. Fall sweetpotato in lowlands is planted from mid-July to mid-August, whereas upland areas are planted from early July to early August. Both are harvested from early November to late December. The growing period ranges from 120-150 days. Most winter sweetpotato is planted in November and harvested in April or May of the following year, with a growing period of 170-200 days.
Regions IV and V together accounted for 15-20 percent of the national sweetpotato area and an even smaller share of the national production average (Map 2.3) although its share of sweetpotato production against the national total has increased over time (Maps 2.1 and 2.2).
Table 2.3 presents another dimension in sweetpotato production showing the distribution by
province. While sweetpotato production is widely distributed over China’s 30 provinces, the top 10 provinces accounted for 82 percent of the national area and 87 percent of total production in 1997-99 (Table 2.3). Indeed most of the production is concentrated in 5 provinces, namely Sichuan, Shandong, Henan, Guangdong (including Hainan) and Anhui. These five provinces accounted for 62 percent and 67 percent of sweetpotato area and production, respectively, in 1997-99. Sichuan alone accounts for more than 20 percent of China’s sweetpotato production and more than the total production in the rest of the world (FAO database).
Apparently, the economic reforms introduced in the late 1970s did not affect the geographic
distribution of sweetpotato substantially. The share of production of the top five and top ten provinces declined between 1984-86 and 1997-99 (Table 2.3). Within the top five sweetpotato producers, the most significant changes took place in Sichuan and Shandong provinces. Both area and production increased in Sichuan and fell in Shandong such that Sichuan overtook Shandong as the largest sweetpotato producer in the 1990s. This further points out the importance of sweetpotato utilization and the demand forces in shaping the crop’s production pattern. 2.2 Sweetpotato Utilization Existing Literature on Sweetpotato Utilization Estimates
Lack of available information on how sweetpotato is utilized has been one of the most serious difficulties in understanding the sweetpotato economy of China. While several studies have attempted to estimate sweetpotato demand by various users, these are based either on small samples in specific locations or at a particular point in time. Not surprisingly, inconsistencies emerge when one attempts to put these estimates together. Projections based on alternative assumptions of sweetpotato utilization could lead to a wide range of perceptions on the future of sweetpotato in China and implications in the policies toward crop production, processing and investment.

23
Table 2.3 Sweetpotato production in top 10 producing provinces in China
Share in nation total Province Sown area
(000 ha) Yield
(ton/ha) Production (000 tons)
Per capita production (kg/person)
Area (%)
Production (%)
Annual average for 1984-86
National total 6232 3.40 21172 25.0 100 100
Shandong 856 5.42 4634 68.6 14 22 Sichuan 1221 3.19 3891 43.6 20 18 Anhui 654 3.74 2447 54.5 10 12 Henan 799 2.69 2153 31.3 13 10 Guangdong 580 2.41 1401 27.0 9 7 Jiangsu 284 4.76 1354 26.1 5 6 Hebei 359 3.26 1170 24.4 6 6 Hunan 267 2.97 794 16.2 4 4 Fujian 218 3.52 767 33.2 3 4 Zhejiang 119 5.36 639 18.7 2 3
Top 5 4110 3.56 14525 45.1 66 69 Top 10 5358 3.59 19249 36.4 86 92
Annual average for 1997-99
National total 5946 4.11 24414 26.6 100 100 Sichuan 1463 3.48 5098 54.3 25 21 Shandong 451 6.90 3113 44.3 8 13 Henan 609 4.46 2716 36.2 10 11 Guangdong 589 4.29 2525 42.4 10 10 Anhui 477 4.50 2150 42.9 8 9 Fujian 289 4.79 1384 51.9 5 6 Hunan 302 3.76 1136 21.3 5 5 Jiangsu 163 6.15 1002 19.1 3 4 Hebei 249 3.91 972 18.3 4 4 Hubei 212 4.20 889 22.3 4 4
Top 5 3589 4.35 15602 44.7 61 64 Top 10 4804 4.37 20985 36.5 82 87 Note: Sweetpotato production is reported on a dry weight basis. Dry weight is computed by dividing fresh weight by 5. Guangdong includes Hainan and Sichuan includes Chongqing.

24
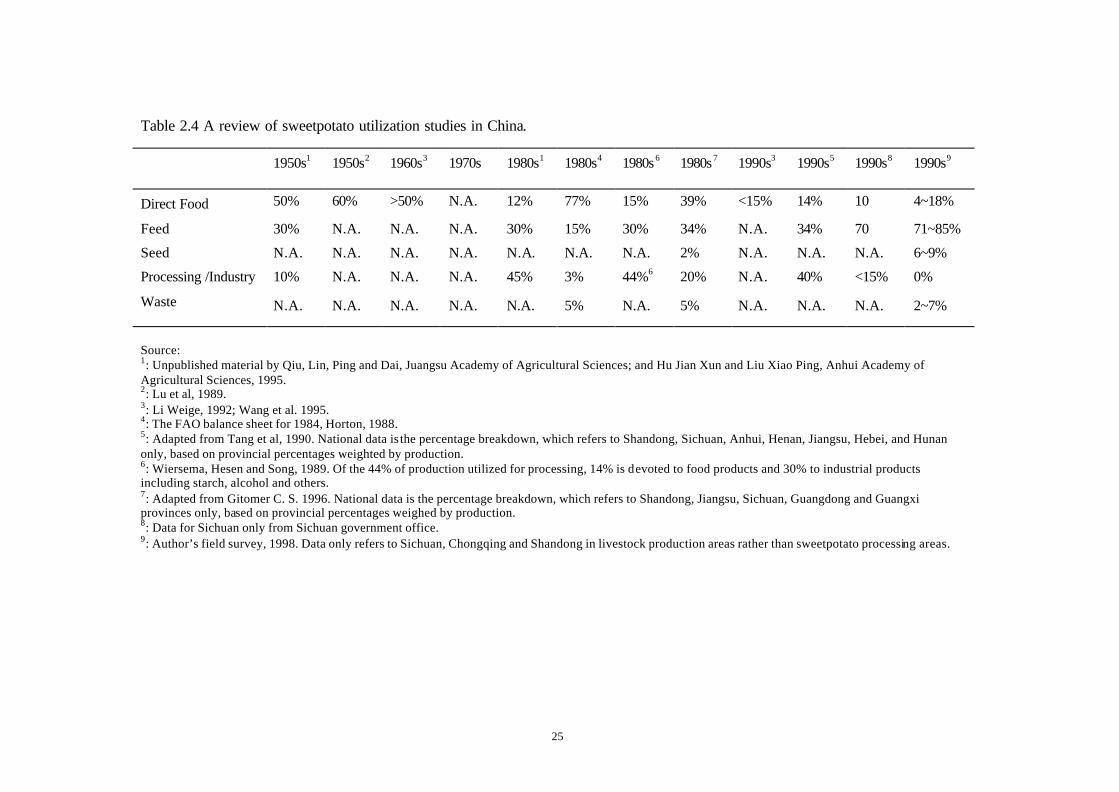
Table 2.4 summarizes our review of some previous studies on sweetpotato utilization in China. While most of these studies show that direct food consumption of sweetpotato has declined over time, the magnitude of estimates vary widely. For example, Qiu et al. (1995) claimed that the share of sweetpotato used for direct food consumption declined from 50 percent in the 1950s to 12 percent in the 1980s, while other studies estimated that direct food consumption still accounted for as much as 34 percent (Gitomer, 1996) or even 77 pe rcent (FAO database) in the 1980s (see the first row of Table 2.4). Significantly, different estimates are also found for utilization of sweetpotato for feed, industry, and food processing. Estimates of the proportion of feed utilization for the 1990s ranged from 34 to 85 percent, and processing demand ranged from less than 15 to 40 percent (the 4th row of Table 2.4).
Despite these discrepancies, the literature does provide some consensus on structural
changes in sweetpotato utilization over time. Sweetpotato was once an important food crop in China in 1950s-1960s. However, with the rapid economic development and rising farmer’s income since the beginning of the reform period in 1978, sweetpotato, often considered as an inferior good, has gradually progressed from being a staple food to animal feed and other uses. Rice and wheat have been the preference among the course grains (including sweetpotato) in food consumption as income rose (Huang and Bouis, 1995). Demand for sweetpotato in food processing expanded over time as rural markets developed and food consumption diversified (Zhang, 1999). Further, there are apparently large differences in utilization patterns among regions. This suggests that estimates of utilization trends based on a small case study may not be appropriate for analysis of regional or national trends, and such results need to be interpreted with caution.
New Estimates for Sweetpotato Utilization in China
To estimate a consistent and plausible database for sweetpotato utilization in China, we conducted a nationwide survey of agricultural leaders and administrators from agricultural bureaus (in charge of sweetpotato production) and grain bureaus (in charge of grain marketing) in each province. Knowledgeable officials in each province were asked to make their best estimates of sweetpotato utilization in their province over time. After receiving the survey forms from all provinces, a consultative meeting that included experts on sweetpotato production and marketing was held in Beijing to evaluate and revise the estimates. Table 2.5 summarizes the results from two leading sweetpotato production provinces, Sichuan and Shandong from the 1950s to the 1990s. Table 2.6 presents yearly estimates of sweetpotato utilization for all China from 1980 to 1997.
The estimates from this survey confirm large differences in sweetpotato utilization across regions and over time. For example, while the proportion of sweetpotato used as feed in Sichuan (14 percent) and Shandong (20 percent) was small and similar in 1950s, it has increased substantially over time. In the 1980s, feed utilization reached 60 percent in Sichuan but only increased to 30 percent in Shandong. Use of sweetpotato for food processing industries accounted for nearly half of sweetpotato production in Shandong in the 1990s. Although food processing demand for sweetpotato was considerably smaller in Sichuan, both provinces registered steady growth in this use over time.
25
Table 2.4 A review of sweetpotato utilization studies in China.
1950s1 1950s2 1960s3 1970s 1980s1 1980s4 1980s6 1980s7 1990s3 1990s5 1990s8 1990s9
Direct Food 50% 60% >50% N.A. 12% 77% 15% 39% <15% 14% 10 4~18%
Feed 30% N.A. N.A. N.A. 30% 15% 30% 34% N.A. 34% 70 71~85%
Seed N.A. N.A. N.A. N.A. N.A. N.A. N.A. 2% N.A. N.A. N.A. 6~9%
Processing /Industry 10% N.A. N.A. N.A. 45% 3% 44%6 20% N.A. 40% <15% 0%
Waste N.A. N.A. N.A. N.A. N.A. 5% N.A. 5% N.A. N.A. N.A. 2~7%
Source: 1: Unpublished material by Qiu, Lin, Ping and Dai, Juangsu Academy of Agricultural Sciences; and Hu Jian Xun and Liu Xiao Ping, Anhui Academy of Agricultural Sciences, 1995. 2: Lu et al, 1989. 3: Li Weige, 1992; Wang et al. 1995. 4: The FAO balance sheet for 1984, Horton, 1988. 5: Adapted from Tang et al, 1990. National data is the percentage breakdown, which refers to Shandong, Sichuan, Anhui, Henan, Jiangsu, Hebei, and Hunan only, based on provincial percentages weighted by production. 6: Wiersema, Hesen and Song, 1989. Of the 44% of production utilized for processing, 14% is devoted to food products and 30% to industrial products including starch, alcohol and others. 7: Adapted from Gitomer C. S. 1996. National data is the percentage breakdown, which refers to Shandong, Jiangsu, Sichuan, Guangdong and Guangxi provinces only, based on provincial percentages weighed by production. 8: Data for Sichuan only from Sichuan government office. 9: Author’s field survey, 1998. Data only refers to Sichuan, Chongqing and Shandong in livestock production areas rather than sweetpotato processing areas.

26
Table 2.5 Sweetpotato utilization (%) in Sichuan and Shandong provinces. 1950s 1960s 1970s 1980s 1990s Sichuan Direct food 65 60 50 20 11 Feed 14 19 29 60 60 Seed 6 6 6 5 5 Processing 3 4 5 10 19 Waste 12 11 10 5 5 Shandong Direct food 50 45 40 20 10 Feed 20 25 30 30 30 Seed 5 5 5 4 4 Processing 15 15 15 38 48 Waste 10 10 10 8 8 Note: Sichuan includes Chongqing. Sources: Figures are provided by Sichuan and Shandong Academies of Agricultural Sicences.
Table 2.6 Changing utilization pattern (%) of sweetpotato in China, 1980-97.
1980 1981 1982 1983 1984 1985 1986 1987 1988 1989 1990 1991 1992 1993 1994 1995 1996 1997
Food 36 36 35 34 32 30 27 25 23 21 19 18 17 16 15 14 14 14 Feed 31 30 31 31 31 32 34 35 36 37 38 39 39 39 40 40 40 41 Seed 6 6 6 6 6 6 5 5 5 5 5 5 5 5 5 5 5 5 Processing 15 16 17 18 20 22 24 25 26 27 28 29 30 31 32 33 33 33 Waste 12 12 11 11 11 10 10 10 10 10 10 9 9 9 8 8 8 7 Sources: Based on authors' surveys.

27
Our field interviews in Sichuan and Shandong reveal that less dramatic shift in the use of sweetpotato from food to feed in Shandong is associated with rapid development of local food processing industry and availability of alternative feeds such as maize. Shandong, one of most developed agricultural food processing provinces in China, has taken advantage of its proximity to urban and export markets to process sweetpotato for various food and industrial products such as noodles, starch and alcohol. In Sichuan, on the other hand, growth in maize production has not kept up with the rapid growth in livestock production. Sichuan is not only the largest sweetpotato producing province but also one of the largest and fastest growing livestock producer. While the maize deficit in Sichuan has been partially filled by shipments of maize from northern China (especially Jilin and Liaoning provinces), high transportation costs and lack of capital to purchase feed in Sichuan provide greater incentive for marginal farmers to use home-grown sweetpotato as feed (see next sections for more discussion).
At the national level, our estimates show that feed and processing demands have dominated sweetpotato utilization since the mid 1980s (Table 2.6). Feed use exceeded food use by 1985 and processing demand surpassed food use by 1988. By 1997, the proportion of sweetpotato used for feed had reached 41 percent and processing use was at 33 percent. It is interesting to note that although both feed and processing utilization rose significantly in the past two decades, the growth in processing use has been higher than the growth in feed use (a result consistent with a study in Sichuan by Zhang,1999). 2.3 Sweetpotato Food Balance Sheet
An estimate of the direct food consumption of sweetpotato by rural and urban consumers was made based on household income and expenditure surveys conducted by the State Statistical Bureau and interviews and surveys done for this study. A sweetpotato supply and utilization food balance sheet was also created for China from 1980 to 1997 using sweetpotato utilization information presented in Table 2.6 and production and trade data from government publications (SSB). End year stocks were estimated as the residual of production, trade and consumption balance.
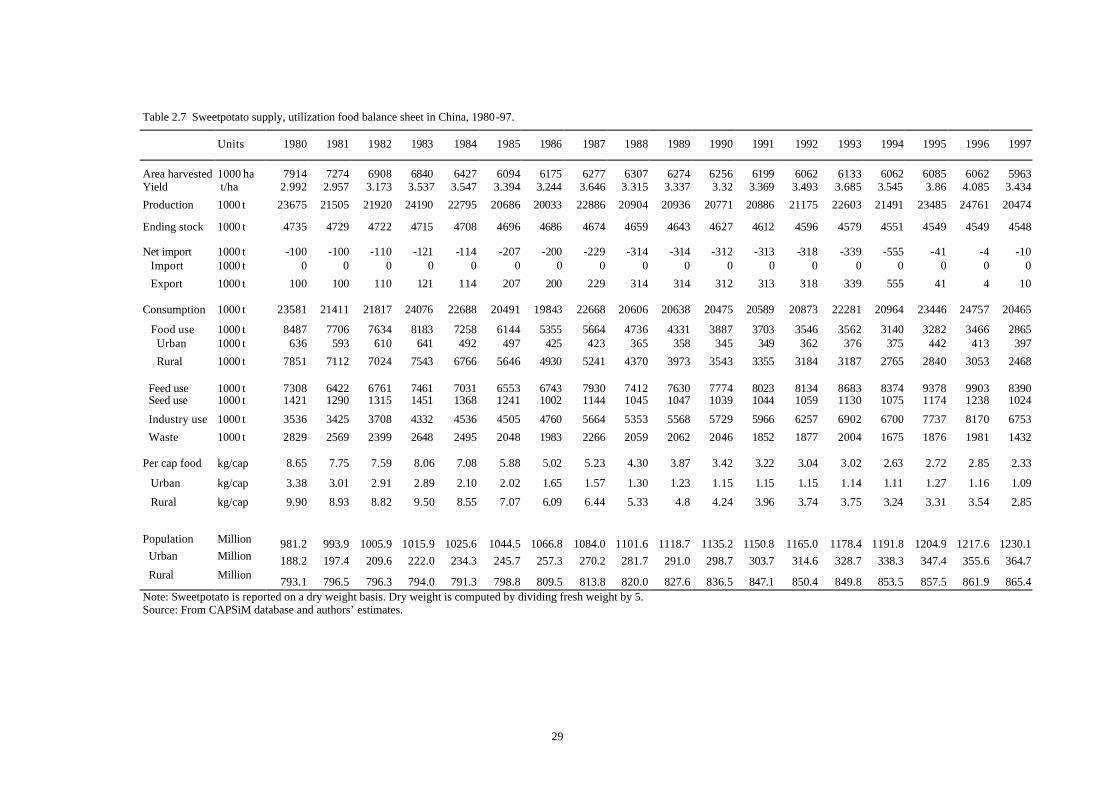
Although sweetpotato is a net export trade commodity of China, it has never been considered an important crop. In many rural areas, it is not planted primarily as a cash income source, but as a crop intended to address household food and feed needs, and a cash income source through processing into starch and food products. Total utilization of sweetpotato remained at 20-24 million metric tons (mmt) per year during the entire period between 1980 and 1997. This demand was met entirely through domestic production. Among various uses, direct food consumption declined from 8.5 mmt in 1980 to less than 3 mmt in 1997, feed demand increased from 7.3 mmt to 8.4 mmt and industry use (processing) from 3.5 mmt to 6.8 mmt over the same period (Table 2.7). The small quantity of exports reported in table 2.7 refer only to trade in fresh sweetpotato. There was also a small but growing export of sweetpotato-processed products such as starch and starch-based noodles, but the overall quantity of these exports are not known.
The decline in sweetpotato consumption as direct food resulted from two major factors. One is income growth, which is negatively correlated with per capita consumption, and the second is
28
rural to urban migration. Urban residents consume only about one-third the amount of sweetpotato consumed by rural villagers. The share of urban consumption increased from less than 20 percent in 1980 to 30 percent in 1997. It is expected that growing urbanization will continue to be a major factor lowering per capita sweetpotato food consumption in the future.
29
Table 2.7 Sweetpotato supply, utilization food balance sheet in China, 1980-97.
Units 1980 1981 1982 1983 1984 1985 1986 1987 1988 1989 1990 1991 1992 1993 1994 1995 1996 1997
Area harvested 1000 ha 7914 7274 6908 6840 6427 6094 6175 6277 6307 6274 6256 6199 6062 6133 6062 6085 6062 5963 Yield t/ha 2.992 2.957 3.173 3.537 3.547 3.394 3.244 3.646 3.315 3.337 3.32 3.369 3.493 3.685 3.545 3.86 4.085 3.434
Production 1000 t 23675 21505 21920 24190 22795 20686 20033 22886 20904 20936 20771 20886 21175 22603 21491 23485 24761 20474
Ending stock 1000 t 4735 4729 4722 4715 4708 4696 4686 4674 4659 4643 4627 4612 4596 4579 4551 4549 4549 4548
Net import 1000 t -100 -100 -110 -121 -114 -207 -200 -229 -314 -314 -312 -313 -318 -339 -555 -41 -4 -10 Import 1000 t 0 0 0 0 0 0 0 0 0 0 0 0 0 0 0 0 0 0
Export 1000 t 100 100 110 121 114 207 200 229 314 314 312 313 318 339 555 41 4 10
Consumption 1000 t 23581 21411 21817 24076 22688 20491 19843 22668 20606 20638 20475 20589 20873 22281 20964 23446 24757 20465
Food use 1000 t 8487 7706 7634 8183 7258 6144 5355 5664 4736 4331 3887 3703 3546 3562 3140 3282 3466 2865 Urban 1000 t 636 593 610 641 492 497 425 423 365 358 345 349 362 376 375 442 413 397
Rural 1000 t 7851 7112 7024 7543 6766 5646 4930 5241 4370 3973 3543 3355 3184 3187 2765 2840 3053 2468
Feed use 1000 t 7308 6422 6761 7461 7031 6553 6743 7930 7412 7630 7774 8023 8134 8683 8374 9378 9903 8390 Seed use 1000 t 1421 1290 1315 1451 1368 1241 1002 1144 1045 1047 1039 1044 1059 1130 1075 1174 1238 1024
Industry use 1000 t 3536 3425 3708 4332 4536 4505 4760 5664 5353 5568 5729 5966 6257 6902 6700 7737 8170 6753
Waste 1000 t 2829 2569 2399 2648 2495 2048 1983 2266 2059 2062 2046 1852 1877 2004 1675 1876 1981 1432
Per cap food kg/cap 8.65 7.75 7.59 8.06 7.08 5.88 5.02 5.23 4.30 3.87 3.42 3.22 3.04 3.02 2.63 2.72 2.85 2.33
Urban kg/cap 3.38 3.01 2.91 2.89 2.10 2.02 1.65 1.57 1.30 1.23 1.15 1.15 1.15 1.14 1.11 1.27 1.16 1.09
Rural kg/cap 9.90 8.93 8.82 9.50 8.55 7.07 6.09 6.44 5.33 4.8 4.24 3.96 3.74 3.75 3.24 3.31 3.54 2.85
Population Million 981.2 993.9 1005.9 1015.9 1025.6 1044.5 1066.8 1084.0 1101.6 1118.7 1135.2 1150.8 1165.0 1178.4 1191.8 1204.9 1217.6 1230.1 Urban Million 188.2 197.4 209.6 222.0 234.3 245.7 257.3 270.2 281.7 291.0 298.7 303.7 314.6 328.7 338.3 347.4 355.6 364.7 Rural Million 793.1 796.5 796.3 794.0 791.3 798.8 809.5 813.8 820.0 827.6 836.5 847.1 850.4 849.8 853.5 857.5 861.9 865.4 Note: Sweetpotato is reported on a dry weight basis. Dry weight is computed by dividing fresh weight by 5. Source: From CAPSiM database and authors’ estimates.
30
III. Sweetpotato Production and Utilization in Major Pig Production Areas 3.1 Data and Samples General Background
The data used in this study come from both primary and secondary sources. Primary data were gathered on sweetpotato production, utilization, price, cropping technologies, farming systems, marketing institutions and policies at the national and provincial level as well as in the study areas. The secondary data came from various official statistical publications in China.
Primary farm household surveys were conducted to gain a better understanding of sweetpotato production practices, utilization of products, incentives in crop production and the efficiency of substituting sweetpotato for maize as feed in swine production. Some 200 farm households from 10 counties in Shandong and Sichuan provinces were selected based on the following criteria for the interview: 1) the areas should include sweetpotato and/or maize as part of the local farm production system; 2) raising pigs is an important or popular activity in the locality; 3) within selected villages, households were randomly stratified by income so that different income groups are represented; and 4) the samples are designed to include those villages and households with varying numbers of pig raised at farm level.
Based on these criteria, Sichuan and Shandong, the two largest sweetpotato provinces in China, were selected as case study areas. Further, localities were selected in areas where sweetpotato was primarily used as feed. Although in Shandong, the volume of sweetpotato used for food processing exceeds that used for feed, we purposely selected counties where feed is a primary use of sweetpotato. The results on sweetpotato utilization and production in Shandong are therefore not representative of the province as a whole.
Counties selected as the primary survey areas for farm level data collection included Jiangjin, Jiange and Leshan in Sichuan and Feixian and Zhucheng in Shandong. Two villages were selected in each county and 20 households were sampled in each village according to the criteria described above. Interviews were conducted in 1997 to get data on cost of production by crops, livestock production at household level and feed use, and again in1998 to gather information on farm household characteristics, production and consumption of major crops such as sweetpotato, maize, wheat and others.
In addition, county-level time series data on the production costs of sweetpotato, maize, wheat and rice for 1985-97 were collected from two counties each in Sichuan and Shandong provinces.4 These data provided means for analyzing the changes in the profitability of crop production over time.
4 These counties had records on sweetpotato production cost and return data.

31
Sichuan and Shandong Provinces Sichuan 5
Sichuan is located in Southwest China on the upper stretch of the Yangtze River. Except for the northwest part of Sichuan Plateau, the province belongs to the Yangzi River Basin Summer Sweetpotato Region (Region III, Map 2.1). Sichuan has 173 counties and 49 city-level urban districts. The research area Jiangjin is located in the southeast part of the province, Leshan in the south and Jiange in the north (Map 3.1, Panel A). Sweetpotato production and pig production are important agricultural activities in these counties (Table 3.2).
Table 3.1 Background information on provinces and counties in 1997 farm surve y
Total population
(million)
Farmer per capita
net income (Yuan)
Share of agricultural income of
farmer (%)
Per capita
cultivate land (ha)
Grain area
Share
(%)
National 1236 2090 56 0.078 73
Sichuan 114.72 1662 72 0.054 78
Jiangjin 1.446 2117 60 0.051 62
Jiange 0.666 1282 80 0.081 65
Leshan 0.525 1762 75 0.040 75
Shandong 87.85 2292 67 0.076 74
Feixian 0.904 1958 75 0.066 53
Zhucheng 1.040 3138 65 0.101 36
Source: China Statistical Yearbook, 1998; Statistical Yearbook of Sichuan, Chongqing and Shandong, 1998; County Statistical Bureaus in Surveyed Counties.
5 Sichuan province was divided into two parts with the separate administration of Chongqing city since 1996. However, in order to obtain a series of consistent data for Sichuan, it is defined as the old administrative classification by the government in this report, which includes Chongqing city.

32
N
E W
S
P a n e l A : T h e s a m p l e c o u n t i e s i n S i c h u a n p r o v i n c e
i
Panel B: The sample counties in Shandong province
Feixian
Zhucheng
N
EW
S
Map 3.1 Sample counties in Sichuan and Shandong province in 1997.
Leshan Jiangjin
Jiange
Feixian
Zhucheng
33
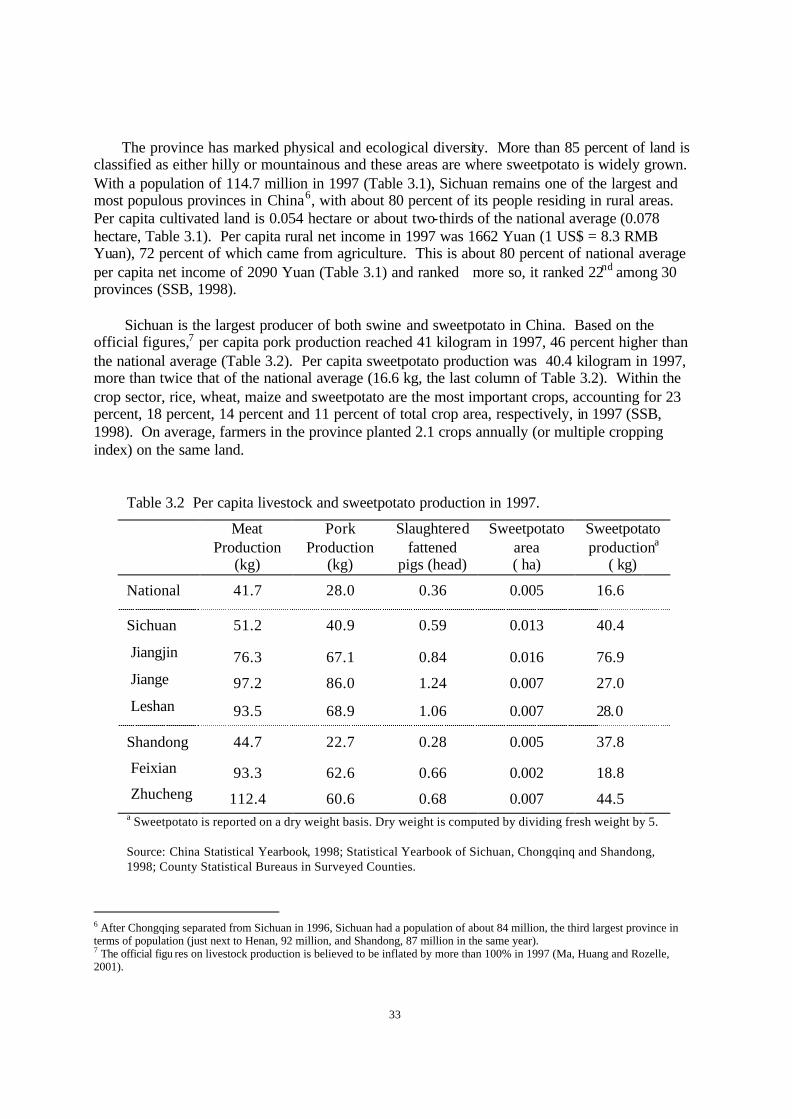
The province has marked physical and ecological diversity. More than 85 percent of land is classified as either hilly or mountainous and these areas are where sweetpotato is widely grown. With a population of 114.7 million in 1997 (Table 3.1), Sichuan remains one of the largest and most populous provinces in China6, with about 80 percent of its people residing in rural areas. Per capita cultivated land is 0.054 hectare or about two-thirds of the national average (0.078 hectare, Table 3.1). Per capita rural net income in 1997 was 1662 Yuan (1 US$ = 8.3 RMB Yuan), 72 percent of which came from agriculture. This is about 80 percent of national average per capita net income of 2090 Yuan (Table 3.1) and ranked more so, it ranked 22nd among 30 provinces (SSB, 1998).
Sichuan is the largest producer of both swine and sweetpotato in China. Based on the official figures,7 per capita pork production reached 41 kilogram in 1997, 46 percent higher than the national average (Table 3.2). Per capita sweetpotato production was 40.4 kilogram in 1997, more than twice that of the national average (16.6 kg, the last column of Table 3.2). Within the crop sector, rice, wheat, maize and sweetpotato are the most important crops, accounting for 23 percent, 18 percent, 14 percent and 11 percent of total crop area, respectively, in 1997 (SSB, 1998). On average, farmers in the province planted 2.1 crops annually (or multiple cropping index) on the same land.
Table 3.2 Per capita livestock and sweetpotato production in 1997.
Meat
Production (kg)
Pork Production
(kg)
Slaughtered fattened
pigs (head)
Sweetpotato area ( ha)
Sweetpotato productiona
( kg)
National 41.7 28.0 0.36 0.005 16.6
Sichuan 51.2 40.9 0.59 0.013 40.4
Jiangjin 76.3 67.1 0.84 0.016 76.9
Jiange 97.2 86.0 1.24 0.007 27.0
Leshan 93.5 68.9 1.06 0.007 28.0
Shandong 44.7 22.7 0.28 0.005 37.8
Feixian 93.3 62.6 0.66 0.002 18.8
Zhucheng 112.4 60.6 0.68 0.007 44.5 a Sweetpotato is reported on a dry weight basis. Dry weight is computed by dividing fresh weight by 5. Source: China Statistical Yearbook, 1998; Statistical Yearbook of Sichuan, Chongqinq and Shandong, 1998; County Statistical Bureaus in Surveyed Counties.
6 After Chongqing separated from Sichuan in 1996, Sichuan had a population of about 84 million, the third largest province in terms of population (just next to Henan, 92 million, and Shandong, 87 million in the same year). 7 The official figu res on livestock production is believed to be inflated by more than 100% in 1997 (Ma, Huang and Rozelle, 2001).
34
Shandong
Shandong is a coastal province located in the North China Plain and belongs to the Huang-Huai Basin Spring and Summer Sweetpotato Region (Map 2.1). It is the third most populous province among 30 provinces (only next to Sichuan and Henan) in China with 87.85 million in 1997 (Table 3.1), accounting for 7.1 percent of the national population. Seventy-four percent of the population reside in rural areas. Shandong has 94 counties and 62 city-level urban districts. The study area, Feixian, is located in the southern part of the province, and Zhucheng is in the southeast of the province (see Map 3.1, Panel B).
Shandong has much less ecological diversity than Sichuan. Only about 30 percent of its
land is classified as hilly or mountainous areas. Per capita cultivated land (0.076 hectare in 1997) is slightly lower than the national average (Table 3.1), but per capita rural income (2292 Yuan) is about 25 percent higher than Sichuan, ranking ninth among 30 provinces. About two-thirds of farm household income is derived from agriculture. The top five crops planted in the province are wheat, maize, peanut, soybean and sweetpotato, accounting for 37, 24 , 7, 5 and 4 percent, respectively, of total crop area in 1997 (SSB, 1998). Per capita sweetpotato production was 2.3 times higher than the national average in 1997 (Table 3.2) and was the highest in China in the mid 1980s (Map 3.2).
Shandong is the largest livestock producer in terms of output value in China. Total value of
livestock production was 75 billion Yuan in 1997 (68 billion Yuan for Sichuan, the second largest producer), accounting for 35 percent of agricultural output (SSB, 1998). Pork accounted for half of livestock production, a figure much lower than Sichuan (94 percent). Based on official data, the province produced about two million tons of pork in 1997, making Shandong the sixth largest producer in terms of quantity (or weight) in China. Trends in Sweetpotato Production
At the national level, sweetpotato production in China was stabilized at 20-24 mmt per year during the 1980s and 1990s despite the decline in the crop area (Table 3.3) although the growth pattern varies among provinces (Appendix Tables 1-3). Sichuan is a typical case where, after 10 years of falling sweetpotato production (Table 3.3), it started to grow at nearly 4 percent per year in 1990s (Table 3.4). This growth came from both area expansion and yield increases. By the late 1990s, Sichuan accounted for about 25 percent of national sweetpotato area, a 5 percent increase from the early 1980s. Its share of production in China also increased from about 19 percent in the early 1980s to 22 percent in the late 1990s (Table 3.3).
Shandong experienced another story. Sweetpotato area sharply declined in the early reform
period (1981-85) with an annual growth of -8 percent ( Table 3.4). Although the decline in area slowed to -2.14 percent per year in 1986-90, it resumed an accelerated decline of more than – 6 percent per year in 1990s. By 1999, sweetpotato area had fallen to 481,000 hectares, about 1/3 of the area in 1980. Despite an impressive gain in yield of about 2.7 percent per year in the 1990s, production fell from 5.55 mmt in 1980 to 2.76 mmt in 1999 (Table 3.3).

35
p r o d . / p o p . 8 4 _ 8 6
< = 3
4 - 1 0
1 1 - 1 9
2 0 - 3 3
> = 3 4
Panel A: Annual average in 1984-86
N
EW
S
p r o d . / p o p . 9 7 _ 9 9
< = 3
4 - 1 0
1 1 - 1 9
2 0 - 3 3
> = 3 4
Panel B: Annual average in 1997-99
N
EW
S
Map 3.2 Annual per capita sweetpotato production (kg) by province in China in 1984-86 and 1997-99
Sichuan
Shandong
Sichuan
Shandong
36
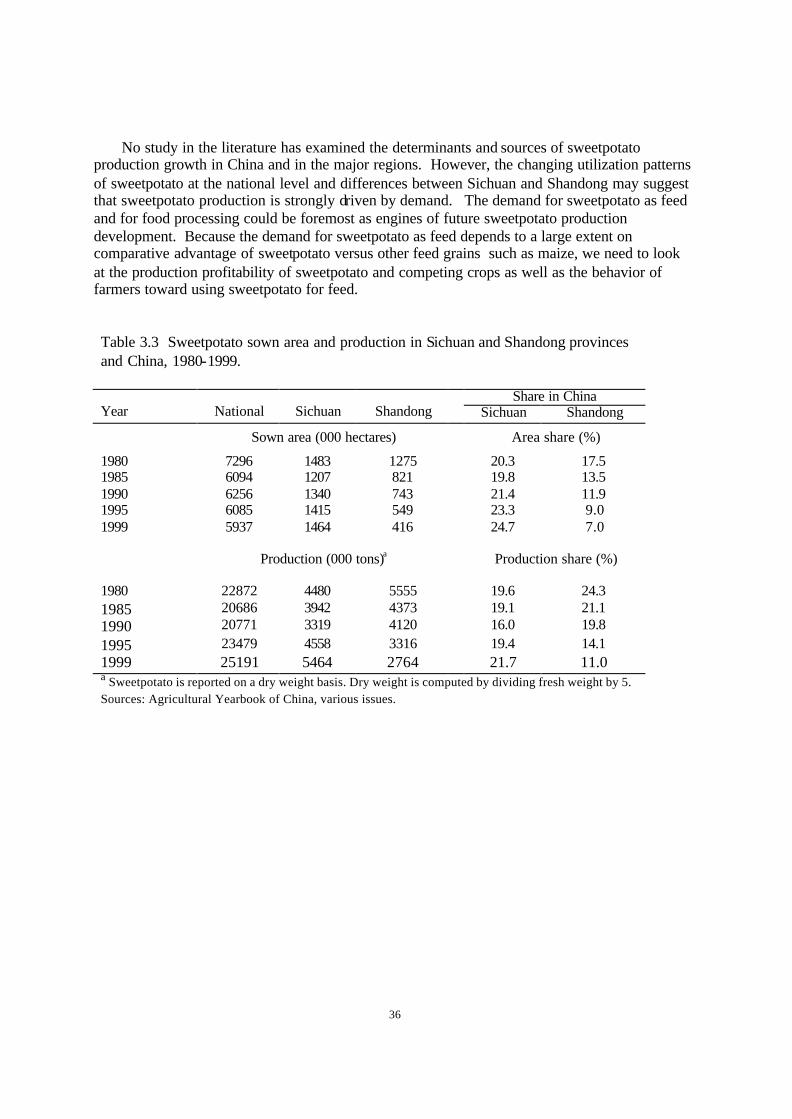
No study in the literature has examined the determinants and sources of sweetpotato production growth in China and in the major regions. However, the changing utilization patterns of sweetpotato at the national level and differences between Sichuan and Shandong may suggest that sweetpotato production is strongly driven by demand. The demand for sweetpotato as feed and for food processing could be foremost as engines of future sweetpotato production development. Because the demand for sweetpotato as feed depends to a large extent on comparative advantage of sweetpotato versus other feed grains such as maize, we need to look at the production profitability of sweetpotato and competing crops as well as the behavior of farmers toward using sweetpotato for feed. Table 3.3 Sweetpotato sown area and production in Sichuan and Shandong provinces and China, 1980-1999.
Share in China Year
National
Sichuan
Shandong Sichuan Shandong
Sown area (000 hectares) Area share (%)
1980 7296 1483 1275 20.3 17.5 1985 6094 1207 821 19.8 13.5 1990 6256 1340 743 21.4 11.9 1995 6085 1415 549 23.3 9.0 1999 5937 1464 416 24.7 7.0 Production (000 tons)a
Production share (%)
1980 22872 4480 5555 19.6 24.3 1985 20686 3942 4373 19.1 21.1 1990 20771 3319 4120 16.0 19.8 1995 23479 4558 3316 19.4 14.1 1999 25191 5464 2764 21.7 11.0 a Sweetpotato is reported on a dry weight basis. Dry weight is computed by dividing fresh weight by 5. Sources: Agricultural Yearbook of China, various issues.

37
Table 3.4 Annual growth rate (%) in sweetpotato production in China, Sichuan and Shandong provinces, 1982-99.
Area Yield Production National 1981-85 -4.71 3.91 -0.88 1986-90 0.52 -0.34 0.18 1991-95 -0.55 2.82 2.25 1996-99 -0.69 2.20 1.51 Sichuan 1981-85 -4.28 2.41 -2.01 1986-90 2.07 -4.10 -2.11 1991-95 1.22 2.91 4.17 1996-99 0.98 2.70 3.70 Shandong 1981-85 -8.00 6.76 -1.78 1986-90 -2.14 -1.53 -3.64 1991-95 -5.88 2.68 -3.36 1996-99 -6.67 2.74 -4.07 Note: Growth rates are computed using regression method. Source: SSB, Statistics Yearbook of China, various issues; Agricultural Yearbook of China, various issues. 3.2 Sweetpotato Production and Utilization Characteristics of Sample Households
Four villages in each county were selected with 10 random households from each village. A total of 200 households from 20 villages in the five counties were interviewed. Among 200 households interviewed, eight were excluded in our analysis due to insufficient information provided by these households, bringing the effective samples down to 192.
The characteristics of the sampled households from Jiangjin, Jiange and Leshan counties in
Sichuan and Feixian and Zhucheng counties in Shandong are summarized in Tables 3.5-3.7. Farm sizes in the sampled villages are close to the average for their respective counties, with a mean of 0.38 hectare (Table 3.5). This size is typical for an individual farm in China. For the sample in Sichuan, irrigated paddy land accounted for 61 percent of total arable land, but this varied considerably among counties, from 34 percent in Jiange to 79 percent in Leshan. In Shandong, upland (nonpaddy land) is dominant among the sample households, accounting for 94 percent of total arable land (Table 3.5). Croplands in Shandong are all ir rigated using groundwater.

38
The average family size was 3.8 persons with 2.71 laborers who were mainly engaged in agricultural production. Each family had to allocate its limited land to various uses in order to meet the needs of the household, and market only the surplus for cash income. Among various grains planted, rice is the most important crop in Sichuan while wheat and maize are dominant in Shandong (Table 3.6). Sweetpotato is the second major grain in Jiangjin county in Sichuan, and the third major crop in the other two Sichuan counties. In Shandong, the shares of sweetpotato in total grain area ranged from 4 percent in Zhucheng to 16 percent in Jiangjin and Feixian (Table 3.6). Table 3.5 Household characteristics of farms included in 1997 survey
Land structure (%) County
Family size
(person)
Farm size (ha)
Per family labor
Per capita arable land
(ha) Paddy land
Dry land
Hill land
Sichuan 3.72 (1.04)
0.36 (0.28)
2.59 (0.89)
0.10 (0.09)
60.7 (26.2)
23.4 (15.2)
16.1 (21.5)
Jiangjin
3.73 (1.28)
0.29 (0.17)
2.77 (0.97)
0.08 (0.04)
72.4 (14.7)
26.3 (12.9)
1.7 (5.2)
Jiange
3.98 (0.95)
0.56 (0.36)
2.35 (0.70)
0.15 (0.12)
34.4 (16.9)
26.5 (13.3)
39.1 (17.8)
Leshan
3.44 (0.85)
0.21 (0.07)
2.69 (0.98)
0.06 (0.02)
79.1 (17.8)
17.8 (17.4)
3.3 (8.5)
Shandong 3.91 (1.09)
0.41 (0.18)
2.88 (1.06)
0.11 (0.05)
3.2 (15.5)
94.0 (18.1)
2.8 (9.9)
Feixian 3.93 (0.83)
0.38 (0.18)
2.57 (0.77)
0.10 (0.04)
7.0 (22.6)
86.8 (25.2)
6.2 (14.0)
Zhucheng 3.89 (1.28)
0.43 (0.17)
3.14 (1.20)
0.12 (0.05)
0 (0)
100 (0)
0 (0)
Average 3.80 (1.06)
0.38 (0.25)
2.71 (0.95)
0.10 (0.25)
39 (36.1)
50.0 (38.0)
11.0 (19.0)
Note: Standard errors in the parentheses. Source: Authors' primary survey.

39
Table 3.6 Sweetpotato and cereal grain production of farms in 1997 survey
Grain area (ha)
Sweetpotato area (ha)
Rice area (%)
Wheat area (%)
Maize area (%)
Sweetpotato area (%)
Sichuan
Jiangjin 0.33 0.05 56 13 14 16
Jiange 0.44 0.02 36 35 23 5
Leshan 0.24 0.02 70 17 3 9
Shandong
Feixian 0.39 0.07 0 46 37 16
Zhucheng 0.60 0.02 0 52 44 4
Sources: Authors' primary survey.
Livestock production, particularly pig raising, is the second most important farming activity after grain production in the sampled areas. The households interviewed raised an average of 4.72 pigs in Sichuan and 1.9 pigs in Shandong (Table 3.7). Poultry is the second most important livestock and is produced by almost all households in the sample. Cattle and sheep were found in a small number of households.
The farmers’ income heavily depended on agricultural production, mainly grain and
livestock. Non-agricultural income contributed 20 percent to the farmer’s net income in both Sichuan and Shandong, a level much less than the national average of about one-third. But the average net income of the sampled households in Shandong was much higher than that in Sichuan. Heads of households in Shandong were also better educated, with an average of 7.3 years of formal schooling, than household heads in Sichuan, with only 5.7 years of schooling (Table 3.7). Sweetpotato Utilization
Households in the sample produced an average of 176 kilograms of sweetpotato in 1997 (Table 3.8). Feed use dominated sweetpotato utilization. Farmers used about 85 percent of the sweetpotato that they produced for feed. The rest (15 %) went to family food consumption, saved for seed use, and include post harvest losses as well. Marketing of sweetpotato was minimal, with only 13 kilograms sold and 6 kilograms purchased, implying a very high level of self-sufficiency at both household and community levels. More than half of marketed sweetpotato was for direct food consumption by local consumers and the rest was used to make starch by local food processors. The variations of utilization patterns were small among five counties studied. Note that because we selected counties where the primary use of sweetpotato

40
was for animal feed, these figures understate the average amount of sweetpotato used for food and industrial processing in these provinces.
Table 3.7 Other household characteristics of farms included in 1997 survey
Number of livestock (average of beginning and end-year inventory)
(head)
Per capita
income (Yuan)
Share of non-agri income
(%) Pig Cattle Sheep Poultry
Head schooling
years (year)
Sichuan 1958 (1241)
22.3 (30.2)
4.72 (21.1)
0.35 (0.6)
0.33 (1.1)
7.36 (16.9)
5.68 (2.6)
Jiangjin 1645 (800)
11.6 (18.2)
8.40 (19.8)
0.007 (0.0)
0.017 (0.1)
9.55 (13.7)
5.23 (2.1)
Jiange 1866 (1193)
22.4 (31.7)
3.16 (2.4)
0.80 (0.7)
0.89 (1.7)
4.00 (4.6)
6.15 (2.5)
Leshan 2294 (1492)
30.5 (33.9)
3.49 (5.7)
0.15 (0.4)
0 (0)
9.13 (25.1)
5.54 (2.8)
Shandong 2904 (2214)
19.4 (21.3)
1.90 (5.2)
0.14 (0.4)
0.24 (1.6)
4.76 (13.2)
7.33 (2.4)
Feixian 2153 (1119)
17.7 (20.6)
3.52 (7.3)
0 (0)
0.53 (2.4)
5.65 (4.7)
6.60 (2.3)
Zhucheng 3531 (2680)
20.7 (22.0)
0.56 (1.2)
0.25 (0.5)
0 (0)
4.01 (17.5)
7.94 (2.3)
Note: Standard errors in the parentheses. Sources: Authors' primary survey.
41
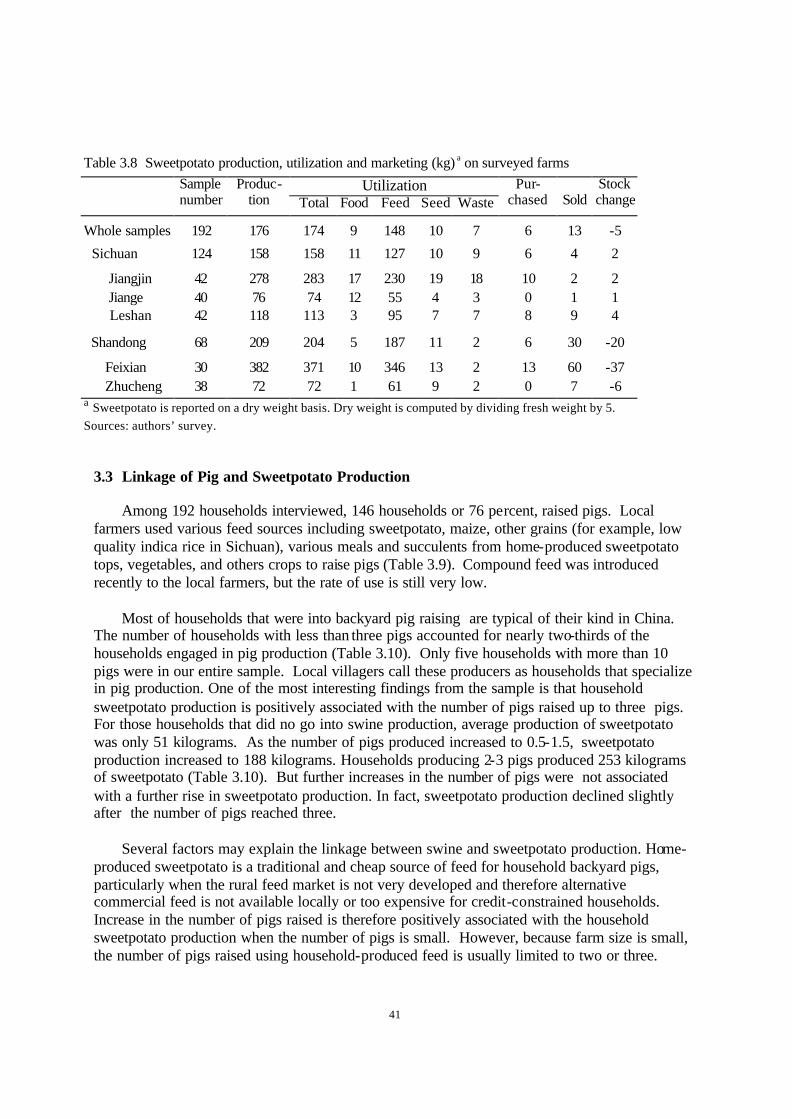
Table 3.8 Sweetpotato production, utilization and marketing (kg) a on surveyed farms
Utilization
Sample number
Produc- tion Total Food Feed Seed Waste
Pur- chased
Sold
Stock change
Whole samples 192 176 174 9 148 10 7 6 13 -5
Sichuan 124 158 158 11 127 10 9 6 4 2
Jiangjin 42 278 283 17 230 19 18 10 2 2 Jiange 40 76 74 12 55 4 3 0 1 1 Leshan 42 118 113 3 95 7 7 8 9 4
Shandong 68 209 204 5 187 11 2 6 30 -20
Feixian 30 382 371 10 346 13 2 13 60 -37 Zhucheng 38 72 72 1 61 9 2 0 7 -6 a Sweetpotato is reported on a dry weight basis. Dry weight is computed by dividing fresh weight by 5. Sources: authors’ survey.
3.3 Linkage of Pig and Sweetpotato Production
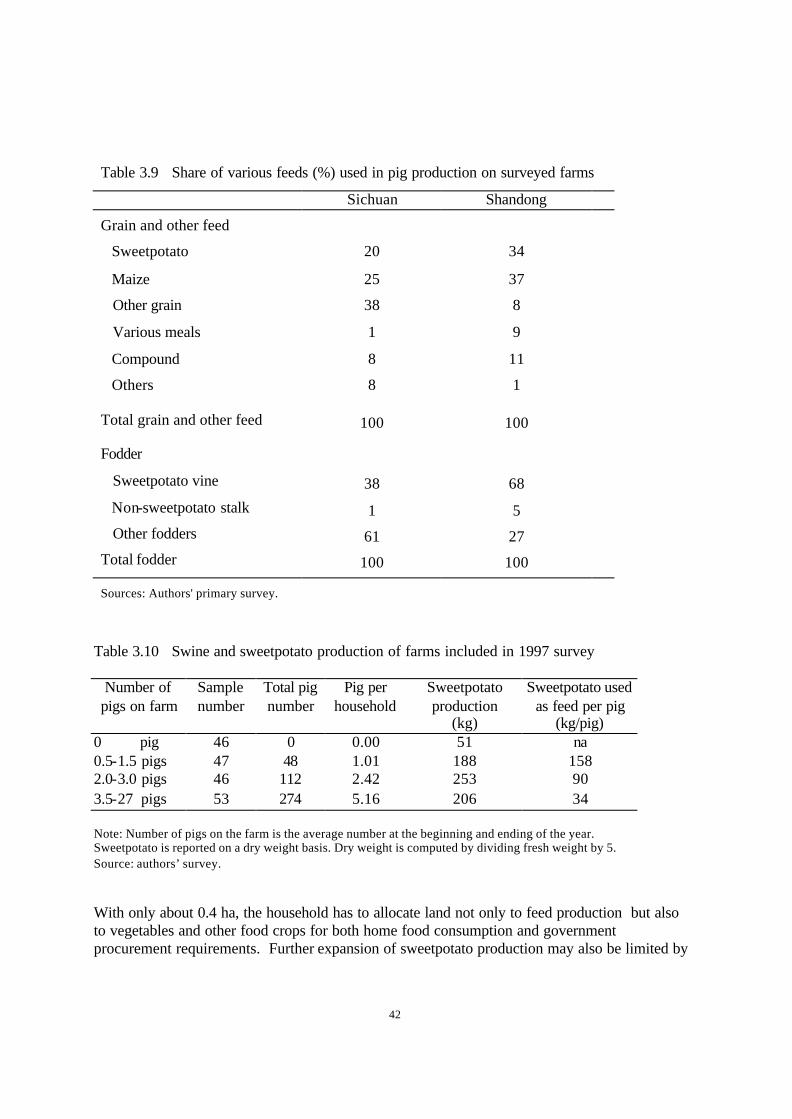
Among 192 households interviewed, 146 households or 76 percent, raised pigs. Local farmers used various feed sources including sweetpotato, maize, other grains (for example, low quality indica rice in Sichuan), various meals and succulents from home-produced sweetpotato tops, vegetables, and others crops to raise pigs (Table 3.9). Compound feed was introduced recently to the local farmers, but the rate of use is still very low.
Most of households that were into backyard pig raising are typical of their kind in China.
The number of households with less than three pigs accounted for nearly two-thirds of the households engaged in pig production (Table 3.10). Only five households with more than 10 pigs were in our entire sample. Local villagers call these producers as households that specialize in pig production. One of the most interesting findings from the sample is that household sweetpotato production is positively associated with the number of pigs raised up to three pigs. For those households that did no go into swine production, average production of sweetpotato was only 51 kilograms. As the number of pigs produced increased to 0.5-1.5, sweetpotato production increased to 188 kilograms. Households producing 2-3 pigs produced 253 kilograms of sweetpotato (Table 3.10). But further increases in the number of pigs were not associated with a further rise in sweetpotato production. In fact, sweetpotato production declined slightly after the number of pigs reached three.
Several factors may explain the linkage between swine and sweetpotato production. Home-
produced sweetpotato is a traditional and cheap source of feed for household backyard pigs, particularly when the rural feed market is not very developed and therefore alternative commercial feed is not available locally or too expensive for credit-constrained households. Increase in the number of pigs raised is therefore positively associated with the household sweetpotato production when the number of pigs is small. However, because farm size is small, the number of pigs raised using household-produced feed is usually limited to two or three.
42
Table 3.9 Share of various feeds (%) used in pig production on surveyed farms
Sichuan Shandong
Grain and other feed Sweetpotato 20 34
Maize 25 37
Other grain 38 8
Various meals 1 9
Compound 8 11 Others 8 1
Total grain and other feed 100 100
Fodder
Sweetpotato vine 38 68
Non-sweetpotato stalk 1 5 Other fodders 61 27 Total fodder 100 100
Sources: Authors' primary survey.
Table 3.10 Swine and sweetpotato production of farms included in 1997 survey
Number of pigs on farm
Sample number
Total pig number
Pig per household
Sweetpotato production
(kg)
Sweetpotato used as feed per pig
(kg/pig) 0 pig 46 0 0.00 51 na 0.5-1.5 pigs 47 48 1.01 188 158 2.0-3.0 pigs 46 112 2.42 253 90 3.5-27 pigs 53 274 5.16 206 34 Note: Number of pigs on the farm is the average number at the beginning and ending of the year. Sweetpotato is reported on a dry weight basis. Dry weight is computed by dividing fresh weight by 5. Source: authors’ survey. With only about 0.4 ha, the household has to allocate land not only to feed production but also to vegetables and other food crops for both home food consumption and government procurement requirements. Further expansion of sweetpotato production may also be limited by

43
the availability of family labor, since growing sweetpotato is more labor intensive than other grain crops. Therefore, increasing the number of pigs raised above this limit would require the use of alternative feed grains or commercial feed, unless suitable technologies can be found to raise sweetpotato yield and reduce labor requirements.
The above discussion implies that future prospects for sweetpotato used as feed for pig production will largely depend on the following factors: 1) grain (and feed) marketing development as well as government grain procurement system reform; 2) growth or decline of backyard pig production; and 3) the comparative advantage of sweetpotato as feed for raising pig. It is evident from the preceding discussion that the first two factors are unlikely to result in the full development of sweetpotato as livestock feed source. China is liberalizing its grain sector and WTO accession is expected to further liberalize this sector. Further, agricultural grain markets, especially for maize, have become increasingly integrated nationally since the late 1980s (Yu and Huang, 1998; Rozelle et al., 2000). The last factor is a central issue of this study that will be investigated in Chapters 4 and 5.
The share of backyard pig production has been declining since the middle 1980s by about one percent per year. According to a nationwide survey conducted by the Ministry of Agriculture, the backyard producers accounted for 94.6 pe rcent of pig production in China in 1985. This share had fallen 80.7 percent by 1996 (Table 3.11). A recent study by Chen (2001) shows that many factors that determine pig production favor its intensification at the expense of backyard pig raising, particularly labor market development and migration, farm income growth, and various risks associated with farm production. However, the trends in backyard pig production vary widely across provinces. The share of households that raise pigs has been falling sharply in coastal provinces but remains high or has even increased in some interior provinces like Sichuan and Hunan (Zhang, 1998). Table 3.11 Share (%) of pig production by different sizes of farms
Backyard Specialized household
Intensive
1985 94.6 2.9 2.5 1993 88.3 8.2 3.5 1996 80.7 14.6 4.7 Note: Annual average number of slaughtered pigs was 3.2 for backyard producer and 436 for specialized household in 1993 and 1996, and 1.7 for backyard producer and 30 for specialized household in 1985. Source: RERC, 1997.
Table 3.12 presents how sweetpotato is utilized and marketed by households that ventured into pig raising. The results show that the majority of sweetpotato produced by farmers were consumed on farm as feed, food, seed, or were lost after harvest. Marketing of sweetpotato was minimal and the number of pigs raised was not correlated with the quantity of sweetpotato

44
marketed. For comparison, Table 3.13 shows similar information in the utilization and marketing of maize by the backyard swine raisers. The results also show that most of maize produced by farmers are utilized on farm as feed, food, and others. Tables 3.12 and 3.13 also indicate that an increase in pig feed demand is met mainly by home-grown sweetpotato and maize in our sample areas. This points out the importance of the relative competitive advantage (or profitability) of sweetpotato versus maize production in determining feed utilization in backyard pig production.
Table 3.12 Sweetpotato production, utilization and marketing (kg) by number of pigs per household in 1997. Pig number Production Home use Purchased Sold Stock change Whole samples 0 pig 51 41 0 7 2 0.5-1.5 pigs 188 184 9 23 -10 2.0-3.0 pigs 253 253 13 13 -1 3.5-27 pigs 206 211 2 10 -13 Sichuan 0 pig 26 27 0 0 0 0.5-1.5 pigs 129 131 1 3 -3 2.0-3.0 pigs 187 190 15 11 2 3.5-27 pigs 181 178 3 0 6 Shandong 0 pig 58 46 0 9 3 0.5-1.5 pigs 275 262 21 53 -20 2.0-3.0 pigs 621 609 0 27 -15 3.5-27 pigs 369 432 0 75 -137 Note: Sweetpotato is reported on a dry weight basis. Dry weight is computed by dividing fresh weight by 5. Sources: Authors’ survey in Sichuan and Shandong.

45
Table 3.13 Maize production, utilization and marketing (kg) by number of pigs per household in 1997. Pig number Production Home use Purchased Sold Stock change Whole samples 0 pig 815 330 88 497 76 0.5-1.5 pigs 398 354 30 106 -32 2.0-3.0 pigs 377 318 12 83 -12 3.5-27 pigs 480 477 55 34 24 Sichuan 0 pig 101 60 5 45 1 0.5-1.5 pigs 157 193 48 5 7 2.0-3.0 pigs 332 304 14 23 19 3.5-27 pigs 376 383 36 24 5 Shandong 0 pig 1040 415 114 643 96 0.5-1.5 pigs 753 592 2 205 -42 2.0-3.0 pigs 625 401 0 280 -56 3.5-27 pigs 1160 1095 179 203 41 Sources: Authors’ survey in Sichuan and Shandong.
Econometric analysis of the determinants of sweetpotato area and production confirm the
relationship between backyard pig activity and sweetpotato production (Table 3.14). While crop area and production had strong positive links with the number of pigs raised, the marginal increase in sweetpotato declined with the number of pigs raised, and did not increase after three pigs.
Among households using sweetpotato in the farm sample, feed accounted for 85 percent of use and the rest (15 %) was nearly equally divided among food, seed and post -harvest losses (Table 3.15). Differences in sweetpotato use among the sample counties were small. There was also no significant difference in the pattern of sweetpotato utilization among different sizes of pig production (Table 3.15). Because there is limitation to sweetpotato expansion at the household level, increasing the number of pigs raised was accompanied by a reduction in the amount of sweetpotato available per pig (Table 3.10).
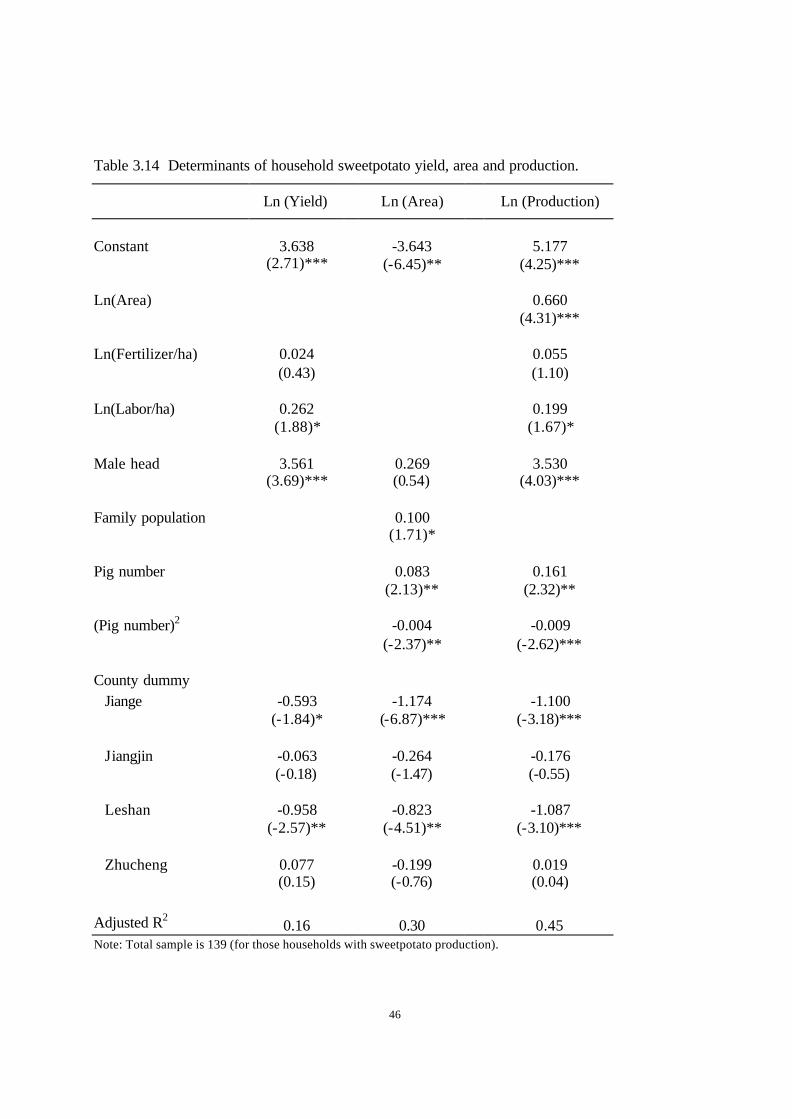
46
Table 3.14 Determinants of household sweetpotato yield, area and production.
Ln (Yield) Ln (Area) Ln (Production)
Constant 3.638
(2.71)***
-3.643
(-6.45)**
5.177
(4.25)***
Ln(Area)
0.660 (4.31)***
Ln(Fertilizer/ha) 0.024
(0.43)
0.055 (1.10)
Ln(Labor/ha) 0.262
(1.88)*
0.199 (1.67)*
Male head 3.561
(3.69)*** 0.269 (0.54)
3.530 (4.03)***
Family population
0.100
(1.71)*
Pig number
0.083 (2.13)**
0.161 (2.32)**
(Pig number)2
-0.004 (-2.37)**
-0.009 (-2.62)***
County dummy Jiange -0.593
(-1.84)*
-1.174 (-6.87)***
-1.100 (-3.18)***
Jiangjin -0.063
(-0.18)
-0.264 (-1.47)
-0.176 (-0.55)
Leshan -0.958
(-2.57)** -0.823
(-4.51)** -1.087
(-3.10)***
Zhucheng 0.077 (0.15)
-0.199 (-0.76)
0.019 (0.04)
Adjusted R2 0.16 0.30 0.45 Note: Total sample is 139 (for those households with sweetpotato production).

47
Table 3.15 Patterns of sweetpotato utilization in households included in 1997 survey
Shares in total home use (%)
Sample number Total Food Feed Seed Waste
Whole sample 192 100 5 85 6 4
Sichuan 124 100 7 81 6 6
Jiangjin 42 100 6 81 7 6 Jiange 40 100 16 74 5 4 Leshan 42 100 3 84 6 7
Shandong 68 100 2 91 5 1
Feixian 30 100 3 93 3 1 Zhucheng 38 100 0 84 12 3 By number of pigs raised (all farms)
0 pig 46 100 4 84 10 2 0.5-1.5 pigs 47 100 5 87 6 3 2.0-3.0 pigs 46 100 6 86 5 3 3.5-27 pigs 53 100 5 84 6 6
By number of pigs raised (farms with sweetpotato production only)
146 100 12 77 7 5
0 pig 12 100 19 63 16 2 0.5-1.5 pigs 39 100 13 77 6 4 2.0-3.0 pigs 45 100 12 78 5 4 3.5-27 pigs 50 100 9 79 6 6 Sources: Authors’ survey in Sichuan and Shandong. 3.4 Farmers’ Perception on Sweetpotato Production and Utilization
In order to gain a better understanding of sweetpotato farmers’ perceptions on sweetpotato production and utilization, the farmers were asked to answer several pre-designed questions. One question asked about the reasons farmers decided to plant sweetpotato to which more than 90 percent in Sichuan and 73 percent in Shandong replied that the primary reason was for home feed use (Table 3.16). Home food consumption and crop profitability were not among the major factors influencing farmers’ decision to plant sweetpotato. The same question was asked regarding maize. The answers from Sichuan’s farmers were not much different for the two crops, sweetpotato and maize. This may be due to the fact that maize in our Sichuan sample was also mostly used as home feed and not for commercial sale. But about 20 percent of farmers from Shandong considered high profit of maize production as the top reason for planting maize.

48
Table 3.16 Farmer’s main reasons (%) for growing sweetpotato and maize for households included in 1997 survey
Sichuan Shandong Reason Average Jiangjin Jiange Leshan Average Feixian Zhucheng
What is your main reason for planting sweetpotato?
Home food use 0 0 0 0 0 0 0 Home feed use 91 88 95 89 73 84 56 Profitable 1 0 3 0 0 0 0 Others 7 9 3 8 20 13 33 Not applicable 2 3 0 3 6 3 11
What is your main reason for planting maize?
Home food use 2 0 0 7 0 0 0 Home feed use 85 97 95 59 55 70 42 Profitable 1 0 3 0 20 13 25 Others and NA 11 3 3 33 26 17 33 Note: NA is for those farmers who did not plant sweetpotato at all. Sources: Authors' primary survey.
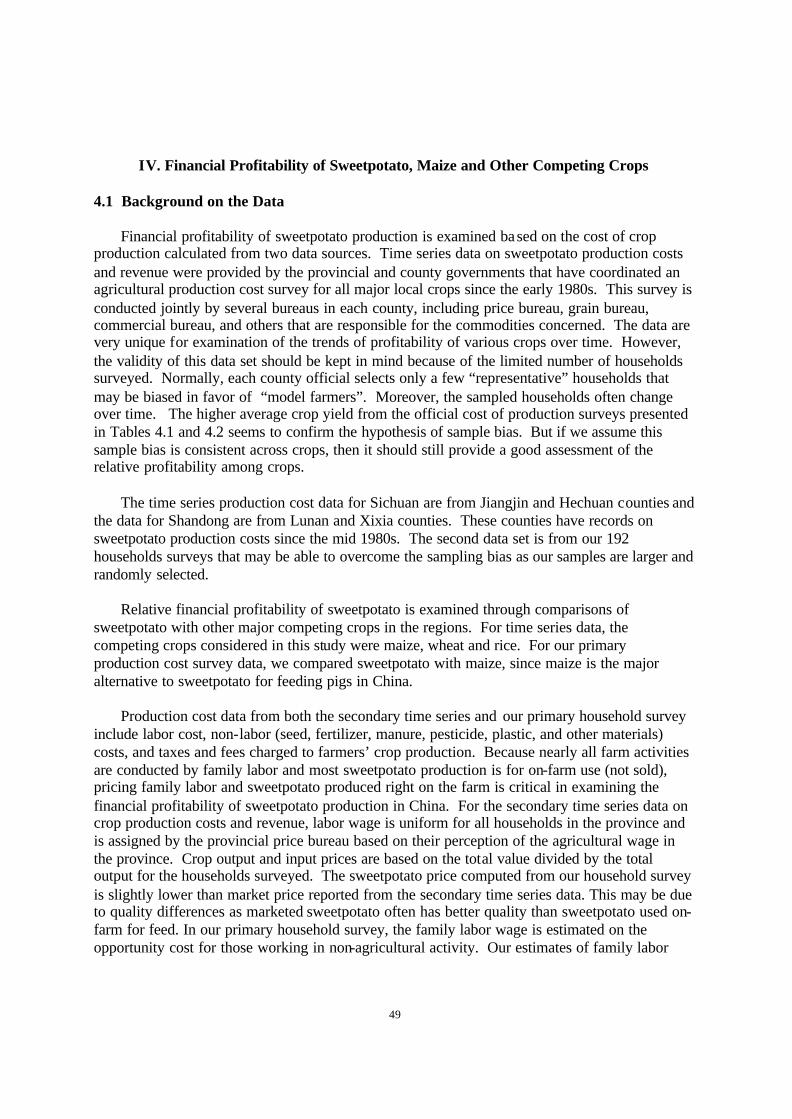
49
IV. Financial Profitability of Sweetpotato, Maize and Other Competing Crops
4.1 Background on the Data
Financial profitability of sweetpotato production is examined based on the cost of crop production calculated from two data sources. Time series data on sweetpotato production costs and revenue were provided by the provincial and county governments that have coordinated an agricultural production cost survey for all major local crops since the early 1980s. This survey is conducted jointly by several bureaus in each county, including price bureau, grain bureau, commercial bureau, and others that are responsible for the commodities concerned. The data are very unique for examination of the trends of profitability of various crops over time. However, the validity of this data set should be kept in mind because of the limited number of households surveyed. Normally, each county official selects only a few “representative” households that may be biased in favor of “model farmers”. Moreover, the sampled households often change over time. The higher average crop yield from the official cost of production surveys presented in Tables 4.1 and 4.2 seems to confirm the hypothesis of sample bias. But if we assume this sample bias is consistent across crops, then it should still provide a good assessment of the relative profitability among crops.
The time series production cost data for Sichuan are from Jiangjin and Hechuan counties and the data for Shandong are from Lunan and Xixia counties. These counties have records on sweetpotato production costs since the mid 1980s. The second data set is from our 192 households surveys that may be able to overcome the sampling bias as our samples are larger and randomly selected.
Relative financial profitability of sweetpotato is examined through comparisons of sweetpotato with other major competing crops in the regions. For time series data, the competing crops considered in this study were maize, wheat and rice. For our primary production cost survey data, we compared sweetpotato with maize, since maize is the major alternative to sweetpotato for feeding pigs in China.
Production cost data from both the secondary time series and our primary household survey include labor cost, non-labor (seed, fertilizer, manure, pesticide, plastic, and other materials) costs, and taxes and fees charged to farmers’ crop production. Because nearly all farm activities are conducted by family labor and most sweetpotato production is for on-farm use (not sold), pricing family labor and sweetpotato produced right on the farm is critical in examining the financial profitability of sweetpotato production in China. For the secondary time series data on crop production costs and revenue, labor wage is uniform for all households in the province and is assigned by the provincial price bureau based on their perception of the agricultural wage in the province. Crop output and input prices are based on the total value divided by the total output for the households surveyed. The sweetpotato price computed from our household survey is slightly lower than market price reported from the secondary time series data. This may be due to quality differences as marketed sweetpotato often has better quality than sweetpotato used on-farm for feed. In our primary household survey, the family labor wage is estimated on the opportunity cost for those working in non-agricultural activity. Our estimates of family labor
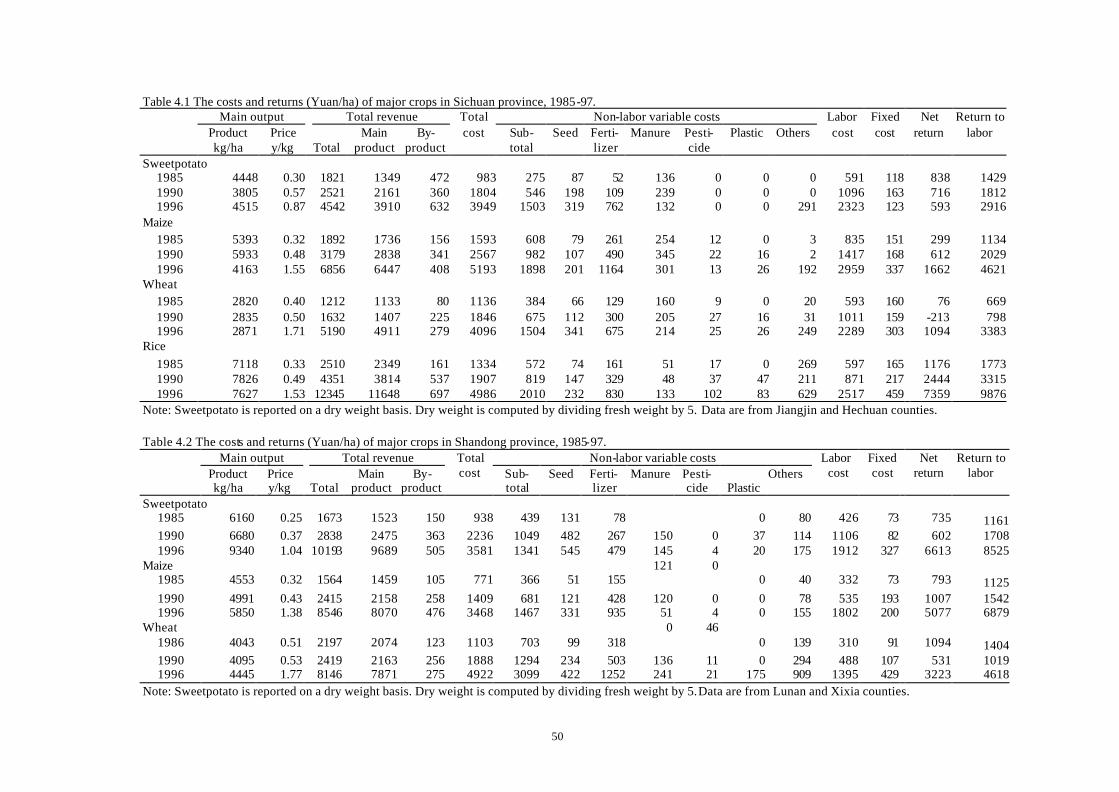
50
Table 4.1 The costs and returns (Yuan/ha) of major crops in Sichuan province, 1985-97. Main output Total revenue Non-labor variable costs Product
kg/ha Price y/kg
Total
Main product
By- product
Total cost Sub-
total Seed Ferti-
lizer Manure Pesti-
cide Plastic Others
Labor cost
Fixed cost
Net return
Return to labor
Sweetpotato 1985 4448 0.30 1821 1349 472 983 275 87 52 136 0 0 0 591 118 838 1429 1990 3805 0.57 2521 2161 360 1804 546 198 109 239 0 0 0 1096 163 716 1812 1996 4515 0.87 4542 3910 632 3949 1503 319 762 132 0 0 291 2323 123 593 2916
Maize 1985 5393 0.32 1892 1736 156 1593 608 79 261 254 12 0 3 835 151 299 1134 1990 5933 0.48 3179 2838 341 2567 982 107 490 345 22 16 2 1417 168 612 2029 1996 4163 1.55 6856 6447 408 5193 1898 201 1164 301 13 26 192 2959 337 1662 4621
Wheat 1985 2820 0.40 1212 1133 80 1136 384 66 129 160 9 0 20 593 160 76 669 1990 2835 0.50 1632 1407 225 1846 675 112 300 205 27 16 31 1011 159 -213 798 1996 2871 1.71 5190 4911 279 4096 1504 341 675 214 25 26 249 2289 303 1094 3383
Rice 1985 7118 0.33 2510 2349 161 1334 572 74 161 51 17 0 269 597 165 1176 1773 1990 7826 0.49 4351 3814 537 1907 819 147 329 48 37 47 211 871 217 2444 3315 1996 7627 1.53 12345 11648 697 4986 2010 232 830 133 102 83 629 2517 459 7359 9876
Note: Sweetpotato is reported on a dry weight basis. Dry weight is computed by dividing fresh weight by 5. Data are from Jiangjin and Hechuan counties. Table 4.2 The costs and returns (Yuan/ha) of major crops in Shandong province, 1985-97.
Main output Total revenue Non-labor variable costs Product
kg/ha Price y/kg
Total
Main product
By- product
Total cost Sub-
total Seed Ferti-
lizer Manure Pesti-
cide
Plastic Others
Labor cost
Fixed cost
Net return
Return to labor
Sweetpotato
1985 6160 0.25 1673 1523 150 938 439 131 78 0 80 426 73 735 1161 1990 6680 0.37 2838 2475 363 2236 1049 482 267 150 0 37 114 1106 82 602 1708 1996 9340 1.04 10193 9689 505 3581 1341 545 479 145 4 20 175 1912 327 6613 8525
Maize 121 0 1985 4553 0.32 1564 1459 105 771 366 51 155 0 40 332 73 793 1125 1990 4991 0.43 2415 2158 258 1409 681 121 428 120 0 0 78 535 193 1007 1542 1996 5850 1.38 8546 8070 476 3468 1467 331 935 51 4 0 155 1802 200 5077 6879
Wheat 0 46 1986 4043 0.51 2197 2074 123 1103 703 99 318 0 139 310 91 1094 1404 1990 4095 0.53 2419 2163 256 1888 1294 234 503 136 11 0 294 488 107 531 1019 1996 4445 1.77 8146 7871 275 4922 3099 422 1252 241 21 175 909 1395 429 3223 4618
Note: Sweetpotato is reported on a dry weight basis. Dry weight is computed by dividing fresh weight by 5.Data are from Lunan and Xixia counties.

51
wage are slightly higher than (about 20 percent) those found in the secondary time series cost of crop production data.
To overcome the potential problems associated with uniformly assigned family labor wage and the price of sweetpotato produced right on the farm, as well as likely sample bias in the secondary time series data, we conducted a breakeven analysis for family labor wage, sweetpotato price and yield. The estimated breakeven values provide useful benchmark information for farmers to decide whether they should produce sweetpotato for profit consideration. The breakeven values also offer policy decision makers with information in formulating policy, including input and out pricing and productivity-enhancing investment policies. 4.2 Financial Profitability Based on Secondary Time Series Data Net Return of Crop’s Production Sichuan
From the secondary time series data from Sichuan, sweetpotato once was profitable although its profitability relative to alternative crops has declined over time. Among four competing commodities in Jiangjin and Hechuan counties of Sichuan province, the profitability of sweetpotato ranked second after rice in 1985 (Table 4.1). Net return per hectare was at 838 Yuan, much higher than maize and wheat. Percentage of net return to total cost (85 percent) in sweetpotato production was also significantly higher than those in wheat (19 percent) and maize (7 percent) and only marginally lower than that in rice (88 percent, Table 4.1).
However, between 1985-96, the financial profitability of sweetpotato production declined while the profitability of competing crops such as rice and maize rose. Given an inflation rate (consumer price index) of 314 percent in the rural area over the period of 1985-96 (SSB, 2000), real profit from sweetpotato production per hectare in 1996 was only about 22 percent of that in 1985. For maize, wheat and rice, the increases in the net return (or profit) were 5.6, 14.3 and 6.3 times, respectively, over the same period. This growth is much higher than the price inflation in the rural areas.
The most important factor explaining the decline in sweetpotato profitability in these data is a decline in sweetpotato price relative to cereal grains. The price of sweetpotato in1996 was 0.87 Yuan/kg, an increase of 290 percent in nominal terms from 1985 (and indeed a decline in real price given an inflation index of 314 percent over this period), while the prices of the other competing crops rose 4-5 times in the same period (Table 4.1). Relative yields and input costs, on the other hand, did not change much in these counties of Sichuan.
The apparent decline in profitability of sweetpotato in our study area in Sichuan belies the
rising trend in production in this province. One explanation may lie in cropping system constraints. Sweetpotato in Sichuan is typically grown in hilly areas (not rice land) in rotation with wheat or maize. The benefit of rotations and reduced soil erosion on hilly land from sweetpotato are not captured in the crop budgets. Another factor is the expansion of backya rd pig
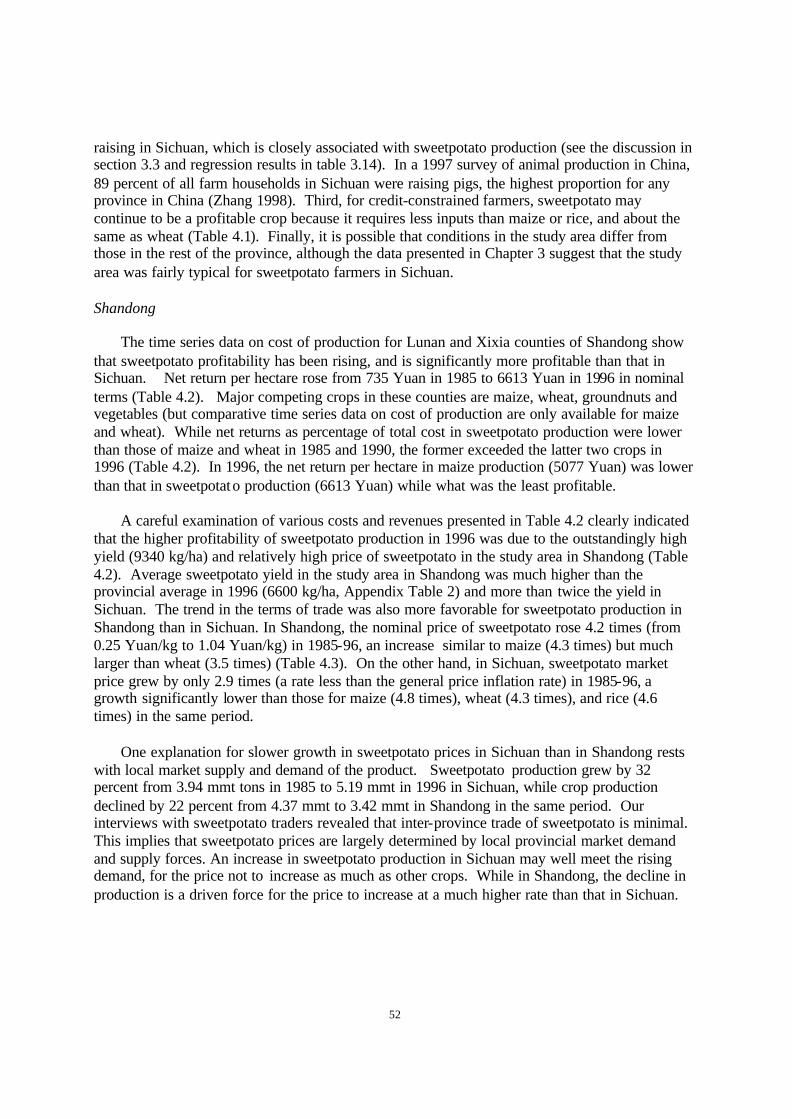
52
raising in Sichuan, which is closely associated with sweetpotato production (see the discussion in section 3.3 and regression results in table 3.14). In a 1997 survey of animal production in China, 89 percent of all farm households in Sichuan were raising pigs, the highest proportion for any province in China (Zhang 1998). Third, for credit-constrained farmers, sweetpotato may continue to be a profitable crop because it requires less inputs than maize or rice, and about the same as wheat (Table 4.1). Finally, it is possible that conditions in the study area differ from those in the rest of the province, although the data presented in Chapter 3 suggest that the study area was fairly typical for sweetpotato farmers in Sichuan. Shandong
The time series data on cost of production for Lunan and Xixia counties of Shandong show that sweetpotato profitability has been rising, and is significantly more profitable than that in Sichuan. Net return per hectare rose from 735 Yuan in 1985 to 6613 Yuan in 1996 in nominal terms (Table 4.2). Major competing crops in these counties are maize, wheat, groundnuts and vegetables (but comparative time series data on cost of production are only available for maize and wheat). While net returns as percentage of total cost in sweetpotato production were lower than those of maize and wheat in 1985 and 1990, the former exceeded the latter two crops in 1996 (Table 4.2). In 1996, the net return per hectare in maize production (5077 Yuan) was lower than that in sweetpotato production (6613 Yuan) while what was the least profitable.
A careful examination of various costs and revenues presented in Table 4.2 clearly indicated that the higher profitability of sweetpotato production in 1996 was due to the outstandingly high yield (9340 kg/ha) and relatively high price of sweetpotato in the study area in Shandong (Table 4.2). Average sweetpotato yield in the study area in Shandong was much higher than the provincial average in 1996 (6600 kg/ha, Appendix Table 2) and more than twice the yield in Sichuan. The trend in the terms of trade was also more favorable for sweetpotato production in Shandong than in Sichuan. In Shandong, the nominal price of sweetpotato rose 4.2 times (from 0.25 Yuan/kg to 1.04 Yuan/kg) in 1985-96, an increase similar to maize (4.3 times) but much larger than wheat (3.5 times) (Table 4.3). On the other hand, in Sichuan, sweetpotato market price grew by only 2.9 times (a rate less than the general price inflation rate) in 1985-96, a growth significantly lower than those for maize (4.8 times), wheat (4.3 times), and rice (4.6 times) in the same period.
One explanation for slower growth in sweetpotato prices in Sichuan than in Shandong rests with local market supply and demand of the product. Sweetpotato production grew by 32 percent from 3.94 mmt tons in 1985 to 5.19 mmt in 1996 in Sichuan, while crop production declined by 22 percent from 4.37 mmt to 3.42 mmt in Shandong in the same period. Our interviews with sweetpotato traders revealed that inter-province trade of sweetpotato is minimal. This implies that sweetpotato prices are largely determined by local provincial market demand and supply forces. An increase in sweetpotato production in Sichuan may well meet the rising demand, for the price not to increase as much as other crops. While in Shandong, the decline in production is a driven force for the price to increase at a much higher rate than that in Sichuan.

53
Table 4.3 Break-even wage, price and crop yield in Sichuan and Shandong
Observed Break-even values Wage Price Yield Wage Price Yield Yuan/day Yuan/kg kg/ha Yuan/day Yuan/kg kg/ha
Sichuan: Sweetpotato 7.48 0.87 4515 9.39 0.73 3830 Maize 7.48 1.55 4163 11.68 1.15 3089 Wheat 7.48 1.71 2871 11.06 1.33 2231 Rice 7.48 1.53 7627 29.35 0.56 2808
Shandong
Sweetpotato 7.75 1.04 9340 34.55 0.33 2965 Maize 7.75 1.38 5850 29.6 0.51 2170 Wheat 7.75 1.77 4445 25.66 1.05 2624 Note: Sweetpotato is reported on a dry weight basis. Dry weight is computed by dividing fresh weight by 5. Data for Sichuan are from Jiangjina nd Hechuan counties and for Shandong are from Lunan and Xixia counties. Break-even Analysis
The results of the previous sub-section may be misleading if the secondary data from the production cost survey has a large sample bias in measuring the following key variables in the analysis of financial profitability: wages, commodity prices, and crop yields. In order to see the extent to which the profitability assessment shown in Tables 4.1 and 4.2 may be sensitive to these measures, we conducted a break-even analysis for these key variables by finding the minimum values necessary for the net return from crop production to be at or above zero. Table 4.3 presents the break-even wage, price and yield of sweetpotato and competing crops in Sichuan and Shandong.
The break-even wage for sweetpotato production in 1996 was 9.39 Yuan per day in Sichuan, only about 25 percent higher than the observed wage (7.48, Table 4.3). This small margin of the difference between the break-even wage and the wage used in the crop production cost survey could have several implications. A conventional or standard explanation is that if the wage rate used in the official production cost accounting is accurate or underestimated, the profitability of sweetpotato production will soon be reduced to zero with the declining wages and production growth. This break-even value also implies that the farmers in many rich areas where local wages are higher than 9.39 Yuan will shift from sweetpotato to other crops or other economic activities. Rice has a much higher break-even value for wage (29.35) while the values for maize and wheat are higher than sweetpotato by nearly two Yuan per day. These further indicate that the possibility of substitution of rice, wheat and maize for sweetpotato production may happen (although recall that in Sichuan, sweetpotato is grown primarily on hilly land whereas rice is grown on flat irrigated land).

54
In our sample area in Shandong province, the break-even value for wage in sweetpotato production was very high (34.55 Yuan) and even higher than other crops. The crop is still very attractive for rural households engaged in agricultural production although the expansion of sweetpotato is limited by the need to allocate larger portions of the farm land to produce various foods for home consumption.
The ratio of break-even values to observed prices of crops in Sichuan are lowest for rice (0.37, computed from 0.56/1.53, Table 4.3), and then followed by maize (0.74), wheat (0.78) and sweetpotato (0.84). The larger these ratios are, the greater the possibility for sweetpotato to be replaced by other crops. Prices and yield of sweetpotato are clearly important to sweetpotato production growth in Sichuan province. But as discussed above, for subsistent farmers, other determinants such as household’s own consumption demand and derived feed demand from the backyard pig production, are even more important than the simple financial budget analysis for a less marketable product such as sweetpotato.
The analyses from Shandong shows the possibility of profit from sweetpotato production falling from the current level to zero through a decline in crop yield or if market price decreases. (Table 4.3). Break-eve n yield and prices for sweetpotato in Shandong are very low even though sweetpotato production in our sampled households has been stagnant and sweetpotato crop area for the whole province has significantly been declining. This may suggest that the marketability of sweetpotato and the determinants of household backyard pig production are the driving forces for sweetpotato production in the province. 4.3 Financial Profitability Based on Primary Household Survey Data Input and Output of Sweetpotato and Maize Production
Table 4.4 summarizes the inputs and outputs of sweetpotato and maize production in our sampled households. While all inputs except manure and irrigation are higher in Shandong than in Sichuan, sweetpotato yield in Shandong (5289 kg/ha) is much higher than in Sichuan (4665 kg/ha) due to better land and growing conditions. In Sichuan , sweetpotato is mainly planted on hillsides and mountain slopes while in Shandong, the sweetpotato cropland is usually flat and with better quality soil. Moreover, sweetpotato has a longer growing period in Shandong than in Sichuan.
In our sample, farmers applied an average of 285 kg of fertilizer in Sichuan, compared to 204 kg in Shandong (Table 4.4). Because of poor soil conditions and cheaper labor in Sichuan compared with Shandong, manure use is much higher in Sichuan. The flat land and higher opportunity cost of labor in Shandong causes farmers to use less labor in sweetpotato production. Farmers spent 305 man-days/ha for sweetpotato production in Jiange of Sichuan province and more than 500 man-days/ha in Leshan. In Feixian and Zhucheng of Shandong province, farmers used only 257 man-days/ha. The differences in input levels between Sichuan and Shandong are even larger for maize production. Farmers applied much more fertilizers, manure, and labor in maize production in Sichuan than in Shandong (Table 4.4).
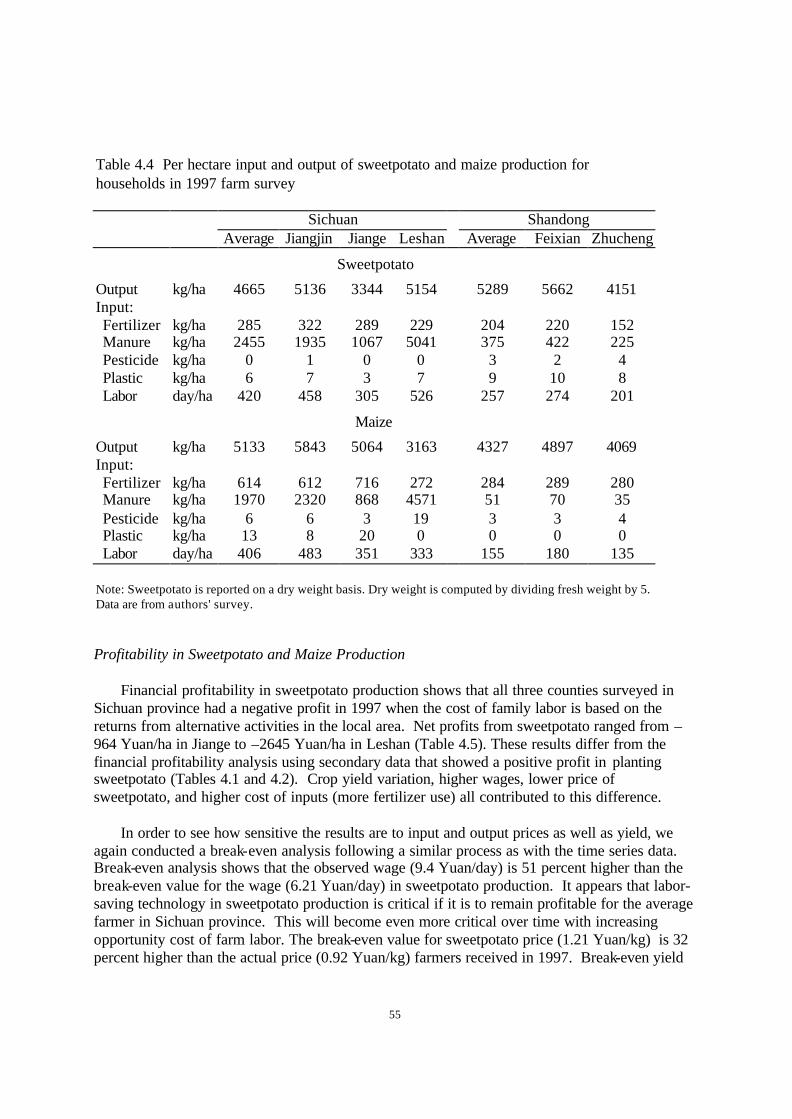
55
Table 4.4 Per hectare input and output of sweetpotato and maize production for households in 1997 farm survey
Sichuan Shandong Average Jiangjin Jiange Leshan Average Feixian Zhucheng
Sweetpotato
Output kg/ha 4665 5136 3344 5154 5289 5662 4151 Input: Fertilizer kg/ha 285 322 289 229 204 220 152 Manure kg/ha 2455 1935 1067 5041 375 422 225 Pesticide kg/ha 0 1 0 0 3 2 4 Plastic kg/ha 6 7 3 7 9 10 8 Labor day/ha 420 458 305 526 257 274 201
Maize
Output kg/ha 5133 5843 5064 3163 4327 4897 4069 Input: Fertilizer kg/ha 614 612 716 272 284 289 280 Manure kg/ha 1970 2320 868 4571 51 70 35 Pesticide kg/ha 6 6 3 19 3 3 4 Plastic kg/ha 13 8 20 0 0 0 0 Labor day/ha 406 483 351 333 155 180 135 Note: Sweetpotato is reported on a dry weight basis. Dry weight is computed by dividing fresh weight by 5. Data are from authors' survey. Profitability in Sweetpotato and Maize Production
Financial profitability in sweetpotato production shows that all three counties surveyed in Sichuan province had a negative profit in 1997 when the cost of family labor is based on the returns from alternative activities in the local area. Net profits from sweetpotato ranged from –964 Yuan/ha in Jiange to –2645 Yuan/ha in Leshan (Table 4.5). These results differ from the financial profitability analysis using secondary data that showed a positive profit in planting sweetpotato (Tables 4.1 and 4.2). Crop yield variation, higher wages, lower price of sweetpotato, and higher cost of inputs (more fertilizer use) all contributed to this difference.
In order to see how sensitive the results are to input and output prices as well as yield, we again conducted a break-even analysis following a similar process as with the time series data. Break-even analysis shows that the observed wage (9.4 Yuan/day) is 51 percent higher than the break-even value for the wage (6.21 Yuan/day) in sweetpotato production. It appears that labor- saving technology in sweetpotato production is critical if it is to remain profitable for the average farmer in Sichuan province. This will become even more critical over time with increasing opportunity cost of farm labor. The break-even value for sweetpotato price (1.21 Yuan/kg) is 32 percent higher than the actual price (0.92 Yuan/kg) farmers received in 1997. Break-even yield

56
is also high (6124 kg/ha), a very high level for Sichuan to reach given the current technology (4665 kg/ha in the sampled households in 1997). Table 4.5 Farm costs and returns of sweetpotato production for households in 1997 farm survey Sichuan Shandong Average Jiangjin Jiange Leshan Average Feixian Zhucheng I. Total revenue (Yuan/ha) 4967 5400 3752 5417 6176 6563 4992 Main product 4292 4725 3077 4742 5501 5888 4317 By-product 675 675 675 675 675 675 675 II. Non-labor (Yuan/ha) 2358 2386 1881 2963 2619 2810 2172 Seed cost 251 204 173 420 710 728 654 Fertilizer 1335 1435 1266 1288 1481 1745 776 Manure 300 236 130 616 46 52 27 Pesticide 4 12 0 0 66 53 113 Plastic 54 68 29 68 85 93 77 Other costs 8 0 0 29 3 4 0 Various taxes 407 431 282 542 228 137 525 III. Labor cost (Yuan/ha) 3951 4214 2835 5099 2767 2824 2258 IV. Total cost (Yuan/ha) 6309 6600 4716 8062 5386 5634 4430 V Net return (Yuan/ha) -1342 -1200 -964 -2645 789 929 562 VI. Return to labor (Yuan/ha) 2609 3014 1871 2454 3556 3753 2820
Break-even values:
Wage (Yuan/day) 6.21 6.58 6.14 4.67 13.85 13.69 14.05 Output price (Yuan/kg) 1.21 1.15 1.21 1.43 0.89 0.88 0.90 Yield (kg/ha) 6124 6440 4392 8029 4530 4768 3611
Observed values:
Wage (Yuan/day) 9.40 9.20 9.30 9.70 10.78 10.30 11.25 Output price (Yuan/kg) 0.92 0.92 0.92 0.92 1.04 1.04 1.04 Yield (kg/ha) 4665 5136 3344 5154 5289 5662 4151 Source: Authors' survey.
All these indicators show that the farmers in our sample in Sichuan province are facing great challenges in sweetpotato production. This also confirms our previous discussion on the reason why farmers plant sweetpotato -- not really for profit but mainly for its use in household livestock production.
Profitability in sweetpotato production in Shandong is much better than in Sichuan mainly due to three factors: higher yield, higher price, and lower labor input (Table 4.5). However, it

57
should be noted that the opportunity cost of agricultural labor is close to the break-even value (13.85 Yuan/day) in many coastal counties in Shandong province. This may partially explain the significant decline of sweetpotato area over time in Shandong as many coastal counties have been moving out of sweetpotato production to horticulture and other economic activities.
Despite much higher yield of maize in our sampled households in Sichuan than in Shandong, the high inputs in chemical fertilizer and manure, pesticide, labor inputs made maize production less profitable in Sichuan than in Shandong. Evaluated at the locally observed agricultural wage rate, net return (profit) was –559 Yuan/ha in Sichuan province while the farmers in Feixian and Zhucheng, both of Shandong province, enjoyed a profit of about 1064 Yuan/ha.

58
V. Efficient Use of Sweetpotato and Maize as Feed in Pig Production
5.1 Notes on Methodology
There are at least two basic ways to analyze the efficiency of sweetpotato as a substitute for maize feed. The first is to examine the efficiency of pig-raising activity with the two alternative feed sources, sweetpotato and maize. However, in our sampled households, farmers actually used a mix of feeds in raising pigs (Table 3.9) and no farmer applied only sweetpotato or maize for feed. Farmers who produce sweetpotato primarily for feed also apply substantial amounts of maize, other grains and forage (Table 3.9). In other words, sweetpotato is used as feed simultaneously with maize. Investigating the efficiency of sweetpotato as a substitute for maize in feeding pig is difficult through a direct comparison of these two alternatives in swine production.
Because sweetpotato in our sampled households is grown primarily for feed use in pig
production, the second way to examine the efficiency of sweetpotato as substitute for maize is to compare the profitability of producing alternative feed crops at the household level. That is, we compare the cost of producing sweetpotato for feed versus growing or buying maize for feed. 8 In this study, we used an indirect measure and applied “Policy Analysis Matrix” (PAM) developed by Monke and Pearson (1989).
PAM uses the concepts of private and social profit (the difference between costs and
revenues evaluated at private and social prices) as its point of analysis (Monke and Pearson, 1989). It can also be used to study the efficiency of alternative technologies in producing the same commodity as well as the impacts of various policies on alternative production systems. The general framework of PAM is summarized in Table 5.1. The method distinguishes between private and social profitability. Private profitability is determined using the first row measure of all inputs and outputs at actual prices prevailing in the domestic market. It presents (reflects or indicates instead of presents?) the actual competitiveness of alternative production systems (i.e., sweetpotato versus maize) under current policies and technologies.
Social profitability, which provides a measure of comparative advantage, is estimated after
removing the price-distorting effects of policies. With no policy distortions, social profitability measures the actual costs and benefits of the production system for the country or region. Social profitability is shown in the second row of Table 5.1. At the margin, a positive social profit indicates that the system uses scarce resources efficiently and the commodity has a static comparative advantage. When social profits are negative, a sector cannot sustain itself without assistance or continued policy interventions from the government. A negative social profit implies that at the margin, the real cost of producing the commodity exceeds the cost of
8 One limitation of this approach is that comparing only the cost of crop production ignores differences in pig raising costs that may result from the use of maize versus sweetpotato. Producers who rely more on cereal-based feeds obtain higher feed conversion efficiency than producers who use mainly tuber crops, roughage, and food processing wastes (Zhang 1998). Further, using sweetpotato for feed often requires additional inputs for feed preparation (e.g. chopping and cooking). However, alternative on-farm feed preparation technologies, such as fermentation of sweetpotato vines and roots can overcome these differences by improving nutrient uptake (and thereby increasing feed conversion and reducing feed preparation inputs by eliminating the need for cooking the roots (Liu et al. 2001).
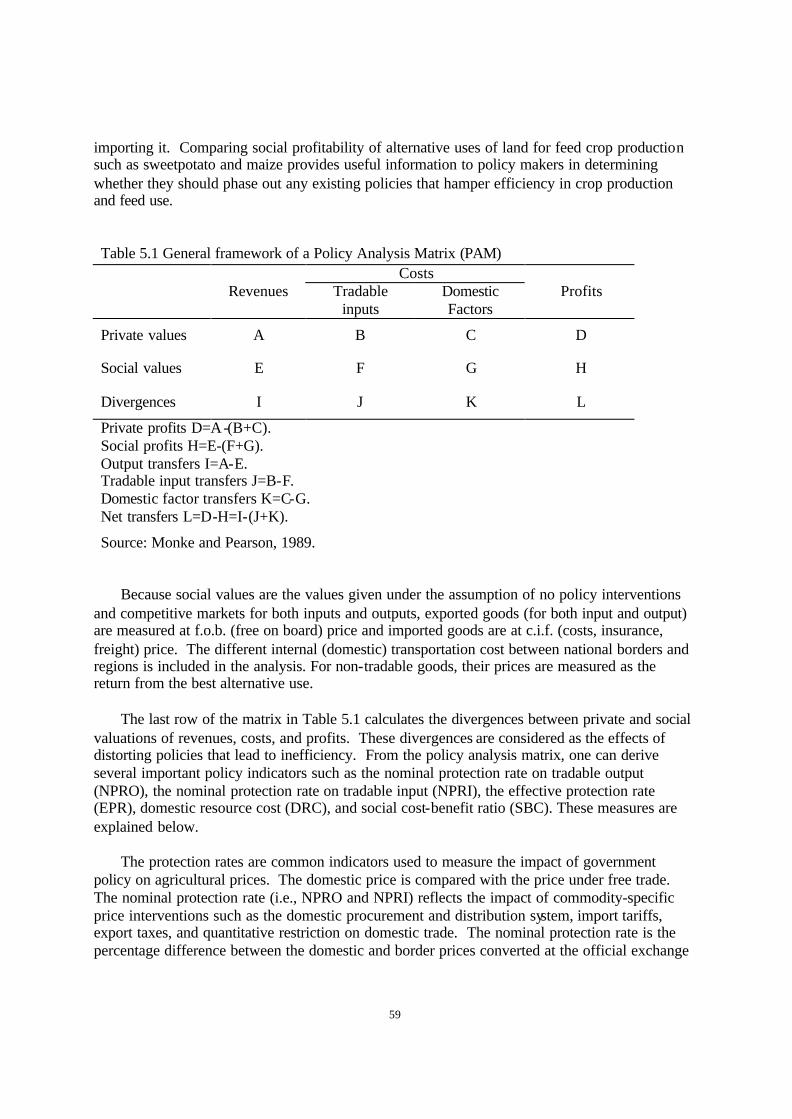
59
importing it. Comparing social profitability of alternative uses of land for feed crop production such as sweetpotato and maize provides useful information to policy makers in determining whether they should phase out any existing policies that hamper efficiency in crop production and feed use.
Table 5.1 General framework of a Policy Analysis Matrix (PAM) Costs Revenues Tradable
inputs Domestic Factors
Profits
Private values A B C D
Social values E F G H
Divergences I J K L
Private profits D=A-(B+C). Social profits H=E-(F+G). Output transfers I=A-E. Tradable input transfers J=B-F. Domestic factor transfers K=C-G. Net transfers L=D-H=I-(J+K).
Source: Monke and Pearson, 1989. Because social values are the values given under the assumption of no policy interventions
and competitive markets for both inputs and outputs, exported goods (for both input and output) are measured at f.o.b. (free on board) price and imported goods are at c.i.f. (costs, insurance, freight) price. The different internal (domestic) transportation cost between national borders and regions is included in the analysis. For non-tradable goods, their prices are measured as the return from the best alternative use.
The last row of the matrix in Table 5.1 calculates the divergences between private and social
valuations of revenues, costs, and profits. These divergences are considered as the effects of distorting policies that lead to inefficiency. From the policy analysis matrix, one can derive several important policy indicators such as the nominal protection rate on tradable output (NPRO), the nominal protection rate on tradable input (NPRI), the effective protection rate (EPR), domestic resource cost (DRC), and social cost-benefit ratio (SBC). These measures are explained below.
The protection rates are common indicators used to measure the impact of government
policy on agricultural prices. The domestic price is compared with the price under free trade. The nominal protection rate (i.e., NPRO and NPRI) reflects the impact of commodity-specific price interventions such as the domestic procurement and distribution system, import tariffs, export taxes, and quantitative restriction on domestic trade. The nominal protection rate is the percentage difference between the domestic and border prices converted at the official exchange
60
rate. From the PAM or policy analysis matrix of Table 5.1, for the tradable output, NPRO (A/E) indicates the degree of output transfer. For the tradable inputs, NPRI (B/F), shows the degree of tradable input transfer. To measure the total effect of government interventions, including the effect of exchange rate distortions, the EPR is estimated as a ratio of value added in private prices (A-B) to value added in the world prices (E-F). EPR measures the percentage difference between domestic and border prices converted at the market equilibrium exchange rate. This coefficient indicates the degree of policy transfer from output and tradable input distortions.
The DRC and SCB are used to compare the relative efficiency or comparative advantage
between agricultural commodities. The DRC is defined as G/(E-F) and is a proxy measure for social profits in cross-commodity comparisons. The DRC indicator is widely used in developing countries to measure comparative advantage and guide policy reforms. However, the DRC may be biased against activities that rely heavily on domestic non-traded factors, i.e., land and labor. A good alternative for the DRC is the SCB, which accounts for all costs and avoids classification errors in calculation of DRC (Masters and Winter-Nelson, 1995).
5.2 Data and Policy Description
In our study, we examined the efficiency of sweetpotato as a substitute for maize to produce
the same commodity (pork) in our survey areas in Sichuan and Shandong. Previous sections showed that sweetpotato was not planted primarily as a cash crop but as a semi-subsistence crop intended to address both household food needs, feed requirements, and to earn part of the household’s cash income. This may violate what is embodied in the profitability analysis, which assumes that sweetpotato would be planted as cash crop and its production is responsive to market prices. However, sweetpotato has been a substitute for maize and other grains for feed use in backyard livestock production ventures in sweetpotato producing regions, and interviews with farmers and local livestock extension technicians found that there is no significant difference in productivity if maize is used as alternative feed. If this assumption holds, then efficient use of sweetpotato as feed can be examined directly by comparing the profitability of sweetpotato and maize production in the households that raise pigs.
Output and Input Prices
To determine the profitability of sweetpotato versus alternative crop, (i.e., maize) as pig feed, expected expenses in planting were estimated using two sets of prices. Financial price, the actual market price paid by farmers for inputs and received for outputs, determines financial or private profitability. Economic price, which is a shadow price representing the scarcity value of inputs and outputs in the Chinese economy are then substituted for the financial price to determine economic or social profitability.
Data on financial prices, representing prices actually paid and received by farmers during the 1997-98 crop season, were gathered as part of the farm survey. For maize, the financial prices are 1.39 Yuan/kg in Sichuan and 1.21 Yuan/kg in Shandong (Table 5.2). Sweetpotato was priced much cheaper by 0.92 Yuan/kg in Sichuan and 1.04 Yuan in Shandong.
The divergences of these prices from the economic or social prices are associated with the domestic price and marketing policies as well as other policies that have impact on the sector performance. Price and market reforms are key components of China’s development policy shift

61
from a socialist to a market-oriented economy. The price and market reforms initiated in the late 1970s were aimed at raising farm level prices and gradually liberalizing the market. These reforms included increases in government procurement quota prices, reduction in the quota levels, introduction of above quota bonuses, negotiated procurement of surplus production of grains, oils, and most other commodities, and flexibility in marketing of surplus production of all categories of agricultural products privately. Sweetpotato is one of the first crops that was liberalized in the early 1980s when the government procurement quota was phased out. Its price has since been determined by local demand and supply conditions.
Table 5.2 Assumptions about private and social prices and tradability of inputs and outputs used in Policy Analysis Matrix (PAM)
Sichuan Shandong Private
price (Yuan/kg)
Social price
(Yuan/kg)
Tradable share (%)
Private price
(Yuan/kg)
Social price
(Yuan/kg)
Tradable share (%)
Sweetpotato
Sweetpotato 0.92 1.12 100 1.04 1.23 100 By-product 1.00a 1.00a 0 1.00a 1.00a 0 Capital inputs: 73 91 Seed 1.00a 1.08 100 1.00a 1.05 100 Fertilizer 4.68 5.26 100 7.26 7.90 100 Manure 0.12 0.12 0 0.12 0.12 0 Pesticide 18.18 20.43 100 24.00 26.53 100 Plastic 8.93 10.48 100 9.44 10.79 100 Tax & depreciation 1.00a 1.17 20 1.00a 1.17 20 Other cash costs 1.00a 1.02 50 1.00a 1.02 50 Labor 9.41 10.35 0 10.77 11.84 0
Maize
Maize 1.39 1.46 100 1.21 1.35 100 By-product 1.00a 1.00a 0 1.00a 1.00a 0 Capital inputs: 87 87 Seed 1.00a 1.08 100 1.00a 1.05 100 Fertilizer 4.82 5.42 100 5.25 5.71 100 Manure 0.12 0.12 0 0.12 0.12 0 Pesticide 41.17 46.26 100 27.00 29.85 100 Plastic 8.92 10.46 100 9.40 10.74 100 Tax & depreciation 1.00a 1.17 20 1.00a 1.17 20 Other cash costs 1.00a 1.02 50 1.00a 1.02 50 Labor 9.39 10.33 0 10.77 11.85 0
62
a: Prices of by-products are normalized at 1. Tradable shares for all capital inputs are weighted average based on amount of input uses and private price. They are marginally lower (1-2 percent) than those at social prices. Shadow exchange rate is 11.28 Yuan/US$, which is 34.86% higher than the official exchange rate (8.29 Yuan/US$).
Price and marketing reform in rice, wheat and maize has lagged far behind that of other agricultural commodities. Despite substantial efforts to liberalize the price and market structure of the agricultural sector, grains continue to be heavily affected by commodity specific policies. Through procurement policies, farmers have received prices below the competitive market price (except for the years after1998, Huang, 2000). These distortions in price incentives depress agricultural production and redistribute income from farmers to urban consumers and the agro-processing sector.
In this study, because sweetpotato is not under government procurement, the financial price for sweetpotato is the price that the farmer should pay for sweetpotato for feed use in the local market. The financial price for maize is the weighted average price received by farmers from government procurement and the local market.
To calculate economic (social) prices, tradable and non-tradable resources are treated differently. Because sweetpotato is not widely traded (except for its processing products), the social price converted at effective or shadow exchange rate is about 10 percent higher than private or financial price due to an overvalued exchange rate. The critical issue we are looking at is the social profitability of substituting this less or non-tradable sweetpotato feed for tradable maize feed in pig production. China has been both importer and exporter of maize. Domestic market prices have been consistently higher than border prices (protected by a tariff on imported maize), Nevertheless, China has become a net exporter of maize since middle 1980s except for 1995 and 1996 when export of maize was banned due to the rapid grain price inflation and fear of food supply deficit in 1994-95 (Huang, 1999). To offset the higher domestic price, the government has provided a substantial subsidy for maize exports. In 2000, export subsidy rate reached as high as 400 Yuan (or 48 USD) per ton. In this study, we considered maize as an importable commodity and measured its social price at c.i.f. (costs, insurance, freight) price. The internal (domestic) transportation cost between ports and the study sites (Shandong and Sichuan) are considered and added to the social price. With all these considerations, social prices for maize were 1.46 Yuan per kg in Sichuan and 1.35 Yuan in Shandong using the shadow exchange rate.9 These are about 5 percent higher than the private prices in Sichuan and 12 percent higher than the private price in Shandong.
Input shadow prices are also required for the PAM. China imported seeds, chemical
fertilizer, plastic materials, and pesticides from international markets. The shadow prices for seeds, chemical fertilizer, plastic materials, and pesticides are the respective import parity prices at the farm gate (Table 5.2). For non-tradable inputs like land and labor, prices are measured at the highest return offered by alternative uses. Using the official exchange rate, most border prices of inputs are lower than the domestic prices. But when measured at the shadow exchange rate, all input social prices are lower than the domestic prices.
Labor is not tradable. The level set for family labor wage is a critical factor in PAM
analysis as the labor costs exceed all other input (materials) costs for both sweetpotato and maize
9 At the official exchange rate, social prices for maize are 1.08 Yuan/kg in Sichuan and 1.00 Yuan/kg in Shandong.
63
production in most of the households interviewed in Sichuan and Shandong. The social value of alternative use of labor is assumed to be the local wage rate for off-farming employment. But note that for some households the opportunity cost of time may be less than local off-farm wages, especially if farm labor is supplied by other family members or during hours when off-farm jobs are not available. We also investigated the sensitivity of our results to assumptions on wages.
Land price is not computed in the analysis due to lack of data on land rental rates in our farm
survey. Land price should also consider agricultural tax that farmers have to pay to the government. In China, this is mainly paid in kind such as grain, based on the area of “contract land”.10 Exchange Rate
China’s open door policy contributed to the rapid growth of external economy and to greater reliance on both domestic and international trade to meet consumer demand. Historically, the overvaluation of domestic currency for trade protection purposes had reduced agricultural incentives. Real exchange rates remained constant and even appreciated during the 30 years prior to reforms. However, the foreign exchange rate has been reformed substantially since the early 1980s. The purpose of China's foreign exchange reform was to reduce administrative intervention and increase the role of market forces.
From 1979, a foreign exchange retention system was applied in China, although foreign
exchange swap market was gradually developing. In early 1994, official Remninbi (RMB or Yuan) exchange rates were unified with the market rate. The banking exchange system was adopted and a nationwide unified inter-bank foreign exchange market was established, with conditional convertibility of RMB on current accounts. Since 1996, foreign invested enterprises ("FIEs") were also permitted into the banking exchange system, and the remaining exchange restrictions on current accounts were eliminated. China had formally accepted the obligation as an IMF member to remove exchange restrictions on current account transactions.
From 1978 to 1994, the real exchange rate depreciated more than 400 percent. Falling
exchange rates increased export competitiveness and contributed substantially to China’s phenomenal export growth record and the spectacular national economic performance of the 1980s. In recent years, however, the situation has changed. The nominal exchange rate has been kept about constant since 1994. There is a consensus among analysts that China’s currency has been and is still overvalued (see Yin and Stoever, 1994). In this study, we assumed that the 1994 unified exchange rate was at the time a shadow nominal exchange rate, with relative purchase power parity holding between China and the United States. For 1997, we calculated the shadow nominal exchange rates as the exchange rates consistent with relative purchase power parity holding for the period of 1996-97. The estimated shadow nominal exchange rate was 11.18 RMB/US$ in 1997, while the official exchange rate was 8.29 RMB/US$ in the same year.
10 For details on China’s agricultural land contracting system, see Brandt et al. (2001).
64
Tradable and Non-tradable Measures We decomposed both total private and total social costs into their domestic and tradable-
factor components. Tradable goods are those that can be imported or exported. Examples of tradable goods include production inputs such as seed, fertilizer, tractors, irrigation pumps etc. and maize output. Social prices for tradable goods are determined by their value in the international market such as discussed above, since these reflect the value of the tradable goods to the national economy.
Assumptions on the share of tradable and non-tradable amounts of each input and output are
summarized in Table 5.2. This involves calculating the appropriate import or export parity price. In a few cases where parity prices are difficult to compute because no clear trading pattern is evident, the domestic market-clearing price is used, with appropriate adjustments for significant distortions attributable to government policies or market failures, e.g. price controls, taxes, subsidies, and exchange rate distortions. It is worth noting that sweetpotato is rarely traded in the world market. 11 Because the sweetpota to in our study sites are produced primarily for feed uses and not for marketing, two alternative assumptions were made in this study for the degree at which sweetpotato is tradable: zero and 10 percent.
Alternative Assumptions for Sensitivity Analysis
In the sensitivity analysis, various alternatives were made in the input and output prices,
tradability of sweetpotato, productivity enhanced investment (i.e., changes in yield) and exchange rate adjustments to explore the likely effects on the efficiency and comparative advantage in producing the two major feed crops, sweetpotato and maize.
5.3 Results of PAM Analyses
Table 5.3 summarizes the whole matrix of PAM for sweetpotato and maize. More detailed
computation can be found in Appendix Tables 5-8. Based on the parameters presented in Table 5.3, several important policy indicators on protection rates and domestic resource costs of the two alternative feeds, sweetpotato and maize, are derived and presented in Table 5.4.
Negative divergences of private profit from social profit of sweetpotato production in both
Sichuan and Shandong indicate that sweetpotato would be more profitable if all policy interventions were removed. In Shandong, profit would be raised from 790 Yuan/ha to 1350 Yuan/ha, or by 70 percent. Although both private and social profit of sweetpotato are negative in Sichuan, the removal of all distortions would reduce the loss by 320 Yuan/ha, or by about 30 percent.
Maize presents a different story for Sichuan and Shandong. The effect of policies is to
increase the private profit of maize production in Sichuan but decrease profitability in Shandong. Maize farmers in Shandong are effectively taxed by about 20 percent through the distortionary policies. While both private and social profitability of maize production are negative in
11 The processed products of sweetpotato such as sweetpotato starch and noodle are tradable, but the traded quantity is thought to be small.
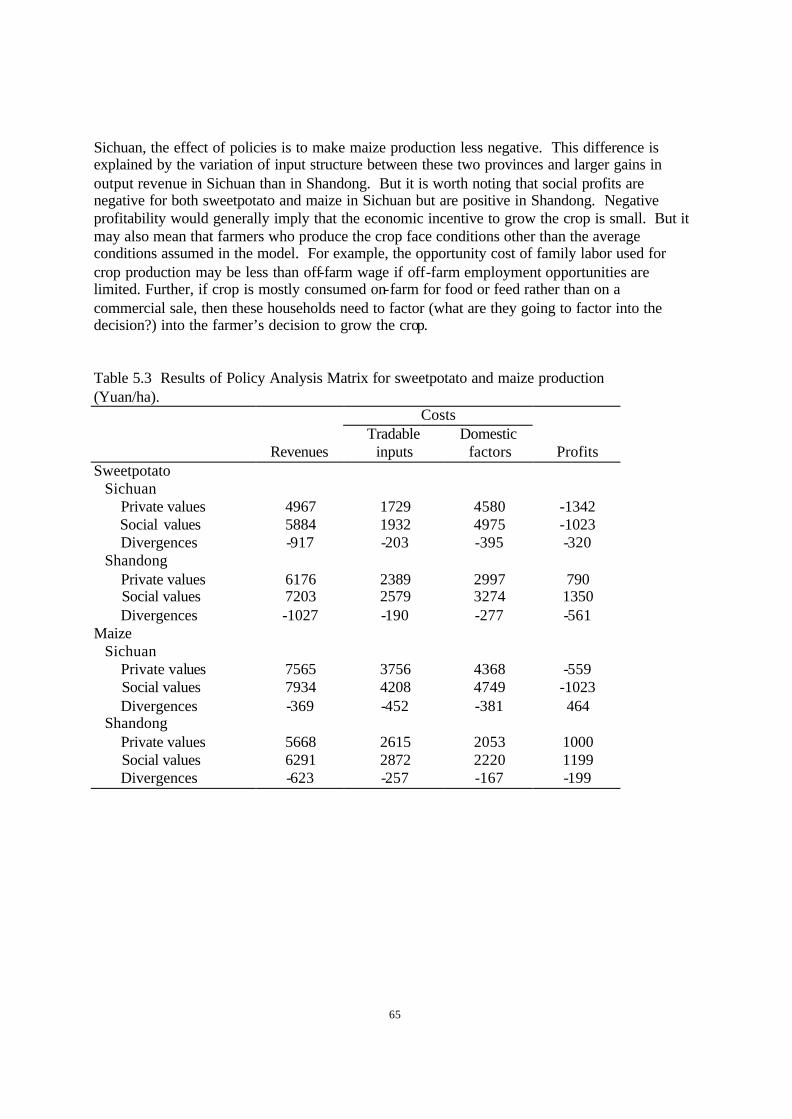
65
Sichuan, the effect of policies is to make maize production less negative. This difference is explained by the variation of input structure between these two provinces and larger gains in output revenue in Sichuan than in Shandong. But it is worth noting that social profits are negative for both sweetpotato and maize in Sichuan but are positive in Shandong. Negative profitability would generally imply that the economic incentive to grow the crop is small. But it may also mean that farmers who produce the crop face conditions other than the average conditions assumed in the model. For example, the opportunity cost of family labor used for crop production may be less than off-farm wage if off-farm employment opportunities are limited. Further, if crop is mostly consumed on-farm for food or feed rather than on a commercial sale, then these households need to factor (what are they going to factor into the decision?) into the farmer’s decision to grow the crop. Table 5.3 Results of Policy Analysis Matrix for sweetpotato and maize production (Yuan/ha).
Costs Tradable Domestic Revenues inputs factors Profits
Sweetpotato Sichuan Private values 4967 1729 4580 -1342 Social values 5884 1932 4975 -1023 Divergences -917 -203 -395 -320 Shandong Private values 6176 2389 2997 790 Social values 7203 2579 3274 1350 Divergences -1027 -190 -277 -561 Maize Sichuan Private values 7565 3756 4368 -559 Social values 7934 4208 4749 -1023 Divergences -369 -452 -381 464 Shandong Private values 5668 2615 2053 1000 Social values 6291 2872 2220 1199 Divergences -623 -257 -167 -199
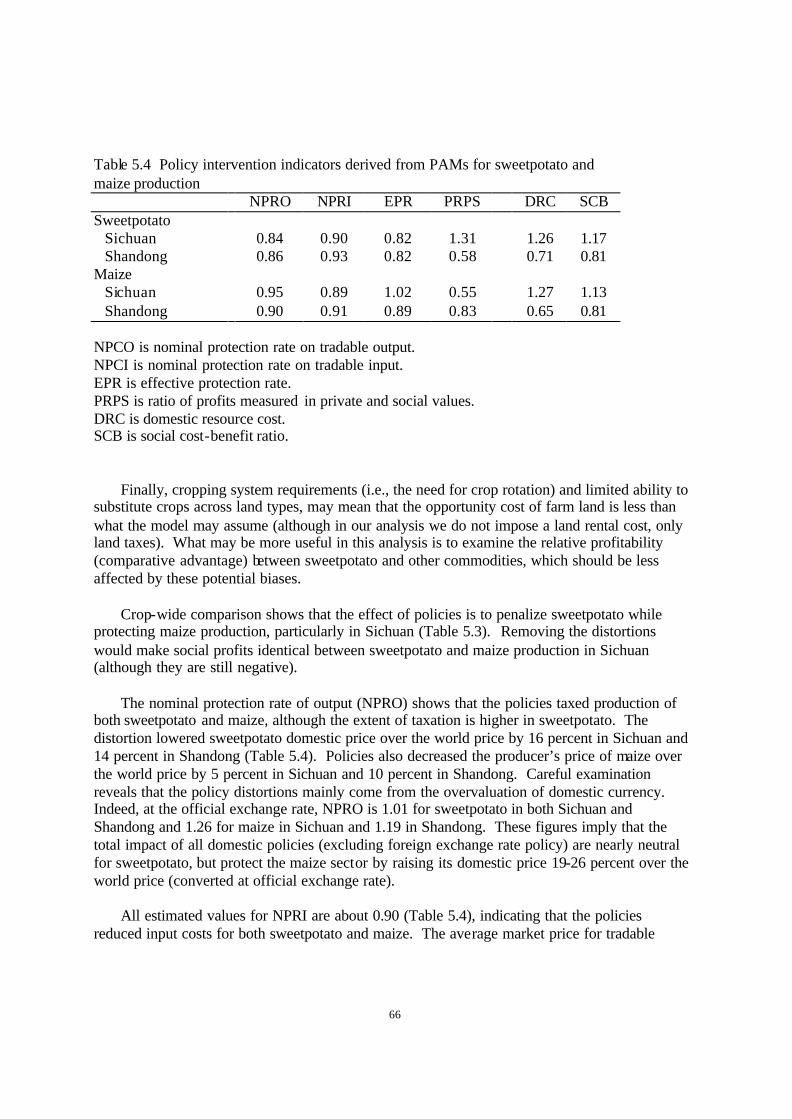
66
Table 5.4 Policy intervention indicators derived from PAMs for sweetpotato and maize production
NPRO NPRI EPR PRPS DRC SCB Sweetpotato Sichuan 0.84 0.90 0.82 1.31 1.26 1.17 Shandong 0.86 0.93 0.82 0.58 0.71 0.81 Maize Sichuan 0.95 0.89 1.02 0.55 1.27 1.13 Shandong 0.90 0.91 0.89 0.83 0.65 0.81 NPCO is nominal protection rate on tradable output. NPCI is nominal protection rate on tradable input. EPR is effective protection rate. PRPS is ratio of profits measured in private and social values. DRC is domestic resource cost. SCB is social cost-benefit ratio.
Finally, cropping system requirements (i.e., the need for crop rotation) and limited ability to
substitute crops across land types, may mean that the opportunity cost of farm land is less than what the model may assume (although in our analysis we do not impose a land rental cost, only land taxes). What may be more useful in this analysis is to examine the relative profitability (comparative advantage) between sweetpotato and other commodities, which should be less affected by these potential biases.
Crop-wide comparison shows that the effect of policies is to penalize sweetpotato while
protecting maize production, particularly in Sichuan (Table 5.3). Removing the distortions would make social profits identical between sweetpotato and maize production in Sichuan (although they are still negative).
The nominal protection rate of output (NPRO) shows that the policies taxed production of both sweetpotato and maize, although the extent of taxation is higher in sweetpotato. The distortion lowered sweetpotato domestic price over the world price by 16 percent in Sichuan and 14 percent in Shandong (Table 5.4). Policies also decreased the producer’s price of maize over the world price by 5 percent in Sichuan and 10 percent in Shandong. Careful examination reveals that the policy distortions mainly come from the overvaluation of domestic currency. Indeed, at the official exchange rate, NPRO is 1.01 for sweetpotato in both Sichuan and Shandong and 1.26 for maize in Sichuan and 1.19 in Shandong. These figures imply that the total impact of all domestic policies (excluding foreign exchange rate policy) are nearly neutral for sweetpotato, but protect the maize sector by raising its domestic price 19-26 percent over the world price (converted at official exchange rate).
All estimated values for NPRI are about 0.90 (Table 5.4), indicating that the policies reduced input costs for both sweetpotato and maize. The average market price for tradable

67
inputs is about 90 percent of social prices. Again, the major distortion is due to the foreign exchange policy.
The values of the EPC show that there is a large transfer from sweetpotato and tradable input policies. Sweetpotato is taxed by 18 percent (1-0.82) on its value added in both provinces (Table 5.4). Maize in Sichuan faces almost no distortion in value added, while it is taxed by 11 percent in Shandong. From the analysis of EPC, it is likely that sweetpotato would gain more in value added than maize if all distortion policies were phased out.
For the relative comparative advantage of sweetpotato and maize production, the estimated values of DRC and SCB in Table 5.4 show that they are very similar.12 The values of DRC for sweetpotato and maize are 1.26 and 1.27, respectively, in Sichuan, pointing out the challenge in both sweetpotato and maize production under trade liberalization. On the other hand, the DRCs for sweetpotato and maize in Shandong province are much lower than 1. They are 0.71 for sweetpotato and 0.65 for maize. The similarity of DRCs of these 2 crops point out that their production substitution under trade liberalization is limited. This may suggest that substituting sweetpotato for maize as feed in swine production in our sample areas will lead to gain in resource allocation efficiency under trade liberalization if the future technology progress in sweetpotato is more than that in maize. The estimates of social and cost benefit ratio (SCB) lead to the same conclusion.
In order to test the sensitivity of the above results and conclusions to the assumptions that are made in PAM analysis, alternative assumptions are defined and all policy indicators are re-estimated. These alternative assumptions deal with the major driving factors that have impacts on social profit and DRC, namely, crop yield, tradability of sweetpotato products, and opportunity cost of family labor. The results of this sensitive analysis are summarized in Table 5.5. For comparison convenience, we call the results estimated from the assumptions listed in Table 5.2 as “baseline” and report private and social profits as well as DRC and SCB in Table 5.5.
Given the relative lower level of sweetpotato yield in Sichuan than Shandong, the first sensitivity analysis is made by assuming that sweetpotato yield would increase by 20 percent in Sichuan and 10 percent in Shandong through adoption of higher yielding variety while holding input levels constant. This assumption alters social profit of sweetpotato production from negative (-1023 Yuan/ha) to positive (19 Yuan/ha) in Sichuan and increases social profit by nearly 50 percent in Shandong (from 1350 Yuan/ha to 2003 Yuan/ha, Table 5.5). The DRC of sweetpotato also declines from 1.26 to 0.99 in Sichuan. Although this DRC is still higher than the DRC of maize in the province, it eventually diminishes to a value less than one – a turning point for comparative advantage of any crop production venture. The same result can be derived from the SCB values. This points out the importance of research and technology investment in sweetpotato to increase the crop competitiveness over other crops in order to minimize the substitution of sweetpotato by other crops as feed in livestock production.
12 The estimates of DRCs for maize in our sample households in Sichuan and Shandong are lower than estimated by Fang and Belghin (1999), and Huang, Ma and Xu (2001). /the estimates from the latter source are about 0.8 to 1.0 for the whole China. Our estimates are close to those estimated by Zhang and Xu (2001) for Sichuan and Shandong provinces.
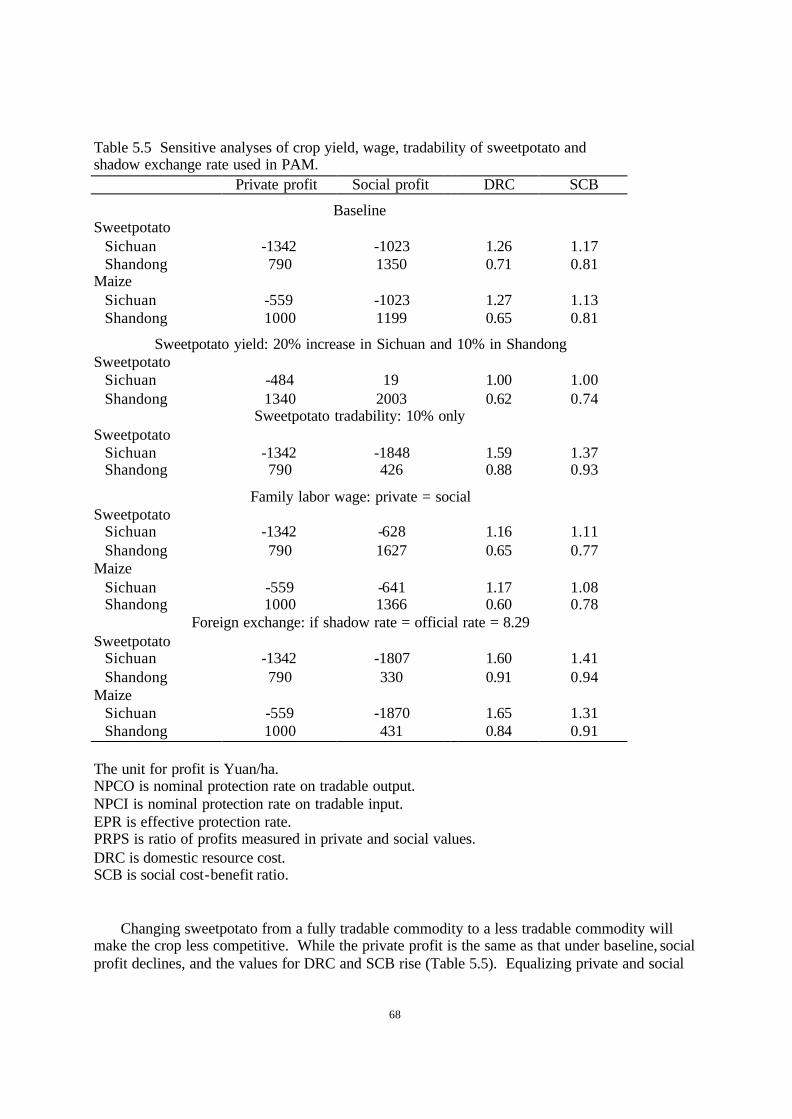
68
Table 5.5 Sensitive analyses of crop yield, wage, tradability of sweetpotato and shadow exchange rate used in PAM.
Private profit Social profit DRC SCB
Baseline Sweetpotato Sichuan -1342 -1023 1.26 1.17 Shandong 790 1350 0.71 0.81 Maize Sichuan -559 -1023 1.27 1.13 Shandong 1000 1199
0.65 0.81
Sweetpotato yield: 20% increase in Sichuan and 10% in Shandong Sweetpotato Sichuan -484 19 1.00 1.00 Shandong 1340 2003 0.62 0.74
Sweetpotato tradability: 10% only Sweetpotato Sichuan -1342 -1848 1.59 1.37 Shandong 790 426
0.88 0.93
Family labor wage: private = social Sweetpotato Sichuan -1342 -628 1.16 1.11 Shandong 790 1627 0.65 0.77 Maize Sichuan -559 -641 1.17 1.08 Shandong 1000 1366
0.60 0.78 Foreign exchange: if shadow rate = official rate = 8.29
Sweetpotato Sichuan -1342 -1807 1.60 1.41 Shandong 790 330 0.91 0.94 Maize Sichuan -559 -1870 1.65 1.31 Shandong 1000 431
0.84 0.91 The unit for profit is Yuan/ha. NPCO is nominal protection rate on tradable output. NPCI is nominal protection rate on tradable input. EPR is effective protection rate. PRPS is ratio of profits measured in private and social values. DRC is domestic resource cost. SCB is social cost-benefit ratio.
Changing sweetpotato from a fully tradable commodity to a less tradable commodity will make the crop less competitive. While the private profit is the same as that under baseline, social profit declines, and the values for DRC and SCB rise (Table 5.5). Equalizing private and social

69
values of family labor (under baseline, social value is 10 percent higher than private value, that is the highest alternative use of family labor is 10 percent higher than the actual observed wage in crop production) increases the crop’s social profit and lowers domestic resource cost. The impacts are similar for both crops. The last alternative examined is related to our assumption on the overvaluation of domestic currency. That is, what could be the implications on the results of PAM analysis if the current official exchange rate would represent the true value of domestic currency? The last four rows in Table 5.5 show that the impacts are significant. The results from the baseline show that sweetpotato can become less competitive.
In sum, the results from this study show that both sweetpotato and maize production are
facing great challenge in Shandong and Sichuan. Distortionary prices and trade policies have penalized sweetpotato while protecting maize production. While the financial (private) profitability of maize appears to be greater than sweetpotato, the social profitability of the two crops are about equal. Sweetpotato used as feed has been a common practice in swine production in China’s major production regions of Sichuan and Shandong. The extent to which sweetpotato can substitute for maize as feed in pig production will highly depend on the direction of future policy intervention and technology development in the sweetpotato and maize sectors. If sweetpotato productivity growth is less than that of other competing feed crops, then these other feed crops will likely gradually substitute for sweetpotato in backyard livestock production. A similar trend may result if policies continue to discriminate against sweetpotato producers. Therefore, increased investment in sweetpotato research and extension and removal of current policy distortions will be critically important to the future of sweetpotato as livestock feed in China.

70
VI. Conclusions and Implications
A rapidly increasing demand for feed grains in China is expected in the coming decades due
to an expansion of the livestock sector, a sector that will grow to meet the equally increasing demand for animal products. This trend has not escaped the attention of leading feed exporters, particularly the U.S., Canada and Australia. Studies in food projections from organizations such as IFPRI, the World Bank, and CCAP have lead to a consensus that the increasing demand for feed in China will be supplied by both domestic and foreign producers. Since China is a less competitive maize producer than the world’s major maize exporters, a large portion of the demand for feed in China is likely to be met by importing maize. The use of sweetpotato as feed (the second largest feed grain in China) has increased significantly in the past two decades, although production has been stagnant and sown area has declined significantly since the 1970s. In this report we addressed the possibility of promoting sweetpotato production so that it can be economically used as a substitute for maize in feeding pigs, the dominant component of China’s livestock sector.
The results from this study show that not only has the substitution of rice and wheat for sweetpotato as food consumption been occurring, but that without policy actions the possibility of substituting maize with sweetpotato in pig production in the future is not promising. The projected reduction in domestic maize prices following China's WTO accession may even partially substitute imported maize for both domestic maize and sweetpotato for feed use. Expecting sweetpotato to serve as a substitute for maize as feed in pig production should be taken cautiously in the absence of policy changes.
Financial analysis from time series data shows that the relative profitability of sweetpotato
declined since the mid 1980s and incentives for substituting sweetpotato with alternative crops are emerging. The horticulture sector has been growing rapidly since the early 1990s. Rising regional market integration favors introducing commercial feeds such as maize and compound feed in backyard pig production. The opportunity cost of agricultural labor in many coastal counties in Shandong Province is high and growing. Break-even analysis demonstrates that the extent of expanding sweetpotato production will highly depend on future trends in farm productivity. Providing new, labor-saving technology in sweetpotato production may become critical in some rural areas where off-farm employment opportunities are increasing.
While incentives to produce sweetpotato may decline without new technologies, PAM analyses reveal that policies have been biased against sweetpotato producers. A large divergence between the private and social profitability of sweetpotato production indicates that incentives to grow sweetpotato would be higher if these policy interventions were removed. The policy distortions penalize sweetpotato while protecting maize. The major distortion comes from an overvaluation of the Chinese currency, which alters the terms of trade against domestic producers. For maize producers, protective tariffs offset terms-of-trade effects of currency overvaluation, but sweetpotato farmers enjoy no such advantage. Estimates of effective protection rate suggest that sweetpotato would gain more in value-added than maize if all distortion policies were removed. In terms of comparative advantage in crop production, the estimated values of domestic resource cost illustrate that both crops are very similar within the

71
provinces of Sichuan and Shandong but differ substantially between provinces. We find that without new technological improvements or policy changes, there is not much support for the argument that sweetpotato will substitute for maize as feed in pig production. .
The declining profitability of sweetpotato given the current status of technology, increasing
opportunity cost of labor, commercialization of livestock production, and trade liberalization, call for new policy initiatives to be considered. Millions of sweetpotato producers and backyard pig growers, who are often poor and lack access to credit, may find themselves increasingly disadvantaged. Re lative slow growth in sweetpotato productivity over the past few decades reflects the result of underinvestment in agricultural research and extension for this crop. Technological change has been the engine of China's agricultural economy, in general, and for grains, like rice and wheat, in particular. The future development of sweetpotato will highly depend on the productivity growth of the crop and diversification of sweetpotato utilization, which requires increasing investment in sweetpotato research and extension for production and post-harvest utilization.
72
References:
Brandt, Loren, Jikun Huang, Guo Li and Scott Rozelle. 2001. "Land Rights in China: Facts, Fiction, and Issues," China Journal, (forthcoming).
Chen, Jing. 2001. The Economy of Backyard Hog Raising in China. Unpublished Dissertation, University of California, Davis.
FAO, Database on Food Balance Sheet. Rome.
Fan, S., E. Wailes, and G. Cramer. 1995. "Household Demand in Rural China: A Two-Stage LES-AIDS Model," American Journal of Agricultural Economics 77(February):54-62
Fang, Cheng and John Beghin. 1999. “Self -sufficiency, Comparative Advantage, and Agricultural Trade: A Policy Analysis Matrix for Chinese Agriculture” paper presented at Symposium on China’s Agricultural Trade and Policy: Issues, Analysis, and Global Consequences, June 25-26, 1999 in San Francisco, Califonia.
Fuglie, K., Liming Zhang, L. Salazar, and T. Walker. 1999. Economic Impact of Virus-Free Sweet Potato Planting Material in Shandong Province, China. International Potato Center: Lima, Peru.
Gitomer, C. S. 1996. Potato and Sweetpotato in China: Systems, Constraints, and Potential, International Potato Center (CIP), Lima, Peru.
Huang, Jikun and Cunlai Chen. 1999. Effects of Trade Liberalization on Agriculture in China: Commodity and Local Agricultural Studies, United Nations ESCAP CGPRT Centre, Bogor, Indonesia.
Huang, Jikun and Howarth Bouis. 2000. “Structural Changes and Demand for Food in Asia: Empirical Evidence from Taiwan,” Agricultural Economics22:1-14
Huang, Jikun and Howarth Bouis. 1996. "Structural Changes in Demand for Food in Asia," IFPRI’s Food, Agriculture, and the Environment 2020 Paper Series 11, International Food Policy Research Institute, Washington DC.
Huang, Jikun, Scott Rozelle, and Mark Rosegrant. 1999. "China’s Food Economy to the 21st Century: Supply, Demand and Trade,” Economic Development and Cultural Change, 47:737-766.
Huang, Jikun, Scott Rozelle, and Linxiu Zhang. 2000. "WTO and Agriculture: Radical Reforms or the Continuation of Gradual Transition,", China Economic Review 11:397-401.
Huang, Jikun. 1997. China’s Food Economy: An Overview. CCAP Working Paper, Center for Chinese Agricultural Policy, CAAS, Beijing. (in Chinese).
Huang, Jikun and Scott Rozelle. 1998. China’s Food Economy to the 21st Century. China’s Agricultural Publishing House, Beijing.
Huang, Jikun, Hengyun Ma and Zigang Xu. 2001. Comparative Advantage of Grain Production in Major Grain and Cotton Production Regions. A Project Report Submitted to the Ministry of Agriculture (unpublished), Center for Chinese Agricultural Policy, Beijing.
73
International Food Policy Research Institute. 2000. 2020 Visions, IFPRI, Washington D.C.
JSAAS and SDAAS [Jiangsu Academy of Agricultural Science and Shandong Academy fo Agricultural Science]. 1984. China's Sweetpotato Cultivation. Shanghai Science and Technology Press. Shanghai.
Jiang, Leying, Scott Rozelle and Jikun Huang. 1994. "Production, Technology and Post -Harvest Processing of Sweet Potatoes in Sichuan Province," A Project Report Submitted to International Potato Center.
Leon-Velarde, C.U., J. Roca, J. Arteaga, L. Quispe, and A. Parraga. 1997. Perspectives on Sweetpotato: Dual-Purpose Varieties. In Program Report 1995-1997, International Potato Center, CIP. pp. 291-294.
Liu, Zhouhua, et al. 2001. Feed Efficiency of Fermented Sweetpotato in Pig Production. Chongqing Swine Sciences Academy, Chongqing, China.
Lu, SY, Q.H. Xue, D.P. Zhang and B.F. Song. 1989. Sweet Potato Production and Research in China, CIP, ICAR, CTCRI, Lima.
Ma, Hengyun. 2000. Market Development and Food Consumption Away from Home. An Unpublished Ph.D Dissertation. Center for Chinese Agricultural Policy, Beijing.
Masters, W.A. and A. Winter-Nelson. 1995. “Measuring the Comparative Advantage of Agricultural Activities: Domestic Resource Costs and the Social Cost- Benefit Ratio,” American Journal of Agricultural Economics 77:243-250.
MOA (Ministry of Agriculture, China). 1996. Agricultural Statistical Yearbook of China, State Statistical Publishing House, Beijing.
Monke, E. A. and S. R. Pearson. 1989. The Policy Analysis Matrix for Agricultural Development, Cornell University Press, Ithaca and London.
RERC [Rural Economic Research Center], 1997. A Comparative Study on Efficiency of Individual Household Livestock Production. A Research Report, 97-06, Rural Economic Research Center, Ministry of Agriculture, China.
Scott, G. J. (ed.) 1995. Prices, Products, and People: Analyzing Agricultural Markets in Developing Countries, Lynne Reinner Publishers, Boulder, CO, USA, and International Potato Center, Lima, Peru.
Shapiro B. I. and S. J. Staal, 1995. The Policy Analysis Matrix Applied to Agricultural Commodity Markets. In Prices, Products, and People: Analyzing Agricultural Markets in Developing Countries. Gregory J. Scott (ed.) Lynne Reinner Publishers, Boulder, CO, USA, and International Potato Center, Lima, Peru.
Simpson, J., Xu Cheng, and A. Miyasaki. 1994. China’s Livestock and Related Agriculture. Projections to 2025. CAB International, UK.
SSB [State Statistical Bureau]. Statistical Yearbook of China, various issues, State Statistical Publishing House, Beijing.
Tang Zongfu, Li Ruquan, Lin Liping, Wan Yalong and Fu Maoyu, Song Bofu and S.G.Wersema. 1990. Sweetpotato Utilization and Processing in China, SAAS, Chengdu.

74
Wailes, Eric. J., Zhang Xiaohui, Cao Liqun, Chen Hansheng, Wu Zhigang, and Guo Jianjun. 1998. “China’s Livestock Feed Use Relationships: Preliminary Results from a Survey in Seven Provinces,” WRCC Selected paper, Honolulu, Hawaii, January 12-13.
Walker, T. 1997. Trip report to Shandong Province, October 1997. Mimeo. International Potato Center. Lima, Peru.
Wang, S., B. Song, and Z. Zhang. 1995. Status and Prospects of Sweetpotato Processing in China. International Potato Center (CIP), Lima, Peru.
Wiersema, S.G., Hesen, J.C. and Song B.F. 1989. Report on a Sweetpotato Postharvest Advisory Visit to the People’s Republic of China, 12-27 January. International Potato Center, Lima.
Yin, J.Z, and W. A. Stoever. 1994. “Testing the Causes of Discontinuities in the Black Market Exchange Rate in China,” World Development, 22(9):1413-24.
Zhang, Xiaohui. 1998. “Situation of Pig Production in China and Analysis of its Efficiency,” China Rural Survey, no. 1 Research Center for Rural Ec onomics (RCRE), Ministry of Agriculture, Beijing, China. (In Chinese).
Zhang, Xiaoyong. 1999. Agricultural Marketing in a Country in Transition: Case of Sweetpotato Products in Sichuan PR. China. Ph.D. Thesis. Wageningen University, Holland.
Zhong, Funing and Zigang Xu. 2001. Regional Comparative Advantage of Agricultrual Production in China. An Unpublished Project Report. Nanjing Agricultural University. Nanjing, China.
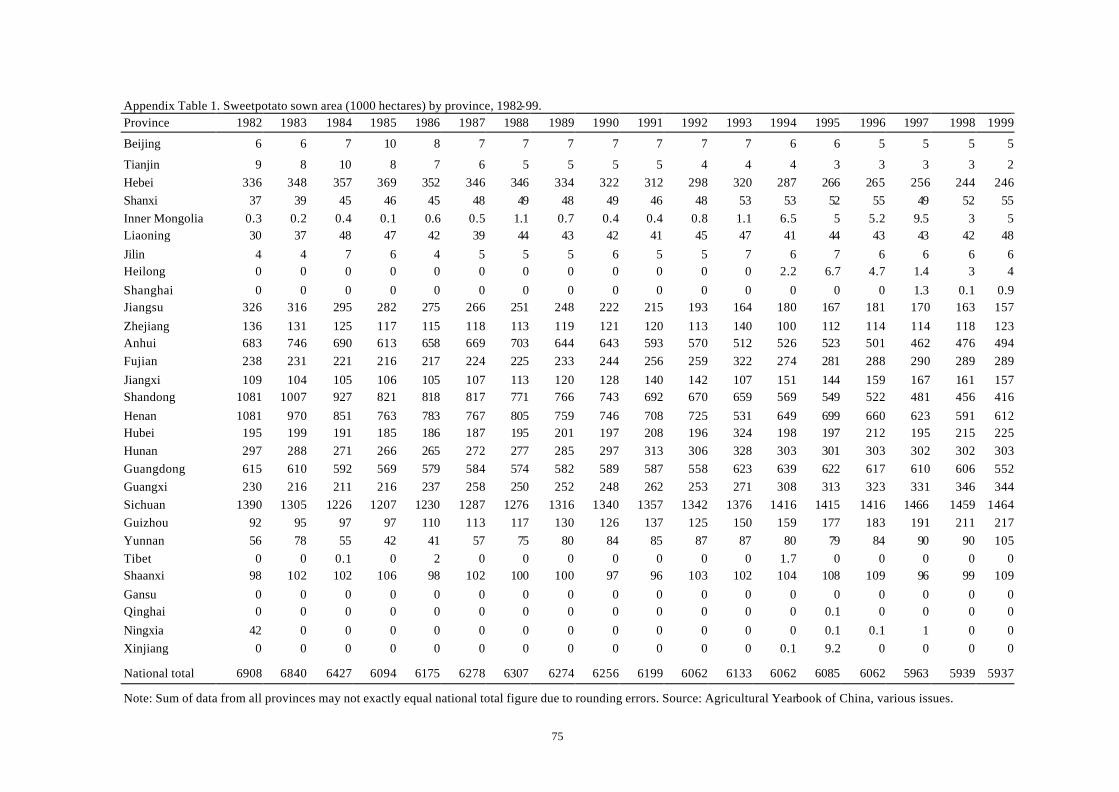
75
Appendix Table 1. Sweetpotato sown area (1000 hectares) by province, 1982-99. Province 1982 1983 1984 1985 1986 1987 1988 1989 1990 1991 1992 1993 1994 1995 1996 1997 1998 1999
Beijing 6 6 7 10 8 7 7 7 7 7 7 7 6 6 5 5 5 5
Tianjin 9 8 10 8 7 6 5 5 5 5 4 4 4 3 3 3 3 2 Hebei 336 348 357 369 352 346 346 334 322 312 298 320 287 266 265 256 244 246 Shanxi 37 39 45 46 45 48 49 48 49 46 48 53 53 52 55 49 52 55 Inner Mongolia 0.3 0.2 0.4 0.1 0.6 0.5 1.1 0.7 0.4 0.4 0.8 1.1 6.5 5 5.2 9.5 3 5 Liaoning 30 37 48 47 42 39 44 43 42 41 45 47 41 44 43 43 42 48 Jilin 4 4 7 6 4 5 5 5 6 5 5 7 6 7 6 6 6 6 Heilong 0 0 0 0 0 0 0 0 0 0 0 0 2.2 6.7 4.7 1.4 3 4 Shanghai 0 0 0 0 0 0 0 0 0 0 0 0 0 0 0 1.3 0.1 0.9 Jiangsu 326 316 295 282 275 266 251 248 222 215 193 164 180 167 181 170 163 157 Zhejiang 136 131 125 117 115 118 113 119 121 120 113 140 100 112 114 114 118 123 Anhui 683 746 690 613 658 669 703 644 643 593 570 512 526 523 501 462 476 494 Fujian 238 231 221 216 217 224 225 233 244 256 259 322 274 281 288 290 289 289 Jiangxi 109 104 105 106 105 107 113 120 128 140 142 107 151 144 159 167 161 157 Shandong 1081 1007 927 821 818 817 771 766 743 692 670 659 569 549 522 481 456 416 Henan 1081 970 851 763 783 767 805 759 746 708 725 531 649 699 660 623 591 612 Hubei 195 199 191 185 186 187 195 201 197 208 196 324 198 197 212 195 215 225 Hunan 297 288 271 266 265 272 277 285 297 313 306 328 303 301 303 302 302 303 Guangdong 615 610 592 569 579 584 574 582 589 587 558 623 639 622 617 610 606 552 Guangxi 230 216 211 216 237 258 250 252 248 262 253 271 308 313 323 331 346 344 Sichuan 1390 1305 1226 1207 1230 1287 1276 1316 1340 1357 1342 1376 1416 1415 1416 1466 1459 1464 Guizhou 92 95 97 97 110 113 117 130 126 137 125 150 159 177 183 191 211 217 Yunnan 56 78 55 42 41 57 75 80 84 85 87 87 80 79 84 90 90 105 Tibet 0 0 0.1 0 2 0 0 0 0 0 0 0 1.7 0 0 0 0 0 Shaanxi 98 102 102 106 98 102 100 100 97 96 103 102 104 108 109 96 99 109 Gansu 0 0 0 0 0 0 0 0 0 0 0 0 0 0 0 0 0 0 Qinghai 0 0 0 0 0 0 0 0 0 0 0 0 0 0.1 0 0 0 0 Ningxia 42 0 0 0 0 0 0 0 0 0 0 0 0 0.1 0.1 1 0 0 Xinjiang 0 0 0 0 0 0 0 0 0 0 0 0 0.1 9.2 0 0 0 0
National total 6908 6840 6427 6094 6175 6278 6307 6274 6256 6199 6062 6133 6062 6085 6062 5963 5939 5937
Note: Sum of data from all provinces may not exactly equal national total figure due to rounding errors. Source: Agricultural Yearbook of China, various issues.

76
Appendix Table 2. Sweetpotato yield (ton/ha) by province, 1982-99 Province 1982 1983 1984 1985 1986 1987 1988 1989 1990 1991 1992 1993 1994 1995 1996 1997 1998 1999
Beijing 2.5 2.5 2.9 3.4 3.3 3.9 3.9 3.9 3.9 4.0 4.7 4.1 5.3 4.8 5.2 4.8 4.6 4.6
Tianjin 3.3 3.8 4.0 4.1 3.7 4.2 3.2 4.4 4.0 4.0 5.0 5.3 4.3 6.0 4.3 3.7 4.4 2.9 Hebei 3.3 3.3 3.3 3.3 3.2 3.5 3.4 3.3 3.5 3.7 3.2 3.8 4.0 4.1 3.9 3.8 4.1 3.9 Shanxi 3.2 3.3 3.6 3.6 2.5 2.9 3.8 3.6 3.2 2.1 3.4 4.2 3.2 4.1 4.1 2.9 4.5 4.2 Inner Mongolia 1.7 2.1 0.9 1.4 2.5 2.3 2.3 2.7 2.3 4.0 6.7 2.6 6.1 3.4 Liaoning 2.5 3.0 2.9 2.2 2.5 2.2 2.8 1.5 2.5 2.4 2.8 3.2 3.2 3.4 3.7 3.6 4.1 3.7 Jilin 2.5 3.8 3.6 2.8 2.8 3.4 4.0 4.0 3.3 5.2 5.2 3.7 3.3 4.0 4.7 2.8 3.2 5.7 Heilong 3.2 3.4 3.4 5.0 4.6 3.3 Shanghai 5.3 5.8 Jiangsu 4.7 4.8 4.7 4.7 4.8 5.0 5.0 4.9 4.7 3.8 4.8 4.8 4.9 5.4 5.3 5.9 6.4 6.2 Zhejiang 5.4 5.7 5.7 5.5 4.8 5.4 5.0 5.2 4.6 4.8 4.9 4.2 4.7 5.2 5.4 5.2 5.4 5.8 Anhui 2.9 4.0 3.6 3.4 4.2 4.0 3.9 4.0 4.0 3.2 3.8 4.4 3.3 4.4 4.6 4.5 4.4 4.6 Fujian 3.8 3.5 3.8 3.7 3.0 3.7 3.5 3.7 3.8 3.9 4.0 3.8 4.3 4.3 4.5 4.7 4.9 4.8 Jiangxi 2.7 2.6 2.7 2.6 2.0 2.5 2.3 2.6 2.6 2.6 3.2 5.6 3.9 4.3 4.0 4.2 4.4 3.9 Shandong 4.6 4.6 5.7 5.3 5.2 5.9 5.2 4.2 5.5 5.3 5.1 6.7 5.7 6.0 6.6 6.9 7.1 6.6 Henan 2.4 3.6 3.0 2.7 2.3 3.0 2.7 3.2 3.4 3.3 3.4 4.3 3.9 4.1 4.6 3.6 5.0 4.8 Hubei 3.2 3.3 3.4 3.2 3.2 3.4 2.9 3.3 2.7 3.0 3.3 3.2 3.5 4.1 3.8 3.6 4.3 4.6 Hunan 3.2 3.4 3.2 3.0 2.7 3.0 2.8 3.0 2.4 2.8 2.4 3.0 3.5 3.6 3.1 3.6 3.6 4.1 Guangdong 2.4 2.3 2.4 2.5 2.4 2.7 2.7 2.8 3.0 3.2 3.0 3.1 3.4 3.6 3.7 4.0 4.2 4.7 Guangxi 1.2 1.1 1.0 1.0 1.0 1.0 0.9 0.9 1.0 1.0 1.2 1.6 1.6 1.6 1.7 1.8 1.8 2.0 Sichuan 2.9 3.3 3.2 3.3 3.1 3.6 3.0 3.2 2.5 3.2 3.4 3.5 2.9 3.2 3.7 3.2 3.6 3.7 Guizhou 2.6 2.7 2.8 2.1 2.5 2.8 2.1 2.4 1.8 2.8 2.9 2.6 2.7 2.5 2.7 2.5 2.5 2.8 Yunnan 1.8 2.5 1.8 2.0 2.1 1.7 1.7 1.7 1.7 1.6 1.5 1.5 2.1 1.8 2.3 2.2 1.9 2.0 Tibet 1.5 2.4 Shaanxi 2.2 2.4 2.5 2.3 2.1 2.7 2.5 2.5 2.5 2.6 2.8 2.6 2.1 2.3 4.4 2.3 3.4 2.8 Gansu Qinghai 2.9 Ningxia 0.5 Xinjiang 5.0
National total 3.2 3.5 3.5 3.4 3.2 3.6 3.3 3.3 3.3 3.4 3.5 3.7 3.5 3.9 4.1 3.4 4.2 4.2
Note: Sweetpotato is reported on a dry weight basis, by dividing fresh weight by 5. Source: Data are from Agricultural Yearbook of China, various issues.

77
Appendix Table 3. Sweetpotato production (1000 tons) by province.
Province 1982 1983 1984 1985 1986 1987 1988 1989 1990 1991 1992 1993 1994 1995 1996 1997 1998 1999
Beijing 15 15 20 34 26 27 27 27 27 28 33 29 32 29 26 24 23 24
Tianjin 30 30 40 33 26 25 16 22 20 20 20 21 17 18 13 11 11 7 Hebei 1115 1155 1180 1206 1125 1195 1166 1111 1138 1163 953 1206 1138 1088 1039 973 993 949 Shanxi 120 130 160 165 113 140 184 172 158 95 164 223 170 212 228 140 234 229 Inner Mongolia 0 0 0 0 1 1 1 1 1 1 2 3 15 20 35 25 20 17 Liaoning 75 110 137 103 105 85 125 66 105 98 125 150 130 151 157 154 173 180 Jilin 10 15 25 17 11 17 20 20 20 26 26 26 20 28 28 17 18 33 Heilong 0 0 0 0 0 0 0 0 0 0 0 0 7 23 16 7 13 13 Shanghai 0 0 0 0 0 0 0 0 0 0 0 0 0 0 0 6.9 0 5 Jiangsu 1520 1520 1395 1336 1330 1319 1249 1203 1053 822 934 788 883 902 959 1002 1035 970 Zhejiang 740 750 715 646 557 637 566 613 557 573 550 587 465 584 615 598 634 709 Anhui 1965 2990 2470 2099 2772 2672 2759 2557 2595 1922 2193 2250 1759 2326 2322 2096 2090 2263 Fujian 915 800 835 805 661 824 784 866 930 993 1039 1217 1174 1211 1293 1356 1403 1392 Jiangxi 295 270 280 276 206 269 257 309 327 360 448 603 589 623 637 700 708 606 Shandong 4945 4670 5280 4373 4247 4784 4040 3220 4120 3684 3400 4409 3255 3316 3422 3325 3250 2764 Henan 2627 3450 2590 2086 1782 2329 2175 2452 2537 2309 2495 2298 2540 2860 3030 2258 2943 2946 Hubei 625 665 640 600 594 635 557 673 524 627 638 1050 699 809 815 707 928 1030 Hunan 955 965 865 808 710 820 768 845 708 883 735 975 1061 1078 931 1087 1092 1230 Guangdong 1505 1380 1400 1416 1386 1589 1542 1633 1773 1855 1682 1917 2177 2256 2284 2446 2555 2574 Guangxi 270 235 220 209 234 266 215 233 249 274 313 423 506 506 550 604 639 674 Sichuan 4050 4345 3910 3942 3820 4572 3824 4211 3319 4350 4530 4842 4038 4558 5188 4638 5192 5464 Guizhou 240 260 275 206 280 313 250 306 225 385 357 394 422 441 488 474 520 605 Yunnan 100 195 100 82 85 95 125 132 145 140 134 133 165 142 197 197 174 207 Tibet 0 0 0 0 3 0 0 0 0 0 0 0 4 0 7 0 0 0 Shaanxi 215 240 255 245 209 275 251 250 240 250 293 265 217 247 477 220 339 300 Gansu 0 0 0 0 0 0 0 0 0 19 0 0 0 0 0 0 0 0 Qinghai 0 0 0 0 0 0 0 0 0 1 0 0 0 0.2 0 0 0 0 Ningxia 20 0 0 0 0 0 0 0 0 0 0 0 0 0 1 0 0 0 Xinjiang 0 0 0 0 0 0 0 0 0 0 0 0 0 46 1 0 0 0
National total 21915 24190 22795 20686 20033 22886 20904 20936 20771 20846 20955 22603 21494 23479 24761 20474 24988 25191
Note: Sweetpotato is reported on a dry weight basis, dividing fresh weight by 5. Sum of data from all provinces may not exactly equal national total due to rounding errors. Sources: Agricultural Yearbook of China, various issues.
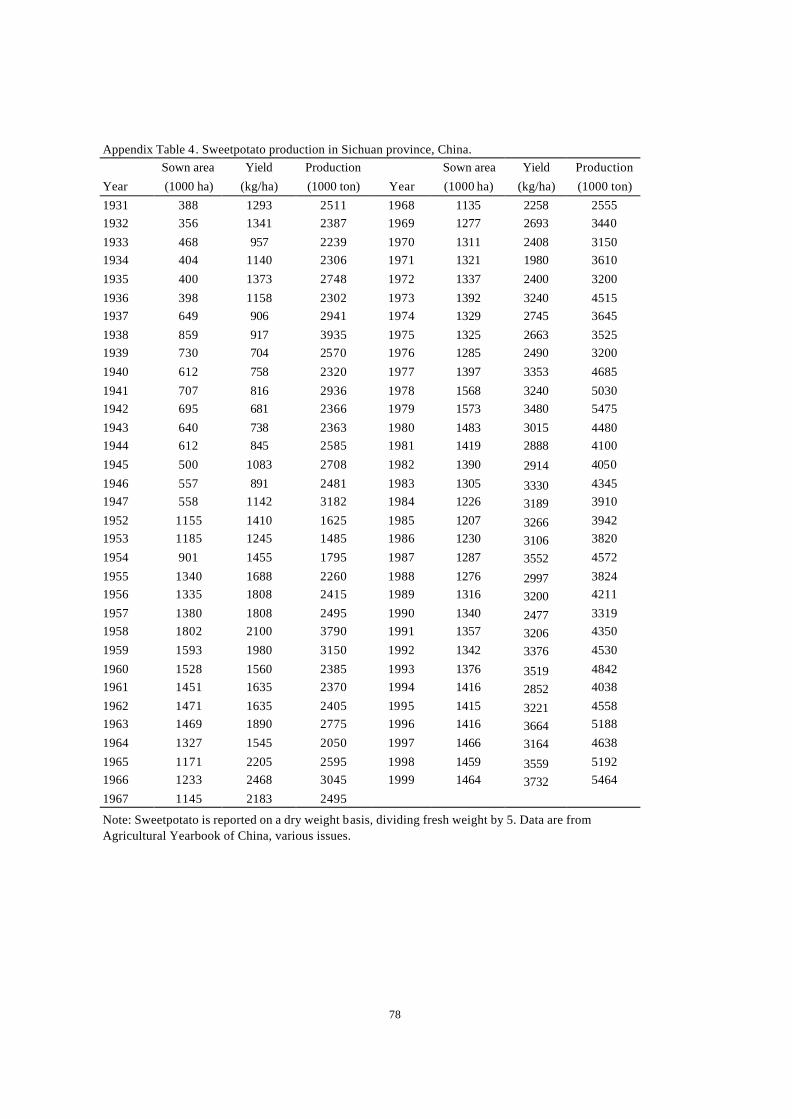
78
Appendix Table 4. Sweetpotato production in Sichuan province, China. Sown area Yield Production Sown area Yield Production
Year (1000 ha) (kg/ha) (1000 ton) Year (1000 ha) (kg/ha) (1000 ton) 1931 388 1293 2511 1968 1135 2258 2555 1932 356 1341 2387 1969 1277 2693 3440 1933 468 957 2239 1970 1311 2408 3150 1934 404 1140 2306 1971 1321 1980 3610 1935 400 1373 2748 1972 1337 2400 3200 1936 398 1158 2302 1973 1392 3240 4515 1937 649 906 2941 1974 1329 2745 3645 1938 859 917 3935 1975 1325 2663 3525 1939 730 704 2570 1976 1285 2490 3200 1940 612 758 2320 1977 1397 3353 4685 1941 707 816 2936 1978 1568 3240 5030 1942 695 681 2366 1979 1573 3480 5475 1943 640 738 2363 1980 1483 3015 4480 1944 612 845 2585 1981 1419 2888 4100 1945 500 1083 2708 1982 1390 2914 4050 1946 557 891 2481 1983 1305 3330 4345 1947 558 1142 3182 1984 1226 3189 3910 1952 1155 1410 1625 1985 1207 3266 3942 1953 1185 1245 1485 1986 1230 3106 3820 1954 901 1455 1795 1987 1287 3552 4572 1955 1340 1688 2260 1988 1276 2997 3824 1956 1335 1808 2415 1989 1316 3200 4211 1957 1380 1808 2495 1990 1340 2477 3319 1958 1802 2100 3790 1991 1357 3206 4350 1959 1593 1980 3150 1992 1342 3376 4530 1960 1528 1560 2385 1993 1376 3519 4842 1961 1451 1635 2370 1994 1416 2852 4038 1962 1471 1635 2405 1995 1415 3221 4558 1963 1469 1890 2775 1996 1416 3664 5188 1964 1327 1545 2050 1997 1466 3164 4638 1965 1171 2205 2595 1998 1459 3559 5192 1966 1233 2468 3045 1999 1464 3732 5464 1967 1145 2183 2495
Note: Sweetpotato is reported on a dry weight basis, dividing fresh weight by 5. Data are from Agricultural Yearbook of China, various issues.
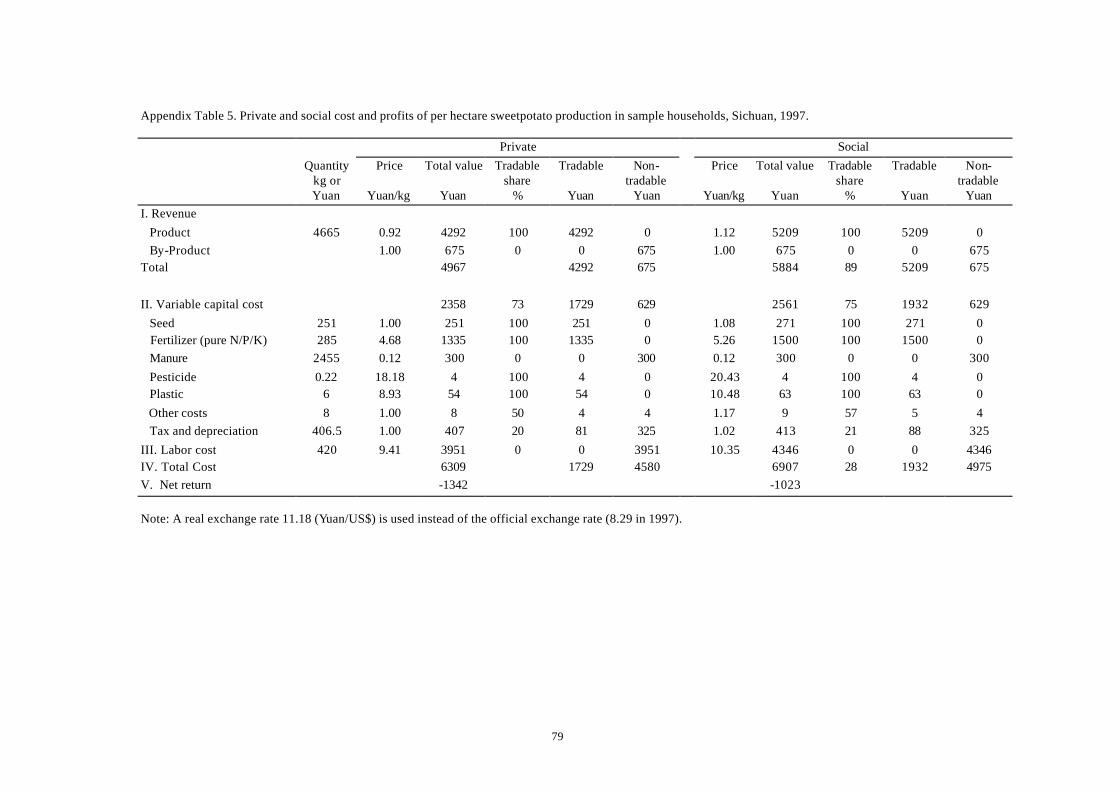
79
Appendix Table 5. Private and social cost and profits of per hectare sweetpotato production in sample households, Sichuan, 1997. Private Social Quantity
kg or Price Total value Tradable
share Tradable Non-
tradable Price Total value Tradable
share Tradable Non-
tradable Yuan Yuan/kg Yuan % Yuan Yuan Yuan/kg Yuan % Yuan Yuan I. Revenue Product 4665 0.92 4292 100 4292 0 1.12 5209 100 5209 0 By-Product 1.00 675 0 0 675 1.00 675 0 0 675 Total 4967 4292 675 5884 89 5209 675 II. Variable capital cost 2358 73 1729 629 2561 75 1932 629 Seed 251 1.00 251 100 251 0 1.08 271 100 271 0 Fertilizer (pure N/P/K) 285 4.68 1335 100 1335 0 5.26 1500 100 1500 0 Manure 2455 0.12 300 0 0 300 0.12 300 0 0 300 Pesticide 0.22 18.18 4 100 4 0 20.43 4 100 4 0 Plastic 6 8.93 54 100 54 0 10.48 63 100 63 0 Other costs 8 1.00 8 50 4 4 1.17 9 57 5 4 Tax and depreciation 406.5 1.00 407 20 81 325 1.02 413 21 88 325 III. Labor cost 420 9.41 3951 0 0 3951 10.35 4346 0 0 4346 IV. Total Cost 6309 1729 4580 6907 28 1932 4975 V. Net return -1342 -1023
Note: A real exchange rate 11.18 (Yuan/US$) is used instead of the official exchange rate (8.29 in 1997).

80
Appendix Table 6. Private and social cost and profits of per hectare sweetpotato production in sample households, Shandong, 1997. Private Social Quantity
kg or Price Total value Tradable
share Tradable Non-
tradable Price Total value Tradable
share Tradable Non-
tradable Yuan Yuan/kg Yuan % Yuan Yuan Yuan/kg Yuan % Yuan Yuan I. Revenue Product 5289 1.04 5501 100 5501 0 1.23 6528 100 6528 0 By-Product 1.00 675 0 0 675 1.00 675 0 0 675 Total 6176 5501 675 7203 91 6528 675 II. Variable capital cost 2619 91 2389 230 2809 92 2579 230 Seed 710 1.00 710 100 710 0 1.05 747 100 747 0 Fertilizer (pure N/P/K) 204 7.26 1481 100 1481 0 7.90 1611 100 1611 0 Manure 375 0.12 46 0 0 46 0.12 46 0 0 46 Pesticide 2.75 24.00 66 100 66 0 26.53 73 100 73 0 Plastic 9 9.44 85 100 85 0 10.79 97 100 97 0 Other costs 3 1.00 3 50 2 2 1.17 4 57 2 2 Tax and depreciation 228 1.00 228 20 46 182 1.02 232 21 49 182 III. Labor cost 257 10.77 2767 0 0 2767 11.84 3044 0 0 3044 IV. Total Cost 5386 2389 2997 5853 44 2579 3274 V. Net return 790 1350
Note: A real exchange rate 11.18 (Yuan/US$) is used instead of the official exchange rate (8.29 in 1997).