Sweet and sour taste preferences of children...Sweet and Sour Taste Preferences of Children Djin Gie...
200
Sweet and Sour Taste Preferences of Children
Transcript of Sweet and sour taste preferences of children...Sweet and Sour Taste Preferences of Children Djin Gie...

Sweet and Sour Taste
Preferences of Children
Promotor
Prof. dr. ir. Frans J. Kok
Hoogleraar Voeding en Gezondheid
Wageningen Universiteit
Co-promotoren
Dr. ir. Kees de Graaf
Universitair hoofddocent
Wageningen Universiteit, sectie Humane Voeding
Dr. Julie A Mennella
Full member of the Monell Chemical Senses Center
Monell Chemical Senses Center, USA
Promotiecommissie
Dr. Gary K. Beauchamp, Monell Chemical Senses Center, USA
Prof. dr. Jan H.A. Kroeze, Wageningen Universiteit/ Universiteit Utrecht
Prof. dr. Anita Jansen, Universiteit Maastricht
Dr. David J. Mela, Unilever Health Institute, Vlaardingen
Dit onderzoek is uitgevoerd binnen de onderzoeksschool VLAG
(Voeding Levensmiddelentechnologie, Agrobiotechnologie en Gezondheid)

Sweet and Sour Taste
Preferences of Children
Djin Gie Liem
Proefschrift
ter verkrijging van de graad van doctor
op gezag van de rector magnificus
van Wageningen Universiteit,
Prof.dr.ir. L. Speelman
in het openbaar te verdedigen
op dinsdag 2 november 2004
des namiddags te vier uur in de Aula.

Liem, Djin Gie
Sweet and sour taste preferences of children
Thesis Wageningen University -with references- with summary in Dutch
ISBN 90-8504-105-8
“I will add that formerly it looked to me as if the sense of taste, at least with my own
children when they were still very young, was different from the adult sense of taste; this
shows itself by the fact that they did not refuse rhubarb with some sugar and milk which
is for us an abominable disgusting mixture and by the fact that they strongly preferred
the most sour and tart fruits, as for instance unripe gooseberries and Holz apples.”
Charles Darwin, 1877
Aan mijn ouders

ABSTRACT
Sweet and sour taste preferences of children
Ph.D.-thesis by Djin Gie Liem, Division of Human Nutrition, Wageningen University, Wageningen, The Netherlands and the Monell Chemical Senses Center, Philadelphia, PA, USA, November 2nd 2004
In the industrialized countries children have many foods to choose from, both healthy
and unhealthy products, these choices mainly depend on children’s taste preferences.
The present thesis focused on preferences for sweet and sour taste of young children (4-
to 12-years of age) living in the US and the Netherlands. Understanding how sweet and
sour taste preferences are formed and modified can help health professionals and those
working in industry, to develop strategies to decrease the consumption of sweet tasting
foods and to increase the variety of children’s diet with sour tasting foods.
By using a variety of stimuli that differed in sweet (0.14M - 0.61M sucrose) and sour
(0.00M - 0.25M citric acid) taste we investigated 1) how sweet and sour taste
preferences of young children can be measured 2) which concentrations of sucrose and
citric acid are most preferred 3) how repeated exposure modifies preferences and 4) how
these preferences are related to oral physiological processes and food consumption.
From the 7 studies we carried out it can be concluded that sweet and sour taste
preferences of young children can consistently be measured with paired comparison and
rank-order methods. Children prefer beverages with high concentrations of sucrose
(0.61M) and a substantial part of children have a preference for extreme sour foods
(0.08-0.25M citric acid). The later is related to intensity and novelty seeking behavior
and consumption of fruits rather than oral physiological differences. Preferences for sour
taste are related to exposure to sour taste during infancy and can not easily be changed
by short repeated exposure during childhood. This is in contrast with preference for
sweet taste, which can be heightened by a short repeated exposure during childhood.
The knowledge gained by the present thesis may open the window to low-sweet and
high-sour foods. This could be beneficial for fruit consumption and the dietary variety
during childhood.

CONTENTS
Chapter 1 Introduction
11
Chapter 2 Consistency of sensory testing with 4-and 5-year-old children
Food quality and preference 2004, 15, pp 541-548
31
Chapter 3 Heightened sour preferences during childhood
Chemical senses, 2003, 28, pp 173-180
49
Chapter 4 Sour taste preferences of children relates to preferences for novel
and intense stimuli
Chemical senses, in press
67
Chapter 5 Fruit consumption of young children is related to preferences for
sour taste
Submitted
85
Chapter 6 Sweet and sour preferences during childhood: role of early
experiences
Developmental psychobiology 2002, 41, pp. 388-395
95
Chapter 7 Sweet preferences and sugar consumption of 4-and-5-year-old
children: role of parents
Appetite, in press
111
Chapter 8 Sweet and sour preferences in young children and adults:
role of repeated exposure
Physiology & behavior, in press
135
Chapter 9 Discussion 155
Summary 179
Samenvatting 185
Dankwoord/ acknowledgements 191
Curriculum Vitae 195


11
Introduction
Chapter 1
12
In the industrialized countries children have many foods to choose from, both healthy
and unhealthy products, these choices mainly depend on children’s taste preferences 1;2
.
The present thesis focused on preferences for sweet and sour taste of young children
who were between the ages of 4-and 11-years. Preferences for sweet taste are of interest
because of their association with energy density and therefore its possible role in
childhood obesity. Preferences for sour taste are poorly investigated, but may increase
dietary variety and interact with the perception of sweet taste. Understanding how sweet
and sour taste preferences are formed and modified can help health professionals and
those working in industry, to develop strategies to decrease the consumption of sweet
tasting foods and to increase the variety of children’s diet with sour tasting foods.
In this thesis we investigated 1) how sweet and sour taste preferences of young children
can be measured 2) which concentrations of sucrose and citric acid are most preferred 3)
how repeated exposure modifies preferences and 4) how these preferences are related to
oral physiological processes and food consumption.
In the first chapter, we discuss the relevance and the bases of, sweet and sour taste
preferences of children. We then display the current knowledge of sweet and sour taste
preferences of young children and discuss how these preferences can be modified by
repeated exposure. The last part of this introduction is dedicated to the aim, the research
questions and the outline of the thesis.
Relevance of research on sweet and sour taste preferences of young children
One in four children in the US is at risk for overweight (body mass index >85th
percentile) 1 and 14% has severe overweight, obesity
3. European countries tend to
follow the same trend 4;5
. Obesity in childhood is associated with risk factors for
cardiovascular and metabolic diseases 6. Research suggested that besides inactivity
7;8,
interactions between genetics and environment 9;10
, the foods children choose and
consume, are of significant importance in the development of childhood obesity.
Children’s consumption of foods that contain fat 8;10-12
as well as beverages that contain
sucrose 12-14
are positively related to children’s Body Mass Index (kg/m2)
13 and
childhood obesity 15
.
Children in the industrialized countries have a wide variety of products they can choose
from, both healthy and unhealthy foods 1-2
. Moreover, they have a large influence on
food purchase decisions 16
. The food choices children in the industrialized countries
make are influenced by a variety of factors 17-21
including taste preferences.
Previous research suggested that taste preferences are the most important determinants
of children’s food choice 22-24
and consumption 11;25
. Especially the addition of sucrose
to foods, which results in an increase of sweet taste, can drive children’s consumption of
a wide variety of foods, such as tofu 26
, spaghetti 27
, applesauce 28
and beverages 22;29-32
.
Introduction
13
With respect to health it is important that children eat a wide range of products, but
adding sugar in order to increase the number of foods children consume will also
increase the caloric density. The relationship between sweet preference and body weight
in adults is weak (see 33
for review) and it is unknown whether this relationship exists
for young children. However, several studies do suggest that high consumption of
beverages that are rich in sugar is positively related to children’s Body Mass Index 12-14
.
Besides the high preference for sweet tasting foods, anecdotal report suggest that some
children also have a high preference for sour tasting foods 16;34;35
. Although many of
these foods contain sugar they can also be a source of important nutrients. For example,
many sour tasting fruits are rich in vitamin C 36
. Sour taste preferences of children have,
however, never been thoroughly investigated.
Decreasing preference for sweet taste and increasing preference for sour taste could be
an useful approach to improve children’s nutrition. That is, a decrease in the
consumption of sweet tasting foods and an increase in the consumption of sour tasting
foods. The latter supposedly will increase the variety of foods children are willing to
consume, without the increase of sugar concentration. Understanding children’s sweet
and sour taste preferences can also contribute to modification of existing and the
development of new products that are highly preferred by children, but that are not high
in sugar content. For example, soda could be decreased in sugar content and increased in
sourness and still be preferred by children.
In order to decrease preferences for sweet taste and increase the preferences for sour
taste, research is needed on how these preferences can be measured and which levels of
these tastes are preferred. Furthermore, it is important to investigate how these
preferences are related to food consumption, oral physiological determinants and
repeated exposure.
Concepts of taste preferences
Before giving insight in the current knowledge and possible gaps in science concerning
preferences for sweet-and sour taste of children, we first have to clarify several concepts
that are widely used across the present thesis. What in common language is referred to
as taste mostly includes a mixture of taste, smell and irritation that is perceived in the
oral and nasal cavities 37
. The present thesis will focus only on taste per se. To be more
specific, the present thesis will focus on sweet and sour taste preferences of young
children. Before a taste quality can be preferred, which takes place in the brain, the taste
has to be perceived by the tongue, this analytical tasks is called taste perception.
Taste perception
The sensation of taste arises from chemical stimulation of specialized cells, taste
receptors, which are grouped in small clusters called taste buds 38
. Each taste bud is

Chapter 1
14
innervated by branches of three cranial nerves: facial (VII), glossopharyngeal (IX), and
vagal (X) nerves 39
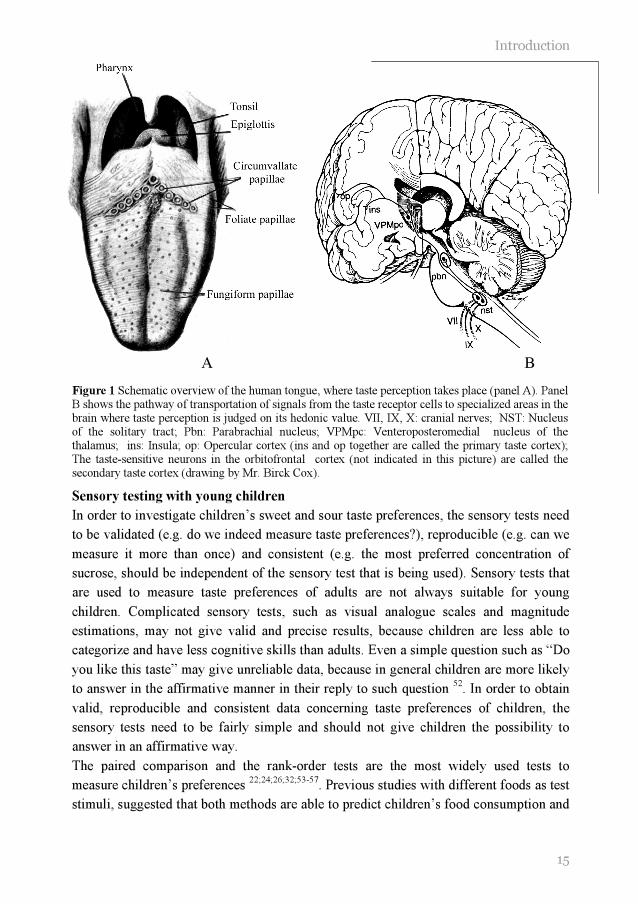
. Taste buds can be found throughout the oral cavity, on the hard and
soft palates, the pharynx, the larynx, the tonsils, the esophagus, and the epiglottis.
However, they are mainly located in structures on the human tongue, called taste
papillae, including fungiform, circumvallate, and foliate papillae 40;41
. Fungiform
papillae consist of 20 to 30 taste buds each and are located on the anterior portion of the
human tongue. Cicumvallate papillae (8 to 12 in total) contain about 250 taste buds
each, and are arranged in a V-shape across the posterior tongue. Foliate papillae consist
of around 1280 taste buds per set. In total two sets of foliate papillae are present on the
human tongue, one on each lateral border 39;41
(see Figure 1 panel a). Chemicals that
interact with taste receptors can be grouped into five basic tastes: sweet, sour, salt, bitter
and umami. These tastes can be perceived in all areas of the tongue 42
. Binding of sweet
tasting molecules (e.g. sucrose) to specific taste receptors (sweet taste receptors) causes
the taste receptors to signal to the nerves that innervate the taste buds. In the same line,
the perception of bitter taste (i.e. quinine, urea) and umami taste (i.e. MSG) are mediated
by binding of bitter or umami tasting molecules respectively, with specific taste
receptors 42-45
. The transduction of sour (i.e. citric acid) and salt taste (NaCl) is most
likely mediated by specific ion channels located on the apical end of the taste cell rather
than binding of molecules to specific receptors 42
.
Interaction between different tastes
Although sweet and sour tastes are perceived by their own unique pathway, the
perceived intensity of sweet and sour taste is different when both tastes are presented in
a mixture 46;47
. This has been described as mixture suppression. Mixture suppression is a
phenomenon whereby the perceived intensity of two tastes in a mixture is less than if
they were unmixed, at the same concentration 48
. Research in adults suggested that
adding high concentrations of citric acid (>0.01M) to a sucrose solution suppresses the
perceived sweetness 46;47
.
Taste preference
The three cranial nerves that innervate each taste bud, transmit information from the
taste buds to specialized area’s in the brain (e.g. primary taste cortex, amygdale and
orbitofrontal cortex) where the taste quality is decoded and judged on its hedonic value 49
(see Figure 1 panel b). Children’s food choices and consumption are mainly driven
by this hedonic judgment 22;50
. Positive hedonic judgments of tastes are partly
determined by nature (e.g. preference for sweet and aversion for sour taste), but can be
modified by learned experiences such as caloric conditioning and repeated exposure (see 51
for a review).
Introduction
15
Figure 1 Schematic overview of the human tongue, where taste perception takes place (panel A). Panel B shows the pathway of transportation of signals from the taste receptor cells to specialized areas in the brain where taste perception is judged on its hedonic value. VII, IX, X: cranial nerves; NST: Nucleus of the solitary tract; Pbn: Parabrachial nucleus; VPMpc: Venteroposteromedial nucleus of the thalamus; ins: Insula; op: Opercular cortex (ins and op together are called the primary taste cortex); The taste-sensitive neurons in the orbitofrontal cortex (not indicated in this picture) are called the secondary taste cortex (drawing by Mr. Birck Cox).
Sensory testing with young children
In order to investigate children’s sweet and sour taste preferences, the sensory tests need
to be validated (e.g. do we indeed measure taste preferences?), reproducible (e.g. can we
measure it more than once) and consistent (e.g. the most preferred concentration of
sucrose, should be independent of the sensory test that is being used). Sensory tests that
are used to measure taste preferences of adults are not always suitable for young
children. Complicated sensory tests, such as visual analogue scales and magnitude
estimations, may not give valid and precise results, because children are less able to
categorize and have less cognitive skills than adults. Even a simple question such as “Do
you like this taste” may give unreliable data, because in general children are more likely
to answer in the affirmative manner in their reply to such question 52
. In order to obtain
valid, reproducible and consistent data concerning taste preferences of children, the
sensory tests need to be fairly simple and should not give children the possibility to
answer in an affirmative way.
The paired comparison and the rank-order tests are the most widely used tests to
measure children’s preferences 22;24;26;32;53-57
. Previous studies with different foods as test
stimuli, suggested that both methods are able to predict children’s food consumption and
A B
Chapter 1
16
are therefore considered to be valid to measure food preferences 24;28;57;58.
. Previous
research showed a high reproducibility of the paired comparison (88%) 59
and moderate
reproducibility of the rank-order method (expressed as tau-correlation, see chapter 8 for
more details, between first and second assessment, mean tau=0.58 24
, mean tau=0.40 53
,
tau could range from –1 (total disagreement) to 1 (total agreement)).
It is, however, unclear whether the paired comparison and the rank-order test give
consistent data with respect to the most preferred level of a specific taste quality. That is,
the most preferred concentration of sucrose could depend on the method that is used. In
order to compare studies that used either paired comparisons or the rank-order test,
information concerning the consistency of both tests is crucial. Especially when the
research is conducted with young children (i.e. 4-and 5-year-olds), the consistency of
both methods is not warranted. The attention span of 5-year-old children and their ability
to categorize, analyze, and synthesize information rapidly is stronger and more efficient
than that of 4-year-old children 60
. Four-year-olds may not be able to carry out simple
sensory tests, which are of no problem to 5-year-olds.
The difference between 4-and 5-year-olds becomes even more important when
investigating discriminatory ability (e.g. which is sweeter) instead of preference. In
order to perform well during the discrimination tests children need to clearly understand
what the researcher means by the specific dimension (e.g. sweetness) 48
. Information
concerning children’s ability to discriminate between different concentrations of sucrose
is important in order to judge the consistency of the preference tests. If children are not
able to discriminate between different sucrose solutions, it is impossible to identify the
most preferred solution in a consistent manner.
Conclusion
Paired comparison and rank-order methods are valid and reproducible methods to
measure children’s food preferences. However, it needs to be investigated whether they
give consistent data when interested in the most preferred concentration of sucrose and
children’s discriminatory ability. Special attention should be given to young children (4-
and 5-year-olds), because their abilities to perform such tasks are rapidly changing.
Preference for sweet and sour taste in young children
In order to understand which levels of sweet-and sour taste children prefer and how this
can be modified, it is important to have insight in the development of taste preferences.
First we describe which levels of sweet and sour taste newborns and children prefer and
whether this is different from adults. We then discuss how these preferences are related
to food consumption and what the possible mechanisms are.
In order to protect children from ingesting harmful substances and to promote the
consumption of nutritious substances, they already have a sophisticated sense of taste at

Introduction
17
birth 61;62
. Based on facial expressions (i.e. facial relaxation) and intake measures, it has
been shown that human newborns (i.e. 1-4 days of life) have a preference for intense
sweet solutions (0.73M sucrose in water) and that they are able to discriminate between
different sugars 63-65
. This preference for high sweet foods continues during childhood
and is evident in children around the world 28-31;66-71
. The concentration of sucrose most
preferred by children (0.60M sucrose in water) is far higher than which is most preferred
by adults (0.075M sucrose in water) 29-31;70
. This is also reflected by large food
consumption data, which revealed that 4-to 7-year-old children (n=325) consumed a
larger percentage of their total energy intake across the day, by means of mono- and
disaccharide’s (girls: 33.2 %; boys: 32.1%), than adults (females: 21.3%; males: 23.7%)
(n=2799) 2.
It has been hypothesized that preferences for sweet tastes are heightened during periods
of maximum growth 71
. This hypothesis has been supported by animal research in which
was shown that newborn rats preferred high concentrations of sucrose, this preference
decreased with age. This change in preference did not depend on the foods that newborn
and older aged rats were fed 72
. An alternative hypothesis is that the preference for sweet
taste expands the species’ use of available nutritional sources 30
. The addition of sucrose
to food can drive children’s consumption of a variety of foods, such as tofu 26
, spaghetti 27
, applesauce 28
and beverages 22;29-32
.
Much less is known about the preference for sour taste. Based on facial expressions (i.e.
lip pursing combined with negative upper and mid-face components) and intake, it has
been suggested that human newborns reject sour tasting substances (0.024M citric acid) 64;65
. Little research, however, has been carried out in children. Anecdotal reports and
marketing observations suggest that children prefer higher levels of sour taste than
adults. For example, Charles Darwin observed in 1877 that, unlike most adults, his
children had a preference for intense sour tasting foods 34
. Nowadays, children’s
preferences for intense sour foods, are reflected by the clear market for extreme sour
tasting candies 16;35
. These candies are highly preferred by some children, but aversive to
most adults 35
. Despite these anecdotal and marketing reports no scientific evidence is
available to support the assumed preference for intense sour taste of children. It also
needs to be determined whether preference for sour taste is evident in all children, or
only in a subset of children.
Why would children have a higher preference for sour taste than adults? Hypothetically
the rejection of sour taste in newborns is biologically relevant because intense sour
tasting foods may cause tissue damage. The possible acceptance of intense sour taste by
young children is difficult to explain. Preference for this taste could possibly increase
the consumption of sour tasting foods such as certain fruits that can be beneficial for
health. For example, sour tasting citrus fruit can be a good source for vitamin C, which
Chapter 1
18
is important for collagen fiber formation in the human body 36
. It has been suggested that
preference is the most important determinant of fruit consumption 73
. It, however, needs
to be investigated whether preference for sour taste plays a role in the consumption of
fruit.
Children’s high preference for sour tasting foods can also be explained by the perceived
intensity of sour taste. Hypothetically, children who have a preference for extreme high
concentrations of citric acid in foods, perceive the sourness as less intense compared to
those who do not prefer this taste. In order to come to a similar sensation of perceived
taste intensity, those who perceive the sourness less intense need more stimulation with
sour taste. Oral physiological differences may play a role in perceived sourness.
Research with adults suggested that a high salivary flow 74
, high buffering capacity of
saliva 75
and low salivary pH 76
are related to a low perceived intensity of sour tasting
foods.
An alternative, but not mutually exclusive, hypothesis is that preference for sour taste is
driven by or related with sensation seeking behavior of children 16;35
. According to this
hypothesis children’s preferences for sour tastes are secondary to their generalized
preferences for adventures and thrills. To our knowledge, there are no published reports
on whether aspects of temperament relate to children’s preferences for sour tastes.
Conclusion
Despite the large amount of research dedicated to children’s preference for sweet taste,
little is know about children’s preference for sour taste. Anecdotal reports suggest that
children have a preference for intense sour tasting foods, but to our knowledge, this was
never scientifically tested. It also remains unknown what drives these preferences for
sour taste and whether preference for this taste is related with dietary intake.
Changing preferences for sweet and sour taste in young children
Although children are born with a preference for sweet taste and an aversion for sour
taste, these preferences can be changed. There are several mechanisms through which
children learn to prefer different tastes, among which classical conditioning (see 51
for
review), post-ingestive learning 77
, peer pressure 57
, interaction between parent and child
(see 51
for review) and repeated exposure. The present thesis focused on the role of
repeated exposure on the preferences for sweet-and sour taste of children.
The role of exposure starts as early as the third trimester of gestation, when the human
fetus is equipped with a functional taste system 78
. While still in the womb, the fetus
ingests almost one-liter amniotic fluid per day 79
. It has been shown that amniotic fluid
contains flavors that reassemble the flavor of the food previously eaten by the mother 80
.
By ingesting the amniotic fluid the fetus is exposed to the flavors of the foods eaten by

Introduction
19
the mother. By means of this pre-natal exposure, the fetus learns to accept and prefer the
food eaten by the mother 81;82
.
Impact of repeated exposure during infancy on sweet and sour taste preferences
The role of exposure continues after birth. By repeatedly exposing infants to the same
food, they learn to accept it as familiar and save to consume, if consumption is not
followed by negative gastrointestinal consequences 83;84
. Repeated exposure to different
tastes during infancy not only affects taste preferences on the short term (i.e. infancy),
but is also thought to be important for taste preferences in the long term (i.e. childhood,
adulthood) 85
. Similar to the sensitive period for normal vision 86
, a sensitive period may
exist to learn to prefer different tastes 37
. During this sensitive period it is hypothesized
that infants can easily accept new flavors and foods and identify regular eaten flavors as
familiar and save 37
. Once this sensitive period comes to an end, the infant is likely to
reject all the flavors that are not familiar to him 87
. It is suggested that flavor preferences
learned early in life (early flavor experiences), are robust and affect taste preferences
later in life 85
.
In humans the concept of ‘early flavor experiences’ has been tested for sweet tasting
sugar water 88
and sour tasting baby formula 89
. Beauchamp and Moran concluded that
infants, who were fed sucrose water, had a higher preference for sucrose water at 2-
years-of-age than children of mothers who did not practice this habit. This was also
evident for those children who were only fed sucrose water during their first 6 months of
life 88
. Along the same line, but now based on sour tasting formula, Mennella and
Beauchamp suggested that 4-to 5-year-old children who were fed sour tasting formula
during their first year of life, were more likely to prefer juices with a sour taste than
those who were fed other formulas (i.e. soy or milk based formulas). This difference in
preferences for sour taste was evident years after children’s last exposure to the sour
tasting formula 89
. It has been suggested that early taste experience with sour tasting
formulas also influences children’s preference for sweet taste 90;91
. However, this has
never been thoroughly investigated. Furthermore, it remains unclear whether early flavor
experiences with sour tasting formula influences preferences for sweet and sour taste of
older aged children.
Impact of repeated exposure during childhood on sweet and sour taste preferences
Repeated exposure remains important during childhood. Previous studies showed that
approximately 8 exposures are necessary to increase the liking of a food during
childhood 2. Parents control their children’s degree of exposure to foods
92-95. Especially
sweet food items are often highly controlled by parents because of the assumed negative
effects on health 96;97
. By imposing rules that aim to restrict the consumption of foods
that contain sugar, parents try to lower their children’s consumption of these foods and
Chapter 1
20
preference for sweet taste in general 98
. Two problems arise from this parental approach.
First, research on the effect of repeated exposure on subsequent preference has been
focused on food products rather than taste per se 99-102
. It remains to be determined
whether repeated exposure during childhood to specific tastes such as sweet or sour taste
result in an increased liking for sweet and sour taste.
Secondly, it is unclear whether restriction of sweet food items, lowers the preference for
sweet taste. On the contrary, restriction may well result in an elevated preference for
sweet taste. Several studies suggested that restriction could result in an increased desire
to consume the restricted food 103
. This high desire would then increase consumption of
the restricted food in the absence of parental monitoring 104
. Whether this mechanism is
relevant for sweet taste remains unknown.
Conclusion
It has been suggested that repeated exposure to sour taste early in life (< 1year)
influences sweet and sour taste preferences of 4-to-5 year-olds, it remains unknown
whether such experience influences the taste preferences of older aged children.
Repeated exposure to sweet and sour taste during childhood may also increase the
preference for both taste qualities during childhood, but this has never thoroughly been
investigated. Despite this lack of evidence many parents try to decrease their children’s
preference for sweet taste by decreasing exposure. It needs to be investigated whether
parental control over the consumption of sweet tasting products is an efficient way to
decrease preference for sweet taste.
Overall conclusion
There exists an extensive research on sweet taste preferences of children. However, due
to the variety of methods that were used it is difficult to compare the different studies. It
needs to be investigated how consistent the results of commonly used methods are,
especially when those methods are used to measure taste preferences of young children.
Beside anecdotal and marketing reports, there is a lack of scientific studies concerning
preferences for sour taste of children. Research on sour taste preferences of children
should be focused on the most preferred intensity, and the physiological and
temperamental differences between those who prefer this taste quality and those who do
not. Furthermore, it needs to be investigated whether preference for sour taste is related
to consumption of sour tasting foods.
It is likely that preferences for sweet and sour taste of children are influenced by a
variety of factors among which repeated exposure. The influence of repeated exposure
on preference for sweet and sour taste in children starts as early as infancy. It has been
suggested that early experience with sour taste influences both sour taste as well as
Introduction
21
sweet taste preferences of children. Further research is needed to confirm the possible
relationship between early experiences and taste preferences during childhood.
Repeated exposure remains of relevance during childhood as suggested by studies that
focused on preference for a specific food. Whether repeated exposure to specific taste
qualities is related to an enhanced preference for these taste qualities remains to be
determined. Deliberately decreasing the exposure to sweet taste may even have the
opposite effect. This, however, needs further investigation.
Outline of the thesis
As has been shown in the overall conclusion research on preferences for sweet and sour
taste of children should be focused on the consistency of the commonly used sensory
tests, the most preferred level of sour taste and how this is related to oral physiological,
temperamental differences and food consumption. Furthermore, it needs to be
investigated whether repeated exposure early in life and during childhood are related to
preferences for sweet and sour taste, and how preferences for sweet taste are influenced
by parental restriction of sweet food items.
Research questions
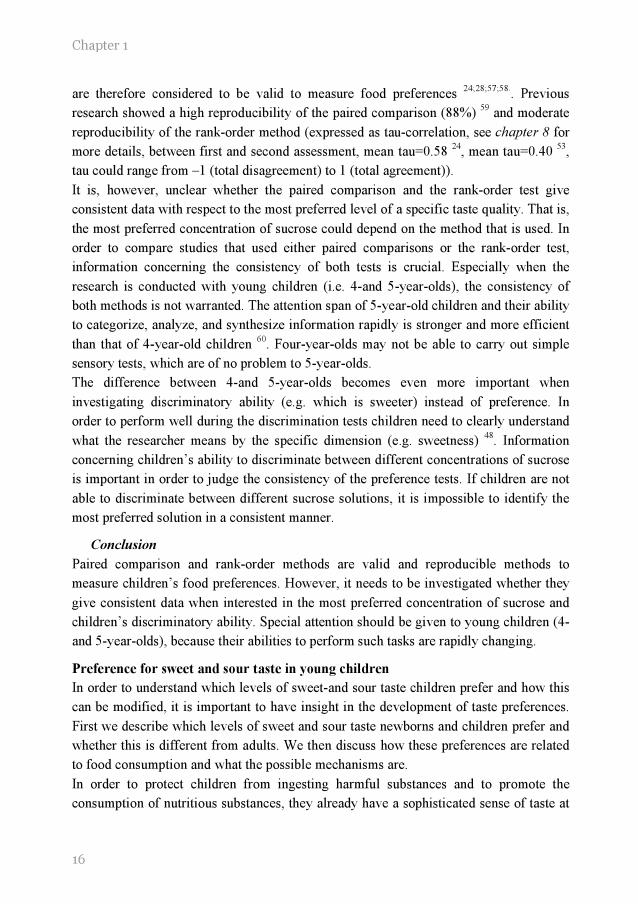
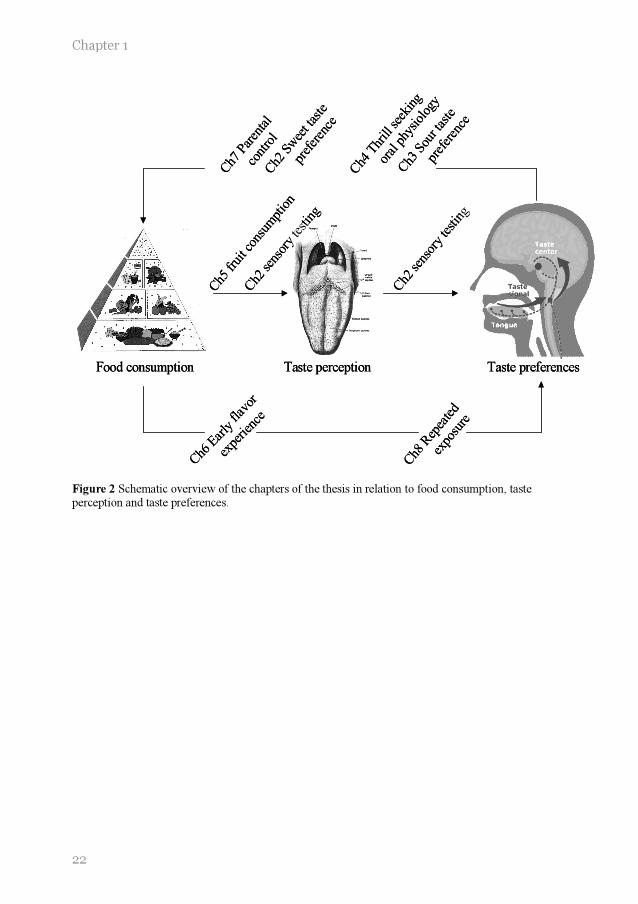
The research questions were stated as follows (see Figure 2 for schematic overview)
1. Do paired comparison and rank-order procedures give consistent data
concerning the most preferred level of sweet taste and the discriminatory
ability of young children? Chapter 2
2. Which levels of sour taste are most preferred by children and how is this
related to physiological determinants, thrill seeking behavior and fruit
consumption? Chapter 3, 4 and 5
3. What is the influence of early experience with sour tastes on preferences for
sweet and sour taste of young children? Chapter 6
4. What is the role of parents on the preference and consumption of sweet foods
of their children? Chapter 7
5. Can sweet and sour taste preferences of children be changed by a short
repeated exposure to sweet and sour tasting stimuli? Chapter 8
Chapter 1
22
Food consumption Taste perception Taste preferences
Ch2
sen
sory
testin
g
Ch5
frui
t con
sum
ptio
n
Ch3
Sou
r tas
te
pref
eren
ce
Ch4
Thr
ill see
king
oral
phy
siol
ogy
Ch6
Ear
ly fla
vor
expe
rienc
e
Ch7
Par
enta
l
cont
rol
Ch8
Rep
eate
d
expo
sure
Ch2
sen
sory
testin
g
Ch2
Sw
eet t
aste
pref
eren
ce
Figure 2 Schematic overview of the chapters of the thesis in relation to food consumption, taste perception and taste preferences.
Introduction
23
REFERENCES
1. Nicklas TA, Yang SJ, Baranowski T, Zakeri I, Berenson G. Eating patterns and obesity in
children. The Bogalusa Heart Study. American journal of preventive medicine 2003; 25: 9-16.
2. Voorlichtings bureau voor de voeding. Zo eet Nederland 1998, This is the way the Netherlands eats 1998. Delft: Van Marken Delft Drukkers, 2002.
3. Hammer LD, Robinson TN. Child and adolescent obesity. In: Levin MD, Carey WB, Crocker AC, eds. Developmental-behavioral pediatrics, 3rd ed. Philadelphia: W.B. Saunders company, 1999: 370-379.
4. Livingstone B. Epidemiology of childhood obesity in Europe. European journal of pediatrics
2000; 159 Suppl 1: S14-S34.
5. Bundred P, Kitchiner D, Buchan I. Prevalence of overweight and obese children between 1989 and 1998: population based series of cross sectional studies. British medical journal 2001; 322: 326-328.
6. Glowinska B, Urban M, Koput A. Cardiovascular risk factors in children with obesity, hypertension and diabetes: lipoprotein(a) levels and body mass index correlate with family history of cardiovascular disease. European journal of pediatrics 2002; 161: 511-518.
7. Epstein LH. Family-based behavioural intervention for obese children. International journal of obesity and related metabolic disorders 1996; 20 Suppl 1: S14-S21.
8. Crooks DL. Food consumption, activity, and overweight among elementary school children in an Appalachian Kentucky community. American journal of physical anthropology 2000; 112: 159-170.
9. Froguel P, Boutin P. Genetics of pathways regulating body weight in the development of obesity in humans. Experimental biology and medicine 2001; 226: 991-996.
10. Maffeis C. Aetiology of overweight and obesity in children and adolescents. European journal of pediatrics 2000; 159 Suppl 1: S35-S44.
11. Ricketts CD. Fat preferences, dietary fat intake and body composition in children. European
journal of clinical nutrition 1997; 51: 778-781.
12. Gillis LJ, Bar-Or O. Food away from home, sugar-sweetened drink consumption and juvenile obesity. Journal of the American college of nutrition 2003; 22: 539-545.
13. Ludwig DS, Peterson KE, Gortmaker SL. Relation between consumption of sugar-sweetened drinks and childhood obesity: a prospective, observational analysis. Lancet 2001; 357: 505-508.
14. Dennison BA, Rockwell HL, Baker SL. Excess fruit juice consumption by preschool-aged children is associated with short stature and obesity. Pediatrics 1997; 99: 15-22.
15. Dennison BA, Rockwell HL, Baker SL. Fruit and vegetable intake in young children. Journal of the American college of nutrition 1998; 17: 371-378.
16. Urbick B. About kids: food and beverages. Surrey: Leatherhead publishing, 2000.
17. Hill AJ. Developmental issues in attitudes to food and diet. The proceedings of the nutrition society 2002; 61: 259-266.

Chapter 1
24
18. Fisher JO, Mitchell DC, Smiciklas-Wright H, Birch LL. Parental influences on young girls' fruit and vegetable, micronutrient, and fat intakes. Journal of the American dietetic association 2002; 102: 58-64.
19. Gibson EL, Wardle J, Watts CJ. Fruit and vegetable consumption, nutritional knowledge and beliefs in mothers and children. Appetite 1998; 31: 205-228.
20. Birch LL. Psychological influences on the childhood diet. Journal of nutrition 1998; 128: 407S-410S.
21. Horne PJ, Lowe CF, Fleming PF, Dowey AJ. An effective procedure for changing food preferences in 5-7-year-old children. The proceedings of the nutrition society 1995; 54: 441-452.
22. Olson CM, Gemmill KP. Association of sweet preference and food selection among four to five year old children. Ecology of food and nutrition. 1981; 11: 145-150.
23. Hair JF, Anderson RE, Tatham RL, Black WC. Factor analyses. In: Hair JF, Anderson RE, Tatham RL, Black WC, eds. Multivariate data analysis, 5th ed. Upper Saddle River, New
Jersey: Prentice- Hall Inc, 1998: 87-138.
24. Leon F, Marcuz MC, Couronne T, Koster EP. Measuring food liking in children: a comparison of non-verbal methods. Food quality and preference 1999; 10: 93-100.
25. Perez-Rodrigo C, Ribas L, Serra-Majem L, Aranceta J. Food preferences of Spanish children and young people: the enKid study. European journal of clinical nutrition 2003; 57 Suppl 1: S45-S48.
26. Sullivan SA, Birch LL. Pass the sugar, pass, the salt: experience dictates preference. Developmental psychology 1990; 26: 546-551.
27. Filer LJ. Studies of taste preference in infancy and childhood. Pediatric basics 1978; 12: 5-9.
28. Bellisle F, Dartois AM, Kleinknecht C, Broyer M. Perceptions of and preferences for sweet taste in uremic children. Journal of the American dietetic association 1990; 90: 951-954.
29. Desor JA, Greene LS, Maller O. Preferences for sweet and salty in 9- to 15-year-old and adult humans. Science 1975; 190: 686-687.
30. Desor JA, Beauchamp GK. Longitudinal changes in sweet preferences in humans. Physiology and behavior 1987; 39: 639-641.
31. Zandstra EH, De Graaf C. Sensory perception and pleasantness of orange beverages from
childhood to old age. Food quality and preference 1998; 9: 5-12.
32. Kroll BJ. Evaluation rating scales for sensory testing with children. Food technology 1990; 44: 78-86. 33. McDaniel AH, Reed DR. The human sweet tooth and its relationship to obesity. In: Moustaid-Moussa N, Berdanier C, eds. Genomics and proteomics in nutrition, New York: Marcel Dekker Inc, 2004: 49-67.
34. Darwin C. Biographiche skizze eines kleinen kindes. Kosmos 1877; 367-376.
35. Frauenfelder M. Gross National Product. Wired archive 1999; 7.06.
36. Halsted CH. Water-soluble vitamins. In: Garrow JS, James CE, eds. Human nutrition and
dietetics 9th ed. New York: Churchill livingstone, 1993: 239-263.
37. Beauchamp GK, Mennella JA. Sensitive periods in the development of human flavor perception and preference. Annales Nestlé, Nestlé Nutrition Workshop Series 1998; 56: 19-31.

Introduction
25
38. Lawless H. Sensory development in children: research in taste and olfaction. Journal of the American dietetic association 1985; 85: 577-82, 585.
39. Witt M, Reutter K, Miller IJ. Morphology of the peripheral taste system. In: Doty RL, ed. Handbook of olfaction and gustation, 2nd ed. New York: Marcel Dekker, Inc, 2003: 651-677.
40. Cowart BJ. Development of taste perception in humans: sensitivity and preference throughout
the life span. Psychological bulletin 1981; 90: 43-73.
41. Mistretta CM. Neurophysiological and anatomical aspects of taste development. In: Aslin RN, Alberts JR, Petersen MR, eds. Development of perception, New York: Academic Press, 1981: 433-455.
42. Bartoshuk LM, Beauchamp GK. Chemical senses. Annual review of psychology 1994; 45: 419-449.
43. Nelson G, Chandrashekar J, Hoon MA, Feng L, Zhao G, Ryba NJ, Zuker CS. An amino-acid taste receptor. Nature 2002; 416: 199-202.
44. Brand JG. Receptor and transduction processes for umami taste. Journal of nutrition 2000;
130: 942S-945S.
45. Kurihara K, Kashiwayanagi M. Physiological studies on umami taste. Journal of nutrition 2000; 130: 931S-934S.
46. Pelletier CA, Lawless HT, Horne J. Sweet-sour mixture suppression in older and young adults. Food quality and preference 2004; 15: 105-116.
47. Schifferstein HNJ, Frijters JER. Sensory integration in citric acid/sucrose mixtures. Chemical senses 1990; 15: 87-109.
48. Lawless HT, Heymann H. Acceptance and preference testing. In: Lawless HT, Heymann H,
eds. Sensory evaluation of food, New York: Kluwer academic/plenum publishers, 1998: 430-479.
49. Rolls ET, Scott TR. Central taste anatomy and neurophysiology. In: Doty RL, ed. Handbook of olfaction and gustation, 2nd ed. New York: Marcel Dekker, Inc, 2003: 679-705.
50. Desor JA, Maller O, Turner RE. Preference for sweet in humans: infants, children and adults. In: Weiffenbach JM, ed. Taste and development: the genesis of sweet preference, Washington, DC: US Government Printing Office, 1977.
51. Birch LL. Development of food preferences. Annual review of nutrition 1999; 19: 41-62.
52. Guinard J-X. Sensory and consumer testing with children. Food science and technology 2001; 11: 273-283.
53. Birch LL. Dimensions of preschool children's food preferences. Journal of nutrition education 1979; 11: 77-80.
54. Birch LL. The relationship between children's food preferences and those of their parents. Journal of nutrition education 1980; 12: 14-18.
55. Birch LL, Marlin DW. I don't like it; I never tried it: effects of exposure on two-year-old children's food preferences. Appetite 1982; 3: 353-360.
56. Guthrie CA, Rapoport L, Wardle J. Young children's food preferences: a comparison of three modalities of food stimuli. Appetite 2000; 35: 73-77.
57. Birch LL. Effects of peer models' food choices and eating behaviors on preschoolers' food preferences. Child development 1980; 51: 489-496.
Chapter 1
26
58. Birch LL. Preschool children's food preferences and consumption patterns. Journal of nutrition education 1979; 11: 189-192.
59. Kimmel SA, Sigman-Grant M, Guinard J-X. Sensory testing with young children. Food technology 1994; 48: 92-99.
60. Krug EF, Mikus KC. The preschool years. In: Levin MD, Carey WB, Crocker AC, eds.
Developmental-Behavioral Pediatrics, 3rd ed. Philadelphia: Saunders, 1999: 38-50.
61. Glendinning JI. Is the bitter rejection response always adaptive? Physiology and behavior 1994; 56: 1217-1227.
62. Mattes RD. Nutritional implications of taste and smell. In: Doty RL, ed. Handbook of olfaction and gustation, 2nd ed. New York: Marcel Dekker, Inc, 2003: 881-903.
63. Cowart BJ, Beauchamp GK. Early development of taste perception. In: McBride RL, MacFie HJH, eds. Psychological basis of sensory evaluation, London and New York: Elsevier applied science, 1990: 1-16.
64. Rossenstein D, Oster H. Differential facial responses to four basic tastes in newborns. Child
development 1988; 59: 1555-1568.
65. Desor JA, Maller O, Andrews K. Ingestive responses of human newborns to salty, sour, and bitter stimuli Journal of comparative and physiological psychology 1975; 89:966-970..
66. Tomita NE, Nadanovsky P, Vieira AL, Lopes ES. Taste preference for sweets and caries prevalence in preschool children. Revista de Saude Publica 1999; 33: 542-546.
67. Jamel HA, Sheiham A, Watt RG, Cowell CR. Sweet preference, consumption of sweet tea and dental caries; studies in urban and rural Iraqi populations. International dental journal 1997; 47: 213-217.
68. Steiner JE. Facial expressions of the neonate infant indication the hedonics of food-related chemical stimuli. In: Weiffenbach JM, ed. Taste and development: the genesis of sweet preference, Washington, DC: U.S. Government Printing Office, 1977: 173-188.
69. Vazquez M, Pearson PB, Beauchamp GK. Flavor preferences in malnourished Mexican infants. Physiology and behavior 1982; 28: 513-519.
70. De Graaf C, Zandstra EH. Sweetness intensity and pleasantness in children, adolescents, and adults. Physiology and behavior 1999; 67: 513-520.
71. Beauchamp GK, Cowart BJ. Development of sweet taste. In: Dobbing J, ed. Sweetness,
Berlin: Springer-Verlag, 1987: 127-138.
72. Bertino M, Wehmer F. Dietary influence on the development of sucrose acceptability in rats. Developmental psychobiology 1981; 14: 19-28.
73. Baxter SD, Thompson WO. Fourth-grade children's consumption of fruit and vegetable items available as part of school lunches is closely related to preferences. Journal of nutrition education and behavior 2002; 34: 166-171.
74. Spielman AI. Interaction of saliva and taste. Journal of dental research 1990; 69: 838-843.
75. Christensen CM, Brand JG, Malamud S. Salivary changes in solution pH: a source of
individual differences in sour taste perception. Physiology and behavior 1987; 40: 221-227.
76. Norris MB, Noble AC, Pangborn RM. Human saliva and taste responses to acids varying in anions, titratable acidity, and pH. Physiology and behavior 1984; 32: 237-244.
77. Birch LL. Children's preferences for High-Fat foods. Nutrition reviews 1992; 50: 249-255.

Introduction
27
78. Ganchrow JR, Mennella JA. The ontogeny of human flavor perception. In: Doty RL, ed. Handbook of olfaction and gustation, 2nd ed. New York: Marcel Dekker, Inc, 2003: 823-846.
79. Mennella JA, Beauchamp GK. Early flavor experiences: research update. Nutrition reviews 1998; 56: 205-211.
80. Mennella JA, Johnson A, Beauchamp GK. Garlic ingestion by pregnant women alters the odor of amniotic fluid. Chemical senses 1995; 20: 207-209.
81. Mennella JA, Jagnow CP, Beauchamp GK. Prenatal and postnatal flavor learning by human infants. Pediatrics 2001; 107: E88.
82. Schaal B, Marlier L, Soussignan R. Human foetuses learn odours from their pregnant mother's diet. Chemical senses 2000; 25: 729-737.
83. Birch LL, Gunder L, Grimm-Thomas K. Infants' consumption of a new food enhances acceptance of similar foods. Appetite 1998; 30: 283-295.
84. Gerrish CJ, Mennella JA. Flavor variety enhances food acceptance in formula-fed infants.
The American journal of clinical nutrition 2001; 73: 1080-1085.
85. Haller R, Rummel C, Henneberg S, Pollmer U, Koster EP. The influence of early experience with vanillin on food preference later in life. Chemical senses 1999; 24: 465-467.
86. Elston JS, Timms C. Clinical evidence for the onset of the sensitive period in infancy. The British journal of ophthalmology 1992; 76: 327-328.
87. Temple EC, Hutchinson I, Laing DG, Jinks AL. Taste development: differential growth rates of tongue regions in humans. Brain research 2002; 135: 65-70.
88. Beauchamp GK, Moran M. Acceptance of sweet and salty tastes in 2-year-old children.
Appetite 1984; 5: 291-305.
89. Mennella JA, Beauchamp GK. Flavor experiences during formula feeding are related to preferences during childhood. Early human development 2002; 68:71-82
90. MacDonald A, Rylance GW, Asplin DA, Hall K, Harris G, Booth IW. Feeding problems in young PKU children. Acta Paediatrica suppl 1994; 407: 73-74.
91. Still S, Little SA, Pollard C, Bevin S, Hourihane JO’B, Harris G, Warner JO, Dean TP. Comparison of taste preference development between breastfed infants and infants receiving standard, soy, or hydrolysate formulas. Journal of clinical immunology 1996; 240
92. Tiggemann M, Lowes J. Predictors of maternal control over children's eating behaviour. Appetite 2002; 39: 1-7.
93. Klesges RC, Stein RJ, Eck LH, Isbell TR, Klesges LM. Parental influence on food selection in young children and its relationships to childhood obesity. American journal of clinical nutrition 1991; 53: 859-864.
94. Contento IR, Basch C, Shea S, Gutin B, Zybert P, Michela JL, Rips J. Relationship of mothers' food choice criteria to food intake of preschool children: identification of family subgroups. Health education quarterly 1993; 20: 243-259.
95. Fischler C. Learned versus "sponteneous" dietetics: French mothers' views of what children should eat. Social science information 1986; 25: 945-965.
96. Lähteenmäki L, Tuorila H. Attitudes towards sweetness as predictors of liking and use of various sweet foods. Ecology of food and nutrition. 1994; 31: 161-170.

Chapter 1
28
97. Lissau I, Breum L, Sorensen TI. Maternal attitude to sweet eating habits and risk of overweight in offspring: a ten-year prospective population study. International journal of obesity and related metabolic disorders 1993; 17: 125-129.
98. Casey R, Rozin P. Changing children's food preferences: parent opinions. Appetite 1989; 12: 171-182.
99. Meiselman HL, deGraaf C, Lesher LL. The effects of variety and monotony on food acceptance and intake at a midday meal. Physiology and behavior 2000; 70: 119-125.
100. Zandstra EH, De Graaf C, van Trijp HC. Effects of variety and repeated in-home consumption on product acceptance. Appetite 2000; 35 : 113-119.
101. Wardle J, Cooke LJ, Gibson EL, Sapochnik M, Sheiham A, Lawson M. Increasing children's acceptance of vegetables; a randomized trial of parent-led exposure. Appetite 2003; 40: 155-162.
102. Birch LL, McPhee L, Shoba BC, Pirok E, Steinberg L. Looking vs. tasting . Appetite 1987; 9: 171-178.
103. Fisher JO, Birch LL. Restricting access to palatable foods affects children's behavioral response, food selection, and intake. American journal of clinical nutrition 1999; 69: 1264-1272.
104. Fisher JO, Birch LL. Restricting access to foods and children's eating. Appetite 1999; 32: 405-419.


22 Djin Gie Liem
Monica Mars Kees de Graaf
Consistency of sensory testing
with 4-and 5-year-old children
Food quality and preference 2004, 15, pp 541-548

32
Chapter 2
ABSTRACT
Background: Rank-order and paired comparison tests are widely used methods to
assess sensory perception of young children. Small age differences could, however,
influence the ability of children to carry out such tasks.
Objective: This study compared rank-order and paired comparison tests for consistency
in 4- and 5-year-old children.
Design: During four sessions, 22 young adults, 21 4-year-old and 47 5-year-old children
carried out rank-order and paired comparison tests to measure discriminatory ability
(0.22, 0.25, 0.29, 0.34, and 0.39M sucrose in orangeade) and preference (0.14, 0.20,
0.29, 0.42 and 0.61 M sucrose in orangeade).
Results: Young adults and 5-year-old children were able to discriminate between all
solutions and showed a high consistency between the rank-order and pair-wise tests for
discriminatory ability (>76% consistency) and preference (>71% consistency). In
contrast, 4-year-olds detected differences in sweetness during the preference tests, but
failed to distinguish sweetness intensities during the discriminatory ability tests.
Conclusion: The dissimilarity between 4-and 5-year-olds in performing sensory tests
was due to a difference in their cognitive skills rather than their sensory perceptual
differences.
ACKNOWLEDGEMENTS
We acknowledge the participation of the children and teachers of “de Prinsenakker” elementary school.

33
Consistency of sensory testing
INTRODUCTION
Children ranging in age from zero to ten years prefer higher concentrations of sucrose in
foods than adults 1-5
. Furthermore, it has been suggested that children are less sensitive
to sweet taste than adults 4-7
. In order to investigate what children prefer, and which
levels of sweet they are able to discriminate, reliable sensory tests are needed. Tests that
are reliable for adults do not always give reliable information when used with young
children. In general, children tend to answer in the affirmative way, and have less
experience with scales than most adults 8.
Rank-order and paired comparison tests are the two most widely used methods to
measure sensory perception and preferences in young children 9-19
. Most sensory studies
reported in the existing literature, grouped 4- and 5-year-old children together 6;11;14-16
.
However, children in this age range are rapidly changing. Their attention spans lengthen
and their ability to categorize, analyze, and synthesize information rapidly becomes
stronger and more efficient 20
. In the Netherlands, children normally enter kindergarten
at the age of four, therefore it is important to asses differences between 4-and 5-year-
olds.
Sensory taste tests with young children typically consist of two types: preference tests
and discrimination tests. Most studies in children focus on preference rather than
discrimination. Stimuli that are commonly used are not only different in taste, but are
also different in color and appearance (e.g. different fruits, different sandwiches). It has
been suggested that with these stimuli, rank-order and paired comparison tests give
consistent data in young children 12
.
However, it remains unknown whether rank-order and paired comparison tests give
consistent data when the presented stimuli differ only in taste (e.g. orangeade with
different concentrations of sucrose). It is also unknown if rank-order and paired
comparison tests give consistent data when they are used to measure discriminatory
ability in young children (i.e. which stimulus is more sweet) instead of preference.
The present study investigated the consistency between rank-order and paired
comparison tests as measures of discriminatory ability and preference, using stimuli that
differed only in sweetness. Subjects of the study were young adults, 4-year-olds and 5-
year-olds.

34
Chapter 2
METHODS
Subjects
Twenty-one 4-year-old children (4.4 ± 0.3 yrs, 12 girls and 9 boys), 47 5-year-old
children (5.4 ± 0.3 yrs, 23 girls and 24 boys) and 22 young adults (22.6 ± 1.8 yrs, 17
females and 5 males) participated in the study (see Table 1). The children attended a
kindergarten in Bennekom, a village 4 km from Wageningen. Since the research study
took place in October, and children in the Netherlands start kindergarten in September,
the 5-years-olds (second graders) had almost one year more experience with
kindergarten and were present in a greater number than 4-year-olds (first graders). The
young adults were students at Wageningen University (see Table 1).
Table 1 Characteristics of subjects (mean ± sem) kindergarten and young adults
Informed consent for the children were obtained from parents prior to testing. The young
adults filled out the informed consent forms by themselves. Exclusion criteria for
participation were diabetes, sugar restriction in the diet, and presumed allergies for sugar
and/or orange beverages. During the actual taste tests, 2 children were excluded because
they refused to taste the beverages.
The study protocol was approved by the Medical Ethical Committee of the Division of
Human Nutrition of Wageningen University.
Sensory tests
Stimuli
A beverage with orange flavor was used for the discriminatory ability and the preference
tests. The beverages were prepared by dissolving 23 g of orange beverage concentrate
and additional sugar in water for a total volume of 1.0 liter. The concentrate (Lim 7644,
Quest International, Naarden, The Netherlands) was composed of concentrated orange
juice, which contained natural orange flavor (80 ppm/l beverage solute), 4.2% w/v citric
Kindergarten Young adults
4-year-olds 5-year-olds
Sex (female : male) 12:9 23:24 17:5
Age (yrs) 4.4 ± 0.3 5.4 ± 0.3 22.6 ± 1.8
Height (m) 1.1 ± 0.04 1.2 ± 0.04 1.7 ± 0.07
Weight (kg) 18.9 ± 3.5 20.9 ± 2.9 65.1 ± 6.3
BMI (kg/m2) 15.5 ± 2.2 15.5 ± 1.8 21.6 ± 1.9
35
Consistency of sensory testing
acid, 1500 ppm benzoic acid, 4100 ppm ascorbic acid, and 44% w/v sugar (50% sucrose,
25% glucose, and 25% fructose).
Two series of solutions with different concentrations of sucrose (Sundale, Suiker Unie,
Breda) were prepared. Series A, which was used during the preference tests, consisted of
5 stimuli ranging from 0.14M to 0.61M sucrose with a middle concentration of 0.29M
sucrose, and a difference of 44% between adjacent concentrations: 0.14, 0.20, 0.29, 0.42,
and 0.61M sucrose (4.8%, 6.9%, 10.0%, 14.4%, 20.8% w/v sucrose/l solute). Series B,
which was used during the discriminatory ability tests, consisted of 5 geometrically
spaced concentrations ranging from 0.22M to 0.39M sucrose, with a middle
concentration of 0.29M, and a difference of 15% between adjacent concentrations: 0.22,
0.25, 0.29, 0.34, and 0.39M sucrose (7.6%, 8.7%, 10.0%, 11.5%, 13.2% w/v sucrose/l
solute). Similar beverages were previously used by de Graaf and Zandstra 5. About 15
mL of each of the stimuli were offered at room temperature in 25 mL transparent cups.
The beverages were prepared the evening before each session and were stored overnight
at a temperature of 4oC.
Procedure
Paired comparison and rank-order tests were used to measure preference and
discriminatory ability. The children were tested at their kindergarten in a room that was
familiar to them. Each child had personal guidance from an adult, who was trained
beforehand to become familiar with the procedures. The testing room consisted of 10 to
15 low tables, depending on the number of children that were tested at the same time.
The children sat in a circle facing outwards, with an adult in front of them. The adults
faced the middle of the circle.
The sensory tests with the children took place on two days, separated by one day. On the
first day, both the tests for discriminatory ability were carried out. On the second day
both tests for preference were carried out. On both days the paired comparison tests were
followed by the rank-order tests, with a 20-minute pause between both tests. Each test
lasted for about 10 minutes. The subjects were allowed to taste the stimuli as often as
necessary to make a decision.
The young-adults received oral and written instructions. They followed a similar
procedure as the children did. Adults performed all tests during one morning, which
involved two sessions, one session for discriminatory ability and one session for
preference. These two tests took about twenty minutes separated by a 10-minute break.
The adult tests were conducted in the tasting booths of the Wageningen University.
Paired comparison tests for discriminatory ability and preference
During the paired comparison tests, subjects judged 5 stimuli in 10 different pairs. For
the discriminatory ability test, subjects answered the question: “In which beverage did

36
Chapter 2
we put the most sugar?”. Before the discrimination tests began, subjects were told that
the sweet food items contained more sugar than non-sweet food items. Subsequently the
children were asked to name foods with a lot of sugar. All children mentioned sweet
food items. For the preference tests, they were asked: “Which one do you like best?”.
The order of presentation between and within pairs was randomly assigned. Before the
actual taste test began, the subjects were offered a pair of stimuli to become familiar
with the beverages. This pair consisted of the second and the fourth stimuli from the
series that was used during the actual paired comparison tests. The subjects used the sip
and swallow procedure, and took a sip of water between each pair of stimuli.
Rank-order tests- for discriminatory ability and preference
During the rank-order test, subjects divided the stimuli into two categories. For the
discriminatory ability tests, the categories “most sugar” and “least sugar” were
visualized by means of different numbers of sugar cubes. For the preference tests the
categories “most preferred” and “least preferred“ were visualized by means of a “happy
face” and a “sad face”. The procedures resulted in a rank-order from most sweet to least
sweet for the discriminatory ability test, and a rank-order from most preferred to least
preferred for the preference test. For further details see de Graaf and Zandstra 4.
Statistical analyses
Scores for discriminatory ability were calculated based on subjects’ performance of the
discriminatory tasks. A score of 10 indicated that subjects ranked the sweet solutions
from least sweet to most sweet in an errorless fashion. A score of –10 indicated that
subjects ranked the sweet solutions from least sweet to most sweet in the opposite way;
i.e. the highest concentration of sugar was ranked as least sweet, the lowest
concentration of sugar was ranked as most sweet.
Scores for sweet preferences were calculated based on the amount of sugar that was
most preferred. A score of 40 indicated that subjects preferred the highest concentration
of sugar in orangeade. A score of 20 indicated that subjects preferred the lowest
concentration of sugar, see de Graaf and Zandstra 5 for further details).
Pearson correlation coefficients were calculated between the scores of the rank-order
and the paired comparison tests. Friedman analyses of ranks were performed in order to
determine whether subjects were able to discriminate between the different beverages.
For the paired comparisons a rank-order was constructed on the basis of the number of
times subjects chose each solution as most preferred (for preference), or as most sweet
(for discriminatory ability).
In order to compare the results of the rank-order tests with the results of the paired
comparison tests, the data obtained by the rank-order tests were transformed into paired
37
Consistency of sensory testing
comparisons. Consistency between both methods was defined as the percentage of pairs
that was judged to be identical during both tests.
Unpaired t-test tests were applied to determine whether there were differences in
preference and discriminatory ability scores between children and young adults, and
between 4- and 5-year old children. P-values smaller than 0.05 were considered
significant. All summary statistics are expressed as means ± sem.
RESULTS
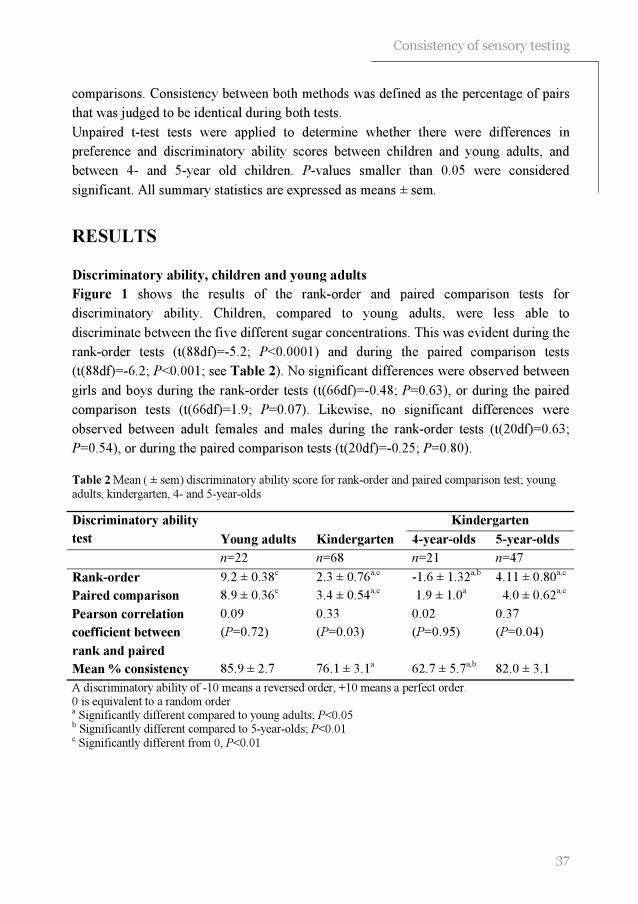
Discriminatory ability, children and young adults
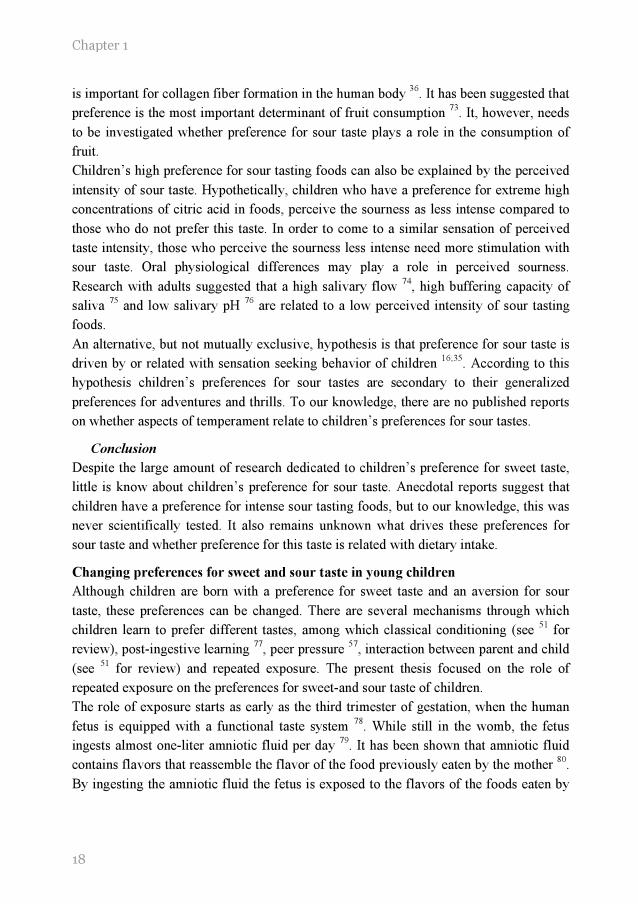
Figure 1 shows the results of the rank-order and paired comparison tests for
discriminatory ability. Children, compared to young adults, were less able to
discriminate between the five different sugar concentrations. This was evident during the
rank-order tests (t(88df)=-5.2; P<0.0001) and during the paired comparison tests
(t(88df)=-6.2; P<0.001; see Table 2). No significant differences were observed between
girls and boys during the rank-order tests (t(66df)=-0.48; P=0.63), or during the paired
comparison tests (t(66df)=1.9; P=0.07). Likewise, no significant differences were
observed between adult females and males during the rank-order tests (t(20df)=0.63;
P=0.54), or during the paired comparison tests (t(20df)=-0.25; P=0.80).
Table 2 Mean ( ± sem) discriminatory ability score for rank-order and paired comparison test; young
adults, kindergarten, 4- and 5-year-olds
A discriminatory ability of -10 means a reversed order, +10 means a perfect order. 0 is equivalent to a random order a Significantly different compared to young adults; P<0.05 b Significantly different compared to 5-year-olds; P<0.01 c Significantly different from 0, P<0.01
Kindergarten Discriminatory ability
test Young adults Kindergarten 4-year-olds 5-year-olds
n=22 n=68 n=21 n=47
Rank-order 9.2 ± 0.38c
2.3 ± 0.76a,c
-1.6 ± 1.32a,b
4.11 ± 0.80a,c
Paired comparison 8.9 ± 0.36c
3.4 ± 0.54a,c
1.9 ± 1.0a
4.0 ± 0.62a,c
Pearson correlation
coefficient between
rank and paired
0.09
(P=0.72)
0.33
(P=0.03)
0.02
(P=0.95)
0.37
(P=0.04)
Mean % consistency 85.9 ± 2.7 76.1 ± 3.1a 62.7 ± 5.7
a,b 82.0 ± 3.1
38
Chapter 2
0.22 0.25 0.29 0.34 0.39
1
2
3
4
5Most sweet
Least swee t
Rank-order
Sucrose concentration in orange beverage (M)
Me
an
ra
nk
ing
nu
mb
er
0.22 0.25 0.29 0.34 0.39
0
1
2
3
4Most swee t
Least swee t
Paired comparison
Sucrose concentration in orange beverage (M)
Nu
mb
er
of
tim
es
ch
os
en
Figure 1 Result of the rank-order test (mean ranking number per solution ± sem) and paired comparison test (mean number of times each solution was chosen as most sweet ± sem) for discriminatory ability, children (●) and young adults (□)
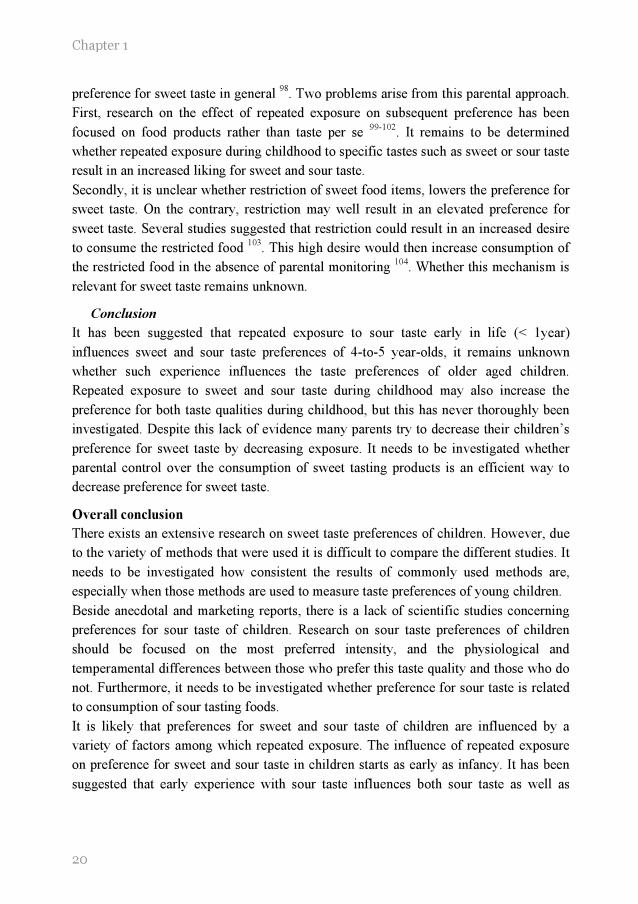
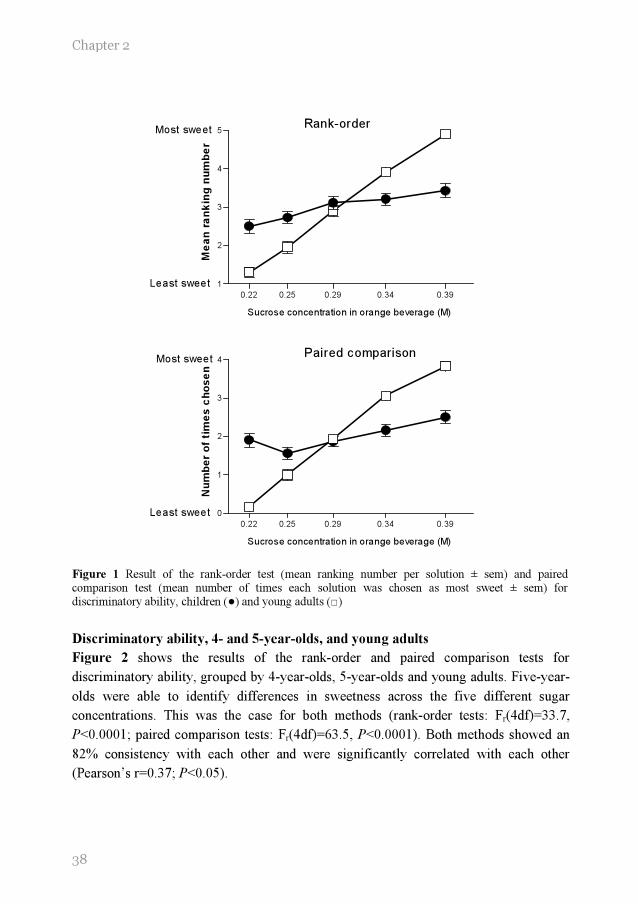
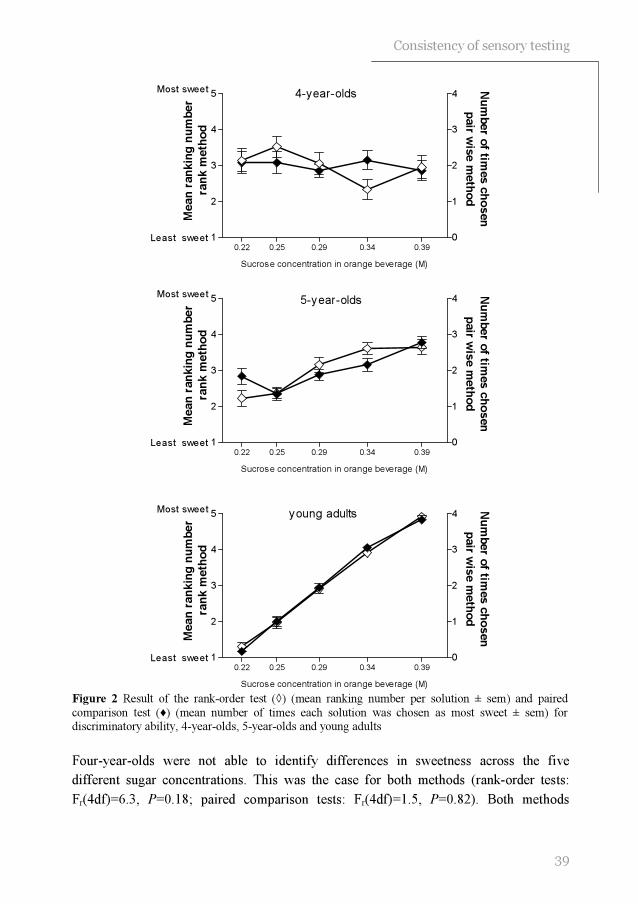
Discriminatory ability, 4- and 5-year-olds, and young adults
Figure 2 shows the results of the rank-order and paired comparison tests for
discriminatory ability, grouped by 4-year-olds, 5-year-olds and young adults. Five-year-
olds were able to identify differences in sweetness across the five different sugar
concentrations. This was the case for both methods (rank-order tests: Fr(4df)=33.7,
P<0.0001; paired comparison tests: Fr(4df)=63.5, P<0.0001). Both methods showed an
82% consistency with each other and were significantly correlated with each other
(Pearson’s r=0.37; P<0.05).
39
Consistency of sensory testing
0.22 0.25 0.29 0.34 0.39
1
2
3
4
5
0
1
2
3
4Most sweet
Least sweet
4-year-olds
Sucrose concentration in orange beverage (M)
Me
an
ran
kin
g n
um
be
r
ran
k m
eth
od
Nu
mb
er o
f times
ch
os
en
pair w
ise
me
tho
d
0.22 0.25 0.29 0.34 0.39
1
2
3
4
5
0
1
2
3
4Most sweet
Least sweet
5-year-olds
Sucrose concentration in orange beverage (M)
Me
an
ran
kin
g n
um
be
r
ran
k m
eth
od
Nu
mb
er o
f times
ch
os
en
pair w
ise m
eth
od
0.22 0.25 0.29 0.34 0.39
1
2
3
4
5
0
1
2
3
4Most sweet
Least sweet
young adults
Sucrose concentration in orange beverage (M)
Me
an
ra
nk
ing
nu
mb
er
ran
k m
eth
od
Nu
mb
er o
f times
ch
os
en
pair w
ise m
eth
od
Figure 2 Result of the rank-order test (◊) (mean ranking number per solution ± sem) and paired
comparison test (♦) (mean number of times each solution was chosen as most sweet ± sem) for discriminatory ability, 4-year-olds, 5-year-olds and young adults
Four-year-olds were not able to identify differences in sweetness across the five
different sugar concentrations. This was the case for both methods (rank-order tests:
Fr(4df)=6.3, P=0.18; paired comparison tests: Fr(4df)=1.5, P=0.82). Both methods

40
Chapter 2
0.14 0.20 0.29 0.42 0.61
1
2
3
4
5Most preferred
Least preferred
Rank-order
Sucrose concentration in orange beverage (M)
Me
an
ra
nk
ing
nu
mb
er
0.14 0.20 0.29 0.42 0.61
0
1
2
3
4Paired comparison
Most preferred
Least preferred
Sucrose concentration in orange beverage (M)
Nu
mb
er o
f t
ime
s c
ho
se
n
showed a 62.7% consistency with each other and were not significantly correlated with
each other (Pearson’s r=0.02; P=0.95).
Young adults were able to identify differences in sweetness across the five different
sugar concentrations (rank-order tests: Fr(4df)=77.9, P<0.0001; paired comparison tests:
Fr(4df)=63.5, P<0.0001). Both methods showed an 86% consistency with each other.
However, there was a low correlation between both tests (Pearson’s r=0.09; P=0.72) (see
Table 2).
Preference, children and young adults
Figure 3 shows the results of the rank-order and paired comparison tests for preference.
Children preferred higher sugar concentrations in orangeade than adults.
Figure 3 Result of the rank-order test (mean ranking number per solution ± sem) and paired comparison test (mean number of times each solution was chosen as most sweet ± sem) for preference, children (●) and young adults (□)

41
Consistency of sensory testing
This was evident in both tests for preference (rank-order tests: (t(88df)=4.2, P<0.0001;
paired comparison tests: t(88df)=5.6, P<0.001). No significant differences were
observed between girls and boys during the rank-order tests (t(66df)=0.70; P=0.50), or
during the paired comparison tests (t(66df)=1.3; P=0.18). Likewise, no significant
differences were observed between adult females and males during the rank-order tests
(t(20df)=2.0; P=0.06), or during the paired comparison tests (t(20df)=1.7; P=0.10).
Preference, 4-and 5-year-olds, and young adults
All subjects could identify differences in preference across the five stimuli (4-year-olds:
rank-order tests: Fr(4df)=12.0, P<0.05; paired comparison tests: Fr(4df)=2.2, P<0.0001-
5-year-olds: rank-order tests: Fr(4df)=47.7, P<0.0001; paired comparison tests:
Fr(4df)=67.4, P<0.0001- young adults: rank-order tests: Fr(4df)=28.4, P<0.0001; paired
comparison tests: Fr(4df)=38.9, P<0.0001; see Table 3). No significant differences in
sweet preference were observed between 4- and 5-year-olds (rank-order tests: t(66df)=-
0.71, P=0.48; paired comparison tests: t(66df)=-0.88, P=0.38).
Five-year-olds and adults, showed a high consistency (young adults: 87.1 ± 2.2; 5-year-
olds: 76.2 ± 3.4) and a significant correlation (5-year-olds: Pearson’s r=0.74, P<0.0001;
young adults: Pearson’s r=0.91, P<0.0001) between both tests for preference.
Four-year-olds showed a 61.2% consistency and no significant correlation between
preference tests (Pearson’s r=0.32; P=0.37; see Table 3). However, both tests showed an
increased preference with an increased concentration of sugar.
Table 3 Mean ( ± sem) preference score for rank-order and paired comparison test; young adults,
kindergarten, 4- and-5-year-olds.
Kindergarten Preference test
Young adults Kindergarten 4-year-olds 5-year-olds
n=22 n=68 n=21 n=47
Rank-order 28.4 ± 1.4
34.9 ± 0.80a 33.8 ± 1.4
a 35.3 ± 1.0
a
Paired comparison
27.7 ± 5.9 35.4 ± 0.7
a 34.6 ± 1.2
a 35.7 ± 0.9
a
Pearson correlation
coefficient between
rank and pair-wise
0.91
(P=0.0001)
0.71
(P=0.0001)
0.32
(P=0.37)
0.83
(P=0.0001)
Mean consistency 87.1 ± 2.2 71.6 ± 3.1a 61.2 ± 6.1
ab 76.2 ± 3.4
a
Minimum=20, maximum=40. The higher this score, the higher the sugar concentration of the most preferred solution a Significantly different compared to young adults; P<0.01 b Significantly difference compared to 5-year-olds, P<0.05

42
Chapter 2
DISCUSSION
The present study suggests that 5-year-old children were able to carry out rank-order and
paired comparison tests for discriminatory ability in a consistent manner. However, 5-
year-olds were less able to discriminate between different sugar concentrations in an
orange drink than adults. Four-year-olds failed to carry out both discriminatory ability
tests in a consistent way. This was in contrast with the tests for preference. In these tests,
young adults and both 4-and-5-year-old children, responded consistently during the
rank-order and paired comparison tests for preference. Furthermore, the present study
suggests that children preferred higher concentrations of sugar in orangeade than adults.
A possible explanation for the lower discriminatory ability of 5-year-olds compared to
adults, is that children analyzed taste mixtures differently 21
. The beverages that were
used in the present study, were mixtures of sucrose and citric acid. Oram and colleagues
suggested that in a mixture of sucrose and citric acid, children only recognize sweetness,
whereas adults have the ability to recognize both tastants 21
. It is possible that children’s
taste system may not be fully developed for processing taste mixtures. This could result
in lower discriminatory ability. In the same line, the use of orange flavor in the present
study may have distracted the children. If this were the case, sensory tests with sugar
water would result in a similar discriminatory ability of children and adults. But, studies
that used sugar water as the test stimulus, have resulted in conflicting results 3;5
. De
Graaf and Zandstra 5 suggested that, similar to sweetened orange drinks, children are less
able to discriminate between different concentrations of sucrose in water than adults.
This is in contrast with Enns and colleagues 3, who found a steeper slope of the
psychophysical function of sucrose for 8-10-year-old children compared to adults. The
latter study, however, used magnitude estimation. The steeper slope could therefore be a
result of a difference in rating behavior. More research is needed to determine whether
the lower discriminatory ability of children is specific to taste mixtures.
It is unlikely that the lower discriminatory ability of 5-year-olds was a result of the
children’s inability to understand the tests. Recall that in the present study, both adults
and 5-year-olds showed a high consistency between the rank-order tests and the paired
comparison tests. Furthermore, our findings are in line with earlier research that found
that young children are less able to discriminate between different sugar solutions 4-6
.
The observed difference in discriminatory ability between 4-and 5-year-old children was
unlikely due to differences in sensitivity for sweet tastes. Although 4-year-olds could not
tell the difference between the highest and lowest concentration of sucrose during the
discriminatory ability test, they consistently preferred the sweeter solution within each
pair.

43
Consistency of sensory testing
Perhaps 4-year-olds were less able to maintain attention than the 5-year-olds 20
.
However, the preference tests, which the 4-year-olds were successfully able to perform,
took the same amount of time as the discriminatory ability tests. The discriminatory
ability tests were supposedly more difficult than the preference tests. In contrast with
tests for preference, in order to perform well during discriminatory ability tests, subjects
had to clearly understand what the researcher meant by the specific dimension (e.g.
sweetness) 22
. The preference tests were fairly intuitive tasks, in which stimuli could be
judged holistically 23
. In other words the discriminatory ability tests required more
cognitive abilities than the preference tests. It has been suggested that 4-and 5-year-old
children are rapidly changing with respect to cognitive abilities 20
. Therefore, four-year-
olds may require more intensive training in order to do well during the discriminatory
ability tests.
In the present study subjects were made more familiar with the task and stimuli by
offering them two solutions from the series that was used. This may not be sufficient for
4-year-olds. Watson and colleagues offered 8-9-year-old children three sweet solutions
with different taste qualities (i.e. sweet, salty, water), and trained them to recognize each
taste quality 24
. They suggest that this procedure overcame cognitive problems some
children had in recognizing tastants in mixtures.
In the present study, the paired comparison and the rank-order tests for preference gave
consistent data for both young adults and 5-year-old children. This is in line with
previous research that used stimuli that were easy to discriminate 9;12;13;16
. The present
study suggests that both methods are also reliable when using stimuli that are difficult to
discriminate. For 4-year -olds, consistency between both tests was lower than for older
children, which is in agreement with previous research 12
. However, in the present study
both tests showed an increase in preference as sweetness increased. This is in line with
the published literature concerning sweet preference in children 1;4;25-30
. It is therefore
concluded, that rank-order as well as paired comparison tests are useful tools to measure
sweet preference in orange beverages for 4-year-olds. The finding that children preferred
higher levels of sweet compared to adults is consistent with the published literature 1-5
.
The findings in the present study need to be viewed with caution. At least six limitations
could have influenced the results of the present study. First, because testing took place at
the beginning of the school year, there were more 5-year-old-children than 4-year-old
children included. More 4-year-olds were expected to enter school during the following
months. It is, however, unlikely that this difference explains our finding. Recall that no
differences between the two age groups were observed for sweet preferences.
Secondly, in the present study only rank-order and paired comparison tests were carried
out. However, the researchers suggest that the present findings can be generalized to
other and more complex indirect scaling methods, such as stair-case method 31;32
and
44
Chapter 2
duo-trio 6. These tests, as well as those investigated in the present study, depend largely
on the subjects’ cognitive abilities.
Thirdly, in the present study only orange beverages were used as test stimuli. It needs to
be determined whether the results of the present study can be replicated by using other
sweet stimuli, such as solid food items.
In the present study the paired comparison tests always preceded the rank-order tests. In
this way subjects could get used to the testing procedures and environment while
performing the paired comparison tests, which were considered to be easier than rank-
order tests. A further limitation of this study is that the order of testing could have
resulted in an order effect. Subjects might have paid less attention to the rank-order tests,
because it was the second test in line. It could be that subjects got less concentrated. This
could have resulted in a higher random error in the outcome of the rank-order tests.
However, the standard errors of the paired comparison and the rank-order tests were
similar.
In the present study the discriminatory ability was measured on day one, whereas
preference was measured on day two, to avoid confusion. If the tests were carried out in
random order, children and the adults who supervised the children could easily have
confused “sweeter” with “more preferred”. Hypothetically, subjects performed better on
the second day, because they obtained experience with sensory testing during the first
day. This could explain why 4-year-olds performed better during the preference tests
than during the discrimination tests.
A sixth limitation of the present study is the way the question during the discrimination
tests was asked; i.e. “In which beverage did we put the most sugar”. Although all
children appeared to understand that large amounts of sugar are present in sweet food
items, the question could potentially have confused 4-year-old children. On the other
hand, visualization of the categories “more sweet” and “less sweet” as done in the
present study, could help these children understand both categories. Printed words could
not be used, because 4-year-olds lack reading skills. Instead, we used more or less lumps
of sugar. In order to match the question with the categories, we asked “In which
beverage did we put the most sugar”.
In conclusion, rank-order and paired comparison tests are not suitable to measure
discriminatory ability in 4-year-old children. These tests are, however, suitable to
measure sweet preferences in these children. This study showed large differences
between 4-and 5-year olds in performing discriminatory ability tests. More research is
needed do develop a reliable tool to measure discriminatory ability in 4-year-old
children.
45
Consistency of sensory testing
REFERENCES
1. Desor JA, Greene LS, Maller O. Preferences for sweet and salty in 9- to 15-year-old and adult
humans. Science 1975; 190: 686-687.
2. Desor JA, Beauchamp GK. Longitudinal changes in sweet preferences in humans. Physiology and behavior 1987; 39: 639-641.
3. Enns MP, Van Itallie TB, Grinker JA. Contributions of age, sex and degree of fatness on preferences and magnitude estimations for sucrose in humans. Physiology and behavior 1979; 22: 999-1003.
4. Zandstra EH, De Graaf C. Sensory perception and pleasantness of orange beverages from childhood to old age. Food quality and preference 1998; 9: 5-12.
5. De Graaf C, Zandstra EH. Sweetness intensity and pleasantness in children, adolescents, and adults. Physiology and behavior 1999; 67: 513-520.
6. Kimmel SA, Sigman-Grant M, Guinard J-X. Sensory testing with young children. Food technology 1994; 48: 92-99.
7. James CE, Laing DG, Oram N, Hutchinson I. Perception of sweetness in simple and complex taste stimuli by adults and children. Chemical senses 1999; 24: 281-287.
8. Guinard J-X. Sensory and consumer testing with children. Food science and technology 2001; 11: 273-283.
9. Birch LL. Dimensions of preschool children's food preferences. Journal of nutrition education
1979; 11: 77-80.
10. Birch LL. The relationship between children's food preferences and those of their parents. Journal of nutrition education 1980; 12: 14-18.
11. Birch LL, Marlin DW. I don't like it; I never tried it: effects of exposure on two-year-old children's food preferences. Appetite 1982; 3: 353-360.
12. Leon F, Marcuz MC, Couronne T, Koster EP. Measuring food liking in children: a comparison of non-verbal methods. Food quality and preference 1999; 10: 93-100.
13. Guthrie CA, Rapoport L, Wardle J. Young children's food preferences: a comparison of three
modalities of food stimuli. Appetite 2000; 35: 73-77.
14. Sullivan SA, Birch LL. Pass the sugar, pass, the salt: experience dictates preference. Developmental psychology 1990; 26: 546-551.
15. Olson CM, Gemmill KP. Association of sweet preference and food selection among four to five year old children. Ecology of food and nutrition. 1981; 11: 145-150.
16. Birch LL. Effects of peer models' food choices and eating behaviors on preschoolers' food preferences. Child development 1980; 51: 489-496.
17. Kroll BJ. Evaluation rating scales for sensory testing with children. Food technology 1990; 44:
78-86.
18. Liem DG, Mennella JA. Sweet and sour preferences during childhood; role of early experiences. Developmental psychobiology 2002; 41: 388-395.

46
Chapter 2
19. Liem DG, Mennella JA. Heightened sour preferences during childhood. Chemical senses 2003; 28: 173-180.
20. Krug EF, Mikus KC. The preschool years. In: Levin MD, Carey WB, Crocker AC, eds. Developmental-behavioral pediatrics, 3rd ed. Philadelphia: Saunders, 1999: 38-50.
21. Oram N, Laing DG, Freeman MH, Hutchinson I. Analysis of taste mixtures by adults and
children. Developmental psychobiology 2001; 38: 67-77.
22. Lawless HT, Heymann H. Discrimination testing. In: Lawless HT, Heymann H, eds. Sensory evaluation of food, New York: Kluwer academic/plenum publishers, 1998: 116-139.
23. Lawless HT, Heymann H. Acceptance and preference testing. In: Lawless HT, Heymann H, eds. Sensory evaluation of food, New York: Kluwer academic/plenum publishers, 1998: 430-479.
24. Watson WL, Laing DG, Hutchinson I, Jinks AL. Identification of the components of taste mixtures by adults and children. Developmental psychobiology 2001; 39: 137-145.
25. Tomita NE, Nadanovsky P, Vieira AL, Lopes ES. Taste preference for sweets and caries
prevalence in preschool children. Revista de saude publica 1999; 33: 542-546.
26. Bellisle F, Dartois AM, Kleinknecht C, Broyer M. Perceptions of and preferences for sweet taste in uremic children. Journal of the American dietetic association 1990; 90: 951-954.
27. Jamel HA, Sheiham A, Watt RG, Cowell CR. Sweet preference, consumption of sweet tea and dental caries; studies in urban and rural Iraqi populations. International dental journal 1997; 47: 213-217.
28. Steiner JE. Facial expressions of the neonate infant indication the hedonics of food-related chemical stimuli. In: Weiffenbach JM, ed. Taste and development: the genesis of sweet
preference, Washington, DC: U.S. Government Printing Office, 1977: 173-188.
29. Beauchamp GK, Cowart BJ. Development of sweet taste. In: Dobbing J, ed. Sweetness, Berlin: Springer-Verlag, 1987: 127-138.
30. Desor JA, Maller O, Turner RE. Taste in acceptance of sugars by human infants. Journal of comparative and physiological psychology 1973; 3: 496-501.
31. Turnbull B, Matisoo-Smith E. Taste sensitivity to 6-n-propylthiouracil predicts acceptance of bitter-tasting spinach in 3-6-y-old children. American journal of clinical nutrition 2002; 76: 1101-1105.
32. Anliker JA, Bartoshuk L, Ferris AM, Hooks LD. Children's food preferences and genetic sensitivity to the bitter taste of 6-n-propylthiouracil (PROP). American journal of clinical nutrition 1991; 54: 316-320.


33 Djin Gie Liem1,2
Julie A Mennella1 Heightened sour preferences
during childhood
1 Monell Chemical Senses Center
Philadelphia, PA, USA
2
Wageningen University, Division of Human Nutrition,
Wageningen Taste & Smell Centre
Wageningen, The Netherlands
Chemical senses, 2003, 28, pp 173-180

Chapter 3
50
ABSTRACT
Background: Basic research has revealed that the chemical sensory world of children is
different from that of adults, as evidenced by their heightened preferences for sweet and
salty tastes. However, little is known about the ontogeny of sour taste preferences,
despite the growing market of extreme sour candies.
Objective: The present study investigated the level of sourness most preferred in a food
matrix and whether the ability to discriminate differences in sour intensity differed
between 5- to 9-year-old children and their mothers.
Design: Preference and discriminatory ability were measured by a rank-by-elimination
procedure embedded in the context of a game. Mothers also completed a variety of
questionnaires and children were asked several questions to assess whether children’s
temperament and food preferences and habits related to sour preferences.
Results: The results indicated that, although every mother and all but two of the children
(92%) were able to rank the gelatins from most to least sour, more than one-third (35%)
of the children, but virtually none of the adults, preferred the high levels of sour taste
(0.25 M citric acid) in gelatin. Those children who preferred the extreme sour tastes
were significantly less food neophobic (P<0.05) and tended to experience a greater
variety of fruits when compared with the remaining children (P=0.11). Moreover, the
children’s preference for sour tastes generalized to other foods, such as candies and
lemons, as reported by both children and mothers.
Conclusion: These findings are the first experimental evidence to demonstrate that sour
taste preferences are heightened during childhood and that such preferences are related
to children’s food habits and preferences. Further research is needed to unfold the
relationship between the level of sour taste preferred and the actual consumption of sour-
tasting foods and flavors in children.
ACKNOWLEDGMENTS
We acknowledge the expert technical assistance of Mr. Brian Pollack and the student apprentices Ms Mayla Henderson and Ms Kelly Walker, whose research apprenticeships were supported by grants from The Annenberg Foundation and Mrs. Patricia Kind. This work was supported by grant HD37119 from the National Institute of Child Health and Human Development.

Heightened sour preferences
51
INTRODUCTION
I will add that formerly it looked to me as if the sense of taste, at least with my
own children when they were still very young, was different from the adult
sense of taste; this shows itself by the fact that they did not refuse rhubarb with
some sugar and milk which is for us an abominable disgusting mixture and by
the fact that they strongly preferred the most sour and tart fruits, as for instance
unripe gooseberries and Holz apples. (Darwin, 1877)1
Charles Darwin keenly observed that children live in different chemical sensory worlds
than adults, as evidenced by their heightened preference for sweet and sour tasting foods 1. Although basic research confirmed his observations on sweet preferences a century
later 2-8
, little scientific investigation has focused on the ontogeny of sour taste
preferences 9;10
. In spite of this paucity of basic research, industry has clearly found a
niche in children for extreme sour candies, which are reported to be quite aversive to
adults 11
.
Some contend that children’s preference for extreme sour tastes is secondary to their
desire for adventure, thrills and excesses 11;12
, of which these products supposedly
provide. To our knowledge, there are no published reports on whether aspects of
temperament or attitudes toward foods, in general, relate to children’s preferences for
sour tastes. However, a study on adults revealed that those who experienced greater
dietary diversity preferred higher levels of sour intensity when compared with food
neophobic adults 13
.
The present study aimed to test the hypotheses that children prefer higher levels of
sourness in foods when compared with adults, and that such preferences are positively
related to their willingness to try new foods and experience with dietary diversity. A
rank-by-elimination and randomized order procedure, embedded in the context of a
game, was used to assess sour preferences as well as the ability to discriminate
differences in sour intensity in 5- to 9-year-old children. The mothers of these children
were also tested using identical procedures in order to determine sour preferences in an
adult population. Mothers also completed a variety of questionnaires and children were
asked whether they had ever tried sour-flavored candies, to determine whether
personality factors, such as temperament and attitudes towards or experience with foods
in general, contribute to preferences for sour taste and flavors.

Chapter 3
52
METHODS
Subjects
Mothers were recruited from advertisements in local newspapers. The mothers (31
Caucasian, 26 African American, 1 Asian and 3 from other ethnic groups) were, on
average, 37.8 ± 0.7 yrs of age, and their children (29 girls, 32 boys) ranged in age from 5
to 9 years (mean=7.4 ± 0.2 years). During a telephone interview, the mother, who was
not informed of the hypothesis of the study, was told that she and her child would
participate in a ‘taste study’ in which they would be asked to taste different flavored
gelatins. Seven additional children began, but did not complete, testing because they
could not understand the task. All children were reported by their mothers to be healthy
at the time of testing. The testing procedures were approved by the Office of Regulatory
Affairs at the University of Pennsylvania. Informed consent was obtained from each
parent and assent was obtained from each child who was eight years of age or older.
General procedures and stimuli
Children and their mothers were individually tested at the Monell Center in a closed
room specifically designed for sensory testing, with a high air-turnover ventilation
system. After subjects acclimated to the room and personnel, we assessed their
preferences for sourness. To this end, four lemon-flavored gelatins were made by either
adding no citric acid (0.00 M) or different concentrations of citric acid (0.02, 0.08 and
0.25M; Sigma Chemical Co., St Louis, MO) to 22 g of a stock gelatin dissolved in 473.2
g of water (JELL-O-., Kraft Foods, Inc., Rye Brook, NY). It should be noted that the
stock gelatin has a sweet taste because it contains ~0.24 M sucrose and 0.30 M glucose
(First Data Bank, Inc, San Bruno, CA). Twenty milliliters of each gelatin was poured
into a 30 mL clear medicine cups (Delaware Valley Surgical Supply, Boothwyn, PA)
and refrigerated for at least 4 h to obtain firmness. During testing, the gelatins were
stored on a tray containing crushed ice.
Preference rankings methods
An age appropriate, game-like task that was fun for children and minimized the impact
of language development was used to examine sour preferences. Using a rank-by-
elimination and randomized ordered procedure 14
, subjects tasted each of the four
gelatins and were asked to point to the one that they liked best. This gelatin was then
removed after which subjects were asked to taste the remaining three gelatins again and
then indicate which of the three was most preferred. This procedure continued until a
rank order preference was established. To determine reliability, subjects were presented,
Heightened sour preferences
53
in counterbalanced order, the gelatins ranked as their two most preferred and were asked
to point to which of the pair they liked best. Subjects rinsed their mouth twice with
bottled water after tasting each gelatin.
Intensity rankings methods
A second test session was conducted ~7.0 ± 0.5 weeks later to determine whether
subjects could distinguish the different intensities of sour taste in the gelatins. We
randomly selected 24 children (10 boys, 14 girls) and their mothers from those who
participated in the first session. Before testing, each subject was trained to distinguish
three of the basic tastes: sweet (0.30M glucose; Sigma), salty (0.30M Na gluconate;
Sigma) and sour (0.01M citric acid; Sigma). Subjects were then given three pairs of
solutions that differed in sour intensity and were asked to focus only on sour taste and to
point to which of the pair tasted more sour, rinsing their mouths twice after tasting each
sample. All subjects were able to perform this task.
After a five-minute break during which subjects were offered an unsalted cracker and a
cup of water to cleanse their palate, they were asked to rank the four gelatins used during
the first session (0.00, 0.02, 0.08 and 0.25M added citric acid) from most to least sour.
The rank-by-elimination procedure was identical to that described above for the
preference test, except here subjects indicated which one tasted most sour. At the end of
the test session, subjects were asked to taste, in counterbalanced order, the least (0.00 M
added citric acid) and the most sour (0.25M added citric acid; hereafter referred to as
‘extreme sour’) gelatin. Immediately after tasting each gelatin, subjects were asked to
respond in the affirmative or negative to the questions: Does this gelatin taste sweet?
Does it taste sour? Subjects rinsed their mouths with water twice between tastings. One
child did not understand the task and therefore was excluded.
Food habits, food neophobia and child temperament measures
Without communicating to the child, mothers completed a series of questionnaires
which included a 10-item scale that measured food neophobia 15
and a eight-item scale
that measured general neophobia in adults 15
, and a 25-item scale that measured five
temperament dimensions (i.e. emotionality, shyness, activity, sociability and negative
reaction to foods in general) in their children 16
. In a few cases, mothers did not answer
all questions and therefore some measures could not be calculated (see Table 1).
Because we were also interested in assessing the children’s reaction to new foods,
mothers were asked to indicate on a 5-point scale (1= not at all characteristic of the
child; 5= very characteristic of the child) their agreement with the statements ‘My child
is afraid to try new foods’ and ‘My child does not trust new foods’ 15
, as well as to
indicate whether they regarded their child as a picky eater and whether they were picky
eaters as children themselves. We also asked each mother whether she thought her child

Chapter 3
54
went ‘through a sour phase’ exhibiting strong preferences for sour candies or raw
lemons. As a first step in investigating whether experience with a variety of sour foods
(e.g. fruits) impacts upon children’s sour preferences, all but six of the mothers indicated
which of the following fruits their child had experienced at home during the past week
(i.e. grapes, bananas, oranges, pineapple, melon, apples, apple sauce, pears, apricots,
raisins and berries). Children were asked directly whether they had ever eaten and
whether they liked extreme sour candies such as Warheads™. (Foreign Candy
Company, Hull, IA); all but three of the children responded to these questions. In
addition, all but one of the children were weighed and measured for height.
Statistical analyses
Sour taste preference and intensity rankings
The null hypothesis tested was that there were no systematic differences in children’s or
mothers’ preference ranking of the four gelatins that differed in citric acid content (i.e.
0.0, 0.02, 0.08 and 0.25M added citric acid). To test this, each of the four gelatins was
ranked according to subject’s preferences (1= most preferred; 4= least preferred). Data
obtained from mothers were analyzed separately from children. Separate Friedman two-
way analyses of ranks were then conducted on these preference ranking scores. Similar
analyses were conducted on the sour intensity ranking scores. When significant, multiple
comparisons were performed to determine which differences among the gelatins were
significant 17
. To test the reliability, identical responses between test and retest were
defined as reflecting guessing if the proportion was below the upper limit of the 95%
confidence interval for 50% correct responses, the latter being the predicted proportion if
subjects were guessing 18
. All summary statistics are expressed as means ± sem and
levels of significance were P<0.05.
To investigate whether there were differences in sour taste preferences between children
and mothers, the frequencies of subjects who classified the extreme sour tasting gelatin
(0.25M added citric acid) as either their most preferred (ranked 1 or 2; hereafter referred
to as High-Sour group) or least preferred (ranked 3 or 4; hereafter referred to as Low-
Sour group) were also determined. Chi-square statistics were then performed to
determine whether children’s preferences differed from adults; the Yates correction for
continuity was applied to all chi-square analyses. To determine whether the children’s
sour preferences were related to their mothers’ sour preferences, Kendall tau correlations
were calculated for each child–mother pair.
Subject demographics, child temperament and food habits
One-way analyses of variance (ANOVA) were conducted to determine whether there
were significant differences between the groups (High-Sour versus Low-Sour) on a
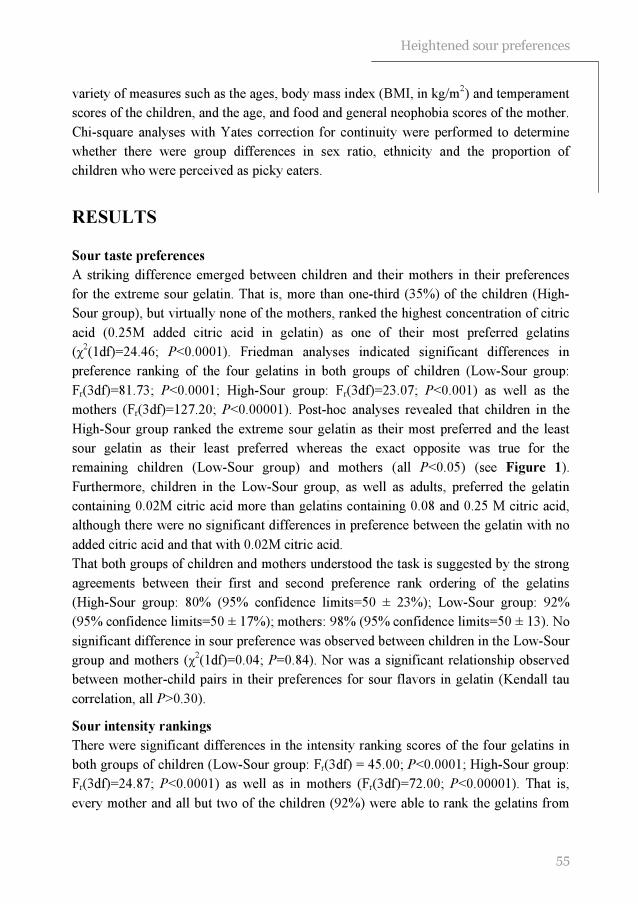
Heightened sour preferences
55
variety of measures such as the ages, body mass index (BMI, in kg/m2) and temperament
scores of the children, and the age, and food and general neophobia scores of the mother.
Chi-square analyses with Yates correction for continuity were performed to determine
whether there were group differences in sex ratio, ethnicity and the proportion of
children who were perceived as picky eaters.
RESULTS
Sour taste preferences
A striking difference emerged between children and their mothers in their preferences
for the extreme sour gelatin. That is, more than one-third (35%) of the children (High-
Sour group), but virtually none of the mothers, ranked the highest concentration of citric
acid (0.25M added citric acid in gelatin) as one of their most preferred gelatins
(χ2(1df)=24.46; P<0.0001). Friedman analyses indicated significant differences in
preference ranking of the four gelatins in both groups of children (Low-Sour group:
Fr(3df)=81.73; P<0.0001; High-Sour group: Fr(3df)=23.07; P<0.001) as well as the
mothers (Fr(3df)=127.20; P<0.00001). Post-hoc analyses revealed that children in the
High-Sour group ranked the extreme sour gelatin as their most preferred and the least
sour gelatin as their least preferred whereas the exact opposite was true for the
remaining children (Low-Sour group) and mothers (all P<0.05) (see Figure 1).
Furthermore, children in the Low-Sour group, as well as adults, preferred the gelatin
containing 0.02M citric acid more than gelatins containing 0.08 and 0.25 M citric acid,
although there were no significant differences in preference between the gelatin with no
added citric acid and that with 0.02M citric acid.
That both groups of children and mothers understood the task is suggested by the strong
agreements between their first and second preference rank ordering of the gelatins
(High-Sour group: 80% (95% confidence limits=50 ± 23%); Low-Sour group: 92%
(95% confidence limits=50 ± 17%); mothers: 98% (95% confidence limits=50 ± 13). No
significant difference in sour preference was observed between children in the Low-Sour
group and mothers (χ2(1df)=0.04; P=0.84). Nor was a significant relationship observed
between mother-child pairs in their preferences for sour flavors in gelatin (Kendall tau
correlation, all P>0.30).
Sour intensity rankings
There were significant differences in the intensity ranking scores of the four gelatins in
both groups of children (Low-Sour group: Fr(3df) = 45.00; P<0.0001; High-Sour group:
Fr(3df)=24.87; P<0.0001) as well as in mothers (Fr(3df)=72.00; P<0.00001). That is,
every mother and all but two of the children (92%) were able to rank the gelatins from
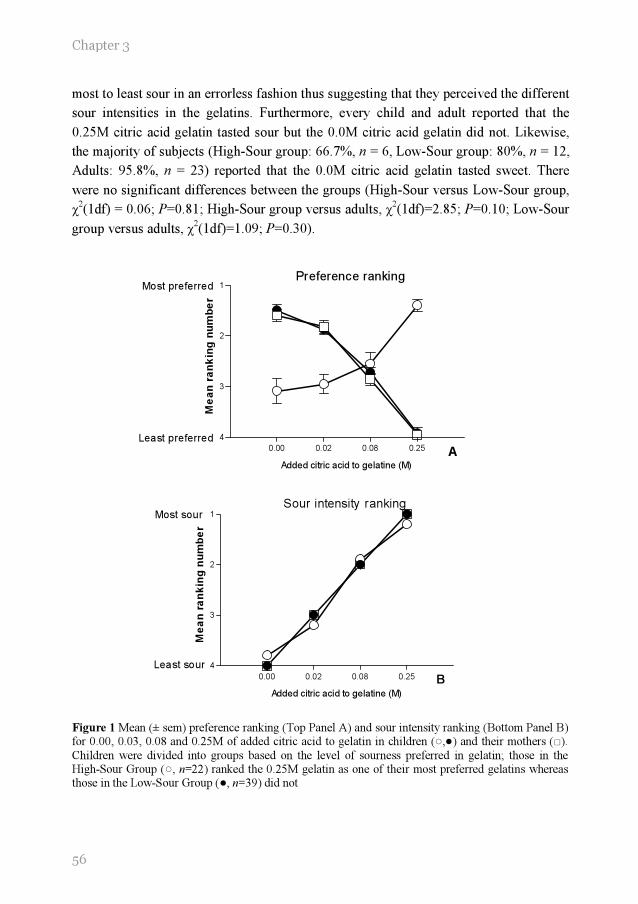
Chapter 3
56
0.00 0.02 0.08 0.25
1
2
3
4
Most preferred
Least preferred
Preference ranking
A
Added citric acid to gelatine (M)
Me
an
ra
nk
ing
nu
mb
er
0.00 0.02 0.08 0.25
1
2
3
4
Most sour
Least sour
Sour intensity ranking
B
Added citric acid to gelatine (M)
Me
an
ra
nk
ing
nu
mb
er
most to least sour in an errorless fashion thus suggesting that they perceived the different
sour intensities in the gelatins. Furthermore, every child and adult reported that the
0.25M citric acid gelatin tasted sour but the 0.0M citric acid gelatin did not. Likewise,
the majority of subjects (High-Sour group: 66.7%, n = 6, Low-Sour group: 80%, n = 12,
Adults: 95.8%, n = 23) reported that the 0.0M citric acid gelatin tasted sweet. There
were no significant differences between the groups (High-Sour versus Low-Sour group,
χ2(1df) = 0.06; P=0.81; High-Sour group versus adults, χ
2(1df)=2.85; P=0.10; Low-Sour
group versus adults, χ2(1df)=1.09; P=0.30).
Figure 1 Mean (± sem) preference ranking (Top Panel A) and sour intensity ranking (Bottom Panel B) for 0.00, 0.03, 0.08 and 0.25M of added citric acid to gelatin in children (○,●) and their mothers (□).
Children were divided into groups based on the level of sourness preferred in gelatin; those in the High-Sour Group (○, n=22) ranked the 0.25M gelatin as one of their most preferred gelatins whereas those in the Low-Sour Group (●, n=39) did not

Heightened sour preferences
57
Subject characteristics, child temperament and food experience
Further analyses were then conducted to determine whether there were significant
differences on any of the measures studied between these High-Sour and Low-Sour
groups of children. Salient characteristics of these two groups of children and their
mothers are listed in the Table. No significant differences between the groups were
observed for the children’s ages (F(1,59df)=0.99; P=0.32), BMI (F(1,58df)=1.28;
P=0.26), proportion of girls to boys (χ2(1df)=0.31; P=0.58) and ethnicity (χ
2(3df)=6.61;
P=0.09); nor was there any difference between the groups in the mothers’ age
(F(1,58df)=0.89; P=0.35), or the mothers’ food neophobia (F(1,59df)=0.74; P=0.39) and
general neophobia (F(1,59df)=1.94; P=0.17) scores.
In addition, there were no significant differences in the children’s temperament
dimensions of shyness (F(1,59df) = 0.25; P=0.162), emotionality (F(1,58df) =0.10;
P=0.75), sociability (F(1,59df)=0.53; P=0.38), activity (F(1,59df)=1.14; P=0.29) or
overall negative reactions to foods (F(1,58df)=0.32; P=0.57). However, mothers of
children in the Low-Sour group were significantly more likely to perceive their child as
a picky eater (χ2(1df)=4.47; P<0.05), and were more likely to agree with the statements
‘My child is afraid to try new foods’ (F(1,56df)=5.11; P<0.05) and ‘My child does not
trust new foods’ (F(1,56df)=6.02; P<0.05) when compared with those in the High-Sour
group.
In addition, mothers who reported that their child was a picky eater tended to be more
likely to report that they themselves were considered picky eaters when they were
children (χ2(1df)=3.41; P<0.06). Furthermore, mothers who were considered picky
eaters when they were children were more likely to be food neophobic as adults
(F(1,57df)=10.68; P<0.001) when compared with mothers who were not considered
picky eaters as children.
Those children who preferred the extreme sour flavor in gelatins, as assessed in the
laboratory, were significantly more likely to report not only that they had tried sour
candies (χ2(1df)=4.65; P=0.03), but they liked their taste as well (χ
2(1df)=7.02;
P<0.008). That such sour preferences generalized to other foods is suggested by the
findings that mothers of children in the High-Sour group were significantly more likely
to report that their child had gone, or was going through, a phase of preferring sour
foods such as lemons or candies (χ2(1df)=3.76; P<0.05), and tended to report that, at
least in the home, their child experienced a larger variety of fruits during the last week
when compared with the Low-Sour group (F(1,53df)=2.59; P<0.11).
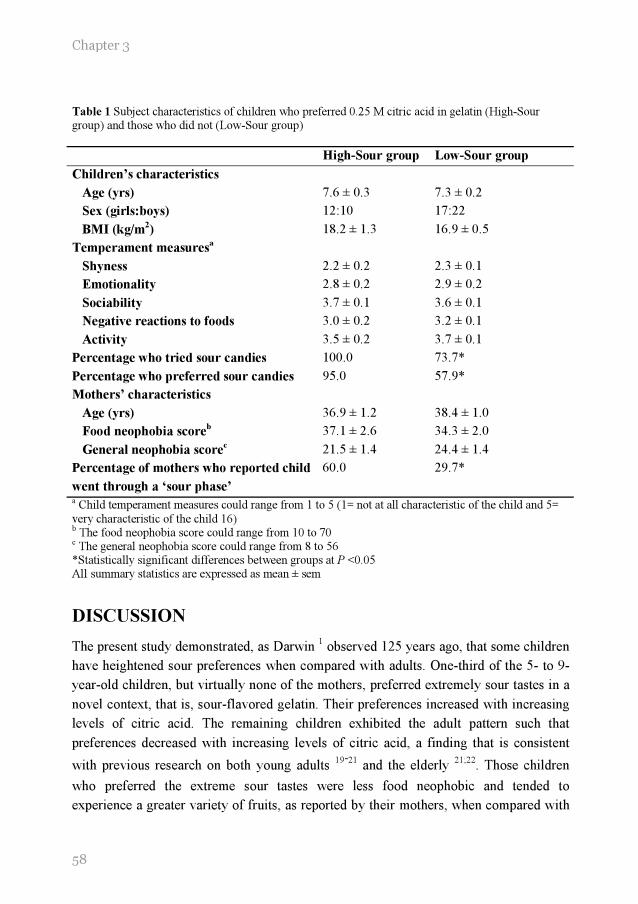
Chapter 3
58
Table 1 Subject characteristics of children who preferred 0.25 M citric acid in gelatin (High-Sour group) and those who did not (Low-Sour group)
High-Sour group Low-Sour group
Children’s characteristics
Age (yrs) 7.6 ± 0.3 7.3 ± 0.2
Sex (girls:boys) 12:10 17:22
BMI (kg/m2) 18.2 ± 1.3 16.9 ± 0.5
Temperament measuresa
Shyness 2.2 ± 0.2 2.3 ± 0.1
Emotionality 2.8 ± 0.2 2.9 ± 0.2
Sociability 3.7 ± 0.1 3.6 ± 0.1
Negative reactions to foods 3.0 ± 0.2 3.2 ± 0.1
Activity 3.5 ± 0.2 3.7 ± 0.1
Percentage who tried sour candies 100.0 73.7*
Percentage who preferred sour candies 95.0 57.9*
Mothers’ characteristics
Age (yrs) 36.9 ± 1.2 38.4 ± 1.0
Food neophobia scoreb 37.1 ± 2.6 34.3 ± 2.0
General neophobia scorec 21.5 ± 1.4 24.4 ± 1.4
Percentage of mothers who reported child
went through a ‘sour phase’
60.0 29.7*
a Child temperament measures could range from 1 to 5 (1= not at all characteristic of the child and 5=
very characteristic of the child 16) b The food neophobia score could range from 10 to 70 c The general neophobia score could range from 8 to 56 *Statistically significant differences between groups at P <0.05 All summary statistics are expressed as mean ± sem
DISCUSSION
The present study demonstrated, as Darwin 1 observed 125 years ago, that some children
have heightened sour preferences when compared with adults. One-third of the 5- to 9-
year-old children, but virtually none of the mothers, preferred extremely sour tastes in a
novel context, that is, sour-flavored gelatin. Their preferences increased with increasing
levels of citric acid. The remaining children exhibited the adult pattern such that
preferences decreased with increasing levels of citric acid, a finding that is consistent
with previous research on both young adults 19-21
and the elderly 21;22
. Those children
who preferred the extreme sour tastes were less food neophobic and tended to
experience a greater variety of fruits, as reported by their mothers, when compared with

Heightened sour preferences
59
the remaining children. Moreover, the children’s preferences for sour tastes generalized
to other foods, such as candies and lemons, as reported by both children and mothers,
and were not related to their mothers’ sour taste preferences.
Three hypotheses, not mutually exclusive, could account for the differences in sour
preferences within children and between children and adults. First, perhaps children who
preferred the extreme sour taste could not discriminate between the different sour
gelatins when compared with the other children and adults 23
. However, this seems
highly unlikely for several reasons. First, the vast majority of the children were able to
rank the gelatins from most to least sour in an errorless fashion. Secondly, children’s
ranking of the gelatins from most to least preferred was found to be a reliable measure,
regardless of the level of sour most preferred. Thirdly, children, like adults, recognized
the sour taste components in a complex food matrix such as gelatin. Nevertheless,
additional research is needed to determine whether the two groups of children perceived
sour tastes differently 6;24
.
A second hypothesis, and one that is popular in the marketing field, is that children’s
preferences for sour tastes are secondary to their generalized preferences for adventure
and thrills 11;12
. To our knowledge, there is no scientific basis for such claims. It is
unknown whether children who have heightened preferences for sour tastes generalize
this preference to other senses, such as vision (e.g. bright colors) and hearing (e.g. loud
noises), or other tastes (e.g. sweet). However, previous research in our laboratory
revealed that preference for extreme sour taste in children was not related to heightened
sweet preferences 25
. Although the present study did not measure thrill-seeking behavior
or sensory reactivity per se, children who preferred extreme sour tastes did not differ
significantly from the other children in a variety of temperament dimensions, such as
shyness, emotionality or sociability. What appears to be significant is the degree of
adventure as it relates to new foods, however. That is, like adults 13
, children who
preferred extreme sour tastes were less food neophobic and less likely to be perceived as
picky eaters by their mothers.
Perhaps individuals who are less food neophobic were more likely to experience
extremely sour foods and, after repeated exposure, developed preferences for such
flavors 26-28
. Consistent with this suggestion is the finding that children who preferred
the extreme sour tastes in the gelatin (High-Sour group) were significantly more likely to
try extreme sour candy such as Warheads™., and to report that they liked the flavor of
these candies when compared with the Low-Sour group. Therefore, we hypothesize that
children who preferred extreme sour tastes are not only more likely to try extreme sour
foods but they continue to eat such foods and subsequently develop a preference for
extremely sour flavors.

Chapter 3
60
This hypothesis is consistent with previous research on adults 19
and children 25;29
that
revealed that repeated exposure to sour flavors may lead to subsequent preferences.
Children who were fed a formula that has a sour and bitter flavor component (i.e. protein
hydrolysate formulas) during their infancy preferred sour-flavored juices significantly
more than did children who were not exposed to such formulas 29
. Because no
differences were observed in their sweet preferences, the effect of early experience
appeared to be specific to sour tastes. Of interest is the finding that Indian laborers,
whose diet consists of many sour foods, such as tamarind fruits, preferred higher levels
of citric acid in water when compared with those living in Western populations whose
diet had less of an emphasis on sour foods 19
.
The present study revealed that children who preferred extreme sour candies such as
Warheads™ were significantly more likely to prefer the extreme sour tastes in gelatins.
It should be noted that the methods used to assess preference for gelatins (i.e. rank-by-
elimination procedures) are limited because the determined level of preferences is
relative to the other stimuli presented. However, we emphasize that children in the High-
Sour group also reported that they preferred a variety of other sour-flavored food items
thus suggesting that these children indeed preferred sour taste.
Whether the heightened sour preference for these sour tasting candies and food exhibited
in one-third of the children decreases with age is unknown. Nor do we know whether the
preference for sour tastes is due to repeated exposure to these extreme sour candies,
which were introduced into the American market during the past decade 11
. However,
Darwin’s description of his children’s preference for tart apples 1 and the report by
mothers in the present study that their children went through a sour phase (e.g. preferred
lemons) suggest that the heightened sour preferences during childhood can be expressed
via a variety of sour-tasting foods, not just candies.
An alternative explanation is that the effects of experience with sour foods may be
secondary to effects of experience with dietary diversity since the present study also
revealed that children who preferred extreme sour tastes tended to experience a larger
variety of fruits. Of interest is the recent finding that children who are food neophobic
consume a diet consisting of less dietary variety when compared with children who do
not exhibit such behavior 30;31
. That dietary diversity enhances acceptance of new foods
has been demonstrated in human infants 32
as well as animal models 33
. In young
children, dietary diversity is determined, in part, by the availability of foods provided by
their caretakers and dietary patterns and attitudes towards foods are largely influenced
by mothers 34;35
. In particular, fruit and vegetable intake by young children is positively
related to parental fruit and vegetable intake 35
. The present study revealed that mothers,
who reported being picky eaters as children, tended to view their own children as picky
eaters and food neophobic. Whether such mothers are providing less dietary diversity,

Heightened sour preferences
61
which, in turn, is related to their children’s sour preferences and consumption of sour
tasting foods, is unknown.
A third, and not mutually exclusive, hypothesis is that there are ontogenic changes in
taste perception, independent of experience, that underlie the heightened sour
preferences in some children. Responsiveness to salt and sweet tastes provides perhaps
the clearest example of a developmental change to taste stimuli that occurs postnatally 4;36;37
. Although human newborns are indifferent to salt taste, preference for salt emerges
at ~4–6 months of age, remains heightened throughout childhood and adolescence, and
then decreases to levels resembling that of the adult during late adolescence 4. The shift
from indifference to preference is thought to be largely unlearned and due to postnatal
maturation of central and/or peripheral mechanisms underlying salt taste perception, as
suggested in animal model studies 38
. Like salt taste, preferences for sweet tastes remain
heightened during infancy and childhood and decrease to levels resembling that of the
adult during late adolescence 36
. That heightened sweet preferences during development
has been observed in animal model studies 39
suggested that experience with sweets
during ontogeny cannot exclusively account for this decline in sweet preference 36
.
Although the mechanisms underlying these age-related changes in sweet and salt
preferences during late adolescence remain unknown, we suggest that similar age-related
changes may be occurring for sour taste in some children. In adults, the perception of
sour is related, but not exclusively, to pH and salivary flow 40-42
. That is, adults with
high salivary flow rates and pH rated sour stimuli consistently more intense when
compared with those with lower salivary flow rates and pH 42
. This elevation in
perceived intensity is presumably due to the greater contrast between the pH of the
stimulus and individual’s salivary pH. Whether the enhanced sour preferences observed
in some children is related to differences in these physiological measures remains to be
determined. Moreover, longitudinal studies on sour preferences, like those conducted on
the ontogeny of sweet and salt taste preferences, are needed.
The findings of the present study further support the contention that children are living
in different chemical sensory worlds when compared with each other as well as to
adults. Such differences in sensory preferences may play a role in acceptance of and
preference for certain foods and flavors. Previous research suggests that sensory
preferences and experiences with foods are better predictors of fruit and vegetable
consumption in children than the foods’ nutritional content or social value 43
.
Consideration of the relationship between the level of sour taste preferred and actual
consumption of sour-tasting foods and flavors is an important area for future research.
Chapter 3
62
REFERENCES
1. Darwin C. Biographiche skizze eines kleinen kindes. Kosmos 1877; 367-376.
2. Peiper A. Cerebral function in infancy and childhood. New York: Consultants bureau, 1963
3. Nisbett RE, Gurwitz SB. Weight, sex and the eating behavior of human newborns. Journal of comparative and physiological psychology 1970; 73: 245-253.
4. Desor JA, Greene LS, Maller O. Preferences for sweet and salty in 9- to 15-year-old and adult humans. Science 1975; 190: 686-687.
5. Desor JA, Beauchamp GK. Longitudinal changes in sweet preferences in humans. Physiology and behavior 1987; 39: 639-641.
6. Enns MP, Van Itallie TB, Grinker JA. Contributions of age, sex and degree of fatness on
preferences and magnitude estimations for sucrose in humans. Physiology and behavior 1979; 22: 999-1003.
7. Maller, O. and Desor, JA. Effect of taste on ingestion by human newborns. Bosmam, J. F. Fourth symposium on oral sensation and perception: development of the fetus and infant. NIH 73-546, 279-291. 1973. Washington, DC, Government printing office.
8. Steiner JE. Facial expressions of the neonate infant indication the hedonics of food-related chemical stimuli. In: Weiffenbach JM, ed. Taste and development: the genesis of sweet preference, Washington, DC: U.S. Government Printing Office, 1977: 173-188.
9. Desor JA, Maller O, Andrews K. Ingestive responses of human newborns to salty, sour, and
bitter stimuli. Journal of comparative and physiological psychology 1975; 89: 966-970.
10. Zandstra EH, De Graaf C. Sensory perception and pleasantness of orange beverages from childhood to old age. Food quality and preference 1998; 9: 5-12.
11. Frauenfelder M. Gross National Product. Wired Archive 1999; 7.06.
12. Urbick B. About kids: food and beverages. Surrey: Leatherhead publishing, 2000
13. Frank RA, van der Klauw NJ. The contribution of chemosensory factors to individual differences in reported food preferences. Appetite 1994; 22: 101-123.
14. Birch LL. Dimensions of preschool children's food preferences. Journal of nutrition education
1979; 11: 77-80.
15. Pliner P, Loewen ER. Temperament and food neophobia in children and their mothers. Appetite 1997; 28: 239-254.
16. Pliner P, Hobden K. Development of a scale to measure the trait of food neophobia in humans. Appetite 1992; 19: 105-120.
17. Siegel S, Castellan NJ. The case of k related samples. In: Siegel S, Castellan NJ, eds. Nonparametric statistics, 2nd ed. Boston: Mc Graw Hill, 1988: 168-189.
18. Snedecor GW, Cochran WG. The binomial distribution. In: Snedecor GW, Cochran WG, eds.
Statistical methods, Iowa State University Press, 1989: 107-134.
19. Moskowitz HW, Kumaraiah V, Sharma KN, Jacobs HL, Sharma SD. Cross-cultural differences in simple taste preferences. Science 1975; 190: 1217-1218.

Heightened sour preferences
63
20. Moskowitz HR, Kumraiah V, Sharma KN, Jacobs HL, Sharma SD. Effects of hunger, satiety and glucose load upon taste intensity and taste hedonics. Physiology and behavior 1976; 16: 471-475.
21. Chauhan J, Hawrysh ZJ. Suprathreshold sour taste intensity and pleasantness perception with age. Physiology and behavior 1988; 43: 601-607.
22. Murphy C, Withee J. Age-related differences in the pleasantness of chemosensory stimuli. Psychology and aging 1986; 1: 312-318.
23. Oram N, Laing DG, Freeman MH, Hutchinson I. Analysis of taste mixtures by adults and children. Developmental psychobiology 2001; 38: 67-77.
24. James CE, Laing DG, Oram N. A comparison of the ability of 8-9-year-old children and adults to detect taste stimuli. Physiology and behavior 1997; 62: 193-197.
25. Liem DG, Mennella JA. Sweet and sour preferences during childhood; role of early experiences. Developmental psychobiology 2002; 41: 388-395.
26. Birch LL, Marlin DW. I don't like it; I never tried it: effects of exposure on two-year-old
children's food preferences. Appetite 1982; 3: 353-360.
27. Birch LL, Gunder L, Grimm-Thomas K. Infants' consumption of a new food enhances acceptance of similar foods. Appetite 1998; 30: 283-295.
28. Pliner P, Stallberg-White C. "Pass the ketchup, please": familiar flavors increase children's willingness to taste novel foods. Appetite 2000; 34: 95-103.
29. Mennella JA, Beauchamp GK. Flavor experiences during formula feeding are related to preferences during childhood. Early human development 2002; 68:71-82
30. Falciglia GA, Couch SC, Gribble LS, Pabst SM, Frank R. Food neophobia in childhood
affects dietary variety. Journal of the American dietetic association 2000; 100: 1474-1481.
31. Carruth BR, Skinner J, Houck K, Moran J, Coletta F, Ott D. The phenomenon of "picky eater": a behavioral marker in eating patterns of toddlers. Journal of the American college of nutrition 1998; 17: 180-186.
32. Gerrish CJ, Mennella JA. Flavor variety enhances food acceptance in formula-fed infants. The American journal of clinical nutrition 2001; 73: 1080-1085.
33. Capretta PJ, Petersik JT, Stewart DJ. Acceptance of novel flavours is increased after early experience of diverse tastes. Nature 1975; 254: 689-691.
34. Klesges RC, Stein RJ, Eck LH, Isbell TR, Klesges LM. Parental influence on food selection in young children and its relationships to childhood obesity. American journal of clinical nutrition 1991; 53: 859-864.
35. Fisher JO, Mitchell DC, Smiciklas-Wright H, Birch LL. Parental influences on young girls' fruit and vegetable, micronutrient, and fat intakes. Journal of the American dietetic association 2002; 102: 58-64.
36. Beauchamp GK, Cowart BJ. Development of sweet taste. In: Dobbing J, ed. Sweetness, Berlin: Springer-Verlag, 1987: 127-138.
37. Mennella JA. Taste and smell. In: Swaiman KF, Ashwall, eds. Pediatric neurology: Principles and practice, 3rd ed. Philadelphia, PA: CV Mosby Company, 1999: 104-113.
38. Hill DL, Mistretta CM. Developmental neurobiology of salt taste sensation. Trends in neurosciences 1990; 13: 188-195.

Chapter 3
64
39. Bertino M, Wehmer F. Dietary influence on the development of sucrose acceptability in rats. Developmental psychobiology 1981; 14: 19-28.
40. Christensen CM, Brand JG, Malamud S. Salivary changes in solution pH: a source of individual differences in sour taste perception. Physiology and behavior 1987; 40: 221-227.
41. Spielman AI. Interaction of saliva and taste. Journal of dental research 1990; 69: 838-843.
42. Norris MB, Noble AC, Pangborn RM. Human saliva and taste responses to acids varying in anions, titratable acidity, and pH. Physiology and behavior 1984; 32: 237-244.
43. Resnicow K, Davis-Hearn M, Smith M, Baranowski T, Lin LS, Baranowski J, Doyle C,
Wang DT. Social-cognitive predictors of fruit and vegetable intake in children. Health psychology 1997; 16: 272-276
.


44 Djin Gie Liem
Annemarie Westerbeek Sascha Wolterink
Frans J Kok Kees de Graaf
Sour taste preferences of
children relates to preferences
for novel and intense stimuli
Chemical senses, in press

Chapter 4
68
ABSTRACT
Background: Previous research suggested that some children have a preference for sour
tastes. The origin of this preference remains unclear.
Objective: We investigated whether preference for sour tastes is related to a difference
in rated sour intensity due to physiological properties of saliva, or to an overall
preference for extreme (i.e. bright colors) and new stimuli.
Design: Eighty-nine 7-to-12-year old children carried out a rank-order procedure for
preference and category scale for perceived intensity for 4 gelatines (i.e. 0.0, 0.02, 0.08,
and 0.25M added citric acid) and 4 yellow cards that differed in brightness. In addition
we measured their willingness to try a candy with an unknown flavor, their salivary flow
and the buffering capacity of their saliva.
Results: Fifty-eight of the children tested preferred one of the two most sour gelatines.
These children had a higher preference for the brightest color (P<0.05) and were more
likely to try the candy with the unknown flavor (P<0.001) than children who did not
prefer the extreme sour gelatines. Preference for sour taste was not related with
differences in rated sour intensity, however those who preferred sour taste had a higher
salivary flow (P<0.05).
Conclusion: A substantial part of young children have a preference for extreme sour
taste. This appears to be related to the willingness to try unknown foods and preference
for intense visual stimuli. Further research is needed to investigate how these findings
can be implemented in the promotion of sour tasting foods such as fruit
ACKNOWLEDGEMENTS
We acknowledge the expert advice of Drs Lina Engelen, Rene de Wijk and Jon Prinz and the
assistance of the teachers and students of the Jena Jozef school and Johan Friso school in Wageningen.

69
Sour taste: novel- and intense stimuli
INTRODUCTION
The food choices of children in industrialized countries are an important determinant of
the development of obesity during childhood 1;2
. Children’s food choices are for the
most part determined by their taste preferences 3-8
.
Since the late sixties researchers try to understand the sensory-taste world of young
children 9. In the past four decades the investigations were mainly focused on sweet- ,
salt- and more recently bitter taste (see 10
for a review). However, little research focused
on preferences for sour taste. Darwin (1877) already noted that his children had a
preference for this taste quality 11
. A systematic scientific investigation of sour taste
preferences of children, however, has not been carried out until recently. To our
knowledge Liem and Mennella 8 were the first to show that a substantial part of the
children (5-to 9-year-olds) they tested had a preference for high concentrations of citric
acid in gelatin, which were perceived as extremely sour by their parents.
The basis of these sour taste preferences remains unknown. One hypothesis is that
children who have a preference for high concentrations of citric acid in foods, rate this
as less sour compared to those who do not prefer these concentrations of citric acid. In
order to come to a similar sensation, those who rate a lower intensity need more
stimulation of sour taste. In adults it has been suggested that a high salivary flow 12
, high
buffering capacity of saliva 13
and low salivary pH 14
are related to a low rated intensity
of sour tasting foods.
An alternative, but not mutually exclusive hypothesis, is that preference for sour taste is
secondary to their desire for adventures, thrills and excesses 15;16
. In this view,
preferences for sour taste might be related to preferences for unfamiliar foods and
intense stimuli perceived by other senses such as vision (e.g. bright colors). More
general, preference for sour taste might be related to an overall thrill seeking behavior.
Research suggests that this behavior is reflected by the rise in cortisol after encountering
a challenging or stressful situation. That is, the increase in cortisol concentration in
saliva, shortly after encountering a challenging or stressful situation, is larger for thrill-
seekers compared with non-trill-seekers 17-19
.
The present study had two main objectives. First, we investigated whether children who
preferred sour taste, rated sourness as less intense. This might be due to a high salivary
flow, a high buffering capacity of saliva and/or a low salivary pH. Secondly, we
investigated whether children who preferred sour taste were more likely to prefer intense
colors, are more likely to try new foods and/or are more thrill seekers in general, than
those who do not prefer this taste.
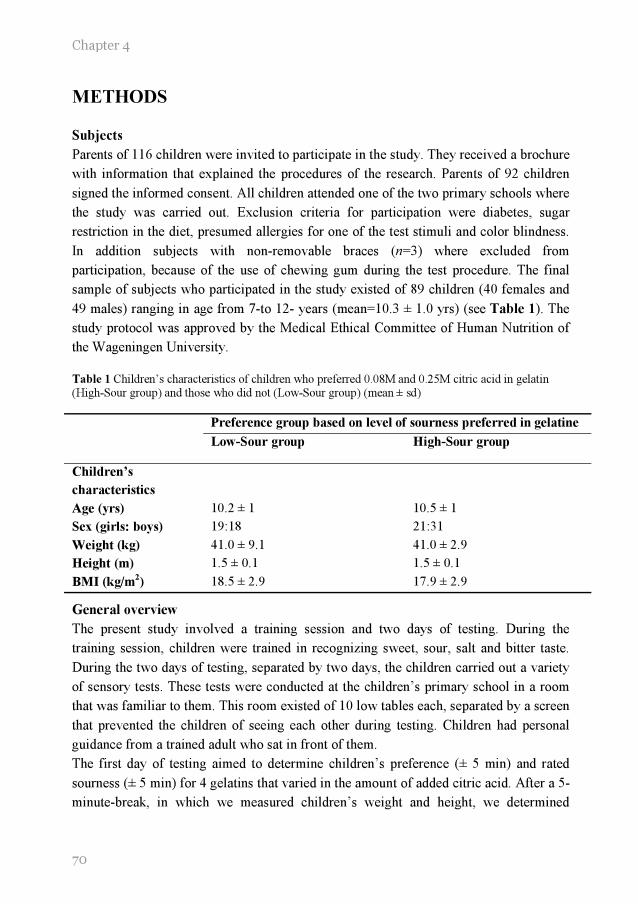
Chapter 4
70
METHODS
Subjects
Parents of 116 children were invited to participate in the study. They received a brochure
with information that explained the procedures of the research. Parents of 92 children
signed the informed consent. All children attended one of the two primary schools where
the study was carried out. Exclusion criteria for participation were diabetes, sugar
restriction in the diet, presumed allergies for one of the test stimuli and color blindness.
In addition subjects with non-removable braces (n=3) where excluded from
participation, because of the use of chewing gum during the test procedure. The final
sample of subjects who participated in the study existed of 89 children (40 females and
49 males) ranging in age from 7-to 12- years (mean=10.3 ± 1.0 yrs) (see Table 1). The
study protocol was approved by the Medical Ethical Committee of Human Nutrition of
the Wageningen University.
Table 1 Children’s characteristics of children who preferred 0.08M and 0.25M citric acid in gelatin (High-Sour group) and those who did not (Low-Sour group) (mean ± sd)
Preference group based on level of sourness preferred in gelatine
Low-Sour group High-Sour group
Children’s
characteristics
Age (yrs) 10.2 ± 1 10.5 ± 1
Sex (girls: boys) 19:18 21:31
Weight (kg) 41.0 ± 9.1 41.0 ± 2.9
Height (m) 1.5 ± 0.1 1.5 ± 0.1
BMI (kg/m2) 18.5 ± 2.9 17.9 ± 2.9
General overview
The present study involved a training session and two days of testing. During the
training session, children were trained in recognizing sweet, sour, salt and bitter taste.
During the two days of testing, separated by two days, the children carried out a variety
of sensory tests. These tests were conducted at the children’s primary school in a room
that was familiar to them. This room existed of 10 low tables each, separated by a screen
that prevented the children of seeing each other during testing. Children had personal
guidance from a trained adult who sat in front of them.
The first day of testing aimed to determine children’s preference (± 5 min) and rated
sourness (± 5 min) for 4 gelatins that varied in the amount of added citric acid. After a 5-
minute-break, in which we measured children’s weight and height, we determined
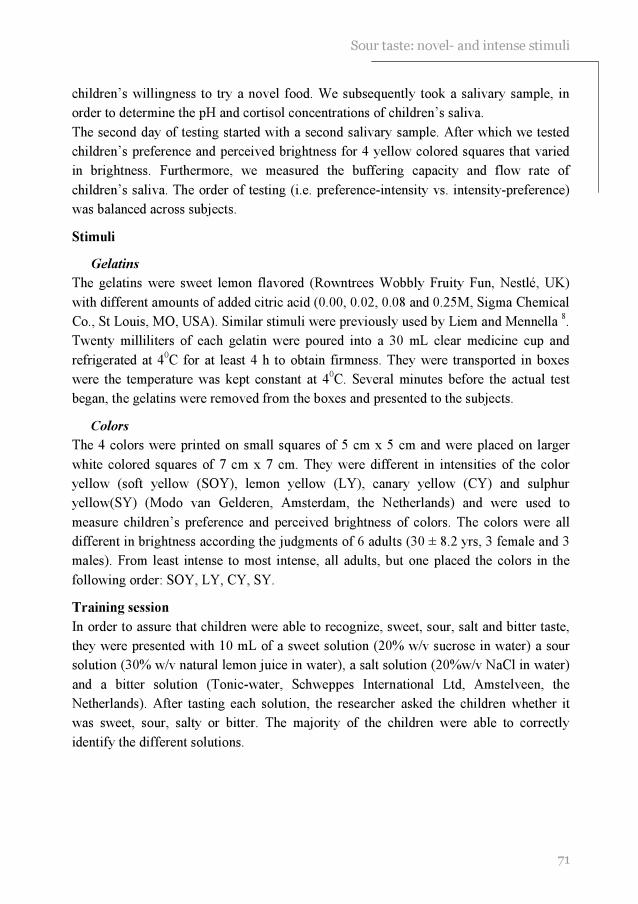
71
Sour taste: novel- and intense stimuli
children’s willingness to try a novel food. We subsequently took a salivary sample, in
order to determine the pH and cortisol concentrations of children’s saliva.
The second day of testing started with a second salivary sample. After which we tested
children’s preference and perceived brightness for 4 yellow colored squares that varied
in brightness. Furthermore, we measured the buffering capacity and flow rate of
children’s saliva. The order of testing (i.e. preference-intensity vs. intensity-preference)
was balanced across subjects.
Stimuli
Gelatins
The gelatins were sweet lemon flavored (Rowntrees Wobbly Fruity Fun, Nestlé, UK)
with different amounts of added citric acid (0.00, 0.02, 0.08 and 0.25M, Sigma Chemical
Co., St Louis, MO, USA). Similar stimuli were previously used by Liem and Mennella 8.
Twenty milliliters of each gelatin were poured into a 30 mL clear medicine cup and
refrigerated at 40C for at least 4 h to obtain firmness. They were transported in boxes
were the temperature was kept constant at 40C. Several minutes before the actual test
began, the gelatins were removed from the boxes and presented to the subjects.
Colors
The 4 colors were printed on small squares of 5 cm x 5 cm and were placed on larger
white colored squares of 7 cm x 7 cm. They were different in intensities of the color
yellow (soft yellow (SOY), lemon yellow (LY), canary yellow (CY) and sulphur
yellow(SY) (Modo van Gelderen, Amsterdam, the Netherlands) and were used to
measure children’s preference and perceived brightness of colors. The colors were all
different in brightness according the judgments of 6 adults (30 ± 8.2 yrs, 3 female and 3
males). From least intense to most intense, all adults, but one placed the colors in the
following order: SOY, LY, CY, SY.
Training session
In order to assure that children were able to recognize, sweet, sour, salt and bitter taste,
they were presented with 10 mL of a sweet solution (20% w/v sucrose in water) a sour
solution (30% w/v natural lemon juice in water), a salt solution (20%w/v NaCl in water)
and a bitter solution (Tonic-water, Schweppes International Ltd, Amstelveen, the
Netherlands). After tasting each solution, the researcher asked the children whether it
was sweet, sour, salty or bitter. The majority of the children were able to correctly
identify the different solutions.

Chapter 4
72
Preference test
The preferences for the different gelatins and colors were measured with a rank-by-
elimination procedure 8. Subjects tasted the four gelatins in a randomized order after
which the researcher asked: “Which one do you like most?”. The children could either
tell or point at the gelatin that was most preferred. This was then removed after which
subjects were asked to taste the remaining three gelatins again. Subsequently the
researcher asked: “Which one of these three do you like most?”. This procedure
continued until a rank-order of preference was established. In order to determine
reliability children were asked to rank the four gelatins again according to their
preference. After tasting each gelatin, subjects drank a sip of water. The same procedure
was followed for the four different colors, with the difference that subjects did not drink
a sip of water after each stimulus.
The results of the rank-order test gave insight in how the different gelatins were
preferred relative to each other. In order to have a direct measurement of preference,
subjects were presented with two pictures, a smiley face and sad face. The researcher
told the children the following: “I am going to give you one gelatin. If you like the taste
I want you to give it to “smiley face”. If you do not like the taste, I want you to give it to
“sad face””. Subsequently the researcher gave the children the gelatin with no added
citric acid. After tasting each gelatin the subjects drank a sip of water
Rated sourness/ brightness test
During a child friendly game children were presented with each of the four gelatins in a
randomized order. Children rated each gelatin on perceived sourness by using a 5-point-
category scale. The 5 categories were labeled with, “not sour at all”, “a little bit sour”,
“sour”, “very sour”, and “extremely sour”. Before the actual test began, the researcher
explained the game by explaining each category of the 5-point scale. After subjects rated
the four gelatins on perceived sourness, the gelatin with 0.08 M added citric acid was
presented again in order to determine consistency of the test. A similar procedure was
followed for the four different colors. The 5-point category scale was now labeled, “not
bright at all”, “a little bit bright”, “bright”, “very bright”, “extremely bright”. In order to
test consistency the color CY was presented twice.
Willingness to try a novel food
In order to test children’s willingness to try a novel food, children were presented with
three identical white opaque cups in a randomized order. The cups were labeled with ‘z’,
‘y’ and ‘x’ and placed up side down. The researcher explained the test by saying:
“Under each cup a candy is hidden. Each candy had its own taste. Under cup ‘z’ a
candy with a strawberry flavor is hidden, under cup ‘y’ a candy with a raspberry flavor
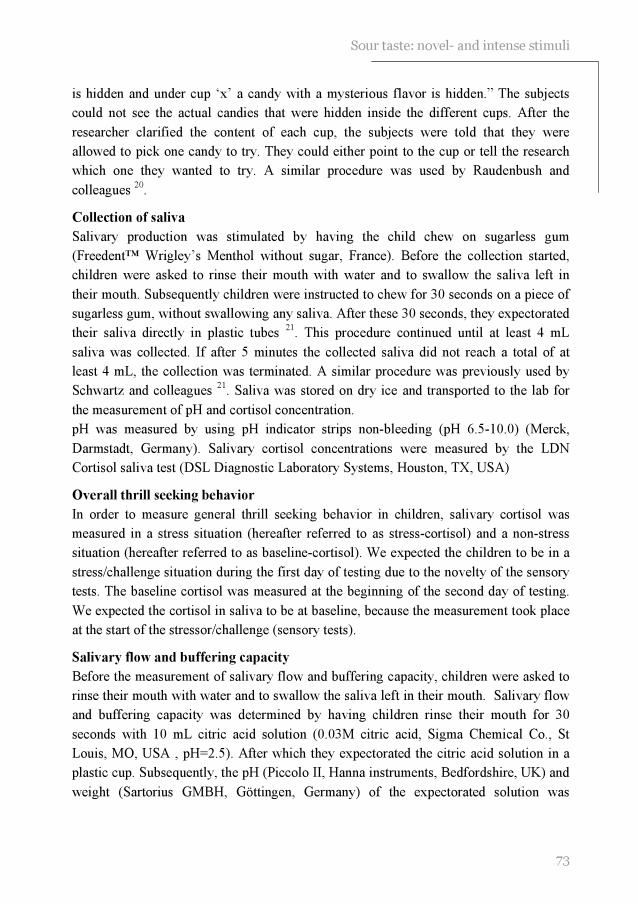
73
Sour taste: novel- and intense stimuli
is hidden and under cup ‘x’ a candy with a mysterious flavor is hidden.” The subjects
could not see the actual candies that were hidden inside the different cups. After the
researcher clarified the content of each cup, the subjects were told that they were
allowed to pick one candy to try. They could either point to the cup or tell the research
which one they wanted to try. A similar procedure was used by Raudenbush and
colleagues 20
.
Collection of saliva
Salivary production was stimulated by having the child chew on sugarless gum
(Freedent™ Wrigley’s Menthol without sugar, France). Before the collection started,
children were asked to rinse their mouth with water and to swallow the saliva left in
their mouth. Subsequently children were instructed to chew for 30 seconds on a piece of
sugarless gum, without swallowing any saliva. After these 30 seconds, they expectorated
their saliva directly in plastic tubes 21
. This procedure continued until at least 4 mL
saliva was collected. If after 5 minutes the collected saliva did not reach a total of at
least 4 mL, the collection was terminated. A similar procedure was previously used by
Schwartz and colleagues 21
. Saliva was stored on dry ice and transported to the lab for
the measurement of pH and cortisol concentration.
pH was measured by using pH indicator strips non-bleeding (pH 6.5-10.0) (Merck,
Darmstadt, Germany). Salivary cortisol concentrations were measured by the LDN
Cortisol saliva test (DSL Diagnostic Laboratory Systems, Houston, TX, USA)
Overall thrill seeking behavior
In order to measure general thrill seeking behavior in children, salivary cortisol was
measured in a stress situation (hereafter referred to as stress-cortisol) and a non-stress
situation (hereafter referred to as baseline-cortisol). We expected the children to be in a
stress/challenge situation during the first day of testing due to the novelty of the sensory
tests. The baseline cortisol was measured at the beginning of the second day of testing.
We expected the cortisol in saliva to be at baseline, because the measurement took place
at the start of the stressor/challenge (sensory tests).
Salivary flow and buffering capacity
Before the measurement of salivary flow and buffering capacity, children were asked to
rinse their mouth with water and to swallow the saliva left in their mouth. Salivary flow
and buffering capacity was determined by having children rinse their mouth for 30
seconds with 10 mL citric acid solution (0.03M citric acid, Sigma Chemical Co., St
Louis, MO, USA , pH=2.5). After which they expectorated the citric acid solution in a
plastic cup. Subsequently, the pH (Piccolo II, Hanna instruments, Bedfordshire, UK) and
weight (Sartorius GMBH, Göttingen, Germany) of the expectorated solution was

Chapter 4
74
measured. A similar procedure was previously used by Dawes and colleagues 22
. The
buffering capacity of saliva was defined as:
Statistical analyses
Sour taste preference and rated intensity
Subjects were divided into two groups based on their sour preferences. Subjects who
classified at least one of the two most sour gelatins as their most preferred or second
most preferred were grouped in the High-Sour group. The remaining subjects were
grouped in the Low-Sour group. Reliability of the preference test for gelatins was
defined as: the percentage of subjects that were grouped in the High-or Low-Sour group
based on the first and the second preference ranking. Chi-squares were conducted to
determine differences between the two group in the distribution of boys and girls, and
differences in preference during the direct measurement of preference. Student t-tests
were used to determine differences in age, height, weight, bmi. Wilcoxon analyses (Z)
were conducted to determine differences between the first and the second intensity
ratings for sour taste. Separate Friedman two-way analyses of ranks were performed to
determine differences between the High- and Low-Sour group in intensity rank-order.
When significant, multiple comparisons were carried out to determine which differences
were significant 23
. Student t-tests determined differences in salivary pH, salivary flow
rate and buffering capacity of saliva.
Sour taste preference, color preferences and thrill seeking behavior
Reliability for the preference test for colors was defined as: the percentage who
preferred the brightest color the same during the first and the second ranking. Wilcoxon
analyses (Z) were conducted to determine differences between the first and the second
intensity ratings for color. Mann-Whithney U tests were performed to determine
differences in preference for the 4 colors, between the High-and Low-Sour group. Chi-
squares were conducted to determine differences in children’s willingness to try a novel
food. Log transformation were applied to the cortisol concentration in order to normalize
the data. Student t-tests were carried out to determine differences in cortisol
concentrations. All summary statistics are expressed as means ± sd.
rinsing beforesolution volume- rinsingafter solution volume
rinsing before pH - rinsingafter pH
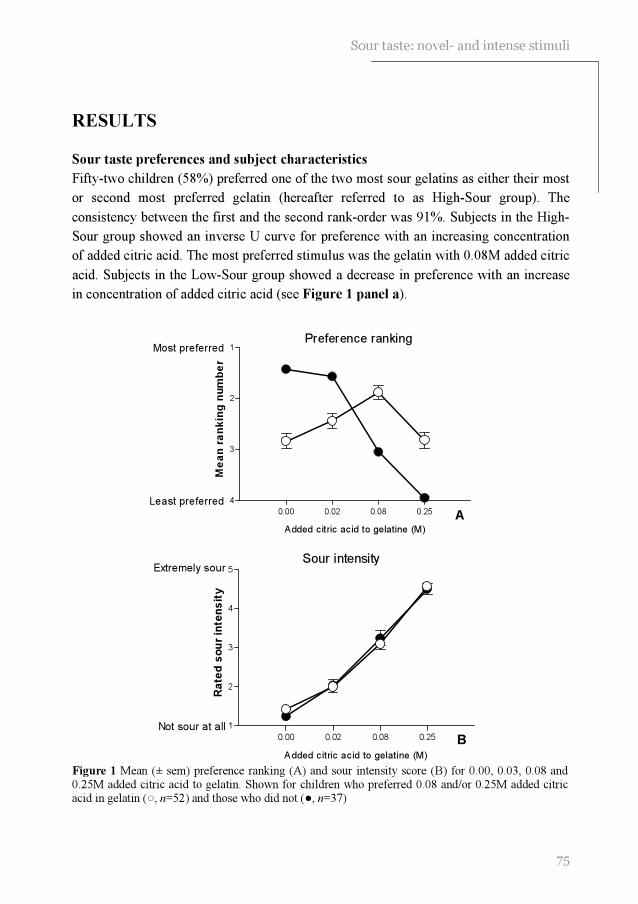
75
Sour taste: novel- and intense stimuli
0.00 0.02 0.08 0.25
1
2
3
4
Most preferred
Least preferred
Preference ranking
A
Added citric acid to gelatine (M)
Me
an
ra
nk
ing
nu
mb
er
0.00 0.02 0.08 0.25
1
2
3
4
5Extremely sour
Not sour at all
Sour intensity
B
Added citric acid to gelatine (M)
Ra
ted
so
ur
inte
ns
ity
RESULTS
Sour taste preferences and subject characteristics
Fifty-two children (58%) preferred one of the two most sour gelatins as either their most
or second most preferred gelatin (hereafter referred to as High-Sour group). The
consistency between the first and the second rank-order was 91%. Subjects in the High-
Sour group showed an inverse U curve for preference with an increasing concentration
of added citric acid. The most preferred stimulus was the gelatin with 0.08M added citric
acid. Subjects in the Low-Sour group showed a decrease in preference with an increase
in concentration of added citric acid (see Figure 1 panel a).
Figure 1 Mean (± sem) preference ranking (A) and sour intensity score (B) for 0.00, 0.03, 0.08 and 0.25M added citric acid to gelatin. Shown for children who preferred 0.08 and/or 0.25M added citric acid in gelatin (○, n=52) and those who did not (●, n=37)
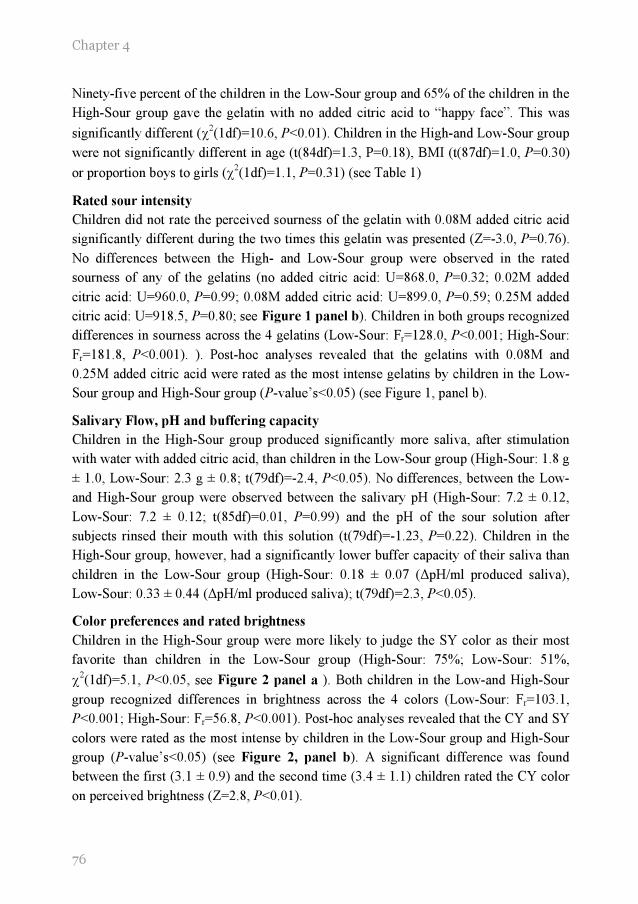
Chapter 4
76
Ninety-five percent of the children in the Low-Sour group and 65% of the children in the
High-Sour group gave the gelatin with no added citric acid to “happy face”. This was
significantly different (χ2(1df)=10.6, P<0.01). Children in the High-and Low-Sour group
were not significantly different in age (t(84df)=1.3, P=0.18), BMI (t(87df)=1.0, P=0.30)
or proportion boys to girls (χ2(1df)=1.1, P=0.31) (see Table 1)
Rated sour intensity
Children did not rate the perceived sourness of the gelatin with 0.08M added citric acid
significantly different during the two times this gelatin was presented (Z=-3.0, P=0.76).
No differences between the High- and Low-Sour group were observed in the rated
sourness of any of the gelatins (no added citric acid: U=868.0, P=0.32; 0.02M added
citric acid: U=960.0, P=0.99; 0.08M added citric acid: U=899.0, P=0.59; 0.25M added
citric acid: U=918.5, P=0.80; see Figure 1 panel b). Children in both groups recognized
differences in sourness across the 4 gelatins (Low-Sour: Fr=128.0, P<0.001; High-Sour:
Fr=181.8, P<0.001). ). Post-hoc analyses revealed that the gelatins with 0.08M and
0.25M added citric acid were rated as the most intense gelatins by children in the Low-
Sour group and High-Sour group (P-value’s<0.05) (see Figure 1, panel b).
Salivary Flow, pH and buffering capacity
Children in the High-Sour group produced significantly more saliva, after stimulation
with water with added citric acid, than children in the Low-Sour group (High-Sour: 1.8 g
± 1.0, Low-Sour: 2.3 g ± 0.8; t(79df)=-2.4, P<0.05). No differences, between the Low-
and High-Sour group were observed between the salivary pH (High-Sour: 7.2 ± 0.12,
Low-Sour: 7.2 ± 0.12; t(85df)=0.01, P=0.99) and the pH of the sour solution after
subjects rinsed their mouth with this solution (t(79df)=-1.23, P=0.22). Children in the
High-Sour group, however, had a significantly lower buffer capacity of their saliva than
children in the Low-Sour group (High-Sour: 0.18 ± 0.07 (∆pH/ml produced saliva),
Low-Sour: 0.33 ± 0.44 (∆pH/ml produced saliva); t(79df)=2.3, P<0.05).
Color preferences and rated brightness
Children in the High-Sour group were more likely to judge the SY color as their most
favorite than children in the Low-Sour group (High-Sour: 75%; Low-Sour: 51%,
χ2(1df)=5.1, P<0.05, see Figure 2 panel a ). Both children in the Low-and High-Sour
group recognized differences in brightness across the 4 colors (Low-Sour: Fr=103.1,
P<0.001; High-Sour: Fr=56.8, P<0.001). Post-hoc analyses revealed that the CY and SY
colors were rated as the most intense by children in the Low-Sour group and High-Sour
group (P-value’s<0.05) (see Figure 2, panel b). A significant difference was found
between the first (3.1 ± 0.9) and the second time (3.4 ± 1.1) children rated the CY color
on perceived brightness (Z=2.8, P<0.01).
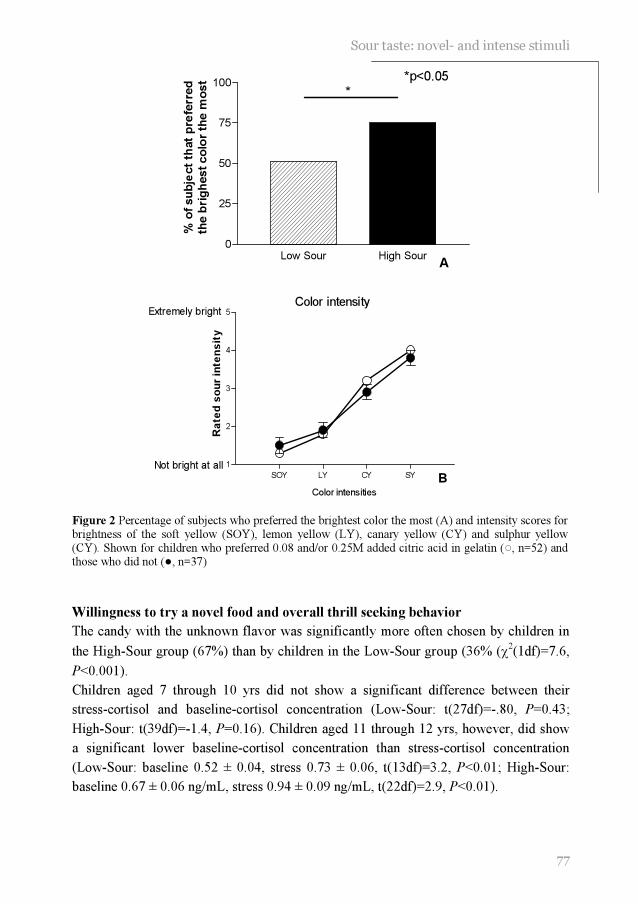
77
Sour taste: novel- and intense stimuli
Low Sour High Sour0
25
50
75
100*
*p<0.05
% o
f subje
ct
that
pre
ferr
ed
the b
righ
est colo
r th
e m
ost
A
SOY LY CY SY
1
2
3
4
5Extremely bright
Not bright at all
Color intensity
B
Color intensities
Ra
ted
so
ur
inte
ns
ity
Figure 2 Percentage of subjects who preferred the brightest color the most (A) and intensity scores for brightness of the soft yellow (SOY), lemon yellow (LY), canary yellow (CY) and sulphur yellow (CY). Shown for children who preferred 0.08 and/or 0.25M added citric acid in gelatin (○, n=52) and those who did not (●, n=37)
Willingness to try a novel food and overall thrill seeking behavior
The candy with the unknown flavor was significantly more often chosen by children in
the High-Sour group (67%) than by children in the Low-Sour group (36% (χ2(1df)=7.6,
P<0.001).
Children aged 7 through 10 yrs did not show a significant difference between their
stress-cortisol and baseline-cortisol concentration (Low-Sour: t(27df)=-.80, P=0.43;
High-Sour: t(39df)=-1.4, P=0.16). Children aged 11 through 12 yrs, however, did show
a significant lower baseline-cortisol concentration than stress-cortisol concentration
(Low-Sour: baseline 0.52 ± 0.04, stress 0.73 ± 0.06, t(13df)=3.2, P<0.01; High-Sour:
baseline 0.67 ± 0.06 ng/mL, stress 0.94 ± 0.09 ng/mL, t(22df)=2.9, P<0.01).

Chapter 4
78
Children in the Low- and High-Sour group were not statistically different with respect to
baseline-cortisol (0.69 ± 0.38 ng/mL vs. 0.74 ± 0.46 ng/mL; t(85df)=-1.5, P=0.60) or
stress-cortisol (0.69 ± 0.35 ng/mL vs. 0.81 ± 0.39 ng/mL; t(87df)=-1.5, P=0.14). The
difference between baseline-cortisol and stress-cortisol concentration was also not
different between the Low-Sour group and the High-Sour group (t(35df)=0.15, P=0.88).
DISCUSSION
The results of the present study suggest that young children’s preference for sour taste is
more likely to be related to behavioral determinants than differences in rated sourness as
measured with a 5-point category scale. Salivary flow may play a role in the preference
for sour taste, but a high salivary flow is not related to large differences in rated sourness
in children who prefer this taste.
In the present study preferences for sour taste were measured by a rank-by-elimination
procedure. Previous research showed that this is a reliable method to measure taste
preferences of young children 24;25
. Moreover, children in the present study showed a
high consistency between the two times they rank-ordered the gelatins according to their
preference. The finding that a substantial part of the children tested (58%) had a
preference for high concentrations of citric acid in gelatin, is in line with a previous
study 8. In the present study sour taste was defined as gelatins with added citric acid
concentrations of 0.08 or 0.25M. In general children rated these gelatins between sour
and extremely sour. It is likely that those who preferred sour taste during our sensory
tests also preferred this taste outside the testing environment, as suggested by previous
research 8;26
. This could be beneficial for the consumption of citrus fruit, which are in
general high in vitamin C content. In the present study children, who preferred sourness
in gelatins, appeared not to prefer the gelatins with no added citric acid. Supposedly,
these gelatins were too bland in taste for those who preferred sour taste.
As shown in the present study, preference for sour taste was not related to a difference in
rated sour intensity as measured with a 5-point category scale. The consistency between
the first and second time subjects rated the gelatin with 0.08 added citric acid on
perceived sourness, suggests the consistency of the testing procedure. Moreover, in
general children rated the gelatins as more sour as citric acid content increased. We
hypothesize that children in the High- and Low-Sour group not only rated the sour
intensity similar, but also perceived the sour intensity similar. This is supported by the
similarity of the pH of children’s expectorated sour solutions. However, due to the
methodology used in the present study to measure sour intensity, such hypothesis can
not be confirmed. We can not assure that the adjectives used in our 5-point scale mean
the same to all the children. Children in the High-sour group (preference for extreme

79
Sour taste: novel- and intense stimuli
sour taste) may judge a stimulus as extremely sour at lower perceived intensities than
children in the Low-Sour group. Children in the High-sour group may have been limited
in their responses by the scale and anchors that were used. Differences might have
occurred when we used the label magnitude estimation scale with the anchors “not sour
at all” and “most extreme sour ever tasted”, but it needs to be determined whether such
procedure is reliable when testing young children. Future research is needed to
determine whether children who prefer sour taste, perceived it as less intense compared
with children who do not prefer this taste.
Despite the similarity in rated sourness, as measured with a 5-point category scale,
children in the High-Sour group had a higher salivary flow than children in the Low-
Sour group. Initially, we hypothesized that high salivary flow would be related to a
lower rated sourness, due to the dilution of the citric acid and the large amount of
buffering agents 12
. However, as shown by the present study, the high salivary flow of
children who preferred sour taste was not related to large differences in rated sourness.
Previous investigations on the relationship between salivary flow rate and perceived
taste intensity gave conflicting results. Some suggest that high salivary flow rates are
related to a lower perceived intensity 12
, whereas Norris and colleagues suggested the
opposite 14
. Others, however, did not observe any relationship 13;27-29
. Hypothetically, the
saliva of children in the High-Sour group had a lower buffering capacity per mL saliva
compared with saliva of children in the Low-Sour group. This could explain why no
differences were found in the rated sourness between the High- and Low-Sour group
despite the differences in salivary flow. This hypothesis can, however, not be fully
confirmed by the present study, because buffering capacity was not measured by means
of titration.
It is more likely that preference for sour taste is related to children’s general preference
for intense and new stimuli. In the present study children who preferred sour taste were
more willing to try a novel food than children who did not prefer this taste. A previous
study suggests that parents of children who preferred sour taste were less likely to report
that their child was afraid to try new foods 8. Pliner and Loewen showed that children
who were willing to try a novel food were less shy and emotional compared with those
who were reluctant to try a novel food 30
.
Children in the High-Sour group were also more likely to prefer a bright color as shown
in the present study. Previous studies demonstrated that bright colors are more preferred
by people with extrovert temperament than by people with an introvert temperament 31
.
It needs to be noted that a significant difference was observed between the first time and
the second time children rated the CY color on perceived brightness. It is unlikely that
children were not able to carry out the test. Recall that children rated the colors in the
same order of intensity as adults did. The difference between the first and the second

Chapter 4
80
rating of the color CY, could be a result of an order effect. The duplo was always
presented last.
We suggest that children in the High-Sour group were more likely to be sensation
seekers than children in the Low-Sour group. But, children in the High-Sour group and
the Low-Sour group did not differ in overall sensation seeking behavior as measured by
salivary cortisol. Studies by Gunnar suggest that surgent temperament (e.g. extrovert,
sensation seeking) in children was related to a high reactivity of cortisol in reaction to a
stressor 17-19
. The lack of difference between the High- and Low-Sour group in the
reactivity of cortisol in the present study can be explained by at least three hypotheses.
First, especially in young children may experienced stress at the baseline measurement.
Children were aware when testing was supposed to take place, this could have resulted
in a stress response even before the actual testing began. This could explain why no
differences in the reactivity of cortisol were measured in the young children. However,
previous research indicated that baseline salivary cortisol concentrations of young
children are most likely between 0.7ng/mL- 3.7 ng/mL 17-19;32;34
. In the present study,
salivary cortisol concentrations in response to our ‘stress’ situation were on average
between 0.73 ng/mL and 0.9 ng mL. A second hypothesis is therefore that the ‘stress’
situation in our study did not initiate real stress. In order for the “cortisol” system to
respond, the situation must be perceived as potentially threatening 19
. A third hypothesis
is that the cortisol concentration was not correctly measured. Cortisol, as well as other
hormones in the body, follow a circadian rhythm. In general cortisol levels peak during
the early morning and decreases during the afternoon 17;35;33
. In the present study stress-
cortisol was measured during the late afternoon, whereas baseline-cortisol was measured
during early afternoon. The circadian rhythm of cortisol concentration could potentially
have diminished the difference between stress-and baseline cortisol levels.
Although the results of the present study are in favor of the behavioral determinants in
the development of sour taste preferences, it cannot be excluded that the biological
development of sense of taste play a role as well. Previous research suggested that the
development of preferences for sweet and salt taste, are influenced by biological
determinants such as energy requirement (sweet taste) 34
and postnatal maturation of
central and/or peripheral mechanisms (salt taste) 35
. It remains unknown whether similar
mechanisms are important in the development of preference for sour taste.
It has been suggested that children who prefer sour taste, experienced a large variety of
fruit 8. Preference for sour taste could therefore play an important role in the
consumption of sour tasting fruits. Increasing preference for sour taste of children who
initially do not like sour taste, is most likely to succeed if the sour food is not presented
as novel and exciting. Children who do not prefer sour taste, should carefully be
introduced to this taste quality. Subsequent repeated exposure could than slowly increase

81
Sour taste: novel- and intense stimuli
the preference for sour taste and hypothetically increase the consumption of sour fruits.
This, however, needs to be investigated.
REFERENCES
1. Ricketts CD. Fat preferences, dietary fat intake and body composition in children. European journal of clinical nutrition 1997; 51: 778-781.
2. Ludwig DS, Peterson KE, Gortmaker SL. Relation between consumption of sugar-sweetened
drinks and childhood obesity: a prospective, observational analysis. Lancet 2001; 357: 505-508.
3. Olson CM, Gemmill KP. Association of sweet preference and food selection among four to five year old children. Ecology of food and nutrition 1981; 11: 145-150.
4. Pangborn RM, Giovanni ME. Dietary intake of sweet foods and of dairy fats and resultant gustatory responses to sugar in lemonade and to fat in milk. Appetite 1984; 5: 317-327.
5. Perez-Rodrigo C, Ribas L, Serra-Majem L, Aranceta J. Food preferences of Spanish children and young people: the enKid study. European journal of clinical nutrition 2003; 57 Suppl 1: S45-S48.
6. Liem DG, Mennella JA. Sweet and sour preferences during childhood; role of early experiences. Developmental psychobiology 2002; 41: 388-395.
7. Michela JL, Contento IR. Cognitive, motivational, social, and environmental influences on children's food choices. Health psychology 1986; 5: 209-230.
8. Liem DG, Mennella JA. Heightened sour preferences during childhood. Chemical senses 2003; 28: 173-180.
9. Cowart BJ. Development of taste perception in humans: sensitivity and preference throughout the life span. Psychological bulletin 1981; 90: 43-73.
10. Birch LL. Development of food preferences. Annual review of nutrition 1999; 19: 41-62.
11. Darwin C. Biographiche skizze eines kleinen kindes. Kosmos 1877; 367-376.
12. Spielman AI. Interaction of saliva and taste. Journal of dental research 1990; 69: 838-843.
13. Christensen CM, Brand JG, Malamud S. Salivary changes in solution pH: a source of individual differences in sour taste perception. Physiology and behavior 1987; 40: 221-227.
14. Norris MB, Noble AC, Pangborn RM. Human saliva and taste responses to acids varying in anions, titratable acidity, and pH. Physiology and behavior 1984; 32: 237-244.
15. Frauenfelder M. Gross National Product. Wired Archive 1999; 7.06:
16. Urbick B. About kids: food and beverages. Surrey: Leatherhead publishing, 2000.
17. Davis EP, Donzella B, Krueger WK, Gunnar MR. The start of a new school year: individual differences in salivary cortisol response in relation to child temperament. Developmental psychobiology 1999; 35: 188-196.
18. Donzella B, Gunnar MR, Krueger WK, Alwin J. Cortisol and vagal tone responses to competitive challenge in preschoolers: associations with temperament. Developmental psychobiology 2000; 37: 209-220.
Chapter 4
82
19. Gunnar MR, Tout K, de Haan M, Pierce S, Stansbury K. Temperament, social competence, and adrenocortical activity in preschoolers. Developmental psychobiology 1997; 31: 65-85.
20. Raudenbush B, Schroth F, Reilley S, Frank RA. Food neophobia, odor evaluation and exploratory sniffing behavior. Appetite 1998; 31: 171-183.
21. Schwartz EB, Granger DA, Susman EJ, Gunnar MR, Laird B. Assessing salivary cortisol
in studies of child development. Child development 1998; 69: 1503-1513.
22. Dawes C, O'Connor AM, Aspen JM. The effect on human salivary flow rate of the temperature of a gustatory stimulus. Archives of oral biology 2000; 45: 957-961.
23. Siegel S, Castellan NJ. The case of k related samples. In: Siegel S, Castellan NJ, eds. Nonparametric statistics, 2nd ed. Boston: Mc Graw Hill, 1988: 168-189.
24. Guinard J-X. Sensory and consumer testing with children. Food science and technology 2001; 11: 273-283.
25. Liem DG, Mars M, De Graaf C. Consistency of sensory testing with 4- and 5-year old children. Food quality and preference 2004; 15: 541-548.
26. Moskowitz HW, Kumaraiah V, Sharma KN, Jacobs HL, Sharma SD. Cross-cultural differences in simple taste preferences. Science 1975; 190: 1217-1218.
27. Sowalsky RA, Noble AC. Comparison of the effects of concentration, pH and anion species on astringency and sourness of organic acids. Chemical senses 1998; 23: 343-349.
28. Bonnans SR, Noble AC. Interaction of salivary flow with temporal perception of sweetness, sourness, and fruitiness. Physiology and behavior 1995; 57: 569-574.
29. Christensen CM, Navazesh M, Brightman VJ. Effects of pharmacologic reductions in salivary flow on judgments of suprathreshold taste stimuli. Chemical senses 1983; 8: 17-26.
30. Pliner P, Loewen ER. Temperament and food neophobia in children and their mothers. Appetite 1997; 28: 239-254.
31. Birren F. Color preference as a clue to personality. Art Psychotherapy 1973; 1: 13-16.
32. de Haan M, Gunnar MR, Tout K, Hart J, Stansbury K. Familiar and novel contexts yield different associations between cortisol and behavior among 2-year-old children. Developmental psychobiology 1998; 33: 93-101.
33. Schmidt NA. Salivary cortisol testing in children. Issues in comprehensive pediatric nursing 1998; 20: 183-190.
34. Beauchamp GK, Cowart BJ. Development of sweet taste. In: Dobbing J, ed. Sweetness, Berlin: Springer-Verlag, 1987: 127-138.
35. Mistretta CM. Neurophysiological and anatomical aspects of taste development. In: Aslin RN, Alberts JR, Petersen MR, eds. Development of perception, New York: Academic Press, 1981: 433-455.


55 Djin Gie Liem 1
Rik P Bogers 2 Pieter C Dagnelie
2
Kees de Graaf 1
Fruit consumption of young
children is related to preferences
for sour taste
1 Wageningen University, Division of Human Nutrition,
Wageningen Taste & Smell Centre
Wageningen, The Netherlands
2. Maastricht University, Department of Epidemiology,
Maastricht, the Netherlands
Submitted

86
Chapter 5
ABSTRACT
Background: It has been suggested that fruit consumption of children is mostly
determined by children’s preference for fruit. It remains unclear whether these
preferences entail specific taste preferences.
Objective: The present study investigated whether preferences for sweet and sour taste
of young children (n=50, mean age 9.2 ± 0.9 yrs) are related to their consumption of
fruit.
Design: Preference for sour taste was measured with a rank-by-elimination procedure
with 7 orangeades that differed in sourness (i.e. 0.009, 0.013, 0.020, 0.029, 0.043 and
0.065M added citric acid). Fruit consumption was assessed with a validated food-
frequency questionnaire that was completed by the children’s parents.
Results: Preference for sour taste of boys, but not girls was positively correlated with
their consumption of fruit (P<0.05).
Conclusion: Preference for sour taste may be associated with the consumption of fruit in
boys. In girls, preference for sour taste seems to be of less importance. Hypothetically,
their consumption of fruit is more influenced by their parents, availability and health
related motives.
ACKNOWLEDGMENTS
We acknowledge the expert technical assistance of Ms Krista Lam and Ms Judie van den Elshout. Also the participation of the children and teachers of the Prinsenakker elementary school is greatly
acknowledged.

Sour taste preferences and fruit consumption
87
INTRODUCTION
An adequate consumption of fruit lowers the risk for cancer 1 and cardiovascular
diseases 2. Public health authorities in many industrialized countries have therefore
defined a recommended daily consumption of fruit 3. However, many children fail to
meet these recommendations 4. It has been suggested that the consumption of fruit of
young children is determined by a variety of factors, among which parenting styles 5;6
,
fruit consumption of parents 7, availability and accessibility of fruit
8 and, most
importantly, taste preferences 9-12
.
In order to increase the consumption of fruit by means of children’s preference for fruit,
we first have to investigate what drives these preferences. Previous research suggests
that children’s food preferences can be established by a variety of factors, such as the
energy density of the food 13
, peer modeling 14
and parent-child interaction (see 15
for
review). Most likely also taste preferences (e.g. sweet and sour taste) are related to
children’s preference for fruit. It has been suggested that preference for sweet taste is
correlated with the consumption of sweet tasting products 16;17
. Preference for sour taste
has been related with the consumption of sour tasting food 18;19
. Sweet and sour taste are
major taste components of fruit (e.g. citrus fruit) generally consumed in the Netherlands 20
. It remains, however, unknown whether preferences for sweet and sour taste are
important predictors of children’s consumption of fruit. We therefore investigated
whether sweet and sour preferences are related to children’s total consumption of fruit.
METHODS
Subjects
Fifty healthy children (9.2 ± 0.9 yrs) participated in the study (see Table 1). Exclusion
criteria for participation were: sucrose restriction in the diet on medical indication, and
presumed allergies to sucrose and/or orangeades. The study protocol was approved by
the Ethics committee of Wageningen University. Written informed consent was obtained
prior to testing from all parents of the participating children.
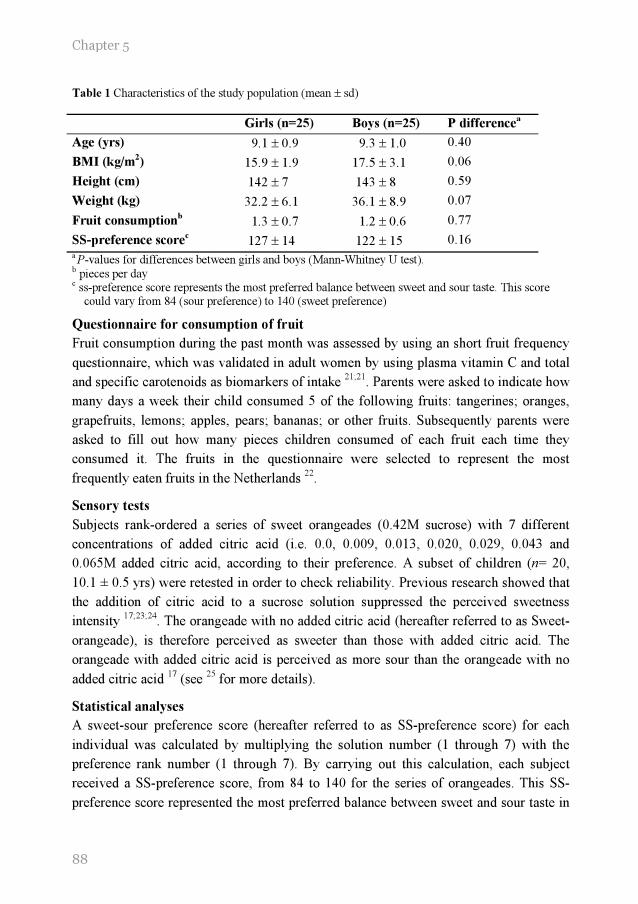
88
Chapter 5
Table 1 Characteristics of the study population (mean ± sd)
Girls (n=25) Boys (n=25) P differencea
Age (yrs) 9.1 ± 0.9 9.3 ± 1.0 0.40
BMI (kg/m2) 15.9 ± 1.9 17.5 ± 3.1 0.06
Height (cm) 142 ± 7 143 ± 8 0.59
Weight (kg) 32.2 ± 6.1 36.1 ± 8.9 0.07
Fruit consumptionb 1.3 ± 0.7 1.2 ± 0.6 0.77
SS-preference scorec 127 ± 14 122 ± 15 0.16
a P-values for differences between girls and boys (Mann-Whitney U test).
b pieces per day c ss-preference score represents the most preferred balance between sweet and sour taste. This score
could vary from 84 (sour preference) to 140 (sweet preference)
Questionnaire for consumption of fruit
Fruit consumption during the past month was assessed by using an short fruit frequency
questionnaire, which was validated in adult women by using plasma vitamin C and total
and specific carotenoids as biomarkers of intake 21;21
. Parents were asked to indicate how
many days a week their child consumed 5 of the following fruits: tangerines; oranges,
grapefruits, lemons; apples, pears; bananas; or other fruits. Subsequently parents were
asked to fill out how many pieces children consumed of each fruit each time they
consumed it. The fruits in the questionnaire were selected to represent the most
frequently eaten fruits in the Netherlands 22
.
Sensory tests
Subjects rank-ordered a series of sweet orangeades (0.42M sucrose) with 7 different
concentrations of added citric acid (i.e. 0.0, 0.009, 0.013, 0.020, 0.029, 0.043 and
0.065M added citric acid, according to their preference. A subset of children (n= 20,
10.1 ± 0.5 yrs) were retested in order to check reliability. Previous research showed that
the addition of citric acid to a sucrose solution suppressed the perceived sweetness
intensity 17;23;24
. The orangeade with no added citric acid (hereafter referred to as Sweet-
orangeade), is therefore perceived as sweeter than those with added citric acid. The
orangeade with added citric acid is perceived as more sour than the orangeade with no
added citric acid 17
(see 25
for more details).
Statistical analyses
A sweet-sour preference score (hereafter referred to as SS-preference score) for each
individual was calculated by multiplying the solution number (1 through 7) with the
preference rank number (1 through 7). By carrying out this calculation, each subject
received a SS-preference score, from 84 to 140 for the series of orangeades. This SS-
preference score represented the most preferred balance between sweet and sour taste in
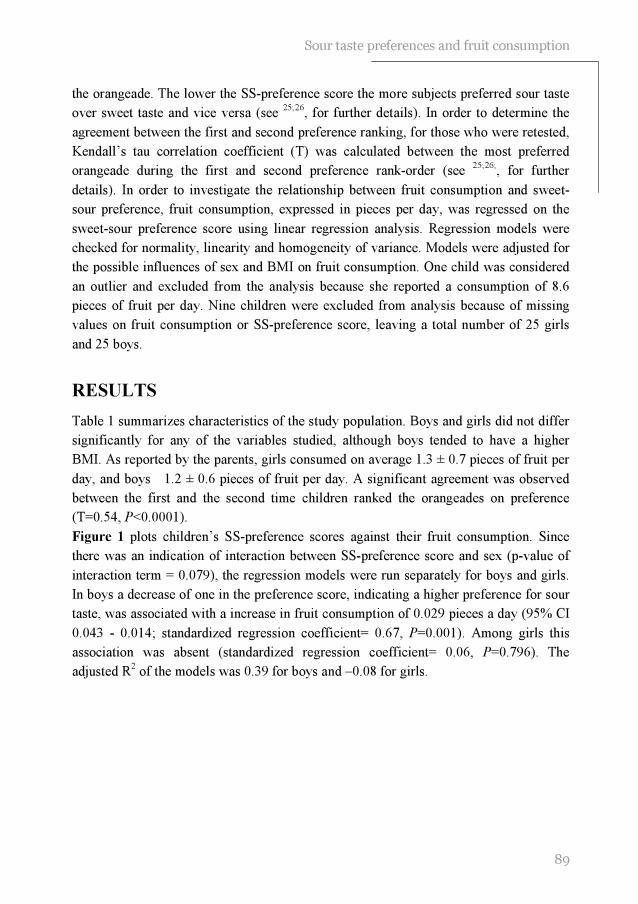
Sour taste preferences and fruit consumption
89
the orangeade. The lower the SS-preference score the more subjects preferred sour taste
over sweet taste and vice versa (see 25;26
, for further details). In order to determine the
agreement between the first and second preference ranking, for those who were retested,
Kendall’s tau correlation coefficient (T) was calculated between the most preferred
orangeade during the first and second preference rank-order (see 25;26;
, for further
details). In order to investigate the relationship between fruit consumption and sweet-
sour preference, fruit consumption, expressed in pieces per day, was regressed on the
sweet-sour preference score using linear regression analysis. Regression models were
checked for normality, linearity and homogeneity of variance. Models were adjusted for
the possible influences of sex and BMI on fruit consumption. One child was considered
an outlier and excluded from the analysis because she reported a consumption of 8.6
pieces of fruit per day. Nine children were excluded from analysis because of missing
values on fruit consumption or SS-preference score, leaving a total number of 25 girls
and 25 boys.
RESULTS
Table 1 summarizes characteristics of the study population. Boys and girls did not differ
significantly for any of the variables studied, although boys tended to have a higher
BMI. As reported by the parents, girls consumed on average 1.3 ± 0.7 pieces of fruit per
day, and boys 1.2 ± 0.6 pieces of fruit per day. A significant agreement was observed
between the first and the second time children ranked the orangeades on preference
(T=0.54, P<0.0001).
Figure 1 plots children’s SS-preference scores against their fruit consumption. Since
there was an indication of interaction between SS-preference score and sex (p-value of
interaction term = 0.079), the regression models were run separately for boys and girls.
In boys a decrease of one in the preference score, indicating a higher preference for sour
taste, was associated with a increase in fruit consumption of 0.029 pieces a day (95% CI
0.043 - 0.014; standardized regression coefficient= 0.67, P=0.001). Among girls this
association was absent (standardized regression coefficient= 0.06, P=0.796). The
adjusted R2 of the models was 0.39 for boys and –0.08 for girls.
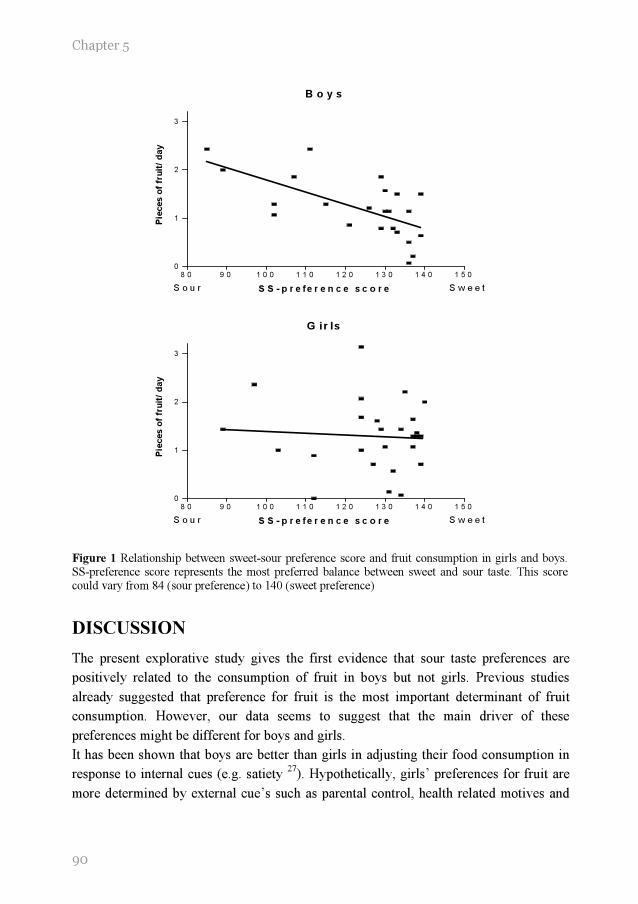
90
Chapter 5
B o y s
8 0 9 0 1 0 0 1 1 0 1 2 0 1 3 0 1 4 0 1 5 0
0
1
2
3
S o u r S w e e tS S - p r e fe r e n c e s c o r e
Pie
ces o
f fr
uit
/ d
ay
G ir ls
8 0 9 0 1 0 0 1 1 0 1 2 0 1 3 0 1 4 0 1 5 0
0
1
2
3
S o u r S w e e tS S - p r e fe r e n c e s c o r e
Pie
ces o
f fr
uit
/ d
ay
Figure 1 Relationship between sweet-sour preference score and fruit consumption in girls and boys. SS-preference score represents the most preferred balance between sweet and sour taste. This score could vary from 84 (sour preference) to 140 (sweet preference)
DISCUSSION
The present explorative study gives the first evidence that sour taste preferences are
positively related to the consumption of fruit in boys but not girls. Previous studies
already suggested that preference for fruit is the most important determinant of fruit
consumption. However, our data seems to suggest that the main driver of these
preferences might be different for boys and girls.
It has been shown that boys are better than girls in adjusting their food consumption in
response to internal cues (e.g. satiety 27
). Hypothetically, girls’ preferences for fruit are
more determined by external cue’s such as parental control, health related motives and

Sour taste preferences and fruit consumption
91
availability. In a study among 5- to 8-years-old children, Tiggemann suggested that
mothers’ dietary restraint predicted the degree of monitoring of daughters’, but not
sons’, eating behavior 28
. Hypothetically mothers are more likely to monitor their
daughters’ fruit consumption. Klesges and colleagues showed that children are more
likely to make healthy food choices when parental control is high 29
. Besides a
difference in parental control, it has been speculated that girls compared to boys are
more likely to adopt their mother’s eating behavior such as dieting 30
. Since according to
girls as young as five years of age, dieting includes “eat more fruits” 31
, dieting behavior
of young girls could be related to their preference for fruit. Another external cue that
could explain the difference between boys and girls is the availability and accessibility
to fruit. Cullen and colleagues showed that availability and accessibility accounted for
only 1% of the variance in the fruit consumption of boys, but accounted for 35% of the
variance of fruit consumption of similar aged girls 8.
The questionnaire that was used in the present study was design to measure total fruit
consumption rather than to discriminate between different fruits with different sensory
profiles. The relationship between the consumption of fruit and preference for sour taste,
is not necessarily due to the sour taste of fruit. Moreover, we cannot conclude from our
results whether preferences for sour taste was a result of repeated exposure to fruit or
vise versa. It is important to note that we did not assess the contribution of taste
preferences relative to other potential determinants of fruit consumption. Furthermore,
the variation in sweet-sour taste preferences of girls is smaller than in boys, which could
explain the difference between boys and girls with respect to the relationship between
sour taste preferences and fruit consumption. Further research should focus on the
relationship between sour fruit and preferences for sour taste in a larger population of
subjects.
In conclusion, our results suggest that preference for sour taste may be associated with
the consumption of fruit in boys. In girls, preference for sour taste seems to be of less
importance. Hypothetically, their consumption of fruit is more influenced by their
parents, availability and health related motives. Future research is needed to confirm this
hypothesis.

92
Chapter 5
REFERENCES
1. Steinmetz KA, Potter JD. Vegetables, fruit, and cancer prevention: a review. Journal of the
American Dietetic Association 1996; 96: 1027-1039.
2. Ness AR, Powles JW. Fruit and vegetables, and cardiovascular disease: a review. International journal of epidemiology 1997; 26: 1-13.
3. WHO/FAO. Expert report on diet, nutrition and the prevention of chronic diseases. World Wide Web . 2004. 10-5-2004.
4. Dennison BA, Rockwell HL, Baker SL. Fruit and vegetable intake in young children. Journal of the American College of Nutrition 1998; 17: 371-378.
5. Kremers SP, Brug J, de Vries H, Engels RC . Parenting style and adolescent fruit
consumption. Appetite 2003; 41 : 43-50.
6. Cullen KW, Baranowski T, Rittenberry L, et al. Socio-environmental influences on children's fruit, juice and vegetable consumption as reported by parents; reliability and validity of measures. Public health nutrition 2000; 30: 345-356.
7. Gibson EL, Wardle J, Watts CJ. Fruit and vegetable consumption, nutritional knowledge and beliefs in mothers and children . Appetite 1998; 31: 205-228.
8. Cullen KW, Baranowski T, Owens E, Marsh T , Rittenberry L, de Moor C. Availability, accessibility, and preferences for fruit, 100% fruit juice, and vegetables influence children's dietary behavior. Health education & behavior 2003; 30: 615-626.
9. Resnicow K, Davis-Hearn M, Smith M, Baranowski T, Lin LS, Baranowski J, Doyle C,
Wang DT.. Social-cognitive predictors of fruit and vegetable intake in children. Health psychology 1997; 16: 272-276.
10. Baxter SD, Thompson WO. Fourth-grade children's consumption of fruit and vegetable items available as part of school lunches is closely related to preferences. Journal of nutrition education and behavior 2002; 34: 166-171.
11. Cullen KW, Eagan J, Baranowski T, Owens E, de Moor C. Effect of a la carte and snack bar foods at school on children's lunchtime intake of fruits and vegetables. Journal of the
American Dietetic Association 2000; 100: 1482-1486.
12. Perez-Rodrigo C, Ribas L, Serra-Majem L, Aranceta J. Food preferences of Spanish children and young people: the enKid study. European journal of clinical nutrition 2003; 57 Suppl 1: S45-S48
13. Gibson EL, Wardle J. Energy density predicts preferences for fruit and vegetables in 4-year-old children. Appetite 2003; 31: 97-98.
14. Birch LL. Effects of peer models' food choices and eating behaviors on preschoolers' food preferences. Child development 1980; 51: 489-496.
15. Birch LL. Development of food preferences. Annual review of nutrition 1999; 19: 41-62.
16. Olson CM, Gemmill KP. Association of sweet preference and food selection among four to five year old children. Ecology of food and nutrition. 1981; 11: 145-150.
17. Pangborn RM, Giovanni ME. Dietary intake of sweet foods and of dairy fats and resultant gustatory responses to sugar in lemonade and to fat in milk. Appetite 1984; 5: 317-327.

Sour taste preferences and fruit consumption
93
18. Moskowitz HW, Kumaraiah V, Sharma KN, Jacobs HL, Sharma SD. Cross-cultural differences in simple taste preferences. Science 1975; 190: 1217-1218.
19. Liem DG, Mennella JA. Heightened sour preferences during childhood. Chemical senses 2003; 28: 173-180.
20. Netherlands Nutrition Centre. Zo eet Nederland 1998. Results of the Dutch Food
Consumption Survey 1998. -The Hague: Netherlands Nutrition Centre, 1998. 1998.
21. Bogers RP, Assema van P, Kester ADM, Westerterp KR, Dagnelie PC. Reproducibility, validity and responsiveness to change of a short questionnaire for measuring intake of fruits and vegetables. American journal of epidemiology 2003; 159:900-909.
22. Hulshof KFAM. The consumption of food groups by Dutch population groups: food consumption survey 1997-1998 (in Dutch). 1998. Zeist, The Netherlands, TNO Nutrition and Food Research.
23. Drewnowski A, Rock CL. The influence of genetic taste markers on food acceptance. The American journal of clinical nutrition 1995; 62: 506-511.
24. Pelletier CA, Lawless HT, Horne J. Sweet-sour mixture suppression in older and young adults. Food quality and preference 2004; 15: 105-116.
25. Liem DG, De Graaf C. Sweet and sour preferences in young children and adults: role of repeated exposure. Physiology & behavior, in press.
26. De Graaf C, Zandstra EH. Sweetness intensity and pleasantness in children, adolescents, and adults. Physiology and behavior 1999; 67: 513-520.
27. Johnson SL, Birch LL. Parents' and children's adiposity and eating style. Pediatrics 1994; 94: 653-661.
28. Tiggemann M, Lowes J. Predictors of maternal control over children's eating behaviour. Appetite 2002; 39: 1-7.
29. Klesges RC, Stein RJ, Eck LH, Isbell TR, Klesges LM. Parental influence on food selection in young children and its relationships to childhood obesity. American journal of clinical nutrition 1991; 53: 859-864.
30. Cutting TM, Fisher JO, Grimm-Thomas K, Birch LL. Like mother, like daughter: familial patterns of overweight are mediated by mothers' dietary disinhibition. The American journal of clinical nutrition 1999; 69: 608-613.
31. Abramovitz BA, Birch LL. Five-year-old girls' ideas about dieting are predicted by their mothers' dieting. Journal of the American dietetic association 2000; 100: 1157-1163.

66 Djin Gie Liem 1,2 Julie A Mennella 1 Sweet and sour preferences
during childhood: role of early
experiences
1 Monell Chemical Senses Center
Philadelphia, PA, USA
2
Wageningen University, Division of Human Nutrition,
Wageningen Taste & Smell Centre
Wageningen, The Netherlands
Developmental Psychobiology 2002, 41, pp. 388-395
Chapter 6
96
ABSTRACT:
Background: It has been suggested that early flavor experiences might influence taste
preferences of children years after the last exposure during infancy.
Objective: We investigated the effects of early experience on sweet and sour
preferences in children.
Design: Eighty-three children were divided into four groups based on the type of
formula fed during infancy and age. By using a forced-choice, sip-and-swallow
procedure, we determined the level of sweetness and sourness preferred in juice.
Results: Children who were fed protein hydrolysate formulas, which have a distinctive
sour and bitter taste and unpleasant odor, preferred higher levels of citric acid in juice
when compared to older children who were fed similar formulas. No such difference
was observed between the groups for sweet preference. However, the level of sweetness
preferred in juice was related to the sugar content of the child’s favorite cereal and
whether the mother routinely added sugar to their foods.
Conclusion: These data illustrate the wide variety of experiential factors that can
influence flavor preferences during childhood.
ACKNOWLEDGEMENTS
We acknowledge the expert technical assistance of Brian Pollack, Saadia Khan, Mayla Henderson, and
Lamoy Morgan. This work was supported by Grant HD37119 from the National Institute of Child Health and Human Development.
97
Sweet and sour preferences: early experiences
INTRODUCTION
In the biography on the life of his children, Charles Darwin (1877) 1 astutely noted that
children are living in different sensory worlds than adults. One century after these keen
observations were made, the scientific investigation of taste preferences during human
ontogeny began. This body of research has focused primarily, but not exclusively, on
sweet tastes and has repeatedly demonstrated, as Darwin noted, the strong acceptance of
sweet-tasting sugars during infancy and childhood 2-7
, with preference levels decreasing
to resemble that of the adult during late adolescence 8.
The heightened preference for sweet taste during early development is universal and
evident in children around the world (e.g., Brazil 9; France
10; Iraq
11; Israel
7; Mexico
12;
Netherlands 13
; North America 2;14
). However, individual variations do exists 3;15;16
.
Genetic variation 17-19
, as well as early experience 15;20
, play a role in establishing such
individual differences. For example, children who were fed sweetened water during the
first several months of life exhibited a greater preference for sweetened water at two
years of age when compared to those who had little of no experience with sweetened
water 15
. Through dietary experiences, children develop a sense of what foods should or
should not taste sweet 21;22
.
In comparison to sweet taste, much less is known about the ontogeny of sour taste
preferences. Unlike the innate preference for sweet tastes 23
, newborns reject the sour
taste of citric acid as evidenced by facial grimacing 7 and reduced intake
24. That
experiences during infancy impact upon sour preferences during childhood is suggested
by our recent study 25
. In that study, we exploited the substantial flavor variation
inherent in commercially available infant formulas, traditional milk-based formulas and
those based on hydrolyzed proteins. Although each formula brand has its own
characteristic flavor profile, milk-based formulas often are described as being slightly
sweet and having ‘‘sour and cereal-type’’ aromas whereas protein hydrolysate formulas
(e.g., Nutramigen, Alimentum) have an extremely unpalatable, offensive taste and ‘‘off’’
odor due primarily to its sourness and bitterness, perhaps because many amino acids
taste sour or bitter 26
. When compared to children who had been fed milk-based formulas
during their infancy, 4- to 5-year-old children who were fed protein hydrolysate
formulas during the first year of life were significantly more likely to prefer sour-
flavored (0.04 M citric acid) apple juices and less likely to make negative facial
responses during the taste tests. We suggest that the inherent variation in these two
classes of formula provides a particularly apt model system to study the role of
preweaning flavor experiences on later preference behaviors because these formulas
differ profoundly in flavor and because exposure is frequent and repeated 27;28
.

Chapter 6
98
The present study was built upon these previous findings and was designed to determine
whether early experience with hydrolysate formulas influences preferences for a wider
range of sour-flavored (0-0.070M citric acid) apple juices in 4- to 5-year-old as well as
older aged (6- to 7-year-old) children. Preference for a range of sweetened apple juices
also was assessed for two reasons. First, the addition of citric acid to apple juice not only
enhances its sour taste but also suppress its sweetness 29
. Therefore, heightened sour
preferences may be secondary to diminished sweet preferences. Second, there have been
reports in the literature that infants who are feeding, or have been fed, protein
hydrolysate formulas have a reduced preference for sweet foods 30;31
. As a first step in
evaluating the role of maternal factors on children’s flavor preferences, we also queried
children and mothers individually about their habits and preferences.
METHODS
Subjects
Mothers of 4- to 7-year-old children were recruited from advertisements in local
newspapers. Four groups of children (n=83; 42 girls, 41 boys) were formed based on
their age (age groups: 4–5 yrs vs. 6–7 yrs) and early formula history (formula groups:
milk formula vs. hydrolysate formula). There were no significant differences among the
groups in the number of months that these children were fed formula during infancy,
F(1, 79df) =2.19, P=0.14. However, as expected, children in the hydrolysate group fed a
milk- or soy-based formula during their first months (1.9 ± 0.4) of life and then, usually
following their pediatrician’s recommendation, were switched to hydrolysate until, on
average, 11.8 (± 0.9) months of age. The vast majority of children in the hydrolysate
group (83%) began this type of formula during the first 3 months of life. None of the
children who were fed milk-based formulas were ever fed hydrolysate formulas.
All children were reported by their mothers to be healthy at the time of testing. Thirteen
children were excluded because they could not understand the task. The procedures used
in this study were approved by the Office of Regulatory Affairs at the University of
Pennsylvania, and informed consent was obtained from each mother prior to testing.
Procedures
Children and their mothers were tested at the Monell Center on 2 days separated by 3.0
± 0.5 days. Testing took place in a closed room specifically designed for sensory testing
with a high air-turnover ventilation system. Each child sat at a small table designed for
children. The mother, who was unaware of the hypothesis being tested, completed
questionnaires about her child’s feeding habits and preferences (discussed later) and sat
approximately 2 ft behind the child, out of the child’s view (see 32
). Mothers were asked
99
Sweet and sour preferences: early experiences
to refrain from talking during the testing session, and replays of videotapes verified that
they indeed did not talk during testing.
After the child acclimated to the room and personnel, we assessed the child’s preference
for sourness (0–0.070M citric acid) during one test session and their preference for
sweetness (0.16–0.93M sucrose) during another. To this end, six solutions with different
concentrations of citric acid (0, 0.007, 0.012, 0.022, 0.039, and 0.070M) were made by
dissolving citric acid (Sigma Chemical) in apple juice and six solutions which differed in
sugar concentrations were made by either diluting the stock 0.34M solution of apple
juice (Mott’s Inc., Stamford, CT) with water (0.16 and 0.22M) or by adding sucrose to
the stock solution (0.47, 0.66, and 0.93M).
An age-appropriate, game like task that was fun for children and minimized the impact
of language development were used to examine flavor preferences. Using a forced-
choice procedure, each child was presented with all possible pairs of solutions (six
solutions yield 15 possible pairs), one pair at a time, on each testing day. Ten mL of
each stimuli were presented in identically colored opaque tumbler cups, containing a slit
through which the child could sip its contents without seeing the color of the solution
presented. The child was asked to taste each solution of the pair and to point to which of
the pair he or she liked better. The order of presentation of the solutions was randomized
within and between each pair. A 10-sec interval separated each pair of solutions, and a
5-min interval separated the tasting of the first eight pairs from the last seven pairs.
During these intervals, children were offered a sip cup containing water and a small
unsalted cracker to cleanse their palate.
Mothers completed a 10-item scale that measured their food neophobia, an 8-item scale
that measured general neophobia 33
, and a 25-item scale that measured temperament and
food neophobia in their children 34
. All but four of the mothers completed the
temperament scales. They also were asked to indicate how often they added sugar to
their child’s diet and whether they perceived their child as a picky eater. Without
communicating to the child, each mother was asked to write down their child’s favorite
cereals and candies. It should be noted that mothers completed this task before their
child answered similar questions: ‘‘What is your favorite cereal (or candy) in the whole
world?’’ and ‘‘Which cereal (or candy) do you ask your mom to buy the most?’’. All but
four of the children were able to answer these questions. Mother–child agreement was
65% for the child’s most favorite cereal and 54% for their favorite candy. The sugar
content (g/100 g) of these cereals then was determined.
Statistical analyses
Separate ANOVAs were conducted to determine whether there were significant
differences between the groups on the age, body mass index (BMI: mass (kg)/height
Chapter 6
100
(m2), and temperament scores of the children as well as the age and variety seeking
(with regards to foods), and food and general neophobia scores of the mother. Least
significant difference analyses were performed to investigate significant effects. Pearson
chi squares were performed to determine whether there were group differences in
ethnicity, proportion of girls to boys, and the mothers’ habit of adding sugar to their
children’s diet (e.g., those who never vs. those who frequently added sugar to their
child’s diet).
To determine whether early experience was related to sour preferences, we determined
the number of times (of 10) each child preferred the two most sour juices (0.04 and 0.07
M citric acid) as ‘‘tasting better.’’ Please recall that our previous findings revealed that
children who were fed hydrolysates were more likely to prefer sour apple juice (0.04 M).
Similarly, we also determined the number of times (of 15) that each child preferred the
apple juices with added sugar (0.47, 0.66, and 0.93 M sucrose). To determine whether
there were significant differences in sweet and sour preferences between the groups,
separate ANOVAs were conducted with age group (4–5 yrs vs. 6–7 yrs) and formula
history (milk vs. hydrolysate) as the between-subject variables. Finally, to determine
whether preference for sweetness in juices was related to preference for sweetness in
cereal, a multiple regression was performed between the average sugar concentration of
the child’s most favorite cereals and the number of times children preferred the apple
juices with the added sugar. All summary statistics are expressed as means ± sem.
RESULTS
Subject Characteristics
Salient characteristics of the four groups of children and their mothers are listed in
Table 1. For those children who were 4- to 5-years of age, there was no significant
difference between the formula groups (milk vs. hydrolysate) in their age:
F(1,37df)=1.26, P=0.27, BMI (kg/m2): F(1,37df) =0.51, P=0.48, the proportion of girls
to boys: χ2(1df) =0.02, P=0.88, or the age of the mothers: F(1,37df) =1.13, P=0.30.
Likewise, there were no significant differences between the formula groups for those
who were 6 to 7 years of age on any of these measures, children’s age: F(1,41df) =0.07,
P=0.80, BMI: F(1,41df) =0.18, P=0.68, sex ratio: χ2 (1df) =0.10, P=0.76, or mothers’
age: F(1,42df) =3.77, P=0.06. However, the two formula groups did differ in their
ethnicity, χ2 (2df) =6.53, P<0.04. That is, significantly more subjects in the hydrolysate
group were Caucasian and less were African American (77% Caucasian, 17% African-
American, 6% Other) when compared to those who were fed milk formulas (44%
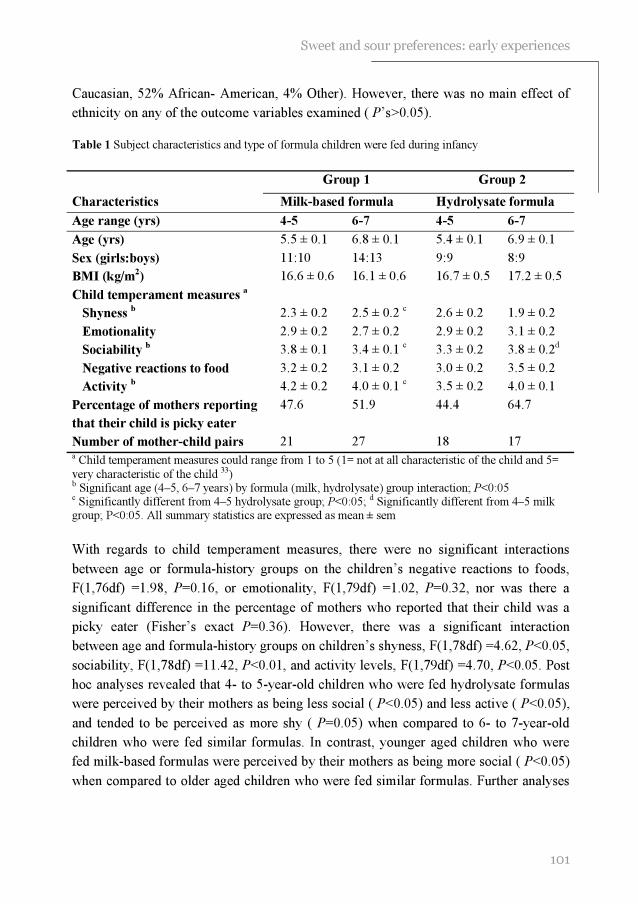
101
Sweet and sour preferences: early experiences
Caucasian, 52% African- American, 4% Other). However, there was no main effect of
ethnicity on any of the outcome variables examined ( P’s>0.05).
Table 1 Subject characteristics and type of formula children were fed during infancy
a Child temperament measures could range from 1 to 5 (1= not at all characteristic of the child and 5=
very characteristic of the child 33) b Significant age (4–5, 6–7 years) by formula (milk, hydrolysate) group interaction; P<0:05 c Significantly different from 4–5 hydrolysate group; P<0:05; d Significantly different from 4–5 milk group; P<0:05. All summary statistics are expressed as mean ± sem
With regards to child temperament measures, there were no significant interactions
between age or formula-history groups on the children’s negative reactions to foods,
F(1,76df) =1.98, P=0.16, or emotionality, F(1,79df) =1.02, P=0.32, nor was there a
significant difference in the percentage of mothers who reported that their child was a
picky eater (Fisher’s exact P=0.36). However, there was a significant interaction
between age and formula-history groups on children’s shyness, F(1,78df) =4.62, P<0.05,
sociability, F(1,78df) =11.42, P<0.01, and activity levels, F(1,79df) =4.70, P<0.05. Post
hoc analyses revealed that 4- to 5-year-old children who were fed hydrolysate formulas
were perceived by their mothers as being less social ( P<0.05) and less active ( P<0.05),
and tended to be perceived as more shy ( P=0.05) when compared to 6- to 7-year-old
children who were fed similar formulas. In contrast, younger aged children who were
fed milk-based formulas were perceived by their mothers as being more social ( P<0.05)
when compared to older aged children who were fed similar formulas. Further analyses
Group 1
Group 2
Characteristics Milk-based formula Hydrolysate formula
Age range (yrs) 4-5 6-7 4-5 6-7
Age (yrs) 5.5 ± 0.1 6.8 ± 0.1 5.4 ± 0.1 6.9 ± 0.1
Sex (girls:boys) 11:10 14:13 9:9 8:9
BMI (kg/m2) 16.6 ± 0.6 16.1 ± 0.6 16.7 ± 0.5 17.2 ± 0.5
Child temperament measures a
Shyness b 2.3 ± 0.2 2.5 ± 0.2
c 2.6 ± 0.2 1.9 ± 0.2
Emotionality 2.9 ± 0.2 2.7 ± 0.2 2.9 ± 0.2 3.1 ± 0.2
Sociability b 3.8 ± 0.1 3.4 ± 0.1
c 3.3 ± 0.2 3.8 ± 0.2
d
Negative reactions to food 3.2 ± 0.2 3.1 ± 0.2 3.0 ± 0.2 3.5 ± 0.2
Activity b 4.2 ± 0.2 4.0 ± 0.1
c 3.5 ± 0.2 4.0 ± 0.1
Percentage of mothers reporting
that their child is picky eater
47.6 51.9 44.4 64.7
Number of mother-child pairs 21 27 18 17

Chapter 6
102
Hydrolysate Milk-Based0
10
20
30
40
50 4-5 yrs.
6-7 yrs.
*
Type of Formula Fed During infancy
pe
rce
nta
ge o
f tim
e e
xtr
em
e s
ou
rju
ice
s c
hos
en a
s m
os
t p
refe
rred
of the children’s temperament revealed no significant main effect of child’s
temperament on any of the outcome variables examined ( P’s>0.05).
For mothers’ eating habits, there was no significant interaction between age and
formula-history groups on the mothers’ variety-seeking behavior to foods: F(1,78df)
=0.02, P=0.90, food neophobia: F(1,76df) = 0.03, P=0.90, or general neophobia:
F(1,76df) =1.90, P=0.17, as determined by questionnaires nor were there differences
between the groups in the mothers’ habit of adding sugar (Fisher’s exact P>0.05) to their
children’s foods.
Effect of early experience and age on sour preferences
As seen in Figure 1, there was a significant interaction between age group (4–5 yrs vs.
6–7 yrs) and formula group (milk vs. hydrolysate) in the children’s preference for the
extreme sour juices, F(1,79df) =4.91, P<0.05.
Figure 1 The percentage of time that 4-to 5-year-old children (solid bars) and 6-to 7-year old children (hatched bars) preferred the two most sour juices (0.04 and 0.07M citric acid) as “tasting better”. The groups differed in the type of formula (i.e., milk, hydrolysate) that the children were fed during
infancy. There was a significant interaction between age group (4-5 yrs. vs. 6-7 yrs) and formula group (milk vs. hydrolysate) in the children’s preference for the extreme sour juices. * children who were 4- to 5-years of age and fed hydrolysate formulas during their infancy preferred these sour juices significantly more than did older children who were fed similar formulas (P< 0.05)
That is, children who were 4-to 5-years of age and fed hydrolysate formulas during their
infancy preferred these sour juices significantly more than did older children who were
fed similar formulas, F(1,33df) =5.81, P<0.05. No such age-related difference was

103
Sweet and sour preferences: early experiences
Hydrolysate Milk-Based0
10
20
30
40
50 4-5 yrs .
6-7 yrs .
Type of Form ula Fed D uring infanc y
perc
enta
ge o
f tim
e S
weete
ned J
uic
es
Chosen a
s m
ost P
refe
rred
observed in children who were fed milk-based formulas during infancy, F(1,46df) =0.54,
P=0.50.
Effect of early experience and age on sweet preferences
Unlike that observed for sour preference, there was no significant interaction between
age group and formula group in their preference for sweetened juices, F(1,79df) =0.10,
P=0.76 (Figure 2). That is, children of both age groups and early feeding history were
significantly more likely to prefer the juices with added sugar (P’s<0.001). Moreover,
there was no significant interaction between the groups in the sugar content of the
children’s favorite cereals, F(1,75df) =0.63, P=0.43, which was, on average, 30.6 ± 1.5
g/100 g.
Figure 2 The percentage of time that 4-to 5-year-old children (solid bars) and 6-to 7-year old children (hatched bars) preferred the apple juice with added sugar (0.47, 0.66, and 0.93 M sucrose) as “tasting better”. The groups differed in the type of formula (i.e. , milk, hydrolysate) that the children were fed
during infancy. There was no significant interaction between age group and formula group in the children’s preference for sweetened juices.
Because there were no significant differences of age or formula-history groups on the
mothers’ habit of adding sugar to their child’s foods, children were divided into two
groups: those whose mothers reported that they never added sugar to their foods (n=29)
versus those whose mother did so on a routine basis (n=51) to further investigate
whether maternal behaviors are related to children’s preferences. Table 2 reveals that
children whose mothers reported adding sugar to their foods on a routine basis were
significantly more likely to prefer apple juices with added sugar, F(1,78df) = 4.68,
P<0.05, and reported that they preferred a cereal with a significantly higher sugar

Chapter 6
104
content, F(1,74df) = 6.02, P<0.05, when compared to children whose parents reported
that they never added sugar to their children’s foods. The mothers who added sugar also
were more likely to be African Americans, χ2 (2df) = 17.06, P<.0001, and were older in
age, F(1,78df) = 11.03, P<0.001, when compared to mothers who never added sugar to
their child’s diet.
Table 2 Mother’s habit of adding sugar to child’s food: subject characteristics and preference
Does mother add sugar to child’s food?
Frequently Never
Children’s age (yrs) 6.2 ± 0.1 6.2 ± 0.2
Ethnicity (%) a
African American 47% 3.5%
Caucasian 47% 93%
Other 6% 3.5%
Mother’s age (yrs) 34.1 ± 0.8 38.3 ± 1.0 b
Children’s BMI (kg/m2) 16.3 ± 0.4 17.0 ± 0.4
No. times (of 15) that child preferred
apple juices with added sugar
9.6 ± 0.32 8.4 ± 0.47 a
Sugar content of favorite cereals
(g/100g)
32.9 ± 1.7 25.2 ± 2.8 a
Number of mother-child pairs 51 29 a P < 0.05; b
P < 0.001
DISCUSSION
This study expands upon our previous findings and demonstrates that the type of
formula fed during infancy influences sour, but not sweet, preferences several years after
the last exposure to the formula. However, these effects were only observed when
children were 4-to 5-years of age. In other words, children who were fed protein
hydrolysate formulas, which have distinctive sour and bitter tastes and unpleasant odors,
preferred higher levels of citric acid in juice when compared to 6- to 7-year-old children
who were fed hydrolysate formulas. Because there was no significant difference in sweet
preference between the groups, the preference for the more sour juices (which also were
less sweet) in the younger children does not appear to be due to a reduced sweet
preference.
Why were the effects of early experience not seen in the older children? It is unlikely
that the enhanced sour preference in the younger children was due to a poorer ability to
perform the sensory tests. The pair-wise comparison test has been frequently used to

105
Sweet and sour preferences: early experiences
determine preference and discriminatory ability in young children 35-37
. Moreover, there
were no age-related differences in the level of sweetness preferred, which was
determined by procedures identical to those used for determining sour preferences.
We hypothesize that the observed shift in sour preference in those children who were fed
hydrolysate during infancy was due to the older children’s more expanded experience
with foods and flavors 38
which, in turn, leads to learning the appropriate level and
context of sour taste in different foods. On the other hand, we hypothesize that the
heightened preference for sour tastes would persist with continued exposure to
hydrolysate formula. Consistent with this hypothesis is the report that adolescent
patients with phenylketonuria who were fed a type of protein hydrolysate formula
(which is specifically treated with charcoal to remove most of the phenylalanine)
throughout childhood and adolescence reported that one of their most preferred flavors,
which was often added to the formulas, was lemon 39
.
Because we did not randomly assign children to groups (parents decided which formulas
they would feed their infants.), this was not a strict experimental study. Nonetheless, we
attempted to match the groups as closely as possible to maximize the probability that
any group differences were due only to differences in early formula-feeding experiences.
Because there were no significant differences among the groups in the mothers’ variety-
seeking scores or food-neophobia scores, the differences observed in the children’s
behavioral responses to the sour flavor were unlikely to be due to the mothers’ eating
habits or attitudes toward foods.
There were significant age-related differences with temperament. Four- to five-year-old
children who were fed hydrolysate formulas were perceived by their mothers as being
less social and less active when compared to 6- to 7-year-old children who were fed
similar formulas. Despite the paucity of research on sour taste preference, a recent study
on sweet taste preference suggested that young adults who scored high on arousability
and pleasure gave higher intensity ratings to a sweet solution under mild stress
conditions when compared to those who scored low on these temperament scores 40
.
However, despite the significant age-related differences in temperament observed in the
present study, no significant main effect of child temperament was observed for any of
the outcome variables.
Are mothers of young children who were on hydrolysate more likely to perceive their
children differently? Of interest here is the finding that mothers who switched their
children’s formula during infancy because of feeding problems were more likely to
perceive their 3.5-year-old children as more vulnerable several years after last exposure
to the formula, despite no observed difference in the children’s personalities or incidence
of asthma or eczema 41
. Recall that every mother in the hydrolysate group switched her
child’s formula during infancy. Forsyth and Canny 41
suggested that the mere experience

Chapter 6
106
of changing formula during early infancy has long-term effects on mother–infant
interaction and perceptions. Nevertheless, controlled experimental studies in which these
formulas are introduced at differing ages and in which later preferences and
temperament are determined by examining the child directly and not by maternal reports
are needed for confirmation. Such studies are ongoing in our laboratories.
The findings from the present study also indicate that, at least for cereals, it is possible to
relate sweet preference as measured in a laboratory setting to preferences for sweets in
everyday foods such as cereals, as reported by the child. That experience influences
sweet preferences is suggested by the finding that children whose mothers routinely
added sugar to their diet preferred higher levels of sugar in apple juice and cereals when
compared to children whose mothers reported never adding sugar. Such findings are
consistent with previous research demonstrating that experience with sweetened water
during infancy resulted in higher preferences for sweetened water at 2 years of age 15;20
and that preference for sweet taste, as assessed by psychophysical methods, is related to
carbohydrate intake in healthy adults 42
.
To be sure, mothers have an important influence on their children’s diet 43
, such as the
types of foods eaten 44
and frequency of exposure to sweet foods 45
. However, these data
underscore the importance of obtaining such information from the child directly because
parents are not always reliable sources of this type of information. For example, mothers
may be more accurate in identifying their child’s favorite cereal when compared to
candy because parents do most of the cereal purchasing. In conclusion, the findings of
the present study illustrate the wide variety of experiential factors that can influence
flavor preferences during childhood and highlight the importance of assessing children’s
preferences directly. The goal of our research program is to identify the early
experiences that influence why we like the foods we do.
REFERENCES
1. Darwin C. Biographiche skizze eines kleinen kindes. Kosmos 1877; 367-376.
2. Desor JA, Greene LS, Maller O. Preferences for sweet and salty in 9- to 15-year-old and adult humans. Science 1975; 190: 686-687.
3. Enns MP, Van Itallie TB, Grinker JA. Contributions of age, sex and degree of fatness on preferences and magnitude estimations for sucrose in humans. Physiology and behavior 1979; 22: 999-1003.
4. Maller, O, Desor, JA. Effect of taste on ingestion by human newborns. Bosmam, J. F. Fourth
symposium on oral sensation and perception: development of the fetus and infant. NIH 73-546, 279-291. 1973. Washington, DC, Government printing office. DHEW publication.
5. Nisbett RE, Gurwitz SB. Weight, sex and the eating behavior of human newborns. Journal of comparative and physiological psychology 1970; 73: 245-253.

107
Sweet and sour preferences: early experiences
6. Peiper A. Cerebral function in infancy and childhood. New York: Consultants bureau, 1963.
7. Steiner JE. Facial expressions of the neonate infant indication the hedonics of food-related chemical stimuli. In: Weiffenbach JM, ed. Taste and development: the genesis of sweet preference, Washington, DC: U.S. Government Printing Office, 1977: 173-188.
8. Desor JA, Beauchamp GK. Longitudinal changes in sweet preferences in humans. Physiology
and behavior 1987; 39: 639-641.
9. Tomita NE, Nadanovsky P, Vieira AL, Lopes ES. Taste preference for sweets and caries prevalence in preschool children. Revista de Saude Publica 1999; 33: 542-546.
10. Bellisle F, Dartois AM, Kleinknecht C, Broyer M. Perceptions of and preferences for sweet taste in uremic children. Journal of the American dietetic association 1990; 90: 951-954.
11. Jamel HA, Sheiham A, Watt RG, Cowell CR. Sweet preference, consumption of sweet tea and dental caries; studies in urban and rural Iraqi populations. International dental journal 1997; 47: 213-217.
12. Vazquez M, Pearson PB, Beauchamp GK. Flavor preferences in malnourished Mexican
infants. Physiology and behavior 1982; 28: 513-519.
13. De Graaf C, Zandstra EH. Sweetness intensity and pleasantness in children, adolescents, and adults. Physiology and behavior 1999; 67: 513-520.
14. Beauchamp GK, Cowart BJ. Development of sweet taste. In: Dobbing J, ed. Sweetness, Berlin: Springer-Verlag, 1987: 127-138.
15. Beauchamp GK, Moran M. Acceptance of sweet and salty tastes in 2-year-old children. Appetite 1984; 5: 291-305.
16. Nilsson B, Holm A-K. Taste threshold, taste preference, and dental caries in 15-year-olds.
Journal of dental research 1983; 62: 1069-1072.
17. Bartoshuk LM. Comparing sensory experiences across individuals: recent psychophysical advances illuminate genetic variation in taste perception. Chemical senses 2000; 25: 447-460.
18. Drewnowski A, Henderson SA, Shore AB. Genetic sensitivity to 6-n-propylthiouracil (PROP) and hedonic responses to bitter and sweet tastes. Chemical senses 1997; 22: 27-37.
19. Looy H, Weingarten HP. Facial expressions and genetic sensitivity to 6-n-propylthiouracil predict hedonic response to sweet. Physiology and behavior1992; 52: 75-82.
20. Beauchamp GK, Moran M. Dietary experience and sweet taste preference in human infants. Appetite 1982; 3: 139-152.
21. Cowart BJ, Beauchamp GK. Factors affecting acceptance of salt by human infants and children. In: Kare MR, Brand JG, eds. Interaction of the chemical senses with nutrition., New York: Academic Press, 1986: 25-44.
22. Sullivan SA, Birch LL. Pass the sugar, pass, the salt: experience dictates preference. Developmental psychology 1990; 26: 546-551.
23. Desor JA, Maller O, Turner RE. Preference for sweet in humans: infants, children and adults.
In: Weiffenbach JM, ed. Taste and development: the genesis of sweet preference, Washington, DC: US Government Printing Office, 1977.
24. Desor JA, Maller O, Andrews K. Ingestive responses of human newborns to salty, sour, and bitter stimuli. Journal of comparative and physiological psychology 1975; 89: 966-970.

Chapter 6
108
25. Mennella JA, Beauchamp GK. Flavor experiences during formula feeding are related to preferences during childhood. Early human development 2002; 68: 71-82.
26. Cook DA, Sarett HP. Design of infant formulas for meeting normal and special need. In: Lifshitz F, ed. Pediatric nutrition: infant feeding, deficiencies, disease, New York: Marcel Dekker, 1982: 71-85.
27. Beauchamp GK, Mennella JA. Sensitive periods in the development of human flavor perception and preference. Annales Nestlé, Nestlé Nutrition Workshop Series 1998; 56: 19-31.
28. Mennella JA, Beauchamp GK. Developmental changes in the acceptance of protein hydrolysate formula. Journal of developmental and behavioral pediatrics 1996; 17: 386-391.
29. Schifferstein HNJ, Frijters JER. Sensory integration in citric acid/sucrose mixtures. Chemical senses 1990; 15: 87-109.
30. MacDonald A, Rylance GW, Asplin DA, Hall K, Harris G, Booth IW. Feeding problems in
young PKU children. Acta paediatrica suppl 1994; 407: 73-74.
31. Still S, Little SA, Pollard C, Bevin S, Hourihane JO’B, Harris G, Warner JO, Dean TP. Comparison of taste preference development between breastfed infants and infants receiving standard, soy, or hydrolysate formulas. Journal of clinical immunology 1996; 240
32. Mennella JA, Garcia PL. Children's hedonic response to the smell of alcohol: effects of parental drinking habits. Alcoholism, clinical and experimental research 2000; 24: 1167-1171.
33. Pliner P, Hobden K. Development of a scale to measure the trait of food neophobia in humans.
Appetite 1992; 19: 105-120.
34. Pliner P, Loewen ER. Temperament and food neophobia in children and their mothers. Appetite 1997; 28: 239-254.
35. Birch LL, Marlin DW. I don't like it; I never tried it: effects of exposure on two-year-old children's food preferences. Appetite 1982; 3: 353-360.
36. Kimmel SA, Sigman-Grant M, Guinard J-X. Sensory testing with young children. Food technology 1994; 48: 92-99.
37. Leon F, Marcuz MC, Couronne T, Koster EP. Measuring food liking in children: a
comparison of non-verbal methods. Food quality and preference 1999; 10: 93-100.
38. Nicklas TA. Dietary studies of children and young adults (1973-1988): the Bogalusa Heart Study. Am Journal of medical science Suppl 1: S101-S108
39. Hogan SE, Gates RD, MacDonald GW, Clarke JT. Experience with adolescents with phenylketonuria returned to phenylalanine-restricted diets. Journal of the American dietetic association 1986; 86: 1203-1207.
40. Dess NK, Edelheit D. The bitter with the sweet: the taste/stress/temperament nexus. Biological psychology 1998; 48: 103-119.
41. Forsyth BW, Canny PF. Perceptions of vulnerability 3 1/2 years after problems of feeding and crying behavior in early infancy. Pediatrics 1991; 88: 757-763.
42. Mattes RD, Mela DJ. Relationships between and among selected measures of sweet-taste preference and dietary intake. Chemical senses 1986; 11: 523-539.

109
Sweet and sour preferences: early experiences
43. Fisher JO, Birch LL. Restricting access to palatable foods affects children's behavioral response, food selection, and intake. American journal of clinical nutrition 1999; 69: 1264-1272.
44. Klesges RC, Stein RJ, Eck LH, Isbell TR, Klesges LM. Parental influence on food selection in young children and its relationships to childhood obesity. American journal of clinical
nutrition 1991; 53: 859-864.
45. Ritchey N, Olson C. Relationship between family variables and children's preference for and consumption of sweet foods. Ecology of food and nutrition. 1983; 13: 257-266.

77 Djin Gie Liem
Monica Mars Kees de Graaf
Sweet preferences and sugar
consumption of 4-and 5-year-old
children: role of parents
Appetite in press
Chapter 7
112
ABSTRACT
Background: Although the relationship between sugar consumption and health is
unclear, many parents in the industrialized counties try to modify the consumption and
preference for sugar of their children by imposing rules that restrict sugar consumption.
Objective: We investigated the relationships in children between rules that restrict
consumption of mono and disaccharides (MDS), consumption of MDS and preferences
for sucrose-containing orangeade. The background ideas of restriction rules we also
investigated.
Design: To this end, 44 children (5.1 ± 0.5 yrs) performed a rank-order and paired-
comparison test of preference for five orangeades, which differed in sucrose
concentration (0.14, 0.20, 0.29, 0.42 and 0.61M sucrose). Parents filled out a
questionnaire concerning restriction rules and their children’s consumption of MDS-
containing foods.
Results: Stronger restriction rules were related to a lower consumption of beverages that
contained MDS and to a lower consumption of MDS-containing foods during breakfast
and lunch. The most freedom to choose foods that contain MDS was given during the
afternoon. Fifty-five percent of the children who were highly restricted showed a
preference for the highest concentration of sucrose in orangeade. None of these children
preferred the orangeade with the lowest concentration of sucrose. While 19% of the
children who were little restricted preferred the beverage with the lowest concentration
of sucrose, 33% preferred the beverage with the highest concentration. These parents
generally believed that sugar has a bad effect on health and had similar background
ideas concerning restriction rules.
Conclusions: Rules that restrict sugar consumption of children may lead to a lower
consumption of sweet tasting foods. These rules may have the unintended effect of
increase children’s preference for sweet foods.
ACKNOWLEDGEMENTS
We acknowledge the participation of the children and teachers of “de Prinsenakker” elementary
school.

113
Sweet preferences: role of parents
INTRODUCTION
Human infants are born with a preference for sweet taste 1-4
. Also infants at 1-3-days-old
can discriminate between different kinds of sugars (e.g. fructose, glucose) and different
concentrations of the same sugar 3. Preference for sweet taste remains during childhood
and decreases during late adolescence, until the adult preference for moderate sweet
taste has been established 5;6
. Preference for high levels of sweetness is evident in
children around the world (for review see 7), and is positively related with children’s
consumption of sweet foods 8;9
. Along the same lines, Dutch survey of food
consumption has shown that 4-to 7-year-old children consumed a larger percentage of
their daily energy intake as means of mono and disaccharides (girls: 33.2 %; boys:
32.1%) than adults (females: 21.3%; males: 23.7%) 10
.
The effects of high consumption mono and disaccharides (hereafter referred to as MDS)
on health are not clear. Excessive consumption of MDS is positively related to dental
caries 11-13
, but there is no conclusive evidence that consumption of MDS causes harm to
health. Several studies suggested that a high intake of beverages that contain MDS is
positively related to obesity 14;15;16
. However, other studies failed to detect such a
relationship 17;18
. Also, behavioral and cognitive changes caused by high consumption of
MDS have not been clearly demonstrated in healthy subjects 19;20
.
Despite this inconclusive scientific evidence, many parents in the industrialized world
try to lower their children’s consumption of MDS and preference for sweet foods by
applying rules that aim to restrict the consumption of MDS (hereafter referred to as
‘MDS restriction rules’). It is unclear which thoughts and attitudes of parents are related
to these rules 21
. Three different attitudes may play an important role in the formation of
MDS restriction rules.
First, it has been suggested that parents who used foods that contains MDS to comfort
their children or used these foods as a reward (the instrumental functions of MDS), were
more likely to give their children these food items 22
. Secondly, the well established
attitude, “sugar is bad for your health”, may also be of importance in the formation of
rules that aimed to restrict consumption of MDS 18;23
. Thirdly, parents may think that
sweet preferences can be modified (e.g. lowering sweet preference) by imposing MDS
restriction rules 24
.
Besides the unclear attitudes behind MDS restriction rules, it is also unclear whether
these rules result in a lower consumption of MDS, or lower preference for sweet taste as
aimed by the parents. Several studies suggested that restriction could result in an
increased desire to consume the restricted food 25
. This high desire would then increase
consumption of the restricted food in the absence of parental monitoring 26
. It is
important to note that the latter studies focused on particular food items and not on one

Chapter 7
114
particular taste dimension per se. From these studies it is therefore unclear whether MDS
restriction would change subjects’ preferences for MDS.
The present study investigated the background ideas of MDS restriction rules.
Subsequently, this study investigated whether MDS restriction rules were related to
consumption of MDS and preference for high concentration of MDS in orangeade.
METHOD
General overview
The present study involved two parts. The first part consisted of a survey questionnaire
concerning three main topics: a) the child’s consumption of a variety of foods that
contain MDS, b) restriction rules concerning consumption of those foods, and c) the
background ideas of the use of MDS and MDS restriction rules. The parents of the
children, who participated in the sensory tests, filled out this questionnaire. The second
part consisted of sensory tests with orangeade that contained different amounts of
sucrose. These tests were completed by children who attended kindergarten. In the
present study “lunch” refers to the second cold meal and “MDS” refers to MDS present
in the foods that were listed in the questionnaire. “Restriction” refers to “the degree
children were restricted to freely choose a food that contained MDS”. “MDS restriction
rules” refers to “rules that restrict children to freely choose a product that contained
MDS”.
Subjects
The subjects who completed the questionnaires were the parents of the children who
participated in the sensory tests. Forty-five of the sixty questionnaires were returned to
the researchers. Sixty children (5.0 ± 0.6 yrs, 33 girls and 27 boys) were involved in the
sensory tests; all attended a kindergarten in a nearby village. Two children refused to
taste the beverages and were therefore excluded. Exclusion criteria for participation of
the children were, restriction of MDS in the diet on medical indication, and presumed
allergies to MDS and/or orange beverages. This resulted in the inclusion of 43 children
(5.1 ± 0.01 yrs, 22 girls and 21 boys) who completed the sensory tests and whose parents
returned the questionnaires. The study protocol was approved by the Medical Ethical
Committee of the Department of Human Nutrition of Wageningen University. Informed
consent was obtained prior to testing from all parents of the children who participated.
Survey questionnaire
The survey questionnaire consisted of 42 questions divided into 4 sections: 1) a food
frequency section, organized to assess consumption of a variety of foods that contain

115
Sweet preferences: role of parents
MDS during specific meals and times of day (i.e. breakfast, during the morning, lunch,
during the afternoon and dinner) 2) a section with MDS restriction rules that referred to
the same food items as in the food frequency list 3) Statements about the background of
MDS restriction rules 4) General questions about each parent (gender, age, and
education).
The 13 food items in the questionnaire were the MDS-containing food items most
frequently eaten by children (4-7 yrs) in the Netherlands 10 (see Table 1).
Table 1 Average mono and disaccharide (MDS) contents and standard portion size of the food items mentioned in the food frequency questionnaire 31.
Food Items Average MDS content
(g/100g product)
Standard
portion (g)
Sweet beverages
Sweetened beverages 10 150
Juices 9 150
Candies
Small candy 70 5
Large candy 70 15
Candy bars 50 15
Cake 30 50
Biscuits 30 10
Others
Sweet yogurt 75 12
Apple sauce 17 10
Sweet dessert 12 150
Sweet spreads for bread 65 15
Sweet breakfast cereals 20 150
Sweeteners 100 5
Parents filled out how many times a day, a week, or a month their children consumed
each specific food item, during each specific time of the day (i.e. breakfast, during the
morning, lunch, during the afternoon, during the dinner) during the past month. During
breakfast, Dutch children normally eat bread or breakfast cereals. During the morning
and afternoon snacks are eaten. Lunch normally consists of bread and dinner normally
consists of a warm meal. The Dutch food composition table was used to calculate the
MDS content of each food item (see Table 1). The questionnaire included foods that
represented about 75% of the regular MDS intake of children 4-7 years of age 10
. Fruit
and milk were not included in the questionnaire, because these foods do not contain
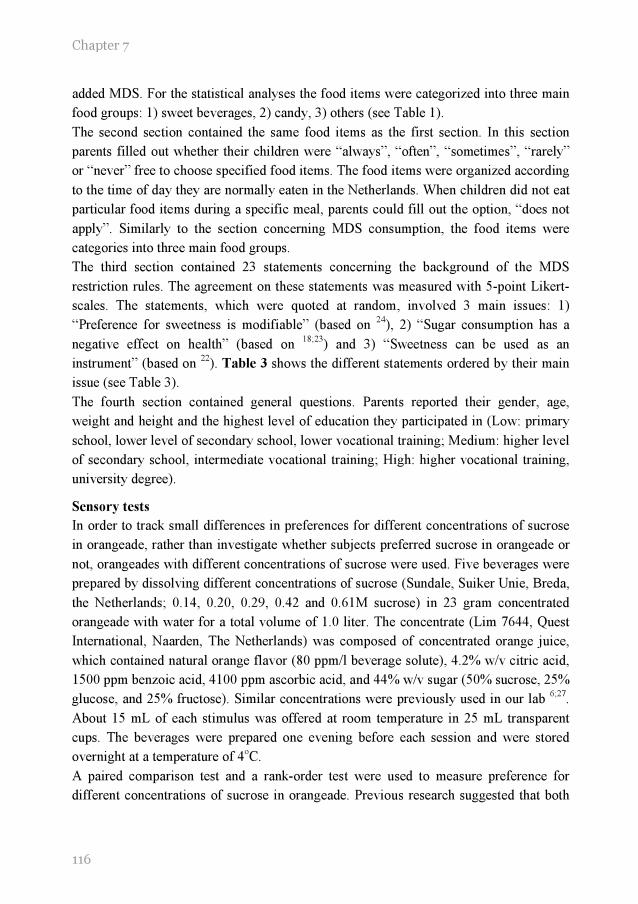
Chapter 7
116
added MDS. For the statistical analyses the food items were categorized into three main
food groups: 1) sweet beverages, 2) candy, 3) others (see Table 1).
The second section contained the same food items as the first section. In this section
parents filled out whether their children were “always”, “often”, “sometimes”, “rarely”
or “never” free to choose specified food items. The food items were organized according
to the time of day they are normally eaten in the Netherlands. When children did not eat
particular food items during a specific meal, parents could fill out the option, “does not
apply”. Similarly to the section concerning MDS consumption, the food items were
categories into three main food groups.
The third section contained 23 statements concerning the background of the MDS
restriction rules. The agreement on these statements was measured with 5-point Likert-
scales. The statements, which were quoted at random, involved 3 main issues: 1)
“Preference for sweetness is modifiable” (based on 24
), 2) “Sugar consumption has a
negative effect on health” (based on 18;23
) and 3) “Sweetness can be used as an
instrument” (based on 22
). Table 3 shows the different statements ordered by their main
issue (see Table 3).
The fourth section contained general questions. Parents reported their gender, age,
weight and height and the highest level of education they participated in (Low: primary
school, lower level of secondary school, lower vocational training; Medium: higher level
of secondary school, intermediate vocational training; High: higher vocational training,
university degree).
Sensory tests
In order to track small differences in preferences for different concentrations of sucrose
in orangeade, rather than investigate whether subjects preferred sucrose in orangeade or
not, orangeades with different concentrations of sucrose were used. Five beverages were
prepared by dissolving different concentrations of sucrose (Sundale, Suiker Unie, Breda,
the Netherlands; 0.14, 0.20, 0.29, 0.42 and 0.61M sucrose) in 23 gram concentrated
orangeade with water for a total volume of 1.0 liter. The concentrate (Lim 7644, Quest
International, Naarden, The Netherlands) was composed of concentrated orange juice,
which contained natural orange flavor (80 ppm/l beverage solute), 4.2% w/v citric acid,
1500 ppm benzoic acid, 4100 ppm ascorbic acid, and 44% w/v sugar (50% sucrose, 25%
glucose, and 25% fructose). Similar concentrations were previously used in our lab 6;27
.
About 15 mL of each stimulus was offered at room temperature in 25 mL transparent
cups. The beverages were prepared one evening before each session and were stored
overnight at a temperature of 4oC.
A paired comparison test and a rank-order test were used to measure preference for
different concentrations of sucrose in orangeade. Previous research suggested that both
117
Sweet preferences: role of parents
paired comparisons 27;28
and the rank-order method 29;30
are reliable methods when
conducted with young children. Children were tested at their kindergarten in a room that
was familiar to them. The testing room existed of ten or fifteen low tables. This
depended on the number of children (ranging from 10 to 15 children) that was tested at
the same time. In order to minimize the influence of peers during the sensory tests, the
tables were set one meter apart from each other. Each child had personal guidance from
an adult, who was trained beforehand to become familiar with the procedures. The
children sat in a circle facing outwards, so they could not see the other children who
were tested at the same time. First the paired comparison test and subsequently the rank-
order test were performed, with a 20-minute pause between the two tests. Each test
lasted for about 10 minutes. The subjects were allowed to taste the stimuli as often as
was necessary to make a decision.
To determine preference with the paired comparison test, the subjects had to judge five
stimuli in ten different pairs. The pairs were presented one at the time in a random order.
Children were asked to taste both stimuli, after which the researcher asked the child:
“Which one do you like most?”. The child could either tell or point to the one he liked
the best. Before the actual test began, the subjects were offered a pair of stimuli to
become familiar with the beverages. This pair consisted of the second and the fourth
stimuli of the series, which were used during the actual paired comparison test. The
subjects used the sip and swallow procedure and took a sip of water between each pair
of stimuli, but not within.
During the rank-order test subjects divided the stimuli into two categories, “most
preferred’ and “least preferred”, which were made visual by a “happy face” and a “sad
face”. First, children were presented with all five stimuli in a random order. Secondly,
the researcher asked the child: “I want you to taste all the beverages. If you like the taste
of the beverage, you give it to the “happy face”, if you do not like the taste I want you to
give it to the unhappy face”. After all stimuli were grouped in either the “happy face”
group, or “unhappy face” group, the researcher asked the child: “Now I want you to rank
the beverages from most preferred to least preferred, starting with the beverages in the
“happy face” group. After the stimuli in the “happy face” group were rank-ordered, the
same procedure was followed for the stimuli in the “unhappy face” group.
The procedure resulted in rank-orders from most preferred to least preferred. This
method was a modification of a method previously used by Birch 30
. In her research,
Birch used three categories (happy face, neutral face and sad face). Because of the small
number of stimuli in the present study we decided to use only two categories.
Chapter 7
118
Statistical analyses
The consumption of MDS was estimated by multiplying the frequency of consumption
of each food item by its standard serving size and the MDS content of each serving size 31
. This resulted in the estimated consumption of mono and disaccharide in g/day per
child. Differences in the consumption of mono and disaccharide within a group, between
different eating moments, or between different food groups, were tested for significance
by using Friedman analyses for ranks (Fr) and post hoc analyses 32
. Mann Whitney U
tests were performed to identify significant differences in MDS consumption, children’s
age, children’s BMI (weight/height2), parent’s age and parents’ BMI between different
groups of children
In the analyses concerning restriction, we only analyzed the number of times parents
answered “never” to give their children freedom to choose a specific product. It
appeared that the options “sometimes, rarely and often” were ambiguous terms for some
of the parents according to the remarks parents wrote on the questionnaires, whereas
“never” was not ambiguous. In order to calculate an individual score for MDS
restriction, the number of times parents reported “never” to give their children freedom
to choose a specific product was summed.
Subsequently, children were divided into two groups based on the frequency parents
reported “never” to give their child freedom of choice. Children of parents who reported
to be stricter than half of all the subjects (upper median) were grouped together (High-
Restriction group). All children of parents who were less strict than half of all the
subjects (lower median) were grouped together in another group (Low-Restrictive
group). Children, whose parents were on the median concerning strictness, were grouped
in the High-Restriction group.
The different statements concerning parents’ background ideas about sugar received a
score and were categorized into three main issues: 1) “The liking of sweetness is
modifiable”, 2) “Sugar has an instrumental function (i.e. Reward, comfort) ” and 3)
“Sugar has a negative effect on health”. For each main issue the mean score ± sd was
calculated. The internal consistency of the three main issues was assessed with
Crohnbach’s alpha. Because of the exploratory character of this part of the
questionnaire, the lower limit for Crohnbach ‘s alpha was set at 0.60 33
.
In order to have individual scores that indicate the subjects’ preference for sucrose in
orangeade, preference scores were calculated as follows. The preference score for the
paired comparison method was calculated by assigning a score of “5” to the solution
with the highest concentration of sucrose. The solution with the second highest
concentration of sucrose received a score of “4” etc. The total score was obtained by
summing the numbers of the most preferred solution within each pair. This gave each

119
Sweet preferences: role of parents
person a preference score between 20 (1+1+1+1+2+2+2+3+3+4) and 40
(5+5+5+5+4+4+4+3+3+2). In which a score of 20 indicated that the subject always
picked the lowest concentration of sucrose in orangeade as most preferred. A score of 40
indicated that the subject always picked the highest concentration of sucrose in
orangeade as most preferred.
The preference score for the rank-ordering method was calculated by assigning a score
of “5” to the solution with the highest concentration of sucrose. The solution with the
second highest concentration of sucrose received a score of “4” etc. For the rank-order
test for preference, a preference score was estimated by the following formula:
Preference score=4 * P1 + 3 * P2 + 2 * P3 + 1 * P4,
Where P1 is the ‘score’ of the concentration with that was most preferred; P2 is the
‘score’ of the concentration that was second-most preferred; P3 is the ‘score’ of the
concentration that was third-most preferred; and P4 is the ‘score’ of the concentration
that was fourth-most preferred. This resulted in a second preference score between 20
and 40 ( 34
for further details).
In order to determine significant correlations between the paired and the rank-order tests,
Spearman’s rho correlation coefficients were calculated between the measures of the
paired comparison tests and rank-order tests. The consistency between the paired and
rank-order test for preference was calculated by transforming the rank-order tests into 10
pairs, with the following assumption: if solution “a” was preferred over solution “b”, and
solution “b” was preferred over solution “c”, then solution “a” was preferred over
solution “c”. Next, these 10 pairs were compared to the 10 pairs of the paired
comparison test. The consistency was then calculated by determining the percentage of
pairs that was judged in the same order in both the rank-order and the paired comparison
test. Mann-Whithney U tests were applied to determine whether there were significant
differences in preference between High- and Low-Restriction children.
All data were analyzed by using SPSS (SPSS version 11.01. LEAD technologies, US)
for the main frame at a critical value of P<0.05. All summary statistics are expressed as
means ± sd.
RESULTS
MDS restriction rules and social-demographics
Parents in the High-Restriction group, answered “never” on more than 42% (median) of
the questions concerning freedom of choice (mean=51 ± 7%). Parents in the Low-
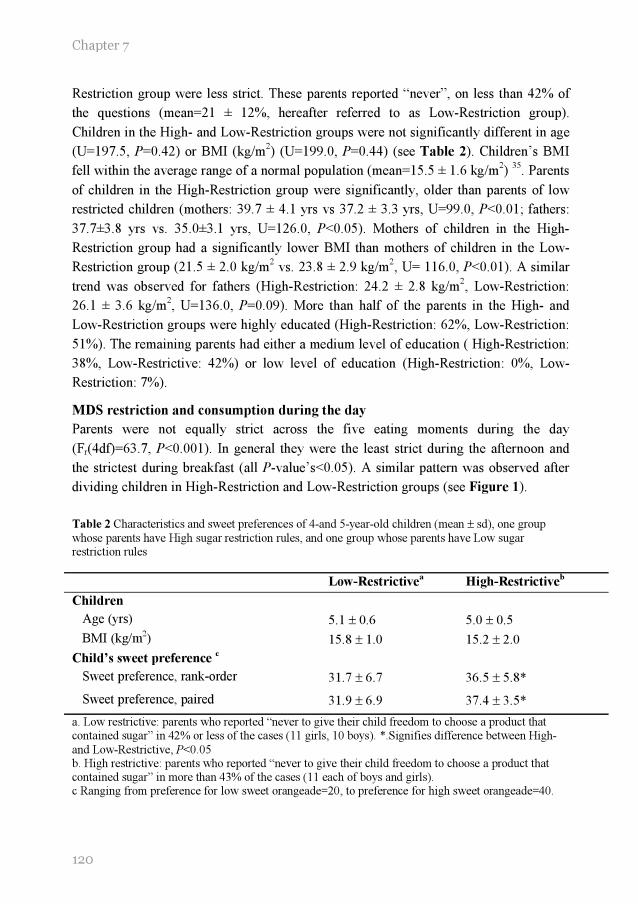
Chapter 7
120
Restriction group were less strict. These parents reported “never”, on less than 42% of
the questions (mean=21 ± 12%, hereafter referred to as Low-Restriction group).
Children in the High- and Low-Restriction groups were not significantly different in age
(U=197.5, P=0.42) or BMI (kg/m2) (U=199.0, P=0.44) (see Table 2). Children’s BMI
fell within the average range of a normal population (mean=15.5 ± 1.6 kg/m2)
35. Parents
of children in the High-Restriction group were significantly, older than parents of low
restricted children (mothers: 39.7 ± 4.1 yrs vs 37.2 ± 3.3 yrs, U=99.0, P<0.01; fathers:
37.7±3.8 yrs vs. 35.0±3.1 yrs, U=126.0, P<0.05). Mothers of children in the High-
Restriction group had a significantly lower BMI than mothers of children in the Low-
Restriction group (21.5 ± 2.0 kg/m2 vs. 23.8 ± 2.9 kg/m
2, U= 116.0, P<0.01). A similar
trend was observed for fathers (High-Restriction: 24.2 ± 2.8 kg/m2, Low-Restriction:
26.1 ± 3.6 kg/m2, U=136.0, P=0.09). More than half of the parents in the High- and
Low-Restriction groups were highly educated (High-Restriction: 62%, Low-Restriction:
51%). The remaining parents had either a medium level of education ( High-Restriction:
38%, Low-Restrictive: 42%) or low level of education (High-Restriction: 0%, Low-
Restriction: 7%).
MDS restriction and consumption during the day
Parents were not equally strict across the five eating moments during the day
(Fr(4df)=63.7, P<0.001). In general they were the least strict during the afternoon and
the strictest during breakfast (all P-value’s<0.05). A similar pattern was observed after
dividing children in High-Restriction and Low-Restriction groups (see Figure 1).
Table 2 Characteristics and sweet preferences of 4-and 5-year-old children (mean ± sd), one group
whose parents have High sugar restriction rules, and one group whose parents have Low sugar restriction rules
Low-Restrictivea High-Restrictive
b
Children
Age (yrs) 5.1 ± 0.6 5.0 ± 0.5
BMI (kg/m2) 15.8 ± 1.0 15.2 ± 2.0
Child’s sweet preference c
Sweet preference, rank-order 31.7 ± 6.7 36.5 ± 5.8*
Sweet preference, paired 31.9 ± 6.9 37.4 ± 3.5*
a. Low restrictive: parents who reported “never to give their child freedom to choose a product that contained sugar” in 42% or less of the cases (11 girls, 10 boys). *.Signifies difference between High-
and Low-Restrictive, P<0.05 b. High restrictive: parents who reported “never to give their child freedom to choose a product that contained sugar” in more than 43% of the cases (11 each of boys and girls). c Ranging from preference for low sweet orangeade=20, to preference for high sweet orangeade=40.
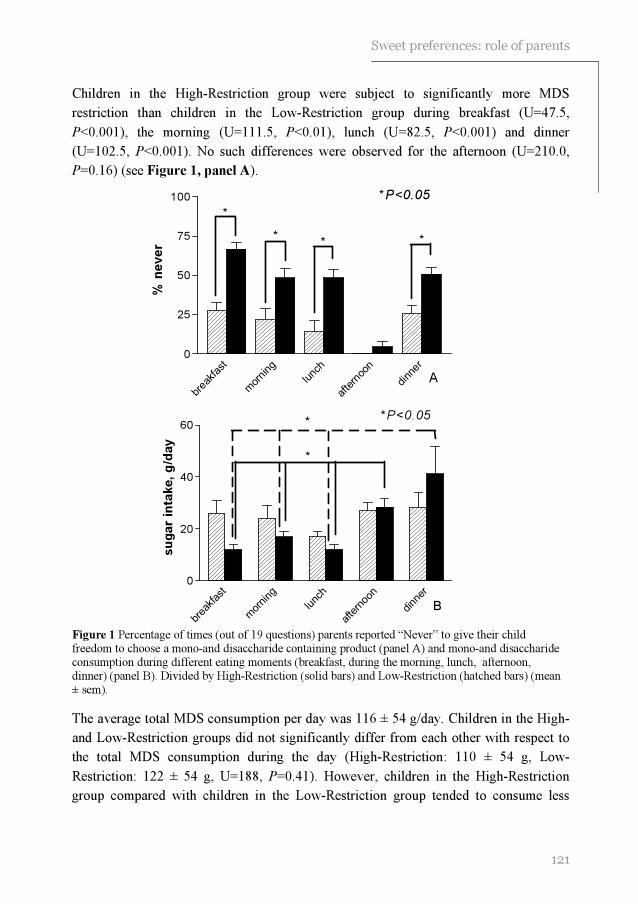
121
Sweet preferences: role of parents
breakfast
morning
lunch
afternoon
dinner
0
25
50
75
100
% n
ev
er
*
***
*P<0.05
A
breakfast
morning
lunch
afternoon
dinner
0
20
40
60
su
gar
inta
ke,
g/d
ay
*
*P<0.05*
B
Children in the High-Restriction group were subject to significantly more MDS
restriction than children in the Low-Restriction group during breakfast (U=47.5,
P<0.001), the morning (U=111.5, P<0.01), lunch (U=82.5, P<0.001) and dinner
(U=102.5, P<0.001). No such differences were observed for the afternoon (U=210.0,
P=0.16) (see Figure 1, panel A).
Figure 1 Percentage of times (out of 19 questions) parents reported “Never” to give their child freedom to choose a mono-and disaccharide containing product (panel A) and mono-and disaccharide consumption during different eating moments (breakfast, during the morning, lunch, afternoon, dinner) (panel B). Divided by High-Restriction (solid bars) and Low-Restriction (hatched bars) (mean ± sem).
The average total MDS consumption per day was 116 ± 54 g/day. Children in the High-
and Low-Restriction groups did not significantly differ from each other with respect to
the total MDS consumption during the day (High-Restriction: 110 ± 54 g, Low-
Restriction: 122 ± 54 g, U=188, P=0.41). However, children in the High-Restriction
group compared with children in the Low-Restriction group tended to consume less

Chapter 7
122
MDS during breakfast (U=153.0, P=0.09) and lunch (U=149.0, P<0.07). Furthermore,
children in the High-Restriction group consumed more MDS during the afternoon (29%
from the total daily sugar intake) and during dinner (31% from the total daily sugar
intake) than during the other eating moments (see Figure 1, panel B). However, this
was not the case for children in the Low-Restriction group. They consumed about the
same amount of MDS across the 5 different eating moments.
When MDS consumption was expressed as ‘gram food that contained MDS’, significant
differences between the High-and Low-Restriction groups were observed. That is,
children in the High-Restriction group compared with children in the Low-Restriction
group consumed less food that contained MDS during breakfast (U=117.0, P<0.009) and
during lunch (U=121.5, P<0.05). High-Restricted children also consumed less MDS-
containing foods during the day (U=127.0, P<0.05), than Low-Restricted children.
MDS restriction for and consumption of different food groups
Children in the High-Restriction group received different degrees of restriction for sweet
beverages, candies and other sweet food items (Fr(2df)=21.8, P<0.001). That is, they
were significantly more restricted to choose a sweet beverage, than to choose candies or
other sweet food items (both P’s<0.05) (see Figure 2, panel A). Children in the Low-
Restriction group were not restricted significantly different across the three different
food groups (Fr(2df)=0.09, P=0.96) (see Figure 2, panel A).
Children in the High-Restriction group were more restricted to choose sweet beverages
(U=33.5, P<0.001) and other sweet food items (U=121.0, P<0.01), than children in the
Low-Restriction group. No significant difference was observed for candies in this
respect (U=189, P=0.24; see Figure 2, panel A).
Children in the Low-Restriction group consumed significantly more MDS from sweet
beverages (63 ± 37 g/day) than children in the High-Restriction group (40 ± 23 g/day)
(U=114.0, P<0.01). Not only did they consume more MDS derived from sweet
beverages, they also consumed more MDS from sweet beverages as percentage of their
total MDS intake (52% ± 18 vs. 40% ± 23 from total MDS intake per day; U= 135.0,
P<0.05). No significant differences between the High- and Low-Restriction groups were
observed for candies (U=187.0, P<0.40) and other sweet food items (U=189.0, P=0.43).
When MDS consumption was expressed as ‘gram MDS-containing foods’, significant
differences between the High-and Low-Restriction groups were observed. That is,
children in the High-Restriction group compared with children in the Low-Restriction
group consumed less sweet beverages (U=120.5, P<0.05). Such difference was not
observed for “candies” (U=203.0, P=0.66), or “other sweet food items” (U=188.5,
P=0.42) (see Figure 2, panel B).

123
Sweet preferences: role of parents
Swee
t bev
erag
es
Can
dy
Oth
ers
0
25
50
75
100
*
*%
ne
ve
r
*P<0.05
Swee
t bev
erag
es
Can
dy
Oth
ers
0
100
200
300
400
500
600
700
*
tota
l c
on
su
mp
tio
n,
g/d
ay
*P<0.05
Figure 2 Percentage of times (out of 19 questions) parents reported “Never” to give their child freedom to choose a mono-and disaccharide containing product (panel A) and consumption of mono-and disaccharide containing foods (i.e. Sweet beverages, Candy an Other sweet food items) (panel B).
Divided by High-Restriction (solid bars) and Low-Restriction (hatched bars) (mean ± sem).
Background of MDS restriction rules
Table 3 shows parents’ response on the different statements. The Cronbach’s alpha’s of
the three main issues reached at least 0.60. In general parents agreed on the statement
“Eating much sugar is bad for children” (see Table 3). Parents of the High- and Low-
Restriction groups did not show an equal agreement across the different main issues
(High-Restriction: Fr(2df)=10.2, P<0.01; Low-Restriction: Fr(2df)=16.4, P<0.001).
Parents of children in the High-Restriction group agreed the least on statements within
the main issue “sweetness can be used as an instrument” (both P-value’s <0.05). No
significant difference in agreement was observed between the statements within the

Chapter 7
124
0.14 0.20 0.29 0.42 0.61
0
1
2
3
4Most preferred
Least preferred
Sucrose concentration in orange beverage (M)
Nu
mb
er o
f t
ime
s c
ho
se
n
other two main issues (i.e. “sugar has a negative effect on health” and “preference for
sweetness is modifiable”). Parents of children in the Low-Restriction group agreed more
on the statements concerning “sugar has an negative effect on health” than on the
statements concerning “eating much sugar is bad for children” and “preference for
sweetness is modifiable” (both P-value’s<0.05). No significant difference in agreement
was observed between the statements concerning “eating much sugar is bad for
children” and “preference for sweetness is modifiable”. No significant difference in
agreement that concerned the statements was observed between the High- and Low-
Restriction groups.
Preference for sucrose in orangeade
The paired comparison and the rank-order test for preference showed a 70.1 ± 3.6%
consistency with each other and a correlation of r=0.63 (see 27
for more details).
Children in the High-Restriction group preferred higher concentrations of sucrose in
orangeade than children in the Low-Restriction group. This was significant during the
rank-order test (U=103.0, P<0.01), as well as during the paired comparison test
(U=102.0, P<0.01) (see Table 2 and Figure 3).
Figure 3 Number of times each solution was chosen as most preferred during the paired comparison test for preference. Shown for High-Restriction (●) and Low-Restriction (□) children (mean ± sem)
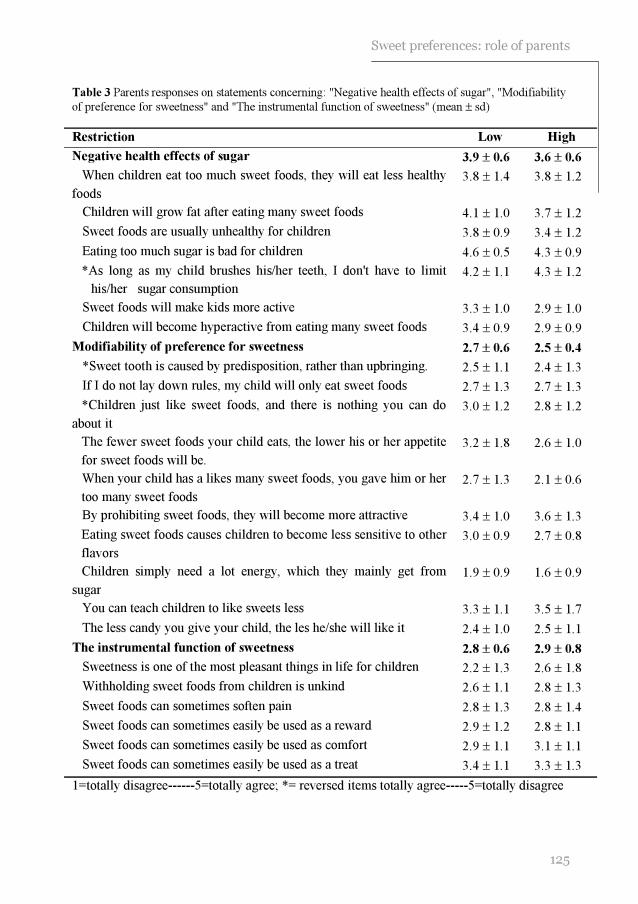
125
Sweet preferences: role of parents
Table 3 Parents responses on statements concerning: "Negative health effects of sugar", "Modifiability
of preference for sweetness" and "The instrumental function of sweetness" (mean ± sd)
Restriction Low High
Negative health effects of sugar 3.9 ± 0.6 3.6 ± 0.6
When children eat too much sweet foods, they will eat less healthy
foods
3.8 ± 1.4 3.8 ± 1.2
Children will grow fat after eating many sweet foods 4.1 ± 1.0 3.7 ± 1.2
Sweet foods are usually unhealthy for children 3.8 ± 0.9 3.4 ± 1.2
Eating too much sugar is bad for children 4.6 ± 0.5 4.3 ± 0.9
*As long as my child brushes his/her teeth, I don't have to limit
his/her sugar consumption
4.2 ± 1.1 4.3 ± 1.2
Sweet foods will make kids more active 3.3 ± 1.0 2.9 ± 1.0
Children will become hyperactive from eating many sweet foods 3.4 ± 0.9 2.9 ± 0.9
Modifiability of preference for sweetness 2.7 ± 0.6 2.5 ± 0.4
*Sweet tooth is caused by predisposition, rather than upbringing. 2.5 ± 1.1 2.4 ± 1.3
If I do not lay down rules, my child will only eat sweet foods 2.7 ± 1.3 2.7 ± 1.3
*Children just like sweet foods, and there is nothing you can do
about it
3.0 ± 1.2 2.8 ± 1.2
The fewer sweet foods your child eats, the lower his or her appetite
for sweet foods will be.
3.2 ± 1.8 2.6 ± 1.0
When your child has a likes many sweet foods, you gave him or her
too many sweet foods
2.7 ± 1.3 2.1 ± 0.6
By prohibiting sweet foods, they will become more attractive 3.4 ± 1.0 3.6 ± 1.3
Eating sweet foods causes children to become less sensitive to other
flavors
3.0 ± 0.9 2.7 ± 0.8
Children simply need a lot energy, which they mainly get from
sugar
1.9 ± 0.9 1.6 ± 0.9
You can teach children to like sweets less 3.3 ± 1.1 3.5 ± 1.7
The less candy you give your child, the les he/she will like it 2.4 ± 1.0 2.5 ± 1.1
The instrumental function of sweetness 2.8 ± 0.6 2.9 ± 0.8
Sweetness is one of the most pleasant things in life for children 2.2 ± 1.3 2.6 ± 1.8
Withholding sweet foods from children is unkind 2.6 ± 1.1 2.8 ± 1.3
Sweet foods can sometimes soften pain 2.8 ± 1.3 2.8 ± 1.4
Sweet foods can sometimes easily be used as a reward 2.9 ± 1.2 2.8 ± 1.1
Sweet foods can sometimes easily be used as comfort 2.9 ± 1.1 3.1 ± 1.1
Sweet foods can sometimes easily be used as a treat 3.4 ± 1.1 3.3 ± 1.3
1=totally disagree------5=totally agree; *= reversed items totally agree-----5=totally disagree

Chapter 7
126
Children in the Low-Restriction group did not significantly differentiate between the
different solutions during the paired comparison (Fr(4df)=5.1, P=0.28) or during the
rank-order test (Fr(4df)=5.5, P=0.24). This was in contrast with children in the High-
Restriction group. They significantly differentiated between the different solutions
during the paired comparison (Fr(4df)=52.9, P<0.001) and during the rank-order test
(Fr(4df)=35.7, P<0.001) (see Figure 3). However, a closer investigation of each subject
in the Low-Restriction group showed that the majority of children (71%) had a clear
preference for one of the five beverages. That was, 19% preferred the orangeade with
the lowest concentration of sucrose, 33% preferred the orangeade with the highest
concentration of sucrose and 19% preferred one of the intermediate orangeade. This was
in contrast with children in the High-Restriction group. None of those children preferred
the orangeade with the lowest concentration of sucrose, 55% preferred the orangeade
with the highest concentration of sucrose, and 27% preferred one of the intermediate
beverages.
DISCUSSION
The results of the present study suggest that children are the least MDS restricted during
the afternoon. Children who were highly restricted, consumed significantly less MDS
derived from sweetened beverages, and consumed less foods that contained MDS during
breakfast and lunch. Also the total consumption of foods that contained MDS was lower
for the highly restricted children, compared with the low restricted children. However,
the total daily consumption of MDS per se was not different for high- and low restricted
children. Furthermore, the present study suggests that the strength of MDS restriction
rules, enforced by parents, was positively related with children’s preferences for sucrose
in orangeade. With respect to the background ideas of MDS restriction rules, parents
agreed in general that sugar has a bad effect on health. In general low and high
restrictive parents had similar background ideas concerning MDS restriction rules.
Previous studies have repeatedly shown that parents can significantly influence their
children’s food consumption. This influence can be established by means of the parents’
own attitude and behavior towards food 22
, parental monitoring and control 25;26;36-38
, and
rewarding 39-41
. The present study suggests that parents are able to lower the
consumption of sweet beverages, and MDS-containing foods during breakfast and lunch,
by means of MDS restriction rules. But these rules appeared to have little influence on
MDS consumption per se. This observation can be explained by at least two hypotheses.
First, MDS restriction rules were effective during meals in which bread is generally
consumed. The food items that contained the most MDS (i.e. candies and sweet yoghurt)
are normally not consumed during these meals, but rather during the afternoon and

127
Sweet preferences: role of parents
dinner. During the afternoon and dinner MDS restriction rules did not appear to affect
the consumption of foods that contained MDS. Along the same line, foods that were rich
in MDS, such as candies, were not affected by MDS restriction rules. Foods that were
affected by MDS restriction rules (i.e. sweet beverages) contained the least percentage
of MDS. This could explain that children in the High-Restriction group consumed less
grams of food that contained MDS, but not less MDS per se.
We speculate that the high level of MDS restriction decreased the consumption of all
foods that contained MDS, not only sweet beverages. This decrease in consumption may
have resulted in a lower consumption of sweet beverages and equal consumption of the
other food items that contained MDS. In an unrestricted setting, with no parental control,
children in the High-Restriction group might have consumed more MDS rich foods, than
children in the Low-Restriction group. This hypothesis is supported by the finding that
children in the High-Restriction group preferred higher concentrations of sucrose in
orangeade than children in the Low-Restriction group. Conner and colleagues suggested
that preference for high concentrations of MDS in an experimental beverage as
measured in a sensory experiment, is related to preference for MDS in a variety of foods
in real life 42;43
. Preference for high concentrations of MDS could lead to high
consumption of food that contain MDS, if children are or not limited in their access to
these foods 8;9
. In order to come to a similar level of consumption of these foods other
than sweet beverages, children in the High-Restriction group needed perhaps more
restriction rules than children in the Low-Restriction group. In that case one could
hypothesize that MDS restriction rules are effective in lowering children’s consumption
of all foods that contain MDS.
A second hypothesis is that parents are successful in lowering their children’s
consumption of MDS, but only when the rules are very tight. As soon as parents loosen
their tightness, MDS restriction rules do not lower consumption of foods that contain
MDS. This hypothesis is supported by the finding that parents in the High-Restriction
group were the strictest with respect to sweet beverages. Moreover, it is this food group
in which the MDS consumption of children in the High-Restriction group was
significantly lower. For the remaining two food groups (i.e. candies and other sweet
food items), no significant differences in the consumption of MDS was observed. In
general, restriction rules might not always have been strict enough to result in a
difference in consumption of MDS between the High-and Low-Restriction groups.
Although MDS restriction rules were related to a lower consumption of foods that
contained MDS, restriction rules may result in a preference for high concentrations of
MDS in food. This preference could then lead to a high consumption of foods that
contain MDS in the absence of parental control. However, this effect may be
unintended. This hypothesis is in line with several experimental studies, which
Chapter 7
128
suggested that food restriction could lead to an increased desire and preference for the
restricted foods 25;26
. Similarly, Spruijt-Metz and colleagues demonstrated that mothers’
concern for her children’s weight was positively related to higher total fat mass of their
children 44
. Furthermore, they suggested that mothers’ pressure to eat was related to
lower total fat mass of their children. Johnson and Birch suggested that mothers who
highly controlled their children’s food intake had children who showed less ability to
self regulate food intake 37
. Along the same line, Carper and colleagues suggested that
high parental control over feeding, has the potential to promote the development of
dietary restraint and disinhibition among girls at a very early age 36
. In other words, at
least in the case of rules that are determined to restrict or control children’s food
consumption, in the absence of parental control children may do the opposite of what
parents want them to do.
The present study, however, did not investigate the causal relationship between
preference for sucrose in orangeade and restriction. We speculate that children who had
a preference for high sweet foods were more likely to be subject to restriction. This
could explain why no difference in attitude of parents concerning sugar consumption
was found between the Low-and High-Restriction groups.
In general, parents in the present study did agree that sugar is not a healthy food choice
(“eating much sugar is bad for children”). This agreement might partly be based on the
assumed negative role of sugar consumption in child obesity and dental caries. In the
present study this idea is supported by the large agreement on the statements “Children
will grow fat when eating many sweet foods”, and “As long as my child brushes his/her
teeth, I don't have to limit his/her sugar consumption”.
The results of the present study cannot be generalized to all parents because most
parents were highly educated. Previous studies suggested that the educational level of
parents is positively related with the tendency to impose rules that aim to restrict the
consumption of certain foods 45
.
It also needs to be noted that mothers of children in the High-Restriction group had a
lower BMI than mothers of children in the Low-Restriction group. This is in contrast
with previous research who did not find a relationship between maternal BMI and the
degree they controlled their children’s food consumption 25;38;46
, however, Fisher and
Birch suggested that a lower BMI of parents was associated with a larger degree of food
restriction they enforced. In the study of Fisher and Birch 25
, similar to the present study,
parents reported their own height and weight. It has been suggested that restrained eaters 47
and those who were dissatisfied with their own body image 48
were more likely to
underestimate their weight. Hypothetically, parents who enforced many restrictive rules
for their children, were more concerned about their own weight than parents who
enforced less restrictive rules. Previous research suggested that those mothers for whom

129
Sweet preferences: role of parents
weight is an issue for themselves, exert most control over their daughter’s eating habits 46
.
Furthermore, the number of subjects in each group was rather small, this could have
resulted in non significant findings. Such as the lack of differences in consumption of
MDS between the High-and Low-Restriction groups. It is, however, unlikely that a
statistically significant difference in total consumption of MDS can easily be obtained
by increasing the number of subjects. In the present study the difference in consumption
of MDS between both groups was only 12 gram/day on an average total of 116
gram/day. Also, the lack of increasing preference with an increasing concentration of
sucrose in orangeade within the Low-Restriction group could be a result of the low
number of subjects. It is, however, more likely that this is a result of the diversity in
preferences within this group. Recall that the majority of these children showed a clear
preference for a specific concentration of sucrose in the orangeade. Moreover, the
preference data obtained from the paired comparison tests and the rank-order tests
showed a high consistency with each other. This suggests that preference was reliably
measured in the present study (see 27
).
It is important to note that the used questionnaire had some important limitations. The
amount of MDS consumed was measured by rather rough estimations. It was assumed
that a standard portion size was given by the parents each time children consumed a
certain food, the standard portion size was, however, not defined in the questionnaire.
No actual amount of foods that contained MDS was measured. Furthermore, milk and
fruits were not included in the questionnaire, because the researchers were interested in
foods with added MDS. Hypothetically, children in the High-Restriction group eat a
large amount of milk and fruits, in order to meet their liking for sweet taste.
Furthermore, both consumption and restriction of foods that contained MDS were
measured in one questionnaire, this could have resulted in bias. Parents could
deliberately have underestimated their children’s consumption of MDS, just to be in line
with their previously given answers concerning MDS restriction. In order to minimize
bias, questions concerning consumption and restriction were completely separated in
two different parts of the questionnaire.
Not all 13-food items were assessed at each eating occasion, but rather at those
occasions they are generally consumed. In case that subjects did not have a ‘normal’
eating pattern, it is possible that the actual consumption of the 13 food items was
underestimated. However, the sugar consumption founded in the present study was in
line with large and extended food consumption data 10
. This suggests that the present
findings give an accurate estimation of the daily consumption of MDS.
In conclusion, the present study suggests that rules aimed to restrict children to consume
foods that contain MDS, are effective during breakfast and lunch. These restriction rules
Chapter 7
130
may also be effective in lowering the consumption of beverages that contain MDS.
However, these rules may lead to an enhanced preference for high concentrations of
MDS. Therefore, restriction rules may have the unintended effect of raising consumption
of MDS of children, when parents are not able to control their children’s consumption of
MDS. Future research is needed to further investigate the background of rules that aimed
to restrict the consumption of foods that contain MDS and the long term effect of MDS
restriction rules on children’s preference for high concentrations of MDS and
consumption of MDS.
REFERENCES
1. Beauchamp GK, Moran M. Dietary experience and sweet taste preference in human infants. Appetite 1982; 3: 139-152.
2. Cowart BJ. Development of taste perception in humans: sensitivity and preference throughout the life span. Psychological bulletin 1981; 90: 43-73.
3. Desor JA, Maller O, Turner RE. Taste in acceptance of sugars by human infants. Journal of comparative and physiological psychology 1973; 3: 496-501.
4. Steiner JE. Facial expressions of the neonate infant indication the hedonics of food-related chemical stimuli. In: Weiffenbach JM, ed. Taste and development: the genesis of sweet preference, Washington, DC: U.S. Government Printing Office, 1977: 173-188.
5. Desor JA, Beauchamp GK. Longitudinal changes in sweet preferences in humans. Physiology
and behavior 1987; 39: 639-641.
6. Zandstra EH, De Graaf C. Sensory perception and pleasantness of orange beverages from childhood to old age. Food quality and preference 1998; 9: 5-12.
7. Liem DG, Mennella JA. Sweet and sour preferences during childhood; role of early experiences. Developmental psychobiology 2002; 41: 388-395.
8. Olson CM, Gemmill KP. Association of sweet preference and food selection among four to five year old children. Ecology of food and nutrition. 1981; 11: 145-150.
9. Pangborn RM, Giovanni ME. Dietary intake of sweet foods and of dairy fats and resultant
gustatory responses to sugar in lemonade and to fat in milk. Appetite 1984; 5: 317-327.
10. Voorlichtings bureau voor de voeding. Zo eet Nederland 1998, This is the way the Netherlands eats 1998. Delft: Van Marken Delft Drukkers, 2002.
11. Borssen E, Stecksen-Blicks C. Risk factors for dental caries in 2-year-old children. Swedish dental journal 1998; 22: 9-14.
12. Jamel HA, Sheiham A, Watt RG, Cowell CR. Sweet preference, consumption of sweet tea and dental caries; studies in urban and rural Iraqi populations. International dental journal 1997; 47: 213-217.
13. Rugg-Gunn AJ. Dietary factors in dental disease. In: Garrow JS, James WPT, eds. Human nutrition and dietetics, 9th ed. Edinburgh, UK: Churchill Livingstone, 1993: 567-583.
14. Dennison BA, Rockwell HL, Nichols MJ, Jenkins P. Children's growth parameters vary by type of fruit juice consumed. Journal of the American college nutrition 1999; 18: 346-352.
131
Sweet preferences: role of parents
15. Dennison BA, Rockwell HL, Baker SL. Excess fruit juice consumption by preschool-aged children is associated with short stature and obesity. Pediatrics 1997; 99: 15-22.
16. Ludwig DS, Peterson KE, Gortmaker SL. Relation between consumption of sugar-sweetened drinks and childhood obesity: a prospective, observational analysis. Lancet 2001; 357: 505-508.
17. Gibson S. Hypothesis: parents may selectively restrict sugar-containing foods for pre-school children with a high BMI. International journal of food sciences and nutrition 1998; 49: 65-70.
18. Lissau I, Breum L, Sorensen TI. Maternal attitude to sweet eating habits and risk of overweight in offspring: a ten-year prospective population study. International journal of obesity and related metabolic disorders 1993; 17: 125-129.
19. Wolraich ML, Lindgren SD, Stumbo PJ, Stegink LD, Appelbaum MI, Kiritsy MC. Effects of diets high in sucrose or aspartame on the behavior and cognitive performance of children. The New England journal of medicine 1994; 330: 301-307.
20. Wolraich ML, Wilson DB, White JW. The effect of sugar on behavior or cognition in children. A meta-analysis. The journal of the American medical association 1995; 274: 1617-1621.
21. Fischler C. Learned versus "sponteneous" dietetics: French mothers' views of what children should eat. Social science information 1986; 25: 945-965.
22. Ritchey N, Olson C. Relationship between family variables and children's preference for and consumption of sweet foods. Ecology of food and nutrition. 1983; 13: 257-266.
23. Lähteenmäki L, Tuorila H. Attitudes towards sweetness as predictors of liking and use of
various sweet foods. Ecology of food and nutrition 1994; 31: 161-170.
24. Casey R, Rozin P. Changing children's food preferences: parent opinions. Appetite 1989; 12: 171-182.
25. Fisher JO, Birch LL. Restricting access to palatable foods affects children's behavioral response, food selection, and intake. American journal of clinical nutrition 1999; 69: 1264-1272.
26. Fisher JO, Birch LL. Restricting access to foods and children's eating. Appetite 1999; 32: 405-419.
27. Liem DG, Mars M, De Graaf C. Consistency of sensory testing with 4- and 5-year old children. Food quality and preference 2004; 15: 541-548.
28. Kimmel SA, Sigman-Grant M, Guinard J-X. Sensory testing with young children. Food technology 1994; 48: 92-99.
29. Liem DG, Mennella JA. Heightened sour preferences during childhood. Chemical senses 2003; 28: 173-180.
30. Birch LL. The relationship between children's food preferences and those of their parents. Journal of nutrition education 1980; 12: 14-18.
31. Stichting Nederlandse voedingsmiddelenbestand. Dutch food composition table, NEVO tabel. Den Haag: Voorlichtings buro voor de voeding, 1996
32. Siegel S, Castellan NJ. Nonparametric statistics for behavioral sciences. New York: McGraw-Hill, 1988.
Chapter 7
132
33. Hair JF, Anderson RE, Tatham RL, Black WC. Factor analyses. In: Hair JF, Anderson RE, Tatham RL, Black WC, eds. Multivariate data analysis, 5th ed. Upper Saddle River, New Jersey: Prentice- Hall Inc, 1998: 87-138.
34. De Graaf C, Zandstra EH. Sweetness intensity and pleasantness in children, adolescents, and adults. Physiology and behavior 1999; 67: 513-520.
35. Hammer LD, Robinson TN. Child and adolescent obesity. In: Levin MD, Carey WB, Crocker AC, eds. Developmental-behavioral pediatrics, 3rd ed. Philadelphia: W.B. Saunders company, 1999: 370-379.
36. Carper JL, Orlet FJ, Birch LL. Young girls' emerging dietary restraint and disinhibition are related to parental control in child feeding. Appetite 2000; 35: 121-129.
37. Johnson SL, Birch LL. Parents' and children's adiposity and eating style. Pediatrics 1994; 94: 653-661.
38. Klesges RC, Stein RJ, Eck LH, Isbell TR, Klesges LM. Parental influence on food selection in young children and its relationships to childhood obesity. American journal of clinical
nutrition 1991; 53: 859-864.
39. Birch LL, Zimmerman SI, Hind H. The influence of social-affective context on the formation of children's food preferences. Child development 1980; 51: 856-861.
40. Horne PJ, Lowe CF, Fleming PF, Dowey AJ. An effective procedure for changing food preferences in 5-7-year-old children. The proceedings of the nutrition society 1995; 54: 441-452.
41. Wardle J, Herrera ML, Cooke L, Gibson EL. Modifying children's food preferences: the effects of exposure and reward on acceptance of an unfamiliar vegetable. European journal
of clinical nutrition 2003; 57: 341-348.
42. Conner MT, Booth DA. Preferred sweetness of a lime drink and preference for sweet over non-sweet foods, related to sex and reported age and body weight. Appetite 1988; 10: 25-35.
43. Conner MT, Haddon AV, Pickering ES, Booth DA. Sweet tooth demonstrated: individual differences in preference for both sweet foods and foods highly sweetened. The journal of applied psychology 1988; 73: 275-280.
44. Spruijt-Metz D, Lindquist CH, Birch LL, Fisher JO, Goran MI. Relation between mothers'
child-feeding practices and children's adiposity. The American journal of clinical nutrition 2002; 75: 581-586.
45. Hupkens CLH, Knibbe RA, Otterlo van AH. Class differences in the food rules mothers impose on their children: a cross-national study. Social science & medicine 1998; 9: 1331-1339.
46. Tiggemann M, Lowes J. Predictors of maternal control over children's eating behaviour. Appetite 2002; 39: 1-7.
47. Shapiro JR, Anderson DA. The effects of restraint, gender, and body mass index on the
accuracy of self-reported weight. The International journal of eating disorders 2003; 34: 177-180.
48. Novotny JA, Rumpler WV, Riddick H, Herbert, JR, Rhodes, D, Judd, J, Baer DJ,
McDowell M, Briefel R. Personality characteristics as predictors of underreporting of energy intake on 24-hour dietary recall interviews. Journal of the American dietetic association 2003; 103: 1146-1151.


88 Djin Gie Liem
Kees de Graaf Sweet and sour preferences in
young children and adults: role
of repeated exposure
Physiology & behavior, in press*
Chapter 8
136
ABSTRACT
Background: Previous studies suggested that repeated exposure might lead to an
enhanced preference of the exposed food.
Objective: We investigated the influence of repeated exposure to orangeades with added
sucrose and different concentrations of citric acid, on the taste preferences of 6-to-11-
year-old children and young adults.
Design: During an intervention study of eight days, 59 children (9.2 ± 0.9 yrs) and 46
young adults (22 ± 2.0 yrs) received each day either an orangeade with a sweet taste, a
sour taste, or no orangeade (control). Before (baseline) and after the intervention,
preferences for a series of orangeades and yoghurt that varied in balance of sweet and
sour taste, were measured by means of a rank ordering procedure. The variation in
balance of sweet and sour taste was established by adding different amounts of citric
acid (orangeade: 0.009, 0.013, 0.020, 0.029, 0.043 and 0.065M added citric acid;
yoghurt: 0.027, 0.038, 0.056, 0.081, 0.12 and 0.17M added citric acid) to a stock
orangeade and yoghurt with 0.42 M sucrose. The sweet and sour tasting orangeade that
were consumed during the intervention were equally preferred at baseline.
Results: After an 8-day exposure to the sweet-orangeade, children’s preferences for this
orangeade (0.42 M sucrose) significantly increased (P<0.05). A similar trend was
observed for the yogurt with 0.42 M sucrose (P=0.09). An 8-day exposure to the sour-
orangeade, did not have a significant effect on children’s preference for this orangeade.
The taste preferences of adults did not change after the intervention. The control group
of children and adults did not show any change in preferences for sweet and sour tastes.
Conclusion: Sour taste preferences of children appeared to be more stable than
preferences for sweet taste. Adults taste preferences were more stable than children’s
taste preferences. Future research is needed to investigate whether the changed
preferences for sweet taste are stable over time and how these changed taste preferences
are related to a change in the consumption of sugar rich foods.
ACKNOWLEDGMENTS
We acknowledge the expert technical assistance of Ms Krista Lam and Ms Judie van den Elshout. Also the participation of the children and teachers at the Prinsenakker elementary school is greatly acknowledged. * accepted in revised form

137
Repeated exposure to sweet and sour taste
INTRODUCTION
In recent years obesity in children has been a growing health problem in Western
countries 1. Obesity in childhood is associated with risk factors for cardiovascular and
metabolic diseases such as diabetes 2. Childhood obesity is related with food choice and
intake 3;4
. Choice and intake of children are influenced by a variety of factors 5, among
which parental behavior 6-10
, social environment 11
, and sensory preferences 12-14
. The
present study will focus on sensory preferences.
Many studies showed that children have a preference for high concentrations of sucrose
in foods 15-20
. This preference for high concentrations of sucrose has been positively
related to a high consumption of sucrose containing foods 12;21;22
. Besides the preference
for sweet taste, a recent study suggested that some children also have a preference for
extremely sour tasting foods 23
. In both adults 24
as well as in children 23
it has been
suggested that those who preferred high concentrations of citric acid (sour taste),
experienced greater dietary diversity when compared to those who did not prefer these
high concentrations of citric acid. It remains to be investigated how preferences for
sweet and sour taste are developed and how they can be modulated.
It has been suggested that a long term repeated exposure to sweet 25
and sour 22;26
taste
during infancy, enhances young children’s preference for these tastes. Beauchamp and
co-workers suggested that repeated exposure to sweetened water during infancy was
positively related to high preferences for sweet taste in water at two years of age 25
. In
the same line, recent studies have suggested that repeated exposure to a sour tasting baby
formula during infancy is related to a high preference for sour taste in young children 22;26
.
Causality could, however, not been drawn from these studies. Studies that did
investigate the effect of repeated exposure of a food on subsequent preference in an
experimental design, mostly used whole food products rather than being focused on one
taste dimension 27-29
. Moreover, most studies used novel foods 30-32
. An increase in
preference for novel foods after repeated exposure could also be due to reduction in food
neophobia rather than an increase in preference for the specific taste of the food 33
.
We investigated whether the preference for sweet and sour taste in two different foods
can be changed, in children and adults, after a short repeated exposure to sweet or sour
taste in orangeade.
Chapter 8
138
METHODS
General overview
Children and adults were divided into three groups. One group consumed for eight days
an orangeade with a sweet taste (hereafter referred to as Sweet-Group). Another group
consumed for eight days an orangeade with a sour taste (hereafter referred to as Sour-
Group). A third group did not consume any orangeade during these eight days (hereafter
referred to as Control-Group). Before (baseline) and after the intervention preference for
a series of Sweet-Sour-orangeade and yoghurt was determined. The sweet and sour-
orangeade were at baseline equally preferred (see determination of the exposure
concentration).
Subjects
Children
Sixty-three children who attended a primary school in Bennekom participated in the
study (see Table 1). The Sweet-Group and Sour-Group consisted of children from two
different classes who were randomly assigned to one of the two groups. Children in the
Control-Group were all classmates and shared the same classroom during school time.
This was done to prevent possible interaction between the Control-Group, and the
experimental groups (i.e. Sweet-Group and Sour-Group) during the time of testing. Four
children were excluded from the final analyses because they were not present during one
of the testing days. All children had a BMI that fell within the normal range for children
their age 34
and were healthy according to their parents. The characteristics of the
children are shown in Table 1.
Adults
Forty-six young adults who were students at the Wageningen University were randomly
assigned to either the Sweet-Group, Sour-Group or Control-Group. Characteristics of the
adults are shown in Table 1. All adults reported to be healthy and had a BMI that fell in
the normal range for adults 35
.
Exclusion criteria for participation of the children and adults were: sucrose restriction in
the diet on medical indication, and presumed allergies to sucrose and/or orangeades. The
study protocol was approved by the Ethics committee of the Wageningen University.
Written informed consent was obtained prior to testing from all participating adults and
parents of the children.
139
Repeated exposure to sweet and sour taste
Stimuli
Seven orangeades with similar concentrations of sucrose (0.42M of sucrose) and
different concentrations of added citric acid, i.e. 0.0, 0.009, 0.013, 0.020, 0.029, 0.043
and 0.065M added citric acid, were prepared by dissolving the citric acid (BUFA B.V.
pharmaceutical products, Uitgeest, The Netherlands) and sucrose (Sundale, Suiker Unie,
Breda, the Netherlands) in 23 grams concentrated orangeade and water for a total
volume of 1.0 liter. The concentrate (Lim 7644, Quest International, Naarden, The
Netherlands) was composed of concentrated orange juice, which contained natural
orange flavor (80 ppm/l beverage solute), 4.2% w/v citric acid, 1500 ppm benzoic acid,
4100 ppm ascorbic acid, and 44% w/v sugar (50% sucrose, 25% glucose, and 25%
fructose). In a similar manner seven lemon flavored sweet yoghurts (Biogarde™,
Almhof, Uniekaas Holding B.V., Veenendaal, the Netherlands; 0.42M sucrose, Sundale,
Suiker Unie, Breda, the Netherlands) with different concentrations of citric acid (0.0,
0.027, 0.038, 0.056, 0.081, 0.12 and 0.17M added citric acid) were prepared by
dissolving sucrose and citric acid in the lemon flavored yoghurt.
The orangeades and yoghurt were prepared one day in advance and were stored
overnight at 40C. The orangeades were presented in opaque cups in quantities of 200
gram each. The cups were covered with a lid, so subjects could not see the content of the
cup. Subjects drank the orangeade out of a straw. The yoghurts were presented in similar
opaque cups in quantities of 50 gram each. Subjects used a plastic spoon to eat the
yoghurt. All stimuli were presented at room temperature.
Procedure
Preference test
Children were tested at their primary school in a room which was familiar to them. Each
child had personal guidance from an adult, who was trained beforehand to become
familiar with the procedure. The testing room existed of 9 low tables, which were
situated in a circle. Children sat in front of their personal guide and faced outwards.
Preferences for the series of orangeades and yoghurt were both measured by means of a
rank-ordering procedure 36
. The preference tests existed of two sessions, one session for
the orangeades, one session for the yoghurt, separated by 20 min. The order of the
sessions was balanced across subjects. During each session, subjects tasted all stimuli
presented in the session and divided them into three categories, “most preferred”,
“neutral” and “least preferred”. These categories were made visual by a “happy face”, a
“neutral face” and a “sad face”. Subsequently, children were asked to taste and rank all
stimuli within each category from most preferred to least preferred. The procedure
resulted in a rank-order from most preferred to least preferred (see 36
). The order in

Chapter 8
140
which the stimuli were presented was randomized. Children took a sip of water after
tasting each stimulus.
Adults were tested in the tasting booths of the Wageningen University and used the
same procedure as children in order to determine their preferences for the series of
orangeades and yoghurt.
Determination of the exposure concentration
During the exposure period, subject in the Sweet-Group were, for eight days, exposed to
the orangeades with no added citric acid (0.42M sucrose). Previous research showed that
the addition of citric acid to a sucrose solution suppressed the perceived sweetness
intensity 37;38
. The orangeade with no added citric acid (hereafter referred to as Sweet-
orangeade), is therefore perceived as sweeter than those with added citric acid.
Subjects in the Sour-Group were exposed to the orangeade with added citric acid that
was at baseline equally preferred as the Sweet-orangeade. The orangeade with added
citric acid is perceived as more sour than the orangeade with no added citric acid 37;38
.
Preferences at baseline are shown in Figure 1.
Figure 1 suggests that at baseline children preferred the Sweet-orangeade similar as the
orangeade with 0.02M added citric acid, hereafter referred to as Sour-orangeade (Figure
1, panel A). Statistical analyses revealed that the Sweet and Sour-orangeades were
indeed not preferred significantly differently (P=0.90). Adults preferred the orangeade
with 0.043 M added citric acid not different from the orangeade with no added citric
acid (P=0.30). (see Figure 1, panel B).
This resulted in the following: children in the Sour-Group were, for eight days, exposed
to the orangeade that contained 0.42M sucrose and 0.02M added citric acid. Adults in
the Sour-Group were, for eight days, exposed to the orangeade that contained 0.42M
sucrose and 0.043M added citric acid.
Exposure period
On each morning, for a period of 8 days, children and adults were presented with 200
mL of orangeade as a midmorning snack. Children drank the orangeade while sitting in
their classroom. They were instructed to drink as much as they wanted to. As soon as a
child did not want to drink any more orangeade, or drank 200 mL, they were asked to
return the cup to one of the researchers who were standing in the back of the classroom.
Before and after consumption each cup with orangeade was weighed in order to
calculate the daily amount consumed.
Adults consumed the orangeade at home. They were instructed to drink as much as they
liked. As soon as they were done drinking they were instructed to mark on the cup how
much was left of the orangeade.
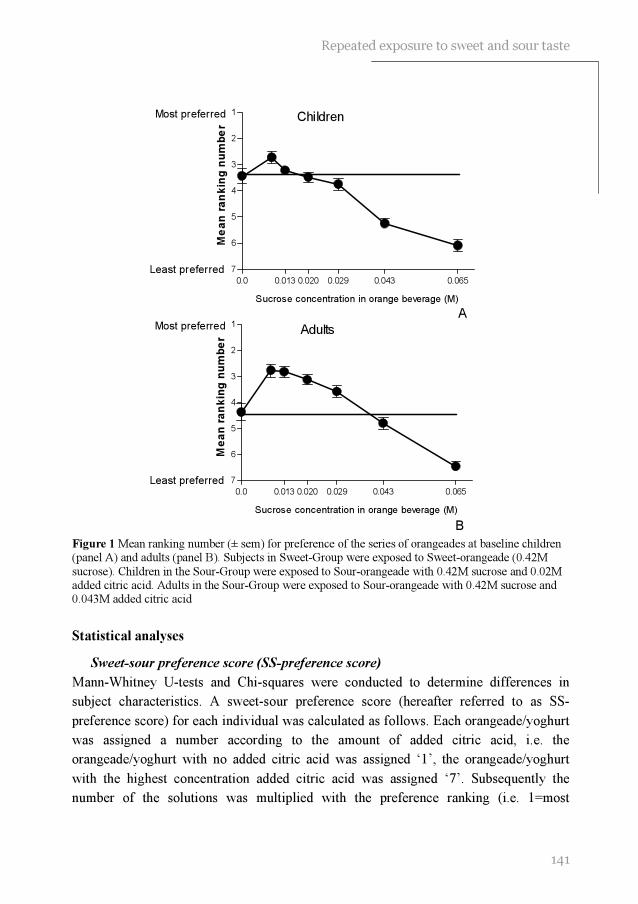
141
Repeated exposure to sweet and sour taste
0.0 0.013 0.020 0.029 0.043 0.065
1
2
3
4
5
6
7
Most preferred
Least preferred
Sucrose concentration in orange beverage (M)
Me
an
ra
nk
ing
nu
mb
er
Children
A
0.0 0.013 0.020 0.029 0.043 0.065
1
2
3
4
5
6
7
Most preferred
Least preferred
Sucrose concentration in orange beverage (M)
Me
an
ra
nk
ing
nu
mb
er
Adults
B
Figure 1 Mean ranking number (± sem) for preference of the series of orangeades at baseline children (panel A) and adults (panel B). Subjects in Sweet-Group were exposed to Sweet-orangeade (0.42M
sucrose). Children in the Sour-Group were exposed to Sour-orangeade with 0.42M sucrose and 0.02M added citric acid. Adults in the Sour-Group were exposed to Sour-orangeade with 0.42M sucrose and 0.043M added citric acid
Statistical analyses
Sweet-sour preference score (SS-preference score)
Mann-Whitney U-tests and Chi-squares were conducted to determine differences in
subject characteristics. A sweet-sour preference score (hereafter referred to as SS-
preference score) for each individual was calculated as follows. Each orangeade/yoghurt
was assigned a number according to the amount of added citric acid, i.e. the
orangeade/yoghurt with no added citric acid was assigned ‘1’, the orangeade/yoghurt
with the highest concentration added citric acid was assigned ‘7’. Subsequently the
number of the solutions was multiplied with the preference ranking (i.e. 1=most

Chapter 8
142
preferred, 7=least preferred) and summed across the preference ranking. By carrying out
this calculation, each subject received a SS-preference score, from 84 to 140 for the
series of orangeades and the series of yoghurt. This SS-preference score represented the
most preferred balance between sweet and sour taste in the orangeade. The lower the SS-
preference score the more subjects preferred sour taste over sweet taste and vice versa
(see 19
, for further details).
Spearman correlation coefficients (r) and 95%-confidence intervals (95%CI) were
calculated in order to determine 1) whether SS-preference scores for orangeade and
yoghurt were correlated and 2) whether baseline preference was significantly correlated
with average consumption of orangeade across the eight days of intervention.
To determine the degree of agreement between preference at baseline and after the
intervention, tau correlation coefficients (T) were calculated between the most preferred
orangeade at baseline and after the intervention. T was defined as [(#agreements -
#disagreements)/total number of pairs)]. For example, 10 subjects ranked 7 stimuli
according to their preference. After an intervention these 10 subjects ranked the 7
stimuli according to their preference again. If 8 subjects ranked the same stimulus as
most preferred before and after the intervention then, T= (8-2/10)=0.5. T could range
from –1 (total disagreement) to 1 (total agreement). The significance of T indicated a
statistical significant agreement between the most preferred orangeade at baseline and
after the intervention 39
. The same calculation was carried out for the most preferred
yoghurt.
The changed preference ranking was defined as: [preference ranking at baseline -
preference ranking after the intervention]. In order to determine whether subjects
changed their preference for the orangeade they were exposed to during the intervention,
Mann-Whitney U-tests were calculated between the changed preference ranking of the
Sweet-Group and the Control-Group, and between the Sour-Group and the Control
group. Similar analyses were carried out for the yoghurt that contained the same amount
of sucrose and citric acid as the beverage subjects were exposed to.
Wilcoxon Signed Ranks Test (Z) were performed in order to determine differences in
consumption of the orangeade during the first and last day of the intervention. All
summary statistics are expressed as means ± sd and levels of significance were P<0.05.
RESULTS
The characteristics of subjects in the Sour-Group, Sweet-Group and Control-Group are
listed in Table 1. No differences in gender or BMI were observed between the different
experimental groups within each age category (i.e. children and adults). Children in the
Control-Group were significantly older than children in the Sweet-Group (U=29.0,

143
Repeated exposure to sweet and sour taste
P<0.001) and children in the Sour-Group (U=35.5, P<0.001). Children in the Sweet-
Group, Sour-Group and Control-Group did not differ in their baseline SS-preference
scores.
Children showed a higher preference ranking for the sweetest tasting orangeade with no
added citric acid than adults (3.4 ± 2.3 vs 4.4 ± 2.1, were 1= most preferred and 7= least
preferred; U=1016, P<0.05). Baseline SS-preference scores for orangeades and yoghurt
were significantly correlated (children: r=0.40, 95%CI: 0.15 to 0.60, adults: r=0.43,
95%CI: 0.16 to 0.65).
Table 1 Characteristics of subjects, divided by Sweet-Group (Sweet), Sour-Group (Sour) and Control- Group (Control) (mean ± sd)
a-b- Significant difference P<0.05
Repeated exposure to sour, children (Sour-Group)
Children in the Sour-Group showed a significant agreement between the most preferred
orangeade at baseline and after the intervention (T=0.30, P<0.05). The same was
observed for yoghurt (T=0.41, P<0.05). They did not change their preference ranking of
the orangeade they consumed during the intervention (U=195.5, P=0.90) (Figure 2,
panel A).
During the intervention children in the Sour-Group consumed on average 150 ± 58 mL
of the Sour-orangeade per day, this was not correlated with the preference ranking of
this Sour-orangeade at baseline (r=0.01, 95%CI: -0.44 to 0.46). No significant
Children
Group Sweet Sour Control
Age (yrs) 8.7 ± 0.8a 8.9 ± 0.7
a 10.1 ± 0.5
b
Girls:Boys 7:12 12:8 12:8
Height (m) 1.37 ± 0.05 1.40 ± 0.06 1.48 ± 0.07
Weight (kg) 31.7 ± 5.6 32.7 ± 5.8 37.1 ± 9.4
BMI (kg/m2) 16.7 ± 2.4 16.6 ± 2.2 16.8 ± 3.0
Adults
Age (yrs) 22.2 ± 2.0 22.1 ± 2.1 22.2 ± 2.1
Girls:Boys 14:2 13:3 8:6
Height (m) 1.74 ± 0.07 1.74 ± 0.07 1.76 ± 0.09
Weight (kg) 67.6 ± 8.3 66.4 ± 9.4 69.2 ± 7.1
BMI (kg/m2) 22.4 ± 2.3 21.9 ± 2.8 22.3 ± 1.8

Chapter 8
144
differences in consumption were observed between the first day and last day of the
intervention (Z=-1.4, P=0.16; Figure 3, panel A).
Repeated exposure to sweet, children (Sweet-Group)
Children in the Sweet-Group did not show a significant agreement between the most
preferred orangeade at baseline and after the intervention (T=-0.08, P=0.67). The same
was observed for yoghurt (T=0.31; P=0.19). Closer investigation suggested that they
increased preferences for the Sweet-orangeade (0.42M sucrose and no added citric acid;
U=120.0, P<0.05) and tended to have increased preferences for sweet yoghurt (0.42M
sucrose and no added citric acid; U=129.5, P=0.09; Figure 2, panel B).
During the intervention they consumed on average 184 ± 28 mL Sweet-orangeade per
day, this was not significantly correlated with the baseline preference ranking for this
Sweet-orangeade (r=0.32, 95%CI: -0.19 to 0.70). Furthermore, they tended to have
consumed more of the orangeade during the last day of the intervention than during the
first day of the intervention (Z=-1.8, P=0.07) (Figure 3, panel A). Children in the Sweet-
Group consumed on average more orangeade during the intervention than children in the
Sour-Group (U=374.5, P<0.05).
Control Group, children (Control-Group)
As expected children in the Control-Group showed a significant agreement between the
most preferred orangeade at baseline and after the intervention (orangeade: T=0.54,
P<0.0001). The same was observed for yoghurt (T=0.45, P<0.05).
Repeated exposure to sour, adults (Sour-Group)
Adults in the Sour-Group showed a significant agreement between the most preferred
orangeade at baseline and after the intervention (orangeade: T=0.78, P<0.0001). Such
agreement was, however, not statistically significant for the yoghurt (T=0.19, P=0.45).
They did not change their preference ranking of the orangeade they consumed during the
intervention (U=68.5, P=0.11; Figure 2, panel C).
During the intervention, adults in the Sour-Group consumed on average 128 ± 63 mL of
the Sour-orangeade per day, this was not significantly correlated with the initial
preference ranking of this Sour-orangeade (r=0.38, 95%CI: -0.21 to –0.77). No
significant differences in consumption were observed between the first day and last day
of the intervention (Z=-0.85, p=0.40; Figure 3, panel B).

145
Repeated exposure to sweet and sour taste
Baseline After exp
1
2
3
4
5
6
7
Most preferred
Least preferred
Preference for sour orangeade children
A
Me
an
ra
nk
ing
nu
mb
er
Baseline After exp
1
2
3
4
5
6
7
Most preferred
Least preferred
Preference for sweet orangeade
Children
B
Me
an
ra
nk
ing
nu
mb
er
Baseline After exp
1
2
3
4
5
6
7
Most preferred
Least preferred
Preference for sour orangeade Adults
C
Me
an
ra
nk
ing
nu
mb
er
Baseline After exp
1
2
3
4
5
6
7
Most preferred
Least preferred
Preference for sweet orangeade
Adults
D
Me
an
ra
nk
ing
nu
mb
er
Figure 2 Mean ranking number for preference of Sour-and Sweet-orangeades at baseline and after repeated exposure (after exp) to these specific beverages, shown for children (panel A and B) and adults (panel C and D) (● Sweet-Group; ○ Sour-Group; □ Control-Group)
Repeated exposure to sweet, adults (Sweet group)
Adults in the Sweet-Group showed a significant agreement between the most preferred
orangeade at baseline and after the intervention (orangeade: T=0.50, P<0.001). A similar
trend in agreement was observed for the most preferred yoghurt (T=0.43, P=0.09). Nor
did they change their preference ranking of the orangeade they consumed during the
intervention (U=88.0, P=0.68; Figure 2 panel D). Adults in the Sweet-Group consumed
on average 172 ± 33 mL Sweet-orangeade per day, this was not significantly correlated
with the initial preference for the Sweet-orangeade (r=0.14, 95%CI: -0.42 to 0.62).
These subjects consumed significantly less during the last day compared with during the
first day of exposure (Z=-2.0, P<0.05; Figure 3, panel B). On the first day 94% of the
adults consumed all the beverage they were presented with. This percentage decreased to
63% on the last day of exposure.
Control-Group, adults
As expected adults in the Control-Group showed a significant agreement between the
most preferred orangeade at baseline and after the intervention (orangeade: T=0.45,

Chapter 8
146
1 2 3 4 5 6 7 8
0
25
50
75
100
125
150
175
200
Children
Days o f inte rvention
me
an
in
tak
e (
mL
)
1 2 3 4 5 6 7 8
0
25
50
75
100
125
150
175
200
Adults
Days o f inte rvention
me
an i
nta
ke
(m
L)
A
B
P<0.05). Such agreement was, however, not statistically significant for the yoghurt
(T=0.22, P=0.42).
Figure 3 Average consumption (± sem) of orangeade during the 8 days of intervention by the Sweet-Group (●) and Sour-Group (○). Shown for children (panel A) and adults (panel B)
DISCUSSION
The present study showed that after an 8-day repeated exposure to orangeade with a high
concentration sucrose during childhood, children’s preferences for this orangeade
significantly increased. A similar trend was observed for yoghurt with a high
concentration of sucrose. This increased preference for a high concentration of sucrose
was specific for the exposed high concentration of sucrose and not specific for the food
sucrose was exposed in. Adults did not change their taste preferences after an 8-day
repeated exposure to a sweet- or sour-orangeade. However, after repeated exposure to a
Sweet-orangeade they decreased their consumption of this orangeade. In 8- to 11-year-

147
Repeated exposure to sweet and sour taste
old children, repeated exposure to the Sweet-orangeade tended to result in an increase of
consumption of the sweet tasting orangeade.
Previous research suggested that a short repeated exposure to an initially novel food is
likely to result in an increased preference for the exposed food 29-32;40
. From these
studies it is unclear whether repeated exposure to a specific taste quality can increase
preference for this taste. Beauchamp and Moran suggested that two-year-old children
who had been regularly fed sucrose water during infancy (<12 months of age),
consumed more sucrose solutions, but not more water than did children who were not
fed sucrose water during infancy 25
. In the same line, a recent study suggested that
children of parents who added sucrose to their children’s diet on a regular basis had a
higher preference for apple juice with added sucrose, than children of parents who did
not practice this habit 22
. Causality can, however, not been drawn from these studies.
The present study is, to our knowledge, the first experimental study with young children
that showed that a short repeated exposure to orangeade with a high concentration of
sucrose results in an elevated preference for this high concentration of sucrose in both
orangeade and yoghurt. Previous research suggested that changed taste preferences,
which were initiated by repeated exposure during infancy are relatively stable over time 22;26
. Future studies are needed in order to determine if the changed taste preferences as
observed in the present study will be stable over time.
As shown in the present study preference for a high concentration of sucrose in
orangeade can be generalized to other foods (i.e. yoghurt). The existence of a sweet
tooth has been suggested by several studies in adults 21;41
as well as in children 12
.
Sullivan and Birch 32
failed to find support for the suggestion that a sweet tooth might be
the result of a generalized preference for sweetened foods. In their research repeated
exposure resulted in an increased preference of the exposed sweet food only and not in
an increased preference of a novel sweet food. This could, however, be a result of a food
neophobic reaction to the novel sweet food, rather than the non-existence of a
generalized preference for sweetened foods.
Repeated exposure is thought to reduce food neophobia 42
. Food neophobia, fear of new
foods, is commonly seen in young children and supposedly protects children of eating
harmful substances 43
. After a repetition of exposures without negative outcomes,
children consider the food to be save 30
. Repeated exposure also teaches children which
tastes, in which foods, are appropriate 32
. The latter was illustrated by Sullivan and Birch 32
. They showed that repeated exposure to sweet tofu did result in an increased liking for
sweet tofu but not for salted or plain tofu. In the same line, as shown in the present
study, repeated exposure to sweet orangeade did not necessarily lead to a preference for
Sour-orangeade.

Chapter 8
148
Preference for sweet taste has been positively correlated with a high consumption of
sugar rich foods 12;21;44
. In the present study, the consumption of orangeade was not
related to the preference for orangeade. This is in contrast with previous studies with
children which suggested that consumption is positively related to taste preferences 22;23;45-49
. In the present study, however, most children consumed all the Sweet-
orangeade they were presented with. This was also the case for adults on the first day of
the intervention. Those who had a high preference for the orangeade might have been
limited in their consumption by the amount they were given.
An alternative explanation is that children in the same classroom influenced each others
drinking behavior. In that case the amount children consumed depended on the amount
consumed by peers, rather than their own taste preference. Birch and colleagues
suggested that peers can have a large influence on children’s eating behavior 11
. We tried
to prevent this influence of peers, by using opaque cups that were covered by an opaque
lid. Children in the experimental groups could therefore not see how much everyone was
drinking.
After the first day of exposure adults decreased their consumption of the Sweet-
orangeade which could be caused by boredom 28
. After serving monotonous meals (i.e.
identical meals) for several days, researchers showed that intake decreased and
acceptance of the meal declined 27
even if the food was initially liked 28
. This
phenomenon was not observed in children. Perhaps in the present study children were
not offered enough orangeade in order to show a decrease in consumption after repeated
exposure.
Unlike to that observed with repeated exposure to sucrose in orangeade, children did not
increase their preference for sour taste after repeated exposure to sour taste. It is unlikely
that this difference was due to the use of unreliable methodology. The rank-ordering
procedures have been shown to be reliable with young children 16;50
. Moreover, in the
present study the majority of subjects (except for children in the Sweet-Group) showed a
significant agreement between the most preferred stimulus at baseline and after the
intervention. The number of subjects in the present study might have been too small to
show significant differences in preferences for sour taste. However, the number of
subjects in the Sweet-Group and the Sour-Group were equal. Recall that we did observe
changes in preference in children in he Sweet-Group.
An alternative hypothesis is therefore that, during childhood, preferences for sour taste
are more stable than preferences for sweet taste. The small number of studies that
investigated preferences for sour taste in children, concluded that these preferences can
be changed by a long term exposure (approximately eight months) during infancy 22;26
.
This could be due to the prolonged exposure or to the timing of the exposure. It has been
suggested that early exposures to flavors are more effective than later ones in

149
Repeated exposure to sweet and sour taste
establishing taste preferences, due to the existence of sensitive periods 51
. The exposure
to sour taste in the present study might have been to short or the time of exposure (i.e.
during childhood) might have fallen outside the sensitive period in which children easily
learn to prefer new tastes.
Adults in the present study did not change their taste preferences for the series of
orangeades or yoghurt, as a result of an eight day repeated exposure to the Sweet-
orangeade. This could be a result of the difference in preference for sweet taste between
children and adults at baseline. In the present study children, compared with adults, had
a higher preference for the Sweetest orangeade. It has been hypothesized that repeated
exposure to stimuli people already liked, causes them to rate those stimuli even more
positively, whereas repeated exposure to initially disliked stimuli leads to even more
negative ratings 52
. Due to the difference in preference of the sweetest orangeade
children were more likely to increase their preference for the sweetest orangeade than
adults.
An alternative hypothesis is that adults are less likely to change their preference for
sweet taste, because of their more expanded experience with foods and flavors 53
. As
mentioned earlier, repeated exposure of flavors within a specific food context teaches
children which flavors are appropriate in which food context. Adults were presumably
less influenced by a short repeated exposure of sweet and sour taste in orangeade,
because of their expanded experience with this beverage in the past.
In conclusion, the present study suggests that sweet preference of children can be
modified by a short repeated exposure during childhood. In contrast with sour taste
preferences which appear to be more stable. Adults’ preferences for sweet and sour taste
are less likely to be influenced by a short repeated exposure. Future studies are needed to
determine whether changed preferences for sweet taste are stable over time and whether
they are related to a change in the consumption of sugar rich foods.
REFERENCES
1. WHO consultation on obesity. Obesity: preventing and managing the global epidemic. Obesity: preventing and managing the global epidemic 894. 1999.
2. Glowinska B, Urban M, Koput A. Cardiovascular risk factors in children with obesity, hypertension and diabetes: lipoprotein(a) levels and body mass index correlate with family
history of cardiovascular disease. European journal of pediatrics 2002; 161: 511-518.
3. Ricketts CD. Fat preferences, dietary fat intake and body composition in children. European journal of clinical nutrition 1997; 51: 778-781.
4. Ludwig DS, Peterson KE, Gortmaker SL. Relation between consumption of sugar-sweetened drinks and childhood obesity: a prospective, observational analysis. Lancet 2001; 357: 505-508.
Chapter 8
150
5. Hill AJ. Developmental issues in attitudes to food and diet. The Proceedings of the nutrition society 2002; 61: 259-266.
6. Fisher JO, Birch LL. Restricting access to palatable foods affects children's behavioral response, food selection, and intake. American journal of clinical nutrition 1999; 69: 1264-1272.
7. Klesges RC, Stein RJ, Eck LH, Isbell TR, Klesges LM. Parental influence on food selection in young children and its relationships to childhood obesity. American journal of clinical nutrition 1991; 53: 859-864.
8. Tiggemann M, Lowes J. Predictors of maternal control over children's eating behaviour. Appetite 2002; 39: 1-7.
9. Contento IR, Basch C, Shea S, Gutin B, Zybert P, Michela JL, Rips J. Relationship of mothers' food choice criteria to food intake of preschool children: identification of family subgroups. Health education quarterly 1993; 20: 243-259.
10. Liem DG, Mars M, De Graaf C. Sweet preferences and sugar consumption of 4-and 5-year
old children: role of parents. Appetite 2004; (In Press)
11. Birch LL. Effects of peer models' food choices and eating behaviors on preschoolers' food preferences. Child development 1980; 51: 489-496.
12. Olson CM, Gemmill KP. Association of sweet preference and food selection among four to five year old children. Ecology of food and nutrition. 1981; 11: 145-150.
13. Perez-Rodrigo C, Ribas L, Serra-Majem L, Aranceta J. Food preferences of Spanish children and young people: the enKid study. European journal of clinical nutrition 2003; 57 Suppl 1: S45-S48.
14. Michela JL, Contento IR. Cognitive, motivational, social, and environmental influences on children's food choices. Health psychology 1986; 5: 209-230.
15. Desor JA, Greene LS, Maller O. Preferences for sweet and salty in 9- to 15-year-old and adult humans. Science 1975; 190: 686-687.
16. Desor JA, Beauchamp GK. Longitudinal changes in sweet preferences in humans. Physiology and behavior 1987; 39: 639-641.
17. Enns MP, Van Itallie TB, Grinker JA. Contributions of age, sex and degree of fatness on preferences and magnitude estimations for sucrose in humans. Physiology and behavior
1979; 22: 999-1003.
18. Zandstra EH, De Graaf C. Sensory perception and pleasantness of orange beverages from childhood to old age. Food quality and preference 1998; 9: 5-12.
19. De Graaf C, Zandstra EH. Sweetness intensity and pleasantness in children, adolescents, and adults. Physiology and behavior 1999; 67: 513-520.
20. Liem DG, Mars M, De Graaf C. Consistency of sensory testing with 4- and 5-year old children. Food quality and preference 2004; 15: 541-548.
21. Pangborn RM, Giovanni ME. Dietary intake of sweet foods and of dairy fats and resultant
gustatory responses to sugar in lemonade and to fat in milk. Appetite 1984; 5: 317-327.
22. Liem DG, Mennella JA. Sweet and sour preferences during childhood; role of early experiences. Developmental psychobiology 2002; 41: 388-395.
151
Repeated exposure to sweet and sour taste
23. Liem DG, Mennella JA. Heightened sour preferences during childhood. Chemical senses 2003; 28: 173-180.
24. Frank RA, van der Klauw NJ. The contribution of chemosensory factors to individual differences in reported food preferences. Appetite 1994; 22: 101-123.
25. Beauchamp GK, Moran M. Acceptance of sweet and salty tastes in 2-year-old children.
Appetite 1984; 5: 291-305.
26. Mennella JA, Beauchamp GK. Flavor experiences during formula feeding are related to preferences during childhood. Early human development 2002; 68:71-82
27. Meiselman HL, deGraaf C, Lesher LL. The effects of variety and monotony on food acceptance and intake at a midday meal. Physiology and behavior 2000; 70: 119-125.
28. Zandstra EH, De Graaf C, van Trijp HC. Effects of variety and repeated in-home consumption on product acceptance. Appetite 2000; 35 : 113-119.
29. Wardle J, Cooke LJ, Gibson EL, Sapochnik M, Sheiham A, Lawson M. Increasing children's acceptance of vegetables; a randomized trial of parent-led exposure. Appetite
2003; 40: 155-162.
30. Birch LL, Marlin DW. I don't like it; I never tried it: effects of exposure on two-year-old children's food preferences. Appetite 1982; 3: 353-360.
31. Wardle J, Herrera ML, Cooke L, Gibson EL. Modifying children's food preferences: the effects of exposure and reward on acceptance of an unfamiliar vegetable. European journal of clinical nutrition 2003; 57: 341-348.
32. Sullivan SA, Birch LL. Pass the sugar, pass, the salt: experience dictates preference. Developmental psychology 1990; 26: 546-551.
33. Steiner JE. Facial expressions of the neonate infant indication the hedonics of food-related chemical stimuli. In: Weiffenbach JM, ed. Taste and development: the genesis of sweet preference, Washington, DC: U.S. Government Printing Office, 1977: 173-188.
34. Hammer LD, Robinson TN. Child and adolescent obesity. In: Levin MD, Carey WB, Crocker AC, eds. Developmental-behavioral pediatrics, 3rd ed. Philadelphia: W.B. Saunders company, 1999: 370-379.
35. Garrow JS. Obesity. In: Garrow JS, James WPT, eds. Human nutrition and dietetics, �9th ed. Edinburgh: Churchill Livingstone, 1993: 465-479.
36. Birch LL. The relationship between children's food preferences and those of their parents. Journal of nutrition education 1980; 12: 14-18.
37. Schifferstein HNJ, Frijters JER. Sensory integration in citric acid/sucrose mixtures. Chemical senses 1990; 15: 87-109.
38. Pelletier CA, Lawless HT, Horne J. Sweet-sour mixture suppression in older and young adults. Food quality and preference 2004; 15: 105-116.
39. Siegel S, Castellan NJ. Measures of association and their tests of significance. In: Anker JD, ed. Nonparametric statistics for the behavioral sciences, second ed. Boston: McGraw-Hill,
inc, 1988: 224-312.
40. Pliner P, Stallberg-White C. "Pass the ketchup, please": familiar flavors increase children's willingness to taste novel foods. Appetite 2000; 34: 95-103.

Chapter 8
152
41. Conner MT, Booth DA. Preferred sweetness of a lime drink and preference for sweet over non-sweet foods, related to sex and reported age and body weight. Appetite 1988; 10: 25-35.
42. Rozin P. The selection of foods by rats, humans and other animals. In: Rosenblatt JS, Hinde RA, Shaw E, Beer C, eds. Advances in the study of behavior, New York: Academic Press, 1976: 21-76.
43. Pliner P, Hobden K. Development of a scale to measure the trait of food neophobia in humans. Appetite 1992; 19: 105-120.
44. Dennison BA, Rockwell HL, Baker SL. Excess fruit juice consumption by preschool-aged children is associated with short stature and obesity. Pediatrics 1997; 99: 15-22.
45. Lawless H. Sensory development in children: research in taste and olfaction. Journal of the American dietetic association 1985; 85: 577-82, 585.
46. Cowart BJ. Development of taste perception in humans: sensitivity and preference throughout the life span. Psychological bulletin 1981; 90: 43-73.
47. Resnicow K, Davis-Hearn M, Smith M, Baranowski T, Lin LS, Baranowski J, Doyle C,
Wang DT. Social-cognitive predictors of fruit and vegetable intake in children. Health psychology 1997; 16: 272-276.
48. Gibson EL, Wardle J, Watts CJ. Fruit and vegetable consumption, nutritional knowledge and beliefs in mothers and children. Appetite 1998; 31: 205-228.
49. Murphy AS, Youatt JP, Hoerr SL, Sawyer CA, Andrews SL. Kindergarten students' food preferences are not consistent with their knowledge of the Dietary Guidelines. Journal of the American dietetic association 1995; 95: 219-223.
50. Guinard J-X. Sensory and consumer testing with children. Food science and technology 2001;
11: 273-283.
51. Beauchamp GK, Mennella JA. Sensitive periods in the development of human flavor perception and preference. Annales Nestlé, Nestlé Nutrition Workshop Series 1998; 56: 19-31.
52. Zimbardo PG, Leippe MR. Making persuasion last. In: Zimbardo PG, Leippe MR, eds. The psychology of attitude change and social influence, New York: McGraw-Hill, Inc, 1991: 168-201.
53. Voorlichtings bureau voor de voeding. Zo eet Nederland 1998, This is the way the
Netherlands eats 1998. Delft: Van Marken Delft Drukkers, 2002.


99
Discussion

Chapter 9
156
The present thesis focused on sweet and sour taste preferences of children. We
investigated how these preferences can be measured, which level of sweet and sour taste
children prefer, and how these preferences are related to oral physiological processes,
food consumption and repeated exposure. The individual studies are discussed at the end
of the previous chapters and will therefore not be discussed in detail.
In the present chapter we give an overview of the main findings, after which we discuss
critical design issues. Furthermore, we discuss the new insight in taste preferences of
children we gained after 4 years of research. We then continue with the implications and
recommendations for future research.
MAIN FINDINGS
The paired comparison and the rank-order tests are widely used methods to assess taste
preferences and discriminatory ability of young children. Although 4-and 5-year old
children were able to give consistent data for preference, large differences appeared
when both tests were used to measure discriminatory ability. That is, 5-year-old children
were able to carry out the paired comparison and the rank-order tests for discriminatory
ability in a consistent manner, but 4-year-olds failed to carry out both tests in a
consistent way (chapter 2).
With respect to children’s preferences for sour taste, we discovered that a substantial
number of children that we tested had a preference for extreme sour taste in gelatins.
This was not related to the rated intensity (chapter 3 & 4), buffering capacity of saliva or
salivary pH (chapter 4). Preference for sour taste appeared to be positively related to
preference for unfamiliar stimuli (chapter 3 & 4), intense colors (chapter 4),
consumption- and variety of fruits (chapter 3 & 5), and early experiences with sour taste
(chapter 6)
Preference for sweet taste can be modified by a short repeated exposure during
childhood (chapter 8), however, restricting children’s freedom to choose for a sweet
tasting product by means of rules is related to a heightened preference for sweet taste
(chapter 7).
In conclusion, sweet and sour taste preferences of young children can consistently be
measured with paired comparison and rank-order methods. Children prefer beverages
with high concentrations of sucrose and a substantial part of children have a preference
for extreme sour foods. The latter is related to intensity-and novelty-seeking behavior
and consumption of fruit. Preferences for sweet and sour taste can be modified by
learned experiences (see Table 1).

Discussion
157
Main
fin
din
gs
5-y
rs-o
lds:
pre
fere
nce
test
s, 7
6%
-consi
stency, r=
0.7
4, p<
0.0
1;
dis
cri
min
atio
n t
est
s, 8
2%
consi
stency
, r=
0.3
7, P
<0.0
5.
4-y
rs-o
lds:
pre
fere
nce
test
, 6
1%
-consi
sten
cy, r=
0.3
2, P
=0.3
7;
dis
cri
min
atio
n t
est
s, 6
2%
consi
stency
, r=
0.0
2, P
=0.9
5.
36%
(U
S)
to 5
8%
(N
eth
.) p
refe
rred e
xtr
eme
sour
tast
e. T
his
was
not
rela
ted t
o p
erc
eived
inte
nsi
ty (
p>
0.3
2)
or
sali
var
y p
H (
7.2
± 0
.12 v
s. 7
.2 ±
0.1
2),
but
was
rela
ted t
o a
hig
her
sali
vary
flo
w (
1.8
g ±
1.0
vs.
2.3
g ±
0.8
, P
<0.0
5),
a l
ow
er
buff
eri
ng c
apaci
ty o
f sa
liva (
0.1
8 ±
0.0
7 v
s. 0
.33 ±
0.4
4 ∆
pH
/ m
L s
aliv
a p
roduced),
pre
fere
nce
for
unfa
mil
iar
foods
(P<
0.0
5)
and f
ruit
consu
mpti
on o
f boys
(r=
0.6
7, P
<0.0
01).
Sour
form
ula
fed C
hil
dre
n (
4-t
o 5
-yea
rs o
f age)
pre
ferr
ed s
our
juic
es
signif
icantl
y m
ore
than
did
old
er
chil
dre
n w
ho w
ere
fed s
imil
ar f
orm
ula
s duri
ng i
nfa
ncy (P
<0.0
5).
No s
uch a
ge-
rela
ted d
iffe
rence
was
obse
rved i
n c
hil
dre
n w
ho w
ere
fed
mil
k-b
ase
d f
orm
ula
s duri
ng
infa
ncy (P
=0.5
0)
Hig
h s
ugar-
rest
ricte
d c
hil
dre
n c
onsu
med l
ess
sw
eet
foods
duri
ng b
reakfa
st (P
<0.0
09)
and
lunch (P
<0.0
5),
but
show
ed h
igher
pre
fere
nce
for
swee
t th
an l
ow
-rest
rict
ed c
hil
dre
n.
(P<
0.0
1).
Pre
fere
nce
for
a 0.4
2M
(14%
w/v
) su
cro
se b
evera
ge
incre
ase
d a
fter
8-d
ay e
xposu
re
(P<
0.0
5).
A s
imil
ar
exposu
re t
o b
evera
ge
wit
h 0
.02M
(0.4
% w
/v)
added c
itri
c a
cid d
id n
ot
incre
ase
the
pre
fere
nce
for
this
bever
age.
Rese
arc
h q
uest
ion
s
Do p
aire
d c
om
pari
son a
nd r
ank-o
rder
pro
ced
ure
s giv
e consi
sten
t dat
a co
nce
rnin
g
the m
ost
pre
ferr
ed l
evel
of
sweet
tast
e a
nd
the
dis
cri
min
ato
ry a
bil
ity o
f young c
hil
dre
n?
Whic
h l
evel
s of
sour
tast
e ar
e m
ost
pre
ferr
ed
by c
hil
dre
n a
nd h
ow
is
this
rel
ate
d t
o
physi
olo
gic
al d
ete
rmin
ants
, th
rill
seek
ing
behav
ior
and f
ruit
consu
mpti
on?
What
is
the
infl
uence
of
earl
y e
xperi
ence
wit
h s
our
tast
es
on p
refe
rence
s fo
r sw
eet
and
sour
tast
e of
young c
hil
dre
n?
What
is
the
role
of
pare
nts
on t
he p
refe
rence
and c
onsu
mpti
on o
f sw
eet
foods
of
thei
r
chil
dre
n?
Can s
weet
and s
our
tast
e pre
fere
nce
s of
chil
dre
n b
e c
hanged
by a
short
repeat
ed
exposu
re t
o s
weet
and s
our
tast
ing s
tim
uli
?
Tab
le 1
Rese
arc
h q
uest
ions
and t
he
main
fin
din
gs,
div
ided b
y c
hapte
r ch
Ch
2
3, 4
& 5
6
7
8
Chapter 9
158
METHODOLOGICAL CONSIDERATIONS
In order to judge the studies that were presented in this thesis on its scientific relevance,
we first have to evaluate the methodology that was used during the studies. We made
several decisions about the way we selected our subjects, the sensory tests were carried
out and how food consumption was measured. In the following paragraphs we discuss
each topic and hypothesize how the decisions we made could have influenced the
validity of our results
Selection of subjects
Population
The studies described in this thesis were carried out in the United Stated (chapter 3 & 6)
and the Netherlands (chapter 2, 4, 5, 7 & 8). Large differences in preference for sweet
taste were not expected and not found. Several studies around the world suggests that
children’s preference for high concentrations of sucrose is universal (e.g., Brazil 1;
France 2; Iraq
3; Israel
4; Mexico
5; Netherlands
6, North America
7;8). Whether this is the
case for sour taste is unknown. Preference for extreme sour taste is more common in
countries were the general diet contains many sour-tasting foods 9. The general cuisine
in the US and Western Europe (among which the Netherlands) are fairly similar 10
.
Furthermore, the environment and situation in which different foods are presented to
children are similar in the US and the Netherlands. For example, in both countries the
consumption of fruit is encouraged 11;12
, sweet foods are seen as unhealthy by parents 13
and over consumption is more likely than foods shortage. We therefore conclude that the
results of our studies are valid for both countries. However, differences in recruitment in
both countries could have influenced our results.
Recruitment
In the US and the Netherlands the subjects were differently recruited. This could have
resulted in restriction and selection bias. Restriction, the admissibility criteria for
subjects, is an effective method to prevent confounding, but potentially provides a poor
basis for generalization of the study results 14
.
In all studies a restriction of age (4-to-12-years of age) was applied. This age range,
middle childhood, is situated between the pre-school and adolescence years. During
middle childhood children have the skills to perform sensory tests and have a moderate
autonomy in the family 15;16
.
Selection biases are distortions that result from procedures used to select subjects and
from factors that influence study participation 17
. Subjects in the US were recruited from
advertisements in Philadelphia newspapers, which were free of charge. The Philadelphia
area has a population of approximately 6 million inhabitants from various races (72.5 %
Discussion
159
Caucasian, 19.6 % African American, 7.9% others) 18
. Compared to the total population
of the US, Philadelphia has a slightly higher percentage of African Americans (12.6%
vs. 19.6%) 19
. Our sample (Chapter 3 & 6) (56% Caucasian, 39% African American and
4% other), consisted of fewer Caucasian and more African Americans than would be
expected from a random sample of the Philadelphia population. Several studies
suggested that African Americans have a preference for higher concentration of sucrose
than their Caucasian counterparts 8;20-22
. Due to the relatively high number of African
Americans the founded preference for sweet taste may not be valid for the total US
population. However, as reported in chapter 6, no main effect of race on preference for
sweet taste was found, therefore the higher number of African Americans did probably
not affect our outcome measures (chapter 3 & 6). Ethnic differences, within our sample
in the US, are also unlikely to explain the observed differences in preference for sour
taste after early exposure to sour formula. In chapter 3, no ethnic differences were found
between children who preferred sour taste and those who did not. Furthermore, in the
US as well as in the Netherlands we found a positive relationship between preference for
sour taste and novelty seeking behavior, despite the high number of African Americans
in the US sample.
In the Netherlands the recruitment of the subjects was organized differently. The study
population was restricted to three schools that were located on different sites of the
Wageningen area. The studies reported in chapter 2, 5, 7 & 8 were carried out at a
school were the education level of the parents was relatively high compared with the
Dutch average 23
. A previous study showed that the education level of parents is
positively related with the tendency to impose rules to restrict the consumption of certain
foods 24
. Other studies suggested that parental education level 25
and intellect 26
are
positively related to children’s own intellect (see for further discussion chapter, 2, 5, 7 &
8).
The high number of well-educated parents could have resulted in a higher number of
parents who were very strict on the consumption of sugar of their children. It is unlikely
that this affected our study findings (chapter 7) to a large extent, because the aim of this
study was to investigate differences between children who were highly restricted and
low restricted within our study population rather than investigating how many parents in
the Netherlands were strict on sugar. Moreover, the variation of parents’ level of
education within our sample was not related to any of our outcome measures. Whether
our results can be extrapolated to children of parents with a low education level needs to
be investigated.
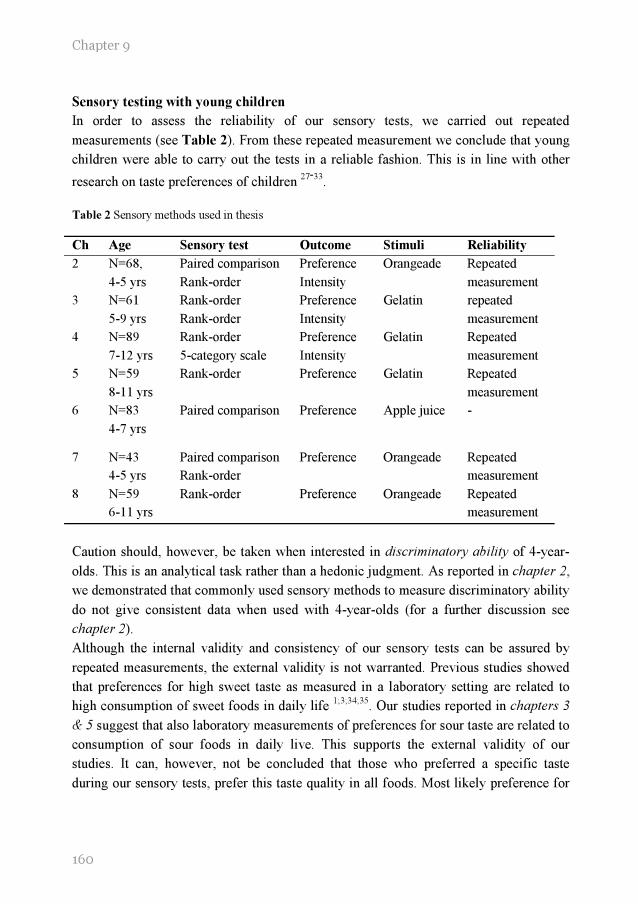
Chapter 9
160
Sensory testing with young children
In order to assess the reliability of our sensory tests, we carried out repeated
measurements (see Table 2). From these repeated measurement we conclude that young
children were able to carry out the tests in a reliable fashion. This is in line with other
research on taste preferences of children 27-33
.
Table 2 Sensory methods used in thesis
Ch Age Sensory test Outcome Stimuli Reliability
2 N=68,
4-5 yrs
Paired comparison
Rank-order
Preference
Intensity
Orangeade Repeated
measurement
3 N=61
5-9 yrs
Rank-order
Rank-order
Preference
Intensity
Gelatin repeated
measurement
4 N=89
7-12 yrs
Rank-order
5-category scale
Preference
Intensity
Gelatin Repeated
measurement
5 N=59
8-11 yrs
Rank-order Preference Gelatin Repeated
measurement
6 N=83
4-7 yrs
Paired comparison Preference Apple juice -
7 N=43
4-5 yrs
Paired comparison
Rank-order
Preference Orangeade Repeated
measurement
8 N=59
6-11 yrs
Rank-order Preference Orangeade Repeated
measurement
Caution should, however, be taken when interested in discriminatory ability of 4-year-
olds. This is an analytical task rather than a hedonic judgment. As reported in chapter 2,
we demonstrated that commonly used sensory methods to measure discriminatory ability
do not give consistent data when used with 4-year-olds (for a further discussion see
chapter 2).
Although the internal validity and consistency of our sensory tests can be assured by
repeated measurements, the external validity is not warranted. Previous studies showed
that preferences for high sweet taste as measured in a laboratory setting are related to
high consumption of sweet foods in daily life 1;3;34;35
. Our studies reported in chapters 3
& 5 suggest that also laboratory measurements of preferences for sour taste are related to
consumption of sour foods in daily live. This supports the external validity of our
studies. It can, however, not be concluded that those who preferred a specific taste
during our sensory tests, prefer this taste quality in all foods. Most likely preference for
Discussion
161
sour and sweet taste is limited to those foods that, according to culture, are suppose to be
sweet and/or sour.
Furthermore, it needs to be noted that, by using traditional sensory methods such as
paired comparison and rank-order procedures, bias caused by differences in cognitive
skills or lack of attention can never be ruled out. These sources of bias will only be of a
larger influence when the research sample exists of young children. Therefore there is a
need for an objective measurement of preference and discriminatory ability. In adults it
has been suggested that differences in preferences is accompanied with differences in
physiological processes in the human body, such as brain activity 36
. Whether this can be
used in sensory testing with young children is unknown and worthwhile to investigate.
Setting of the sensory tests
The reliability of the outcome of sensory tests also depends on the setting children are
tested in. In the US we tested children individually in a closed room, hereafter referred
to as ‘single testing’. In the Netherlands we also tested children on a individual bases,
but they sat in a classroom with about ten other participants who were all individually
tested, hereafter referred to as ‘multiple testing’. Single testing gives the researcher the
possibility to avoid influences from peers during testing and to highly control the testing
environment (i.e. high-air ventilation, no distracting objects present). On the other hand,
single testing is time consuming and therefore the sensory tests of a large number of
subjects are spread out over several months. This means that seasonal variation, such as
the availability of certain foods and outside temperature cannot be controlled for. These
variables could be of influence on children’s taste preferences. For example, during and
shortly after the Halloween festivities children consume large quantities of sweet foods 37
, this could result in a higher exposure to sweet foods than normally. During periods of
extreme high temperatures children have a large change to become dehydrated 38
, this
could influence their taste preferences 39
.
Multiple testing is less time consuming and the sensory tests of a large number of
subjects can be carried out in just two days. On the other hand, one has to be aware of
the influence of peers 30
. This influence could result in a more homogenous group with
respect to taste preferences than would be the case during individual testing 30
.
Furthermore, multiple testing involves more than one researcher that is supervising the
subjects.
In the present thesis we used individual testing (chapter 3 & 6) as well as multiple
testing (chapter 2, 4, 5, 7 & 8). The influence of seasonal variation on our results that
were obtained with individual testing is likely to be not significant. The founded taste
preferences are in line with other research that is carried out during different times of the
year in countries with different climates. The variation in preferences for sweet and sour
Chapter 9
162
taste during individual testing are more likely to be related to differences in exposure
and children’s temperament.
During our multiple testing we minimized the influence of peers by separating the
subjects by at least one meter. Furthermore, a trained adult who was instructed to
minimize the influence of peers guided each subject. Moreover, all studies, but one,
were checked on reliability by repeated measurement.
Food consumption questionnaires
During the studies several questionnaires were used to measure food consumption. The
discussion on each specific questionnaire can be found in the previous chapters. The
present paragraphs will give a general discussion on the use of food frequency
questionnaires in the type of research described in this thesis.
It has been shown in previous research 40
and in the present thesis that young children
are able to express their food and taste preferences in a reliable fashion. Children older
than approximately 8-years of age are also able to report their food frequency under
supervision of an adult 41-43
. Younger aged children are less able to report their own food
consumption 44;45
, therefore research with these children, relies on parental report when
it comes to food frequency 13;41;46-52
. Because our age-range of interest (4-12 years of
age) included children below the age of 8, food frequency was measured by means of
parental report (chapter 3, 5, 6, 7 & 8). It has been suggested that this approach gives
reliable data for foods consumed at home, but might not be accurate for foods consumed
outside of the home environment 45
.
In our studies we did not assess the number of foods consumed out of home. This could
have resulted in an underestimation of the sugar (chapter 7) and fruit consumption
(chapter 5). In our studies this is of minor importance because in chapter 7 we were
interested in the sugar consumption that was controlled by parents. In chapter 5 we were
interested in the relative consumption rather than the absolute number of fruits they
consumed. When interested in absolute numbers of consumption it is recommended to
include both parents and others who take care of the child in the reporting process (see 45
for review)
TASTE PREFERENCES, NEW INSIGHTS
As noted in the introduction of this thesis, there has been extensive research carried out
on preferences for sweet taste in children. Research on sour taste preferences of children
did, however, not exist. A literature search in Medline on the key words “sour” “taste”
“preferences” and “children” resulted in no relevant publications before the initiation of
our research in the year 2000. To date a same Medline search resulted in three relevant
Discussion
163
studies 53-55
, two of which are reported in the present thesis. With the submission of
three other papers (chapter 4, 5 & 8) with relevant research on sour taste preferences of
children, we conclude that the results of the present thesis add substantial knowledge to
the field of taste preferences of children.
Preference for extreme sour taste
The research reported in chapter 3 was the first scientific study that investigated
children’s preferences for extreme sour taste. Marketing-and consumer reports suggested
that children have a preference for extreme sour taste 56;57
. Detailed scientific
information about this phenomenon was, however, not available. In the past it has
already been suggested that children live in a different sensory world. They prefer higher
concentrations of sucrose 6;8;58;59
and salt 8 than adults. Based on our research it can be
concluded that this heightened preference is also evident for sour taste, in 5- to 12-year-
old children (chapter 3 & 4). Longitudinal studies with sweet taste, suggested that
preference for this taste decreases with age 8. From our study (chapter 3) we can at least
conclude that parents of children who preferred extreme sour taste did not prefer this
taste themselves. We assume that children’s preference for sour is not related to a
specific cohort, as suggested by Darwin’s observations more than 100 years ago 60
.
Longitudinal studies are, however, needed to investigate whether preference for sour
taste decreases with age.
There are at least two mechanisms that could explain the decrease of preference for sour
taste with age. As suggested for sweet taste, high preference of young children for a
specific taste could be explained by their physiological need 7. However, while the
physiological consequences of the consumption of sweet foods are clear (i.e. calorie
uptake), this is less evident for the consumption of sour foods. Furthermore, preference
for high sweet solutions seems to be innate, while preference for sour taste is not 61-63
.
Moreover, preference for sweet taste was seen in almost all children, whereas preference
for extreme sour taste was only observed in a subset of the children we tested. It is more
likely that some children prefer extreme sour taste as a result of early exposure or as part
of sensation seeking behavior. After a more expanded experience with foods mostly
eaten by adolescence and adults, children adjust their preference for sour taste when they
approach the adult age. Similar to preference for salt taste 64
, the most preferred level of
sour taste at adult age is likely dictated by dietary experiences. We therefore hypothesize
that preference for sour taste decreases with age and that this is due to dietary
experiences rather than physiological need.
Chapter 9
164
Preference for sour taste relates to novelty-and intensity seeking
For the first time a scientific investigation related preference for extreme sour taste of
children to preferences for unfamiliar (novel) foods (chapter 3 & 4) and intense visual
stimuli (chapter 4). In adults it has previously been speculated that sensation seekers are
more likely to prefer sour taste 65
and that those who preferred a wide range of products
also liked higher intensities of sour taste 66
. Perhaps sour taste elicits similar sensations
as novel foods and intense visual stimuli. This is in contrast with preference for sweet
taste, which is associated with comfort and pain relieve 67
. The optimal balance between
sweet and sour taste, hypothetically represents the optimal balance between comfort and
sensation.
Causality can, however, not been drawn from our studies. Perhaps children develop a
preference for sour taste early in life, due to early flavor experiences (chapter 6).
Subsequently, they not only become to like this intense taste but also the associated
intense sensation. During childhood they are more likely to expand this preference for
intense sensation to other modalities such as novelty and color intensity. It is, however,
unlikely that early exposure to sour tasting hydrolysate formula (chapter 6) fully
explains the variation in preference for extreme sour taste during childhood. Hydrolysate
formulas are only given to a small portion of the infants in the US 68
, whereas the
prevalence of children’s preference for extreme sour taste is close to one third of the
children tested. Preference for sour during childhood must then be a result of exposure to
other sour tasting foods such as lemons. Unfortunately we have no data on the foods
children consumed during their first years of life.
An alternative explanation is suggested in chapter 3. We hypothesize that children’s
novelty and intensity seeking behavior leads to an increased likelihood to try sour foods.
After repeated consumption of these foods, which fulfill their need for novelty and
intense experiences, they develop a preference for sour taste. Behavioral differences
among children can already be observed during early infancy 69
and may precede
children’s preference for extreme sour taste. New studies are, however, needed to
confirm this hypothesis.
Whether our results can be extrapolated to all cultures is questionable. In countries were
many extreme sour foods are part of a normal diet, extreme sour taste may not be a
novelty. Relationships between preference for sour taste and preference for novel foods
may then not exist.
Preference for sour taste does not relate to oral physiology
Preference for sour taste is most likely not due to a low perceived intensity (chapter 3 &
4). However, as suggested in chapter 4, children who preferred extreme sour taste did
have a higher salivary flow. Spielman (1990) 70
suggested that a high salivary flow
Discussion
165
results in a lower perceived intensity of sourness, due to the dilution of citric acid and
the large amount of buffering agents. In their study the used sour stimuli were of a much
lower intensity than the stimuli that were used in our studies. A high salivary flow may
not be sufficient enough to change the perceived sour intensity of our stimuli. Perhaps in
our study the high salivary flow in children who preferred extreme sour taste, affected
the aftertaste rather than the sour intensity during and shortly after the stimulus was
consumed. Hypothetically, the high salivary flow results in a faster disappearance of the
sour stimuli from the oral cavity.
An alternative explanation for the discrepancy between Spielman’s study and ours is that
saliva of those who preferred extreme sour taste has a low buffering capacity per mL
saliva. This hypothesis can, however, not fully be confirmed by our studies, because
buffering capacity of saliva was not measured by means of titration (see chapter 4 for
further discussion).
Preference for sour taste relates to fruit consumption
Our explorative study reported in chapter 5 was the first to suggest that sour taste
preferences play an important role in the consumption of fruit in boys but not girls
Previous studies already suggested that preference for fruit is an important determinant
of fruit consumption 71;72;72-74
. However, our data seems to suggest that preferences for
sour taste may play a different role in the fruit consumption of boys than for girls.
Previous studies suggested that boys are better than girls in adjusting their food
consumption in response to internal cues (e.g. satiety) 75
. Perhaps girls’ preferences for
fruit are more determined by external cues such as parental control 76
, health related
motives 77;78
and availability 79
. More studies are needed to investigate the causality if
the relationship between preference for sour taste and consumption of fruit.
CHANGING OF TASTE PREFERENCES, NEW INSIGHTS
Before the initiation of our studies in the year 2000 interventions concerning the effect
of repeated exposure on subsequent preference only focused on foods, mostly novel
foods, rather than taste per se 80-85
. Food exists of many variables which influences
preferences, such as appearance 86;87
and familiarity. 52
. Enhanced food preferences after
repeated exposure is therefore not necessarily a result of an increased preference for the
specific taste of the food. Early research of Zajonc showed that people could increase
their preference for a meaningless object by repeated exposure 88
. Although several
studies already suggested that repeated exposure to sweet taste is positively related with
preference for sweet taste, causality could never been drawn from these studies 20;89
. To
our knowledge our study reported in chapter 8, was the first experimental study in
Chapter 9
166
young children that showed that repeated exposure to a specific concentration of sucrose
increases preference for this concentration.
Prevent increase rather than promote decrease of sweet preference
It is, however, unlikely that preference for sweet taste during middle childhood can be
decreased. Most sweet tasting products are caloric dense and are, due to caloric
conditioning, easy to develop a preference for 90
. Sweet tasting products such as candy,
ice cream and soda are often associated with celebration, comfort or reward 47
. All these
associations will make it difficult to decrease the preference for sweet taste in young
children.
An alternative strategy is to prevent the increase of preference for sweet taste.
Hypothetically, decreasing the number of exposures to sweet foods would stabilize
children’s preference for sweet taste and prevent it from increasing. Decreasing
children’s sugar consumption by means of strict rules, may, however, result in a high
preference for sweet taste (chapter 7). This is in line with findings of Fisher and Birch
who concluded that restricting children’s access to palatable foods result in an increase
desire and consumption of those foods 91;92
.
We hypothesize that decreasing the consumption of sweet foods in order to prevent the
increase of preference for sweet taste, can only be effective if children do not perceive
themselves as being restricted. Children have to prevent excessive consumption of sugar
themselves, rather than obeying rules that are set by their parents. A similar approach
was suggested for energy dense foods: “The optimal environment for children’s
development of self-control of energy intake is that in which parents provide healthy
food choices but allow children to assume control of how much they consume.” 75
.
It needs to be noted that our research population in chapter 7 were all 4-to 5-year-old
Dutch children, whether our findings can be generalized to older aged children is
unknown. Supposedly, older aged children are less dependent on their parents with
respect to sugar consumption. Rules that parents apply to restrict their children’s sugar
consumption, have therefore a lower impact on older aged children than on younger
aged children. Furthermore, our study was carried out in an industrialized country were
over consumption is more likely than foods shortage. In countries were there is a
shortage of food, it is questionable if parents would apply rules that restrict sugar
consumption of their children.
Changing preference for sour taste, early exposure
As shown in chapter 8 preferences for sour taste are not easily changed by a short
repeated exposure during childhood, but can possibly be changed by repeated exposure
during infancy (53
and chapter 6). This suggests that preferences for sour taste are
determined early in life. It is unlikely that children were given sour formula because they
Discussion
167
preferred sour taste. Parent who decided to feed their infants sour-bitter tasting formula,
did not base their decision on the infant’s ingestion or taste preferences, but rather on the
expected reduction of colic (chapter 6). The importance of early flavor experiences on
food acceptance has previously been shown with these formulas. Infants who were
introduced to the formula before 2 months of age continued drinking these formulas
during their first year of life. However, infants who are introduced to these formulas at 7
months of age show similar rejections as adults 93;94
. Early flavor experiences do not
only affect preferences during infancy and childhood, but possibly also affect
preferences during adulthood. Haller and colleagues suggested that adults who were fed
a vanilla flavored baby formula during infancy, were more likely to prefer vanilla
flavored ketchup than adults who did not experience this formula during infancy 95
. Our
study (chapter 6) and Haller’s study were both observational studies. There is a need for
intervention studies to confirm the influence of early flavor experience on taste
preferences during childhood and adulthood.
Changing preference for sour taste, prenatal exposure
Besides, taste experiences during infancy, taste preferences are also thought to be
influenced by prenatal events. Research on salt taste suggested that preferences for high
concentrations of salt in infants 96
and adults 97
are related to reported morning sickness
of their mothers. It has been hypothesized that extra cellular dehydration and electrolyte
imbalance related with morning sickness influences the development of salt taste
preference of the offspring 98
. Mennella and colleagues suggested that prenatal
experience with carrot flavor increases infants’ preference for this flavor 99
. Along the
same line, prenatal experience with anis flavor affected preference for anis after birth 100
.
Hypothetically, also preferences for sour taste can be modified before birth by means of
the mothers’ diet, or other prenatal events. However, as suggested in chapter 3, no
relationship was found between mothers’ and their children’s preferences for sour taste.
It is, however, unknown whether mother’s present diet was a reflection of what she
consumed during pregnancy.
Changing preference for sour taste, caloric conditioning
An alternative approach to increase children’s preference for sour taste could be caloric
conditioning. It has been shown that children learn to prefer flavors that are associated
with high energy density (see 101
for review). Exposing children to high-energy dense
foods with a predominant sour taste could result in a preference for high sour taste.
Studies with rats showed that preference for sour taste can be increased when the oral
ingestion of water with added citric acid was paired with the intragastrically infusion of
16% glucose water 102
.

Chapter 9
168
Replacing sweet preferences by sour preferences
The prevention of excessive intake of sweet foods could lower children’s caloric intake.
Increasing children’s preference for sour foods could be beneficial for the dietary variety
and the fruit consumption of young boys (chapter 3, 4 & 5). Replacing sweet preference
by preference for sour taste could therefore result in a diet low in calories and high in
variety. Increasing preference for sour taste does, however, not entail that sweet
preferences are automatically decreased. In the present thesis we have no evidence that
children who preferred high sour taste had a lower preference for sweet taste than those
who did not prefer sour taste (chapter 6). On the contrary, most sour products consumed
by young children such as candies are also high in sugar contents. As mentioned earlier,
decreasing preference for sweet taste in children is in our opinion not realistic. Children
will always prefer sweetness, but by decreasing the exposure to sweet taste a further
increase of sweet preference can be tempered. For an important part of children this
decrease in exposure can be established by increasing sourness. For example soda could
be decreased in sweetness and increased in sourness. It needs to be noted that this
approach is not valid for all products. The addition of sugar makes products that are rich
in fat more palatable 103
. Whether sour taste can take over this task is questionable.
Furthermore, the consumption of large amounts of sour foods can result in teeth erosion.
This is mainly due to the low pH. The concentration of H+ ions is, however, not the only
determinant of sour taste. It has been shown that sour tasting agents with a similar pH
can elicit a different perception of sour taste 104
. It remains to be investigated whether
this can be used to produce sour foods that are preferred by children but that do not
cause teeth erosion.
MAIN CONCLUSIONS
1. Sweet taste is highly preferred by young children, this can consistently be
measured.
2. Repeated exposure to high concentrations of sucrose during childhood can
result in heightened preference for this concentration in a variety of foods.
However, strict parental control on the consumption of sweet foods
hypothetically increases preference for sweet taste.
3. An important part of young children have a preference for extreme sour tasting
foods. This preference is most likely driven by a general preference for extreme
stimuli and the urge to search for new and exciting events in life. Preferences
for sour are likely determined early in life and appear to be related to
consumption of fruit in daily life.

Discussion
169
IMPLICATIONS AND RECOMMENDATION FOR
FURTHER RESEARCH
The knowledge gained by the present thesis can be of great use for health professionals
and those working in industry. There is growing evidence that consumption of sugar
derived from beverages such as soda and fruit juices is related with childhood obesity. In
order to prevent children from developing preference for excessive high concentrations
of sucrose, children need to be directed to other foods that are highly preferred but do
not elicit a intense sweet taste. The knowledge that an important part of young children
have a preference for intense sour foods, may open the window to the promotion of low
sweet – high sour foods. Not all children have a preference for sour taste, however, we
suggest that preference for sour taste can be modified early in life. This modification of
preferences for sour taste could be beneficial for fruit consumption and the dietary
variety during childhood.
In our opinion it is unrealistic to assume that children can be taught to get an aversion
for sweet taste. However, sweet taste may not be a necessity for products in order to be
highly preferred by children. Sour taste is already preferred by a substantial part of
children. Moreover, there is now evidence that a preference for sour taste can be created
by early exposure to this taste quality.
Although the present thesis gave answers to many prominent questions, it raised even
more questions that need to be answered by other investigations. Below are some
suggestions.
1. As suggested by the present thesis, conventional methods to measure preference
and discriminatory ability of children largely depend on children’s skills to
perform these tasks. Biological measurements such as functional magnetic
resonance imaging (fMRI) may provide more reliable results when children are
not able to understand the conventional methods. Although this biological
measurement is tested with adults, with mixed results, to our knowledge they
were never used during sensory testing with young children. Research with
young children would especially benefit from such approach.
2. In order to investigate whether preference for extreme sour taste decreases with
age, longitudinal studies are needed. We realize that the influence of dietary
experience is hard to record during a longitudinal study with humans. In
addition to these longitudinal studies with humans, it is recommended to carry
out a longitudinal study with rats. Bertino and colleagues demonstrated that rats
showed a similar decrease in preference for sweet taste with age as humans.

Chapter 9
170
During this experiment the researchers were able to keep the diet the same
during their study. It was therefore concluded that the decrease in sweet
preference is most likely independent from dietary experiences 105
.
3. Based on our observational study (chapter 6) we suggest that early experiences
with sour taste influences preference for sour taste during childhood.
Furthermore, it has been suggested that preference for sour taste is related with,
novelty and intensity seeking behavior and the consumption of fruit in boys.
Experimental studies are, however, needed to confirm our findings. The first
step of such study has recently be undertaken by Mennella and co-workers 94
. In
this study infants were randomly assigned to different feeding regimens which
consisted of sour-bitter hydrolysate formula and/or regular milk based formula.
The next step would be to follow up these children and measure their preference
for sour taste, fruit consumption and novelty- and intensity seeking behavior
when they reach the middle childhood age.
4. Hypothetically, the high salivary flow, of those who prefer extreme sour taste,
results in a faster disappearance of the sour stimuli from the oral cavity. In order
to test this hypothesis, it needs to be investigated how long after ingestion the
sour taste is still perceived in the oral cavity. Furthermore, the buffering
capacity of saliva needs to be determined by means of titration in order to
investigate whether there are differences between those who prefer sour taste
and those who do not.
5. We hypothesize that decreasing the consumption of sweet foods in order to
prevent the increase of preference for sweet taste, can only be effective if
children do not perceive themselves as being restricted. We suggest an
experimental design with three groups. One group needs to be restricted in their
sugar consumption by applying strict rules. The second group needs to be
encouraged to consume foods that are low in sugar contents and needs to be
provided with low-sugar alternatives. The third group is a control group that can
freely choose between sugar -and non-sugar containing products. Before and
after the intervention children are tested for their preference for sweet taste and
the food choices children make when parents or caretakers are not present.
Furthermore, it needs to be determined whether sugar restriction rules are
applied in a similar way across parents with different social economic and
educational backgrounds. The results of these studies should result in advice
that can be given to parents.
6. The influence of prenatal events on infants and children’s preference for sour
taste is unknown. Experimental studies such as carried out by Mennella and
colleagues 99
are needed to investigate this matter.

Discussion
171
7. Foods that are low in pH could cause teeth erosion. There is a need for additives
that create a sour taste without lowering the pH of the product.
Answers to all these questions will able us to better understand children’s taste
preferences and understand better why children prefer the foods they do.
REFERENCES
1. Tomita NE, Nadanovsky P, Vieira AL, Lopes ES. Taste preference for sweets and caries prevalence in preschool children. Revista de Saude Publica 1999; 33: 542-546.
2. Bellisle F, Dartois AM, Kleinknecht C, Broyer M. Perceptions of and preferences for sweet taste in uremic children. Journal of the American dietetic association 1990; 90: 951-954.
3. Jamel HA, Sheiham A, Watt RG, Cowell CR. Sweet preference, consumption of sweet tea and dental caries; studies in urban and rural Iraqi populations. International dental journal 1997; 47: 213-217.
4. Steiner JE. Facial expressions of the neonate infant indication the hedonics of food-related chemical stimuli. In: Weiffenbach JM, ed. Taste and development: the genesis of sweet preference, Washington, DC: U.S. Government Printing Office, 1977: 173-188.
5. Vazquez M, Pearson PB, Beauchamp GK. Flavor preferences in malnourished Mexican
infants. Physiology and behavior 1982; 28: 513-519.
6. De Graaf C, Zandstra EH. Sweetness intensity and pleasantness in children, adolescents, and adults. Physiology and Behavior 1999; 67: 513-520.
7. Beauchamp GK, Cowart BJ. Development of sweet taste. In: Dobbing J, ed. Sweetness, Berlin: Springer-Verlag, 1987: 127-138.
8. Desor JA, Greene LS, Maller O. Preferences for sweet and salty in 9- to 15-year-old and adult humans. Science 1975; 190: 686-687.
9. Moskowitz HW, Kumaraiah V, Sharma KN, Jacobs HL, Sharma SD. Cross-cultural
differences in simple taste preferences. Science 1975; 190: 1217-1218.
10. Rozin E. The role of flavor in the meal and the culture. In: Meiselman HL, ed. Dimensions of the meal, Gaithersburg, MD: Aspen publishers, Inc, 2000: 134-142.
11. Kremers SP, Brug J, de Vries H, Engels RC. Parenting style and adolescent fruit consumption. Appetite 2003; 41: 43-50.
12. Fisher JO, Mitchell DC, Smiciklas-Wright H, Birch LL. Parental influences on young girls' fruit and vegetable, micronutrient, and fat intakes. Journal of the American dietetic association 2002; 102: 58-64.
13. Contento IR, Basch C, Shea S, Gutin B, Zybert P, Michela JL, Rips J. Relationship of mothers' food choice criteria to food intake of preschool children: identification of family subgroups. Health education quarterly 1993; 20: 243-259.
14. Rothman KJ, Greenland S. Accuracy considerations in study design. In: Rothman KJ, Greenland S, eds. Modern epidemiology, 2nd ed. Philadelphia, PA: Lippincott, 1998: 135-145.

Chapter 9
172
15. Levin MD. Middle childhood. In: Levin MD, Carey GB, Crocker AC, eds. Developmental-behavioral pediatrics, 3rd ed. Philadelphia: WB Saunders company, 1999: 51-67.
16. Ford CA, Coleman WL. Adolescent development and behavior: implications for the primary care physician. In: Levin MD, Carey GB, Crocker AC, eds. Developmental-behavioral pediatrics, 3rd ed. Philadelphia: W.B. Saunders company, 1999: 69-79.
17. Rothman KJ, Greenland S. Precision and validity in epidemiologic studies. In: Rothman KJ, Greenland S, eds. Modern epidemiology, 2nd ed. Philadelphia: Lippincott, 1998: 115-134.
18. City demographics. http//www.cityrating.com/citystats.asp?city=Philadelphia&state=PA, accessed on 22-4-2004.
19. Grieco, E. M. and Cassidy, R. C. Overview of race and Hispanic origin, United states census 2000. 2004. U.S. department of commerce, economics and statistics administration U.S. census bureau.
20. Beauchamp GK, Moran M. Dietary experience and sweet taste preference in human infants.
Appetite 1982; 3: 139-152.
21. Schiffman SS, Graham BG, Sattely-Miller EA, Peterson-Dancy M. Elevated and sustained desire for sweet taste in african-americans: a potential factor in the development of obesity. Nutrition 2000; 16: 886-893.
22. Pepino MY, Kennedy JM, Currler MP, Mennella JA. Individual differences in sweet preferences across the lifespan. Chemical senses 2003; 28: 551(Abstract)
23. Centraal buro voor de statistiek. Beroepsbevolking naar geslacht. 28-4-2004. Centraal buro voor de statistiek, Voorburg/Heerlen.
24. Hupkens CLH, Knibbe RA, Otterlo van AH. Class differences in the food rules mothers impose on their children: a cross-national study. Social science & medicine 1998; 9: 1331-1339.
25. Neiss M, Rowe DC. Parental education and child's verbal IQ in adoptive and biological families in the National Longitudinal Study of Adolescent Health. Behavior genetics 2000; 30: 487-495.
26. McGue M. The democracy of the genes. Nature 1997; 388: 417-418.
27. Guinard J-X. Sensory and consumer testing with children. Food science and technology 2001;
11: 273-283.
28. Kimmel SA, Sigman-Grant M, Guinard J-X. Sensory testing with young children. Food technology 1994; 48: 92-99.
29. Birch LL. Dimensions of preschool children's food preferences. Journal of nutrition education 1979; 11: 77-80.
30. Birch LL. Effects of peer models' food choices and eating behaviors on preschoolers' food preferences. Child development 1980; 51: 489-496.
31. Leon F, Marcuz MC, Couronne T, Koster EP. Measuring food liking in children: a
comparison of non-verbal methods. Food quality and preference 1999; 10: 93-100.
32. Guthrie CA, Rapoport L, Wardle J. Young children's food preferences: a comparison of three modalities of food stimuli. Appetite 2000; 35: 73-77.
Discussion
173
33. Turnbull B, Matisoo-Smith E. Taste sensitivity to 6-n-propylthiouracil predicts acceptance of bitter-tasting spinach in 3-6-y-old children. American journal of clinical nutrition 2002; 76: 1101-1105.
34. Olson CM, Gemmill KP. Association of sweet preference and food selection among four to five year old children. Ecology of food and nutrition. 1981; 11: 145-150.
35. Steiner JE, Sgan-Cohen HD, Nahas J. Sweet preference and dental caries among Bedouin youth in Israel. Community dentistry and oral epidemiology 1984; 12: 386-389.
36. Frank ME, Hettinger TP, Barry MA, Gent JF, Doty RL. Contemporary measurement of human gustatory function. In: Doty RL, ed. Handbook of olfaction and gustation, 2nd ed. New York: Marcel Dekker, Inc., 2003: 783-804.
37. Schwartz MB, Chen EY, Brownell KD. Trick, treat, or toy: children are just as likely to choose toys as candy on halloween. Journal of nutrition education and behavior 2003; 35: 207-209.
38. Falk B. Effects of thermal stress during rest and exercise in the paediatric population. Sports
medicine 1998; 25: 221-240.
39. Meyer F, Bar-Or O, Salsberg A, Passe D. Hypohydration during exercise in children: effect on thirst, drink preferences, and rehydration. International journal of sport nutrition 1994; 4: 22-35.
40. Birch LL, Sullivan SA. Measuring children's food preferences. Journal of school health 1991; 61: 212-213.
41. Nicklas TA. Dietary studies of children and young adults (1973-1988): the Bogalusa Heart Study. The American journal of the medical sciences 1995; 310 Suppl 1: S101-S108
42. Crooks DL. Food consumption, activity, and overweight among elementary school children in an Appalachian Kentucky community. American journal of physical anthropology 2000; 112: 159-170.
43. Falciglia GA, Couch SC, Gribble LS, Pabst SM, Frank R. Food neophobia in childhood affects dietary variety. Journal of the American dietetic association 2000; 100: 1474-1481.
44. Warren JM, Henry CJ, Livingstone MB, Lightowler HJ, Bradshaw SM, Perwaiz S. How well do children aged 5-7 years recall food eaten at school lunch? Public health nutrition 2003; 6: 41-47.
45. Livingstone MB, Robson PJ. Measurement of dietary intake in children. The Proceedings of the Nutrition Society 2000; 59: 279-293.
46. Harnack L, Stang J, Story M. Soft drink consumption among US children and adolescents: nutritional consequences. Journal of the American dietetic association 1999; 99: 436-441.
47. Ritchey N, Olson C. Relationship between family variables and children's preference for and consumption of sweet foods. Ecology of food and nutrition. 1983; 13: 257-266.
48. Yperman AM, Vermeersch JA. Factors associated with children's food habits. Journal of nutrition education 1979; 11: 72-75.
49. Keller KL, Steinmann L, Nurse RJ, Tepper BJ. Genetic taste sensitivity to 6-n-propylthiouracil influences food preference and reported intake in preschool children. Appetite 2002; 38: 3-12.
Chapter 9
174
50. Albertson AM, Anderson GH, Crockett SJ, Goebel MT. Ready-to-eat cereal consumption: its relationship with BMI and nutrient intake of children aged 4 to 12 years. Journal of the American dietetic association 2003; 103: 1613-1619.
51. Munoz KA, Krebs-Smith SM, Ballard-Barbash R, Cleveland LE. Food intakes of US children and adolescents compared with recommendations. Pediatrics 1997; 100: 323-329.
52. Carruth BR, Skinner J, Houck K, Moran J, Coletta F, Ott D. The phenomenon of "picky eater": a behavioral marker in eating patterns of toddlers. Journal of the American College of Nutrition 1998; 17: 180-186.
53. Mennella JA, Beauchamp GK. Flavor experiences during formula feeding are related to preferences during childhood. Early human development 2002; 68:71-82
54. Liem DG, Mennella JA. Heightened sour preferences during childhood. Chemical senses 2003; 28: 173-180.
55. Liem DG, Mennella JA. Sweet and sour preferences during childhood; role of early experiences. Developmental psychobiology 2002; 41: 388-395.
56. Urbick B. About kids: food and beverages. Surrey: Leatherhead publishing, 2000.
57. Frauenfelder M. Gross National Product. Wired Archive 1999; 7.06.
58. Desor JA, Beauchamp GK. Longitudinal changes in sweet preferences in humans. Physiology and Behavior 1987; 39: 639-641.
59. Zandstra EH, De Graaf C. Sensory perception and pleasantness of orange beverages from childhood to old age. Food quality and preference 1998; 9: 5-12.
60. Darwin C. Biographiche skizze eines kleinen kindes. Kosmos 1877; 367-376.
61. Rossenstein D, Oster H. Differential facial responses to four basic tastes in newborns. Child
development 1988; 59: 1555-1568.
62. Cowart BJ, Beauchamp GK. Early development of taste perception. In: McBride RL, MacFie HJH, eds. Psychological basis of sensory evaluation, London and New York: Elsevier applied science, 1990: 1-16.
63. Desor JA, Maller O, Turner RE. Taste in acceptance of sugars by human infants. Journal of comparative and physiological psychology 1973; 3: 496-501.
64. Beauchamp GK, Engelman K. Factors in reducing salt intake: High salt intake. Hyperertension 1991; 17: 176-181.
65. Kish GB, Donnenwerth GV. Sex differences in the correlates of stimulus seeking. Journal of consulting and clinical psychology 1972; 38: 42-49.
66. Frank RA, van der Klauw NJ. The contribution of chemosensory factors to individual differences in reported food preferences. Appetite 1994; 22: 101-123.
67. Miller A, Barr RG, Young SN. The cold pressor test in children: methodological aspects and the analgesic effect of intraoral sucrose. Pain 1994; 56: 175-183.
68. Hernell O, Lonnerdal B. Nutritional evaluation of protein hydrolysate formulas in healthy term infants: plasma amino acids, hematology, and trace elements. The American journal of
clinical nutrition 2003; 78: 296-301.
69. Chess S, Thomas A. The development of behavioral individuality. In: Levin MD, Casey R, Crocker AC, eds. Developmental-behavioral pediatrics, 3rd ed. Philadelphia: W.B. Saunders compagny, 1999: 89-99.
Discussion
175
70. Spielman AI. Interaction of saliva and taste. Journal of dental research 1990; 69: 838-843.
71. Resnicow K, Davis-Hearn M, Smith M, Baranowski T, Lin LS, Baranowski J, Doyle C,
Wang DT. Social-cognitive predictors of fruit and vegetable intake in children. Health psychology 1997; 16: 272-276.
72. Baxter SD, Thompson WO. Fourth-grade children's consumption of fruit and vegetable items
available as part of school lunches is closely related to preferences. Journal of nutrition education and behavior 2002; 34: 166-171.
73. Cullen KW, Eagan J, Baranowski T, Owens E, de Moor C. Effect of a la carte and snack bar foods at school on children's lunchtime intake of fruits and vegetables. Journal of the American Dietetic Association 2000; 100: 1482-1486.
74. Perez-Rodrigo C, Ribas L, Serra-Majem L, Aranceta J. Food preferences of Spanish children and young people: the enKid study. European journal of clinical nutrition 2003; 57 Suppl 1: S45-S48
75. Johnson SL, Birch LL. Parents' and children's adiposity and eating style. Pediatrics 1994; 94:
653-661.
76. Tiggemann M, Lowes J. Predictors of maternal control over children's eating behaviour. Appetite 2002; 39: 1-7.
77. Cutting TM, Fisher JO, Grimm-Thomas K, Birch LL. Like mother, like daughter: familial patterns of overweight are mediated by mothers' dietary disinhibition. American journal of clinical nutrition1999; 69: 608-613.
78. Abramovitz BA, Birch LL. Five-year-old girls' ideas about dieting are predicted by their mothers' dieting. Journal of the American Dietetic Association 2000; 100: 1157-1163.
79. Cullen KW, Baranowski T, Owens E, Marsh T, Rittenberry L, de Moor C. Availability, accessibility, and preferences for fruit, 100% fruit juice, and vegetables influence children's dietary behavior. Health education & behavior 2003; 30: 615-626.
80. Meiselman HL, deGraaf C, Lesher LL. The effects of variety and monotony on food acceptance and intake at a midday meal. Physiology and behavior 2000; 70: 119-125.
81. Zandstra EH, De Graaf C, van Trijp HC. Effects of variety and repeated in-home consumption on product acceptance. Appetite 2000; 35: 113-119.
82. Wardle J, Cooke LJ, Gibson EL, Sapochnik M, Sheiham A, Lawson M. Increasing
children's acceptance of vegetables; a randomized trial of parent-led exposure. Appetite 2003; 40: 155-162.
83. Birch LL, Marlin DW. I don't like it; I never tried it: effects of exposure on two-year-old children's food preferences. Appetite 1982; 3: 353-360.
84. Wardle J, Herrera ML, Cooke L, Gibson EL. Modifying children's food preferences: the effects of exposure and reward on acceptance of an unfamiliar vegetable. European journal of clinical nutrition 2003; 57: 341-348.
85. Sullivan SA, Birch LL. Pass the sugar, pass, the salt: experience dictates preference.
Developmental psychology 1990; 26: 546-551.
86. Walsh LM, Toma RB, Tuveson RV, Sondhi L. Color preference and food choice among children. The Journal of psychology 1990; 124: 645-653.
87. Clydesdale FM. Color as a factor in food choice. Critical reviews in food science and nutrition 1993; 33: 83-101.
Chapter 9
176
88. Zajonc RB. Attitude effects of mere exposure. Journal of personality and social psychology monograph 1968; 1-27.
89. Beauchamp GK, Moran M. Acceptance of sweet and salty tastes in 2-year-old children. Appetite 1984; 5: 291-305.
90. Birch LL. Children's preferences for High-Fat foods. Nutrition reviews 1992; 50: 249-255.
91. Fisher JO, Birch LL. Restricting access to foods and children's eating. Appetite 1999; 32: 405-419.
92. Fisher JO, Birch LL. Restricting access to palatable foods affects children's behavioral response, food selection, and intake. American journal of clinical nutrition 1999; 69: 1264-1272.
93. Mennella JA, Beauchamp GK. Developmental changes in the acceptance of protein hydrolysate formula. Journal of developmental and behavioral pediatrics 1996; 17: 386-391.
94. Mennella JA, Griffin CE, Beauchamp GK. Flavor programming during infancy. Pediatrics
2004; 113: 840-845.
95. Haller R, Rummel C, Henneberg S, Pollmer U, Koster EP. The influence of early experience with vanillin on food preference later in life. Chemical senses 1999; 24: 465-467.
96. Crystal SR, Bernstein IL. Infant salt preference and mother's morning sickness. Appetite 1998; 30: 297-307.
97. Crystal SR, Bernstein IL. Morning sickness: impact on offspring salt preference. Appetite 1995; 25: 231-240.
98. Nicolaidis S, Galaverna O, Metzler CH. Extracellular dehydration during pregnancy increases
salt appetite of offspring. The American journal of physiology 1990; 258: R281-R283
99. Mennella JA, Jagnow CP, Beauchamp GK. Prenatal and postnatal flavor learning by human infants. Pediatrics 2001; 107: E88
100. Schaal B, Marlier L, Soussignan R. Human foetuses learn odours from their pregnant mother's diet. Chemical senses 2000; 25: 729-737.
101. Birch LL. Development of food preferences. Annual review of nutrition 1999; 19: 41-62.
102. Myers KP, Sclafani A. Conditioned acceptance and preference but not altered taste reactivity responses to bitter and sour flavors paired with intragastric glucose infusion. Physiology &
behavior 2003; 78: 173-183.
103. Emmett PM, Heaton KW. Is extrinsic sugar a vehicle for dietary fat? Lancet 1995; 345: 1537-1540.
104. Ganzevles PGJ, Kroeze JH. The sour taste of acids. The hydrogen ion and the undissociated acid sour agents. Chemical senses 1987; 563-576.
105. Bertino M, Wehmer F. Dietary influence on the development of sucrose acceptability in rats. Developmental psychobiology 1981; 14: 19-28.


Summary
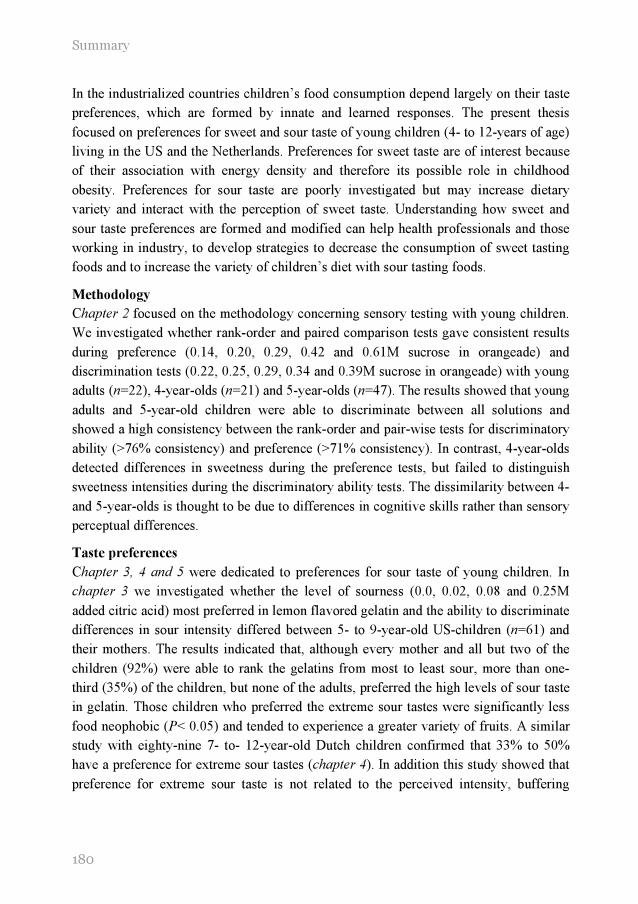
Summary
180
In the industrialized countries children’s food consumption depend largely on their taste
preferences, which are formed by innate and learned responses. The present thesis
focused on preferences for sweet and sour taste of young children (4- to 12-years of age)
living in the US and the Netherlands. Preferences for sweet taste are of interest because
of their association with energy density and therefore its possible role in childhood
obesity. Preferences for sour taste are poorly investigated but may increase dietary
variety and interact with the perception of sweet taste. Understanding how sweet and
sour taste preferences are formed and modified can help health professionals and those
working in industry, to develop strategies to decrease the consumption of sweet tasting
foods and to increase the variety of children’s diet with sour tasting foods.
Methodology
Chapter 2 focused on the methodology concerning sensory testing with young children.
We investigated whether rank-order and paired comparison tests gave consistent results
during preference (0.14, 0.20, 0.29, 0.42 and 0.61M sucrose in orangeade) and
discrimination tests (0.22, 0.25, 0.29, 0.34 and 0.39M sucrose in orangeade) with young
adults (n=22), 4-year-olds (n=21) and 5-year-olds (n=47). The results showed that young
adults and 5-year-old children were able to discriminate between all solutions and
showed a high consistency between the rank-order and pair-wise tests for discriminatory
ability (>76% consistency) and preference (>71% consistency). In contrast, 4-year-olds
detected differences in sweetness during the preference tests, but failed to distinguish
sweetness intensities during the discriminatory ability tests. The dissimilarity between 4-
and 5-year-olds is thought to be due to differences in cognitive skills rather than sensory
perceptual differences.
Taste preferences
Chapter 3, 4 and 5 were dedicated to preferences for sour taste of young children. In
chapter 3 we investigated whether the level of sourness (0.0, 0.02, 0.08 and 0.25M
added citric acid) most preferred in lemon flavored gelatin and the ability to discriminate
differences in sour intensity differed between 5- to 9-year-old US-children (n=61) and
their mothers. The results indicated that, although every mother and all but two of the
children (92%) were able to rank the gelatins from most to least sour, more than one-
third (35%) of the children, but none of the adults, preferred the high levels of sour taste
in gelatin. Those children who preferred the extreme sour tastes were significantly less
food neophobic (P< 0.05) and tended to experience a greater variety of fruits. A similar
study with eighty-nine 7- to- 12-year-old Dutch children confirmed that 33% to 50%
have a preference for extreme sour tastes (chapter 4). In addition this study showed that
preference for extreme sour taste is not related to the perceived intensity, buffering
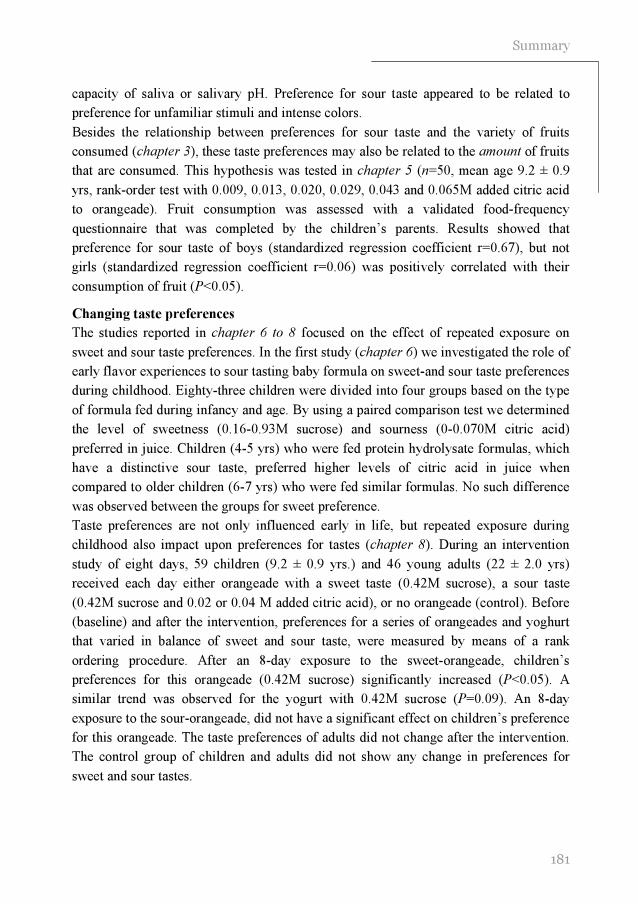
181
Summary
capacity of saliva or salivary pH. Preference for sour taste appeared to be related to
preference for unfamiliar stimuli and intense colors.
Besides the relationship between preferences for sour taste and the variety of fruits
consumed (chapter 3), these taste preferences may also be related to the amount of fruits
that are consumed. This hypothesis was tested in chapter 5 (n=50, mean age 9.2 ± 0.9
yrs, rank-order test with 0.009, 0.013, 0.020, 0.029, 0.043 and 0.065M added citric acid
to orangeade). Fruit consumption was assessed with a validated food-frequency
questionnaire that was completed by the children’s parents. Results showed that
preference for sour taste of boys (standardized regression coefficient r=0.67), but not
girls (standardized regression coefficient r=0.06) was positively correlated with their
consumption of fruit (P<0.05).
Changing taste preferences
The studies reported in chapter 6 to 8 focused on the effect of repeated exposure on
sweet and sour taste preferences. In the first study (chapter 6) we investigated the role of
early flavor experiences to sour tasting baby formula on sweet-and sour taste preferences
during childhood. Eighty-three children were divided into four groups based on the type
of formula fed during infancy and age. By using a paired comparison test we determined
the level of sweetness (0.16-0.93M sucrose) and sourness (0-0.070M citric acid)
preferred in juice. Children (4-5 yrs) who were fed protein hydrolysate formulas, which
have a distinctive sour taste, preferred higher levels of citric acid in juice when
compared to older children (6-7 yrs) who were fed similar formulas. No such difference
was observed between the groups for sweet preference.
Taste preferences are not only influenced early in life, but repeated exposure during
childhood also impact upon preferences for tastes (chapter 8). During an intervention
study of eight days, 59 children (9.2 ± 0.9 yrs.) and 46 young adults (22 ± 2.0 yrs)
received each day either orangeade with a sweet taste (0.42M sucrose), a sour taste
(0.42M sucrose and 0.02 or 0.04 M added citric acid), or no orangeade (control). Before
(baseline) and after the intervention, preferences for a series of orangeades and yoghurt
that varied in balance of sweet and sour taste, were measured by means of a rank
ordering procedure. After an 8-day exposure to the sweet-orangeade, children’s
preferences for this orangeade (0.42M sucrose) significantly increased (P<0.05). A
similar trend was observed for the yogurt with 0.42M sucrose (P=0.09). An 8-day
exposure to the sour-orangeade, did not have a significant effect on children’s preference
for this orangeade. The taste preferences of adults did not change after the intervention.
The control group of children and adults did not show any change in preferences for
sweet and sour tastes.

Summary
182
Although repeated exposure to sweet taste may increase children’s preferences for sweet
taste, restricting children’s freedom to choose for these product may result in an increase
in preference for sweet taste. This hypothesis was tested in chapter 7. To this end, 44
children (5.1 ± 0.5 yrs) performed a rank-order and paired-comparison test of preference
for five orangeades (0.14, 0.20, 0.29, 0.42, 0.61M sucrose). Parents filled out a
questionnaire concerning restriction rules and their children’s consumption of mono and
disaccharide (MDS)-containing foods. Stronger restriction rules were related to a lower
consumption of beverages that contained MDS and to a lower consumption of MDS-
containing foods during breakfast and lunch. Fifty-five percent of the children who were
highly restricted showed a preference for the highest concentration of sucrose in
orangeade. None of these children preferred the orangeade with the lowest concentration
of sucrose. While 19% of the children who were little restricted preferred the beverage
with the lowest concentration of sucrose, 33% preferred the beverage with the highest
concentration.
In chapter 9 we discus several methodological considerations as well as new insights
gained by the present thesis concerning taste preferences and changing taste preferences
of children. Furthermore, implications and recommendations for further research are
given.
Conclusion
Sweet and sour taste preferences of young children can consistently be measured with
paired comparison and rank-order methods if cognitive skills related to small age
differences are taken into consideration. Young children prefer beverages with high
concentrations of sucrose and a substantial part of children have a preference for
extreme sour foods. The latter is related to intensity and novelty seeking behavior and
consumption of fruit. Preferences for sweet and sour taste can be modified by learned
experiences.


Samenvatting

Samenvatting
186
In de geïndustrialiseerde landen worden voedselvoorkeuren van kinderen voornamelijk
bepaald door hun aangeboren en aangeleerde smaakvoorkeuren. Dit proefschrift richtte
zich op voorkeuren voor zoete en zure smaak van jonge kinderen (4 tot 12jaar oud) die
woonachtig waren in de Verenigde Staten of Nederland. Voorkeuren voor zoete smaak
zijn interessant door de associatie van deze smaak met energiedichtheid en het mogelijke
verband met zwaarlijvigheid van kinderen. Er is weinig onderzoek gedaan naar voorkeur
voor zure smaak van kinderen. Mogelijk zorgt deze voorkeur voor een grotere
verscheidenheid aan voedingsmiddelen die kinderen eten en is er een interactie tussen
zure en zoete smaakwaarneming van kinderen. Door te begrijpen hoe de voorkeur voor
zoete en zure smaak ontstaat en hoe deze zijn te beïnvloeden, kunnen wetenschappers en
diegenen werkzaam in de industrie strategieën ontwikkelen die er op gericht zijn om de
consumptie van het aantal zoete voedingsmiddelen te verlagen en het voedingspatroon
van kinderen uit te breiden met zuur smakende voedingsmiddelen.
Methodologie
Hoofdstuk 2 richtte zich op de methodologie van sensorisch onderzoek bij jonge
kinderen. We onderzochten of rangorde en paarsgewijze methoden consistente resultaten
gaven tijdens testen gericht op voorkeur (0,14; 0,20; 0,29; 0,42 en 0,61M sucrose) en
onderscheidend vermogen (0,22; 0,25; 0,29; 0,34 en 0,39M sucrose) van jong
volwassenen (n=22), 4 jarigen (n=21), en 5 jarigen (n=47). Uit de resultaten bleek dat
jong volwassenen en 5-jarigen alle oplossingen van elkaar konden onderscheiden.
Verder was er een hoge consistentie tussen de rangorde en paarsgewijze methoden voor
onderscheidend vermogen (>76% consistentie) en voorkeur (>71% consistentie). Dit in
tegenstelling tot 4-jarigen, die in staat waren om verschillen tussen de oplossingen waar
te nemen tijdens de voorkeurstest, maar dit niet konden weergeven tijdens de testen die
gericht waren op onderscheidend vermogen. Het verschil tussen 4- en 5-jarigen is
waarschijnlijk te wijten aan een verschil in cognitieve vaardigheden en niet aan
verschillen in sensorische perceptie.
Smaakvoorkeur
De Hoofdstukken 3, 4 en 5 waren gewijd aan voorkeur voor zure smaak van kinderen. In
hoofdstuk 3 onderzochten we of de meest geprefereerde concentratie citroenzuur (0,0;
0,02; 0,08; en 0,25M toegevoegd citroenzuur) in citroenpudding en het onderscheidend
vermogen met betrekking tot zuur verschilden tussen 5-tot 9-jarige Amerikaanse
kinderen (n= 61) en hun ouders. Uit de resultaten bleek dat alle moeders en kinderen, op
twee na, (92%) in staat waren om de verschillende concentraties citroenzuur te
onderscheiden. Echter, meer dan één derde (35%) van de kinderen, maar geen van de
ouders, hadden een voorkeur voor extreem hoge concentraties citroenzuur in pudding.
Kinderen die van extreem zuur hielden waren significant minder bang voor nieuwe

187
Samenvatting
voedingsmiddelen (P<0.05) en het leek er op dat ze een grotere diversiteit aan fruit aten.
Een soortgelijk onderzoek met 89 7 tot 12 jarigen bevestigde dat 33% tot 50% een
voorkeur had voor extreem zure smaak (hoofdstuk 4). Verder toonde dit onderzoek aan
dat voorkeur voor extreem zuur niet gerelateerd was aan waargenomen zuurintensiteit,
bufferende werking van speeksel of de pH van het speeksel. Voorkeur voor zuur bleek
wel gerelateerd te zijn aan voorkeur voor onbekende stimuli en intense kleuren.
Naast de relatie tussen zuurvoorkeur en de consumptie van een grote diversiteit aan fruit
(hoofdstuk 3), zou voorkeur voor zuur ook gerelateerd kunnen zijn aan de hoeveelheid
fruit die kinderen eten. Deze hypothese werd getest in hoofdstuk 5 (n=50, gemiddelde
leeftijd 9.2 ± 0.9 jaar, rangorde test met 0,009; 0,013; 0,020; 0,029; 0,043 en 0,065M
toegevoegd citroenzuur aan sinaasappellimonade). Fruitconsumptie was gemeten met
een gevalideerde voedselfrequentie vragenlijst die werd ingevuld door de moeders van
de kinderen. De resultaten lieten zien dat de voorkeur voor zuur van jongens
(gestandaardiseerde regressiecoëfficiënt r=0.67), maar niet meisjes (gestandaardiseerde
regressiecoëfficiënt r=0.06), positief was gerelateerd aan fruitconsumptie (P<0.05).
Veranderen van smaakvoorkeuren
Het onderzoek dat beschreven staat in de hoofdstukken 6 tot 8 richtte zich op het effect
van herhaalde blootstelling op zoet en zuurvoorkeuren. In het eerste onderzoek
(hoofdstuk 6) bestudeerden we de rol van vroege bloostelling aan zure babyvoeding op
de voorkeuren voor zoet en zuur tijdens de kinderjaren. Drieëntachtig kinderen werden
onderverdeeld in vier groepen gebaseerd op het type babyvoeding en leeftijd. Met een
paarsgewijze methode bepaalden we het meest geprefereerde nivo van zoet (0.16-0.93M
sucrose) en zuur (0-0.070M citroenzuur) in sap. Kinderen (4 en 5 jarigen) die met
gehydrolyseerde babyvoeding (zure-bittere smaak) waren gevoed, hadden een voorkeur
voor hogere concentraties citroenzuur in sap dan oudere kinderen (6 en 7 jarigen) die
ervaring hadden met dezelfde soort babyvoeding. Een soortgelijk verschil tussen de
leeftijdsgroepen werd niet gevonden voor zoet voorkeur of voor kinderen die een op
melk gebaseerde baby voeding hadden gekregen
Smaakvoorkeuren zijn niet alleen beïnvloedbaar voor het eerste levensjaar, maar ook
tijdens de kindertijd (hoofdstuk 8). Gedurende een interventiestudie van 8 dagen, kregen
59 kinderen (9,2 ± 0,9 jaar) en 46 jong volwassenen elke dag een sinaasappellimonade
met een zoete smaak (0.42M sucrose), een zure smaak (0,42M sucrose en 0,02 of 0,04M
toegevoegd citroenzuur) of geen sinaasappellimonade (controle). Voor (baseline) en na
de interventie werd de voorkeur voor een reeks zoete en zure sinaasappellimonades en
yoghurt gemeten met behulp van een rangorde methode. Na een blootstelling van 8
dagen aan de zoete limonades ging de voorkeur van kinderen voor deze limonade
significant omhoog (P<0.05). Een zelfde trend werd gevonden voor de yoghurt met

Samenvatting
188
0.42M sucrose (P= 0.09). Een 8-daagse blootstelling aan de zure limonade zorgde niet
voor een significante verandering in de voorkeur voor deze limonade. De
smaakvoorkeuren van volwassenen veranderden niet ten gevolge van de interventie. De
controlegroep van kinderen en volwassenen lieten eveneens geen verandering zien in
zoet-zuur preferenties.
Ondanks dat herhaalde blootstelling aan zoet mogelijk zorgt voor een verhoogde
voorkeur voor zoete smaak, kan de restrictie van vrijheid van kinderen om voor deze
producten te kiezen een zelfde effect hebben. Deze hypothese werd getest in hoofdstuk
7. In deze studie werden 44 kinderen (5.1 ± 0.5 jaar) getest op voorkeur voor een vijftal
limonades (0.14, 0.20, 0.29, 0.42 en 0.61M sucrose) met behulp van een rangorder en
paarsgewijze test. De ouders vulden een vragenlijst in over regels die tot doel hadden het
suikergebruik (mono-en disacchariden) van hun kinderen in te perken. Strengere regels
waren gerelateerd aan lagere consumptie van zoete dranken en een lagere consumptie
van andere suikerhoudende voedingsmiddelen gedurende het ontbijt en de lunch.
Vijfenvijftig procent van de kinderen die werden opgevoed met strenge regels omtrent
suikergebruik hadden een voorkeur voor de hoogste concentratie sucrose in de limonade.
Niemand in deze groep had een voorkeur voor de limonade met de laagste concentratie
suiker. Dit in tegenstelling tot kinderen die minder streng waren opgevoed. Van hen had
slechts 19% een voorkeur voor de hoogste suikerconcentratie en 33% een voorkeur voor
de hoogste suikerconcentratie.
In hoofdstuk 9 bediscussiëren we een aantal methodologische knelpunten en geven we
aan welke nieuwe inzichten, met betrekking tot smaakvoorkeuren en verandering van
smaakvoorkeuren van kinderen, verworven zijn op basis van het onderzoek dat in het
proefschrift beschreven staat. Verder worden er implicaties en suggesties geven voor
toekomstig onderzoek.
Conclusie
Zoet en zuur voorkeuren van kinderen kunnen consistent gemeten worden met behulp
van een rangorde en paarsgewijze methode, mits de cognitieve vaardigheden die
gerelateerd zijn aan kleine leeftijdsverschillen in acht worden genomen. Jonge kinderen
houden van dranken met een hoge suikerconcentratie en een deel van de kinderen heeft
ook een hoge voorkeur voor extreme zure voedingsmiddelen. Deze voorkeur is
gerelateerd aan de voorkeur voor nieuwe en intense stimuli en de consumptie van fruit.
Voorkeuren voor zoet en zuur kunnen worden aangeleerd.


Dankwoord
Acknowledgements
Dankwoord/ acknowledgments
192
Een droom is werkelijkheid geworden. In 1995, toen tweedejaars student “Voeding van
de mens” schreef ik een scriptie met de titel “Voedselvoorkeuren van kinderen”. Ik
raakte gefascineerd door de smaakbeleving van kinderen. Nu negen jaar later leg ik de
laatste hand aan mijn proefschrift “sweet and sour taste preferences of children”. Een
verzameling van zeven onderzoeken die ik opdraag aan mijn ouders, omdat jullie me
altijd gesteund hebben en vertrouwen in me hadden. Als jongste van 6 kinderen kreeg ik
de kans om zelfstandig dingen te ondernemen en dat heeft me in het onderzoek altijd
geholpen. Jullie hebben me kansen gegeven die ik slechts hoefde te benutten.
In 2004 I was given the opportunity to work at the most well known institute in the field
of taste research, the Monell Chemical Senses Center. During the two years I worked at
Monell, Julie has provided more help and support I had any right to expect. Julie, you
have a great eye for science. You brought up the patience to tutor me and made my stay
in the States an endless experience. It was quite an honour to work with you. Also all the
people in the Mennella Lab, Saadia, Pamela, Corine, Corren, Brian, Mayla, Kelly
and Lamoy were of great help. To two people I would like to give some special
attention. Cara, it was great to work with you, you are such a wonderful and warm
person. You and Joe are always welcome at my house in the Netherlands. Yanina, as the
two foreigners in the lab we had something in common. Thanks for the long discussions
we had about science and life in the States in general. Also other people at Monell like
Hong, Steward, Paul, Gary, Leslie, Danny, Xia, Greg, Monique, Moira and many
many more, made me feel like a true Monellian. I would also like to thank all the
participants and their parents for making the research studies a success.
Toen ik in 2002 terug keerde naar Wageningen lagen er nieuwe uitdagingen op me te
wachten. Zonder de hulp van heel veel mensen was het me nooit gelukt om deze
uitdagingen om te zetten in mooie herinneringen. Ten eerste waren daar mijn begeleiders
Kees en Frans. Kees, in mijn ogen ben je niet alleen een goede wetenschapper, maar ook
een prettig persoon om mee te praten over van alles en nog wat. Bijvoorbeeld het
vaderschap. Als onderzoekers denken we te weten wat goed is voor kinderen, maar in de
praktijk valt dit nog wel eens vies tegen als we de theorie op onze eigen kinderen
proberen toe te passen. Frans, je oog voor overzicht en je talent voor leiderschap heeft
me in vele opzichten geholpen om tot een goed eindresultaat te komen. Ook mijn
opponenten die tijd hebben gevonden om het eindresultaat te lezen ben ik zeer dankbaar
(Dr. Gary Beauchamp, Prof dr Anita Jansen, Prof dr Jan Kroeze, en Dr Dave
Mela), evenals mijn paranimfen (Koos en Rik) die me zullen helpen bij het verweer
tegen de eerder genoemde opponenten.
Verder had ik de eer te mogen samenwerken met een aantal uitmuntende studenten.
Judie, Krista, Annemarie en Sascha; jullie hebben tijdens je afstudeervak fantastisch
werk afgeleverd. Twee mooie publicaties zijn het resultaat en daar mogen jullie heel

Dankwoord/ acknowledgments
193
trots op zijn. Naast het werk van dit viertal, was de deelname van de verschillende
basisscholen van cruciaal belang om het geheel te laten slagen. De leerkrachten en
leerlingen van de Prinsenakker in Bennenkom en de Johan Friso en Jena Jozef school
in Wageningen hebben me de ruimte gegeven om een deel van het onderzoek op hun
scholen uit te voeren, heel veel dank hiervoor. Verder zijn er ook heel veel mensen die
achter de schermen meewerkten. Belangrijke mensen, die ook tijdens de organisatie van
het symposium ‘it’s a matter of taste’ onmisbaar waren. Zonder hen zou mijn
“sporadische” wanorde veranderen in wanhoop. Els (zonder jou geen sensorisch
onderzoek, omdat het materiaal dan simpelweg niet aanwezig is), Eric en Rikkie (fijn
dat jullie mijn handschrift konden lezen en zorgden dat ik niet duizend aanmaningen
kreeg van onbetaalde rekeningen) , Lidwien (bedankt voor je accuraatheid), Ben, Dirk,
Anne en Dione (pc’s zijn gemaakt om soms onbegrijpelijk te zijn, jullie hadden hier
schijnbaar geen last van), Eva, Marie en Karen (zonder jullie….tsja dat kan ik me
eigenlijk moeilijk voorstellen), Gerard (het is een fantastische voorkant geworden).
Verder wil ik natuurlijk mijn directe collega’s bedanken voor de goede sfeer,
gesprekken, statistische steun, carpooltjes, koffie en taart. Als enige mannelijke AIO in
het Agrotechnion (na het vertrek van Mark), heb ik van jullie heel veel geleerd over het
wel en wee van de vrouw (dit is positief bedoeld). Dit is met name van toepassing op
Pascalle. Samen hadden we de sensoriek kamer van de vakgroep. Sensory rules!
Toen Marije en ik in Philadelphia woonden stond het sociale leven een beetje op een
laag pitje. Als je naar het buitenland vertrekt, beloven velen dat ze een keer langs
komen, ik begrijp heel goed dat dat makkelijker gezegd is dan gedaan, maar een aantal
vrienden hebben het daadwerkelijk gedaan en dat was van onschatbare waarde. Jan,
Anneke, Femke en Ay Hwa, we hebben het heel erg gewaardeerd. Ook de vele e-
mailtjes hebben me altijd doen beseffen hoe belangrijk vrienden zijn (Ans en
Karen…thanks!). Verder nog een aantal woorden voor vrienden van het eerste uur Rik,
Marleen, Monica en Marleen: over een klein poosje kunnen we ons afstudeerfeest
herhalen. We gaan nu allemaal onze eigen weg met relaties, kinderen en werk, maar ik
weet zeker dat we elkaar altijd zullen blijven steunen….bedankt.
Het slot is voor mijn lieve vrouw. Marije, de afgelopen vier jaar is er veel gebeurd in
ons leven. Natuurlijk was het niet altijd even makkelijk om in Amerika te wonen,
zaterdagen op te offeren voor het onderzoek, ver weg te zijn van familie en vrienden.
Samen zijn we gekomen waar we nu zijn. Zonder jou waren veel dingen gewoonweg
onmogelijk geweest. Soms was ik te veel bezig met het onderzoek, gelukkig was jij er
dan om dingen in perspectief te plaatsen. Onze zoon Stijn is het mooiste dat me ooit
overkomen is, daar kan geen proefschrift tegen op. Lieve Stijn, als ik zie hoe je lacht,
rent, praat en slaapt, zie ik hoe mooi het leven kan zijn. We gaan samen op weg naar een
gelukkige toekomst. Jij, mama, papa en……..


Curriculum Vitae
Curriculum Vitae
196
ABOUT THE AUTHOR
Djin Gie Liem was born on December 8th
,
1974, in Amersfoort, The Netherlands. In
1994, he passed secondary school,
Atheneum, at the Eemland College,
Amersfoort and started the study ‘Human
Nutrition’ at the Wageningen University. His
BSc-thesis was on ‘communication strategies
in adolescence’. His MSc-thesis was on
‘taste development in children’. During his
MSc-program he conducted research studies
at the Monell Chemical Senses Center in
Philadelphia, PA, US, for 6 months. In
collaboration with Dr. J.A. Mennella, he
investigated the influence of early flavor
experiences on taste preferences in children. Djin Gie graduated in 1999, after which he
worked for the department of communication and public relations at the Wageningen
University for half a year. In 2000, he designed his own PhD project in collaboration
with the Monell Center and Wageningen University. This project was entitled: “Taste
development in children”. The first two years of this project were carried out at the
Monell Center. Where Djin Gie conducted studies on food acceptance and taste
development in infants and children. In 2002, he returned to Wageningen University
were he continued his work on taste development in children. In 2004 he was selected to
participate in the 10th European Nutritional Leadership Program, which took place in
Luxembourg. He is currently working as a consumer-sensory scientist in the Consumer
Perception & Behavior unit at Unilever R&D Vlaardingen.

Curriculum Vitae
197
LIST OF PUBLICATIONS
Papers
Liem DG, Mennella JA. Sweet and sour preferences during childhood; role of early
experiences. Developmental psychobiology 2002; 41: 388-395.
Liem DG, Mennella JA. Heightened sour preferences during childhood. Chemical
senses 2003; 28: 173-180.
Liem DG, Mars M, De Graaf C. Consistency of sensory testing with 4- and 5-year old
children. Food quality and preference 2004; 15: 541-548.
Liem DG, Mars M, De Graaf C. Sweet preferences and sugar consumption of 4- and 5-
year-old children: role of parents. Appetite, in press
Liem DG, Westerbeek A, Wolterink S, Kok FJ, De Graaf C. Sour taste preferences of
children relates to preferences for novel and intense stimuli. Chemical senses, in
press
Liem DG, Bogers RP, Dagnelie PC, De Graaf C. Fruit consumption of young children is
related to preferences for sour taste. Submitted.
Liem DG, De Graaf C. Sweet and sour taste preferences in young children and adults:
role of repeated exposure. Physiology & behavior, in press
Abstracts
Liem DG, Mars M, De Graaf C. Reliability of indirect scaling tests with respect to the
intensity and pleasantness of sugar (in 4-and 5-year-olds). Chemical senses 2000;
25, 637. Presented at AchemS 2000, Sarasota, Florida, US
Liem DG, Mennella JA. Flavor preferences during childhood. Chemical senses 2001;
26, 1041. Presented at AchemS 2001, Sarasota, Florida, US
Liem DG, Mennella JA. Heightened sour preferences during childhood. Liem DG,
Mennella JA. Chemical senses 2002 ; 27, A43. Presented at AchemS 2002,
Sarasota, Florida, US
Liem DG, Mars M, De Graaf C. Parental influences on sugar consumption and
sweet preference in children. Appetite 2002; 39, 246. Presented at Food Choice
2002, Wageningen, the Netherlands
Liem DG, Lam K, Elshout J, Kok FJ, De Graaf C. Sweet and sour preferences in
young children and adults: role of repeated exposure. Chemical Senses 2003;
Presented at AchemS 2003; 28. Sarasota, Florida, US
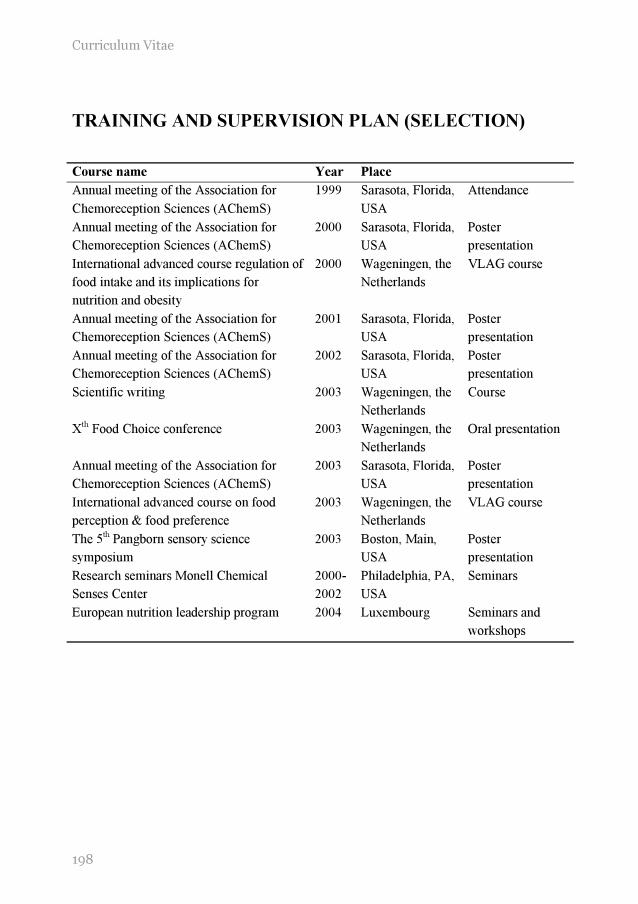
Curriculum Vitae
198
TRAINING AND SUPERVISION PLAN (SELECTION)
Course name Year Place
Annual meeting of the Association for
Chemoreception Sciences (AChemS)
1999 Sarasota, Florida,
USA
Attendance
Annual meeting of the Association for
Chemoreception Sciences (AChemS)
2000 Sarasota, Florida,
USA
Poster
presentation
International advanced course regulation of
food intake and its implications for
nutrition and obesity
2000 Wageningen, the
Netherlands
VLAG course
Annual meeting of the Association for
Chemoreception Sciences (AChemS)
2001 Sarasota, Florida,
USA
Poster
presentation
Annual meeting of the Association for
Chemoreception Sciences (AChemS)
2002 Sarasota, Florida,
USA
Poster
presentation
Scientific writing 2003 Wageningen, the
Netherlands
Course
Xth Food Choice conference 2003 Wageningen, the
Netherlands
Oral presentation
Annual meeting of the Association for
Chemoreception Sciences (AChemS)
2003 Sarasota, Florida,
USA
Poster
presentation
International advanced course on food
perception & food preference
2003 Wageningen, the
Netherlands
VLAG course
The 5th Pangborn sensory science
symposium
2003 Boston, Main,
USA
Poster
presentation
Research seminars Monell Chemical
Senses Center
2000-
2002
Philadelphia, PA,
USA
Seminars
European nutrition leadership program 2004 Luxembourg Seminars and
workshops

199

200
The research presented in this thesis was supported by Wageningen University and grant
HD37119 from the National Institute of Child Health and Human Development.
Financial support by the Wageningen University, Numico Research BV and Purac for
printing of the thesis is gratefully acknowledged
Cover: The game
Design: Djin Gie Liem
Graphics design: Gerard Treur
Printing: Ponsen & Looijen bv. Wageningen, The Netherlands
© Djin Gie Liem, 2004