Swedbank investor presentation · 2 Table of contents 1. Quarterly financial update 3 2. Capital...
65
Swedbank investor presentation July 2015
Transcript of Swedbank investor presentation · 2 Table of contents 1. Quarterly financial update 3 2. Capital...

Swedbank investor presentation July 2015

2
Table of contents 1. Quarterly financial update 3
2. Capital considerations 11
3. Liquidity and funding 17
4. Cover pool data 27
5. Swedish economy 35
6. Swedish housing and mortgage market 39
7. Appendix 46

1. Quarterly financial update
3
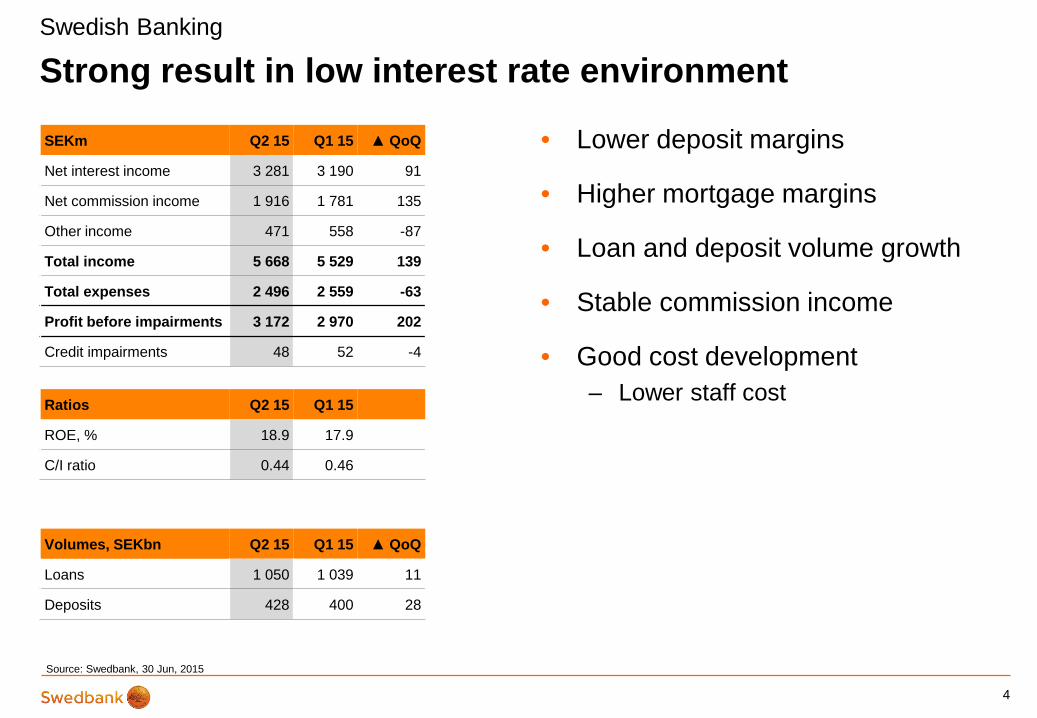
Strong result in low interest rate environment
4
Swedish Banking
Ratios Q2 15 Q1 15
ROE, % 18.9 17.9
C/I ratio 0.44 0.46
• Lower deposit margins
• Higher mortgage margins
• Loan and deposit volume growth
• Stable commission income
• Good cost development – Lower staff cost
Volumes, SEKbn Q2 15 Q1 15 ▲ QoQ
Loans 1 050 1 039 11
Deposits 428 400 28
SEKm Q2 15 Q1 15 ▲ QoQ
Net interest income 3 281 3 190 91
Net commission income 1 916 1 781 135
Other income 471 558 -87
Total income 5 668 5 529 139
Total expenses 2 496 2 559 -63
Profit before impairments 3 172 2 970 202
Credit impairments 48 52 -4
Source: Swedbank, 30 Jun, 2015

Stable result
• Loan volume growth
• Strong commission income – Cards and payments
• Solid asset quality
• Extra dividend from Estonia triggers increased tax cost
5
Baltic Banking
Ratios Q2 15 Q1 15
ROE, % (excl. one-off tax) 16.6 15.0
C/I ratio 0.40 0.41
Volumes, SEKbn Q2 15 Q1 15 ▲ QoQ
Loans 126 125 1
Deposits 138 135 3
SEKm Q2 15 Q1 15 ▲ QoQ
Net interest income 865 831 34
Net commission income 524 469 55
Other income 147 199 -52
Total income 1 536 1 499 37
Total expenses 611 612 -1
Profit before impairments 925 887 38
Credit impairments -49 -9 -40
Tax 1 064 131 933
Net profit -91 767 -858
Source: Swedbank, 30 Jun, 2015

Stable result
• Stable NII
• Lower deposit margins
• Volatile markets
• Good asset quality
6
Large Corporates & Institutions
Ratios Q2 15 Q1 15
ROE, % (excl. one-off tax) 15.6 16.9
C/I ratio 0.43 0.44
Volumes, SEKbn Q2 15 Q1 15 ▲ QoQ
Loans 182 178 4
Deposits 106 117 -11
SEKm Q2 15 Q1 15 ▲ QoQ
Net interest income 862 862 0
Net commission income 491 496 -5
Net gains and losses 576 587 -11
Other income 39 35 4
Total income 1 968 1 980 -12
Total expenses 842 877 -35
Profit before impairments 1 126 1 103 23
Credit impairments 7 16 -9
Source: Swedbank, 30 Jun, 2015

Stable result in low interest rate environment
7
Group results
SEKm Q2 15 Q1 15 ▲QoQ
Net interest income 5 704 5 719 -15
Net commission income 2 842 2 744 98
Net gains and losses 82 320 -238
Other income 687 835 -148
Total income 9 315 9 618 -303
Total expenses 4 047 4 168 -121 Profit before impairments 5 268 5 450 -182
Credit impairments 6 59 -53
Other impairments 22 15 7
Tax 1 538 1 101 437
Net profit 3 666 4 320 -654
• Stable NII
• Good cost development
• Strong asset quality
• Negative one-off tax effects
Ratios Q2 15 Q1 15
ROE, % 13.4 14.9
ROE, % (excl. one-off tax) 15.0 14.9
Cost/income ratio 0.43 0.43
CET1 capital ratio, % 22.4 20.5
Source: Swedbank, 30 Jun, 2015

-1.8
-1.7
-3.7
0.0
-3.7
-2.4
-2.2
422.3
406.8
400
405
410
415
420
425
430
Q1 2015 Exposurechange
Ratingmigration
(PD)
LGDchanges
Other creditrisk
CVA risk Market risk Operationalrisk
Q2 2015
Increase Decrease
Positive REA impact from market movements Capital
8
• REA net decrease of SEK 15.6bn
− Interest rates and FX fluctuations impact positively
− VaR model approval – to manage negative interest rate
Risk exposure amount
SEKbn
Source: Swedbank, 30 Jun, 2015

20.5%
22.4%
19.6%
Q1 2015 Q2 2015 CET1 capital ratiorequirement
Strong capitalisation – no excess capital Capital
9
• CET1 capital positively impacted
− IAS 19 (SEK 3.4bn)
• REA net decrease of SEK 15.6bn
• Continued regulatory uncertainty
CET1 capital ratio, %
Source: Swedbank, 30 Jun, 2015
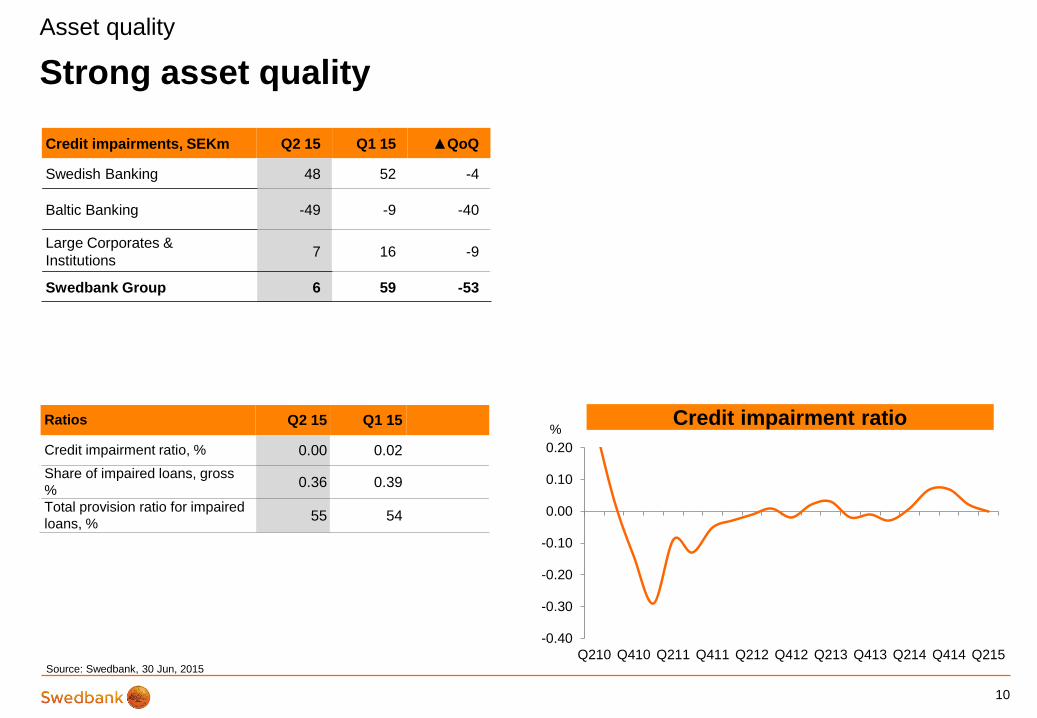
Strong asset quality
10
Asset quality
Credit impairments, SEKm Q2 15 Q1 15 ▲QoQ
Swedish Banking 48 52 -4
Baltic Banking -49 -9 -40
Large Corporates & Institutions 7 16 -9
Swedbank Group 6 59 -53
Ratios Q2 15 Q1 15
Credit impairment ratio, % 0.00 0.02 Share of impaired loans, gross % 0.36 0.39
Total provision ratio for impaired loans, % 55 54
Credit impairment ratio %
-0.40
-0.30
-0.20
-0.10
0.00
0.10
0.20
Q210 Q410 Q211 Q411 Q212 Q412 Q213 Q413 Q214 Q414 Q215Source: Swedbank, 30 Jun, 2015
2. Capital considerations
11

14.5%
13.7%
4.5%
3.5%
3.0%
1.0%
2.5%
1.5%
7.0%
2.0%Systemic Risk inPillar 2
25% REA MortgageFloor
Individual Pillar 2charge
Capital ConservationBuffer
CountercyclicalBuffer (1.5%)
Systemic Risk Buffer
Min additional T1and T2 capital
Minimum CET1Requirement
11.0%
11.4%
4.5%
3.0%
1.0%
2.5%
1.1%
5.5%
2.0% Systemic Risk inPillar 2
25% REAMortgage Floor
Individual Pillar 2charge
CapitalConservationBuffer
CountercyclicalBuffer (1.5%)
Systemic RiskBuffer
Minimum CET1Requirement
12
Capital position
19.6%*
Swedbank CET1 Requirements
28.2%*
22.4%*
*Fully loaded CRD IV
25.0%*
Swedbank Total Capital ratio
Source: Swedbank 30 Jun, 2015 – estimated CET1 and Total capital requirement based upon the Swedish FSA’s memorandum (08/09/2014)
Swedbank CET1 Capital ratio Swedbank Total Capital Requirements
Res
tric
tive
Mea
sure
s
Cor
rect
ive
Mea
sure
s
MDA Restrictions
Composition of Swedbank’s CET1 and total capital ratio requirements

0
50
100
150
200
250
8% ofliabilities
20% of REA +P1 buffers
2 x Basel 1floor
2 x Leverageratio
SwedbankQ215
Requirement Capital Senior > 1Year
Regulatory uncertainty remains Capital regulation
Swedbank’s current capital position Q2 2015
SEKbn
Source: Swedbank, 30 Jun, 2015
* Assuming leverage ratio requirement of 3%
13
MREL TLAC
Relevance EU banks under BRRD G-SIBs initially via Basel recommendations
Timing Jan 2016 at the earliest Transition to be specified
Jan 2019 at the earliest Transition to be specified
Amount Set individually, by Riksgälden (National debt office)
Minimum of 16-20% of REA + P1 buffers or 2 x leverage ratio requirement
What qualifies
Capital + Senior >1Y
Capital + "Designated senior" >1Y
Applies to Swedbank
Yes No, not a G-SIB
BRRD proposal: 8% of liabilities or 2 x Basel 1 floor

Swedish household loans(90% mortgages)
Shipping and offshore, TransportationManufacturing
Other corporate lending
Latvian lending
Other property management
Residential properties
Agriculture and forestry
Hotels and restaurants, Retail
63%
14%
4%
3%
8%
Lithuanian lending2%
6%
Estonian lending
Tenant owner associations
Asset portfolios – low risk
14
Source: Swedbank, 30 Jun, 2015 * Loans to the public excl. Credit institutions and SNDO
Asset quality
Group loan book* Q2 2015, total SEK 1 358bn Sweden
Baltic Banking
51%49% PrivateCorporate
64%
36% PrivateCorporate

0
2
4
6
8
10
12
14
16
18
20
SvenskaHandelsbanken
Nordea SEB Swedbank
2013
2014
2015
2016
02468
10121416182022
SvenskaHandelsbanken
Nordea SEB Swedbank
2014
2015
2016
2017
02468
10121416182022
SvenskaHandelsbanken
Nordea SEB Swedbank
2014
2015
2016
2017
15
Asset quality – stress tests
CET1 - The Riksbank stress test (%)
Source: EBA stress test Oct 2014
CET1 - The EBA stress test (%)
Swedbank’s strong relative risk position confirmed
Source: The Riksbank’s Financial Stability Report 2014:2, chart 4:9 Note: The chart shows the CET1 capital ratios in the third quarter of each year.
CET1 - The Swedish FSA stress test (%)
• SFSA stress test: SEK 45bn
• Riksbank stress test: SEK 45bn
• EBA stress test: SEK 25bn
• ICAAP stress test: SEK 17bn
Total Swedbank loan losses in the different stress tests
Source: SFSA’s risk report Dec 2014
Source: The SFSA Dec 2014, Riksbank Dec 2014, EBA Oct 2014 and Swedbank Apr 2015

16

3. Liquidity and funding
17

0
200
400
600
800
1 000
1 200
1 400
1 600
1 800
Q2 20150
200
400
600
800
1 000
1 200
1 400
1 600
1 800
Q2 2015
Source: Swedbank 30 Jun, 2015
Core balance sheet* structure Liquidity and funding
Lithuania Latvia
Other corporate lending, Sweden & other Nordic countries
Other private, Sweden
Swedish mortgage loans
Senior unsecured debt
Covered bonds
Deposits
CET1 Suppl. cap
Assets Liabilities SEKbn SEKbn
* Simplified balance sheet
Estonia
18

0
1 000
2 000
3 000
4 000
5 000
6 000
7 000
8 000
9 000
0%
10%
20%
30%
40%
50%
60%
70%
80%
90%
100%
1980 1990 2000 2005 2010 2012 2013 2014
Other financial assets (LHS) Pension savings and mutual funds (LHS)
Equities (LHS) Deposits and retail bonds (LHS)
Total financial assets (RHS)
19
Covered bond strategy
Source: Swedbank 30 Jun, 2015
Liquidity and funding
Maturity, years
EUR/USD SEK 150-200bn
Other* SEK 50-85bn
Sweden SEK 300-375bn
<5Y 3-7Y >7Y
Swedish households’ financial assets SEKbn
Covered bond strategy

0
20
40
60
2015 2016 2017 2018 2019 2020 2021-
Senior unsecured debt
Senior unsecured debt strategy
Source: Swedbank 30 Jun 2015, *nominal amounts
Senior unsecured debt maturity profile
SEKbn*
Liquidity and funding
20

0
50
100
150
200
250
300
0 20 40 60 80 100 120 140 160 180 200 220 240 260 280 300 320 340 3650
10
20
30
40
50
60
70
80
90
100
Q112 Q212 Q312 Q412 Q113 Q213 Q313 Q413 Q114 Q214 Q314 Q414 Q115 Q215 Q315 Q415 Q116
Covered bonds Senior unsecured debt
Conservative funding position • LCR 136% (Swedish FSA definition FFFS 2012:6)
• NSFR 101% (Basel committee)
• Issued SEK 133bn of term-funding YTD 2015 (excl. AT1 transaction in Feb. 2015)
• Increased funding need to support loan growth
Liquidity and funding
Term funding issuance – completed and planned
SEKbn
Source: Swedbank, 30 Jun 2015, nominal amounts
SEKbn
Days forward
Prefunded in excess of 12 months
Survival horizon
21

20
22
24
26
28
30
32
34
36
38
Q414 Q115 Q215
Covered bondfunding
Senior unsecureddebt
Total capital marketfunding
0
10
20
30
40
50
60
70
80
Average 2014 Q115 Q215
Other
Senior unsecured debt
Covered bonds
Increased long-term funding activity
• Taking advantage of favourable funding markets
• Extending maturity profile
• Credit rating upgrades
22
Liquidity and funding
Extension of maturity profile
Quarterly long-term funding issuance
SE
Kbn
N
umbe
r of m
onth
s
Source: Swedbank, 30 Jun, 2015

Private placements – active in both covered bonds and senior unsecured debt • All major currencies
• Bullet format, FRN or Fixed
• EUR 10m equivalent minimum size
• Sweet spots: – Senior: 2.5-5Y – Covered: 3-8Y – Longer tenors also possible
• Open to larger placements with smaller investor groups
• Open to tap existing bonds
• Listing is optional
• FRN’s (SEK and EUR) – issued with a “strike adjustment spread”*
• Program formats available: – Senior unsecured debt: MTN, NSV and
potentially USD 144a format – Covered bonds: MTN, RCB and
Norwegian CB program
23
Liquidity and funding
*Spread added to the coupon to avoid negative coupon fixings. Bond issued above par to compensate for this. The above par value reflects the NPV of the adjusted spread

Liquidity reserve According to the template defined by the Swedish Bankers' Association
Liquidity and funding
Source: Swedbank 30 Jun 2015
SEKmCash and holdings in central banks 237 956Deposits in other banks available overnight 879Securities issued or guaranteed by sovereigns, central banks or multilateral development banks 65 783Securities issued or guaranteed by municipalities or public sector entities 3 554Covered bonds 46 480 - Issued by other institutions 46 480 - Own issuedSecurities issued by non-financial corporatesSecurities issued by financial corporates (excl. covered bonds) 740Other
Total1 355 392
Additional liquid assets, Group2, 3 77 401
1) 94% of the securities in the liquidity reserve per Q2 2015 are rated AAA. The rating requirement is AA-.
2) 89% of the additional assets fulf ill the Liquidity Reserve definition by the Sw edish Bankers’ Association except for that they are held outside the Treasury department.
3) 86 % of the additional assets are rated AAA.
24

Rating strategy – same level as the best rated Nordic banks
25
Source: Swedbank 30 Jun 2015
This is Swedbank - Credit ratings
• June 25, 2015, S&P raised Swedbank’s standalone rating to A+. The outlook was changed to stable, from negative. The main drivers are a stable management, strong key ratios in efficiency, and earnings stability.
• June 17, 2015, Moody’s upgraded Swedbank to Aa3 with a stable outlook. The upgrade reflects Moody’s estimation that Swedbank’s strong asset quality and stable earnings generation, underpinned by focused management and established franchise in Sweden and the Baltic countries, position the bank well to manage challenges coming from the low interest-rate environment, developments in mobile banking, and competition in historically more profitable activities
• June 09, 2015, Fitch affirmed the rating, with a positive outlook. Fitch restated they expect to upgrade the rating to AA- provided Swedbank continue to build on the current track record
Short Long SACP* Short Long BCA* Short Long VR*
Swedbank A-1 A+ a+ P-1 Aa3 a3 F1 A+ a+
Swedbank Mortgage A-1 A+ - P-1 Aa3 - - - -
Covered bonds - AAA - - Aaa - - - -
* Standalone Rating
S&P (Stable) Moody's (Stable) Fitch (Positive)

26

4. Cover pool data
27
Swedbank is a labeled issuer of the ECBC Covered Bond Label Foundation (www.coveredbondlabel.com )

28
Rating, S&P / Moody’s AAA / Aaa Total pool size SEK 799.8bn Geographic distribution Sweden 100% Current OC-level 56.9%
Weighted average seasoning 2 65 months Average LTV 3, 4 – WA LTV on property level (Max LTV) 54% Non-performing loans 5 None
Fixed /Floating interest loans 6
– Fixed 30% – Floating 70%
Repayment structure 7 – Amortising 55% – Interest only 45%
Average loan size SEK 504 755 Number of loans outstanding 1 585 221 Number of borrowers 1 121 130 Number of properties 747 700 Dynamic pool Yes
1 As per 30 Jun, 2015
2 Public sector loans not included
3 Index valuation as per 30 Jun, 2015 4 Maximum LTV: Residential 75%, Commercial 60%, Forest and Agriculture 70% 5 Past due loans > 60 days are not eligible for the cover pool 6 Floating interest loans < 365 days 7 Property level of cover pool
Cover pool data1
Source: Swedbank 30 Jun 2015
Swedbank’s cover pool
Swedbank is a labeled issuer of the ECBC Covered Bond Label Foundation (www.coveredbondlabel.com )

Cover pool data
29
Swedbank’s cover pool
Source: Swedbank 30 Jun 2015
Swedbank is a labeled issuer of the ECBC Covered Bond Label Foundation (www.coveredbondlabel.com )
Type of loans
Residentials 91.0% of w hich Single-family housing 57.5% of w hich Tenant ow ner rights 18.2% of w hich Tenant ow ner association 10.4% of w hich Multi-family housing 5.1%Public 1.0%Commercial 0.5%Forest & Agricultural 7.3%
100.0%
Geographical distribution, Sweden, per cent 30 Jun2015
North 6.3Norrbotten county (BD) 1.3Västerbotten county (AC) 2.4Västernorrland county (Y) 1.4Jämtland county (Z) 1.2Middle (including Stockholm) 44.9Dalarna county (W) 2.1Gävleborg county (X) 2.1Värmland county (S) 2.2Örebro county (T) 2.5Västmanland county (U) 2.5Uppsala county ( C) 4.0Södermanland county (D) 2.3Stockholm county (including Stockholm) (AB) 27.2South (including Göteborg and Malmö) 48.8Västra götaland county (Including Göteborg) (O) 17.5Östergötland county (E) 4.0Jönköping county (F) 3.6Halland county (N) 3.8Kronoberg county (G) 2.1Kalmar county (H) 3.1Skåne county (including Malmö) (M) 12.5Blekinge county (K) 1.6Gotland county (I) 0.6
100.0

Cover pool loan-to-value distribution
30
Swedbank’s cover pool
Source: Swedbank 30 Jun 2015
• Weighted average LTV 54%
LTV distribution per property1 LTV distribution by volume1, 2
1 Public loans of 1.0% of the cover pool are excluded as they are either guaranteed by a Swedish municipality or the government and have therefore no LTV assigned to them. 2 LTV distribution as defined by the Association of Swedish Covered Bond Issuers (www.ascb.se)
Swedbank is a labeled issuer of the ECBC Covered Bond Label Foundation (www.coveredbondlabel.com )
0%
5%
10%
15%
20%
25%
30%
00-10 10-20 20-30 30-40 40-50 50-60 60-70 70-750%
5%
10%
15%
20%
25%
30%
00-10 10-20 20-30 30-40 40-50 50-60 60-70 70-75

Cover pool loan type and loan-to-value distribution
31
Swedbank’s cover pool
Source: Swedbank 30 Jun 2015
1excluding public sector loans of 1.0%
WA LTV per property type1
1
Swedbank is a labeled issuer of the ECBC Covered Bond Label Foundation (www.coveredbondlabel.com )
0%
20%
40%
60%
80%
100%
120%
0%
20%
40%
60%
80%
100%
120%
Single-familyhomes
Tenant ownerrights
(apartments)
Tenant ownerassociations
Multi-familyhousing
Commercial Forestry &Agricultural
Total alltypes
Percentage of the pool Average LTV per loan type

Strong resilience to house prices changes
• Current OC-level of 56.9%
• Can withstand a severe house price drop and still be able to issue AAA-rated covered bonds
32
Swedbank’s cover pool O
ver-
colla
tera
lisat
ion
House price drop
House price sensitivity of the cover pool
Source: Swedbank 30 Jun 2015
Swedbank is a labeled issuer of the ECBC Covered Bond Label Foundation (www.coveredbondlabel.com )
0%
10%
20%
30%
40%
50%
60%
0% -5% -10% -15% -20% -25% -30% -35% -40% -45% -50%
OC, Q215

The Covered Bond Act entered into force on July 1, 2004 and is over-sighted by the Swedish FSA. Its main characteristics are: Dual recourse to the issuer and cover pool Dynamic, regulated pool of assets, frequently monitored by the Swedish FSA via appointment of an
independent inspector Regulated valuation of cover pool assets which remain on the balance sheet
The cover pool may consist of certain mortgage credits, public credits and supplemental assets. There is no requirement to segregate mortgage and public credits.
Maximum LTVs: Residential 75%, Agricultural 70%, Commercial 60%
Maximum 10% commercial loans and 20% supplemental assets in cover pool
Regular monitoring of the property values, revaluation of property prices in case of significant drop (generally interpreted as 15% drop)
No mandatory over-collateralisation (OC)
Regional constraint on collateral assets (Mortgage - EEA, Public - OECD)
The cover pool value shall always exceed the aggregate value of claims (including derivatives)
A sound balance in terms of FX, interest rates and maturities must be achieved. It is deemed to exist when the present value of the cover pool at all times exceed the present value of liabilities (including derivatives), even on a stressed basis. Present value cover must hold even after 1% upward and downward shift in the yield curve and a 10% change in the currency
Non-performing assets in the cover pool which are more than 60 days overdue must be disregarded for the purposes of the matching tests
Holders of covered bonds and relevant derivative counterparties benefit from a priority claim over the cover pool should the institution be declared bankrupt and rank pari passu ahead of unsecured creditors and all other creditors of the institution in respect of assets in the cover pool
The registered assets in the cover pool, the covered bonds and any relevant derivative contracts are required to be maintained as a unit and kept segregated from other assets and liabilities of the bankruptcy estate of the institution. The administrators-in-bankruptcy are then required to procure the continued timely service of payments due under the covered bonds and any relevant derivative contracts
Overview of the Swedish covered bond legislation
33
Swedish covered bond legislation
Loan-to-value ratios and other limitations
Matching requirements
Benefit of a priority right over the cover pool
Administration in event of bankruptcy
The Covered Bond Act
Source: www.ascb.se

34

5. Swedish economy
35
-5
-4
-3
-2
-1
0
1
2
3
4
93 94 95 96 97 98 99 00 01 02 03 04 05 06 07 08 09 10 11 12 13 14
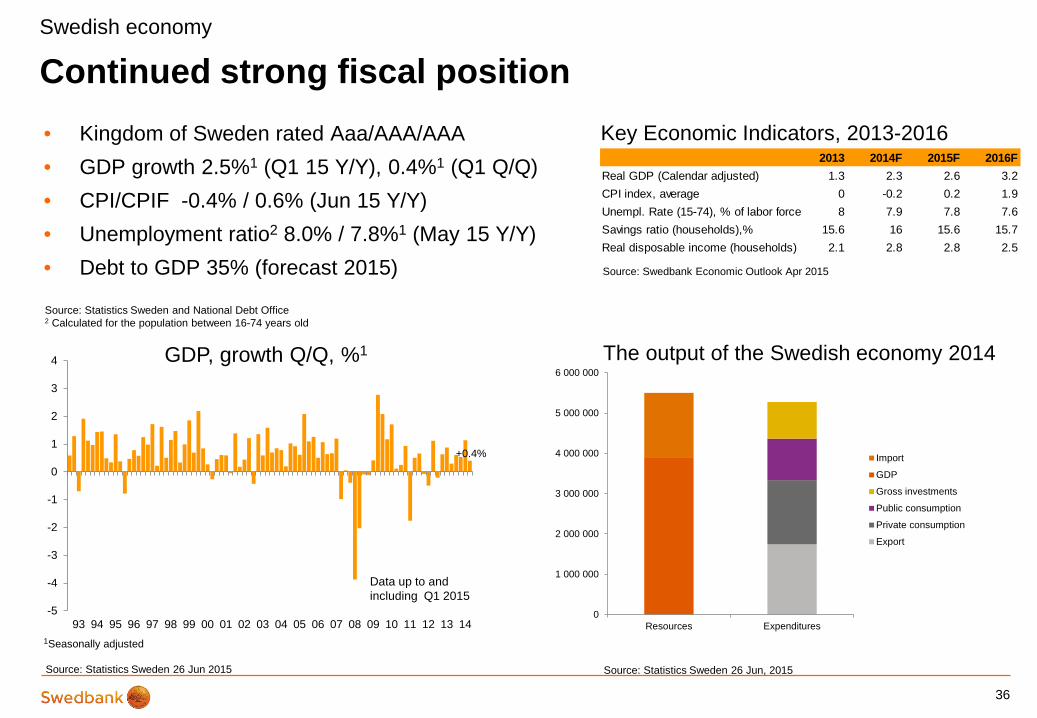
Continued strong fiscal position • Kingdom of Sweden rated Aaa/AAA/AAA • GDP growth 2.5%1 (Q1 15 Y/Y), 0.4%1 (Q1 Q/Q) • CPI/CPIF -0.4% / 0.6% (Jun 15 Y/Y) • Unemployment ratio2 8.0% / 7.8%1 (May 15 Y/Y) • Debt to GDP 35% (forecast 2015)
36
Swedish economy
Key Economic Indicators, 2013-2016
Source: Swedbank Economic Outlook Apr 2015
Source: Statistics Sweden and National Debt Office 2 Calculated for the population between 16-74 years old
Source: Statistics Sweden 26 Jun 2015
GDP, growth Q/Q, %1
Data up to and including Q1 2015
1Seasonally adjusted
+0.4%
0
1 000 000
2 000 000
3 000 000
4 000 000
5 000 000
6 000 000
Resources Expenditures
Import
GDP
Gross investments
Public consumption
Private consumption
Export
The output of the Swedish economy 2014
Source: Statistics Sweden 26 Jun, 2015
2013 2014F 2015F 2016FReal GDP (Calendar adjusted) 1.3 2.3 2.6 3.2CPI index, average 0 -0.2 0.2 1.9Unempl. Rate (15-74), % of labor force 8 7.9 7.8 7.6Savings ratio (households),% 15.6 16 15.6 15.7Real disposable income (households) 2.1 2.8 2.8 2.5

-8
-6
-4
-2
0
2
4
6
8
10
Germany
Denmark
Sweden
France
Finland
United States
Canada
United Kingdom
Italy
14%
44%
14%
11%
10%
7%
0%
10%
20%
30%
40%
50%
60%
70%
80%
90%
100%
Energy
Minerals
Forest
Chemical
Engineering
Other
0%
2%
4%
6%
8%
10%
12%
0
20 000
40 000
60 000
80 000
100 000
120 000
-04 -05 -06 -07 -08 -09 -10 -11 -12 -13 -14 -15
Import
Export
Exports – key factor for growth
37
Swedish economy
Source: Statistics Sweden, 26 Jun 2015
Current account balance as % of GDP
Source: OECD – Economic outlook 97, table 51, Jun 2015
Exports by important commodity groups, %
Exports and imports trend per month, SEKm Current prices
Data up to and including May 2015
Top 10 export countries, %
Source: Statistics Sweden, 26 Jun 2015
Source: Statistics Sweden, 26 June 2015

38

6. Swedish housing and mortgage market
39

Swedish mortgage market • No securitisation (on balance sheet), no sub-prime market, no 3rd party origination, restricted buy-
to-let market
• 70% home ownership1
• Rental market is regulated
• Transparent credit information (credit information agency, www.uc.se) – Publicly available information regarding income, debt, payment track record etc
• Consumer credit legislation requires affordability calculations including stress test of higher interest rate and conservative cost of living
• Very limited debt forgiveness possibilities (full recourse)
• Strong social security and generous unemployment benefit system
40
Swedish housing and mortgage market
1 Source: Boverket, 2011

0
2
4
6
8
10
12
14
16
18
02 03 04 05 06 07 08 09 10 11 12 13 14 15
Annual percentage change, total Mortgage lending
Household borrowing growth
41
Lack of residential housing drives lending growth
Source: Swedbank, Statistics Sweden, data as per Jun 2015
%
Swedish housing and mortgage market
• LTV cap of 85% – Mandatory since 2010 – (Min 15% own equity)
• Amortisation – Mandatory amortisation >70% LTV – Individual amortisation plan >50%
LTV
• Risk-weight floor of 25% on mortgage loans
Data up to and including May 2015

Swedbank - tightened mortgage standards
• Average LTV in back book is 59%. Average LTV in new lending is 70%
• Tightened amortisation standards (e.g. min. interest rate of 7% in stress test)
• 94% of households with LTV > 70% amortise (81% in back-book)
• 53% of households with LTV 50-70% amortise (52% in back-book)
• In total 76% of households amortise (61% in back-book)
42
50%
55%
60%
65%
70%
75%
2009 2010 2011 2012 2013 2014 Q1 2015 Q2 2015
LTV distribution
Single-family, back-book Single-family, new
Tenant-owner rights, back-book Tenant-owner rights, new LTV
Swedish housing and mortgage market
40%
50%
60%
70%
80%
90%
100%
0-50% 50-70% >70% Total
Amortisation level – new lending
Source: Swedbank, 30 Jun, 2015

0
20 000
40 000
60 000
80 000
100 000
120 000
75 78 81 84 87 90 93 96 99 02 05 08 11 14
Apartment buildings Single-family dwellingsPopulation growth
Shortage of housing Swedish housing and mortgage market
Housing completions in Sweden
Num
ber o
f un
its a
nd p
erso
ns
• 58% of the apartments was produced in the three largest areas (Stockholm, Gothenburg and Malmoe)
• 55% of the single-family dwellings was produced outside of the largest cities
• 52% was rental apartments (35% in Larger Stockholm and 65% outside the three larger areas)
• Forecast from municipalities to start up projects for 59 000 units in 2015 and 63 000 units in 2016 (according to survey1) Source: Sweden statistics , the Riksbank and Swedbank, Jun 2015
0
10 000
20 000
30 000
40 000
50 000
60 000
70 000
2015 2016
Apartment buildings Single-family dwellings
Source: 1 Boverket (www.boverket.se) ’Mortgage market survey 2015’
43

0
100
200
300
400
500
600
700
75 78 81 84 87 90 93 96 99 02 05 08 11 14Total assets excl. collective insurance Real assets (housing) Debt
0
2
4
6
8
10
12
75 78 81 84 87 90 93 96 99 02 05 08 11 14
Interest-to-income ratio Historical average
Affordability withstands higher indebtedness • Low interest rate environment • Disposable income
– Increase in salaries
– Tax cuts (income + property tax etc.)
• Higher indebtedness – Higher share of home ownership
– Rapid population growth (immigrations)
– Urbanisation trend
• Wealth – Increased house prices
– Mutual funds, pension savings etc.
Swedish housing and mortgage market
Swedish household financial assets and liabilities to disposable income
Household interest expenditure in Sweden to disposable income
Source: OECD Economic Outlook 97, table 23, Jun 2015
Source: Swedish Riksbank’s Financial Stability report 2015:1 (chart 2:10)
%
%
-10
-5
0
5
10
15
20
98 00 02 04 06 08 10 12 14 16F
Sweden
Germany
Norway
United States
Finland
Denmark
Source: Swedish Riksbank’s Financial Stability report 2015:1 (chart A36)
44
Household saving rates % of disp. income

0
50
100
150
200
250
300
05 06 07 08 09 10 11 12 13 14 15
Total Tenant owner rights (apartments) Single-family houses
0
50
100
150
200
250
300
05 06 07 08 09 10 11 12 13 14 15
Tenant owner rights (apartments) Single-family houses
0
50
100
150
200
250
300
05 06 07 08 09 10 11 12 13 14 15
Tenant owner rights (apartments) Single-family houses
0
50
100
150
200
250
05 06 07 08 09 10 11 12 13 14 15
Tenant owner rights (apartments) Single-family houses
Upward pressure on house prices Swedish housing and mortgage market
Sweden, total
Source: Valueguard Index (2005=100), 30 Jun, 2015
Stockholm
Gothenburg Malmoe
45

Appendix
46

0
5
10
15
20
25
0
20
40
60
80
100
120
140
160
2011 2012 2013 2014 H1 2015
NSFR LCR CET1 capital ratio, Basel 3 (RHS)
Swedbank – a low-risk bank with strong capital base
47
• Low risk – a Board of Directors’ strategic priority – ensures access to funding markets and low funding costs
• Retail profile and four home markets a key feature – 86% of total loans originated in Sweden - Swedish mortgages account for 62% of total loans – 90% of total loans are collateralised (76% real estate and 14% other collateral)
• Strong capital position – Board of Directors’ decision to maintain a buffer above prevailing SFSA capital requirements to have operational flexibility – current buffer 280bp
• Conservative funding and liquidity position – survival horizon longer than 12 months assuming closed funding markets, NSFR 101% and LCR 136%
• Baltic operations self-funded – Loan-to-Deposit ratio < 100%
%
This is Swedbank
Liquidity & capital %
Source: Swedbank 30 Jun 2015
Credit impairment ratio
-0.40
-0.30
-0.20
-0.10
0.00
0.10
0.20
Q210 Q410 Q211 Q411 Q212 Q412 Q213 Q413 Q214 Q414 Q215
%

Swedbank – strong and stable earnings capacity
48
• Four home markets – Sweden, Estonia, Latvia and Lithuania – Strong and stable economies – Market leading position in all home markets – Largest customer base in all home markets
• Retail profile ensures stable earnings with low volatility
• High cost efficiency – a strategic priority – ensures good profitability
• Stable earnings is first line of defence supporting low risk profile and strong capital position
SEKm
This is Swedbank
0
1 000
2 000
3 000
4 000
5 000
6 000
7 000
Q1 10 Q1 11 Q1 12 Q1 13 Q1 14 Q1 15
Source: Swedbank 30 Jun 2015
Profit before impairment

12 000
14 000
16 000
18 000
20 000
2010 2011 2012 2013 2014 Ambition2016
Acquistion of Sparbanken Öresund
Swedbank – market leading cost efficiency
49
• Best in-class cost efficiency – an executive management strategic priority • Strong dedication from executive management on cost and change management
− Integrated in corporate culture − Focus on straight-through-processing − Evolving household banking model – digitalisation trend
• Retail profile a key feature − Four home markets – Sweden, Estonia, Latvia and Lithuania – reducing complexity − Largest private and SME customer base − High degree of digitalisation in home markets
SEKm Total expenses
This is Swedbank
Source: Swedbank 30 Jun 2015
0.30
0.35
0.40
0.45
0.50
0.55
0.60
2010 2011 2012 2013 2014 H1 2015
C/I ratio

Sweden’s largest retail bank
50
Latvia Population 2.0m Private customers 0.9m1 Corporate customers 89 000 Branches 43 ATMs 405 Cards 1.0m Employees 1 503
Lithuania Population 3.0m Private customers 1.5m1 Corporate customers 86 000 Branches 68 ATMs 457 Cards 1.7m Employees 1 886
Estonia Population 1.3m Private customers 0.8m Corporate customers 134 000 Branches 38 ATMs 442 Cards 1.1m Employees 2 332
Sweden Population 9.6m Private customers 4.1m Corporate customers 268 000 Organisations 64 000 Branches 296 ATMs * Cards 3.9m Employees 7 957
This is Swedbank
~10%* ~86%*
* Share of loanbook
* ATMs are handled in Bankomat AB (www.bankomat.se)
Source: Swedbank Fact book Q2 2015 1Definition of private customers changed compared to Q4 2014

0
10
20
30
40
50
60
Sweden Estonia Latvia* Lithuania**
Mortgage lendingCorporate lending
0
10
20
30
40
50
60
Sweden Estonia Latvia* Lithuania**
Deposits Private
Deposits Corporate
Market leading retail franchise in all home markets
51
% %
Source: Source Sweden: Statistics Sweden (SCB) as per May 2015 Source Estonia: Estonian Central Bank, as per May 2015 Sources Latvia: Association of Commercial Banks of Latvia (ACBL) & The Financial and Capital Market Commission (FCMC), *as per Dec 2014 Source Lithuania: Association of Lithuanian Banks (LBA), **as per Mar 2015
This is Swedbank
Market shares, Deposits
• Largest retail bank and fund manager in Sweden
Market shares, Lending

Swedish Banking +
Large Corporates
& Institutions
78%
Estonia 6%
Latvia 4%
Lithuania 4%
Other 8%
Lending and deposits
64%
Treasury, Trading and
Capital Markets5%
Asset Management
11%
Payment, Cards
8%
Insurance2%
Share of P&L of associates
3%
Other7%
Strong earnings capacity – retail bank profile
52
This is Swedbank
FY Total Income evolution, SEKbn
…And distribution by business area
FY 2014 Total income geographic distribution…
Source: Swedbank 31 Dec 2014
0
5
10
15
20
25
30
35
40
45
2010 2011 2012 2013 2014
OtherNet Gains & Losses on financial itemsNet Commission Income, otherNet Commission Income, RetailNet Interest Income

0 200 400 600 800 1000 1200
Other* 4.3%
Lithuania 2.9%
Latvia 2.1%
Estonia 4.3%
Sweden 86.4%
Swedish Mortgage loans (private+corp)
Other corporate (incl. LC&I, Sweden)
Sweden – the dominating home market • Total lending to the public amounts to SEK 1 358bn (as per Q2 2015), out of which
around 86% is originated in Sweden
• Estonia makes up 46% of total lending in the Baltics
53
Source: Swedbank 31 Mar 2015
This is Swedbank
* Denmark, Norway, Finland and NY Branch
Lending distributed by countries (Q2 2015)
SEK 1 174bn

01 0002 0003 0004 0005 0006 0007 0008 0009 000
10 000
Loans net, SEKm
Shipping and Offshore
• Total lending of SEK 29.5bn (30bn, Q1) – Market activity slowed down in Q2
compared to Q1 15 and Q4 14 – Decreased origination
• Individual client action plans in place
• Clients now adapting to the lower oil price by cutting costs, postponing orders and setting up new financial structures
Asset quality
Shipping and Offshore
Negatively impacted by lower oil prices
Source: Swedbank 30 Jun 2015
SEKm
54

New insolvency order for banks – gone concern capital protects depositors and the government
55
Capital regulation
CET1 capital
Additional Tier 1 capital
Tier 2 capital
Other subordinated debt
Senior bonds
(unsecured)
Uninsured deposits (natural persons + micro + SEM’s)
DGS (in lieu of insured depositors)
(Resolution fund)
Fiscal backstop
Uninsured non-preferred
deposits
Other liabilities
Other liabilities
Regulatory capital
Preferred classes (possible if above
not sufficient)
Private loss absorbency
Industry loss absorbency (subject to State aid rules)
Taxpayer loss absorbency (subject to State aid rules)
Secured liabilities (incl. covered bonds)
Client assets and some liabilities
Staff (ex bonus)/Tax/ Trade liabilities/DGS
contributions
Covered deposits Some interbank liabilities
Some payment & settlement liabilities
Defined exclusions
Discretionary exclusions
Derivatives Uninsured retail,
micro & SME deposits
3rd country debt issued
prior to 2013
Exclusions
Swedish Stability Fund Under Article 44 8(a) of BRRD the Swedish Stability fund would be able to contribute to cover losses that have not been absorbed after either 20% of RWA or 8% of total liabilities have contributed to loss absorption Fund Size: SEK 53,016bn (28 Feb 15) Swedbank CET1: 20.5% (Q115)

11.0%
8.6%
Swedbank CET1 Capital ratio Requirements
Pillar 2 CET1Requirements
Pillar 1 CET1Requirements
56
● “It is particularly important that FI has the possibility of giving due consideration to the specific situation…in which a firm in financial stress finds itself… For example, certain risks included in the assessment of the Pillar 2 basic requirement might have materialized, which might mean there are no longer grounds for requiring the firm to hold capital for them”.
● “It ought to be positive for financial stability that a firm has the possibility… to restore its capital without the firm necessarily becoming subject to priorly specified and automatic legal restrictions. In other words, firms are hence given the possibility of re-establishing their capital in a strained situation without automatic restrictions on distributions or, depending on the size of the capital shortage, a formal resolution phase being activated."
● “Hence…a firm may freely choose…the most suitable way of restoring the capital in that specific situation. For example, the firm is not obliged to halt or limit dividends or interest payments on Tier 1 capital contributions, if the firm can identify other and more appropriate ways of restoring the capital sufficiently quickly.”
Source: Swedish FSA Memorandum: ”Capital requirements for Swedish banks” – 8 Sep 2014 and Swedbank
AT1 capital transaction
Corrective M
easures R
estrictive Measures
*Fully loaded CRD IV
19.6%*
No automatic sanctions for breaching the Pillar 2 capital requirements
MDA Restrictions

0
5
10
15
20
25
30
35
40
45
Q112 Q212 Q312 Q412 Q113 Q213 Q313 Q413 Q114 Q214 Q314 Q414 Q115 Q215
Total capital market funding Covered bond funding
29%19%
35%
15%
34%
57%
2%9%
0%
10%
20%
30%
40%
50%
60%
70%
80%
90%
100%
2007 Q2 2015
5 years +
1-5 years
3-12 months
0-3 months
Fundamental change of maturity profile
57
Average maturity profile of outstanding market funding
Source: Swedbank, 30 Jun 2015
Months
SEK 673bn
SEK 838bn
• 2007 – 64% of wholesale funding < 12 months, SEK 13bn in central bank deposits
• Q2 2015 – 34% of wholesale funding < 12 months, SEK 238bn in central bank deposits
Liquidity and funding

0
50
100
150
200
2015 2016 2017 2018 2019 2020 2021-
Senior unsecureddebt
Covered bonds
Long-term funding maturity profile
Long-term funding maturity profile, by funding source
Source: Swedbank 30 Jun 2015
Liquidity and funding
SEKbn SEKbn
Long-term funding maturity profile, by currency
Benchmark transactions YTD 2015 ● USD 750m, Perp. NC5 (2020), AT1, 5.50% - equity conversion
● USD 1bn 144a Senior, 5Y (2020), T+77bp (+ USD 400m 3Y (2018) T+65bp)
● EUR 1bn CB, 7Y (2022), Fixed MS-5bp
● GBP 500m CB, 3Y (2018 FRN, 3m £L+20bp
● GBP 300m Senior, 4Y (2019), Fixed G+80bp
● SEK 3bn, Senior 5Y (2020), Fixed/FRN, 3m Stibor + 50bp
● USD 1bn, RegS. CB 5Y (2020), Fixed, 3m $L + 37bp
● EUR 750m Senior 7Y (2022), Fixed, MS+45bp
0
50
100
150
200
2015 2016 2017 2018 2019 2020 2021-
Other
CHF
USD
EUR
SEK
58

Asset encumbrance
59
Liquidity and funding
Source: Swedbank Facts 30 June 2015 – All amounts according to Swedbank consolidated situation
Information on importance of encumbrance-Outside of mortgage loans, used for Sw edbanks main funding source covered bonds, small volumes derives from derivatives and repos-Outside of mortgage loans, originated out of the 100% ow ned subsidiary Sw edbank Mortgage AB, the absolute main part belongs to Sw edbank AB (less than 1% from other subsidiaries w ithin the Group)-Unencumbered assets under 'other assets' include assets not eligible for pledging in central banks (e.g. intangible assets)
Type of assets (Balance Sheet items)
SEKmCarrying amount of
encumbered assetsFair value of encumbered
assetsCarrying amount of
unencumbered assetsFair value of
unencumbered assets
Assets of the reporting institution 551 066 1 592 612 Loans on demand 237 422 Equity instruments 10 333 10 333 Debt securities 26 029 26 156 184 321 185 222 Loans and advances other than loans on demand 525 037 1 034 701 of w hich mortgage loans 501 540 452 118 Other assets 125 835
Type of assets (Off-balance sheet items)
SEKm
Fair value of encumbered collateral received or ow n
debt securities issued
Fair value of collateral received or ow n debt securities issued
available for encumbrance
Nominal amount of collateral received or ow n debt
securities issued not available for encumbrance
Collateral received by the reporting institution 21 172 81 402 3 907
Unencumbered
Purpose for encumbrance (On- and off-balance sheet items)
SEKmMatching liabilities, contingent
liabilities or securities lent
Assets, collateral received and ow n debt securities issued
other than covered bonds and ABSs encumbered
Carrying amount of selected f inancial liabilities 565 274 566 294 Derivatives 21 799 22 819 Deposits 41 935 41 935 Debt securities issued 501 540 501 540Other sources of encumbrance 5 944 5 944Total 571 218 572 238

Funding sources
60
Swedbank AB Swedbank Mortgage AB*
* 100% guaranteed by parent company - Irrevocable - Unconditional - Timely ** Limited by cover pool size
100% owned
Liquidity and funding
Source: Swedbank, 30 Jun 2015
Program LimitLong Term
Domestic Benchmark CB Unlimited**EMTN CB EUR 25bnUSD Covered bonds (144a / Reg.S) USD 15bnDomestic MTN CB SEK 150bnNorwegian Benchmark CB Unlimited**
Registered CB (stand alone doc.)
Short Term
Domestic CP SEK 50bn
Program LimitLong Term
Global MTN USD 40bnDomestic MTN SEK 60bnUSD Senior (144a / Reg.S) USD 15bn
NSV (stand alone doc.)
Short TermDomestic CP SEK 80bnEuropean CP/CD EUR 6bnUS CP USD 20bnYankee CD USD 20bnFinnish CD EUR 4bn

Swedish FSA’s mortgage market report 2015
• Average LTV: 67%
• Amortise, LTV>70%: 90%
• Amortise, LTV 50-70%: 40%
• Debt to disp. Income*: 366%
• Around 5% of households (with amortisations) will have a deficit if interest rates increase by 5%-points
61
Swedish housing and mortgage market
*Mortgage loans only
Source: Swedish FSA’s memorandum “The Swedish Mortgage Market 2015, published 14th April 2015 and Swedbank
Loan-to-value distribution – new lending, %
0
5
10
15
20
25
30
35
40
45
50
0
5
10
15
20
25
30
35
40
45
50
0-25 25-50 50-70 70-85 over 85
2011 2012 2013 2014
0
2
4
6
8
0
2
4
6
8
0 1 2 3 4 5Not amortising Amortising 2013 (not amortising)
Stress test – share of households with deficit post interest rate hike, %
Increased interest rate, percentage points
New lending
Sha
re o
f hou
seho
lds
LTV

100
120
140
160
180
200
220
05 06 07 08 09 10 11 12 13 14 15
Single-family homes
Real estate prices – Sweden 12 months development
62
Swedish housing and mortgage market
Single-family homes1 Tenant-owner rights2 Combined3
12M Δ
12M Δ
12M Δ
Jul/14 9% 14% 11%
Aug/14 9% 14% 11%
Sep/14 9% 15% 11%
Oct/14 8% 15% 11%
Nov/14 13% 15% 14%
Dec/14 15% 15% 15%
Jan/15 11% 15% 12%
Feb/15 12% 17% 14%
Mar/15 13% 19% 15%
Apr/15 13% 20% 16%
May/15 13% 18% 15%
Jun/15 12% 19% 14%
Source: Valuegard www.valuegard.se (Based on data from Mäklarstatistik), 1 HOXHOUSESWE, 2 HOXFLATSWE, 3 HOXSWE
House price index, Sweden3
2005=100

0200400600800
1 0001 2001 4001 6001 800
Jun-
05D
ec-0
5Ju
n-06
Dec
-06
Jun-
07D
ec-0
7Ju
n-08
Dec
-08
Jun-
09D
ec-0
9Ju
n-10
Dec
-10
Jun-
11D
ec-1
1Ju
n-12
Dec
-12
Jun-
13D
ec-1
3Ju
n-14
Dec
-14
Jun-
15
Vilnius
No. of deals EUR/m2
0200400600800
1 0001 2001 4001 6001 800
Jun-
05D
ec-0
5Ju
n-06
Dec
-06
Jun-
07D
ec-0
7Ju
n-08
Dec
-08
Jun-
09D
ec-0
9Ju
n-10
Dec
-10
Jun-
11D
ec-1
1Ju
n-12
Dec
-12
Jun-
13D
ec-1
3Ju
n-14
Dec
-14
Jun-
15
Riga
No. of deals EUR/m2
0200400600800
1 0001 2001 4001 6001 800
Jun-
05D
ec-0
5Ju
n-06
Dec
-06
Jun-
07D
ec-0
7Ju
n-08
Dec
-08
Jun-
09D
ec-0
9Ju
n-10
Dec
-10
Jun-
11D
ec-1
1Ju
n-12
Dec
-12
Jun-
13D
ec-1
3Ju
n-14
Dec
-14
Jun-
15
Tallinn
No. of deals EUR/m2
Baltic countries Real estate prices
63
EUR/m2 /No. of deals EUR/m2 /No. of deals
EUR/m2 /No. of deals

64
Swedbank – contacts and financial calendar
Helo Meigas, Head of Group Treasury
[email protected] +46 8 585 900 25
Gregori Karamouzis, Head of Investor Relations
[email protected] +46 8 585 930 31
Bogdan Woronowicz, Debt Investor Relations
[email protected] +46 8 585 922 53
Peter Stenborn, Debt Investor Relations
[email protected] +46 8 585 909 30
Ulf Jakobsson, Head of Funding
[email protected] +46 8 700 90 61
Kimmy Samuelsson, Head of Long-Term Funding
[email protected] +46 8 700 97 89
Joakim Henriks, Money Markets and Short-Term Funding
[email protected] +46 8 700 90 62
Q3 Interim report 20 Oct 2015
Q4 Interim report 2 Feb 2016
www.swedbank.com/investor-relations/debt-investor
Swedbank Group Treasury Landsvägen 40,
SE-105 34 Stockholm, Sweden Sundbyberg
Contact debt investor relations:
For further information, please contact: Financial calendar
Postal address: Visitors:
Appendix

65
Disclaimer
Certain statements made in this presentation are forward looking statements. Such statements are based on current expectations and are subject to a number of risks and uncertainties that could cause actual results and performance to differ materially from any expected future results or performance, express or implied, by the forward looking statements. Factors that might cause forward looking statements to differ materially from actual results include, among other things, regulatory and economic factors. Swedbank AB assumes no responsibility to update any of the forward looking statements contained herein.
No representation or warranty, express or implied, is made or given by or on behalf of Swedbank AB or its directors, officers or employees or any other person as to the accuracy, completeness or fairness of the information or opinions contained in this presentation. None of Swedbank AB or any of its directors, officers or employees nor any other person accepts any liability whatsoever for any loss howsoever arising from any use of this presentation or its contents or otherwise arising in connection therewith.
This presentation does not constitute or form part of any offer or invitation to sell or issue, or any solicitation of any offer to purchase or subscribe for, any securities of Swedbank AB, nor shall it or any part of it nor the fact of its distribution form the basis of, or be relied on in connection with, any contract or investment decision.