Swaroop Dinakar Portfolio
26
Research Portfolio Swaroop Dinakar Master of Science -Industrial Engineering Department of Industrial & Systems Engineering Texas A&M University 1
-
Upload
swaroop-dinakar -
Category
Documents
-
view
56 -
download
7
Transcript of Swaroop Dinakar Portfolio

Research Portfolio
Swaroop DinakarMaster of Science -Industrial Engineering
Department of Industrial & Systems Engineering Texas A&M University
1

About me
• Texas A&M University– MS in Industrial Engineering (May 2015)
• Grader: Cognitive Systems Engineering; Human Operator in Complex Systems• Student Researcher: Human Factors and Cognitive Systems Laboratory
• Bigstamp Technologies Pvt. Ltd.– Design and Industrial Engineer (June 2013)
• Product Conceptualization, Prototyping, Engineering Design, Interface Design
• Dayananda Sagar College of Engineering– BE in Industrial Engineering and Management (May 2012)
• SAE BAJA India
Courses at Texas A&M University
• Cognitive Systems Engineering
• Survey of Optimization • Design of Experiments
• Human InformationProcessing
• Introduction to Statistical inference
• Engineering Data Analysis
• Human Operator in Complex Systems
• Probability Engineering Decisions
• Simulation Methods & Applications
• Quantitative Ethnography • Production Inventory Control
2

Research Experience
• Emergency Vehicle Operator On-board Device Distraction
• Effects of Screen Size, Screen Orientation, and Input Method on Multitasking Driving Performance
• Human Factors Evaluation of the Texas A&M University AGN-201 Nuclear Reactor Control Console
• Course Projects
– Classification of Traffic Lane Occupancy Data to Predict Day of the Week
– Cognitive Analysis of Bus Drivers of the Texas A&M Transportation System
– Usability Analysis of Infiniti G35 Navigation System
3

Emergency Vehicle Operator On-board Device Distraction
• A white paper for the Transportation Safety
Advancement Group (TSAG) of the Intelligent
Transportation Society of America (ITSA)
• Performed a literature review with the following
objectives:
• Determine the extent of the driver distraction
problem in EV operations
• Identify technologies and interactions that induce
high cognitive workload and driver distraction
• Develop design recommendations for minimizing
likelihood and severity of distracted driving
problems4

Methods
• Structured and unstructured interviews with emergency response personnel: front-line responders, supervisors, and training and safety specialists– Critical Incident Technique– Routine and non-routine tasks/conditions
• Online survey of emergency responders
• Public Information Requests for crash-related data– Targeted major metropolitan locations and state DoTs– Very few positive responses to date
• Many don’t maintain these data, or compiling is a major effort• Near holiday season
– Many/most do not code “distraction” as a crash cause, fewer give any sort of detail as to source of distraction
5
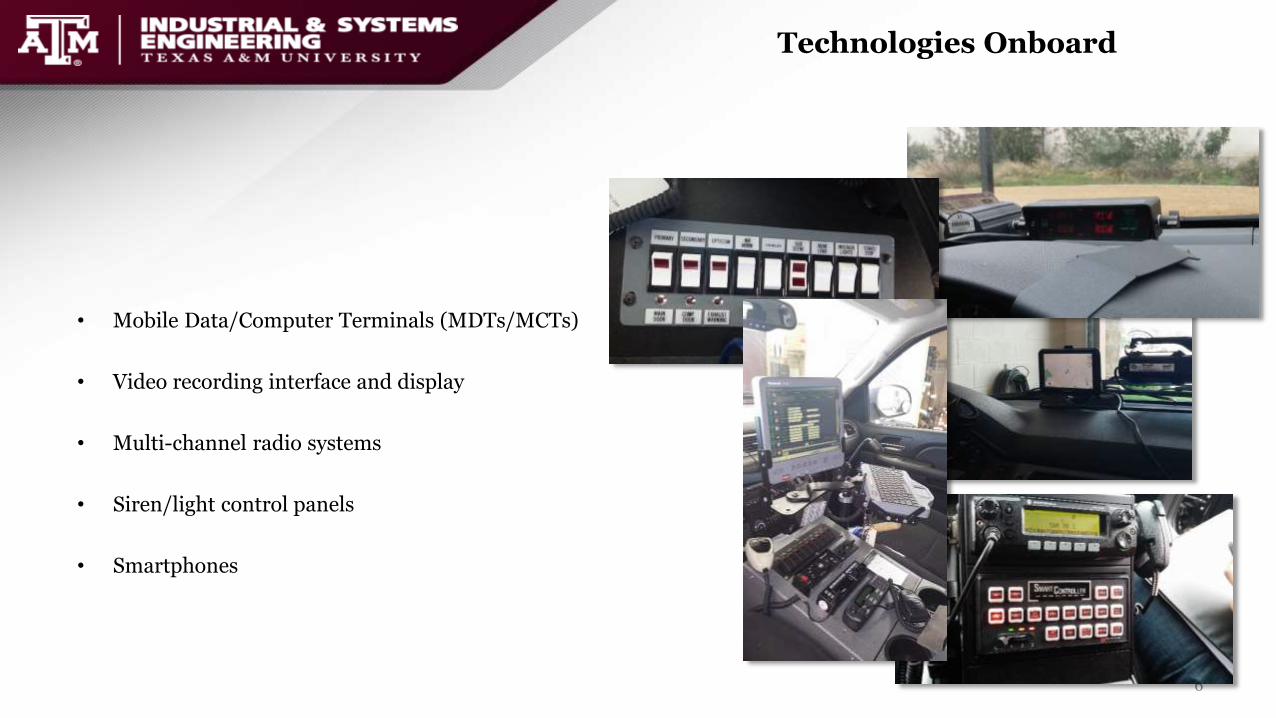
Technologies Onboard
• Mobile Data/Computer Terminals (MDTs/MCTs)
• Video recording interface and display
• Multi-channel radio systems
• Siren/light control panels
• Smartphones
6

Crash Data
Driver Distraction
• One of largest contributors to fatal crashes
– 2012: 3,328 vehicle fatalities and 421,000
injuries (NHTSA, 2014)
• Main source of distraction: cell phone usage
– 2012: 13% of fatal crashes; 7% of all crashes
(NHTSA, 2014)
• . Fatalities involving emergency vehicles from
2002-2012 (NHTSA FARS and GES report)
1726 Fatalities
• 50.7% were caused in non emergency mode
• Kansas City (MO) Police Department:181 crashes between 2009 – 2014, ~30 per year
• Austin (TX) PD: 48 crashes 2010 – 2014 (~10/yr)25 instances: interacting with MCT
8 instances: interacting with cellphone or other onboard equipment
• State of Texas DoT: 1021 crashes from 2010 – 2014 (~200/yr)– 310 injurious, 4 fatal
• Illinois DoT: 137 crashes from 2010 – 2012 (~45/yr)
• South Carolina Department of Public Safety (Abdelwanis,2013): 803 from 2010 – 2010 (~80/yr)– One of most prominent factors, along with driver fatigue
– Distracted drivers more likely to be in head-on collisions with othervehicles than single-vehicle accidents, more likely to result infatalities
• The Florida Department of Transportation– 1881 crashes from 2011 – 2013
– Injury crashes - 79%
– Roughly 6 fatalities/yr 7

High Number of Crashes in Police Vehicles?
• More patrol vehicles on road at any given time
• Pursuing malcontents
• Need for more background information from MCT/radio
• More likely to be single-crewed, greater task load for police drivers– Double-crewed police vehicles found to involve at least twice as much MCT interactions
as single-crewed (and as many as 5x; Hampton & Langham, 2005)– Suggests that if more cognitive resources were available, more tech interactions are
beneficial– Other ways to reduce cognitive resource load?
8

Task Analysis
VISUAL TASKS
Driving: visually monitoring the roadway/surroundings and
driving-related displays
Monitoring MCT for notifications and activity changes
Reading call notes
Searching for and identifying locations of interest on maps
Viewing live video feeds
Reading environmental data, such as vehicle license plates
Observing speed detection system visual displays
AUDITORY TASKS
Driving: listening for sounds related to the driving/navigation task
Monitoring radio communications from dispatchers or other
responders
Communicating directly or over an intercom with other
responders in the vehicle
Receiving and interpreting audible cues or vocalizations from
MCT
Listening to read-aloud call notes from MCT
Listening to speed detection system auditory output
PHYSICAL TASKS
Driving: manually controlling the speed and heading of the
vehicle
Interacting with MCT through touchscreen, touchpad, and
keyboard controllers
Interacting with radio controls (handset and console)
Interacting with light and siren controls
Adjusting onboard video system cameras
COGNITIVE TASKS
Driving: cognitive tasks such as route planning, hazard avoidance
Strategic and tactical decision making and planning for response
activities
Interpreting call notes and other MCT data
Processing related to in-vehicle control tasks during response
activities
Navigating between various MCT function screens
9

10

Design Guidelines
• Reduce visual, manual, and cognitive load
– Voice-entry
• Supports travelling at appropriate speeds, committing fewer navigational errors, reporting lower overall workload (Srinivasan & Jovanis, 1997)
• Anecdotal evidence: they don’t work very well (yet)
– Voice output
• Vocalized navigation instructions reduce visual attentional demand, fewer glances and shorter glance durations at map screens, fewer braking errors and lane deviations (Dingus, 1995)
• Downside: competes with verbal conversations (radio)
• Audio-voice (vs. visual-manual) interfaces adequately support MCT interaction, reduce the number of safety-critical off-road glances (Filtness et al., 2013)
11

Design guidelines
• Reduce effort and time required for interactions
– Police: more heavily “coded” language, less time spent reading/verifying input in MCT (Garrison et al., 2012)
– But can lead to greater need to view MCT for relative novices (Garrison et al., 2012)
• Assign secondary rider to manage technology
– Especially for fire battalion chief!
• Restrict/prohibit texting as a communication means
– Already the case in many states, and more following suit (Ashton, 2014)
12

Research Experience
• Emergency Vehicle Operator On-board Device Distraction
• Effects of Screen Size, Screen Orientation, and Input Method on Multitasking Driving Performance
• Human Factors Evaluation of the Texas A&M University AGN-201 Nuclear Reactor Control Console
• Course Projects
– Classification of Traffic Lane Occupancy Data to Predict Day of the Week
– Cognitive Analysis of Bus Drivers of the Texas A&M Transportation System
– Usability Analysis of Infiniti G35 Navigation System
13

Effects of Screen Size, Screen Orientation, and Input Method on Multitasking Driving
Performance
Experiment
• Participants to perform the primary task of driving while interacting with different mobile devices.
• The experiment will evaluate secondary task mental workload and performance of driving task in multitasking.
• The study will compare results from 4 scenarios,
– Manual and voice-text modes of using the cell phone
– Manual and voice-text modes of using while using the MCT.
Measurements/Comparisons
• Compare different parameters Cell Phone (Manual) vs MCT(Manual), Cell Phone (Voice) vs MCT (Voice)
• Compare percentage difference between manual vs. voice with the devices
• Compare performance in different types of tasks (Visual vs. Spatial, etc.)
14

Independent Variables:1. Tasks:
a. MCT: 4 sets of tasks involving visual, and visual andspatial tasks. Each task will be performed once in the scenario
b. Cell Phone: Text messaging tasks utilize similar mentalresources as the MCT tasks.
Cues will be displayed for operators to perform requiredtask.2. Driving Scenario- the driving scenario will include 4 stages,of approximately equal length and intermediate level ofdifficulty. Cues will be displayed for operators to performrequired task.
Dependent Variables:1. NASA TLx: subjective measure to compare workload acrossdevices and across modalities2. Driving Performance Measures: to compare primary taskperformance across devices and across modalities3. Secondary Task Performance: to compare secondary taskperformance across modalities
15

Research Experience
• Emergency Vehicle Operator On-board Device Distraction
• Effects of Screen Size, Screen Orientation, and Input Method on Multitasking Driving Performance
• Human Factors Evaluation of the Texas A&M University AGN-201 Nuclear Reactor Control Console
• Course Projects
– Classification of Traffic Lane Occupancy Data to Predict Day of the Week
– Cognitive Analysis of Bus Drivers of the Texas A&M Transportation System
– Usability Analysis of Infiniti G35 Navigation System
16

Human Factors Evaluation of the Texas A&M University AGN-201 Nuclear Reactor
Control Console
• An NRC report dated June 12, 2014, requested a human factors evaluation be conducted on the console restoration process in order to recertify the reactor.
• Human factors evaluation of the Texas A&M University’s AGN-201M reactor and is intended for use as documentation for the reactor’s license renewal.
• The review is structured according to the National Regulatory Commission (NRC) guidelines – NUREG 0700/ 0711/ 0800.
17

Link Analysis And System Grouping
18

System Issues
NRC violation
• Restoration of log and linear channel power instrument channels to analog meters as compared to the current digital instrument
• Use of hardwired rod position indicators to verify rod position in case of an automatic shutdown
Human Factors concern
• Low Proximity Compatibility
• Existence of additional/unused buttons and displays
• No discrimination between Alarms and Warnings
• The Period Bypass is a digital control in the AGN Program, which may cause an accidental deactivation of the period scram
• Dependence on Digital Reading from the Chart Recorder
• Label absent for the Manual Scram button
• Redundant Plateau Voltage Meter on Panel 2
19

Network Analysis
0.6
0.65
0.7
0.75
0.8
0.85
0.9
15
20
25
30
35
40
45
1 2 3 4 5 6
Pro
po
rtio
n C
orr
ect
Ba
dn
ess o
f F
it
No. of Subgroups
Badness of Fit Final Proportiion Correct
Startup Controls SC Manual Scram MS
Digital Chart
Recorder
DR System Status
PanelSS
Testing Controls TCRod Movement
ControlsRM
Calibration
EquipmentCE Alarm Panel AP
Neutron Source
PanelNS
Pan Alarm
ModulePA
Rod Energize
/StatusRE Startup Controls SC
Factions Centrality Analysis

Suggested Solutions
• Use of Analog Displays and Controls for log and
linear power
• Rod position indicator provides digital numeric
value as compared to an additive display
• Move Chart Recorder Panel to the Panel 1 position
• Improved Proximity Compatibility
• Omission of unused buttons and displays
• Alarm Panel Color Coded to differentiate between
warnings and alarms

Research Experience
• Emergency Vehicle Operator On-board Device Distraction
• Effects of Screen Size, Screen Orientation, and Input Method on Multitasking Driving Performance
• Human Factors Evaluation of the Texas A&M University AGN-201 Nuclear Reactor Control Console
• Course Projects
– Classification of Traffic Lane Occupancy Data to Predict Day of the Week
– Cognitive Analysis of Bus Drivers of the Texas A&M Transportation System
– Usability Analysis of Infiniti G35 Navigation System
22

Classification of Traffic Lane Occupancy Data
to Predict Day of the Week
Objective
Classification of the day of the week based on laneoccupancy with traffic patterns in the San Francisco Bayarea, the data subset from the California Department ofTransportation Performance Measurement System(PEMS) database.
DatabaseThe data set we will be analyzing is the PEMS-SF data set (available from the UCI machine learning repository) which includes 440 days worth of lane occupancy rates (between 0 and 1) taken at 10 minute intervals on 963 sensors recording data on the road.
Implemented Methods
• Support Vector Machines: svm(), e1071 package
• Discrete Wavelet Transformations, wavelets package
• Empirical Mode Decomposition, EMD package
• Linear Discriminant Analysis: lda()
• Quadratic Discriminant Analysis: qda()
• Kernel estimators: kedd package, lokern package
23

Cognitive Analysis of Bus Drivers of the
Texas A&M Transportation SystemObjectives
• Study the given system from thecognitive and ergonomic point ofview
• To study the interactions of thedriver in the bus system
• Identify the problems in thesystem requiring additionalmental effort
Methodology
• Phase 1: Understand System
• New Driver Orientation
• Expert interviews
• Phase 2: Observation
• 8 Drivers, 4 New & 4 Veterans
• Think Aloud Protocol
• Structured and UnstructuredInterviews
• Critical Incident Method
• Phase 3: Data collection through survey
• Student Drivers- Received 75Responses
• Open and Closed Ended (withbounded scale)
• Addressed frequency of use ofcontrols, control positions,display informativeness andperceived effort required inspecific tasksSolutions
• Reducing the mental effort by redesigning tasks
• HUDs not far into the future
• Manufacturing level design changes to better facilitateergonomic use 24

Usability Analysis of Infiniti G35 Navigation System
0
0.1
0.2
0.3
0.4
OldSystem
NewSystem
Information Theory Comparison
H-Loss
Noise
Improved Interface Layout
Improved Key Layout
System: Infniti G35, 6” Screen with manual button interface
Methods: Usability Analysis, Information Theory
Design Improvements: • Reduced button layout to interact with the system• Improved interaction screen layout for ease of learning• Studied advantages of gesture based functionality to
interact with the system
25

Questions?
26


![DINAKAR RAMAKRISHNAN arXiv:0710.0676v2 [math.NT] 2 Jul 2009 · DINAKAR RAMAKRISHNAN To Steve Gelbart On the occasion of his sixtieth birthday Introduction Let F be a number field,](https://static.fdocuments.net/doc/165x107/5f0200d67e708231d4021930/dinakar-ramakrishnan-arxiv07100676v2-mathnt-2-jul-2009-dinakar-ramakrishnan.jpg)


![NATHAN M. DUNFIELD AND DINAKAR …arXiv:0712.3243v2 [math.GT] 16 Dec 2008 INCREASING THE NUMBER OF FIBERED FACES OF ARITHMETIC HYPERBOLIC 3-MANIFOLDS NATHAN M. DUNFIELD AND DINAKAR](https://static.fdocuments.net/doc/165x107/5e5cdcbac94a0b3274569063/nathan-m-dunfield-and-dinakar-arxiv07123243v2-mathgt-16-dec-2008-increasing.jpg)