
Sutton Trust-EEF Teaching and Learning Toolkit & … · ensure it achieves the desired effects. The...
56
Sutton Trust-EEF Teaching and Learning Toolkit & EEF Early Years Toolkit Technical appendix and process manual (Working document v.01) July 2018
-
Upload
hoangtuong -
Category
Documents
-
view
217 -
download
0
Transcript of Sutton Trust-EEF Teaching and Learning Toolkit & … · ensure it achieves the desired effects. The...

Sutton Trust-EEF Teaching and
Learning Toolkit
& EEF Early Years Toolkit
Technical appendix and process manual
(Working document v.01)
July 2018
2
Table of Contents
1. Introduction .................................................................................................................... 5
1.1. The manual as a working document ....................................................................... 6
2. Acknowledgements ........................................................................................................ 7
3. Toolkit strands ............................................................................................................... 8
3.1. Strands in earlier versions ....................................................................................... 8
3.2. Adding new strands to the toolkit .......................................................................... 10
4. The systematic search process .................................................................................... 11
5. Identification ................................................................................................................. 12
5.1. Identification- standards ........................................................................................ 12
5.2. Identification - keywords........................................................................................ 12
5.3. Identification - search engines and databases ...................................................... 14
6. Screening..................................................................................................................... 16
6.1. Screening – type of study...................................................................................... 16
Systematic reviews ...................................................................................................... 16
Meta-analysis ............................................................................................................... 16
Single studies .............................................................................................................. 16
6.2. Screening – type of outcome ................................................................................ 17
Reading ....................................................................................................................... 17
Writing ......................................................................................................................... 17
Oral language (speaking and listening ) ....................................................................... 17
Mathematics ................................................................................................................ 17
Cognitive tests ............................................................................................................. 17

3
7. Inclusion ...................................................................................................................... 18
8. Data extraction ............................................................................................................. 19
8.1. Coding and data extraction ................................................................................... 19
9. Single studies .............................................................................................................. 20
Table 9.1: Inclusion criteria for single studies .............................................................. 21
10. Creating effect size estimates ................................................................................... 24
10.1. Choice of outcomes ........................................................................................... 24
10.2. Choice of measure for a given outcome ............................................................ 24
10.3. Choice of effect size .......................................................................................... 24
Weighted mean ............................................................................................................ 24
Median ......................................................................................................................... 25
Mean ............................................................................................................................ 25
Indicative...................................................................................................................... 25
11. Translating effect size to months’ progress ............................................................... 26
Table 11.1: Converting effect size to months’ progress for the Toolkit .......................... 28
12. Evidence security ratings .......................................................................................... 30
13. Cost estimates .......................................................................................................... 34
13.1. How we derive the costs .................................................................................... 34
14. Toolkit strand summary text ...................................................................................... 36
15. Updating the Toolkit.................................................................................................. 37
16. Strand Technical Appendix ....................................................................................... 38
Definition ...................................................................................................................... 38
Search terms ............................................................................................................... 38
Evidence rating ............................................................................................................ 38
4
Additional cost information ........................................................................................... 38
References .................................................................................................................. 38
Summary of effects ...................................................................................................... 38
Meta-analyses abstracts .............................................................................................. 38
Appendix 1: Background to the Toolkit - The Pupil Premium in England ............................. 39
Appendix 2: Rationale for the Toolkit ................................................................................... 40
Resources and pupil learning .......................................................................................... 41
Appendix 3: Causal inference and evaluation of impact, By Professor Steve Higgins. ........ 43
Appendix 4: Effect sizes in education research ................................................................... 46
What is an effect size? .................................................................................................... 46
Methods of calculation ..................................................................................................... 47
What does it mean? ......................................................................................................... 47
How comparable are effect sizes? ................................................................................... 50
17. References ............................................................................................................... 53

5
1. Introduction
The Sutton Trust-EEF Teaching and Learning Toolkit is an accessible summary of educational
research which provides guidance for teachers and schools on how to use their resources to
improve outcomes for learners. It currently covers a range of topics, each summarised in terms
of their average impact on attainment, the strength of the evidence supporting them and
their cost.
The aim of the Toolkit is not to provide definitive claims as to what will work to bring about
improvement in a new context. Rather it is an attempt to provide the best possible estimate of
what is likely to be beneficial based on the existing evidence. In effect, it summarises what
has worked as a ‘best bet’ for what might work in the future. The applicability of this information
to a new context is always likely to need active professional investigation and evaluation to
ensure it achieves the desired effects.
The first page of the Toolkit presents comparable information for each of the topics or ‘strands’
in the Toolkit. This summary contains:
An estimate of the average impact of relevant interventions, presented in terms of
expected months’ progress. This is based on an effect size estimate derived from a
synthesis of meta-analytical effect sizes in existing meta-analyses and quantitative
systematic reviews, where there is sufficient data to combine these estimates. This
calculation is referred to as a ‘meta-meta-analysis’. The effect size estimate itself is
included in the technical appendix to each strand.
An evidence security rating reflecting the quality, quantity and consistency of the
evidence used to derive the effect size.
A cost rating reflecting the approximate additional cost per pupil of implementing such
interventions in schools.
Each Toolkit strand then has a page which includes:
A definition of the strand topic and explanation of how it is relevant to teaching and
learning in schools;
Discussion of the impact of the approach on key outcomes for schools;
An overview of how secure the evidence is for this topic;
A brief explanation of the cost rating (Section 5.8).
A range of other information is presented for each strand: links to further reading and related
EEF projects and resources. There is also a technical appendix (see section 16) which details
the evidence drawn upon for each strand.
This document provides detail on how the Toolkit is maintained and updated, and the
methods used to derive the estimates and supporting information for each strand. It refers to
the Teaching and Learning Toolkit, but unless otherwise stated the methods and process
apply equally to the Early Years Toolkit.

6
1.1. The manual as a working document
This is the first version of this manual, which will be kept updated as the Toolkit methodology
is further refined over time. We would welcome any comments, which should be addressed
7
2. Acknowledgements
The first version of the Toolkit was originally commissioned by the Sutton Trust and produced
as the ‘Pupil Premium Toolkit’ by Durham University in May 2011. Since its launch in 2011 the
Education Endowment Foundation has funded significant further development, including
expansion from the initial 12 strands to over 30 in the current Toolkit. An early years version
of the Toolkit was launched in 2015.
The initial source of studies for the Toolkit was a database of meta-analyses of educational
interventions developed for an ESRC Researcher Development Initiative (RES-035-25-0037)
between 2005-2010. Repeated systematic searches have since been undertaken for
systematic reviews with quantitative data (where effect sizes are reported but not pooled) and
meta-analyses (where effect sizes are combined to provide a pooled estimated of effect) of
intervention research in education in each of the areas of the Toolkit.
The Toolkit has been developed and written over five years by a team of people: Professor
Steve Higgins, Dr Maria Katsipataki, Dr Alaidde Berenice Villanueva Aguilera (School of
Education, Durham University), Dr Dimitra Kokotsaki, Professor Rob Coe (CEM Centre,
Durham University), Dr Lee Elliot Major (The Sutton Trust), Robbie Coleman, Peter
Henderson, Jonathan Kay and Danni Mason (Education Endowment Foundation).
Feedback from schools and teachers has been and remains an important part of the
development of the Toolkit. Thanks in particular go to ARK and teachers from the TeachFirst
Future Leaders programme, a group of Hammersmith and Ealing deputy headteachers and a
number of teachers in the North-East of England who were generous with their time in
attending conference or workshop presentations about early drafts of the Toolkit.
The toolkits should be cited as:
Education Endowment Foundation (2018) Sutton Trust-Education Endowment Foundation
Teaching and Learning Toolkit London: Education Endowment Foundation.
https://educationendowmentfoundation.org.uk/resources/teaching-learning-toolkit
Authorship: Steve Higgins, Lee Elliot-Major, Robbie Coleman, Maria Katsipataki, Peter
Henderson, Danielle Mason, Alaidde Berenice Villanueva Aguilera , Jonathan Kay.
Education Endowment Foundation (2018) Education Endowment Foundation Early Years
Toolkit London: Education Endowment Foundation.
https://educationendowmentfoundation.org.uk/resources/early-years-toolkit/
8
3. Toolkit strands
3.1. Strands in earlier versions
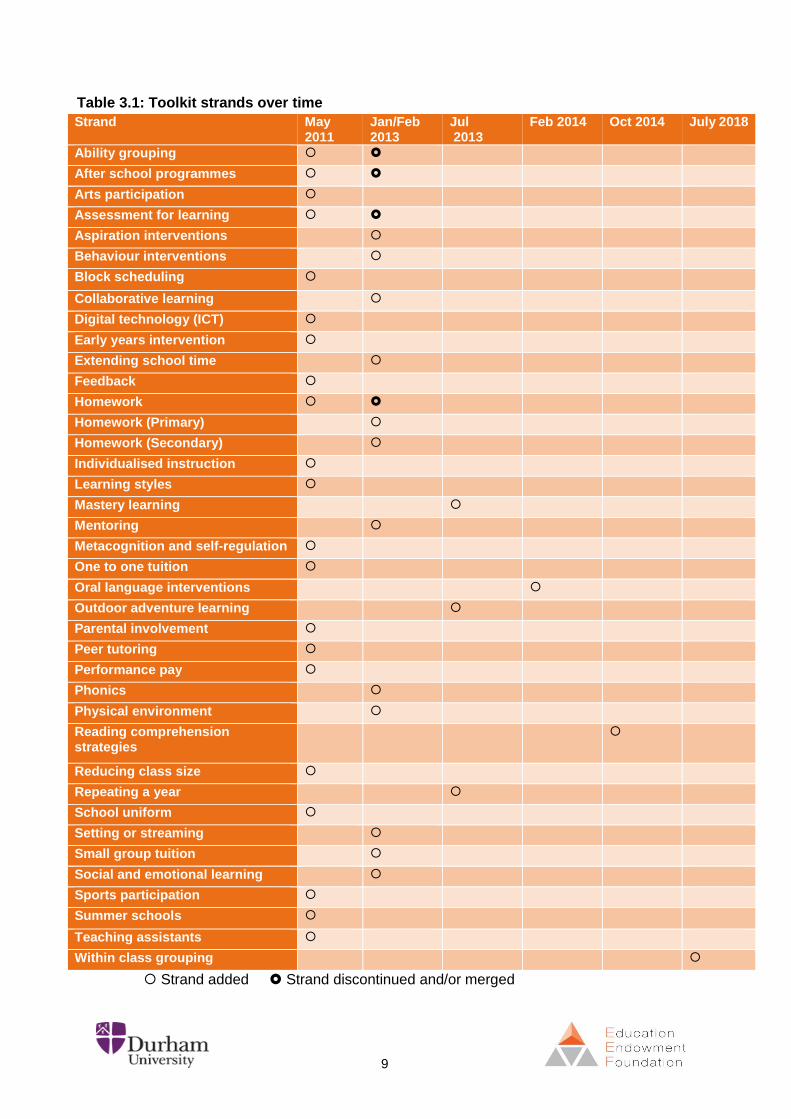
The initial themes for the Toolkit (see Table 3.1) were based on expectations of how schools
seemed likely to spend the Pupil Premium in England when it was first announced in 2010 as
a means to improve educational outcomes for disadvantaged pupils.
A number of areas were specifically included at the request of teachers who have been
consulted at different stages in the development of the Toolkit.
Some of these topics (for example School Uniforms and Performance Pay) had limited
evidence to support an estimate of effect. However, it seemed important to summarise the
evidence in areas of interest to practitioners both where the evidence was strong, and where
the evidence was weaker. Knowing that there is an absence of robust evidence is also
important in terms of informing professional decisions in schools. For topics with limited
evidence, this was reflected in the padlock rating (see section 12 below).
9
Table 3.1: Toolkit strands over time
Strand May 2011
Jan/Feb 2013
Jul 2013
Feb 2014 Oct 2014 July 2018
Ability grouping
After school programmes
Arts participation
Assessment for learning
Aspiration interventions
Behaviour interventions
Block scheduling
Collaborative learning
Digital technology (ICT)
Early years intervention
Extending school time
Feedback
Homework
Homework (Primary)
Homework (Secondary)
Individualised instruction
Learning styles
Mastery learning
Mentoring
Metacognition and self-regulation
One to one tuition
Oral language interventions
Outdoor adventure learning
Parental involvement
Peer tutoring
Performance pay
Phonics
Physical environment
Reading comprehension strategies
Reducing class size
Repeating a year
School uniform
Setting or streaming
Small group tuition
Social and emotional learning
Sports participation
Summer schools
Teaching assistants
Within class grouping
Strand added Strand discontinued and/or merged

10
3.2. Adding new strands to the toolkit
There are over 30 strands in the main UK version of the Toolkit and a further 12 in the early
years version. When considering whether to add new strands, we aim to a strike a balance
between being comprehensive and presenting a manageable amount of information in order
to maintain accessibility, and allow comparison across strands.
New topics are considered for inclusion as a strand in the Toolkit if they are:
i) Approaches commonly mentioned in education policy;
ii) Suggestions from teachers and schools;
iii) Approaches with a strong evidence of effectiveness not covered by either previous
criterion;
A new strand covering a particular approach can be added to the Toolkit if any of the below
criteria apply:
i) Schools are using or may be advised to use the approach and the evidence
suggests the approach is harmful or ineffective or that the approach is expensive
and there is limited evidence about its effectiveness;
ii) Schools are not using, or may be advised not to use an approach which the
evidence indicates or suggests is cost-effective;
iii) There is demand from teachers as to what the evidence says about the approach;
iv) There are popular misconceptions about the evidence or the strength of the
evidence available about the approach;
v) New evidence has become available about the approach which would be of value
to schools or teachers.
11
4. The systematic search process
Each Toolkit strand is updated with new evidence found through systematic searches around
every 2 years. Revisions to the live Toolkit are made two or three times a year. New strands
are introduced in accordance with the criteria above. The following sections set out the
evidence review process for creating a new strand or updating an existing one.
Figure 5.1 below provides more detail on the distinct steps of the review process, using the
PRISMA categories of:
Identification
Screening
Eligibility
Inclusion
Further detail on each step is provided in the following sections. Further detail on PRIMSA is
provided in section 5.

12
5. Identification
5.1. Identification- standards
The PRISMA framework is used as the basis for our systematic reviewing and meta-analysis.
More details can be found at http://www.prisma-statement.org. The aim is to conduct searches
for relevant research as exhaustively and systematically as possible.
Searches are undertaken for systematic reviews with quantitative data (where effect sizes are
reported but not pooled) and meta-analyses (where effect sizes are combined to provide a
pooled estimated of effect) of intervention research in education in each of the areas of the
Toolkit. In addition, a separate search is undertaken for single studies to ensure the most
recent evidence is included in any Toolkit update. See section 9 for more detail on the use of
single studies in the Toolkit.
5.2. Identification - keywords
Keywords are initially defined from the strand definition (e.g. Collaborative Learning includes
cooperative/collaborative learning; group activities; cooperative/collaborative learning
instruction/strategies). We then test a range of synonyms and cognate terms to assess
whether they significantly improve the comprehensiveness of the search, and if so we add
them to the keywords (e.g. collaborative group work, group interaction). The keywords for
each strand are reviewed each time a strand is updated. If any new systematic reviews or
meta-analyses were found in the previous update, the search terms used in them are
compared with the current strand search terms. They are added to the current strand search
terms if they are consistent with the definition and extend the comprehensiveness of the
search.
When searching for new meta-analyses and systematic reviews these terms are also included:
‘meta-analysis’; ‘quantitative synthesis’; ‘systematic review’.
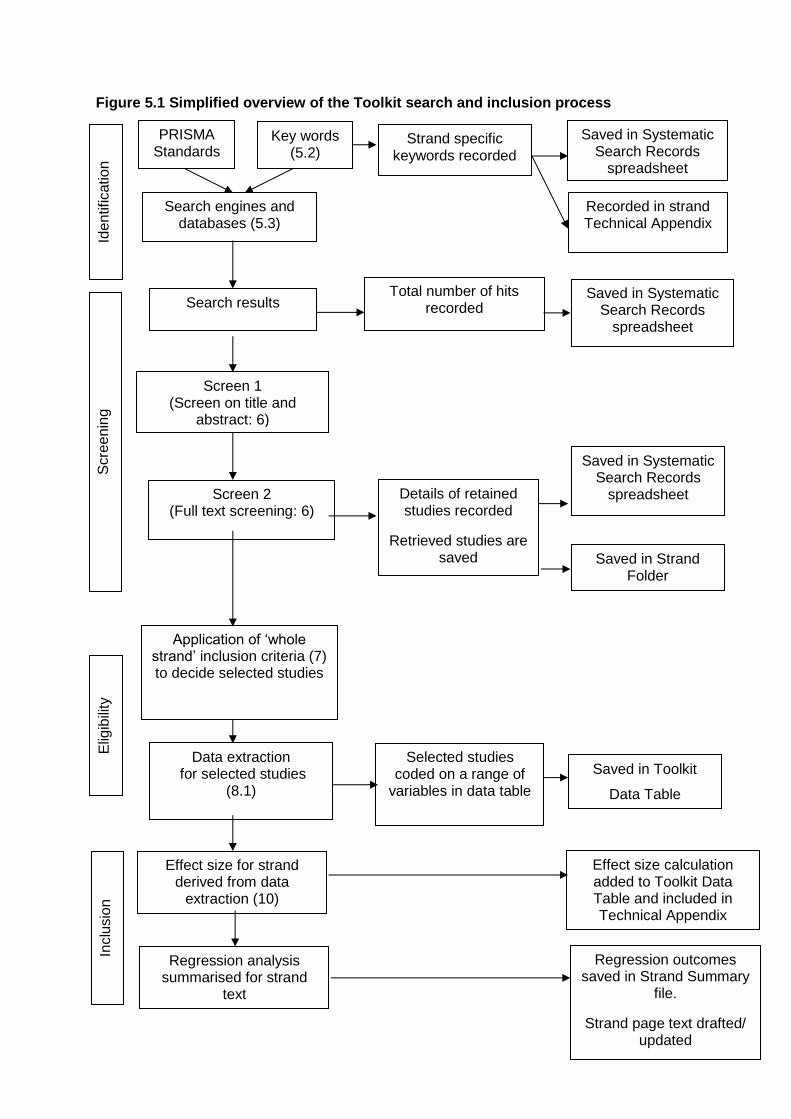
Figure 5.1 Simplified overview of the Toolkit search and inclusion process
Total number of hits recorded
Selected studies coded on a range of
variables in data table
Screen 2 (Full text screening: 6)
Application of ‘whole strand’ inclusion criteria (7) to decide selected studies
Saved in Systematic Search Records
spreadsheet
Saved in Systematic Search Records
spreadsheet
Saved in Toolkit
Data Table
Recorded in strand Technical Appendix
Effect size calculation added to Toolkit Data Table and included in Technical Appendix
PRISMA Standards
Key words (5.2)
Details of retained studies recorded
Retrieved studies are saved
Search engines and databases (5.3)
Screen 1 (Screen on title and
abstract: 6)
Search results
Data extraction for selected studies
(8.1)
Strand specific keywords recorded
Saved in Strand Folder
Effect size for strand derived from data
extraction (10)
Iden
tificatio
n
Scre
en
ing
Inclu
sio
n
Elig
ibili
ty
Regression analysis summarised for strand
text
Regression outcomes saved in Strand Summary
file.
Strand page text drafted/ updated
Saved in Systematic Search Records
spreadsheet
14
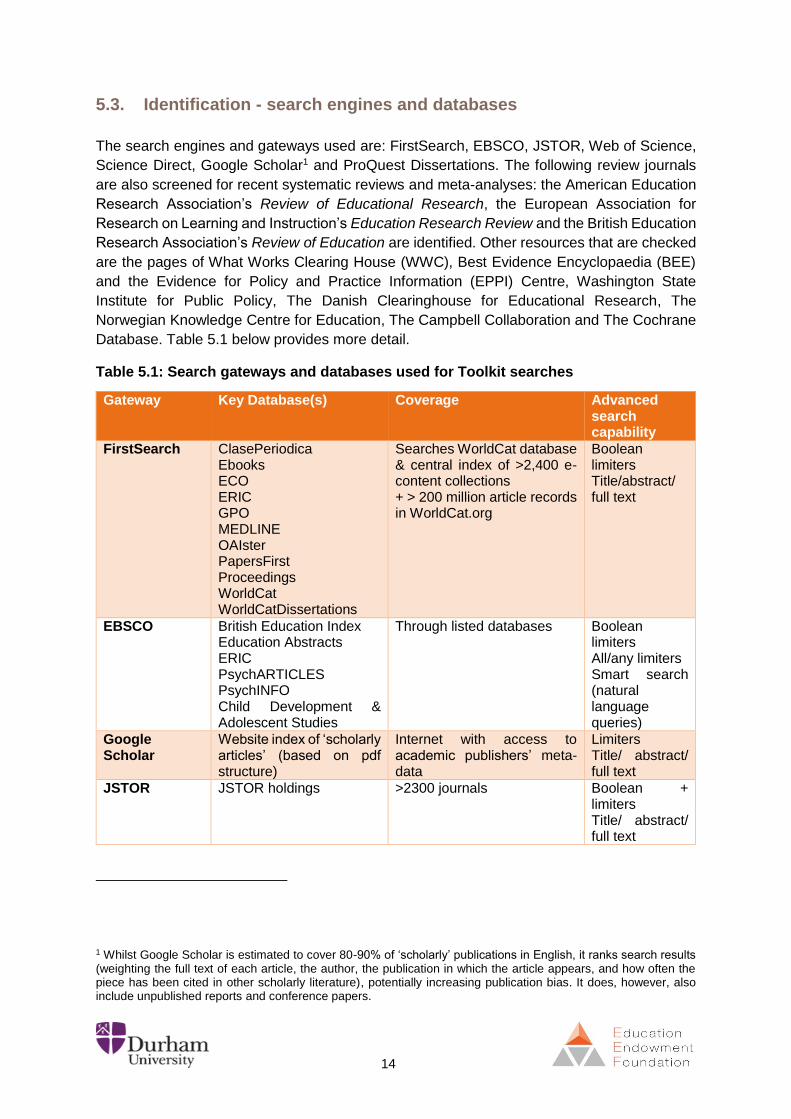
5.3. Identification - search engines and databases
The search engines and gateways used are: FirstSearch, EBSCO, JSTOR, Web of Science,
Science Direct, Google Scholar1 and ProQuest Dissertations. The following review journals
are also screened for recent systematic reviews and meta-analyses: the American Education
Research Association’s Review of Educational Research, the European Association for
Research on Learning and Instruction’s Education Research Review and the British Education
Research Association’s Review of Education are identified. Other resources that are checked
are the pages of What Works Clearing House (WWC), Best Evidence Encyclopaedia (BEE)
and the Evidence for Policy and Practice Information (EPPI) Centre, Washington State
Institute for Public Policy, The Danish Clearinghouse for Educational Research, The
Norwegian Knowledge Centre for Education, The Campbell Collaboration and The Cochrane
Database. Table 5.1 below provides more detail.
Table 5.1: Search gateways and databases used for Toolkit searches
Gateway Key Database(s) Coverage Advanced search capability
FirstSearch ClasePeriodica Ebooks ECO ERIC GPO MEDLINE OAIster PapersFirst Proceedings WorldCat WorldCatDissertations
Searches WorldCat database & central index of >2,400 e-content collections + > 200 million article records in WorldCat.org
Boolean limiters Title/abstract/ full text
EBSCO British Education Index Education Abstracts ERIC PsychARTICLES PsychINFO Child Development & Adolescent Studies
Through listed databases Boolean limiters All/any limiters Smart search (natural language queries)
Google Scholar
Website index of ‘scholarly articles’ (based on pdf structure)
Internet with access to academic publishers’ meta-data
Limiters Title/ abstract/ full text
JSTOR JSTOR holdings >2300 journals Boolean + limiters Title/ abstract/ full text
1 Whilst Google Scholar is estimated to cover 80-90% of ‘scholarly’ publications in English, it ranks search results (weighting the full text of each article, the author, the publication in which the article appears, and how often the piece has been cited in other scholarly literature), potentially increasing publication bias. It does, however, also include unpublished reports and conference papers.
15
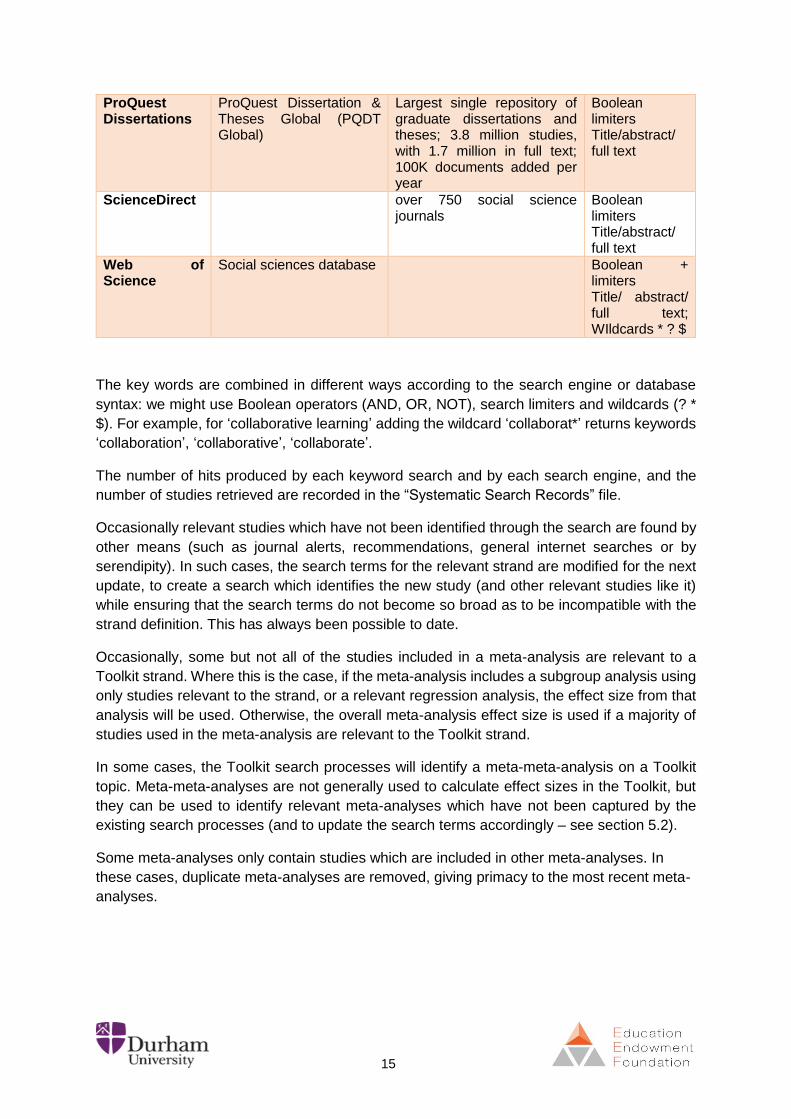
ProQuest Dissertations
ProQuest Dissertation & Theses Global (PQDT Global)
Largest single repository of graduate dissertations and theses; 3.8 million studies, with 1.7 million in full text; 100K documents added per year
Boolean limiters Title/abstract/ full text
ScienceDirect over 750 social science journals
Boolean limiters Title/abstract/ full text
Web of Science
Social sciences database Boolean + limiters Title/ abstract/ full text; WIldcards * ? $
The key words are combined in different ways according to the search engine or database
syntax: we might use Boolean operators (AND, OR, NOT), search limiters and wildcards (? *
$). For example, for ‘collaborative learning’ adding the wildcard ‘collaborat*’ returns keywords
‘collaboration’, ‘collaborative’, ‘collaborate’.
The number of hits produced by each keyword search and by each search engine, and the
number of studies retrieved are recorded in the “Systematic Search Records” file.
Occasionally relevant studies which have not been identified through the search are found by
other means (such as journal alerts, recommendations, general internet searches or by
serendipity). In such cases, the search terms for the relevant strand are modified for the next
update, to create a search which identifies the new study (and other relevant studies like it)
while ensuring that the search terms do not become so broad as to be incompatible with the
strand definition. This has always been possible to date.
Occasionally, some but not all of the studies included in a meta-analysis are relevant to a
Toolkit strand. Where this is the case, if the meta-analysis includes a subgroup analysis using
only studies relevant to the strand, or a relevant regression analysis, the effect size from that
analysis will be used. Otherwise, the overall meta-analysis effect size is used if a majority of
studies used in the meta-analysis are relevant to the Toolkit strand.
In some cases, the Toolkit search processes will identify a meta-meta-analysis on a Toolkit
topic. Meta-meta-analyses are not generally used to calculate effect sizes in the Toolkit, but
they can be used to identify relevant meta-analyses which have not been captured by the
existing search processes (and to update the search terms accordingly – see section 5.2).
Some meta-analyses only contain studies which are included in other meta-analyses. In
these cases, duplicate meta-analyses are removed, giving primacy to the most recent meta-
analyses.
16
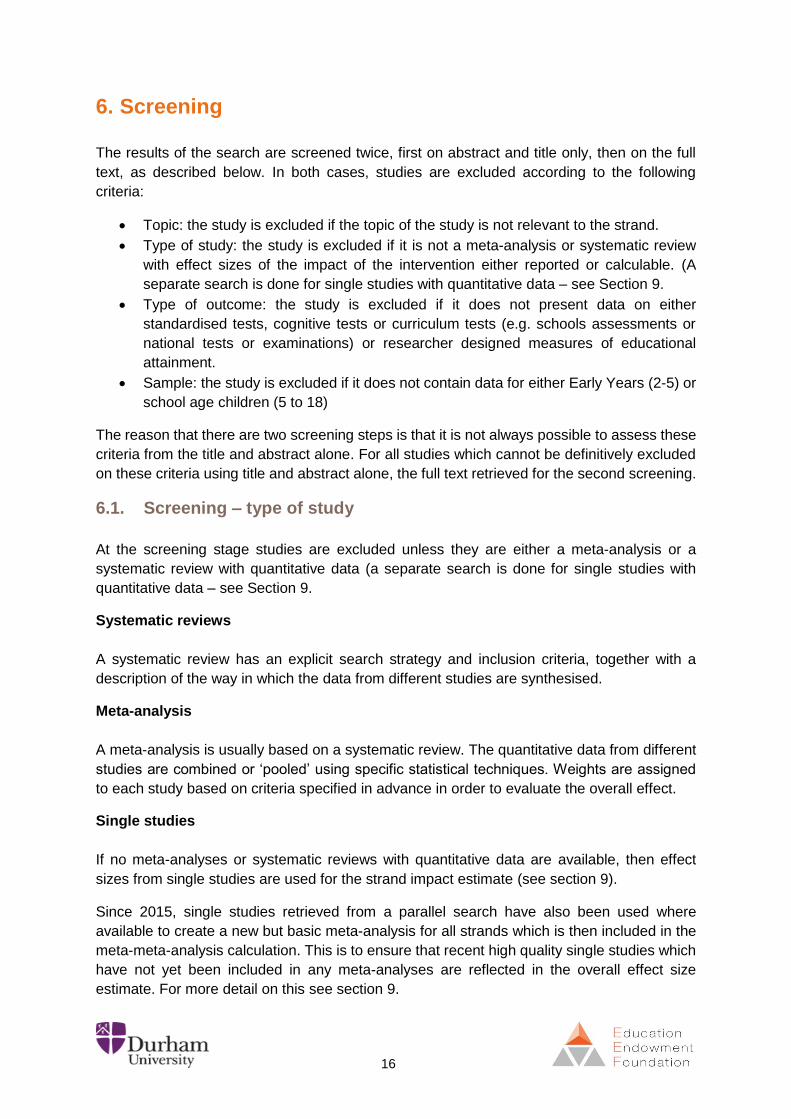
6. Screening
The results of the search are screened twice, first on abstract and title only, then on the full
text, as described below. In both cases, studies are excluded according to the following
criteria:
Topic: the study is excluded if the topic of the study is not relevant to the strand.
Type of study: the study is excluded if it is not a meta-analysis or systematic review
with effect sizes of the impact of the intervention either reported or calculable. (A
separate search is done for single studies with quantitative data – see Section 9.
Type of outcome: the study is excluded if it does not present data on either
standardised tests, cognitive tests or curriculum tests (e.g. schools assessments or
national tests or examinations) or researcher designed measures of educational
attainment.
Sample: the study is excluded if it does not contain data for either Early Years (2-5) or
school age children (5 to 18)
The reason that there are two screening steps is that it is not always possible to assess these
criteria from the title and abstract alone. For all studies which cannot be definitively excluded
on these criteria using title and abstract alone, the full text retrieved for the second screening.
6.1. Screening – type of study
At the screening stage studies are excluded unless they are either a meta-analysis or a
systematic review with quantitative data (a separate search is done for single studies with
quantitative data – see Section 9.
Systematic reviews
A systematic review has an explicit search strategy and inclusion criteria, together with a
description of the way in which the data from different studies are synthesised.
Meta-analysis
A meta-analysis is usually based on a systematic review. The quantitative data from different
studies are combined or ‘pooled’ using specific statistical techniques. Weights are assigned
to each study based on criteria specified in advance in order to evaluate the overall effect.
Single studies
If no meta-analyses or systematic reviews with quantitative data are available, then effect
sizes from single studies are used for the strand impact estimate (see section 9).
Since 2015, single studies retrieved from a parallel search have also been used where
available to create a new but basic meta-analysis for all strands which is then included in the
meta-meta-analysis calculation. This is to ensure that recent high quality single studies which
have not yet been included in any meta-analyses are reflected in the overall effect size
estimate. For more detail on this see section 9.
17
6.2. Screening – type of outcome
Studies are excluded during the screening process unless they present data on cognitive
outcomes or attainment outcomes. The aim is to use measures which predict later educational
outcomes well.
The attainment outcomes measured include reading, writing, oral language and mathematics
outcomes or outcomes from other subjects of the school curriculum, and the cognitive
outcomes include reasoning and problem-solving skills.
The outcomes can be measured by standardised tests, cognitive tests or curriculum tests (e.g.
schools assessments or national tests or examinations) or researcher designed measures of
educational attainment. Some examples of different outcomes are provided below.
Reading
A wide range of reading outcomes are used in the studies including reading comprehension,
vocabulary knowledge, letter and word recognition and phonological knowledge and skills
(also described as ‘word attack’ or word-level skills).
Writing
Few standardised writing measures are available, most estimates rely on specific researcher
designed measures which often measure quantity (for example total length or number of
sentences) and use quality indicators, relating to sentence complexity, grammatical
construction or vocabulary measures.
Oral language (speaking and listening )
Some research uses measures of speaking and listening skills. These are often used to predict
later reading capability, particularly for very young children.
Mathematics
Measures of mathematics outcomes are usually based on the topics or academic outcomes
that are being researched.
Cognitive tests
Examples of tests used include the Cognitive Abilities Test (CAT - GL Assessment); Ravens
Progressive Matrices and Vocabulary Scales (Pearson), Watson-Glaser Critical Thinking
Appraisal, Piagetian reasoning skills.
18
7. Inclusion
After the screening process for meta-analyses and systematic reviews has been completed
(on title and abstract and then on full text – see section 6), and any single studies have been
identified and meta-analysed (see section 9), a final set of inclusion criteria are applied to the
retained studies for each strand, as described below.
According to these final criteria, meta-analysis and systematic reviews which are based wholly
on observational studies are excluded, unless there are no meta-analysis and systematic
reviews which are based on experimental or quasi-experimental studies, and there are not
sufficient single studies based on experimental data from the single study search to provide a
secure pooled estimate (usually at least 5 studies are needed for a secure pooled estimate).
In exceptional cases, a review based on observational data will be retained in the case where
there are no meta-analysis and systematic reviews which are based on experimental data,
and it is judged that the single studies based on experimental data do not on their own
sufficiently reflect the likely heterogeneity of impact for approaches within that strand. This
judgement is based on the scale and quality of the individual studies, drawing on the
CONSORT reporting guidelines2 and the Cochrane risk of bias tool3. Most educational studies
do not meet these criteria.
In addition, observational studies are only included when they include correlational estimates
relevant to the relationship between an intervention or approach and learning outcomes.
Definitions
In experimental studies, an intervention is intentionally introduced and the result is observed.
For example, in randomised controlled trial studies, two or more groups are formed through
random allocation to provide equivalence over known and unknown variables, and then post-
test outcomes on the variable of interest are compared.
Quasi-experimental studies lack random allocation, but attempt to simulate its effect, for
example by comparing outcomes for the control group with those from a group which have
been ‘matched’ to the control group on known variables.
In observational studies the intervention is not assigned to a particular group. Instead, data is
collected from a group already receiving the intervention in the population.
Experimental and quasi-experimental studies are preferred over observational studies
because they deliver stronger causal inference4, based on the counterfactual comparison.
2 http://www.consort-statement.org 3 http://methods.cochrane.org/bias/assessing-risk-bias-included-studies 4 As discussed in Higgins, S. (2017) Impact evaluation in R. Coe, M. Waring, L. V. Hedges
& J. Arthur (Eds) Research Methods & Methodologies in Education, 2ndedition, London: Sage
19
8. Data extraction
8.1. Coding and data extraction
After the final inclusion criteria have been applied (as described in Section 7), the remaining
studies are coded on the following variables and the data recorded in the Toolkit Data Table
spreadsheet:
a) Study name
b) Pooled effect size (for meta-analyses or systematic reviews with quantitative data)
or overall effect size (single studies)
c) FSM effect size (if applicable)
d) Effect Size type: g, d, Δ, r, g(c) (see appendix 4 on effect sizes in education
research)
e) Standard Error (SE)
f) Standard Deviation (SD)
g) Confidence Intervals (CI) 95%
h) Effect Size Range (Max/ Min)
i) Number of Studies (k)
j) Number of Effects
k) Number of pupils (N)
l) Pupils’ age or age range
m) Moderator Analysis: Yes, No, Unclear
n) Publication Bias Evaluated: Yes, No, Unclear
o) Meta-Analysis: Yes, No
p) Study quality reported: Yes, No, Unclear
This data is saved in the Toolkit Data Table as shown in Figure 5.1
20
9. Single studies
As discussed in Section 6, in order to ensure that recent high quality studies not yet included
in reviews are captured by the search process, a separate search of single studies is done for
each Toolkit strand.
The single studies search has the same process and criteria as described in sections 5, 6, 7
and 8, with three exceptions.
First, the search terms differ, not in terms of the topics of studies but in terms of their
methodologies. For example, methodological limiters such as ‘experiment’ ‘RCT’ and ‘trial’ will
be added, which are not necessary for the meta-analysis search because they will be captured
by search terms such as ‘meta-analysis’ and ‘systematic review’.
Second, studies are excluded during the screening process unless they are single studies
with:
quantitative evidence of impact, with effect size data reported or calculable (for
example, randomised controlled trials, well-matched experimental studies, regression
discontinuity studies or natural experiments with appropriate analysis); or
correlational estimates of effects related to the intervention or approach being studied.
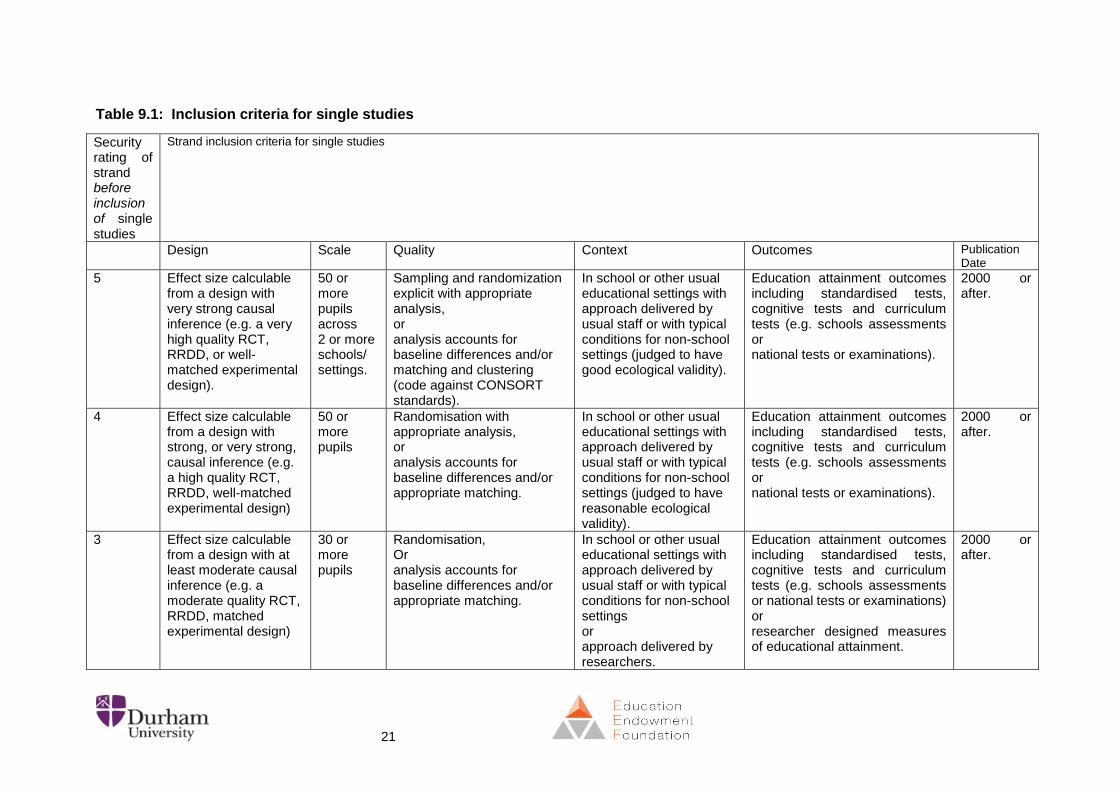
Third, whether studies are included depends on an additional set of criteria as described in
the table below. These criteria differ depending on the security rating of the relevant strand at
the time of the update, as shown in Table 5a. The rationale is that new single studies should
be reflected in the strand impact estimate, except where their inclusion would reduce the
overall quality of evidence used to create the impact estimate.
For a single study to meet the criteria (for a given strand security rating) it must meet all the
requirements for design, scale, quality, context, outcomes and publication date in the relevant
row.
21
Table 9.1: Inclusion criteria for single studies
Security rating of strand before inclusion of single studies
Strand inclusion criteria for single studies
Design Scale Quality Context Outcomes Publication Date
5 Effect size calculable from a design with very strong causal inference (e.g. a very high quality RCT, RRDD, or well-matched experimental design).
50 or more pupils across 2 or more schools/ settings.
Sampling and randomization explicit with appropriate analysis, or analysis accounts for baseline differences and/or matching and clustering (code against CONSORT standards).
In school or other usual educational settings with approach delivered by usual staff or with typical conditions for non-school settings (judged to have good ecological validity).
Education attainment outcomes including standardised tests, cognitive tests and curriculum tests (e.g. schools assessments or national tests or examinations).
2000 or after.
4 Effect size calculable from a design with strong, or very strong, causal inference (e.g. a high quality RCT, RRDD, well-matched experimental design)
50 or more pupils
Randomisation with appropriate analysis, or analysis accounts for baseline differences and/or appropriate matching.
In school or other usual educational settings with approach delivered by usual staff or with typical conditions for non-school settings (judged to have reasonable ecological validity).
Education attainment outcomes including standardised tests, cognitive tests and curriculum tests (e.g. schools assessments or national tests or examinations).
2000 or after.
3 Effect size calculable from a design with at least moderate causal inference (e.g. a moderate quality RCT, RRDD, matched experimental design)
30 or more pupils
Randomisation, Or analysis accounts for baseline differences and/or appropriate matching.
In school or other usual educational settings with approach delivered by usual staff or with typical conditions for non-school settings or approach delivered by researchers.
Education attainment outcomes including standardised tests, cognitive tests and curriculum tests (e.g. schools assessments or national tests or examinations) or researcher designed measures of educational attainment.
2000 or after.

22
2 Effect size calculable from a design with at least some causal inference (e.g. RCT, RRDD, experimental design)
30 or more pupils.
Randomisation OR analysis accounts for or acknowledges baseline differences and/or appropriate matching.
Any setting. Education attainment outcomes including standardised tests, cognitive tests and curriculum tests (e.g. schools assessments or national tests or examinations) or researcher designed measures of educational attainment.
2000 or after.
1 Effect size calculable from a comparison of those who have received the intervention/ approach with those who have not (i.e. experimental and observational designs).
Sample includes pupils or learners between the ages of 3-18.
Any setting. Any cognitive or learning outcomes.
Any date.
23
When these criteria have been applied, the effect size estimates for remaining single studies
for any given strand are used to create a new fixed effect meta-analysis.
If a single study identifies a single primary outcome, then this outcome is used in the new fixed
effect meta-analysis.
If a single study does not identify a single primary outcome, then up to four outcomes from the
study can be used in the new meta-analysis, one relating to each categories from the list
below. (If more than one effect size is available for any of the categories in this list, the most
robust appropriate effect size is used for that category).
literacy or literacy related outcomes
mathematics or mathematics related outcomes
curriculum-wide outcomes
cognitive outcomes
If outcomes are available for more than one of the categories listed above, a pooled effect
size will usually be calculated for the study before it is added into the new meta-analysis.
This new fixed effects single study meta-analysis estimate then contributes to the calculation
of the overall impact estimate for the strand (see section 10 for more detail on how strand
effect size estimates are created).
It is important to note that these internal meta-analyses are not treated as published meta-
analyses or systematic reviews for the purposes of allocating evidence ratings to the Toolkit
strands (see section 12).
24
10. Creating effect size estimates
When the final set of included studies has been determined for each strand, an overall
estimate of effect size is calculated, depending on the available data.
10.1. Choice of outcomes
In some cases, meta-analyses and reviews report an effect size (or data from which an effect
size is calculable) for more than one outcome. In these cases only one effect size should be
used for each of the following types of outcomes:
literacy or literacy related outcomes
mathematics or mathematics related outcomes
curriculum-wide outcomes
cognitive outcomes
Where appropriate, we might pool two different estimates from a meta-analysis before
including them in the meta-meta-analysis for the Toolkit estimate.
10.2. Choice of measure for a given outcome
For literacy, priority is given to outcomes measuring reading skills. In descending order:
reading comprehension
word reading skills
letter and sound knowledge
vocabulary knowledge
An exception would be made to this if the measures used for the preferred outcome were of
much lower quality that those used for one of the other outcomes.
For mathematics, priority is given to standardised measures of mathematics attainment where
these are available.
10.3. Choice of effect size
Effect sizes are calculated as follows:
Weighted mean
Where confidence intervals and/or standard errors around the pooled effect size are available,
an inverse variance weighted mean effect size is calculated as the overall estimate. There are
two types of weighted mean commonly used in meta-analysis: the fixed effect and the random
effects. A fixed effect model assumes that there one common effect size shared among all the
included studies and any observed differences can be assigned to sampling error alone. A
random effects model assumes that the effect size might differ from study to study and the
average is based on the variability both within and between studies (Borenstein, Hedges &
25
Rothstein, 2007). The toolkit uses a fixed effect model to create the weighted means as this
allows the combination of pooled effects.
In order to calculate a weighted mean effect size for the meta-meta-analysis, we need a
standard error for each meta-analytic effect size included in the calculation.
If a case arose where most of the included meta-analyses provided sufficient data to allow the
calculation of a weighted mean, but a small proportion didn’t report a standard error or provide
sufficient data for a standard error to be calculated, it might be considered appropriate to
exclude those meta-analyses in order that a more robust weighted mean could be calculated
rather than a median or a mean.
Median
If there is insufficient data to calculate a weighted mean, a median effect size is calculated as
an overall estimate. The median is used rather than the mean because it is less affected by
extreme values and tends to be closer to the weighted mean in cases where it is possible to
calculate both.
Mean
In cases where the range of effect sizes is unusual or sparse such that the median is judged
to provide an unsatisfactory estimate, a mean value is calculated as the overall estimate.
Indicative
If it is not possible to calculate a weighted mean, median or mean effect size, (or, exceptionally,
where we judge that using such an effect size may be misleading in some way, for example,
because the relevant studies have been disproportionately carried out with a particularly
unusual group of pupils or an unusual context) an indicative effect size is estimated from the
best available data. For example, if the studies only present estimates for the correlation
coefficient (r), these could be used to derive an indicative effect size based on the magnitude
of r, which can then be converted to a standardised mean difference (d).

26
11. Translating effect size to months’ progress
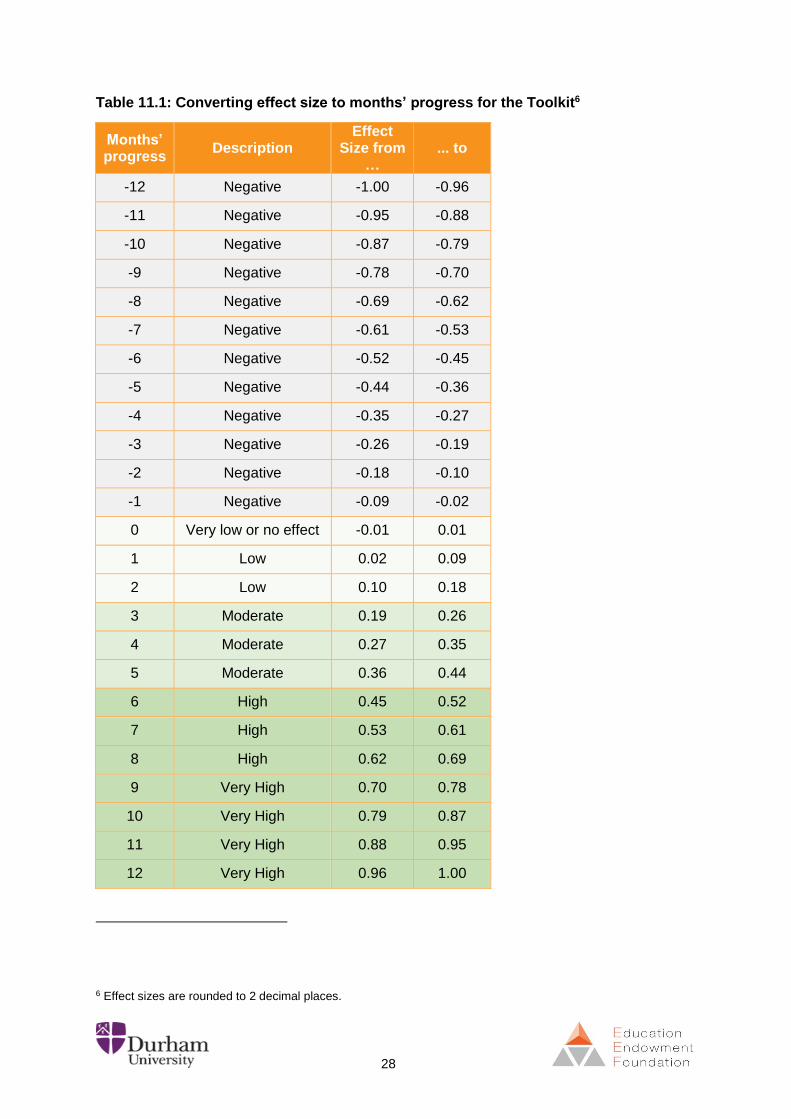
The Toolkit translates effect sizes into months of additional progress (see Table 11.1, below).
This is to provide a comparable estimate of impact which is more easily understood than effect
sizes and which can be applied to children across the age range of the toolkits (age 3 to age
18). The aim is to provide a single measure of impact which makes the research results
meaningful to users who are not familiar with effect sizes.
In order to do this we started with Glass’ observation that “the standard deviation of most
achievement tests in elementary school is 1.0 grade equivalent units; hence the effect size of
one year’s instruction at the elementary school level is about +1” (Glass, 1981: 103).
Using the assumption that 1 year of progress is equivalent to 1 standard deviation, it is possible
to translate effect sizes into months progress, because the unit of effect size is a standard
deviation. So, if 1 year of progress is 1 SD, then 1 month of progress is about 0.09 SD – an
effect size of 0.09 (1/12).
This approach provides a simple way to translate effect size into a measure that is meaningful
for teachers and educational professionals.
However, the precise correspondence of one standard deviation to one year’s progress does
not hold for all ages and across different studies. For example, in the UK, data5 from National
Curriculum tests (DfES, 2004) indicates annual progress of about 0.8 of a standard deviation
at age 7 (at the end of Key Stage 1), falling to 0.7 at 11 (at the end of Key Stage 2) and only
0.4 at age 14 (end of Key Stage 3).
This raises an issue which is more to do with effect size calculation than the EEF method of
converting effect sizes into months of progress. In general, as children get older, the ratio of
the progress in attainment made over the past year, to the spread of attainment across the
cohort, reduces (in other words, the ratio of annual progress to spread reduces). This means
that if we think of intervention effect sizes as ‘average progress made in attainment’ divided
by ‘the spread of attainment’, the same effect size will tend to correspond to a larger proportion
of an average year of progress for older pupils. So, using effect sizes may lead to
underestimating the months of progress delivered for older pupils compared to younger pupils.
This doesn’t mean there’s anything wrong with effect sizes, it’s just that they are designed to
measure average change relative to spread, not average change relative to average annual
progress.
By converting effect sizes into months progress, it would be possible to address this problem,
by taking into account the differing ratios of annual progress to spread discussed above.
However, this simply isn’t possible when we are working with meta-analytic effect sizes, which
5 http://www.education.gov.uk/rsgateway/DB/SBU/b000481/b02-2004v2.pdf, with thanks in particular to Michelle Weatherburn and Helen Evans at the Department for Education for identifying this data and providing support with the interpretation of National Test data.

27
will include results from children of a range of ages. Instead we use the ratio at age 7, when 1
year of progress is broadly equivalent to 1 standard deviation, as stated above.
In recognising this limitation, it is important to emphasise two things. First, the EEF months
progress measure is proportional to effect size: a bigger effect size always equates to more
months’ progress. So in terms of the comparing different Toolkit strands, looking at the EEF
months progress measure is just the same as looking at effect sizes. Second, by using the
ratio we observed for children at the relatively young age of 7, the estimates of months
progress in the Toolkit may tend to under-estimate impact for strands with more studies
conducted with older children, but might over-estimate impact for those with more studies
undertaken with very young children. In general, however, our overall estimates will be
conservative, and on balance we have decided that defining 1 year of progress as 1 SD
provides a simple measure which can be used across the age range, based on annual
progress for younger learners, to create a single scale of progress, understandable for all
pupils.
Overall, and despite the limitations of this approach in terms of precision, we think that the
conversion makes effect size data more accessible to practitioner and other users of the
Toolkit.
For future iterations of the Toolkits we are considering ways to present a months’ progress
figure which takes into account pupil age and test type.
28
Table 11.1: Converting effect size to months’ progress for the Toolkit6
Months’ progress
Description Effect
Size from …
... to
-12 Negative -1.00 -0.96
-11 Negative -0.95 -0.88
-10 Negative -0.87 -0.79
-9 Negative -0.78 -0.70
-8 Negative -0.69 -0.62
-7 Negative -0.61 -0.53
-6 Negative -0.52 -0.45
-5 Negative -0.44 -0.36
-4 Negative -0.35 -0.27
-3 Negative -0.26 -0.19
-2 Negative -0.18 -0.10
-1 Negative -0.09 -0.02
0 Very low or no effect -0.01 0.01
1 Low 0.02 0.09
2 Low 0.10 0.18
3 Moderate 0.19 0.26
4 Moderate 0.27 0.35
5 Moderate 0.36 0.44
6 High 0.45 0.52
7 High 0.53 0.61
8 High 0.62 0.69
9 Very High 0.70 0.78
10 Very High 0.79 0.87
11 Very High 0.88 0.95
12 Very High 0.96 1.00
6 Effect sizes are rounded to 2 decimal places.

29
It is important to note that this is slightly different from the table used to convert Effect Sizes
to months’ progress for EEF projects. Specifically, the boundaries for the zero months band
are different (because of differences in the precision of effect size estimates from single
studies and meta-analyses).
30
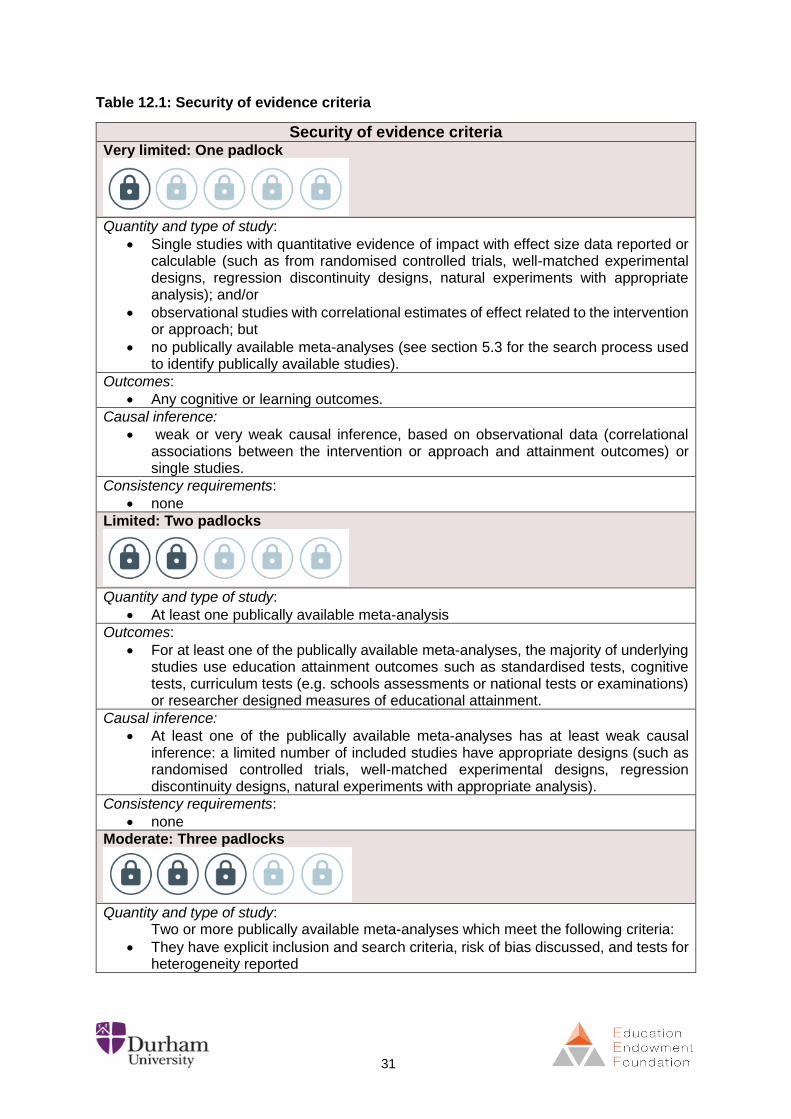
12. Evidence security ratings
The Toolkit presents a rating of the security of the evidence for each approach. This is
illustrated on the Toolkit website using a padlock icon so it is sometimes referred to as the
'padlock' security rating. This rating provides an overall estimate of the robustness of the
evidence, to help support professional decision-making in schools.
These security ratings take into account:
the quantity and types of studies available;
the outcomes measured in those studies;
The strength of causal inference provided by those studies; and
the consistency of estimated impacts across the studies that have been synthesised.
Table 12.1 below provides more detail on how the ratings are allocated. In most cases it is
clear which rating should be allocated. However, because of the complexities involved in, for
example, assessing the appropriate causal inference from a given study, expert judgement is
needed in some cases.
These ratings are designed to summarise the strength of the causal inference for impact on
learning outcomes in schools, the quantity and consistency of the findings (both the overall
pooled effect and the pattern of effects relating to moderator variables) and the ecological
validity of the studies (where studies took place in schools with interventions managed by
teachers rather than researchers). The focus of the Toolkit is on providing advice to schools
about how to spend additional resource to benefit disadvantaged learners, so these are judged
to be the most relevant criteria.
The requirements for each padlock rating have recently been reviewed and minor
adjustments have been made to improve the methodological coherence of the Toolkit as a
whole. For some strands, these revisions will not feed through into the published toolkit until
the next Toolkit updates. In other cases, allocating a padlock rating, even with the criteria
shown below, requires professional judgment, for example, regarding the strength of causal
inference. We aim to use the Technical Appendix provided for each Toolkit strand to provide
transparency about the role that judgement plays. We welcome constructive debate about
the padlock rating and how it is applied. Comments should be addressed to
For the purposes of this Table 12.1, a “meta-analysis” is a quantitative synthesis of effect sizes
for the impact of the intervention based on a systematic review or a systematic review with a
pooled effect size for the impact of the intervention reported or calculable. The mini-meta-
analysis carried out on single studies by the Toolkit team as detailed in section 9 is not included
in this definition.
31
Table 12.1: Security of evidence criteria
Security of evidence criteria
Very limited: One padlock
Quantity and type of study:
Single studies with quantitative evidence of impact with effect size data reported or calculable (such as from randomised controlled trials, well-matched experimental designs, regression discontinuity designs, natural experiments with appropriate analysis); and/or
observational studies with correlational estimates of effect related to the intervention or approach; but
no publically available meta-analyses (see section 5.3 for the search process used to identify publically available studies).
Outcomes:
Any cognitive or learning outcomes.
Causal inference:
weak or very weak causal inference, based on observational data (correlational associations between the intervention or approach and attainment outcomes) or single studies.
Consistency requirements:
none
Limited: Two padlocks
Quantity and type of study:
At least one publically available meta-analysis
Outcomes:
For at least one of the publically available meta-analyses, the majority of underlying studies use education attainment outcomes such as standardised tests, cognitive tests, curriculum tests (e.g. schools assessments or national tests or examinations) or researcher designed measures of educational attainment.
Causal inference:
At least one of the publically available meta-analyses has at least weak causal inference: a limited number of included studies have appropriate designs (such as randomised controlled trials, well-matched experimental designs, regression discontinuity designs, natural experiments with appropriate analysis).
Consistency requirements:
none
Moderate: Three padlocks
Quantity and type of study:
Two or more publically available meta-analyses which meet the following criteria:
They have explicit inclusion and search criteria, risk of bias discussed, and tests for heterogeneity reported
32
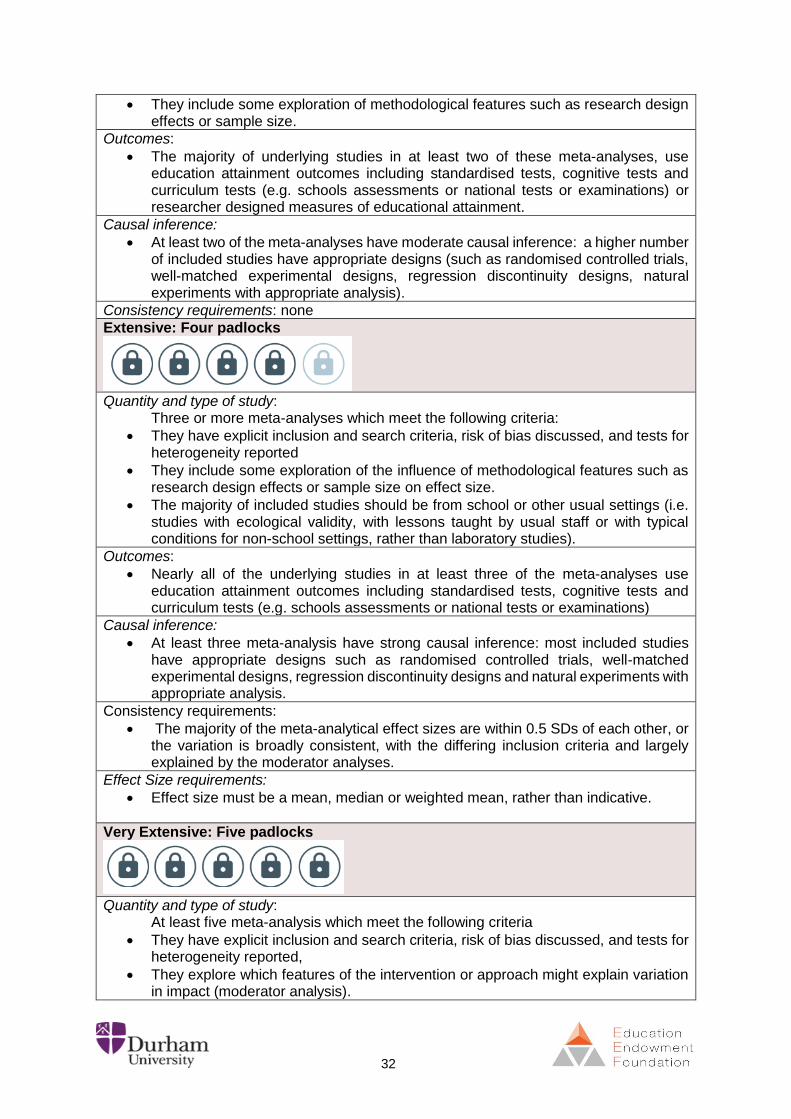
They include some exploration of methodological features such as research design effects or sample size.
Outcomes:
The majority of underlying studies in at least two of these meta-analyses, use education attainment outcomes including standardised tests, cognitive tests and curriculum tests (e.g. schools assessments or national tests or examinations) or researcher designed measures of educational attainment.
Causal inference:
At least two of the meta-analyses have moderate causal inference: a higher number of included studies have appropriate designs (such as randomised controlled trials, well-matched experimental designs, regression discontinuity designs, natural experiments with appropriate analysis).
Consistency requirements: none
Extensive: Four padlocks
Quantity and type of study:
Three or more meta-analyses which meet the following criteria:
They have explicit inclusion and search criteria, risk of bias discussed, and tests for heterogeneity reported
They include some exploration of the influence of methodological features such as research design effects or sample size on effect size.
The majority of included studies should be from school or other usual settings (i.e. studies with ecological validity, with lessons taught by usual staff or with typical conditions for non-school settings, rather than laboratory studies).
Outcomes:
Nearly all of the underlying studies in at least three of the meta-analyses use education attainment outcomes including standardised tests, cognitive tests and curriculum tests (e.g. schools assessments or national tests or examinations)
Causal inference:
At least three meta-analysis have strong causal inference: most included studies have appropriate designs such as randomised controlled trials, well-matched experimental designs, regression discontinuity designs and natural experiments with appropriate analysis.
Consistency requirements:
The majority of the meta-analytical effect sizes are within 0.5 SDs of each other, or the variation is broadly consistent, with the differing inclusion criteria and largely explained by the moderator analyses.
Effect Size requirements:
Effect size must be a mean, median or weighted mean, rather than indicative.
Very Extensive: Five padlocks
Quantity and type of study:
At least five meta-analysis which meet the following criteria
They have explicit inclusion and search criteria, risk of bias discussed, and tests for heterogeneity reported,
They explore which features of the intervention or approach might explain variation in impact (moderator analysis).
33
The majority of included studies should be from school or other usual settings (i.e. studies with ecological validity with lessons taught by usual staff or with typical conditions for non-school settings, rather than laboratory studies).
At least three of these meta-analysis have been carried out within the last 3 years.
Outcomes:
Nearly all of the underlying studies in at least five of the meta-analyses use education attainment outcomes including standardised tests, cognitive tests and curriculum tests (e.g. schools assessments or national tests or examinations
Causal inference:
Those meta-analysis have strong causal inference: most included studies having appropriate designs, such as randomised controlled trials, well-matched experimental designs, regression discontinuity designs and natural experiments with appropriate analysis.
Consistency requirements:
Results are broadly consistent across the meta-analyses (i.e. the spread of the pooled effects is relatively narrow, such as less than 0.5 standard deviations, or the variation is consistent with the differing inclusion criteria and largely explained by the moderator analyses).
Effect Size requirements:
Effect size must be a mean, median or weighted mean, rather than indicative.

34
13. Cost estimates
Cost estimates are based on the additional likely costs of adopting or implementing an
approach with a class of twenty-five pupils in England.
The banding used for the cost rating is shown in Table 13.1.
Table 13.1: Cost rating bands for EEF Toolkit
£ Very low: up to about £2,000 per year per class of 25 pupils, or less than £80 per pupil per year.
££ Low: £2,001-£5,000 per year per class of 25 pupils, or up to about £200 per pupil per year.
£££ Moderate: £5,001 to £18,000 per year per class of 25 pupils, or up to about £720 per pupil per year.
££££ High: £18,001 to £30,000 per year per class of 25 pupils, or up to £1,200 per pupil.
£££££ Very High: over £30,000 per year per class of 25 pupils, or over £1,200 per pupil.
13.1. How we derive the costs
Cost estimates are based on the additional expenditure required from a school to begin
implementing the approach. This might include, for example:
the cost of new resources required, such as lessons plans or technological hardware
or software.
the cost of training courses or CPD to support a new approach, and teacher cover to
enable this to happen.
the cost of activities for pupils such as outdoor education programmes or music tuition.
Cost estimates do not include the cost of resources which are necessary for the intervention
but which are schools are expected to already have, such as interactive whiteboards, or
teachers (unless an additional new teacher is required to deliver the intervention).
This means that the Toolkit cost estimates do not reflect the total absolute cost of the different
intervention types in the Toolkit, which would include the opportunity costs of using existing
resources in a particular way.
They also do not distinguish between start-up costs (such as training teachers to deliver an
intervention or investment in new technologies) and maintenance costs (how much it costs to
continue with a programme or approach after it has been established).
However, we think presenting costs in terms of additional expenditure makes it most useful to
schools leaders deciding how to allocate budgets.
The costs are derived from the following sources:
Published research (e.g. EEF studies or other studies where costs are provided)
Publically available cost information (e.g. from providers’ web pages).

35
Costs estimated by the toolkit team based on the constituent costs of the interventions,
using web searches (e.g. using pay scales for salary costs for teachers and teaching
assistants).
A judgement is made based on what information is available and what seems likely to be
needed for implementation. More detail will be available in the next version of this manual.
We prioritise cost estimates coming from UK over US or other countries. This is to provide a
local estimate where possible.
Costs are checked and updated as part of the regular updates for each strand (see section
15).
36
14. Toolkit strand summary text
The summary text accompanying each Toolkit impact estimate draws on a range of
information. It is primarily based on studies identified in the systematic search for impact
estimates. Note that some of these may be studies which did not meet the final inclusion
criteria for inclusion in the calculation of the effect size estimate, but which still have
information which is useful in defining the intervention or approach or in helping understand
the effective use of the approach.
For the original Toolkit published in 2011, some of the studies used in the summary text were
not identified through systematic searches. However, as of 2015, to be used in the textual
summary a study has to be identified through the systematic search and be:
a systematic review with quantitative evidence of impact; a meta-analysis; or a single
study which meets the criteria for inclusion in terms of quality for the strand (see
Section 9); or
a high-quality review or robust study which does not contain quantitative estimates of
effect size but which contains additional data which can help to explain the observed
variation in the individual effect size estimates which have contributed to the overall
effect size estimate and/or information about application of the evidence in schools; or
a conceptual analysis of the intervention or approach in the strand which helps to clarify
the underlying causal mechanisms and/or implementation issues in schools.
Any reference to impact or relative effectiveness in the text is supported by causal inference
from the quantitative estimates for the strand and/or the effect sizes and regression analyses
from the meta-analytic data.
37
15. Updating the Toolkit
The process described above for creating a Toolkit strand is repeated for each strand as part
of the regular Toolkit updates (undertaken around every 2 years to date), to ensure that the
Toolkit remains a live resource. For each update, we go back to existing included studies and
check the dates of publication, then begin the systematic search starting from an earlier date
of publication (usually five years) so that any lag in indexing or publication does not mean
studies are missed (if the search terms for a strand have been revised since the last update,
then we search on those new terms for the full range of dates – from 1980 for meta-analyses
and from 2000 for single studies). The inclusion criteria are therefore the same as for new
strands but involve a more recent date range restriction.
38
16. Strand Technical Appendix
For each strand of the Toolkit a technical appendix is available on the strand webpage. It
contains the following sections:
Definition
A more detailed definition than provided on each Toolkit strand webpage. This is extended
and clarified where necessary so it shows how the definition is operationalized and what
interventions would not be captured.
Search terms
Search terms for the search described in section 5 are included, though all variants of the
terms used (plurals, different spellings etc.) are only recorded on the search record
spreadsheet.
Evidence rating
Provides details to explain how the padlock rating was awarded.
Additional cost information
Provides information about how the cost estimates were derived.
References
A list of references used to compile the Toolkit entry, including all meta-analyses, systematic
reviews and single studies used to derive the impact estimate. Other reviews and studies used
for the strand summary text (see section 14) are also included. Where possible a web
reference or digital object identifier is included so as to facilitate access to the sources of the
Toolkit. References are presented in a format similar to the American Psychological
Association (APA) format.
Summary of effects
A table presents the effect sizes used to estimate the overall impact for the Toolkit together
with the estimate itself.
If data is available to calculate a separate effect size for disadvantaged pupils it is also
recorded here. However, the definition of disadvantaged pupils may not be strictly comparable
between studies. For example, some studies use eligibility for free school meals as an
indicator of disadvantage, whilst others use high household poverty.
Meta-analyses abstracts
The abstracts from each of the meta-analyses or systematic reviews used to calculate the
impact estimates for each strand are included for further background detail.

39
Appendix 1: Background to the Toolkit - The Pupil
Premium in England
The Sutton Trust-EEF Teaching and Learning Toolkit arose from work funded by the Sutton
Trust to review potential effective use by schools of the pupil premium grant in England when
it was first proposed in 2010 (Higgins, Kokotsaki & Coe, 2011). Initially the pupil premium was
set at £488 per eligible pupil in 2011-12, rose to £600 in 2012-13, to £953 per eligible child in
primary schools and £900 for secondary pupils in 2013-14, then £1320 for primary and £935
for secondary in 2014-15. The current value of the Pupil Premium can be found on the
Department for Education webpage:
https://www.gov.uk/government/organisations/department-for-education
The policy proposal was that schools should be given the money and would be accountable
for how they spent it, but decisions about how to spend the money would be up to the schools
themselves. A number of suggestions of ways in which the money should be spent were made
at the time, such as to reduce class size or to provide additional one-to-one tuition. Some of
this advice encouraged schools to spend the grant on things that evidence suggested were
not cost effective. For example, the research suggests that reducing class size is expensive
for the potential benefit, and in some circumstances one-to-two teaching can be as effective
as one-to-one, but at almost half the cost.
The cost bands for the Toolkit cost rating (see section 13) were initially created to reflect the
value of the pupil premium per child.

40
Appendix 2: Rationale for the Toolkit
This appendix sets out the rationale for the development of the Sutton Trust-EEF Teaching
and Learning Toolkit and the reasons we think it can support schools to make better decisions.
The primary aim of the Toolkit is to provide schools with evidence from education research to
help them make informed decisions about spending to support pupils’ learning.
The aim of the Toolkit is not to provide definitive claims as to what will work to bring about
improvement in a new context. Rather it is an attempt to provide the best possible estimate of
what is likely to be beneficial based on existing evidence. In effect it summarises what has
worked in order to provide a ‘best bet’ for what might work in the future. The applicability of
this information to a new context is always likely to need active professional enquiry and
evaluation to ensure it achieves the desired effects.
That is why we always talk about the Toolkit evidence as only one element of the school
improvement process. Good application of the Toolkit evidence requires contextual knowledge
and professional educational expertise as well
Our emphasis is on identifying comparative messages from research. In summarising each
field, a number of judgements have had to be made about the applicability of the evidence in
relation to the challenge of improving outcomes for learners.
We believe that educational research can help schools get better value from their spending.
This is both in terms of making an initial choice between possible strategies, and then in
implementing a strategy or approach as effectively as possible. We are not saying that
approaches which are unsuccessful on average can never work or that approaches like
feedback and metacognitive approaches will always work in a new context, with different
pupils, a different curriculum and undertaken by different teachers. However, we believe that
the existing evidence provides information and insight that is useful to schools as they make
decisions about spending and about their teaching priorities.
There are, of course, some limitations to the meta-analytic approach we have taken in creating
the Toolkit. The quality of the evidence within any area is variable and one of the issues in
meta-analysis is that some of the subtleties of these issues are lost in aggregation. There is
also considerable variation in each of the themes that have been summarised for the Toolkit.
For further discussion of these issues see Higgins (2016).
Overall we think that the messages in the Toolkit are encouraging for teachers. The evidence
summarised in the Toolkit shows that many of the things that have the greatest impact on
outcomes are related to teacher practice and the choices individual teachers make in the
classroom.
We do not believe that there are any guarantees from the evidence. Teachers and schools
will need to try out these ideas and evaluate their usefulness in improving learning. Sometimes
this needs perseverance to create the conditions in which learners can respond to feedback
or take more responsibility for their learning. Another way of looking at these approaches is
seeing them as means to set up a context in which learning is more or less likely to improve.
The actual improvement will depend on the extent to which learners actually think harder,
41
more deeply or more frequently about what is being learned and their teachers can support,
challenge, extend and develop this thinking.
Further information about the background to the use of meta-analysis (and meta-meta
analysis) in education can be found in Higgins (2016) and further details about the approach
to the Early Years Toolkit and the Teaching and Learning Toolkit in Higgins and Katsipataki
(2016).
Resources and pupil learning
Decisions about how to allocate school funds have been increasingly devolved schools. But
making these decisions is not straightforward.
It is difficult to establish a clear link between educational expenditure and pupils’ learning in
schools. Analysis of spending per pupil and scores on the Third International Maths and
Science Study (TIMSS) found ‘no association between spending levels and average academic
achievement’ even after controlling for variables such as family background and school
characteristics’ (Hanushek & Woessman, 2010). However, most of the studies have been
undertaken at the system level (e.g. whole countries, states or local authorities) where the
relationship between allocation of resources and differences in schools, teachers and pupils
is highly complex. It may seem obvious that more money offers the possibilities for a better or
higher quality educational experience, but the evidence suggests that it is not simply a
question of spending more to get better results. This may be because in the UK and other
developed countries we spend reasonably efficiently, and increased effectiveness comes at
much greater cost (Steele et al., 2007). Much of the early research in this area failed to find a
convincing connection for a range of reasons (Burtless, 1996), though meta-analyses of such
studies indicated there was a sufficient connection to warrant increased spending (e.g.
Greenwald et al. 1998). More recent research suggests that there is a link between spending
and outcomes, but that it is a complex picture (e.g. Vignoles et al., 2000) and that higher
quality data sets are required to understand the mechanisms by which spending and learning
are associated (Levačić & Vignoles, 2002). Some analyses suggest that the effects of greater
spending tend to influence mathematics and science more than English in UK secondary
schools (Steele et al., 2007) and that disadvantaged pupils may benefit more (Holmund et al.
2010; Pugh et al. 2011).
Over the period 1997-2011 per capita spending in England increased by 85% in real terms
(based on projections in DCSF, 2009). During the same period improvements in pupil
outcomes were marginal on most international and comparative measures (e.g. Tymms, 2004;
Tymms and Merrell, 2007; NFER, 2011; OECD, 2011). It is hard to identify any clear link
between increased spending and school performance in England (Heath, Sullivan, Boliver,
Zimdars, 2013).
Investing for better learning, or spending so as to improve learning, is therefore not easy,
particularly when the specific aim is to support disadvantaged learners whose educational
trajectories are harder to influence. Much depends on the context, the school, the teachers
(their levels of knowledge and experience), the learners (their level of attainment and their
social background) and the educational outcomes that you want to improve (knowledge, skills
42
or dispositions). Improving test scores in arithmetic in the short term, for example, may not
raise students’ aspirations for what further learning in mathematics may accomplish for them.
We interpret the lack of a clear causal link between general additional spending and
learning to mean that it is difficult to spend additional resource effectively to improve
learning and to increase attainment, but that there must be some areas which offer
better prospects than others. This is what this Toolkit seeks to provide.
We also think that the evidence shows that if schools want to use any additional resource,
such as the Pupil Premium, to benefit disadvantaged learners they should not assume that
any increased allocation alone will improve learning, but they will need to decide specifically
and deliberately how it should be spent, and then evaluate the impact of this for themselves.
The existing research indicates that this is a challenging but achievable task.
43
Appendix 3: Causal inference and evaluation of impact, By
Professor Steve Higgins.
The Toolkit is based on meta-analyses of education research studies. As detailed in section
12 a higher evidence rating is allocated to Toolkit strands which are supported by studies
providing greater causal inference. This Appendix discusses the relationship between
evaluation design and causal inference.
Impact evaluation in education usually means assessing the effects of policies, programmes
and initiatives or other approaches to bring about intentional change in terms of valued
educational outcomes for learners7. The aim of such research is to identify the effect so as to
provide a retrospective assessment of whether the policy, intervention or approach was
actually responsible for any changes in outcomes for learners (Higgins, 2017). The aims of
the initiative will therefore determine the main questions for the evaluation (Rossi, Lipsey &
Freeman, 2003). These are usually causal questions as policy makers, practitioners and
researchers want to know whether the initiative has actually been responsible for any
improvement.
Impact evaluation therefore tends to be summative rather than formative, in that the aim is to
identify the effects of what has happened, rather than improve the effectiveness of a policy or
intervention for the future. A key concept in any assessment of effectiveness or evaluation of
impact or is therefore understanding the nature of any comparison being made, or the
‘counterfactual’ condition. We would ideally like to know what would have happened to pupils’
learning both with and without the initiative taking place. This is not possible, of course, as a
single student cannot both experience and not experience an initiative. We can’t run a parallel
worlds experiment in real life. So, different kinds of comparisons provide evidence for a
stronger or weaker argument about the robustness of any causal claim in terms of whether an
initiative has had an effect or not. The nature of the particular counterfactual or comparison in
an impact evaluation affects what is a plausible explanation and a reasonable interpretation
of the findings. More specifically, it affects the internal validity of the evaluation claims: what
is the evidence that it has actually worked? Each of the approaches to impact evaluation in
Table A3.1 (below, adapted from Higgins, 2017) seek to understand whether an initiative has
achieved its aims or not. The strength of the claim weakens as the comparison is less capable
of providing evidence that the change being evaluated is the actual cause of any improvement.
The counterfactual comparison becomes less convincing the greater the threats to internal
validity.
7 Impact evaluation may, of course, also include the effects of change on educational systems or on the perceptions of those involved, rather than outcomes for learners.
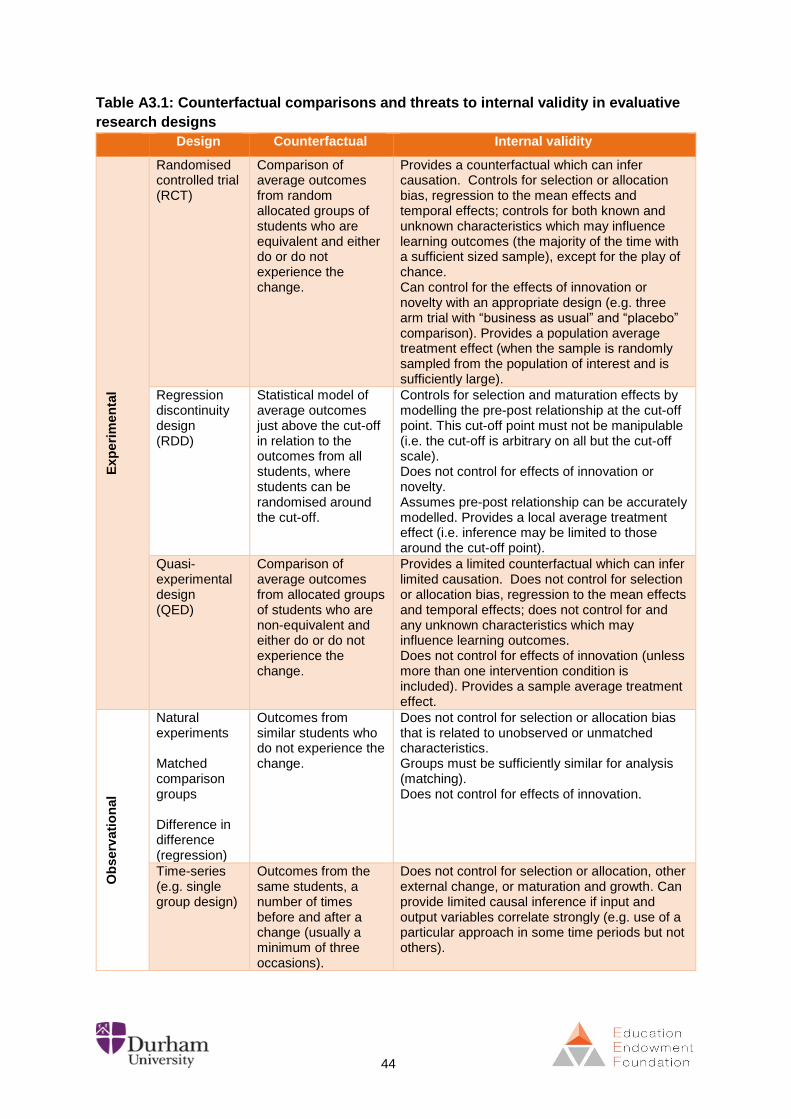
44
Table A3.1: Counterfactual comparisons and threats to internal validity in evaluative
research designs
Design Counterfactual Internal validity
Exp
eri
men
tal
Randomised controlled trial (RCT)
Comparison of average outcomes from random allocated groups of students who are equivalent and either do or do not experience the change.
Provides a counterfactual which can infer causation. Controls for selection or allocation bias, regression to the mean effects and temporal effects; controls for both known and unknown characteristics which may influence learning outcomes (the majority of the time with a sufficient sized sample), except for the play of chance. Can control for the effects of innovation or novelty with an appropriate design (e.g. three arm trial with “business as usual” and “placebo” comparison). Provides a population average treatment effect (when the sample is randomly sampled from the population of interest and is sufficiently large).
Regression discontinuity design (RDD)
Statistical model of average outcomes just above the cut-off in relation to the outcomes from all students, where students can be randomised around the cut-off.
Controls for selection and maturation effects by modelling the pre-post relationship at the cut-off point. This cut-off point must not be manipulable (i.e. the cut-off is arbitrary on all but the cut-off scale). Does not control for effects of innovation or novelty. Assumes pre-post relationship can be accurately modelled. Provides a local average treatment effect (i.e. inference may be limited to those around the cut-off point).
Quasi-experimental design (QED)
Comparison of average outcomes from allocated groups of students who are non-equivalent and either do or do not experience the change.
Provides a limited counterfactual which can infer limited causation. Does not control for selection or allocation bias, regression to the mean effects and temporal effects; does not control for and any unknown characteristics which may influence learning outcomes. Does not control for effects of innovation (unless more than one intervention condition is included). Provides a sample average treatment effect.
Ob
serv
ati
on
al
Natural experiments Matched comparison groups Difference in difference (regression)
Outcomes from similar students who do not experience the change.
Does not control for selection or allocation bias that is related to unobserved or unmatched characteristics. Groups must be sufficiently similar for analysis (matching). Does not control for effects of innovation.
Time-series (e.g. single group design)
Outcomes from the same students, a number of times before and after a change (usually a minimum of three occasions).
Does not control for selection or allocation, other external change, or maturation and growth. Can provide limited causal inference if input and output variables correlate strongly (e.g. use of a particular approach in some time periods but not others).
45
Randomisation aims to take account of both known and unknown factors which may account
for differences in groups, as opposed to matching, which controls for known factors (such as
age, gender, socio-economic background, special educational attendance). Randomisation
therefore aims to take account of aspects of the complexity of a context which may not be
known in advance. Experimentation is a deliberate inquiry which makes intentional change
and aims to identify the effects of that change. A further goal may be to identify and test a
specific causal model or to validate how the change has been effective or which students
benefited most. Approaches such as theory-based evaluation seek to do this by having a clear
conceptualization or logic model which attempts to explain how the policy or intervention
produces the desired effects (Fitz-Gibbon & Morris, 1996). In this approach factors or features
of the theoretical model are included in the evaluation design so that any association can also
be explored. This might include aspects of fidelity (tracking how faithfully those involved
adopted the changes in practice) or measures which might indicate changes in participants’
behaviours or the processes of the new practices being evaluated which are consistent with
the theory and which would therefore be expected to be clearly correlated with successful
outcomes. If ‘evidence’ is taken here to mean ‘causal evidence of impact’, then it seems clear
that such evidence is necessary for decision-making in education. We need to know whether
some things have been successful or not: whether they ‘worked’ as intended.

46
Appendix 4: Effect sizes in education research
What is an effect size?
An effect size8 is a key measure in intervention research and an important concept in the
methodology of the Toolkit. It is a standardised way of measuring the extent of the difference
between two groups: in this context, a group who have received the intervention and a group
who have not. It is easy to calculate, and can be applied to any measured outcome for groups
in education or in research more broadly.
The value of using an effect size to assess the impact of an intervention is that it quantifies
the effectiveness of a particular intervention, relative to a comparison group, and it does so in
a comparable way which allows results from different research projects to be compared and
combined. It allows us to move beyond the simplistic, ‘Did it work (or not)?' to the far more
important, 'How well did it work across a range of contexts?' It therefore supports a more
scientific and rigorous approach to the accumulation of knowledge, by placing the emphasis
on the most important aspect of the intervention – the size of the effect – rather than its
statistical significance, which is dependent upon both the effect size and sample size. For
these reasons, effect size is the most important tool in reporting and interpreting effectiveness,
particularly when drawing comparisons about relative effectiveness of different approaches.
Effect sizes allow you to compare groups, relative to the distribution of scores. The effect size
is the standardised mean difference between two groups. This is calculated by finding the
difference between the control and intervention groups, divided by their spread (standard
deviation). There has been some debate over the years about exactly how to calculate the
effect size (see below), however in practice most of the variations in approaches make very
little difference to the calculated effect size in the majority of contexts where effect sizes are
calculated using data on pupils’ learning (see Xiao, Higgins & Kasim (2016) for a comparison
of Glass’ Δ, Cohen’s d and Hedges’ g across 20 outcomes from EEF trials). It is important to
remember that, as with many other statistics, the effect size is based on the mean difference
between two groups. It does not mean that all of the pupils will show the same difference, it
represents the average difference between the groups. The mean difference is moderated by
the spread of the groups (the standard deviation). The greater the spread, relative to the mean,
the smaller the effect size.
For those concerned with statistical significance, it is still readily apparent in the confidence
intervals surrounding an effect size. If the confidence interval includes zero, then the effect
8 Effect sizes can be thought of in two broad categories: first, those which compare the extent of the differences
between two groups or standardised mean differences, such as Cohen’s d or Hedges g; and second, variance-
accounted for effect sizes, such as 2, 2 or R2) which report the extent to which overlap of key variables is explained. A third group of corrected effect sizes (Vacha-Haase and Thompson, 2002), are variations of these two, but which attempt to adjust for sampling issues. Some effect sizes can be converted mathematically into others (d to r, for example). However, it is important to bear in mind the research design from which data is analysed and the precise calculation method used in understanding the comparability of particular effect size measures (Coe, 2004). The Toolkit focuses on standardised mean difference as a measure of the impact of different interventions.
47
size would be considered not to have reached conventional statistical significance. The
advantage of reporting effect size with a confidence interval is that it lets you judge the size of
the effect first and then decide the meaning of conventional statistical significance. So a small
study with an effect size of 0.8, but with a confidence interval which includes zero, might be
more interesting educationally that a larger study with a negligible effect of 0.01, but which is
statistically significant.
Methods of calculation
Over the years there have been a number of methods proposed to calculate the appropriate
standard deviation for use in deriving an effect size. The main approaches are listed below.
Glass's Δ
Gene V. Glass (1977) proposed an estimator of the effect size that uses only the
standard deviation of the control group, this is commonly referred to as Glass’s Δ
(delta). He argued that if several interventions or treatments were compared with the
control group it would be better to use just the standard deviation from the control
group, so that effect sizes would not differ under equal means and different variances.
Cohen's d
Cohen's d is defined as the difference between two means divided by an unspecified
standard deviation for the data. This definition of Cohen's d is termed the ‘maximum
likelihood estimator’ by Hedges and Olkin (1985).
Hedges' g
Hedges' g, suggested by Larry Hedges (1981) is based on a standardized mean
difference, like the other measures, but the pooled standard deviation is computed
slightly differently from Cohen's d, in that it contains a correction factor for small sample
sizes.
‘g (corrected)’ or ‘d’
Hedges’s g is biased for small sample sizes. However, this bias can be adjusted (g
(corrected)). Hedges and Olkin (1985) refer to this unbiased estimate as d, but it is not
the same as Cohen's d. In most recent meta-analyses when an effect size is referred
to as Hedges’s g it is the bias-corrected formula which has been used, though some
studies also refer to this as d.
What does it mean?
As an example, suppose we have two classes of 25 students, one class is taught using a
feedback intervention, the other is taught as normal. The classes are equivalent before the
intervention. The intervention is effective with an effect size of 0.8. This means that the
average person in the class receiving the feedback intervention (i.e. the one who would have
been ranked 12th or 13th in their class) would now score about the same as the person ranked
48
6th in a control class which had not received the intervention. Visualising these two individuals
provides a valuable interpretation of the difference between the two effects (see Figure 1).
Another way to interpret effect sizes is to compare them with effect sizes of differences that
are familiar. For example, Cohen (1988, p23) describes an effect size of 0.2 as 'small', and
gives to illustrate the point an example that the difference between the heights of 15 year old
and 16 year old girls in the US corresponds to an effect of this size. An effect size of 0.5 is
described as 'medium' and is 'large enough to be visible to the naked eye'. A 0.5 effect size
corresponds to the difference between the heights of 14 year old and 18 year old girls. Cohen
describes an effect size of 0.8 as 'grossly perceptible and therefore large' and equates it to
the difference between the heights of 13 year old and 18 year old girls.
As a further example, he states that the difference in IQ between holders of the PhD and
'typical college freshmen' is comparable to an effect size of 0.8.
Hattie (2009) concludes that most things in education ‘work’ with an average affect size of
about 0.4, and that this should therefore be a benchmark.

49
Figure 1: An effect size of 0.8
Although the labelling of effect sizes as small, medium or large on this basis (Cohen, 1988)
corresponds with the overall distribution of effects found in education research with an average
around 0.4 (Sipe and Curlette, 1997; Hattie and Timperley, 2007), a ‘small’ effect may be
educationally important if, for example, it is easy or cheap to attain or is achievable with groups
who are otherwise hard to influence. Similarly, a large effect size may not be important if it is
unrealistic to bring it about in normal circumstances. Cohen does acknowledge the danger of
using terms like 'small', 'medium' and 'large' out of context. Glass and colleagues (1981, p104)
are particularly critical of this approach, arguing that the effectiveness of a particular
intervention can only be interpreted in relation to other interventions that seek to produce the
same effect. They also point out that the practical importance of an effect depends entirely on
its relative costs and benefits. In education, if it could be shown that making a small and
inexpensive change would raise academic achievement by an effect size of even as little as
0.1, then this could be a very significant improvement, particularly if the improvement applied
uniformly to all students, and even more so if the effect were cumulative over time.
As a standardised metric an effect size can also be converted to other measures for
comparison: e.g. “students at Phoenix Park outperformed those at Amber Hill in the national
school-leaving examination (the General Certificate of Secondary Education, or GCSE) by, on
average, one third of a grade, equivalent to a standardized effect size of 0.21” (Wiliam et al.
2004: 50). So using this conversion, an effect size of 0.8 would be equivalent to an
improvement of just over one GCSE grade.
There are a number of reasons for preferring a conservative estimate of what it likely to be
achievable in practice. One problem is that estimates of the effects of interventions come from
research studies that may optimise rather than typify their effects. For example, research is
50
often conducted by advocates of a particular approach; considerable care is often taken to
ensure that the intervention is implemented faithfully in the research setting; outcome
measures used in research studies may be better aligned with the aims and focus of the
intervention than other more general measures. It may be therefore be unrealistic to expect
schools to achieve the gains reported in research whose impact may be inflated (this is what
Cronbach and colleagues (1980) called ‘super-realisation bias’). Other evidence suggests that
effect sizes will also be smaller as interventions are scaled up or rolled out (Slavin & Smith,
2008).
How comparable are effect sizes?
There are some notes of caution in comparing effect sizes across different kinds of
interventions. Effect size as a measure assumes a normal distribution of scores. If this is not
the case, then an effect size might provide a misleading comparison. If the standard deviation
of a sample is decreased (for example, if the study does not contain the full range of a
population) or inflated (for example, if an unreliable test is used), the effect size is affected. A
smaller standard deviation will increase the effect size, a larger standard deviation will reduce
it. Another issue is which standard deviation is chosen (Bloom et al., 2008) as this primarily
determines the comparability of the effect size (Coe, 2004). This explains some of the variation
in methods discussed above. This is also relevant to how effect sizes are calculated from
linear regression models (Hedges, 2007; Xiao, Kasim & Higgins, 2016).
There is also evidence that there is some systematic variation in effect sizes in education. One
factor, for example, is the age of the pupils, where studies with younger learners tend to have
higher effect sizes. One reason for this is likely to be the narrower distribution of scores at this
age, producing a smaller standard deviation and therefore a larger effect size, though there is
also a relationship with the subject (e.g. mathematics or English) being researched (Hill, Bloom
& Lipsey, 2009). In England the standard deviations of National Test scores1 increase from
3.9 at age 7, to 4.3 at age 11, and 6.8 at 14 as the distribution of scores widens and flattens
(DfES, 2004). This would change a mean difference of 3 National Curriculum points from an
effect size of 0.8 at age 7, to 0.7 at age 11 and 0.4 at age 16.
There is also some variation associated with the type of outcome measure with larger effect
sizes typically reported in mathematics and science compared with English (e.g. Higgins et
al., 2005) and for researcher designed tests and teacher assessments compared with
standardised tests and examinations (e.g. Hill et al., 2007: 7).
It is also important that any comparison in an experimental design is a fair one. One issue is
what the control or comparison group did, or the ‘counterfactual’ (Higgins, 2017). In general
there are three possibilities here. The first is that they did nothing at all. This might be the case
with a summer school intervention where it is reasonable to evaluate the difference between
going to summer school or not going. The second is that you might want to find out if a new
approach is better than what usually happened or “business as usual” where the impact of
peer-tutoring in reading is compared with what other schools or classes normally do to teach
reading. The challenge here is that what the counterfactual group did is rarely reported. The
third is that there may be two interventions which are compared, often referred to as an “active
control” where you find out if one approach to teaching spelling is better than another
approach, when both are newly introduced to different classes or schools. This controls for
51
any innovation effect of introducing something new. It seems like likely that effect sizes would
be tend to be greatest where the comparison group does nothing, smaller where the
comparison group is business as usual and smaller again when there is an active control.
A related issue here is which outcomes are measured and how closely they are aligned with
the intervention. This is what Slavin and Madden (2011) call treatment-inherent or treatment-
independent measures. They define these as (p. 374):
1. “If a skill or concept has been taught to the experimental group but not to the control group,
all measures of that skill or concept are treatment inherent.
2. Except for #1, standardized tests and other assessments not made by the developer or
the experimenter are treatment independent.
3. Experimenter-made or developer-made assessments are treatment independent if
curriculum is held constant in experimental and control groups (i.e., the groups differ in
teaching method but not content). Otherwise, such assessments are treatment inherent.
4. If an experimental treatment gives students extensive practice with an unusual response
format (such as computer-adaptive testing) to which the control group is not exposed, then
measures using this response format are treatment inherent.”
Unsurprisingly, effect sizes for outcomes based on treatment inherent measures tend to be
larger than those based on outcomes which are treatment independent (Slavin & Madden,
2011). Again, here the issue is what makes a fair test and what inference can reasonably be
drawn the from the findings. If, for example, a summer school evaluation uses standardised
tests of reading and mathematics, although these would be treatment-inherent, this seems a
reasonable way to evaluate the impact of a summer school and how much difference it has
made, on average, to those who attend as we are interested in how a summer school might
help children’s progress, usually those who are falling behind their peers. By contrast, a
science reasoning intervention, which used a test which closely matches what the intervention
covered, as opposed to a ‘business as usual’ group might simply show that when you teach
something, on average, students improve. So the treatment inherent measure is an issue in
terms of what the intervention group might have gained. The challenge is to use an outcome
measure which is a fair test of the intervention or approach, taking the research question and
design into account. It would not be reasonable to use a standardised mathematics test as an
outcome measure for a phonics intervention. For the Toolkit, we prefer standardised tests
(these are usually of reading comprehension or of mathematics) or curriculum measures which
schools would normally use. Here we are interested in the predictive validity of the outcome
measure in terms of how well it measures aspects of learning which are associated with later
school success. The outcome measure needs to be both a fair test of the comparison being
made and a fair test of learning progress.
Slavin and Smith (2009) report that there is a relationship between sample size and effect size
in education research, with smaller studies tending to have larger effect sizes. The correlation
found was -0.28 (p. 503), suggesting that this explains about 8% of the variation between large
and small studies, with larger studies typically having smaller effect sizes. The issue is
important in terms of comparing effects between different kinds of interventions which tend to
be small scale (such as areas of research looking at interventions to address special needs
for example) and others which tend to have larger samples (class size interventions for
example). This association is also found in research in psychology (Kühberger, Fritz &
52
Scherndl, 2014) where the negative association is even stronger (r =-.45) explaining as much
as 20% of difference (or from and effect size of 0.40 to 0.32).
Comparability may also be restricted for studies reporting effect sizes with groups from either
end of the distribution (high attaining or low attaining learners), which are likely to be affected
by regression to the mean (Shagen & Hogden, 2009). This would inflate effect sizes for low
attaining pupils (who are more likely to get higher marks on re-test) and depress effect sizes
for high performing students when they are compared with ‘average’ pupils. If the correlation
between pre-test and post-test is 0.8, regression to the mean may account for as much as
20% of the variation in the difference between test and retest scores when comparing low and
average students.
In addition to the factors discussion above, other factors are often explored in meta-analyses
as part of a ‘moderator analysis’ to understand how they are related to effects, such as the
length of the intervention (duration and/or intensity) or the quality of the research. The
evidence here is less consistent and varies between syntheses, so it is hard to draw clear
conclusions about any clear patterns of effect.
These issues all need to be considered when comparing (or combining effect) sizes (Higgins,
2016). One of the key assumptions of the Toolkit is that the factors which influence effect size
such as those discussed above are relatively evenly distributed across the studies included,
as any systematic variation might bias the overall pooled estimate. We are carrying out
ongoing review and analysis to test this assumption.
53
17. References
Aguinis, H., Pierce, C. A., Bosco, F. A., Dalton, D. R., & Dalton, C. M. (2011). Debunking myths and urban legends about meta-analysis. Organizational Research Methods, 14(2), 306-331.
Bloom, B. S. (1984). The 2 sigma problem: The search for methods of group instruction as effective as one-to-one tutoring. Educational Researcher, 13(6), 4-16.
Bloom, H.S., Hill, C.J., Black, A.R. and Lipsey, M.W. (2008). Performance Trajectories and Performance Gaps as Achievement Effect-Size Benchmarks for Educational Interventions. Journal of Research on Educational Effectiveness, 1.4 pp 289-328.
Borenstein, M., Hedges, L., & Rothstein, H. (2007). Meta-analysis: Fixed effect vs. random effects. Meta-analysis. com.
Borenstein, M., Hedges, L. V., Higgins, J., & Rothstein, H. R. (2010). A basic introduction to
fixed‐effect and random‐effects models for meta‐analysis. Research Synthesis Methods, 1(2), 97-111.
Borenstein, M., Hedges, L. V., Higgins, J. P., & Rothstein, H. R. (2011). Introduction to meta-analysis. London: John Wiley & Sons.
Burtless, G. (ed.) (1996). Does Money Matter? The Effect of School Resources on Student Achievement and Adult Success. Washington, D.C.: Brookings Institute Press.
Chan, M. E., & Arvey, R. D. (2012). Meta-Analysis and the Development of Knowledge. Perspectives on Psychological Science, 7(1), 79-92.
Coe R, (2002). It's the Effect Size, Stupid: What effect size is and why it is important Paper presented at the Annual Conference of the British Educational Research Association, University of Exeter, England, 12-14 September 2002. Available at: http://www.leeds.ac.uk/educol/documents/00002182.htm (accessed 2/3/11).
Coe, R. (2004) ‘Issues arising from the use of effect sizes in analysing and reporting research’ in I. Schagen and K. Elliot (Eds) But what does it mean? The use of effect sizes in educational research. Slough, UK: National Foundation for Educational Research. Available at: http://www.nfer.ac.uk/nfer/publications/SEF01/SEF01.pdf
Cohen, J. (1988). Statistical Power Analysis for the Behavioral Sciences (2nd ed.). Hillsdale, New Jersey: Lawrence Erlbaum Associates.
Cronbach, L.J., Ambron, S.R., Dornbusch, S.M., Hess, R.O., Hornik, R.C., Phillips, D.C., Walker, D.F. & Weiner, S.S. (1980). Toward reform of program evaluation: Aims, methods, and institutional arrangements. San Francisco, Ca.: Jossey-Bass.
Department for Education and Skills (DfES) (2004). Statistics of Education: Variation in Pupil Progress 2003 London: Department for Education and Skills. Available at: http://www.education.gov.uk/rsgateway/DB/SBU/b000481/b02-2004v2.pdf (accessed 15/06/11).
Department for Children, Schools and Families (DCSF). Departmental Report 2009. London: Department for Children Schools and Families. Available at: http://media.education.gov.uk/assets/files/pdf/d/departmental%20report%202009.PDF (accessed 18/05/13).
54
Dillon, J.T., (1982). Superanalysis. American Journal of Evaluation 3(4) pp 35-43.
Fitz-Gibbon, C. T., & Morris, L. L. (1996). Theory-Based Evaluation. Evaluation Practice, 17(2), 177-184.
Glass G.V., McGaw, B. & Smith, M.L. (1981). Meta-analysis in social research Beverly Hills, Ca: Sage.
Glass, G.V. (1977). Integrating Findings: The Meta-Analysis of Research. Review of Research in Education, 5: 351-379.
Greenwald, R, Hedges, LV, and Laine, RD (1996). 'The Effect of School Resources on Student Achievement'. Review of Educational Research, 66(3), 361-396.
Hanushek, E., and Woessman, L. (2010). The economics of international differences in educational achievement. NBER Working Paper 15949, April 2010, p18
Hattie, J.A. (1992). Measuring the effects of schooling. Australian Journal of Education, 36, 5-13.
Hattie, J.A. (2008). Visible Learning. London: Routledge.
Heath, A., Sullivan, A., Boliver, V., & Zimdars, A. (2013). Education under New Labour, 1997–2010. Oxford Review of Economic Policy, 29(1), 227-247. http://dx.doi.org/10.1093/oxrep/grt003
Hedges, L.V. & Olkin, I. (1985). Statistical Methods for Meta-Analysis. Orland, Florida: Academic Press.
Higgins, S. (2016) Meta-synthesis and comparative meta-analysis of education research findings: some risks and benefits Review of Education 4.1: 31–53. http://dx.doi.org/10.1002/rev3.3067
Higgins, S. (2017) Impact evaluation: a case study of the introduction of interactive whiteboards in schools in the UK in in R. Coe, M. Waring, L.V Hedges & J. Arthur. Eds) Education Research: Methods and Methodologies (2nd Edn.)London: Sage Publications Ltd
Higgins, S. & Katsipataki, M. (2016) Communicating comparative findings from meta-analysis in educational research: some examples and suggestions International Journal of Research & Method in Education 39(3) pp 237-254 http://dx.doi.org/10.1080/1743727X.2016.1166486
Higgins, S. & Simpson, A. (2011). Book Review: Visible Learning. British Journal of Educational Studies 59.2 pp 90-92.
Higgins, S., Hall, E., Baumfield, V., Moseley, D. (2005). A meta-analysis of the impact of the implementation of thinking skills approaches on pupils. In: Research Evidence in Education Library. London: EPPI-Centre, Social Science Research Unit, Institute of Education, University of London.
Higgins, S., Kokotsaki, D. & Coe, R. (2011) Toolkit of Strategies to Improve Learning: Summary for Schools Spending the Pupil Premium London: Sutton Trust. Available at: http://dro.dur.ac.uk/11453/3/11453S.pdf
Hill, C.J., Bloom, H.S., Black, A.R. & Lipsey, M.W. (2007). Empirical Benchmarks for Interpreting Effect Sizes in Research MDRC Working Papers on Research Methodology New York: MDRC Avaliable at: www.mdrc.org/publications/459/full.pdf (accessed 17/5/11).
55
Holmlund, H., McNally, S., & Viarengo, M. (2010). Does money matter for schools?. Economics of Education Review, 29(6), 1154-1164.
Ioannidis, J.P.A. & Trikalinos, T.A. (2007). The appropriateness of asymmetry tests for publication bias in meta-analyses: a large survey. Canadian Medical Association Journal 176 p 8.
Kühberger A, Fritz A, Scherndl T (2014) Publication Bias in Psychology: A Diagnosis Based on the Correlation between Effect Size and Sample Size. PloS ONE 9(9): e105825. doi:10.1371/journal.pone.0105825ü
Levačić, R., & Vignoles, A. (2002). Researching the links between school resources and student outcomes in the UK: a review of issues and evidence. Education Economics 10 (3), 312-331.
Luyten, H. (2006). 'An empirical assessment of the absolute effect of schooling: regression/ discontinuity applied to TIMSS-95'. Oxford Review of Education, 32: 3, 397-429.
Luyten, H., Peschar, H., Coe, R. (2008). Effects of Schooling on Reading Performance, Reading Engagement, and Reading Activities of 15-Year-Olds in England. American Educational Research Journal 45 (2) pp 319-342.
Marzano, R.J. (1998). A Theory-Based Meta-Analysis of Research on Instruction. Aurora, Colorado, Mid-continent Regional Educational Laboratory. Available at: http://www.mcrel.org:80/topics/products/83/ (viewed 31/05/11).
National Foundation of Educational Research (2011). Appendix A: Progress in International Reading Literacy Study (PIRLS) 2011 Overview. Slough: NFER. Available at http://www.nfer.ac.uk/publications/PRTZ01/PRTZ01App.pdf (accessed 18/05/13).
OECD (2009). PISA 2009 Results: Learning Trends. Paris: OECD. Available at http://www.oecd.org/pisa/pisaproducts/48852742.pdf (accessed 18/05/13).
Pugh, G., Mangan, J., & Gray, J. (2011). Do increased resources increase educational attainment during a period of rising expenditure? Evidence from English secondary schools using a dynamic panel analysis. British Educational Research Journal, 37(1), 163-189.
Rossi, P. H., Lipsey, M. W., & Freeman, H. E. (2003). Evaluation: A systematic approach. New York: Sage publications.
Schagen, I. & Hodgen, E. (2009). How Much Difference Does It Make? Notes on Understanding, Using, and Calculating Effect Sizes for Schools Wellington NZ: Research Division, Ministry of Education Available at: http://www.educationcounts.govt.nz/publications/schooling/36097/2 (accessed 5/6/11).
Sipe, T. & Curlette, W.L. (1997). A Meta-Synthesis Of Factors Related To Educational Achievement: A Methodological Approach To Summarizing And Synthesizing Meta-Analyses. International Journal of Educational Research 25.7. pp 583-698.
Slavin, R., & Madden, N. A. (2011). Measures inherent to treatments in program effectiveness reviews. Journal of Research on Educational Effectiveness, 4(4), 370-380.
Slavin, R. & Smith, D. (2009). The Relationship Between Sample Sizes and Effect Sizes in Systematic Reviews in Education. Educational Evaluation and Policy Analysis 31.4: 500-506.
56
Smith, N.L. (1982). Evaluative Applications of Meta- and Mega-Analysis. American Journal of Evaluation 3(4) pp 43.
Steele, F., Vignoles, A., & Jenkins, A. (2007). The effect of school resources on pupil attainment: a multilevel simultaneous equation modeling approach. Journal of Royal Statistical Society Series A,.170(3), 801-824.
Tanner, E., Brown, A., Day, N., Kotecha, M., Low, N., Morrell, G., Brown, V., Collingwood, A., Chowdry, H., Greaves, E., Harrison, C., Johnson, G., & Purdon, S. (2011). Evaluation of Every Child a Reader (ECar): Research Report DFE-RR114 London: Department for Education.
Tymms, P. (2004). Are standards rising in English primary schools? British Educational Research Jounrnal, 30(4), 477-494.
Tymms, P. & Merrell, C. (2007). Standards and quality in English primary schools over time: the national evidence. Primary Review Research Survey 4/1. Cambridge: The Primary Review.
Vignoles, A., Levačić, R., Walker, J., Machin, S. & Reynolds, D. (2000). The Relationship Between Resource Allocation and Pupil Attainment: A Review London: Department for Education and Employment.
Walberg, H. J. (1984). Improving the productivity of America's schools. Educational Leadership, 41(8), 19-27.
Wiliam, D. (2002). ‘Linking Research and Practice: knowledge transfer or knowledge creation?’ Plenary presentation at the annual conference of the North American Chapter of the International Group for the Psychology of Mathematics Education, Athens, Georgia, USA, October 2002.
Wiliam, D. (2010). 'Standardized Testing and School Accountability'. Educational Psychologist, 45: 2, 107-122.
Wiliam, D., Lee, C., Harrison, C. & Black P. (2004). Teachers developing assessment for learning: impact on student achievement. Assessment in Education, 11, 1 49-65.
Xiao Z., Kasim, A., Higgins, S.E. (2016) Same Difference? Understanding Variation in the Estimation of Effect Sizes from Educational Trials International Journal of Educational Research 77: 1-14 http://dx.doi.org/10.1016/j.ijer.2016.02.001