The Sustainable Plastics Roadmap: Recycling, Bioplastics ...
Upload
vuongxuyenCategory
view
229download
0
Sustainable Water Recycling An integrated solution to the water issues challenging
Hampton Roads and the Commonwealth of Virginia
2
HRSD
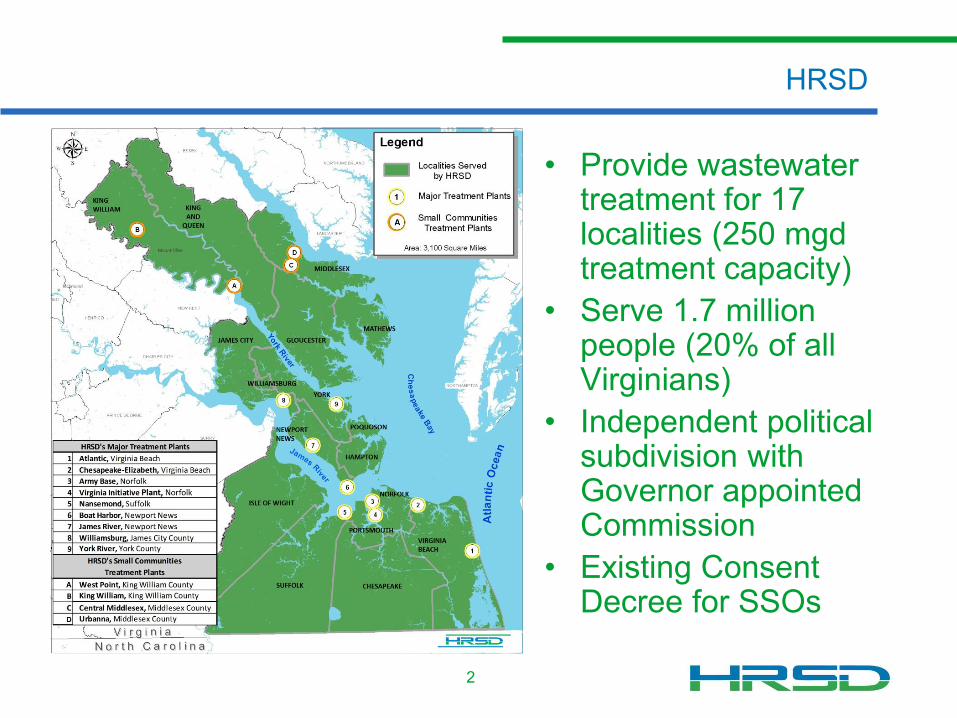
• Provide wastewatertreatment for 17localities (250 mgdtreatment capacity)
• Serve 1.7 millionpeople (20% of allVirginians)
• Independent politicalsubdivision withGovernor appointedCommission
• Existing ConsentDecree for SSOs

• Depletion of groundwater resources– Including protection from saltwater contamination
• Restoration of the Chesapeake Bay– Harmful Algal Blooms– Localized bacteria impairments– Urban stormwater retrofits (cost and complexity)
• Adaptation to sea level rise– Recurrent flooding
• Wet weather sewer overflows– Compliance with Federal enforcement action
Water Issues Challenging Virginia and Hampton Roads
3

Currently mining but not replenishing the aquifer
• Natural aquifer rechargeis not keeping up withwithdrawals
• Water is cleaned anddischarged to localwaterways, ultimately tothe ocean with nodownstream use
• Aggravating otherproblems including landsubsidence and saltwater intrusion
Current state of groundwater in Eastern VA
4

• Top DEQ priority• 177 permits = 147.3
MGD– Currently withdrawing
approximately 115 mgd• 200,000 unpermitted
“domestic” wells– Estimated to be
withdrawing approx. 40mgd
– Growing at 1 MGD/year
Groundwater depletion
5
Groundwater water-level decreases from 1900 to 2008
USGS 2013
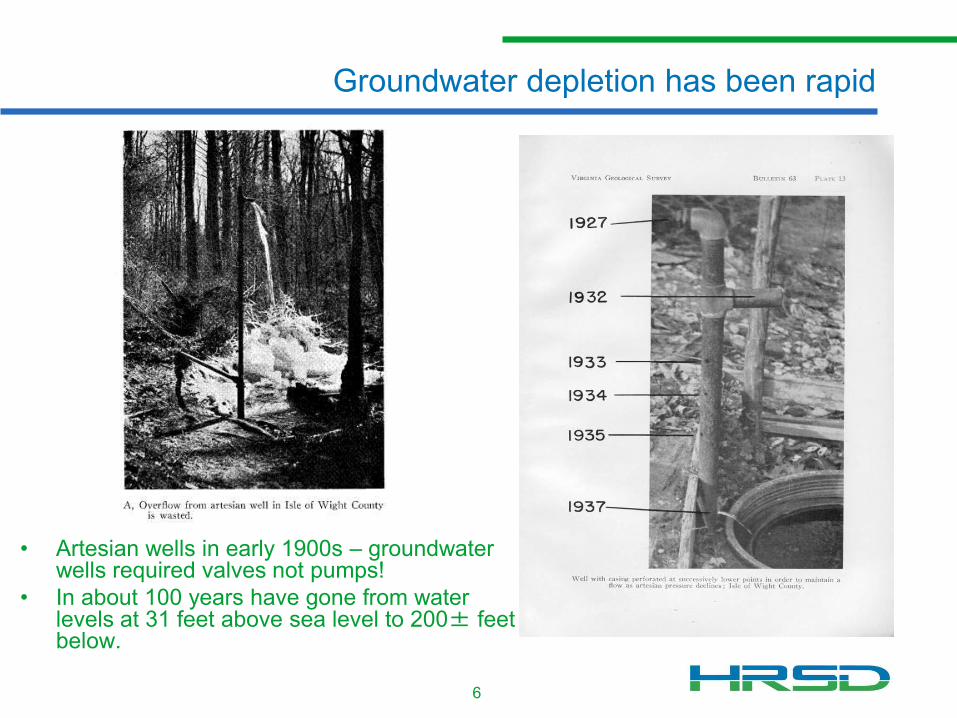
Groundwater depletion has been rapid
• Artesian wells in early 1900s – groundwaterwells required valves not pumps!
• In about 100 years have gone from waterlevels at 31 feet above sea level to 200± feetbelow.
6

Unsustainable Aquifer Withdrawals
• Over-allocated permittedwithdrawal– Water levels falling several
feet/yr– Some water levels below the
aquifer tops in western CoastalPlain
• Total permitted withdrawalsare unsustainable
– Areas below regulatory criteria– Areas experience aquifer
dewatering
7
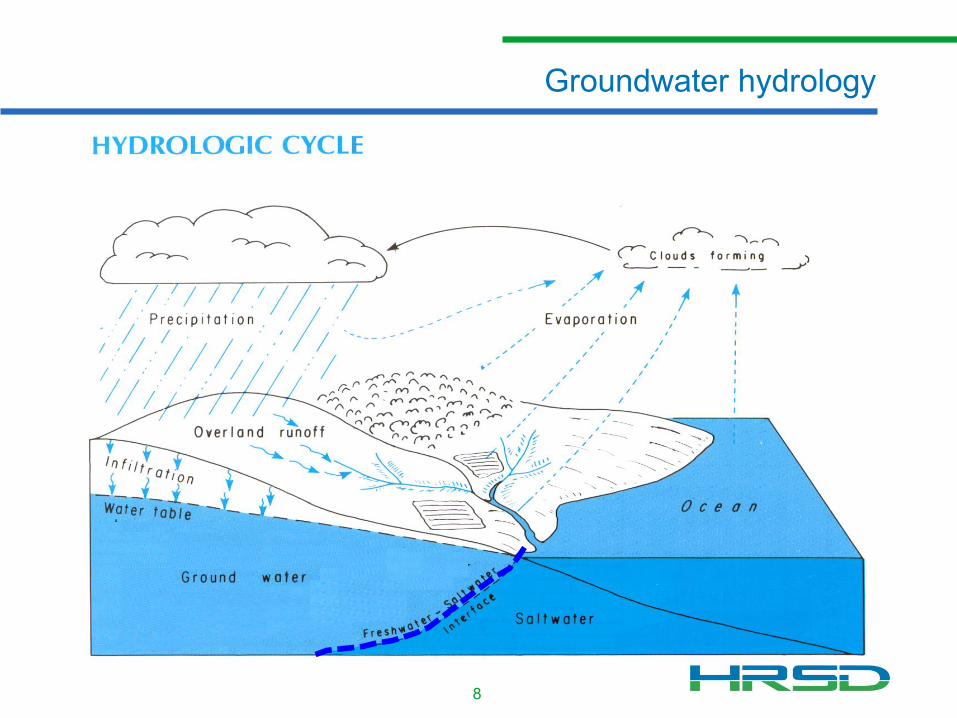
Groundwater hydrology
8

• Subsurface Geology - sediments (sands, silts, clays, shells, bedrockway down there)
• Aquifers - geologic units that easily store and transmit water– Unconfined– Confined - pressurized
Hydrogeologic framework
Confined Aquifer
Confined Aquifer
USGS, Basic Groundwater Hydrology, 1982
Confining Unit - Geologic units that retard the flow of water
Confining Unit
Confining Unit
Unconfined Aquifer

Hydrogeologic setting in the Coastal Plain of Virginia
• Fall Line (around I-95 corridor)to the Ocean
• Truncated by Chesapeake BayImpact Crater (Bolide/Meteor)
• Essentially no natural recharge– Aquifer water is 40,000 years old
Eastern Va Groundwater
Management Area
Section A-A
Potomac
Aquifer
Crater
10

• HRSD’s concept -replenish the aquiferwith clean water to:– Reduce nutrient
discharges to the Bay– Provide a sustainable
supply of groundwater– Reduce the rate of land
subsidence– Protect the groundwater
from saltwatercontamination
Proposed cycle of sustainable water recycling
11
Advanced
Water
Treatment

Potomac Aquifer water levels before and after injection
12

Potomac Aquifer water levels before and after injection
13

Saltwater contamination of groundwater
• Potentially irreversible contamination
14

0
1,000,000
2,000,000
3,000,000
4,000,000
5,000,000
6,000,000
7,000,000
2011 2012 2013 2014 2015 2016 2017 2018 2019 2020 2021 2022 2023
To
tal N
itro
gen
, (l
bs/y
r)
James River Basin Total Nitrogen 2011 WLA 2017 WLA
Projected 2022 WLA EPA Backstop SWR Projected
Impact on Nutrient Reductions
15
6,000,000 lbs TN 2011 WLA
4,400,000 lbs TN 2017 WLA
3,400,000 lbs TN 2022 WLA
1,600,000 lbs TN EPA Backstop
Army Base Completed VIP
Completed
Nansemond Completed
James River Completed
Chesapeake-Elizabeth Offline
WLA – Nutrient Waste Load Allocation in lbs/yr
SWR Projected TN
James River Basin – TN Similar results with TP and TSS and in other river basins.

• According to USGS– Up to 50% of sea-level
rise may be due to landsubsidence
– Up to 50% of landsubsidence may be dueto aquifer compaction
• Two potential solutions– Reduced withdrawal– Aquifer recharge
Land subsidence – we are sinking -1.6
-2.4
-2.8
-4
-3.6
-1.2
-0.8
-4.4
-2
-1.2
-2
-2
-1.6
-2
-3.2
-3.2
West Point
Franklin
Suffolk
Rates of Elevation Change (mm/year)
DEQ 2015
16
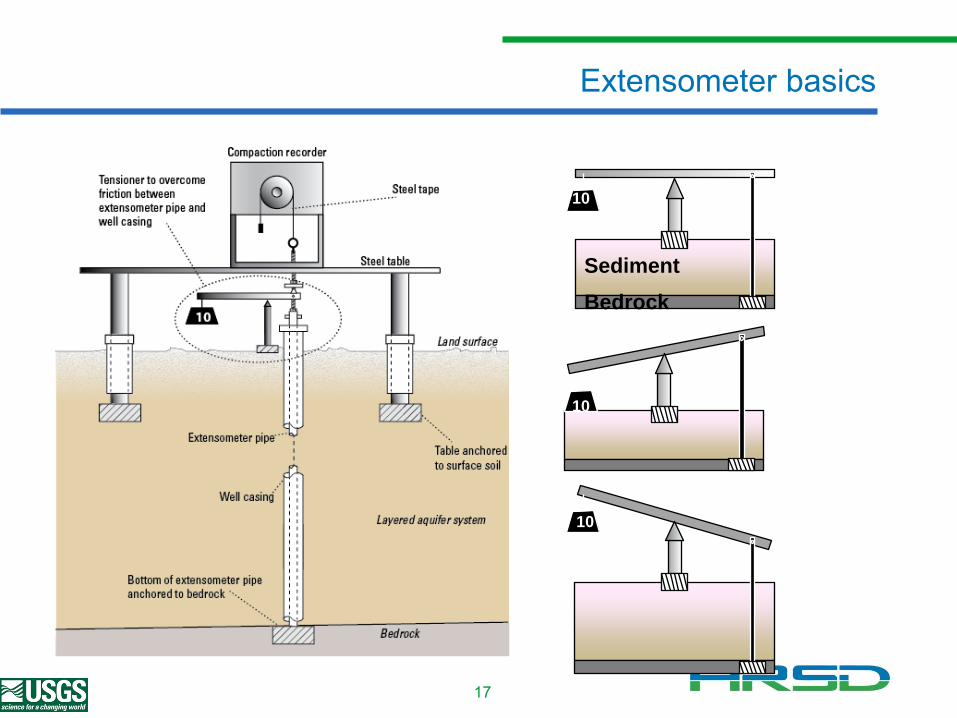
10
Before
After
Compaction /
Subsidence
10
10
After
Expansion /
Rise
Sediment
Bedrock
Extensometer basics
17

2002 2002
2015
Ground levels recovered
USGS found ground level rose 32 mm between 2002 and 2015 coinciding with reduced groundwater withdrawal by Franklin papermill.
18
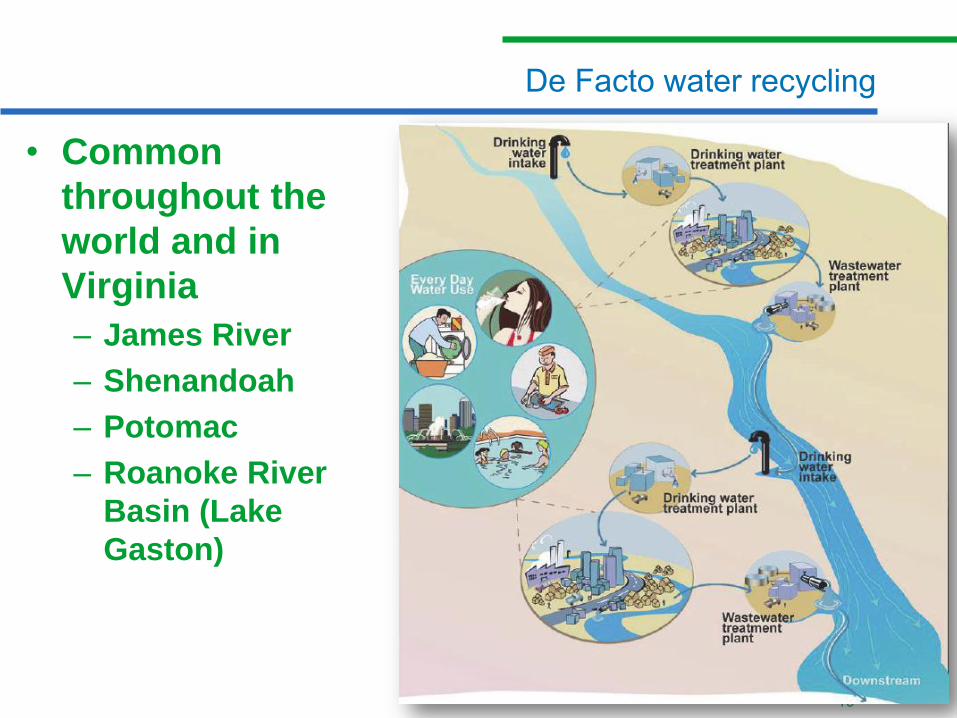
De Facto water recycling
• Common
throughout the
world and in
Virginia
– James River
– Shenandoah
– Potomac
– Roanoke River
Basin (Lake
Gaston)
19

Water recycling opportunities
0
Wastewater
Treatment Plant
Water
Reclamation
Plant
Agricultural Irrigation
Landscape Irrigation
Industrial Uses
Recreational &
Environmental Enhancement
Indirect Potable Reuse:
Drinking water source
(reservoir, aquifer, etc..)
Direct Potable Reuse:
Pipe to Pipe Connection
Non-Potable Reuse
Potable Reuse
Treatment
Plant Effluent
20

Project Location Type of Potable Reuse Year Capacity
Current Advanced Treatment
Process
Montebello Forebay, CA Coastal GW recharge via spreading basins
1962 44 mgd GMF + Cl2 + SAT (spreading basins)
Windhoek, Namibia Inland Direct potable reuse 1968 5.5 mgd
O3 + Coag + DAF + GMF + O3/H2O2 + BAC + GAC + UF + Cl2 (process as of 2002)
UOSA, VA Inland Surface water augmentation 1978 54 mgd Lime + GMF + GAC + Cl2
Hueco Bolson, El Paso, TX Inland GW recharge via direct injection and spreading basins
1985 10 mgd Lime + GMF + Ozone + GAC + Cl2
Clayton County, GA Inland Surface water augmentation 1985 18 mgd Cl2 + UV disinfection + SAT (wetlands)
West Basin, El Segundo, CA Coastal GW recharge via direct injection 1993 12.5 mgd MF + RO + UVAOP
Scottsdale, AZ Inland GW recharge via direct injection 1999 20 mgd MF + RO + Cl2
Gwinnett County, GA Inland Surface water augmentation 2000 60 mgd Coag/floc/sed + UF + Ozone + GAC + Ozone
NEWater, Singapore Coastal Surface water augmentation 2000 146 mgd (5 plants) MF + RO + UV disinfection
Los Alamitos, CA Coastal GW recharge via direct injection 2006 3.0 mgd MF + RO + UV disinfection
Chino GW Recharge, CA Inland GW recharge via spreading basins
2007 18 mgd GMF + Cl2 + SAT (spreading basins)
GWRS, Orange County, CA Coastal GW recharge via direct injection and spreading basins
2008 70 mgd MF + RO + UVAOP + SAT (spreading basins for a portion of the flow)
Queensland, Australia Coastal Surface water augmentation 2009 66 mgd via three plants
MF + RO + UVAOP
Arapahoe County, CO Inland GW recharge via spreading 2009 9 mgd SAT (via RBF) + RO + UVAOP
Loudoun County, VA Inland Surface water augmentation 2009 11 mgd MBR + GAC + UV
Big Spring (Wichita Falls),
TX Inland
Direct potable reuse through raw water blending
2013 1.8 mgd MF + RO + UVAOP
Operational water recycling projects
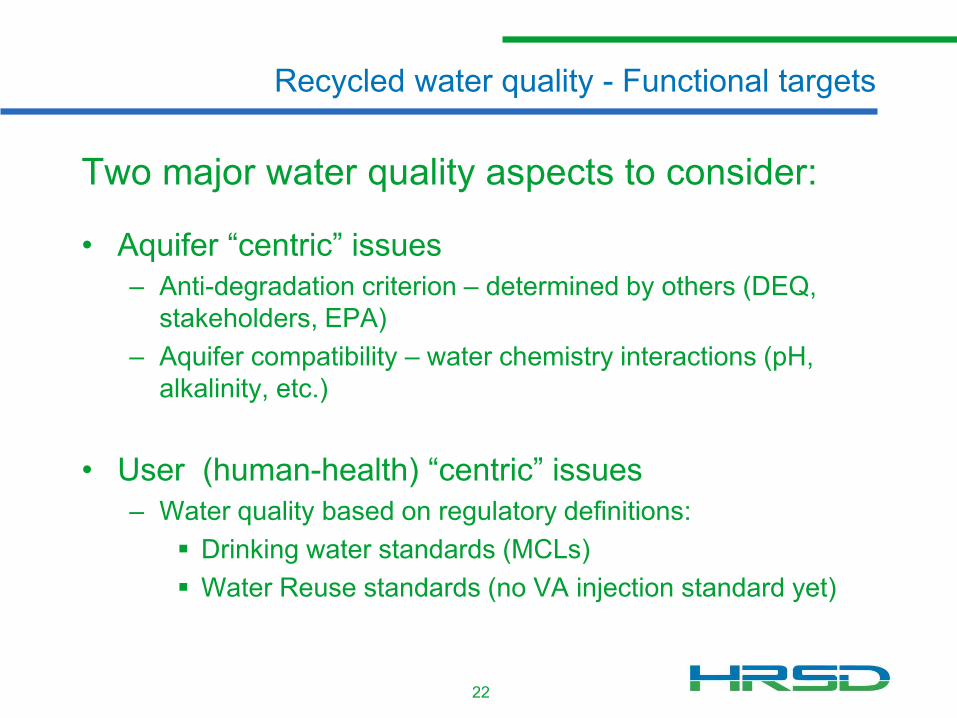
Two major water quality aspects to consider:
• Aquifer “centric” issues– Anti-degradation criterion – determined by others (DEQ,
stakeholders, EPA)– Aquifer compatibility – water chemistry interactions (pH,
alkalinity, etc.)
• User (human-health) “centric” issues– Water quality based on regulatory definitions:
Drinking water standards (MCLs) Water Reuse standards (no VA injection standard yet)
Recycled water quality - Functional targets
22

23
Advanced water treatment alternatives
Microfiltration Reverse Osmosis
UV AOP
Aquifer Injection
Existing Discharge
Chemical Precipitation
Sequencing Batch Reactor
(Nit/DeNit)
River Outfall
MF-RO-UVAOP
Microfiltration Nanofiltration
UV AOP
Aquifer Injection
Existing Discharge
Chemical Precipitation
River Outfall
MF-NF-UVAOP
Floc/Sed Ozone BAC GAC UV
Existing Discharge
Aquifer Injection
FLOC/SED-OZONE-BAC-GAC-UV
Reverse Osmosis
(RO)
Nanofiltration (NF)
Biologically-Active
Granular Activated
Carbon (BAC)/
Granular Activated
Carbon (GAC)

• Examples:– x
(Northern Virginia)
– Gwinnett County (Georgia)– Singapore NEWater
Water recycling - Surface water augmentation
24
WWTP AWTP
Reservoir
WTP

Water recycling - Groundwater recharge via direct injection
25
• Examples:– Groundwater Replenishment System (Orange County, CA)– West Basin (El Segundo, CA)– Los Alamitos (Long Beach, CA)– Scottsdale Water Campus (AZ)– Hueco Bolson (El Paso, TX)
WWTP AWTP
This is a form of Indirect Potable Reuse
+WTP

• Add advancedtreatment and treat toexceed drinking waterstandards
• Pump 120 MGD ofclean water into aquifer
• Effectively eliminatedaily discharges to:– James River– York River– Elizabeth River
Sustainable Water Recycling Proposal
26
Advanced
Water
Treatment

Cost for 20 MGD
27
$170M
$157M
$128M
$100M
$110M
$120M
$130M
$140M
$150M
$160M
$170M
$180M
RO Nano BAC/GAC
Capital Cost
RO
Nano
BAC/GAC
$7.2M
$6.4M
$3.5M
$0M
$1M
$2M
$3M
$4M
$5M
$6M
$7M
$8M
RO Nano BAC/GAC
Annual Operating and Maintenance (O&M) Cost
RO
Nano
BAC/GAC
27

• Total project in the $1 billion range (120 mgd)– For 6 or 7 plants (not CE or Atlantic)– York needs additional study to locate injection site
• Annual operating costs $21 - $43 M• Operating costs could be recovered with
reasonable permitted withdrawal fee– Provides incentive for permits without significant
reserves for potential future needs – right sized– Encourages conservation
Cost Summary
28
• Significantly reduced discharge into theChesapeake Bay (only during wet weather)– Creates source of nutrient allocation to support other
needs
– Increases available oyster grounds• Regulatory stability for treatment processes• Sustainable source for groundwater
replenishment– Supports water needs (today and future) throughout
Eastern Virginia without piping to specific locations(wireless solution)
• Potential reduction in the rate of land subsidence• Protection of groundwater from saltwater
contamination
Conclusion – Summary of Benefits
29

• No downstream low-flow issues from HRSDplants
• Daily capacity to make an impact on aquifer• Large regional political subdivision• Governor appointed Commissioners
– Commission has committed resources to continueto move toward implementation
• 20-year CIP forecast in excess of $4B– Can re-prioritize to include this project
HRSD Uniquely positioned
30
• Engage stakeholders• Model and quantify
– Impact on saltwater intrusion– Impact on land subsidence– Safe yield– Spatial analysis and travel time to existing withdrawals
• Additional geochemistry evaluation• Additional water treatment technology analysis
and evaluation – pilot-scale• Develop demonstration-scale project – advanced
treatment & aquifer injection (2-4 mgd)
Next steps
31

• Complete next phase of study with consultant by end of 2016• Room scale pilot projects – operating in May 2016• 2017
– Endorsement from DEQ/VDH to move forward– EVGWAC recommends recharge project– EPA agrees to integrated plan to meet CD requirements– Phase 3 WIP includes this project to achieve TMDL goals
• 2018– Demonstration pilot (2 year study)
• 2020– EPA/DEQ/VDH formally approves CTC for SWR
• 2020 to 2030– Construction through phased implementation
• 2030 Fully operational– 120 MGD of clean water put into the aquifer
Timeline
32

Future generations will inherit clean waterways
and be able to keep them clean.
Questions?
33