
SUSTAINABLE VALUE CREATION IN MANUFACTURING … THESIS... · María Holgado Granados. Supervisor:...
209
POLITECNICO DI MILANO DEPARTMENT OF MANAGEMENT, ECONOMICS AND INDUSTRIAL ENGINEERING DOCTORAL PROGRAMME IN MANAGEMENT, ECONOMICS AND INDUSTRIAL ENGINEERING XXVII CYCLE _ SUSTAINABLE VALUE CREATION IN MANUFACTURING THROUGH MAINTENANCE SERVICES Doctoral Dissertation of: María Holgado Granados Supervisor: Marco Macchi Tutor: Prof. Marco Garetti October 2014
Transcript of SUSTAINABLE VALUE CREATION IN MANUFACTURING … THESIS... · María Holgado Granados. Supervisor:...

POLITECNICO DI MILANO
DEPARTMENT OF MANAGEMENT, ECONOMICS AND INDUSTRIAL ENGINEERING DOCTORAL PROGRAMME IN MANAGEMENT, ECONOMICS AND INDUSTRIAL ENGINEERING
XXVII CYCLE
_
SUSTAINABLE VALUE CREATION IN MANUFACTURING
THROUGH MAINTENANCE SERVICES
Doctoral Dissertation of:
María Holgado Granados
Supervisor: Marco Macchi
Tutor: Prof. Marco Garetti
October 2014


ACKNOWLEDGEMENTS This PhD experience has been a very interesting learning process in many aspects. Many people have contributed to make it remarkable and unforgettable and I would like to thank all of them.
First of all, I would like to thank my research group at Politecnico di Milano for their support and contributions in ideas to this PhD thesis. I am very thankful to my tutor, Prof. Marco Garetti, and my supervisor, Marco Macchi, for giving me this great opportunity to learn and mature professionally. I would also like to deeply thank Dr. Luca Fumagalli for his support and encouragement during the whole journey, starting from the very first day I landed in Milan. I am very grateful to the younger researchers in the group - Klodian Farruku, Simone Pala, Federico Curcio, Irene Roda and Elisa Negri – for providing me with fruitful discussions on my work and many great coffee breaks!
My gratitude also goes to all the team of the Observatory on Technologies and Services for Maintenance (TeSeM) and the master students that have participated in every annual research work. Great results as those obtained in TeSeM Observatory were not have been possible without all your contributions.
Moreover, I feel very fortunate for having done two visiting periods during this PhD time. Getting to know how life and research works in two different countries and Universities has been a very fruitful experience both academically and personally.
I am very grateful to Prof. Jay Lee for welcoming me as a visitor in the Center for Intelligent Maintenance Systems (IMS) at the University of Cincinnati and to all his enthusiastic research group for hosting me and sharing their research experiences with me. This experience increased astonishingly my understanding of maintenance technologies and my skills on using chopsticks. Special thanks to Michael Lyons and Wenjing Jin who made my life much more comfortable from my first to my last day in Cincinnati.
I would like to express my sincere gratitude to Prof. Steve Evans for so many reasons. Firstly, for inviting me to join the PhD Cohort where I have met many outstanding PhD and postdocs researchers and had enjoyed stretching my brain to find a proper way to deal with PhD challenges. Secondly, for receiving me as a visitor in his research group in the Institute for Manufacturing (IfM) at the University of Cambridge and providing me with the perfect environment to concentrate during the last stage of my PhD. Thirdly, for his guidance and advice on thesis writing that made possible to get this document done on time and good shape.
I was also lucky to be writing down the PhD thesis at approximately the same time as Dr. Curie Park was writing hers. Her positive attitude and path forward were an additional source of motivation for me. I am very grateful to IfM PhD students and researchers for the great conversations, the amazing environment and the liquid buns on Friday evenings. Special thanks to Dr. Padmakshi Rana for providing me good advice at some critical points of my thesis work and as well as guidance for my time in Cambridge.
I have been also extremely lucky for having had the opportunity to work on the European project SustainValue during these years. It has been a great experience that gave me the opportunity to bring new perspectives into maintenance management and I have enormously enjoyed working within this international and interdisciplinary team. Many thanks to all the academic and industrial partners in SustainValue project, in particular to VTT and Teuvo Uusitalo, our project coordinator, for making it
i

happen. Special thanks to the usual suspects, Dr. Padmakshi Rana, Dr. Nicolas Sergent, Dr. Sam Short and Jakob Beer, for the great time and discussions on after work hours.
I would also like to thank the industrialists that have collaborated in my thesis with their knowledge and experience providing me with valuable data to make this PhD work happen. Many thanks to the participants on the exploratory case studies and the testing case study. Also I express my gratitude to the respondents of the survey on maintenance technologies. Special thanks to Luca Adorante that supported me during the testing case study, its good results are a reflection of his willingness to strive for excellence.
My gratitude also goes to the researchers from other Universities whom I have shared interesting discussions on research at different stages of my PhD journey. I have learnt from all conversations and you have contributed to improve my PhD work and influenced the way I think about research. I appreciate specially the conversations and feedback received during DIG Seminars and PhD workshops from Dr. Telli van der Lei, Dr. Rogelio Oliva, Dr. Veronica Martinez, Dr. Mario Rapaccini, Dr. Sergio Cavalieri and Paolo Gaiardelli.
I am also very grateful to Prof. Adolfo Crespo for giving me the opportunity to start working in the Department of Industrial Organization and Business Management at the University of Seville and get to know about research and academic life. Within his research group I owed special thanks to Dr. Juan Francisco Gómez who has always given me good advice and has been a great colleague.
I would like to extend my gratitude to all the PhD students at Department of Management, Economics and Industrial Engineering that I met during these years for their friendship and enjoyable moments spent at doctoral courses and seminars, conferences and workshops, during all these years. Many thanks to all of them, especially to Monica Rossi, Ali Mohammadi, Keivan Aghasi, Mahnoosh Zebardast, Endris Kerga, Golboo Pourabdollahian, Borzoo Pourabdollahian, Gökan May, Bojan Stahl and Mohammad Reza Heydari.
This PhD brought me to live in different countries where I had the opportunity to know amazing people. My life in the last years would not have been the same without my new friends in Milan, Cincinnati and Cambridge. Many thanks to you all!
My parents, Antonio and Maria, deserve recognition for their support and patience during all my studying years, especially in the last years when I have been moving around between countries and not always being available to come to visit them as often as we all would like; my deepest gratitude to both of them.
Last but not least, I would like to deeply thank my partner for being a great support in the difficult moments and an amazing company in the joyful times. Keivan, you know I could not have survived nor finished this PhD without having you by my side. Despite the geographical distance and the differences in time zones of some periods, many thanks for always being there!
ii

TABLE OF CONTENTS Acknowledgements ........................................................................................................................................................................ i
ABSTRACT ...................................................................................................................................................................................... vii
List of Figures............................................................................................................................................................................... viii
List of Tables ................................................................................................................................................................................... ix
List of abbreviations ................................................................................................................................................................ ..... x
1. INTRODUCTION .................................................................................................................................................................... 1
1.1. BACKGROUND .................................................................................................................................................................... 1
1.1.1. Sustainability .............................................................................................................................................................. 1
1.1.2. Servitization ................................................................................................................................................................ 3
1.1.3. Value .............................................................................................................................................................................. 5
1.2. PROBLEM STATEMENT AND MOTIVATION .......................................................................................................... 8
1.3. THESIS STRUCTURE ..................................................................................................................................................... 10
PART I. RESEARCH PROJECT DESIGN & STATE OF THE ART .................................................................................. 11
2. RESEARCH DESIGN ........................................................................................................................................................... 13
2.1. RESEARCH OBJECTIVE AND RESEARCH QUESTIONS .................................................................................... 13
2.2. RESEARCH METHODOLOGY ...................................................................................................................................... 14
2.2.1. Overview of the research project .................................................................................................................... 14
2.2.2. Literature & Theory Understanding Phase ................................................................................................. 15
2.2.3. Exploratory Phase ................................................................................................................................................. 18
2.2.4. Explanatory Phase ................................................................................................................................................. 24
2.2.5. Development Phase .............................................................................................................................................. 27
2.2.6. Testing Phase .......................................................................................................................................................... 30
3. LITERATURE REVIEW & CURRENT PRACTICE ON MAINTENANCE SERVICES IN ITALY .................. 33
3.1. INTERNATIONAL STATE OF THE ART ON INDUSTRIAL MAINTENANCE ............................................. 33
3.1.1. Industrial Maintenance: Definition & Scope ............................................................................................... 33
3.1.2. Maintenance Management ................................................................................................................................. 34
3.1.3. Methods & Tools in Maintenance .................................................................................................................... 36
3.1.4. Maintenance Outsourcing .................................................................................................................................. 38
3.1.5. Maintenance Performance Measurement ................................................................................................... 39
3.2. INDUSTRIAL MAINTENANCE WITHIN SUSTAINABLE MANUFACTURING ........................................... 42
3.2.1. International State of the Art on sustainable manufacturing .............................................................. 42
3.2.2. Maintenance envisaged role for sustainable manufacturing .............................................................. 45
3.2.3. Sustainability performance measurement in manufacturing ............................................................. 47
3.3. INDUSTRIAL MAINTENANCE WITHIN SERVITIZATION ............................................................................... 48
iii

3.3.1. International State of the Art on servitization & PSS .............................................................................. 48
3.3.2. Maintenance envisaged role for servitization ........................................................................................... 51
3.3.3. Industrial services performance measurement ........................................................................................ 53
3.4. CURRENT PRACTICE ON MAINTENANCE SERVICES IN ITALY .................................................................. 55
3.4.1. Brief overview of the manufacturing industry in Italy .......................................................................... 55
3.4.2.Acquisition of maintenance services: target area and motivations ................................................... 57
3.4.3. Maintenance services acquired: contract types and requirements .................................................. 60
3.4.5. Outsourcing strategy & main outsourced activities ................................................................................ 62
3.5. SUMMARY OF MAIN FINDINGS & GAPS IDENTIFICATION .......................................................................... 64
3.5.1. Research Gaps ......................................................................................................................................................... 65
3.5.2. Research Practice Gap ......................................................................................................................................... 65
PART II. RESEARCH FINDINGS & CONTRIBUTIONS ..................................................................................................... 67
4. UNDERSTANDING MAINTENANCE CONTRIBUTION TO SUSTAINABLE MANUFACTURING ........... 69
4.1. OVERVIEW OF CASE STUDIES .................................................................................................................................. 69
4.2. FINDINGS OF THE CASE STUDIES........................................................................................................................... 74
4.2.1. Findings related to the connection with company’s vision and goals ............................................. 74
4.2.2. Findings related to the economic dimension ............................................................................................. 80
4.2.3. Findings related to the environmental dimension .................................................................................. 83
4.2.4. Findings related to the social dimension ..................................................................................................... 86
4.3. DISCUSSION & FRAMEWORK FOR MAINTENANCE VALUE ........................................................................ 89
5. THE MAINTENANCE BUSINESS MODEL AS A DRIVER FOR VALUE CREATION ..................................... 92
5.1. BACKGROUND ON BUSINESS MODEL LITERATURE ...................................................................................... 92
5.2. THE MAINTENANCE BUSINESS MODEL CONCEPT ......................................................................................... 94
5.2.1. Definition of the Maintenance Business Model ......................................................................................... 94
5.2.2. The Maintenance Business Model as part of a maintenance management framework ........... 96
5.3. PROPOSAL OF CATEGORIZATION WITHIN THE MBM ELEMENTS .......................................................... 97
5.4. DISCUSSION ....................................................................................................................................................................103
6. TECHNOLOGY-BASED MAINTENANCE SERVICES: COMPOSITION & VALUE ANALYSIS ..................105
6.1. TECHNOLOGICAL COMPOSITION OF TECHNOLOGY-BASED MAINTENANCE SERVICES .............105
6.1.1. Categorization of the baseline infrastructure level ...............................................................................106
6.1.2. Categorization of the innovative tools & applications level ...............................................................108
6.2. REVIEW ON INNOVATIVE TOOLS & APPLICATIONS ....................................................................................110
6.3. VALUE ANALYSIS METHOD: APPLICATION TO INNOVATIVE TOOLS & APPLICATIONS .............113
6.3.1. The value analysis method ..............................................................................................................................113
6.3.2. Results ......................................................................................................................................................................115
6.4. DISCUSSION & POTENTIAL USES OF THE VALUE ANALYSIS METHOD ...............................................120 iv

7. PROPOSAL OF A VALUE-DRIVEN DESIGN METHODOLOGY FOR PERFORMANCE-BASED MAINTENANCE SERVICES .....................................................................................................................................................122
7.1. RATIONALE ....................................................................................................................................................................122
7.1.1. Value-driven approach ......................................................................................................................................122
7.1.2. Purpose of the value-driven methodology ................................................................................................123
7.2. STEP-WISE DESCRIPTION OF THE VALUE-DRIVEN METHODOLOGY ..................................................124
7.2.1.Overview of the value-driven design methodology ...............................................................................124
7.2.2. Step I: Equipment & Process Analysis ........................................................................................................124
7.2.3. Step II: Value Analysis .......................................................................................................................................126
7.2.4. Step III: Service solution definition ..............................................................................................................130
7.3. DISCUSSION ....................................................................................................................................................................135
8. VALUE-DRIVEN DESIGN METHODOLOGY: CASE STUDY ................................................................................136
8.1. CASE STUDY OVERVIEW ...........................................................................................................................................136
8.1.1. Service provider profile ....................................................................................................................................136
8.1.2. Industrial user profile ........................................................................................................................................137
8.2. APPLICATION OF THE VALUE-DRIVEN METHODOLOGY ...........................................................................138
8.2.1. Application of step I: Equipment & Process Analysis ...........................................................................138
8.2.2. Application of step II: Value Analysis ..........................................................................................................141
8.2.3. Application of step III: Service Solution Definition ...............................................................................147
8.3. DISCUSSION & LESSONS LEARNT .........................................................................................................................153
9. CONCLUSIONS ................................................................................................................................................................ ...155
9.1. CONTRIBUTION TO KNOWLEDGE ........................................................................................................................155
9.2. IMPLICATIONS FOR PRACTITIONERS ................................................................................................................157
9.3. LIMITATIONS .................................................................................................................................................................159
9.4. OPPORTUNITIES & LINES FOR FUTURE RESEARCH ....................................................................................160
REFERENCES ...............................................................................................................................................................................162
APPENDIXES ...............................................................................................................................................................................180
APPENDIX A. List of publications ..................................................................................................................................181
APPENDIX B. List of selected articles – Literature review on sustainable manufacturing ....................182
APPENDIX C. Questionnaire for the semi-structured interviews .....................................................................183
APPENDIX D. Survey on technologies for maintenance service provision ...................................................187
APPENDIX E. Summary of the AHP results for the three interviewees .........................................................193
APPENDIX F. Calculation of the value scores for direct and indirect maintenance activities ..............196
v

vi
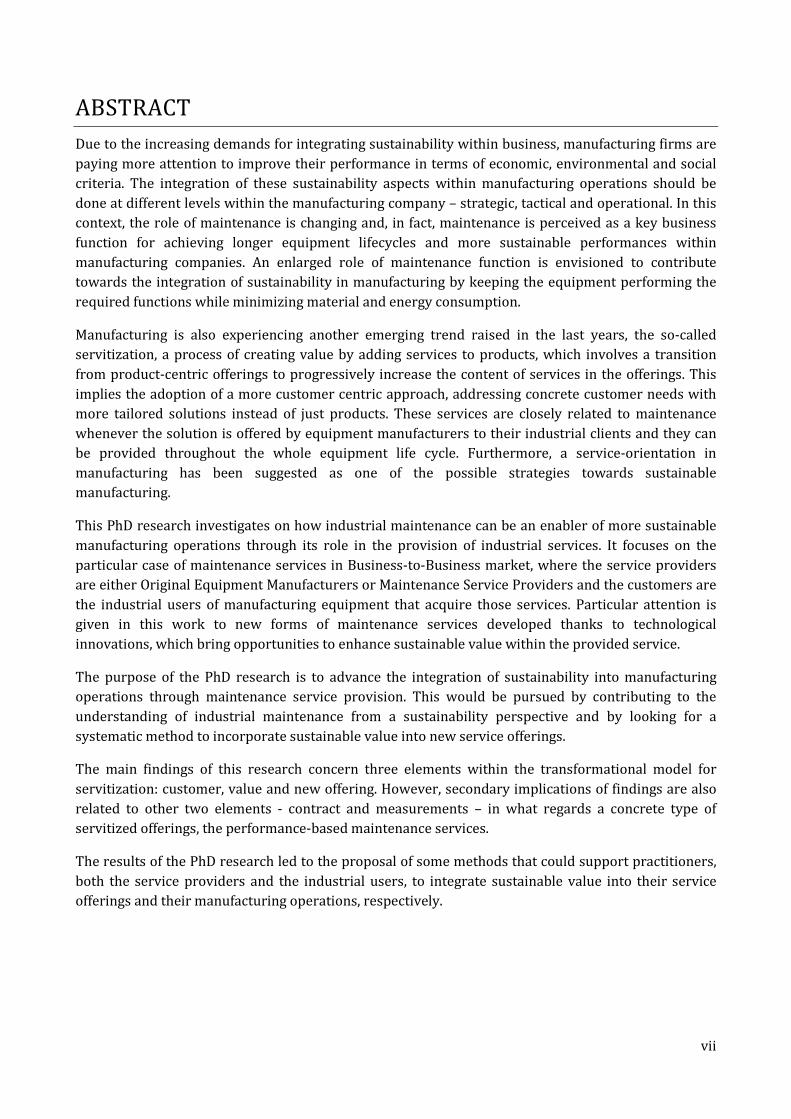
ABSTRACT Due to the increasing demands for integrating sustainability within business, manufacturing firms are paying more attention to improve their performance in terms of economic, environmental and social criteria. The integration of these sustainability aspects within manufacturing operations should be done at different levels within the manufacturing company – strategic, tactical and operational. In this context, the role of maintenance is changing and, in fact, maintenance is perceived as a key business function for achieving longer equipment lifecycles and more sustainable performances within manufacturing companies. An enlarged role of maintenance function is envisioned to contribute towards the integration of sustainability in manufacturing by keeping the equipment performing the required functions while minimizing material and energy consumption.
Manufacturing is also experiencing another emerging trend raised in the last years, the so-called servitization, a process of creating value by adding services to products, which involves a transition from product-centric offerings to progressively increase the content of services in the offerings. This implies the adoption of a more customer centric approach, addressing concrete customer needs with more tailored solutions instead of just products. These services are closely related to maintenance whenever the solution is offered by equipment manufacturers to their industrial clients and they can be provided throughout the whole equipment life cycle. Furthermore, a service-orientation in manufacturing has been suggested as one of the possible strategies towards sustainable manufacturing.
This PhD research investigates on how industrial maintenance can be an enabler of more sustainable manufacturing operations through its role in the provision of industrial services. It focuses on the particular case of maintenance services in Business-to-Business market, where the service providers are either Original Equipment Manufacturers or Maintenance Service Providers and the customers are the industrial users of manufacturing equipment that acquire those services. Particular attention is given in this work to new forms of maintenance services developed thanks to technological innovations, which bring opportunities to enhance sustainable value within the provided service.
The purpose of the PhD research is to advance the integration of sustainability into manufacturing operations through maintenance service provision. This would be pursued by contributing to the understanding of industrial maintenance from a sustainability perspective and by looking for a systematic method to incorporate sustainable value into new service offerings.
The main findings of this research concern three elements within the transformational model for servitization: customer, value and new offering. However, secondary implications of findings are also related to other two elements - contract and measurements – in what regards a concrete type of servitized offerings, the performance-based maintenance services.
The results of the PhD research led to the proposal of some methods that could support practitioners, both the service providers and the industrial users, to integrate sustainable value into their service offerings and their manufacturing operations, respectively.
vii

LIST OF FIGURES Figure 1.1. Sustainability pillars (adapted from The World Conservation Union, 2006) ..................................................... 2 Figure 1.2. The planetary boundaries defined by Rockstrom et al. (2009) ......................................................................... 2 Figure 1.3. Dimensions within the sustainability pillars identified by Arena et al. (2009) .................................................. 2 Figure 1.4. Transformation model for servitization (Vladimirova et al., 2011)................................................................... 4 Figure 1.5. The profile of service offered: comparison between 2007 and 2009 (Neely, 2011) .......................................... 5 Figure 1.6. Elements of the Value Framework (adapted from Den Ouden, 2012) .............................................................. 7 Figure 1.7. The Sustainable Value Framework (Hart and Milstein, 2003) .......................................................................... 7 Figure 1.8. Thesis structure ............................................................................................................................................... 10 Figure 2.1. Overview of project phases and research methods ........................................................................................ 15 Figure 2.2. Distribution of industrial sectors within the sample ....................................................................................... 20 Figure 2.3. Distribution of countries of survey respondents’ institutions ......................................................................... 26 Figure 2.4. Confidence level stated by survey respondents .............................................................................................. 26 Figure 2.5. Components of an IDEF0 representation ........................................................................................................ 28 Figure 2.6. IDEF0 representation of the context diagram for a PBMS system .................................................................. 28 Figure 2.7. IDEF0 representation of the functional decomposition of tasks within a PBMS system ................................. 29 Figure 3.1. Maintenance objectives along the equipment life cycle (Levrat et al., 2008) ................................................. 34 Figure 3.2. Main elements within the dimensions of sustainable manufacturing in the selected articles ....................... 44 Figure 3.3. Product-service continuum (Oliva and Kallenberg, 2003) ............................................................................... 49 Figure 3.4. Value elements for customers according to Ali-Marttila et al. (2013) ............................................................ 52 Figure 3.5. Classification scheme for performance indicators in industrial services (adapted from Meier et al., 2013) .. 54 Figure 3.6, Overview of manufacturing sectors in Italy ................................................................................................... 56 Figure 3.7. Distribution of sectors in manufacturing industry in Italy .............................................................................. 56 Figure 3.8. Density rate in each sector in manufacturing industry in Italy ....................................................................... 57 Figure 3.9. Distribution of maintenance service providers by target area ........................................................................ 57 Figure 3.10. Distribution by sectors of maintenance service providers in production areas ............................................ 58 Figure 3.11. Distribution by company size of maintenance service providers in production areas .................................. 58 Figure 3.12. Percentage of selection of motivations (either alone or combined) for each industrial sector .................... 60 Figure 3.13. Distribution of contract types in each industrial sector ................................................................................ 61 Figure 3.14. Average number of each type of contracts acquired by sample sectors ...................................................... 61 Figure 3.15. Distribution by size and sector of the companies with outsourcing strategy in the sample ......................... 63 Figure 3.16. Frequency that different types of activities are given in outsourcing in the sample .................................... 63 Figure 3.17. Maintenance engineering activities performed internally, externally or both ............................................. 64 Figure 3.18. Techniques for condition monitoring done internally, externally or both ..................................................... 64 Figure 4.1. Framework for maintenance value within sustainable manufacturing .......................................................... 89 Figure 5.1. The MBM canvas (derived by the business model canvas developed by Osterwalder and Pigneur, 2010) .... 96 Figure 5.2. Proposed maintenance management framework based on findings from business literature ...................... 96 Figure 5.3. Example of maintenance stakeholders taken from the case study in Company C .......................................... 99 Figure 5.4. Example of possible choices in the MBM for maintenance value contributing to delivery punctuality ........ 104 Figure 6.1. Technological levels in the composition of smart maintenance services ...................................................... 105 Figure 6.2. Categories identified within the technological levels .................................................................................... 106 Figure 6.3. Percentage of use for baseline technologies in tool categories. ................................................................... 111 Figure 6.4. Citation of baseline technologies for tool categories in the first group ........................................................ 111 Figure 6.5. Citation of baseline technologies for tool categories in the second group ................................................... 112 Figure 6.6. Distribution of baseline technologies for inspection, diagnosis and prognosis tools .................................... 113 Figure 6.7. Overall scores obtained by each tool categories .......................................................................................... 116 Figure 6.8. Radar charts of the four tool categories obtaining higher overall score ...................................................... 118 Figure 6.9. Radar charts of the six tool categories obtaining lower overall score .......................................................... 119 Figure 6.10. Example of the comparative use of the value analysis method considering several tool categories ......... 120
viii

Figure 6.11. Example of the use of the value analysis method for the assessment of a complete solution ................... 121 Figure 7.1. Value-driven design methodology: steps ...................................................................................................... 124 Figure 7.2. Sustainable Value Tree for operational values in maintenance services ...................................................... 127 Figure 7.3. Overview of the rating AHP structure ........................................................................................................... 128 Figure 8.1. AHP model using SuperDecisions software ................................................................................................... 143 Figure 8.2. Example of pairwise comparisons with SuperDecisions software ................................................................ 143 Figure 8.3. Value scores obtained in the rating AHP for all machine groups .................................................................. 144 Figure 8.4. Value scores for direct and indirect activities in each service solution alternative ....................................... 152 Figure 8.5. Total value scores for the six service solution alternatives ........................................................................... 152
LIST OF TABLES Table 2.1. Search results regarding the connection between maintenance and eco-efficiency dimensions .................... 17 Table 2.2. Characteristics of the companies selected for the exploratory case research. ................................................ 22 Table 2.3. Sources of evidence in the exploratory case studies ........................................................................................ 23 Table 2.4. Sources of evidence used during the testing case ............................................................................................ 31 Table 3.1. Functionalities within each pillar proposed by Crespo Márquez and Gupta (2006)......................................... 35 Table 3.2. Categories of e-maintenance capabilities identified by Muller et al. (2008) ................................................... 36 Table 3.3. Categories for maintenance performance indicators....................................................................................... 40 Table 3.4. Leading performance indicators for maintenance proposed by Muchiri et al. (2011) ..................................... 41 Table 3.5. Lagging performance indicators for maintenance proposed by Muchiri et al. (2011) ..................................... 42 Table 3.6. Definitions of sustainable manufacturing in the selected articles ................................................................... 43 Table 3.7. Findings on value propositions of equipment-based services from Smith et al. (2012) ................................... 51 Table 3.8. Examples of performance measures for field service (Finke et al., 2012) ........................................................ 54 Table 3.9. Average and maximum number of service providers per company in the sample .......................................... 58 Table 3.10. Motivations for the acquisition of maintenance services............................................................................... 59 Table 3.11. Requirements for each type of maintenance contract ................................................................................... 62 Table 4.1. Overview of the strategic perspective regarding the nine case studies ........................................................... 76 Table 4.2. Maintenance contribution at equipment level according to case study findings ............................................ 90 Table 4.3. Maintenance contribution at process level according to case study findings .................................................. 90 Table 5.1. Selected list of business model definitions ....................................................................................................... 93 Table 6.1. Functionalities suggested for each category of innovative tools & applications ........................................... 110 Table 6.2. Likert-type scale used in the value analysis method ...................................................................................... 114 Table 6.3. Total score obtained in each value dimension by each tool category ............................................................ 116 Table 6.4. Frequency of “Indifferent / No knowledge” score for each tool categories and value dimension ................. 117 Table 7.1. Guiding questions for strategic and operational context overview ............................................................... 125 Table 7.2. Guiding questions for target entity context understanding ........................................................................... 126 Table 7.3. Priority scores to be used for the pairwise comparisons in the AHP .............................................................. 128 Table 7.4. Value-driven FMEA ......................................................................................................................................... 130 Table 7.5. Example of table for connection analysis between direct and indirect maintenance activities ..................... 132 Table 7.6. Table for calculating the value score of direct maintenance activities in a service offering alternative ....... 132 Table 7.7. Table for calculating the value score of indirect maintenance activities in a service offering alternative .... 133 Table 7.8. List of suggested performance measures for operational values related to production processes ............... 134 Table 7.9. List of suggested performance measures for operational values related to production equipment ............. 135 Table 8.1. Selected list of machine groups with the production areas ........................................................................... 140 Table 8.2. Operational values selected to be considered for each machine group ......................................................... 142 Table 8.3. Value-driven FMEA applied to the testing case ............................................................................................. 146 Table 8.4. Portfolio analysis for direct maintenance activities available to be applied in the service solution .............. 147
ix
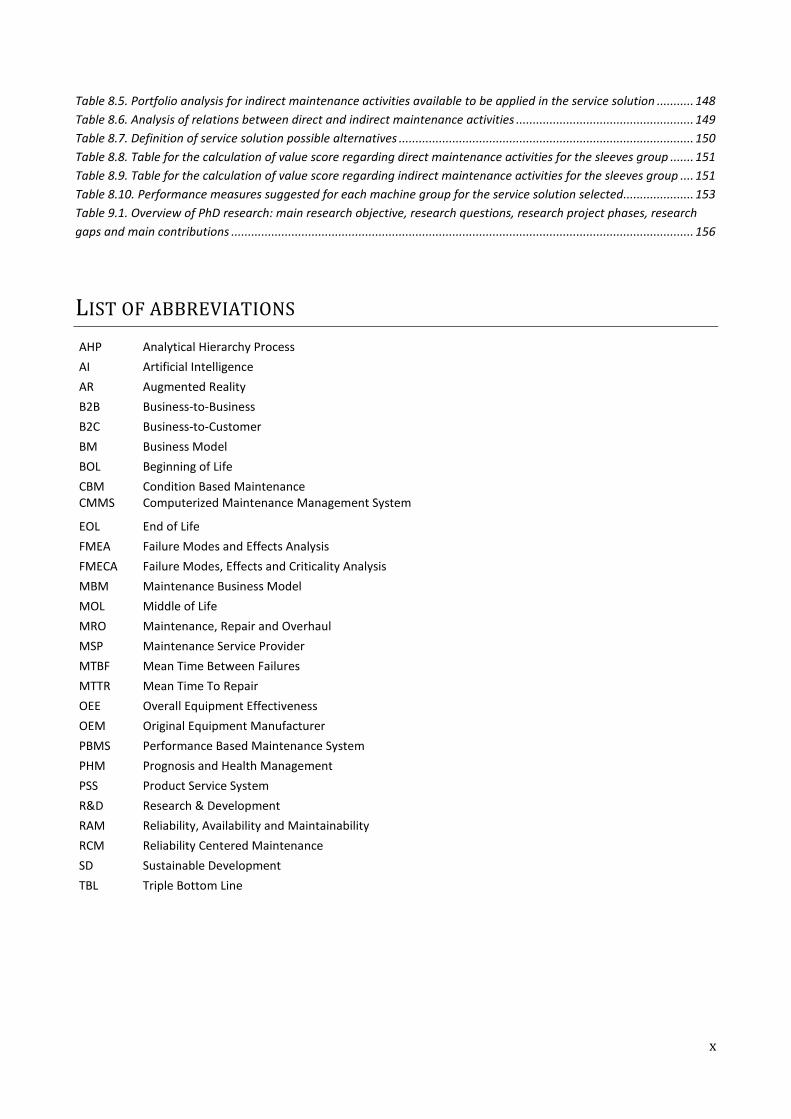
Table 8.5. Portfolio analysis for indirect maintenance activities available to be applied in the service solution ........... 148 Table 8.6. Analysis of relations between direct and indirect maintenance activities ..................................................... 149 Table 8.7. Definition of service solution possible alternatives ........................................................................................ 150 Table 8.8. Table for the calculation of value score regarding direct maintenance activities for the sleeves group ....... 151 Table 8.9. Table for the calculation of value score regarding indirect maintenance activities for the sleeves group .... 151 Table 8.10. Performance measures suggested for each machine group for the service solution selected ..................... 153 Table 9.1. Overview of PhD research: main research objective, research questions, research project phases, research gaps and main contributions .......................................................................................................................................... 156
LIST OF ABBREVIATIONS AHP Analytical Hierarchy Process AI Artificial Intelligence AR Augmented Reality B2B Business-to-Business B2C Business-to-Customer BM Business Model BOL Beginning of Life CBM Condition Based Maintenance CMMS Computerized Maintenance Management System
EOL End of Life FMEA Failure Modes and Effects Analysis FMECA Failure Modes, Effects and Criticality Analysis MBM Maintenance Business Model MOL Middle of Life MRO Maintenance, Repair and Overhaul MSP Maintenance Service Provider MTBF Mean Time Between Failures MTTR Mean Time To Repair OEE Overall Equipment Effectiveness OEM Original Equipment Manufacturer PBMS Performance Based Maintenance System PHM Prognosis and Health Management PSS Product Service System R&D Research & Development RAM Reliability, Availability and Maintainability RCM Reliability Centered Maintenance SD Sustainable Development TBL Triple Bottom Line
x

1. INTRODUCTION This first chapter introduces the main concepts taken as a background for this PhD research as well as the motivations and the overall problem that this research is addressing. The last section of the chapter presents the structure of the document as a guide along all chapters included herein.
1.1. BACKGROUND The main bodies of knowledge considered in this PhD research are sustainability, servitization and maintenance. The first two broad bodies of knowledge are introduced in this section, together with a brief review of the concepts of value and value creation, as the linking notion between the three main bodies of knowledge. First insights into the connection of maintenance to sustainability and servitization would be later introduced in next section 1.2 as part of the problem statement.
Thus, this section settles the basis knowledge that supports the understanding of the problem addressed in this PhD research and the interconnections between sustainability, servitization and maintenance under the viewpoint of value creation.
1.1.1. SUSTAINABILITY The concept of sustainable development (SD) first came out in 1987 as “development that meets the need of the present, without compromising the ability of future generations to meet their own needs” (Brundtland Commission, 1987). The publication of Changing Course by the Business Council for Sustainable Development (Schmidheiny, 1992) states the business interest and provides an extensive analysis of how the business community can adapt and contribute to the crucial goal of sustainable development. Since then, sustainability has been identified as one of the key factors of future competitiveness and business survival (Porter and van der Linde, 1995; Magretta, 1997; Elkington, 1997; Hart & Milstein, 2003) and hundreds of concepts and definitions have been proposed referring to a more humane, more ethical and more transparent way of doing business (van Marrewijk, 2003).
According to Barlow (2004), the concept of SD spans the aspects of business operations under the three headings of environmental, economic and social sustainability. Although there are several interpretations of the key issues of sustainability, environmental, social, and economic aspects are usually known as the three pillars of sustainability, as shown in Figure 1.1. Campbell (1996) stated that these three priorities resulted in three conflicts: “(i) Grow the economy, (ii) distribute the growth fairly, and (iii) in the process do not degrade the ecosystem”.
In this regard, a new approach to global sustainability has been proposed by Rockstrom et al. (2009) by defining nine planetary boundaries within which business operations could be performed safely, i.e. without major human-induced environmental change on a global scale (Figure 1.2).
1
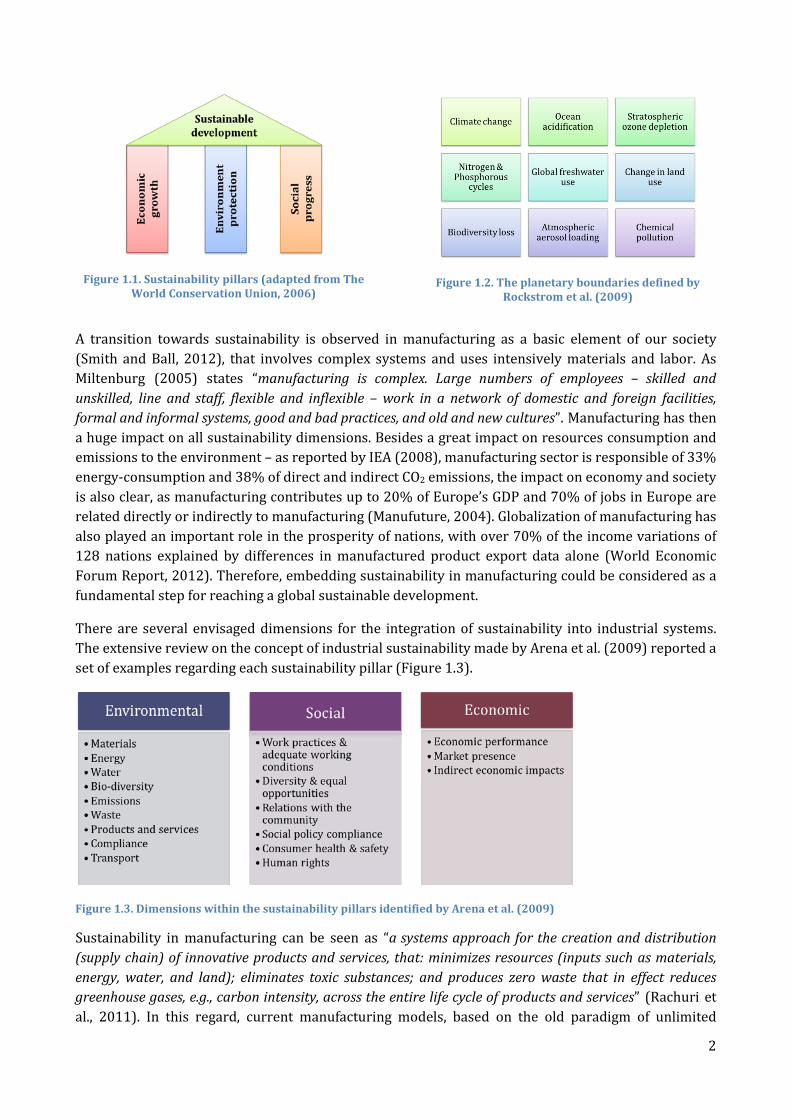
Figure 1.1. Sustainability pillars (adapted from The World Conservation Union, 2006)
Figure 1.2. The planetary boundaries defined by Rockstrom et al. (2009)
A transition towards sustainability is observed in manufacturing as a basic element of our society (Smith and Ball, 2012), that involves complex systems and uses intensively materials and labor. As Miltenburg (2005) states “manufacturing is complex. Large numbers of employees – skilled and unskilled, line and staff, flexible and inflexible – work in a network of domestic and foreign facilities, formal and informal systems, good and bad practices, and old and new cultures”. Manufacturing has then a huge impact on all sustainability dimensions. Besides a great impact on resources consumption and emissions to the environment – as reported by IEA (2008), manufacturing sector is responsible of 33% energy-consumption and 38% of direct and indirect CO2 emissions, the impact on economy and society is also clear, as manufacturing contributes up to 20% of Europe’s GDP and 70% of jobs in Europe are related directly or indirectly to manufacturing (Manufuture, 2004). Globalization of manufacturing has also played an important role in the prosperity of nations, with over 70% of the income variations of 128 nations explained by differences in manufactured product export data alone (World Economic Forum Report, 2012). Therefore, embedding sustainability in manufacturing could be considered as a fundamental step for reaching a global sustainable development.
There are several envisaged dimensions for the integration of sustainability into industrial systems. The extensive review on the concept of industrial sustainability made by Arena et al. (2009) reported a set of examples regarding each sustainability pillar (Figure 1.3).
Figure 1.3. Dimensions within the sustainability pillars identified by Arena et al. (2009)
Sustainability in manufacturing can be seen as “a systems approach for the creation and distribution (supply chain) of innovative products and services, that: minimizes resources (inputs such as materials, energy, water, and land); eliminates toxic substances; and produces zero waste that in effect reduces greenhouse gases, e.g., carbon intensity, across the entire life cycle of products and services” (Rachuri et al., 2011). In this regard, current manufacturing models, based on the old paradigm of unlimited
2
resources and capacity for regeneration, need to be updated for sustainable manufacturing (Garetti and Taisch, 2012). Seliger et al. (2008) propose three strategies for sustainable manufacturing:
1) The implementation of innovative technologies, which are evaluated according to sustainable manufacturing and are used for resource-saving applications
2) The improvement of use-intensity of products, by increasing the utilization ratio of a product and its components. Within this strategy they consider two approaches: service-oriented business models and distributed use of products and components
3) The extension of product life span, which can be achieved by expanding the use phase or by the realization of multiple use phases.
1.1.2. SERVITIZATION The servitization of business was first defined by Vandermerwe and Rada (1988) as a global trend happening in all industries that puts services into business strategic mission and corporate planning and gives services a lead role within their new market packages or integrated bundles. This is then realized by providing specialist services around products, selling their knowhow and setting up special companies and units for new service activities. This trend has been followed by manufacturing companies, as discussed first by Wise and Baumgartner (1999). Since then, the concept of servitization in manufacturing has been covered in a wide range of topics related to the integration of products and services, such as service business expansion, solutions provision, after-sale marketing and service profitability (Baines et al., 2009). Several competitive factors has been highlighted for this new service-oriented model of manufacturing such as capability for continuous innovation, improved design and quality and more customized products (Mont, 2002). As mentioned in previous section, Seliger et al. (2008) consider service-oriented business models as contributors for sustainability in manufacturing. Other authors has supported this connection between servitization and sustainability regarding two concepts: (i) dematerialization, by intensifying service and knowledge contents in all stages of product life cycle (Tomiyama, 2001); (ii) functional economy, by shifting towards a performance driven orientation where customer pays for the utilization of the product or the function provided (Mont, 2002).
Servitization frequently occurs due to three types of drivers (Baines et al, 2009; Oliva and Kallenberg, 2003): financial (e.g. revenue stream and profit margin); strategic (e.g. competitive opportunities and advantage); and marketing drivers (e.g. customer relationships and product differentiation). The transformation of manufacturers towards service providers has been studied in literature in order to understand the process itself, i.e. which are the transformational steps, and the challenges associated to this process. In this regard, Morelli (2006) states that the production function considers product characteristics such as dimensions and mechanical phenomena but incorporating services requires considerations for new characteristics such as time and interaction. Timescale has been highlighted by Neely (2008) as one of the main challenges of servitization, as manufacturers would enter into long-term partnerships that imply a new mindset regarding cost and profitability as well as risk control. However, the variety of challenges and their nature is manifold. For example, Brax (2005) proposed a set of six challenges that a manufacturer faces when becoming a service provider:
1) The marketing challenge involves problems that are rooted in the manufacturer’s prevailing marketing practices.
2) The production challenge regards the needs of information regarding their installed base, as well as operation and maintenance data from the customer.
3

3) The delivery challenge involves cultural problems and challenges based on bad timing as well as lack of adequate staff training.
4) The product-design challenge comes from the unsophisticated design of the offering which creates problems in its use and arises problems of usability and compatibility of support systems.
5) The communication challenges concern the lack of stablished processes to obtain and utilize feedback from their customers.
6) The relationship challenge consists of the problems arising from the nature of the relationship between the provider and its customers.
Another study on challenges done by Vladimirova et al. (2011) has gone one step further and taking the challenges identified as intermediate results, they have identified nine elements of change in the transformation model for servitization that are grouped in three dimensions – network, organization and processes - as illustrated in Figure 1.4.
Figure 1.4. Transformation model for servitization (Vladimirova et al., 2011)
The global trends of servitization in manufacturing has been studied by Neely (2011) by looking at three separate time periods - 2007, 2009 and 2011. The first study published by Neely (2008) included data from 2007 and revealed some interesting evidence on the scale of servitization (which was 30% meaning that 30% of firms with manufacturing SIC codes also offer services) the range of services offered by manufacturing firms (12 different types of service, including: consulting services; design and development services; financial services; installation and implementation services; leasing services; maintenance and support services; outsourcing and operating services; procurement services; property and real estate; retail and distribution services; systems and solutions; and transportation and trucking services) and the extent of servitization in different countries (e.g. 58% of US manufacturers while with less than 1% of Chinese manufacturers had servitized in 2007). The update of the study (Neely, 2011) indicates that the scale of servitization has not changed significantly and remains around 30%. Similar results were found regarding the types of services offered by manufacturing companies, where the most common services offered remained the same, though their order has slightly changed. As illustrated in Figure 1.5, the most common type of services offered are systems and solutions services, followed by design and development, maintenance and support and retail and distribution services. These four types of services offered are by far the most frequently offered types of services, when compared with the rest of services. Regarding the diffusion of
4
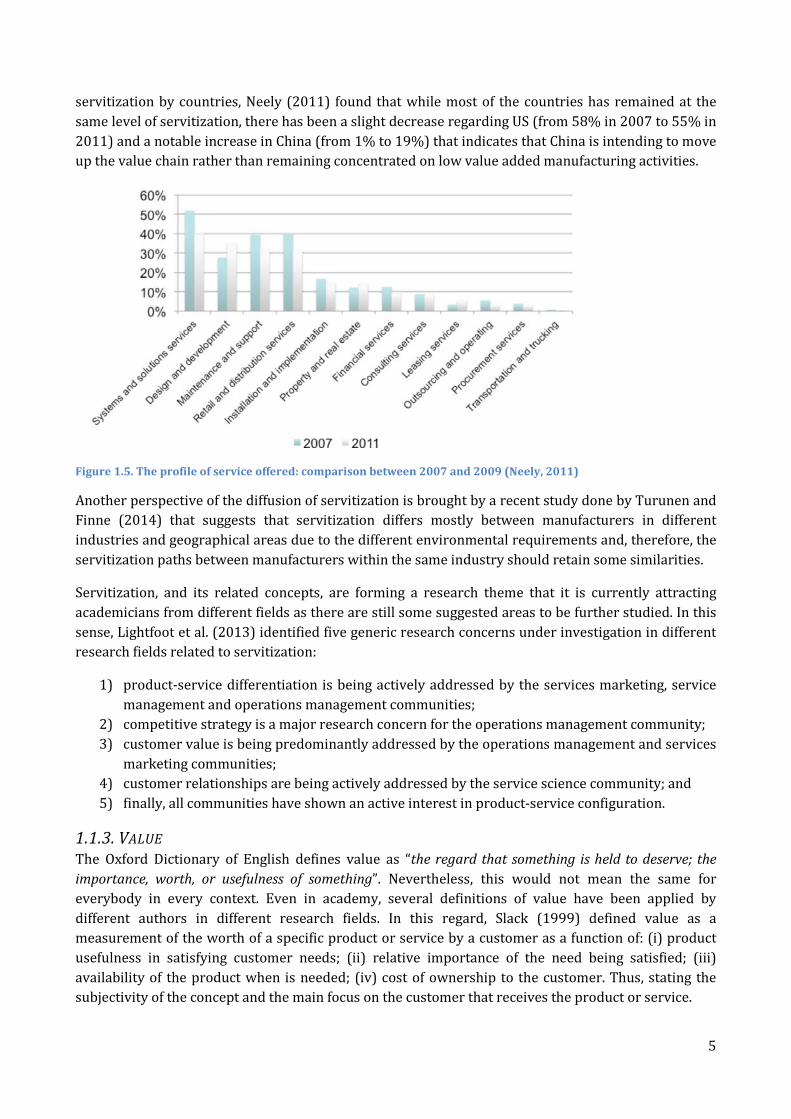
servitization by countries, Neely (2011) found that while most of the countries has remained at the same level of servitization, there has been a slight decrease regarding US (from 58% in 2007 to 55% in 2011) and a notable increase in China (from 1% to 19%) that indicates that China is intending to move up the value chain rather than remaining concentrated on low value added manufacturing activities.
Figure 1.5. The profile of service offered: comparison between 2007 and 2009 (Neely, 2011)
Another perspective of the diffusion of servitization is brought by a recent study done by Turunen and Finne (2014) that suggests that servitization differs mostly between manufacturers in different industries and geographical areas due to the different environmental requirements and, therefore, the servitization paths between manufacturers within the same industry should retain some similarities.
Servitization, and its related concepts, are forming a research theme that it is currently attracting academicians from different fields as there are still some suggested areas to be further studied. In this sense, Lightfoot et al. (2013) identified five generic research concerns under investigation in different research fields related to servitization:
1) product-service differentiation is being actively addressed by the services marketing, service management and operations management communities;
2) competitive strategy is a major research concern for the operations management community; 3) customer value is being predominantly addressed by the operations management and services
marketing communities; 4) customer relationships are being actively addressed by the service science community; and 5) finally, all communities have shown an active interest in product-service configuration.
1.1.3. VALUE The Oxford Dictionary of English defines value as “the regard that something is held to deserve; the importance, worth, or usefulness of something”. Nevertheless, this would not mean the same for everybody in every context. Even in academy, several definitions of value have been applied by different authors in different research fields. In this regard, Slack (1999) defined value as a measurement of the worth of a specific product or service by a customer as a function of: (i) product usefulness in satisfying customer needs; (ii) relative importance of the need being satisfied; (iii) availability of the product when is needed; (iv) cost of ownership to the customer. Thus, stating the subjectivity of the concept and the main focus on the customer that receives the product or service.
5

The concept of value is then widely discussed in the literature under many different disciplines. However, it receives particular attention in the business literature. For example, Porter’s value chain framework can be used to understand or analyze the logic of firm-level value creation regarding the economic performance of a company (Porter, 1985; Stabell and Fjeldstad, 2012) and Richardson (2008) used value as a central concept in the analysis of business logic adopted in implementing a strategy. This concept has been thoroughly studied in business theory, which has led to the emergence of several related concepts, such as value creation, value chain, value network and value proposition. Regarding this, Lindgreen and Wynstra (2005) identified three major value themes in business and industrial marketing: value analysis, value creation and value delivery. The value creation and delivery system explains the logic of how the company creates and delivers value for its customer and the source of its competitive advantage (Richardson, 2008).
In business-related literature, the concept of value is closely connected to the concept of business model, which addresses two main issues according to Casadesus-Masanell and Ricart (2010): (i) how a company identifies and creates value for customers, (ii) and how it captures some of this value as its profit in the process. Customers as a main focus for value creation have been present in literature for long time. For example, Holbrock (1994) suggested eight types of customer benefits - efficiency, excellence, politics, esteem, play, aesthetic, morality and spirituality - while Woodruff (1997) proposed a deconstruction of customer value into three dimensions – products attribute and attribute performance, consequences in use situations, customer’s goals and purposes.
Mason and Spring (2011) define value as the benefits derived by a customer from an interchange. The scope of value has also evolved from considering only economic value, exchanged between a company and its customers, to the understanding of value as derived from goods and services but also from buyer–seller relationships (Lindgreen et al., 2012) Thus, it involves not only economic transactions but also relationships, exchanges and interactions (Allee, 2011).
A broader perspective of value has been suggested by some authors. For example, the concept of extended customer value considers a threefold generation of value: for the company, its customers and the public (Lüdeke -Freund, 2010). A multilevel perspective of value has been proposed by Lepak et al. (2007) that consider that value can be defined at individual, organizational and societal levels and it can also be created by individuals, organizations and society. A comprehensive study of the concept of value made by Den Ouden (2012) resulted on the proposal of a Value Framework that considers value on four different levels (for the user, organization, ecosystem and society) and from the different perspectives of social sciences (from economy, psychology, sociology and ecology viewpoints). Figure 1.6 introduces the different value concepts, at each level and from each perspective, that she identified in her work as the basis to build her Value Framework.
6

Figure 1.6. Elements of the Value Framework (adapted from Den Ouden, 2012)
The integration of sustainability into company’s value creation logic should consider a more holistic view of value that integrates social and environmental goals (Schaltegger et al., 2011) and a multi-stakeholder perspective that addresses not only customers and shareholders but also society stakeholders (Hart and Milstein, 2003). As mentioned by Prahalad and Ramaswamy (2004), in today’s competitive landscape, organizations as producers of goods and services cannot exclusively create added value for customers, value has to be jointly created by both corporations and consumers as co-producers. This broader view of companies’ stakeholders and co-creators of value is embedded in the concept of value networks (Normann and Ramirez, 1994; Peppard and Rylander, 2006), which expands from the traditional view of value chains and involves “complex dynamic exchanges between one or more enterprises, customers, suppliers, strategic partners and the community” (Allee, 2000). The creation of sustainable value is a complex and multi-dimensional process illustrated by Hart and Milstein (2003) in their proposed Sustainable Value Framework for companies (Figure 1.7) where they consider different strategies, drivers and corporate payoff under two dimensions indicates in the vertical and horizontal axis. The vertical axis considers the time dimension, from a short-term (today) to a long-term (tomorrow) thinking, while the horizontal axis regards the business tension created between the protection of internal organizational capabilities and core technical aspects and the acquisition of new perspectives and knowledge from the outside.
Figure 1.7. The Sustainable Value Framework (Hart and Milstein, 2003)
7

From the perspective of servitization, which is commonly understood as the process of adding value by adding services (Vandermerwe and Rada, 1988; Baines et al., 2009), the emphasis of the service is in “the process of doing something for and with another entity in order to create value” (Barile and Polese, 2010). Value co-creation has shift the traditional idea of value creation, where customers were seen as “destroying the value which organizations create for them”, while in alternative, the new value creation paradigm views customers “actively co-creating and re-creating value with organizations” (Ramirez, 1999). This involves implicitly and actively the customer in the process of value creation (Vargo and Lusch, 2004).
In this regard, the concept of service dominant logic introduced by Vargo and Lusch (2008) could support the transition from product focus in manufacturing to a service-provider model by bringing service-centric thinking into value creation instead of the old mindset which gives priority to product-centric perspective. Value from a service perspective is not anymore based on the exchange-value defined by manufacturers but on the value-in-use determined by the customer according to the perceived benefits of the service (Vargo and Lusch, 2008) and the provider perspective of value-in-offering (Ngo and O’Cass, 2009). Customer value is a predominant research theme regarding the servitization of manufacturing as stated by Lightfoot et al. (2013). Within this research theme, the understanding of customer perceived value, i.e. value-in-use, is still in its early stages of research (Ostrom et al., 2010).
1.2. PROBLEM STATEMENT AND MOTIVATION The changing business landscape, influenced by increasing awareness of environmental and social impact of industrial activities, is progressively addressing new challenges that stimulate an on-going transformation process leading towards a sustainable industrial system (Evans et al. 2009). In this regard, Jawahir and Dillon (2007) consider four stages in the evolution of sustainability concept in manufacturing: Traditional manufacturing (substitution-based); Lean manufacturing (based on waste reduction); Green manufacturing (environmentally benign and based on 3R perspective); Sustainable manufacturing (focusing on innovation and based on 6R perspective). Sustainable manufacturing could be then achieved by moving from the 3R concept – reduce, reuse, recycle – to the 6R concept – reduce, reuse, recover, redesign, remanufacture, recycle – as well as by optimizing technological improvements and process planning (Jawahir and Dillon, 2007; Jayal et al., 2010). As mentioned in the introduction on sustainability (section 1.1.1), the implementation of innovative technologies, the improvement of utilization ratio of products / components and the extension of product life span are the three strategies proposed by Seliger et al. (2008) for sustainable manufacturing. Industrial maintenance may play a significant role regarding those three strategies as it is described herein.
Process innovation is seen as a key source of long-term competitive advantage in manufacturing (Frishammar et al., 2012) and it covers both, improvements in manufacturing operations done by the use of new equipment and small-scale changes in the method of production or routine operations (Reichstein and Salter, 2006). Production related factors, such as quality, failure and deterioration, and advanced manufacturing technologies are the main stimulus of process innovations (Utterback and Abernarthy, 1975). The use of advanced manufacturing technologies is related to maintenance function as the equipment would be more complicated to maintain and it is significantly and positively associated with the use of preventive maintenance (Swanson, 1999). Furthermore, the evolution from time-based preventive maintenance towards condition-based maintenance, which main techniques are diagnosis and prognosis (Jardine et al, 2006), and predictive maintenance (Lee, 2003) has driven the development of the e-maintenance concept. E-maintenance is an emerging concept generally defined as “a maintenance management concept whereby assets are monitored and managed over the
8

Internet”. (Levrat et al., 2008) and it is seen as a means for collaboration and pro-activity involving not only e-technologies integration but also new expected services (Iung et al., 2009).
The improvement of utilization ratio and use-intensity of products can be addressed by service-oriented business models (Seliger et al., 2008). Regarding manufacturing industry, this would imply equipment manufacturers entering a servitization strategy as introduced in previous section 1.1.2. Maintenance, repair and overhaul contracts as well as availability contracts are considered as product-centric services in which equipment suppliers take on maintenance activities related to the equipment once it is located on the customer’s site (Baines et al., 2011). Among the research topics under investigation within the servitization research theme identified by Lightfoot et al. (2013), this PhD research would concentrate on two main topics: customer value and product-service configuration. When considering maintenance-related services, the customer value has to be investigated from the perspective of the manufacturing plant where the equipment is located, i.e. the industrial user of the equipment. The product-service configuration then regards the characterization of the value proposition that the equipment manufacturer / service provider offers to the industrial user. This implies intrinsic difficulties as designing the new integrated offering can be critical for the manufacturer (Vladimirova et al., 2011).
The extension of life span can be applied to both final industrial products and industrial equipment to be used in manufacturing facilities. The latter is the object of maintenance function in manufacturing industry. An enlarged view of maintenance, under an asset management perspective, is extended to the overall equipment lifecycle and covers all involved manufacturing processes (Takata et al. 2004). In this sense, some authors have investigated the contribution of maintenance to the extension of the useful life of equipment or facilities (Carvalho et al., 2008; Yan et al., 2012).
The main motivation of this PhD research is to investigate how industrial maintenance can be an enabler of more sustainable manufacturing operations through its role in the provision of industrial services. Considering the above and the background on sustainability, servitization and value concepts previously introduced, this motivation can be depicted in the following aspects:
The transformation of equipment manufacturers towards servitized manufacturers brings new challenges that are being studying in literature. In this regard, considering the derived elements of the transformational model identified by Vladimirova et al. (2011), this PhD research focuses on three of them – customer, value, new offering – as main themes.
Different types of maintenance-related services have been mentioned above as indicated by Baines et al. (2011). Considering the potential variation of servitization aspects in different industries and potential areas mentioned by Turunen and Finne (2014), this PhD research would investigate different customer’s contextual situations and requirements, thus considering different manufacturing sectors and geographical aspects within the research, understanding the customers of the services under concern as the industrial users of manufacturing equipment.
Therefore, customer value has to be understood as the value obtained by the industrial user from the acquisition of maintenance-related services. In this sense, there is an envisaged contribution of this PhD research regarding the understanding of value-in-use, which is a research theme still in its early stages (Ostrom et al., 2010), in the particular case of customers of maintenance-related services. Special consideration should be made to the creation of value-in-use under the perspective of industrial sustainability, thus, encompassing economic, environmental and social criteria.
9
The new offerings related to maintenance and support services, developed under the servitization trend and concerning equipment manufacturers, need to be understood as a means to offer sustainable value to industrial users. In this regard, the study of maintenance technologies and e-maintenance concept is reflected on important as technological innovations can be seen as a strategy towards sustainable manufacturing (Seliger et al., 2008). Moreover, the design of the new offerings as an integrated solution for the customers is also a key aspect (Vladimirova et al., 2011), thus, this PhD research would also work on a potential contribution to support servitized manufacturers on product-service configurations.
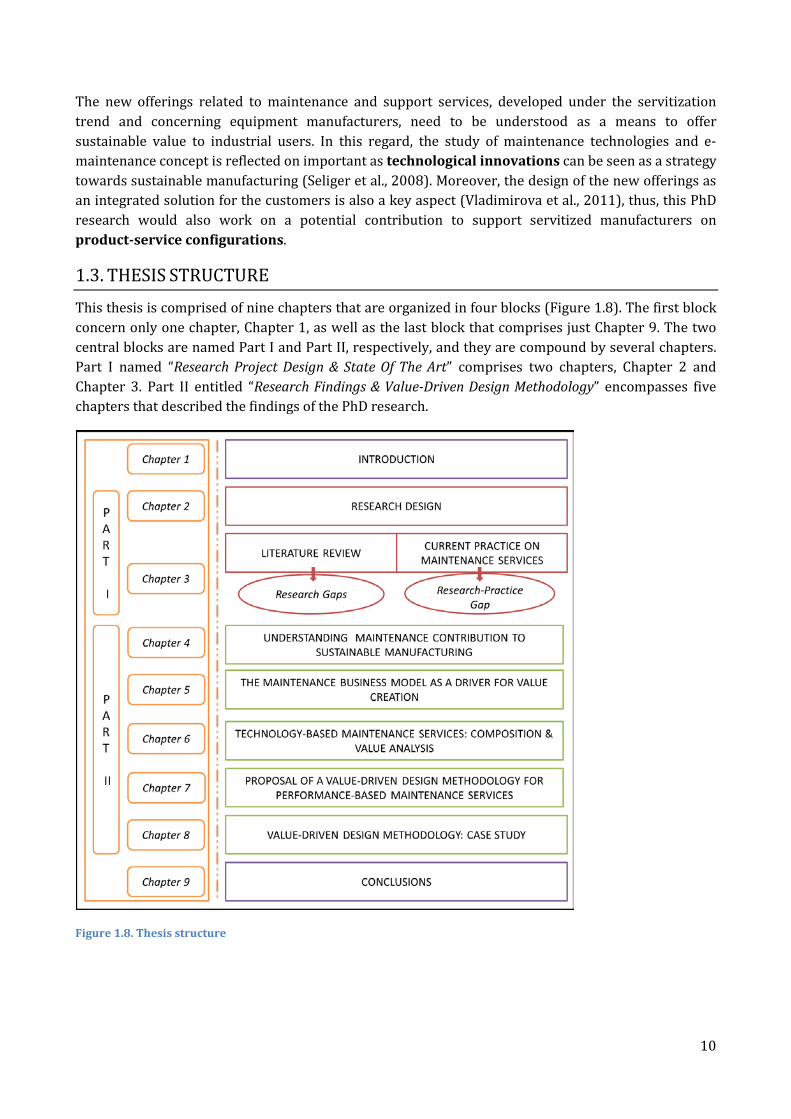
1.3. THESIS STRUCTURE This thesis is comprised of nine chapters that are organized in four blocks (Figure 1.8). The first block concern only one chapter, Chapter 1, as well as the last block that comprises just Chapter 9. The two central blocks are named Part I and Part II, respectively, and they are compound by several chapters. Part I named “Research Project Design & State Of The Art” comprises two chapters, Chapter 2 and Chapter 3. Part II entitled “Research Findings & Value-Driven Design Methodology” encompasses five chapters that described the findings of the PhD research.
Figure 1.8. Thesis structure
10

PART I. RESEARCH PROJECT DESIGN & STATE OF THE ART
11

12
2. RESEARCH DESIGN This chapter introduces the main research objective and the research questions that have led the research project towards its achievement as well as the research methodology followed during the different stages of the PhD research. The research methodology encompasses several phases and research methods that are described in details in the second part of this chapter.
2.1. RESEARCH OBJECTIVE AND RESEARCH QUESTIONS This PhD research focuses on the particular case of maintenance services in Business-to-Business (B2B) market, where the service providers are either Original Equipment Manufacturers (OEMs) or Maintenance Service Providers (MSPs) and the customers are the industrial users of manufacturing equipment and plants which acquire those services. A broad typology of maintenance services within this B2B situation would be initially considered in order to encompass all possible services that can provide sustainable added-value to the industrial users, though it is envisaged a particularization towards those types of services, depending on research results, to concentrate in those that have higher potential to contribute to most sustainability dimensions.
This research aims at studying maintenance services from an integrated view of maintenance– under the perspective of life cycle management – focusing on their potentialities to contribute to the creation of sustainable value for both the service provider and the industrial user. Particular attention is given in this work to new forms of maintenance services developed thanks to technological innovations and the analysis of their possibilities to add more sustainable value to the service provision.
All in all, the main objective of this PhD research is to advance the integration of sustainability into manufacturing operations through maintenance service provision by contributing to the understanding of industrial maintenance from a sustainability perspective and by looking for a systematic method to incorporate sustainable value into the new offerings proposed by servitized manufacturers.
Therefore, the main research question (RQ) has been defined as follows:
How can maintenance services contribute to sustainable value creation in manufacturing?
This research question could have been faced in different ways, thus, in order to provide a concrete research path for answering it, a set of three research sub-questions have been also defined. These sub-questions are the following:
Research sub-question 1 (SQ1): What is the current approach regarding the acquisition of different maintenance services in manufacturing companies?
This research sub-question aims at understanding the research context by (i) analyzing the diverse typology of maintenance services and their connection to servitization strategies and PSS offerings in B2B market and (ii) studying the current situation (state-of-practice) of maintenance services, focusing specifically in Italian manufacturing industry. This sub-question takes the viewpoint of the equipment industrial users, as the customers of the offered maintenance-related services. Although there is a wide discussion in academia regarding the process of servitization and the willingness of OEMs / MSPs to increase their service offerings, it is necessary to understand how much manufacturing companies are currently following or willing to follow a contracting-out or outsourcing strategy for their maintenance activities and to which extend are different types of maintenance services already introduced in manufacturing companies.
13

Research sub-question 2 (SQ2): How does maintenance function in manufacturing companies contribute to more sustainable manufacturing operations?
Although some authors (Garetti, 2011; Liyanage, 2007; Ahuja and Khamba, 2008:2009, Yan et al., 2012) have suggested some streams for the envisaged contribution of maintenance to sustainability, there is not a comprehensive empirical study investigating on that contribution. This research sub-question aims at fulfilling this research gap by studying the understanding of the concept of sustainability in maintenance function within the manufacturing and how maintenance function contribute to more sustainable operations in manufacturing companies. In this regard, for answering this sub-question manufacturing companies would be the main target of the study in order to: (i) understand the connection between their maintenance function and sustainable operations; (ii) study their needs and requirements in terms of sustainable operations as customers of maintenance services provided by OEMs or MSPs, so acquiring the knowledge necessary to have a customer-oriented view of maintenance services.
Research sub-question 3 (SQ3): How can technological innovations contribute to enhance sustainable value in maintenance service provision?
Technological innovations have been drivers of the evolution of manufacturing paradigms from mass production, through the concepts of lean, flexible, reconfigurable manufacturing, to the current stage of predictive manufacturing characterized by bringing transparency to manufacturing assets capabilities (Lee and Lapira, 2013). Real time monitoring, performance assessment and advanced technologies are cornerstones to contribute to achieving transparency in manufacturing, as they are part of predictive maintenance systems, named traditionally as E-maintenance systems (Koç et al., 2005). New maintenance capabilities enabled by such evolved systems are creating further opportunities for the provision of maintenance related services. Thus, this research sub-question aims at exploring the different technological choices for the provision of maintenance services and their potentials for enhancing value creation.
2.2. RESEARCH METHODOLOGY The research methodology followed during the PhD research project is based on a multi-phase and multi-method approach. Most of research phases have been developed simultaneously at least during some time due to the necessary overlaps among phases in order to inform/update the ongoing activities with the concurrent results obtained in other phases. Next sections introduce first the rationale and an overview of all research phases and then describe in-depth the research methods followed in each phase.
2.2.1. OVERVIEW OF THE RESEARCH PROJECT The research project, carried out in order to address the research questions, has been compound of five phases: (i) literature theory understanding; (ii) exploratory phase; (iii) explanatory phase; (iv) development phase; and (v) testing phase. Figure 2.1 shows an overview of the different phases and the research methods employed in each phase. These research phases and research methods are described in details in the next sub-sections.
14

Figure 2.1. Overview of project phases and research methods
This PhD research considers both qualitative and quantitative research approaches, thus being a mixed method research project, which is an increasingly popular approach combining qualitative and quantitative approaches (Robson, 2011). In this approach, the integration of qualitative and quantitative methods could be done at different levels, in different ways and for different purposes (Flick, 2007). In this research, both methods are combined to provide a more complete picture of the research topic, as they have been found adequate in different phases of the research project. Mixed methods research can provide, among others, the following benefits which have been considered important for this research: completeness and more comprehensive representation of the research topic; capacity to address a wider range of research questions, better illustration of data and better refining of the research questions (Robson, 2011). The main research approach has been qualitative, considering the exploratory case studies and the testing case, though the inclusion of quantitative methods as secondary research method have been beneficial in order to understand the research context from a practical viewpoint and to support the development phase by providing some quantitative figures. This rationale is aligned with the ways of integrating qualitative and quantitative research suggested by Bryman (1992).
2.2.2. LITERATURE & THEORY UNDERSTANDING PHASE An extensive literature review has been done regarding to the main bodies of knowledge of the PhD research, which are sustainability, servitization and maintenance themes within the manufacturing industry context, considering also the two main actors involved in the provision of industrial maintenance services: the provider (OEMs or MSPs) and the customer (equipment industrial users in manufacturing companies). This initial broad literature understanding permitted to identify the main concepts / variables and actors within each body of knowledge, so to define the conceptual framework for this research, as well as to understand which are their potential synergies and connections and how the concepts of value and value creation are addressed in each of them.
Moreover, specific literature reviews have also been needed during the PhD research to analyze concrete issues that emerged during the whole research project. In this sense, this research phase, although more intense at the beginning, remained an active method during the whole research project as a significant source of knowledge regarding the research context, the research content and the research methods which have been applied along the PhD project.
15
Main literature review done following a systematic approach: exploratory stage A systematic literature review has been done to study the concept of sustainable manufacturing and identify its main dimensions according to literature. The systematic review has been made using the research engine Scopus by looking for “article” or “review article” as document types, with the word “sustainable manufacturing” in the title, from year 2000 to date (search done on February 2013), and considering only physical sciences as subject type. The search resulted in 97 publications which were examined and their abstracts were carefully read in order to make a selection according to two criteria: (i) “sustainable manufacturing” needs to be included in the publication as a concept, not just a random coincidence of words; (ii) the article or review needs to include a framework or model, which contains several dimensions of sustainability, as either an input or an outcome of the research or review done. Using these criteria, 20 publications were finally selected. These 20 publications were analyzed in order to explore which are the definitions given to the concept of sustainable manufacturing and which are some of its constituting dimensions and elements according to this selected literature. The results of this analysis have brought initial understanding to this research on this wide topic and are presented in section 3.2.1. The list of these 20 selected articles can be found in Appendix B.
Other briefly systematic literature review has been conducted in order to investigate whether the concept of industrial maintenance has been already studied under the themes of sustainable manufacturing or eco-efficiency, the latter being considered by Rashid et al. (2008) as the broadest and most complex strategy to be pursued for the achievement of sustainable manufacturing. The results of these reviews have been taken as starting point to explore maintenance role within sustainability in manufacturing industry.
Regarding sustainable manufacturing, it was surprising not to find further direct evidence in literature of the connection between sustainability and maintenance in a manufacturing context. A simple search of literature made using the research engine Scopus revealed that there is no much recent literature focusing on this topic. The search was made by looking for coincidences of the words “sustainability” and “maintenance” together with the words “production” or “manufacturing” in the fields “Article title, abstract, keywords” considering only “article” as document type, from year 2000 to date, in the subject areas “physical sciences” and “social sciences and humanities”. The search resulted in a total of 176 articles, but among those only 10 were selected as related to our study according to their theme and approach. Although the articles found may suggest some streams for the envisaged contribution of maintenance to sustainability, there was not found any article presenting a comprehensive study on that contribution.
Regarding eco-efficiency, the results of a preliminary search made using the research engine Scopus revealed that there is also not much literature on the specific connection between industrial maintenance and eco-efficiency. The search was made by looking for coincidences of the words “eco-efficiency” and “maintenance” in the fields “Article title, abstract, keywords” with no other constraints. Most of the findings (17 articles in total) were not related to industrial equipment, thus only 3 could be selected as related to industrial maintenance: Levrat et al., 2008; Iung et al., 2007; and Iung et al., 2008. However, these articles are not really going into a deep understanding on the connection between eco-efficiency and maintenance, they just point out the envisaged connection. In order to broaden this first search regarding eco-efficiency, a second search was carried out by looking for coincidences of the word “eco-efficiency” in “All Fields” and the word “maintenance” in the field “Article title”, searching only in the subject areas of physical and social sciences. Similar results were found this time, the articles found (10 articles in total) were not related to industrial maintenance or were from
16

the same authors as those found in the first search. Thus, at this initial stage, it can be said that the potential and envisaged relationship between eco-efficiency and industrial maintenance is not widely discussed in literature.
Further search was done in order to find some connections to the two specific dimensions of eco-efficiency: resources and product life cycle. These more concrete searches were done only in the subject area of physical sciences and keeping always the words “maintenance” and “industrial equipment” in the fields “Article title, abstract, keywords”. Then, four different searches were done, varying the source type between journals and conference proceeding and looking for the words “product life cycle” and “resource efficiency” in the fields “Article title, abstract, keywords” alternatively. Table 2.1 shows the number of coincidences found and some selected articles (11 in total) according to their connection to the topics studied in this research and the practical implications of their contributions. The different topics studied in the references are shown in the table as possible concepts to be further investigated to highlight the potential relationship among maintenance and eco-efficiency.
Table 2.1. Search results regarding the connection between maintenance and eco-efficiency dimensions
Eco-efficiency dimension
No. articles
Selected articles Topics of selected articles
Source type: Journals Product life cycle 8 Desai and Mital, 2011
Li et al, 2010 Datta and Roy, 2010 Candell et al, 2009
Design for maintenance Maintenance support system Cost modelling service contracts E-maintenance
Resource efficiency 20 Anvari and Edwards, 2011 Tousley, 2010 Candell et al, 2009 Savsar, 2008 Badinger et al, 2008 Demirbas, 2008
Integrated equipment effectiveness Maintenance practices – energy cost E-maintenance Modelling production lines OEE methodology Energy efficiency
Source type: conference proceedings Product life cycle 3 - Resource efficiency 16 Seow and Jiying, 2006
Reilly, 2004 TPM and maintenance strategies Maintenance strategies
Main literature review done following a snowballing approach Another different approach has been followed in more advanced stages of the research project, concretely a snowballing approach has been preferred to be used for conducting specific literature reviews regarding current maintenance management frameworks, the concept of e-maintenance together with the study of different maintenance technologies and the current product-service-system and industrial services design / development frameworks. A snowballing approach for literature review consists on reference tracking which is done typically by scanning the reference list of some selected papers and used judgment to decide whether to pursue this further (Greenhalgh and Peacock, 2005). This structured way for performing a literature review starts with the selection of some major contributions are likely to be in the leading journals, then two strategies can be followed: (i) going backward, by reviewing the references of the selected articles; (ii) going forward, by using a research database to identify articles citing the selected articles (Webster and Watson, 2002). The selection processes for the first set of articles used for the main snowballing-based literature reviews done in this PhD research are explained next.
17

Regarding the literature review on maintenance management frameworks and models, one paper was the starting point for the snowballing process. This paper was found by searching on the search engine Scopus for journal articles in which the words “maintenance management” and “review” are in the article. The results were 3 papers but only one provided a general overview of maintenance management, which is:
– Garg, A., Deshmukh, S.G. Maintenance management: Literature review and directions, (2006) Journal of Quality in Maintenance Engineering, 12 (3), pp. 205-238.
This article had been cited 67 times by March 2013, were this search was done, therefore, the reference tracking process consisted in going backward and forward. The journal where this article was cited was also checked as seems to be a preferred journal for maintenance-related publications. The starting set of articles for the snowballing process regarding maintenance technologies and e-maintenance was found in a similar process. Looking for journal articles with the words “e-maintenance” and “review” in the title, using the search engine Scopus. Two articles were found and they were used for the reference tracking process in the same way as above, going backward and forward. Those articles are:
– Muller, A., Crespo Márquez, A., Iung, B. On the concept of e-maintenance: Review and current research, (2008) Reliability Engineering and System Safety, 93 (8), pp. 1165-1187. Cited 121 times by end of 2013.
– Levrat, E., Iung, B., Crespo Márquez, A. E-maintenance: Review and conceptual framework, (2008) Production Planning and Control, 19 (4), pp. 408-429. Cited 43 times by the end of 2013.
The review on service and product service system design and development methods was done following a similar procedure. The starting point for the snowballing process was a set of 5 articles found by looking in the research engine Scopus for journal articles or reviews with the words “product service system” and “review” in the article title, with a range of years from 2000 to present (July 2014). The results of this search were exactly these 5 articles, whose references were again tracked by going backward and forward:
– Boehm, M., Thomas, O. Looking beyond the rim of one's teacup: A multidisciplinary literature review of Product-Service Systems in Information Systems, Business Management, and Engineering & Design, (2013) Journal of Cleaner Production, 51, pp. 245-250. Cited 4 times.
– Beuren, F.H., Gomes Ferreira, M.G., Cauchick Miguel, P.A. Product-service systems: A literature review on integrated products and services, (2013) Journal of Cleaner Production, 47, pp. 222-231. Cited 5 times.
– Vasantha, G.V.A., Roy, R., Lelah, A., Brissaud, D. A review of product-service systems design methodologies, (2012) Journal of Engineering Design, 23 (9), pp. 635-659. Cited 7 times.
– Wang, P.P., Ming, X.G., Li, D., Kong, F.B., Wang, L., Wu, Z.Y. Status review and research strategies on product-service systems, (2011) International Journal of Production Research, 49 (22), pp. 6863-6883. Cited 9 times.
– Durugbo, C., Tiwari, A., Alcock, J.R. A review of information flow diagrammatic models for product-service systems, (2011) International Journal of Advanced Manufacturing Technology, 52 (9-12), pp. 1193-1208. Cited 12 times.
2.2.3. EXPLORATORY PHASE This section presents some insights into the data collection and data analysis performed during the exploratory phase of the PhD research, which aimed at understanding two different phenomena and consisted of two different empirical research methods.
The first phenomenon under study is the current state-of-practice of maintenance services acquisition in manufacturing companies, which is directly related to the SQ1. An exploratory survey is the research method chosen as more appropriate to provide evidence at this preliminary stage of the research, due to its applicability in early stages of research to gain preliminary insights on the topic and to uncover some evidence on preliminary concepts and interrelations within a phenomenon
18

(Forza, 2002). As a secondary objective, the exploratory survey helped to identify interesting cases for the next step of this phase.
The second phenomenon, which is closely related the SQ2, is the understanding of the concept of sustainability under the perspective of maintenance function in manufacturing companies and how maintenance function could contribute to more sustainable manufacturing operations. The exploratory nature of this study is due to the complexity of this phenomenon is caused by the different dimensions of a potential contribution of maintenance to sustainable manufacturing and the different processes that could influence it within real-life context of a manufacturing company, in addition to the newness of this approach as no previous empirical study has been found in literature. The research method chosen is a case study method, due to its applicability to investigate a contemporary phenomenon within a real-life context in cases where the boundaries between phenomenon and context are not so clear (Yin, 2003) and due to its adequacy for topics that are either new or complex (Lewis, 1998; Johnston et al, 1999).
Exploratory survey The exploratory survey is based on a concrete section of the questionnaire developed by the TeSeM Observatory (www.tesem.net), in particular the section regarding maintenance services acquisition and maintenance activities outsourcing. TeSeM Observatory aims at being an independent point for observation between demand and supply of technologies and services for maintenance. The questionnaire developed for the research of the year 2012-2013 measures the maturity of several maintenance processes, in a scale of five maturity levels. Section F within the questionnaire has been designed for the purpose of describing the state-of-practice of different types of maintenance-related services. An exploratory survey can be sometimes done by using data collected in other studies (Forza, 2002), thus, this is why data from TeSeM Observatory, though the questionnaire was designed to study maturity on maintenance outsourcing, could serve for the purpose of exploring the current practice of maintenance services in manufacturing companies.
Survey design: The design of the questionnaire for the exploratory survey has been done by the research team of TeSeM Observatory, the PhD researcher has been part of the team and has been specifically strongly involved in the design on the section regarding maintenance services. This section of the questionnaire addresses the following themes:
– Services acquired by target area – Motivations for the acquisition of maintenance services – Maintenance services acquired in production areas – Outsourcing strategy – Services related to maintenance engineering – Requirements for maintenance service providers
Sample design: The population concerns the whole manufacturing industry in Italy. The sample design for the TeSeM Observatory survey has been selected according to a set of defined manufacturing sectors and across the whole geographical extension of the country (this was enabled due to the geographical distribution of TeSeM research partners) and considering all company sizes. The defined manufacturing sectors are the following eleven categories: textile, food and beverage, pulp and paper, refined petroleum, machinery, electronics, automotive, chemical/pharmaceutical, rubber and plastics, steel, other metals. Some non-homogeneous distribution of company’s sectors in the sample is expected as the metal-mechanical, chemical / pharmaceutical and food and beverage sectors were the target of TeSeM annual research 2012-2013.
19

Data collection: The data collection was done by TeSeM Observatory personnel. It consisted in the expedition of the questionnaire to 323 companies via email. The response rate has been of 16%. Other questionnaires have been received from some partners of TeSeM Observatory which are 7 other Italian Universities (no information regarding their response rate has been provided). The geographical distribution of questionnaires received is quite fair between north and center-south of Italy, with predominance of north due to the location of TeSeM Observatory (42% Centre-South and 58% North Italy). Data from the questionnaires received have been introduced in a database (TeSeM database) for its preparation to data analysis activities.
Data sample: After reviewing the questionnaires received in order to remove those not matching the characteristics desired in the sample, the data from the 112 questionnaires have been analyzed, conforming the sample of the exploratory survey. The companies answering the questionnaires were from several sectors, although mostly were from metal-mechanical, chemical / pharmaceutical and food and beverage, as they were the target of TeSeM annual research 2012-2013. Concretely, Figure 2.2 shows the distribution of sectors within the survey sample.
Figure 2.2. Distribution of industrial sectors within the sample
Due to the small representation of some sectors, those with a rate lower than 6 % were integrated into a miscellaneous group named “other sectors” for the analysis of the survey. The final sector groups analyzed are: Food and beverage, Chemical/Pharmaceutical, Machinery, Other metallic products, Automotive, Other sectors (which includes the rest of sectors).
As a preliminary step before analyzing the data from the survey, an analysis of the distribution of companies within the manufacturing sector in Italy has been carried out (its results are presented in section 3.4.1 in this document) based on data taken from EUROSTAT database corresponding to year 2010, which was the latest data available when accessed statistics website in August 2013. This preliminary analysis illustrates the representativeness of the companies which responded to TeSeM survey respect to the whole manufacturing industry in Italy.
Comparing the sample with the statistics of the manufacturing sectors in Italy, it can be observed that although the Italian manufacturing industry is mainly compound by micro companies (75%), only one company in the sample belong to a micro company. The rest of questionnaires received are coming from small companies (24%), medium companies (43%) and big companies (33%). Thus, the survey analysis would mostly include medium and big companies. A comparison with the data from EUROSTAT shows that textile and electronics sectors are not equally represented in the survey as in the actual manufacturing industry; this was anyway expected as they are not target sectors of the annual research 2012-2013 of TeSeM Observatory.
20

Data analysis: Once data collection finished, the concrete data necessary for this exploratory study have been extracted from TeSeM database. The data concerned for this exploratory study is mainly collected in section F of TeSeM questionnaire. Additional data collected in other sections of questionnaire would be also used in order to: (i) characterize the companies, such as sector, size, type of demand, strategic objectives; (ii) characterize, in a general perspective, the maintenance department, such as its size and structure; (iii) allow comparison between activities done internally and externally, such as maintenance engineering activities and CBM techniques.
The data to be used in the analysis was collected in an excel file and the answers to the questions were translated to numerical and categorical data. The categorical data reflects those questions were some possible answers were given; thus, a number was defined for any possible answer, as an example, the question regarding the organizational structure of maintenance function in the plant has 4 possible answers, so each one was associated with a number, from 1 to 4. However, most of the questions allowed the possibility to translate the answers into binary data, were 0 was applied to No answers and 1 was applied to Yes answers.
The data collected was then aggregated into variables to perform a descriptive analysis. The results of the data analysis are presented in section 3.4. Reliability of results has been checked against the analysis done by TeSeM Observatory independently.
Exploratory case studies As mentioned above, the second part of the exploratory phase was based on case study research. This part can be seen as a follow u of the exploratory survey, as the data analysis done under the scope of TeSeM Observatory supported the selection of some cases to be further investigated. This research covers a novel empirical study on the contribution of maintenance function to more sustainable operations within manufacturing companies. A multi-sector study has been done in order to cover a broader scope of the manufacturing industry and avoid the focus on a particular sector during this part of the exploratory phase, so avoiding possible bias related to concrete sectorial characteristics.
Case study design: The selected approach for the case study is a multi-case research, which has the potential of providing more robust and compelling evidence on the phenomenon under study (Yin, 2003). The unit of analysis is the maintenance function or department inside a manufacturing company. The case studies are based on multiple source of evidence, as it will be explained later, though the main source of evidence was a set of semi-structured exploratory interviews that has been carried out in each company involved. The interview design and protocol are described herein.
The interview protocol consisted on a series of steps to be done in order to assure reliability and validity of the research results. First of all, the questionnaire design has been developed on two steps: (i) a first version of the questionnaire was used for a pilot case in a company outside the set of target companies; (ii) using feedback from the pilot case, the questionnaire was reviewed and improved in order to better collect useful data for the study. The pilot case was done in a multinational maintenance service provider company; in particular the interviewee was a person with an outstanding knowledge of maintenance function in several industrial sectors. The information gathered was used in parallel with an ongoing review of relevant literature, so that the final research design was informed both by prevailing theories and by the feedback from the pilot case. The questionnaire was then improved following two main lines: (1) the questions were checked again, even changing the focus of some questions, to make them more operational and understandable by the potential interviewee which is assumed to have an industrial background, not academic; (2) as a consequence of some difficulties found while using directly the word “sustainability” during the pilot
21

interview, a general change was done in the whole questionnaire in order to avoid misleading or biases with its use; thus, it was decided to avoid to refer directly to sustainability, so the word “sustainability” was replaced for its dimensions and elements according to the findings of the systematic literature review done (systematic method explained in previous section 2.3.2). Thus, the interview would focus on the elements of sustainability and how maintenance operations and management contribute to them or has an effect on them but without mentioning the word sustainability in the questionnaire as it may be subject of different interpretations or maybe not understandable in some case, so needing further explanation which would be opposite to the nature of the study. The final design of the questionnaire used during the semi-structured interviews is presented in Appendix C.
The interview protocol encompasses some activities to be carried out before the interview: some previous information on the company and the interviewee were check, if available, based on company website and/or answers to TeSeM questionnaire. Then, after each interview, in the cases that the interview was allowed to be recorded, the transcription of the interview has been done and a coding process was realized to proceed with the analysis of each interview.
Cases selection: The selection of the companies for the case studies was done according to: (i) their size, only medium/big companies were chosen to avoid potential misalignment of results due to concrete characteristics/limitations of small companies, and (ii) their results on TeSeM questionnaire, the companies were selected among those which scored the same or higher maturity levels than their sector average maturity levels. The companies were selected among those which scored higher maturity levels as it is assumed that low maturity levels mean that maintenance processes are not so well-organized or are facing internal difficulties which lead the company to focus on other improvements, rather than those related to sustainability, of their maintenance activities, such as maintenance control and administration. It is assumed then that aiming at having more sustainable performance is part of an improvement strategy in manufacturing companies and would not be compatible with low maturity levels. The selected companies were from different industrial environments such as food and beverage, chemical/pharmaceutical, automotive, mechanical and textile. Table 2.2 shows some characteristics of the companies included in the case study research.
Table 2.2. Characteristics of the companies selected for the exploratory case research.
Case Company sector Plant size Maturity Index Sector average Maturity
Index A Chemical/Pharma Medium ML3 low ML3 low B Textile Medium ML3 high ML2 high C Other mechanical Big ML3 high ML3 low D Chemical/Pharma Big ML3 low ML3 low E Other mechanical Big ML3 high ML3 low F Metal Big ML2 high ML2 high G Chemical/Pharma Big ML4 high ML3 low H Food/Beverage Big ML4 high ML3 low I Automotive Big ML4 high ML3 high
Data collection: The data collection process for the nine case studies encompassed several sources of evidence that are shown in next Table 2.3, based on the six categories of sources proposed by Yin (2003). Two categories proposed by Yin (2003) do not apply to these case studies – participant observation and physical artifacts. According to Strauss and Corbin (1998) the three major components of qualitative research are: (i) data consisting in interviews and observations, (ii)
22

procedures for conceptualizing and reducing the data and (iii) written and verbal reports. The main source of evidence has been the interviews carried out in the companies, though observations and secondary documents were revealed as an important source of evidence and the main means for triangulation during the case analysis. One semi-structured interview has been carried out in each company. The targeted interviewee had either a comprehensive view of all business functions (including maintenance) or technical responsibility including the maintenance function.
Table 2.3. Sources of evidence in the exploratory case studies
Case Documentation Archival records
Interviews Direct observations
A Information and documents from company website
TeSeM questionnaire
Plant technical manager
Interview was done at plant technical office
B Information from company website; Report of a previous case study
Plant technical manager
Interview was done at plant technical office
C
Information and documents from website; Report of a previous case study
TeSeM questionnaire of 2 factories in production site
Site industrial engineer manager
Visit to production site previous to the interview; Interview was done at plant engineering offices
D
Information from company website
TeSeM questionnaire
Maintenance manager
Interview was done in plant offices and a visit to production plant followed the interview
E Information from company website; Report of a previous case study
TeSeM questionnaire
Maintenance manager
Interview was done in an office within the production area
F
Information and documents from company website
TeSeM questionnaire
Maintenance manager
Interview was done in plant offices and a visit to production plant followed the interview
G
Information and documents from company website; Internal communication document; Report of a previous case study
TeSeM questionnaire
Maintenance and technical materials manager
Interview was done at the headquarters location
H Information and documents from company website
TeSeM questionnaire
Operations director
Interview was done at the headquarters location
I
Information and documents from company website; Report of a previous case study
TeSeM questionnaire
Maintenance and production manager
Interview was done in an office within the production area
Data analysis: After the interviews, the transcription and coding of the interviews which were recorded was done. The total time recorder was around 10 hours and the transcription process resulted in 107 pages (58.738 words) of transcripts. The analysis of the interview (the one done in company D) which couldn’t be recorded –due to expressed request related to company’s internal rules - has been done based on a report written exactly after the interview and checked together by the two researchers present in the interview.
The coding procedure for the transcripts of the interviews and the report regarding the interview not recorded was based on a set of pre-determined broad categories. This provisional approach is used in exploratory coding methods (Saldaña, 2009). Descriptive coding has been later used in order to confirm the categories used in the provisional coding and to identify the sub-categories within each
23

broad category used. The seven broad categories used are the following: BIZ, for business context; MCX, for maintenance context; STK, for stakeholders; ECO, for economic dimension; ENV, for environmental dimension; SOC, for social dimension; TECH, for technology / innovation aspects. The use of pre-determined broad categories have been found useful to keep the focus of the analysis and to interpret data (within the broad categories) in order to establish subcategories which are only inferred by the data collected. The provisional categories are generated from previous knowledge, in this specific case from the literature review done on sustainable manufacturing topic, and they helped to understand the context of each case. In qualitative research is crucial to take into account the context as a means of situating action and understanding meaning correctly (Dey, 1993).
This analysis has been done individually and globally in order to identify the differences in the results that could be coming from the operational context. Cross-case analysis was based on a variable-oriented approach, i.e. looking for themes that cut across the cases (Miles and Huberman, 1994). Reliability of results from the interviews has been checked in two ways: (i) by triangulation with secondary data available (from company website, press articles and other available information) in order to check the consistency of the data collected (mainly concerning figures and facts), (iii) by choosing the interviewees according to their position within the company and their experience / background regarding maintenance concepts. A check for internal validity has also been done during the coding process by double-check the coding results of some interviews with other two researchers which were not involved in the interview process.
2.2.4. EXPLANATORY PHASE The objective of this phase is to identify the different technological innovations related to industrial maintenance that can be employed for the provision of maintenance services by OEMs / MSPs and understand their potential relationships the value provided by maintenance services.
Specific literature reviews on technologies for maintenance and technology-based tools used in industrial maintenance, together with a review on value dimensions proposed in literature for the provision of maintenance services, have been informed this explanatory phase. The research method used in this phase is an explanatory survey that is suggested to be adequate to understand basic or directional relationships.
According to Forza (2002) an explanatory survey can be used to test the adequacy of the concepts developed in relation to a phenomenon and the potential linkages among concepts, therefore, it seems suitable to use this method for testing whether the use of different technologies in the provision of maintenance services has connection with the value dimensions, i.e. whether they can contribute to increase the value of the different dimensions that according to previous studies are the most important for maintenance service provision.
Survey design: Literature has been the main source for the definition of the questions included in the survey. The literature review done regarding technologies for maintenance and the e-maintenance concept has identified different categories of technology-based tools and applications which may act as enablers of technology-based maintenance services. Ten categories were identified. The concrete results of this literature review are explained in sections 6.1 and 6.2. The more important value dimensions, according to the reviewed literature, for the provision of maintenance services are six; further details on this topic are described in section 3.3.2. The survey has been defined in two steps. The first step concerns a first version of the survey which was used for a pilot test in order to check whether questions were understandable and the easiness of fulfilment of the questionnaire. A set of six experts were involved in this pilot test and their feedback was used for the improvement of the
24

questionnaire content and format. Main feedback received was related to the clarity of some value dimensions, e.g. some respondents suggested to include a short explanation for each of them, and to the difficulties on measuring the contribution as different interpretations were possible and the value dimensions could be understood in different ways, e.g. a positive contribution could mean an increase on the service price or vice versa.
The final version of the questionnaire addresses these issues by including guiding questions for each value dimension that help clarifying the interpretation of positive / negative contributions and that can support the respondents during the questionnaire fulfilment. The final version of the survey questionnaire is included in Appendix D.
Sample design: As this survey focused more on investigating the potential linkages between the use of innovative tools and applications for maintenance services and the value dimensions of those services rather than on the generalizability of the results (the representativeness of the sample is not an important variable), thus, a non-probabilistic sampling approach has been chosen (Forza, 2002). Moreover, this type of sampling are employed to target the specific user population of a concrete good (Maxim, 1999) and in this explanatory phase, the target respondent would be either researchers or company managers working on the specific areas of maintenance technologies and/or industrial services. Therefore, the target population is quite specific. According to Forza (2002), two sampling approaches could be used for obtaining information relevant to and available only from certain groups: Judgment sampling (when looking for information that only a few experts can provide); and Quota sampling (when the responses of special interest minority groups are needed). The judgment sampling has been selected for this survey, so a selection of professionals and academic researchers working on the mentioned topics compounded the target sample.
Data collection: As mentioned above the pilot test involved a group of six experts from academy, equally distributed between experts in maintenance technologies and experts in industrial services. The distribution of the final survey, refined according to the pilot test findings, was mainly done via email. The selection of target respondents were done following three main streams: (i) Mailing lists, used to reach a community of Italian professors and researchers in topics regarding industrial plants; (ii) Well-known researchers in both areas, identified thanks to literature review; (iii) Conferences, those happening at the time of survey distribution and that had special sessions on e-maintenance or industrial services.
Moreover, the survey has also proposed to participants in a workshop carried out within the research project “Smart Maintenance” in September 2014, where 6 more responses were collected between the industrial partners of the project.
Data sample: The survey was initially prepared for addressing academicians and industry professionals, though some difficulties were found with potential industry respondents and the target audience was modified to be mainly from academy. In total, the survey was sent to around 100 researchers and received 39 responses, from which 2 were invalid due to a problem with the file that couldn’t recover the survey responses.
The final sample considered 37 responses to the survey: 27 were from academy and 10 from industry. Regarding institution size, 62% were from big institutions with more than 250 employees. The respondents had been in the same company for an average of 8,15 years and in the same role for an average of 5,45 years. This indicates the average experience of respondents that were the target of the data collection process. Figure 2.3 shows the distribution of countries to which the institutions belong.
25

Except for the case of Italy, that has higher representation, it can be observed that in most cases there is a similar representation of the other countries involved. Respondents are from 8 European and 2 American countries. Considering the question regarding the level of confidence at the beginning of the survey, the average confidence regarding maintenance technologies is slightly higher than the average confidence regarding maintenance service provision (Figure 2.4).
Figure 2.3. Distribution of countries of survey respondents’ institutions
Figure 2.4. Confidence level stated by survey respondents
Data analysis: The analysis of survey responses has been performed by using descriptive statistics. The description of respondents has been already explained above. The survey asked the respondents to indicate in a 7-point Likert-type scale the contribution of each category of technology-based tools and applications to each of the six value dimensions identified for maintenance services. These responses have been analyzed by calculating the average value and its standard deviation for each dyad category-value. The results are presented in section 6.3.2. The respondents were also asked to define their confidence in the two topics related to this survey (maintenance technologies and industrial services) in a scale considering three levels: not confident, quite confident, and very confident. A secondary analysis has been carried out separating the responses of those considering themselves very confident in each topic or in both of them. The respondents that stated to be very confident on maintenance technologies were 43% of the sample while those that stated to be very confident on maintenance service provision were just 19% of the sample. Some differences came out from this secondary analysis that are presented in section 6.4.
Regarding potential errors that be considered during the data analysis, the main source could be misinterpretation, i.e. some interpretation error should be assumed as not all respondents would understand and interpret the underlying score system in the same way (Maxim, 1999). This could be especially present in the responses regarding service price, as it was already shown to be misleading in the test pilot. Additional analysis of the data have been done to minimize this error, concretely the overall score have been calculated in two ways, with and without the service price scores, and both calculations showed the same ranking of tool categories.
26

2.2.5. DEVELOPMENT PHASE This phase considers the results of previous phases in different ways:
– Literature review regarding the typology of maintenance services and the exploratory survey have provided the knowledge regarding the kind of maintenance services which has more potential for adding more sustainable value to both providers and industrial users, i.e. performance-based maintenance services.
– Literature review on value dimensions of maintenance services and the exploratory case studies brought into light the different types of value that maintenance services can provide, i.e. operational values related directly to the industrial equipment / operations and values related to the provision of the service from a more holistic perspective of service performance.
– Literature review on the categories of technology-based tools and applications for maintenance and the explanatory survey results brought knowledge regarding the most adequate technological choices for obtaining more value in maintenance services related to service performance.
Considering the previous input, the development phase aims at designing a methodology to support maintenance service providers (either OEMs or MSPs) during the definition of their offerings of performance-based maintenance services, in order to provide more sustainable value to their customer’s operations under an industrial sustainability perspective. The methodology proposed is aligned with the research line started by Macchi et al. (2014) which considers a value-driven approach for the assessment of technological innovations in industrial maintenance from a manufacturing company perspective and can be seen as preliminary work of the PhD researcher regarding the inclusion of a value-driven perspective in maintenance techniques and methods.
To support the development of the value-driven methodology, the perspective of system engineering has been taken for this development phase, considering a performance-based maintenance service as the system under concern. The life cycle phases for a system according to GERAM (1999) are the following: (i) identification; (ii) concept; (iii) requirement; (iv) design; (v) implementation; (vi) operation, and; (vii) decommissioning. The three initial phases has been analyzed in this study by using a sound modelling technique, IDEF0, and considering the results of previous research phases. IDEF0 is a structured representation of the functions, activities or processes within a system. It consists on a hierarchical series of diagrams following a set of rules for the progressive decomposition of the system (NIST, 1993): (i) a process is modelled as a sequence of activities, composing a diagram; (ii) in a given diagram (parent diagram), any activity can be further decomposed; (ii) all sub-activities of the one decomposed create another diagram (child diagram) and so on. The modelling components of an IDEF0 representation model are functions, represented by boxes, and data / objects, represented by arrows (Figure 2.5). There are four types of arrows:
– Input arrows representing data or objects that are transformed by the function into output,
– Output arrows representing data or objects produced by a function, – Control arrows represent the conditions required to produce correctly the output, – Mechanism arrow represent the means used to perform a function.
27

Figure 2.5. Components of an IDEF0 representation
Phase 1: System identification The system under study is a performance-based maintenance service (PBMS) and the following assumptions have been taken for simplification of the study:
1. Although in practice a PBMS system can involve several actors, there is only one service provider and one industrial user of the equipment considered in this study.
2. The PBMS is provided to only one equipment within a plant. 3. The performance objective for the PBMS is an equipment availability target.
The purpose of the PBMS system has been defined as “to provide the customer with the agreed equipment availability and service level”. The study considers the following viewpoints: asset management, production management, maintenance management, supply management, logistics, and service management. Figure 2.6 illustrates the context IDEF0 diagram, which is considered as the highest level parental diagram of the PBMS system.
Figure 2.6. IDEF0 representation of the context diagram for a PBMS system
Phase 2: System concept As indicated in Figure 2.6, the high level function of the PBMS system is to perform the right maintenance activities at the right time and in the right way. This function can be further decomposed into a set of tasks which are the following:
– requirements analysis – service offering definition – maintenance planning
– maintenance scheduling – maintenance execution – service monitoring and evaluation.
28

The identification of values of this system is informed by the results of previous research phases, mainly from the exploratory phase. The set of potential values related to a maintenance service have been defined and they are further explained in section 7.2.3.
Phase 3: System requirements In order to identify the requirements of the PBMS system, the functional analysis of the system is done by providing a detailed characterization of the high level function. Figure 2.7 illustrates the functional decomposition of the PBMS system based on the IDEF0 modelling technique.
Figure 2.7. IDEF0 representation of the functional decomposition of tasks within a PBMS system
The results of this study under the system engineering perspective were used for informing the proposal of the value-driven methodology for the design of performance-based maintenance services. Concretely, the value-driven methodology is based on the analysis done of two tasks identified for the PBMS system: requirements analysis and service offering definition.
The final output of this development phase is a proposal of a methodology that structures the process of including sustainable value into a performance-based maintenance service offering. This methodology has been tested during the last research phase, which is explained in next section.
Furthermore, an extensive literature review of different methodologies for PSS design and development has been carried out, specifically during this development phase, in order to analyze their functionalities and study their limitations. This literature review followed a snowballing approach as explained previously.
29
2.2.6. TESTING PHASE This phase aims at testing the output of the previous phase in an industrial reality in order to find some evidence on the actual contribution of the value-driven design methodology for increasing the sustainable value created in a service solution, in the particular case of performance-based maintenance services. The research method used in this testing phase is a case study, concretely a single case study has been done in a particular context that have been considered as adequate for the testing purposes.
Case study design: A single case study is appropriate, according to Yin (2003), under several circumstances that can be explained following any of these five rationales: critical case; extreme or unique case; representative or typical case; revelatory case; and longitudinal case. In this sense, a single case study was considered appropriate for this testing phase due to the special conditions requested for the case selection (explained below) that makes difficult to find more cases under the constraints needed for the testing activities. Moreover, performing a single case allows to reach greater depth on the study (Voss et al., 2002), which could provide greater information for further improvements of the proposed methodology. The unit of analysis of the case study is the dyad provider-customer. The need to have both actors involved in the testing case made specially challenging the case selection process.
The drawbacks of using a single case are related to the limitation in generalizability of conclusions and to the potential introduction of biases due to misjudgment or exaggeration of available data (Voss et al., 2002). This testing phase does not aim at generalizing the results obtained but rather at investigating the potential benefits of the use of the value-driven methodology in a concrete industrial case performed in a controlled environment. The avoidance of biases was prevented during the case development by the involvement of several people from the two companies involved in the case.
Case selection: The target case includes a dyad composed by a maintenance service provider with experience in the provision of different types of maintenance services and a current customer of that service provider that is currently engaging in the process of acquiring a performance-based maintenance service. The service offering should not be already put in place, so this would give the opportunity to test the value-driven design methodology in a new test bed as having already a service settled between both actors would have created some bias during the case development. Thus, both companies should be starting the process of defining the performance-based maintenance service. Moreover, in order to avoid problems related to lack of trust and reluctance regarding data sharing (Brax and Jonsson, 2009), the companies may already know each other or be already engaged in other types of long-term agreements.
Case development: During the case study several meetings and interviews have been carried out in both companies’ sites and data has been collected through several sources of evidence as indicated in next Table 2.4. The application of the value-driven design methodology has been done following the steps described in section 7.2 and in some cases several iterations between steps have been necessary for completeness and accuracy of the application. The type of interviews done are focused interviews which have lasted around one hour. This type of interviews are based on open-ended questions and follows a conversational manner (Yin, 2003), though in the concrete case of those done with the scope of the AHP analysis a set of questions regarding the pairwise comparisons were included during the conversational interviews.
30

Table 2.4. Sources of evidence used during the testing case
Sources of evidence in the testing case study
Documentation Internal communications and reports; Information and articles from the companies’ website
Archival records Plant layout, equipment information and value stream map of the production plant
Interviews 7 focused interviews with area supervisors, production manager, maintenance manager and location manager (1 or 1,5 hours each) and 7 meetings between PhD researcher and service researcher
Direct observations PhD researcher made 2 field visits in the production plant site Participant observation PhD researcher was actively involved in the application of the value-
driven design methodology during the testing case
Case analysis: Interviews were not recorded but short after their realization a meeting to analyze the results was carried out between the PhD researcher and the service researcher. Both researchers took notes during all interviews and confronted them during these analysis-oriented meetings. Once all steps were applied, two meetings took place in order to gather the feedback from both companies involved, under the perspective of a SWOT analysis. The SWOT analysis is a strategic planning method used to evaluate the Strengths, Weaknesses, Opportunities, and Threats of a project or business venture. Here it has been used to guide the discussions during the final meetings with the companies in order to analyze these concrete aspects related to the application of the value-driven design methodology. The feedback from these meetings is discussed in section 8.3.
31

32

3. LITERATURE REVIEW & CURRENT PRACTICE ON
MAINTENANCE SERVICES IN ITALY This chapter presents first the main literature review done for this PhD research. The International State of the Art regarding industrial maintenance is introduced in the first section, while the following two sections presents some insights into the other two bodies of knowledge of this research and highlights the envisaged contribution of maintenance to both of them. Within the literature review is was found necessary to make some comments on the most common performance measures regarding the three bodies of knowledge. Later in the chapter, a study on the current practice regarding maintenance services focalized in the Italian manufacturing industry is described. Eventually, a short section summarizes the main findings and states the gaps found in literature and between literature and actual industrial practice that are addressed in this PhD research.
3.1. INTERNATIONAL STATE OF THE ART ON INDUSTRIAL MAINTENANCE This section introduces the main concepts related to industrial maintenance that are the basis for the research work and are considered necessary to understand the connections and potential contributions of maintenance within the other bodies of knowledge studied in this research, i.e. sustainability and servitization in manufacturing industry.
3.1.1. INDUSTRIAL MAINTENANCE: DEFINITION & SCOPE Maintenance is defined as “the combination of all technical, administrative and managerial actions during the life cycle of an item intended to retain it in, or restore it to, a state in which it can perform the required function” (EN 13306, 2010). By the term industrial maintenance it is understood that the item under concern is an equipment, a set of equipment conforming a production system / line or equipment components which are used in industrial plants.
This definition suggests that there is a myriad of activities within the maintenance function in an industrial plant. Technical activities are those directly related to the action of retaining or restoring the equipment required function, i.e. corrective or preventive actions performed by technical personnel. Administrative activities are the necessary supporting activities for those technical actions, such as documentation preparation/fulfillment, purchasing procedures for spare parts, etc. Managerial actions are those that determine the maintenance objectives, strategies and responsibilities and implement through maintenance planning, maintenance control, and the improvement of maintenance activities and economics (EN 13306, 2010). Therefore, maintenance management has to be considered not only from an operational perspective but also including its strategic and tactical aspects.
Moreover, the activities related to industrial maintenance have to be applied along the whole life cycle of the equipment or industrial system as proposed in the given definition. Equipment life cycle can be divided in three phases: Beginning of Life (BOL), including design and manufacturing; Middle of Life (MOL), use phase encompassing the equipment service time and its maintenance; End of Life (EOL), including reuse and disposal (Kiritsis et al., 2003). In this regard, although traditionally maintenance activities have been limited only to the equipment use phase, the maintenance function is enlarging its involvement also to other phases, such as BOL and EOL as a consequence of its main role regarding life cycle management (Takata et al., 2004). Levrat et al. (2008) also reflects on the fact that maintenance objectives are present along the whole product lifecycle (Figure 3.1), proposing an enlarged scope of maintenance commitment in all life cycle phases. For example, Markeset and Kumar (2003) mention two main approaches while considering maintenance during the design phase: (i) design out
33

maintenance, minimizing the maintenance needs of the equipment or (ii) design for maintenance, considering criteria of reliability, maintainability and product support.
Figure 3.1. Maintenance objectives along the equipment life cycle (Levrat et al., 2008)
Furthermore, the given definition highlights the main goal of maintenance as keeping the equipment in a state that it can perform its required function. A broader perspective of equipment function considers not only its primary function, i.e. its intended purpose to appear in the process, but also secondary functions, which can be even more crucial to safety than primary functions, such as: auxiliary functions, protective and control functions, information functions and interface functions (Crespo Márquez, 2007).
Thus, the scope of industrial maintenance includes different dimensions and perspectives, such as a broad variety of activities, objectives allocated along the whole equipment lifecycle and the assurance of multiple required functions.
3.1.2. MAINTENANCE MANAGEMENT The broad scope of industrial maintenance suggests that maintenance function has a multidisciplinary character that, indeed, has been already highlighted by some authors (Murthy et al., 2002; Karim et al., 2009). The multidisciplinary nature of maintenance is observed, according to Murthy et al. (2002), through a maintenance management approach that encompasses the following features: (i) a scientific understanding of the degradation mechanisms and equipment condition analysis; (ii) quantitative models to predict equipment degradation; (iii) a strategic perspective for managing maintenance. The strategic dimensions of maintenance management has been studied by Tsang (2002) who states that “considering maintenance a purely tactical matter is myopic”. In this regard, Simões et al (2011) indicates that it is necessary to manage maintenance and its related performance aspects from a strategic perspective. Maintenance management has also been considered as involving both the formulation and the execution of the maintenance strategy (Murthy et al., 2002; Crespo Márquez et al., 2009). In this regard, Tsang (2002) identified four strategic dimensions of maintenance management: (1) service delivery options; (2) organization of maintenance function and tasks; (3) selection of maintenance policies; (4) maintenance support design.
The first dimension is understood as the decision between in-house or outsourcing. In this sense, when the decision of outsourcing some or all maintenance activities is taken, it is important to develop an overall plan for outsourcing process beforehand (Campbell, 1995). Success in outsourcing is a matter of how well is managed and how much benefit is obtained from the perspective of the company contracting-out maintenance tasks (Cholasuke et al., 2004).
34

The second dimension concerns the maintenance organization and work structuring. Maintenance work can be classified by its planning and characteristics as suggested by Kelly (1997) in three groups: first-line work, including tasks performed in daily basis such as frequent preventive routines; second-line work, considering maintenance jobs that takes less than two days to be performed and needs to be prioritized, planned and scheduled; and third-line work, including those jobs creating peak loads such as major shutdown and plant overhaul. Regarding the definition of maintenance organization, Gómez Fernández and Crespo Márquez (2012) discuss on several key aspects that needs to be considered:
– Types of internal and external relationships with suppliers, other departments, clients, etc. – Hierarchical levels for operation and management activities. – Centralization and decentralization of operations and management. – Use of internal or external resources (subcontracting) for the activities development. – Measurement and development of human skills and specialization. – Degree of support on information and communication technologies.
The third dimension comprises the adoption of a maintenance methodology to support the selection of maintenance policies. Four basic approaches for maintenance are indicated by Tsang (2002): run-to-failure, preventive maintenance, condition-based maintenance and design improvement. Decisions regarding which approach would suit best a concrete item can be determined by using maintenance techniques in isolation or established methodologies such as Reliability-Centered Maintenance (RCM) or Total Productive Maintenance (TPM) (Tsang, 2002; Garg and Deshmukh, 2006).
The fourth dimension considers the design of the infrastructure that supports maintenance, understanding that this design would include decisions to be taken regarding several aspects concerning maintenance personnel such as training, autonomy, reward and recognition as well as performance measurement, maintenance information systems and maintenance technologies (Tsang, 2002).
Crespo Márquez and Gupta (2006) have proposed a basic supporting structure for maintenance management based on three pillars: the Information Technology (IT) pillar, maintenance engineering (ME) pillar and organizational techniques pillar. The IT pillar would support the transformation of equipment data into information which could be used to prioritize tasks and activities and it comprises the deployment of a computerized maintenance management system (CMMS) and the application of condition monitoring technologies and the e-maintenance concept. The ME pillar is compound by a set of techniques that can be used for designing the maintenance system, improving maintenance execution and controlling maintenance performance. The organizational pillar includes all techniques that can foster relationships competency within and outside the organization such as centralized-decentralized configurations, team work and internal / external coordination and communication. They have also identified a set of major functions that each pillar contributes to support; they are summarized in next Table 3.1.
Table 3.1. Functionalities within each pillar proposed by Crespo Márquez and Gupta (2006)
Supporting pillar Functionality supported by the pillar IT pillar Capturing and processing information
Providing maintenance support at operational level Deriving and tracking maintenance performance indicators Supporting maintenance planning Auditing maintenance activities Integrating maintenance information system with company’s information system
35

Supporting pillar Functionality supported by the pillar ME pillar Designing maintenance plan and its continuous improvement
Optimizing maintenance policies Measuring and controlling ME activities
Organizational techniques pillar
Providing flexibility into maintenance organization Supporting communication and coordination with other functional areas Improving external relationships
E-maintenance concept as maintenance support E-maintenance as a concept is often discussed in literature as linked to both the emergence of new e-technologies for maintenance optimization and to a new way of thinking maintenance as a supporting pillar of e-manufacturing and e-business (Lee, 2001; Koç et al., 2005; Muller et al., 2008; Iung et al., 2009). According to Muller et al. (2008) E-maintenance is defined as a “maintenance support which includes the resources, services and management necessary to enable proactive decision process execution”, where support refers to e-technologies and e-maintenance operations and activities.
New maintenance capabilities enabled by e-maintenance have been identified and classified by Muller et al. (2008) into 3 categories: maintenance type and strategies, maintenance support and tools, maintenance activities (see a summary in Table 3.2).
Table 3.2. Categories of e-maintenance capabilities identified by Muller et al. (2008)
E-maintenance capabilities Maintenance type and
strategies Maintenance support and tools Maintenance activities
- Remote maintenance - Cooperative / collaborative maintenance - Immediate / on-line maintenance - Predictive maintenance
- Fault/failure analysis - Maintenance documentation / record - After-sales services (support anywhere and anytime)
- Fault diagnostics / localization - Repair / rebuilding - Modification/improvement knowledge capitalization & management
3.1.3. METHODS & TOOLS IN MAINTENANCE Duffuaa et al. (2001) reflect on the maintenance system as a simple input-output system, where the inputs are manpower, management, tools, equipment, etc.. and the output is the equipment working reliably and well configured to achieve the required performance. They assure that the required activities for this system to function are: maintenance planning (workload forecast, capacity and scheduling); maintenance organization (work design, standards, work measurement, project administration); and maintenance control of works, materials, inventories, costs and quality. All these activities could be supported by a variety of methods and tools. Some of them are necessary to be introduced as part of the contextual literature review for this PhD research and are described herein.
Reliability-Centered maintenance (RCM) for designing the maintenance plan RCM was originated in 1960s by the North American government and the aeronautical industry in order to establish a logical process to design appropriate maintenance activities with optimal frequency (Crespo Márquez, 2007). The basis of this method is the concept of restoring equipment function rather than keeping the equipment in ideal conditions (Duffuaa and Haroun, 2009) and it prioritizes equipment maintenance by assigning levels of criticality based on the consequences of failure (Siddiqui and Ben-Daya. 2009). The actual maintenance needs for the equipment are identified within its operating context by analyzing a set of seven questions (Moubray, 1997):
36
1. What are the functions and associated performance standards of the asset in its present operating context?
2. In what ways does it fail to fulfil its functions? 3. What causes each functional failure? 4. What happens when the failure occurs? 5. In what way does each failure matter? 6. What can be done to predict or prevent each failure? 7. What should be done if a suitable proactive task cannot be found?
The first five questions are part of a technique named Failure Modes and Effects and Analysis (FMEA) that deals with the identification of equipment functions, their failure modes and the consequences of the failures, while the final two questions compound the RCM logic for identification of the most adequate maintenance activity in order to face each failure mode (Crespo Márquez, 2007). All these questions have to be answered during the implementation of the RCM method orderly and methodically (Moubray, 1997).
Failure Modes and Effects and Analysis (FMEA) for failure analysis and support to maintenance plan design FMEA is a highly-structured inductive assessment which reveals consequences of all possible failure modes of the system under study. Traditionally, it has been a design tool used for the systematic identification of design weaknesses (Crespo Márquez, 2007). Applied to maintenance, the failure modes are evaluated at component, subsystem and system levels and also their effects on the system and the probability of occurrence are defined. According to Ben-Daya (2009), the typical FMEA application considers the evaluation of each potential failure mode and effect under three factors: (i) severity, i.e. the consequence of the failure when it happens; (ii) occurrence, i.e. the probability or frequency of the failure; (iii) detection, i.e. the probability of the failure being detected. These three factors are combined to calculate the risk priority number (RPN) by multiplying all of them:
Risk Priority Number (RPN) = Severity * Occurrence * Detection
The RPN is then used to rank failure modes and prioritize maintenance activities. This can be done in an iterative manner in order to update failure modes and effects during both design development and the entire equipment life time (Cassanelli et al., 2006).
Total Productive Maintenance (TPM) for maintenance organization and continuous improvement TPM has been originated in Japan in the 1970s by extending preventive maintenance to become more like productive maintenance, meaning that maintenance is performed while production goes on and trying to minimize troubles for production (Ahuja, 2009). TPM has the overall objective of engaging employees at all levels and functions in an organization to maximize the overall effectiveness of production equipment, thus involving a fundamental organizational change (Crespo Márquez, 2007). According to Riis et al. (1997), several aspects related to TPM are the following:
– It tries to maximize overall equipment effectiveness and overall efficiency; – It develops a preventive maintenance program for the life-cycle of the equipment; – It uses team-based concepts; – It involves operators in maintaining the equipment; – It uses motivational management (by creating autonomous small groups) to promote
preventive maintenance.
37

3.1.4. MAINTENANCE OUTSOURCING As mentioned above, Tsang (2002) considers outsourcing decisions within the strategic dimensions of maintenance management. Indeed, he points out that the decisions should be made considering the context of the overall business strategy and by answering a set of three questions:
– What should not be outsourced? – What type of relationship with the external supplier should be adopted? – How should the risks of outsourcing be managed?
In this regard, Murthy et al. (2002) differentiate between maintenance management and maintenance execution from an outsourcing perspective and then claim that while maintenance execution could be outsourced based on a cost reasoning, maintenance management and planning shouldn’t be outsourced due to their closeness with production, the lack of common long-term vision with the service supplier and the large risks related to potential loss of knowledge. Nevertheless, maintenance outsourcing or contracting out maintenance activities has been a common practice in manufacturing companies (Tarakci et al., 2006). Two trends can be seen as the main motives for this (Kumar, 2008): (i) asset / equipment managers tend to outsource maintenance function in order to concentrate in their core business activities and pursue a more lean and flat maintenance organization, (ii) asset / equipment managers establish contractual agreements with the equipment suppliers which become responsible of performing the repair and maintenance activities necessary for keeping a demanded level of availability of the equipment.
The decision of outsourcing or contracting out maintenance is not any more based on just cost-based decision models but taking into consideration other strategic factors, both tangible and intangible (Bertolini et al., 2004). In this regard, some potential advantages of outsourcing maintenance have been mentioned by Jackson and Pascual (2008) regarding the access to the latest maintenance technology and to higher level of expertise brought by provider’s personnel, a more efficient distribution of managers’ time and effort and some economic benefits related to reduce the risk of high costs and less capital investment. The same authors mentioned also some disadvantages that are associated to the cost of outsourcing, the dependency on the service provider and the loss of maintenance knowledge and personnel.
Traditionally, contracting out maintenance have been done by the application of three types of contracts (Martin, 1997): Work package contracts, Performance contracts and Facilitator contracts. The work package contract represents the most basic type and the decisions regarding the activities to perform is taken by the customer, i.e. the equipment owner or user. The contractor, i.e. the maintenance service provider, executes the maintenance activities agreed with the customer and the payment is based on unit rate or lump sum. A variant of this contract type regards maintenance management consultancy. The performance contracts are based on the contractors’ guarantee of a certain level of equipment availability, failure rates, response time or time to restoration desired by the customer and the payment is made via a budget provided to the contractor. A key element in this type of contract is the relationship between both parties involved. The facilitator contract implies that the contractor keeps the ownership of the equipment, while the customer pays for the time of use of the equipment and / or the actual production units finalized. This type of contract is also known as term lease contract.
Furthermore, these service contracts applied to industrial equipment can be offered by types of companies: the equipment manufacturer, a service provider that is dependent on the equipment manufacturer or an independent service provider (Kumar et al., 2004).
38
Performance-based contracts Performance-based contracting (PBC) approaches have been mainly developed in aerospace and defense industry, while being still less developed and just recently gaining importance in other sectors such as transport, automotive and machinery and equipment manufacturing industries (Hypko et al., 2010a). In this type of contracts, industrial customers are transferring responsibility to equipment manufacturers through equipment availability agreements (Datta and Roy, 2010) regarding all maintenance activities for the equipment. Equipment manufacturers / service providers could then decide to perform more preventive maintenance rather that repairs, as a means to control the service demand and optimize the service operations (Colen and Lambrecht, 2012).
The industrial customers, therefore, evaluate the service in terms of the value offered rather than its price alone (Stremersch et al., 2001), this leads to different types of payment methods. Concretely, the payment can be done by assigning a budget to the provider or following other payment approached based on the results obtained. Hypko et al. (2010a) consider two types of payment approaches within PBC. On one side, the payment method can be based on a pay-on-availability approach. On the other side, the payment method can be related to production outcomes, so following one of the following approaches: pay-per-unit, pay-on-production or pay-per-use.
In this type of contracts, the reputation of the provider and the level of information detail provided on maintenance activities are considered as highly important attributes (Stremersch et al., 2001). A service agreement, therefore, should describe the key content of the service, the responsibilities and the expected performance levels (Kumar et al., 2004).
Moreover, no consistent terminology has been agreed in research fields for this type of service approach (Hypko et al., 2010b). PBC is also named as outcome-based contracting (Ng et al., 2009), functional product (Kumar and Kumar, 2004; Markeset and Kumar, 2005), Total Care Products (Alonso-Rasgado et al., 2004), full service offerings (Stremersch et al., 2001) and performance contracting (Buse et al., 2001). Other similar general service-based business concepts are integrated solutions, functional sales, servicizing, product service systems and product-life extension services (Lay et al., 2009). There is then an envisaged connection between this type of contracts and the concept of servitization introduced in section 1.2, which is further explored later in section 3.3.2.
3.1.5. MAINTENANCE PERFORMANCE MEASUREMENT The main sense of designing maintenance management models is to continuously improve maintenance performance (López Campos and Crespo Márquez, 2009). New proposals of maintenance management models themselves or a combination of existing models could be an interesting source of inspiration for the development of maintenance performance measurement systems.
For example, Cholasuke et al. (2004) understand key measures in maintenance as related to the successful implementation of a maintenance framework. Taking as starting point the success factors provided in previous literature, they identified nine areas of analysis connected to effective maintenance management. The nine areas are the following: policy deployment & organization, maintenance approach, task planning & scheduling, information management & CMMS, spare parts management, human resource management, financial aspect, continuous improvement, contracting out maintenance. The analysis carried out revealed a positive contribution to effective maintenance management of two variables: maintenance approach (which concerns whether there is a tendency towards preventive rather than corrective maintenance and the employment of autonomous maintenance or not); and continuous improvement (which is based on a proactive maintenance and the use of performance measurement).
39

Indeed, maintenance performance goals and measurement help companies and plant managers to drive continuous improvement in plant and maintenance performance with respect to business and maintenance objectives, as well as to realize a benchmarking of their performance within industry (Rosqvist et al., 2009). According to Simões et al (2011), companies which tend to perceive maintenance as a strategic competitive resource would use consistently the maintenance performance measures in an integrated information system and broader benchmarking practices.
According to Parida and Kumar (2006), the main reasons for measuring maintenance performance are the following:
• to measure the value created by maintenance process; thus, understanding the actual contribution to business goals and supporting the adaptation to new trends in operation and maintenance strategy, i.e. those regarding reduction of production loss and process waste,
• to justify the organization’s investment made in maintenance organization; i.e. understanding whether there is a return on the resources consumed,
• to revise resource allocations; i.e. to determine whether more resources are needed or whether changes are to be made in order to increase maintenance effectiveness,
• to understand the contribution of maintenance towards Health, Safety and Environmental (HSE) issues,
• to effectively manage knowledge in the company, especially regarding changes towards predictive activities enabled by new advanced technologies,
• to integrate innovations regarding organizational structural changes, providing a rewarding return for maintenance function.
Maintenance indicators have been categorized in different ways by different authors, presenting the diversity of areas of interests in maintenance performance (Muchiri et al., 2011). Table 3.3 presents some categories suggested by several authors in literature.
Table 3.3. Categories for maintenance performance indicators.
Author/s, year No. of categories
Categories for maintenance performance indicators
De Groote, 1995 2 Economic ratios; technical ratios Campbell, 1995 3 Equipment performance; Cost performance; Process performance Coetzee, 1997 4 Maintenance results; Maintenance productivity; Maintenance operational
purposefulness; Maintenance cost justification Wireman, 1998 4 Corporate indicators; Financial indicators; Effectiveness and efficiency
indicators; Tactical and functional indicators Arts et al., 1998 3 Strategic indicators; Tactical indicators; Operational indicators Kutucuoglu et al., 2001
5 Equipment related performance; Task related performance; Cost related performance; Immediate customer impact related performance; Learning and growth related performance
Alsyouf, 2006 4 Innovation and growth perspective; Maintenance perspective; Production perspective; Downstream organization
Weber and Thomas, 2006
2 Leading indicators; Lagging indicators
Parida and Chattopadhyay, 2007
7 Equipment / process related; Cost / finance related; Maintenance task related; Learning growth and innovation; Customer satisfaction related; Health, safety, security and environment; Employee satisfaction
3 Strategic / top management; Tactical / middle management; Functional / operational
Crespo Márquez, 2007
3 Equipment operational dependability; maintenance management effectiveness; maintenance management efficiency
EN 15431, 2007 3 Economic indicators; Technical indicators; Organizational indicators 40
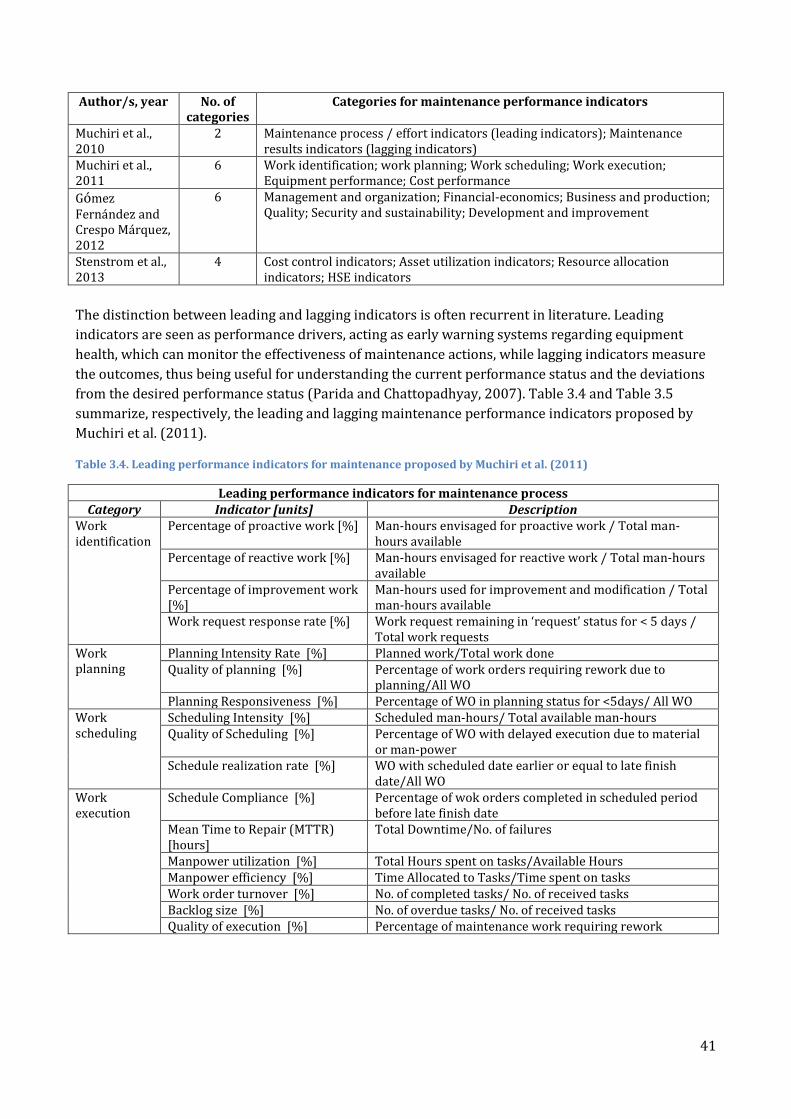
Author/s, year No. of categories
Categories for maintenance performance indicators
Muchiri et al., 2010
2 Maintenance process / effort indicators (leading indicators); Maintenance results indicators (lagging indicators)
Muchiri et al., 2011
6 Work identification; work planning; Work scheduling; Work execution; Equipment performance; Cost performance
Gómez Fernández and Crespo Márquez, 2012
6 Management and organization; Financial-economics; Business and production; Quality; Security and sustainability; Development and improvement
Stenstrom et al., 2013
4 Cost control indicators; Asset utilization indicators; Resource allocation indicators; HSE indicators
The distinction between leading and lagging indicators is often recurrent in literature. Leading indicators are seen as performance drivers, acting as early warning systems regarding equipment health, which can monitor the effectiveness of maintenance actions, while lagging indicators measure the outcomes, thus being useful for understanding the current performance status and the deviations from the desired performance status (Parida and Chattopadhyay, 2007). Table 3.4 and Table 3.5 summarize, respectively, the leading and lagging maintenance performance indicators proposed by Muchiri et al. (2011).
Table 3.4. Leading performance indicators for maintenance proposed by Muchiri et al. (2011)
Leading performance indicators for maintenance process Category Indicator [units] Description
Work identification
Percentage of proactive work [%] Man-hours envisaged for proactive work / Total man-hours available
Percentage of reactive work [%] Man-hours envisaged for reactive work / Total man-hours available
Percentage of improvement work [%]
Man-hours used for improvement and modification / Total man-hours available
Work request response rate [%] Work request remaining in ‘request’ status for < 5 days / Total work requests
Work planning
Planning Intensity Rate [%] Planned work/Total work done Quality of planning [%] Percentage of work orders requiring rework due to
planning/All WO Planning Responsiveness [%] Percentage of WO in planning status for <5days/ All WO
Work scheduling
Scheduling Intensity [%] Scheduled man-hours/ Total available man-hours Quality of Scheduling [%] Percentage of WO with delayed execution due to material
or man-power Schedule realization rate [%] WO with scheduled date earlier or equal to late finish
date/All WO Work execution
Schedule Compliance [%] Percentage of wok orders completed in scheduled period before late finish date
Mean Time to Repair (MTTR) [hours]
Total Downtime/No. of failures
Manpower utilization [%] Total Hours spent on tasks/Available Hours Manpower efficiency [%] Time Allocated to Tasks/Time spent on tasks Work order turnover [%] No. of completed tasks/ No. of received tasks Backlog size [%] No. of overdue tasks/ No. of received tasks Quality of execution [%] Percentage of maintenance work requiring rework
41

Table 3.5. Lagging performance indicators for maintenance proposed by Muchiri et al. (2011)
Lagging performance indicators for maintenance process Category Indicator [units] Description
Equipment performance
No. of failures [No.] No. of failures classified by their consequences: operational, non-operational, safety, etc.
Failure / Breakdown frequency [No./unit time]
No. of failures per unit time (a measure of reliability)
MTBF [hours] Mean Time Between Failure (a measure of reliability) Availability [%] MTBF / (MTBF + MTTR) = Uptime /(Uptime + downtime) OEE [%] Availability * Performance rate * Quality rate
Cost performance
Direct Maintenance Cost [$] Total maintenance cost Breakdown Severity [%] Breakdown cost / direct maintenance cost Maintenance Intensity [$/unit production]
% of maintenance cost per unit of products produced in a period
Maintenance Cost component over manufacturing cost [%]
% Maintenance cost / total manufacturing cost
Equipment Replacement Value (ERV) [%]
Maintenance cost / new condition value
Maintenance stock turnover [No.] Ratio of cost of materials used from stock within a period Cost of personnel [%] Staff cost / total maintenance cost Cost of subcontractors [%] Expenditure of subcontracting / total maintenance cost Cost of supplies [%] Cost of supplies / total maintenance cost
Differences regarding maintenance performance measurement frameworks are also evident regarding the choice of indicators, though some vital indicators are agreed among authors, such as number / frequency of breakdowns, Mean Time To Failure (MTTF), availability and Overall Equipment Effectiveness (OEE) (Muchiri et al., 2010). The latter is a measure of equipment productivity introduced by the TPM concept (Nakajima, 1988) which considers losses in equipment availability, production rate and quality rate.
3.2. INDUSTRIAL MAINTENANCE WITHIN SUSTAINABLE MANUFACTURING This section presents the International State of the Art regarding sustainability in manufacturing industry in the first place and then introduces the envisaged role of maintenance as a potential contributor to achieve sustainable manufacturing goals. The section finishes with some insight into different proposals for sustainability performance measurement from an industrial perspective.
3.2.1. INTERNATIONAL STATE OF THE ART ON SUSTAINABLE MANUFACTURING A systematic literature review has been done to study the concept of sustainable manufacturing and explore its main dimensions according to a set of selected papers from literature. The systematic method employed (explained in section 2.3.2.) identified 20 publications which were analyzed in order to find which are the definitions given to the concept of sustainable manufacturing and which are its constituting dimensions and elements according to literature. The list of 20 publications selected can be found in Appendix B.
Within the articles selected, only 8 definitions were found (see Table 3.6); the rest of articles either repeat one of these or not include any definition at all. Among the 8 definitions, 7 are original contributions of the authors and 1 is used in some articles but it is a reference from US Department of Commerce (DOC). The most frequently used is the definition given by DOC, which was found in the 20% of the articles reviewed, considering all articles even those which not propose or use any definition of the concept.
42

Sustainable manufacturing is defined in many different ways. It is seen as a paradigm, a strategy, a set of technologies or a system. This shows very different perspectives of the concept, some more operational and others more strategic, so the understanding of the nature of the concept remains quite blurry. Most of the definitions consider sustainable manufacturing linked to either the characteristics of the transformation / manufacturing process or the characteristics of the final products obtained in the manufacturing process. Half of the definitions focus on the transformation process, while one third emphasize on the final products. Only 2 definitions mention both. The vision of sustainability comprising three aspects (economic, environmental and social) is supported in half of the definitions, while the others focus only on two aspects (economic and environmental). Thus, the social dimension is sometimes neglected while environmental dimension is always considered in the definitions.
Table 3.6. Definitions of sustainable manufacturing in the selected articles
AUTHOR/S DEFINITION Despeisse et al., 2012 Sustainable Manufacturing can be defined as a new paradigm for developing socially
and environmentally sound techniques to transform materials into economically valuable goods
Garetti and Taisch, 2012
Sustainable Manufacturing can be defined as the ability to smartly use natural resources for manufacturing, by creating products and solutions that, thanks to new technology, regulatory measures and coherent social behaviors, are able to satisfy economic, environmental and social objectives, thus preserving the environment, while continuing to improve the quality of human life.
Singh and Lal, 2012 Sustainable Manufacturing is defined as developing technologies to transform materials without the emission of greenhouse gases, use of non-renewable materials or generation of waste.
Yuan et al., 2012 Sustainable Manufacturing has attracted enormous attention in recent years as a comprehensive strategy for reducing the environmental impact and improving the economic performance of manufacturing industry.
Feng and Joung, 2011 Sustainable Manufacturing is the creation of a product that throughout its entire lifecycle, the product has minimal negative impact on the environment, conserves energy and natural resources, is safe for human beings, and is economically sound for both producer and consumer.
Rachuri et al., 2011 Sustainable Manufacturing is a systems approach for the creation and distribution (supply chain) of innovative products and services, that: minimizes resources (inputs such as materials, energy, water, and land); eliminates toxic substances; and produces zero waste that in effect reduces greenhouse gases, e.g., carbon intensity, across the entire life cycle of products and services.
Jovane et al., 2008 Sustainable Manufacturing is a manufacturing system that produces value. Considering that total value is given by the sum of both: natural value: space, functionality of eco-system (eco-system services), mineral resources, energy, bio resource and artificial value: primitive services potential, functionality of material, functionality of products.
United States Department of Commerce (DOC), 2008
Sustainable Manufacturing is the creation of a manufactured product with processes that have minimal negative impact on the environment, conserve energy and natural resources, are safe for employees and communities, and are economically sound.
Besides the analysis of definitions, the 20 articles and their contributions were studied in order to understand which are the main dimensions of sustainable manufacturing and the elements within the dimensions. The levels of analysis used in the selected articles are quite different, so first of all the articles were classified according to two categories for their level of analysis: manufacturing industry or manufacturing company/plant. Due to the different nature of the articles selected, their main contributions were also identified in order to take it into account while doing the later analysis of dimensions and elements. Contributions vary from an analysis of manufacturing activities, a review of trends in industry, a categorization of sustainability indicators or a comparison of sustainable manufacturing strategies, as examples. As a general trend is worth to mention that a life cycle
43

approach is linked to sustainable manufacturing in 60% of articles studied, which represents an important finding as life cycle perspective is a main element in the new role of maintenance in manufacturing.
A more in-depth evaluation of the levels of application for the concept of sustainable manufacturing brought out that it can be seen from different perspectives: system, process or product. The more mentioned perspectives are process or product related. The system perspective is mentioned scarcely and mostly in those articles which analyze the whole manufacturing industry (in 45% of those articles, but only 25% of total articles mention a systems perspective).
The three main aspects of sustainability mentioned frequently in literature, i.e. economic, environmental and social, were almost always found as broad dimensions of sustainable manufacturing in the articles analyzed. Another broad dimension which some authors add as a fourth element to be considered for sustainable manufacturing is technology (50% of articles mention technology or technological innovation). Only one article mentions education as another dimension of sustainable manufacturing.
The elements within the main dimensions in each article were also analyzed to reach a level of detail that would enable to perform later a deep study of the contribution of maintenance to sustainable manufacturing. Figure 3.2 presents an overview of the elements found within the most mentioned dimensions of sustainability, according to the literature review.
Figure 3.2. Main elements within the dimensions of sustainable manufacturing in the selected articles
Regarding a strategic perspective of sustainable manufacturing, Rachuri et al. (2011) propose a set of critical drivers which are: a business case for sustainable manufacturing, the promotion of eco-innovation, the development of sustainability metrics and tools, the reduction of energy consumption, the position of neutral and trusted standards and programs. The primary strategies for sustainable manufacturing have been studied by Rashid et al. (2008), from the simplest and most easily adopted (waste minimization) to the most philosophical and complex (eco-efficiency). Eco-efficiency is then seen as the broadest of the strategies, aiming at preventing waste and increasing resource productivity while having a wider scope that involves addressing earth carrying capacity and quality of life, thus including also the social dimension.
Sustainability related literature frequently suggests the consideration of a broad set of stakeholders in order to achieve more sustainable performance. A multi-stakeholder perspective of sustainable manufacturing is only partially supported by this review of selected articles as not only the customer of the company, but also other stakeholders such as suppliers, employees and the community are mentioned in 20% of articles. Concretely, Rosen and Kishawy (2012) mention customer and supplier
44

attitudes and support to sustainability as well as community engagement to sustainability as important contributors of sustainability in the manufacturing industry.
One of the articles (Joung et al., 2012), which propose a categorization of sustainability indicators, mentions two elements within the particular category named Performance Management: conformance and program & policy. This is linked to other elements mentioned in other articles as they also refer to performance measures, such as environmental controls, economic performance, macro-social performance, production efficiency, energy efficiency, materials optimization. Performance measurement or management seems to be transversal to the sustainability dimensions mostly considered by the articles selected and could be used also to evaluate whether a balance between dimensions is achieved.
Finally, it is worthy to point out that only one article (Garetti and Taisch, 2012), which makes a review of the main research areas for sustainable manufacturing, suggests maintenance as a one lever for improvement of sustainable performance in manufacturing. Next subsection introduces the main aspects highlighted in literature regarding the role of maintenance as a contributor to sustainability in manufacturing industry.
3.2.2. MAINTENANCE ENVISAGED ROLE FOR SUSTAINABLE MANUFACTURING Several authors has envisaged a change in the role of maintenance within manufacturing industry due to the current challenges and trends in manufacturing brought by sustainability. This section gives a brief overview of this new role for maintenance according to findings in literature.
Sustainability in manufacturing would involve the integration of the three sustainability perspectives for technological and organizational measures in production management (Herrmann et al.,2008). Maintenance function would then play an important role for sustainable manufacturing, regarding several aspects to which it can contribute such as technological innovations and asset life cycle management (Garetti, 2011).
Technological innovations are seen as means for achieving competitive advantages related to sustainability (Elkington, 1997). Advance maintenance technologies could support both more efficient production of quality products and more sustainable production processes (Garetti, 2011). Technological innovations in maintenance allows to change from “fail and fix” to “predict and prevent” maintenance practices (Lee et al., 2006) and to integrate manufacturing operations with the company’s functional objectives (Lee, 2003). The fundamental enabler of predictive manufacturing is transparency, i.e. visibility of the actual condition and degradation state of manufacturing assets (Lee and Lapira, 2013), which would remove uncertainties regarding production capabilities and enable more informed production decisions. Real time monitoring, performance assessment and advanced technologies contribute to achieving this transparency in manufacturing, as they are part of predictive maintenance systems, named also e-maintenance systems (Koç et al., 2005). E-maintenance concept has been briefly introduced in previous section 3.1.2.
A life cycle perspective for products and manufacturing assets is often mentioned in literature regarding sustainability (Seliger et al., 2008). This emphasis on the life cycle perspective of manufacturing assets has caused the redefinition of the role of maintenance as being “a prime method for life cycle management whose objective is to provide society with the required functions while minimizing material and energy consumption” (Takata et al., 2004), pointing out also the potential environmental value provided by maintenance. The commitment of maintenance has also been enlarged to the whole asset life cycle, not just in the operation phase as it was already mentioned in
45

section 3.1.1. Longer equipment lifecycles and more sustainable performances regarding the three sustainability dimensions could be achieved through effective and efficient maintenance (Garetti and Taisch, 2012). In this sense, the contribution of maintenance to the extension of the useful life of equipment has been studied under a sustainability perspective by some authors: Yan et al. (2012) provide a methodology which supports maintenance decisions in order to contribute to the extension of the useful life of manufacturing facilities; Carvalho et al. (2008) investigate the extension of useful life through retrofit analysis.
From an organizational viewpoint of production management, some authors have highlighted the potential contribution of maintenance in several aspects. Kaur et al. (2013) propose that the synergic implementation of total quality management (TQM) and total productive maintenance (TPM) would contribute to company’s growth and sustainability. TPM as a means for reaching sustainability in manufacturing has also been mentioned in Ahuja and Khamba (2008, 2009) and Cakmakci and Karasu (2007). Crespo Márquez and Iung (2007) mention sustainability as one of the factors to be considered when performing an assessment of availability and reliability of a manufacturing system. According to Liyanage (2007), operations and maintenance performance could portray improvements to business regarding their sustainability requirements. In this regard, Bechthold et al. (2009) suggest that a close cooperation between operations and maintenance could provide sustainable improvements in maintenance processes. Ojanen et al. (2012) perceive a connection between sustainability and manufacturing assets through the purchase of industrial maintenance services offered by service providers.
Eco-efficiency is seen as the most comprehensive and complex strategy for sustainable manufacturing (Rashid et al., 2008). Maintenance role within life cycle management is foreseen as a contributor to the enhancement of eco-efficiency while preserving equipment availability, reliability, safety and maintainability (DeSimone, and Popoff,1997; Cunha et al., 2004; Levrat et al., 2008). Good maintenance is suggested as an enabler of energy efficiency (Tousley, 2010; Demirbas, 2008). Moreover, Seow and Jiying (2006) mention that maintenance strategy is an approach that can extend product life time and improve product quality and system efficiency for SMEs.
Furthermore, the integration of sustainability into company’s logic and operations encompasses two approaches as discussed in section 1.1.3: a broader perspective of value, including not only economic value but also environmental and social aspects of value, and a multi-stakeholder perspective. The concept of value and a wider view of stakeholders have also been applied to maintenance function in manufacturing. Some contributions in this regard are introduced in the following.
Maintenance Value and Maintenance Stakeholders The traditional view of maintenance as just an expense for the company is changing due to the introduction of the concept of value in maintenance (Naughton and Tiernan, 2012). This has recently risen, so still not a clear definition of maintenance value is commonly agreed in literature. Some authors understand it as just economic value (Marais and Saleh, 2009), connected to productivity and profitability (Alsyouf, 2007), while others advocate to give also environmental and social perspective to the concept (Liyanage and Kumar, 2003; Rosqvist et al., 2009), including environmental friendliness, health and safety, skillful personnel as potential benefits. Not so many concrete implementations of the concept of maintenance value have been proposed till now although some remarkable contributions have been done towards the integration of the value concept in maintenance function and activities. As an example, in their value-driven maintenance planning approach, Rosqvist et al. (2009) introduce the value tree as a reflection of the fundamental objectives of company and plant managers into maintenance objectives.
46

However, the value of maintenance could go beyond the contribution to company and plant managers’ objectives as can be foreseen from the wide typology of value discussed above. Maintenance may have a say in other company internal processes, such as production process, or in the fulfillment of external stakeholders’ requirements, for example regulatory bodies (Söderholm et al., 2007). Nevertheless, the literature does focus frequently just on the cost of maintenance but not on its value; this could occur due to the difficulty on quantifying the benefits of maintenance (Marais and Saleh, 2009).
3.2.3. SUSTAINABILITY PERFORMANCE MEASUREMENT IN MANUFACTURING Understanding and translating strategic sustainability objectives into concrete actions at project-specific levels is a very challenging task for companies (Stirling, 1999) According to Arena et al. (2009), sustainability reporting is a main tool through which companies can implement proactive sustainability strategies. This broad term sustainability reporting can be seen as a synonymous with others used to describe reporting on economic, environmental, and social impacts, such as triple bottom line, corporate responsibility reporting, etc. (G3.1 Guidelines, 2011). The Triple Bottom Line (TBL) is a concept which considers a balance between economic, environmental and social issues in organizations (Elkington, 1997). Thus, sustainability performance measurement would need to address these three dimensions in order to offer a complete overview of the balance reached among them.
Arena et al. (2009) made a review of the contributions in literature regarding the types of indicators to be measured in a sustainability-based strategy (i.e. quantitative financial, quantitative non-financial and qualitative) and how the information should be collected and disclose (i.e. reports or indicators). These are some of their main findings:
– The sets of indicators proposed in literature are widely diversified, with a growing focus on quantitative non-financial measures;
– In many cases sustainability reporting focuses chiefly on environmental issues, with less emphasis on social performance,
– Narrative information about environmental and social performance is more common than quantitative indicators.
Contributions in the area of sustainability performance measured are shaped in two ways. On the one hand, there are several proposals of standards or frameworks for sustainability performance proposed by standardization or regulation bodies, such as the International Standard Organization (ISO) or the European Commission (EC), or by other organizations, such as the Global Reporting Initiative (GRI). Some of these standards and frameworks are the following:
– ISO 14001:2004 Environmental Management System, – ISO 14031:1999 Environmental Performance Evaluation, – ISO 14040:2006 series Environmental Management – Life Cycle assessment – principles and
framework, – ISO 14064:2006 Greenhouse gases – Part 1 (Specification for quantification and reporting of
greenhouse gas emissions and removals at the organization level)- Part 2 (Specification with guidance at the project level for quantification, monitoring and reporting of greenhouse gas emission reduction or removal enhancements) - Part 3 ( Specification with guidance for the validation and verification of greenhouse gas assertions),
– ISO 50001:2011 Energy management Systems – Requirements with guidance for use, – ISO 26000:2010 Guidance on Social Responsibility, – SA 8000:2008 Social accountability,
47

– EMAS: 2009 Eco-management and audit scheme, – G3.1 Guidelines: 2011, Global Reporting Initiative.
These sustainability standards and frameworks tend to give a wide categorization of indicators that companies can adapt to their concrete industrial context. Thus, they do not focus on any concrete sector or industry. The World Business Council for Sustainable Development, for instance, has identified five generic environmental measures applicable to most industries that were tested in companies from 10 industrial sectors and 15 countries (WBCSD, 2000): Energy consumption, Material consumption, Water consumption, Greenhouse gas emissions, Ozone depleting substance emissions.
On the other hand, there are some proposals in literature of set of sustainability performance indicators focusing on concrete industrial contexts or operations management fields such as green supply chains (for example, contributions of Björklund et al., 2012; Darnall et al., 2008; Hervani et al., 2005). Moreover, these articles do not normally contribute to all sustainability dimensions, being a clear concentration of contributions dealing with environmental performance. Some examples of concrete application of a small set of environmental performance indicators are given next: Colicchia et al. (2013) proposed an environmental assessment based on calculation of carbon footprint (CF) and greenhouse gases (GHG) emissions in the reverse logistics industry; Yan and Hua (2010) model the energy consumption of machine tools after they are maintained preventively based on energy consumption and CO2 emissions indicators. Some authors have made a review of these indicators proposals. For example, Čuček et al. (2012) present an overview of footprints as defined indicators that can be used to measure sustainability with respect to the appropriation of natural resources.
Some challenges associated with the efficient use of sustainability measures for decision making and guiding future actions are related to the quantity of indicators proposed, as there are many indicators available that represent a dimension or a combination of dimensions (Feng and Joung, 2011) and to the nature of the indicators, as it seems to be a preference for lagging indicators that measure the final outcomes from the initiatives implemented but often do not provide enough information to ensure overall sustainability program success (Pojasek, 2009).
3.3. INDUSTRIAL MAINTENANCE WITHIN SERVITIZATION This section presents the International State of the Art regarding servitization, and some related concepts, in manufacturing industry, followed by an introduction of the envisaged role that industrial maintenance and maintenance technologies could play within integrated offerings in a servitized industrial context. The section finishes with a brief review of performance measurement regarding industrial service provision.
3.3.1. INTERNATIONAL STATE OF THE ART ON SERVITIZATION & PSS Servitization has been identified as an emerging trend among equipment manufacturers (Oliva and Kallenberg, 2003; Morelli, 2006; Neely et al., 2011) and has created huge interest on academy, business and government as a means to generate additional value for traditional manufacturers (Hewitt, 2002). OEMs following a servitization strategy begin the process by offering few product-related services and then adding more services targeting the end-user’s processes, as they get consolidated in the service market (Oliva and Kallenberg, 2003). As suggested by Chase (1981) and Oliva and Kallenberg (2003), there is a transition line from pure product manufacturers to service providers (Figure 3.3). At one extreme of the continuum, there are product manufacturers which produce core products with services purely as an add-on to the product and, at the other extreme, there are service providers whose products are merely an add-on to services.
48

Figure 3.3. Product-service continuum (Oliva and Kallenberg, 2003)
This shift also implies the adoption of a more customer centric approach, by offering customized solutions instead of just products (Baines et al, 2009) and, in some cases, even incorporating products from other manufacturers to the solution offering (Brax, 2005; Miller et al, 2002). A concrete study made by Neu and Brown (2008) identified some aspects that are present in the cases of manufacturing firms that have successfully developed service businesses in complex markets, which are the following:
– A market and customer-centered orientation; – A high degree of resource synergy, considering the resources that enable the firm to deal with
market uncertainty; – Integration of business units responsibilities and a high degree of intra-firm collaboration; – Management’s financial incentives on performance criteria of an interdependent cluster of
organizational subunits; – Select, develop, and retain human resources to cope with market complexity; – Vertically decentralize decision-making authority for strategy formation; – A high degree of information processing during strategy formulation with an improvisational
performance during strategy implementation; and – A high degree of inter-firm collaboration to support the integrative strategy formation process
There are several terms related to servitization that have arisen in the last years, such as extended products (Thoben et al., 2001), solution-oriented partnerships (Evans et al., 2007), installed based services (Oliva and Kallenberg, 2003) and Product Service Systems (Goedkoop et al., 1999). However, a key concept within servitization literature is Product Service System (PSS), as there is a remarkable overlap between both concepts (Baines et al., 2009). Tukker and Tischner (2006) see PSS as consisting of “a mix of tangible products and intangible services designed and combined so that they jointly are capable of fulfilling final customer needs”. PSS aims at fulfilling customer requirements in the form of an individual solution that creates high value added and that cannot be provided by standardized products or services (Tukker, 2004).
Together with a focus on customer, PSS is also closely linked to the concept of life cycle (Tan et al., 2010). In this regard, some examples can be cited: Aurich et al (2006) assert that product life cycle management is the core issue for the design of PSS; Mien et al (2005) present a life cycle framework where services are identified around product life cycle phases; and Lujing et al (2010) present a service life cycle framework integrating product life cycle. Thus, it seems that service life cycle is a new concept that is getting more relevance and needs to be integrated with product life cycle when designing the services as part of a PSS or designing complete solutions within the provider’s portfolio.
49
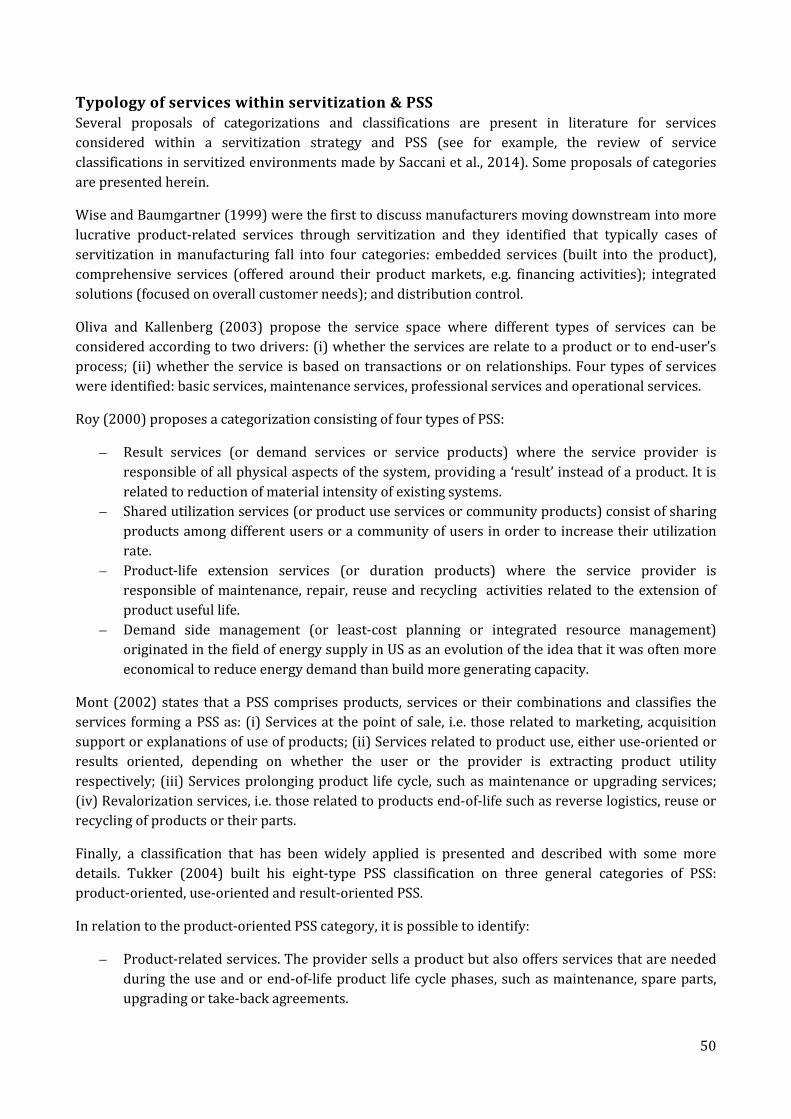
Typology of services within servitization & PSS Several proposals of categorizations and classifications are present in literature for services considered within a servitization strategy and PSS (see for example, the review of service classifications in servitized environments made by Saccani et al., 2014). Some proposals of categories are presented herein.
Wise and Baumgartner (1999) were the first to discuss manufacturers moving downstream into more lucrative product-related services through servitization and they identified that typically cases of servitization in manufacturing fall into four categories: embedded services (built into the product), comprehensive services (offered around their product markets, e.g. financing activities); integrated solutions (focused on overall customer needs); and distribution control.
Oliva and Kallenberg (2003) propose the service space where different types of services can be considered according to two drivers: (i) whether the services are relate to a product or to end-user’s process; (ii) whether the service is based on transactions or on relationships. Four types of services were identified: basic services, maintenance services, professional services and operational services.
Roy (2000) proposes a categorization consisting of four types of PSS:
– Result services (or demand services or service products) where the service provider is responsible of all physical aspects of the system, providing a ‘result’ instead of a product. It is related to reduction of material intensity of existing systems.
– Shared utilization services (or product use services or community products) consist of sharing products among different users or a community of users in order to increase their utilization rate.
– Product-life extension services (or duration products) where the service provider is responsible of maintenance, repair, reuse and recycling activities related to the extension of product useful life.
– Demand side management (or least-cost planning or integrated resource management) originated in the field of energy supply in US as an evolution of the idea that it was often more economical to reduce energy demand than build more generating capacity.
Mont (2002) states that a PSS comprises products, services or their combinations and classifies the services forming a PSS as: (i) Services at the point of sale, i.e. those related to marketing, acquisition support or explanations of use of products; (ii) Services related to product use, either use-oriented or results oriented, depending on whether the user or the provider is extracting product utility respectively; (iii) Services prolonging product life cycle, such as maintenance or upgrading services; (iv) Revalorization services, i.e. those related to products end-of-life such as reverse logistics, reuse or recycling of products or their parts.
Finally, a classification that has been widely applied is presented and described with some more details. Tukker (2004) built his eight-type PSS classification on three general categories of PSS: product-oriented, use-oriented and result-oriented PSS.
In relation to the product-oriented PSS category, it is possible to identify:
– Product-related services. The provider sells a product but also offers services that are needed during the use and or end-of-life product life cycle phases, such as maintenance, spare parts, upgrading or take-back agreements.
50

– Product-related advice/consultancy. The provider gives advice in order to improve efficiency during product use regarding different aspects such as team structure or factory logistics related to product location during its use phase.
Regarding the use-oriented PSS category, it is possible to identify four more specific types:
– Product lease. The provider keeps product ownership and customers pay a regular fee for the use of the product, having unlimited and individual access to the product. The provider is normally responsible for maintenance, repair and disposal activities related to the leased product.
– Product renting or sharing. The provider keeps product ownership and customers pay for the use of the product, not having unlimited and individual access, thus the product is sequentially used by different customers. The provider is responsible for maintenance, repair and disposal activities related to the product.
– Product pooling. Similarly to previous one, the provider keeps product ownership and customers pay for the use of the product, but in this case, the product can be simultaneously used by different customers.
In relation to the result-oriented PSS category, it is possible to identify two more specific types:
– Activity management/outsourcing. The provider takes over a customer’s activity. An outsourcing contract is established which includes a set of performance indicators to control the quality of the outsourced activity.
– Pay per service unit. Instead of selling the product, the provider sells the output of the product according to the level of use. Customers operate the product, while the provider is responsible of keeping the product function available.
– Functional result. The producer/provider agrees with the customer the delivery of a functional result, frequently in abstract terms and not including any predetermined product or technology to be used, thus the provider is free to decide the most effective means to deliver the result.
3.3.2. MAINTENANCE ENVISAGED ROLE FOR SERVITIZATION Industrial services are related to the provision of after-sales services and customer support regarding both spare parts and maintenance of industrial equipment (Johansson and Olhager, 2004). The implication of maintenance is clear when considering equipment-based services as can be derived from the results of the study done by Smith et al. (2012) in which they identified three value propositions related to equipment-based services under the servitization context: recovery, availability and outcome. The value proposed in each of them is presented in Table 3.7. It seems to be a clear connection between the value proposed in these services and the equipment properties related to industrial maintenance which are maintainability, availability and reliability.
Table 3.7. Findings on value propositions of equipment-based services from Smith et al. (2012)
Value proposition cycle Value proposed
Recovery Minimum disruption when equipment fails Availability Maximum availability of equipment Outcome Better capability to achieve outcomes
51
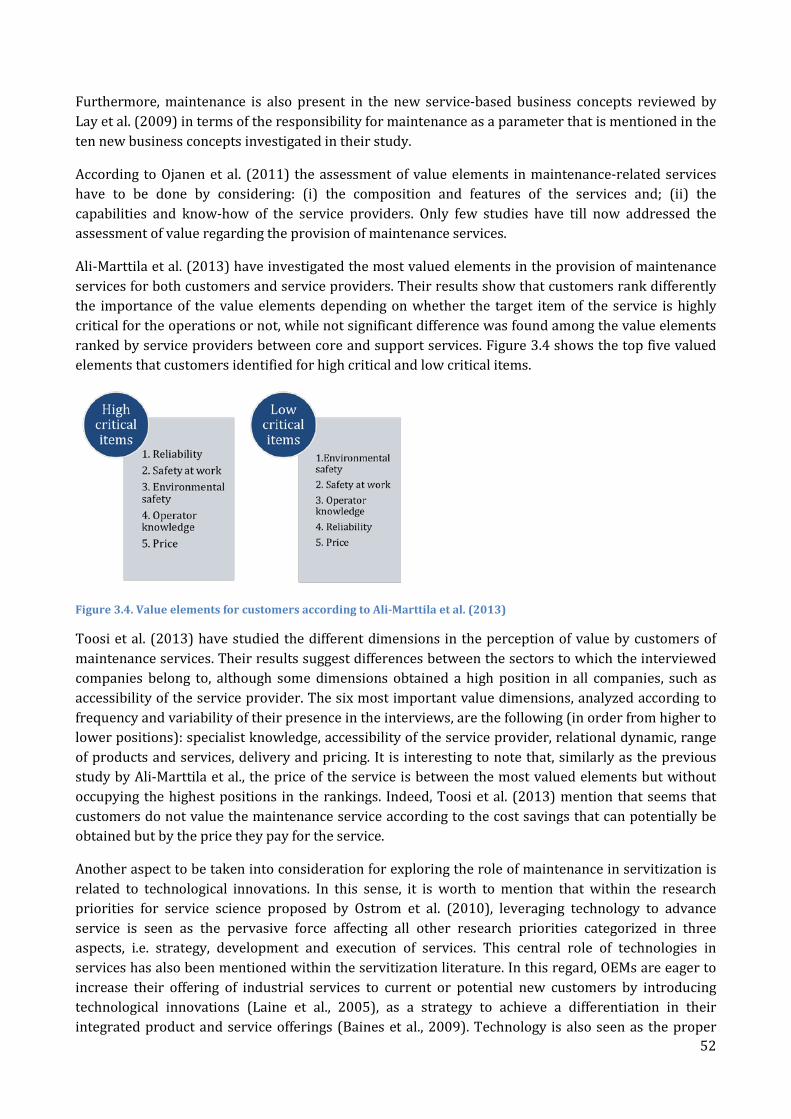
Furthermore, maintenance is also present in the new service-based business concepts reviewed by Lay et al. (2009) in terms of the responsibility for maintenance as a parameter that is mentioned in the ten new business concepts investigated in their study.
According to Ojanen et al. (2011) the assessment of value elements in maintenance-related services have to be done by considering: (i) the composition and features of the services and; (ii) the capabilities and know-how of the service providers. Only few studies have till now addressed the assessment of value regarding the provision of maintenance services.
Ali-Marttila et al. (2013) have investigated the most valued elements in the provision of maintenance services for both customers and service providers. Their results show that customers rank differently the importance of the value elements depending on whether the target item of the service is highly critical for the operations or not, while not significant difference was found among the value elements ranked by service providers between core and support services. Figure 3.4 shows the top five valued elements that customers identified for high critical and low critical items.
Figure 3.4. Value elements for customers according to Ali-Marttila et al. (2013)
Toosi et al. (2013) have studied the different dimensions in the perception of value by customers of maintenance services. Their results suggest differences between the sectors to which the interviewed companies belong to, although some dimensions obtained a high position in all companies, such as accessibility of the service provider. The six most important value dimensions, analyzed according to frequency and variability of their presence in the interviews, are the following (in order from higher to lower positions): specialist knowledge, accessibility of the service provider, relational dynamic, range of products and services, delivery and pricing. It is interesting to note that, similarly as the previous study by Ali-Marttila et al., the price of the service is between the most valued elements but without occupying the highest positions in the rankings. Indeed, Toosi et al. (2013) mention that seems that customers do not value the maintenance service according to the cost savings that can potentially be obtained but by the price they pay for the service.
Another aspect to be taken into consideration for exploring the role of maintenance in servitization is related to technological innovations. In this sense, it is worth to mention that within the research priorities for service science proposed by Ostrom et al. (2010), leveraging technology to advance service is seen as the pervasive force affecting all other research priorities categorized in three aspects, i.e. strategy, development and execution of services. This central role of technologies in services has also been mentioned within the servitization literature. In this regard, OEMs are eager to increase their offering of industrial services to current or potential new customers by introducing technological innovations (Laine et al., 2005), as a strategy to achieve a differentiation in their integrated product and service offerings (Baines et al., 2009). Technology is also seen as the proper
52

interface for the interaction between products and services (Geum et al., 2011), as well as an internal driver for PSS development (Cook et al., 2006). Moreover, technology could increase the efficiency of internal operations of the service provider while keeping the same level of customer satisfaction (Agnihothri et al., 2002).
Regarding maintenance literature, Tsang (2002) suggested that the deployment of new technologies for maintenance is crucial to deliver better or innovative services to customers. The importance of e-maintenance technologies for customer support services has been hinted by several authors (Lee, 2001; Levrat et al., 2008; Kumar, 2008); due to their potential to provide real-time data regarding operation and maintenance conditions and real-time support to decision making. E-technologies are a means for communication, processing and storage of information to offer the technical support to access remote information and support maintenance decision making (Levrat et al., 2008).
The application of new technologies to maintenance services can create additional value that would potentially lead to extend the equipment life, reduce the downtime, increase product quality, decrease cost and increase overall productivity (Lee and AbuAli, 2009). Allmendinger and Lombreglia (2005) claim that it could provide another type of value; “the value of removing unpleasant surprises”, by anticipating equipment behavior and potential failures. Moreover, the service provider would have the opportunity of creating long-lasting relationships with the customer (Kumar et al., 2004) and of learning from their interaction more about customers’ concrete needs and specific operation conditions (Grubic, 2014). This knowledge would provide the proper feedback to improve the service offering to better match actual customer needs and requirements (Allmendiger and Lombreglia, 2005; Laine et al., 2005; Grubic, 2014).
The use of remote monitoring techniques within a condition-based maintenance approach is seen as an appropriate maintenance strategy to be integrated in functional products (Alonso-Rasgado et al., 2004). In this regard, remote monitoring technology and Prognosis and Health Management (PHM) are envisaged to have an important role to support servitization in manufacturing (Grubic, 2014).
3.3.3. INDUSTRIAL SERVICES PERFORMANCE MEASUREMENT There are few contributions in after-sales services performance measurement and those present in literature focuses only on some aspects without considering and integrated view (Gaiardelli et al., 2007). This seems to be also happening in the context of industrial services due to some potential causes. According to Ostrom et al. (2010), service cost accounting systems are design for accounting needs rather than for tracking service costs across all functions and business units. Moreover, the servitization focus on providing functions rather that products would cause changes in performance measurement approaches as the customer values asset performance or utilization rather than ownership (Baines et al., 2007). Thus, many opportunities for academy and industry still exists in relation to the investigation of service measurement (Ostrom et al., 2010).
The selection of performance measures that addresses a twofold measurement, considering the benefits for both actors involved in the service provision – the provider and the customer – is a key step for the definition of the service delivery process (Datta and Roy, 2011). According to Parasuraman (2002) the customer evaluates the service according to the effectiveness of its inputs in terms of quality, satisfaction and utility, while the provider considers returns of its inputs in use.
Some examples of dimensions considered in after sales services measurement are given by the following two contributions. The framework introduced by Gaiardelli et al. (2007) for after sales services integrates the features of some existing models and presents a comprehensive overview of
53

performance measures in after sales by addressing different levels – business, process, activity and development / innovation – and different performance areas within each level in order to represent at the same time internal and customer-oriented measures. Legnani (2011) proposed a framework with six performance categories - Reliability, Responsiveness, Agility, Assets, Costs and Growth – and these categories encompass both internal-facing perspectives (Costs, Asset, Growth) and customer-facing perspectives (Reliability, Responsiveness, Agility).
Finke et al. (2012) propose a performance measurement system for industrial field service that determines the following performance dimensions: quality, regarding the quality of the services provided in terms of how well the service intervention is performed; cost, considering all expenses on-site and off-site; delivery, encompassing response time and reliability as the two main aspects; customer satisfaction, which is one of most critical as long-term collaboration with the customer would depend on this; flexibility, regarding the adaptability to changes in the manufacturing environment. They also provide some examples for each dimension that are shown in Table 3.8.
Table 3.8. Examples of performance measures for field service (Finke et al., 2012)
Dimension Performance measure Quality First Time Fix Rate
Mean Time Between Failure % of not completed service requests
Cost – operational Total personnel cost Inventory costs
Cost - investments Total Infrastructure Investments Cost of a car fleet
Delivery - reliability % of services delayed % of services delayed because of unavailability of employees
Delivery – response time
Average time to arrive on-site Average time to answer a call
Customer satisfaction
Average customer satisfaction Net promoter score
Flexibility Utilization of personnel Average number of different products that can be serviced by a technician
It is worth also to mention the classification scheme and proposal of key performance indicators made by Meier et al. (2013), that maps performance indicators inside a matrix considering their importance for measuring delivery planning and delivery performance using a ranking (low, moderate, high). Figure 3.5 shows this classification scheme.
Figure 3.5. Classification scheme for performance indicators in industrial services (adapted from Meier et al., 2013)
54

3.4. CURRENT PRACTICE ON MAINTENANCE SERVICES IN ITALY This section presents first a brief overview of the manufacturing industry in Italy, illustrating its distribution regarding industrial sectors with respect to number of companies, number of employees and company size. Then, the results from the exploratory survey on maintenance services are presented. As mentioned in the research methodology chapter, the final sector groups analyzed are: Food and beverage, Chemical / Pharmaceutical, Machinery, Other metallic products, Automotive, Other sectors (which includes companies from a myriad of other sectors whose representation was not enough to be analyzed alone).
3.4.1. BRIEF OVERVIEW OF THE MANUFACTURING INDUSTRY IN ITALY This overview of the manufacturing industry in Italy builds on data corresponding to 2010, it is assumed that no big structural changes would have been produced in the industry in the last three years, although as a result of the economic crisis, the number of active companies could have decreased. Data for this study have been taken from EUROSTAT database in August 2013.
Manufacturing industry in Italy comprises many different sectors, ranging from textile and leather to food and beverage and metal, electronic and electrical products. In 2010, the whole manufacturing industry was encompassing 256.313 active companies, which are mainly micro and small companies. As an average the Italian manufacturing industry has 75% of companies with 10 or less employees, which are considered as micro companies. The sector with the highest number of micro companies (85%) is food and beverage while the sector with the least number of micro companies (46%) is coke and refined petroleum, followed by chemical/pharmaceutical (52%) and automotive and transport equipment (55%).
Graph A in Figure 3.6 represents the population of active companies by each manufacturing sector and Graph B in Figure 3.6 shows the distribution of the different sectors within the whole manufacturing industry, considering both all companies (light blue) and companies with more than 10 employees (dark blue). It is worth to observe that although Graph A shows huge differences in population within each sector whether micro companies are included or not, the distribution of each sector in Graph B does not change drastically. The higher changes are experienced in food and beverage sector, where the distribution of the sector decreases around 6% when not considering micro companies, and in machinery and equipment sector where it increases around 5% when not considering micro companies. In general, it can be said that the distribution of each sector is not highly impacted by removing micro companies from the analysis, therefore micro companies are not considered for the analysis in the remainder.
55

Figure 3.6, Overview of manufacturing sectors in Italy
Figure 3.7 regards the distribution of the different sectors within manufacturing industry in Italy, considering just companies with more than 10 employees. The distribution has been calculated in two ways:
1. considering the number of active companies in each sector with respect to the total number of companies in manufacturing industry, displayed in part A of Figure 3.7;
2. considering the number of employees in each sector with respect to the total number of employees in manufacturing industry, displayed in part B of Figure 3.7. The latter can be seen also as an indicator of the human capital intensity of each sector, thus, measuring the impact on society in terms of manpower needed for performing activities within the sector.
Figure 3.7. Distribution of sectors in manufacturing industry in Italy
Furthermore, the density rate has been analyzed in each industrial sector as an indicator of the concentration of employees in each sector (micro companies has been studied separately to avoid high differences in the data, resulting on an average of 3,61 employees per company in the whole manufacturing industry and average figures for each sector ranging from 2,68 to 4,06, which do not show high variations). Figure 3.8 shows the density rate in each sector and the whole manufacturing
56

industry considering only companies with more than 10 employees. Sectors which have higher density than the average manufacturing industry (which is 43,98 employees per company) are the following (in decreasing order):
• Automotive and transport equipment (Density rate: 144,59) • Coke and refined petroleum (Density rate: 98,32) • Chemical/Pharmaceutical (Density rate: 86,64) • Electronic and electrical products (Density rate: 61,54) • Machinery and equipment (Density rate: 48,99)
Figure 3.8. Density rate in each sector in manufacturing industry in Italy
3.4.2.ACQUISITION OF MAINTENANCE SERVICES: TARGET AREA AND MOTIVATIONS The acquisition of maintenance services regarding the area in which the service is performed within the manufacturing company has been investigated by analyzing the number of service providers that each company contracts for each area. The target areas studied are the following: (i) non-functional areas, such are office heating, air conditioned, lighting; (ii) auxiliary areas to production, such as water treatment for production facilities, air compression: (iii) production area. Figure 3.9 shows the distribution of service providers for each area considering the total number of providers given by the whole sample analyzed (see section 2.3.3 for more information regarding the sample) without considering sectorial differences.
Figure 3.9. Distribution of maintenance service providers by target area
57

Table 3.9 indicates the average and maximum number of service providers that the companies in the sample employ for each target area. Among the total number of maintenance service providers, the analysis done indicates that 20% of them are providing services as an integrated package, i.e. services addressing at least two target areas and 44% of them are Original Equipment Manufacturers (OEMs).
Table 3.9. Average and maximum number of service providers per company in the sample
Target area Average number of service providers per manufacturing plant
Maximum number of service providers per manufacturing plant
Non-functional areas 3,8 18 Auxiliary areas 4,6 40 Production areas 6,9 60
A sectorial analysis have been done regarding maintenance service provision in production areas. Figure 3.10 illustrates the distribution by industrial sectors included in the sample of maintenance service providers employed in production areas. This data considers only the companies which have at least one provider in this target area, so the analysis deepens on the distribution of the 43% of providers in production areas indicated in Figure 3.9 (above). Apart from the miscellaneous of sectors, which obtained the higher percentage, Chemical/Pharmaceutical and Other metallic products sectors are those employing more maintenance service providers in production areas.
Figure 3.10. Distribution by sectors of maintenance service providers in production areas
Figure 3.11 shows the analysis done considering company size, which shows that the bigger the company, the highest the number of maintenance service providers employed in production areas. It would be worth to deepen in this analysis to understand whether is a matter of company’s size or there are other influencing factors, such as company production layout, company sector, etc.
Figure 3.11. Distribution by company size of maintenance service providers in production areas
58
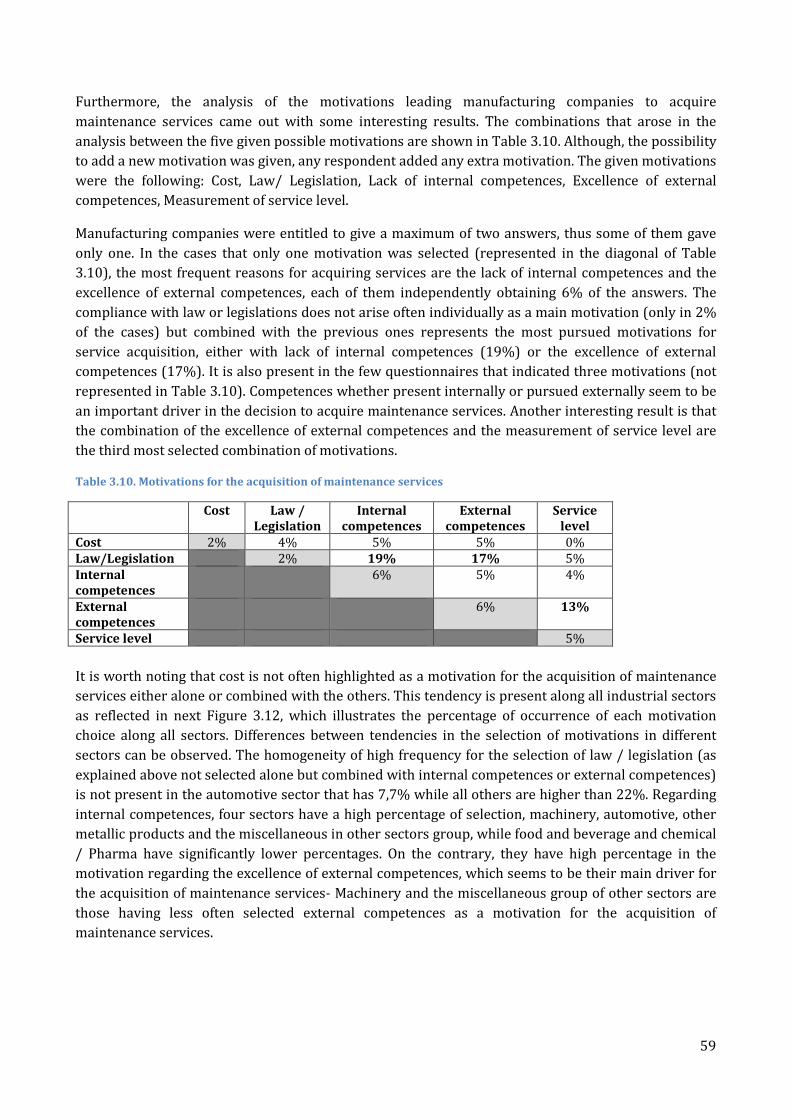
Furthermore, the analysis of the motivations leading manufacturing companies to acquire maintenance services came out with some interesting results. The combinations that arose in the analysis between the five given possible motivations are shown in Table 3.10. Although, the possibility to add a new motivation was given, any respondent added any extra motivation. The given motivations were the following: Cost, Law/ Legislation, Lack of internal competences, Excellence of external competences, Measurement of service level.
Manufacturing companies were entitled to give a maximum of two answers, thus some of them gave only one. In the cases that only one motivation was selected (represented in the diagonal of Table 3.10), the most frequent reasons for acquiring services are the lack of internal competences and the excellence of external competences, each of them independently obtaining 6% of the answers. The compliance with law or legislations does not arise often individually as a main motivation (only in 2% of the cases) but combined with the previous ones represents the most pursued motivations for service acquisition, either with lack of internal competences (19%) or the excellence of external competences (17%). It is also present in the few questionnaires that indicated three motivations (not represented in Table 3.10). Competences whether present internally or pursued externally seem to be an important driver in the decision to acquire maintenance services. Another interesting result is that the combination of the excellence of external competences and the measurement of service level are the third most selected combination of motivations.
Table 3.10. Motivations for the acquisition of maintenance services
Cost Law / Legislation
Internal competences
External competences
Service level
Cost 2% 4% 5% 5% 0% Law/Legislation 2% 19% 17% 5% Internal competences
6% 5% 4%
External competences
6% 13%
Service level 5%
It is worth noting that cost is not often highlighted as a motivation for the acquisition of maintenance services either alone or combined with the others. This tendency is present along all industrial sectors as reflected in next Figure 3.12, which illustrates the percentage of occurrence of each motivation choice along all sectors. Differences between tendencies in the selection of motivations in different sectors can be observed. The homogeneity of high frequency for the selection of law / legislation (as explained above not selected alone but combined with internal competences or external competences) is not present in the automotive sector that has 7,7% while all others are higher than 22%. Regarding internal competences, four sectors have a high percentage of selection, machinery, automotive, other metallic products and the miscellaneous in other sectors group, while food and beverage and chemical / Pharma have significantly lower percentages. On the contrary, they have high percentage in the motivation regarding the excellence of external competences, which seems to be their main driver for the acquisition of maintenance services- Machinery and the miscellaneous group of other sectors are those having less often selected external competences as a motivation for the acquisition of maintenance services.
59

Figure 3.12. Percentage of selection of motivations (either alone or combined) for each industrial sector
3.4.3. MAINTENANCE SERVICES ACQUIRED: CONTRACT TYPES AND REQUIREMENTS Five types of contract for maintenance services have been considered in this study, which are the following: (i) Forfeit contract, which concerns the realization of a concrete maintenance activity paid by means of a lump sum; (ii) Intervention contract, which regards routine maintenance activities and it can be paid either by a lump sum or based on hourly cost; (iii) General contract, which involves that a significant part of maintenance activities is outsourced to an external contractor who coordinates all necessary external personnel, from one or more companies, in order to fulfil the requested work; (iv) Performance-based contract, which considers that the objective of the maintenance contract is the achievement of a desired performance target or service level, thus the payment is based on the performance achieved; (v) Life cycle contract, which is similar to the previous one, but considering all the equipment life cycle.
The first two types concerns the more traditional types of maintenance contracts, while the rest, especially life cycle contracts, are newest forms of contracting. As in previous sections, a general analysis and a sectorial analysis have been performed for this matter.
The analysis done indicates that forfeit and intervention are the most common forms of contracting (present in 72% and 65% of responses, respectively). The rest of contract types are just present in few responses, when compared to previous ones’ results: general contract (13%), performance-based contract (7%) and life cycle contract (4%). Figure 3.13 shows a distribution among sectors of the different types of contracts. It can be observed that only two sectors have presence of all types of contracts, which are the Chemical / Pharma and the miscellaneous group of other sectors, while machinery sector and food and beverage sector are missing the performance-based contract type and the life cycle contract type, respectively. The automotive sector is the one with less variety of contracts, as only has the presence of forfeit and intervention contracts.
60

Figure 3.13. Distribution of contract types in each industrial sector
As manufacturing plants are composed by numerous equipment, it is logical to assume that each plant would acquire several services of different types. In this sense, an analysis have been done regarding the average number of each contract type per sector that a manufacturing company would acquire. Figure 3.14 illustrates the distribution and average number of each contract type for a single company in each sector and in the whole sample. The calculation for each type of contracts have been done considering only the companies acquiring that type of contract, thus the average number of contracts per sector is smaller than the sum of the average numbers displayed in the figure. It is worth noting that the number of life cycle contracts is quite high in Chemical / Pharma, even though in other sectors this contract type does not even appear. This means that the few companies from Chemical / Pharma sector acquiring this type of contract have acquired a relatively important number of contracts.
Figure 3.14. Average number of each type of contracts acquired by sample sectors
Regarding the maintenance services contracted with the OEMs, the analysis indicates that the presence of OEMs is very high respect those provided by other MSPs in general contracts (75%). The other types of contracts have much lower percentage: forfeit contracts (39%), intervention contracts
61

(33%), performance-based contracts (31%), and life cycle contracts (11%). Data related to life cycle contract may not be representative due to the few examples of life cycle contracts within the data collected.
Considering a sectorial analysis, the presence of contracts done with OEMs is the highest in general contracts in almost all sectors which acquired that type of contracts, except in the Other metallic products sector. In the automotive sector, which in our sample does not acquire general contracts, the presence of OEMs is higher in intervention contracts than in forfeit contracts.
The requirements for service providers may vary depending on the type of contract, so the analysis has been done generally for all contracts and independently for each type of contract. Table 3.11 presents the percentages obtained by each type of requirement generally and by type of contract. The requirements included in the study are the following: Low cost, Quality, Reputation, Law / Regulations, Technological knowledge, Structured contract.
Technological knowledge and quality are the most common requirements if the total contracts are considered (25% and 23% respectively), followed by law/regulations (18%). However, if looking to each specific type of contract there are notable differences. The first and second most selected requirements in each type of contract are highlighted in bold. In the case of forfeit contracts, quality is the most required aspect, followed by law / Regulations and Technological Knowledge. Quality is also the most demanded aspect for Performance-based contracts, followed by Technological knowledge, while it has the second position for Intervention contracts. Technological knowledge is the most demanded aspect in Intervention contracts, General contracts and Life cycle contracts. Finally is worth note that reputation is the second most important requirement is the cases of General contracts and Life cycle contracts.
Furthermore, it is worth note that Structured contract is not a significant requirement for the more traditional types of contract, forfeit and intervention contracts, however its importance is clearly higher the other types. This focus on the structure of the contract is related to the difficulties mentioned by some authors regarding the challenges of contracting performance-based contracts.
Table 3.11. Requirements for each type of maintenance contract
Low cost Quality Reputation Law / Regulations
Technological knowledge
Structured contract
Forfeit contract 16% 25% 13% 19% 19% 9% Intervention contract 10% 22% 13% 19% 30% 6% General contract 8% 16% 20% 16% 24% 18% Performance-based contract
8% 31% 8% 14% 22% 17%
Life cycle contract 0% 15% 23% 8% 38% 15% Total contracts 11% 23% 14% 18% 25% 10%
3.4.5. OUTSOURCING STRATEGY & MAIN OUTSOURCED ACTIVITIES The provision of maintenance services is associated to the concept of outsourcing of a series of activities by manufacturing plants. This section studies how often manufacturing plants are following and outsourcing strategy and which activities are mainly given in outsourcing to third parties. Previous sections have focused on the concept of maintenance services, though not going to the details of the concrete types of activities which are performed in those maintenance services. Thus, this section provides details on the activities given in outsourcing.
62

An outsourcing strategy is indicated to be followed by 39,3% of the manufacturing companies in the sample, which corresponds to 44 out of 112 manufacturing plants. The distribution of these companies by size and sector is illustrated in Figure 3.15.
Figure 3.15. Distribution by size and sector of the companies with outsourcing strategy in the sample
It is also important to understand which activities are outsourced in those companies. Errore. L'origine riferimento non è stata trovata. shows the types of activities which are mainly given in outsourcing. The outsourcing of shop floor personnel (43,2%) is the most common, followed by the management of building or non-functional (36,4%). Predictive maintenance is the third most outsourced type of activity (27,3%).
Figure 3.16. Frequency that different types of activities are given in outsourcing in the sample
The outsourcing of intervention personnel involved in direct maintenance activities is also outsourced often (22,7%). The remaining types of activities are outsourced in very few cases (less than 5%), concretely surprising is the low rate of outsourcing of maintenance engineering activities (2,3%). Thus, further study would be interesting in order to understand whether maintenance engineering is not performed at all or performed internally in the companies within the sample. This analysis has been done and shown in Figure 3.17, where is can be observed whether each maintenance engineering activity is performed internally by manufacturing companies, externally by a third party or both. It is worth to note that generally for most of the activities the percentage of performing it both internally
63

and externally is higher that the percentage of performing it only externally. It seems that maintenance engineering involves a set of activities which are preferable performed internally.
Figure 3.17. Maintenance engineering activities performed internally, externally or both
Furthermore, the study has deepened on the techniques for condition based maintenance which are at the basis for predictive maintenance activities in most cases. Figure 3.18 shows the techniques for condition monitoring that are performed internally, externally or in both ways in the manufacturing companies within the sample.
Figure 3.18. Techniques for condition monitoring done internally, externally or both
3.5. SUMMARY OF MAIN FINDINGS & GAPS IDENTIFICATION The literature overview presented in sections 3.1, 3.2 and 3.3 serves the purpose of framing the research context and introduces the main concepts and relationships among them which constitute the current state of the art. The study of the current practice on maintenance services in Italy, described in section 3.4, shows the industry context and gives some hints on the reason why the research context is relevant from a practical viewpoint for manufacturers. A summary of the main findings and gaps of previous sections is given herein.
64

3.5.1. RESEARCH GAPS Given the recent trend in manufacturing industry towards more sustainable operations, it is necessary that all business functions involved in manufacturing processes are included in the new perspective of sustainable manufacturing and contributes to achieve its main goals regarding the three sustainability pillars (economic, environmental and social). Maintenance function as part of manufacturing plants is also called to embrace this new perspective and in this sense, some authors have proposed some areas of contribution of maintenance to sustainable manufacturing goals, such as technological innovations and life cycle management (Garetti, 2011). The study of maintenance function within the sustainability umbrella would imply further insights into maintenance values and maintenance stakeholders. Some contributions regarding these issues have been mentioned in section 3.2.2, though a research gap can be identified:
Research Gap 1 - Although several authors claim the potential of maintenance function in manufacturing to contribute to sustainable manufacturing goals, there is no comprehensive empirical study done regarding the concrete dimensions and elements of this contribution.
Several authors have made proposals regarding maintenance management frameworks and models and is expected that they may illustrate how value is created inside maintenance function. The lack of studies regarding maintenance value, especially from the sustainability perspective, may be the cause of this apparent lack of focus on value creation logic and processes within maintenance management frameworks and models. Concretely, a second research gap can be defined as:
Research Gap 2 - In maintenance literature, it seems to be a missing link between maintenance strategy and maintenance processes that could help understanding the value creation processes.
Industrial maintenance is mentioned directly or indirectly by many authors in relation to servitization trends in manufacturing and other related concepts, as explained in section 3.3.2. Specially, it seems that maintenance technologies could be an enabler of servitization, though scarce literature on concrete applications has been found (Grubic, 2014). A third research gap could then be stated as:
Research Gap 3 - Although maintenance technologies (specially, condition monitoring techniques and PHM) are claimed to contribute to servitization in manufacturing, there is no clear understanding of how this contribution could be done or could influence the value of the service provision.
Moreover, the study done by Neely (2011) indicates that maintenance and support services are the third most diffused type of services in servitized manufacturers and maintenance is also present in the new service-based business concepts (Lay et al., 2009), the servitization literature seems to neglect maintenance-related methods and techniques for industrial services and PSS design and development as well as maintenance potential value within service offerings.
Research Gap 4 – Industrial maintenance seems to be a central part in the provision of services by servitized manufacturers. However, there is a lack of studies regarding the understanding of maintenance values within these solution offerings and some research is still necessary on a systematic methodology that considers this value for product-service configurations in maintenance-related services.
3.5.2. RESEARCH PRACTICE GAP The benefits of result-oriented PSS, this category including performance-based services (Datta and Roy, 2011), have been highlighted by several authors in terms reduction of material intensity (Roy, 2000), control process quality and higher potential for environmental sustainability (Tukker, 2004),
65

reduction of cost of ownership and higher levels of availability and reliability performance (Jin et al., 2011).
However, the study of the current practice regarding maintenance services in Italian manufacturing companies indicates that performance-based contracts (7%) are among the less extended forms of maintenance service contracts, although according to literature are those providing higher value. This seems to be a gap between research and practice that is worthy to be further investigated in this research.
66

PART II. RESEARCH FINDINGS & CONTRIBUTIONS
67

68

4. UNDERSTANDING MAINTENANCE CONTRIBUTION TO
SUSTAINABLE MANUFACTURING This chapter introduces the research findings regarding the contribution of industrial maintenance to more sustainable manufacturing operations. The chapter presents first an overview of all companies involved in the case studies, then explains the findings of the case studies organized in four categories and end with a brief discussion of the findings and a proposal of a framework for maintenance contribution in sustainable manufacturing. The findings of this chapter have informed some categories within the Maintenance Business Model concept, to be further explained in next chapter 5, and some operational values proposed within the methodology to be presented and described in chapter 7.
4.1. OVERVIEW OF CASE STUDIES This section provides an overview of the companies selected for the nine case studies and introduces their business context, as well as their production plants and operational context in which maintenance function is placed. The understanding on each concrete context has provided the elements to proper frame the case studies findings and has facilitated an adequate interpretation and a more complete discussion, which is later explained in section 4.3. Most of the information provided in this section has been taken from the company’s websites and completed with information from interviews and internal documents provided by the interviewees.
Profile company A This company, founded in 1966, is a manufacturer of chemical specialties for industries with more than 40 years of experience. It works mainly for footwear manufacturing sector, but also other industrial sectors such as Automotive, Transportation, Aerospace, Wind Energy, Furniture Toys and Cosmetics (regarding packaging). The company is present in more than 60 countries worldwide and provides different product types such as technologically advanced release agents, lubricants, coatings and color pigments.
Company A pays a special attention to safety and environment, which are continuously monitored in their facilities and is certified in both ISO 9001 and ISO 14001 standards.
The manufacturing plant is situated in the north of Italy and produces a huge range of products related to two main product lines: release agents and coatings. The production process is based on a batch configuration where similar products are processed in the same production line, however production facilities would constantly change to adapt to changes in client’s request. The plant is open 10h/day, 5 days per week and has around 60 employees.
In this plant, maintenance function is part of the technical office, which depends directly on plant management. The production function depends on both the technical office and the plant management. The technical office manager currently covers two production sites and environmental aspects for both facilities. The technical office is not a large department (2 internal people, plus 4 external maintenance operators as an average), so the internal people have contemporarily several roles related to plant production, process technology, environmental and safety aspects and maintenance. Maintenance function also provides assistance to production, thus, the same maintenance team performs corrective and preventive maintenance activity as well as assists production lines. This is a particularity that allows some interesting synergies between plant functions and provides the technical office manager with some data from the production machinery that otherwise would not be able to have.
69

Profile company B Company B has been since its foundation in 1876 a family business that today is under the guidance of the fifth generation of the founder family. It is the largest European manufacturer of shirting fabrics, producing high quality textiles for the fashion sector. With four brands and a collection of more than 20,000 fabric variations, this manufacturer is able to satisfy the most demanding customers in more than 80 countries of the world, and all styles, from sporty to the more classic. Its strategic goal of high quality requires the accurate selection of raw materials, the use of control technologies in different production phases, and the adoption of advanced machining systems within the plants of the company. The seven plants owned by the company are distributed through Europe and the Mediterranean area. The total number of employees is about 1400, an average of 200 employees in each plant.
Protecting the environment, improving environmental standards and product quality, using processes that reduce interaction with the environment, employing energy resources and raw materials efficiently are some aims of Company B. Moreover, in order to encourage the professional growth and the competitiveness of young designers and to show the real values of Made in Italy fabrics, Company B has also collaborated with the most prestigious international fashion schools and it has sustained the projects of young designers.
The manufacturing plant which was considered for this case study is located in the north of Italy, where the dyeing and finishing processes of more than one million meters of fabric per month are currently handled. The production is performed as a continuous process, where the materials are sequentially processed in the plant continuous machines: the raw fabric enter the factory and it is processed along different sequential paths in order to acquire different characteristics.
There are two organizational structures within the plant: production management and technical management. The main objective of the technical management is to support production management in the accomplishment of production plans, i.e. to manage the plant in order to provide the requested availability, including plant updates and revamping and acquisition of new machinery. Maintenance function is then considered under the technical management structure, thus the maintenance manager reports directly to the plant technical manager and it is independent from the production manager.
Profile company C Company C was founded in 1911 and it is a world leading global manufacturer of home major appliances. Their strategy focuses on innovation, cost productivity, product quality and consumer value, in order to provide great products to their customers worldwide. Company C applies principles of lean manufacturing and operational excellence to ensure continuous improvement of processes and to produce products that meet the company's high-quality standards. Its vision is described as “The Best Branded Consumer Products... in Every Home Around the World”.
A constant focus on seeking out new and unique ways to improve the function, performance and sustainability of their products is present in this company, together with a unique sense of responsibility which is described as “a culture of responsibility that is good for the business, the environment and society overall”. The values that Company C follows in its business are the following: Respect, Integrity, Diversity and Inclusion, Teamwork, Spirit of Winning.
The production site considered in this case study is compound by two factories, which were unified on February 2013 under the same management structure. It is located in the north of Italy and it is also a main location in the Europe, Middle East and Africa Region. This production site manufactures four types of home appliances, which define four value streams driving the whole site activities: ovens,
70

hobs, fridges and side-by-side fridges. The production process is compounded by an area of primary processes, a decoupling warehouse and an assembly area. The two different factories have different approaches for the assembly area, which was renovated in 2009 in the oven factory and transformed mostly in a continuous flow, while in the fridge factory the technology is stop-and-go with long distances between the assembly positions as designed in the 80s.
Before February 2013, when the two factories were running independently, the technology manager and the maintenance manager were the same person within the plant structures. The unification of the two factories brought the need to decouple the responsibilities due to the larger range of the new production site. Thus, for each production process there are now two managers, one from technology side and another one from maintenance side that need to work together to run the production processes. Technology supervisors and maintenance supervisors are also divided by value streams, thus each value stream manager would have only a maintenance supervisor and a technology supervisor to interact with.
Profile company D Company D is an important chemical company in Italy and supplies a full range of industrial, specialty, food and medical gases. It was founded in 1927 and in its more than 85 years of existence, has succeeded in entering new geographic markets and sectors, whilst growing as a flexible and dynamic organization and guaranteeing the utmost quality, reliability and professionalism.
Its core principles and values are built on the concepts of transparency and clarity, respect for its stakeholders, fair competition, a commitment to quality, safety and environmental protection, and social accountability. Company D runs an effective safety policy which fully supports protection of the environment. The promotion of the culture value is another dimension in which this company is currently working. Company D is also currently member of the Responsible Care® Programme.
Company D has 10 production plants in Italy, this study is based on one of its plants in northern Italy which is the most complex plant in Europe. The plant follows a continuous process layout, working H24 365 and produces a great variety of volumes and gas types, including medical and technical gases as well as gas samples. This plant obtained in 2007 the certification according to OHSAS 18001 regulation of the Occupation Health and Safety Assessment Series (SGS) that together with the previously obtained certifications on ISO 9001 and 14001 standards pertaining the Quality Management System and the Environment Management System complete an integrated approach to standards compliance. Other specific regulations of its sectors are also certified for this plant.
Within the production plant, maintenance function depends directly from plant management, thus being at the same level of other business functions such as production function. There are around 25 employees in the maintenance department. The maintenance approach in this plant has moved from the old-traditional view of maintenance based on just corrective activities to a more proactive approach based on big investments on preventive maintenance, technological innovations and machinery upgrades.
Profile company E Company E was founded in 1910 and is currently one of the global leaders in the elevator and escalator industry, providing elevators, escalators and automatic building doors as well as innovative solutions for modernization and maintenance. It is present in more than 50 countries. The values guiding the behavior of company’s personnel are strongly customer-driven and are stated as the
71

following: “Delighting the Customer, Energy for Renewal, Passion for Performance and Winning Together”.
Company E is committed to improving the quality of life in cities, through innovations and corporate responsibility. Innovations would be done according to the drivers of eco-efficiency, comfort and design. Its approach to corporate responsibility is guided by the four megatrends in their industry, which are urbanization, demographic change, safety and environment, and it is divided in three areas: economic responsibility, social responsibility, and environmental and product responsibility. Its commitment goes beyond its company boundaries, as Company E has defined a supplier code of conduct that illustrates its values and expects all of its suppliers to conform to the policies of the code.
The Italian production plant specializes in the production of cabins and doors for elevators, in addition to managing the provision of complete elevators in all European countries and in some countries outside Europe. The production layout is divided in two areas, the cabins area and the doors area, each of them being formed by similar production processes. The materials first go to an area of stamping and bending, followed by an assembly area and a buffer line that conduct the finished product to the packaging area.
Maintenance function depends directly on the plant manager, though is centralized within a plant but not as a group, i.e. it is managed locally for each plant. There are 14 employees in the maintenance department. The maintenance manager carries out also the energy management activities, which are mainly oriented to energy savings and energy efficiency.
Profile company F Company F is a leader in stainless steel long products in Europe and the world. Its main products are stainless steel wire rod and bars, valve steel, tool steel, atomized powders and semi-finished products such as ingots, blooms, billets and bars which are supplied mainly to petrochemical, naval, food and energy sectors. The company is increasing its interest on specialties rather than more common products, focusing on higher quality and new steel characteristics in order to move towards medical, biomedical, aerospace and automotive sectors.
Special attention is given to quality and environment in Company F. Quality is understood as both customer satisfaction and quality management system implementation. Environment aspects are accomplished through the certification on ISO 14001 and the compliance with the European regulation on Security of Chemical products, known as REACH (Registration, Evaluation and Authorization of Chemicals).
The company has two manufacturing sites, one in Italy and one in China. The case study concerns the plant in Italy. The plant is compound of the following production units: a steel shop, where an electric arc furnace is located; a rolling unit equipped also with heat treatment furnaces; a finishing area for wired rob, bars and blocks; and a production area for gas-atomized metal powders and tailor-made finished pieces.
The production plant has experienced an organizational change regarding maintenance function in April 2013. Maintenance function, which was before depending on production function, has gained its own identity as an independent plant department reporting directly to plant management. It has also been created a maintenance engineering section within the maintenance department. The maintenance manager has duties related to maintenance activities in the whole plant, maintenance engineering, the management of plant utilities networks (electricity, gas, water, heating,…) and the plant emergency team, formed by maintenance personnel.
72
Profile company G Company G is a petrochemical company offering a wide portfolio of petrochemical products, having the possibility to use a range of proprietary technologies and state-of-the-art production systems. Its main products are several types of polyethylene, styrene and elastomers and it can also provide tailor-made solutions and specific responses to the requests of every customer.
From 2011 it has entered the green chemistry business with the implementation of a new plant in Italy. Sustainability is an important part of this company’s culture and they work on different dimensions: environment, HSE, quality and product stewardship. They have an integrated management system formalized and certified according to well-known standards: EN ISO 9001, OSHAS 18001, EN ISO 14001, and EMAS. Company G also follows REACH, the new Regulation for Registration, Evaluation, Authorization and Restriction of Chemicals born in 2007, which intends to demonstrate the safety of chemical products.
Company G owns 15 production sites in Europe and a head office in the north of Italy. The case study involves the centralized Maintenance and Technical Materials department located in the head office. This main department has 32 employees and it acts as a coordinating unit between all production sites. The department is divided in two functions: maintenance engineering and technical materials management, each of them consisting in one supervisor and some specialists. In the production sites, the maintenance manager of each site reports to the site technical services manager and to the centralized maintenance unit in the head office, which gives them the objectives and directives for maintenance function in each site.
Profile company H Company H was established in 1877 and it is a family owned business led currently by the fourth generation of the founding family, as committed to producing quality and innovative products today as its great-great grandfather was over 130 years ago. It is one of top Italian food groups, leading pasta business worldwide and employing more than 8000 people in 2013. The company has 14 production sites in Italy and 16 outside Italy, exports to more than 100 countries, and it is widely recognized by respecting its longstanding traditional principles and values, considering employees a fundamental asset and developing leading-edge production systems. Its stated aspiration is to “Double the business by 2020, while continuously reducing our footprint on the Planet and promoting wholesome and joyful food habits” and, to this end, the company has created an initiative called “Good for you, Good for the planet” to support the right achievement of its aspiration.
A high quality level is pursued in its products, as well as important basic characteristics regarding food safety and flavor and nutritional aspects. Thus, special attention is paid to the manufacturing processes and the products’ packaging in order to ensure hygiene standards and product characteristics along its life cycle and to minimize the risk of product contamination.
Apart from the 14 production sites, the company has its main headquarters in center Italy located nearby one of the production sites. The case study focuses on this headquarters / production plant. The plant layout is based on continuous process production and it does not have a packaging unit, as packaging is a centralized business unit. Each plant has a technical area manager to which maintenance function and engineering function are assigned. There is a closed collaboration between these two functions in order to support the production plans. Energy efficiency management is included within the responsibilities of the maintenance manager, as a secondary activity.
73

Profile company I Company I was founded in 1954 and it is a leader in the design and production of electronic and electromechanical components for the Automotive, the Off-Highway and Race industry, in Italy and worldwide. Its main aims are related to ensuring the quality of products, the environment and interpersonal relations. A strong commitment to innovation makes it invest 6% of their total revenues on Research & Development and remain at the leading-edge of technological innovations. In 2012 was inaugurated and area of 1600m2 dedicated to research in company’s headquarters, where all electronic and electro-mechanical tests in-house would be carry out.
The company has recently established a code of conduct that is yearly distributed together with company’s policies on safety, environment and quality. Its aims to achieve competitive advantage are based on quality, innovation, service and price, while keeping a strong commitment on environment, through its own pollution prevention plan and implementation of environmental management system.
It has now two production units in Italy, which follow the lean manufacturing principles and are currently implementing a WCM (World Class Manufacturing) programme. The case study concerns the production plant situated in the headquarters’ location, which employs around 400 people. This production plant has plastic injection and metal blanking departments, as well as an assembly department and a tool department, where all molds and dies are produced. Each of these departments has a maintenance team assigned that reports directly to the department manager. Thus, maintenance function is organized in different way for each department due to the different characteristics and needs of each of them, implying for example different shifts plans for each maintenance team and different balance between corrective/preventive activities and internal/external maintenance manpower within each department. There is also another maintenance team that is assigned to the management of technical services in the plant and covers all plant facilities which are not considered as production facilities.
4.2. FINDINGS OF THE CASE STUDIES This section introduces the findings of the case studies according to four categories, which are explained herein in the subsequent subsections. The first category concerns the connection between maintenance objectives and the company’s vision and goals, including the analysis of the different alignment procedures described in the case studies. The second category considers the economic dimension of sustainability at business level and at production process level. The third category explains the findings related to the environmental dimension of sustainability, including the concept of product/equipment life cycle. The inclusion of the life cycle perspective here is coherent with the perspective of sustainability given by Rachuri et al. (2011). The forth category concerns the social dimension of sustainability. Taking into account that stakeholder participation is suggested to be related to this dimension by Vinodh and Joy (2012), the analysis of maintenance stakeholders is included in this last section.
4.2.1. FINDINGS RELATED TO THE CONNECTION WITH COMPANY’S VISION AND GOALS According to Mintzberg (1988), business strategy dimensions that define a differentiation strategy are quality, price, design, support and image. One or more of these dimensions could be considered by companies to define their business strategies depending on their specific sector, context and long-term perspective. Business strategy would then drive choices regarding company’s capabilities and processes. Considering in particular manufacturing industry, the four commonly accepted competitive manufacturing capabilities are cost, quality, delivery performance and flexibility (Ward et al., 1996). These are examples of manufacturing priorities that companies could enhance in order to reach their
74

business goals. The manufacturing companies included in this study follow some of these priorities in order to gain competitive advantage at business level, but they are also transmitted to the operational level, therefore, they reach all operational functions where maintenance is included in most cases.
This section presents first the results of the analysis done during the case studies on the strategic level for the nine companies involved in the case studies, based mainly on information from company websites and the initial questions made during the interviews. Concretely, Table 4.1 presents an overview of each company’s vision and strategic competitive priorities as resulted from the interviews and completed with available information from each company. The information to fulfil the fifth column on company’s mission / vision was taken from the website when the interviewee did not mention it. On the contrary, when it was mentioned, the interviewee definition was used after triangulation with company website or documents. The sixth column reflects the direct answers that the interviewees gave to the question regarding their companies’ competitive priorities, thus, it shows their perceptions of the business strategy.
75

Table 4.1. Overview of the strategic perspective regarding the nine case studies
Case Sector Size Market type
Mission / Vision statement Competitive priorities Initiatives at business level
A Chemical /Pharma
Medium B2B “We do not sell products, we sell service” (interviewee)
Focus on niche products (high quality); Adaptability to customer needs; Production flexibility
Reorganization from 2008, gave more autonomy to plant departments, but with strong focus on team work, safety at first place, environmental respect
B Textile Medium B2B “We design and make our products for the international market with the guarantee of style, innovation and quality that distinguishes Made in Italy products” (company website); “We want to be the benchmark for our customers for the true value of our service.” (company website)
Quality; Delivery punctuality; Product innovation
A new group company to provide consultancy services based on the gained experience on energy optimization and alternative resources. Certification on the textiles regarding environmental and social concerns are made on customer requests.
C Mechanical
Big B2C “The Best Branded Consumer Products... in Every Home Around the World” (company website)
Quality and cost leadership; another key strategic aspects are product innovation and price margin.
Implementation of lean manufacturing principles adapted to their own reality. Recent unification of the management of two factories, brought the reorganization of business functions in the production site. Business initiatives for main goals: Quality first and Productivity for growth
D Chemical /Pharma
Big B2B “To offer the best products with the best service” (interviewee)
Product quality Pursue of quality, safety and environmental commitment through certifications in diverse standards
E Mechanical
Big B2C “To create the best people flow experience” (company website)
Quality and delivery punctuality
Implementation of four development programs in order to pursue its business values. Implementation of lean manufacturing principles
F Metal Big B2B “(Company F) commitment to its customers is to produce and supply material to agreed specifications and to continually strive to improve levels of quality at competitive costs” (company website)
Quality of product and know-how of production process
Recent business reorganization towards niche products in more competitive sectors
G Chemical / Pharma
Big B2B “(Company G) men and women have a passion for challenges, continuous improvement, excellence and particularly value people, the environment and integrity” (company website)
Focus on specialties; Partnerships for new East markets; Green Chemistry
Implementation of a code of ethics and certification on standards regarding Quality, Health, Safety and Environmental Management Systems. Creation of the Total Reliability Management system
H Food / Beverage
Big B2C “Good for you, good for the planet” (interviewee) Quality, cost Design team for each new product is compound by all business functions; the Quality Assurance and Food Safety Unit works to ensure food safety and product quality
I Automotive
Big B2B “Produce, in a complete cycle from design through full-scale production, electronic and electromechanical components, offering customers our competence and cooperation” (company website)
Cost, quality, delivery punctuality
Implementation of the lean manufacturing principles and deployment of WCM program; creation of a code of conduct and implementation of an environmental management system
76

As it can be observed in the previous Table 4.1, the companies considered in this exploratory study have different visions, competitive priorities and initiatives put in place to reach them. Nevertheless, all the interviewees involved in the case studies agreed that maintenance function is recognized as a contributor to company’s goals and competitive priorities, though in some cases they point out that this is happening in the recent years. Concretely, maintenance function is seen as a contributor to several aspects of competitiveness, for example, regarding product competitiveness:
“Therefore, the company is surely looking to create competitiveness and then through this competitiveness, […] to grow […] then this surely go through all lines of authority and come directly to maintenance as a contributor to product competitiveness” (transcript excerpt, Company H)
Company D’s interviewee mentioned that maintenance’s main objective is to assure the reliability of the plants, which then allows the company to perform its mission and pointed out that this contribution is recognized by the company as plant reliability is crucial for them.
The importance of plant reliability, thus, of maintenance as a means to achieve higher reliability, is seen as a strategic value by Company G:
“The reliability of a complex asset originates primarily in maintenance. The conscious and consolidated conviction that maintenance is a strategic value allows an increase in competitiveness and a generalized reduction of costs, related directly or indirectly to maintenance itself. A holistic vision, including multiple aspects, numerous interdependencies and links to multitude of disciplines and specialist, will make maintenance an element of competitive distinction “ (internal document regarding the Total Reliability Management program, Company G)
This holistic vision has been also mentioned by some interviewees in terms of the necessary perspective of maintenance manager:
”I [maintenance manager] must have this wider vision of the things that happen” (transcript excerpt , Company A)
“It is not enough to perform maintenance as we have done up to now, we must have a more holistic approach, therefore, we must have an overall vision that takes into account also those that are the business needs […] in this sense, a maintenance manager today is asked not only to be a technician […] but [the maintenance manager] must also manage the material resources of the company, that is what is provided, must manage the maintenance budget in a logic of company’s profit. Then, there is actually this transition from maintenance seen as a cost center […] to instead a unit that can give value, a strategic contribution to business, that can move the business forward. This is a bit what have changed compared to before, because it is requested to be more competitive and the competitiveness is made through all business units” (transcript excerpt , Company G)
Moreover, the interviewees have also highlighted the interconnections between maintenance function and the other functions within the plant:
“It would be difficult for me to find an area in which maintenance is excluded” (transcript excerpt , Company H)
“[maintenance] is supposed to have, anyway, more or less, connection to any activity that is performed in the company because, in theory, everything should be integrated […] to see which are the problems of others [business functions] that indirectly at first level or second level [maintenance] can influence. Think that anyway it would be right to see that all” (transcript excerpt , Company B)
77
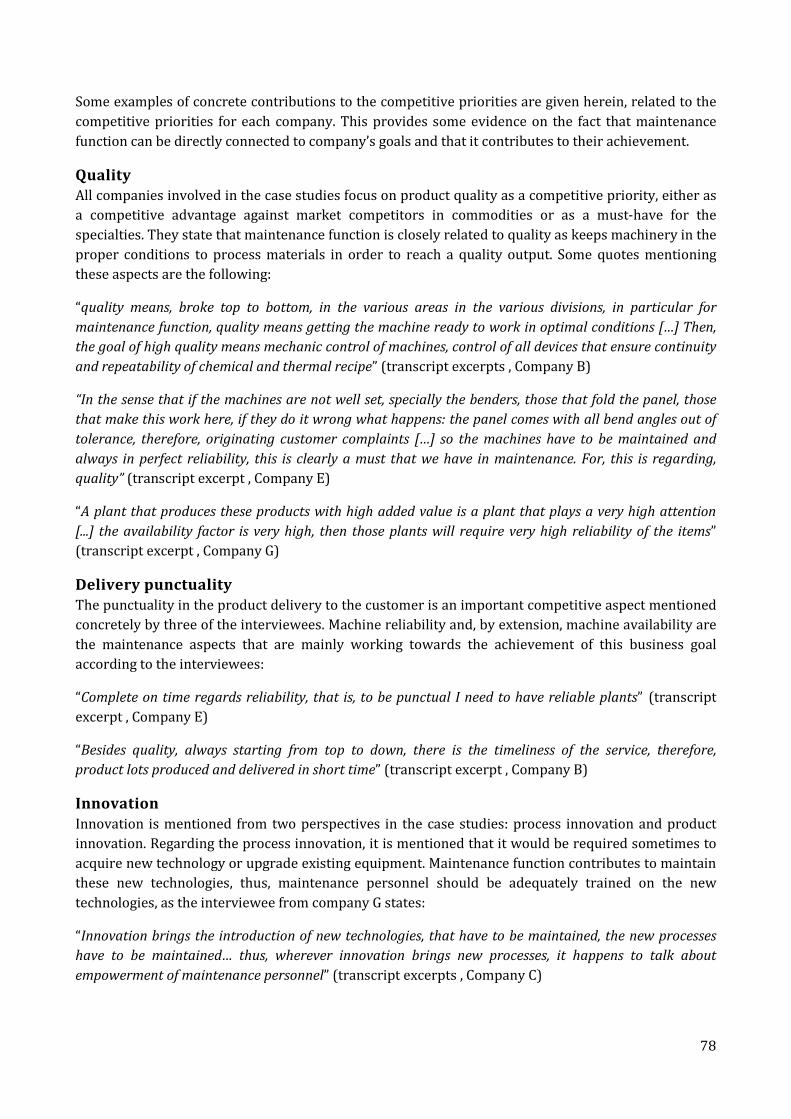
Some examples of concrete contributions to the competitive priorities are given herein, related to the competitive priorities for each company. This provides some evidence on the fact that maintenance function can be directly connected to company’s goals and that it contributes to their achievement.
Quality All companies involved in the case studies focus on product quality as a competitive priority, either as a competitive advantage against market competitors in commodities or as a must-have for the specialties. They state that maintenance function is closely related to quality as keeps machinery in the proper conditions to process materials in order to reach a quality output. Some quotes mentioning these aspects are the following:
“quality means, broke top to bottom, in the various areas in the various divisions, in particular for maintenance function, quality means getting the machine ready to work in optimal conditions […] Then, the goal of high quality means mechanic control of machines, control of all devices that ensure continuity and repeatability of chemical and thermal recipe” (transcript excerpts , Company B)
“In the sense that if the machines are not well set, specially the benders, those that fold the panel, those that make this work here, if they do it wrong what happens: the panel comes with all bend angles out of tolerance, therefore, originating customer complaints […] so the machines have to be maintained and always in perfect reliability, this is clearly a must that we have in maintenance. For, this is regarding, quality” (transcript excerpt , Company E)
“A plant that produces these products with high added value is a plant that plays a very high attention [...] the availability factor is very high, then those plants will require very high reliability of the items” (transcript excerpt , Company G)
Delivery punctuality The punctuality in the product delivery to the customer is an important competitive aspect mentioned concretely by three of the interviewees. Machine reliability and, by extension, machine availability are the maintenance aspects that are mainly working towards the achievement of this business goal according to the interviewees:
“Complete on time regards reliability, that is, to be punctual I need to have reliable plants” (transcript excerpt , Company E)
“Besides quality, always starting from top to down, there is the timeliness of the service, therefore, product lots produced and delivered in short time” (transcript excerpt , Company B)
Innovation Innovation is mentioned from two perspectives in the case studies: process innovation and product innovation. Regarding the process innovation, it is mentioned that it would be required sometimes to acquire new technology or upgrade existing equipment. Maintenance function contributes to maintain these new technologies, thus, maintenance personnel should be adequately trained on the new technologies, as the interviewee from company G states:
“Innovation brings the introduction of new technologies, that have to be maintained, the new processes have to be maintained… thus, wherever innovation brings new processes, it happens to talk about empowerment of maintenance personnel” (transcript excerpts , Company C)
78

Considering the product innovation, maintenance function could be indirectly involved by giving ideas for new products or product improvements and directly involved in the industrialization of the production process for an already designed new product, as it is mentioned in the next quotes:
“They can be ideas from maintenance that are then filtered by technology […]thus, indirectly yes, there are some ideas developed, found by a maintenance worker that later became part of product design” (transcript excerpt , Company C)
“Maintenance works a lot with the industrialization, that is the part of the company than once the product to be produced is defined, it is responsible for the configuration phase of the production line, for setting the parameters to make that product in the line… When maintenance works there, it is a great assurance for those who are here in the headquarters” (transcript excerpt , Company H)
Cost The focus on cost reduction at business level is transmitted to maintenance function and drives its objectives and approach towards maintenance policies. This is not seen though, by some interviewees, as something negative but otherwise as challenges and opportunities to improve maintenance function, as mentioned in the following quotes:
“A good part of the company focuses on trying to improve those which are the performances, since it is different… talking on fuses in general… the challenge of this type of product is to reduce the performance losses, in all of this, maintenance is also involved” (transcript excerpt , Company I)
“Another very important thing in my opinion, or anyway very close to the environment of maintenance, is also the subject of Productivity for Growth. Work on costs impacts, obviously, then on the maintenance policies and impacts on who improves them. This improves the way to do maintenance” (transcript excerpt , Company C)
Adaptability and flexibility Company A has a strong focus on customer requirements which lead to change continuously the production configuration to acquire or use the best machinery to provide high quality products, as the interviewee mentioned:
“For us, it is continuous to change disposition, change raw materials (…) in this sense, maintenance function is necessary” (transcript excerpt , Company A)
Furthermore, the procedures used for the alignment between business goals and maintenance objectives and activities have also been analyzed in this study. In order to communicate the vision and strategic goal to their business functions, and in particular to maintenance function, companies used a myriad of procedures and initiatives: regular meetings with top management with the presence of maintenance manager; initiatives to create awareness on the main company’s objectives and establish concrete targets. Some quotes mentioning procedures and initiatives:
“The procedure is quite structured (…) Every day, in first half an hour, there is a meeting to review the KPIs of the previous day (…) The maintenance manager participates also in this meeting (…) Once a week, there is a 3-4 hours meeting in which all KPIs are reviewed and analyzed respect to its advancement of the current week, the previous week, the previous month and the target of the month” (transcript excerpt, Company C)
“I interact a lot with the top management regarding maintenance and interventions related to safety and environment” (transcript excerpt , Company A)
79

4.2.2. FINDINGS RELATED TO THE ECONOMIC DIMENSION According to some interviewees, in the last recent years they have improved or even created their ways to report maintenance function outcomes and performance. For example, Company A has recently implemented a new system for categorizing the entries of the maintenance budget led by new company’s reorganization and mindset change, which has improved the control on maintenance budget according to the interviewee:
“Everything is set in a more precise way and an effort has been put in maintenance by looking at maintenance together with energy savings for example... then the budget respect to the environment and safety regulations [...] then at the end it does not change, because as I've spent last year, this year I will spend [that quantity]. Just last year... I did not know the cost entries [...] so I am aware of this because I put them [the expenses] into categories. And this is part of the budget because there was this, indeed, cultural and mind change that they [the top management] have set the various categories” (transcript excerpt, Company A)
In some cases, these reports regarding maintenance costs and performance have been used for benchmarking between several plants within a company, as this interviewee who works on the headquarters of Company G mentioned:
“Then we implement a sort of benchmark among the various production sites .... So that whatever it is the theme, in terms of reliability, in terms of warehouse management, in terms of maintenance costs, all the logic of management are compared ... and we do it, we manage the KPIs” (transcript excerpt , Company G)
In other cases, they have helped to communicate with the plant management inside a plant. This has been a recent change in some companies, as explained interviewee from Company F:
“The economic impact was given by all values that until about a year and a half ago were managed by production, today maintenance has come into this comparison [...] every month we are confronted with the ownership or management of the plant […] we talk about the costs incurred in the month, about performance and costs. Since I am the maintenance manager, maintenance is seated next to the others on this table and then we expose our costs and our performance to the top management and we justify any non-achievements of the budget” (transcript excerpt , Company F)
Maintenance cost are not just those directly related to the interventions, manpower and spare parts, there is another type of maintenance costs that are related to production losses or hidden maintenance costs. Some hidden costs of maintenance function have also been mentioned during the interviews. The interviewee in Company D mentioned that managing bad suppliers involves hidden costs, which are mainly high. Other hidden costs mentioned are the following:
- The cost of rework:
“A proper maintenance, for example, avoids that you have to rework a fabric because it has creases or stains […] Indirectly, a proper maintenance prevents further additional costs” (transcript excerpt , Company B)
- The cost associated to non-quality which is also related to customer claims when the non-quality reaches the customer:
“Not doing preventive maintenance activities could generate non-quality of the product and, as a consequence, this non-quality could reach the customer” (transcript excerpt , Company C)
80

“We have a very interesting project on the reduction of the number of consumer complaints. You would say, what maintenance has to do with respect of the product quality? It has, because we look at the root causes [of the non-quality]” (transcript excerpt , Company H)
The last transcript excerpt suggest also that maintenance technique that support the understanding of failure causes, such as root cause analysis, may be applied to find out non-quality causes, so serving directly to solve a possible important issue for the company.
- The losses due to opportunity costs, thus those associated with not serving product demand. This is clearly stated by the interviewee from Company H, as in some cases the relationship between a production line and a concrete market is 1-1, disturbances on one side could affect the other side:
“Since our products often have a relation one-to-one with the production lines, that is, one production line makes one product, not always but generally speaking, then the market goes straight on the production line” (transcript excerpt , Company H)
- The costs related to process inefficiency, i.e. losses related to process performance as mentioned by interviewee from Company I or losses related to non-optimum transformation of materials as stated by interviewee from Company B:
“An important part of the production is not customized .. a good portion of the company is focusing on trying to improve the performance [...] the challenge of this type of product is to reduce the performance losses, in all of this, maintenance is also involved” (transcript excerpt , Company I)
“If the machinery is well-maintained, automatically also the raw material is transformed in an optimal manner. If, instead, they have mechanical problems [...] you can also have the fabric downgraded to second or third quality class... not necessarily you have a good quality after the rework so you can also optimize the waste materials .. fabrics of third class are wasteful” (transcript excerpt, Company B)
According to the interviewee in Company D, maintenance activities could bring as a result a reduction of operations costs, which would indirectly increase company’s overall profits. However, another interviewee pointed out the difficulties for measuring quantitatively the benefits of maintenance function, when it is performed in the right way:
“What is needed is that whoever is at the top [in the company], that is, who put the money, sees and understands that maintenance is a benefit hardly tangible and quantifiable... while you sell something and you know how much it cost to produce it and how much did you get from the sale. . maintenance is working more on philosophical aspect. You know that you invest but you also know what the investment returns will be linked to quality improvements… you can also quantify them... I have also tried to do quantity a lot but no quantification is objective as to such a measure like an objective data from a machine such as temperature, flow, pressure… or the revenue of a sale” (transcript excerpt , Company F)
The investments mentioned during the case studies were related to both maintenance itself and its associated resources and to company’s acquisition of new technologies / machinery or upgrade of existing ones. The investments related to maintenance function concerned either on extraordinary or non-routine maintenance interventions or acquisition of tools/software to improve maintenance management procedures and maintenance performance. In this regard, Company D has made some small investments on maintenance that have brought some benefits to maintenance performance, thus to company performance also. They have adapted a software bought by another business function for its use by maintenance department, enabling better knowledge and technical documents sharing and
81

more efficient work order management. Another interviewee bringing up the benefits of the acquisition of a maintenance software was the technical office manager from Company A:
“I do everything using the same software that I use for maintenance, it centralizes everything […] I did a search on different software and this was the only one that could manage all of these things [...] we have been able to use it to make the preventive plan, to make the links with safety, to do all the checking that before we could not do” (transcript excerpt , Company A)
Another investments in maintenance have been made to provide operators with new tools to perform their activities, the interviewee from Company D mentioned that the return of these small investments are much bigger than their costs, considering the improvements on work accuracy and motivational benefits for maintenance operators. The interviewee from Company F considers that the new status of maintenance function in his company has raised the maintenance budget and gave him the possibility for investment plans:
“An increase in the budget, surely yes… the fact of having more spending power in respect of certain matters that we have been able to carry on. We have also had the opportunity to make an investment plan and to have more resources, […] to use maintenance to make extraordinary maintenance interventions” (transcript excerpt , Company F)
Whenever the company understand the strategic value of maintenance as a contributor to its main goals, such as increasing product quality or improving the delivery time, they are more willing to support investments on maintenance interventions:
“Where the current level of availability required the equipment is not reached, the company is now very willing to spend in order to increase the reliability level and thus the availability associated. So either varying maintenance policies, but often is not enough, you must do extraordinary interventions, or reasoning on the logic of new technologies, or redundancies, or even an upgrade” (transcript excerpt , Company G)
“The owners [of the company] have realized that to step up in class it is necessary to invest on maintenance” (transcript excerpt , Company F)
The investments related to company’s acquisitions or upgrades of equipment / machinery are normally bigger investments at company level in which maintenance has a contribution related to the transmission of the knowledge and information regarding plant current machinery, historical reliability and expected reliability, spare parts conditions and availability, etc. In this sense, the interviewee from Company D pointed out that sometimes continuing using old machinery may result on being more expensive that acquiring new ones, as some providers may not have still spare parts or need to remake them specifically when out of catalogue. Other comments regarding these investments, from maintenance perspective, are the following:
“There is always an eye on the machines that are known to be a bit old […] there are even machines that are more subject to maintenance because they are old and we see this in the statistics of maintenance interventions” (transcript excerpt , Company A)
“If I design a new plant and I do not involve maintenance I make the mistake, that we said before, for example, of neglecting the maintenance costs in the investment. I can make a selection of a plant or equipment seemingly convenient that has unacceptable maintenance costs” (transcript excerpt , Company G)
82

Several interviewees mentioned that collaboration between maintenance and other plant departments are necessary to make sound decisions on the future investments, this is related directly to the concept of equipment life cycle and life cycle costs:
“It must be something shared between maintenance and technology managers, but what… the considerations respect to the level of spending on an equipment compared with the performance of this equipment, compared with the current state of the art, compared with the employment of maintenance resources that this equipment needs, then the costs not only as spare parts and external interventions bus also as internal manpower... for this manpower cost, then the maintenance manager has the control” (transcript excerpt, Company G)
“Failure rate and useful life rate are ours, it is me that propose them” (transcript excerpt, Company E)
This is seen as a contribution that the maintenance manager will provide, as in the case of the maintenance manager from Company E, who clarifies that he has a role in the preparation of proposals for new equipment acquisitions (excerpt above)
4.2.3. FINDINGS RELATED TO THE ENVIRONMENTAL DIMENSION The concrete contribution of maintenance regarding several environmental factors is highlighted herein. The main factors that came out during the case studies are considered in the following and these factors are: water, air, energy, land, materials.
The connection between reprocessing / rework and maintenance function has been mentioned by several interviewees, as explained above from the economic perspective. However, there is also an effect in terms of utilities consumption highlighted in this way by one interviewee:
“A proper maintenance, for example, avoids that you rework a fabric because it has creases or stains […] So, you have to rework and consume energy again, consume water again, you consume air again” (transcript excerpt , Company B)
It seems, though, that the impact on utilities would have a different effect on different industrial contexts, e.g. it may depend on some factors such as the concrete manufacturing process and within the same factory on the specific area, as it can be inferred from different interviewee’s answers. For example, the interviewee from Company H stated that impact on utilities consumption is high from maintenance perspective as well as the interviewee from Company F (which is even the utilities network manager in the plant, as a secondary activity), while the interviewee from Company E agrees on an effect of maintenance on air and energy consumption, but not on water consumption or the interviewee from Company C sees all of them being low impacted by maintenance and explained it in this way:.
“In my opinion, as maintenance, the impact on utilities (energy, water, ..) tends to be low, then obviously you have to enter into the merits of each issue .. that is if I have an air leak and I do not fix it, it's clear that I'm having an impact on the consumption of compressed area, however, I tend to see it as something low-impact” (transcript excerpt , Company C)
Water and Air As mentioned before, the impact of maintenance on utilities consumption would vary from the context of application. Some interviewees have made concrete comments on the effects of carrying out improvements related to maintenance processes and preventive maintenance plans, which are seen connected to the reduction of utilities consumption. Some quotes reflecting this are the following:
83

“However, a proper maintenance, for example, also directly implies some benefits, for example, on the consumption of air. A factory consumes so much air and it is much related to dispersion, if you perform good maintenance in all devices that use air, you avoid unnecessary dispersions of air ... which means energy, then go directly brings benefit” (transcript excerpt , Company B)
“If I have to do maintenance on the compressed air lines, it brings savings of compressed air, therefore, of electricity, if I do maintenance on the steam line, it saves steam and then gas” (transcript excerpt , Company A)
“Regarding the air, air emissions… so the efficiency of the filters, of filtration, […] if they do not work properly or we do not perform maintenance” (transcript excerpt , Company E)
Energy Maintenance effects on energy have been linked to two main aspects by the interviewees: energy consumption reduction and energy savings or efficiency, which are also directly related to savings in other utilities as mentioned in transcripts excerpts above. Some quotes mentioning the relation between maintenance and energy are the following:
“Or in energy consumption… For example, a production line with mechanical problems, as well as having quality problems and thus indirectly lead to rework and many other problems, could consume more, there are more friction and therefore it takes more energy to operate, therefore it losses time… for equal time, it consumes more power” (transcript excerpt , Company B)
“We have a department that does the energy management for each site, the energy manager […] is very oriented towards energy saving. And inevitably he may need to ask something to us [...] The historical reliability, not the one that the equipment manufacturer says, not the one that the engineer in the technical office says but the one that we have ... so, he [energy manager] comes to the maintenance engineer [...] from this point of view, we are able to make important contributions” (transcript excerpt, Company G)
The connection between energy and maintenance seems to be very strong according to the findings of the case studies, as most of the interviewees have mentioned a closed collaboration between both plant departments / functions and, even in some cases, the maintenance manager has either some direct responsibilities on energy management activities, such as plant energy audit, or he is himself the energy manager. The interviewee from Company E explains this connection in this way:
“Thus, maintenance-energy is a strengthened synergy. It is founded and innate, meaning that, the electric motors are set by us [maintenance personnel], we assemble them, we take the measures, we know the efficiency of the machinery, it is obvious that it [energy management] passes through maintenance” (transcript excerpt , Company E)
Land It can occur that some maintenance activities are performed outside the company’s boundaries. This happens in the case of Company G, as there are some pipelines that go underground across the land. It this case, it is important to take care on the effects of that maintenance intervention and release the land in good conditions afterwards as the interviewee pointed out:
“My piping passes through a cultivated field. I go there, ask permission from the farmer, the farmer will say, what do you have to do? I have to make a dig, 5 deep, 40 meters wide, and this will destroy the crop...
84

then there begins a negotiation [...] Actually, there is obviously attention towards the restoration of the natural habitat because we are aware of this” (transcript excerpt , Company F)
Materials Keeping the equipment in good working conditions has an effect on the transformation process that the equipment has to perform. An optimal transformation of the input materials would be beneficial in terms of final product quality and safety, as well as in terms of materials savings, scrap production and allowance of input materials. Some quotes from the interviews regarding these aspects are these:
“If the machinery is well-maintained, automatically also the raw material is transformed in an optimal manner. If, instead, they have mechanical problems [...] you can also have the fabric downgraded to second or third quality class... not necessarily you have a good quality after the rework so you can also optimize the waste materials .. fabrics of third class are wasteful” (transcript excerpt , Company B)
“There is a very strong contribution to the healthiness of the product [...] if there is a reason that stops a line is for this reason, then it can stop because it's working wrong, but especially when there are hygienical conditions that do not allow….that is, that they are dangerous ... everything stops ... if the metal detector does not work, it stops [the production]. The huge impact is this for me […] that is, a maintenance intervention done well ends up with the machine clean, it does not end with the machine dirty, it is essential” (transcript excerpt , Company H)
“If a good maintenance includes, for example, a good lubrication plan this would preserve the bearings fleet of the plant. If you do a poor lubrication, with poor materials or with a wrong periodicity, you risk of having to improperly change the bearings. So maintenance understood as proper timing, proper use of materials, e.g. using the right lubricant, and proper management could bring to a reduction of spares, such as bearings” (transcript excerpt , Company B)
“if the right maintenance is not done, for example to a mold, there is a risk of producing scrap… or for example to a machine, if the right maintenance is not done or maintenance is done wrong (…) there is a risk to produce scrap for poaching, (…) anyway, there is a real risk to ruin the material”, “risk of not being able to use some materials, especially in the mold or cold press if they are not properly maintained, they degrade and degrading they cannot work input materials which are less noble (…) so having to throw tons of materials that although within the specifications given to supplier, cannot be work on the machine” (transcript excerpt , Company C)
Equipment integrity and End of Life (EOL) Preventive maintenance plans can reduce the use of consumables, such as spare parts but it has been also associated with the whole equipment as a means to keep asset integrity and extend the equipment life cycle. There is also some potential benefits regarding the reuse of old equipment either as spare parts for other similar equipment or for building new facilities in the plant. Some interviewees mentioned these aspects during the interviews, as the next quotes reflect:
“I made a lot of plants using old machinery that was kept aside, then we used them instead. This then maintaining the safety and regulatory measures, for example, on electrical systems this can rarely be done” (transcript excerpt , Company A)
“We dismantled a fully automated factory that failed. As they were going to throw it all away, we started to dismantle inverters, drives, etc., [...] if there are good parts over there, we take them and we keep them” (transcript excerpt , Company E)
85
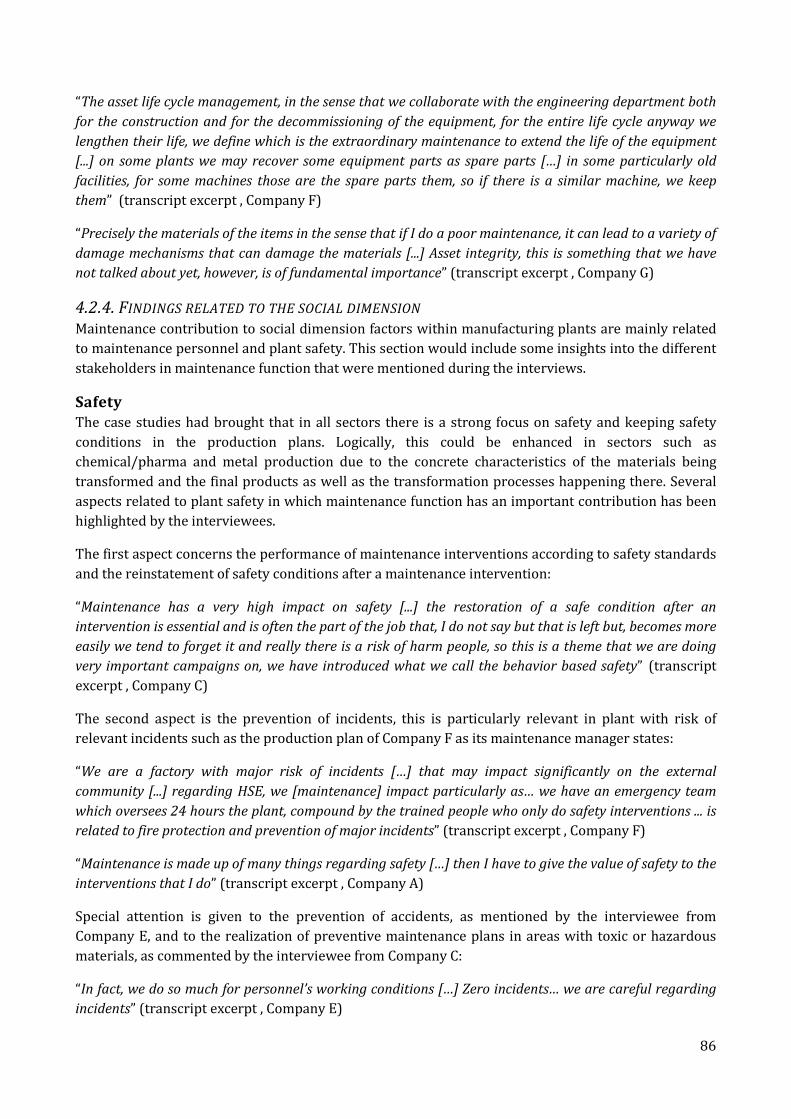
“The asset life cycle management, in the sense that we collaborate with the engineering department both for the construction and for the decommissioning of the equipment, for the entire life cycle anyway we lengthen their life, we define which is the extraordinary maintenance to extend the life of the equipment [...] on some plants we may recover some equipment parts as spare parts […] in some particularly old facilities, for some machines those are the spare parts them, so if there is a similar machine, we keep them” (transcript excerpt , Company F)
“Precisely the materials of the items in the sense that if I do a poor maintenance, it can lead to a variety of damage mechanisms that can damage the materials [...] Asset integrity, this is something that we have not talked about yet, however, is of fundamental importance” (transcript excerpt , Company G)
4.2.4. FINDINGS RELATED TO THE SOCIAL DIMENSION Maintenance contribution to social dimension factors within manufacturing plants are mainly related to maintenance personnel and plant safety. This section would include some insights into the different stakeholders in maintenance function that were mentioned during the interviews.
Safety The case studies had brought that in all sectors there is a strong focus on safety and keeping safety conditions in the production plans. Logically, this could be enhanced in sectors such as chemical/pharma and metal production due to the concrete characteristics of the materials being transformed and the final products as well as the transformation processes happening there. Several aspects related to plant safety in which maintenance function has an important contribution has been highlighted by the interviewees.
The first aspect concerns the performance of maintenance interventions according to safety standards and the reinstatement of safety conditions after a maintenance intervention:
“Maintenance has a very high impact on safety [...] the restoration of a safe condition after an intervention is essential and is often the part of the job that, I do not say but that is left but, becomes more easily we tend to forget it and really there is a risk of harm people, so this is a theme that we are doing very important campaigns on, we have introduced what we call the behavior based safety” (transcript excerpt , Company C)
The second aspect is the prevention of incidents, this is particularly relevant in plant with risk of relevant incidents such as the production plan of Company F as its maintenance manager states:
“We are a factory with major risk of incidents […] that may impact significantly on the external community [...] regarding HSE, we [maintenance] impact particularly as… we have an emergency team which oversees 24 hours the plant, compound by the trained people who only do safety interventions ... is related to fire protection and prevention of major incidents” (transcript excerpt , Company F)
“Maintenance is made up of many things regarding safety […] then I have to give the value of safety to the interventions that I do” (transcript excerpt , Company A)
Special attention is given to the prevention of accidents, as mentioned by the interviewee from Company E, and to the realization of preventive maintenance plans in areas with toxic or hazardous materials, as commented by the interviewee from Company C:
“In fact, we do so much for personnel’s working conditions […] Zero incidents… we are careful regarding incidents” (transcript excerpt , Company E)
86

“The area were we have chemicals that are dangerous[…] obviously here all preventive maintenance needs to be done and if not, the risk for others’ health is very very important” (transcript excerpt , Company C)
The third aspect is related to the contribution of maintenance function to the compliance with safety standards and certifications (this also concerns environmental standards and certifications as well). Some interviewees have mentioned this contribution of maintenance function:
“We give the part of technical contribution to build the operating procedures as well as to define the interventions to face anomalies in the plant” (transcript excerpt , Company F)
“We have a series of audits, we have so many audits because we are certified according to the ISO 9001, the ISO 14001, the OSHAS… so we have an integrated management system for safety, environment and quality and this integrated management system is partly managed by maintenance” (transcript excerpt , Company G)
Maintenance personnel Several factors can be cited regarding maintenance personnel, such as working conditions, team work, motivation procedures and training. They are all discussed herein.
Regarding the working conditions, the reduction of failures as a consequence of preventive maintenance activities has brought out less pressure in the working environment and no need to work extra hours according to the interviewee from Company D. Less pressure in the working environmental has also been reached in Company A by focusing on collaborative and team work:
“We work certainly more in teams and it can be less pressure when there is a problem, in the sense that when there is a problem if they are 3 days, they are 3 days… is not that… then, do it in one day […] if then it is possible to make the emergency repair, if it is possible to do it… if not… if we do it in 3 days is fine, we solve [the problem] the same, we do not have this oppression” (transcript excerpt , Company A)
Some companies has implemented some initiatives in order to improve the team work and collaborative relationships within maintenance personnel as well as increase the motivation of maintenance personnel. The latter is done in several ways, the most common approaches are related to the empowerment or training of maintenance personnel and to the provision of better or more adequate tools for performing maintenance activities. The interviewee from Company D reflects on this as a means to increase motivation of maintenance personnel as they realized that the company cares about their work and how is performed.
“Then, we tend to do some team building events with the maintenance personnel, this may be the classic dinner rather than events, other types of events [...] Generally, the team building events are usually related to the white collar personnel, so the team building with the maintenance workers are very rare, even if sometimes they are done” (transcript excerpt , Company C)
The training needs can be driven either by the implementation of new technologies, by a need that arise from maintenance plans or by the professional paths established by the company. Examples of these are given in the following quotes:
“In the end we are going towards having more and more technological plants and therefore I need more trained personnel […] For example, I have electricians who are trained to do only instrumentation and maintenance interventions in areas with risks of explosions and work at height […] being less trained, it does not work well” (transcript excerpt , Company A)
87
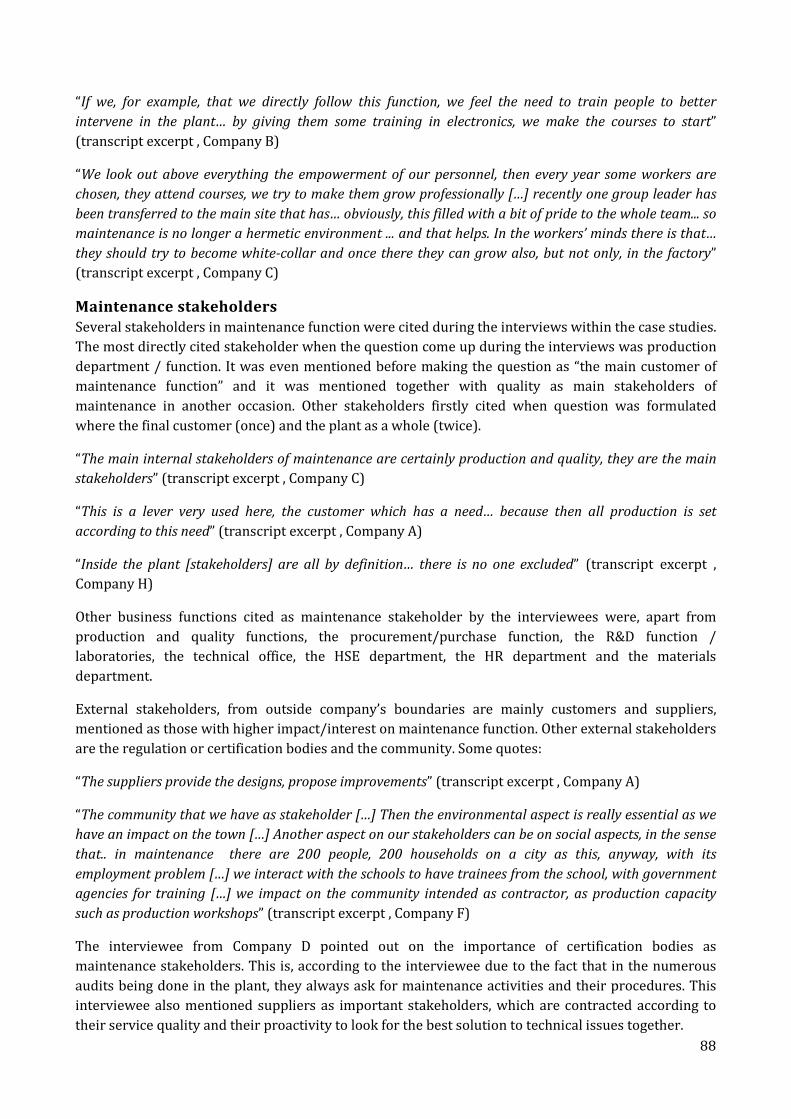
“If we, for example, that we directly follow this function, we feel the need to train people to better intervene in the plant… by giving them some training in electronics, we make the courses to start” (transcript excerpt , Company B)
“We look out above everything the empowerment of our personnel, then every year some workers are chosen, they attend courses, we try to make them grow professionally […] recently one group leader has been transferred to the main site that has… obviously, this filled with a bit of pride to the whole team... so maintenance is no longer a hermetic environment ... and that helps. In the workers’ minds there is that… they should try to become white-collar and once there they can grow also, but not only, in the factory” (transcript excerpt , Company C)
Maintenance stakeholders Several stakeholders in maintenance function were cited during the interviews within the case studies. The most directly cited stakeholder when the question come up during the interviews was production department / function. It was even mentioned before making the question as “the main customer of maintenance function” and it was mentioned together with quality as main stakeholders of maintenance in another occasion. Other stakeholders firstly cited when question was formulated where the final customer (once) and the plant as a whole (twice).
“The main internal stakeholders of maintenance are certainly production and quality, they are the main stakeholders” (transcript excerpt , Company C)
“This is a lever very used here, the customer which has a need… because then all production is set according to this need” (transcript excerpt , Company A)
“Inside the plant [stakeholders] are all by definition… there is no one excluded” (transcript excerpt , Company H)
Other business functions cited as maintenance stakeholder by the interviewees were, apart from production and quality functions, the procurement/purchase function, the R&D function / laboratories, the technical office, the HSE department, the HR department and the materials department.
External stakeholders, from outside company’s boundaries are mainly customers and suppliers, mentioned as those with higher impact/interest on maintenance function. Other external stakeholders are the regulation or certification bodies and the community. Some quotes:
“The suppliers provide the designs, propose improvements” (transcript excerpt , Company A)
“The community that we have as stakeholder […] Then the environmental aspect is really essential as we have an impact on the town […] Another aspect on our stakeholders can be on social aspects, in the sense that.. in maintenance there are 200 people, 200 households on a city as this, anyway, with its employment problem […] we interact with the schools to have trainees from the school, with government agencies for training […] we impact on the community intended as contractor, as production capacity such as production workshops” (transcript excerpt , Company F)
The interviewee from Company D pointed out on the importance of certification bodies as maintenance stakeholders. This is, according to the interviewee due to the fact that in the numerous audits being done in the plant, they always ask for maintenance activities and their procedures. This interviewee also mentioned suppliers as important stakeholders, which are contracted according to their service quality and their proactivity to look for the best solution to technical issues together.
88

It seems that also here, the perspective of stakeholders depends on some business driven factors, such as type of plant organization, type of market addressed (B2B vs B2C; commodities vs. specialties) and allocation of maintenance function within the functional chart.
4.3. DISCUSSION & FRAMEWORK FOR MAINTENANCE VALUE The findings from the cases studies indicate that maintenance contribution to business competitive priorities and more sustainable manufacturing operations has several dimensions. There are three main dimensions of maintenance contribution that emerge from the case studies: the sustainability dimension, the level of application dimension and the life cycle dimension. Figure 4.1 represents the three-dimensional space of maintenance contribution to more sustainable operations in manufacturing, i.e. the framework for maintenance value from sustainability perspective in manufacturing. Specific contributions of maintenance within this space would depend, as the findings of the case studies suggest, on the business context as well as the operational context of the production plant where maintenance function placed.
Figure 4.1. Framework for maintenance value within sustainable manufacturing
The sustainability dimension is represented by the three sustainability aspects: economic, environmental and social. The findings of the case studies support this as maintenance contribution is occurring in all three aspects. Concretely, the contribution of maintenance towards economic sustainability concerns the reduction of both maintenance costs and total operations costs (as far as they can be seen as hidden costs of not performing maintenance interventions or not performing the right ones), which would led to the increase of company profit, and the improvement of company’s investments in new equipment or new technologies, by providing information regarding historical reliability, expected useful life and failure rates and training maintenance personnel of the specific maintenance needs of new technologies / equipment. Environmental sustainability can be achieved by resource (water, air, energy, materials) efficiency, air emissions reduction and land conservation, depending on the specific operational context these would require more or less involvement of maintenance function. Regarding equipment life cycle, apart from the contribution to equipment acquisition, maintenance is a main actor to preserve equipment integrity and extend, when possible, its life cycle by performing the necessary routine or non-routine maintenance interventions. The social aspect regards the relationship of maintenance function with its various stakeholders within and outside the company, special attention to maintenance personnel as those stakeholders in which decisions taken in the maintenance department would affect directly. Maintenance contribution to social aspect is also linked to plant safety and human safety, as a main means to avoid undesired failures and minimize the consequences of the failures.
89
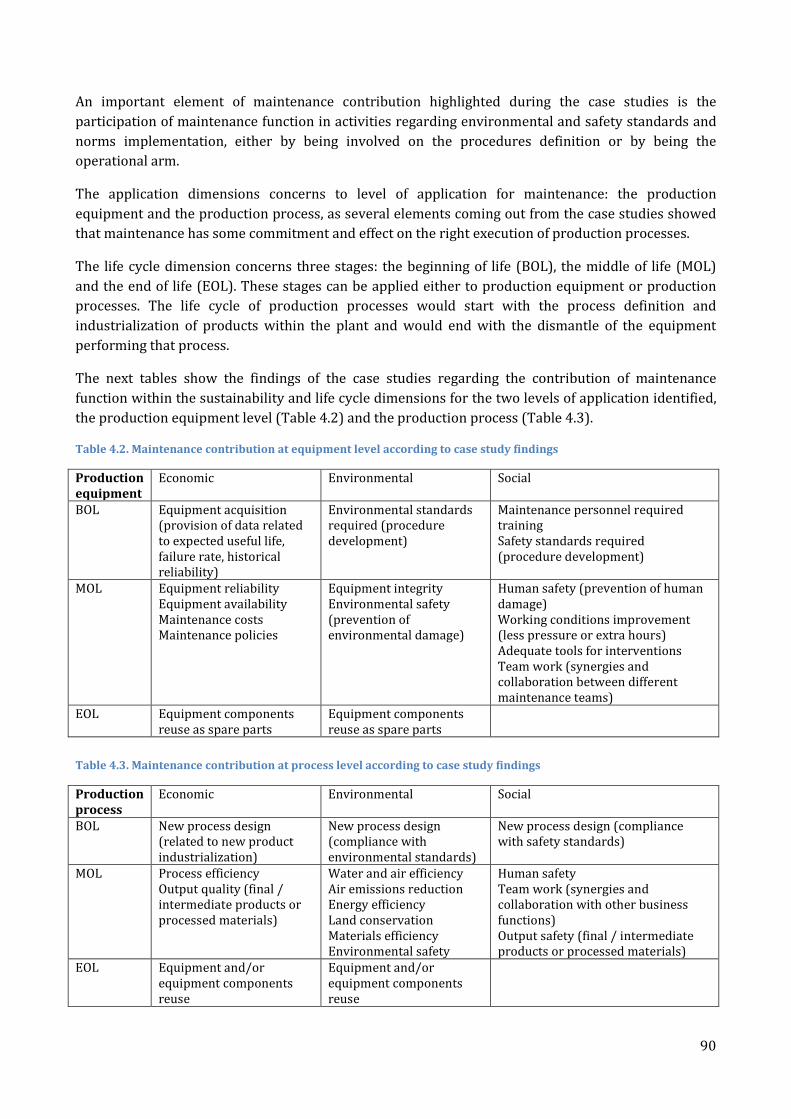
An important element of maintenance contribution highlighted during the case studies is the participation of maintenance function in activities regarding environmental and safety standards and norms implementation, either by being involved on the procedures definition or by being the operational arm.
The application dimensions concerns to level of application for maintenance: the production equipment and the production process, as several elements coming out from the case studies showed that maintenance has some commitment and effect on the right execution of production processes.
The life cycle dimension concerns three stages: the beginning of life (BOL), the middle of life (MOL) and the end of life (EOL). These stages can be applied either to production equipment or production processes. The life cycle of production processes would start with the process definition and industrialization of products within the plant and would end with the dismantle of the equipment performing that process.
The next tables show the findings of the case studies regarding the contribution of maintenance function within the sustainability and life cycle dimensions for the two levels of application identified, the production equipment level (Table 4.2) and the production process (Table 4.3).
Table 4.2. Maintenance contribution at equipment level according to case study findings
Production equipment
Economic Environmental Social
BOL Equipment acquisition (provision of data related to expected useful life, failure rate, historical reliability)
Environmental standards required (procedure development)
Maintenance personnel required training Safety standards required (procedure development)
MOL Equipment reliability Equipment availability Maintenance costs Maintenance policies
Equipment integrity Environmental safety (prevention of environmental damage)
Human safety (prevention of human damage) Working conditions improvement (less pressure or extra hours) Adequate tools for interventions Team work (synergies and collaboration between different maintenance teams)
EOL Equipment components reuse as spare parts
Equipment components reuse as spare parts
Table 4.3. Maintenance contribution at process level according to case study findings
Production process
Economic Environmental Social
BOL New process design (related to new product industrialization)
New process design (compliance with environmental standards)
New process design (compliance with safety standards)
MOL Process efficiency Output quality (final / intermediate products or processed materials)
Water and air efficiency Air emissions reduction Energy efficiency Land conservation Materials efficiency Environmental safety
Human safety Team work (synergies and collaboration with other business functions) Output safety (final / intermediate products or processed materials)
EOL Equipment and/or equipment components reuse
Equipment and/or equipment components reuse
90

The competitive priorities that the companies are pointing out in order to gain competitive advantage have influence on maintenance function goals and priorities. The findings from the case studies allows identifying some links between some competitive priorities and maintenance function requested contribution.
The focus on product quality as a competitive priority is transmitted to maintenance function as a request for the equipment to be ready to work in optimal conditions and ensure its reliability, so no damages in the product can be caused by equipment failure. In the cases in which delivery punctuality is a company priority, maintenance function is requested to retain equipment availability and reliability at high level, so the equipment would not cause any delays in the production plan. A focus on product innovation is directly related to maintenance as a participant on the industrialization process for new products, while a focus on process innovation would require from maintenance to have the competencies to maintain the new technologies or equipment working on proper conditions. A company engaging into cost reduction as a competitive priority would request that maintenance function keeps good control of its budget and investments and improves its maintenance policies as well as contributes to the reduction of production performance losses. The operational implications of these strategic requests to maintenance function can be mapped in the maintenance contribution framework presented above.
91

5. THE MAINTENANCE BUSINESS MODEL AS A DRIVER FOR
VALUE CREATION This chapter concerns the investigation of value creation within maintenance function in manufacturing and aims at providing a tool for understanding the logic behind different choices in maintenance function. The chapter starts with a brief background on the concept of business models, as closely related to value creation in business literature and as main source of inspiration for the concept presented herein. After this background, the concept of Maintenance Business Model (MBM) is introduced and framed within a proposal of a maintenance management framework. Afterwards, the elements envisaged to be part of the MBM are presented and some categories are proposed for each of them. The chapter ends with a discussion and a conceptual example of choices within the MBM inspired by previous chapter 4.
This chapter is an extension of some concepts that have been presented previously in the Maintenance Performance Measurement and Management Conference 2013, held in Lappeenranta (Finland) and afterwards the article was selected for a special issue in the International Journal of Strategic Engineering Asset Management (IJSEAM), currently in print.
5.1. BACKGROUND ON BUSINESS MODEL LITERATURE The term business model is widely used in academic and business literature (Richardson, 2008; Zott et al., 2011; Lee et al., 2011). Although there is a general agreement on the basic definition of a business model, considered as a simple description of how a firm does business (Richardson, 2008), there is still not theoretical grounding in economic or business studies about this concept (Teece, 2010). As the business model concept is relatively young, its place and role within organizations is still subject to debate (Osterwalder et al., 2005), specially its boundaries and interconnections with other business aspects, such as business strategy and business processes (Bask et al., 2010; Al-Debei and Avison, 2010).
Several authors have made in the last years a review of publications on business model concept (as examples: Al-Debei and Avison, 2010; Teece, 2010; Bask et al.,2010; Zott et al., 2011; George and Bock, 2011). In particular, the analysis of publications carried out by Zott et al. (2011) highlighted some common themes regarding business models as: (1) a new unit of analysis, (2) a holistic perspective on how firms do business, (3) an emphasis on activities, and (4) an acknowledgement of the importance of value creation. George and Bock (2011) made a similar analysis focused on organizational theory and entrepreneurship perspectives and found six broad themes for business model concept as reflecting on (1) the organizational design, (2) the resource-based view of the firm, (3) a narrative and sense making role of the business model, (4) the nature of innovation, (5) the nature of opportunity, and (6) the structure and governance of transactions. This heterogeneity of perspectives motivated a myriad of definitions for the concept of business model, which some authors like Al-Debei and Avison (2010) and Zott et al. (2011) has collected in their publications. A selected list of business model definitions is presented in Table 5.1.
92

Table 5.1. Selected list of business model definitions
Author/s, Year Definition
Chesbrough and Rosenbloom, 2002
The BM is the heuristic logic that connects technical potential with the realization of economic value.
Hedman and Kalling, 2003 BM is a term often used to describe the key components of a given business.
Richardson, 2008 The BM is a conceptual framework that helps to link the firm’s strategy, or theory of how to compete, to its activities, or execution of the strategy.
Casadesus-Masanell and Ricart, 2010
A BM is… a reflection of the firm’s realized strategy.
Osterwalder and Pigneur, 2010 A BM describes the rationale of how an organization creates, delivers and captures value.
The open debate regarding business models is focus on two main aspects, which are its place and role within a firm and its composition. Regarding the former aspect, Bask et al. (2010) consider that strategy, business models, and processes are closely linked, focusing on the same challenges within the firm, although on different levels and Richardson (2008) suggests that a business model helps to link the firm’s strategy, or theory of how to compete, to its activities, or execution of the strategy. Many authors explain these connections considering different business “layers”, where the business model is a link, an interface or theoretical layer between the business strategy layer and the business processes layer (Amit and Zott 2001; Osterwalder et al., 2005; Al-Debei and Avison, 2011; Bask et al., 2010) and, by consequence, the business model is seen as a conceptual tool of alignment, thus concretely considering business strategy, business model and business processes as a harmonized package (Al-Debei and Avison, 2011).
Nevertheless, the business model is not only seen as a tool for alignment but it is claimed to have multiple purposes within an organization. Osterwalder et al. (2005) outline the managerial roles of the business model concept, identifying five categories of functions where it may have contribution: (i) understanding and sharing, as well as (ii) analyzing and (iii) managing the business logic; (iv) fostering prospects and innovation; (v) patenting of business models or processes. Other authors delineate the business model contribution to company’s development by considering the business model as a source of innovation (Zott and Amit, 2007; Teece, 2010), as the representation of the execution of the strategy to gain competitive advantage (Richardson, 2008) and as a powerful tool for improving execution when it is used as a basis for employee communication and motivation (Magretta, 2002). Casadesus-Masanell and Ricart (2010) state that “business models are made of concrete choices and the consequences of these choices… different designs have different specific logics of operation and create different value for their stakeholders”, thus, underlining the relevant link between the business model concept and the multi-stakeholder perspective of value creation in a firm.
The other aspect under debate regarding business model concept is its composition (i.e. which are the elements comprised in a business model). Diverse frameworks have been proposed in this regard that include a variety of components within the BM (see, as an example, the reviews made by Morris et al.
93
(2005) and Richardson (2008) on business model components). Among other proposals, Osterwalder and Pigneur (2010)’s canvas covers the dominant components discussed in literature, although presenting some limitations such as a focus on solely economic value and a restricted inclusion of stakeholders, comprising just customers and immediate partners (Holgado et al., 2013). The components enclosed within the canvas are: value proposition, customer segments, channels, customer relationships, key resources, key activities, key partnerships, revenue streams and cost structure. The value proposition is the most cited component in literature, therefore, it may be the central element around which the business model can be built (Richardson, 2008). Osterwalder and Pigneur (2010)’s canvas has been already used in several applications, such as to describe new service business for agricultural machinery manufacturers (Corti et al., 2013), to support the development of product service systems (PSS) in aeronautics scope (Wallin et al., 2013), to map the case of a machine tool manufacturer (Barquet et al., 2012) and to be part of a lean approach for start-ups development (Blank, 2013).
This brief review of the business model concept brings out some interesting ideas that can be taken into consideration as basis for its conceptual application to industrial maintenance, such as:
– the business model as an unit of analysis, endowed with a holistic perspective of business logic which provides alignment between strategy and processes;
– the emphasis on value as a driving concept for the business model: business logic is described from a viewpoint of how value is created, delivered and captured;
– the business model as a conceptual map illustrating the key components of a business, as a guide to influence the way operations (i.e. processes) are executed;
– the business model as a source of innovation, for analyzing the existent business logic and nurturing potential changes and innovations;
– the business model canvas (Osterwalder and Pigneur, 2010) for enabling concrete application of the concept, due to its diffusion within industry-related work it is considered as a main reference to keep a practical approach in the conceptualization of business models.
5.2. THE MAINTENANCE BUSINESS MODEL CONCEPT Previous section has set up the background on business model literature in which the new proposal of the maintenance business model is built on, as well as introduced the business model canvas developed by Osterwalder and Pigneur (2010) as the main reference for this study, since it has been recognized both as reference in the scientific community and as intuitive model for industrial application. This section defines the Maintenance Business Model concept and positions it within a proposal of a maintenance management framework, based on findings in business literature.
5.2.1. DEFINITION OF THE MAINTENANCE BUSINESS MODEL The concept of maintenance business model (MBM) was first mentioned by Garetti et al. (2007) as the way in which maintenance management is organized and its main purpose was defined as “to put in evidence the relationship between technical inputs and the management outputs that can be achieved”. They stated that the MBM is strongly influenced by company’s features and context, such as its business objectives (vendor or user of industrial equipment) and its geographical dispersion (mono-site or multi-site) and they identified four super-classes of MBMs based on those drivers: (1) site-maintenance and (2) centralized-maintenance, regarding the users of industrial equipment; (3) maintenance artisan, machinery vendor acting as service provider or (4) pure service provider in case of companies providing industrial maintenance as its main business. Later, Fumagalli et al. (2008) defined the MBM as a set of interrelated elements present in the maintenance organization and in the
94

technological systems used to support maintenance operations, giving a technology-oriented perspective to the concept with a specific focus on the exploitation of new ICT systems for condition based maintenance. Finally, Gómez Fernández et al. (2008) included the viewpoint of value created into the MBM concept, specifically the value created by Maintenance Service Provider companies to their clients. Here, the concept is revisited and enhanced with the background on business literature presented in section 5.1.
The business model concept is seen as a design of the value creation, delivery and capture mechanisms (Teece, 2010; Osterwalder and Pigneur, 2010), so it has a strong connection with the logic of value creation in a company. By analogy, it could be an adequate concept for understanding the value creation mechanisms within different business functions in a company, thus, permitting its conceptual application to industrial maintenance as a business function within manufacturing companies.
In the same way as the business model of a company drives the execution of the strategy, according to Richardson (2008), the concept of MBM can be seen as the logic that permits the right execution of maintenance strategy. If maintenance strategy is aligned with business strategy, then the MBM is also coherent with the business goals.
The execution of the strategy, although guided by the business model, is then realized by business processes. The same applies to the maintenance function by analogy: thus, maintenance processes are seen as the realization of maintenance strategy and they are guided and, to some extent limited, by the choices taken in the MBM.
The MBM describes the rationale of how maintenance function creates and delivers value to its stakeholders and how the value is captured by maintenance function itself. Figure 5.1 graphically reports the MBM canvas similarly to the BM canvas proposed by Osterwalder and Pigneur (2010), including a short description of its main components. The main components within the MBM, inspired by the business literature, are: value proposition, stakeholder groups, stakeholder relationships, communication channels, key resources, key activities, key partnerships, cost structure, value capture streams. These components are further explained and categorized in section 5.3.
95

Figure 5.1. The MBM canvas (derived by the business model canvas developed by Osterwalder and Pigneur, 2010)
5.2.2. THE MAINTENANCE BUSINESS MODEL AS PART OF A MAINTENANCE MANAGEMENT FRAMEWORK Some authors have suggested that maintenance management involves two main aspects: the formulation and the execution of the strategy (Murthy et al., 2002; Crespo Márquez et al., 2009). A missing linkage between these concepts can be foreseen, by analogy with business model literature (as mentioned in section 5.1). In this regard, a three-layer framework is proposed for maintenance management which adds an additional dimension as the central point (Figure 5.2) and builds on the analogy with business literature that presents the business model as the link between the definition and execution of business strategy, i.e. as an instrument of alignment between business strategy and business processes. The inclusion of the MBM as an intermediate layer supports also the emphasis on maintenance function as a source of value, due to the link between business models and value creation stated in business literature.
Figure 5.2. Proposed maintenance management framework based on findings from business literature
The maintenance strategy layer concerns the strategic decisions for managing the maintenance function and aligning it with business goals and asset management strategy. The business context
96

would determine the requirements for asset management strategy, e.g. capacity, flexibility, quality (Komonen and Despujols, 2013). Based on these requirements and the overall business goals stated by company’s top management, the strategic goals and objectives for maintenance function will be defined, as the key aspects which concerns maintenance strategy.
The strategic decisions taken within maintenance strategy then drive choices to be made regarding the key components of maintenance function at the MBM layer. Richardson (2008) states that a business model implies options on which to design the business processes, so it acts as a base for running the operational processes precisely. The choices within the MBM would then have operational consequences which, reflecting the maintenance strategy goals, lead maintenance processes to perform activities in a way that is coherent with both maintenance objectives and business goals.
Although it may seem that the three layers follow a one-way process, we envisage a continuous improvement cycle guided from the MBM layer which acts not only as a link but also as a tool for analysis and innovation and is indicated by the feedback loop drawn in the left side of Figure 5.2.
5.3. PROPOSAL OF CATEGORIZATION WITHIN THE MBM ELEMENTS This section describes the main components within the MBM canvas and suggests some potential categorizations within each element in order to support the selection of different options according to the business context.
The definition of the MBM components are often derived from the analogue definition given by Osterwalder and Pigneur (2010) for business model components, reinterpreting the concepts according to maintenance function perspective and considering a broader inclusion of maintenance stakeholders. In this concern, it is worth to make some remarks: (i) the understanding of each category, within a component, could depend strongly on the type of company, industrial sector as well as other context variables, for example geographical dispersion (mono-site or multi-site); (ii) different business / maintenance strategies can lead to different perception on the priority / importance of different categories.
Hereafter the main components, and examples of their possible categories, of the MBM are introduced; their definition represents a contribution to the conceptualization of the MBM concept. Examples from the previous nine case studies, explained already in chapter 4, are taken to illustrate better the MBM components. These examples are highlighted in italics.
5.3.1. Maintenance value proposition The value proposition concerns the bundle of activities and services performed by maintenance function that creates value for its stakeholders. The type of value created varies from one stakeholder type to another, according to their different needs and requirements. For example, the company itself would require maintenance function to contribute to its business goals and to gain advantages in terms of higher product quality or flexibility and availability of production equipment. Value could be generally categorized also according to its nature as tangible (e.g. quality, availability) or intangible (e.g. know-how, brand, status) or according to the triple bottom line viewpoint (Elkington, 1997) as economic (e.g. contribution to profit or productivity), environmental (e.g. energy efficiency) or social (e.g. health and safety). Some potential characteristics of the value provided by maintenance function could be, for instance, the following: technological update/upgrade, asset life cycle, product quality, process design, cost reduction, risk reduction (related to decrease of risk of failure but also prevention or mitigation of its effects).
97

In this regard, the findings from the previous nine case studies (chapter 4) have driven the proposal of the framework for maintenance value within sustainable manufacturing (section 4.3) which frames maintenance value among three dimensions considering the three sustainability perspectives (economic, environmental and social), two levels of application of maintenance contribution (production equipment and production process) and the life cycle perspective (BOL, MOL and EOL stages). These three dimensions would allow mapping the value of industrial maintenance within the MBM.
As an example, equipment reliability is a maintenance value that is related to the economic perspective of sustainability, applied directly to manufacturing equipment in its MOL phase. This value has been mentioned for example by company G.
5.3.2. Maintenance stakeholders groups Stakeholders can be seen as “any group or individual who can affect or is affected by the achievement of the organization’s objectives” (Freeman, 1984) or as “individual or group that has an interest in any decision or activity of an organization” (ISO 26000, 2010). The role of maintenance as a function inside a company has an effect on the definition of maintenance stakeholders, so it is important to consider its potential relations with other business functions. Thus, derived by the definitions from general literature, maintenance stakeholders may be seen as any individual, group or business function that has interest / influence in maintenance decisions / activities or that can be affected by the execution of maintenance processes. Understanding stakeholders’ requirements is an important issue in order to define adequate value propositions that provide them with their expected value. Therefore, the categorization of maintenance stakeholder groups would be useful for establishing the prioritization of actions to be taken. The categorization herein proposed consists of two drivers.
A first driver considers their relations with respect to company’s boundaries, i.e. internal vs. external stakeholder groups. Maintenance function could be used also as a boundary, considering as internal stakeholders only those within the maintenance process, as suggested by Söderholm et al. (2007). However, the results from previous chapter 4 suggest that this driver is more likely to be understood when internality is considered within plant/ company boundaries, as all manufacturing companies involved in the case studies gave this perspective.
A second driver relates to the way in which stakeholders and maintenance function interact with each other, i.e. direct vs. indirect. Depending on the company context, some stakeholders could be seen as indirect or direct from the maintenance function viewpoint, for example the final customer that in some cases would need to interact with maintenance function (Crespo Márquez and Gupta, 2006).
As an example, Figure 5.3 illustrates some results regarding the findings of the case study carried out in Company C n relation to the analysis of their maintenance stakeholders. The boundaries for internality / externality are considered as the company boundaries. In this concrete case, the final customer is seen as an indirect stakeholder due to the consequences of wrong maintenance interventions (or lack of intervention) in the product quality that could arrive to them. The main internal stakeholders which maintenance works very closely with are production and quality departments, another internal and direct stakeholder could be also the technology department. This department is related to the production processes in the same extend as maintenance, but its responsibilities are closer to product design, thus in some occasions it would be the intermediary that brings innovation ideas from maintenance to the product design department. The relationship with machine constructors is based on a collaborative approach with frequent direct interaction with maintenance personnel, which leads to consider them as direct stakeholders.
98

Figure 5.3. Example of maintenance stakeholders taken from the case study in Company C
5.3.3. Stakeholder relationships This component concerns the relationships that maintenance function creates with its stakeholders and how these relationships are maintained. It would apply just to direct stakeholders to whom maintenance function establishes an immediate relationship, independently on being internal or external. Strong and dynamic relationships are the foundation of any successful business endeavor (Allee, 2008) and are important for value creation (Windahl and Lakemond, 2006). Thus, the relationships that maintenance function sets up with its direct stakeholders could be crucial to increase the value provided by maintenance’s value propositions. The relationships could be categorized by the role that the stakeholders play as a part involved in the release of the value proposition: they could offer assistance, consultancy, information, collaboration, coordination,… The relationships could be supported by procedures and methods or not, e.g. so being provided in an informal way.
In the example above (Figure 5.3), collaboration is set between all direct stakeholders mentioned. The nature of this collaboration would depend on each stakeholder though. The collaboration with production and quality department would involve frequent meetings and decisions taken together regarding the advancement of the production and the equipment state. Machine constructors would maintain a collaborative relationship with maintenance personnel by providing assistance or advice regarding better ways of operate their machinery. In this case study (related to Company C), the procedure for keeping the relationship with internal stakeholders is based on a set of meetings organized both weekly and monthly, while the relationship with machine constructors is developed with more informal ways, such as occasional meetings or walks inside the plant areas.
5.3.4. Communication channels Unlike the previous component, communication channels are established with direct and indirect stakeholders, although it may have different aims depending on the stakeholder type. Communication channels are the interfaces between maintenance and its stakeholders created in order to deliver the value propositions. These interfaces may be supported by available technologies in terms of information systems or platforms where information regarding maintenance performance or equipment health can be shared among several stakeholders. The interfaces may permit two-way communications, serving to send information from maintenance to its stakeholders and vice versa. Mobile technology could support this communication by providing contextualized information to different types of users through ubiquitous user interfaces (Emmanouilidis et al., 2009). Thus, communication channels could also be the means for receiving requests or work orders from maintenance stakeholders.
99

An example of a communication channel that is working effectively comes from the case study done in Company D, where an information system acquired by another company department has been adapted to its use by maintenance department also. This information system is used by production personnel to send maintenance requests and by maintenance personnel to receive and keep track of their pending or already attended requests, so keeping an historical record of all work done by each maintenance operator. Each operator has a personalized interface in the system and can see all his/her historical records. Both maintenance personnel and production personnel can access the historical records of their maintenance requests or maintenance interventions performed. This information system has improved the timing of maintenance interventions and has removed the extra hours employed previously by maintenance personnel fulfilling by hand the paperwork related to the interventions.
5.3.5. Key resources The key resources of the maintenance function are the essential assets required to create and deliver value to the maintenance stakeholders. They are necessary to perform the activities or services offered through the value propositions as well as to establish relationships and communicate with maintenance stakeholders. Resources pertain to different types and can be categorized in many ways. The classification herein proposed includes four categories of resources: financial, human, physical and support resources. Financial resources for maintenance function are mainly identified as maintenance budget. In some cases, it could also concern the life cycle budget of the equipment under maintenance, which is categorized according to two concepts: CAPEX (capital expenditures) and OPEX (operational expenditures). Human resources comprise the maintenance personnel, their skills and competences. The classification can be done according to different taxonomies. Maintenance personnel may be appointed with different responsibilities and duties, hence they could also be classified according to their organizational role, at an operational/technical, engineering/supervision or managerial level. Physical resources encompass a wide variety of technical and technological resources, spread from ICT components for maintenance management as a whole, to instruments, tools and MRO (Maintenance Repair Operations) materials for maintenance execution, to crucial assets within the company production facilities. Support resources concern the set of methodologies, procedures and techniques needed to support decision making and carry out maintenance activities at different management levels, i.e. strategic, tactical and operational levels.
As an example, the case study carried out in company G can be cited as the company has some equipment which are used to transform materials in order to produce high value-added products, i.e. niche products, thus this particular equipment are considered key for Company G.
5.3.6. Key activities The key activities of the maintenance function are the main activities or processes performed in order to create and deliver value to maintenance stakeholders. Maintenance is defined as the combination of all technical, administrative and managerial actions during the life cycle of an item intended to retain it in, or restore it to, a state in which it can perform the required function (EN 13306). In a broader sense, it comprises decisions at all levels of organization regarding acquiring and maintaining a high level of reliability, availability and value of assets (Al-Turki, 2011) and decisions along all life cycle of assets, i.e. not only during operations phase but also in design and end of life phases (Takata et al, 2004; Levrat et al, 2008). Thus, maintenance activities can be categorized in three levels: strategic, tactical and operational.
Strategic activities are usually associated with long-term planning and could assume two different perspectives regarding the development of maintenance function (related to the alignment between business and maintenance objectives) and the life cycle management (concerning the contribution of
100
maintenance to asset life cycle phases). The alignment with business goals would be done with respect to maintenance activities, processes, internal and external resources, as well as to maintenance organization. Asset life cycle costing and operational availability analysis are activities where maintenance would contribute to support capital asset decisions.
Tactical activities consider a mid-term horizon, comprising all the activities carried on to engineer and plan maintenance during the asset operations phase; such as maintenance budgeting, planning and control cycle, supervised (or not) through maintenance engineering. Herein, the activities deals with failure and criticality analysis, development of plans to avoid potential failures and performance losses, technical and economic performance control, continuous performance improvement as maintenance spending in the budget can be also dedicated to such activities. Besides, support activities are those related to the supplier and contractual management, regarding maintenance services and/or materials.
Operational activities concern a short-term horizon and encompass a huge variety of activities performed by maintenance personnel for delivering field service, ranging from MRO replacements, human sense inspections, to real time monitoring, diagnostics / prognostics based on availability of technical/technological tools. Short term planning and work order management are two relevant operational activities. Finally, it is worth observing that the different types of activities can be at different technology intensity, depending on the “tools” available at hand of maintenance personnel.
In the concrete case study done in Company H, a key activity could be the performance of a root cause analysis to identify the cause of a non-quality product that has reached the final customer and made a customer to send the company a product complaint.
5.3.7. Key partnerships The key partnerships for maintenance function are those formed with the main third parties that provide services and/or resources required to create and deliver value to maintenance stakeholders. They entail a supplement to the key resources of maintenance function, which may be, in some cases, fundamental in order to perform the activities or services involved in maintenance’s value propositions. The key partners pertain to different types and can be categorized in many ways. The categorization herein proposed includes four categories: Maintenance Service Providers, Original Equipment Manufacturers, Consulting companies, MRO materials suppliers.
Maintenance service providers (MSPs) are third parties providing specialized skills and competences to maintenance function. They may offer operational/technical, engineering/supervision or managerial capabilities, for example: maintenance planning and control, maintenance engineering, engineering support for plant revamping and retrofitting, spare parts engineering, diagnostics and prognostics, field maintenance service with different specialties (mechanical and electric maintenance, etc.).
Original Equipment Manufacturers (OEMs) are manufacturers of durable goods providing additional services linked to their products (technical assistance supporting operation and maintenance of their equipment, for example: spare parts management, maintenance planning, field maintenance service, diagnostics and prognostics, tele-maintenance service,...). Consulting companies would provide support to rethink the maintenance activities in the company, in different matters such as: maintenance engineering, maintenance planning, business process re-engineering and re-organization, empowerment of maintenance personnel, etc.
101

Last but not least, MRO materials suppliers would provide different classes of maintenance materials (i.e. strategic, generic and specific materials, and consumables) as well as related repair services.
An example of key partnerships regarding the case study done in Company C is their relationship with machine constructors. They are starting to share their OEE results with some constructor as a way to receive more feedback on ways to improve the machine performance in the manufacturing plant. This would be also useful for the machine constructors to get data on the working behavior of their machinery in real manufacturing contexts.
5.3.8. Cost structure Cost structure is the categorization of cost entries to be included as costs of maintenance activities. The categorization can be done in several ways. A simple manner of classification is the following: fixed costs versus variable costs. In all cases, the cost structure is much related to the concrete context of maintenance function within the company and company’s organizational structure. Detailing cost structure within the MBM means to relate such structure to the strategic perspective of maintenance. In fact, it is possible to highlight peculiarities within the MBM by identifying specific cost categories. For example, the identification of cost category “Cost for walk-around inspections for condition based maintenance activity”, highlights an element within the MBM that then can be related to the created value (e.g., the reduction of failure risk), to key activities (e.g., condition based maintenance related actions such as on condition lubrication, on condition substitution of components), or to key partnership (e.g., service providers offering such inspection service). Detailing appropriately the costs thus allows to create a path that links properly all the elements of the MBM among them.
The structure of maintenance costs would then reflect the main targets of maintenance function, and by extension, of the manufacturing company. An example of this can be taken from the case study done in Company A in which the company management has set a list of categories that are used for classifying the maintenance interventions performed in the plant within the maintenance budget, according to recently established business targets.
5.3.9. Value capture streams This component concerns the value generated to maintenance function from the creation and delivery of value to its stakeholders. The value that maintenance function perceives from the activities and/or services shaping its value propositions may come from different sources, i.e. from different value capture streams. As main stream, maintenance stakeholders would provide maintenance with feedback from activities or services performed, which can be quantitative, such as incentives, but also qualitative, such as satisfaction or recognition. Another stream could be reflected within the maintenance function itself. According to Parida and Kumar (2006), maintenance performance measures are used for quantifying the value created by maintenance. These measures could not only serve as a means to communicate the achievement of maintenance goals to the stakeholders, but also as feedback to maintenance function regarding its performance, thus as a source for continuous improvement. This would be used to evaluate internally maintenance performance and guide actions to improve maintenance processes and to increase the value created for maintenance stakeholders. It is worth mentioning that this can be concretely important for one group of maintenance stakeholders, maintenance personnel, which could capture value in different ways such as incentives on the available budget, direct monetary benefits or public acknowledgement and visibility within the company. A proper design of value capture streams is crucial to avoid some risks, such as not achieving good maintenance practices due to the difficulty to motivate maintenance personnel.
102

The case study done in Company G reflects that the value created by maintenance function in each production plan is collected in a report which includes not only maintenance costs but also the balance between maintenance policies and the incidence of maintenance activities in production outcomes. These reports are shared among all company’s production sites and serves as a benchmarking tool where all sites can see the performance of the others and compare their actual performance with other production sites.
5.4. DISCUSSION The MBM is then fostered to be the relevant layer to execute the maintenance strategy by driving the design of maintenance processes, compared to business goals. The proposed framework advances in the direction suggested by Parida and Kumar (2006) that identified a gap between maintenance planning and execution, and stated the need of mapping maintenance processes.
The envisaged potential uses of the MBM concept concern the mapping of main elements within maintenance function and the understanding of their connection among each other, with maintenance strategy and maintenance processes as well as with company strategic priorities and main manufacturing goals.
A particular interesting use would be to analyze how implementation of new technologies as key resources (e.g. e-maintenance) or acquisition of a concrete service from key partners (e.g. from an OEM extending its product-service offer) can affect or influence the different elements within the MBM Canvas, with particular concern to the cost structure and value capture streams as leading factors of expected performance improvement.
Furthermore, another relevant use of the MBM can be envisioned as a tool to understand how a concrete contribution of maintenance function to the competitive priorities in a manufacturing company is realized. This potential use can be illustrated with the findings from the case studies already introduced in chapter 4. In this regard, different choices within the components of the MBM are proposed in next Figure 5.4 by considering the specific cases of companies whose competitive priority is delivery punctuality. The companies that expressed this goal are concretely companies B, E and I, thus, the information to provide the different choices within each MBM component has been extracted from those case studies. This conceptual exercise gives an example of which could be the choices in the MBM related to a company which points out to delivery punctuality as a main manufacturing priority. Figure 5.4 includes all possible choices taken from the case studies, but they may not be complete to give an overview of each company’s MBM as this was not the scope of the case studies. Actual choices in all MBM components related to one single company would depend on its concrete application scenario, i.e. industrial sector, company size, type of production facilities, geographical distribution, etc.
103

Figure 5.4. Example of possible choices in the MBM for maintenance value contributing to delivery punctuality
In the conceptual example illustrated in Figure 5.4, maintenance value pertains to the economic sustainability dimension, applied to production equipment in its MOL stage (according to the framework proposed in section 4.3). The main maintenance stakeholders which are related to this value are the plant management, other plant departments such as production and technical office and other company plants, as the final product may be assembly elsewhere. The relationship with plant management could be informative and maintained through reports highlighting the status of production equipment, as an example. The relationship with other plant departments could be collaborative in order to support each other in the realization of the production plan within the request delivery time and this relationship could be maintained by frequent meetings involving all necessary plant departments. The coordination with other plants within the same company could be done by means of electronic mails and/or information systems where data would be shared among plants. The key activities related to equipment reliability and availability could be very different depending on the concrete industrial case, as examples the execution of preventive maintenance plans or the monitoring of equipment conditions can be given. Key resources can be the most critical equipment in the plant in terms of having higher impact on possible production delays and maintenance engineering techniques related to failure analysis and Reliability, Availability and Maintainability (RAM) analysis. Key partnerships could be created with machine constructors or external manpower suppliers. The latter could be also considered as an important entry in maintenance costs, as well as the cost of preventive maintenance plans and the investments on non-routine maintenance interventions in order to restore the optimal working conditions of the equipment. Last but not least, main value capture streams may be the feedback and benchmarking with other similar production sites regarding product delivery performance measures.
104
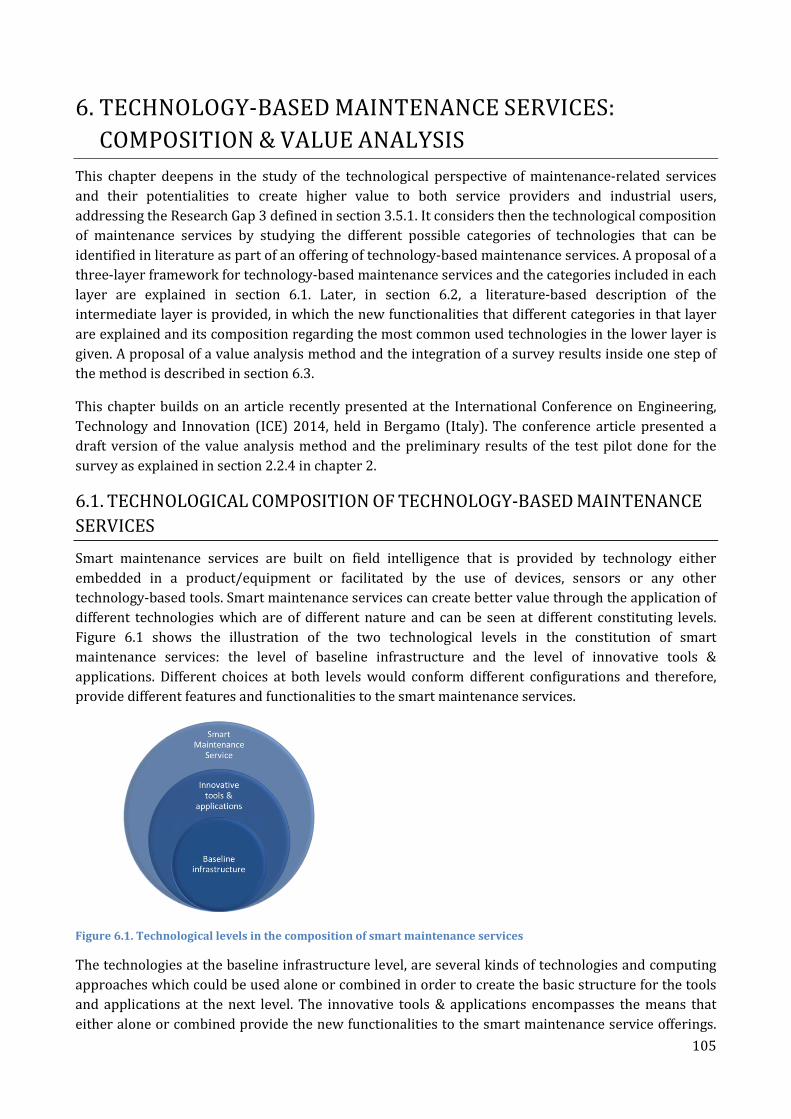
6. TECHNOLOGY-BASED MAINTENANCE SERVICES:
COMPOSITION & VALUE ANALYSIS This chapter deepens in the study of the technological perspective of maintenance-related services and their potentialities to create higher value to both service providers and industrial users, addressing the Research Gap 3 defined in section 3.5.1. It considers then the technological composition of maintenance services by studying the different possible categories of technologies that can be identified in literature as part of an offering of technology-based maintenance services. A proposal of a three-layer framework for technology-based maintenance services and the categories included in each layer are explained in section 6.1. Later, in section 6.2, a literature-based description of the intermediate layer is provided, in which the new functionalities that different categories in that layer are explained and its composition regarding the most common used technologies in the lower layer is given. A proposal of a value analysis method and the integration of a survey results inside one step of the method is described in section 6.3.
This chapter builds on an article recently presented at the International Conference on Engineering, Technology and Innovation (ICE) 2014, held in Bergamo (Italy). The conference article presented a draft version of the value analysis method and the preliminary results of the test pilot done for the survey as explained in section 2.2.4 in chapter 2.
6.1. TECHNOLOGICAL COMPOSITION OF TECHNOLOGY-BASED MAINTENANCE
SERVICES Smart maintenance services are built on field intelligence that is provided by technology either embedded in a product/equipment or facilitated by the use of devices, sensors or any other technology-based tools. Smart maintenance services can create better value through the application of different technologies which are of different nature and can be seen at different constituting levels. Figure 6.1 shows the illustration of the two technological levels in the constitution of smart maintenance services: the level of baseline infrastructure and the level of innovative tools & applications. Different choices at both levels would conform different configurations and therefore, provide different features and functionalities to the smart maintenance services.
Figure 6.1. Technological levels in the composition of smart maintenance services
The technologies at the baseline infrastructure level, are several kinds of technologies and computing approaches which could be used alone or combined in order to create the basic structure for the tools and applications at the next level. The innovative tools & applications encompasses the means that either alone or combined provide the new functionalities to the smart maintenance service offerings.
105

They are founded on the baseline infrastructure elements, so being composed by a combination of the technologies at the lower level. It is worth to mention that, even though not included as a category in the baseline infrastructure level, interoperability standards play an important role in the combination of different technologies and their use for configuring innovative tools & applications, especially in cases complex cases in which several tools are included in the service offering. Interoperability standards have been developed to ensure the integration and interoperation between technological components (see Chapter 5 in Gómez Fernández and Crespo Márquez (2012) for a review on interoperability standards in industrial and telecommunication sectors).
The different categories for each technological level are illustrated in Figure 6.2 and are described herein. Although this proposal of technological levels is based on technology and maintenance related literature, some examples can be found in service-oriented literature of technological tools which are used for the design or the delivery of smart maintenance services. For example, Hui et al. (2001) propose a web-based intelligent fault diagnosis system for customer support, where the customer support is the smart maintenance service, the fault diagnosis system is a diagnosis tool within the intermediate level, and web technologies combined together with AI conform the elements at the baseline infrastructure level.
Figure 6.2. Categories identified within the technological levels
6.1.1. CATEGORIZATION OF THE BASELINE INFRASTRUCTURE LEVEL The different 8 categories proposed for this level are the following: web technology, wireless technology, artificial intelligence, agent technology, advanced computing methods, sensor technology, model-based technology and materials technology. All these types of technologies have been found in literature related to industrial maintenance as part of innovative tools and applications proposed by different authors. Each category is briefly explained next.
Web technology Web technology uses multi-tier architecture for data and information sharing among the tiers that “are like a platform where software programs and Web applications can be run on and be used for various tasks” (Campos, 2009). Internet, intranet and Ethernet technologies are examples of web technologies.
106
Wireless technology The main advantages of wireless technology compared to the wired systems are related to savings in networking cost and to its degree of flexibility (Iung et al., 2009). It includes, among others, the following technologies: WLAN, WPAN, RFID, GPS, Bluetooth, and ZigBee.
Artificial Intelligence (AI) AI is used to assist interpretation of fault data and degradation parameters, statistic failure analysis and prognosis and intelligent diagnosis (Han and Yang, 2006). Commonly used AI techniques are Expert Systems (ESs) and Artificial Neural Networks (ANNs), which are used alone or combined with others AI techniques to enhance diagnostics systems (Jardine et al., 2006).
Agent technology This technology has evolved from distributed artificial intelligence (Campos, 2009). There are different types of agents, such as intelligent agents, which can autonomously plan actions, interact with others and respond to dynamic and unpredictable situations (Wooldridge and Jennings, 1995), and mobile agents, which are able to move across the network (Campos, 2009).
Computing methods This category encompasses different methods for processing information based on mathematical, numerical or logical methods. Examples of recent computing approaches are autonomic computing, grid computing and cloud computing. Autonomic computing brings to the system the capability of sensing its operating environment and taking decisions if needed to change the environment or its behavior (Lee et al., 2011). Grid computing is a method of distributed computing which enables anyone in the grid to cooperate and access each other’s information (Zhang et al., 2010). Several authors make a comparison between grid computing and cloud computing and see the latter as an evolution of grid computing, which provides a pool of information from which resources are retrieved on-demand (Foster et al., 2008 ; Zhang et al., 2010). Dillon et al. (2010) see five fundamental elements of cloud computing: on-demand self-service, broad network access, resource pooling (to benefit from economies of scale and specialization), rapid elasticity in consumption and measured service level.
Sensor technology The development of sensor technology has enabled to move from failures detection to degradation monitoring (Crespo Márquez and Iung, 2008). Additional capabilities provided by the advances of sensor technology, needed to convert sensors into smart sensors, are the following: two-way digital communication, self-identification, self-diagnosis and more powerful data processing (Zhang et al., 2004). There is a high variety of sensors; in the field of tool condition monitoring, a classification of sensors was given by Kurada and Bradley (1997), which consider in-process sensors as those monitoring during the machining operation, and in-cycle sensors as those operating through periodic examination. It is also possible to combine several sensors in network configurations (Tao et al., 2003) or use sensor fusion techniques to obtain mutual information from different sensors (Lee et al., 2006).
Model-based technologies Modelling technology in maintenance has been used for product life cycle management to carry out different evaluations in each product life cycle phase: for example, failure analysis in the planning phase or diagnosis in the operation phase (Takata et al., 2004). Virtual product models may also be used for facilitating decision making in the design phase (Nee et al., 2012). These technologies include product modelling, digital product modelling and 3-D modelling.
107

Materials technology This broad category encompasses techniques based on materials science, such as thermography, ultrasonic, acoustic emissions and tribology, which provide the characterization of the physical properties of materials in order to monitor materials behaviors and detect defects and material deterioration (Achenbach, 2000). As examples; changes in material density has been suggested as a potentially useful condition monitoring for insulation materials in nuclear power plants (Gillen et al., 1999 ); the emissions of infrared energy in machinery can determine their operating conditions (Tsang, 1995); and an spectral analysis could detect the loss of the protection capacity of a lubricant, so indicating that the lubricant needs to be changed (Carnero, 2005). Smart materials are those displaying some properties or responding to specific stimuli in a way that can be used as a monitoring parameter in a specific situation (Goddard et al., 1997) and could be used to build up smart sensors or built-in test equipment (BITE) (Pintelon et al., 1999).
6.1.2. CATEGORIZATION OF THE INNOVATIVE TOOLS & APPLICATIONS LEVEL The above baseline technologies are used individually or combined to conform tools and applications that can be used in industrial maintenance. The literature review done has found 10 categories of innovation tools & applications at this technological level, which are the following:
Smart devices and sensors Smart devices such as graphic tablets, PDA, smart tags are hardware devices which are equipped with wireless technologies in order to provide functionalities that support the operator in the field (Iung et al., 2009). Smart sensors combine a sensing element with information processing and wireless technologies in order to improve their easiness of configuration and connectivity (Zhang et al., 2004).
e-CMMS They are web-enabled computerized maintenance management systems (CMMS) which are able to monitor and manage preventive maintenance activities while connecting to mobile technologies for retrieving (Iung at el, 2009). Duran (2011) highlights the relevance of using a CMMS when the number of critical equipment is high or the need for maintenance resources management is significant.
Inspection tools Assets and equipment conditions could be measured through periodic inspection in order to detect failures and/or its degradation state. These inspections are performed manually or automatically. This category includes the tools used for those periodic inspections, such as NDT (Kumar et al., 2009), a combination of vibration and lubrication analysis (Carnero, 2005), power spectrum graph, phase spectrum graph (Jardine et al., 2006), among others.
Diagnosis tools The heart of Condition-Based Maintenance (CBM) is condition monitoring, which encompasses: data acquisition, data processing and analysis, data interpretation and extraction of useful information from it (Campos, 2009). Tools in this category are condition monitoring tools or fault diagnosis tools. Fault diagnosis can be done both manually, requiring specific expertise, or automatically, by the use of automatic pattern recognition which can classify signals based on the information and/or features extracted from the signals (Jardine et al., 2006). Diagnosis tools would perform automatic pattern recognition by using different approaches, connected to different baseline technologies explained above as AI or model-based technologies.
108

Prognosis tools Prognosis and Health Management (PHM) is a natural extension of the CBM approach that aims at predicting, with some level of confidence and by identifying trends in degradation parameters, when the equipment is going to fail (Lee and Lapira, 2013). Concretely, prognostics “attempts to predict faults or failures before they occur” (Jardine et al., 2006). Although sharing the same principles as diagnosis tools (based on monitoring of equipment or process parameters), they provide different functionalities so they are here categorized separated. Prognosis approaches can be classified into three basic groups: model-based prognostics, data-driven prognostics, and experience-based prognostics (Gouriveau and Medjaher, 2011). An overview of prognosis technical approaches and the types of information needed for their implementation is given by Muller et al. (2008).
Cloud-based tools These tools use cloud computing technology in order to provide the necessary resources to customers via information technology on-demand self-services over a network and independent of location and devices (Marston et al., 2011). These applications are delivered as services over the Internet and can support different types of services: Software as a Service (SaaS), Infrastructure as a Service (IaaS) and Platform as a Service (PaaS) (Dillon et al., 2010; Armbrust et al., 2010).
Simulation tools Simulation techniques have been largely used in maintenance for several purposes, such as to study different preventive maintenance and replacement strategies, to investigate the effect of different maintenance policies on production, to define the optimal maintenance workforce and inventory capacity (Andijani and Duffuaa, 2002). An example of a simulation technique for maintenance is Monte Carlo simulation, which has been used for calculating the likelihood of failure occurrences (Tsutsui and Takata, 2012) and for maintenance capacity planning (Crespo Márquez, 2007). Some authors propose simulation tools/applications which combine modelling and artificial intelligence techniques (Marseguerra et al.,2002; Oyarbide-Zubillaga et al., 2008). Moreover, Saker and Haque (2000) propose a simulation tool for the joint optimization of maintenance and spare parts inventory policies.
Location and tracking tools These tools may use wireless technology, such as RFID or GPS, due to their capability for assets tracking and handling, in order to provide location-based services (Emmanouilidis et al., 2009). Additional functionalities are to support operator and component identification, the storage of conventional data on the machine and also the traceability of the past maintenance actions (Iung et al., 2009)
Augmented reality (AR) tools These tools are built on innovative communication equipment (virtual reality) for supporting man/machine or man/man exchanges (Iung et al 2009) and equipped with a see-through capability, which optically superimpose text and/or images computer, using half-silvered mirrors, onto directly real-world scenes (Zlatanova, 2002). They can use 3-D models and animations to show the information and the procedures to the operator (Porcelli et al., 2013). There, these tools can provide support to operators for maintenance execution by showing the sequence of operations to perform (De Crescenzio et al., 2011) and by tracking the motion of operator’s body, head, hands,.. (Zlatanova, 2002).
109
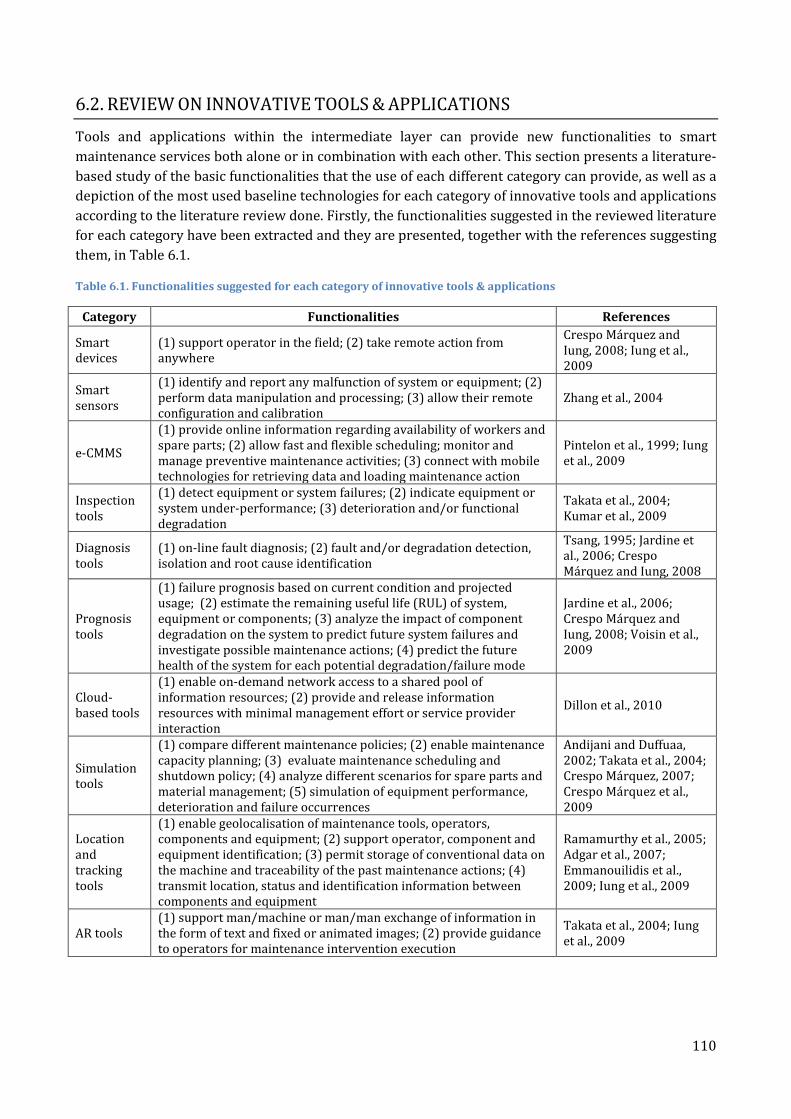
6.2. REVIEW ON INNOVATIVE TOOLS & APPLICATIONS Tools and applications within the intermediate layer can provide new functionalities to smart maintenance services both alone or in combination with each other. This section presents a literature-based study of the basic functionalities that the use of each different category can provide, as well as a depiction of the most used baseline technologies for each category of innovative tools and applications according to the literature review done. Firstly, the functionalities suggested in the reviewed literature for each category have been extracted and they are presented, together with the references suggesting them, in Table 6.1.
Table 6.1. Functionalities suggested for each category of innovative tools & applications
Category Functionalities References
Smart devices
(1) support operator in the field; (2) take remote action from anywhere
Crespo Márquez and Iung, 2008; Iung et al., 2009
Smart sensors
(1) identify and report any malfunction of system or equipment; (2) perform data manipulation and processing; (3) allow their remote configuration and calibration
Zhang et al., 2004
e-CMMS
(1) provide online information regarding availability of workers and spare parts; (2) allow fast and flexible scheduling; monitor and manage preventive maintenance activities; (3) connect with mobile technologies for retrieving data and loading maintenance action
Pintelon et al., 1999; Iung et al., 2009
Inspection tools
(1) detect equipment or system failures; (2) indicate equipment or system under-performance; (3) deterioration and/or functional degradation
Takata et al., 2004; Kumar et al., 2009
Diagnosis tools
(1) on-line fault diagnosis; (2) fault and/or degradation detection, isolation and root cause identification
Tsang, 1995; Jardine et al., 2006; Crespo Márquez and Iung, 2008
Prognosis tools
(1) failure prognosis based on current condition and projected usage; (2) estimate the remaining useful life (RUL) of system, equipment or components; (3) analyze the impact of component degradation on the system to predict future system failures and investigate possible maintenance actions; (4) predict the future health of the system for each potential degradation/failure mode
Jardine et al., 2006; Crespo Márquez and Iung, 2008; Voisin et al., 2009
Cloud-based tools
(1) enable on-demand network access to a shared pool of information resources; (2) provide and release information resources with minimal management effort or service provider interaction
Dillon et al., 2010
Simulation tools
(1) compare different maintenance policies; (2) enable maintenance capacity planning; (3) evaluate maintenance scheduling and shutdown policy; (4) analyze different scenarios for spare parts and material management; (5) simulation of equipment performance, deterioration and failure occurrences
Andijani and Duffuaa, 2002; Takata et al., 2004; Crespo Márquez, 2007; Crespo Márquez et al., 2009
Location and tracking tools
(1) enable geolocalisation of maintenance tools, operators, components and equipment; (2) support operator, component and equipment identification; (3) permit storage of conventional data on the machine and traceability of the past maintenance actions; (4) transmit location, status and identification information between components and equipment
Ramamurthy et al., 2005; Adgar et al., 2007; Emmanouilidis et al., 2009; Iung et al., 2009
AR tools (1) support man/machine or man/man exchange of information in the form of text and fixed or animated images; (2) provide guidance to operators for maintenance intervention execution
Takata et al., 2004; Iung et al., 2009
110

Secondly, the baseline technologies that are suggested by the reviewed literature to be included in each category of innovative tools and applications have been investigated. A general analysis of the use of baseline technologies brings up that some baseline technologies are present in most categories while others are not so commonly used / mentioned. Figure 6.3 show the percentage of use of baseline technologies in the categories for tools and applications. It is worth to mention that web technology is the most used baseline technology, being present in 9 out of 10 tool categories, followed by wireless technologies, computing methods and agent technology. The less mentioned baseline technology is materials technology, which is used in 4 out of 10 tool categories.
Figure 6.3. Percentage of use for baseline technologies in tool categories.
Moreover, an analysis of the composition has also been done in order to identify which are the most frequently used technologies within the baseline infrastructure level for each tool category. The analysis shows that an average of 5 baseline technologies are present in the tool categories, but a more detailed insight explains that either the categories are mentioned to employ 4 or less or to employ 7 or 8 baseline technologies. This permits to make two groups to be represented and further analyzed: the first group is compound by categories using 4 or less than 4 baseline technologies; the second group refers to those employing 7 or 8 baseline technologies. Figure 6.4 and Figure 6.5 show the distribution of technologies composing the two groups, respectively. The columns refer to the number of articles which mention that the baseline technology is being used to build up a tool included within that category of innovative tools and applications.
Figure 6.4. Citation of baseline technologies for tool categories in the first group
111
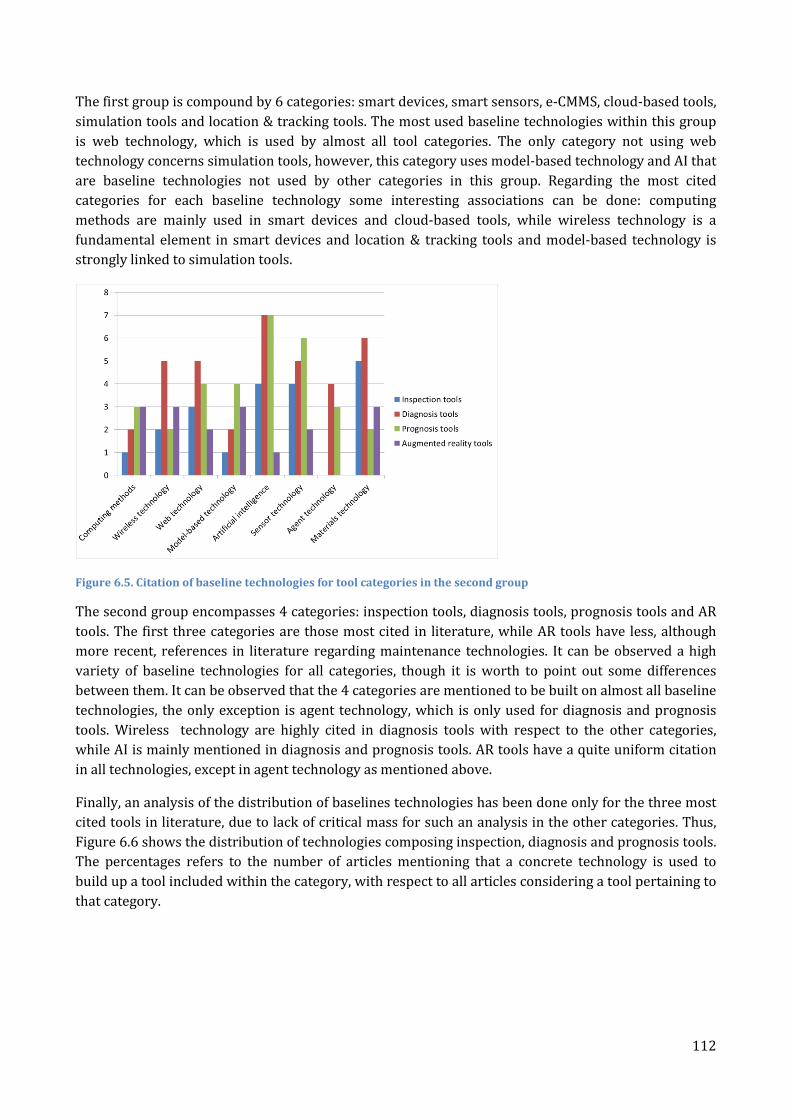
The first group is compound by 6 categories: smart devices, smart sensors, e-CMMS, cloud-based tools, simulation tools and location & tracking tools. The most used baseline technologies within this group is web technology, which is used by almost all tool categories. The only category not using web technology concerns simulation tools, however, this category uses model-based technology and AI that are baseline technologies not used by other categories in this group. Regarding the most cited categories for each baseline technology some interesting associations can be done: computing methods are mainly used in smart devices and cloud-based tools, while wireless technology is a fundamental element in smart devices and location & tracking tools and model-based technology is strongly linked to simulation tools.
Figure 6.5. Citation of baseline technologies for tool categories in the second group
The second group encompasses 4 categories: inspection tools, diagnosis tools, prognosis tools and AR tools. The first three categories are those most cited in literature, while AR tools have less, although more recent, references in literature regarding maintenance technologies. It can be observed a high variety of baseline technologies for all categories, though it is worth to point out some differences between them. It can be observed that the 4 categories are mentioned to be built on almost all baseline technologies, the only exception is agent technology, which is only used for diagnosis and prognosis tools. Wireless technology are highly cited in diagnosis tools with respect to the other categories, while AI is mainly mentioned in diagnosis and prognosis tools. AR tools have a quite uniform citation in all technologies, except in agent technology as mentioned above.
Finally, an analysis of the distribution of baselines technologies has been done only for the three most cited tools in literature, due to lack of critical mass for such an analysis in the other categories. Thus, Figure 6.6 shows the distribution of technologies composing inspection, diagnosis and prognosis tools. The percentages refers to the number of articles mentioning that a concrete technology is used to build up a tool included within the category, with respect to all articles considering a tool pertaining to that category.
112

Figure 6.6. Distribution of baseline technologies for inspection, diagnosis and prognosis tools
It can be observed that inspection and diagnosis tools have similar distribution in technologies such as computing methods, wireless, web and model-based technologies and AI; however, authors in literature highlight more sensor and materials technologies for inspection tools rather than diagnosis tools. Diagnosis and prognosis tools have similar distributions regarding web and agent technology; the rest of technologies are more often cited in relation to prognosis (except for wireless and materials technologies). The greater differences are related to computing methods, AI, model-based and sensor technologies.
6.3. VALUE ANALYSIS METHOD: APPLICATION TO INNOVATIVE TOOLS &
APPLICATIONS This section presents a proposal of a method for the value analysis of technology-based tools and the application of this method to all categories within the intermediate technological level, i.e. the ten typologies of innovative tools and application defined previously according to literature findings.
6.3.1. THE VALUE ANALYSIS METHOD The method proposed for value analysis consist in three general steps that have been particularized for the evaluation of the categories regarding the innovative tools and applications defined above. The three steps are the following:
1) Definition of value dimensions, 2) Definition of a rating scale, 3) Visualization of results.
This general steps could be applied to different types of analysis. In this work, they have been particularized for the evaluation of the potential contribution of the categories defined above to a set of value dimensions in the provision of maintenance services, based on dimensions proposed in literature. The particularization of the steps done is explained next.
1) Definition of value dimensions Several dimensions could be taken into consideration for analyzing the value created through the use of innovative tools and applications in service provision. In this work, the value dimensions are considered similar for customers and provider, although they would have different perspectives as suggested by the work of Ali-Marttila et al. (2013). The value dimensions selected to be analyzed for
113

each tool category have been adapted from Ali-Marttila et al. (2013) and Sinkkonen et al. (2013) and are defined as follows:
1) Service Reliability >This dimension concerns whether the service is performed how and when it was agreed.
2) Operator knowledge > This dimension is related to the know-how of the service operator for performing the work and solving emerging problems.
3) Safety at work > This dimension concerns whether the service provision is done according to safety policies and increases the operational safety of system/equipment.
4) Environmental safety > This dimension is related to the mitigation or elimination of environmental safety hazards during the provision of the service.
5) Service price > This dimension refers to the price of the service with respect to the received/provided service.
6) Technical quality > This dimension concerns the outcome of the service and whether is obtained as expected and during the agreed time
2) Definition of the rating scale The method for value analysis is based on the evaluation of the different value dimensions according to a given scale of ordered predefined scores, which provide the rating of each analyzed category or tool compared with the given rating scale.
Qualitative data (non-metric data) is suitable to be measured with nominal or ordinal scales (Hair et al., 1992). The different rating scales suitable for qualitative research represent mainly two types: nominal scales that can be used to assign items to certain characteristics such as names or categories, no statistical operations are allowed for this scale type, except for the assessment of frequencies; and ordinal scales that include an order but in general do not allow for interpretation of the distance between different levels (Fahrmeir et al. 2004). A concrete example of ordinal scales are Likert scales (also mentioned as interval scales by Maxim (1999) and Forza (2002)), which include two extreme poles on each side of the scale and several intermediate levels in order of intensity or magnitude among which the rater can choose the most suitable one to describe his assessment object. As Moultrie et al. (2007) point out, Likert scales provide a higher degree of information granularity and, when symmetric and have approximately similar distance between each level, their character tends to become of interval scale which allows for more statistical operations and more sophisticated interpretation.
Thus, the rating scale chosen for this value analysis method is based on a 7-point Likert-type scale. The scale used for evaluating the contribution of each category to the value dimensions presented in previous step is shown in Table 6.2. The use of this scale allows identifying whether the contribution of the tool category to a value dimension is considered to have a positive effect, a negative effect or neither of them.
Table 6.2. Likert-type scale used in the value analysis method
Degree 1 2 3 4 5 6 7 Description Very
negative Fairly negative
Somewhat negative
Indifferent / No knowledge
Somewhat positive
Fairly positive
Very positive
114

3) Visualization of results The suggested visual representation method for the results of value analysis method is a radar chart, due to its capability to represent several dimensions at the same time. A radar chart has been previously suggested by Ali-Marttila et al. (2013) as a proper means to visualize the value gap between customer and provider valued elements. A radar chart representation is then adopted here to display the value of a tool category as it makes simpler to identify whether the category matches the value dimensions and in which degree. Moreover, this type of representation gives flexibility for other potential uses: for example, it could possible to use this representation to analyze whether the value provided for each tool category covers the value dimensions targeted by a customer and/or provider, which themselves could also map their desired values in their own radar charts using the same value dimensions to this end.
Once the different steps have been defined for the application of the value analysis method to the different technologies that can be involved in maintenance services provision, a survey has been carried out in order to collect data for the value analysis. Different approaches could have been used for data collection, but the survey approach was chosen as the most suitable one due to the possibilities to put together inputs from a wide range of experts. Concretely, the target respondents were experts in the fields of maintenance technologies and maintenance service provision from both academy and industry. More details regarding the survey developed regarding also the data collection and analysis processes can be found in section 2.3.4.
6.3.2. RESULTS Overall scores for each tool category have been calculated as well as the detached scores for each value dimension. The overall score has been then calculated for all value dimensions and also without considering the score given to service price, due to some potential differences in the interpretation given to the service price dimension. Figure 6.7 shows the tool categories ordered according to their obtained overall score, calculated in both ways. Although the scores slightly change in both calculating ways, the general order from higher to lower contribution to value dimensions is kept for all the tool categories. Considering the overall score calculated including all categories, it can be observed that some categories below the score 5 or slightly above it, which means that it is not clear that they have a general positive contribution to the value dimensions under concern. These tools are e-CMMS, location & tracking tools, simulation tools and cloud-based tools.
The total score obtained for each tool category in each value dimension has been calculated as an average of the scores received. Table 6.3 indicates the average scores and the standard deviations for all tool categories in each value dimensions. It can be noted that the standard deviations are commonly around 1, with the service price being the value dimension having highest standard deviations and the environmental safety being the one having lowest standard deviations. These results of the service price dimension may show either strong disagreement among experts or differences in the interpretation of the value dimension (as it was revealed in the preliminary analysis done with the pilot test, explained in section 2.3.4)
115

Figure 6.7. Overall scores obtained by each tool categories
Table 6.3. Total score obtained in each value dimension by each tool category
Tool categories Service Reliability
Operator Knowledge
Safety at Work
Environmental Safety
Technical Quality
Service Price
Smart devices
average 5,50 5,50 5,29 4,91 5,44 4,86 σ 1,04 1,09 1,10 0,85 1,14 1,20
Smart sensors
average 5,83 5,06 5,31 5,31 5,58 4,97 σ 1,13 0,98 1,21 1,19 0,92 1,21
e-CMMS average 5,49 5,39 4,64 4,47 5,51 4,80 σ 1,05 1,06 0,89 0,69 0,91 1,12
Inspection tools
average 5,73 5,39 5,03 5,06 5,73 5,06 σ 1,05 1,07 1,06 1,01 0,99 1,07
Diagnosis tools
average 6,00 5,71 5,17 5,31 5,91 5,26 σ 0,97 1,14 1,06 0,98 0,91 1,13
Prognosis tools
average 6,06 5,55 5,24 5,36 5,88 5,21 σ 1,04 1,10 1,16 0,98 1,09 1,25
Cloud-based tools
average 4,73 5,00 4,33 4,36 4,88 4,88 σ 1,14 1,11 0,59 0,59 0,95 1,15
Simulation tools
average 5,10 5,03 4,42 4,61 5,10 4,74 σ 1,17 1,02 0,83 0,83 1,00 1,16
Location & tracking tools
average 5,26 5,13 5,06 4,90 5,03 4,74 σ
0,84 1,04 1,11 0,96 0,86 1,11 AR tools average 4,73 5,73 5,70 4,80 5,30 4,40
σ 1,15 1,26 1,10 0,79 1,07 1,50
116
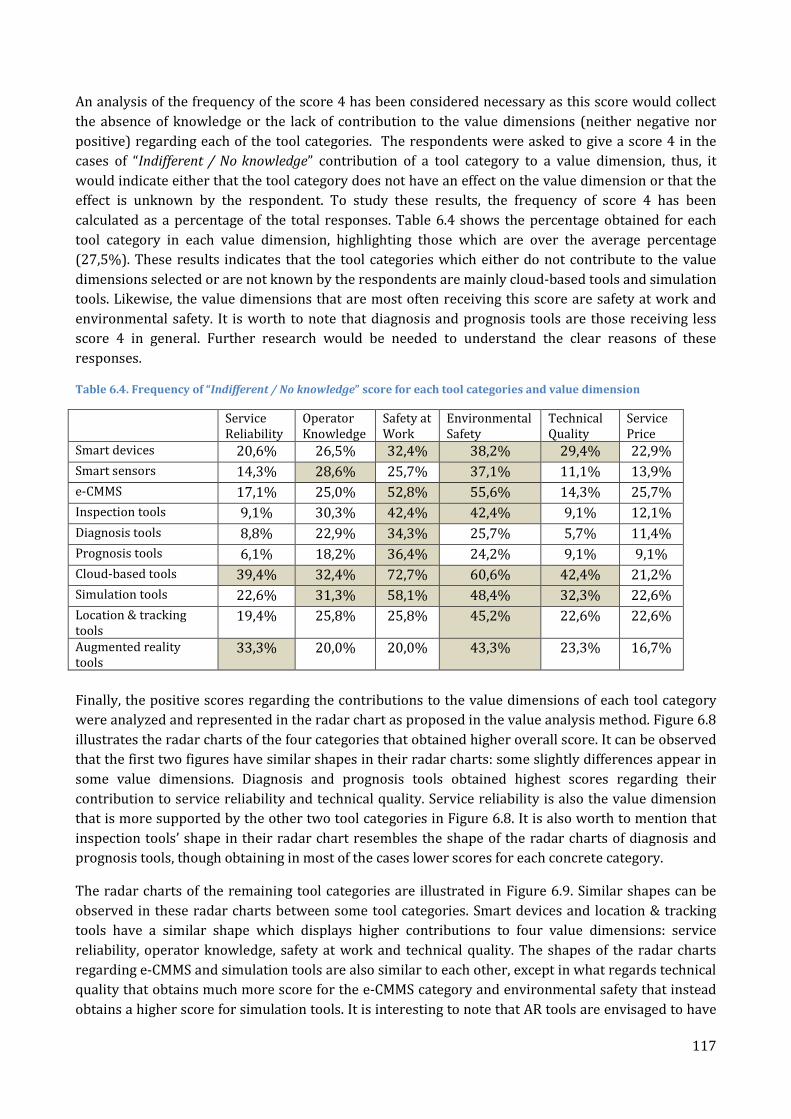
An analysis of the frequency of the score 4 has been considered necessary as this score would collect the absence of knowledge or the lack of contribution to the value dimensions (neither negative nor positive) regarding each of the tool categories. The respondents were asked to give a score 4 in the cases of “Indifferent / No knowledge” contribution of a tool category to a value dimension, thus, it would indicate either that the tool category does not have an effect on the value dimension or that the effect is unknown by the respondent. To study these results, the frequency of score 4 has been calculated as a percentage of the total responses. Table 6.4 shows the percentage obtained for each tool category in each value dimension, highlighting those which are over the average percentage (27,5%). These results indicates that the tool categories which either do not contribute to the value dimensions selected or are not known by the respondents are mainly cloud-based tools and simulation tools. Likewise, the value dimensions that are most often receiving this score are safety at work and environmental safety. It is worth to note that diagnosis and prognosis tools are those receiving less score 4 in general. Further research would be needed to understand the clear reasons of these responses.
Table 6.4. Frequency of “Indifferent / No knowledge” score for each tool categories and value dimension
Service Reliability
Operator Knowledge
Safety at Work
Environmental Safety
Technical Quality
Service Price
Smart devices 20,6% 26,5% 32,4% 38,2% 29,4% 22,9% Smart sensors 14,3% 28,6% 25,7% 37,1% 11,1% 13,9% e-CMMS 17,1% 25,0% 52,8% 55,6% 14,3% 25,7% Inspection tools 9,1% 30,3% 42,4% 42,4% 9,1% 12,1% Diagnosis tools 8,8% 22,9% 34,3% 25,7% 5,7% 11,4% Prognosis tools 6,1% 18,2% 36,4% 24,2% 9,1% 9,1% Cloud-based tools 39,4% 32,4% 72,7% 60,6% 42,4% 21,2% Simulation tools 22,6% 31,3% 58,1% 48,4% 32,3% 22,6% Location & tracking tools
19,4% 25,8% 25,8% 45,2% 22,6% 22,6%
Augmented reality tools
33,3% 20,0% 20,0% 43,3% 23,3% 16,7%
Finally, the positive scores regarding the contributions to the value dimensions of each tool category were analyzed and represented in the radar chart as proposed in the value analysis method. Figure 6.8 illustrates the radar charts of the four categories that obtained higher overall score. It can be observed that the first two figures have similar shapes in their radar charts: some slightly differences appear in some value dimensions. Diagnosis and prognosis tools obtained highest scores regarding their contribution to service reliability and technical quality. Service reliability is also the value dimension that is more supported by the other two tool categories in Figure 6.8. It is also worth to mention that inspection tools’ shape in their radar chart resembles the shape of the radar charts of diagnosis and prognosis tools, though obtaining in most of the cases lower scores for each concrete category.
The radar charts of the remaining tool categories are illustrated in Figure 6.9. Similar shapes can be observed in these radar charts between some tool categories. Smart devices and location & tracking tools have a similar shape which displays higher contributions to four value dimensions: service reliability, operator knowledge, safety at work and technical quality. The shapes of the radar charts regarding e-CMMS and simulation tools are also similar to each other, except in what regards technical quality that obtains much more score for the e-CMMS category and environmental safety that instead obtains a higher score for simulation tools. It is interesting to note that AR tools are envisaged to have
117

higher contributions in three value dimensions, which are operator knowledge, technical quality and safety at work, however, in one of them that is safety at work they obtained the highest contribution among all ten tool categories. It seems to be a high connection between the use of AR tools and safety at work. Operator knowledge is the value dimension in which cloud-based tools seems to contribute most: it is actually the only dimension reaching score 5 for this tool category.
Figure 6.8. Radar charts of the four tool categories obtaining higher overall score
118

Figure 6.9. Radar charts of the six tool categories obtaining lower overall score
119

6.4. DISCUSSION & POTENTIAL USES OF THE VALUE ANALYSIS METHOD Ojanen et al. (2011) suggested that there is a need for new methods to promote value elements identification and value assessment in industrial maintenance services. This chapter presents a work that builds on previous studies regarding the identification of value elements and that contributes to the research regarding the value assessment of maintenance service from a technological perspective.
The proposal of the value analysis method presented here has the potential to be used in three different ways. The first use regards the evaluation of broad categories of tools, as those defined in sections 6.1.2, and it is the use presented in previous section 6.3. The second use concerns the comparison between two or more tool categories, e.g. this could be interesting when the analyst is looking at identifying a concrete tool category that contributes to a particular value dimension of maintenance services. Figure 6.10 shows an example of this second potential use built on the data collected for three tool categories at a preliminary stage (inspection, prognosis and AR tools). This comparison could support the choices on technologies that could be added to a maintenance service to enhance concrete value dimensions.
Figure 6.10. Example of the comparative use of the value analysis method considering several tool categories
Moreover, a complete technological solution for the provision of a service, encompassing several tools from different categories could be also assessed against customer and /or provider desired scores for the value dimensions. This third use of the value analysis method would display in the same radar chart the desired scores for a set of value dimensions of the service provider and / or the customer together with the results of the evaluation of a complete solution, which could be compound by one or a combination of innovative tools and applications. Figure 6.11. presents an example, based on exemplary data, of this possible third use of the value analysis method. The example represents a hypothetical case of the involvement in the value assessment of a customer and the provider of the maintenance service. The value analysis method should be modified for collecting the necessary data to assess the customer and the provider desired scores regarding each value dimension, which want to be evaluated using this method. This would require some further research.
120

Figure 6.11. Example of the use of the value analysis method for the assessment of a complete solution
Additionally to the analysis of the survey responses done for illustrating the results within the value analysis method presented in 6.3.2, a secondary analysis has been done using the data collected through the survey in order to understand whether there are differences in the opinion that experts from maintenance technologies and experts from service provision (research themes involved in the survey) as stated in their responses to the survey. The responses of those respondents stating to be very confidence in maintenance technologies and in maintenance service provision were studied independently and contrasted between them and with the total results obtained considering all responses. The first interesting result of this study is the difference in the overall score regarding one tool category – inspection tools – that considering only experts which are very confident in any of the research themes comes to the first place on both cases (average of 6,40 for maintenance technologies experts and average of 6,64 for service provision experts) while the rest of categories keep their place in the ranking as in the analysis done for total responses.
Another interesting result concerns the analysis of frequency of score 4 which revealed also differences with respect to the analysis of total responses. As mentioned before a high frequency of the assignment of score 4 for the contribution of a tool category to a value dimension may indicate that the tool categories does not contribute to that dimension or that the respondent does not have the knowledge or clear understanding to answer that concrete inquiry. The analysis of score 4 in those cases that the respondent states to be very confident on maintenance technologies indicates a high frequency related to cloud-based tools and simulation tools, while the analysis in the cases that the respondent states to be very confident on service provision points out a high frequency regarding smart devices. In the latter case, it is interesting to note a high frequency of score 4 regarding a concrete dimension, safety at work, in 7 out of 10 tool categories (Smart devices, Inspection tools, Diagnosis tools, Prognosis tools, Cloud-based tools, Simulation tools and AR tools). Further research could be suggested regarding these results in order to clarify whether the tools are unknown or do not contribute to the value dimensions in service provision.
121

7. PROPOSAL OF A VALUE-DRIVEN DESIGN METHODOLOGY
FOR PERFORMANCE-BASED MAINTENANCE SERVICES This chapter explains the rationale for the proposal of this value-driven design methodology, including an overview of previous works considering a value perspective in maintenance. The proposed methodology is then presented and its steps are described in details as well as the different activities and tools to be employed in each one. A comparison with similar methodologies / tools identified in literature is also exposed at the end of this chapter. This methodology has been tested in an industrial context through a case study that is described and analyzed in next chapter 8.
7.1. RATIONALE This section introduces the reasoning behind the proposal of the value-driven design methodology for performance-based maintenance services. The concept of value has been used before as a driver for some maintenance related techniques, though the focus missed the sustainability perspective and multi-stakeholder inclusion. Next sections introduce a review of previous works in the fields of maintenance taking a value perspective and state the purpose for the development of the proposed value-driven design methodology for performance-based maintenance services.
7.1.1. VALUE-DRIVEN APPROACH The concrete application of the value concept to engineering domains has led to related concepts, such as value-driven decision making, for example the one proposed by Lazarus (1997) for air combat simulation and value engineering. Value engineering is defined as “a proven management technique used to identify alternative approaches for satisfying the requirements of a project while lowering costs and ensuring technical competence in performance” (Acharya et al., 1995). It is seen as a function-oriented systematic method for analyzing and improving the value of product, design, system, service or process in order to increase customer satisfaction and investment value (Ojala, 2004). Furthermore, value engineering is also considered a synonym for value management and value analysis concepts (Ojala, 2004).
The literature shows evidence regarding the application of the value concept to maintenance. Since the value analysis of maintenance operations carried out by Weiss (1979), few other authors have studied the value of maintenance activities. Most have focused on economic value. In this regard, Marais and Saleh (2009) asserted that maintenance has intrinsic value, although it has been frequently dismissed or neglected because its benefits are difficult to quantify. Liyanage and Kumar (2003) extended the meaning of value regarding maintenance, emphasizing not only its economic benefits but also its social and environmental value in the cases of social equity and environmental concerns, respectively. Moreover, business theory has been used to enhance maintenance methodologies through value orientation. It is worth citing, for example, methodologies such as business-centered maintenance (Kelly, 1997) and value-driven maintenance (Rosqvist et al., 2009).
In their value-driven maintenance planning approach, Rosqvist et al. (2009) introduce the value tree as a reflection of the main objectives of company and plant managers into maintenance objectives. The value of an e-maintenance platform is the central element of the methodology proposed by Macchi et al. (2014) for a value driven engineering of the services that the implementation of an e-maintenance platform could bring to maintenance operations and business objectives.
122

The application of a value-centric reasoning to maintenance services has also led to identification of their value elements / dimensions (Sinkkonen et al., 2013; Toosi et al., 2013). These studies are needed as, according to Ojanen et al. (2012), the value offered by maintenance services may be different from other industrial services.
7.1.2. PURPOSE OF THE VALUE-DRIVEN METHODOLOGY The value-driven design methodology aims at supporting OEMs or MSPs in the introduction of sustainable value into the design of performance-based maintenance services, considering the value added from a customer-oriented perspective. The understanding of customer perceived value has been highlighted as an area needing further research in literature (Ostrom et al., 2010) and besides, the configuration of product-services is also a research theme that is being currently addressed by several research disciplines (Lightfoot et al., 2013). Thus, from an academic viewpoint it seems interesting to investigate how a methodology for product-service design could support the integration of value thinking on maintenance-related service.
Considering the practice perspective, it is also fundamental to study the customer perspective and integrate it into tools for industry, concretely for OEMs and MSPs, that can support them to achieve better (and more sustainable) customer value in their service proposals. This need has been revealed by the analysis of current practice presented in section 3.4 that points out to performance-based maintenance services as a type of service that is not widely extended (only 7% of the services within the sample) though their benefits has been broadly highlighted in literature. The main benefits of these services are related to the reduction of ownership cost, the increase of equipment reliability and better environmental performances (Roy, 2000; Tukker, 2004; Jin et al., 2011).
The analysis of current practice also came out with a distribution of the requirements that manufacturing companies are seeking mostly for each type of services (explained extensively in section 3.4.3). The results regarding the requirements most pursued in performance-based maintenance services show that quality of the service is the main requirement (31%), followed by the technological knowledge (22%) and the structured contract (17%).
Quality of the service, considering industrial services, is related to the results that the customer obtains in terms of how well the service interventions are performed (Finke et al., 2012) under three perspectives (Legnani, 2011): service reliability, responsiveness and agility.
The emphasis on technological knowledge could be cause for the implementation of advanced manufacturing technologies in customer’s production plants, thus requiring more competences and skills to be maintain (Swanson, 1999). This could be also related to the provider decision of use cross-trained or dedicated technicians for the service provision.
A structured contract seems to be important for the customers of industrial services. However, there are some challenges associated to contracting performance-based services. According to Guo and Ng (2011), even the most comprehensive contract could not cover all potential risks and uncertainties and difficulties in specifying boundaries and roles could cause some misunderstanding between the parties involved in the service provision. Moreover, the level of information detail has been identified as an important attribute for the evaluation of performance-based services in the study carried out by Stremersch et al. (2001).
The methodology proposed here works to fulfil this gap by focusing on the most required elements of performance-based services according to previous results of the analysis of current practice in Italy. In this sense, this methodology could contribute as: (i) it is based on a sound technique (FMEA) that is
123

widely employed in maintenance management in industry as a source of knowledge regarding equipment functions and potential failures; (ii) considers high involvement of customer, i.e. the industrial user, in the development process which improves the technical quality and the time-to-market of the new service offerings (Carbonell et al.,2009); (iii) it is envisaged to be used during the first stages of the contract development as it supports the decision of the activities to introduced in the contract and the performance measures to include, thus, it gives higher information to the industrial user regarding the service to be acquired.
7.2. STEP-WISE DESCRIPTION OF THE VALUE-DRIVEN METHODOLOGY This section presents first an overview of the steps of the methodology, followed by a detailed description of each step and the tools suggested to be used in each of them.
7.2.1.OVERVIEW OF THE VALUE-DRIVEN DESIGN METHODOLOGY The value-driven design methodology consists of three steps that are designed to be done sequentially, though iterations are possible between and within steps as needed during the application process. Steps of the methodology are shown in Figure 7.1.
Figure 7.1. Value-driven design methodology: steps
The first step concerns an in-depth study of the strategic and operational context of the industrial user, which is the customer of the service, thus facilitating the adaptation of the service offering to customer’s specific reality. This step addresses then the understanding of customer context, in order to provide a more adapted solution offering to its needs.
The second step aims at understanding which are the main values that the customer pursues in relation to the concrete entity that is the focus of the service. The object of the service can be a specific equipment, a group of equipment or a production line. This step concerns the so called operational values, in order to clarify that there are values that apply at company’s operational level.
The results of the value analysis would support the service alternatives definition and evaluation, as well as the selection of the performance indicators to be measured during the service provision, which are activities pertaining to the third and last step of the methodology.
It is worth remarking that the value-driven design methodology is supported by an excel file covering all steps and activities / sub-steps.
7.2.2. STEP I: EQUIPMENT & PROCESS ANALYSIS This step has two main objectives. The first one it to understand the customer’s strategic and operational context and the second one is the identification and description of the target entity. As stated above, the target entity for the service offering can be an equipment, a group of equipment or a production line. Thus, Step I is divided into two activities or sub-steps that are explained next.
124

I.1. Strategic & operational context analysis This first action concerns the comprehensive study of the industrial user specific context. Some guiding questions are proposed in order to realize this first action, whose results would be the description of the business and strategic context, as well as the description of the production process. Table 7.1 presents the proposed set of guiding questions that can be used as a checklist regarding the information to be obtained during the first meetings with the industrial user.
Table 7.1. Guiding questions for strategic and operational context overview
Description of business & strategic context of the industrial user
Which is the industrial user’ s sector? Which is the company/plant size? Which is its main target market? What are its main products? How is their demand (constant, variable, seasonal,..)? Which are the main strategic priorities and goals?
Description of production process in the plant under concern
How is the functional chart of plant departments/functions? Which is the concrete position of maintenance function in the functional chart? Which type of production process is there in the plant? Which is the plant layout and the main processes in each plant area? Which are the environmental and safety standards implemented in the plant?
This set of questions would provide an overview of customer’s context that would help to understand better the concrete needs of the target entity selected as the object of the service.
I.2. Identification & description of the target entity The target entity for the provision of a performance-based maintenance service could be a specific equipment, a set of equipment with similar technical characteristics or pertaining to the same production area, or a whole production line. In some cases the target entity may be preselected by the industrial user while in other cases the range of equipment to be cover under the service would not be clear from the beginning. The realization of this step at the same time as the previous one would provide enough information to take decisions related to the items to be included in the service solution.
This second activity, which can be performed as the same time as the first one, regards the selection of the target entity and a brief description considering the equipment involved (in case of equipment groups or production lines), the main components, the production process and the location within the plant of the target entity. It would be also necessary to identify the main stakeholders directly related to the target entity.
As in previous sub-step a set of guiding questions are proposed to support the realization of this sub-step. These questions are presented in next Table 7.2. The data collected in this sub-step may be enough to make a short description of the target entity and its main components as well as their required functions and main critical issues. In the specific case of OEMs providing the service at the same time as the equipment, the questions regarding the age of the equipment are not necessary and the understanding of the operational context would focus on the requirements for this new equipment as an integrated part in the production process of the industrial user.
125

Table 7.2. Guiding questions for target entity context understanding
Description of target entity and its related operational context
How old is the main equipment involved? When was the last revamping activity? What are the main functions required to the target entity and related equipment? Which is the expected working time for the target entity?
Description of target entity operations and specific needs in terms of environment and human safety
Which are the possibilities regarding the outsourcing of the requested functions in case of unavailability of the target entity? Would it imply an extra high cost? Which are the main stakeholders of the target entity operations? Is there any hazardous material related to the target entity? If yes, which are the safety measures to be adopted? Are working conditions particularly critical in relation to the target entity? Have it ever happened any situation leading to injuries related to the target entity? How often did it happen, in case, in the recent years? Was any exceptional safety measure adopted afterwards? Does the target entity operations have any risk of environmental damage? Is there any preventive measures put in place? Have any energy consumption peaks being observed in the target entity or an increase of material consumption? Is the target entity part of an energy intensive production process?
7.2.3. STEP II: VALUE ANALYSIS The value analysis is to be performed in three sub-steps and it would strongly involve the industrial user in all of them. This is the main step within the methodology as it would set the customer requirements in terms of operational values related to the target entity and it would provide the basis for the prioritization and selection of the activities to be included in a service solution. The three sub-steps are described next.
II.1. Selection of a set of operational values to be applied to the target entity This sub-step would involve several stakeholders of the target entity in order to better define the most adequate operational values to be applied. A simple tool is proposed here to facilitate the identification of those values: the Sustainable Value Tree. This tool does not have the scope to be comprehensive though, i.e. values different from the ones suggested in the Sustainable Value Tree may be preferred in some cases depending on the concrete plant context.
The Sustainable Value Tree (Figure 7.2) is suggested as an evolved proposal that takes as a basis the main ideas behind the value tree suggested by Macchi et al. (2012) but it has been modified according to the results of the study made by Ali-Marttila et al. (2013), in order to give an stronger focus on values related to service provision, and the findings of the case studies presented in Chapter 4 to provide the new perspective of the values that maintenance function can contribute to under the perspective of sustainability in manufacturing. Equipment maintainability has been also included together with equipment reliability and availability to complete the inclusion of the operational dependability factors suggested by Crespo Márquez (2007).
The operational values proposed in the Sustainable Value Tree are divided into two main groups, according to the findings of chapter 4: values related to the equipment and values related to the process. Each branch of values is then divided into the three sustainability dimensions, thus, the operational values that could be selected are identified to a specific level of application and to a sustainability dimension, according to the framework proposed in section 4.3. The life cycle dimension considered here is just the MOL, as the performance-based service is entitled to be offered for this specific life cycle stage. Within the production process values, it can be found a reference to output quality, in the economic dimension, and to output safety, in the social dimension. The word output has
126

been preferred here to be used in order to refer to the outcome of the production process, which is some case would be a final product, but in other cases would be an intermediate component to be latter assembled into the final product. The word output leaves the meaning open to this general consideration.
Figure 7.2. Sustainable Value Tree for operational values in maintenance services
II.2. Rating of selected set of operational values (Rating AHP) After the selection of the operational values that can be applied to the target entity, it is necessary to make some prioritization of those values in order to understand. In this sense, a multi criteria analysis technique is necessary in order to deal with complex prioritization processes concerning several attributes, in our case several operational values, and several stakeholders. The preferred technique is the Analytical Hierarchy Process (AHP) which is used in its rating mode, as done before by Macchi et al. (2014) in their case study regarding the deployment of an E-maintenance platform based on multiple criteria.
A typical AHP analysis starts from a hierarchical structure of the decision problem: the structure is built from a top level representing the goal of the analysis; the intermediate levels then define the relevant criteria and sub-criteria adopted for the analysis; the bottom level introduces the possible alternatives under study according to the criteria and the sub-criteria. Once the hierarchy is built, a series of pairwise judgments from experts allows the assignment of the relative importance between criteria, sub-criteria and alternatives: this enables to reduce complex decisions to simple rankings of such criteria, sub-criteria and alternatives, which would help the expert identifying the best decision accordingly to his/her own interests, while perceiving a clear rationale for the decisions taken. On the contrary, the AHP called ratings mode instead of choosing the best option among several alternatives,
127

give different weights to more than two criteria when looking for a prioritization among them by adding a level above the alternatives consisting of ratings which are refinements of the criteria or subcriteria governing the alternatives (for example, high, medium, low) (Saaty et al, 1991; Partovi and Burton, 1993).
From this perspective, the AHP model would be built considering as the goal of the analysis the calculation of a score for each degree of the operational values that apply to the target entity. The criteria at intermediate level would be the operational values identified for each target entity, while the bottom level of sub-criteria is related to the rating degrees, defined as low, medium and high. Figure 7.3 illustrates the generic case of a selected set of n operational values for the target entity.
Figure 7.3. Overview of the rating AHP structure
Table 7.3. Priority scores to be used for the pairwise comparisons in the AHP
Priority score
Interpretation
1 Value i and j are of equal importance 3 Value i has a slightly higher importance than j 5 Value i has a strongly higher importance than j 7 Value i has a very strongly higher importance
than j 9 Value i has an absolutely higher importance than
j 2,4,6,8 These are intermediate scales Reciprocals If Value i has a lower importance that j (e.g. 1/x)
The rating AHP permits to calculate an integrated value score (Vs) for each rating degree of each operational value, Vsij, as a result of the bottom level and intermediate level pairwise judgments. The priority scores to be used for the pairwise comparisons are indicated in Table 7.3. Considering n operational values selected for the target entity, therefore:
Vsi = AHP score assigned to the i-th operational value
Vsij = Vsi * AHP score assigned to the j-th rating degree
Where: i = 1,.., n
J = 1, 2, 3, corresponding to the rating degrees low, medium, high, respectively.
128

The above considers only one decision maker, however, in the multi-stakeholder case, one more index would be added to the calculation. Considering the case of a number N of stakeholders to be involved in this step, the final value scores would be calculated as the average of the value scores obtained for each stakeholder. Therefore:
Vsik = AHP score assigned to the i-th operational value for the k-th stakeholder
Vsijk = Vsik * AHP score assigned to the j-th rating degree for the k-th stakeholder
The value score for each rating degree in each operational value in the case of S stakeholders would be calculated as:
𝑉𝑉𝑉𝑉𝑖𝑖𝑖𝑖 = �∑ 𝑉𝑉𝑉𝑉𝑖𝑖𝑖𝑖𝑖𝑖𝑆𝑆𝑖𝑖 �𝑆𝑆
[Equation 7.1]
Where: i = 1,.., n
k = 1,…, N
j = 1, 2, 3, corresponding to the rating degrees low, medium, high, respectively.
Supporting tools for this sub-step are a software facilitating the data collection, e.g. SuperDecisions or ExpertChoice could be used, and a supporting excel file. which has been prepared for this step to facilitate the calculation of the integrated score considering the case of involving three stakeholders in this process.
II.3. Value-driven FMEA This sub-step aims at identifying which mechanisms of equipment failure would be higher impacted in terms of the selected operational values, i.e. which would benefit more from the provision of a potential set of activities avoiding those failures. In this sense, a variation of the FMEA technique is proposed to be used in this sub-step. Apart from the mentioned traditional uses of FMEA for product design or planning maintenance activities, other applications can be found in literature that gives an idea of the versatility of this technique.
The value-driven FMEA proposed here is based on the use of this technique as part of an RCM methodology as explained by Crespo Márquez (2007). The FMEA technique has four steps (McDermott et al., 1996):
• Description of functions • Description of functional failures • Definition of failure modes • Description of failure modes effects
The value-driven FMEA resembles the previous use within RCM with regard to the first three steps. The novelty of the proposed variation falls into the fourth and last step, i.e. the description of the failure modes effects. In the value-driven FMEA, the description of the effects of each failure mode is done by rating the consequences of the failure mode occurrence respect the set of operational values identified for the target entity. The rating of the effects is identified in three levels – low, medium, high – with correspond to the rating degrees for each value in the previous Rating AHP. This allows to calculate a value score for each failure mode, Vfx, considering the effects of each failure mode occurrence on the desired operational values. The value-driven FMEA is suggested to be done by using a table similar to next Table 7.4.
129
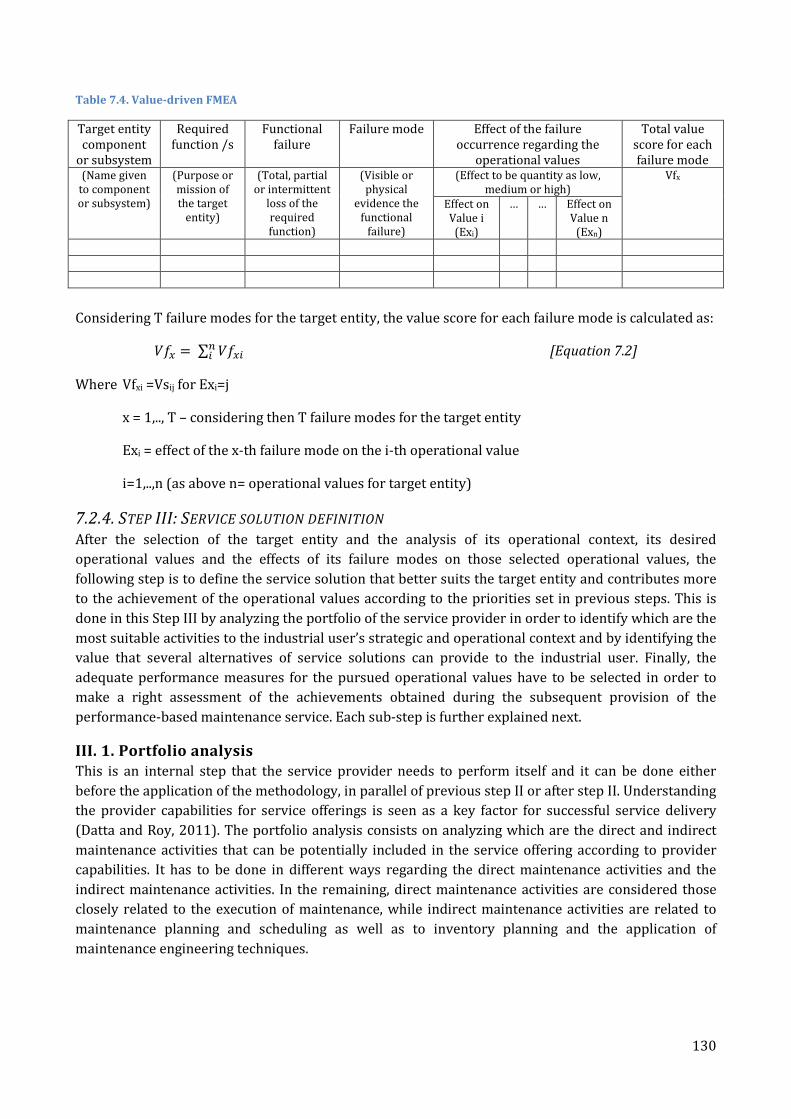
Table 7.4. Value-driven FMEA
Target entity component
or subsystem
Required function /s
Functional failure
Failure mode Effect of the failure occurrence regarding the
operational values
Total value score for each failure mode
(Name given to component or subsystem)
(Purpose or mission of the target
entity)
(Total, partial or intermittent
loss of the required function)
(Visible or physical
evidence the functional
failure)
(Effect to be quantity as low, medium or high)
Vfx
Effect on Value i
(Exi)
… … Effect on Value n
(Exn)
Considering T failure modes for the target entity, the value score for each failure mode is calculated as:
𝑉𝑉𝑉𝑉𝑥𝑥 = ∑ 𝑉𝑉𝑉𝑉𝑥𝑥𝑖𝑖𝑛𝑛𝑖𝑖 [Equation 7.2]
Where Vfxi =Vsij for Exi=j
x = 1,.., T – considering then T failure modes for the target entity
Exi = effect of the x-th failure mode on the i-th operational value
i=1,..,n (as above n= operational values for target entity)
7.2.4. STEP III: SERVICE SOLUTION DEFINITION After the selection of the target entity and the analysis of its operational context, its desired operational values and the effects of its failure modes on those selected operational values, the following step is to define the service solution that better suits the target entity and contributes more to the achievement of the operational values according to the priorities set in previous steps. This is done in this Step III by analyzing the portfolio of the service provider in order to identify which are the most suitable activities to the industrial user’s strategic and operational context and by identifying the value that several alternatives of service solutions can provide to the industrial user. Finally, the adequate performance measures for the pursued operational values have to be selected in order to make a right assessment of the achievements obtained during the subsequent provision of the performance-based maintenance service. Each sub-step is further explained next.
III. 1. Portfolio analysis This is an internal step that the service provider needs to perform itself and it can be done either before the application of the methodology, in parallel of previous step II or after step II. Understanding the provider capabilities for service offerings is seen as a key factor for successful service delivery (Datta and Roy, 2011). The portfolio analysis consists on analyzing which are the direct and indirect maintenance activities that can be potentially included in the service offering according to provider capabilities. It has to be done in different ways regarding the direct maintenance activities and the indirect maintenance activities. In the remaining, direct maintenance activities are considered those closely related to the execution of maintenance, while indirect maintenance activities are related to maintenance planning and scheduling as well as to inventory planning and the application of maintenance engineering techniques.
130

Some examples of direct maintenance activities are those identified by Crespo Márquez (2007) as most common maintenance activities:
- Inspection, which is the check for conformity by measuring, observing, testing or gauging the relevant characteristics of an item;
- Monitoring, which is an activity performed either manually or automatically intended to observe the actual state of the equipment. Monitoring may be continuous, over an interval of time, or after a given number of operations;
- Routine maintenance, which are regular or repeated elementary maintenance activities which usually do not require special qualification, authorization(s) or tools;
- Overhaul, which is a comprehensive set of examinations and actions carried out in order to maintain the required level of availability and safety of the equipment and it may require a partial or complete dismantling of the item.
Examples of indirect maintenance activities are those related to the techniques and tools for maintenance management suggested by Wireman (1998): Total productive maintenance (TPM), Computerized maintenance management systems (CMMS), Reliability centered maintenance (RCM), Technical and interpersonal training, statistical financial optimization and work-flow diagrams.
Portfolio analysis regarding direct maintenance activities This analysis consists on the identification of the direct maintenance activities that the service provider could provide and the description of potential failures modes (or types of failure modes) that those direct maintenance activities could prevent when applied. This analysis then requires a brief description of failure modes or types of failure modes that could be avoided (or limited) when each type of direct maintenance activity is performed. Understanding the possibilities of application for the concrete context of the customer would simplify this part of the analysis, thus it is recommended to be done after Step I at least.
Portfolio analysis regarding indirect maintenance activities The analysis regarding indirect maintenance activities has two main activities to be performed:
– The first one regards the identification of the indirect maintenance activities that the service provider could performed as part of the service solution and their potential applicability regarding different degrees of the operational values that they can be assigned to. As an example, a RAM analysis (as indirect activity) could be applied in cases that required high operational reliability (equipment reliability being the operational value).
– The second one concerns the intrinsic connections between direct and indirect activities that could be present in some cases. For example, an indirect activity (RAM analysis) may require the knowledge obtained during the provision of a direct activity (corrective maintenance) to be performed with the maximum available information, or a direct activity (preventive maintenance) could be planned by applying an specific indirect maintenance activity (RCM implementation). This connections could be analyzed by indicating in a table (see as an example Table 7.5) whether the direct maintenance activities could be inputs (I) or outputs (O) of each indirect maintenance activities. This could support the selection of activities for the different service offering alternatives to be evaluated in next steps.
131

Table 7.5. Example of table for connection analysis between direct and indirect maintenance activities
Direct maintenance (DM) activities
available for the service offering
Indirect maintenance (IM) activities available for the service offering IM activity 1 IM activity 2 IM activity 3 IM activity 4
DM activity 1 (I) (O) DM activity 2 (I) DM activity 3 (O) (O)
III. 2. Alternatives definition & evaluation This sub-step uses the information gathered in previous steps to define and compare two (or more) possible service offerings including different bundles of direct & indirect activities. As in previous sub-steps direct and indirect maintenance activities would be treated in different ways, thus, following different evaluation paths. The result of this sub-step will be a value score for each service offering alternative under study, VSO, which is compound by the value score of the direct maintenance activities, VDA, and the value score of the indirect maintenance activities, VIA.
The value score of the direct maintenance activities included in a service offering, VDA, can be directly associated to operational values obtained by the avoidance (or limitation) of a failure mode. Table 7.6 shows an example of a table that is proposed to support the calculation of the total VDA as compound by the value score of all activities included for each failure mode. The cells of the table have to be fulfilled by indicating 1 when the activity in the column is proposed in the service offering to be performed to avoid (or limit) the failure mode in the row. The number in each cell is considered as a variable, Axr, where x is the index for the failure mode and r is the index for the direct activity.
Table 7.6. Table for calculating the value score of direct maintenance activities in a service offering alternative
Target entity component or
subsystem
Failure mode
Total value score for failure mode
(Vfx)
Direct maintenance activities included in service solution
Activity 1 … … Activity R F1 Vf1 … … … … FT VfT
Total scores for each direct activity VDA1 … … VDAR
The total value score of the direct maintenance activities included in the service offering is calculated as follows:
𝑉𝑉𝑉𝑉𝑉𝑉 = ∑ 𝑉𝑉𝑉𝑉𝑉𝑉𝑟𝑟𝑅𝑅𝑟𝑟 [Equation 7.3]
Where,
VDAr= value score of the r-th direct activity, calculated as
𝑉𝑉𝑉𝑉𝑉𝑉𝑟𝑟 = ∑ 𝑉𝑉𝑥𝑥𝑟𝑟 ∗ 𝑉𝑉𝑉𝑉𝑥𝑥𝑇𝑇𝑥𝑥 [Equation 7.4]
Axr = binary value (0 when activity is not included in the service offering, 1 when activity is included for that x-th failure mode)
The value score of the indirect maintenance activities included in a service offering, VIA, cannot be directly linked to the failure modes of the target entity but they could be connected directly to the operational values pursued for the target entity of the service. Therefore, the calculation would be
132

done considering the rating degree that got the maximum value score for each operational value that the indirect activities can be connected to. the value score considered for their evaluation is the integrated value score obtained for each operational value in the rating AHP.
Table 7.7 shows the table proposed for the calculation of the value scores for each indirect activity. In this case, the cells of the table have to be fulfilled by indicating 1 whenever two conditions are satisfied: (i) the indirect activity in the column is connected to the rating degree in the row according to the previous portfolio analysis; (ii) the indirect activity is proposed as part of the service offering alternative. If any of these conditions are not satisfied the cell a 0 should be indicated in the respective cell. The number in each cell is then considered as a variable, Ais, where i is the index for the operational value and s is the index for the indirect activity.
Table 7.7. Table for calculating the value score of indirect maintenance activities in a service offering alternative
Operational values selected for the target
entity
Maximum rating degree for each operational value (from II.2)
Indirect maintenance activities included in the service solution
(Maximum rating degree, j)
Value score of maximum rating degree, Vsij)
Activity 1 … … Activity S
Value 1 Max j (Value1) Max Vs1j … … … … … … Value n Max j (Value n) Max Vsnj
Total scores for each direct activity VIA1 … … VIAS
The total value score of the indirect maintenance activities included in the service offering is calculated as follows:
𝑉𝑉𝑉𝑉𝑉𝑉 = ∑ 𝑉𝑉𝑉𝑉𝑉𝑉𝑉𝑉𝑆𝑆𝑉𝑉 [Equation 7.5]
Where,
VIAs= value score of the s-th indirect activity, calculated as
𝑉𝑉𝑉𝑉𝑉𝑉𝑉𝑉 = ∑ 𝑉𝑉𝑖𝑖𝑉𝑉 ∗ 𝑉𝑉𝑉𝑉𝑖𝑖𝑖𝑖𝑛𝑛𝑖𝑖 [Equation 7.6]
III. 3. Performance measures selection Once the different service offering alternatives are selected and the preferred one is selected, the performance measures to be related to be related to the service needs to be chosen. Performance measures for a performance-based maintenance services that aims to add sustainable value to the industrial user’ s operations would need to be considered from three viewpoints: (i) maintenance performance perspective as the main activities to be performed within the service are related to industrial maintenance; (ii) sustainability performance perspective as the operational values cover the three sustainability aspects; (iii) industrial service performance perspective in order to consider measures regarding service performance. These three types of performance measures have been reviewed in the literature review in sections 3.1.5, 3.2.4 and 3.3.4 respectively.
In order to measure the outcomes of the service and provide solid measures to be considered for the payment of the service, it seems adequate to use lagging indicators for measuring service results. Lagging indicators are useful for understanding the current performance status and the deviations from the desired performance status (Parida and Chattopadhyay, 2007), thus they are adequate for measuring service results in terms of closeness to or deviation from a performance target.
133

The proposed approach for this value-driven design methodology is to consider lagging indicators regarding each of the operational values obtaining highest value score for the target entity as measures to be considered in the service contract agreement. These lagging indicators at operational level could be also complemented with other indicators at tactical level to measure the performance of the service provider with respect to how efficiently the service is provided, using indicators such as first right first time (Gaiardelli et al., 2007), in order to make bonuses or modifications in the service contract. The main measures though are proposed to be the operational ones as closely related to the value created to the customer’s operations. A similar differentiation is also done by Datta and Roy (2011) as they identified performance measures related to the contract definition, at tactical level, and related to the service delivery and the actual outcome of the service, at more operational level).
The proposed list of performance measures related to the operational values suggested in the Sustainable Value Tree are introduced in Table 7.8 with respect to values related to maintenance contribution in the production processes and in Table 7.9 with respect to values related to production equipment. These lists of suggested performance measures do not intend to be comprehensive but to provide examples of the types of measures that could be used. The performance measures suggested before are inspired on previous literature review presented in sections 3.1.4, 3.2.3, and 3.3.3. The selection of performance measures would depend on the concrete application of the methodology, i.e. depending on the customer needs and contextual aspects.
Table 7.8. List of suggested performance measures for operational values related to production processes
Operational value Performance measure Units Production efficiency Production rate items / h
Lead Time H Work-in-progress items
Production effectiveness Actual production / planned production % Manufacturing cycle time H OEE %
Output quality No. defects or rework Items with defects or needing rework
Quality rate % Scrap production rate %
Utilities efficiency Water footprint m3 Energy efficiency % Energy consumption MWh or KJ Air consumption m3
Material efficiency Mass-flow of different materials used Kg Significant spills (number and volume) Kg or m3
Air emissions reduction Carbon footprint Global warming CO2 eq. Kg
Land conservation Soil erosion Kg Environmental safety Environmental damage caused by failures %
Environmental damaged caused by maintenance (or lack of maintenance)
%
Potential environmental damage (near miss) caused by failures
%
Environment-related non-conformities % Human safety Injuries caused by failures %
Injuries caused by maintenance (or lack of maintenance)
%
Potential injuries (near miss) caused by failures % Output safety Non-compliance with regulations on health &
safety impact during output life %
Technical knowledge Multi-skilled maintenance personnel % Average resolution time H
134

Table 7.9. List of suggested performance measures for operational values related to production equipment
Operational value Performance measure Units Equipment reliability Mean Time Between Failures (MTBF) H
Mean Time To Failures (MTTF) H Failure frequency failures/year
Equipment availability Availability % Mean Down Time (MDT) H Mean Up Time (MUT) H
Equipment maintainability Mean Time To Repair (MTTR) H Maintenance costs Total maintenance cost €
Corrective maintenance cost € Preventive maintenance cost € Maintenance Intensity € /item Maintenance cost over manufacturing cost % Equipment Replacement Value (ERV) %
Equipment integrity Remaining Useful Life (RUL) H Components recycling ratio %
Environmental safety Environmental damage caused by failures % Environmental damaged caused by maintenance (or lack of maintenance)
%
Potential environmental damage (near miss) caused by failures
%
Environment-related non-conformities % Human safety Injuries caused by failures %
Injuries caused by maintenance (or lack of maintenance)
%
Potential injuries (near miss) caused by failures % Man hours lost due to injuries to maintenance personnel
H
Technical knowledge Multi-skilled maintenance personnel % Average resolution time H
7.3. DISCUSSION A value-driven approach has been considered adequate as a basis for this proposal to reach better customer understanding. Thus, the methodology can support servitized manufacturers in the development of a service solution tailored to concrete customer’s needs. The value-driven design methodology uses the customer’s desired operational values as a driver for the selection of the most suitable alternative for a service solution offering. This methodology studies also the target entity context, its age and its required functions in order to define the best set of alternatives to be confronted and evaluated in the last step of the methodology. This reflects the fact that in the service portfolio of a servitized manufacturer there can be different types of direct or indirect activities that can be added to the offering depending on the characteristics of the equipment, for example regarding its technological life and its production stage, i.e. whether the product is still on production or not.
The value-driven FMEA, as a sub-step within the second step, allows the connection between the operational values desired by the industrial user and the direct maintenance activities available in the service provider’s portfolio. The typical application of FMEA has been used previously in PSS development, e.g. in the final phases of service prototyping and simulation in order to provide a detailed analysis of risks within the delivery process (Luczak et al., 2007). However, the proposed version of FMEA presented here takes a more central role in the development of service solutions.
The value-driven design methodology can support better understanding of the contract agreements in performance-based maintenance services as it contributes to the definition of the concrete activities to be included in the contract. It could then serve also as a means to understand how risk could be shared between the service provider and the industrial user.
135

8. VALUE-DRIVEN DESIGN METHODOLOGY: CASE STUDY This chapter describes the application of the value-driven design methodology, proposed in previous chapter 7, in an industrial case. The selection of the case have been previously explained in section 2.2.6 within the research methodology. The chapter gives first an overview of the case study, providing a narrative of the two companies involved. Later, the application of the methodology is explained step by step. The final part of the chapter discusses the results of the application and highlights some lessons learnt during the case development.
8.1. CASE STUDY OVERVIEW The testing case study has been developed considering the dyad service provider-industrial user. In this regard, the selected companies for the case have been chosen due to their already established close relationship. The companies have been working together for several years till now, under a service contract agreement involving mainly corrective maintenance.. This has given the opportunity to perform the necessary activities for the case study development, without the need to deal with the potential problems related to the stage of relationship between the two companies (Guo and Ng, 2011). Thus, during this case study less relationship-related issues would emerge, thus, limiting the potential interferences during the case development.
Next sections describe the profile of the service business unit and the manufacturing plant participating in the case study.
8.1.1. SERVICE PROVIDER PROFILE ABB was founded in 1988 by the merger of two well-established engineering groups. It is based in Zurich, Switzerland. Currently it has around 150,000 employees and operates in more than 100 countries from every region of the world. (ABB website, 21/2/2013).
ABB’s portfolio is very vast. Its operations are organized into five business divisions focused on particular industries and product categories, which are made up of several business units. The five business divisions are the following (ABB website, 21/2/2013): Power Products, Power Systems, Discrete Automation and Motion, Low Voltage Products, Process Automation.
ABB Italy has about 6,000 employees, allocated in several production plants in north and center of Italy. All divisions are represented in Italy, however, the Italian manufacturing plants are technological leaders on molded circuit breakers, open low-voltage breakers, modular circuit breakers, sensors and pressure transmitters, air isolated medium-voltage distribution boards and medium-voltage circuit breakers. ABB Italy is also the Global Technical Service Centre for motors and generators and the excellence center for turn-key plants in oil and gas sector and advanced automation solutions.
ABB Full Service is a business unit within the Process Automation division. This business unit provides a complete portfolio of services to ensure maximum equipment performance, ranging from spare parts and repairs to consulting, optimization, and outsourcing services. Final aims of the provision of these services are to improve system productivity, minimize cost, and extend the useful life of products and systems in their customers’ plants/facilities.
Their value proposition is characterized by four main features:
– Rapid response. They offer a fast and reliable response by leveraging on the expertise of their service professionals to identify problems and get the job done right the first time.
136
– Lifecycle Management. They offer services to help customers to maximize equipment and systems lifecycle and plan for adequate upgrades through remote enabled services.
– Performance Improvement. They offer process optimization services to uncover current limitations to better equipment and systems performance and support the implementation of necessary improvements in customers’ production processes.
– Operational Efficiency. They offer services for long-term strategic organizational improvements related to safety, energy efficiency and plant reliability by leveraging on their expertise, practical tools and proven methodologies to achieve operational excellence.
ABB Full Service is based in Prague, Czech Republic and one of the most important business unit is located in Milan, Italy. ABB Full Service Italy has 45 employees, ten of them are members of the operational staff, four of them are Site Managers and the remaining employees are indirect workers who manage all the non-operational business functions like engineering department, sales department and HR/HSE department.
Its portfolio of activities includes several types of maintenance-related services and a wide application dimensions, such are short-term / long-term offerings. The three main streams of activities are: Performance- based agreements, Maintenance Management & Supervision and Maintenance & Productivity Implementation. The latter includes a specific offering on Energy Efficiency Improvement.
Performance-based agreements are long-term performance services based on partnerships agreements that can be applied to specific manufacturing equipment, to all maintenance activities or even to both, operations and maintenance activities. The payment method is mainly based on lump sums and KPIs.
It is also worth to underline that ABB Full Service has established a process for developing the collaborative agreement with their customer. The phases of this process are: screening phase, feasibility study phase, partnership development phase, mobilization phase, maintenance agreement execution phase (ABB, 2008, p.81).
In the remainder, the service provider is referred to as “ABB Sesto”.
8.1.2. INDUSTRIAL USER PROFILE The industrial user belongs to a group division that employs around 4000 people in 34 countries and has 16 plants. The production plant located in a small town, by the shore of a lake in the north of Italy, is the industrial user considered in this case study. It is named ”Instrumentia” in the remainder.
Instrumentia was founded in the beginning of the 20th century. It was previously located in Milan but it was transferred to a small town by the lake in order to ensure production while avoiding bombing during the II World War. Thanks to this decision, the company has invested in local skills, setting up training schools and specialized electro-mechanical skills from generation to generation. It has been recently moved to the nearby town, just 1 km. from its previous location. This final location change has been done due to land regulations that prevented further expansion of facilities and to aesthetic request as now it is invisible from the lake.
The plant has currently 110 employees and is the global excellence center for pressure instruments, serving sensors for its own industrial group’s assembly units and pressure instrumentation for the European market. It produces more than 30,000 pressure transmitters and around 15,000 transducers per year (Company website, 2/6/2014).
137
Its main competitive advantage is the high quality of their pressure instrumentation. The inductive pressure sensors, created with proprietary technology, are unique in the market due to the accuracy obtained by the induction technology: they can measure differential pressures from 10mbar to 160 bar in conditions of line pressure till 400bar with an accuracy of 0,04%. These are considered niche products. Instrumentia market share is around 10%, the second position after its main competitor which holds the 45% of the market (Company website, 2/6/2014).
From its origin, this manufacturing plant has integrated the latest technological innovations. For example, nanotechnology applied to anti-abrasion coatings in separators or wireless communication in the latest version of pressure transmitters. Technological innovations in Instrumentia have been not only applied to new products abut also to production processes. Due to market demands in terms of volume and quality of products, the manufacturing plant has automatized the most delicate steps along the production process by installing five robotized work areas, one in the machining area and four in the “clean room”. These robotized areas have permitted to reduce production time, from four / five minutes to ten / fifteen seconds in some operations, and to detach operations personnel from repetitive and low value-added activities, thus, diverting the personnel towards professional growth.
8.2. APPLICATION OF THE VALUE-DRIVEN METHODOLOGY This section describes how the value-driven design methodology has been applied in the industrial case. The application of the three steps of the methodology is introduced first, followed by a summary of the main results achieved.
The application of the case has counted with great support from both companies which have provided access to production facilities and multiple interviews with main actors involved in the service provision. Apart from the PhD researcher, there has been a person from ABB Sesto providing support and knowledge about the production plant along the whole case study. This person is mentioned in the remainder as the service researcher.
8.2.1. APPLICATION OF STEP I: EQUIPMENT & PROCESS ANALYSIS The application of the first step was done by analyzing the available documents regarding the production plant of Instrumentia, as the industrial user in the testing case, and by realizing some meetings / interviews with personnel from the production site and with the service researcher.
I.1. Industrial user’s strategic and operational context The industrial user profile has been already introduced in previous section 3.1.2. A brief remainder of some key points is given here, together with some more details on the plant layout and production equipment as requested in this step of the methodology.
Instrumentia holds the second position in its market share and its main competitive advantage is the high quality of their pressure instrumentation, which are considered niche products. This company works in tight cooperation with selected key vendors at global level. The main product is the differential pressure transmitter, while other products are also produced in this plant such as gauge and absolute pressure transmitters or transducers.
The plant is located in a green area between mountains, close to a lake and by a creek. The total plant area is 12.000m2 and includes some covered and non-covered areas. The plant has three buildings: a main hall, where all production processes occur, a pre-manufacturing & heat treatment area and a shelter.
138
The plant is organized as a job shop where there are four main production areas: machine shop (LAV), clean room shop (CAB), compensation / characterization shop (COM), assembly shop (ATO). The manufacturing plant has automatized the most delicate steps along the production process by installing five robotized work areas, one in the machining area and four in the clean room area. This robotized areas have permitted to reduce production time and to detach operations personnel from repetitive and low value-added activities.
The maximum production capacity, in case of working 3 shifts per day, is the 100.000 units per year. They are currently working at around 60% of their maximum capacity, with working time of 16 hours per day during 5 to 6 days per week (depending on weekly production needs)
The demand is quite volatile, with a large component of market requests determined by special orders. Customers of Instrumentia are spread all over the world and it is difficult to determine a specific industrial sector of reference, main customers would pertain to chemical, petrochemical, pulp and paper as macro-industrial sectorial groups of reference.
There are not critical hazardous materials or processes in the production plant. Machining processes and robotized areas are properly protected in closed / isolated spaces and this machinery is provided with alarms to warn plant personnel in case of unsafe or risky conditions during the operation. Likewise, there is not risk of serious environmental damage considering the plant production processes.
Environmental and safety standards implemented in the plant are the ISO 9001 standard, regarding quality management systems and the ISO 14001 standard, concerning environmental management systems.
Regarding the context of maintenance in this production plant is necessary to point out that maintenance function in this plant is given in outsourcing to ABB Sesto. The outsourcing process is at the stage of individualizing the main activities to include in the contract agreement, which is why this case has been selected. The outsourcing of maintenance function is included within the function-oriented PSS type in literature (Tukker, 2004) and it has been also named as Total Care Products (Alonso-Rasgado et al., 2004), Functional products (Markeset and Kumar, 2003) and Technical Integrity Management Services (Kumar et al., 2009), among others, in some industrial applications reported in literature.
Therefore, maintenance function in Instrumentia, managed by ABB Sesto, reports functionally to the plant management (i.e., economic reports, extra costs, etc..) and has a close collaboration with the production function regarding the corrective maintenance interventions performed in the plant and the monitoring and improvement of equipment availability. Moreover, there is also a meaningful relation with the HSE function within the plant in what concerns:
– Safety: regarding the implementation of corrective actions as a result of irregularities emerged during Safety Observation Tours (SOT);
– Environment: in relation to the adoption of specific procedures for environmental protection (defined by law or internal ABB policy), measures of environmental impact required by law (resources consumption ) and the upgrading of procedures.
I.2. Selection of equipment groups Although ABB Sesto is taking over the whole maintenance function in the production plant, the target entity considered for this testing case is a predefined set of machinery in more critical areas for which
139

they are planning to perform maintenance activities that go beyond a corrective approach. This predefined set is taken as a starting point for discussion in order to identify a smaller set of machines to apply the value-driven design methodology.
A first meeting between the PhD researcher and the service researcher came out with a draft list of machines in the production plant which are more interesting to be included in the study due to their complexity or potential criticality within the production process. The machinery in this draft list was divided by production area in order to facilitate further discussions.
The draft list was checked with each area supervisors from LAV, CAB and COM production areas and with the production manager, during a set of interviews done with a twofold objective for this step: (i) to understand whether the machines included in the list were significant or any important machine was missing from the list and (ii) to understand the operational context of each production area concretely. The results of these interviews brought a new list of machines to be considered for the study, as they suggested to remove some not so important machines from the draft list and to add one missing machine with some availability problems that had occurred lately.
The final list of machinery to be considered as the target of the performance-based service was defined in a later meeting that analyzed the initially proposed operational values for each machine within the list. This analysis supported the identification of machine groups, as the level of single machines was found unpractical for this case. In this sense, the final refinement of the machine groups was done in parallel with sub-step II.1, as the selection of operational values for each machine was found useful as a driver for making groups with machines that would have similar priorities. Nine machine groups were made according to the analysis of operational values.
The list of nine machine groups was eventually presented to the location manager at the beginning of the interview done with him regarding the Rating AHP (sub-step II.2) and he suggested to shorten the list to seven groups. Table 8.1 shows the final list of seven machine groups for the three production areas considered for the testing case.
Table 8.1. Selected list of machine groups with the production areas
Production area
Machine group name Machinery included
CAB Welding machines Electric arc, automated and laser welding machines Sleeves Sleeve loading units Mass spectrometry Mass spectrometry tools Washing machine Washing machine
LAV TSD machines Machines working directly on the transmitter, such as electric drilling machine, drilling machine, lathe, levigation machine, milling machine
COM Compensation system Climatic chambers, pressure generator and compensation system except chambers
Flanger machine Flanger machine
Main characteristics of the concrete context of selected machine groups Regarding the guiding questions to understand the concrete context of the target entity, these questions were formulated to area supervisors regarding the area under their responsibility. Not so many notable differences were found among areas, the most remarkable aspects are presented next.
Machinery age in the production plant varies from 0 to 20 years. Recently new machines have been located in the COM area, while just 5 machines have less than 10 years in the LAV area and 3 machines
140

have less than 15 years in the CAB area. It is commonly understood by area supervisors that older machines incurred in higher maintenance costs.
The highest variety of functions required to the machinery is found in the LAV area. The area supervisor suggested that some machines have similar characteristics regarding their expected working time, 16 hours per day, and the difficulties regarding a possible external realization of their processes in case of machine unavailability. In this sense, a machine becomes critical whenever its requested elaboration process cannot be done externally due to the high cost or low quality of the external production.
Special characteristics of the CAB area are related to the requested quality of the input intermediate products that arrive to this area from the machining area. The material that is provided as an input to the CAB area is assumed to be according to the high quality standards as not further control is done within this area till the final check. A special working condition regards the washing machine in this area as it works 24hours per day.
The COM area realizes the characterization of the transducers, as every transducer has a different output at different levels of pressure and temperature. A special request to the compensation system regard the working speed as it is a crucial parameter for the production flow.
A more general consideration regarding the possibilities for outsourcing production processes can be done for the whole plant. All strategically critical components, due to their process, their technology or the requested quality assurance, are manufactured internally. There is no outsourcing possibility for them, but some could be done manually (employing much more resources, so more inefficiently than when done automatically).
No hazardous materials in the plant or particular environmental risks have been identified regarding the selected machines. No concrete safety issues or serious risk of injuries have been identified regarding the selected machines, neither.
Target stakeholders Due to the wide application of the value-driven design methodology in several plant areas, the main stakeholders for the service provision were identified at plant level as they can provide their same perspective to machines in each area: area supervisors, production manager, maintenance manager and location manager. These people were further involved in the value-driven design methodology application, concretely in the next step II.
8.2.2. APPLICATION OF STEP II: VALUE ANALYSIS The application of the second step has been done by a set of several interviews and meetings done in the production plant. Some iterations with the previous sub-step I.2 has been found necessary during the development of this step, concretely at sub-steps II.1 and II.2.
II.1. Selection of operational values This sub-step involved mainly the area supervisors as experts on the machinery in each area and the production manager in order to give a broader perspective to this step. The selection of operational values was done by interviewing the area supervisors at the production site. During the interviews they were also asked to confirm the list of machinery for their production area, as explained in previous sub-step I.2. and the final list has been shown in previous Table 8.1. The production manager was also interviewed regarding both the machinery list and the operational values for each production area. The list of operational values to be applied to each machine group and the machine groups was
141

then defined after a meeting between the PhD researcher and the service researcher in which they analyzed together the data obtained in the interviews done at the production site.
Both the machine groups and the operational values to be applied to each machine group were introduced at the beginning of the interview with the location manager, under the activities done for next sub-step II.2.He suggested a final list of seven machine groups and he also included few more operational values for the machine groups selected. The operational values to be applied to each machine group are the presented in next Table 8.2.
Table 8.2. Operational values selected to be considered for each machine group
Operational values
Machine groups Welding
machines Sleeves Mass
spectrometry Washing machine
TSD machines
Compensation system
Flanger machine
Equipment reliability
Equipment availability
Production efficiency
Production effectiveness
Maintenance cost
Output quality Technical knowledge
Environmental safety
Human safety
It is important to mention that all interviewees highlighted the importance of environmental and human safety as priorities of all production areas and the whole plant. Although, they didn’t feel like putting it in comparison with any of the other operational values. These two values would not be included in the rating AHP according to the expressed intentions of all interviewees.
The meaning of technical knowledge understood in this case context involves knowledge regarding the production and set up processes as they were identified as fundamental for the right operation and maintenance of some machine groups.
II.2. Rating AHP The stakeholders involved in the AHP application are those with a wider vision of the plant areas and machinery: location manager, production manager and maintenance manager. The inclusion of area supervisors would have made sense regarding their concrete production area of responsibility, but it would imply a longer list of interviews for this sub-step and it would have introduced different perspectives for each production area. Thus, the wider perspectives of people having responsibilities along the whole plant was preferred.
Figure 8.1 shows the structure of the AHP developed as a model using the software SuperDecisions. The model in the software facilitated the data collection regarding the pairwise comparisons done by each interviewee. The intermediate level of the model was grouped by production area, in order to make easier the visualization of the machine groups in each area. The results of the each interview were then integrated by using a supporting excel file prepared to integrate the results. The integrated
142

results were the averages of the values obtained for each rating degree of the operational values selected for each machine group.
Figure 8.1. AHP model using SuperDecisions software
The order of the interviews was picked intentionally. Therefore, the first interviewee was the location manager which was also asked to confirm the machine groups and the operational values selected for each machine group as explained above in sub-step II.1.
The interview process was supported by SuperDecisions software but a small exercise was prepared to be done before assigning the priority scores in the pairwise comparisons in order to support the pairwise comparisons and increase the consistency of the AHP results. Previous experience gained in other AHP analysis done involving a high variety of elements for the pairwise comparisons at the same level suggests that is more likely to have higher or even unacceptable levels of inconsistency in AHP results when the number of elements compared is more than five. Thus, in order to avoid higher inconsistency in the AHP results, some pieces of paper were prepared with the operational values selected for the machine groups and the interviewees were asked to display them in a table according to the hierarchy and priorities that they consider for those operational values. Afterwards, the interviewees were asked to complete the pairwise comparison table for each operational value and each rating degree with the support of SuperDecisions program. The levels of inconsistency of their pairwise comparison were acceptable in all cases, with a slight tendency to be lower than expected. Figure 8.2 shows an example of the tables for pairwise comparisons provide by the software.
Figure 8.2. Example of pairwise comparisons with SuperDecisions software
143

The results of the AHP analysis for each interviewee are included in Appendix E. The integrated results of the Rating AHP for all machines involved are shown in next Figure 8.3 which is directly taken from the supporting excel file prepared for this sub-step.
It can be observed in Figure 8.3 which are the rating degrees obtaining higher score for each operational value as they are shown in several shadows of green (the darker the color, the higher the obtained score). For each machine group, it has also been marked which are the higher scores obtained in general by adding a star next to each score (the more colored in yellow the star, the higher the value score). These two ways to represent the scores obtained helped to identify the highest scores for each operational value in each machine group and the highest scores for each machine groups considering together all operational values selected for the group.
Figure 8.3. Value scores obtained in the rating AHP for all machine groups
As mentioned before, two operational values – environmental and human safety – were selected as priorities but not for the AHP analysis due to a specific request from the interviewees as they are two values considered as having the highest importance. For these values, a direct value of 1 was applied for their use in next steps, as the scores obtained in an AHP analysis would vary from 0 to 1.
II.3. Value-driven FMEA This sub-step was performed by defining required functions, the functional failures and failure modes for each machine group, following the first three steps of a typical FMEA technique, and by doing an evaluation of their failure modes’ effects regarding their impacts on the operational values selected for each machine group. In the particular cases of Environmental and human safety, the evaluation was
AVERAGE VALUES
AREA: LAV AREA: CAB AREA: COM
TSD MACHINES WELDING MACHINES COMPENSATION SYSTEMVALUE SCORES VALUE SCORES VALUE SCORES
Low Medium High Low Medium High Low Medium HighAvailability 0,0218 0,0418 0,1970 Availability 0,0147 0,0577 0,1569 Cost 0,0081 0,0142 0,0582Cost 0,0101 0,0061 0,0158 Effectiveness 0,0116 0,0302 0,0840 Effectiveness 0,0276 0,0412 0,2176Effectiveness 0,0108 0,0209 0,0926 Quality 0,0368 0,0418 0,3426 Efficiency 0,0158 0,0097 0,0415Quality 0,0294 0,0294 0,2398 Reliability 0,0183 0,0331 0,1254 Quality 0,0234 0,0440 0,1917Reliability 0,0230 0,0264 0,1716 Technical knowledge 0,0049 0,0241 0,0180 Reliability 0,0290 0,0421 0,2359Technical knowledge 0,0049 0,0141 0,0444
SLEEVES FLANGERVALUE SCORES VALUE SCORES
Low Medium High Low Medium HighAvailability 0,0165 0,0387 0,0730 Availability 0,0120 0,0141 0,0425Quality 0,0324 0,0412 0,2350 Effectiveness 0,0238 0,0589 0,2215Reliability 0,0425 0,0646 0,3260 Efficiency 0,0304 0,0645 0,2424Technical knowledge 0,0102 0,0266 0,0932 Reliability 0,0282 0,0302 0,2315
MASS SPECTROMETRYVALUE SCORES
Low Medium HighAvailability 0,0186 0,0183 0,0312Quality 0,0652 0,0652 0,5386Reliability 0,0311 0,0926 0,1393
WASHING MACHINE CABVALUE SCORES
Low Medium HighAvailability 0,0301 0,0609 0,1983Effectiveness 0,0214 0,0266 0,1552Efficiency 0,0171 0,0427 0,1331Reliability 0,0216 0,0489 0,1759Technical knowledge 0,0177 0,0117 0,0387
144

performed by indicating whether there is a potential loss of environmental safety or human safety when the failure modes occur. Table 8.3 shows the result of the value-driven FMEA done in the testing case. The last column of Table 8.3 indicates the total value score for each failure mode, Vfx, to be used for the evaluation of maintenance activities in next step III.
145

Table 8.3. Value-driven FMEA applied to the testing case
AREAMACHINE
GROUP REQUIRED FUNCTION/S FUNCTIONAL FAILURE FAILURE MODE/S
(Plant area)
(Name given to the machine
group)
(Purpose or mission of the equipment within the
machine group)
(Total, partial or intermittent loss of the
required function)
(Visible or physical evidence of the occurence of the
functional failure)Reliabil ity Availabil ity Efficiency Effectiveness Maintenance
CostQuality Technical
knowledgeEnvironmental
safetyHuman safety
Machine doesn't start welding
One of the components is broken
High High Medium Low Low No No0,354
Perform the process out of operation standards
The products is outside the specification l imits
Low Low High High Medium No No0,484
Machine setup is not appropiate for welding (different raw materials required different set up)
Quality loss that comes out in subsequent operations
Medium Low Medium High High No No0,439
Act as a screen betweend welding area and production area
Not proper isolation Isolation system is broken High High Low Low Low No Yes1,336
Sleeve doesn't move One of the components of the automation is broken
High High Low Medium No No 0,458
Can't place all the pieces in the right position
One of the components loses its accuracy
Medium Low Medium Medium No No 0,149
Performs out of the speed rate
Malfunctioning of any of the components
Medium Low Low High No 0,207Loss of machine reference point
Machine does not pick any piece, though continues
Medium Low Low High No No 0,207
Machine doesn't work Failure of one of the
High High Low No No 0,236Machine loses accuracy Wearing of the sensor High High High No No 0,709
Removing small particles from pieces
Performs out of the production rate
One of the component works out of speed rate
Low Low High Medium Low No No 0,229
Contain the industrial soap
Can't contain the industrial soap
Wearing of the seals Medium High Medium Medium Low No Yes 1,334
Not perform the required process
One of the components is broken
High High Medium Medium Low Low No No 0,430Perform the process out of operation standards
Perform the process with non-quality output
Low Low High Low High Medium No No0,401
Performs out of the speed rate
Wearing of one of the components or more
Medium Medium Low Medium Low Low No No0,120
Can't reach the standard leves of temperature
Machine controller fails High High High Medium High No No0,701
Not perform the required process
One of the component is broken
High Low Medium Medium Low No No 0,331Not perform the required process
Failure immediately evident High High Low Medium No No 0,363
Machine works out of operation standards
Failure immediately evident High Low Low Medium No No 0,333
Not perform according to speed rate
Failure immediately evident Low Low Medium Medium No No 0,164
COM
COMPENSATION SYSTEM
Perform the required process for each machine within the required times
FLANGER MACHINE
Perform the required process at the right speed rate
VALUE SCORE FOR EACH
FUNCTIONAL FAILURE (Vfx)
LAV TSD MACHINES
Perform the required process for each machine within the operation standards and producing quality output
CAB
WELDING MACHINES
Perform the welding process according to production standards
Postioning pieces to be assembled
MASS SPECTROMETRY
Detecting the right amount of Helium
WASHING MACHINE
EFFECT ON OPERATIONAL VALUES (To be defined by indicating: Low, Medium or High)
SLEEVES
146

8.2.3. APPLICATION OF STEP III: SERVICE SOLUTION DEFINITION The third and last step builds on the results on the application of previous steps regarding the value scores for the rating degrees of each operational values and for the identified failure modes for the selected machine groups. The aim of Step III is to select the service solution that better matches the requirements in terms of strategic aims and operational values of the industrial user.
III.1. Portfolio analysis This sub-step in Step II was carried out with the service researcher as main source of knowledge on the available activities from service provider perspective. The updated version of the contract under development between both companies was also studied by the PhD researcher as preparation for the meeting with the service researcher. A set of direct and indirect activities was defined and analyzed as a result of the meeting, considering only those indirect activities that can be performed at equipment level among the wide range of potential activities to be implemented by the provider. It is worth to note that the wide variety of possible indirect activities allowed to identify some activities, other than those related to maintenance planning or maintenance engineering, that can be performed as part of a service solution. These activities were also included.
The analysis of direct activities was done by describing typical failure modes that could be prevented by the available maintenance activities. The following Table 8.4 indicates the maintenance direct activities selected as available for the service provider to be considered for their application in the machine groups target of the service solution.
Table 8.4. Portfolio analysis for direct maintenance activities available to be applied in the service solution
Direct Maintenance Activities
Description of the type of functional failures / failure modes to be potentially prevented by each activity type
Corrective maintenance It would be applied in cases where the failure does not have important consequences on production, environment or safety.
Equipment condition inspections
Inspections of equipment conditions would be applied when the degradation parameters can be checked in fixed time intervals and the inspection provide enough time to plan the maintenance action
Quality output inspections
Quality inspections would be performed in cases that lack of quality output can be considered a failure, due to high quality conditions required, or can provide enough time to plan the maintenance action and prevent out-of-specifications output
Preventive maintenance
Time-based preventive maintenance would be applied in cases that failure rate can be calculated and failure mode has consequences on production, environment or safety.
Condition-based maintenance
Condition-based maintenance would be applied in cases that real time monitoring of process parameter can provide enough time to plan the maintenance action and prevent significant production losses
The analysis of indirect activities was done by using two tables as suggested in the proposed description of the value-driven methodology. The first table (Table 8.5) regards the connection between the indirect activities and the desired operational values (from a general perspective). The second table (Table 8.6) indicates the linkages between direct and indirect activities in terms of input (I) or output (O), i.e. indicates whether a direct maintenance activity can be seen as an input for the realization of an indirect maintenance activity or as an output of the application of an indirect maintenance activity, respectively.
147

Table 8.5. Portfolio analysis for indirect maintenance activities available to be applied in the service solution
Indirect Maintenance Activities
Relation between the rating degree of operational values and the indirect activities
Reliability Availability Efficiency Effectiveness Maintenance Cost Quality Technical
knowledge Environmental
safety Human safety
Preliminary analysis of criticality equipment
Medium; High
Medium; High
Medium; High Medium; High
Medium; High
Design by-law maintenance plan
Medium; High Medium; High
Medium; High
Design FMECA-based maintenance plan
Medium; High Medium; High
Medium; High
Medium; High Medium; High
Medium; High
Condition-based maintenance program design
Medium; High
Medium; High Medium; High
Medium; High
Medium; High
RAM Analysis Medium; High
Medium; High
Medium; High
Medium; High
Medium; High
RCA-RBI Analysis
Medium; High
Medium; High Medium; High
Medium; High Medium; High
Medium; High
Revamping study Medium; High
Medium; High
Medium; High Medium; High
Medium; High
Medium; High Medium; High
Medium; High
Machinery re-certification Medium; High
Medium; High
Training of equipment operators
Medium; High Medium; High
Medium; High
Medium; High Medium; High
Medium; High
Training of maintenance team
Medium; High Medium; High Medium
Medium; High Medium; High
Medium; High
Energy efficiency audit
Medium; High
Safety Integrity Level (SIL) analysis Medium; High
Medium; High
Risk Assessment Medium; High
Medium; High
148

Table 8.6. Analysis of relations between direct and indirect maintenance activities
Indirect Maintenance Activities
Relation between the direct activities and indirect maintenance activities
Corrective maintenance
Equipment condition
inspections
Quality output inspections
Preventive maintenance
Condition-based maintenance
Preliminary analysis of criticality equipment x(I) x(O)
Design by-law maintenance plan x(O) Design FMECA-based maintenance plan x(I) x(O) x(O)
Condition-based maintenance program design
x(I) x(I) x(O)
RAM Analysis x(I) x(I) x(O) RCA-RBI Analysis x(I) x(O) Revamping study x(I) Machinery re-certification x(I) Training of equipment operators x(I) Training of maintenance team x(O) Energy efficiency audit x(I) x(O) Safety Integrity Level (SIL) x(I) x(O) Risk Assessment x(I) x(O)
III.2. Alternatives definition and evaluation At this point, it was found interesting to make a study of different possible scenarios for the service solution. Several service offering alternatives were evaluated according to previous results.
Three possibilities were defined for the direct maintenance activities:
- Corrective maintenance only. This alternative would consider the current situation in the plant, which is currently being maintained only by performing corrective maintenance (this includes also the by-law preventive maintenance required for some equipment);
- Preventive maintenance when possible. Taking the previous situation as a starting point, the second possibility implied the application of preventive maintenance and inspections whenever is possible to avoid the failure modes for the selected machine groups;
- Predictive maintenance when possible. This possibility goes one step further and considers the application of condition-based / predictive maintenance, instead of preventive or corrective maintenance, whenever is possible to avoid the failure modes for the selected machine groups. As stated by Campos (2009) condition-based maintenance is preferred wherever technically feasible or economically viable.
For each of the possible scenarios presented regarding the direct maintenance activities, two packages of indirect maintenance activities would be defined: (i) a basic package, containing a set of basic indirect maintenance activities and (ii) an advanced packaged, including a different set or a
149

complementary set for the activities inside the basic package. The packages for each alternative would be defined ad-hoc for the specific case, considering the functional relations between activities included as direct maintenance activities. The selected service solution alternatives, indicating also the indirect maintenance activities included in each package for each type of direct activities, are presented in next Table 8.7. It is necessary to point out that not all indirect activities are applied to all machine groups, this table gives just an overview of which are the activities included in each scenario.
The evaluation of each alternative is subsequently done. The calculation tables for the value scores of the direct and indirect maintenance activities included in each service solution alternative are included in Appendix F. It can be seen in those calculation tables which are the concrete indirect activities applied to each machine group in each scenario.
Table 8.7. Definition of service solution possible alternatives
Scenarios for indirect maintenance alternatives
Scenarios for direct maintenance activities Corrective
maintenance only - Preventive maintenance
when possible Predictive maintenance
when possible Basic package Service offering 1 (SO1) –
Basic package Service offering 2 (SO2) –
Basic package Service offering 3 (SO3) –
Basic package Preliminary analysis of
criticality equipment
Design by-law maintenance plan
Design FMECA-based maintenance plan
Condition-based maintenance program
design
RAM Analysis Training equipment
operators
Training maintenance team
Energy efficiency audit Advanced package Service offering 1 (SO1) –
Advanced package Service offering 2 (SO2) –
Advanced package Service offering 3 (SO3) –
Advanced package Preliminary analysis of
criticality equipment
Design by-law maintenance plan
Design FMECA-based maintenance plan
Condition-based maintenance program
design
RAM Analysis Revamping study
Machinery re-certification
Training equipment operators
Training maintenance team
Energy efficiency audit
150

Example of the calculations done for one machine group The tables supporting the calculations done for one of the machine groups, the Sleeves group, are presented here as an example to illustrate how the scores where obtained.
Table 8.8 summarizes the calculations done for obtaining the value scores related to direct maintenance activities included in each service offering for the sleeves group, according to the scenarios presented in previous Table 8.7. It is necessary to point out that it is assumed that corrective actions do not contribute to avoid the effect of the failure modes, as the action would be done after the occurrence of the failure modes. Thus, the contribution of corrective maintenance activities to the achievement of greater value is null, as can be seen in Table 8.8. The calculations done regarding the indirect maintenance activities proposed in the different scenarios for the sleeves group are summarize in next Table 8.9.
Table 8.8. Table for the calculation of value score regarding direct maintenance activities for the sleeves group
Table 8.9. Table for the calculation of value score regarding indirect maintenance activities for the sleeves group
FAILURES MODE/S VALUE SCORE(Visible or physical evidence
of the occurence of the functional failure) (Vff)
Corrective maintenance
Preventive maintenance
Condition-based maintenance
Corrective maintenance
Preventive maintenance
Condition-based maintenance
Corrective maintenance
Preventive maintenance
Condition-based maintenance
One of the components of the automation is broken 0,458 1 1 1One of the components loses its accuracy 0,149 1 1 1Malfunctioning of any of the components 0,207 1 1 1Machine does not pick any piece, though continues working 0,207 1 1 1
0,000 0,000 0,207 0,000 0,207 0,607
VDA (SO1)= 0,000 VDA (SO2)= 0,207 VDA (SO3)= 0,814
INCLUSION OF ACTIVITIES IN SERVICE OFFERING 3 (SO3)
DIRECT MAINTENANCE ACTIVITIES
INCLUSION OF ACTIVITIES IN SERVICE OFFERING 1 (SO1)
DIRECT MAINTENANCE ACTIVITIES
INCLUSION OF ACTIVITIES IN SERVICE OFFERING 2 (SO2)
DIRECT MAINTENANCE ACTIVITIES
OPERATIONAL VALUES
(Maximum rating degree )(Value score )
Preliminary analysis of criticality equipment
Design FMECA-based maintenance plan
Condition-based maintenance program design
RAM Analysis
Revamping study
Training equipment operators
Training maintenance team
Reliability High 0,326 1 1 1 1Availability High 0,073 1 1 1 1 1 1 1Quality High 0,235 1 1 1 1Technological knowledge High 0,093 1 1 1 1 1Environmental safety High 1,000 1 1 1 1 1Human safety High 1,000 1 1 1 1 1 1
2,399 2,401 1,727 2,492 2,634 2,401 2,166
VIA (SO1) - BASIC = 2,40 1
VIA (SO2) - BASIC = 4,89 1 1
VIA (SO3) - BASIC = 8,69 1 1 1 1
VIA (SO1) - ADVANCED = 11,86 1 1 1 1 1
VIA (SO2) - ADVANCED = 14,49 1 1 1 1 1 1
VIA (SO3) - ADVANCED = 14,49 1 1 1 1 1 1 1
INCLUSION OF INDIRECT ACTIVITIES IN SERVICE OFFERING 1 (SO1) - ADVANCED PACKAGE
INCLUSION OF INDIRECT ACTIVITIES IN SERVICE OFFERING 2 (SO2) - ADVANCED PACKAGE
INCLUSION OF INDIRECT ACTIVITIES IN SERVICE OFFERING 3 (SO3) - ADVANCED PACKAGE
MACHINE GROUP: SLEEVES
MAXIMUM RATING DEGREE
INCLUSION OF INDIRECT ACTIVITIES IN SERVICE OFFERING 1 (SO1) - BASIC PACKAGE
INCLUSION OF INDIRECT ACTIVITIES IN SERVICE OFFERING 2 (SO2) - BASIC PACKAGE
INCLUSION OF INDIRECT ACTIVITIES IN SERVICE OFFERING 3 (SO3) - BASIC PACKAGE
AVAILABITY OF INDIRECT ACTIVITIES FROM PORTFOLIO ANALYSIS
INDIRECT MAINTENANCE ACTIVITIES
Value of the indirect activity whether performed
151
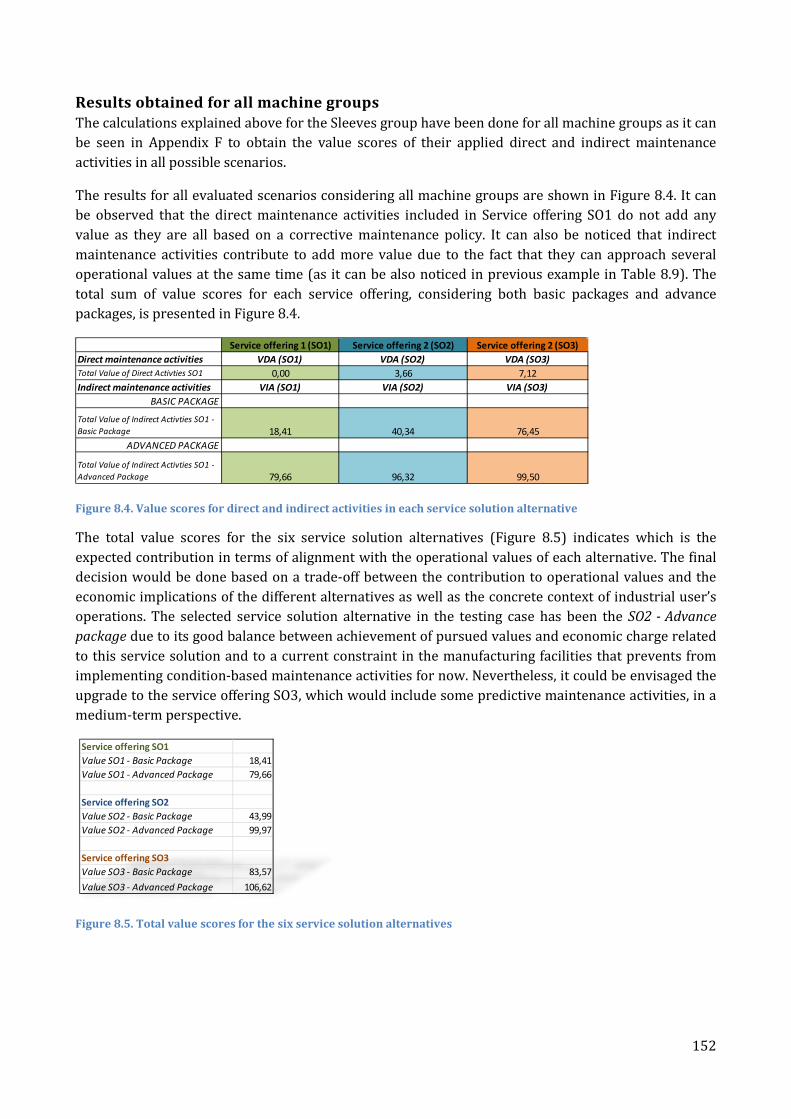
Results obtained for all machine groups The calculations explained above for the Sleeves group have been done for all machine groups as it can be seen in Appendix F to obtain the value scores of their applied direct and indirect maintenance activities in all possible scenarios.
The results for all evaluated scenarios considering all machine groups are shown in Figure 8.4. It can be observed that the direct maintenance activities included in Service offering SO1 do not add any value as they are all based on a corrective maintenance policy. It can also be noticed that indirect maintenance activities contribute to add more value due to the fact that they can approach several operational values at the same time (as it can be also noticed in previous example in Table 8.9). The total sum of value scores for each service offering, considering both basic packages and advance packages, is presented in Figure 8.4.
Figure 8.4. Value scores for direct and indirect activities in each service solution alternative
The total value scores for the six service solution alternatives (Figure 8.5) indicates which is the expected contribution in terms of alignment with the operational values of each alternative. The final decision would be done based on a trade-off between the contribution to operational values and the economic implications of the different alternatives as well as the concrete context of industrial user’s operations. The selected service solution alternative in the testing case has been the SO2 - Advance package due to its good balance between achievement of pursued values and economic charge related to this service solution and to a current constraint in the manufacturing facilities that prevents from implementing condition-based maintenance activities for now. Nevertheless, it could be envisaged the upgrade to the service offering SO3, which would include some predictive maintenance activities, in a medium-term perspective.
Figure 8.5. Total value scores for the six service solution alternatives
Service offering 1 (SO1) Service offering 2 (SO2) Service offering 2 (SO3)Direct maintenance activities VDA (SO1) VDA (SO2) VDA (SO3)Total Value of Direct Activties SO1 0,00 3,66 7,12Indirect maintenance activities VIA (SO1) VIA (SO2) VIA (SO3)
BASIC PACKAGE
Total Value of Indirect Activties SO1 - Basic Package 18,41 40,34 76,45
ADVANCED PACKAGE
Total Value of Indirect Activties SO1 - Advanced Package 79,66 96,32 99,50
Service offering SO1Value SO1 - Basic Package 18,41Value SO1 - Advanced Package 79,66
Service offering SO2Value SO2 - Basic Package 43,99Value SO2 - Advanced Package 99,97
Service offering SO3Value SO3 - Basic Package 83,57Value SO3 - Advanced Package 106,62
152

III.3. Performance measures selection The selected service solution implies different direct and indirect maintenance activities for each type of machine group. Thus, the performance measures suggested to be used for the contract agreement development are based on the operational values that obtained higher score for each machine groups. Table 8.10 shows the preferred measures for each type of machine group.
Table 8.10. Performance measures suggested for each machine group for the service solution selected
8.3. DISCUSSION & LESSONS LEARNT The value-driven design methodology applied in this case study has been incorporated into the feasibility study phase of the development process for a new collaborative agreement under elaboration between the two companies involved in the case study. In this context, it has shown its flexibility regarding several aspects:
– First and foremost, some iterations were found necessary during the application of the methodology between different steps in order to refine decisions taken in previous steps. The main iterations happened between from step II.1 to step I.2 (machine groups were designated mainly based on the operational values selected for each machine in the initial list) and between step II.2 and step II.1 (during the realization of the Rating AHP it was suggested by an interviewee to add new operational values to some machine groups).
– Secondly, the model defined for the Rating AHP in the software used supported changes in the list of operational values. This is a flexibility of the software that has permit some flexibility also in the methodology being tested. Another aspects of flexibility within the AHP is the possibility to give highest value to very important operational values, as done for environmental and human safety in this testing case. This envisages the adaptability to different industrial realities and needs while proving that this is not a limitation for the application of the methodology.
– Thirdly, the value-driven FMEA can support different levels of details regarding the description of the failure modes. The necessary level of detail required should be enough to understand the effects of the failure mode on the operational values selected for the machine under concern. This is permitted due to the effect description needed for the value-driven FMEA, as the effect needs to be defined considering three levels of impact: low, medium or high.
The value-driven design methodology has revealed to bring benefits to both actors involved, as they are described herein.
From the service provider perspective, the main strengths of the value-driven design methodology are related to being a means for better understanding customers’ needs from an operational perspective
WELDING MACHINES SLEEVES MASS SPECTROMETRY WASHING MACHINE TSD MACHINES COMPENSATION SYSTEM FLANGER MACHINE
ReliabilityMTBF; Failure frequency
MTBF; Failure frequency
MTBF; Failure frequency MTBF; Failure frequencyMTBF; Failure
frequencyMTBF; Failure frequency
MTBF; Failure frequency
Availability MDT; MTTR MDT; MTTR MDT; MTTREfficiency Lead time per cycle
EffectivenessActual cycles/Plan cycles Actual cycles/Plan cycles
Actual cycles/Plan cycles
Cost
Quality% rework; Scrap production rate
Scrap production rate Scrap production rateScrap production
rateScrap production rate
Technological knowledge
Environmental safety
Human safety
Machine groups
Environmental damage caused by failures; Potential environmental damage (near miss) caused by failures;
Injuries caused by failures; Potential injuries (near miss) caused by failures
Operational values
153

and to its potential use as a knowledge database, as it is assumed that customers with similar operational contexts could pursue similar values. This would enable the service provider to create a database that serves to better identify initial proposals to customers with similar business and operations characteristics.
Another opportunities that can be envisaged for use of the value-driven design methodology are the following:
– It provides a route of activities to include within service offerings, thus, giving several options to customers as modules of activities that could be added in the service. These modules could follow a logic path, according to customers’ contextual needs and constraints. As an example, it can be observed that in the scenario for the advanced packaged offered within service offering SO1 (Table 8.7) it is included the realization of a FMECA-based design of the maintenance plan, which is normally not used for corrective actions (Service offering SO1 includes only corrective actions as direct maintenance activities). This could be seen as an opportunity given to the provider to further study maintenance needs and upgrade the service offering to include some preventive actions, thus, proceeding towards a potential update of the service agreement including a new offering that is closer to service offering SO2.
– It could support the formalization of the provider competences, giving higher visibility to customers of other potential activities within the provider portfolio that otherwise would not be taken into consideration.
The value-driven design methodology has also some limitations. One of them is related to not considering the economic charge for each service offering alternative as it is assumed that the provider would have it already calculated and the value obtained from this methodology could be directly confronted with the total price for the customer that the different alternatives would have. This is probably not true for all service providers willing to offer performance-based maintenance services.
Another possible limitation, that would apply to both the service provider and the industrial user, regards the stakeholder selection. It is important to identify the right people to get involved in the Rating AHP as its results would guide the selection of activities to be included in the service offering alternatives and evaluated in the last step of the value-driven design methodology.
From the industrial user perspective, some benefits can been highlighted related to two main aspects:
– The analysis done in the plant, considering results till the AHP analysis, has itself a great value for the industrial user’ s personnel as it can improve their understanding on their own plant. It constitutes a new perspective from which to look at their equipment and that can be applied to their machinery in order to better understand their operational requirements.
– The methodology provides support to the industrial user’s decision making process by improving their understanding of the services to be acquired. This would provide the industrial user with a means to make more sound decisions on the activities to be included in future service contracts.
154
9. CONCLUSIONS This final chapter summarizes the results of this PhD research by identifying its main contributions to knowledge and mentioning some implications for practitioners. It also explains the limitations of the research and proposes some lines for further research related to the main findings of this research and the remaining open issues.
9.1. CONTRIBUTION TO KNOWLEDGE The main research questions that have been addressed in this research have been defined at the beginning of this document in section 2.1. They have led the research during the whole PhD project, thus, the main findings can be mapped against these research questions. Table 9.1 gives an overview of the PhD research, indicating the project phases, research gaps and main contributions connected to each research question.
As mentioned in the problem statement this PhD research focuses on three of elements of the transformation model for servitization defined by Vladimirova et al. (2011) which are customer, value, new offering. Though the main contributions have been done within these three elements, some secondary implications of the PhD results can be seen related to other two elements: contract and measurements, as it can be seen in Table 9.1.
155

Table 9.1. Overview of PhD research: main research objective, research questions, research project phases, research gaps and main contributions
Main research objective: “to advance the integration of sustainability into manufacturing operations through maintenance service provision by contributing to the understanding of industrial maintenance from a
sustainability perspective and by looking for a systematic method to incorporate sustainable value into the new offerings proposed by servitized manufacturers” Research questions Research project
phase/s Research gaps Main contributions related to the research question
SQ 1: What is the current approach regarding the acquisition of different maintenance services in manufacturing companies?
- Literature review - Exploratory phase
Research – Practice gap: the study of the current practice regarding maintenance services in Italian manufacturing companies indicates that performance-based contracts (7%) are among the less extended forms of maintenance service contracts, although according to literature are those providing higher value.
- Analysis of target areas and main motivations for the acquisition of maintenance services - Analysis of maintenance contract types and their main requirements - Analysis of outsourcing strategy and main outsourced activities
SQ 2: How does maintenance function in manufacturing companies contribute to more sustainable manufacturing operations?
- Literature review - Exploratory phase
Research Gap 1: There is no comprehensive empirical study done regarding the concrete dimensions and elements of maintenance contribution to sustainable manufacturing
- Analysis of maintenance contribution to company’s strategic priorities and identification of relations between companies priorities and maintenance features - Identification of the dimensions related to the contribution of maintenance to sustainable manufacturing - Proposal of a framework for maintenance value within sustainable manufacturing
Research Gap 2: In maintenance literature, it seems to be a missing link between maintenance strategy and maintenance processes that could help understanding the value creation processes.
- Proposal of the concept of Maintenance Business Model for driving value creation in maintenance - Categorization of different choices within each element of the Maintenance Business Model
SQ 3: How can technological innovations contribute to enhance sustainable value in maintenance service provision?
- Literature review - Explanatory phase
Research Gap 3: There is no clear understanding of how advanced maintenance technologies contribute or influence the value of the service provision.
- Literature-based analysis of technologies for maintenance services and identification of categories within a proposed two-level vision of technology-based services - Proposal of a value analysis method for the evaluation of the technological tools / applications - Identification of possible connections between the service value dimensions and the technological tools/ applications.
RQ: How can maintenance services contribute to sustainable value creation in manufacturing?
- Literature review - Development phase - Testing phase
Research Gap 4: there is a lack of studies regarding the understanding of maintenance values within these solution offerings and some research is still necessary on a systematic methodology that considers this value for product-service configurations in maintenance-related services
- Proposal of the value-driven design methodology that includes steps aiming at: > understanding customers’ contexts and operational desired values before service solution definition > using a rating AHP to prioritize operational values > proposing a value-driven FMEA as a tool for identifying the effects of failures on the operational values >supporting the selection of the most adequate service offering alternative according to customer’s values
156

9.2. IMPLICATIONS FOR PRACTITIONERS
This research came up with several implications for practitioners that consider both actors involved in the service provision, servitized manufacturers or service providers as well as industrial users. This section highlights the main implications giving a brief explanation, nevertheless details have been given in previous chapters regarding all results of this PhD research.
Implications for servitized manufacturers: The analysis done regarding the current practice on maintenance services in Italian manufacturing companies (section 3.5) brought out a set of interesting findings for service providers that can help them understand better their potential customers’ requirements and needs. Main issues are the following:
– The analysis of motivations for the acquisition of maintenance services indicates that the combination of two sets of motivations: the compliance with law / legislations together with the lack of internal competences and with the excellence of external competences are the first and second most frequent motivations revealed. This clearly suggests that the development of competences regarding service provider staff is key in order to succeed in service provision.
– The analysis of requirements pursued by manufacturing companies, i.e. the industrial customers, when acquiring maintenance services has been made considering each type of maintenance contract and also the total amount of maintenance contracts. Results revealed that technological knowledge and quality are the first and second most required characteristics of maintenance contracts in total. It is worth to note that technological knowledge obtains either the first or second top position for each type of contract, therefore, it can be suggested that there is an increasing need for high technological knowledge in maintenance service provision.
Chapter 6 studies the technological composition of technology-based maintenance services and proposes a value analysis method for the evaluation of the contribution of different tool categories to a set of predefined service value dimensions. Both results could be useful for servitized manufacturers willing to propose their customers a service solution that includes innovative tools or applications in several ways:
– The analysis of the new functionalities that the identified generic tool categories could provide to maintenance services according to the reviewed literature can serve as guidelines for practitioners to understand the type of technologies to be included in their service offerings in order to improve the pursued value dimensions.
– The flexibility of the proposed value analysis method permits to vary the value dimensions under evaluation (e.g. including accessibility of the provider or location) as well as the rating system, thus practitioners can adapt the method to their concrete needs.
Chapter 7 proposes a value-driven design methodology that could support servitized manufacturers to identify different solution alternatives adapted to their concrete customers’ contexts. This methodology could be used during the early stages of a contract agreement in order to set the service proposal and performance measures to be employed during the service provision. Moreover, the methodology itself could even be proposed as an initial service to their customers, which could be performed before the contract agreement or even without any contractual obligations on any further contract agreement. This is due to the observed benefits that this methodology can bring to the industrial customer as an analysis of the equipment impacting more on the desired operational values.
157

The service provider could use this analysis as a means to engage with the customer, which could be keener to contract further services once a small collaboration has been carried out between them.
This methodology could support servitized manufacturers along all stages of the product-service continuum, i.e. OEMs that enter performance-based contracts for the first time as well as MSPs that may have more experience in this type of contracts.
Concretely:
– The value-driven design methodology could support OEMs that have little idea regarding what to offer, to develop a sound service solution by using techniques that are available for them, such as the Rating AHP and the Value-driven FMEA. The AHP analysis can be supported by commercial tools, such as SuperDecisions software, that are available on-the-shelf. Moreover, the Value-driven FMEA is based on the FMEA technique that, as mentioned before, is often used by equipment manufacturers at the design stages of equipment, thus, it is probably an already known technique for them.
– The value-driven design methodology could also support more experienced servitized manufacturers and MSPs as a means to improve their service solutions based on actual customer’s needs. In this regard, understanding their customer’s desired operational values could give the service provider a set of goals to be used in their long-term contract offerings, thus, they could work towards them in the time given: 10 years, 25 years, etc.
Implications for industrial users: Chapter 4 has introduced the findings related to the nine exploratory case studies done to investigate the contribution of maintenance for more sustainable operations in manufacturing companies. Some concrete implications for users / owners of manufacturing equipment and facilities can be highlighted as the following:
– The role of maintenance as a contributor to company competitiveness could be enhanced addressing the aspects identified as main maintenance features related to business strategy (section 4.2.1). In particular, the findings inform on concrete contributions of maintenance to product competitiveness, innovation and quality, delivery punctuality, operational cost reduction, manufacturing flexibility and process innovation.
– The role of maintenance as a contributor to more sustainable operations have been identified as a three-dimensional theme, including sustainability, application subject and life cycle as its dimensions. Guidelines to understand and identify actions to be taken could be inferred from the summary of findings included in Table 4.2 and Table 4.3 (section 4.3).
Chapter 5 has introduced the proposal of the concept of Maintenance Business Model that could be useful for practitioners within manufacturing facilities as:
– An intermediate layer between maintenance strategy definition and execution: thus, it can represent an element for alignment between maintenance strategy and maintenance processes and for driving performance measurement potential technological innovations or investments towards the desired strategic maintenance goals,
– A means to represent value creation logic in maintenance function: it can describe the rationale of how maintenance value is created for all its stakeholders and how maintenance function captures value itself in terms of budget, incentives, feedback, etc. It could be also convenient for communicating choices and its consequences within the maintenance function to its stakeholders, such as contracting-out or outsourcing some tasks to key partners.
158

Furthermore, the value-driven design methodology proposed in chapter 7, although thought as a tool to support service providers, revealed to have interesting benefits for the industrial users during the testing case study. This methodology could serve industrial users as a means to assess whether the service solution offered fulfil their needs and to support the decision making process regarding the acquisition of performance-based maintenance services. However, the application of the Steps I and II of the methodology alone could be itself an interesting activity to be performed in a manufacturing plant. This analysis of the equipment based on the desired operational values could support a different perspective to classify critical equipment in the manufacturing plant.
9.3. LIMITATIONS The main limitations of this PhD research are described in the following related to the research done in order to address the research questions considered in this research:
SQ 1: What is the current approach regarding the acquisition of different maintenance services in manufacturing companies?
Limitations regarding the study of the current practice on maintenance services made by the realization of an exploratory survey are related to the origin of the data and the geographical limitation of respondents. The data used have been taken from a previous study done by TeSeM Observatory, thus, the character of the results are just exploratory and they are not strongly generalizable. This is also a limitation that regards the geographical distribution of respondents as the TeSeM survey concerns just manufacturing companies located in Italy. The particular economic context of this country in the last recent years, could drive some specific features in their current manufacturing industry.
SQ 2: How does maintenance function in manufacturing companies contribute to more sustainable manufacturing operations?
On the one hand, limitations related to the definition of the framework for maintenance value within sustainable manufacturing are related to the exploratory character of the study. Therefore, it results cannot be widely generalized but they serve as a starting point towards more robust theory building on this envisaged contribution of maintenance for sustainability.
On the other hand, the definition of the concept of MBM is mainly based on an analogy created with business literature regarding the connection between value creation and business models. It has been proved useful to map some findings from chapter 4, however, this do not prove all choices envisaged within the proposed categorizations in the elements of the MBM.
SQ 3: How can technological innovations contribute to enhance sustainable value in maintenance service provision?
The main limitation regarding the literature-based analysis on maintenance technologies applied to services is the restricted number of articles considered for some tools, such as augmented reality tools, which are recently increasing their application in industry but this seems not yet reflected in publications. Limitations regarding the explanatory survey on technologies for maintenance service provision fall on the characteristics of the sample as few respondents are from industry, thus the industrial perspective is not strongly considered in the analysis.
159

RQ: How can maintenance services contribute to sustainable value creation in manufacturing?
The main limitation of the proposal of the value-driven design methodology regards its testing phase, as it has been tested in a single case study. The particular conditions of this testing case has provided an adequate context for the first testing of the methodology, thus, proving its envisaged usefulness and the understanding of the proposed steps as defined so far. It is, however, limited in terms of generalizability of results as it was just tested in one industrial case.
9.4. OPPORTUNITIES & LINES FOR FUTURE RESEARCH Taken this PhD research findings as a starting point, some opportunities for further research can be highlighted. Some ideas for new lines of research that can come out of this PhD research, either to overcome the limitations presented in previous section or to broaden the scope in new directions, are explained next.
Regarding the study of current practice on maintenance services, it can be noted that the results of the exploratory survey, that was done using data from a previous study of TeSeM Observatory, could serve to make an ad-hoc survey for a study that investigates in-depth the actual opportunities and challenges of maintenance services in different contextual situations. A cross-country study is advisable in order to minimize the effects of a concrete country situation.
The study of maintenance contribution to sustainable manufacturing is an exploratory study that can be taken as a starting point for further research in this direction. Different approaches could be followed in this regard, some suggestions are the following:
– The range of research could be widened in order to consider a larger number of companies. A survey research method could be adequate in this regard. Special attention should be paid to including questions to define characteristics of the different sectors and types of production, as differences between sectors and types of operations were suggested by research findings.
– Another approach for further research could deepen in a concrete sector or a concrete dimension within the framework proposed in order to reach higher details of the findings. This could be appropriate to be done by a multiple-case research method including several companies within a sector or with similar production systems.
The proposal of the MBM concept presented in chapter 5 could be used as ground for further research regarding several lines of research:
– Empirical case studies could be performed in order to further develop the robustness of the MBM concept in industry. It would be interesting to consider how the value creation logic varies in different sectors for the same type of value added by maintenance function.
– Further research could also focus on the components of the MBM, i.e. on understanding of their categories and priorities depending on different application scenarios (industrial sector, company size, type of production facilities, geographical distribution, etc.).
Regarding the findings of chapter 6, three types of potential uses have been envisaged for the value analysis method. Further research could explore the third suggested use of the method that aims at analyzing how much a complete service solution fulfils the desired levels for the value dimensions pursued by the industrial user and / or the service provider. Case study research would be the suggested research method for this line of research.
160
Moreover, the study on the contribution of maintenance technologies to service provision under the perspective of the potential value dimensions of maintenance services considers the technological choices that a provider could made for the provision of services. However, the customer perspective is unexplored in this study. In this sense, it could be interesting to investigate whether the industrial users are also required to make technological changes while acquiring industrial services in order to obtain the highest added-value for their processes, i.e. to analyze which are the consequences of the acquisition of technology-based maintenance services for industrial user’s own production processes.
Finally, further research regarding the value-driven design methodology could address two aspects:
The first aspect regards the test of the value-driven design methodology in other cases as the testing case done so far offered a concrete scenario, which involved a service provider that has long experience as maintenance service provider and an industrial user in a concrete sector and production system that has minimal impact on some sustainability aspects. It would be then interesting to test the methodology in the case of a service provider that is an OEM recently entering in the servitization trend to understand whether the results of the application of the methodology are similar to the obtained results in the testing case presented here. Moreover, it could be interesting also to study other contexts from the industrial user perspective, either varying the industrial sector or the type of production systems in the same sector. Therefore, this envisaged broaden study could be done by using a multiple-case case study research method.
The second aspect concerns the enlargement of the scope in the value-driven design methodology by incorporating steps addressing the service delivery planning in terms of workforce and material resources planning. As mentioned by Kumar et al. (2013), it is key to have adequate support for both maintenance planning and maintenance execution in service provision, as it would enhance the achieved level of maintenance performance. These possible new steps could deepen on decisions to be taken by the service provider considering the provider’s representation personnel at industrial user’s site (e.g. a team, a service representative or neither of them), team size and training, and spare parts location and planning. This could also represent an attempt to integrate scheduling and inventory choices within the performance-based service in order to improve the efficiency of service provider’s activities and its internal performance. In this regard, a simulation study could be adequate for this new research line as it can be used to test how the performance of the service system can be altered under different planning choices and different operating conditions.
161

REFERENCES ABB (2008) – ABB Review. Special Report on Process Automation Services & Capabilities
Abernathy W. J. & Clark, K. B. (1985). Innovation: mapping the winds of creative destruction. Research policy, 14, 3-22.
Acharya, P., Pfrommer, C. & Zirbel, C. (1995). Think value engineering, Journal of management in engineering, 11(6), 13-17
Achenbach, J. D. (2000). Quantitative non-destructive evaluation. International Journal of Solids and Structures, 37, 13-27.
Adgar, A., Addison, D. & Yau, C-Y. (2007). Applications of RFID technology in maintenance systems. In: Proceedings of the second World Congress on Engineering Asset Management (WCEAM).
AENOR. Norma UNE-EN 13306: Terminología De Mantenimiento; 2002.
Agnihothri, S., Sivasubramaniam, N. & Simmons, D. (2002). Leveraging technology to improve field service. International Journal of Service Industry Management, 13(1), 47-68.
Ahuja, I.P.S. & Khamba, J.S. (2008). Assessment of contributions of successful TPM initiatives towards competitive manufacturing. Journal of Quality in Maintenance Engineering, 14 (4), 356-374
Ahuja, I.P.S. & Khamba, J.S. (2009). Investigation of manufacturing performance achievements through strategic total productive maintenance. International Journal of Productivity and Quality Management, 4 (2), 129-152
Ahuja, P.S. (2009). Total Productive Maintenance. Handbook of Maintenance Management and Engineering, M.Ben-Daya, S..O. Duffuaa, A. Raouf, J. Knezevic, D. Ait-Kadi (Eds), 417-459
Al-Debei, M.M. & Avison, D. (2010). Developing a unified framework of the business model concept. European Journal of Information Systems, 19, 359–376.
Ali-Marttila, M., Tynninen, L., Marttonen, S. & Kärri, T. (2013). Solving the value puzzle of the customer and service provider in industrial maintenance services. Proceedings of the Maintenance Performance Measurement and Management Conference, S. Monto, M. Pirttilä, T. Kärri (editors), 234-248.
Allee, V. (2000). Reconfiguring the value network. Journal of Business strategy, 21(4), 36-39.
Allee V. (2008). Value network analysis and value conversion of tangible and intangible assets. Journal of Intellectual Capital, 9(1), 5-24.
Allee, V. (2011). Value Networks and the true nature of collaboration. Online Edn, Value Networks and Verna Allee Associates.
Allmendinger, G. & Lombreglia, R. (2005). Four strategies for the age of smart services, Harvard Business Review, 83(10), 131
Alonso-Rasgado, T., Thompson, G. & Elfstrm, B. (2004). The design of functional (total care) products, Journal of Engineering Design, 15(6), 515-540
Alsyouf, I. (2006). Measuring maintenance performance using a balanced scorecard approach, Journal of Quality in Maintenance Engineering, 12(2), 133-149.
Alsyouf, I. (2007). The role of maintenance in improving companies’ productivity and profitability, International Journal of Production Economics, 105, 70-78.
162

Al-Turki, U. (2011). A framework for strategic planning in maintenance, Journal of Quality in Maintenance Engineering, 17(2), 150-162.
Amit, R. and Zott, C. (2001). Value creation in e-business, Strategic Management Journal, 22, 493–520.
Andijani, A.A. & Duffuaa, S.O. (2002). Critical evaluation of simulation studies in maintenance systems, Production Planning & Control: The Management of Operations, 13(4), 336-341.
Arena, M., Duque Ciceri, N., Terzi, S., Bengo, I., Azzone, G., & Garetti, M. (2009). A state-of-the-art of industrial sustainability: Definitions, tools and metrics, International Journal of Product Lifecycle Management, 4(1-3), 207-251.
Armbrust, M., Fox, A., Griffith, R., Joseph, A. D., Katz, R., Konwinski, A., ... & Zaharia, M. (2010). A view of cloud computing. Communications of the ACM, 53(4), 50-58.
Arts, R.H.P.M., Knapp, G.M. and Mann Jr. L. (1998), Some aspects of measuring maintenance performance in the process industry, Journal of Quality in Maintenance Engineering, 4(1), 6-11.
Aurich, J.C., Fuchs, C. & Wagenknecht, C. (2006). Life cycle oriented design of technical Product-Service Systems. Journal of Cleaner Production, 14, 1480-1494
Baines T.S., Lightfoot H.W., Benedettini O. & Kay J.M. (2009). The servitization of manufacturing: A review of literature and reflection on future challenges, Journal of Manufacturing Technology Management, 20(5), 547-567.
Baines, T., Lightfoot, H., Peppard, J., Johnson, M., Tiwari, A., Shehab, E. & Swink, M. (2009). Towards and operations strategy for product-centric servitization, International Journal for Operations and Production Management, 29 (5), 494-519.
Baines, T., Lightfoot, H. & Smart, P. (2011). Servitization within manufacturing: Exploring the provision of advanced services and their impact on vertical integration. Journal of Manufacturing Technology Management, 22(7), 947 – 954.
Baines, T.S., Lightfoot, H.W., Evans, S., Neely, A., Greenough, R., Peppard, J., Roy, R., Shehab, E., Braganza, A., Tiwari, A., Alcock, J.R., Angus, J.P., Bastl, M., Cousens, A., Irving, P., Johnson, M., Kingston, J., Lockett, H., Martinez, V., Michele, P., Tranfield, D., Walton I.M. & Wilson, H. (2007), State-of-the-art in product-service systems, IMechE Proc. IMechE Vol. 221 Part B: J. Engineering Manufacture.
Barile, S. and Polese, F. (2010). Smart service systems and viable service systems: applying systems theory to service science, Service Science, 2 (1/2), 21-40.
Barlow, C. (2004). Towards industrial sustainability. IEE Manufacturing Engineer, www.iee.org/manufacturingmagazine
Barquet, A. P. B., Cunha, V. P., Oliveira, M. G., & Rozenfeld, H. (2012). Business Models for Product-Service Systems (PSS): An Exploratory Study in a Machine Tool Manufacturer. In Sustainable Manufacturing, 189-194. Springer Berlin Heidelberg.
Bask, A.H., Tinnilä, M. & Rajahonka, M. (2010). Matching service strategies, business models and modular business processes, Business Process Management Journal, 16(1), 153-180.
Bechthold, T., Von Colln, H. & Hahn, W. (2009). Sustainable and successful maintenance management. Euroheat and Power, 6 (1), 24-27.
Bertolini, M., Bevilacqua, M., braglia, M. & Frosolini, M. (2004). An analytical method for maintenance outsourcing service selection, International Journal of Quality & Reliability Management, 21(7), 772-788.
163

Ben-Daya, M. (2009). Failure Modes and Effect Analysis, in Handbook of Maintenance Management and Engineering, M.Ben-Daya, S..O. Duffuaa, A. Raouf, J. Knezevic, D. Ait-Kadi (Eds), 75-90.
Björklund, M., Martinsen, U. & Abrahamsson, M. (2012). Performance measurements in the greening of supply chains, Supply Chain Management: An International Journal, 17(1), 29–39.
Blank, S. (2013). Why the lean start-up changes everything. Harvard Business Review, 91(5), 63-72.
Brax, S. (2005). A manufacturer becoming service provider – challenges and a paradox, Managing Service Quality, 15(2), 142-155.
Brax, S.A. & Jonsson, K. (2009). Developing integrated solution offerings for remote diagnostics. A comparative case study of two manufacturers, International Journal of Operations and Production Management, 29(5), 539-560.
Brundtland Commission. (1987). Our common future, Report of the World Commission on Environment and Development (WCED). Oxford University Press, Oxford.
Bryman, A. (1992). Quantitative and qualitative research: further reflections on their integration. Mixing methods: Qualitative and quantitative research.
Buse, C., Freiling, J. & Weisenfels, S. (2001). Turning product business into service business: Performance contracting as a challenge of SME customer / supplier networks, Paper presented at the 17th Annual IMP Conference in Oslo/Norway.
Cakmakci, M. & Karasu, M.K. (2007). Set-up time reduction process and integrated predetermined time system MTM-UAS: A study of application in a large size company of automobile industry, International Journal of Advanced Manufacturing Technology, 33 (3-4), 334-344.
Campbell, J. D. (1995). Outsourcing in maintenance management: a valid alternative to self-provision. Journal of Quality in Maintenance Engineering, 1(3), 18-24.
Campbell, S. (1996). Green cities, growing cities, just cities? Urban planning and the contradictions of sustainable development. Journal of American Planning Association, 62(3), 296-312.
Campos, J. (2009). Development in the application of ICT in condition monitoring and maintenance, Computers in Industry, 60, 1–20
Carbonell, P., Rodriguez-Escudero, A.I. & Pujari, D. (2009). Customer involvement in new service development: an examination of antecedents and outcomes, Journal of Product Innovation Management, 26, 536-550.
Carnero, M.C. (2005). Selection of diagnostic techniques and instrumentation in a predictive maintenance program. A case study, Decision Support Systems, 38, 539– 555.
Carvalho, A., Gani, R. & Matos, H. (2008). Design of sustainable chemical processes: systematic retrofit analysis generation and evaluation of alternatives. Process Safety and Environmental Protection, 86 (5), 328-346.
Casadesus-Masanell, R. & Ricart, J.E. (2010). From Strategy to Business Models and onto Tactics, Long Range Planning, 43(2-3), 195-215.
Cassanelli, G., Mura, G., Fantini, F., Vanzi, M. & Plano, B. (2006). Failure Analysis-assisted FMEA, Microelectronics Reliability, 46, 1795–1799.
Chase R. (1981). The customer contact approach to services: theoretical bases and practical extensions. Operations Research, 24(4), 698–706.
164
Chesbrough, H. & Rosenbloom, R. S. (2002). The role of the business model in capturing value from innovation: evidence from Xerox Corporation’s technology spin-off companies, Industrial and Corporate Change, 11(3), 529-555.
Cholasuke C, Bhardwa R & Antony J. (2004). The status of maintenance management in UK manufacturing organisations: Results from a pilot survey, Journal of Quality in Maintenance Engineering, 10(1), 5-15.
Colen, P.J. & Lambrecht, M.R. (2012). Cross-training policies in field services. International Journal of Production Economics, 138, 76-88
Colicchia, C., Marchet, G., Melacini, M. & Perotti, S. (2013). Building environmental sustainability: empirical evidence from logistics service providers. Journal of Cleaner Production, 59, 197-209.
Cook, M.B., Bhamra, T.A. & Lemon, M. (2006). The transfer and application of Product Service Systems: from academia to UK manufacturing firms. Journal of Cleaner Production, 14, 1455-1465.
Corti, D., Holgado Granados, M., Macchi, M. & Canetta, L. (2013). Service-oriented business models for agricultural machinery manufacturers: looking forward to improving sustainability, IEEE International Technology Management Conference and 19th ICE Conference, 24-26 June 2013, the Hague, The Netherlands.
Crespo Márquez, A. (2007). The maintenance management framework: models and methods for complex systems maintenance, Springer Series in Reliability Engineering, Springer-Verlag London.
Crespo Márquez, A & Gupta, J.N.D. (2006). Contemporary maintenance management: process, framework and supporting pillars, Omega, 34, 313-326.
Crespo Márquez, A. & Iung, B. (2007). A structured approach for the assessment of system availability and reliability using Monte Carlo simulation. Journal of Quality in maintenance Engineering, 13 (2), 125-136.
Crespo Márquez, A. & B. Iung, (2008). A Review of e-Maintenance Capabilities and Challenges, Journal of Systemics, Cybernetics and Informatics, 6, 62-66.
Crespo Márquez, A., Moreu de León P., Gómez Fernández J., Parra Márquez C. & López Campos M. (2009). The maintenance management framework: A practical view to maintenance management, Journal of Quality in Maintenance Engineering, 15(2), 167-178.
Coetzee, J. L. (1997). Towards a general maintenance model. Proceedings of IFRIM ‘97, 1-9.
Cunha, P. F., Duarte, J. A., & Alting, L. (2004). Development of a productive service module based on a life cycle perspective of maintenance issues. CIRP Annals-Manufacturing Technology, 53(1), 13-16.
Čuček, L., Klemeš, J.J. & Kravanja, Z. (2012). A Review of Footprint analysis tools for monitoring impacts on sustainability. Journal of Cleaner Production, 34, 9-20.
Darnall, N., Jolley, G.J. & Handfield, R. (2008). Environmental Management Systems and Green Supply Chain Management: Complements for Sustainability?, Business Strategy and the Environment, 18, 30–45.
Datta, P.P. & Roy, R. (2010). Cost modelling techniques for availability type service support contracts: A literature review and empirical study, CIRP Journal of Manufacturing Science and Technology , 3, 142–157.
165

Datta, P.P. & Roy, R., (2011). Operations strategy for the effective delivery of integrated industrial product-service offerings: Two exploratory defence industry case studies, International Journal of Operations & Production Management, 31(5), 579 – 603.
De Crescenzio, F., Fantini, M., Persiani, F., Di Stefano, L., Azzari, P. & Salti, S. (2011). Augmented Reality for Aircraft Maintenance Training and Operations Support, IEEE Computer Graphics and Applications, 31(1), 96-101.
De Groote, P. (1995). Maintenance performance analysis: a practical approach, Journal of Quality in Maintenance Engineering, 1(2), 4 – 24.
Demirbas, A. (2008). Energy issues and energy priorities. Energy sources, Part B: Economics, Planning and Policy, 3 (1), 41-49.
DeSimone, L. D., & Popoff, F. with the World Business Council for Sustainable Development. (1997), Eco-efficiency: the business link to sustainable development. MIT Press, Cambridge,
Den Ouden, E. (2012). Innovation Design. Creating value for people, organizations and society. Springer-Verlag, London
Department of Commerce (DOC), United States. (2008). How does Commerce Define Sustainable Manufacturing? http://www.trade.gov/competitiveness/sustainablemanufacturing/how_doc_defines_SM.asp.
Despeisse, M., Mbaye, F., Ball, P.D., Levers, A. 2012. The emergence of sustainable manufacturing practices. Production Planning & Control: The Management of Operations, 23 (5), pp. 354-376
Dey, I. (1993). Qualitative Data Analysis. A User-Friendly Guide for Social Scientists. Routledge, London.
Dillon, T., Wu, C. & Chang, E. [2010). Cloud computing: issues and challenges, 24th IEEE International Conference on Advanced Information Networking and Applications, 27-33.
Duffuaa, S. O. & Haroun, A. E. (2009). Maintenance control, in Handbook of Maintenance Management and Engineering, M.Ben-Daya, S..O. Duffuaa, A. Raouf, J. Knezevic, D. Ait-Kadi (Eds), 93-114.
Duffuaa, S.O., Ben-Daya, M., Al-Sultan, K.S. & Andijani, A.A. (2001). A generic conceptual simulation model for maintenance systems. Journal of Quality in Maintenance Engineering, 7 (3), 207 – 219.
Duran, O. (2011). Computer-aided maintenance management systems selection based on a fuzzy AHP approach, Advances in Engineering Software, 42, 821-829.
Elkington, J. (1997). Cannibals with Forks. The triple bottom line of 21 st century business. Oxford, UK: Capstone Publishing Ltd.
EMAS III Regulation. (2009). Regulation (EC) No 1221/2009 of the European Parliament and of the Council of 25 November 2009 on the voluntary participation by organisations in a Community eco-management and audit scheme (EMAS).
Emmanouilidis C., Liyanage J.P. & Jantunen E. (2009). Mobile solutions for engineering asset and maintenance management. Journal of Quality in Maintenance Engineering, 15 (1), 92-105.
EN 13306: 2010. (2010). Maintenance Terminology. European standards. CEN (European Committee for Standardization). Brussels.
Evans, S., Bergendahl, M.N., Gregory, M., & Ryan, C. (2009). Towards a sustainable industrial system – with recommendations for education, research, industry and policy. Cambridge, UK: University of Cambridge, Institute for Manufacturing, Department of Engineering (available at: http://www.ifm.eng.cam.ac.uk/sis/industrial_sustainability_report.pdf).
166

Evans, S., Partidario, P. &Lambert, J. (2007). Industrialization as a key element of sustainable product-service solutions, International Journal of Production Research, 45(18–19), 4225–4246.
Fahrmeir, L., Künstler, R., Pigeot, I. & Tutz, G. (2004), Statistik: Der Weg zur Datenanalyse, 5th ed., Springer, Berlin, Heidelberg, New York.
Feng, S.C. & Joung, C.B. (2011). A measurement infrastructure for sustainable manufacturing. International Journal of Sustainable Manufacturing, 2 (2-3), 204-221.
Finke, G.R., Hertz, P. & Schonsleben, P. (2012). Industrial field service network performance measurement Performance dimensions and indicators for service providers, Service Systems and Service Management (ICSSSM), 2012 9th International Conference on , 499,504.
Flick, U. (2007). Designing qualitative research. Sage Publications.
Forza, C. (2002). Survey research in operations management: a process-based perspective. International Journal of Operations & Production Management, 22(2),152 – 194.
Foster, I., Zhao, Y., Raicu, I. & Lu, S. (2008). Cloud computing and grid computing 360-degree compared, Grid Computing Environments Workshop, GCE '08, 1-10.
Freeman, R.E. (1984). Strategic Management: A Stakeholder Approach. Boston: Pitman.
Frishammar, J., Kurkkio, M., Abrahamsson, L., & Lichtenthaler, U. (2012). Antecedents and consequences of firms' process innovation capability: a literature review and a conceptual framework. IEEE Transactions on Engineering Management, 59(4), 519-529.
Fumagalli, L., Garetti, M., Macchi, M. (2008). Investigating Business Models when adopting new ICT systems for condition based maintenance: a case study analysis, Fifteenth International Working Seminar on Production Economics, Innsbruck, Austria, 209-219.
Gaiardelli, P., Saccani, N. & Songini, L. (2007). Performance measurement systems in after-sales service: an integrated framework. International Journal of Business Performance Management, 9(2), 145-171.
Garetti, M .& Taisch, M. (2012). Sustainable manufacturing: trends and research challenges, Production Planning and Control, 23(February-March), 83-104.
Garetti, M., Macchi, M., Fumagalli, L. & Terzi, S. (2007). Investigating the organizational business models of maintenance when adopting self diagnosing and self healing ICT systems in multi-site contexts, Proceedings of IFAC Conference on Cost Effective Automation in Networked Product Development and Manufacturing, Monterrey, Mexico
Garetti, M. (2011). Maintenance for sustainable manufacturing. The 1st MaintWorld Congress, Helsinki.
Garg, A. & Deshmukh, S.G. (2006). Maintenance management: Literature review directions, Journal of Quality in Maintenance Engineering, 12 (3), 205-238.
George, G. & Bock, A.J. (2011). The Business Model in Practice and its Implications for Entrepreneurship Research, Entrepreneurship theory and practice, January, 1042-2587.
GERAM (Generalised Enterprise Reference Architecture and Methodology) v1.6.3. 1999, IFIP-IFAC Task Force on Architectures for Enterprise Integration. Creative Commons CC.
Geum, Y., Lee, S., Kang, D. & Park, Y. (2011). Technology roadmapping for technology-based product- service integration: A case study. Journal of Engineering and Technology Management, 29 (3), 128-146
167

Gillen, K.T., Celina, M. & Clough, R.L. (1999). Density measurements as a condition monitoring approach for following the aging of nuclear power plant cable materials, Radiation Physics and Chemistry, 56, 429-447.
Global Reporting Initiative, G3.1 guidelines (2000-2011) version 3.1 available at: [https://www.globalreporting.org/resourcelibrary/G3.1-Guidelines-Incl-Technical-Protocol.pdf]
Goddard, N.D.R., Kemp, R.M.J. & Lane, R. (1997). An overview of smart technology, Packaging technology and science, 10, 129-143.
Goedkoop, M., van Haler, C., te Riele, H. & Rommers, P. (1999), Product Service-systems, Ecological and Economic Basics, Pre Consultants, The Hague. Report for Dutch Ministries of Environment (VROM) and Economic Affairs (EZ).
Gómez Fernández, J.F & Crespo Márquez, A. (2012). Maintenance Management in Network Utilities. Framework and Practical Implementation. Springer Series in Reliability Engineering. Springer-Verlag
Gómez Fernández, J.F., Fumagalli, L., Macchi, M. & Crespo Márquez, A. (2008). A score card approach to investigate the IT in the Maintenance Business Models, MITIP 2008, Prague, Czech Republic, .
Gouriveau, R., Medjaher, K. (2011). Industrial prognosis – An overview, In: Maintenance Modelling and Applications, John Andrews, Christophe Berenguer, Lisa Jackson, (Eds.), Det Norske Veritas, Høvik, 10-30.
Greenhalgh, T., & Peacock, R. (2005). Effectiveness and efficiency of search methods in systematic reviews of complex evidence: audit of primary sources. Bmj, 331(7524), 1064-1065.
Grubic, T. (2014). Servitization and remote monitoring technology. A literature review and research agenda, Journal of Manufacturing Technology Management, 25, 100-124.
Guo, L. & Ng, I. (2011). The co-production of equipment-based services: An interpersonal approach, European Management Journal, 29, 43– 50.
Hair, J.F. Jr, Anderson, R.E., Tatham, R.L. & Black, W.C. (1992), Multivariate Data Analysis, Maxwell Macmillan, New York, NY
Han, T. & Yang, B-S. (2006). Development of an e-maintenance system integrating advanced techniques, Computers in Industry, 57, 569–580
Hart, S.L. & Milstein, M.B. (2003). Creating sustainable value, Academy of Management Executive, 17(2),56-69.
Hedman, J. & Kalling, T. (2003). The business model concept: theoretical underpinnings and empirical illustrations, European Journal of Information Systems, 12, 49–59.
Hervani, A.A., Helms, M.M. & Sarkis, J. (2005). Performance measurement for green supply chain management. Benchmarking: An International Journal, 12(4), 330-353.
Herrmann, C., Zein, A., Thiede, S., Bergmann, L. & Bock, R. (2008). Bringing sustainable manufacturing into practice – the machine tool case, Sustainable Manufacturing VI: Global Conference on Sustainable Product Development and Life Cycle Engineering, Pusan, Korea, 2008
Hewitt, P. (2002). The government’s manufacturing strategy. Secretary of State for Trade and Industry, available at: www.dti.gov.uk/manufacturing
Holbrook, M. B. (1994). The nature of customer value. In R. T. Rust, & R. L. Oliver (Eds.), Service Quality: New Directions in Theory and Practice , Thousand Oaks, California: Sage Publications, 21–71.
168
Holgado, M., Donatella, C., Macchi, M., Rana, P., Short, S. & Evans, S. (2013). Business Modelling for Sustainable Manufacturing. Competitive Manufacturing for Innovative Products and Services: Proceedings of the APMS 2012 Conference, Advances in Production Management Systems, Emmanouilidis, C., Taisch, M., & Kiritsis, D. (editors).
Hui, S.C., Fong, A.C.M. & Jha, G. (2001). A web-based intelligent fault diagnosis system for customer service support, Engineering applications of artificial intelligence, 14, 537-548.
Hypko, P., Tilebein, M. & Gleich, R. (2010a). Benefits and uncertainties of performance-based contracting in manufacturing industries. An agency theory perspective, Journal of Service Management, 21(4), 460-489.
Hypko, P., Tilebein, M. & Gleich, R. (2010b), Clarifying the concept of performance-based contracting in manufacturing industries, Journal of Service Management, 21(5), 625 – 655.
IEA. 2008. Worldwide Trends in Energy Use and Efficiency. Key Insights from IEA Indicator Analysis. International Energy Agency (IEA). Paris, France.
ISO 14001:2004. (2004). Environmental Management System
ISO 14031:1999. (1999). Environmental Performance Evaluation.
ISO 15431:2007. (2007). Maintenance Key Performance Indicators.
ISO 26000:2010. (2010), Guidance on social responsibility.
ISO 50001:2011. (2011). Energy management Systems – Requirements with guidance for use.
Iung, B., Levrat, E., Crespo Márquez, A. & Erbe, H. (2009). Conceptual framework for e-Maintenance: Illustration by e-Maintenance technologies and platforms, Annual Reviews in Control, 33, 220–229.
Iung, B., Levrat, E., Crespo Marquez, A. & Erbe, H. (2007), E-maintenance: Principles, review and conceptual framework, IFAC Proceedings Volumes (IFAC-PapersOnline), 1, 18-29.
Jackson, C. & Pascual, R. (2008). Optimal maintenance service contract negotiation with aging equipment, European Journal of Operational Research, 189, 387–398.
Jardine, A.K.S., Lin, D. & Banjevic, D. (2006), A review on machinery diagnostics and prognostics implementing condition-based maintenance, Mechanical Systems and Signal Processing, 20, 1483–1510.
Jawahir, I.S., Dillon Jr O.W. (2007). Sustainable Manufacturing Processes: New Challenges for Developing Predictive Models and Optimization Techniques, in: Proceedings of the 1st International Conference on Sustainable Manufacturing (SM1), Montreal, Canada.
Jayal, A.D., Badurdeen, O.W., Dillon, Jr., Jawahir, I.S. (2010). Sustainable manufacturing: Modeling and optimization challenges at the product, process and system levels. CIRP Journal of Manufacturing Science and Technology, 2 (2010), 144–152.
Jin, T., Nalajala, N. & Jimenez, J.A. (2011). A multi-criteria approach for performance based maintenance with variable fleet size, Reliability, Maintainability and Safety (ICRMS), 2011 9th International Conference on, 12-15 June 2011, 909-914.
Johansson, P. & Olhager, J. (2004). Industrial service profiling: matching service offerings and processes. International Journal of Production Economics, 89, 309-320.
Johnston, W. J., Leach, M. P., & Liu, A. H. (1999). Theory testing using case studies in business-to-business research. Industrial Marketing Management, 28(3), 201-213.
169

Joung, C.B., Carrell, J., Sarkar, P., Feng, S.C. (2012). Categorization of indicators for sustainable manufacturing. Ecological Indicators, 24 (2012), 148–157.
Jovane, F., Yoshikawa, H. Alting, L., Boer, C.r., Westkamper, E., Williams, D., Tseng, M., Seliger, G. & Paci, A.M. (2008). The incoming global technological and industrial revolution towards competitive sustainable manufacturing. CIRP Annals - Manufacturing Technology, 57 (2008), 641–659.
Karim, R., Soderholm, P. & Candell, O. (2009). Development of ICT-based maintenance support services, Journal of Quality in Maintenance Engineering, 15(2), 127-150.
Kaur, M., Singh, K & Ahuja, I.S. (2013). An evaluation of the synergic implementation of TQM and TPM paradigms on business performance. International journal of productivity and performance management, 62 (1), 66-84.
Kelly, A. (1997). Maintenance Organization and Systems: Business- centred Maintenance, Butterworth-Heinemann, Oxford.
Kiritsis, D. Bufardi, A. & Xirouchakis, P. (2003). Research issues on product lifecycle management and information tracking using smart embedded systems, Advanced Engineering Informatics, 17 (2003), 189–202.
Komonen, K. & Despujols, A. (2013). Maintenance within physical asset management: A standardization project within CEN TC319. COMADEN, 11-13 June, Helsinki.
Koç, M., Ni, J., Lee, J. & Bandyopadhyay, P. (2005). Introduction to e-manufacturing. In: The Industrial information technology handbook. Ed: Zurawski, R. Industrial Electronics Series
Kumar, U., Galar, D., Parida, A., Stenström, C., & Berges, L. (2013). Maintenance performance metrics: a state-of-the-art review. Journal of Quality in Maintenance Engineering, 19(3), 233-277.
Kumar, R. Panesar, S.S. & Markeset, T. (2009). Development of technical integrity management services – a concept, Journal of Quality in Maintenance Engineering, 15(3), 271-284.
Kumar R., Markeset T. & Kumar U. (2004). Maintenance of machinery – Negotiating service contracts in business-to-business marketing. International Journal of Service Industry Management, 15 (4), 400-413.
Kumar, U. (2008). System Maintenance: Trends in Management and Technology, in Handbook of Performability Engineering, K. B. Misra, Ed. Springer London, 773-787.
Kumar, R., & Kumar, U. (2004). A conceptual framework for the development of a service delivery strategy for industrial systems and products. Journal of Business & Industrial Marketing, 19(5), 310-319.
Kurada, S. & Bradley, C. (1997). A review of machine vision sensors for tool condition monitoring, Computers in industry, 34, 55-72.
Kutucuoglu, K. Y., Hamali, J., Irani, Z., & Sharp, J. M. (2001). A framework for managing maintenance using performance measurement systems. International Journal of Operations & Production Management, 21(1/2), 173-195.
Laine, T., Paranko, J., Varila, M. & Suomala, P. (2005). Diffusion of industrial services: is it another story?,” In: proceedings of the IEEE engineering management society conference, 1, 363-368.
Lay, G., Schroeter, M. & Biege, S. (2009). Service-based business concepts: A typology for business-to-business markets. European Management Journal, 27, 442–455.
170

Lazarus, E. (1997), The Application of Value-Driven Decision-Making in Air Combat Simulation. Computational Cybernetics and Simulation., IEEE International Conference on , 3, 2302-2307.
Lee, J. & AbuAli, M. (2009). Intelligent Maintenance Systems Next 5 Years and Beyond: Transforming Condition-based Maintenance to Productivity and Service Innovation, Keynote Paper, 22th International COMADEM Conference.
Lee, J. (2001). A framework for Web-enabled e-maintenance systems, Environmentally Conscious Design and Inverse Manufacturing. In: Proceedings EcoDesign 2001,450-459.
Lee, J. (2003). E-manufacturing—fundamental, tools, and transformation. Robotics and Computer Integrated Manufacturing, 19, 501–507.
Lee, J., & Lapira, E. (2013). Predictive Factories: The Next Transformation, Manufacturing Leadership Journal, Feb. 2013 Issue. Frost Sullivan
Lee, J., Ghaffari, M. & Elmeligly, S. (2011). Self-maintenance and enginering inmune systems: towards smarter machines and manufacturing systems. Annual Reviews in Control, 35, 111-122.
Lee, J., Ni, J., Djurdjanovic, D., Qiu, H. & Liao, H. (2006). Intelligent prognostics tools and e-maintenance, Computers in Industry, 57, 476–489.
Lee, J.H., Shin, D.I. & Hong, Y.S. (2011). Business Model Design Methodology for Innovative Product-Service Systems: A Strategic and Structured approach. Annual SRII Global Conference, 663-673
Legnani, E. (2011). Controlling and improving the provision of after-sales services, PhD thesis, Facoltà di Economia, Università degli Studi di Bergamo Bergamo, 2011.
Lepak, D. P., Smith, K. G., & Taylor, M. S. (2007). Value creation and value capture: a multilevel perspective. Academy of management review, 32(1), 180-194.
Levrat, E., Iung, B. & Crespo Márquez, A. (2008). E-maintenance: review and conceptual framework, Production Planning and Control, 19(4), 408-429.
Lewis M. H. (1998). Iterative triangulation: a theory development process using existing case studies, Journal of Operations Management, 16, 455-469.
Lightfoot, H., Baines, T., & Smart, P. (2013). The servitization of manufacturing: A systematic literature review of interdependent trends. International Journal of Operations & Production Management, 33(11/12), 1408-1434.
Lindgreen, A., & Wynstra, F. (2005). Value in business markets: What do we know? Where are we going? Industrial Marketing Management, 34(7), 732–748.
Lindgreen, A., Hingley, M.K., Grant, D.B. & Morgan, R.E. (2012). Value in business and industrial marketing: Past, present, and future. Industrial Marketing Management, 41 (2012), 207–214.
Liyanage, J.P. (2007). Operations and maintenance performance in production and manufacturing assets: the sustainability perspective. Journal of Manufacturing Technology Management, 18 (3), 304-314.
Liyanage, J.P. & Kumar, U. (2003). Towards a value-based view on operations and maintenance performance management, Journal of Quality in Maintenance Engineering, 9(4), 333-350.
López Campos, M. & Crespo Márquez, A. (2009). Review, classification and comparative analysis of maintenance management models, Journal of Automation, Mobile Robotics and Intelligent Systems, 3(3), 110-115.
171

Luczak, H., Gill, C., Sander, B. (2007). Architecture for service engineering – the design and development of industrial service work, in: Advances in Services Innovations, Springer, Berlin/Heidelberg, 47–63.
Lüdeke-Freund, F. (2010). Towards a conceptual framework of business models for sustainability. Knowledge Collaboration & Learning for Sustainable Innovation ERSCP-EMSU conference, Delft, The Netherlands.
Lujing , Y., Ke, X. & Sang-Heon, L. (2010). Framework for PSS from Service’ Perspective. Proceedings of the International MultiConference of Engineers and Computer Scientists. Vol III IMECS 2010, March 17-19, Hong Kong.
Macchi, M., Barberá Martínez, L. Crespo Márquez, A., Holgado Granados, M. & Fumagalli, L. (2012). Value assessment of an E-maintenance platform. 2nd Workshop on Advanced Maintenance Engineering, Services and Technology (AMEST 2012). 22-23 November 2012, Sevilla, Spain
Macchi, M., Crespo Márquez, A., Holgado, M., Fumagalli, L. & Barberá Martínez, L. (2014). Value driven engineering of E-maintenance platforms. Journal of Manufacturing Technology Management. Special issue on Advanced Maintenance Engineering, Services and Technology, 25(4), 568-598.
Magretta, J. (2002). Why business models matter, Harvard Business Review, 80(5), 86–92.
Magretta, J. (1997). Growth through global sustainability, An interview with Monsanto’s CEO, Robert B. Shapiro, Harvard Business Review, 75 (1), 78–88.
MANUFUTURE. 2004. A vision for 2020. Assuring the future of manufacturing in Europe . ISBN 92-894- 8322-9, http://www.manufuture.org [Accessed 1 April 2011].
Marais, K.B., Saleh, J.H. (2009). Beyond its cost, the value of maintenance: an analytical framework for capturing its net present value, Reliability Engineering and System Safety, 94, 644-657.
Markeset, T. & Kumar, U. (2003). Design and development of product support and maintenance concepts for industrial systems. Journal of Quality in Maintenance Engineering, 9 (4), 376-92.
Markeset, T., & Kumar, U. (2005). Product support strategy: conventional versus functional products. Journal of Quality in Maintenance Engineering, 11(1), 53-67.
Martin, H. H. (1997). Contracting out maintenance and a plan for future research. Journal of Quality in Maintenance engineering, 3(2), 81-90.
Marseguerra, M., Zio, E. & Podofillini, L. (2002). Condition-based maintenance optimization by means of genetic algorithms and Monte Carlo simulation, Reliability Engineering and System Safety, 77, 151-166.
Marston, S., Li,Z., Bandyopadhyay, S., Zhang, J. & Ghalsasi, A. (2011). Cloud computing – the business perspective, Decision Support Systems, 51, 176-189.
Mason, K. & Spring, M. (2011). The sites and practices of business models, Industrial Marketing Management, 40 (2011), 1032–1041
Maxim, P.S. (1999). Quantitative research methods in social sciences. Oxford University Press, Inc. New York, US
McDermott, R. E., Mikulak, R. J., & Beauregard, M. R. (1996). The basics of FMEA. New York: Quality Resources
Meier, H., Lagemann, H., Morlock, F. & Rathmann, C. (2013). Key performance indicators for assessing the planning and delivery of industrial services. Procedia CIRP 11, 99-104.
172
Mien, L.H., Feng, L.W. & Kheng Leng, R.G. (2005). An Integrated Manufacturing and Product Services System (IMPSS) Concept for Sustainable Product Development. IEEE, 656-662.
Miles, M. B. & Huberman, A. M. (1994). Qualitative data analysis: An expanded sourcebook. Sage.
Millar, H.H. & Russell, S.N. (2011). The Adoption of Sustainable Manufacturing Practices in the Caribbean. Business Strategy and the Environment, 20, 512–526.
Miller, D., Hope, Q., Eisenstat, R., Foote, N. & Galbraith, J. (2002). The problem of solutions: Balancing clients and capabilities. Business Horizons, 45 (2), 3-12
Miltenburg, J. (2005). Manufacturing Strategy – How to Formulate and Implement a Winning Plan. Productivity Press, New York.
Mintzberg, H. (1988). Generic strategies: toward a comprehensive framework. Advances in strategic management, 5(1), 1-67.
Mont, O. K. (2002). Clarifying the concept of product–service system. Journal of Cleaner Production, 10 (3), 237–245.
Morelli, N. (2006). Developing new product service systems (PSS): methodologies and operational tools. Journal of Cleaner Production, 14, 1495-1501
Morris, M, Schindehutte, M & Allen, J. (2005). The entrepreneur’s business model: toward a unified perspective, Journal of Business Research, 58(6), 726-735.
Moubray J. (1997). Reliability-centred maintenance: RCM II. Butterworth-Heinemann.
Moultrie, J., Clarkson, P.J. & Probert, D. (2007). Development of a Design Audit Tool for SMEs, The Journal of Product Innovation Management, 24(4), 335–368.
Muchiri, P. N., Pintelon, L., Martin, H., & De Meyer, A. M. (2010). Empirical analysis of maintenance performance measurement in Belgian industries. International Journal of Production Research, 48(20), 5905-5924.
Muchiri, P., Pintelon, L., Gelders, L., & Martin, H. (2011). Development of maintenance function performance measurement framework and indicators. International Journal of Production Economics, 131(1), 295-302.
Muller, A. Crespo Márquez, A. & Iung, B. (2008), On the concept of e-maintenance: Review and current research, Reliability Engineering and System Safety, 93, 1165–1187.
Murthy, D.N.P., Atrens, A & Eccleston, J.A. (2002). Strategic maintenance management, Journal of Quality in Maintenance Engineering, 8(4), 287-305.
Nakajima, S. (1988), Introduction to TPM: Total Productive Maintenance. Productivity Press, Cambridge.
Naughton, M.D. & Tiernan, P. (2012). Individualising maintenance management: a proposed framework and case study, Journal of Quality in Maintenance Engineering, 18(3), 267-281.
Nee, A.Y.C., Ong, S.K., Chryssolouris, G. & Mourtzis, D. (2012). Augmented reality applications in design and manufacturing, CIRP Annals in Manufacturing Technology, 61, 657-679.
Neely, A. (2008). Exploring the financial consequences of the servitization of manufacturing. Operations Management Research, 1(2), 103-118.
Neely. A, Benedettini, O & Visnjic, I. (2011). The servitization of manufacturing: Further evidence. 18th European Operations Management Association Conference, Cambridge.
173

Neu, W. A., & Brown, S. W. (2008). Manufacturers forming successful complex business services: designing an organization to fit the market. International Journal of Service Industry Management, 19(2), 232-251.
Ngo & A. O’Cass. (2009). Creating value offerings via operant resource-based capabilities, Industrial marketing management, 38, 45-59.
NIST - National Institute for Standards and Technology, (1993). Standard for Integration Definition for Function Modeling (IDEF0). Federal Information Processing Standards Publications. no. 183.
Normann, R. & Ramiraz, R. (1994). Designing interactive strategy: from the value chain to the value constellation, John Wiley and Sons, Chichester.
Ojala, P. (2004). Combining Capability Assessment and Value Engineering: A BOOTSTRAP Example. F. Bomarius and H. Iida (Eds.): PROFES 2004, LNCS 3009, Springer-Verlag Berlin Heidelberg, 471–484.
Ojanen, V., Ahonen, T. & Reunanen, M. (2011). Availability and sustainability as value elements in assessing customer value of an industrial service, Technology Management in the Energy Smart World (PICMET), 2011 Proceedings of PICMET '11, 1-11.
Ojanen, V., Ahonen, T., Reunanen, M. & Hanski, J. (2012). Towards availability and sustainability in customer value assessment of asset management services. International Journal of Innovation and Sustainable Development, 6 (4), 368-391.
Oliva R. & Kallenberg R. (2003). Managing the transition from products to services, International Journal of Service Industry Management, 14(2), 160-172.
Osterwalder, A. & Pigneur, Y. (2010). Business Model Generation – A Handbook for Visionaries, Game Changers, and Challengers, John Wiley & Sons, Inc., New Jersey.
Osterwalder, A., Pigneur, Y. & Tucci, C.L. (2005). Clarifying business models: origins, present, and future of the concept, Communications of the AIS, 15, May 2005.
Ostrom, A.L., Bitner, M.J., Brown, S.W., Burkhard, K.A., Goul, M., Smith-Daniels, V., Demirkan, H, & Rabinovich, E. (2010). Moving Forward and Making a Difference: Research Priorities for the Science of Service, Journal of Service Research, 13(1), 4-36.
Oyarbide-Zubillaga, A., Goti, A. & Sanchez, A. Preventive maintenance optimisation of multiequipment manufacturing systems by combining discrete event simulation and multi-objective evolutionary algorithms, Production Planning & Control: The Management of Operations, 19(4), 342-355.
Parasuraman, A. (2002), Service quality and productivity: a synergistic perspective, Managing Service Quality, 12(1), 6-9.
Parida, A. & Chattopadhyay,G. (2007). Development of a multi-criteria hierarchical framework for maintenance performance measurement (MPM). Journal of Quality in Maintenance Engineering, 13(3), 241–258.
Parida, A. & Kumar, U. (2006). Maintenance performance measurement (MPM): issues and challenges, Journal of Quality in Maintenance Engineering, 12(3), 239-251.
Partovi, F.Y., & Burton, J. (1993). Using the analytic hierarchy process for ABC analysis, International Journal of Operations & Production Management, 13(9), 29-44.
Peppard, J. & Rylander, A. (2006). From value chain to value networks: insights for mobile operators, European Management Journal, 24(2-3), 128-141.
174

Pintelon, L., Du Preez, N. & Van Puyvelde, F. (1999). Information technology: opportunities for maintenance management, Journal of Quality in Maintenance Engineering, 5, 9 – 24.
Pojasek, R. B. (2009). Sustainability reports: An alternative view. Environmental Quality Management, 18(3), 85-92.
Porcelli I., Rapaccini, M., Espíndola, D.B. & Pereira, C.E. (2013). Innovating product-service systems through augmented reality: a selection model, In: The Philosopher's Stone for Sustainability, Y. Shimomura and K. Kimita (Eds), Springer Berlin Heidelberg, 137-142.
Porter, M. (1985). Competitive Advantage: Creating and Sustaining Superior Performance. Free Press, New York
Porter, M.E. & van der Linde, C. (1995). Green and competitive: An underlying logic links the environment, resource productivity, innovation, and competitiveness, Harvard Business Review, 73 (5), 120–129.
Prahalad, C. K., & Ramaswamy, V. (2004). Co-creation experiences: The next practice in value creation. Journal of interactive marketing, 18(3), 5-14.
Rachuri, S., Sriram, R.D., Narayanah, A., Sarkar, P., Lee, J.H, Lyons, K.W., Srinivasan, V., Kemmerer, S.J. (2011). Summary of the NIST workshop on sustainable manufacturing: metrics, standards, and infrastructure. International Journal of Sustainable Manufacturing, 2 (2-3), 237-259.
Ramamurthy, H., Prabhu, B.S. & Gadh, R. (2005). Smart sensor platform for industrial monitoring and control, In Proceedings of the 4th IEEE conference on sensors, 1116-1119.
Ramirez, R. (1999). Value co-production: intellectual origins and implications for practice and research. Strategic Management Journal, 20 (1), 49-65.
Rashid, S.H.A., Evans, S. & Longhurst, P. (2008). A comparison of four sustainable manufacturing strategies. International Journal of Sustainable Engineering, 1(3), 214-229.
Reichstein, T. & Salter, A. (2006). Investigating the sources of process innovation among UK manufacturing firms, Industrial and Corporate Change, 15 (4), 653–682.
Richardson, J. (2008). The business model: an integrative framework for strategy execution, Strategic Change, 17, 133–144.
Riis, J.O., Luxhøj, J.T. & Thorsteinsson, U. (1997). A situational maintenance model, International Journal of Quality & Reliability Management, 14(4), 349 – 366.
Robson, C. (2011). Real world research: a resource for users of social research methods in applied settings. Chichester: Wiley.
Rockstrom, J., Steffen, W., Noone, K., Persson, A., Chapin, F.S., Lambin, III.E., Lenton, T.M., Scheffer, M., Folke, C., Schellnhuber, H., Nykvist,B., De Wit, C.A., Hughes, T., van der Leeuw, S., Rodhe, H., Sorlin, S., Snyder, P.K., Costanza, R., Svedin, U., Falkenmark, M., Karlberg, L., Corell, R.W., Fabry, V.J., Hansen, J., Walker, B., Liverman, D., Richardson, K., Crutzen, P. & Foley, J. (2009). Planetary boundaries: exploring the safe operating space for humanity. Ecology and Society, 14(2): 32. [URL:http://www.ecologyandsociety.org/vol14/iss2/art32/]
Röglinger, M., Pöppelbuß, J. & Becker, J. (2012). Maturity models in business process management. Business Process Management Journal, 18(2), 328 – 346.
Rosen, M.A. & Kishawy, H.A. (2012). Sustainable Manufacturing and Design: Concepts, Practices and Needs. Sustainability, 4, 154-174.
175

Rosqvist, T., Laaksoa, K. & Reunanen, M. (2009). Value-driven maintenance planning for a production plant, Reliability Engineering and System Safety, 94, 97–110.
Roy, R. (2000). Sustainable product-service systems. Futures, 32, 289-299.
SA 8000:2008. (2008). Social accountability.
Saaty, T.L., France, J.W. & Valentine, K.R. (1991). Modeling the Graduate Business School Admissions Process, Socio-Economic Planning Sciences, 25(2), 155-162.
Saccani, N., Visintin, F. & Rapaccini, M. (2014). Investigating the linkages between service types and supplier relationships in servitized environments, International Journal of Production Economics, 149, 226–238.
Saker, R. & Haque, A. (2000). Optimization of maintenance and spare provisioning policy using simulation, Applied Mathematical Modelling, 24, 751-760.
Saldaña, J. (2009). The coding manual for qualitative researchers. SAGE Publications, ltd. London, UK.
Schaltegger, S., Lüdeke-Freund, F. & Hansen, E.G. (2011). Business Cases for Sustainability and the Role of Business Model Innovation: Developing a Conceptual Framework, Centre for Sustainability Management, Leuphana University, Lueneburg.
Schmidheiny, S. (1992). Changing course: A global business perspective on development and the environment, MIT press.
Seliger, G., Kim, H-J., Kernbaum, S. & Zettl, M. (2008). Approaches in sustainable manufacturing. International Journal of sustainable Manufacturing, 1 (2), 58-77.
Seow, C. & Jiying, L. (2006). Innovation in maintenance strategy through six sigma: Insights of a Malaysian SME. ICMIT 2006 Proceedings – 2006 IEEE International Conference on Management of Innovation and Technology, 2, art. no. 4037127, 793-797.
Siddiqui, A. W. & Ben-Daya, M. (2009). Reliability Centered Maintenance, in Handbook of Maintenance Management and Engineering, M.Ben-Daya, S..O. Duffuaa, A. Raouf, J. Knezevic, D. Ait-Kadi (Eds), 397-416.
Simões, J.M., Gomes, C.F. & Yasin, M.M. (2011). A literature review of maintenance performance Measurement A conceptual framework and directions for future research, Journal of Quality in Maintenance Engineering, 17(2), 116-137.
Singh, S. & Lal, S.P. (2012). Mathematical modelling of innovation-driven sustainable manufacturing: case study of industrial pollution control equipment used in steel manufacturing organisations. International Journal of Manufacturing Research, 7 (4), 426-438.
Sinkkonen, T., Kivimaki, H., Marttonen, S. & Karri, T. (2013). A value-based life-cycle framework for networks of industrial maintenance services, In: Proceedings of COMADEN 2013, 1-13.
Slack, R.A. (1999). The Lean value principle in military aerospace product development, Lean Aerospace Initiative Report RP99-01-16, MIT, Cambridge, MA.
Smith, L. & Ball, P. (2012). Steps towards sustainable manufacturing through modeling material, energy and waste flows. International Journal of Production Economics, 140, 227–238.
Smith, L., Ng, I. & Maull, R. (2012). The three value proposition cycles of equipment-based service, Production Planning & Control: The Management of Operations, 23 (7), 553-570.
176

Söderholm, P., Holmgren, M. & Klefsjö, B. (2007). A process view of maintenance and its stakeholders, Journal of Quality in Maintenance Engineering, 13(1), 19–32.
Stabell, C.B. & Fjeldstad, O.D. (1998). Configuring value for competitive advantage: on chains, shops, and networks, Strategic Management Journal, 19, 413–437.
Stenstrom, C., Parida, A., Kumar, U., Galar, D. (2013). Performance indicators and terminology for value driven maintenance, Journal of Quality in Maintenance Engineering, 19(3), 222-232.
Stirling, A. (1999). The appraisal of sustainability: some problems and possible responses. Local Environment, 4(2), 111-135
Strauss, A. & Corbin, J. (1998). Basics of qualitative research: techniques and procedures for developing grounded theory.2nd edition. SAGE Publications, Inc, US.
Stremersch, S., Wuyts, S., Frambach, R.T. (2001), The Purchasing of Full-Service Contracts: An Exploratory Study within the Industrial Maintenance Market, Industrial Marketing Management 30, 1–12.
Swanson, L. (1999). The impact of new production technologies on the maintenance function: an empirical study. International journal of production research, 37(4), 849-869.
Takata, S., Kimura, F., van Houten, F.J.A.M., Westkämper, E., Shpitalni, M., Ceglarek, D. & Lee, J. (2004), Maintenance: changing role in life cycle management, Annals of the CIRP, 53(2), 643–656.
Tan, A.R., Matzen, D., McAloone, T.C. & Evans, S. (2010), Strategies for designing and developing services for manufacturing firms, CIRP Journal of Manufacturing Science and Technology, 3, 90–97.
Tao, B., Ding, H. & Xiong, Y.L. (2003). IP sensor and its distributed networking application in e-maintenance, Systems, Man and Cybernetics. IEEE International Conference on, 4, 3858-3863.
Tarakci, H. , Tang, K. , Moskowitz, H. & Plante, R. (2006). Maintenance outsourcing of a multi-process manufacturing system with multiple contractors, IIE Transactions, 38(1), 67-78.
Teece, D. (2010). Business models, business strategy and innovation, Long Range Planning, 43(2/3), 172–194.
The World Conservation Union. (2006). The Future of Sustainability: Re-thinking Environment and Development in the Twenty-first Century. Report of the IUCN Renowned Thinkers Meeting, 29-31 January 2006
Thoben, K. D., Eschenbächer, J. & Jagdev, H. (2001, June). Extended products: evolving traditional product concepts. In 7th international Conference on Concurrent Enterprising. Bremen.
Tomiyama, T. (2001). Service engineering to intensify service contents in product life cycles. In Environmentally Conscious Design and Inverse Manufacturing, 2001. Proceedings EcoDesign 2001: Second International Symposium on. IEEE, 613-618.
Toosi, A., Lockett, H.L., Raja. J.Z. & Martinez, V. (2013). Assessing the value dimensions of outsourced maintenance services, Journal of Quality in Maintenance Engineering, 19(4), 348-363.
Tousley, P. (2010). Maintain it and save. Energy Engineering: Journal of the Association of Energy Engineering, 107 (5), 64-75.
Tsang, A.H.C. (1995). Condition-based maintenance:vtools and decision making, Journal of Quality in Maintenance Engineering, 1(3), 3-17.
177

Tsang, A.H.C. (2002). Strategic dimensions of maintenance management, Journal of Quality in Maintenance Engineering, 8(1), 7 – 39.
Tsutsui, M. & Takata, S. (2012). Life cycle maintenance planning method in consideration of operation and maintenance integration, Production Planning & Control: The Management of Operations, 23(2-3), 183-193.
Tukker, A. (2004), Eight types of product-service system: eight ways to sustainability?, Business Strategy and the Environment, 13(4), 246-60.
Tukker, A. & Tischner, U. (2006). New Business for Old Europe: Product-Service Development, Competitiveness and Sustainability, Greenleaf Publishing, Sheffield.
Turunen, T., & Finne, M. (2013). The organisational environment’s impact on the servitization of manufacturers. European Management Journal, 32, 603-615
Van Marrewijk, M. (2003). Concepts and Definitions of CSR and Corporate Sustainability: Between Agency and Communion, Journal of Business Ethics, 44, 95–105.
Vandermerwe S. & Rada, J. (1988). Servitization of business: adding value by adding services, European Management Journal, 6(4), 314-24.
Vargo, L.S. and Lusch, R.F. (2004), Evolving to a new dominant logic for marketing. Journal of marketing, 68, 1-17.
Vargo, L.S. & Lusch, R.F. (2008). From goods to service(s): Divergences and convergences of logics. Industrial Marketing Management, 37, 254–259.
Vinodh, S. & Joy, D. (2012). Structural equation modeling of sustainable manufacturing practices. Clean Technologies and Environmental Policy, 14, 79–84.
Vladimirova, D., Evans, S., Martinez, V. & Kingston, J. (2011). Elements of change in the transformation towards product-service systems, in: Functional Thinking for Value Creation, Proceedings of the 3rd CIRP International Conference on Industrial Product Service Systems (IPS2), Technische Universität Braunschweig, 5-6 May, 2011, Braunschweig, Germany, 21-26.
Voisin, A., Levrat, E., Cocheteux, P. & Iung, B. (2010). Generic prognosis model for proactive maintenance decision support: application to pre-industrial e-maintenance test bed, Journal of Intelligent Manufacturing, 21, 177-193.
Voss, C., Tsikriktsis, N. & Frohlich, M. (2002). Case research in operations management, International Journal of Operations & Production Management, 22(2), 195-219.
Wallin, J., Koteshwar C. & Thompson, A. (2013). Developing PSS concepts from traditional product sales situation: the use of business model canvas, Product-Service Integration for Sustainable Solutions. Springer Berlin Heidelberg, 263-274.
Ward, P. T., Bickford, D. J., & Leong, G. K. (1996). Configurations of manufacturing strategy, business strategy, environment and structure. Journal of management, 22(4), 597-626.
Weber, A. & Thomas, R., (2006). Key Performance Indicators: Measuring & Managing the Maintenance Function. Ivara Corporation
Webster, J. & Watson, R.T. (2002), Analyzing the past to prepare for the future: writing a literature review, MIS Quarterly, 26(2), 13-23.
Windahl C. & Lakemond N. (2006). Developing integrated solutions: The importance of relationships within the network. Industrial Marketing Management, 35, 806–818.
178

Wireman T. (1998), Developing Performance Indicators For Managing Maintenance, New York Industrial Press
Wise, R. & Baumgartner, P. (1999). Go downstream: the new profit imperative in manufacturing. Harvard Business Review, September/October, 133-41.
Woodruff, R. B. (1997). Customer value: The next source of competitive advantage. Journal of the Academy of Marketing Science, 25(2), 139–153
Wooldridge, M. & Jennings, N.R. (1995). Intelligent agents: Theory and practice, The Knowledge Engineering Review, 10(2), 115-152.
World Business Council for Sustainable Development (WBCSD). (2000). Measuring eco-efficiency: a guide to reporting company performance [http://www.gdrc.org/sustbiz/measuring.pdf , Last accessed: 25/08/2014]
World Economic Forum (2012). The future of manufacturing: opportunities to drive economic growth. World Economic Forum Report in collaboration with Deloitte Touche Tohmatsu Limited. World Economic Forum, Switzerland.
Yan, J. & Hua, D. (2010). Energy consumption modeling for machine tools after preventive maintenance, Industrial Engineering and Engineering Management (IEEM), 2010 IEEE International Conference on , 2201,2205.
Yan, J., Hua, D., Wang, X. & Li, X. (2012). Sustainable manufacturing oriented prognosis for facility reuse combining ANN and reliability, Quality and Reliability Engineering International, 28(3), 265-277.
Yin, R. (2003). Case study research: design and methods. Sage Publications .
Yuan, C., Zhai, Q. & Dornfeld, D. (2012). A three dimensional system approach for environmentally sustainable manufacturing. CIRP Annals - Manufacturing Technology, 61, 39–42.
Zhang, Y., Gu, Y., Vlatkovic, V. & Wang, X. (2004).Progress of smart sensor and smart sensor networks, IEEE Publications, 3600–3606.
Zhang, S., Chen, X., Zhang, S. & Huo, X. (2010). The comparison between cloud computing and grid computing, in Computer Application and System Modeling (ICCASM), 2010 International Conference on, 11, 72 – 75.
Zlatanova, S. (2002). Augmented Reality Technology, GIS Report No.17, Delft, December 2002
Zott, C. & Amit, R. (2007). Business Model Design and the Performance of Entrepreneurial Firms, Organization Science, 18(2), 181–199.
Zott, C., Amit, R. & Massa, L. (2011). The Business Model: Recent Developments and Future Research, Journal of Management, 37(4), 1019-1042.
179

APPENDIXES
180

APPENDIX A. LIST OF PUBLICATIONS
2014 Holgado, M., Macchi, M., Fumagalli, L. (2014). Maintenance Business Model: a concept for driving performance improvement, International Journal of Strategic Engineering Asset Management (IJSEAM), accepted.
Macchi, M., Farruku, K., Holgado, M., Negri, E., Panarese, D. (2014), Economic and environmental impact assessment through system dynamics of technology-enhanced maintenance services, International Journal of Industrial and Systems Engineering (IJISE), in print.
Dalle Carbonare, A., Ball, P., Macchi, M., Holgado, M. (2014), Improving environmental performance through maintenance: a proposed QFD-based methodology, ICMR conference, 9-11 September 2014, Southampton, UK
Tornese, F., Holgado, M., Gnoni, M.G., Elia, V., Macchi, M. (2014). A systematic framework for defining environmental performance metrics for industrial services. Summer School Francesco Turco 2014, 9-12 September 2014, Senigallia, Italy
Benedetti, M, Cesarotti, V., Holgado, M., Introna, V., Macchi, M. (2014). A framework for energy services within Product Service Systems. Summer School Francesco Turco 2014, 9-12 September 2014, Senigallia, Italy
Lee, J., Holgado, M., Kao, H., Macchi, M. (2014). New Thinking Paradigm for Maintenance Innovation Design. 19th World Congress of the International Federation of Automatic Control (IFAC) - 24-29 August 2014, Cape Town, South Africa.
Holgado, M. and Macchi, M. (2014). Exploring the role of E-maintenance for value creation in service provision. 2014 International Conference on Engineering, Technology and Innovation (ICE) - 23-25 June 2014, Bergamo, Italy, Paper 38
Macchi, M., Crespo Márquez, A., Holgado, M., Fumagalli, L., Barberá Martínez, L. (2014). Value driven engineering of E-maintenance platforms. Journal of Manufacturing Technology Management. Special issue on Advanced Maintenance Engineering, Services and Technology. Vol. 25, Issue 4, pp. 568-598
2013 Holgado, M., Macchi, M., Fumagalli, L. (2013). Driving performance improvement through the concept of Maintenance Business Model. Proceedings of the Maintenance Performance Measurement and Management Conference, Monto, S., Pirttilä, M., Kärri, T. (editors), pp. 148-162. 12-13 September 2013, Lappeenranta, Finland. ISBN 978-952-265-443-4.
Macchi, M., Farruku, K., Holgado, M., Negri, E., Panarese, D. (2013). Economic and environmental impact analysis of maintenance policies for service planning through system dynamics. Proceedings of the Maintenance Performance Measurement and Management Conference, Monto, S., Pirttilä, M., Kärri, T. (editors), pp. 234-248. 12-13 September 2013, Lappeenranta, Finland. ISBN 978-952-265-443-4.
Holgado, M., Corti, D., Macchi, M., Rana, P., Short, S., Evans, S. (2013). Business modelling for sustainable manufacturing. "Competitive Manufacturing for Innovative Products and Services: Proceedings of the APMS 2012 Conference, Advances in Production Management Systems". Editors: Emmanouilidis, C., Taisch, M., and Kiritsis, D. (IFIP AICT, Springer Series ISSN: 1868-4238).
Negri, E., Holgado, M., Grefrath, C., Wagner, D., Macchi, M. (2013). Life Cycle Based and Triple Bottom Line Assessment of Sustainability Impacts in Product-Service Systems. XVIII Summer School "Francesco Turco". 10-13 September 2013, Ancona, Italy.
2012 Macchi, M., Barberá Martínez, L. Crespo Márquez, A., Holgado Granados, M., Fumagalli, L. (2012). Value assessment of an E-maintenance platform. 2nd Workshop on Advanced Maintenance Engineering, Services and Technology (AMEST 2012). 22-23 November 2012, Sevilla, Spain
Holgado Granados, M. (2012) - Book Review- Innovation design. Creating value for people, organisations and society, by Elke den Ouden, Production Planning & Control: The Management of Operations, DOI:10.1080/09537287.2012.727665
Holgado Granados, M., Corti D, Macchi, M., Rana, P., Short S., Evans, S. (2012) Business modelling for sustainable manufacturing. APMS conference on Advances in Production Management Systems. 24-26 September 2012, Rhodes, Greece
Macchi, M., Fumagalli, L., De Carlo, F., Ierace, S., Mossa, G., Regattieri, A., Farruku, K., Gasparetti, M., Holgado Granados, M. (2012). Empirical evidences on maintenance management in the Italian manufacturing and process industry. XVII Summer School "Francesco Turco". 12-14 September 2012, Venezia, Italy
181
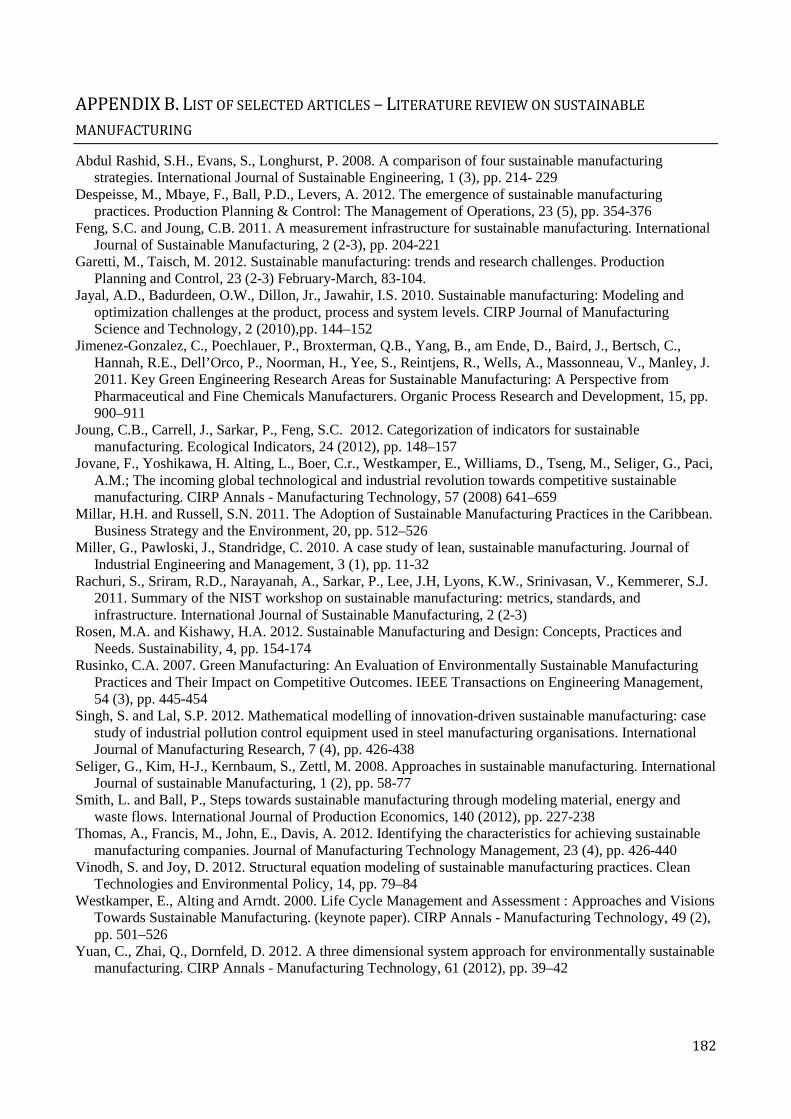
APPENDIX B. LIST OF SELECTED ARTICLES – LITERATURE REVIEW ON SUSTAINABLE
MANUFACTURING Abdul Rashid, S.H., Evans, S., Longhurst, P. 2008. A comparison of four sustainable manufacturing
strategies. International Journal of Sustainable Engineering, 1 (3), pp. 214- 229 Despeisse, M., Mbaye, F., Ball, P.D., Levers, A. 2012. The emergence of sustainable manufacturing
practices. Production Planning & Control: The Management of Operations, 23 (5), pp. 354-376 Feng, S.C. and Joung, C.B. 2011. A measurement infrastructure for sustainable manufacturing. International
Journal of Sustainable Manufacturing, 2 (2-3), pp. 204-221 Garetti, M., Taisch, M. 2012. Sustainable manufacturing: trends and research challenges. Production
Planning and Control, 23 (2-3) February-March, 83-104. Jayal, A.D., Badurdeen, O.W., Dillon, Jr., Jawahir, I.S. 2010. Sustainable manufacturing: Modeling and
optimization challenges at the product, process and system levels. CIRP Journal of Manufacturing Science and Technology, 2 (2010),pp. 144–152
Jimenez-Gonzalez, C., Poechlauer, P., Broxterman, Q.B., Yang, B., am Ende, D., Baird, J., Bertsch, C., Hannah, R.E., Dell’Orco, P., Noorman, H., Yee, S., Reintjens, R., Wells, A., Massonneau, V., Manley, J. 2011. Key Green Engineering Research Areas for Sustainable Manufacturing: A Perspective from Pharmaceutical and Fine Chemicals Manufacturers. Organic Process Research and Development, 15, pp. 900–911
Joung, C.B., Carrell, J., Sarkar, P., Feng, S.C. 2012. Categorization of indicators for sustainable manufacturing. Ecological Indicators, 24 (2012), pp. 148–157
Jovane, F., Yoshikawa, H. Alting, L., Boer, C.r., Westkamper, E., Williams, D., Tseng, M., Seliger, G., Paci, A.M.; The incoming global technological and industrial revolution towards competitive sustainable manufacturing. CIRP Annals - Manufacturing Technology, 57 (2008) 641–659
Millar, H.H. and Russell, S.N. 2011. The Adoption of Sustainable Manufacturing Practices in the Caribbean. Business Strategy and the Environment, 20, pp. 512–526
Miller, G., Pawloski, J., Standridge, C. 2010. A case study of lean, sustainable manufacturing. Journal of Industrial Engineering and Management, 3 (1), pp. 11-32
Rachuri, S., Sriram, R.D., Narayanah, A., Sarkar, P., Lee, J.H, Lyons, K.W., Srinivasan, V., Kemmerer, S.J. 2011. Summary of the NIST workshop on sustainable manufacturing: metrics, standards, and infrastructure. International Journal of Sustainable Manufacturing, 2 (2-3)
Rosen, M.A. and Kishawy, H.A. 2012. Sustainable Manufacturing and Design: Concepts, Practices and Needs. Sustainability, 4, pp. 154-174
Rusinko, C.A. 2007. Green Manufacturing: An Evaluation of Environmentally Sustainable Manufacturing Practices and Their Impact on Competitive Outcomes. IEEE Transactions on Engineering Management, 54 (3), pp. 445-454
Singh, S. and Lal, S.P. 2012. Mathematical modelling of innovation-driven sustainable manufacturing: case study of industrial pollution control equipment used in steel manufacturing organisations. International Journal of Manufacturing Research, 7 (4), pp. 426-438
Seliger, G., Kim, H-J., Kernbaum, S., Zettl, M. 2008. Approaches in sustainable manufacturing. International Journal of sustainable Manufacturing, 1 (2), pp. 58-77
Smith, L. and Ball, P., Steps towards sustainable manufacturing through modeling material, energy and waste flows. International Journal of Production Economics, 140 (2012), pp. 227-238
Thomas, A., Francis, M., John, E., Davis, A. 2012. Identifying the characteristics for achieving sustainable manufacturing companies. Journal of Manufacturing Technology Management, 23 (4), pp. 426-440
Vinodh, S. and Joy, D. 2012. Structural equation modeling of sustainable manufacturing practices. Clean Technologies and Environmental Policy, 14, pp. 79–84
Westkamper, E., Alting and Arndt. 2000. Life Cycle Management and Assessment : Approaches and Visions Towards Sustainable Manufacturing. (keynote paper). CIRP Annals - Manufacturing Technology, 49 (2), pp. 501–526
Yuan, C., Zhai, Q., Dornfeld, D. 2012. A three dimensional system approach for environmentally sustainable manufacturing. CIRP Annals - Manufacturing Technology, 61 (2012), pp. 39–42
182

APPENDIX C. QUESTIONNAIRE FOR THE SEMI-STRUCTURED INTERVIEWS
183

184
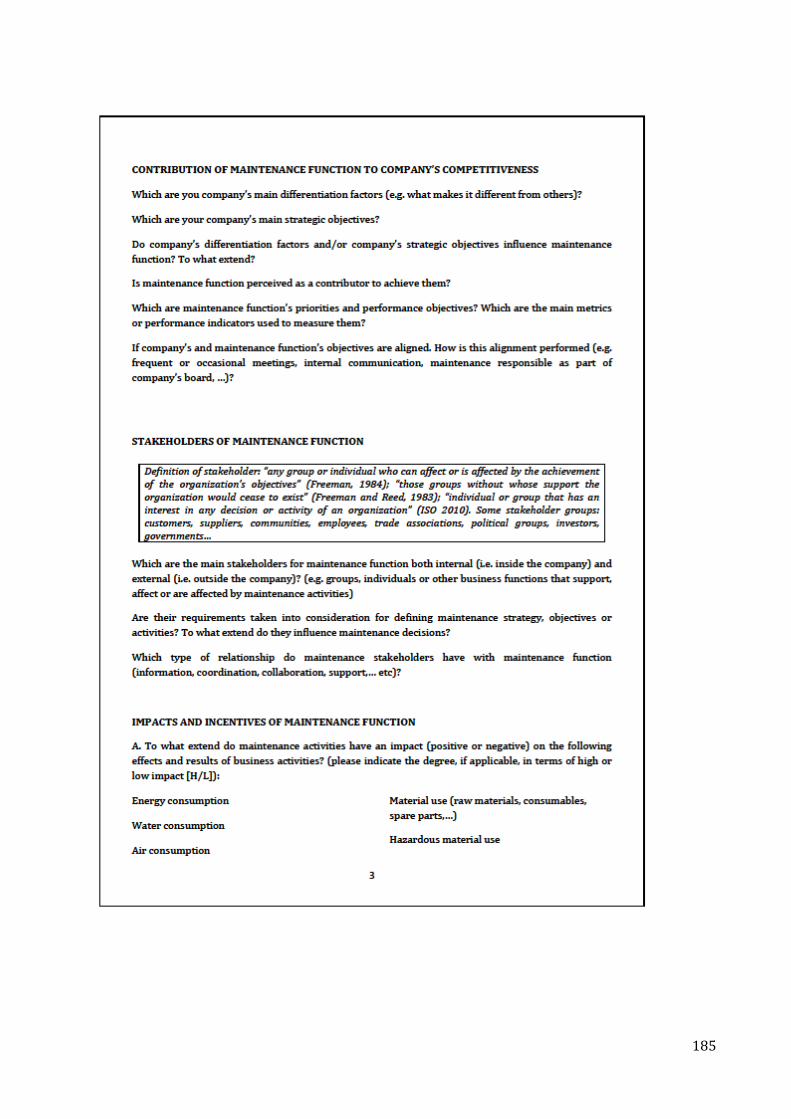
185

186

APPENDIX D. SURVEY ON TECHNOLOGIES FOR MAINTENANCE SERVICE PROVISION
187

188

189
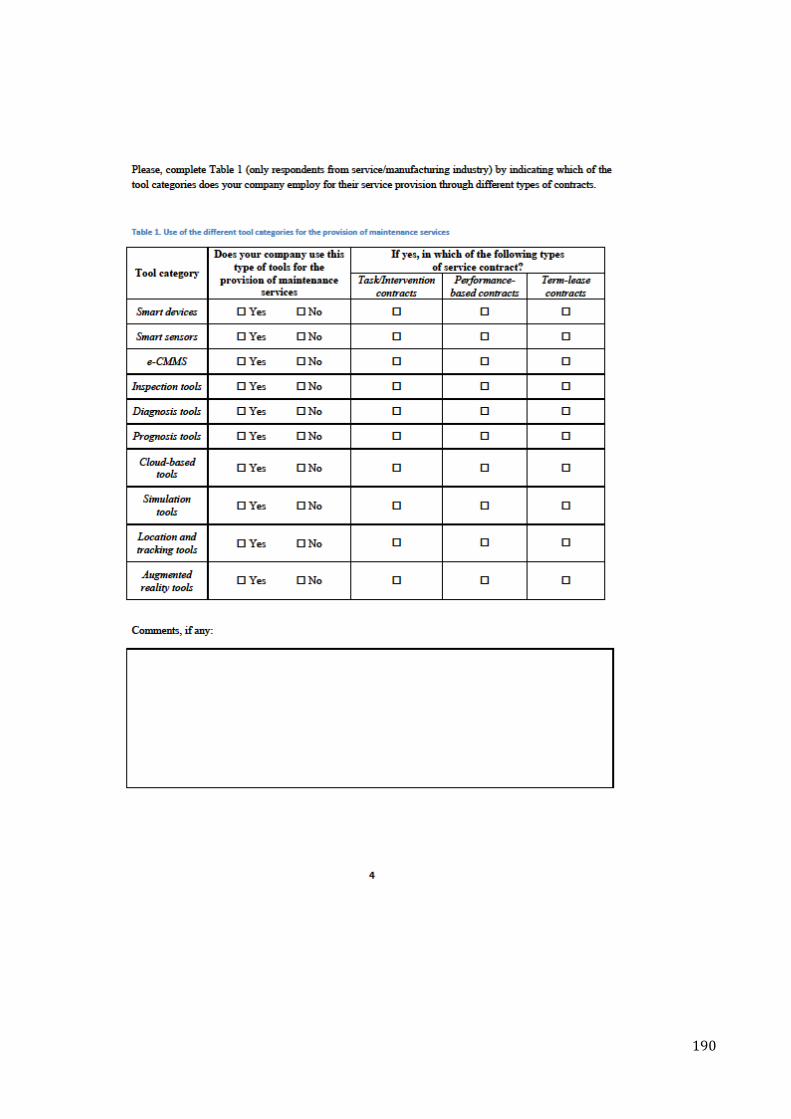
190

191

192

APPENDIX E. SUMMARY OF THE AHP RESULTS FOR THE THREE INTERVIEWEES
Respondent 1Location manager
TSD MACHINESArea: LAV VALUE SCORESMachine types : 1 Results from Super DecisionsNames of machine types: Values Comparison Low rating Medium rating High rating Low Medium HighTSD MACHINES Availability 0,37141 0,06579 0,14881 0,78539 0,08 Availability 0,0244 0,0553 0,2917
Cost 0,03624 0,11111 0,22222 0,66667 0,00 Cost 0,0040 0,0081 0,0242Effectiveness 0,10997 0,06793 0,16176 0,77031 0,05 Effectiveness 0,0075 0,0178 0,0847Quality 0,34411 0,09091 0,09091 0,81818 0,00 Quality 0,0313 0,0313 0,2815Reliability 0,11148 0,06793 0,16176 0,77031 0,05 Reliability 0,0076 0,0180 0,0859Technical knowledge 0,02679 0,11685 0,19981 0,68334 0,02 Technical knowledge 0,0031 0,0054 0,0183
Matrix inconsistency 0,05
WELDING MACHINESArea: CAB VALUE SCORESMachine types : 4 Results from Super DecisionsNames of machine types: Values Comparison Low rating Medium rating High rating Low Medium HighWELDING MACHINES Availability 0,07378 0,08096 0,18839 0,73064 0,06 Availability 0,0060 0,0139 0,0539SLEEVES Effectiveness 0,16668 0,07042 0,17818 0,7514 0,03 Effectiveness 0,0117 0,0297 0,1252MASS SPECTROMETRY Quality 0,56035 0,09091 0,09091 0,81818 0,00 Quality 0,0509 0,0509 0,4585WASHING MACHINE CAB Reliability 0,16668 0,06793 0,16176 0,77031 0,05 Reliability 0,0113 0,0270 0,1284
Technical knowledge 0,03252 0,08096 0,18839 0,73064 0,06 Technical knowledge 0,0026 0,0061 0,0238
Matrix inconsistency 0,09
SLEEVESVALUE SCORES
Results from Super DecisionsValues Comparison Low rating Medium rating High rating Low Medium HighAvailability 0,05262 0,10615 0,19288 0,70097 0,01 Availability 0,0056 0,0101 0,0369Quality 0,64983 0,11111 0,11111 0,77778 0,00 Quality 0,0722 0,0722 0,5054Reliability 0,23407 0,08096 0,18839 0,73064 0,06 Reliability 0,0190 0,0441 0,1710Technical knowledge 0,06347 0,10615 0,19288 0,70097 0,01 Technical knowledge 0,0067 0,0122 0,0445
Matrix inconsistency 0,08
MASS SPECTROMETRYVALUE SCORES
Results from Super DecisionsValues Comparison Low rating Medium rating High rating Low Medium HighAvailability 0,06033 0,12202 0,22965 0,64833 0,004 Availability 0,0074 0,0139 0,0391Quality 0,70852 0,09091 0,09091 0,81818 0,000 Quality 0,0644 0,0644 0,5797Reliability 0,23115 0,12202 0,22965 0,64833 0,004 Reliability 0,0282 0,0531 0,1499
Matrix inconsistency 0,07
WASHING MACHINE CABVALUE SCORES
Results from Super DecisionsValues Comparison Low rating Medium rating High rating Low Medium HighAvailability 0,3489 0,08096 0,18839 0,73064 0,06 Availability 0,0282 0,0657 0,2549Effectiveness 0,04978 0,11685 0,19981 0,68334 0,02 Effectiveness 0,0058 0,0099 0,0340Efficiency 0,3489 0,08096 0,18839 0,73064 0,06 Efficiency 0,0282 0,0657 0,2549Reliability 0,12621 0,12202 0,22965 0,64833 0,00 Reliability 0,0154 0,0290 0,0818Technical knowledge 0,12621 0,10203 0,17212 0,72585 0,03 Technical knowledge 0,0129 0,0217 0,0916
Matrix inconsistency 0,01
COMPENSATION SYSTEMArea: COM VALUE SCORESMachine types : 2 Results from Super DecisionsNames of machine types: Values Comparison Low rating Medium rating High rating Low Medium HighCOMPENSATION SYSTEM Cost 0,03221 0,10615 0,19288 0,70097 0,01 Cost 0,0034 0,0062 0,0226FLANGER Effectiveness 0,38574 0,08715 0,16181 0,75104 0,01 Effectiveness 0,0336 0,0624 0,2897
Efficiency 0,09816 0,09091 0,09091 0,81818 0,00 Efficiency 0,0089 0,0089 0,0803Quality 0,38574 0,07602 0,13122 0,79276 0,02 Quality 0,0293 0,0506 0,3058Reliability 0,09816 0,08096 0,18839 0,73064 0,06 Reliability 0,0079 0,0185 0,0717
Matrix inconsistency 0,05
FLANGERVALUE SCORES
Results from Super DecisionsValues Comparison Low rating Medium rating High rating Low Medium HighAvailability 0,07143 0,10615 0,19288 0,70097 0,01 Availability 0,0076 0,0138 0,0501Effectiveness 0,42857 0,07261 0,16623 0,76116 0,07 Effectiveness 0,0311 0,0712 0,3262Efficiency 0,42857 0,07261 0,16623 0,76116 0,07 Efficiency 0,0311 0,0712 0,3262Reliability 0,07143 0,10615 0,19288 0,70097 0,01 Reliability 0,0076 0,0138 0,0501
Matrix inconsistency 0,00
Matrix inconsistency for ratings
Matrix inconsistency for ratings
Matrix inconsistency for ratings
Matrix inconsistency for ratings
Matrix inconsistency for ratings
Matrix inconsistency for ratings
Matrix inconsistency for ratings
193

Respondent 2Production manager
TSD MACHINESArea: LAV VALUE SCORESMachine types : 1 Results from Super DecisionsNames of machine types: Values Comparison Low rating Medium rating High rating Low Medium HighTSD MACHINES Availability 0,04319 0,32339 0,58763 0,08898 0,01 Availability 0,014 0,02537974 0,0038
Cost 0,02451 0,78377 0,13493 0,0813 0,03 Cost 0,0192 0,00330713 0,002Effectiveness 0,15683 0,08414 0,21092 0,70494 0,03 Effectiveness 0,0132 0,03307858 0,1106Quality 0,33402 0,11111 0,11111 0,77778 0,00 Quality 0,0371 0,03711296 0,2598Reliability 0,33402 0,11111 0,11111 0,77778 0,00 Reliability 0,0371 0,03711296 0,2598Technical knowledge 0,10744 0,06033 0,23115 0,70852 0,07 Technical knowledge 0,0065 0,02483476 0,0761
Matrix inconsistency 0,04
WELDING MACHINESArea: CAB VALUE SCORESMachine types : 4 Results from Super DecisionsNames of machine types: Values Comparison Low rating Medium rating High rating Low Medium HighWELDING MACHINES Availability 0,03396 0,16342 0,53961 0,29696 0,01 Availability 0,0055 0,0183 0,0101SLEEVES Effectiveness 0,14718 0,07193 0,27895 0,64912 0,06 Effectiveness 0,0106 0,0411 0,0955MASS SPECTROMETRY Quality 0,52284 0,09091 0,09091 0,81818 0,00 Quality 0,0475 0,0475 0,4278WASHING MACHINE CAB Reliability 0,2311 0,09091 0,09091 0,81818 0,00 Reliability 0,0210 0,0210 0,1891
Technical knowledge 0,06492 0,14881 0,78539 0,06579 0,08 Technical knowledge 0,0097 0,0510 0,0043
Matrix inconsistency 0,04
SLEEVESVALUE SCORES
Results from Super DecisionsValues Comparison Low rating Medium rating High rating Low Medium HighAvailability 0,05529 0,09534 0,24986 0,65481 0,02 Availability 0,0053 0,0138 0,0362Quality 0,1175 0,09534 0,24986 0,65481 0,02 Quality 0,0112 0,0294 0,0769Reliability 0,56501 0,09381 0,16659 0,73959 0,01 Reliability 0,0530 0,0941 0,4179Technical knowledge 0,2622 0,0752 0,18295 0,74184 0,04 Technical knowledge 0,0197 0,0480 0,1945
Matrix inconsistency 0,04
MASS SPECTROMETRYVALUE SCORES
Results from Super DecisionsValues Comparison Low rating Medium rating High rating Low Medium HighAvailability 0,07193 0,59173 0,33322 0,07506 0,014 Availability 0,0426 0,0240 0,0054Quality 0,64912 0,11111 0,11111 0,77778 0,000 Quality 0,0721 0,0721 0,5049Reliability 0,27895 0,14286 0,71429 0,14286 0,000 Reliability 0,0399 0,1993 0,0399
Matrix inconsistency 0,06
WASHING MACHINE CABVALUE SCORES
Results from Super DecisionsValues Comparison Low rating Medium rating High rating Low Medium HighAvailability 0,04515 0,73959 0,16659 0,09381 0,014 Availability 0,0334 0,0075 0,0042Effectiveness 0,36961 0,11111 0,11111 0,77778 0,000 Effectiveness 0,0411 0,0411 0,2875Efficiency 0,17048 0,07862 0,26275 0,65863 0,031 Efficiency 0,0134 0,0448 0,1123Reliability 0,36961 0,09381 0,16659 0,73959 0,014 Reliability 0,0347 0,0616 0,2734Technical knowledge 0,04515 0,77778 0,11111 0,11111 0,000 Technical knowledge 0,0351 0,0050 0,0050
Matrix inconsistency 0,02
COMPENSATION SYSTEMArea: COM VALUE SCORESMachine types : 2 Results from Super DecisionsNames of machine types: Values Comparison Low rating Medium rating High rating Low Medium HighCOMPENSATION SYSTEM Cost 0,16069 0,09381 0,16659 0,73959 0,014 Cost 0,0151 0,0268 0,1188FLANGER Effectiveness 0,36209 0,11111 0,11111 0,77778 0,000 Effectiveness 0,0402 0,0402 0,2816
Efficiency 0,03892 0,81818 0,09091 0,09091 0,000 Efficiency 0,0318 0,0035 0,0035Quality 0,0762 0,16033 0,69084 0,14884 0,005 Quality 0,0122 0,0526 0,0113Reliability 0,36209 0,11111 0,11111 0,77778 0,000 Reliability 0,0402 0,0402 0,2816
Matrix inconsistency 0,03
FLANGERVALUE SCORES
Results from Super DecisionsValues Comparison Low rating Medium rating High rating Low Medium HighAvailability 0,04249 0,42857 0,42857 0,14286 0,000 Availability 0,0182 0,0182 0,0061Effectiveness 0,28953 0,07862 0,26275 0,65863 0,031 Effectiveness 0,0228 0,0761 0,1907Efficiency 0,0849 0,22965 0,64833 0,12202 0,004 Efficiency 0,0195 0,0550 0,0104Reliability 0,58309 0,09091 0,09091 0,81818 0,000 Reliability 0,0530 0,0530 0,4771
Matrix inconsistency 0,06
Matrix inconsistency for ratings
Matrix inconsistency for ratings
Matrix inconsistency for ratings
Matrix inconsistency for ratings
Matrix inconsistency for ratings
Matrix inconsistency for ratings
Matrix inconsistency for ratings
194

Respondent 3Maintenance manager
TSD MACHINESArea: LAV VALUE SCORESMachine types : 1 Results from Super DecisionsNames of machine types: Values Comparison Low rating Medium rating High rating Low Medium HighTSD MACHINES Availability 0,36748 0,07378 0,12181 0,80441 0,035 Availability 0,0271 0,0448 0,2956
Cost 0,0354 0,2 0,2 0,6 0,000 Cost 0,0071 0,0071 0,0212Effectiveness 0,10608 0,11111 0,11111 0,77778 0,000 Effectiveness 0,0118 0,0118 0,0825Quality 0,21752 0,09091 0,09091 0,81818 0,000 Quality 0,0198 0,0198 0,1780Reliability 0,21752 0,11111 0,11111 0,77778 0,000 Reliability 0,0242 0,0242 0,1692Technical knowledge 0,05599 0,0914 0,21764 0,69096 0,052 Technical knowledge 0,0051 0,0122 0,0387
Matrix inconsistency 0,02
WELDING MACHINESArea: CAB VALUE SCORESMachine types : 4 Results from Super DecisionsNames of machine types: Values Comparison Low rating Medium rating High rating Low Medium HighWELDING MACHINES Availability 0,5801 0,05616 0,24298 0,70087 0,10 Availability 0,0326 0,1410 0,4066SLEEVES Effectiveness 0,06351 0,1958 0,31081 0,49339 0,05 Effectiveness 0,0124 0,0197 0,0313MASS SPECTROMETRY Quality 0,18005 0,06579 0,14881 0,78539 0,08 Quality 0,0118 0,0268 0,1414WASHING MACHINE CAB Reliability 0,13264 0,1692 0,38737 0,44343 0,02 Reliability 0,0224 0,0514 0,0588
Technical knowledge 0,04371 0,05724 0,34583 0,59693 0,02 Technical knowledge 0,0025 0,0151 0,0261
Matrix inconsistency 0,08
SLEEVESVALUE SCORES
Results from Super DecisionsValues Comparison Low rating Medium rating High rating Low Medium HighAvailability 0,27669 0,13965 0,33252 0,52784 0,05 Availability 0,0386 0,0920 0,1460Quality 0,15867 0,08767 0,13916 0,77317 0,05 Quality 0,0139 0,0221 0,1227Reliability 0,5004 0,11111 0,11111 0,77778 0,00 Reliability 0,0556 0,0556 0,3892Technical knowledge 0,06424 0,0627 0,30431 0,63299 0,13 Technical knowledge 0,0040 0,0195 0,0407
Matrix inconsistency 0,09
MASS SPECTROMETRYVALUE SCORES
Results from Super DecisionsValues Comparison Low rating Medium rating High rating Low Medium HighAvailability 0,07193 0,08193 0,23634 0,68172 0,001 Availability 0,0059 0,0170 0,0490Quality 0,64912 0,09091 0,09091 0,81818 0,000 Quality 0,0590 0,0590 0,5311Reliability 0,27895 0,09091 0,09091 0,81818 0,000 Reliability 0,0254 0,0254 0,2282
Matrix inconsistency 0,06
WASHING MACHINE CABVALUE SCORES
Results from Super DecisionsValues Comparison Low rating Medium rating High rating Low Medium HighAvailability 0,47391 0,06033 0,23115 0,70852 0,07 Availability 0,0286 0,1095 0,3358Effectiveness 0,1902 0,09051 0,15125 0,75825 0,03 Effectiveness 0,0172 0,0288 0,1442Efficiency 0,0596 0,16342 0,29696 0,53961 0,01 Efficiency 0,0097 0,0177 0,0322Reliability 0,2433 0,06033 0,23115 0,70852 0,07 Reliability 0,0147 0,0562 0,1724Technical knowledge 0,03299 0,15706 0,24931 0,59363 0,05 Technical knowledge 0,0052 0,0082 0,0196
Matrix inconsistency 0,06
COMPENSATION SYSTEMArea: COM VALUE SCORESMachine types : 2 Results from Super DecisionsNames of machine types: Values Comparison Low rating Medium rating High rating Low Medium HighCOMPENSATION SYSTEM Cost 0,04873 0,11685 0,19981 0,68334 0,02 Cost 0,0057 0,0097 0,0333FLANGER Effectiveness 0,11147 0,08096 0,18839 0,73064 0,06 Effectiveness 0,0090 0,0210 0,0814
Efficiency 0,064 0,10473 0,25828 0,63699 0,04 Efficiency 0,0067 0,0165 0,0408Quality 0,31513 0,09091 0,09091 0,81818 0,00 Quality 0,0286 0,0286 0,2578Reliability 0,46068 0,084 0,14676 0,76924 0,02 Reliability 0,0387 0,0676 0,3544
Matrix inconsistency 0,06
FLANGERVALUE SCORES
Results from Super DecisionsValues Comparison Low rating Medium rating High rating Low Medium HighAvailability 0,09162 0,11111 0,11111 0,77778 0,000 Availability 0,0102 0,0102 0,0713Effectiveness 0,1948 0,09051 0,15125 0,75825 0,031 Effectiveness 0,0176 0,0295 0,1477Efficiency 0,49849 0,0813 0,13493 0,78377 0,034 Efficiency 0,0405 0,0673 0,3907Reliability 0,21509 0,11111 0,11111 0,77778 0,000 Reliability 0,0239 0,0239 0,1673
Matrix inconsistency 0,09
Matrix inconsistency for ratings
Matrix inconsistency for ratings
Matrix inconsistency for ratings
Matrix inconsistency for ratings
Matrix inconsistency for ratings
Matrix inconsistency for ratings
Matrix inconsistency for ratings
195

APPENDIX F. CALCULATION OF THE VALUE SCORES FOR DIRECT AND INDIRECT MAINTENANCE ACTIVITIES
1. INDICATE THE AVAILABILITY OF PERFORMING DIFFERENT ACTIVITIES TO ADDRESS THE FAILURE MODES/FUNCTIONAL FAILURES BY THE SERVICE PROVIDER 2. COMPARE TWO (OR MORE) POSSIBLE SERVICE OFFERINGS FOR THE INDUSTRIAL USER'S SPECIFIC CASE
AREA MACHINE GROUP FAILURES MODE/S VALUE SCORE(Plant area code) (Name given to the machine group)
(Visible or physical evidence of the occurence of the
functional failure) (Vff)Corrective
maintenance
Equipment condition
inspections
Quality output
inspectionsPreventive
maintenanceCondition-based
maintenanceCorrective
maintenance
Equipment condition
inspections
Quality output
inspectionsPreventive
maintenance
Condition-based
maintenanceCorrective
maintenance
Equipment condition
inspections
Quality output
inspectionsPreventive
maintenance
Condition-based
maintenanceCorrective
maintenance
Equipment condition
inspections
Quality output
inspectionsPreventive
maintenance
Condition-based
maintenanceOne of the components is broken 0,354 1 1 1 1
The products is outside the specification l imits 0,484 1 1 1 1 1 1Quality loss that comes out in subsequent operations 0,439 1 1 1 1 1Isolation system is broken 1,336 1 1 1 1 1One of the components of the automation is broken 0,458 1 1 1 1One of the components loses its accuracy 0,149 1 1 1 1 1Malfunctioning of any of the components 0,207 1 1 1 1 1 1Machine does not pick any piece, though continues working 0,207 1 1 1 1 1Failure of one of the electrical components 0,236 1 1 1 1Wearing of the sensor 0,709 1 1 1 1One of the component works out of speed rate (design speed) 0,229 1 1 1 1 1Wearing of the seals 1,334 1 1 1 1
One of the components is broken 0,430 1 1 1 1 1 1Perform the process with non-quality output 0,401 1 1 1 1 1 1Wearing of one of the components or more 0,120 1 1 1 1 1
Machine controller fails 0,701 1 1 1 1
One of the component is broker 0,331 1 1 1 1 1 1Failure immediately evident 0,363 1 1 1 1Failure immediately evident 0,333 1 1 1 1 1 1Failure immediately evident 0,164 1 1 1 1
8,350 2,661 1,324 1,258 0,207 0,000 0,000 0,000 0,000 0,000 0,922 2,734 0,000 1,548 0,439 1,399 3,736
0,000 3,656 7,122TOTAL VALUE OF VDA (SO1): TOTAL VALUE OF VDA (SO2): TOTAL VALUE OF VDA (SO3):
CAB
WELDING MACHINES (includes electric arc, automated and laser
welding machines)
MASS SPECTROMETRY
WASHING MACHINE (includes the washing machine Fribrimatic)
SLEEVES (including the sleeves loading units)
LAV
TSD MACHINES (includes the machines working directly on the transmitter, such as electric dril l ing machine, dril l ing machine MAKINO, lathe BRUCK, levigation machine, mill ing machine.
COM
COMPENSATION SYSTEM (includes climatic chambers, pressure
generator and compensation system except chambers)
FLANGER MACHINE (Flanger machine VEGETTI)
INCLUSION OF ACTIVITIES IN SERVICE OFFERING 3 (SO3)DIRECT MAINTENANCE ACTIVITIESDIRECT MAINTENANCE ACTIVITIES
AVAILABILITY OF ACTIVITIES FROM PROVIDER SIDE INCLUSION OF ACTIVITIES IN SERVICE OFFERING 1 (SO1)DIRECT MAINTENANCE ACTIVITIES
INCLUSION OF ACTIVITIES IN SERVICE OFFERING 2 (SO2)DIRECT MAINTENANCE ACTIVITIES
196
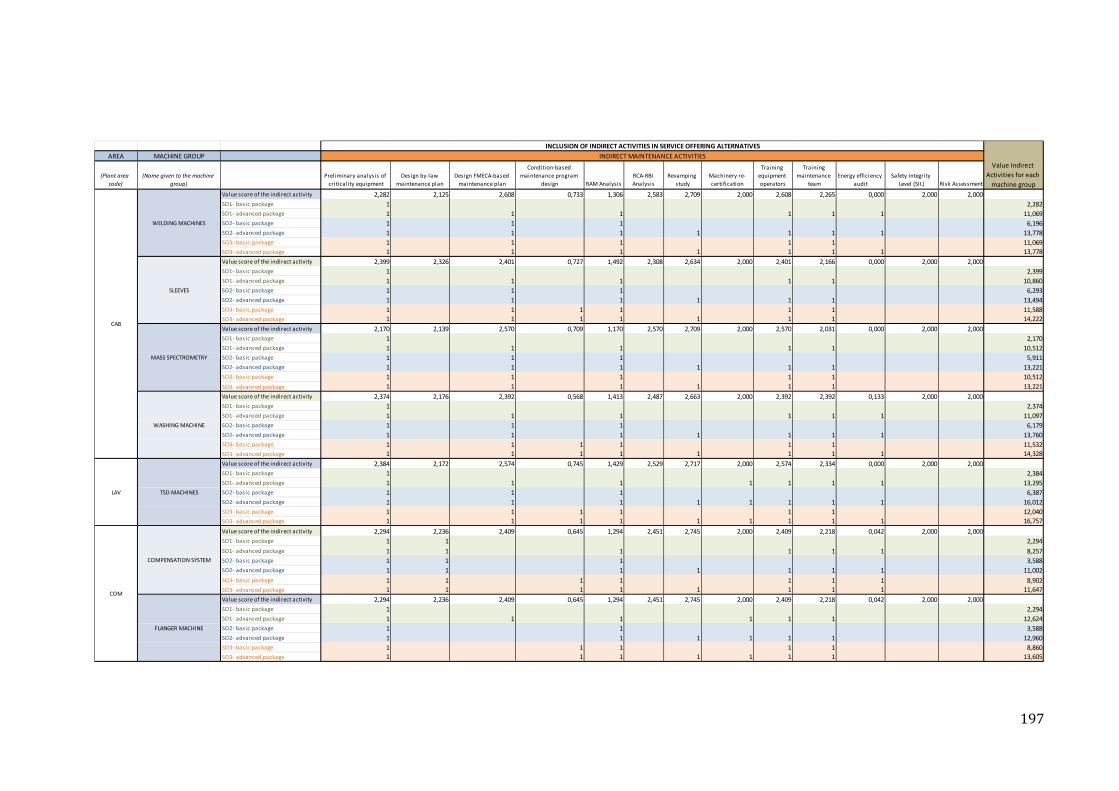
AREA MACHINE GROUP
(Plant area code)
(Name given to the machine group)
Preliminary analysis of criticality equipment
Design by-law maintenance plan
Design FMECA-based maintenance plan
Condition-based maintenance program
design RAM AnalysisRCA-RBI Analysis
Revamping study
Machinery re-certification
Training equipment operators
Training maintenance
teamEnergy efficiency
auditSafety Integrity
Level (SIL) Risk Assessment
Value score of the indirect activity 2,282 2,125 2,608 0,733 1,306 2,583 2,709 2,000 2,608 2,265 0,000 2,000 2,000SO1- basic package 1 2,282SO1- advanced package 1 1 1 1 1 1 11,069SO2- basic package 1 1 1 6,196SO2- advanced package 1 1 1 1 1 1 1 13,778SO3- basic package 1 1 1 1 1 11,069SO3- advanced package 1 1 1 1 1 1 1 13,778Value score of the indirect activity 2,399 2,326 2,401 0,727 1,492 2,308 2,634 2,000 2,401 2,166 0,000 2,000 2,000SO1- basic package 1 2,399SO1- advanced package 1 1 1 1 1 10,860SO2- basic package 1 1 1 6,293SO2- advanced package 1 1 1 1 1 1 13,494SO3- basic package 1 1 1 1 1 1 11,588SO3- advanced package 1 1 1 1 1 1 1 14,222Value score of the indirect activity 2,170 2,139 2,570 0,709 1,170 2,570 2,709 2,000 2,570 2,031 0,000 2,000 2,000SO1- basic package 1 2,170SO1- advanced package 1 1 1 1 1 10,512SO2- basic package 1 1 1 5,911SO2- advanced package 1 1 1 1 1 1 13,221SO3- basic package 1 1 1 1 1 10,512SO3- advanced package 1 1 1 1 1 1 13,221Value score of the indirect activity 2,374 2,176 2,392 0,568 1,413 2,487 2,663 2,000 2,392 2,392 0,133 2,000 2,000SO1- basic package 1 2,374SO1- advanced package 1 1 1 1 1 1 11,097SO2- basic package 1 1 1 6,179SO2- advanced package 1 1 1 1 1 1 1 13,760SO3- basic package 1 1 1 1 1 1 11,532SO3- advanced package 1 1 1 1 1 1 1 1 14,328Value score of the indirect activity 2,384 2,172 2,574 0,745 1,429 2,529 2,717 2,000 2,574 2,334 0,000 2,000 2,000SO1- basic package 1 2,384SO1- advanced package 1 1 1 1 1 1 1 13,295SO2- basic package 1 1 1 6,387SO2- advanced package 1 1 1 1 1 1 1 1 16,012SO3- basic package 1 1 1 1 1 1 12,040SO3- advanced package 1 1 1 1 1 1 1 1 1 16,757Value score of the indirect activity 2,294 2,236 2,409 0,645 1,294 2,451 2,745 2,000 2,409 2,218 0,042 2,000 2,000SO1- basic package 1 1 2,294SO1- advanced package 1 1 1 1 1 1 8,257SO2- basic package 1 1 1 3,588SO2- advanced package 1 1 1 1 1 1 1 11,002SO3- basic package 1 1 1 1 1 1 1 8,902SO3- advanced package 1 1 1 1 1 1 1 1 11,647Value score of the indirect activity 2,294 2,236 2,409 0,645 1,294 2,451 2,745 2,000 2,409 2,218 0,042 2,000 2,000SO1- basic package 1 2,294SO1- advanced package 1 1 1 1 1 1 12,624SO2- basic package 1 1 3,588SO2- advanced package 1 1 1 1 1 1 12,960SO3- basic package 1 1 1 1 1 8,860SO3- advanced package 1 1 1 1 1 1 1 13,605
Value Indirect Activities for each
machine group
INCLUSION OF INDIRECT ACTIVITIES IN SERVICE OFFERING ALTERNATIVESINDIRECT MAINTENANCE ACTIVITIES
COM
CAB
LAV
WELDING MACHINES
SLEEVES
MASS SPECTROMETRY
WASHING MACHINE
TSD MACHINES
COMPENSATION SYSTEM
FLANGER MACHINE
197