SUSTAINABLE SAN JOSÉ - SPUR · 2017-11-16 · Sustainable San José ... Public Art Community...
65
1 SUSTAINABLE SAN JOSÉ ENVIRONMENTAL SUSTAINABILITY PLAN (ESP) SAN JOSÉ ENVIRONMENTAL SUSTAINABILITY PLAN PRESENTATION TO SAN JOSÉ CITY COUNCIL 21 ST AUGUST 2017 DISCLAIMER: The Project Team is finalizing materials in advance of the Report’s launch in September. All numbers and content subject to final validation.
Transcript of SUSTAINABLE SAN JOSÉ - SPUR · 2017-11-16 · Sustainable San José ... Public Art Community...

1
SUSTAINABLE SAN JOSÉ ENVIRONMENTAL SUSTAINABILITY PLAN (ESP)
S A N J O S É E N V I R O N M E N T A L S U S T A I N A B I L I T Y P L A N
PRESENTATION TO SAN JOSÉ CITY COUNCIL21ST AUGUST 2017
DISCLAIMER:The Project Team is finalizing materials in advance of the Report’s launch in September. All numbers and content subject to final validation.
2 S A N J O S É E N V I R O N M E N T A L S U S T A I N A B I L I T Y P L A N
Envision 2040 San José General Plan
San José Economic Strategy
Environmental Sustainability Plan
Sustainable San José
IF THERE IS ONLY ONE THING THAT YOU TAKE AWAY:THE ESP BUILDS ON WORK ALREADY UNDERWAY

3
THRIVING
COMMUNITY
Diverse and
Innovative
Economy
IE-1
Land Use and
Employment
IE-2
Business
Growth and
Retention
IE-3
Regional,
State, &
National
Leadership
IE-4
Connections
to Promote
Economic
Development
IE-5
Cultural
Attractions
IE-6
Broad
Economic
Prosperity
IE-7
Clean
Technology
Arts and Culture
AC-1
San José as
the Silicon
Valley Cultural
Center
AC-2
High Impact
Public Art
Community
Engagement
CE-1
Active
Community
Engagement
CE-2
Community
Partnerships
Fiscal
Sustainability
FS-1
City
Operations
FS-2
Cultivate
Fiscal
Resources
FS-3
Fiscally
Sustainable
Land Use
Framework
FS-4
Promote
Fiscally
Beneficial
Land Use
FS-5
Fiscally
Sustainable
Service
Delivery
FS-6
Fiscally
Sustainable
Waste
Management
ENVIRONMENTAL
LEADERSHIP
Measurable
Environmental
Sustainability
MS-1
Green
Building Policy
Leadership
MS-2
Energy
Conservation
and
Renewable
Energy Use
MS-3
Water
Conservation
and Quality
MS-4
Healthful
Indoor
Environment
MS-5
Waste
Diversion
MS-6
Waste
Reduction
MS-7
Environmental
Leadership
and Innovation
MS-8
Environmental
Stewardship
MS-9
Service
Delivery
MS-10
Air Pollutant
Emission
Reduction
MS-11
Toxic Air
Contaminants
MS-12
Objectional
Odors
MS-13
Construction
Air Emissions
MS-14
Reduce
Consumption
and Increase
Efficiency
MS-15
Renewable
Energy
MS-16
Energy
Security
MS-17
Responsible
Management
of Water
Supply
MS-18
Water
Conservation
MS-19
Water
Recycling
MS-20
Water Quality
MS-21
Community
Forest
Environmental
Resources
ER-1
Grassland,
Oak
Woodlands,
Chaparral,
and Coast
Scrub
ER-2
Riparian
Corridors
ER-3
Bay and
Baylands
ER-4
Special-Status
Plants and
Animals
ER-5
Migratory
Birds
ER-6
Urban Natural
Interface
ER-7
Wildlife
Movement
ER-8
Stormwater
ER-9
Water
Resources
ER-10
Archaeology
and
Paleontology
ER-11
Extractive
Resources
Environmental
Considerations /
Hazards
EC-1
Community
Noise Levels
and Land Use
Compatability
EC-2
Vibration
EC-3
Seismic
Hazards
EC-4
Geologic and
Soil Hazards
EC-5
Flooding
Hazards
EC-6
Hazardous
Materials
EC-7
Environmental
Contamination
EC-8
Wildland and
Urban Fire
Hazards
Infrastructure
IN-1
General
Provision of
Infrastructure
IN-2
Infrastructure
Management
IN-3
Water Supply,
Sanitary
Sewer, and
Storm
Drainage
IN-4
Wastewater
Treatment and
Water
Reclamation
IN-5
Solid Waste-
Materials
Recovery /
Landfill
IN-6
Telecommunic
ations
QUALITY OF LIFE
Vibrant
Neighborhoods
VN-1
Vibrant,
Attractive, and
Complete
Neighborhood
s
VN-2
Community
Empowerment
VN-3
Access to
Healthful
Foods
VN-4
Cultural
Opportunities
VN-5
Private
Community
Gathering
Facilities
Community
Design
CD-1
Attractive City
CD-2
Function
CD-3
Connections
CD-4
Compatibility
CD-5
Community
Health,
Safety, and
Wellness
CD-6
Downtown
Urban Design
CD-7
Urban Villages
CD-8
Building
Height
CD-9
Access to
Scenic
Resources
CD-10
Attractive
Gateways
Housing
H-1
Housing -
Social Equity
and Diversity
H-2
Affordable
Housing
H-3
High Quality
Housing and
Great Places
H-4
Housing -
Environmental
Sustainability
Education and
Services
ES-1
Education
ES-2
Libraries
ES-3
Law
Enforcement
and Fire
Protection
ES-4
Emergency
Management
ES-5
Code
Enforcement
ES-6
Access to
Medical
Services
Parks, Open
Space and
Recreation
PR-1
High Quality
Facilities and
Programs
PR-2
Contribute to a
Healthful
Community
PR-3
Provide an
Equitable Park
System
PR-4
Community
Identity
PR-5
Grand Parks
PR-6
Sustainable
Parks and
Recreation
PR-7
Interconnecte
d Parks
System
PR-8
Fiscal
Management
of Parks and
Recreation
Resources
LAND USE AND
TRANSPORTATION
Land Use
Policies
LU-1
General Land
Use
LU-2
Growth Areas
LU-3
Downtown
LU-4
Commercial
LU-5
Neighborhood
Serving
Commercial
LU-6
Industrial
Preservation
LU-7
Attract New
Industrial
Uses
LU-8
Maintain
Employment
Lands
LU-9
High-Quality
Living
Environments
LU-10
Efficient Use
of Residential
and Mixed-
Use Lands
LU-11
Residential
Neighborhood
s
LU-12
Urban
Agriculture
LU-13
Landmarks
and Districts
LU-14
Historic
Structures of
Lesser
Significance
LU-15
Public
Awareness
LU-16
Sustainable
Practices
LU-17
Hillside / Rural
Preservation
LU-18
Hillside
Development
Hazard
Avoidance
LU-19
Urban Growth
Boundary
(Open Hillside
/ Agriculture
Lands)
LU-20
Rural
Agriculture
Transportation
Policies
TR-1
Balanced
Transportation
System
TR-2
Walking and
Bicycling
TR-3
Maximize Use
of Public
Transit
TR-4
Passenger
Rail Service
TR-5
Vehicular
Circulation
TR-6
Goods
Movement
TR-7
Transportation
Demand
Management
TR-8
Parking
Strategies
TR-9
Tier I
Reduction of
Vehicle Miles
Traveled
TR-10
Tier II Vehicle
Miles Traveled
Reduction
TR-11
Regional and
State VMT
Reduction
Efforts
TR-12
Intelligent
Transportation
System
TR-13
Attractive and
Accessible
Airport
TR-14
Safe Airport
TR-15
Moffett Field
TN-1
National
Model for Trail
Development
and Use
TN-2
Trails as
Transportation
TN-3
Accessible,
Safe, and
Well-
Functioning
Trails
IMPLEMENTATION Implementation
IP-1
Land Use /
Transportation
Diagram
IP-2
General Plan
Phasing /
Planning
Horizons /
Major Review
IP-3
General Plan
Annual
Review and
Measureable
Sustainability
IP-4
General Plan
Annual
Review
Hearing
Process
IP-5
Urban Village
Planning
IP-6
Capital
Improvement
Program
IP-7
Specific Plans
IP-8
Zoning
IP-9
Subdivision
IP-10
Site
Development
IP-11
Annexations
IP-12
Environmental
Clearance
IP-13
Building
Permits
IP-14
Citizen
Participation
and
Community
Engagement
IP-15
Development
Fees, Taxes,
and
Improvement
Requirements
IP-16
Implementatio
n of the
General Plan
by Other
Agencies
IP-17
Environmental
Leadership /
Stewardship
IP-18
Economic
Development
IP-19
Housing
Development
THE ESP REQUIRES
ACTIVATION OF 73% OF THE GENERAL PLAN’S GOALS
S A N J O S É E N V I R O N M E N T A L S U S T A I N A B I L I T Y P L A N
CHAPTERS GOALS
KEY
The ESP drives progress on this goal
The ESP enables progresson this goal
The ESP aligns with this goal
The ESP does not actively consider this goal
4 4
1. Recap on WHY we’re doing this
2. Overview of WHAT we’re doing
3. HOW City Hall and the Community can implement
4. Q&A with Council
5. Hear from general public
FRAMING FOR TODAY’S SESSION
S A N J O S É E N V I R O N M E N T A L S U S T A I N A B I L I T Y P L A N

5 S A N J O S É E N V I R O N M E N T A L S U S T A I N A B I L I T Y P L A N
RECAP ON WHY WE’RE DOING THIS
1
6 S A N J O S É E N V I R O N M E N T A L S U S T A I N A B I L I T Y P L A N
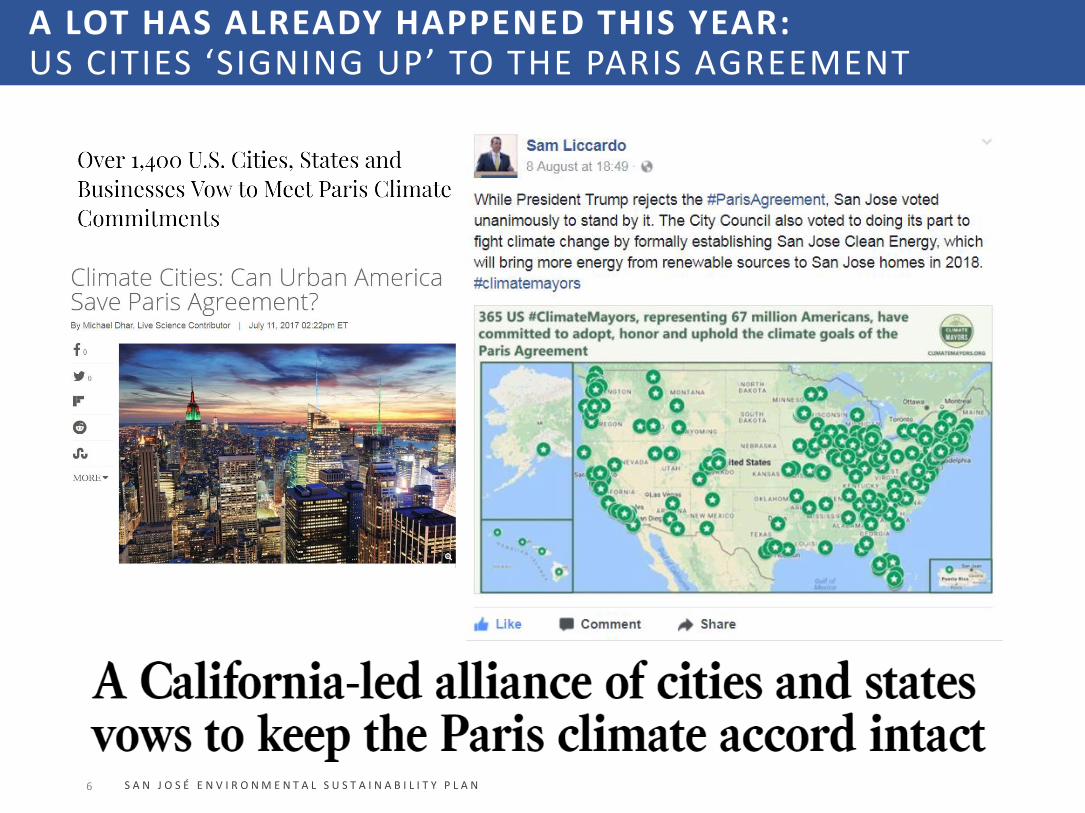
A LOT HAS ALREADY HAPPENED THIS YEAR:US CITIES ‘SIGNING UP’ TO THE PARIS AGREEMENT

7 S A N J O S É E N V I R O N M E N T A L S U S T A I N A B I L I T Y P L A N
A LOT HAS ALREADY HAPPENED THIS YEAR:SAN JOSÉ’S COMMUNITY CHOICE ENERGY SUCCESS
8 S A N J O S É E N V I R O N M E N T A L S U S T A I N A B I L I T Y P L A N
OVERVIEW OF WHATWE’RE DOING
2

9 S A N J O S É E N V I R O N M E N T A L S U S T A I N A B I L I T Y P L A N
1DATA: Understand what is important from a carbon and water point of view, and how far the General Plan takes us
2OUTREACH: Solicit ideas from the community, comparators and the data to identify sustainability measures
3IDEAS: Filter ideas into a short-list of sustainability measures
4ANALYSIS: Model the costs and carbon benefits of each measure
5PATHWAY: Integrate and sequence measures to identify San José’s Paris-compliant pathway for emissions reduction
IN THE MEANTIME, WE’VE BEEN DOING THE FOLLOWING TO PROGRESS THIS WORK:

10
0.0
2.0
4.0
6.0
8.0
10.0
19
90
19
92
19
94
19
96
19
98
20
00
20
02
20
04
20
06
20
08
20
10
20
12
20
14
20
16
20
18
20
20
20
22
20
24
20
26
20
28
20
30
20
32
20
34
20
36
20
38
20
40
20
42
20
44
20
46
20
48
20
50
Mill
ion
to
nn
esca
rbo
n d
ioxi
de
equ
ival
ent
per
yea
r (M
tCO
2e/
yr)
S A N J O S É E N V I R O N M E N T A L S U S T A I N A B I L I T Y P L A N
WE STARTED BY LOOKING AT SAN JOSÉ’S CLIMATE PROFILE

11 S A N J O S É E N V I R O N M E N T A L S U S T A I N A B I L I T Y P L A N

12
0.0
2.0
4.0
6.0
8.0
10.0
19
90
19
92
19
94
19
96
19
98
20
00
20
02
20
04
20
06
20
08
20
10
20
12
20
14
20
16
20
18
20
20
20
22
20
24
20
26
20
28
20
30
20
32
20
34
20
36
20
38
20
40
20
42
20
44
20
46
20
48
20
50
Mill
ion
to
nn
esca
rbo
n d
ioxi
de
equ
ival
ent
per
yea
r (M
tCO
2e/
yr)
S A N J O S É E N V I R O N M E N T A L S U S T A I N A B I L I T Y P L A N
San José baseline and projection California AB32 and SB32 (EO-S-3-05 and EO-B-30-15) targets
Paris-compliant 2°C pathway(6.5% p.a. decarbonization rate)
8.9
7.8
9.6
7.06.7
MtCO2e
1.1
0.8
3.4Pro-rated emissions targets for San José
Reduce GHG emissions to 1990 levels by 2020
Reduce GHG emissions 80% below 1990 levels by 2050
Reduce GHG emissions 40% below 1990 levels by 2030
MtCO2e
WE STARTED BY LOOKING AT SAN JOSÉ’S CLIMATE PROFILE

13 S A N J O S É E N V I R O N M E N T A L S U S T A I N A B I L I T Y P L A N
2
3
1 3.8MtCO2e
TRANSPORT
0.9RESIDENTIAL BUILDINGS
1.3COMMERCIAL &
INDUSTRIAL BUILDINGS
0.7OTHER
6.7MtCO2e
CITY-WIDE CARBON
FOOTPRINT (2017)
Gasoline
Diesel
Natural Gas
ElectricityRenewable Electricity
...AND ITS DRIVERS, WHICH TOLD US WHERE TO FOCUS
4

14
0.0
2.0
4.0
6.0
8.0
10.0
19
90
19
92
19
94
19
96
19
98
20
00
20
02
20
04
20
06
20
08
20
10
20
12
20
14
20
16
20
18
20
20
20
22
20
24
20
26
20
28
20
30
20
32
20
34
20
36
20
38
20
40
20
42
20
44
20
46
20
48
20
50
Mill
ion
to
nn
esca
rbo
n d
ioxi
de
equ
ival
ent
per
yea
r (M
tCO
2e/
yr)
S A N J O S É E N V I R O N M E N T A L S U S T A I N A B I L I T Y P L A N
San José baseline and projection California AB32 and SB32 (EO-S-3-05 and EO-B-30-15) targets
Paris-compliant 2°C pathway(6.5% p.a. decarbonization rate)
8.9
7.8
9.6
7.06.7
MtCO2e
1.1
0.8
3.4Pro-rated emissions targets for San José
Reduce GHG emissions to 1990 levels by 2020
Reduce GHG emissions 80% below 1990 levels by 2050
Reduce GHG emissions 40% below 1990 levels by 2030
MtCO2e
General Plan
The General Plan (specifically those related clean energy, densification, city vehicles and building retrofit) takes us part of the way there, but not far enough
INCORPORATING PLANNED POLICIES TO UNDERSTAND THE GAP THAT NEEDS TO BE BRIDGED
15
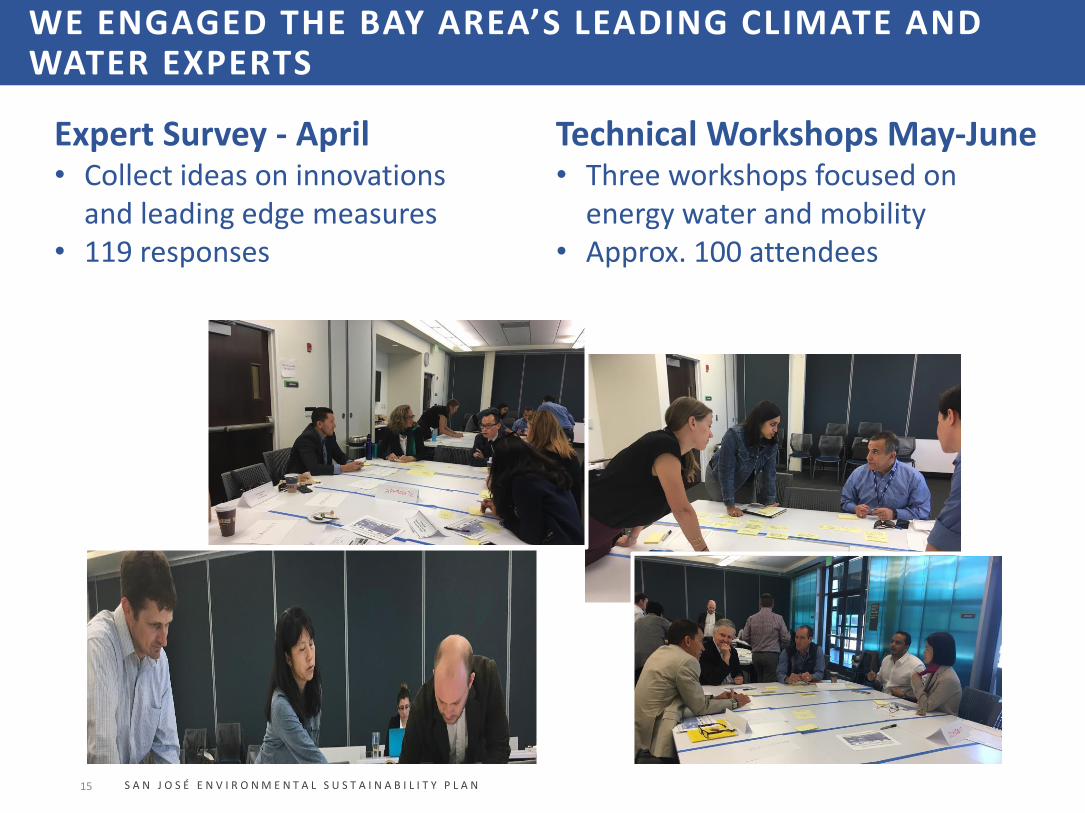
Expert Survey - April• Collect ideas on innovations
and leading edge measures • 119 responses
Technical Workshops May-June• Three workshops focused on
energy water and mobility• Approx. 100 attendees
WE ENGAGED THE BAY AREA’S LEADING CLIMATE AND WATER EXPERTS
S A N J O S É E N V I R O N M E N T A L S U S T A I N A B I L I T Y P L A N

16
• April 19 Town Hall
• 5 District meetings
• Youth Council
• June 17th
Earthquakes game
AND INVITED THE VIEWS OF SAN JOSÉ RESIDENTS AND COMMUNITY GROUPS
S A N J O S É E N V I R O N M E N T A L S U S T A I N A B I L I T Y P L A N

17
Objective• Understand
people’s feelings, perspectives, and actions on sustainability issues and The Good Life
• 2,100 responses • 1,800 ideas
submittedWord cloud generated
from responses to a question on what the
good life means to you.
WHICH HELPED US DEVELOP A VISION FOR THE GOOD LIFE, AND WHAT IT MEANS FOR RESIDENTS OF THE CITY
S A N J O S É E N V I R O N M E N T A L S U S T A I N A B I L I T Y P L A N

18 S A N J O S É E N V I R O N M E N T A L S U S T A I N A B I L I T Y P L A N
Documents we’ve reviewed
Expert survey responses
City benchmarks
1198880+Town hall attendees
100
Ideas for sustainability measures
710
THIS HELPED US COMPILE A LONG LIST OF SUSTAINABILITY MEASURES
19 S A N J O S É E N V I R O N M E N T A L S U S T A I N A B I L I T Y P L A N
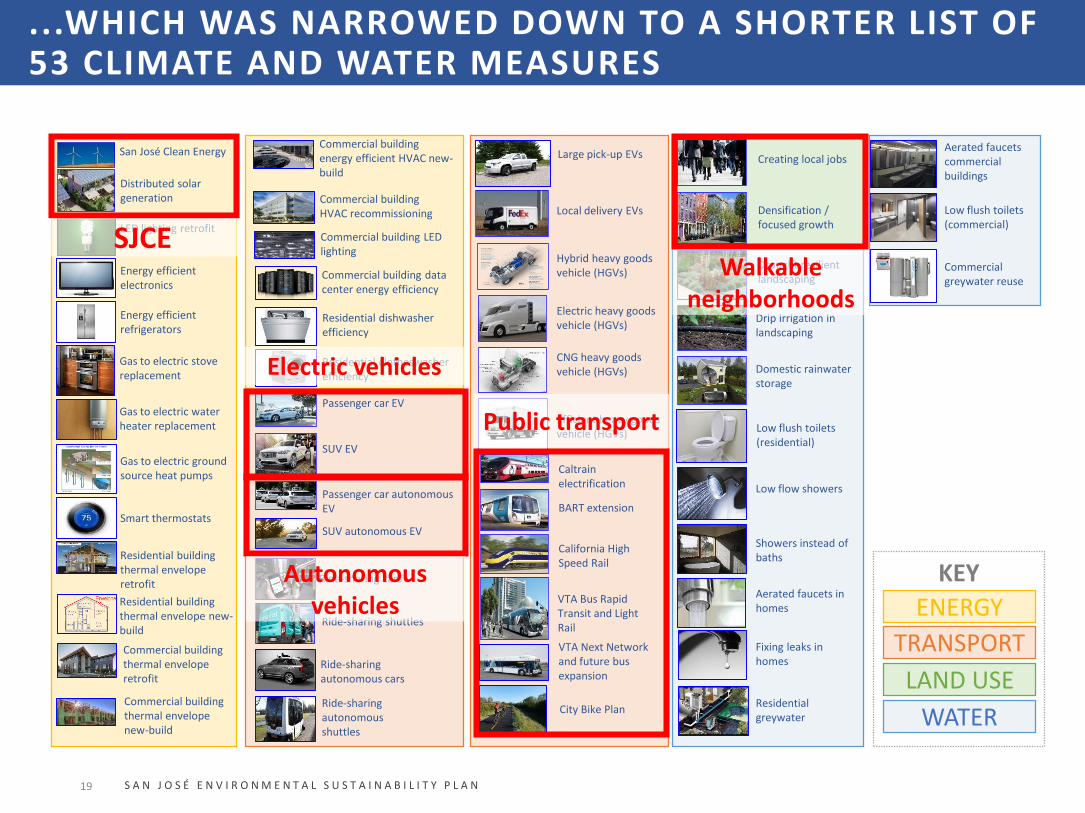
San José Clean Energy
Distributed solar generation
LED lighting retrofit
Energy efficient electronics
Energy efficient refrigerators
Gas to electric stove replacement
Gas to electric water heater replacement
Gas to electric ground source heat pumps
Smart thermostats
Residential building thermal envelope retrofit
Residential building thermal envelope new-build
Commercial building thermal envelope retrofit
Commercial building thermal envelope new-build
Commercial building energy efficient HVAC new-build
Commercial building HVAC recommissioning
Commercial building LED lighting
Commercial building data center energy efficiency
Residential dishwasher efficiency
Residential clotheswasherefficiency
Passenger car EV
SUV EV
Passenger car autonomous EV
SUV autonomous EV
Ride-sharing cars
Ride-sharing autonomous cars
Ride-sharing shuttles
Ride-sharing autonomous shuttles
Large pick-up EVs
Local delivery EVs
Hybrid heavy goods vehicle (HGVs)
Electric heavy goods vehicle (HGVs)
CNG heavy goods vehicle (HGVs)
Efficient heavy goods vehicle (HGVs)
Caltrainelectrification
BART extension
California High Speed Rail
VTA Bus Rapid Transit and Light Rail
VTA Next Network and future bus expansion
City Bike Plan
Creating local jobs
Densification / focused growth
Drought resilient landscaping
Drip irrigation in landscaping
Domestic rainwater storage
Low flush toilets (residential)
Low flow showers
Showers instead of baths
Aerated faucets in homes
Fixing leaks in homes
Residential greywater
Aerated faucets commercial buildings
Low flush toilets (commercial)
Commercial greywater reuse
WATER
LAND USE
TRANSPORT
ENERGY
KEY
SJCE
Electric vehicles
Autonomous vehicles
Public transport
Walkable neighborhoods
...WHICH WAS NARROWED DOWN TO A SHORTER LIST OF 53 CLIMATE AND WATER MEASURES

20 S A N J O S É E N V I R O N M E N T A L S U S T A I N A B I L I T Y P L A N
Climate and water STRATEGIES
1.1Transition to a
renewable energy future
1.2Embrace our
Californian climate
2.1Densify our city to accommodate our future neighbors
2.2Make homes efficient and
affordable for our families
2.3Create clean, personalized
mobility choices
2.4Develop integrated,
accessible public transport
infrastructure
3.1Create local jobs
3.2Improve our
commercial building stock
3.3Make commercial goods movement clean and efficient
A SUSTAINABLE AND CLIMATE-
SMART CITY
A VIBRANT CITY OF CONNECTED AND FOCUSED GROWTH
AN ECONOMICALLY INCLUSIVE CITY OF OPPORTUNITY
PILLARS of what residents want
1 2 3
3.1 3.3
3.2
2.1 2.3
2.42.21.2
1.1
WE STRUCTURED THIS INTO 3 PILLARS AND 9 STRATEGIES THAT WOULD TAILOR THE ‘GOOD LIFE’ FOR SAN JOSÉ
21 S A N J O S É E N V I R O N M E N T A L S U S T A I N A B I L I T Y P L A N
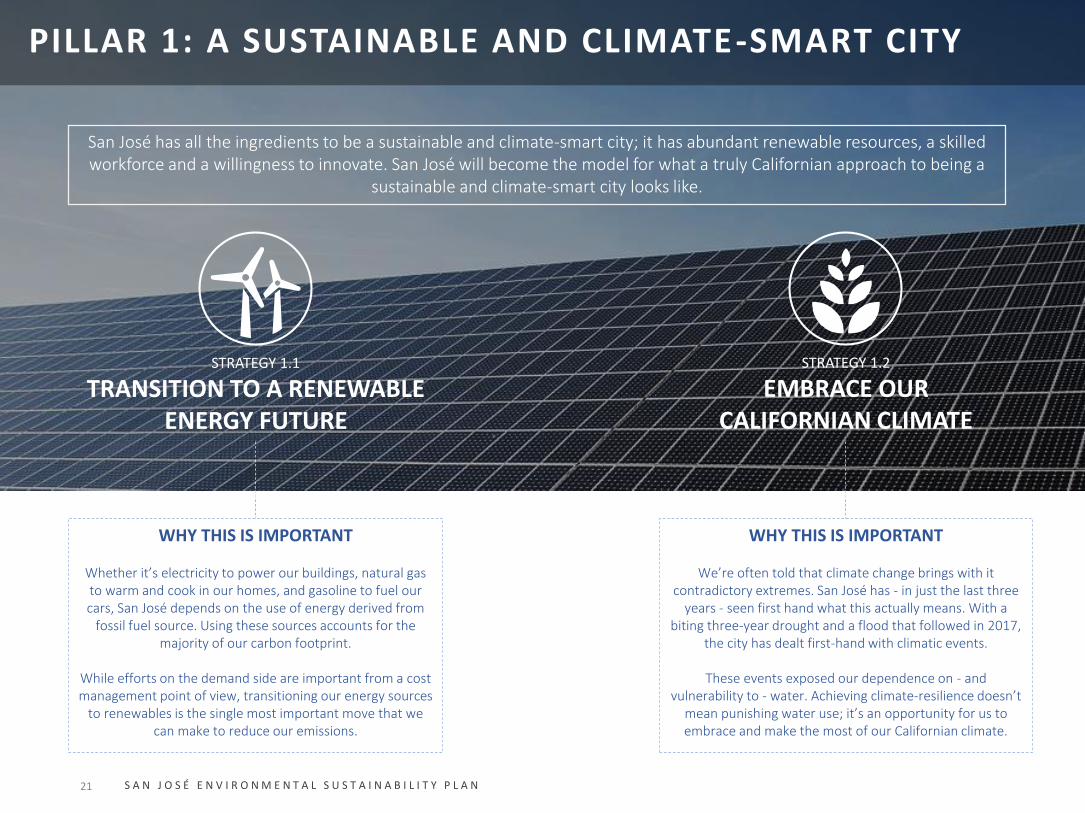
San José has all the ingredients to be a sustainable and climate-smart city; it has abundant renewable resources, a skilled workforce and a willingness to innovate. San José will become the model for what a truly Californian approach to being a
sustainable and climate-smart city looks like.
STRATEGY 1.1
TRANSITION TO A RENEWABLE ENERGY FUTURE
STRATEGY 1.2
EMBRACE OUR CALIFORNIAN CLIMATE
WHY THIS IS IMPORTANT
Whether it’s electricity to power our buildings, natural gas to warm and cook in our homes, and gasoline to fuel our cars, San José depends on the use of energy derived from
fossil fuel source. Using these sources accounts for the majority of our carbon footprint.
While efforts on the demand side are important from a cost management point of view, transitioning our energy sources
to renewables is the single most important move that we can make to reduce our emissions.
WHY THIS IS IMPORTANT
We’re often told that climate change brings with it contradictory extremes. San José has - in just the last three
years - seen first hand what this actually means. With a biting three-year drought and a flood that followed in 2017,
the city has dealt first-hand with climatic events.
These events exposed our dependence on - and vulnerability to - water. Achieving climate-resilience doesn’t
mean punishing water use; it’s an opportunity for us to embrace and make the most of our Californian climate.
PILLAR 1: A SUSTAINABLE AND CLIMATE-SMART CITY

22 S A N J O S É E N V I R O N M E N T A L S U S T A I N A B I L I T Y P L A N
San José is the capital of Silicon Valley. We can use the best products, services and know how from our own back yard to enhance our city to be compact, smart and connected, which will combine intelligent planning with seamless mobility,
solving the problems of last-mile journeys and making moving around our city clean, efficient and convenient.
STRATEGY 2.1
DENSIFY OUR CITY TO ACCOMMODATE OUR FUTURE
NEIGHBORS
STRATEGY 2.2
MAKE HOMES EFFICIENT AND AFFORDABLE FOR OUR
FAMILIES
STRATEGY 2.3
CREATE CLEAN, PERSONALIZED MOBILITY CHOICES
STRATEGY 2.4
DEVELOP INTEGRATED, ACCESSIBLE PUBLIC
TRANSPORT INFRASTRUCTURE
PILLAR 2: A CONNECTED CITY OF VIBRANT AND FOCUSED GROWTH

23 S A N J O S É E N V I R O N M E N T A L S U S T A I N A B I L I T Y P L A N
WHY THIS IS IMPORTANT
Creating local jobs is not just a driver of economic development, it also brings
sustainability benefits in allowing workers to live close to where they work and reduce time, money and carbon emissions spent
commuting.
WHY THIS IS IMPORTANT
San José can offer productive, high-performance commercial real estate to
businesses that reduce their energy costs and, in doing so, contribute to reduced
energy demand.
WHY THIS IS IMPORTANT
Commercial vehicle movements in the city, including logistics and freight, contribute to the city’s overall carbon footprint. Working with the commercial sector, San José can
benefit from clean and efficient goods and logistics movement, contributing to
sustainability.
Economic development and sustainability are mutually reinforcing in San José; local job creation can lead to reduce carbon emissions, and high-performing logistics and real estate can be attractive to companies looking to do business in the city. Designing-in economic development and the requirements of business will make attaining a sustainable city all
the more feasible.
STRATEGY 3.1
CREATE LOCAL JOBSSTRATEGY 3.2
IMPROVE OUR COMMERCIAL BUILDING
STOCK
STRATEGY 3.3
MAKE COMMERCIAL GOODS MOVEMENT
CLEAN AND EFFICIENT
PILLAR 3: AN ECONOMICALLY INCLUSIVE CITY OF OPPORTUNITY

24 S A N J O S É E N V I R O N M E N T A L S U S T A I N A B I L I T Y P L A N
-$10,000
-$1,000
-$100
-$10
0
$10
$100
$1,000
$10,000
15010050
Carbon saved 2018-50
(MtCO2e)
Ma
rgin
al
ab
ate
me
nt
co
st
($/t
CO
2e
)
SAN JOSÉ CLEAN ENERGY-$29/tCO2e
DISTRIBUTED SOLAR NET METERING$359/tCO2e
STRATEGY 1.1
TRANSITION TO A RENEWABLE ENERGY FUTURE
THE COSTS & BENEFITS INFORM THE PATHWAY:MARGINAL ABATEMENT COST CURVE

25 S A N J O S É E N V I R O N M E N T A L S U S T A I N A B I L I T Y P L A N
-$10,000
-$1,000
-$100
-$10
0
$10
$100
$1,000
$10,000
15010050
Carbon saved 2018-50
(MtCO2e)
Ma
rgin
al
ab
ate
me
nt
co
st
($/t
CO
2e
)
FOCUSED GROWTH AND URBAN VILLAGES-$76/tCO2e
PASSENGER CAR EVs$162/tCO2e
STRATEGY 2.1
DENSIFY OUR CITY TO ACCOMMODATE OUR FUTURE NEIGHBORS
VTA NEXT NETWORK (LOCAL BUSES)
$79/tCO2e
PASSENGER SUV EVs$44/tCO2e
THE COSTS & BENEFITS INFORM THE PATHWAY:MARGINAL ABATEMENT COST CURVE

26 S A N J O S É E N V I R O N M E N T A L S U S T A I N A B I L I T Y P L A N
-$10,000
-$1,000
-$100
-$10
0
$10
$100
$1,000
$10,000
15010050
Carbon saved 2018-50
(MtCO2e)
Ma
rgin
al
ab
ate
me
nt
co
st
($/t
CO
2e
)
HOME WATER HEATERS-$64/tCO2e
IMPROVED THERMAL ENVELOPES$175/tCO2e
STRATEGY 2.2
MAKE HOMES EFFICIENT AND AFFORDABLE FOR OUR FAMILIES
ELECTRIC STOVES$79/tCO2e
GROUND SOURCE HEAT PUMPS-$89/tCO2e
EFFICIENT LIGHTING-$2,505/tCO2e
THE COSTS & BENEFITS INFORM THE PATHWAY:MARGINAL ABATEMENT COST CURVE
27 S A N J O S É E N V I R O N M E N T A L S U S T A I N A B I L I T Y P L A N
-$10,000
-$1,000
-$100
-$10
0
$10
$100
$1,000
$10,000
15010050
Carbon saved 2018-50
(MtCO2e)
Ma
rgin
al
ab
ate
me
nt
co
st
($/t
CO
2e
)
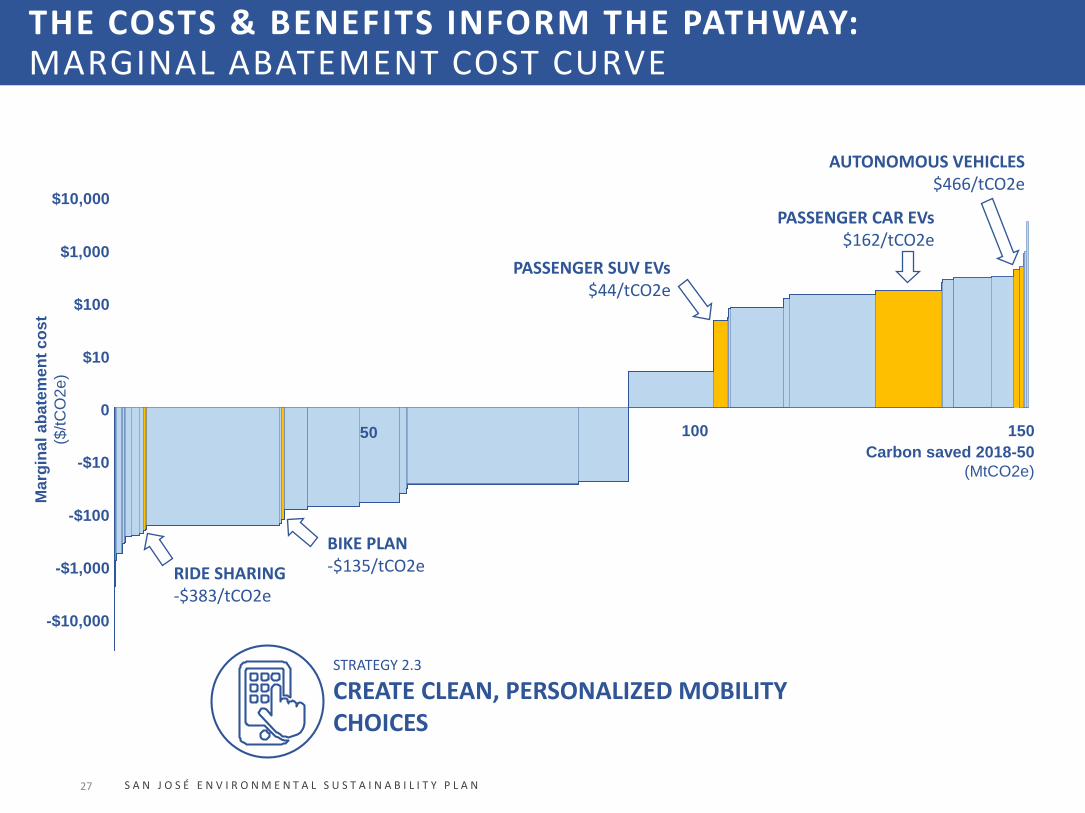
RIDE SHARING-$383/tCO2e
PASSENGER CAR EVs$162/tCO2e
STRATEGY 2.3
CREATE CLEAN, PERSONALIZED MOBILITY CHOICES
AUTONOMOUS VEHICLES$466/tCO2e
PASSENGER SUV EVs$44/tCO2e
BIKE PLAN-$135/tCO2e
THE COSTS & BENEFITS INFORM THE PATHWAY:MARGINAL ABATEMENT COST CURVE
28 S A N J O S É E N V I R O N M E N T A L S U S T A I N A B I L I T Y P L A N
-$10,000
-$1,000
-$100
-$10
0
$10
$100
$1,000
$10,000
15010050
Carbon saved 2018-50
(MtCO2e)
Ma
rgin
al
ab
ate
me
nt
co
st
($/t
CO
2e
)
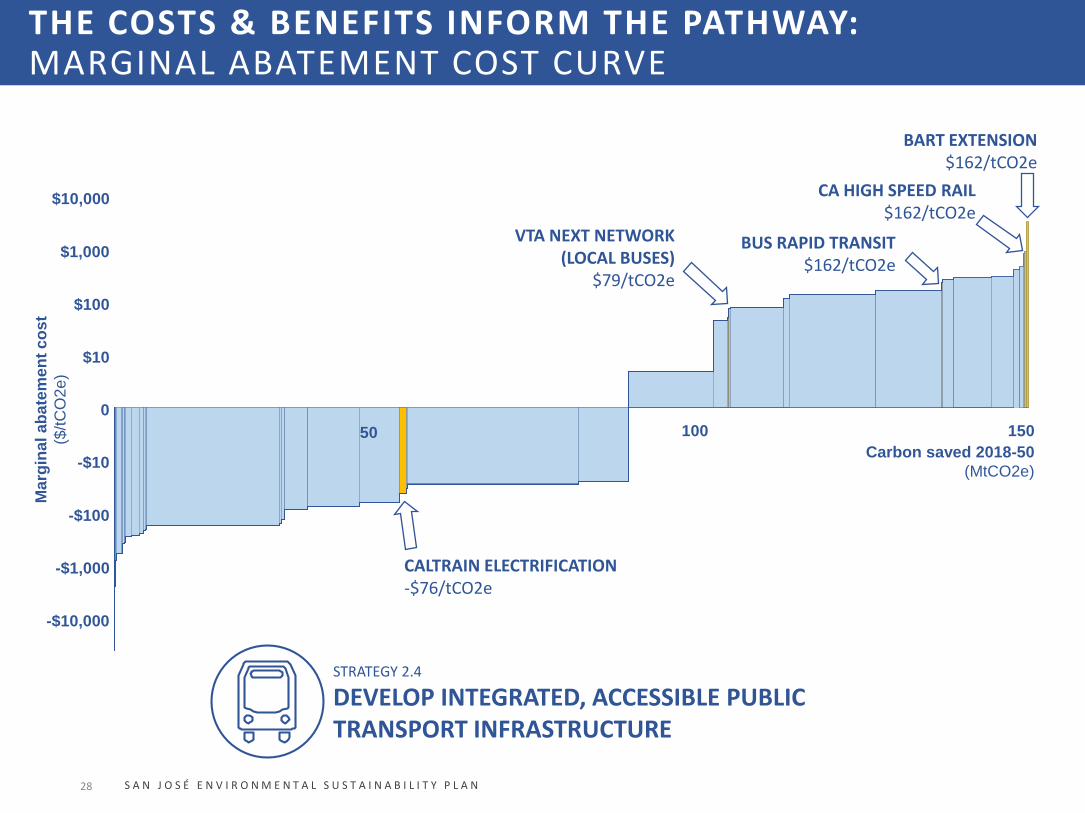
CALTRAIN ELECTRIFICATION-$76/tCO2e
BART EXTENSION$162/tCO2e
STRATEGY 2.4
DEVELOP INTEGRATED, ACCESSIBLE PUBLIC TRANSPORT INFRASTRUCTURE
VTA NEXT NETWORK (LOCAL BUSES)
$79/tCO2e
BUS RAPID TRANSIT$162/tCO2e
CA HIGH SPEED RAIL$162/tCO2e
THE COSTS & BENEFITS INFORM THE PATHWAY:MARGINAL ABATEMENT COST CURVE

29 S A N J O S É E N V I R O N M E N T A L S U S T A I N A B I L I T Y P L A N
-$10,000
-$1,000
-$100
-$10
0
$10
$100
$1,000
$10,000
15010050
Carbon saved 2018-50
(MtCO2e)
Ma
rgin
al
ab
ate
me
nt
co
st
($/t
CO
2e
)
LOCAL JOB CREATION-$177/tCO2e
STRATEGY 3.1
CREATE LOCAL JOBS
THE COSTS & BENEFITS INFORM THE PATHWAY:MARGINAL ABATEMENT COST CURVE

30 S A N J O S É E N V I R O N M E N T A L S U S T A I N A B I L I T Y P L A N
-$10,000
-$1,000
-$100
-$10
0
$10
$100
$1,000
$10,000
15010050
Carbon saved 2018-50
(MtCO2e)
Ma
rgin
al
ab
ate
me
nt
co
st
($/t
CO
2e
)
HVAC EFFICIENCY-$26/tCO2e
STRATEGY 3.2
IMPROVE OUR COMMERCIAL BUILDING STOCK
THERMOSTATS AND EFFICIENT OFFICE EQPMT-$588/tCO2e
THE COSTS & BENEFITS INFORM THE PATHWAY:MARGINAL ABATEMENT COST CURVE

31 S A N J O S É E N V I R O N M E N T A L S U S T A I N A B I L I T Y P L A N
-$10,000
-$1,000
-$100
-$10
0
$10
$100
$1,000
$10,000
15010050
Carbon saved 2018-50
(MtCO2e)
Ma
rgin
al
ab
ate
me
nt
co
st
($/t
CO
2e
)
HGV FUEL EFFICIENCY-$597/tCO2e
HGV HYBRIDS$261/tCO2e
STRATEGY 3.3
MAKE COMMERCIAL GOODS MOVEMENT CLEAN AND EFFICIENT
HGV EVs$140/tCO2e
LOCAL DELIVERY EVs$5/tCO2e
LARGE PICK-UPS EVs$298/tCO2e
THE COSTS & BENEFITS INFORM THE PATHWAY:MARGINAL ABATEMENT COST CURVE

32 S A N J O S É E N V I R O N M E N T A L S U S T A I N A B I L I T Y P L A N
San José’s emissions reduction profile through the ESP
Reduce GHG emissions to 1990 levels by 2020(California law)
Reduce GHG emissions 40% below 1990 levels by 2030(California law)
Reduce GHG emissions 80% below 1990 levels by 2050(California law)
Sustained 6.5% y-on-y emissions reduction to limit CC to <2°C (Paris Agreement)
PATHWAY TO A NEAR-ZERO CARBON FUTURE:ACHIEVING CALIFORNIA AND PARIS CLIMATE TARGETS

33 S A N J O S É E N V I R O N M E N T A L S U S T A I N A B I L I T Y P L A N
HOW CITY HALL AND THE
COMMUNITY CAN IMPLEMENT
3
34 S A N J O S É E N V I R O N M E N T A L S U S T A I N A B I L I T Y P L A N
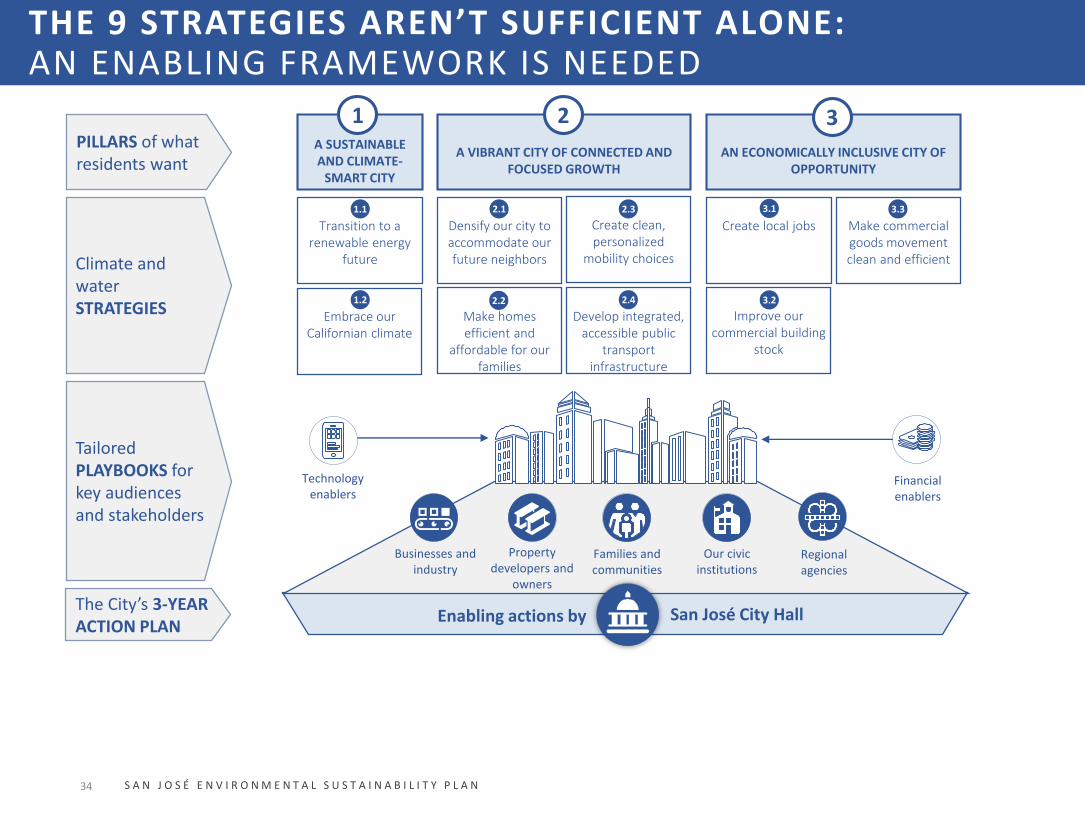
Climate and water STRATEGIES
TailoredPLAYBOOKS for key audiences and stakeholders
San José City HallEnabling actions by
Technology enablers
Financial enablers
Families and communities
Businesses and industry
Our civic institutions
Regional agencies
Property developers and
owners
1.1Transition to a
renewable energy future
1.2Embrace our
Californian climate
2.1Densify our city to accommodate our future neighbors
2.2Make homes efficient and
affordable for our families
2.3Create clean, personalized
mobility choices
2.4Develop integrated,
accessible public transport
infrastructure
3.1Create local jobs
3.2Improve our
commercial building stock
3.3Make commercial goods movement clean and efficient
A SUSTAINABLE AND CLIMATE-
SMART CITY
A VIBRANT CITY OF CONNECTED AND FOCUSED GROWTH
AN ECONOMICALLY INCLUSIVE CITY OF OPPORTUNITY
PILLARS of what residents want
1 2 3
The City’s 3-YEAR ACTION PLAN
3.1 3.3
3.2
2.1 2.3
2.42.21.2
1.1
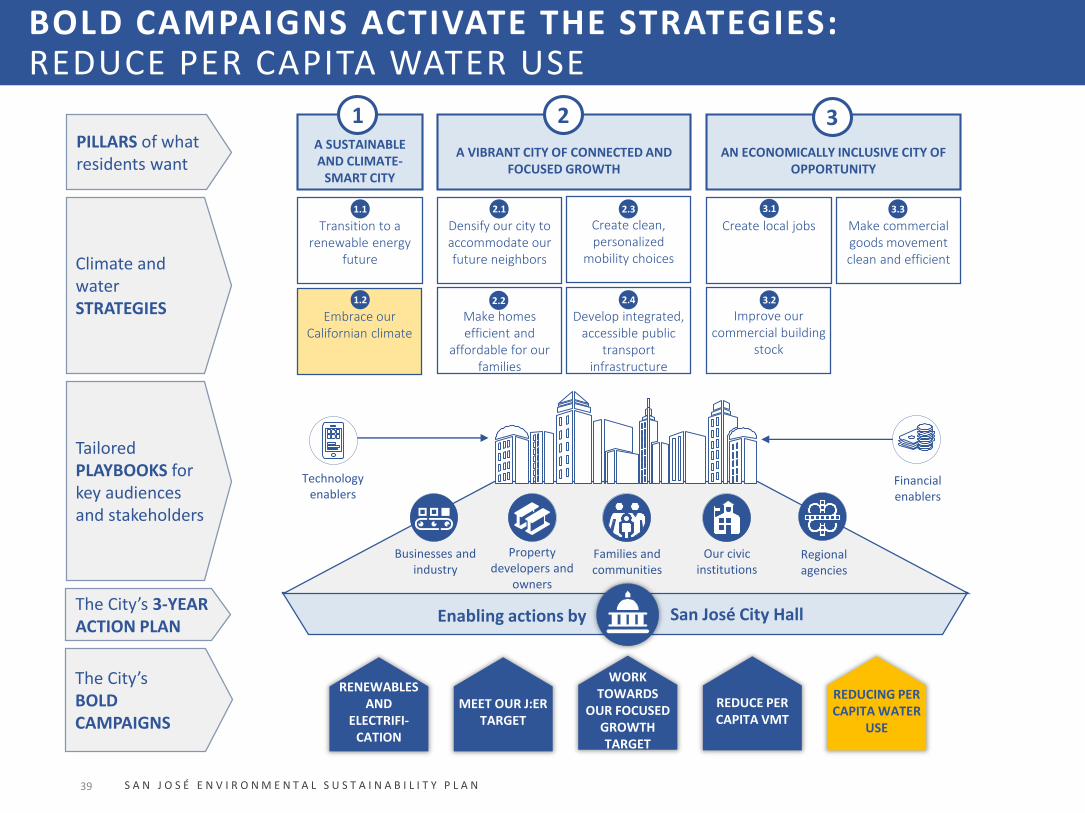
THE 9 STRATEGIES AREN’T SUFFICIENT ALONE:AN ENABLING FRAMEWORK IS NEEDED

35
RENEWABLES AND
ELECTRIFI-CATION
S A N J O S É E N V I R O N M E N T A L S U S T A I N A B I L I T Y P L A N
Climate and water STRATEGIES
TailoredPLAYBOOKS for key audiences and stakeholders
San José City HallEnabling actions by
Technology enablers
Financial enablers
Families and communities
Businesses and industry
Our civic institutions
Regional agencies
Property developers and
owners
1.1Transition to a
renewable energy future
1.2Embrace our
Californian climate
2.1Densify our city to accommodate our future neighbors
2.2Make homes efficient and
affordable for our families
2.3Create clean, personalized
mobility choices
2.4Develop integrated,
accessible public transport
infrastructure
3.1Create local jobs
3.2Improve our
commercial building stock
3.3Make commercial goods movement clean and efficient
A SUSTAINABLE AND CLIMATE-
SMART CITY
A VIBRANT CITY OF CONNECTED AND FOCUSED GROWTH
AN ECONOMICALLY INCLUSIVE CITY OF OPPORTUNITY
PILLARS of what residents want
1 2 3
The City’s 3-YEAR ACTION PLAN
3.1 3.3
3.2
2.1 2.3
2.42.21.2
1.1
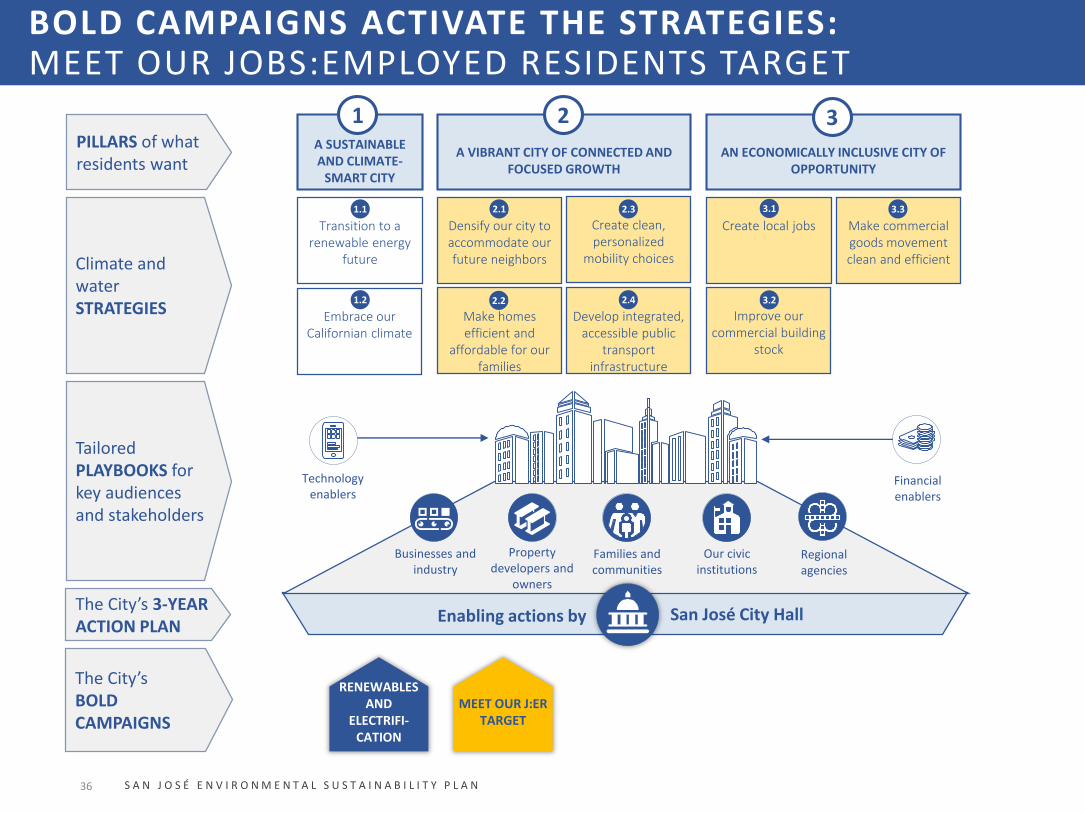
The City’s BOLD CAMPAIGNS
BOLD CAMPAIGNS ACTIVATE THE STRATEGIES:RENEWABLES AND ELECTRIFICATION
36
RENEWABLES AND
ELECTRIFI-CATION
MEET OUR J:ER TARGET
S A N J O S É E N V I R O N M E N T A L S U S T A I N A B I L I T Y P L A N
Climate and water STRATEGIES
TailoredPLAYBOOKS for key audiences and stakeholders
San José City HallEnabling actions by
Technology enablers
Financial enablers
Families and communities
Businesses and industry
Our civic institutions
Regional agencies
Property developers and
owners
1.1Transition to a
renewable energy future
1.2Embrace our
Californian climate
2.1Densify our city to accommodate our future neighbors
2.2Make homes efficient and
affordable for our families
2.3Create clean, personalized
mobility choices
2.4Develop integrated,
accessible public transport
infrastructure
3.1Create local jobs
3.2Improve our
commercial building stock
3.3Make commercial goods movement clean and efficient
A SUSTAINABLE AND CLIMATE-
SMART CITY
A VIBRANT CITY OF CONNECTED AND FOCUSED GROWTH
AN ECONOMICALLY INCLUSIVE CITY OF OPPORTUNITY
PILLARS of what residents want
1 2 3
The City’s 3-YEAR ACTION PLAN
3.1 3.3
3.2
2.1 2.3
2.42.21.2
1.1
The City’s BOLD CAMPAIGNS
BOLD CAMPAIGNS ACTIVATE THE STRATEGIES:MEET OUR JOBS:EMPLOYED RESIDENTS TARGET
37
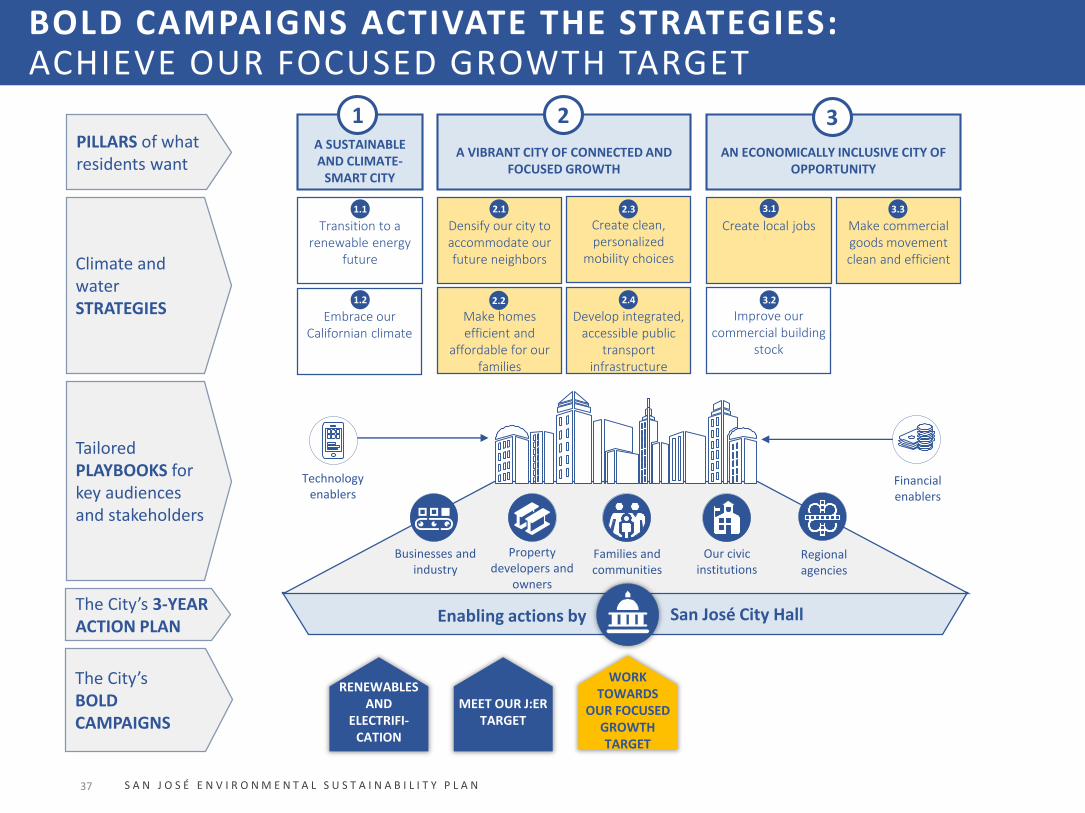
WORK TOWARDS
OUR FOCUSED GROWTH TARGET
RENEWABLES AND
ELECTRIFI-CATION
MEET OUR J:ER TARGET
S A N J O S É E N V I R O N M E N T A L S U S T A I N A B I L I T Y P L A N
Climate and water STRATEGIES
TailoredPLAYBOOKS for key audiences and stakeholders
San José City HallEnabling actions by
Technology enablers
Financial enablers
Families and communities
Businesses and industry
Our civic institutions
Regional agencies
Property developers and
owners
1.1Transition to a
renewable energy future
1.2Embrace our
Californian climate
2.1Densify our city to accommodate our future neighbors
2.2Make homes efficient and
affordable for our families
2.3Create clean, personalized
mobility choices
2.4Develop integrated,
accessible public transport
infrastructure
3.1Create local jobs
3.2Improve our
commercial building stock
3.3Make commercial goods movement clean and efficient
A SUSTAINABLE AND CLIMATE-
SMART CITY
A VIBRANT CITY OF CONNECTED AND FOCUSED GROWTH
AN ECONOMICALLY INCLUSIVE CITY OF OPPORTUNITY
PILLARS of what residents want
1 2 3
The City’s 3-YEAR ACTION PLAN
3.1 3.3
3.2
2.1 2.3
2.42.21.2
1.1
The City’s BOLD CAMPAIGNS
BOLD CAMPAIGNS ACTIVATE THE STRATEGIES:ACHIEVE OUR FOCUSED GROWTH TARGET
38
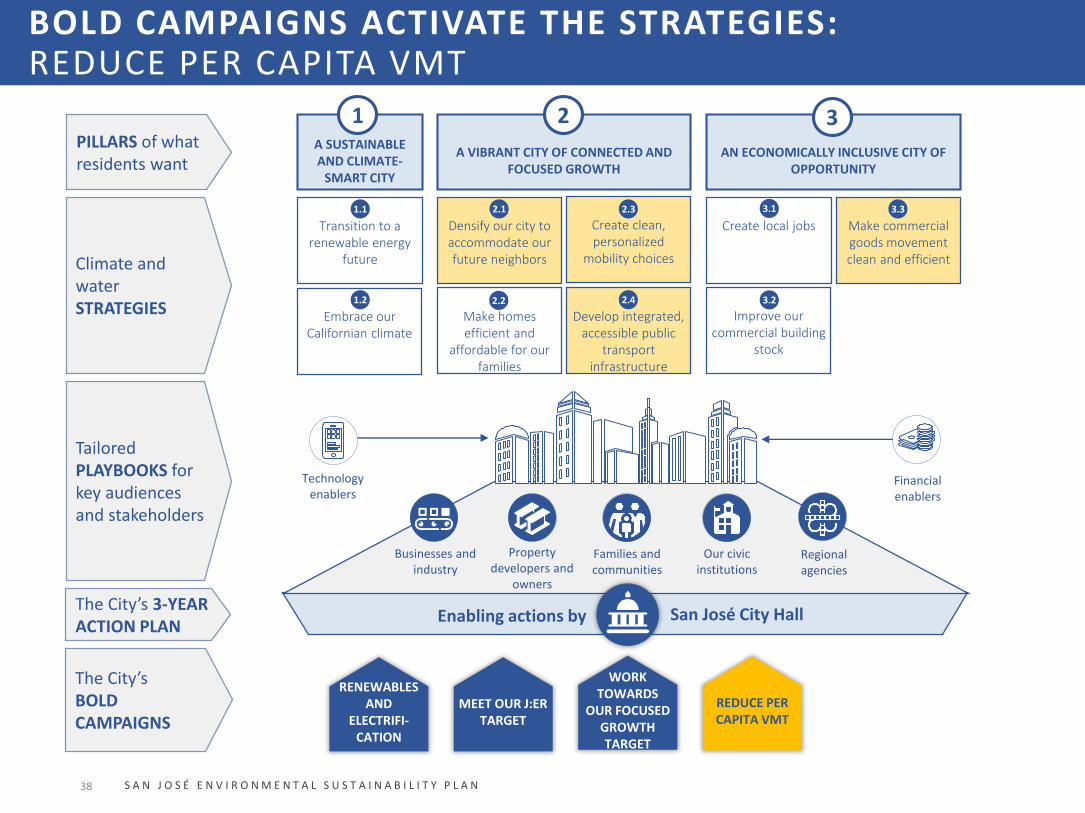
WORK TOWARDS
OUR FOCUSED GROWTH TARGET
REDUCE PER CAPITA VMT
RENEWABLES AND
ELECTRIFI-CATION
MEET OUR J:ER TARGET
S A N J O S É E N V I R O N M E N T A L S U S T A I N A B I L I T Y P L A N
Climate and water STRATEGIES
TailoredPLAYBOOKS for key audiences and stakeholders
San José City HallEnabling actions by
Technology enablers
Financial enablers
Families and communities
Businesses and industry
Our civic institutions
Regional agencies
Property developers and
owners
1.1Transition to a
renewable energy future
1.2Embrace our
Californian climate
2.1Densify our city to accommodate our future neighbors
2.2Make homes efficient and
affordable for our families
2.3Create clean, personalized
mobility choices
2.4Develop integrated,
accessible public transport
infrastructure
3.1Create local jobs
3.2Improve our
commercial building stock
3.3Make commercial goods movement clean and efficient
A SUSTAINABLE AND CLIMATE-
SMART CITY
A VIBRANT CITY OF CONNECTED AND FOCUSED GROWTH
AN ECONOMICALLY INCLUSIVE CITY OF OPPORTUNITY
PILLARS of what residents want
1 2 3
The City’s 3-YEAR ACTION PLAN
3.1 3.3
3.2
2.1 2.3
2.42.21.2
1.1
The City’s BOLD CAMPAIGNS
BOLD CAMPAIGNS ACTIVATE THE STRATEGIES:REDUCE PER CAPITA VMT
39
WORK TOWARDS
OUR FOCUSED GROWTH TARGET
REDUCE PER CAPITA VMT
REDUCING PER CAPITA WATER
USE
RENEWABLES AND
ELECTRIFI-CATION
MEET OUR J:ER TARGET
S A N J O S É E N V I R O N M E N T A L S U S T A I N A B I L I T Y P L A N
Climate and water STRATEGIES
TailoredPLAYBOOKS for key audiences and stakeholders
San José City HallEnabling actions by
Technology enablers
Financial enablers
Families and communities
Businesses and industry
Our civic institutions
Regional agencies
Property developers and
owners
1.1Transition to a
renewable energy future
1.2Embrace our
Californian climate
2.1Densify our city to accommodate our future neighbors
2.2Make homes efficient and
affordable for our families
2.3Create clean, personalized
mobility choices
2.4Develop integrated,
accessible public transport
infrastructure
3.1Create local jobs
3.2Improve our
commercial building stock
3.3Make commercial goods movement clean and efficient
A SUSTAINABLE AND CLIMATE-
SMART CITY
A VIBRANT CITY OF CONNECTED AND FOCUSED GROWTH
AN ECONOMICALLY INCLUSIVE CITY OF OPPORTUNITY
PILLARS of what residents want
1 2 3
The City’s 3-YEAR ACTION PLAN
3.1 3.3
3.2
2.1 2.3
2.42.21.2
1.1
The City’s BOLD CAMPAIGNS
BOLD CAMPAIGNS ACTIVATE THE STRATEGIES:REDUCE PER CAPITA WATER USE

40 S A N J O S É E N V I R O N M E N T A L S U S T A I N A B I L I T Y P L A N
ACTIVATING THE STRATEGIES TO DELIVER THE GOOD LIFE:BOLD CAMPAIGNS AND BOLD GOALS
RENEWABLES AND ELECTRIFICATION
MEET OUR JOBS:EMPLOYED RESIDENT TARGET
WORK TOWARDS OUR FOCUSED GROWTH TARGET
BOLD CAMPAIGNS
REDUCE PER CAPITA VMT
REDUCE PER CAPITA WATER USE
2. By 2030, San José will be the world’s first 1 GW solar city; doubling our rooftop solar capacity in the next 18 months
1. From 2021, SJCE will offer 100% GHG-free power as a base product
3. By 2030, 30% of all passenger vehicles in the city will be electric, making us the electric car capital of the United States
4. By 2030, 100% of new homes will be Zero Net Energy and 25% of existing homes will be energy efficient and all-electric
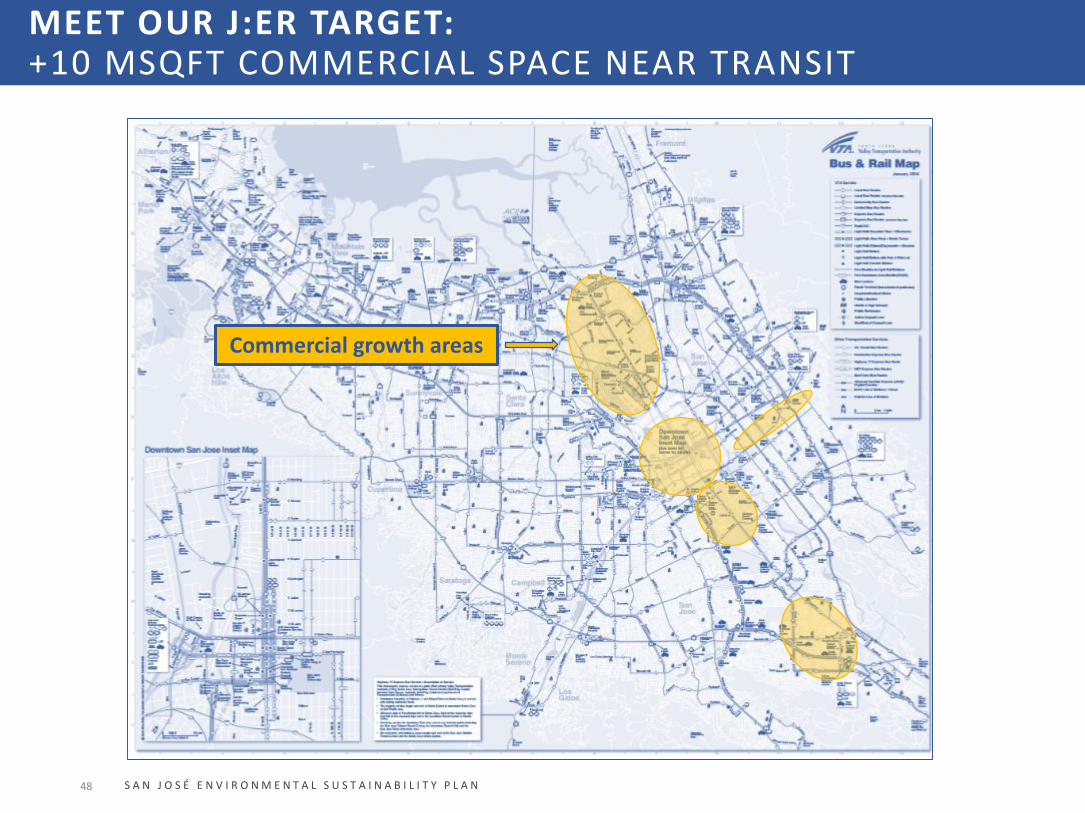
5. By 2030, San José will create an additional 10 million sq ft of commercial workspace located within half a mile of transit
6. By 2030, San José will have developed 40,000 dwelling units in its urban villages and focused growth areas
8. By 2030, San José will reduce its per capita residential water consumption by 30% compared to 2009 levels
7. By 2030, only 4 out of 10 commute trips in San José will be taken in single occupancy vehicles
BOLD GOALS
PARIS CLIMATE AGREEMENT The first Paris-compliant pathway of any US city

41 S A N J O S É E N V I R O N M E N T A L S U S T A I N A B I L I T Y P L A N
RENEWABLES AND ELECTRIFICATION
MEET OUR JOBS:EMPLOYED RESIDENT TARGET
WORK TOWARDS OUR FOCUSED GROWTH TARGET
REDUCE PER CAPITA VMT
REDUCE PER CAPITA WATER USE
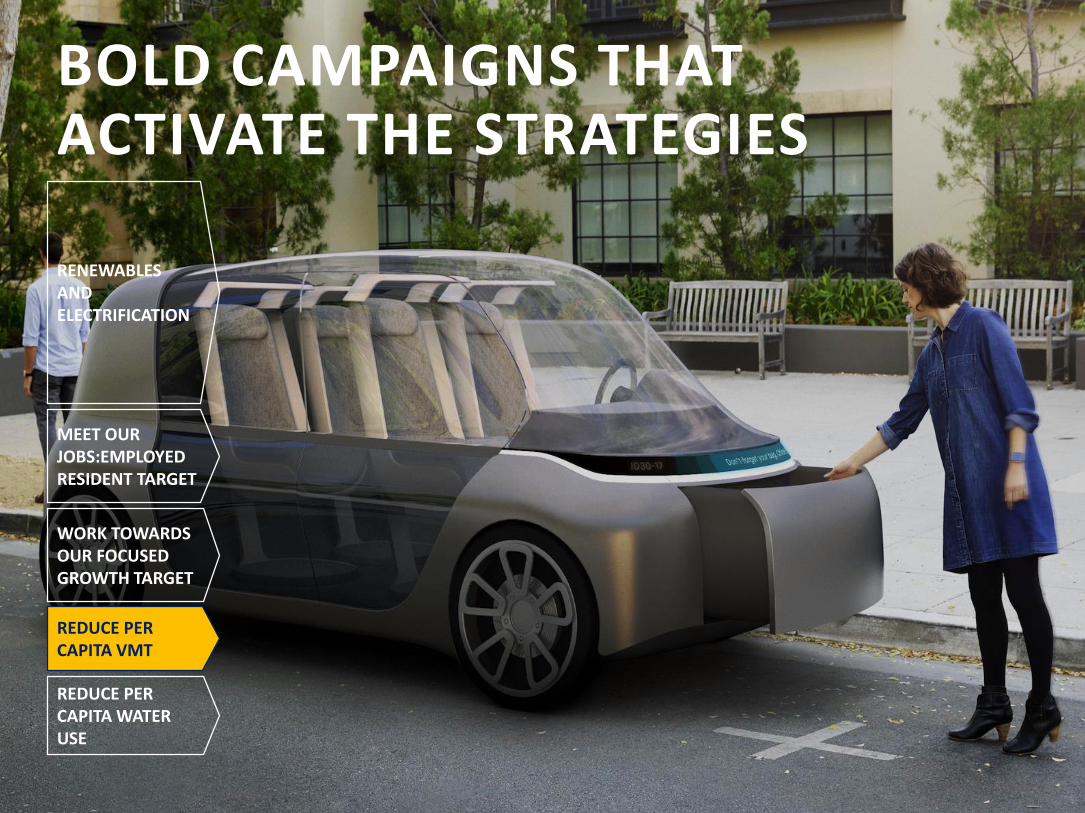
BOLD CAMPAIGNS THAT ACTIVATE THE STRATEGIES

42 S A N J O S É E N V I R O N M E N T A L S U S T A I N A B I L I T Y P L A N
0
0.02
0.04
0.06
0.08
0.1
0.12
0.14
0.16
0.18
20
18
20
19
20
20
20
21
20
22
20
23
20
24
20
25
20
26
20
27
20
28
20
29
20
30
20
31
20
32
20
33
20
34
20
35
20
36
20
37
20
38
20
39
20
40
20
41
20
42
20
43
20
44
20
45
20
46
20
47
20
48
20
49
20
50
San Jose Clean Energy PG&E
PG&E
San José Clean Energy
Carbon intensity of electricity(tCO2e/MWh)
Precise grid intensity beyond 2020 is uncertain. Scaled to meet RPS 2030 then flat thereafter
RENEWABLES AND ELECTRIFICATION:SJCE 100% GHG-FREE POWER FROM 2021

43 S A N J O S É E N V I R O N M E N T A L S U S T A I N A B I L I T Y P L A N
131225
596
1,014
1,362
0
200
400
600
800
1000
1200
1400
1600
2017 2021 2030 2040 2050
Local Renewables (MW)
Industrial Commercial Residential Municipal
RENEWABLES AND ELECTRIFICATION:WORLD’S FIRST 1 GW SOLAR CITY, 2x IN NEXT 18 MONTHS

44 S A N J O S É E N V I R O N M E N T A L S U S T A I N A B I L I T Y P L A N
0%
10%
20%
30%
40%
50%
60%
70%
80%
90%
100%
20
18
20
19
20
20
20
21
20
22
20
23
20
24
20
25
20
26
20
27
20
28
20
29
20
30
20
31
20
32
20
33
20
34
20
35
20
36
20
37
20
38
20
39
20
40
20
41
20
42
20
43
20
44
20
45
20
46
20
47
20
48
20
49
20
50
EVs
AUTONOMOUS EVs
SHARED EVs
SHARED AUTONOMOUS EVs
ICE PASSENGER VEHICLES
Proportion of vehicles moving through the city
RENEWABLES AND ELECTRIFICATION:ELECTRIC CAR CAPITAL OF THE UNITED STATES

45 S A N J O S É E N V I R O N M E N T A L S U S T A I N A B I L I T Y P L A N
Number of zero net energy and all-electric homes
0
100,000
200,000
300,000
400,000
500,000
600,000
700,000
800,000
20
10
20
11
20
12
20
13
20
14
20
15
20
16
20
17
20
18
20
19
20
20
20
21
20
22
20
23
20
24
20
25
20
26
20
27
20
28
20
29
20
30
20
31
20
32
20
33
20
34
20
35
20
36
20
37
20
38
20
39
20
40
20
41
20
42
20
43
20
44
20
45
20
46
20
47
20
48
20
49
20
50
Number of Retrofitted ZNE Ready homes Number of Newly Constructed ZNE homes
All-electric, energy-efficient homes
Zero net energy homes
RENEWABLES AND ELECTRIFICATION:100% OF NEW HOMES ZNE AND 25% RETROFITTED

46 S A N J O S É E N V I R O N M E N T A L S U S T A I N A B I L I T Y P L A N
17,660
12,707
4,210 4,056
0
2,000
4,000
6,000
8,000
10,000
12,000
14,000
16,000
18,000
20,000
Pre-2010 House with 2010Reference Units
Newly Built 2016 House 2020 Full Retrofit in 2020 2020 New Construction in2020
Zero Net Energy
Average annual residential energy consumption(kWh equivalent per household)
Water heating
HVAC
Other Electrical
28%
67%
RENEWABLES AND ELECTRIFICATION:100% OF NEW HOMES ZNE AND 25% RETROFITTED

47 S A N J O S É E N V I R O N M E N T A L S U S T A I N A B I L I T Y P L A N
RENEWABLES AND ELECTRIFICATION
MEET OUR JOBS:EMPLOYED RESIDENT TARGET
WORK TOWARDS OUR FOCUSED GROWTH TARGET
REDUCE PER CAPITA VMT
REDUCE PER CAPITA WATER USE
BOLD CAMPAIGNS THAT ACTIVATE THE STRATEGIES
48 S A N J O S É E N V I R O N M E N T A L S U S T A I N A B I L I T Y P L A N
MEET OUR J:ER TARGET:+10 MSQFT COMMERCIAL SPACE NEAR TRANSIT
Commercial growth areas

49
BOLD CAMPAIGNS THAT ACTIVATE THE STRATEGIES
RENEWABLES AND ELECTRIFICATION
MEET OUR JOBS:EMPLOYED RESIDENT TARGET
WORK TOWARDS OUR FOCUSED GROWTH TARGET
REDUCE PER CAPITA VMT
REDUCE PER CAPITA WATER USE

50 S A N J O S É E N V I R O N M E N T A L S U S T A I N A B I L I T Y P L A N
WORK TOWARDS OUR FOCUSED GROWTH TARGET:40,000 DUs IN URBAN VILLAGES AND GROWTH AREAS

51 S A N J O S É E N V I R O N M E N T A L S U S T A I N A B I L I T Y P L A N
0%
10%
20%
30%
40%
50%
60%
70%
80%
90%
100%
2017 2021 2030 2040 2050
Walking Biking Other Forms Excluding Walking and Biking
Proportion of trips in San José made by walking and biking
32%
22%
11%
3%1%
WORK TOWARDS OUR FOCUSED GROWTH TARGET:40,000 DUs IN URBAN VILLAGES AND GROWTH AREAS
52 S A N J O S É E N V I R O N M E N T A L S U S T A I N A B I L I T Y P L A N
BOLD CAMPAIGNS THAT ACTIVATE THE STRATEGIES
RENEWABLES AND ELECTRIFICATION
MEET OUR JOBS:EMPLOYED RESIDENT TARGET
WORK TOWARDS OUR FOCUSED GROWTH TARGET
REDUCE PER CAPITA VMT
REDUCE PER CAPITA WATER USE

53 S A N J O S É E N V I R O N M E N T A L S U S T A I N A B I L I T Y P L A N
0%
10%
20%
30%
40%
50%
60%
70%
80%
90%
100%
2017 2021 2030 2040 2050
Commute Trip Breakdown
Auto % Transit % Walk % Bicycle %
REDUCE PER CAPITA VMT:4 OUT OF 10 COMMUTE TRIPS IN SOVs
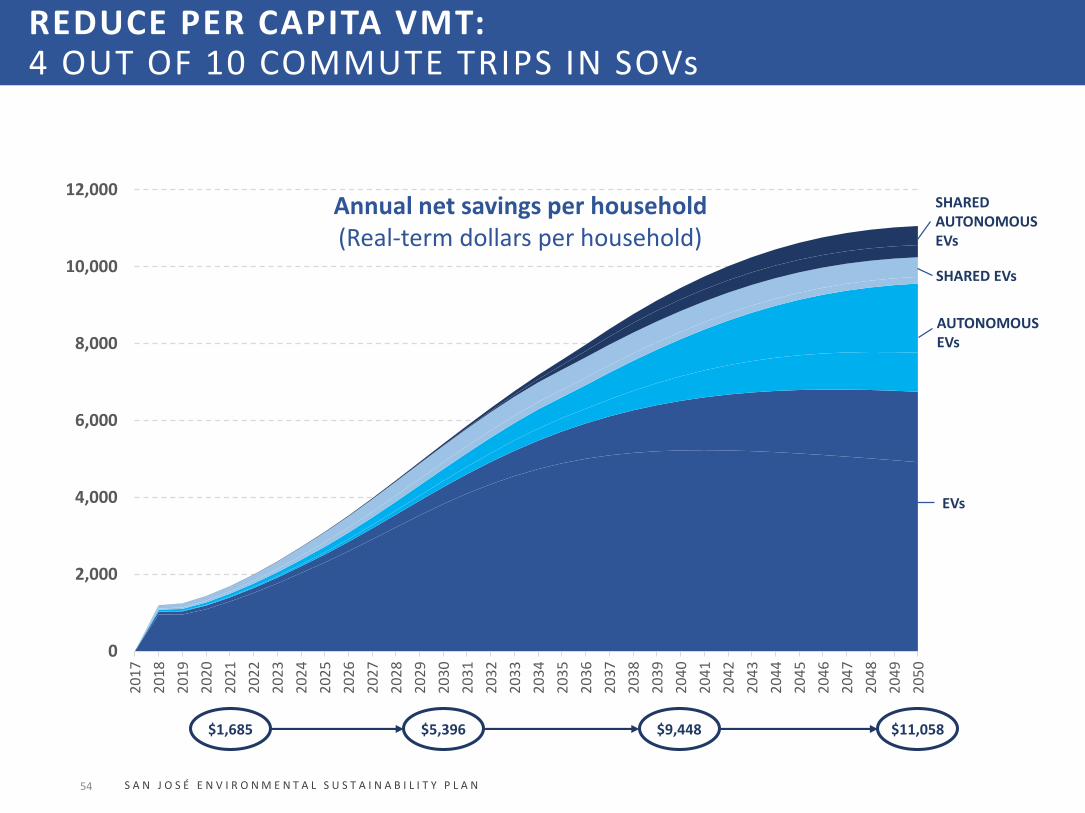
54 S A N J O S É E N V I R O N M E N T A L S U S T A I N A B I L I T Y P L A N
0
2,000
4,000
6,000
8,000
10,000
12,000
20
17
20
18
20
19
20
20
20
21
20
22
20
23
20
24
20
25
20
26
20
27
20
28
20
29
20
30
20
31
20
32
20
33
20
34
20
35
20
36
20
37
20
38
20
39
20
40
20
41
20
42
20
43
20
44
20
45
20
46
20
47
20
48
20
49
20
50
$1,685 $5,396 $9,448 $11,058
EVs
AUTONOMOUS EVs
SHARED EVs
SHARED AUTONOMOUS EVs
Annual net savings per household(Real-term dollars per household)
REDUCE PER CAPITA VMT:4 OUT OF 10 COMMUTE TRIPS IN SOVs

55 S A N J O S É E N V I R O N M E N T A L S U S T A I N A B I L I T Y P L A N
BOLD CAMPAIGNS THAT ACTIVATE THE STRATEGIES
RENEWABLES AND ELECTRIFICATION
MEET OUR JOBS:EMPLOYED RESIDENT TARGET
WORK TOWARDS OUR FOCUSED GROWTH TARGET
REDUCE PER CAPITA VMT
REDUCE PER CAPITA WATER USE

56 S A N J O S É E N V I R O N M E N T A L S U S T A I N A B I L I T Y P L A N
0
50
100
150
200
250
300
20
10
20
11
20
12
20
13
20
14
20
15
20
16
20
17
20
18
20
19
20
20
20
21
20
22
20
23
20
24
20
25
20
26
20
27
20
28
20
29
20
30
20
31
20
32
20
33
20
34
20
35
20
36
20
37
20
38
20
39
20
40
Metered Indoor Unmetered Outdoor
Residential daily water consumption (gallons per household)
194
63
68%
REDUCE PER CAPITA WATER USE:REDUCE RESIDENTIAL WATER USE BY 30%

57 S A N J O S É E N V I R O N M E N T A L S U S T A I N A B I L I T Y P L A N
LINING UP OUR ACTIONS TO ENABLE OTHERS

58
WORK TOWARDS
OUR FOCUSED GROWTH TARGET
REDUCE PER CAPITA VMT
REDUCING PER CAPITA WATER
USE
RENEWABLES AND
ELECTRIFI-CATION
MEET OUR J:ER TARGET
S A N J O S É E N V I R O N M E N T A L S U S T A I N A B I L I T Y P L A N
Climate and water STRATEGIES
TailoredPLAYBOOKS for key audiences and stakeholders
San José City HallEnabling actions by
Technology enablers
Financial enablers
Families and communities
Businesses and industry
Our civic institutions
Regional agencies
Property developers and
owners
1.1Transition to a
renewable energy future
1.2Embrace our
Californian climate
2.1Densify our city to accommodate our future neighbors
2.2Make homes efficient and
affordable for our families
2.3Create clean, personalized
mobility choices
2.4Develop integrated,
accessible public transport
infrastructure
3.1Create local jobs
3.2Improve our
commercial building stock
3.3Make commercial goods movement clean and efficient
A SUSTAINABLE AND CLIMATE-
SMART CITY
A VIBRANT CITY OF CONNECTED AND FOCUSED GROWTH
AN ECONOMICALLY INCLUSIVE CITY OF OPPORTUNITY
PILLARS of what residents want
1 2 3
The City’s 3-YEAR ACTION PLAN
3.1 3.3
3.2
2.1 2.3
2.42.21.2
1.1
The City’s BOLD CAMPAIGNS
REVISITING THE STRATEGY ENABLING FRAMEWORK:THE ENABLING ROLE OF CITY HALL

59 S A N J O S É E N V I R O N M E N T A L S U S T A I N A B I L I T Y P L A N
San José Clean Energy
Distributed solar generation
LED lighting retrofit
Energy efficient electronics
Energy efficient refrigerators
Gas to electric stove replacement
Gas to electric water heater replacement
Gas to electric ground source heat pumps
Smart thermostats
Residential building thermal envelope retrofit
Residential building thermal envelope new-build
Commercial building thermal envelope retrofit
Commercial building thermal envelope new-build
Commercial building energy efficient HVAC new-build
Commercial building HVAC recommissioning
Commercial building LED lighting
Commercial building data center energy efficiency
Residential dishwasher efficiency
Residential clotheswasherefficiency
Passenger car EV
SUV EV
Passenger car autonomous EV
SUV autonomous EV
Ride-sharing cars
Ride-sharing autonomous cars
Ride-sharing shuttles
Ride-sharing autonomous shuttles
Large pick-up EVs
Local delivery EVs
Hybrid heavy goods vehicle (HGVs)
Electric heavy goods vehicle (HGVs)
CNG heavy goods vehicle (HGVs)
Efficient heavy goods vehicle (HGVs)
Caltrainelectrification
BART extension
California High Speed Rail
VTA Bus Rapid Transit and Light rail
VTA Next Network and bus network
City Bike Plan
Creating local jobs
Densification / focused growth
Drought resilient landscaping
Drip irrigation in landscaping
Domestic rainwater storage
Low flush toilets (residential)
Low flow showers
Showers instead of baths
Aerated faucets in homes
Fixing leaks in homes
Residential greywater
Aerated faucets commercial buildings
Low flush toilets (commercial)
Commercial greywater reuse
WATER
LAND USE
TRANSPORT
ENERGY
KEY
CITY HALL CAN ENABLE ADOPTION OF THE PRODUCTS, SERVICES AND BUSINESS MODELS TO ADDRESS CLIMATE

60 S A N J O S É E N V I R O N M E N T A L S U S T A I N A B I L I T Y P L A N
CITY HALL’S ROLE WILL BE TO ENABLE OTHERS:PROGRESS THROUGH THE ADOPTION CURVE
61
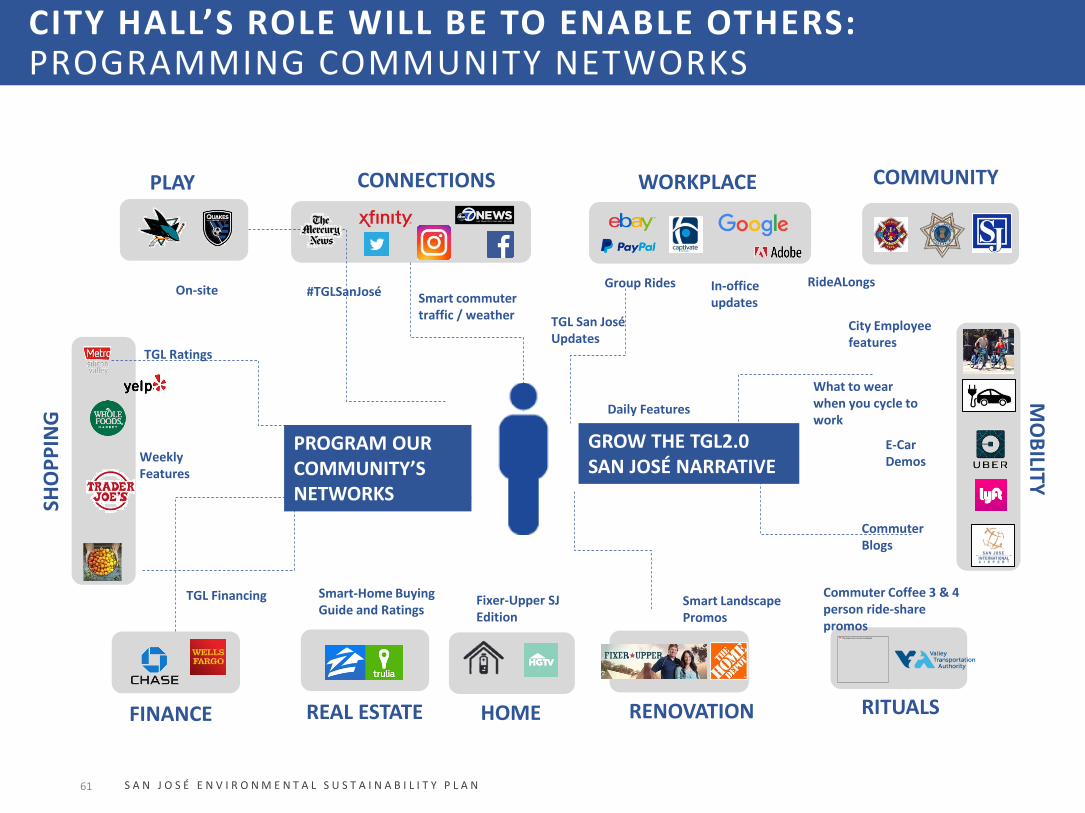
WORKPLACE
HOME
SHO
PP
ING
MO
BILITY
CONNECTIONS COMMUNITY
RENOVATIONREAL ESTATEFINANCE
PLAY
What to wear when you cycle to work
Commuter Coffee 3 & 4 person ride-share promos
Fixer-Upper SJ Edition
Smart-Home Buying Guide and Ratings
Weekly Features
E-Car Demos
City Employee features
Daily Features
TGL Financing
On-siteSmart commuter traffic / weather
Smart Landscape Promos
TGL San José Updates
TGL Ratings
Group Rides RideALongs#TGLSanJosé
RITUALS
GROW THE TGL2.0 SAN JOSÉ NARRATIVE
PROGRAM OUR COMMUNITY’S NETWORKS
Commuter Blogs
In-office updates
S A N J O S É E N V I R O N M E N T A L S U S T A I N A B I L I T Y P L A N
CITY HALL’S ROLE WILL BE TO ENABLE OTHERS:PROGRAMMING COMMUNITY NETWORKS

62 S A N J O S É E N V I R O N M E N T A L S U S T A I N A B I L I T Y P L A N
CITY HALL’S ROLE WILL BE TO ENABLE OTHERS:TAILORED PLAYBOOKS FOR KEY AUDIENCES
• Families• Real estate developers• Business community• Regional stakeholders

63
ESP
CO
MP
LET
ION
S A N J O S É E N V I R O N M E N T A L S U S T A I N A B I L I T Y P L A N
Jan Feb Mar Apr May Jun Jul Aug Sept Oct Early 2018
Actions in the next 8 weeks to complete the Plan:1. External stakeholder outreach and validation (August)2. Completion of the ESP (September)3. Council consideration of Final Draft of Plan (October)4. Implementation Plan (early 2018, subject to Council approval)
Town Hall
Expert workshops on energy, water & mobility
Co
mm
un
ity
Enga
gem
en
tTe
chn
ical
A
nal
ysis
District#5
Expert survey
District#7
Development of baseline
Analysis of sustainability measures
Pathway integration
Document review
and research
YouthCouncil
General Public SurveyFINAL DRAFT PLAN
ESP goals and
target
UPCOMING MILESTONES:TOWARDS COMPLETION OF THE PLAN
External stakeholder outreach and validation
IMP
LEM
ENTA
TIO
N P
LAN

64 S A N J O S É E N V I R O N M E N T A L S U S T A I N A B I L I T Y P L A N
Q&A4

65 S A N J O S É E N V I R O N M E N T A L S U S T A I N A B I L I T Y P L A N
Comments from the General Public
5