Sustainable model of Plastic waste management
20
International Journal of ChemTech Research CODEN (USA): IJCRGG ISSN: 0974-4290 Vol.7, No.01, pp 440-458 2014-2015 Sustainable model of Plastic waste management Vivek Prakash Pankaj* Research Scholar,Centre for Energy and Environmental Engineering, National Institute of Technology,Hamirpur,Himachal Pradesh-177005, India. Abstract: In India, Plastic waste rising rapidly day by day due to increasing the living standards of human beings by leaps & bounds and due to increasing population.The plastic waste management is not developing in India however, India having Plastic Waste (Management and Handling) Rules, 2011. The collection, transportation and process of plastic waste management are unscientific and chaotic. Uncontrolled dumping of wastes on outskirts of towns and cities has created abundantlandfills, which are not only impossible to reclaim because of the haphazard manner of dumping, but also have serious environmental implications in terms of ground water pollution and contribution to global warming. Burning of plastic waste leads to air pollution, which is equivalent to vehicular emissions at times.In the absence of plastic waste segregation practices, recycling has remained to be an informalsector working on outdated technology, but nevertheless flourishing owing to waste material availability and market demand of cheaper recycled products. Plastic recycling have been especially growing due to continuously increasing consumption levels of both the commodities. In this paper,I developa model of plastic waste management under the rule and regulation which has been given by CPCB, Ministry of Environment and etc. in India to maintain the balance of the ecosystem by proper managing the plastic wastes. Keywords: Plastic waste management; Recycling; Disposal; incineration; Plastic; India. 1. Introduction of Plastic The increased use of plastics products as packaging application in the recent years has increased the quantity of plastics in the solid waste stream to a great extent. The quantum of solid waste is ever increasing due to increase in population, development activities, changes in life style, and socio-economic conditions. It is estimated that approximately 15722 tons per day (TPD) of plastic waste is generated on the basis of per capita consumption based on population of India.Plastic is the general term for a wide range of synthetic or semi synthetic polymerization products. They are composed of organic condensation or addition polymers and may contain other substances to improve performance or economics. There are few natural polymers generally considered to be "plastics". These polymers are broken in presence of suitable catalyst, into monomers such as ethylene, propylene, vinyl, styrene and benzene. These monomers are then chemically polymerized into different categories of plastics [1]. 1.1 Waste Generation and Composition in India The rate of waste generation in India is growing very quickly owing to urbanization and higher incomes. The current composition of waste carries a high potential for recycling that is barely exploited. Generally, about 15 percent of waste materials—which consist mainly of paper, plastic, metal, and glass—can be retrieved from the waste stream for further recycling (as shown in figure no. 1).Another 35 to 55 percent of waste material is organic waste, which can be converted into useful compost, leaving only 30 to 50 percent that needs to go to landfills [2]. Data pertaining to the physical and chemical composition of the MSW has been compiled for 75 cities from various renowned databases. An attempt has been made to establish a relation between the Calorific Value
Transcript of Sustainable model of Plastic waste management

International Journal of ChemTech Research CODEN (USA): IJCRGG ISSN: 0974-4290
Vol.7, No.01, pp 440-458 2014-2015
Sustainable model of Plastic waste management
Vivek Prakash Pankaj*
Research Scholar,Centre for Energy and Environmental Engineering, National Instituteof Technology,Hamirpur,Himachal Pradesh-177005, India.
Abstract: In India, Plastic waste rising rapidly day by day due to increasing the living standards of humanbeings by leaps & bounds and due to increasing population.The plastic waste management is not developing inIndia however, India having Plastic Waste (Management and Handling) Rules, 2011. The collection,transportation and process of plastic waste management are unscientific and chaotic. Uncontrolled dumping ofwastes on outskirts of towns and cities has created abundantlandfills, which are not only impossible to reclaimbecause of the haphazard manner of dumping, but also have serious environmental implications in terms ofground water pollution and contribution to global warming. Burning of plastic waste leads to air pollution,which is equivalent to vehicular emissions at times.In the absence of plastic waste segregation practices,recycling has remained to be an informalsector working on outdated technology, but nevertheless flourishingowing to waste material availability and market demand of cheaper recycled products. Plastic recycling havebeen especially growing due to continuously increasing consumption levels of both the commodities.In this paper,I developa model of plastic waste management under the rule and regulation which has been givenby CPCB, Ministry of Environment and etc. in India to maintain the balance of the ecosystem by propermanaging the plastic wastes.Keywords: Plastic waste management; Recycling; Disposal; incineration; Plastic; India.
1. Introduction of PlasticThe increased use of plastics products as packaging application in the recent years has increased the
quantity of plastics in the solid waste stream to a great extent. The quantum of solid waste is ever increasingdue to increase in population, development activities, changes in life style, and socio-economic conditions. It isestimated that approximately 15722 tons per day (TPD) of plastic waste is generated on the basis of per capitaconsumption based on population of India.Plastic is the general term for a wide range of synthetic or semisynthetic polymerization products. They are composed of organic condensation or addition polymers and maycontain other substances to improve performance or economics. There are few natural polymers generallyconsidered to be "plastics". These polymers are broken in presence of suitable catalyst, into monomers such asethylene, propylene, vinyl, styrene and benzene. These monomers are then chemically polymerized intodifferent categories of plastics [1].
1.1 Waste Generation and Composition in India
The rate of waste generation in India is growing very quickly owing to urbanization and higherincomes. The current composition of waste carries a high potential for recycling that is barely exploited.Generally, about 15 percent of waste materials—which consist mainly of paper, plastic, metal, and glass—canbe retrieved from the waste stream for further recycling (as shown in figure no. 1).Another 35 to 55 percent ofwaste material is organic waste, which can be converted into useful compost, leaving only 30 to 50 percent thatneeds to go to landfills [2].
Data pertaining to the physical and chemical composition of the MSW has been compiled for 75 citiesfrom various renowned databases. An attempt has been made to establish a relation between the Calorific Value

Vivek Prakash Pankaj /Int.J. ChemTech Res. 2014-15, 07(01),pp 440-458. 441
and the biodegradable and paper fractions of the MSW generated in various cities. The cities have beenclassified on the basis of population, i.e. cities having a population of over 20,00,000 are classified as Tier 1cities, between 5,00,000 to 20,00,000 as Tier 2 cities, between 1,00,000 to 5,00,000 as Tier 3 cities and lessthan 1,00,000 as Tier 4 cities[3].
Figure no. 1 Recycling Potential
1.2 Description of Plastic Waste
Plastic products have become an integral part in our daily life as a basic need. It produced on a massivescale worldwide and its production crosses the 150 million tonnes per year globally. In India approximately 8Million tonnes plastic products are consumed every year (2008). Its broad range of application in films,wrapping materials, shopping and garbage bags, fluid containers, clothing, toys, household and industrialproducts, and building materials. It is a fact that plastics will never degrade and remains on landscape forseveral years. Mostly, plastics are recyclable but recycled products are more hazardous to the environment thanthe virgin products. The recycling of a virgin plastic material can be done 2-3 times only, because after everyrecycling, the plastic material is deteriorated due to thermal pressure. Considering, 70% of plastic consumptionis converted as waste, approximately 5.6 million tons per annum (TPA) plastic waste is generated in country,which equals to15342 tons per day (TPD) [1].
Plastic waste has a significant portion in total municipal solid waste (MSW). Hence, there is a formalsystem of waste collection in urban areas, however, informal sectors i.e. rag pickers, collect only value addedplastics waste such as pet bottles etc. However, plastic carry bags and low quality plastic less than 20 micron donot figure in their priorities, because collecting them is not profitable. This is primarily because the rewards arenot much than efforts required for collection, and this leads to plastic bags and other packaging materialscontinuing to pose a major threat to the environment [2].
Moreover the major concern for this waste stream is that these are non-biodegradable and remains inthe environment for several years. Clogging of drains by plastic waste is a common problem. The packagingand poly vinyl chloride (PVC) pipe industry are growing at 16-18% per year. The demand of plastics goods isincreasing from house hold use to industrial applications. It is growing at an annual rate of 22% annually. Thepolymers production has reached to 8.5 million tons in 2007.
1.3 Categories of plastics
A. Recyclable Plastics (Thermoplastics): PET, HDPE, LDPE, PP, PVC, PS, etc.B. Non-Recyclable Plastics (Thermoset & others): Multilayer & Laminated Plastics, PUF, Bakelite,Polycarbonate, Melamine, Nylon etc.
As per BIS Classification, there are seven categories of plastics like; PET, HDPE, PVC, LDPE, PP, PS andother. The typical thermoplastic and thermosetting resins have shown in table no 1.
Table no. 1
S. No. Thermo plastic S. No. Thermoset Plastic1 Polyethylene Tetraphthalate (PET) 1 Bakelite2 Polypropylene (PP) 2 Epoxy3 Poly Vinyl Acetate (PVA) 3 Melamine4 Poly Vinyl Chloride (PVC) 4 Polyester5 Polystyrene 5 Polyurethane

Vivek Prakash Pankaj /Int.J. ChemTech Res. 2014-15, 07(01),pp 440-458. 442
1.4 Plastics Consumption in India
National plastic waste management task force in 1997 projected the polymers demand in the country. InIndia (Million Tones) documents the demand of different polymers in India during years 1995-96, 2001-02 and2006-07. The comparison of demand and consumption from More than one fourth of the consumption in Indiais that of PVC which is being phased out in many countries. Poly bags and other plastic items except PET inparticular have been a focus, because it has contributed to host of problems in India such as choked sewers,animal deaths and clogged soils [4].
2. Objective of the Study
The objectives of this study are in two fold.
i. To investigate the actual situation of plastic waste in India.ii. To identify and propose future sustainable plastic waste management.
3. Plastic Materials
Plastics are man-made organic materials that are produced from oil and natural gas as raw materials.Plastics consist of large molecules (macromolecules), the building blocks of all materials. The molecularweights of plastics may vary from about 20,000 to 100,000 mg/L. Plastics can be regarded as long chains ofbeads in which the so-called monomers. Development of plastics production worldwide ethylene, propylene,styrene and vinyl chloride are linked together to form a chain called a polymer. Polymers such as polyethylene(PE), polystyrene (PS) and polyvinyl chloride (PVC) are the end products of the process of polymerization, inwhich the monomers are joined together. In many cases only one type of monomer is used to make the material,sometimes two or more. A wide range of products can be made by melting the basic plastic material in the formof pellets or powder [5]. Plastics can be either thermoplastics or thermosets, having melting which is given intable no. 2.
Table no.2 Melting point of common thermoplastic [7]
Polyolefin Melting point (0C)LDPE 115LLDPE 123HDPE 130Polyethylene (PE) 135Polypropylene (PP) 170Polystyrene (PS) 240Polyethylene terephthalate (PET) 245Polyamide 6 (PA6) 233
Materials that repeatedly often on heating and harden on cooling are known as thermoplastics. They canbe melted down and made into new plastic end products. Thermo plastics are similar to paraffin wax. They aredense and hard at room temperature, become soft and mouldable when heated, dense and hard again and retainnew shapes when cooled (see Figure 2 for a schematic overview of the structure of thermoplastic andThermoset).
Figure no. 2. The structure of (a) thermoplastic and (b) thermosets
6 Low Density Polyethylene (LDPE) 6 Urea-Formaldehyde7 High Density Polyethylene (HDPE)

Vivek Prakash Pankaj /Int.J. ChemTech Res. 2014-15, 07(01),pp 440-458. 443
This process can be repeated numerous times and the chemical characteristics of the material do notchange. In Europe, over 80% of the plastics produced are thermoplastics [5]. Thermosets, on the other hand arenot suitable for repeated heat treatments because of their complex molecular structures (see Figure 2b).Thestructure of thermosetting materials resembles a kind of thinly meshed network that is formed during the initialproduction phase. Such materials cannot be reprocessed into new products unlike thermoplastics. Thermosetsare widely used in electronics and automotive products. The properties of plastics can be modified by a numberof substances known as additives.
3.1 Types of Plastics
In industrialized countries, literally hundreds of plastic materials are available commercially. Ineconomically less developed countries however, fewer types of plastics tend to be used. In both economicallyless developed and industrialized countries, the four types of plastics that are most commonly reprocessed orrecycled are polyethylene(PE), polypropylene (PP), polystyrene (PS)and polyvinyl chloride(PVC) as shown inFigure no3. Each of these can be subdivided according to their density, the type of process involved in theirmanufacture, and the additives they contain.
Figure no. 3.
3.2 Sources of Plastic
Plastics can be used for many purposes, and thus, waste plastics are generated from a wide variety ofsources. The main sources of plastic waste can be classified as follows: industrial, commercial and municipalwaste.
Table no. 3 Types of Plastics and variation in bending strength
Type ofPlastic
Percentage of Plastic Bending strengthin Kg
Compressionstrength (Tonnes)
PE 10 325 25020 340 27025 350 290
Poly propylene 10 350 28020 370 29025 385 310
PS 10 200 15520 210 16525 215 170
PE foam 10 310 25020 325 26525 335 290
PP foam 10 340 27020 360 290

Vivek Prakash Pankaj /Int.J. ChemTech Res. 2014-15, 07(01),pp 440-458. 444
25 365 270Laminated
plastic10 360 290
20 385 31025 400 335
BOPP 10 380 30020 400 31025 410 330
3.3 Industrial waste
Industrial waste and rejected material (so-called primary waste) can be obtained from large plasticsprocessing, manufacturing and packaging industries. Most of this waste material has relatively good physicalcharacteristics; i.e.it is sufficiently clean, since it is not mixed with other materials. It has been exposed to hightemperatures during the manufacturing process which may have decreased its characteristics, but it has not beenused in any product applications. Many industries discard polyethylene film wrapping that has been used toprotect goods delivered to the factory. This is an excellent material for reprocessing, because it is usuallyrelatively thick, free from impurities and in ample supply. Many industries may provide useful supplies ofprimary waste plastics:
Ø The automotive industries: spare-parts for cars, such as fan blades, seat coverings, battery containers andfront grills.
Ø Construction and demolition companies: e.g. PVC pipes and fittings, tiles and sheets.Ø Electrical and electronics industries: e.g. switch boxes, cable sheaths, cassette boxes, TV screens, etc.
Physical properties of waste plastics are given below in table no.4[8].
Table no. 4 Physical properties of waste plastics
Commercial Plasticmaterial
Nature of Plastic Thickness( )
Softeningpoint (oC)
Cup PE 150 100-120Carry bag PE 10 100-120Water bottle PET 210 170-180Cool drinks bottle PET 210 170-180Chocolate covers Poly ester + PE +
metalized polyester20 155
Parcel cover PE 50 100-120Supari cover Polyester + PE 60 120-135Milk pouch LDPE 60 100-120Biscuit covers Polyester + PE 40 170Decoration papers BOPP 100 110Film PE 50 120-130Foam PE NA 100-110Foam PS NA 110
Considerable amounts of waste plastics generated by many industries remain uncollected or end up atthe municipal dump. Industries are often willing to cooperate with private collecting or reprocessing units.
3.4 Commercial waste
Workshops, craftsmen, shops, supermarkets and wholesalers may be able to provide reasonablequantities of waste plastics for recovery. A great deal of such waste is likely to be in the form of packagingmaterial made of PE, either clean or contaminated. Hotels and restaurants are often sources of contaminated PEmaterial.

Vivek Prakash Pankaj /Int.J. ChemTech Res. 2014-15, 07(01),pp 440-458. 445
3.5 Municipal waste
Waste plastics can be collected from residential areas (domestic or household waste), streets, parks,collection depots and waste dumps. In India, considerable amounts of plastic waste can be found within theMunicipal Solid Waste stream due to the littering habit of the population. The most common type of plasticwaste within the municipal waste stream is the “sachet” water film bags that are discarded in discriminatelysoon after consuming its contents. In Asian countries in particular, the collection of this type of waste iswidespread. However, unless they are bought directly from households, before they have been mixed with otherwaste materials, such waste plastics are likely to be dirty and contaminated. Sometimes the plastics can beseparated and cleaned quite easily, but contamination with hazardous waste is not always visible and may bemore difficult to remove. Litter that has been waiting for collection for some time may have been degraded bysunlight. This is mainly a superficial effect, however, and does not always mean that the plastics cannot bereprocessed. The data on waste generated based on income with characterized of some Asian countries as givenbelow in table no. 5[6].
Table no. 5 Data on waste generated based on income with characterized of some Asian countries
Composition (% wet weight basis)Countries GDP,PPPcapitaestimatedfor 2077(USD)
Wastegeneration(Kg/capita/day)
Biodegradable
Paper Plastic Glass Metal Textile/leather
Inertandothers
Hong kong 35,385 2.25 38 28 19 3 2 3 9Japan 33,010 1.1 26 46 9 7 8 - 12Singapore 31,165 1.1 44.4 28.3 11.8 4.1 4.8 - 6.6Taiwan 31,040 0.667 31 26 22 7 4 9 -SouthKorea
23,331 1.0 25 26 7 4 9 29 -
Malaysia 12,702 0.1-0.8 40 15 15 4 3 3 20Thailand 9426 1.1 48.6 14.6 13.9 5.1 3.6 - 14.2China 8854 0.8 35.8 3.7 3.8 2 0.3 - 47.5Philippines 5409 0.3-0.7 41.6 19.5 13.8 1.3 4.8 - 17.9Indonesia 5096 0.8-1 74 10 8 2 2 2 2Sri Lanka 5047 0.2-0.9 76.4 10.6 5.7 1.3 1.3 - 4.7India 3794 0.3-0.6 42 6 4 2 2 4 40Vietnam 3502 0.55 58 4 5.6 1.6 1.5 1.8 27.5Lao PDR 2260 0.7 54.3 3.3 7.8 1.5 3.8 - 22.5Nepal 1760 0.2-0.5 80 7 2.5 3 0.5 - 7
3.6 Hazardous effects of Plastics
In terms of environmental and health effects it is important to differentiate between the various types ofplastics. Most plastics are considered nontoxic (PVC is an important exception). Polyethylene (PE) andpolypropylene (PP), for example, are inert materials [6], but it should be realized that plastics are notcompletely stable. Under the influence of light, heat or mechanical pressure they can decompose and releasehazardous substances. For example, the monomers from which polymers are made may be released and mayaffect human health. Both styrene (which is used to make polystyrene, PS) and vinyl chloride (used to makePVC) are known to be toxic, and ethylene and propylene may also cause problems [7]. The environmentaleffects of plastics also differ according to the type and quantity of additives that have been used. Some flameretardants may pollute the environment (e.g. bromine emissions). Pigments or colorants may contain heavymetals that are highly toxic to humans, such as chromium(Cr), copper (Cu), cobalt (Co),selenium(Se), lead(Pb)and cadmium (Cd) are often used to produce brightly coloured plastics. Cadmium is used in red, yellowand orange pigments. In most industrialized countries these pigments have been banned by law. The additivesused as heat stabilizers (i.e. chemical compounds that raise the temperature at which decomposition occurs),frequently contain heavy metals such as barium (Ba), tin (Sn), lead and cadmium, sometimes in combination.

Vivek Prakash Pankaj /Int.J. ChemTech Res. 2014-15, 07(01),pp 440-458. 446
4. Planning of Plastic Waste Management
Plastic Waste management involves activities associated with generation, storage, collection,transportation, processing and disposal. Plastic waste disposal in an environmentally sustainable manner shouldbe achieved by adopting principles of economy, aesthetics, and energy conservation and pollution control. Itencompasses planning, organization, administration, financial, legal and engineering aspects involvinginterdisciplinary relationships.
India as a developing country needs simpler, low cost technology keeping in view of maximumresource recovery in environmental friendly manner. An advanced technological solution for plastic wastedisposal available in developed countries but cannot be directly adopted in developing countries due todifference in waste characteristics, financial constraints and socio-cultural aspects. With the aim of restrainlittering and have proper disposal process for plastic waste, following activities are required to enforce in plasticwaste management.
4.1 Two-Bin System
The plastic waste management needs to be optimized from concept to project management.
In order to follow appropriate plastic disposal technologies, segregation at source is essential. Therecyclable waste material should be separated from food waste and other biodegradable waste, in a separate binat the source of waste generation, by having a two bin system for waste storage. The bins are clearlylabeled/marked on them “Recyclable Waste” and “Bio-degradable Waste”. The plastic waste is separated outeasily from other recyclable materials. The bio-degradable waste goes to the Municipal landfill for energyrecovery or bio-fertilizer and recyclable waste can be handed over for further reuse. The reuse of recyclablewaste material will reduce land fill requirement and environment pollution.
4.2 Porta cabin
Figure no. 4 Porta cabin for collection of all Plastic Waste
A Porta cabin is a collection facility most typically used for the collection of non-bottle wasteplastics. There is usually a separate container for the collection of plastics, which are subsequently sorted intovaluable and refuse fractions. For some polymers where cleanliness of the material is important for plasticpolymers which may be collected separately. Large sized containers and disposal apertures permit the collectionof bulkier goods such as furniture, pipes, windows etc. They also enable some degree of control to be exertedover the types of waste deposited. Porta cabins can be used for temporal or fixed deposits as shown in figure no4.The collection schemes established for industrial and commercial sectors usually have better results than forthe household waste and municipal waste (from retail, small business). There are two main reasons for this.Firstly, the waste is concentrated in a reduced number of places; this is in contrast to household waste arisings,which are geographically more dispersed, making collection more difficult. Secondly, wastes from industry arecleaner and better identified than wastes from households, which give a better value to this waste. Nevertheless,some professional sectors, like the agricultural or construction sectors, do generate quantities of filmscontaminated by such as earth, humidity etc.
4.3 Quality control
As already mentioned, the quality of the sorted plastics has a direct influence on its sale price. Inorder to maintain the desirable quality, routine quality control must be established. Samples of sorted materialsshould be analyzed in detail and the results compared with the requested quality.

Vivek Prakash Pankaj /Int.J. ChemTech Res. 2014-15, 07(01),pp 440-458. 447
This enables streams that have sorting deficiencies to be identified. A more detailed analysis willidentify the cause of a bad sorting: misunderstanding of the sorting instruction, equipment failing etc. In orderto maintain the desirable quality, routine quality control must be established. Samples of sorted materials shouldbe analyzed in detail and the results compared with the requested quality. This enables streams that have sortingdeficiencies to be identified. Reduction of volume and storing sorted waste plastics which can be bulky totransport and store. To make these activities more economical, some type of volume reduction process isnecessary.
4.4 Baling
Baling is a suitable option for both films and bottles, providing a reduction in volume that aids storageand management of the waste plastics. The baler must be compatible with the baled materials and with theflow. Over-compaction may weld the waste together making it difficult to separate whilst under compactedbales will be unstable and difficult to stack. Most balers can be used for several materials, but adjustments maybe necessary. The choice of baler strapping is also important; it must be strong enough to contain long-termbaled material and particularly if the material is to be stored outdoors, be rust-resistant. Polyester strapping orstainless steel is commonly used. For plastic bottles, previous perforation of the bottles improves the density ofthe bales.
4.5 Pre-shredding
For the big pieces of waste plastics, such as pipes or window frames, pre-shredding can be aninteresting option in order to reduce the stocking area and the transportation costs. However, it is theresponsibility of the sorting plant to evaluate the benefits of such equipment in relation with its price. This typeof equipment can also be helpful in reducing the volume of other waste. As for the baler, the two importantpoints to check are the material compatibility and the outflow of materials to shred. It is important to note thatshredded material, particularly mixed shredded plastics are not accepted by some markets because qualitystandards beyond common sorting processes are required and therefore assured applications for the shreddedmaterial should be investigated [10].
4.6 Storing sorted waste plastics
Rain does not affect the quality of plastics; however, UV light does degrade the physical and chemicalstructure of most plastics. The effect of UV degradation varies according to the virgin polymer, therefore ifplastics are to be stored outside, they should be protected by tarpaulins or other UV-protective material. Toavoid contamination by dust and dirt, plastics should be stored on clean concrete floors; storage of the materialon pallets can also reduce contamination. Where plastics are to be stored indoors, fire-safety and preventionsystems should be installed. Plastic is flammable and while it is difficult to ignite baled plastics; it is mucheasier for non-baled material. As such, these considerations must be integrated into the planning stages ofstorage areas.
4.7 Collection and transportation
The collection and transportation of plastic waste on a daily basis is an imperative step.Since the wastecannot be removed as fast as it is produced, it is stored and transported as soon as possible at specific pre-defined frequencies. The system of storage and types of vehicles are often compatible. Mechanical lifting binsare required to minimize the cost of manually collection.
5. Micro Planning
An efficient and cost beneficiary system of waste management requires micro planning for collection,storage, transportation processing and disposal of plastic waste. This should also ensure an effectiveparticipation of the Government, citizens and NGO’s in planning and waste management system. This devicereduces the volume of plastic waste by compacting, so that storage and transportation becomes relatively easier.Integrated sustainable waste manage model as shown in figure no. 5[9].

Vivek Prakash Pankaj /Int.J. ChemTech Res. 2014-15, 07(01),pp 440-458. 448
Figure no. 5The integrated sustainable waste management modal
6. Recycling of Plastic Waste
The recycling of plastic is possible through different methods. The compacted bales of plastic wastefrom stations and airport should reach the recycling unit on daily basis. Recycling of plastics waste should becarried with a view to:
Ø Minimize the pollution level during the processØ Enhance the efficiency of the process, andØ Conserve the energy
The practice of recycling post-manufacturing plastic waste has been in vogue since the last manyyears. But problems are encountered in case of post consumption of plastic. The incompatibilities of thecomponents mixed are generally chemically different polymers and hence pose difficulties in processing. Manya time the in homogeneity of polymers will lead to inferior material properties. The collected plastic from anystate of India has been channeled properly to recycle unit, but the multilayered metalized plastic which islittering the area is not recycled. This is because these wastes are not segregated anywhere in the channel ofwaste disposal and find its way in the landfill along with MSW. The selection of technological options torecycle/reuse of plastic wastes is depends upon the quality and quantity of waste. While determining themethodologies of recovery system, it is required to make a distinction between different recovery optionsnamely: Primary Recycling (Conversion of waste plastic into products having performance level comparableto that of original products made from virgin plastics); SecondaryRecycling (Conversion of waste plastics intoproducts having less demanding performance requirements than the original material); Tertiary Recycling(The process of producing chemicals/ fuels/ similar products from waste plastics); and Quaternary Recycling(The process of recovering energy from waste plastics by incineration). However, International Standards likeISO refers Plastics Recycling as a Recovery Process. The recovery has been divided into two categories namelymaterial recovery and energy recovery.The process flow chart for recovery process is depicted in Figure no. 6.
Figure no. 6 Schematic diagram of Plastic Recovery Options

Vivek Prakash Pankaj /Int.J. ChemTech Res. 2014-15, 07(01),pp 440-458. 449
6.1 Mechanical Recycling:
Mechanical recycling involves processing of waste in to a product with characteristics similar to thoseof original product. This is the most preferred and widely used recycling process due to its cost effectivenessand ease of conversion to useful products of daily use.
The limitation of this process is that the process requires homogenous and clean input. The process ofmechanical recycling of waste plastics into products of varying usefulness mostly involves the essential stepsnamely:
Ø Collection/ Segregation (Plastic wastes are separated/segregated by Flotation Process in which varyingdensity property of plastic waste is made use for segregating plastics);
Ø Cleaning & Drying (Post consumer plastic wastes require cleaning and drying than industrial waste. Thewastes generated during these processes require proper treatment and disposal methods);
Ø Sizing/ Chipping (Cleaned plastic waste products should be sized/chipped to fed into the extruders forprocessing and palletizing and these operations depends upon the type and size of the plastic waste);
Ø Agglomeration/Coloring (Depending upon the end product, sized plastic waste is mixed with color masterbatch in high speed mixers/ agglomerators);
Ø Extrusion/ Pelletisation(Chipped plastics are plasticized and regranulated to make the plastic materialready for fabrication) and finally fabrication into End Product.
6.2 Technological Disposal Options
The selection of appropriate technology for plastic waste disposal and its processes for themanagement of plastic wastes are available in literature. Several processes and technologies have been exploredand developed for plastic waste management. Some of these are:
Ø Chemical recycling of pet bottles into fibersØ Processing of plastic waste in Blast FurnaceØ Co-incineration of plastic waste in cement kilnsØ Utilization of plastic waste in road construction with bitumenØ Plasma Pyrolysis Technology for disposal of plastic waste andØ Gasification
6.3 Chemical recycling of pet bottles into fibers
This method of plastic recycling, involves the breaking down of polymer chain in to their basiccomponents, which can then be used in various industries. The feedstock plastic recycling process is flexibleand more forbearing to the plastic additives, as compared to the mechanical plastic recycling. This is the mostcostly method of recycling. The varying end products are obtained by using following process:
6.3.1 Monomerization:
The waste plastics are initially broken down into their constituent monomers by chemical reaction(depolymerization). These monomers are then extracted for use as the raw material in new plastic products.Monomerization produces higher quality plastic raw materials than material recycling. Which in turn enablesthe production of high quality plastic products with the same (or almost the same) quality as virgin rawmaterial.
Among other products, this enables the recycling of waste PET bottles into new PET bottles, which isnot possible with other recycling technologies. About 50% recovery is possible through this process. Thelimitations of this process is that, the large scale process setup along with clean and single resin plastic waste asinput is required.
6.4 Processing of plastic waste in Blast Furnace:
Plastic waste can be co-incinerated as fuel in the iron and steel industry. This will reduce coalconsumption and hence in reduction in the consumption of energy. The proportion of waste plastic added tocoal should be about 1% by mass. Increased addition of waste plastic will reduce the heating strength of thecoal/coke. The use of plastic in coke ovens-a typical high-temperature process in the iron and steel industry wasput in practice in the year

Vivek Prakash Pankaj /Int.J. ChemTech Res. 2014-15, 07(01),pp 440-458. 450
2000 at Nippon Steel Corporation, Japan. In this process, the collected and baled plastic waste that hasbeen agglomerated by pre-treatment is mixed together with coal and charged into coke oven. The mixed plasticwaste and coal are carbonized in an oxygen-free reducing atmosphere at about 1,100 to 1,2000C. As a result, thewaste plastic is thermally decomposed into coke (about 20%), tar/light oil (about 40%) and coke oven gas(about 40%). These products obtained by the carbonization of waste plastics have their own uses.When plasticsare used together with coke, CO2 emission is significantly less. The excessive reducing gases are also used forblast furnace stove and power generation.
6.4.1Blast Furnace:
Plastics waste can be used as an alternative raw material in blast furnaces to generate energy formanufacturing of iron. Plastic waste can be successfully used as a reducing agent in blast furnaces for themanufacturing of iron from its ore. Use of coke in blast furnace provides only one type of reducing agent-carbon Monoxide. In contrast, use of plastic waste provides one additional type of reducing agent – Hydrogen.Advantage of this process includes use of all types of plastics including laminated plastics without creating anyenvironmental pollution. The high temperature inside the blast furnace around 20000C ensures that there is nopossibility of any dioxins formation even if PVC is processed.Furthermore, as the reducing atmosphere in thelow- temperature region at the top of the furnace contains no oxygen, no dioxins are produced or re-synthesizedin the lower temperature zone also.The plastics waste is first formed into suitable size either by crushing orpellatising as necessary, and subsequently injected into the blast furnace from the tuyeres at the base of thefurnace with hot air. The injected plastic waste material is broken down to form reducer gas- Carbon Monoxide(CO) and Hydrogen (H2). The reducer gas rises through the raw material layers in the blast furnace and reactswith iron ore to produce pig iron. The gas, after the reduction reaction, is recovered at the top of the blastfurnace which has energy content to the tune of 800 kcal/NM3 and is reused as a fuel gas in heating furnaceswithin the steel plant.
6.5Co-incineration of Plastics Waste in Cement Kilns:
Keeping in view the problems associated with the disposal of plastic waste, CPCB initiated a study on“Co-incineration of plastic waste in cement kiln” in collaboration with Indian Centre for Plastics in theEnvironment (ICPE), MP Pollution Control Board and ACC Ltd. Co-incineration refers to the usage of wastematerials as alternative fuels to recover energy and material value from them. The temperature in the cementkiln process is about 14000C.Excess level of oxygen and counter flow operation with the flue gases moving in adirection opposite to the materials lends a high degree of turbulence to the process. The presence of an alkalinereducing environment (lime) and the pre-heating of the raw materials by a preheated tower (>100 meter tall)acts as an ideal scrubber for hot flue gases before they are emitted into the atmosphere. The 3Ts- Time,Temperature and Turbulence in cement kilns provides extremely high destruction removal efficiency (DRE) forthe plastic wastes. Co-incineration leaves no residue as the incombustible, inorganic content of the wastematerials are incorporated in the clinker matrix. Therefore, after the waste is co-incinerated, it becomes a part ofthe product. Co-incineration ranks higher on the waste disposal hierarchy and eliminates the need for landfillsand incineration.
6.6Utilization of plastic waste in road construction:
To address the plastics waste disposal issue, an attempt has been made to describe the possibilities ofreusing the plastics waste (post-consumer plastics waste) in road construction. Central Pollution Control Board(CPCB) Delhi has published “Indicative Operational Guidelines on Construction of Polymer – Bitumen Roadsfor reuse of waste plastics (PROBES/101/2005-06). The document explains the method of collection, cleaningprocess, shredding, sieving and then mixing with bitumen for road laying. By using this technology (plasticswaste coated aggregate bitumen mix), several roads have been laid in the States of Tamil Nadu, Maharashtra,Pondicherry, Kerala,Andhra Pradesh and Goa. To evaluate the performance of the built roads using plasticswaste coated aggregate (PCA) bitumen mix and also to generate data base for evolving Standards by IndianRoad Congress (IRC), CPCB has instituted a study on “Performance Studies ofPolymer Coated Bitumen BuiltRoads during 2002-2007” to Thigarajarcollege of Engineering, Madurai.
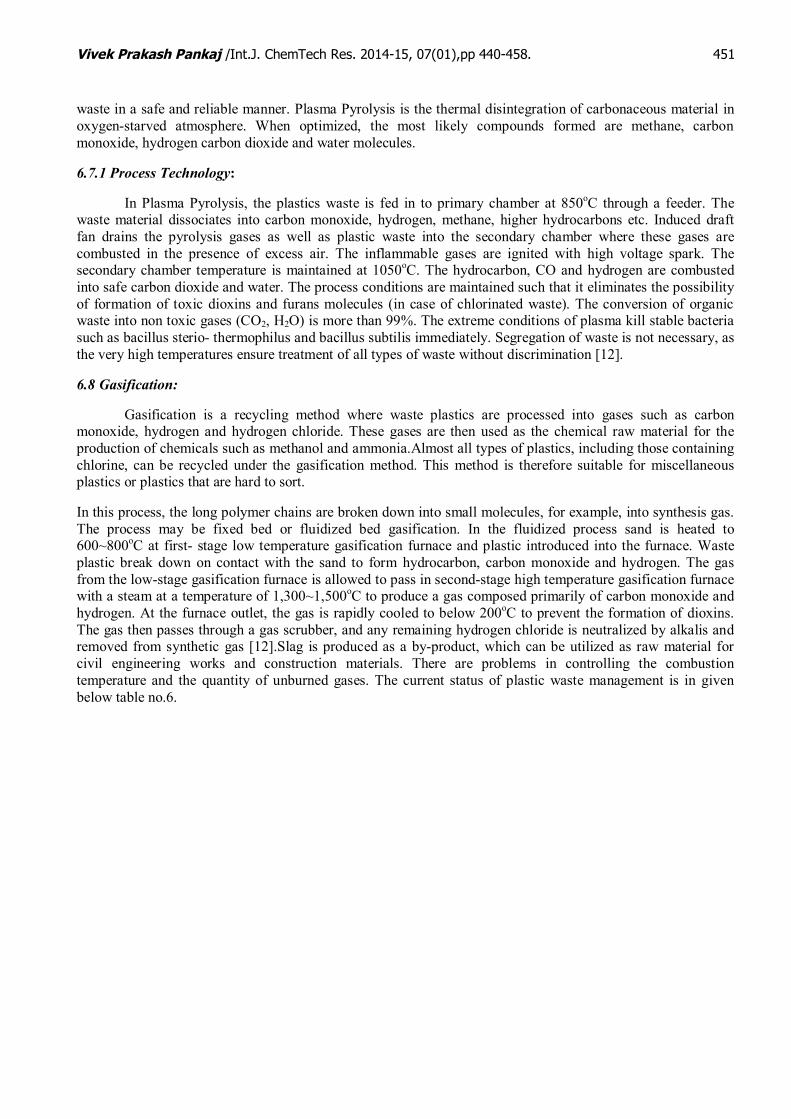
6.7Plasma Pyrolysis Technology (PPT):
Plasma pyrolysis is a state of the art technology, which integrates the thermo-chemical properties ofplasma with the pyrolysis process. The intense and versatile heat generation capabilities of Plasma Pyrolysistechnology enable it to dispose of all types of plastic wasteincluding polymeric, biomedical and hazardous
Vivek Prakash Pankaj /Int.J. ChemTech Res. 2014-15, 07(01),pp 440-458. 451
waste in a safe and reliable manner. Plasma Pyrolysis is the thermal disintegration of carbonaceous material inoxygen-starved atmosphere. When optimized, the most likely compounds formed are methane, carbonmonoxide, hydrogen carbon dioxide and water molecules.
6.7.1 Process Technology:
In Plasma Pyrolysis, the plastics waste is fed in to primary chamber at 850oC through a feeder. Thewaste material dissociates into carbon monoxide, hydrogen, methane, higher hydrocarbons etc. Induced draftfan drains the pyrolysis gases as well as plastic waste into the secondary chamber where these gases arecombusted in the presence of excess air. The inflammable gases are ignited with high voltage spark. Thesecondary chamber temperature is maintained at 1050oC. The hydrocarbon, CO and hydrogen are combustedinto safe carbon dioxide and water. The process conditions are maintained such that it eliminates the possibilityof formation of toxic dioxins and furans molecules (in case of chlorinated waste). The conversion of organicwaste into non toxic gases (CO2, H2O) is more than 99%. The extreme conditions of plasma kill stable bacteriasuch as bacillus sterio- thermophilus and bacillus subtilis immediately. Segregation of waste is not necessary, asthe very high temperatures ensure treatment of all types of waste without discrimination [12].
6.8 Gasification:
Gasification is a recycling method where waste plastics are processed into gases such as carbonmonoxide, hydrogen and hydrogen chloride. These gases are then used as the chemical raw material for theproduction of chemicals such as methanol and ammonia.Almost all types of plastics, including those containingchlorine, can be recycled under the gasification method. This method is therefore suitable for miscellaneousplastics or plastics that are hard to sort.
In this process, the long polymer chains are broken down into small molecules, for example, into synthesis gas.The process may be fixed bed or fluidized bed gasification. In the fluidized process sand is heated to600~800oC at first- stage low temperature gasification furnace and plastic introduced into the furnace. Wasteplastic break down on contact with the sand to form hydrocarbon, carbon monoxide and hydrogen. The gasfrom the low-stage gasification furnace is allowed to pass in second-stage high temperature gasification furnacewith a steam at a temperature of 1,300~1,500oC to produce a gas composed primarily of carbon monoxide andhydrogen. At the furnace outlet, the gas is rapidly cooled to below 200oC to prevent the formation of dioxins.The gas then passes through a gas scrubber, and any remaining hydrogen chloride is neutralized by alkalis andremoved from synthetic gas [12].Slag is produced as a by-product, which can be utilized as raw material forcivil engineering works and construction materials. There are problems in controlling the combustiontemperature and the quantity of unburned gases. The current status of plastic waste management is in givenbelow table no.6.

Vivek Prakash Pankaj /Int.J. ChemTech Res. 2014-15, 07(01),pp 440-458. 452
Table no. 6 Status of Plastic waste management (Updated on 30-05-2012)
S.No
Items Description
1 Total Population 2008 (As per-World Bank)
1139964932 (Say 114 Million )
2 Estimated Plastic Production in 2008 8 Million tons
3 Plastic Waste Generation Per Year Per Day(Considering;70%as waste) 5.6 Million tons/Year 15342.46 tons/day
4 Plastic Waste Generation Per Year Per Dayper capita. 4.91 kg/Year 13.45 gm/day
5 Plastic Waste Collection Per Year Per Day(Estimated;60% by weight 3.36 Million tons/Year 9205 tons/day
6 Uncollected Plastic Waste Per Year Per Day(Estimated;40% by weight 2.24 Million tons/Year 6137 tons/day
7 a) CPCB study on MSW Generation Per Year Per Dayin 60 major cities (2010-11) 1,8466080 Million tons/Year 50592 tons/dayb) CPCB study on Plastic waste Per Year Per Daygeneration in 60 major cities (2010-11) 0.1277847 Million tons/Year 3501 tons/day
8 No. of Plastic Manufacturer andRecycling unit in industrial area
5511 (30 States and UTs)
9 No. of Registration Granted 210810 No. of States and UTs issued 15 (Goa, Haryana, Himachal Pradesh, Karnataka, Kerala
Maharashtra,Separate Act/Notification Madhya Pradesh , Nagaland, Punjab, Meghalaya, Chandigarh,
Lakshadweep Pondicherry, Delhi, Rajasthan)11 Name of states and UTs Ban Plastics
Carry BagsDetail given as below
12 i) Complete Ban 11 (Chandigarh, Sikkim, Nagaland, Delhi, Haryana, HimachalPradesh,
(Through Notification/Act) Tripura, Rajasthan, J&K, Andaman & Nicobar island &Lakshadweep)
ii) Partial Ban 10 (Andhra Pradesh, Arunachal Pradesh, Assam, Goa,Karnataka,
(Through Executive Order Orissa, Tamil Nadu, West Bengal, Mizoram, Uttar Pradesh13 Names of States and Uts Increased the 03 (Maharashtra:50, Tamil Nadu:60 μ and Puducherry:51 μ
thickness of plastic carry bags i.e>40 μ14 Plastic Waste Utilization i) Plastic waste can be utilized in road construction such as in
the states ofTamil Nadu, Karnataka, Maharashtra ,Pondicherry andHimachal Pradesh etc.ii) Plastic waste can be co-processed in cement kilns such as inthe statesof Madhya Pradesh, Tamil Nadu , Orissa, Andhra Pradesh etc.
15 Use of carry bags made from As per Plastic Waste (Management & Handling) (Amendment)Rules,2011
Compostable plastic or material carry bags can be made from compostable plastic or materialconfirmingIS/ISO ; 17088 :2008

Vivek Prakash Pankaj /Int.J. ChemTech Res. 2014-15, 07(01),pp 440-458. 453
7. Assessment and Quantification of Plastic Waste Quantification in Sixty Cities
CPCB has sponsored a study to CIPET for Assessment and Quantification of Plastic Wastegeneration in sixty major cities. The preliminary findings of the study are in given below;
Table no. 7
City TMSW PMSW Total Plastic Waste (TPD)Kavaratti 2 12.16 0.24Dwaraka 18 8.28 1.49Daman 25 4.554 1.14Panjim 25 4.47 1.12Gangtok 26 11.12 2.89Jamshedpur 28 3.216 0.90Silvassa 35 6.077 2.13Port Blair 45 10.76 4.84Kohima 45 5.013 2.26Shimla 50 4.273 2.14Meerut 52 6.444 3.35Gadhinagar 97 4.361 4.23Shilong 97 5.436 5.27Itanagar 102 5.352 5.46Agartala 102 5.712 5.83Aizwal 107 7.948 8.50Imphal 120 5.132 6.16Ranchi 140 5.915 8.28Kochin 150 6.288 9.43Dhanbad 150 5.008 7.51Guwahati 204 5.036 10.27Asansol 210 6.017 12.64Dehradun 220 6.665 14.66Patna 220 5.696 12.53Raipur 224 10.607 23.76Rajkot 230 6.92 15.92Tiruvanandapuram 250 6.022 15.06Pondicherry 250 10.62 26.55Chandigarh 264 3.098 8.18Jammu 300 7.226 21.68Jaipur 310 5.085 15.76Vishakapattnam 334 9.033 30.17Nashik 350 5.822 20.38Bhopal 350 6.594 23.08Allahabad 350 5.377 18.82Jabalpur 400 5.175 20.70Bhubaneswar 400 7.862 31.45Madurai 450 5.059 22.77Varanasi 450 5.78 26.01Agra 520 7.863 40.89Srinagar 550 5.117 28.14Amritsar 550 4.44 24.42Vadodara 600 4.704 28.22Vijayawada 600 7.352 44.11Nagpur 650 6.984 45.40Coimbatore 700 9.473 66.31Faridabad 700 11.65 81.55Indore 720 8.805 63.40

Vivek Prakash Pankaj /Int.J. ChemTech Res. 2014-15, 07(01),pp 440-458. 454
The total MSW Generated in 60 cities as shown in table no. 7, around 48592 MT/Day and the TotalPlastic Waste generated in same cites around 3905.64 MT/Day.
8. Plastics recycling & sustainable development
The recycling of plastic waste can be a positive contribution to a sustainable development policy,integrating environmental, economic and social aspects, within a framework of effective legislative instruments.Continuing advances in sorting and processing technologies is increasing the accessibility of waste previouslydeemed unsuitable for recycling. Greater ranges of materials are now accepted for recycling; whiledevelopments in collection and sorting systems continue to increase the quality of recycle waste generated. Thisis supported by R&D into new markets for secondary plastics, which is essential if plastics’ recycling is to besustainable. Research into new and existing practices will expand opportunities for secondary materials; what iscurrently not technically or economically viable may be so in the future. It should look towards the materialneeds of the present, using best available technologies and practices to meet market demands, whileappreciating the impacts that future technological and material quality requirements will have on currentpractice [10].
The benefits of recycling can be categorized into these aspects such as; environmental, economic andsocial and Environmental awareness of the population. These are briefly explained below.
8.1 Environmental aspects
There is only one environment and it must be treated with the respect it deserves already been extractedthen it makes sense to use them again if possible. This means that reserves last longer into the future. Moreover,recycling of plastic waste conserves natural resources, particularly raw materials such as oil and energy. Themore that is recycled, the longer will natural resources be available for future generations. It means that there isless environmental impact due to mining, quarrying, oil and gas drilling, deforestation and the likes. If there arefewer of these operations, the environment will be safe from continuous destruction and degradation.
Another positive effect of recycling on the environment is that it may reduce emissions of substancesuch as carbon dioxide (CO2) into the atmosphere. From life- cycle analysis of reprocessed plastics and virginplastics, it is known that the emissions of CO2, SO2, NOX (NO and NO2) are much smaller for recycled plasticscompared to that for virgin materials [13]. Hence the environment will be better safe from air pollution andglobal warming if recycling is adopted on large scales. Recycling of plastic wastes will also safe both groundand surface waters from pollution. This is because if discarded randomly, they choke gutters and even find theirway into water bodies that serve as sources of drinking water for communities and towns. They also help tobreed leachate that can seep into the ground there by contaminating groundwater bodies as well.
8.2 Economic aspects
Resource recovery reduces the quantity of raw material seeded in production processes. The reuse ofplastic say therefore helps to reduce the dependence on ported raw materials and to save foreign currency. Dueto increasing cost of virgin plastics as a result of dwindling oil reserves, the use of reprocessed pellets forproduct manufacture will save recycling companies from folding up as a result of high cost of importation ofvirgin pellets. The low energy and water consumption will save recycling companies from paying huge billsthat could otherwise have adverse effect on their operations [10].
Ludhiana 850 5.962 50.68Surat 1200 12.468 149.62Lucknow 1200 5.886 70.63Pune 1300 7.971 103.62Kanpur 1600 6.666 106.66Bangalore 1700 8.483 144.21Ahmedabad 2300 10.5 241.50Kolkata 3670 11.59 425.35Hyderabad 4200 4.72 198.24Chennai 4500 9.54 429.30Mumbai 6500 6.477 421.01Delhi 6800 10.13 688.84

Vivek Prakash Pankaj /Int.J. ChemTech Res. 2014-15, 07(01),pp 440-458. 455
8.2.1 Creating employment
Recycling can be an opportunity to create local jobs in collection, sorting, communications,administration and reprocessing. The reprocessing can be undertaken locally, regionally or beyond, andconsequently the positive economic aspects of increased employment can be local or dispersed further afield.Job creation obviously brings many positive social effects.
8.3 Social aspects
The introduction of an intensive recycling strategy can avoid the need of new or additional incinerationor landfill capacity. The setting up of such facilities is a challenge for the public authorities, which willinevitably face some degree of Nimby phenomenon, although this can be mitigated through effective, sustainedpublic communications. However, in many cases recycling costs are higher than incineration; hence the cost forthe citizen will go up.
Recycling of plastic wastes helps to keep the environment clean. Therefore diseases associated withfilth will be prevented and this will save foreign exchange in the importation of drugs to fight cholera andmalaria that may result from the rubbish heaps. Recycling will also create a healthy environment for touristsattraction Recycling is a source of job creation. Through recycling, numerous poor people will get employedparticularly at the collection stage and hence be able to earn their living. This will help raise social standardsand to eliminate vices in society.
8.4 Environmental awareness of the population
The introduction of recycling programmes will heighten public environmental awareness. As aconsequence, a significant fraction of population feels motivated to participate in schemes where they areoffered. There often follows an increased demand – with local elected representatives targeted - to improve andextend the existing services to a wider variety of waste plastics. This enhanced awareness can be linkedbeneficially to plastics in general, improving the image of these materials (which are often associated withwastage, the throw-away society and litter). In addition, including plastics in multi-material collection schemescan raise the overall amount of materials collected from curbside collection schemes by between 20 – 30 percent.
9. Zero Waste Concepts
Humanity has to evolve to Zero Waste Management system for sustainability. How long and where allcan we keep dumping our waste or keep releasing in air and water when it is very much possible to processevery waste - solid liquid or in gaseous form in a way so to render it harmless to the nature, why are we notdoing it and whenever it is difficult, the technology development for it, is not only possible, but is within ourmeans to do so, then why don’t we do it. We should work together in this direction: The climate crime updateseries is for sharing information on these issues.
Total recycling of waste i.e. of every useful product at the end of its usable life, and useless by productsof its production process, may it be in gaseous, liquid or solid form or their combinations, should be given backto the nature in the naturally harmless forms. In 1962 it took 0.7 years for the earth’s annual biological harvestto regenerate and now it takes 1.25 years [14]. Global ecosystem services have been over-used significantly inparallel with world economic growth. Global economic growth has increased 5 times since the mid-twentiethcentury and 60% of the world’s ecosystem services have been degraded during the same period [15]. It isestimated that by 2050 we will have 9 billion people on earth. Global non-renewable resources are depleted as aresult of over consumption. Continuous depletion of natural finite resources by urban populations is leading toan uncertain future. Therefore, to prevent further depletion of global resources, we need sustainableconsumption and strategic Plastic waste management systems based on (i) waste avoidance, (ii) materialefficiency and (iii) resource recovery [16].
Waste is the symbol of inefficiency of any modern society and a representation of misallocatedresources. More than 50% of the world’s population live in urban areas [17], and some estimates havesuggested that 80% of the human population will dwell in urban areas by 2030. Cities cover only around 2% ofthe world’s surface consume over 75% of the world’s natural resources and generate 70% of all the wasteproduced globally [18-19]. Creation of any waste depletes natural resources, uses energy and water, placespressure on land, pollutes the environment and, finally, creates an additional economic cost for managing the

Vivek Prakash Pankaj /Int.J. ChemTech Res. 2014-15, 07(01),pp 440-458. 456
waste. We need to move to a position where there will be no such thing as waste, merely transformation; thisposition is called zero waste.‘Zero waste’ is one of the most visionary concepts for solving waste problems.Many cities around the globe such as Adelaide, San Francisco and Stockholm have declared their zero wastevision and these cities are working to be the world’s first zero waste city. But how to transform our existingcities into zero waste cities and how to measure the performance of a zero waste city are the prime questions toanswer in zero waste research. The products that we consume every day are primarily produced using virginmaterials, energy and water. From resources extraction to waste generation, consumption depletes theenvironment by contributing greenhouse gases (GHG) to the atmosphere.
8.1 Development of the zero waste concepts
From outer space to the bottom of the ocean, generations of waste is accumulating over time. On onehand, the estimated amount of debris put into space by humans and no longer in function has increased from14,000 pieces in 2007 to 18,000 pieces in 2008. On the other hand, accumulation of waste in the great PacificGarbage Patch (currently 1,760,000 sqkm, 12 times bigger than Bangladesh) is getting larger every day [20 –21]. Currently, the world’s cities generate about 1.3 billion tonnes of solid waste per year and the volume isexpected to increase to 2.2 billion tonnes by 2025 [22]. Waste generation rates will more than double over thenext twenty years in lower income countries. However, this current trend of generating waste is not a recentpractice; it comes from the very early stages of modern society.
Zero waste means designing and managing products and processes systematically to avoid andeliminate waste, and to recover all resources from the waste stream [23]. Working towards zero waste hasbecome a worldwide movement that motivates changes in design that make it possible to disassemble andrecycle products. To put it simply, zero waste means no unnecessary and unwanted waste from a product at anystage of its life cycle. The scope of zero waste comprises many concepts that have been developed forsustainable waste management systems, including avoiding, reducing, reusing, redesigning, regenerating,recycling, repairing, remanufacturing, reselling and re-distributing waste resources. Hence, a zero-wastestrategy is growing in popularity as best practice. It not only encourages recycling of products but also aims torestructure their design, production and distribution to prevent waste emerging in the first place [24].Mostmodern societies have been implementing integrated waste management systems to recycle and recoverresources from waste. However, the concept of zero waste is not limited to optimum recycling or resourcerecovery; in addition to that zero waste requires elimination of unnecessary waste creation at the first stage ofdesigning a product. Therefore, zero waste design principles go beyond recycling to focus firstly on avoidanceand reduction of waste by innovative product design and then recycling and composting the rest [25] and thedrivers for transforming current cites into waste cities shown in figure no. 7.
Figure no. 7 Drivers for transforming current cities into zero waste cities.
With proper implementation of all these principles, current cities could be transformed into zero wastecities. The key drivers are based on short-term and long-term implementation strategies. Awareness andeducation, behavior change and systems thinking are long-term strategies, whereas innovative industrial design,legislation and 100% recycling are the short-term strategies to implement in a city.
One of the important aspects of the zero waste cities is the conversion of the linear city metabolism to acircular city metabolism. This transformation requires a series of holistic strategies based on key development

Vivek Prakash Pankaj /Int.J. ChemTech Res. 2014-15, 07(01),pp 440-458. 457
principles. Education and research is on the top of the zero waste hierarchy. Without proper environmentalawareness and advanced research on waste, it would not be possible to achieve zero waste goals. Sustainableconsumption and behavior is placed second in the zero waste hierarchy. As the current trend of consumption isunsustainable and cannot be continued for ever, it is important to understand the reality and act accordingly.The next on zero waste hierarchy is transformed industrial design for example, cradle-to-cradle design, eco-design or cleaner production combined with extended producer responsibility. It is important to have specificzero depletion legislation and incentive policies as part of the strict environmental legislations. If products aredesigned in such a way that everything can be recycled, then achieving optimum recycling and resourcerecovery will not be impossible in the long run.
In a zero waste city material flow is circular, which means the same materials are used again and againuntil the optimum level of consumption. No materials are wasted or under used in circular cities. Therefore, atthe end of their lives products are reused, repaired sold or redistributed within the system. If reuse or repair isnot possible then they are recycled or recovered from the waste stream and used as inputs, substituting thedemand for the extraction of natural resources.
Figure no. 8 Material flow in a Zero waste city
Figure no.8 shows the symbolic material flow of a circular city, where the end of-life product or outputwaste are treated as resources and used as inputs in the city’s metabolism.From this Figure no.8, it is clear that acity’s performance is reflected by its waste management systems. Material flow in a zero waste city should becircular and resources should be used efficiently. The performance of waste management systems thereforesymbolizes the performance of a zero waste city. Hence, it is important to development a zero wastemeasurement tool for cities. Finally, a new system thinking approach and innovative technologies are needed totransform current cities into zero waste cities.
10. Conclusions
There are no independent management systems for plastic waste. They come under the larger purviewof solid waste management with Municipal Corporation’s being the key organization responsible for it.Management of solid waste including plastic waste is in miserable states in India. Due to lack of propercollection systems, the waste generated in the city is littered at public places leading to unhygienic conditions.Lack of segregation of waste at source or at collection points is creating problems for management of waste.
To support any recycling initiative, storage of plastic waste will be a problem due to its high volume butless density. However, if there are systems in place for segregation and storage of plastic waste at Porta- cabincollection points, there are technologies available for compacting the waste for easy and economical storage andtransportation without compromising the quality of plastic and then recycling all sorted plastic waste based onzero waste mechanism.
The major legislations governing solid plastic waste management are in India such as;
Ø Municipal Solid Waste (Management and Handing) Rules, 2000Ø Recycled Plastic Manufacture and Usage (Amendment) Rules, 2003

Vivek Prakash Pankaj /Int.J. ChemTech Res. 2014-15, 07(01),pp 440-458. 458
Ø Plastic Waste (Management and Handling) Rules, 2011
For recycling to achieve its intended purpose of contributing to plastic waste management, thefollowing recommendations might be helpful. Environmental consciousness is certainly of paramountimportance. This is where well designed and continued public awareness campaigns and education is useful.People must be educated on the need to protect and preserve the environment.
11. References:
1. A report on Material on Plastic Waste Management by Central Pollution Control Board,PariveshBhawan, East Arjun Nagar, Delhi-110032, June, 2012.
2. Analysing Plastic Waste Management in India, Priya Narayan, Sept.2001.3. Amit Bajaj &Vipan Kumar., Solid Waste Management; Clean India by Reduce Solid Waste, Global
Journal of human social science Geography, Geo-Sciences, Environmental Disaster ManagementVolume 13 Issue 5 Version 1.0 Year 2013.
4. Plastics for Environment and Sustainable Development, ICPE, Vol. 8, Issue 1, Jan- Mar 2007.5. Warmer Fact Sheet, Plastic Recycling, number 32,1992.6. Mewis, J.,Gevaarlijkestoffen. Monografieenleefmilienu. De Nederlandseboekhandel, Antwerp/
Amsterdam, 1983.7. Goodship, V., Introduction to Plastics Recycling, seconded. SmithersRapra Technology Limited, United
Kingdom, 2007.8. R. Vasudevan, A. Ramalinga Chandra Sekar, B. Sundarakannan, and R. Velkennedy., A technique to
dispose waste plastics in an ecofriendly way – Application in construction of flexible pavements, SciVerse Science Direct, Construction and Building Materials 28 311–320, 2012.
9. Lilliana Abarca Guerrero, Ger Maas, and William Hogland, Solid waste management challenges forcities in developing countries, Sci Verse Science Direct, Waste Management 33220–232, 2013.
10. A Report On Good Practices Guide On Waste Plastics Recycling A Guide By And For Local AndRegional Authorities.
11. A report on Material on Plastic Waste Management by Central Pollution Control Board,PariveshBhawan, East Arjun Nagar, Delhi-110032, June, 2012.
12. Lardinois, I. and Klundert, A., Plastic Waste: Options for Small Scale Recovery. The Netherlands:Waste Consultants, 1995.
13. Smith, P.F., Architecture in a Climate of Change: A Guide to Sustainable Design. Elsevier/ArchitecturalPress, eBook Collection, EBSCO host, 2005.
14. Jackson, T., Prosperity Without Growth: Economics for a Finite Planet. Earths can, London, 2009.15. Lehmann, S., Resource recovery and materials flow in the city: zero waste sustainable consumption as
paradigms in urban development. Sustainable Development Law and Policy 11, 28e38, 2010.16. UN-HABITAT, Solid Waste Management in the World’s Cities. Water and Sanitation in the World’s
Cities Report 2010. Earths can, Washington, DC, 2010.17. UN-MEA., The UN Millennium Ecosystem Assessment Report, 2006.18. Ramsar.,The Ramsar Convention on Wetlands. Background and Context to the Development of
Principles and Guidance for the Planning and Management of Urban and Peri urban Wetlands (COP11DR11), 2012.
19. Mother Nature Network (MNN), What Is the Great Pacific Ocean Garbage Patch, 2010.20. Plastic Pollution Coalition (PPC), Pacific Garbage Patch Graphics by Denisiuk, D. and Bogado, A. from
5WGraphics 2011.21. Hoornweg, D., Bhada-Tata, P., What a Waste: A Global Review of Solid Waste Management, 2012.22. ZWIA.,Zero Waste Definition Adopted by Zero Waste Planning Group, 2004.23. United Nations Economic Commission for Europe (UNECE), Climate Neutral Cities: How to Make
Cities Less Energy and Carbon Intensive and More Resilient to Climatic Challenges,2011.24. City of Austin., Zero Waste Strategic Plan. City of Austin, Austin, TX, 2008.
*****

Vivek Prakash Pankaj /Int.J. ChemTech Res. 2014-15, 07(01),pp 440-458. 459
International Journal of ChemTech Research(Oldest & Original)
CODEN (USA): IJCRGG, ISSN: 0974-4290 [www.sphinxsai.com]
Subject areas: Chemistry, Chemical Technology.
http://www.scimagojr.com/journalrank.php?area=1500&category=1501&country=IN&year=2011&order=tc&min=0&min_type=cd
Please log on to - www.sphinxsai.com
http://www.scimagojr.com/journalsearch.php?q=19700175055&tip=sid&clean=0
SCOPUS[Elsevier]
· Source Normalized Impact per Paper (SNIP) 2013= 0.635
· Impact per Publication (IPP) 2013= 0.57
Check at= http://www.journalmetrics.com/display2.php
[Add Start Year of IMPACT =2011,Origin Year of Journal= 2009]
Indexing and Abstracting.
International Journal of ChemTech Research is selected by -
CABI, CAS(USA), SCOPUS, MAPA (India), ISA(India),DOAJ(USA),Index Copernicus, Embasedatabase, EVISA, DATA BASE(Europe), Birmingham Public Library, Birmingham,Alabama, RGATE Databases/organizations for Indexing and Abstracting.
It is also in process for inclusion in various other databases/libraries.
Please log on to - www.sphinxsai.com
*****