SUSTAINABLE MITIGATION OF STORMWATER … · PAVEMENT March 2018 A Research Report from the National...
69
i SUSTAINABLE MITIGATION OF STORMWATER RUNOFF THROUGH FULLY PERMEABLE PAVEMENT March 2018 A Research Report from the National Center for Sustainable Transportation Avinash Ralla, California State University, Long Beach Dr. Shadi Saadeh, California State University, Long Beach
Transcript of SUSTAINABLE MITIGATION OF STORMWATER … · PAVEMENT March 2018 A Research Report from the National...
i
SUSTAINABLE MITIGATION OF STORMWATER RUNOFF THROUGH FULLY PERMEABLE PAVEMENT
March 2018 A Research Report from the National Center
for Sustainable Transportation
Avinash Ralla, California State University, Long Beach
Dr. Shadi Saadeh, California State University, Long Beach

ii
About the National Center for Sustainable Transportation The National Center for Sustainable Transportation is a consortium of leading universities
committed to advancing an environmentally sustainable transportation system through cutting-
edge research, direct policy engagement, and education of our future leaders. Consortium
members include University of California, Davis; University of California, Riverside; University of
Southern California; California State University, Long Beach; Georgia Institute of Technology;
and University of Vermont. More information can be found at: ncst.ucdavis.edu.
Disclaimer The contents of this report reflect the views of the authors, who are responsible for the facts
and the accuracy of the information presented herein. This document is disseminated under
the sponsorship of the United States Department of Transportation’s University Transportation
Centers program, in the interest of information exchange. The U.S. Government and the State
of California assumes no liability for the contents or use thereof. Nor does the content
necessarily reflect the official views or policies of the U.S. Government and the State of
California. This report does not constitute a standard, specification, or regulation. This report
does not constitute an endorsement by the California Department of Transportation (Caltrans)
of any product described herein.
For individuals with sensory disabilities, this document is available in alternate formats. For
information, call (916) 654-8899, TTY 711, or write to California Department of Transportation,
Division of Research, Innovation and System Information, MS-83, P.O. Box 942873, Sacramento,
CA 94273-0001.
Acknowledgments This study was funded by a grant from the National Center for Sustainable Transportation
(NCST), supported by USDOT and Caltrans through the University Transportation Centers
program. The authors would like to thank the NCST, USDOT, and Caltrans for their support of
university-based research in transportation, and especially for the funding provided in support
of this project. The authors are also thankful to Dr. John Harvey, Dr. Rongzong Wu, Dr. John P.
Caffrey and Omer Eljairi for their contribution in the project.

iii
Sustainable Mitigation of Stormwater
Runoff Through Fully Permeable Pavement A National Center for Sustainable Transportation Research Report
March 2018
Avinash Ralla, Graduate Student, Department of Civil Engineering and Construction Engineering Management,
California State University, Long Beach
Dr. Shadi Saadeh, Associate Professor, Department of Civil Engineering and Construction Engineering
Management, California State University, Long Beach

iv
[page left intentionally blank]

v
TABLE OF CONTENTS
EXECUTIVE SUMMARY ................................................................................................................ x1. Introduction ............................................................................................................................ 1
1.1 Project Scope .................................................................................................................... 11.2 Background to the Study ................................................................................................... 11.3 Study Objectives................................................................................................................ 21.4 Report Layout ................................................................................................................... 21.5 Introduction to Permeable Pavements .............................................................................. 2
2. Literature Review .................................................................................................................... 43. Materials Characterization and Testing ................................................................................. 14
3.1 Subgrade ......................................................................................................................... 143.2 Base Course Material ...................................................................................................... 163.3 Bedding Material ............................................................................................................. 173.4 Permeable Asphalt .......................................................................................................... 173.5 Permeable Concrete Mix Design and Testing ................................................................... 183.6 Flexural Strength of Concrete Test .................................................................................. 20
4. Test Track Location and Fully Permeable Pavement Design ................................................... 224.1 Test Track Location ......................................................................................................... 224.2 Mechanistic-Empirical Design .......................................................................................... 224.3 Fully Permeable Pavement Design................................................................................... 23
5. Test Track Layout and Instrumentation ................................................................................. 275.1 Test Track Layout ............................................................................................................ 275.2 Test Section Instrumentation and Measurements ........................................................... 27
6. Test Track Construction ......................................................................................................... 316.1 Subgrade Preparation ..................................................................................................... 316.2 Base Layer Placement ..................................................................................................... 316.3 Bedding Layer Placement ................................................................................................ 316.4 Concrete Placement ........................................................................................................ 316.5 Asphalt Placement .......................................................................................................... 32
7. Traffic Volume Count ............................................................................................................ 337.1 Counting Types................................................................................................................ 337.2 Manual Count Method .................................................................................................... 33

vi
7.3 Traffic Volume Forecasting .............................................................................................. 348. Data Analysis ......................................................................................................................... 35
8.1 Precipitation.................................................................................................................... 358.2 Data Analysis ................................................................................................................... 358.3. Fully Permeable Pavement Infiltration Performance ...................................................... 43
9. Pavement Distress ................................................................................................................ 449.1 Types of Distress ............................................................................................................. 44
10. Conclusion and Recommendation ....................................................................................... 4710.1 Conclusion..................................................................................................................... 4710.2 Recommendation .......................................................................................................... 48
Appendix: Reference Tables and Images ................................................................................... 49References ................................................................................................................................ 56

vii
LIST OF FIGURES
Figure 1. Preparation of concrete test specimen ....................................................................... 21Figure 2. Aerial view of the test location ................................................................................... 22Figure 3. Fully permeable asphalt pavement design .................................................................. 25Figure 4. Fully permeable concrete pavement design ............................................................... 26Figure 5. Aerial view of test sections ......................................................................................... 27Figure 6. Sensors location on the track...................................................................................... 28Figure 7. Installation of strain gages on the pavement .............................................................. 29Figure 8. Installation of pressure cell on concrete test section .................................................. 30Figure 9. Installation of pressure cell on an asphalt test section ................................................ 30Figure 10. Concrete placement ................................................................................................. 32Figure 11. Asphalt placement and compaction .......................................................................... 33Figure 12. Peak hour traffic plot for morning and evening ........................................................ 34Figure 13. Data comparison of asphalt and concrete sections for vehicle 1 ............................... 37Figure 14. Data comparison of asphalt and concrete sections for vehicle 2 ............................... 38Figure 15. Data comparison of asphalt and concrete sections for vehicle 3 ............................... 39Figure 16. Data comparison of asphalt and concrete sections for vehicle 4 ............................... 40Figure 17. Data comparison of asphalt and concrete sections for vehicle 5 ............................... 41Figure 18. Data comparison of asphalt and concrete sections for vehicle 6 ............................... 42Figure 19. Comparison of conventional (left) and fully permeable asphalt pavements (right) ... 43Figure 20. Fully permeable concrete pavement......................................................................... 43

viii
LIST OF TABLES
Table 1. No 200 Wash Sieve Results .......................................................................................... 14Table 2. Atterberg Limits of Subgrade ....................................................................................... 15Table 3. Percolation Test Results. .............................................................................................. 16Table 4. Sampling of Base Material ........................................................................................... 16Table 5. Sampling of Bedding Material ...................................................................................... 17Table 6. HMA-O Gradation Results ............................................................................................ 18Table 7. Permeable Concrete Aggregate Gradation ................................................................... 19Table 8. Permeable Concrete Mix Design .................................................................................. 19Table 9. Flexural Strength of Permeable Concrete Sample ........................................................ 20Table 10. Permeable Asphalt Pavement Thickness .................................................................... 24Table 11. Permeable Concrete Pavement Thickness.................................................................. 26Table 12. Monthly Rainfall Data of Long Beach, California ......................................................... 35
ix
LIST OF ABBREVIATIONS
CSULB California State University
UCPRC University of California Pavement Research Center
NPS Nonpoint Pollution Source
OGFC Open Graded Friction Course
LID Low Impact Development
BMP Best Management Practice
NAPA National Asphalt Pavement Association
ACPA American Concrete Pavement Association
ICPI Interlocking Concrete Pavement Institute
TI Traffic Index
HMA Hot-Mix Asphalt
PCC Portland Cement Concrete
AASHTO American Association of State Highway and Transportation Officials
ASTM American Society for Testing and Materials
DOT Department of Transportation
HWTT Hamburg Wheel Tracking Test
LCCA Life Cycle Cost Analysis
GWP Global Warming Potential
ODP Ozone Depletion Potential
HVS Heavy Vehicle Simulator
PFC Permeable Friction Course
PICP Permeable Interlocking Concrete Pavement
SUDS Sustainable Urban Drainage Systems
UHI Urban Heat Islands
NRMCA National Ready-Mix Concrete Association
pH Power of Hydrogen
ACI American Concrete Institute US United States
SCM Supplementary Cementing Materials
LA Los Angeles
HDM Highway Design Manual
CNCA California Nevada Cement Association

x
Sustainable Mitigation of Stormwater Runoff Through
Fully Permeable Pavement
EXECUTIVE SUMMARY This report presents the implementation of new design method developed using mechanistic-
empirical design approach by University of California Pavement Research Center (UCPRC)
through building two test sections at California State University Long Beach (CSULB). The study
includes a literature review, pavement design procedure, mix design, construction procedure,
instrumentation, and collection of performance data of the permeable asphalt and concrete
pavement sections for validation and structural design calibration of the new design approach.
Fully permeable pavements are characterized as those in which all layers are porous, and the
pavement structure serves as a reservoir to store water and minimize the negative impacts of
stormwater spillover. The California Department of Transportation (Caltrans) has shown
interest in developing fully permeable pavement design for use in territories that convey
substantial truck activity as a potential stormwater management best management practice
(BMP) to give low-effect infrastructure and proficient framework operation.
A location was selected within CSULB for the construction of the test sections. Pressure cells
and strain gages were installed during the construction of pavements for measuring the stress
on the top of subgrade on both test sections and the strain at the bottom of surface layer to
assess the performance of the fully permeable pavements. In the study, the traffic count was
also determined.
The data acquisition device CDaq was installed at the site to collect the data. The recorded data
was analyzed using the MATLAB program code. The data from pressure cells and strain gages
are analyzed, and graphs were plotted to study the pattern in the data sets. The stress and
strain measurements and the cracking (both sections) and rutting (asphalt section only) will be
used to calibrate the pavement structural design procedure and hydraulic performance will also
be monitored.
Key observations from the study include:
• The collected data has revealed that there is a significant difference in the performance
of the permeable asphalt and permeable concrete test sections.
• The asphalt test section data results showed that high readings of vertical pressure on
the top of subgrade was recorded when compared with the concrete section.
• The vertical strain in the transverse direction at the bottom of the asphalt pavement
surface was recorded and is high compared to the concrete test section.
• The vertical strain in the transverse direction was low when compared to the vertical
strain in the longitudinal direction in the bottom of concrete surface.

xi
• Distresses on the pavement were observed. Raveling and longitudinal cracking were
observed on the concrete test section while surface depression was seen on asphalt
section, for the fifteen months of general parking lot traffic.
• Improper construction practice might have caused surface depression on the asphalt
test section.
• Both test sections performed well in terms of infiltration where year 2017, was
considered as one of the wettest years in California.
Fully permeable pavements are sustainable and cost effective as they eliminate the
construction of drainage pipes or trenches for collecting the stormwater. Based on the
performance evaluation of both the test sections, the fully permeable pavement design will be
enhanced and developed as a potential stormwater mitigation and best management practice
for pavements.

1
1. Introduction 1.1 Project Scope
Fully permeable pavements are those wherein each layer is permeable and serves as a reservoir
to store stormwater. In this study, concrete and asphalt fully permeable pavement sections
were build. A location is selected within California State University Long Beach (CSULB) for the
construction of these test sections. Pressure cells and strain gages were installed during the
construction of pavements for measuring the stress and strain of the pavement. In this study,
the traffic count was also determined.
The design of the fully permeable pavement of concrete and asphalt pavement was performed
using design procedure proposed by the University of California Pavement Research Center
(UCPRC). Once the construction was completed, the pavement sections were open to traffic,
and then data was collected to examine the performance of the constructed test sections. The
results of the study are used to validate and calibrate the structural design procedure proposed
by the UCPRC.
1.2 Background to the Study
Fully permeable pavements are the pavements in which each layer is permeable and where the
structure of pavement acts as a reservoir to store stormwater during the stormwater runoff.
These pavements are mainly intended to reduce the negative effects of stormwater runoff. The
California Department of Transportation (Caltrans) has shown interest in developing the design
procedure for the fully permeable pavement which can carry heavy traffic and as potential
stormwater management best management practice (BMP) in order to provide efficient system
operations and low-impact infrastructure (Jones et al. 2010).
Although permeable pavements are vastly used in the United States, they are limited only to
parking lots, basic access streets, recreation areas which carry light weight vehicles or slow-
moving traffic. Very limited research has been conducted on mechanistic-empirical design and
long-term performance observation of permeable pavements which carry heavy loads and high
traffic. Literature reveals that a variety of fully permeable pavements were successfully
constructed in the late 1970s for low traffic and light vehicles with mixed results. Reports given
by various authors through their observations show that clogging of the permeable surface,
raveling and cracking are common reasons for the failure of the permeable pavements.
The structural design of the pavements is empirical in nature with the availability of little or no
information to support the empiricism. For the expected design conditions, a lot of empirical
data is required, which restricted the speed of technology development for fully permeable
pavement due to excessive cost learning. The speed of the technology can be increased by
implementation of mechanistic-empirical approach which is used in this project for developing
the fully permeable pavement design. This approach consists of determining relevant material
properties and using them in computer models to examine the performance of the pavement.
The results are used to validate the empirical design and calibration of structural design

2
procedure and performance will be evaluated through accelerated pavement testing and field
test sections.
1.3 Study Objectives
The objective of this project is to construct test sections using the design proposed UCPRC and
validate and calibrate the structural design procedure for fully permeable pavement at
California State University Long Beach (CSULB). This design helps in stormwater management
and best management practice in providing low-impact infrastructure and efficient system.
The objective can be achieved after the completion of four tasks:
1. Installation of a pressure cell and strain gages in fully permeable concrete pavement to
enable measuring the stress and strain.
2. Installation of a pressure cell and strain gages in fully permeable asphalt pavement to
enable measuring the stress and strain.
3. Determine traffic volume count.
4. Analyzing the collected data from the strain gages and pressure cells.
1.4 Report Layout
This report presents the research detailed in the tasks listed in the above section 1.3 to achieve
the study objectives. Chapters in the report include the following:
• Chapter 1 details the background and introduction to the report.
• Chapter 2 summarizes the main concepts from the literature review.
• Chapter 3 provides details of the characteristics of the materials used in the project and
tests performed on the materials.
• Chapter 4 details the fully permeable pavement design of permeable asphalt pavement
and permeable concrete pavement.
• Chapter 5 provides details on the test track layout and the instrumentation.
• Chapter 6 summarizes the construction of test sections.
• Chapter 7 details on determination of traffic volume count.
• Chapter 8 deals with the data analysis of the fully permeable pavement.
• Chapter 9 provides details on pavement distresses.
• Chapter 10 summarizes and concludes the findings of the research.
1.5 Introduction to Permeable Pavements
Today, green lands are being replaced by rooftops and roads which is leading to alteration in
water movement across the landscape (Booth and Leavitt 1999). Some of these changes may
be unintentional or intentional but can have severe consequences, especially in disturbing
runoff processes. The loss of the water retaining property of the soil in urban landscapes is due
3
to chemical constituents carried by the runoff. As the water flows through its path, it picks up
pollutants and deposits them into bodies of water, causing those bodies to become polluted. To
reduce the runoff volume, environmentally friendly concepts should be implemented within
the infrastructure.
Permeable pavement is one existing method that can improve stormwater management and
can be used in parking lots and light traffic. These pavements have the potential to decrease
runoff volume. One of the study shows that the water quality is almost similar in asphalt and
concrete permeable pavements (Welker et al. 2012). Permeable pavements can be either
permeable asphalt pavements or permeable concrete pavements. The porous pavements are
often termed as open-graded friction course (OGFC) because they reduce the runoff volume.
Permeable pavements may be an alternative low impact development (LID) and/or best
management practice (BMP) design for the storm water management. The quality of the
permeable pavement depends on the design specifications, construction practice implements
and maintenance practices. Design and construction of permeable pavements for distinct types
of the surface, requires structural and hydrological analysis for the proper function of the
pavement. In the structural design of the pavement, thickness of the different layers of the
structure, which can bear the design traffic is determined. In the hydrological analysis, the
stormwater management objectives are meet as the infiltration of runoff water through the
pavement can filter the water. Though installation of permeable pavements is expensive
initially compared to standard impermeable asphalt pavement, the benefits earned with time
will make the permeable pavements more cost-effective and improves the water sustainability
in surrounding area (Terhell et al. 2015).
The following are the benefits of permeable pavements:
• Recharge of the ground water reserves.
• Less consumed energy and natural resources.
• Low-impact Infrastructure and cost-effective method for stormwater mitigation by
eliminating the use of drainage structure.
• Reduces hydroplaning.
• Absorption of noise created between tire and pavement surface during rainy conditions.
• Greenroads construction.

4
2. Literature Review Fully permeable pavement is a pavement in which all layers are permeable. The structure of
pavement functions as a reservoir in storing the water during storm periods to minimize the
negative effects of stormwater runoff (Jones et al. 2010).
The California Department of Transportation (Caltrans) had tasked the University of California
Pavement Research Center (UCPRC) to develop fully permeable pavement designs for use in
places that carry heavy truck traffic. This is intended as a potential stormwater best
management practice (BMP) in providing low-impact infrastructure and efficient system
operation (Jones et al. 2010). Many projects to build fully permeable pavement have previously
been undertaken in several states. Most of these projects reported a successful experience with
few failures in localized areas due to clogging of permeable surfaces and severe raveling that is
associated with poor construction practices (Jones et al. 2010).
The application of fully permeable pavement has been mostly on parking lots and areas that
have a low volume of truck traffic or heavy loads. Such placement implies that the road owners
are concerned with the durability of the permeable pavement (Jones et al. 2010). The design
procedures that were used were empirical and did not have long-term data monitoring to
support the adequacy of the design. A review of design practice across the United States (Jones
et al. 2010) reveals the limited scope of existing usage for fully permeable pavements, even by
those groups specializing in this type of design. The limited scope of this applications was
observed in the design manuals for the design of porous asphalt, pervious concrete pavements,
and permeable interlocking concrete pavements produced National Asphalt Pavement
Association (NAPA), American Concrete Pavement Association (ACPA), and Interlocking
Concrete Pavement Institute (ICPI), respectively (Jones et al. 2010).
UCPRC presented a summary of laboratory testing, computer performance modeling and life
cycle cost analysis results of fully permeable pavements in their studies (Jones et al. 2010).
These types of pavements can qualify as an effective BMP for managing stormwater on
California highways. The outcomes of their research are a preliminary design procedure and
design catalogue tables which helps to design and experiment fully permeable pavement test
sections in California. The results from the analysis show that fully permeable pavements could
be a cost-effective stormwater BMP alternative to shoulder retrofitting on highways, and for
parking lots, maintenance yards and other areas with slow moving traffic. Though, these results
should be validated through experimental test sections in controlled conditions and pilot
studies before it is considered for full-scale implemented.
The study suggested that accelerated pavement tests and pilot studies on service roadways
should be considered, using the newly developed procedure, then constructed and monitor
under traffic (Jones et al. 2010). The observations from these full-scale experiments should be
used to (1) identify situations where use of fully permeable pavements is applicable BMP, (2)
validate and refine the design method, (3) consider detailed life cycle cost and environmental

5
life cycle assessment, and (4) prepare design and construction procedure guides for the fully
permeable pavements.
Jones et al. (2010) presented the results of the laboratory testing on subgrade, base, asphalt,
and Portland cement concrete surfacing. These results will be used to develop preliminary
pavement designs and identify conditions of fully permeable pavements, to determine whether
the use is appropriate on Caltrans highways and other pavements. The mechanistic-empirical
approach is used for both asphalt and concrete permeable pavements in producing a set of
designs for different Traffic Indexes (TI), climate, and soil conditions.
On subgrade materials, early studies of properties of clays in California showed that there are
slight differences in strength and permeability characteristics of these materials. One clay and
one silt material were tested. The test results of two different subgrade soils, which are
common in California, show that both materials give insufficient support to the pavement
structure. In addition, the stiffness and strength of material decreased due to an increase in
moisture level; using these materials to construct fully permeable pavement requires greater
base thickness and thicker surfacing layers to compensate for the poor bearing capacity of the
subgrade.
On base course materials, four different commercially available aggregate samples were
considered. They are granite (two grades), basalt and alluvial. The results of grading analysis
revealed that the alluvial and basalt materials showed similar grading with no variation in
particle sizes. These base course materials had a void ratio of around 20 to 25% and
permeability of approximately 0.1 cm/sec. The resilient modulus was relatively high for the
finer and more graded samples. These materials will probably provide required support for
typical traffic loads, such as those in parking lots, basic access streets and as well as driveways
and on highway shoulders.
Portland cement concrete materials (PCC) are a common substitute for hot-mix asphalt (HMA-
O) as a wearing course. The PCC-O wearing course materials were tested to determine their
tensile strength, compressive strength, flexural strength, and permeability. For hot-mix asphalt
design, (Jones et al. 2010) showed steps to determine optimum mix designs for the open
graded asphalt concrete wearing courses for use in fully permeable pavements. Georgia,
Arizona, European, California, and other mixes were tested. D125 mix, which is Caltrans
conventional dense-graded mix, was also compared with permeable open-graded mixes. Lab
testing included measurement of permeability, moisture sensitivity, bulk density, fatigue
cracking, resistance against rutting, air voids and flexural strength. American Association of
State Highway and Transportation Officials (AASHTO) and American Society for Testing and
Materials (ASTM) standard methods were followed during testing. The test results revealed
that particle size gradation of aggregate in mix, and the binder type are the two most critical
factors in designing permeable asphalt concrete surface courses. The level of permeability
required in California was obtained after different ranges of mixes tested. The results show that
permeability increased with increasing aggregate size.
6
Hamburg Wheel Tracking Test (HWTT) results show that Georgia Department of Transportation
open-graded mix (G125) was the best, more than those of control dense-graded mix, in spite of
having nearly the permeability very high. This was due to the polymer-modified binder and
usage of fibers. The other open-graded mixes which showed better HWTT results compared to
the control mix including AR95W and RW19. Resistance to rutting will be obtained if the thinner
designs were provided good support. Mix design G125 mix and AR95 mixes had good rutting
resistance. Moisture sensitivity can be removed by use of anti-strip mechanisms. G125 mix is
the best for the stiffness. Most of the mixes had good durability compared to densely-graded
mixes.
The report by Li et al. (2010) outlines the computer modeling of the expected pavement
performance of fully permeable pavements. The report used laboratory test results of the
structural performance of materials, and development of pavement designs for critical
distresses. The approach used for development of detailed pavement designs in this study is
referred to as “mechanistic-empirical” (Li et al 2010). For both asphalt and two different types
of concrete fully permeable pavements, the mechanistic-empirical method was implemented to
yield a set of design procedures for varied Traffic Indexes (TI), climate, and soil conditions. One
type of concrete pavement had surfaces of open-graded PCC-O; in these, the surface is
permeable due to aggregate gradation. The other type was surfaced with ordinary dense-
graded PCC-O; in these during construction, the surface has drainage holes cast into it. All
calculations consider two subbase options in order to give support to the granular layer and
protect the saturated subgrade. These options are: (1) no subbase, and (2) 0.5 ft (150 mm) thick
open-graded Portland cement concrete subbase. The experimental designs were used as a
guide, taking type of pavement, material type, pavement geometry (thicknesses, and slab
dimensions for concrete pavement only), climate, truck axle type, traffic load, and traffic speed
(HMA-O only) into consideration. This leads to nearly 20,000 cases of analysis using layer elastic
theory and for HMA and finite element analysis for HMA and concrete respectively (Li et al.
2010).
In the experimental design of Portland cement concrete fully permeable pavement, the
example predictions of design life (Traffic Index) for various combinations of variables are
considered (Li et al 2010). In the experimental design, for different combinations of variables
the predictions of the shear stress/strength ratio at the top of the subgrade are important since
it is the important contributing factor for permanent deformation (rutting) of the granular base
and subgrade (Li et al. 2010). The results revealed that the required strength can be achieved
with suitable pavement designs for fully permeable hot-mix asphalt and concrete pavements. A
final set of new pavement designs, methodology, material characterizations and
recommendations for full scale validation experiment through accelerated pavement testing
and pilot sections was provided. However, the permeability for functional performance was
considered in the design, performance in terms of raveling and clogging can be evaluated only
through full-scale experiments (Li et al. 2010).

7
Wang et al. (2010) compile a framework for venturing life-cycle cost analyses and
environmental life-cycle assessments of fully permeable pavements. They considered two fully
permeable pavements for Life cycle cost analysis:
• Shoulder retrofit for high-speed highways: Where the comparison is done between
conventional pavement shoulders on a two-lane highway with six lanes (three in each
direction) on conventional treatment Best Managing Practices with a fully permeable
pavement shoulder.
• Low-speed highway or parking lot/maintenance yard: With conventional treatment BMP
versus fully permeable pavement.
In real life cycle cost, analysis period is required, and it is one and a half times of the design life.
The analysis period of 40 years was used in the study of BMP and fully permeable pavement.
The discount rates consider the time value of money used in the account, Caltrans typically uses
4% in its LCCA (Life Cycle Cost Analysis) studies. In this study, 0 and 4% discount rates were used
and the salvage value of zero was assumed at the end of analysis period. Mr. Bill Clarkson of
Teichert Construction in Sacramento volunteered in developing the cost estimates for each
scenario where only agency costs have been estimated. In their study, the Caltrans actual cost
LCCA software was considered for calculating the pavement-related costs. When compared, it
shows that the fully permeable pavements appear to be more cost-effective than the existing
BMPs in most situations for both the shoulder retrofit and the maintenance yard/parking lot
scenarios.
Fully permeable pavements costed two-thirds of BMP for the single lane pavement, fully
permeable pavement costed half of BMPs for three lanes and similar for the parking lot. When
the maximal costs are compared then fully permeable pavement systems are more cost-
effective than existing BMP technologies. The detailed costs, environmental inventory
information and actual life data are not accessible for fully permeable pavement or for the
other BMPs currently available for managing stormwater runoff on California highways. These
data will be available once full-fledged field applications are systematically analyzed and
documented (Wang et al. 2010). Therefore, an accurate environmental life cycle assessment
cannot be considered. It should be observed that these cost comparisons are proposed as
examples for an order of significant comparison only, as costs will vary depending on numerous
factors, and the data will need to be ratified in full-scale field experiments. Project-specific
LCCAs must be performed for every project to make sure that appropriate technologies were
compared and the appropriate local input values were used.
The impact assessment level gives comprehensive information in assessing the product’s
inventory results. The initial step in this stage is to provide the suitable inventory results to the
chosen impact categories such as global warming, ozone depletion, etc. Then, the results that
come in the same category are categorized and calculated by a category indicator, such as
Global Warming Potential (GWP), Ozone Depletion Potential (ODOP), etc. (Wang et al. 2010).
The last step is an evaluation, which sums up across impact categories using weights or other
decision-makers to take in and consider the full range of appropriate results. Some common

8
impact categories are climate change, resource depletion, and other categories, for example:
human health and environmental categories such as ozone depletion or acidification potential.
Li et al. (2014) presented the research initiated for development of revised design tables for
permeable interlocking concrete pavement based on mechanistic-empirical design method. In
this study, field testing of already existing projects and test sections was done later, the
effective stiffness of every layer in permeable interlocking concrete pavement structures is
evaluated, mechanistic analysis of the data and structural design of test track consisting three
different subbase thicknesses. Tests were conducted on the track with a Heavy Vehicle
Simulator to collect performance data and validate the design approach using accelerated
loading, improvisation and calibration of the design methodology using the test track data,
developing the spreadsheet-based design tool, and developing the design tables using the
design tool (Li et al. 2014).
The basis for the design approach was the developing rut rate as a function of the shear stress
to shear strength ratio at the top of the subbase and subgrade. When the subgrade is
compacted before placing the subbase, the infiltration of water into the subgrade is decreased.
From the study differences in rutting performance and rutting behavior were observed
between the wet and dry tests. A maximum extent of the rutting on all three sections occurred
as initial embedment in first 2000 to 5000 load repetitions of the test and again after load
changes, most of the rutting in base and subbase layers was associated to bedding,
densification, and reorientation of the aggregate particles (Li et al. 2014). This type of
observance is common in rutting on the interlocking concrete pavement with different types of
structures.
In testing under dry conditions, a permanent deformation of less than 4mm was recorded in
bedding and the base layers on all three subsections in very initial stages in the tests and a
linear increasing trend of permanent deformation with decreasing subbase thickness (Li et al.
2014). While testing under the wet conditions, despite limited testing that was done in drained
conditions, the rutting showed a similar behavior to the test under dry conditions. The
thickness of subbase changed the rut depth in subgrade but did not show any influence of
rutting behavior in subbase and the rutting was governed by aggregate properties and quality
of construction. During the dry testing, deflection was reliant on subbase thickness and
increased with increasing load. The comparison showed that deflections were higher than
traditional pavements, and they were high in wet testing conditions. Distresses in any
pavement were not found during the testing.
Over the Heavy Vehicle Simulator (HVS) testing, the infiltration rate of water through the
pavers reduced but it was considered to be rapid and effective. Higher risk of rutting is
observed at higher shear stress/strength ratios in the subgrade, where the subbase layer should
be thicker, as anticipated. To achieve the same shear stress/strength ratio an increase in the
stiffness of the surface layer reduces the thickness of the subbase. However, the surface layer
stiffness does not show any negative effect on the overall pavement performance due to
minimal thickness. The wet conditions require thicker subbase layer compared to the dry

9
conditions for the same shear stress/strength ratio, which specifies that wet conditions are
most critical conditions for the design. To prevent the rutting in the subgrade, the minimum
thickness required is the same as in the current tables. Designs for a specific set of project
circumstances can be undertaken using the same Excel® spreadsheet-based design tool used to
develop the tables in conjunction with the hydrological design procedures provided in the ICPI
guide (Li et al. 2014).
Hein et al. (2013) discussed the permeable pavement systems that include a surface having
joints or openings which allow water to infiltrate. The joints allow water from rainfall to flow
through the surface into an open-graded base or subbase where it is collected and stored
before it gets infiltrated through the pavement structure. The careful design of permeable
pavements can assure that they can provide long life and be effective in accommodating
stormwater (Hein et al. 2013). Attentive considerations of the design feature and construction
techniques are required for satisfactory results.
The structural design of the pavement is completed to find the thickness of the different
pavement layers, which are necessary to support the anticipated design traffic to protect the
subgrade from deformation. The hydrological design identifies the key design parameters
required to infiltrate rainwater and surface runoff into the pavement hold and release and filter
the water to achieve the stormwater management goals.
The most common structural analysis method for porous asphalt and permeable interlocking
concrete pavement uses the requirements of the AASHTO (1993) American Association of State Highway and Transportation Officials Guide for the Design of Pavement Structures (Hein et al.
2013). The important design parameters include an attentive evaluation of the permeable
pavement site and its surrounding land use to ensure that the pavement has good durability.
The evaluation of the traffic to which the pavement will be exposed including trucks, buses, and
other heavy vehicles will allow the designer to ensure that the pavement has enough structural
capacity for its design life (Hein et al. 2013). Water landing on pavement and watershed from
surrounding area can be taken into consideration in the hydrological design of the permeable
pavement. Later water can be treated for quality improvement and allowed to exit the
pavement through infiltration or controlled through underdrains. There are many ways
stormwater models that could be implemented to perform the hydrological design for
permeable pavements. Based on the hydrologic design objectives, appropriate models may be
used, simple volumetric runoff estimation method, event-based hydrograph estimation
method, continuous simulation modeling programs.
The suitability of the project for permeable pavement is based on certain considerations or
factors. These factors can be divided into primary, secondary and others. The primary factors
considered are the availability of funds, the status of environmental approval, safety, depth of
water table, geotechnical risks, and ground water contamination risks. The secondary factors
include: stringent receiving water quality standards, sand use for winter maintenance, low soil
infiltration rates, target design volumes and runoff rates, risk of flooding, mandates for
stormwater quality control, mandates for drainage and peak flow control, and maintenance

10
protocols. Other factors consist of interest in innovation, presence of utilities, impact of
unknown site conditions, and risk of the accidental chemical spill (Hein et al. 2013).
The key structural and hydrological design considerations include traffic, subgrade
characteristics for infiltration capacity, surface layer to determine the structural capacity, base
and subbase to determine the structural capacity, ability to assess the maintenance and design
reliability. In hydrological design considerations, design storm to determine storm duration,
frequency; intensity, surface infiltration capacity, surface slope less than 5%, avoid subsurface
slope for infiltration designs, contributing catchment area, supplemental surface drainage,
subgrade infiltration, underdrains, outflow details to meet detention goals, geotextiles for
prevention of movement of fine particles, and liner for no infiltration designs.
Construction processes and techniques should account for the protection of the permeable
pavement from contamination during construction and should assure that the pavement is able
to accommodate both vehicle loading and water infiltration. The key construction
considerations are construction timing, preconstruction meeting, subgrade compaction,
underdrains, base and subbase placement and construction protection. The considerations for
interlocking concrete pavements include pavement selection, bedding layer, and joint filler. For
porous asphalt, the construction considerations are mix design and placement. Finally, for all
pavements, maintenance practices should include occasional vacuum sweeping to ensure the
longevity of the permeable surface with repairs completed to avoid any distresses such as
settlement and raveling etc. (Hein et al. 2013).
Leipard et al. (2015) presented a hydraulic design methodology that was developed in their
current research on permeable interlocking concrete pavements and tested pavement section
in a two-layer hydraulic flume. Acceptable runoff area with different site geometries and design
storm was determined. The results state that before it reaches bypass the infiltration increases
with increase in flow rate. The experiment displayed initial results of the project and showed
that the infiltration rate of the interlocking permeable pavement blocks exposed to horizontal
sheet flow is higher when compared to the vertical infiltration (Leipard et al. 2015). Moreover,
a statistical analysis was used to determine the similarity of the means among the experimental
groups of five. The statistical analysis had a one-way ANOVA to correlate the unknown variance
of the five-experimental groups capture discharge flow rate.
The null hypothesis was explained, as the group means were equal, alternative hypothesis that
at least one group mean was different with a significance level of 0.05 or 5% and “the failure to
reject the null hypotheses indicates that the assumption that the means of the 6 mm and the
precision test are equivalent was probable. The p-value of 0.029 for the 6 mm and herringbone
degree pattern experiment indicates a failure to reject of the null hypothesis value for an alpha
of 0.05” (Leipard et al. 2015). An additional test run was performed, which showed that pattern
data differed from the running bond 6mm pattern. P value of 0.001 was recorded for the 6mm
spacing and 10mm experiment. However, the p value of less than 0.05 revealed the rejection of
the null hypothesis, implying that there was a significant difference between the 6mm spacing
separation and 10mm spacing. The research found similar results for experiments between

11
6mm and 12.5mm. Stated briefly, it conveys statistical analyses between spacing, patterns, and
precision testing were incorporated showing the greatest differences between the 6mm and
10mm spacing respectively. The study shows that infiltration rates are inversely proportional to
the cross slope of the pavement. Moreover, a portion of this research includes pervious
pavement as a substitute subbase and clogging tests were synthetic stormwater were
incorporated for permeable interlocking concrete pavement (PICP) was developed and
evaluated. The complete research results will allow the designer to attentively design PICP for
hydraulic performance including traditional hydrological and structural aspects.
Braga and Connolly (2010) presented a permeable friction course (PFC) paving approach
implementing a pervious top course upon an impermeable paving base. Highway applications
have unveiled that PFC overlays can provide stormwater runoff mitigation and significantly
reducing the amount of pollutants discharged from paved areas (Braga and Connolly. 2010).
Their report presents the PFC specifications and installation criteria and compares the PFC over
permeable pavement applications and results of case studies of projects where PFC has been
installed.
For a selection of an optimum blend of fine and coarse aggregate, grading specification bands
are represented as a guide. Based on the tests conducted on the average seven-day maximum
and minimum temperatures, the appropriate asphalt binder can be easily selected for suitable
conditions. To protect the asphalt binder from deteriorating, stabilizing additives are used in
the PFC mixtures such as cellulose fiber, mineral fiber, polymers. In the installation, there are
certain different specifications when compared to traditional installation of the pavement. A
PFC application project should not be implemented if the pavement surface temperatures are
below 50°F (McGhee et al. 2009) and the mixture should be stopped for a small amount of time
to reach the project site.
On comparison of the PFC with full depth porous asphalt, PFC is applied only for 1 inch over an
existing impermeable pavement while full depth porous asphalt is an integrated approach and
installed based on multilayer thickness design. Porous asphalt tends to withstand the wintry
conditions while PFC was not so effective. High maintenance is required for PFC in wintry
conditions. However, porous asphalt is not ideal for high speed, and high traffic roads.
In case studies on the water quality, runoff samples were considered during every rainfall which
has taken place before and after PFC was installed over a 21-month interval. The samples were
examined in the lab where the concentrations of pollutants were measured. On comparison,
the concentrations levels from samples of runoff extracted from the impermeable asphalt
versus the new PFC overlay, the results showed that concentrations of total suspended solids
(92%) decreased, and total copper (51%), lead (90%) and zinc (74%). While in noise reduction, it
revealed that due to the porosity and rubber or polymer modifiers found in PFC overlays, they
reduced the noise generated from the tire-pavement contact (Braga and Connolly. 2010).
Swan et al. (2010) depicted the development of the structural and hydrological design
procedure with an application. Regulatory frameworks for incorporating of sustainable design

12
have inclined on permeable pavement solutions which are known as low impact development
(LID) or sustainable urban drainage systems (SUDS). In 2008, the Interlocking Concrete
Pavement Institute (ICPI) proposed a software program called Permeable Design Pro which
sums up hydrological and structural design answers for permeable interlocking concrete
pavement (PICP). A logical and technically sound design process using design software known
as Permeable Design Pro software tool will help in developing appropriate PICP designs having
good structure and accommodating and exiting the stormwater (Swan et al. 2010). The
hydrological evaluation ensures if the amount of water from rainfall events can be stored and
released by the pavement structure. Based on the parameters given by the user, the water
infiltration into subgrade is determined and infiltration into pipe subdrains. By using the
AASHTO 1993 structural design equations for base or subbase thickness, the structural capacity
of the pavement is determined to support vehicular traffic.
The Permeable Design Pro software implements an iterative process to estimate the water
balance during rainfall for six days later to determine whether the system drains in a
considerable length of time. The results will help the designers decide whether PICP can be
implemented. The program calculates the AASHTO structural number required given input
properties for the individual pavement layer. Based on the evaluations the program determines
the thickness of base/subbase required from the structural or hydrological for the use as the
PICP design cross-section. This helps the user in choosing the conservative design values and
the program default values for input variables when sufficient parameter values are not
available. This helps the user to conduct sensitivity evaluation and determine the optimal base
thickness for the pavement.
Anush K. Chandrappa and Krishna Prapoorna Biligiri’s (2016) study details the mechanical
properties, hydrological properties, stormwater purification efficiency, rehabilitation
techniques for better hydraulic efficiency, life-cycle cost analysis and field investigation of test
sections and in-service pervious pavements. The two major environmental effects that are
caused due to the construction of impervious pavements are: (a) ground water recharge
changes, (b) surrounding temperature increases. Pervious concrete pavement has reduced the
Urban Heat Islands (UHI) effect and other benefits lead to the application of pervious concrete
pavement around various places in the world.
Pervious concrete is a gap graded material that has pore structure which is interconnected. The
gradation consists of single sized course aggregate. The pervious concrete consists of porosity
ranging between 15-25% with a minimum of 15% recommended by the National Ready-Mix
Concrete Association (NRMCA). The water-cement ratio ranging between 0.28-0.40, the
aggregate to cement ratio ranged between 4:1 to 6:1 and the volume aggregates in pervious
pavement is 50-65%. To have a good strength the aggregate size varied between 9.5-2.36mm is
used in numerous studies. The aggregate used in pervious concrete should have properties
specified by the ASTM standard specification for concrete aggregate which specifies the
limitations of the material that may affect the pervious pavement performance. Pervious
concrete was produced using the ordinary Portland cement (OPC). Later researchers have
implemented partial substitution like fly ash, silica fume for OPC but the addition of these

13
materials lead to a reduction in strength properties of pervious concrete after exceeding a
certain point. It also revealed that with an increase in aggregate size the compressive strength
and elasticity increased. The admixtures which reduce the water in concrete have been used in
most of the studies to increase the workability and easy placement of the concrete on the field.
To provide an applicable amount of cement paste around the aggregate is the primary principle
in the mix design proportion. In one of the studies, the mix proportion was calculated using the
absolute volume method (Deo and Neithalath. 2011). The study shows that strength properties
like compressive, flexural and fatigue are a function of mix variables and highly depend upon
aggregate to cement ratio rather than cement to water ratio. Studies have shown that the
compressive strength of pervious concrete gains 70 to 90% of the 28 days strength in 7 days.
The fatigue strength of pervious concrete in compression was studied by addition of polymers
which improved the fatigue strength. As of now, there is no specific method to determine the
compressive and flexural strength of pervious concrete. To determine the durability of pervious
concrete, abrasion and freeze resistance play a significant role. In a study, the researcher used
latex and fiber to modify the pervious concrete, which resulted in resistance against the
abrasion, when tested in three different methods. Pervious concrete having a lean aggregate
shows a very low resistance to abrasion due to weak bond but using recycled aggregate it
showed good resistance. Fine crumb rubber increased the abrasion resistance whereas tire
chips reduced the abrasion resistance. Induction of silica fume with super plasticizer will
enhance the freeze thaw resistance. The pore properties are classified as (a) non-transport-
related and (b) transport-related. The non-transport-related properties include total volumetric
porosity, pore size and distribution and, while transport-related properties are effective
porosity and pore connectivity and tortuosity. In pervious concrete, the porosity distribution is
vertical and increases along the depth of pervious concrete. The strength of the pervious
concrete decreased with increase in porosity (Chandrappa and Biligiri 2016).
The transport-related properties help in movement of water from the surface to bottom and
high paste concrete mixture decreases the pore connectivity. Permeability is a crucial factor in
the study of pore properties. As the age of pavement goes on the permeability decreases due
to clogging of debris and other material on the pervious concrete. According to Rowe’s (2010)
study on field investigation placement of geotextile over the open-graded base layer is not
recommended and if placed on subgrade it increases the stability of the subgrade if weak.
The structure of pervious concrete purifies the water by removing the suspended particles in
the water when water moves through the layer. Due to the presence of alkaline in pervious
concrete, the pH of water is increased making it more neutral than acidic in nature. Studies
show that in service pervious concrete removes 94.3% of phosphorous content in water
(Radlinska et al. 2012). The pervious concrete even reduced the heavy metals when the water
was tested after infiltration. Pervious concrete initially costs a lot when compared to
conventional pavement due to controlled design approach. The overall cost of the project is
less on comparison with the conventional pavement. Due to lack of information on LCCA it was
difficult to study LCCA without any assumptions. The benefits which are provided by the

14
permeable pavement can outperform the conventional pavement from environmental point of
view with reduction in UHI which is major factor on temperature maintenance.
In fully permeable pavements, the stormwater gets infiltrated from the surface layer through
each layer of the pavement. The greater amount of voids in each layer allows water to infiltrate
and store. This process basically helps in avoiding the construction of drainages or trenches
which collect the stormwater in conventional pavements. Fully permeable pavements are
sustainable in nature as they infiltrate the water naturally and reduce the construction cost of
the pavement by discarding the drainage pipes to collect water.
3. Materials Characterization and Testing
3.1 Subgrade
Subgrade material is the soil present under the base or subbase layer of the pavement. In
conventional pavement, the subgrade is well-compacted during construction to increase the
structural strength of the pavement. However, compaction of the subgrade is not allowed for
the fully permeable pavement to provide infiltration of water. This condition of the subgrade,
poorly compacted and often saturated, must be considered when designing the pavement
structure.
3.1.1 Field Exploration
Boring and sampling were conducted at the location of test section at CSULB. The results
showed that subgrade material consisted of lean clay to clayey sand material. The clayey
subgrade was observed to be moist and with stiffness ranging between soft to medium. The
subgrade material found is typical for that part of campus area based on previous works
performed at this location of CSULB.
3.1.2 Laboratory Moisture Content and Density Tests
The moisture content and dry density of selected samples obtained from the exploratory
borings were evaluated using test method ASTM D 2937. The results show that for 0-5 feet the
moisture content was 17.4% and dry density was 103.5pcf.
3.1.3 Wash Sieve
The amount of fines passing the sieve No. 200 sieve was evaluated through the wash sieve. The
test procedure was in general accordance with ASTM D 1140. The percent passing #200 is
shown in Table 1.
Table 1. No 200 Wash Sieve Results
Boring No. Depth (feet) Percent passing #200 1 0-5 54.7
1 6 40.3

15
3.1.4 Atterberg Limit
Liquid limit, plastic limit, and plasticity index of the soil are evaluated. The test procedure was in
general accordance with ASTM D 4318. The results are presented in Table 2.
Table 2. Atterberg Limits of Subgrade
Depth Liquid limit Plastic limit
Plasticity index
USCS classification
At 3 feet 32 16 16 Sandy lean clay
At 5 feet NP NP NP Silty sand
3.1.5 Maximum Dry Density-Optimum Moisture Content
A selected bulk soil sample was tested to determine the maximum dry density and optimum
moisture content. The test was performed using the ASTM D 1557 method A. Results show that
the maximum dry density is 125.0 pcf and optimum moisture content is 9.5% for 0-5 feet.
3.1.6 Resistance Value (R-Value)
To determine the R-value, the test was conducted on a select bulk sample of the near-surface
soils encountered at the site. The test was performed using the test method ASTM D 28444.
The testing was performed by AP Engineering and Testing, Inc. Results show that the R-value is
8 for the initial 5 feet.
3.1.7 Percolation Test
The percolation test boring was excavated at the project site. The percolation test was
conducted on December 16, 2015, in conformance with the of Los Angeles county (2014)
requirements. The percolation test was performed within the excavation of a boring of 11.5
feet below the existing grade.
After the completion of the excavation, approximately 2 inches of coarse gravel was placed at
the bottoms of the boreholes to prevent scouring during testing. A 10-feet section of
perforated PVC pipe was installed in the boreholes, and coarse gravel was used to fill around
the pipes. The boreholes were presoaked prior to testing for two 30-minute intervals. Once the
presoaking was completed, the borings were filled with water and measurements were taken at
30-minute intervals at the test locations. The drop which takes place during the final three
intervals was used to determine the percolation rate at test location. The percolation test result
is shown in Table 3. The measured percolation rate at the test section was 3.6 in/hr. (2.5x10⁻³
cm/sec) while the minimum recommended percolation rate for pavement that intended to
infiltrate stormwater rather than merely detain it is 0.1417 in/hr. (10-4 cm/sec).

16
Table 3. Percolation Test Results
Test Location Depth of Test Hole
Measured Percolation Rate
Design Infiltration Rate
1 120 in 3.6 (in/hr.) 0.45 (in/hr.)
3.2 Base Course Material
Base material differentiates the surface layer and the subgrade material and contributes to
most of the bearing capacity of the pavement. This layer also provides much of the shear stress
protection to the subgrade and bending resistance to the surface layer of the pavement. In the
study, the ASTM#2 aggregate was used as the base material per the design proposed by UCPRC.
In conventional pavement, the base layer is densely compacted in order to provide a platform
to overlay surface layer and provide good structural strength to the pavement. In fully
permeable pavement, the open-graded base course is used to allow the water to be stored
while it is infiltrating into the subgrade. The level of compaction and resultant strength are
influenced by open-graded base course. To compensate the lower strength and stiffness, a
greater thickness of the base layer is required. Though the gradation of aggregate changes from
day to day, the supplied aggregate was within the specifications.
3.2.1 Material Sampling
The sampling test was conducted on the ASTM#2 material of the base layer using ASTM D75
test procedure. The results of the test are shown in Table 4.
Table 4. Sampling of Base Material
Sieve size Percentage passing 3 in (75mm) 100
2 ½ in (62.5mm) 94
2 in (50mm) 64
1 ½ in (37.5mm) 13
1 in (25mm) 4
¾ in (19mm) 2
½ in(12.5mm) 2
3/8 in (9.5mm) 1
No. 200 (75µm) 0.2
Other Properties: The ASTM #2 aggregate was tested for abrasion loss using ASTM C535 and
test results show that for 1000 revolutions, the abrasion loss is 10%. Based on the tests ASTM C
142, ASTM C123, ASTM C 117, the results show that deleterious substances like clay and friable,
coal and lignite, -200 mesh are in 0, 0, 0.2 percentages.
17
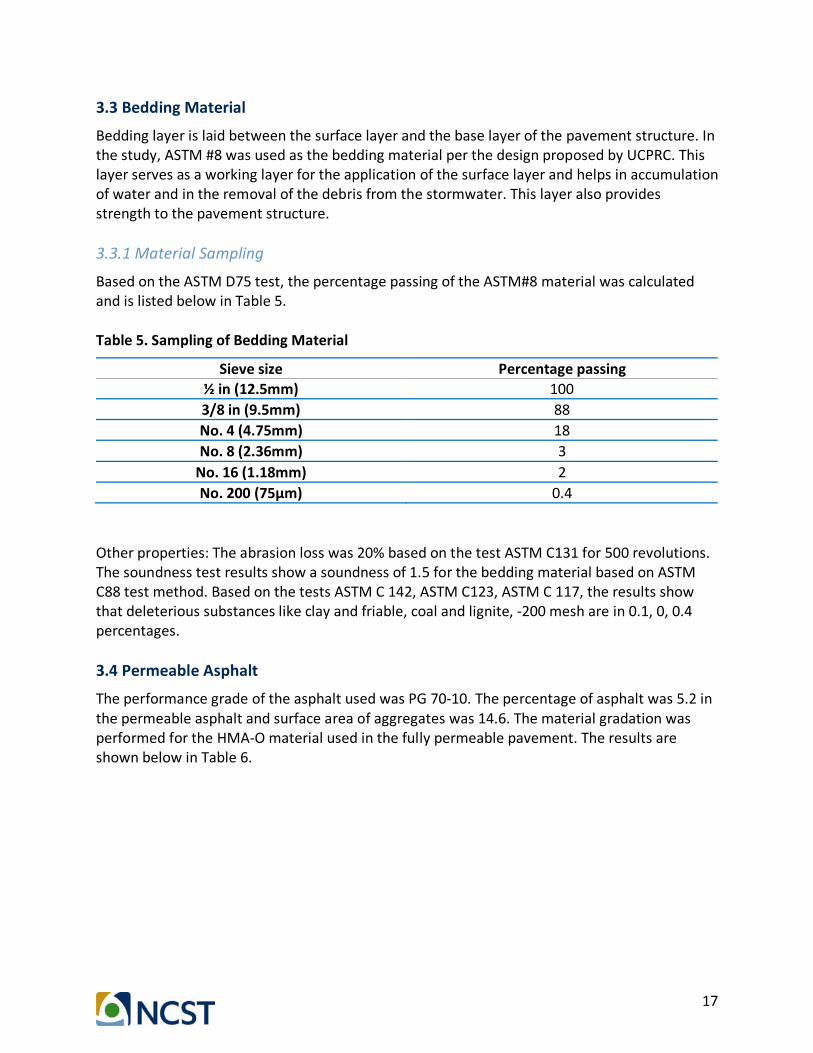
3.3 Bedding Material
Bedding layer is laid between the surface layer and the base layer of the pavement structure. In
the study, ASTM #8 was used as the bedding material per the design proposed by UCPRC. This
layer serves as a working layer for the application of the surface layer and helps in accumulation
of water and in the removal of the debris from the stormwater. This layer also provides
strength to the pavement structure.
3.3.1 Material Sampling
Based on the ASTM D75 test, the percentage passing of the ASTM#8 material was calculated
and is listed below in Table 5.
Table 5. Sampling of Bedding Material
Sieve size Percentage passing ½ in (12.5mm) 100
3/8 in (9.5mm) 88
No. 4 (4.75mm) 18
No. 8 (2.36mm) 3
No. 16 (1.18mm) 2
No. 200 (75µm) 0.4
Other properties: The abrasion loss was 20% based on the test ASTM C131 for 500 revolutions.
The soundness test results show a soundness of 1.5 for the bedding material based on ASTM
C88 test method. Based on the tests ASTM C 142, ASTM C123, ASTM C 117, the results show
that deleterious substances like clay and friable, coal and lignite, -200 mesh are in 0.1, 0, 0.4
percentages.
3.4 Permeable Asphalt
The performance grade of the asphalt used was PG 70-10. The percentage of asphalt was 5.2 in
the permeable asphalt and surface area of aggregates was 14.6. The material gradation was
performed for the HMA-O material used in the fully permeable pavement. The results are
shown below in Table 6.

18
Table 6. HMA-O Gradation Results
3.5 Permeable Concrete Mix Design and Testing
Permeable concrete is a special kind of concrete with greater porosity due to the presence of
interconnected pores which allow the water to infiltrate through the permeable concrete. The
mix design for the Portland cement pervious concrete was performed as per the California
Nevada Cement Association guidelines (CNCA).
3.5.1 Aggregate Gradation
The aggregate gradation used in the permeable concrete is shown in Table 7. The primary
aggregate gradation (% passing U.S. standard sieve).
Sieve Size Percent Passing 1 in.(25mm) 100
3/4 in.(19mm) 100
1/2 in.(12.5mm) 95.3
3/8 in.(9.5mm) 82.1
No. 4 (4.75mm) 28.4
No. 8 (2.36mm) 13.9
No. 16 (1.18mm) 9.8
No. 30 (0.60mm) 8.5
No. 50 (0.30mm) 5.8
No. 100 (0.15mm) 4.2
No. 200 (0.075mm) 3.3

19
Table 7. Permeable Concrete Aggregate Gradation
Size 1.5 in 1.0 in 3/8 in WCS COMB. Agg% 0% 0% 100% 0% 100%
2.0 in 100 100 100 100 100
1.5 in 98 100 100 100 100
1.0 in 22 94 100 100 100
¾ in 8 75 100 100 100
3/8 in 2 11 91 100 91
#4 2 19 95 19
#8 1 3 82 3
#16 0 69 0
#30 48 0
#50 22 0
#100 5 0
#200 0.4 0.2 2 0
F.M 7.92 7.12 5.87 2.79 5.87
Pertinent Properties: Unit weight: 120.8 pcf (plastic)
Cementitious factor: 7.00 sk/cu.
W/(C+P): 0.29 by wt., 3.29 gal/sack
Admixtures: The admixtures which improve the characteristics of the concrete are added to the
permeable concrete. The admixtures used are Plastocrete 161, viscocrete 2100, sikaTard 440
with dosage range 2-6 Oz/100wt, 2-10 Oz/100wt, 09 Oz/100wt. The admixtures are adjusted to
maintain the workability, finish ability and set time.
Permeable Concrete Mix Design for 1 Cubic Yard The mix design of permeable concrete for one cubic yard is shown in Table 8.
Table 8. Permeable Concrete Mix Design
Material SP. Gravity Abs Vol(cu.ft) Batch wt.(Lbs)
Cement 7.00 3.15 3.35 658
Fly ash 0.0 2.30 0.00 0
1.5 in agg 0.0% 2.72 0.00 0
1.0 in agg 0.0% 2.71 0.00 0
3/8 in agg 100% 2.69 14.37 2412
W/C sand 0.0% 2.65 0.00 0
Water 23.0 1.0 3.07 192
Air voids 23.0% 6.21
Total 27.00 3262

20
3.6 Flexural Strength of Concrete Test
The tensile strength of the concrete is measured in terms of flexural strength. It is measured
using a concrete beam without reinforcement or ability of slab to resist failure in bending. The
measurements of the specimen are, 6x6 inch concrete beams with a span length of three times
the depth of the beam. The flexural strength of concrete is expressed in terms of Modulus of
Rupture (psi). A typical modulus of rupture ranges between 300psi and 700psi.
Testing was conducted on the concrete samples collected from the test location at parking lot 7
in CSULB to find the flexural strength of the concrete using the ASTM C78 test method. The
results of the testing samples are as shown in Table 9. Preparation of the samples is shown in
Figure 1. The fracture type 1= C39: cones on both ends; C1314: Conical Break, 1-T1- Reasonably
well-formed cones on ends, >1in.of cracking through caps.
Table 9. Flexural Strength of Permeable Concrete Sample
Note: The average 28-day modulus of rupture (psi) = 585psi
Unit weight of permeable concrete = 132.1 pcf
Date sampled
Date tested
Age (days)
Width (in)
Depth (in)
Span (in)
Ultimate load (lbf)
Fracture type
Modulus of Rupture
07/25/16 08/22/16 28 5.85 6.00 18.00 6913 1 590
07/25/16 08/22/16 28 6.00 6.05 18.00 7014 1 575
07/25/16 09/19/16 56 5.95 6.05 18.00 7628 1 630
07/25/16 09/19/16 56 5.90 6.00 18.00 7290 1 620

21
a) Compaction of sample b) Weighing of sample
c) Beam sample preparation d) Curing of samples
Figure 1. Preparation of concrete test specimen
22
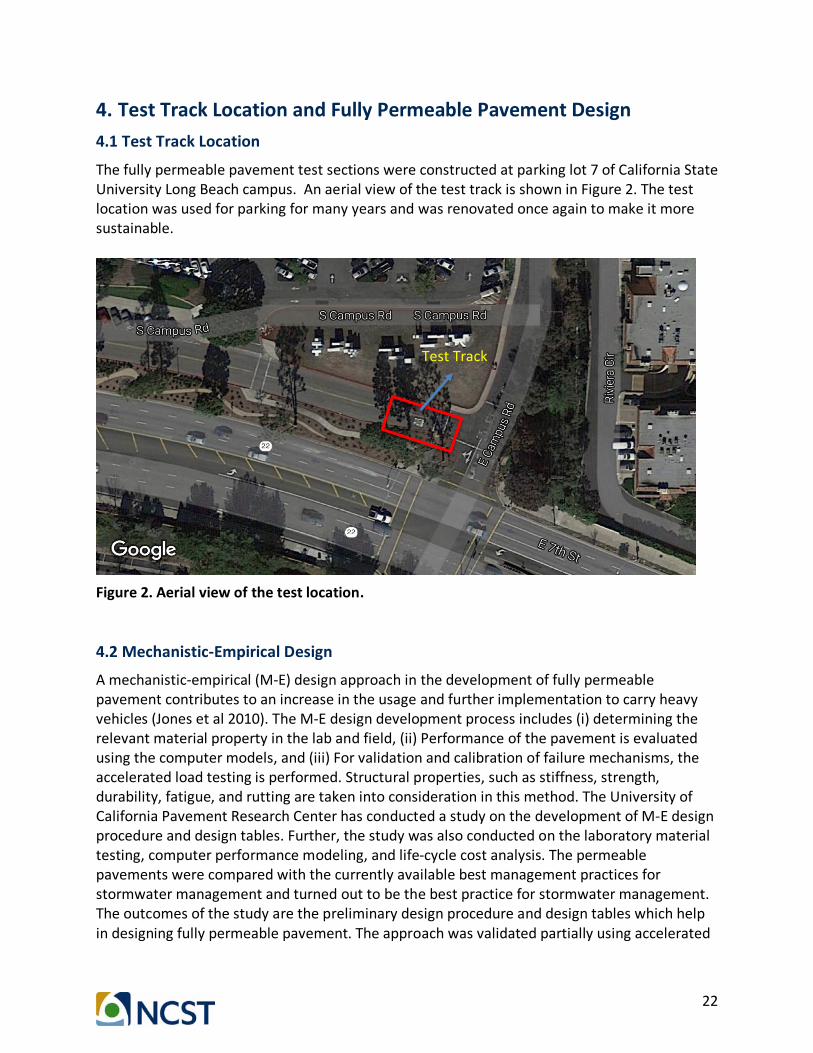
4. Test Track Location and Fully Permeable Pavement Design 4.1 Test Track Location
The fully permeable pavement test sections were constructed at parking lot 7 of California State
University Long Beach campus. An aerial view of the test track is shown in Figure 2. The test
location was used for parking for many years and was renovated once again to make it more
sustainable.
Figure 2. Aerial view of the test location.
4.2 Mechanistic-Empirical Design
A mechanistic-empirical (M-E) design approach in the development of fully permeable
pavement contributes to an increase in the usage and further implementation to carry heavy
vehicles (Jones et al 2010). The M-E design development process includes (i) determining the
relevant material property in the lab and field, (ii) Performance of the pavement is evaluated
using the computer models, and (iii) For validation and calibration of failure mechanisms, the
accelerated load testing is performed. Structural properties, such as stiffness, strength,
durability, fatigue, and rutting are taken into consideration in this method. The University of
California Pavement Research Center has conducted a study on the development of M-E design
procedure and design tables. Further, the study was also conducted on the laboratory material
testing, computer performance modeling, and life-cycle cost analysis. The permeable
pavements were compared with the currently available best management practices for
stormwater management and turned out to be the best practice for stormwater management.
The outcomes of the study are the preliminary design procedure and design tables which help
in designing fully permeable pavement. The approach was validated partially using accelerated
Test Track

23
pavement testing on the permeable interlocking concrete pavement built at the University of
California Pavement Research Center (Li et al 2014). The testing was performed in dry, soaked,
and intermediate conditions. Based on the material properties, stresses and strain, fatigue life,
region, types of surface, structure type, thickness, load, hydraulic performance etc., were all
analyzed in developing the structural designs for fully permeable pavements.
4.3 Fully Permeable Pavement Design
A preliminary design method for fully permeable pavement has been developed by University
of California Pavement Research Center (UCPRC) based on the regional rainfall, storm event
design period, truck speed, return period, surfacing (open-graded asphalt concrete [HMA-O] or
open-graded Portland cement concrete [PCC-O]), traffic, subbase type and the shear stress-to
shear strength ratio at the top of the subgrade for fully permeable pavement in California
(Jones et al. 2010). Pre-cast concrete with holes is also included in the design method but not
considered in this study. The design tables used in the design are prepared from computer
modeling analysis, but have not yet been validated in the field, which is the purpose of this
study. The hydraulic design table includes 2-year, 50-year, and 100-year storm return periods
for three distinct climate regions in California (Sacramento, Los Angeles, and Eureka). These
regions were selected to test the sensitivity of design to different events (intensity of storm,
duration of storm, geometry, draw down and clogging of infiltration). The following is the
design procedure:
1. The subgrade soil permeability, region, design storm event period and lanes drained are
selected. The thickness of the open-graded gravel base is determined from the above
information and selection of subbase option is also required for HMA-O pavements. The
storm design period and thickness of the base layer are influenced by whether
occasional overflows are permitted or not. The lowest permeability is considered in the
design.
2. The type of surface is selected. In PCC-O pavement based on the slab length, thickness
of base, design traffic, and design speed the thickness of the surface layer is determined
while for HMA-O pavement, thickness of base, design traffic and design speed are
incorporated to determine the HMA-O layer thickness. Once the thickness of different
layers is determined, the shear stress to shear strength ratio is identified on the top of
the subgrade to prevent permanent deformation.
4.3.1 Fully Permeable Asphalt Pavement Design
a. Design Parameters The following are the design parameters for a HMA-O test section of two lanes of a local street
and parking lane, with no subbase, in the LA area:
• Compacted subgrade (minimum allowable compaction) permeability: 10-4 cm/s (0.1417
in/hr.)
• Storm design: 50 years
• Design Traffic Index: 5 (4710 ESALS, minimum required by HDM)

24
• Design truck speed: 7 km/h. (4.35 mph)
• Surface layer: 12.5 mm (1/2 in.) nominal maximum aggregate size (NMAS) open-graded
hot mix asphalt (HMA-O)
• Subbase: No subbase
b. Design Procedure The design procedure discussed below refers to a series of tables in Appendix A through
Appendix E in the “Laboratory testing and modeling for structural performance of fully
permeable pavements” final report by UCPRC (Jones et al 2010). The tables referred are
provided in the appendix. Cells that are referred to in the tables are circled and highlighted.
Step 1: Choose base thickness based on hydraulic performance. Using Appendix A, select the minimum thickness of granular base for a subgrade soil
permeability of 10-4 cm/s, 50-year design storm, and LA region. These variables require a
minimum base/reservoir layer thickness of 360 mm for a two-lane highway. For soil
permeability of 10-4 cm/s, the minimum base/reservoir will be 360 mm. Round up to 500
mm.
Step 2: Choose HMA-O layer thickness based on HMA-O fatigue damage for given TI. Using Appendix B, select the minimum HMA-O layer thickness for a base thickness of 500
mm, and a TI of 5 (the corresponding minimum TI in the table is 5.5). The minimum required
thickness of HMA-O is 200 mm.
Step 3: Check the stress/strength ratio at the top of the subgrade. Using Appendix C, check the shear stress-to-shear strength ratio at the top of subgrade
based on the minimum required thickness of granular base of 500 mm and minimum
required a thickness of HMA-O of 200 mm. The stress/strength ratio is “Y” where the shear
stress is between 0.3 and 0.7 of the shear strength. Consequently, a medium risk of
permanent deformation in the subgrade is expected for this pavement design. For the
permeability of 10-4 the minimum thickness of the base is 500 mm and the required HMA-O
thickness to get the “Y” indicator is 200 mm (8 in.). A 50-mm (2 in.) No.8 base bedding layer
on top of the base is required.
c. Pavement Design Thickness The design thickness of the permeable asphalt pavement of different layers is given below in
Table 10 and is shown in Figure 3.
Table 10. Permeable Asphalt Pavement Thickness
Layer Thickness Material HMA-O 8 in (200mm) NMAS=1/2 in (12.5mm)
Bedding 2 in (50mm) ASTM No 8
Base 20 in (500mm) ASTM No 2

25
Figure 3. Fully permeable asphalt pavement design Note
* HMA-O permeability should be no less than 425 in./hr. (0.3 cm/s)
** A subgrade compaction of between 90 and 92% is recommended (i.e., target 91% ± 1%
tolerance) of laboratory determined maximum density, following Caltrans Test Method 216.
4.3.2 Fully Permeable Concrete Pavement Design
a. Project Design Parameters The following are the design parameters for a PCC-O test section of three lanes of local street
and parking lane, with no subbase, in the LA area:
• Compacted subgrade permeability: 10-4 cm/s (0.1417 in/hr.)
• Storm design: 50 years
• Design Traffic Index: 5 (4710 ESALS, minimum required by HDM)
• Surface layer: Jointed, no dowels, PCC-O with 12 ft (3.6 m) slab length, and k-value of
0.05 Mpa/mm. Note that this is a test section that its joints are either sawn or formed to
link with existing joints in the adjacent lanes.
• Subbase: No subbase
b. Design Procedure Step 1: Choose base thickness based on hydraulic performance. Using Appendix D, select the minimum thickness of granular base for a subgrade soil
permeability of 10-4 cm/s, 50-year design storm, and the LA region. These variables require a
minimum base/reservoir layer thickness of 700 mm for a three-lane highway. Use 710 mm.
The base layer is open-graded, which has grater voids than densely graded base layer.
200mm HMA-O* (12.5mm
NMAS)
500mm ASTM No. 2 Open-
graded base layer
Subgrade** (no compaction)
50mm ASTM No. 8 Bedding
layer
Geotextile on bottom and sides

26
Step 2: Select PCC-O slab thickness based on PCC-O fatigue damage for given TI. Using Appendix E, select the minimum PCC-O slab thickness for a slab length of 3,100 mm
and TI of 5 is selected. The minimum required slab thickness of PCC-O is 250 mm. Therefore,
the minimum required granular base thickness is 710 mm, and the minimum thickness of
PCC-O is 250 mm for the design requirements and site conditions.
c. Design Thickness The thickness of each layer of the pavement is shown in Table 11 and the design section is
shown in Figure 4.
Table 11. Permeable Concrete Pavement Thickness
Layer Thickness Material PCC-O 10 in (250mm) Max Size Ag= 3/8 in (9.5mm)
Bedding 2 in (50mm) ASTM No 8
Base 28 in (710mm) ASTM No 2
Figure 4. Fully permeable concrete pavement design Note
1. Minimum strength requirements for permeable concrete.
* The 28-day flexural strength of 330 psi ASTM C-78, if using SCM the 56-day strength is
required.
2. Portland cement concrete Infiltration rate 1 cm/s (1417 in/hr.) infiltration (Air voids content
of 30%).
3. Minimum cementitious content, including SCM and cement, must be 425 lb/cu yd minimum.
4. A subgrade compaction between 90 and 92% is recommended, (i.e., target 91% ± 1%
tolerance) of laboratory determined maximum density, following Caltrans Test Method 216.
250 mm. PCC-O
710 mm. ASTM No. 2 Open-
graded base material
Subgrade
50 mm. ASTM No. 8 bedding
layer
Geotextile on bottom and sides

27
5. Test Track Layout and Instrumentation 5.1 Test Track Layout
The test track layout is shown in Figure 5. The test section is comprised of concrete pavement and asphalt pavement, both of which are fully permeable. The test section lies in parking lot 7 at the CSULB campus on East Campus Drive and 7the Street. The test section has two subsections; the section toward the left is fully permeable concrete pavement and the section on the right is fully permeable asphalt pavement. Both the test sections consist of subgrade, a base layer, a bedding layer and a surface layer.
Figure 5. Aerial view of test sections 5.2 Test Section Instrumentation and Measurements
The vertical stress and strain measurements were taken in the study to evaluate the performance of the test sections. The vertical stress was measured using pressure cells while the vertical strain was measured through strain gages. The instrument positions are shown in Figure 6. In the figure, the rectangular box with numbers 1 to 8 are strain gages, and the blue highlighted spots are the pressure cells.
Concrete Test Track
Asphalt Test Track

28
Figure 6. Sensors location on the track 5.2.1 Strain Gages on the Top of Base Layer Strain gages were installed on top of the base layer on both the pavement sections. On the concrete section, two strain gages were installed transversely, and another two were installed in the longitudinal direction. The same installation process was followed on the asphalt section. In the concrete section, a small batch of concrete is placed on the exact location of the strain gage and is then closed by pouring concrete on top of the strain gage. Later, after some time the concrete was placed. In case of the asphalt section, a nylon material is wrapped around the wires of the strain gages to prevent physical damage to the wires resulting from the heat of the asphalt (Oregon Department of Transportation 2015). Then a small batch of asphalt was poured, and the gages were installed accordingly. Once the gages were covered with asphalt, the asphalt was compacted using the tamper so that the strain gages would not be wrecked. Later, the asphalt was placed on the entire section. The installation of strain gages is shown in Figure 7.

29
a) Placing strain gages b) Placing strain gages on asphalt
c) Pouring of HMA on strain gages d) Pouring of HMA on test section
Figure 7. Installation of strain gages on the pavement 5.2.2 Vertical Pressure Cell on the Top of Subgrade Pressure cells were installed in the subgrade layer of the concrete and asphalt section to measure the vertical pressure (stress) under the moving wheel. The RST instrument total pressure cell was installed on the surface of the subgrade layer before placement of the geotextile. A similar pressure cell was installed on the top of subgrade of asphalt section. Initially, 2 inches of subgrade soil was excavated and filled with fine sand. After the sand was placed, it was leveled using a leveling instrument. A square shaped geotextile, i.e., woolen woven cloth, was placed before the sand was poured into the trench. Then the pressure cell was placed on top of the sand and was leveled again. As a result, the pressure cell will not move. After leveling, sand was poured on top of pressure cell, leveling it with the subgrade layer. A trench was excavated for the cable. After the cable was placed, it was covered with sand, and this completed the installation of pressure cell. Data was recorded from the pressure cell after the pavement was constructed. The variation of the pressure reading will be recorded based on the wheel position of the vehicle travelling and the load applied by the vehicle. Installation of pressure cell is shown in Figure 8 and Figure 9.
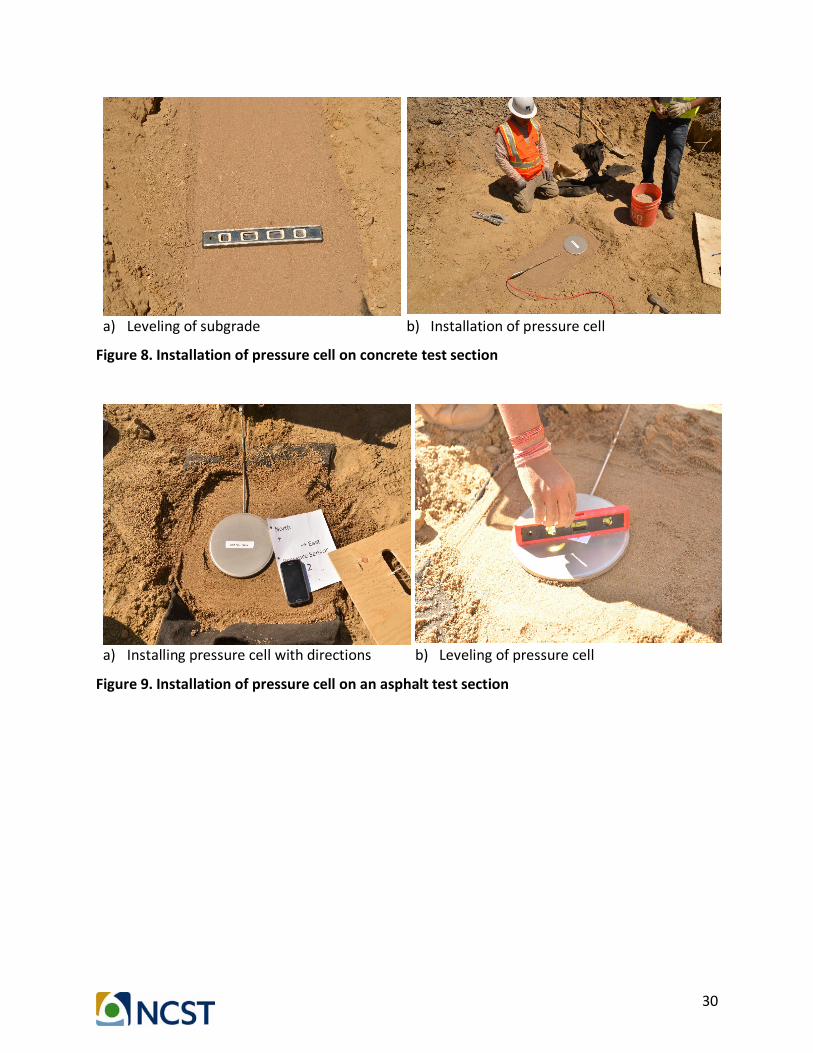
30
a) Leveling of subgrade b) Installation of pressure cell
Figure 8. Installation of pressure cell on concrete test section
a) Installing pressure cell with directions b) Leveling of pressure cell
Figure 9. Installation of pressure cell on an asphalt test section

31
6. Test Track Construction The construction of the test track was started in July 2016 and was completed in August 2016. The test track was constructed in Parking Lot 7 at California State University Long Beach (CSULB). 6.1 Subgrade Preparation
The test track, along with the rest of the parking lot was excavated. The soil was excavated based on the depth required for different pavement sections. The subgrade soil consisted of lean clay to clayey sand material. The measured percolation rate of subgrade soil after excavation was 3.6 in/hr. Geotextile was placed on the subgrade floor and sides of the excavation to prevent the movement of subgrade fines into the base material. 6.2 Base Layer Placement
The base layer of the pavement provides the structural strength required for the pavement to withstand. Each test section has a base layer of a different depth. The ASTM #2 material was used as the base for both the test sections which was open-graded in nature. The asphalt section has a base layer depth of 20 inches while the concrete section has 28 inches. The aggregate was compacted after placement, which increases the strength of the base layer. As the base is open graded, it will allow the water to percolate through the layers and store stormwater. 6.3 Bedding Layer Placement
The bedding layer is sandwiched between the surface layer and the base layer of the pavement. This layer helps to stop the mixing of the surface layer material and the base layer. This layer provides the structural strength to the surface layer of the pavement. ASTM #8 material is used as the bedding material. The thickness of the bedding layer was 2 inches for both pavement sections. The bedding layer was compacted for strength purposes. 6.4 Concrete Placement
The concrete was poured on top of the bedding layer of the pavement from the ready-mix concrete pumping truck. A thickness of 10inches of the concrete was placed. Compaction of the concrete was performed using the roller screed and hand floats. A plastic cover was used for curing of the permeable concrete test section for 7 days. The placement of concrete and compaction is shown in Figure 10.

32
a) Permeable concrete placement b) Pouring of concrete
c) Compacting concrete using roller screed d) Compaction using hand floats
Figure 10. Concrete placement 6.5 Asphalt Placement
The asphalt was placed on top of the bedding layer of the asphalt pavement section. The thickness of 8 inches of asphalt was placed. The permeable asphalt pavement was compacted using a static roller and was allowed for traffic after one day. Asphalt placement is shown in Figure 11.

33
a) Pouring of asphalt mix b) Compaction using static roller
Figure 11. Asphalt placement and compaction 7. Traffic Volume Count The traffic volume count is conducted to identify the number, movement and classification of the roadway vehicles at a location (Iowa State University Center for Transportation Research and Education [CTRE] 2002). The collected data is used to assess the critical flow periods, and identify the influence of heavy vehicles or pedestrians on traffic flow of vehicles. The type of data collection period depends on the type of counting and objectives of the projects. In this study, the traffic volume count was determined to validate the data collected from both the test sections. 7.1 Counting Types
Traffic volume counting is performed by two methods: (1) Manual Counting and (2) Automatic Counting. Manual counting is performed to collect the data of vehicle classification, vehicle turnings, the vehicle moving direction, vehicle occupancy (CTRE 2002). This type of counting is taken up mostly for the brief time data collection and forecasting the data. Automatic counts are usually used to gather a large quantity of data continuously, identify the hourly pattern of the traffic, and determine growth trends based on the daily and seasonal variation. The collected data is very helpful in calculating the average annual daily traffic. In this study, the manual counting method was considered. 7.2 Manual Count Method
Manual count method is mostly used in the collection of small data samples at a required location. Manual counts are considered when the effort and cost for automatic equipment is not available, and they are mandatory in case of unavailability of automated devices (CTRE 2002). Manual counts are performed for periods of less than a day. The most common intervals considered in manual counting are 5, 10 or 15 minutes.

34
In this study, the data was recorded on a tally sheet which is the simplest way of performing the traffic count. The data was recorded on a pre-prepared location form with a tick. A stopwatch was used to measure 15 minutes interval time. The tally sheet contains the sketch of the site location, time, data and weather condition details. The traffic count was performed for a week from Monday through Friday for data accuracy and consistency during the peak hours of the day at the test location. The collected data showed a varied growth pattern. High traffic was observed only during the class hours in the evening time on Monday and Wednesday and during theatrical event days. As the path is a one-way road, the traffic at the test location is meager. 7.3 Traffic Volume Forecasting
Traffic volume forecasting is a phenomenon which deals with the prediction of number of vehicles that are most likely to use the transportation facility in the future. The forecasting starts with the collection of the traffic count at a required location. In this study, traffic count of the vehicles was collected for a weak and then used for the forecasting. The traffic volume count was forecasted by plotting a graph and using the polynomial equation that was generated for the plot. The plot was generated for both the morning peak hours and evening peak hours. The morning peak hours were from 8 am to 11 am and the evening peak hours were from 3 pm to 7 pm. The plot was used to forecast the traffic. The traffic volume count plot for morning and evening peak hours is shown in Figure 12.
Figure 12. Peak hour traffic plot for morning and evening
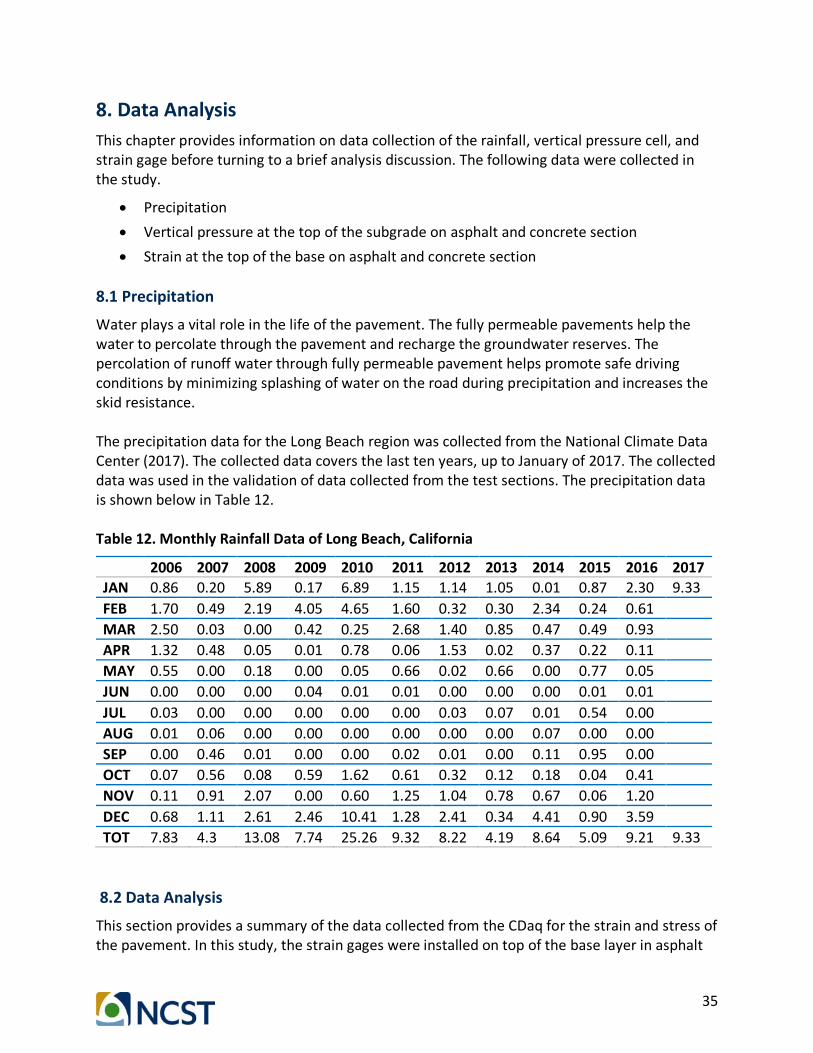
35
8. Data Analysis This chapter provides information on data collection of the rainfall, vertical pressure cell, and strain gage before turning to a brief analysis discussion. The following data were collected in the study.
• Precipitation • Vertical pressure at the top of the subgrade on asphalt and concrete section • Strain at the top of the base on asphalt and concrete section
8.1 Precipitation
Water plays a vital role in the life of the pavement. The fully permeable pavements help the water to percolate through the pavement and recharge the groundwater reserves. The percolation of runoff water through fully permeable pavement helps promote safe driving conditions by minimizing splashing of water on the road during precipitation and increases the skid resistance. The precipitation data for the Long Beach region was collected from the National Climate Data Center (2017). The collected data covers the last ten years, up to January of 2017. The collected data was used in the validation of data collected from the test sections. The precipitation data is shown below in Table 12. Table 12. Monthly Rainfall Data of Long Beach, California
2006 2007 2008 2009 2010 2011 2012 2013 2014 2015 2016 2017 JAN 0.86 0.20 5.89 0.17 6.89 1.15 1.14 1.05 0.01 0.87 2.30 9.33 FEB 1.70 0.49 2.19 4.05 4.65 1.60 0.32 0.30 2.34 0.24 0.61 MAR 2.50 0.03 0.00 0.42 0.25 2.68 1.40 0.85 0.47 0.49 0.93 APR 1.32 0.48 0.05 0.01 0.78 0.06 1.53 0.02 0.37 0.22 0.11 MAY 0.55 0.00 0.18 0.00 0.05 0.66 0.02 0.66 0.00 0.77 0.05 JUN 0.00 0.00 0.00 0.04 0.01 0.01 0.00 0.00 0.00 0.01 0.01 JUL 0.03 0.00 0.00 0.00 0.00 0.00 0.03 0.07 0.01 0.54 0.00 AUG 0.01 0.06 0.00 0.00 0.00 0.00 0.00 0.00 0.07 0.00 0.00 SEP 0.00 0.46 0.01 0.00 0.00 0.02 0.01 0.00 0.11 0.95 0.00 OCT 0.07 0.56 0.08 0.59 1.62 0.61 0.32 0.12 0.18 0.04 0.41 NOV 0.11 0.91 2.07 0.00 0.60 1.25 1.04 0.78 0.67 0.06 1.20 DEC 0.68 1.11 2.61 2.46 10.41 1.28 2.41 0.34 4.41 0.90 3.59 TOT 7.83 4.3 13.08 7.74 25.26 9.32 8.22 4.19 8.64 5.09 9.21 9.33
8.2 Data Analysis
This section provides a summary of the data collected from the CDaq for the strain and stress of the pavement. In this study, the strain gages were installed on top of the base layer in asphalt
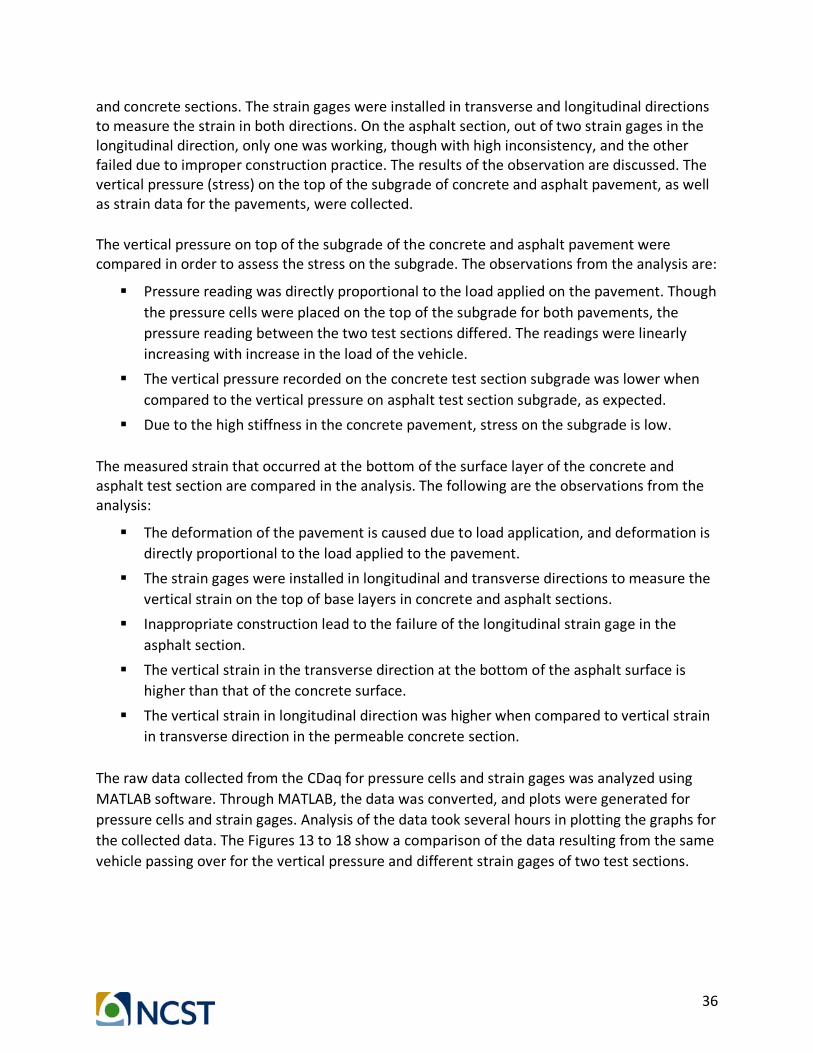
36
and concrete sections. The strain gages were installed in transverse and longitudinal directions to measure the strain in both directions. On the asphalt section, out of two strain gages in the longitudinal direction, only one was working, though with high inconsistency, and the other failed due to improper construction practice. The results of the observation are discussed. The vertical pressure (stress) on the top of the subgrade of concrete and asphalt pavement, as well as strain data for the pavements, were collected. The vertical pressure on top of the subgrade of the concrete and asphalt pavement were compared in order to assess the stress on the subgrade. The observations from the analysis are:
§ Pressure reading was directly proportional to the load applied on the pavement. Though the pressure cells were placed on the top of the subgrade for both pavements, the pressure reading between the two test sections differed. The readings were linearly increasing with increase in the load of the vehicle.
§ The vertical pressure recorded on the concrete test section subgrade was lower when compared to the vertical pressure on asphalt test section subgrade, as expected.
§ Due to the high stiffness in the concrete pavement, stress on the subgrade is low.
The measured strain that occurred at the bottom of the surface layer of the concrete and asphalt test section are compared in the analysis. The following are the observations from the analysis:
§ The deformation of the pavement is caused due to load application, and deformation is directly proportional to the load applied to the pavement.
§ The strain gages were installed in longitudinal and transverse directions to measure the vertical strain on the top of base layers in concrete and asphalt sections.
§ Inappropriate construction lead to the failure of the longitudinal strain gage in the asphalt section.
§ The vertical strain in the transverse direction at the bottom of the asphalt surface is higher than that of the concrete surface.
§ The vertical strain in longitudinal direction was higher when compared to vertical strain in transverse direction in the permeable concrete section.
The raw data collected from the CDaq for pressure cells and strain gages was analyzed using MATLAB software. Through MATLAB, the data was converted, and plots were generated for pressure cells and strain gages. Analysis of the data took several hours in plotting the graphs for the collected data. The Figures 13 to 18 show a comparison of the data resulting from the same vehicle passing over for the vertical pressure and different strain gages of two test sections.

37
Permeable Asphalt Section Permeable Concrete Section
a) Vertical pressure cell b) Vertical pressure cell
c) Transverse strain gage d) Transverse strain gage
e) Vertical stress comparison f) Longitudinal strain gage
Figure 13. Data comparison of asphalt and concrete sections for vehicle 1

38
Permeable Asphalt Section Permeable Concrete Section
a) Vertical pressure cell b) Vertical pressure cell
c) Transverse strain gage d) Transverse strain gage
e) Vertical stress comparison f) Longitudinal strain gage
Figure 14. Data comparison of asphalt and concrete sections for vehicle 2
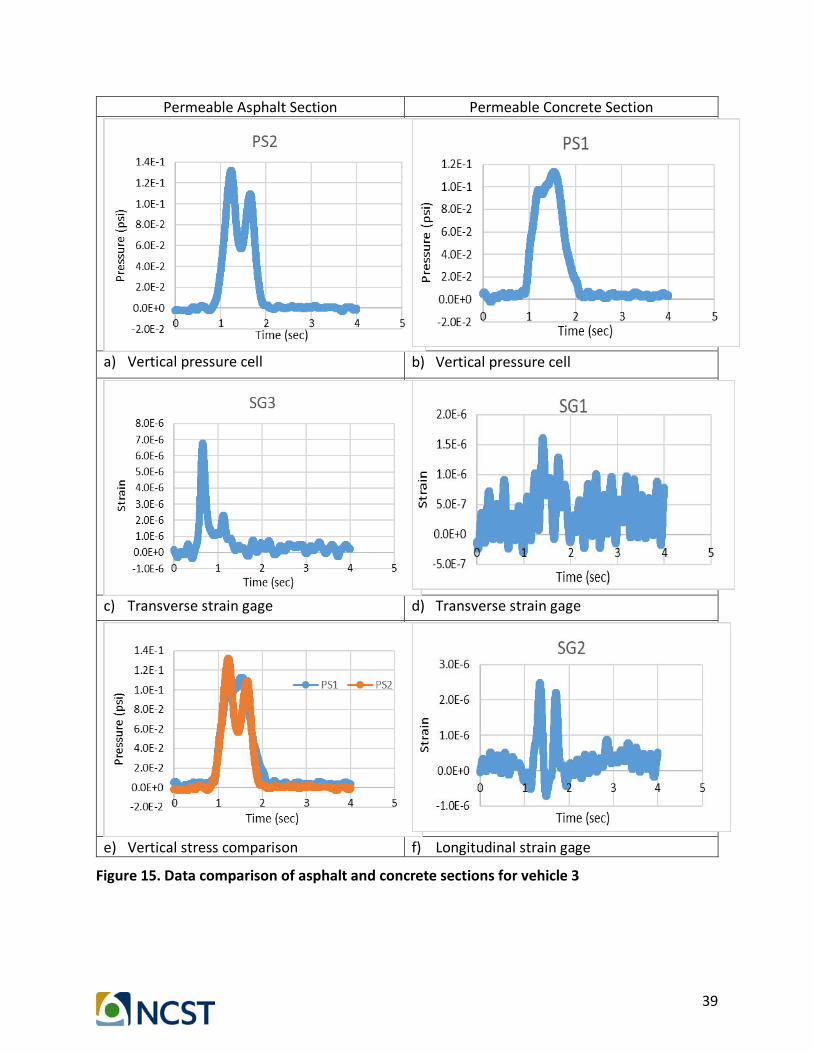
39
Permeable Asphalt Section Permeable Concrete Section
a) Vertical pressure cell b) Vertical pressure cell
c) Transverse strain gage d) Transverse strain gage
e) Vertical stress comparison f) Longitudinal strain gage
Figure 15. Data comparison of asphalt and concrete sections for vehicle 3

40
Permeable Asphalt Section Permeable Concrete Section
a) Vertical pressure cell b) Vertical pressure cell
c) Transverse strain gage d) Transverse strain gage
e) Vertical stress comparison f) Longitudinal strain gage
Figure 16. Data comparison of asphalt and concrete sections for vehicle 4
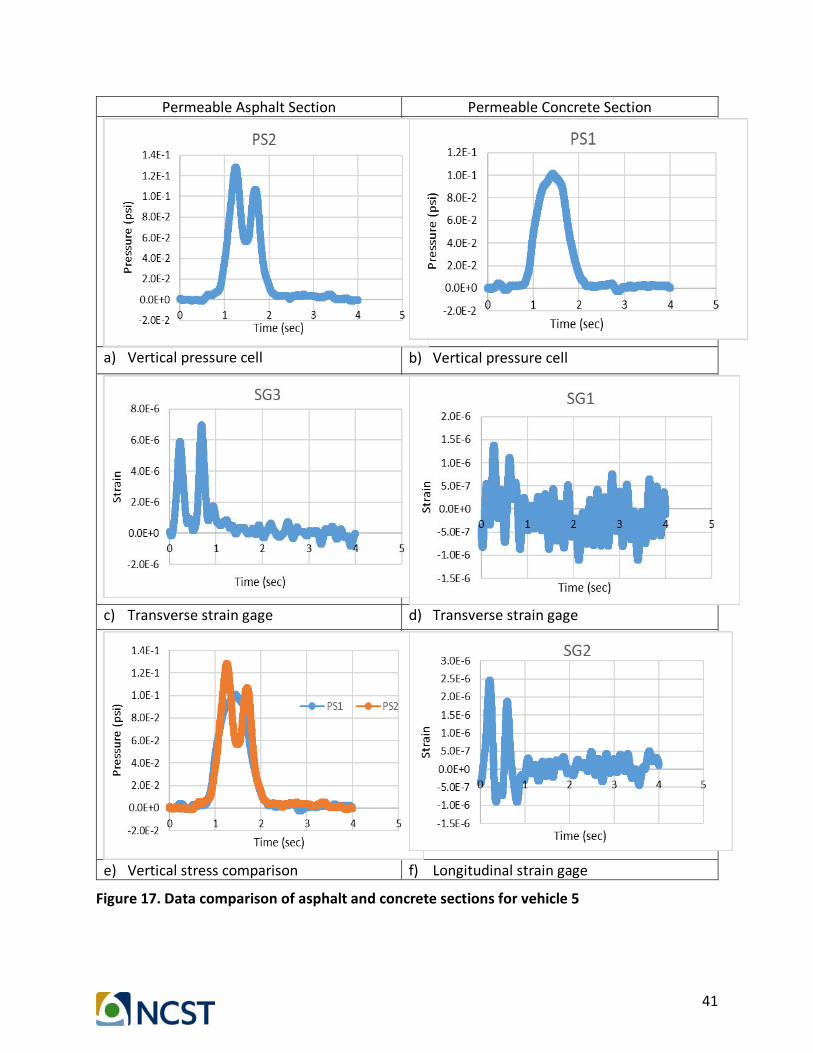
41
Permeable Asphalt Section Permeable Concrete Section
a) Vertical pressure cell b) Vertical pressure cell
c) Transverse strain gage d) Transverse strain gage
e) Vertical stress comparison f) Longitudinal strain gage
Figure 17. Data comparison of asphalt and concrete sections for vehicle 5

42
Permeable Asphalt Section Permeable Concrete Section
a) Vertical pressure cell b) Vertical pressure cell
c) Transverse strain gage d) Transverse strain gage
e) Vertical stress comparison f) Longitudinal strain gage
Figure 18. Data comparison of asphalt and concrete sections for vehicle 6

43
8.3. Fully Permeable Pavement Infiltration Performance
Both the test sections performed well in terms of infiltration of stormwater runoff. 2017 is considered one of the wettest years in California, yet both the test sections were able to infiltrate water and no overflow of water from both the test sections was seen at any time. The performance of fully permeable asphalt and the concrete section is shown in Figure 19 and 20. The Figure 19 shows the difference in infiltration performance on conventional asphalt pavement and fully permeable asphalt pavement. This is the best example to show how fully permeable pavement will reduce the hydroplaning and mitigate the stormwater runoff on the pavement.
Figure 19. Comparison of conventional (left) and fully permeable asphalt pavements (right)
Figure 20. Fully permeable concrete pavement

44
9. Pavement Distress Distress in pavement is unavoidable and a vital parameter in design of pavement. Knowledge on pavement distress is important as it helps the pavement designer in identifying the cause of the distress (Huang. 2003). Some pavements fail due to faulty construction. There are several reasons for the failure of the pavement such as immediate increase in the traffic loading, particularly on new roads which are designed for lower loading; shifting of load of adjacent pavement, high variations in temperature and poor subgrade such as clayey subgrade materials. 9.1 Types of Distress
The different types of distresses which the pavement exhibits are cracking, surface deformation, disintegration, surface defects (Adlinge and Gupta. 2015). 9.1.1 Cracking The different types of cracking are fatigue cracking, longitudinal cracking, transverse cracking, block cracking, slippage cracking, and edge cracking. The potential causes for the cracking are overloading, and inadequate joint depth (Kevern. 2011). Fatigue cracking: The other name for fatigue cracking is alligator cracking. In this type of distress, the creation of interconnected cracks leads to small, uneven shaped pieces of pavement. This cracking takes place mostly due to surface or base layer failure due to repeated traffic (Fatigue) loading. Longitudinal cracking: These are the cracks that take place along the road, i.e., parallel to the centerline of the pavement. These are caused due to joint failures or heaving, or due to excess load induction. Transverse cracking: These cracks are formed perpendicular to the direction of traveling. Initially, they start with hair sized cracks and later increase. The causes and solutions for the transverse cracking are similar to that of longitudinal cracking. Block cracking: In this form of cracking, the formation of irregular pieces of the pavement in the form of interconnected series of cracks takes place. This is sometimes the result of longitudinal and transverse cracking. This may happen due to poor compaction during compaction. Slippage cracking: These cracks are formed in semi-circled shape with both edges pointing towards the direction of vehicles. Lack of tack coat and weak bonding between the surface and base layers are the two potential causes. Edge cracking: This type of cracking takes place due to poor support of shoulder and due to the weak material or excess moisture.

45
9.1.2 Surface Deformation Pavement deformation takes place mostly due to weakness in the structural aspect or in different layers of the pavement. The deformation may be accompanied by cracking of the pavement (Adlinge and Gupta. 2015), which can be a traffic hazard. Various types of surface deformations are rutting, corrugation, and swelling. Rutting: Rutting is a movement of pavement which leads to depressions in the path of the wheel. Severe rutting will allow allocation of water in the rut. It is caused mainly due to failure in single or multiple layers in the pavement. The rut width indicates which layer has failed. The solution for the rutting is recycling of the surface for the unstable asphalt surface and reclamation if the problem occurs in the subgrade layer. Corrugation: As the pavement surface becomes distorted like a washboard, it is referred to as wash boarding. Due to excess content of asphalt cement, fine aggregate, and rounded or smooth textured coarse aggregate, the asphalt concrete surface takes place is destabilized. Swelling: Swell is an upward projection of the bump on the surface of the pavement. Expansion of the layer below the surface layer or subgrade leads to swelling. The expansion takes place due to frost heaving or moisture. 9.1.3 Surface Defects and Disintegration Surface defects are basically associated with the surface layer. The most common types of surface distress are raveling, bleeding, potholes (Adlinge and Gupta. 2015). Raveling: Raveling is a loss of surface layer material of the pavement. It is caused mainly due to insufficient bonding between the aggregate and the asphalt cement. Raveling increases with traffic and chilling weather. Sometimes it happens due to improper construction practice. Bleeding: Bleeding is the presence of excess asphalt binder on the surface of pavement which creates patches of asphalt. The skid resistance of the pavement is reduced due to excess asphalt, and becomes slippery in wet conditions thus creating a safety hazard. This happens due to excess content of asphalt cement in the mix. Potholes: Potholes are holes created in the pavement which is similar to depression. Initially, the top layer fragments are dislodged and overtime, the distress will move in a downward direction into the deeper layers of the pavement. The basic reason for this failure is poor strength in one or multiple layers of the pavement. In this study, different types of distress were identified after both the test sections being exposed to fifteen months of general parking lot traffic. Cracking and raveling were two types of distress exhibited in the concrete pavement. As mentioned, raveling is caused due to wearing out of the surface material of the pavement by traffic. The cracking exhibited is longitudinal cracking, which formed along the centerline of the pavement and its moving along

46
the traffic direction. The figures related to raveling and longitudinal cracking are shown in Appendix F. On the asphalt pavement, the only distress that is identified is surface depression in the pavement at a location. Surface depression might have been caused due to improper compaction during the construction. The distress is leading to stagnation of water, and the percolation rate is very low compared to the other part of the pavement. The other reason for the low percolation rate is accumulation of dirt on the surface of the pavement at the distress location. The distress is shown in Appendix G.

47
10. Conclusion and Recommendation 10.1 Conclusion
The report presents the research undertaken to build a test section based on the new design method developed using the mechanistic-empirical design approach by UCPRC at CSULB. The study includes a literature review, field testing of the test section, materials and their properties, mix design, performance data of the concrete and asphalt pavement sections collected for calibration and performance evaluation of the new design approach. The design tables used in the design are prepared from computer modeling cases and calculations, but have not yet been validated in the field, which is the purpose of this study. A location was selected within CSULB for construction of the test sections. Pressure cells and strain gages were installed during the construction of test sections for measuring the stress and strain of the pavements. In this study, the traffic count was also determined. The data acquisition device CDaq was installed at the test section’s location to collect the data of the pavements. The recorded data was analyzed using the MATLAB program code. The collected data from pressure cells and strain gages were analyzed, and graphs were plotted to study the pattern in the data sets. The stress and strain measurements and the cracking (both sections) and rutting (asphalt section only) will be used to calibrate the pavement structural design procedure and hydraulic performance will also be monitored. A hydraulic study was conducted by UCPRC to determine the performance of fully permeable pavements as a part of their study. Assessment of hydraulic performance was performed by determining the minimum thickness required for base course aggregate and retain stormwater during rainfall events. Simulation for varied hydrological, material, and geometric conditions was performed to evaluate the hydraulic performance. A software known as HYDRUS was used in evaluation of hydraulic performance. In the study, the collected data has revealed that there is a significant difference in the performance of the asphalt and concrete test sections. The asphalt test section data results showed that high readings of vertical pressure on the top of subgrade were recorded when compared with the concrete section. The vertical strain in a transverse direction at the bottom of the asphalt pavement was recorded and is high compared to the concrete test section. The vertical strain in the transverse direction was low when compared to the vertical strain in the longitudinal direction at the bottom of concrete section. Distresses on the pavement were observed. Raveling and longitudinal cracking were observed on the concrete test section while surface depression was seen on the permeable asphalt section, for the fifteen months of general parking lot traffic. Despite 2017, being one of the wettest in California, both test sections performed well in terms of infiltration of stormwater. The base layer of both the sections is open-graded which allows the infiltrated stormwater to be stored and infiltrate into the subgrade. Due to the open-graded nature of surface layer and base layer of the pavement, the stormwater infiltrates through the layers of pavement recharging the groundwater reserves and eliminating the need for construction of side drainage
48
for collecting the stormwater. A life-cycle cost estimates comparison was performed by UCPRC for currently available BMPs and fully permeable pavements which showed that fully permeable pavements were more cost effective than currently available BMPs in most of aspects. These pavements are sustainable and cost effective as they help in the hydrological cycle process by eliminating the drainage pipes and require lower maintenance with comparison to conventional pavements. Based on the performance evaluation of both the test sections, validation and structural design calibration of the mechanistic-empirical design approach proposed by UCPRC will be done in developing the design procedure which has a potential stormwater mitigation and best management practice for the freeways. The lesson learned from this study is that both test sections performed well in terms of distresses with time for the general parking traffic. Both the test sections infiltrated the stormwater during the rainy days in 2017, which was considered as one of the wettest years of California. Proper construction practice should be followed to avoid distresses of the pavement. The purpose of this study, was to implement a new design method and use the measured stresses and strains to validate and calibrate the structural design. This will then, aid in further enhancement and development of the design which has a potential for stormwater mitigation and best management practice for the freeways. 10.2 Recommendation
Fully permeable pavements should be vacuumed once a year for long-term reliable performance for a long time. The scope for future studies include, accelerated pavement testing (using Heavy Vehicle Simulator [HVS]) that must be performed to evaluate the performance of both the test sections. Further monitoring of both the test sections should be continued to evaluate the performance with time.

49
Appendix: Reference Tables and Images
Appendix A. Preliminary Hydraulic Design Table HMA-O

50
Appendix B. Preliminary Structural Design of HMA-O

51
Appendix C. Preliminary Stress-to-Strength Ratio at the top of Subgrade Table, HMA-O

52
Appendix D. Preliminary Hydraulic Design Table PCC-O

53
Appendix E. Preliminary Structural Design PCC

54
a) Raveling of Surface b) Longitudinal Cracking
Appendix F. Distresses on Permeable Concrete Test Section

55
a) Surface Depression b) Stagnation of Stormwater
Appendix G. Distresses on Permeable Asphalt Test Section

56
References AASHTO (American Association of State Highway and Transportation Officials). (1993). Guide for the Design of Pavement Structures. AASHTO, Washington, D.C. Adlinge, S. S. and Gupta, A.K. (2015). “Pavement deterioration and its causes.” IOSR Journal of Mechanical & Civil Engineering, 9-15. <http://www.iosrjournals.org/iosr-jmce /papers/ sicete(civil)-volume6/60.pdf> Booth, D. B., and Leavitt, J. (1999). “Field evaluation of permeable pavement systems for improved stormwater management.” Journal for American Planning Association 65(3), doi:10.1080/ 01944369908976060. Braga, A., and Connolly, C. (2010). “Introduction to permeable friction course (PFC) Asphalt.” Proc. Low Impact Development (LID) International Conference, ASCE, Reston, VA, 104-112. California Nevada Cement Association. “Portland Cement Pervious Concrete Paving.” Guide specifications, Section 32 13 43. <http:// http://cncement.org/>. Chandrappa, A. K., and Biligiri, K. P. (2016). “Pervious concrete as a sustainable pavement material – Research findings and future prospects: A state-of-the-art review.” Construction and Building Materials, 111, 262-274. Deo, O., and Neithalath, N. (2011). “Compressive response of pervious concretes proportioned for desired porosities.” Constr. Build. Mater., 25(2011), 4181–4189. Hein, D. K., and Schaus, L. (2013). Permeable Pavement Design and Construction. Green Streets Highways, and Development, Toronto, Canada. Huang, Y. H. (2003). Pavement Analysis and Design. 2nd edition. Pearson Education, Upper Saddle River, NJ. Iowa State University Center for Transportation Research and Education. (2002). “Traffic volume count.” Handbook of Simplified Practice for Traffic Studies, <http://www. ctre.iastate.edu/pubs/traffichandbook/>. Jones, D., Harvey, J., Li, H., and Campbell, B. (2010). Laboratory Tests to Assess Mechanical Properties of Permeable Pavement Materials, Technical Memorandum. California Department of Transportation, Sacramento. Jones, D., Harvey, J., Li, H., Wang, T., Wu, R., and Campbell, B. (2010). Laboratory Testing and Modeling for Structural Performance of Fully Permeable Pavements, Final Report. California Department of Transportation, Sacramento, CTSW-RT-10-249.04.
57
Kevern, J. T. (2010). “Operation and maintenance of pervious concrete pavements.” Proc., 11th Annual Transportation Research Board Meeting, 1-16. Leipard, A.R., Kevern, J. T., and Richardson, J.R. (2015). “Hydraulic Characterization and Design of Permeable Interlocking Concrete Pavement.” Proc. World Environmental and Water Resources Congress, ASCE, Reston, VA, 292-301. Li, H., Jones, D., and Harvey, J. (2010). Computer Modeling Study to Understand the Performance Properties of Fully Permeable Pavements, Technical Memorandum. California Department of Transportation, Sacramento. Li, H., Jones, D., Wu, R., and Harvey, J. (2014). Development and HVS Validation of Design Tables for Permeable Interlocking Concrete Pavement, Final Report. University of California Pavement Research Center, Sacramento. Los Angeles County. (2014). Administrative Manual, County of Los Angeles Department of Public Works Geotechnical and Materials Engineering Division, GS200.1. County of Los Angeles, CA. McGhee, K., Clark, T., and Hemp, C. (2009). A Functionally Optimized Hot-Mix Asphalt Wearing Course: Part 1: Preliminary Results, Final Report VTRC 09-R20. Virginia Transportation Research Council, Charlottesville, VA. National Climate Data Center. (2017). “Monthly observational data map.” <https://gis.ncdc. noaa.gov/maps/ncei/cdo/monthly>. Oregon Department of Transportation. (2015). “Measuring the strain of the road.” Research Notes, <https://digital.osl.state.or.us/islandora/object/osl:10005> Rowe, A., Borst, M., and O’Connor, T. (2010). “Environmental Effects of Pervious Pavement as Low Impact Development Installation in Urban Regions.” Chapter 13 in The Effects of Urbanization on Groundwater: An Engineering Case-based Approach for Sustainable Development, N. B. Chang, ed. ASCE, Reston, VA, 344-366 Radlinska, A., Welker, A., Greising, K., Campbell, B., and Littlewood, D. (2012). Long-term field performance of pervious concrete pavement. Adv. Civ. Eng. 2012 (2012) 9, http://dx.doi.org/10.1155/2012/380795 (Article ID 380795). Swan, D. J., and Smith, D. R. (2010). “Development of design system for permeable interlocking concrete pavement.” Proc. Green Streets and Highways Conference, ASCE, Reston, VA, 314-322. Terhell, S-L., Cai, K., Chiu, D., and Murphy, J. (2015). Cost and Benefit Analysis of Permeable Pavements in Water Sustainability. ESM 121 Final Paper. <http://watermanagement. ucdavis.edu/files/5414/3891/2393/A03_Terhell_Cai_Chiu_Murphy_ESM121_FinalReport.pdf>

58
Welker, A. L., Barbis, J. D., and Jeffers, P. A. (2012). “A side-by-side comparison of pervious concrete and porous asphalt.” Journal of the American Water Resources Association (JAWRA), 48(4), 809-819. Wang, T., Harvey, J., and Jones, D. (2010). A Framework for Life-Cycle Cost Analyses and Environmental Life- Cycle Assessments for Fully Permeable Pavements, Technical Memorandum. California Department of Transportation, Sacramento.


![4 Maintenance Landscape Professionals BLUE.pptx [Read-Only]...NON-PLANT BASED PRACTICES PERMEABLE PAVEMENT DRY WELLS RAIN BARREL. Permeable Pavement Maintenance. PERMEABLE PAVEMENT](https://static.fdocuments.net/doc/165x107/5f59581beea3a81dcc67a1d5/4-maintenance-landscape-professionals-bluepptx-read-only-non-plant-based.jpg)