SUSTAINABLE MANAGEMENT OF ELECTRICITY - PRACTICES OF ...
24
Journal of Environmental Science and Sustainable Development Journal of Environmental Science and Sustainable Development Volume 4 Issue 1 July Article 7 7-30-2021 SUSTAINABLE MANAGEMENT OF ELECTRICITY - PRACTICES OF SUSTAINABLE MANAGEMENT OF ELECTRICITY - PRACTICES OF FEDERAL UNIVERSITY OF LAVRAS FEDERAL UNIVERSITY OF LAVRAS Isadora Nascimento Della-Sávia Braga Department of Physics (DFI) Faculty of Natural Sciences (FCN) Federal University of Lavras (UFLA) PObox 3037, Zip code: 37200-900, Lavras-MG, Brazil, isadora.braga@ufla.br Silvia Costa Ferreira School of Engineering(EE), Department of Automation(DAT), Federal University of Lavras (UFLA) PObox 3037, Zip code: 37200-900, Lavras-MG, Brazil, silvia.ferreira@ufla.br Marcelo Arriel Rezende Directorate of Projects and Supervision of Building Works, Project Coordination, Federal University of Lavras (UFLA) PObox 3037, Zip code: 37200-900, Lavras-MG, Brazil, marcelo.rezende@ufla.br Joaquim Paulo da Silva Department of Physics (DFI) Faculty of Natural Sciences (FCN) Federal University of Lavras (UFLA) PObox 3037, Zip code: 37200-900, Lavras-MG, Brazil, joaquim@ufla.br Follow this and additional works at: https://scholarhub.ui.ac.id/jessd Part of the Oil, Gas, and Energy Commons Recommended Citation Recommended Citation Della-Sávia Braga, Isadora Nascimento; Ferreira, Silvia Costa; Rezende, Marcelo Arriel; and da Silva, Joaquim Paulo (2021). SUSTAINABLE MANAGEMENT OF ELECTRICITY - PRACTICES OF FEDERAL UNIVERSITY OF LAVRAS. Journal of Environmental Science and Sustainable Development, 4(1), 137-159. Available at: https://doi.org/10.7454/jessd.v4i1.1059 This Case-Based Article is brought to you for free and open access by the School of Environmental Science at UI Scholars Hub. It has been accepted for inclusion in Journal of Environmental Science and Sustainable Development by an authorized editor of UI Scholars Hub.
Transcript of SUSTAINABLE MANAGEMENT OF ELECTRICITY - PRACTICES OF ...
Journal of Environmental Science and Sustainable Development Journal of Environmental Science and Sustainable Development
Volume 4 Issue 1 July Article 7
7-30-2021
SUSTAINABLE MANAGEMENT OF ELECTRICITY - PRACTICES OF SUSTAINABLE MANAGEMENT OF ELECTRICITY - PRACTICES OF
FEDERAL UNIVERSITY OF LAVRAS FEDERAL UNIVERSITY OF LAVRAS
Isadora Nascimento Della-Sávia Braga Department of Physics (DFI) Faculty of Natural Sciences (FCN) Federal University of Lavras (UFLA) PObox 3037, Zip code: 37200-900, Lavras-MG, Brazil, [email protected]
Silvia Costa Ferreira School of Engineering(EE), Department of Automation(DAT), Federal University of Lavras (UFLA) PObox 3037, Zip code: 37200-900, Lavras-MG, Brazil, [email protected]
Marcelo Arriel Rezende Directorate of Projects and Supervision of Building Works, Project Coordination, Federal University of Lavras (UFLA) PObox 3037, Zip code: 37200-900, Lavras-MG, Brazil, [email protected]
Joaquim Paulo da Silva Department of Physics (DFI) Faculty of Natural Sciences (FCN) Federal University of Lavras (UFLA) PObox 3037, Zip code: 37200-900, Lavras-MG, Brazil, [email protected]
Follow this and additional works at: https://scholarhub.ui.ac.id/jessd
Part of the Oil, Gas, and Energy Commons
Recommended Citation Recommended Citation Della-Sávia Braga, Isadora Nascimento; Ferreira, Silvia Costa; Rezende, Marcelo Arriel; and da Silva, Joaquim Paulo (2021). SUSTAINABLE MANAGEMENT OF ELECTRICITY - PRACTICES OF FEDERAL UNIVERSITY OF LAVRAS. Journal of Environmental Science and Sustainable Development, 4(1), 137-159. Available at: https://doi.org/10.7454/jessd.v4i1.1059
This Case-Based Article is brought to you for free and open access by the School of Environmental Science at UI Scholars Hub. It has been accepted for inclusion in Journal of Environmental Science and Sustainable Development by an authorized editor of UI Scholars Hub.

Journal of Environmental Science and Sustainable Development
Volume 4, Issue 1, Page 137-159
ISSN: 2655-6847
Homepage: http://scholarhub.ui.ac.id/jessd
DOI: https://doi.org/10.7454/jessd.v4i1.1059 137
SUSTAINABLE MANAGEMENT OF ELECTRICITY - PRACTICES OF FEDERAL
UNIVERSITY OF LAVRAS
Isadora Nascimento Della-Sávia Braga1*, Silvia Costa Ferreira2, Marcelo Arriel
Rezende3, Joaquim Paulo da Silva1
1Department of Physics (DFI) Faculty of Natural Sciences (FCN) Federal University of
Lavras (UFLA) PObox 3037, Zip code: 37200-900, Lavras-MG, Brazil, 2School of Engineering (EE), Department of Automation (DAT), Federal University of
Lavras (UFLA) PObox 3037, Zip code: 37200-900, Lavras-MG, Brazil 3Directorate of Projects and Supervision of Building Works, Project Coordination, Federal
University of Lavras (UFLA) PObox 3037, Zip code: 37200-900, Lavras-MG, Brazil
*Corresponding author: [email protected]
(Received: 7 September 2020; Accepted: 18 June 2021; Published: 30 July 2021)
Abstract
Considering that most of the world electrical matrix is made up of non-renewable sources, the
search for safer and more sustainable energy generation solutions has grown. In view of this
scenario, there is an increase in the use of renewable energy sources integrated with electrical
systems. In this context, Universities have an important role in research development,
implementation of environmental plans aimed at sustainability, optimization in the use of
electric energy and development of the use of renewable energies. The Federal University of
Lavras has an environmental plan with goals related to carbon emissions, solid waste
management, rainwater collection and reuse, among others, are established. In order to
achieve the goals related to sustainable electricity management practices on campus, the
University has acted in several ways, resulting in approximately 30% electricity savings. This
article presents the actions of the University in obtaining this result. First, we present a study
on the application of energy indicators as a strategic tool to assist in the management process
at the Federal University of Lavras (UFLA). Next, we discuss the energy efficiency projects
developed in conjunction with the local concessionaire (CEMIG) and their impact on energy
consumption. Finally, we present the proposal for the implantation of a microgrid in the
internal distribution network and detail the photovoltaic generation system already installed.
The evaluation of the energy indicators allowed the definition of priorities for the allocation
of investments in the energy efficiency program. In addition, the results were compared to the
goals outlined in environmental plan of the university. Finally, the ongoing microgrid project
is presented but, to date, there are no significant data on the generation of UFLA's Solar
Parking.
Keywords: Energy efficiency projects; Energy indicators; Grid-connected photovoltaic
system; Microgrid.

Journal of Environmental Science and Sustainable Development 4(1): 137-159
DOI: https://doi.org/10.7454/jessd.v4i1.1059 138
1. Introduction
The concept of sustainable power management can be understood as a planned search for
minimizing the use of non-renewable power resources, using the generated energy in a more
efficient way and reducing the losses (Aduda et al., 2016; Fathi & Bevrani, 2017; Onat &
Bayar, 2010). Therefore, a sustainable development is directly correlated to the use of
efficient and renewable resources (Claudia Roldán et al., 2014; Güney, 2019; Østergaard et
al., 2020).
The use of distributed renewable sources brings additional challenges in power planning
mainly due to the intermittent power generation (Hou et al., 2020; Mer & Patel, 2016). When
the level of penetration of these systems reaches or exceeds the hosting capacity of the grid,
the effective integration of these energy resources is indispensable. The concepts of
microgrids and smart-grids are considered promising solutions to these problems (Jirdehi et
al., 2020; Kathirgamanathan et al., 2020; Yoldaş et al., 2017).
There are several initiatives around the world, where these concepts have been applied in
pilot projects (Bianchini et al., 2017; Jirdehi et al., 2020; Sharma et al., 2017), such as by
looking for efficiency and power quality. In Brazil, initiatives for implementing smart grids
and microgrids are still growing, and the investment in the implementation of pilot projects
had increased in the past years. Dranka & Ferreira (2020) presented an overview of the
challenges for smart grids implementation in Brazil.
In this context, the interest of Universities in sustainable management is noticeable by
their projects and research related to energy sustainability and efficiency (Ávila et al., 2017;
Machado, 2019; Moura et al., 2019; Rebelatto et al., 2020). In fact, these institutions play an
important role in the dissemination of technical knowledge of sustainable practices and
technologies. However, many barriers have yet to be overcome to create efficient sustainable
management strategies at universities. According to Ávila et al., (2017) the main problems
identified in relation to sustainability were lack of support from administrative sectors, lack
of technology and awareness, and absence of environmental committees.
On the other hand, there are several tools to assist Universities in the management and
improvement performance related to social and environmental responsibility. Sustainable
initiatives related to LiFE index (Learning in Future Environments) has been reported by
Rebelatto et al., (2020), where an analysis of 100 articles related to the aforementioned
themes was presented. The LiFE index was developed by the Environmental Association for
Universities and Colleges and four areas stand out when educational institutions are

Journal of Environmental Science and Sustainable Development 4(1): 137-159
DOI: https://doi.org/10.7454/jessd.v4i1.1059 139
considered. The first area is leadership and governance which analyzes the commitment and
financial support to sustainable activities and initiatives. The second is partnership and
engagement which correlate the events and partnerships between universities and the private
sector. The third is teaching and research which mainly considers the sustainable disciplines
and extension projects. Finally, the fourth is facilities and operation which considers
infrastructure, waste management and energy efficiency.
In view of this scenario and based on the UFLA`s Institutional Development Plan (PDI), it
is worth to mention the initiatives related to UFLA´s energy management cover most
previously mentioned areas of the LiFE index. For example, we have a committee to deal
specifically with environment issues and policies for the efficient use of water and electricity
(Environmental Committee). This committee has a coordination for power planning and
management, responsible for actions that minimizes the power consumption and waste, as
well new propositions for using alternative and sustainable energy sources.
Moreover, the Institutional Development Plan (PDI) and the Sustainable Logistics Plan
(PDS) of the institution include several actions aimed at the efficient use of electricity
(UFLA-DMA, 2019; UFLA, 2014). It worth to cite the implementation of a new internal
electric grid with an exclusive feeder, seeking to reduce the number of interruptions not
programmed by the electricity supply concessionaire; the implementation of energy
efficiency projects; a survey of the institution's energy consumption indicators and the
installation of photovoltaic solar energy generation systems.
Other tools that can be used to assist Universities in energy management, in the path of
sustainability, are the energy indicators. The energy indicators are commonly used as
instruments for assessing energy use in order to identify the relationship between
administrative or physical information, and electrical or cost quantities (Fernandes, 2004;
Kathirgamanathan et al., 2020). Their results are generally used for awareness and guidance
of users and also for comparison with other similar units (Li & Tao, 2017; Mardani et al.,
2017; Pitt & Michaud, 2015; Vigna et al., 2018; Yu et al., 2020).
Given the above, the aim of this paper is to present the actions taken by the Federal
University of Lavras to achieve sustainable development and the goals outlined in its
environmental plan. To fulfil this objective and as the main contribution, we present a study
of energy indicators as a tool for power management and decision-making. In this work, we
also apply these indicators to guide the actions for reducing the energy consumption by
means of the national Program of Energy Efficiency (PEE) with excellent cost-benefit ratio.
Journal of Environmental Science and Sustainable Development 4(1): 137-159
DOI: https://doi.org/10.7454/jessd.v4i1.1059 140
As a complementary contribution, we propose to model the local grid as a small microgrid.
This paper proposes the use of microgrid concept to solve the possible problems caused by
the intermittency of renewables sources. In addition, we present the detailed design of solar
photovoltaic system (PV). However, the microgrid concept and the PV system implantation
are still ongoing.
2. Methods
This research has been conducted in the campus of Federal University of Lavras, state of
Minas Gerais, Brazil. The constructions and facilities of the campus are diverse and involve
students’ accommodation, multi-sport gym, soccer courts and stadium, university restaurant
(UK), cafeterias, community center, university integration center, support foundations, 21
didactic-scientific departments, and others.
According to the University's portal, the campus has an area of 500 hectares, that is six
million square meters, with approximately 237250 square meters of built area. In addition, in
the first period of 2019, there were 11100 undergraduate students, 1850 graduate students,
766 teachers, 581 administrative technicians, totaling 14941 individuals who used the
institution's spaces.
All data needed for this work were collected from electricity bills, the mass memory report
data from UFLA energy meters and the University's portal, as previously described. The
physical information of the campus facilities areas were available from the main
administration. We analyze data from a minimum period of 24 months aiming to consider the
seasonality of energy consumption. This definition of this time window was based on the
manual of general guidelines for the conservation of electricity in public buildings.
The methods were divided into three main parts: the energy indicators formulation and
definition, energy efficiency projects and microgrid modelling. Each one will be described in
the following details.
2.1. Methods for energy indicators
The energy indicators used in this work were based on Morales (2007) and could be divided
into global, specific and financial. Global indicators use technical information to characterize
the unit. They are responsible for pointing out the efficiency in the use of electricity in
general. They are used in the early stages of characterization, indicating technical or
behavioral flaws. The specific indicators take into account physical information, occupation
Journal of Environmental Science and Sustainable Development 4(1): 137-159
DOI: https://doi.org/10.7454/jessd.v4i1.1059 141
and end uses in order to assess the behavior in the use of electricity. Financial indicators
demonstrated how resources are distributed and used within the institution.
In this work we linked the habits of energy usage to information such as: area and purpose
of use, equipment used, number and type of users, time of use, among others. These types of
data were necessary for the initial characterization of the units. In addition, they were
essential for the elaboration and choice of the indicators used and the most efficient action
plan. The energy indicators proposed for evaluation of UFLA scenario were the percentage
consumption ratio of reserved hours, average monthly consumption by users, the
consumption indicator by built area, the financial indicators by built area and the financial
indicators by total number of users. They will be described below.
2.1.1. Percentage consumption ratio
The indicators of energy consumption by time of use takes into account the seasonality of
consumption. This indicator was called PCR (Percentage Consumption Ratio in the Reserved
Period) and aims to characterize the energy consumption in reserved period of the consumer
unit in relation to its total consumption (Saidel et al., 2005).
(1)
For this indicator, consumption information should be separated by time of use. According
to ANEEL Normative Resolution No 414/2010 (ANEEL, 2010), Brazilian distributors can
define 3 consecutive daily hours where there is greater consumption. This set of hours is
called peak hour, at that time the amount charged per kilowatt (kWh) hour is higher. The rest
of the day is off-peak.
Thus, the PCR indicator was used to assess consumption during peak and off-peak hours
or at specific times. Through its use, it is possible to ascertain the energy consumption at a
specific time of interest, providing data for decision making to manage energy use during
peak hours, for example. For the seasonality to be considered, the period from August 2016
to August 2018 was used.

Journal of Environmental Science and Sustainable Development 4(1): 137-159
DOI: https://doi.org/10.7454/jessd.v4i1.1059 142
2.1.2. Average monthly consumption by users
The average monthly consumption by users (ACU) evaluated the energy consumption per
user. The users were separated into specific groups for better evaluation of the indicator
(Saidel et al., 2005). The ACU was characterized by the ratio between the average monthly
consumption and the number of users in the group under evaluation:
(2)
where, is the average monthly energy (kWh / month) and N is the number of people who
fall into the group under analysis.
At UFLA, for the calculation of the , the information present in the Institutional
Development Plan (IDP) (UFLA, 2016) was considered. The groups considered were:
students (ACUS), professors (ACUP), administrative technicians
(ACUAT) and total users (ACUTU). Each of the indicators by group was calculated considering
the University's total energy consumption in the month and the number of individuals in each
group, as previously described.
2.1.3. Consumption indicator by built area
The consumption indicator per built area is obtained by means of the ratio of energy
consumption in a given period, by the product of the total useful area of the unit and the
desired time interval:
(3)
where, is the average monthly energy (kWh / month) and is the total useful area (m²).
To calculate the indicator by area built at UFLA, values of the institution's built area were
obtained through the Institutional Development Plan – IDP (UFLA, 2016) and were used in
the management reports. The evaluated period was from January 2018 to August 2018.
2.1.4. Financial indicators
Financial indicators can be classified in relation to several variables, here we consider the
financial indicator by build area ( ) and financial indicator by number of users ( ),
given by:
Journal of Environmental Science and Sustainable Development 4(1): 137-159
DOI: https://doi.org/10.7454/jessd.v4i1.1059 143
(4)
(5)
where, is the monthly cost of electricity (R$), is the total useful área and is the total
number of users.
2.2. Methods in energy efficiency projects
UFLA's energy efficiency plan includes, among other sustainability projects, a project to
reduce electricity consumption and implement process automation through equipment
efficiency, energy management and the use of energy generation from renewable sources.
One of the first solutions to reduce electricity costs is the replacement of fluorescent lamps
for LED lamps. The use of LED lamps can reduce energy consumption by up to 50% and it
has been a very common practice in energy efficiency projects (Napitupulu & Mawengkang,
2017).
Between 2016 and 2018, seeking to achieve energy efficiency goals, the university
submitted projects annually for the Program of Energy Efficiency (PEE) funded by the local
energy concessionaire (CEMIG). The Brazilian concessionaires release project calls for
energy efficiency every year in order to comply with regulations established by Brazilian
National Electric Energy Agency (ANEEL). These regulations require the concessionaires to
allocate a portion of their revenue to Energy Efficiency Projects (CEMIG, 2012; Dranka &
Ferreira, 2020; Silva et al., 2017).
The project is accompanied by Measurements and Verifications in order to confirm the
projected consumption and savings. The entire process was prepared in accordance with the
provisions of Energy Efficiency Program Procedures - PROPEE and the International
Performance Measurement and Verification Protocol - PIMVP - January 2012 - EVO 10000 -
1: 2012. Another important step in the process is correct disposal of materials that have been
replaced. For lighting and air conditioning equipment, disposal must be guaranteed and
follow Brazilian solid waste management policies.
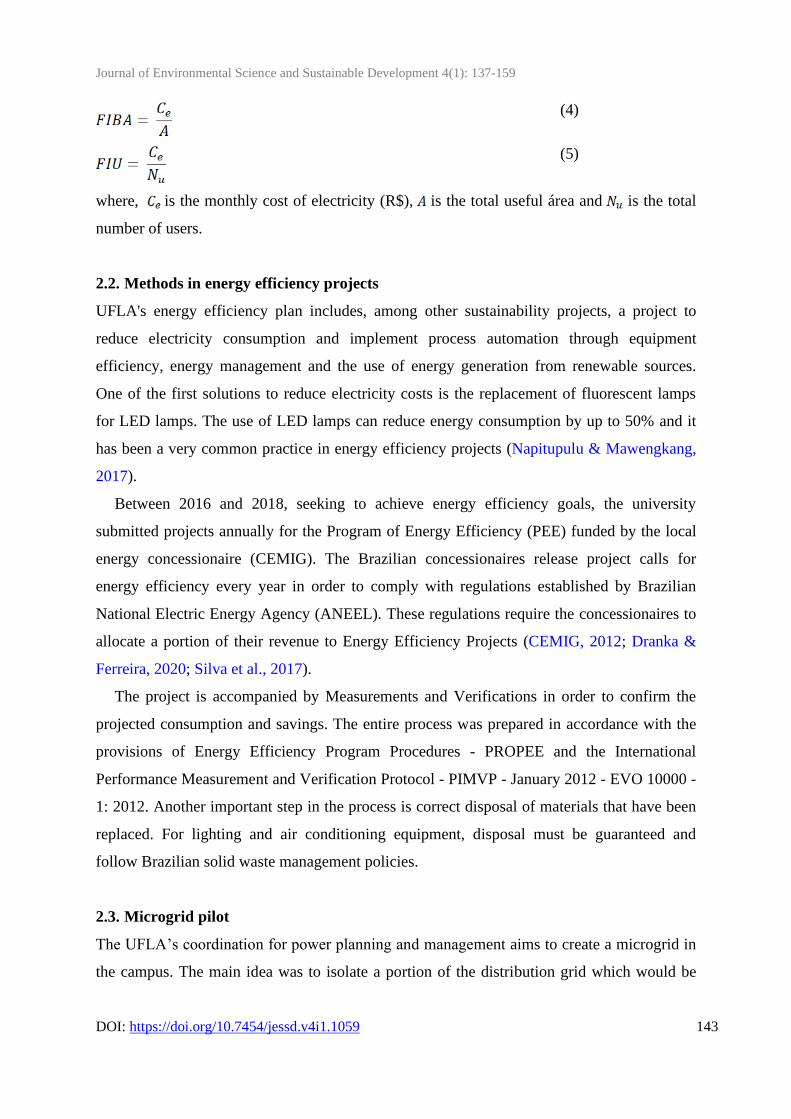
2.3. Microgrid pilot
The UFLA’s coordination for power planning and management aims to create a microgrid in
the campus. The main idea was to isolate a portion of the distribution grid which would be

Journal of Environmental Science and Sustainable Development 4(1): 137-159
DOI: https://doi.org/10.7454/jessd.v4i1.1059 144
managed individually. This microgrid will be composed by critical loads and distributed
generation units allowing proper monitoring of main electrical variables.
A long-term prospect of this microgrid is presented in Figure 1. The proposed microgrid
will be formed by:
a. Photovoltaic Generation Systems: its operation is connected to main grid in order to
reduce energy bills according to Brazilian regulations. In the future, they can be used
to increase the available energy in the microgrid and consequently its reliability and
autonomy (ITEM 1);
b. Energy storage systems aim to reduce the consumption in peak hours where energy is
more expensive and even supply the demand for this microgrid under conditions of
island operation (ITEM 2);
c. Grid-forming converters: used to provide voltage and frequency reference for the
microgrid when operating islanded and coordinate the connection and disconnection
of the microgrid to main grid (ITEM 3);
d. Synchronous generators: powered by alternative energy sources such as ethanol or
biofuel, and used to complement the power generated by photovoltaic systems (ITEM
4);
e. Critical Loads: they are chosen based on criteria defined by UFLA’s coordination
and previous information of demand, such as energy indicators. Now the veterinary
hospital, the engineering department and the illumination strategic areas represent
them (ITEMS 5, 6 e 7);
f. Center for data, supervision and control, training and research: its objective is to
maintain an exclusive server for assessment of distributed generation and the
microgrid status, enabling the real-time execution of innovative power quality and
energy efficiency algorithms, detection of load centers and defining the priority places
for allocation of loads, among others. Summarizing, it will be the center of
information for sustainable power management (ITEMS 8, 9 e 10);
g. Exclusive feeder: aims to supply the crescent demand of the University, with the
possibility of meeting up to 6000 kW of contracted demand (ITEM 11); and
h. Smart meters and switches: they will allow the data collection of energy consumption
for feeding the algorithms of power management and control the power flow into the
microgrid (ITEM 12, 13).
Journal of Environmental Science and Sustainable Development 4(1): 137-159
DOI: https://doi.org/10.7454/jessd.v4i1.1059 145
Figure 1. Prospect of a microgrid in UFLA distribution power system
For now, only the exclusive feeder and the photovoltaic system are already installed in
the campus distribution grid. The exclusive feeder has been installed in 2015 in order to
provide more reliability because it had more direct path between the Lavras substation and
the University. The modernization of the system concludes with the installation of two
feeders for contingency situations and protections through automatic reclosers and
telecontrol. On the other hand, the photovoltaic system will be described in detail in the
results.
3. Results and Discussions
3.1. Energy indicators
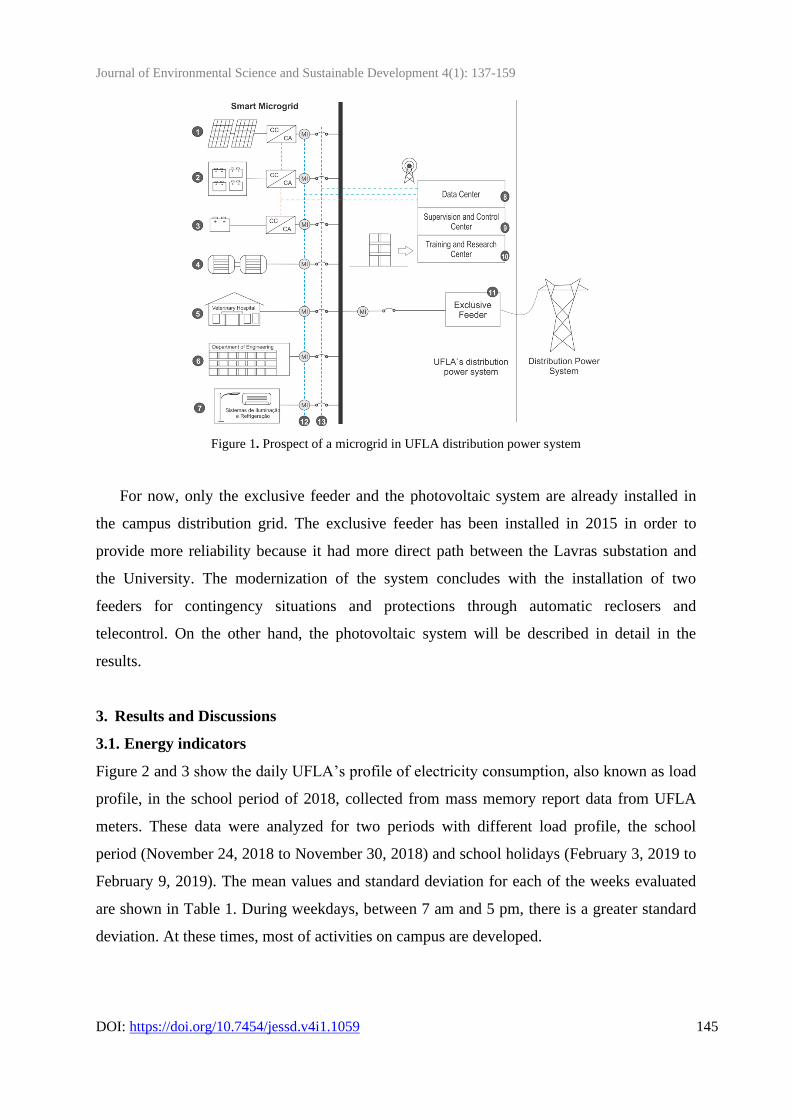
Figure 2 and 3 show the daily UFLA’s profile of electricity consumption, also known as load
profile, in the school period of 2018, collected from mass memory report data from UFLA
meters. These data were analyzed for two periods with different load profile, the school
period (November 24, 2018 to November 30, 2018) and school holidays (February 3, 2019 to
February 9, 2019). The mean values and standard deviation for each of the weeks evaluated
are shown in Table 1. During weekdays, between 7 am and 5 pm, there is a greater standard
deviation. At these times, most of activities on campus are developed.
Journal of Environmental Science and Sustainable Development 4(1): 137-159
DOI: https://doi.org/10.7454/jessd.v4i1.1059 146
Figure 2. Profile of electricity consumption at UFLA in the school period of nov/2018
Figure 3. Profile of electricity consumption at UFLA in the school holidays of feb/2019
Table 1. Average and standard deviation of energy consumption in the school period and
holidays
Weekdays Weekends
School period Holidays School period Holidays
Average (kWh) 272.53 228.91 170.08 183.65
Standard deviation (%) 30.85 27.75 6.9 7.45
Another point is the considerable difference in the average consumption during the studied
periods. During the holiday period, there is a decrease in the average consumption of
weekdays (Monday to Friday) of approximately 16% and on weekends, it is approximately
7.4% lower compared to the school term. For one month, this difference is equivalent to

Journal of Environmental Science and Sustainable Development 4(1): 137-159
DOI: https://doi.org/10.7454/jessd.v4i1.1059 147
approximately 760 kWh of savings. This period can be strategic to implement saving
measures, e.g., maintenance and overhaul of equipment for improvements in relation to
energy consumption.
Regarding to the energy indicators, the first analyzed result is the percentage consumption
ratio of reserved hours ( ). Figure 4 shows the results of applying the PCR indicator in
two intervals: peak hours, from 5 pm to 8 pm, and off-peak hours, remaining hours of the
day. Table 2 shows the average and standard deviation of the PCR for off-peak hours
( ) and peak hours ( ).
The indicates that on average approximately 90% of the total electricity is
consumed during off-peak hours. This indicator and its variations were used to assist in the
choice of the tariff modality, since UFLA's facilities fall into group A4.
Figure 4. Percentage consumption ratio ( ) at UFLA, off-peak hours and peak hours
Table 2. Average and standard deviation of PCR for off-peak hours and peak hours
Average Standard deviation (%)
0.896 0.01
0.104 0.01
Next indicator analyzed was the average monthly consumption by users. The average
values and standard deviation of the indicators of average monthly consumption ( ) for
each evaluated group are shown in Table 3.

Journal of Environmental Science and Sustainable Development 4(1): 137-159
DOI: https://doi.org/10.7454/jessd.v4i1.1059 148
Table 3. Average monthly consumption by users
Average (kWh/month/user) Standard deviation (%)
48.62 17.00
813.31 13.32
1038.06 15.65
44.01 16.85
The relationship between the total number of users and the institution's annual energy
consumption in the year of 2016 to 2018 is shown in Figure 5. It shows that when there is an
increase in the number of significant users, the same increase does not happen for
consumption. At UFLA, for an increase of approximately 13% in the group of users, there
was an increase of approximately 1% in the annual consumption of electricity.
Figure 5. Annual energy consumption and UFLA community
The third indicator discussed was the consumption of energy by built area. The global
results for the consumption related to the total built area of UFLA's campus are shown in
Table 4. Considering the different physical structures of UFLA, the calculated indicator is a
source of data that can assist in the projects of new buildings in the Institution, with the
implementation of sustainable installations with the use of solar energy, rainwater capture, for
example.

Journal of Environmental Science and Sustainable Development 4(1): 137-159
DOI: https://doi.org/10.7454/jessd.v4i1.1059 149
Table 4. Consumption by built area
Built area (m²) (kWh/month/m²) Standard deviation (%)
UFLA 237,250 2.72 9.85
Considering the diversity of constructions, based on the analysis of representativeness
within the university, the places chosen for calculating the were students’
accommodation, classrooms, university library, community center, university restaurant,
didactic-scientific departments and pro-rectories. The results of by places are presented
in Table 5 and Figure 6. In this case, it is worth mentioning that these indicators should not be
evaluated alone because the differences between the places are not taken into account in this
indicator. The key point is the built area and not the final use of electricity in each area.
However, it is possible to obtain results that signal an order of priority for actions of
sustainability and energy efficiency.
Table 5. Consumption by built area in the specific places at UFLA
Place Built area
(m²)
(kWh/month/m²)
Standard
deviation (%)
Didactic-scientific
departments
135,418 4.77 9.85
Classrooms 16,960 38.10 9.85
Students’ accommodation 9,078 71.18 9.85
Community center 6,621 97.60 9.85
University library 5,024 128.62 9.85
Pro-rectories 4,269 151.37 9.85
University restaurant 3,311 195.17 9.85

Journal of Environmental Science and Sustainable Development 4(1): 137-159
DOI: https://doi.org/10.7454/jessd.v4i1.1059 150
Figure 6. Consumption by built area in the specific places at UFLA
From the results of indicators by specific areas of UFLA, an order of actions priority can
be defined: university restaurant, pro-rectories, university library, community center,
accommodation, classrooms and didactic departments scientific. This ranking provides a
parameter for initiating actions, but as previously discussed, it is not possible to disregard the
particularities of each environment, such as the university restaurant that uses many industrial
equipment. For other locations, educational campaigns can bring good results.
After obtaining monthly electricity costs for the year of 2018, the average of the period
was used to calculate the financial indicators (Table 6). Through them, it is possible to point
out the contribution portion of each specific variable with the total cost of electricity, in
addition to making a direct link between the amount spent on energy and total costs of the
units.
Table 6. Financial indicators per built area and user
Average Standard deviation (%)
(R$/month/m2) 1.23 13.74
(R$/month/user) 21.48 17.83
Financial indicators make it possible to associate the amount spent by the institution in
relation to its total cost. Associated with the consumption indicator by built area ,
is also an aid tool for decision making in relation to projects to be built, exchange and
maintenance of air conditioning and other devices, updating of the lighting system, among
others.
Journal of Environmental Science and Sustainable Development 4(1): 137-159
DOI: https://doi.org/10.7454/jessd.v4i1.1059 151
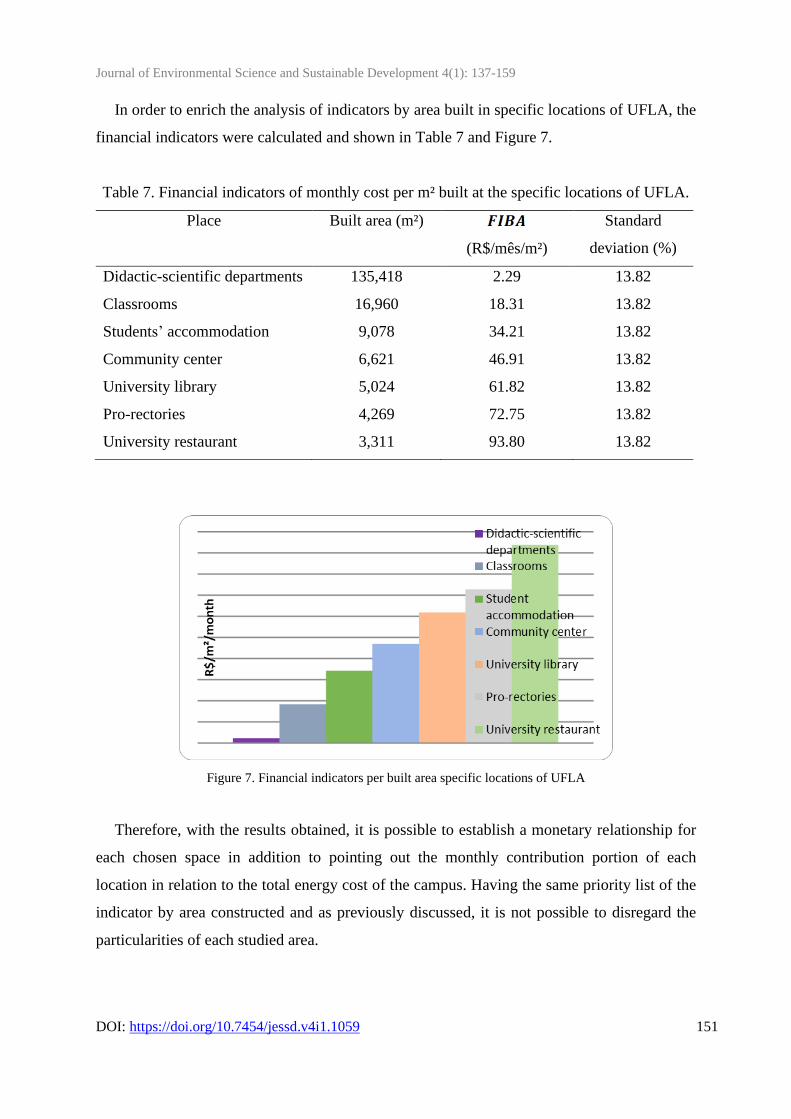
In order to enrich the analysis of indicators by area built in specific locations of UFLA, the
financial indicators were calculated and shown in Table 7 and Figure 7.
Table 7. Financial indicators of monthly cost per m² built at the specific locations of UFLA.
Place Built area (m²)
(R$/mês/m²)
Standard
deviation (%)
Didactic-scientific departments 135,418 2.29 13.82
Classrooms 16,960 18.31 13.82
Students’ accommodation 9,078 34.21 13.82
Community center 6,621 46.91 13.82
University library 5,024 61.82 13.82
Pro-rectories 4,269 72.75 13.82
University restaurant 3,311 93.80 13.82
Figure 7. Financial indicators per built area specific locations of UFLA
Therefore, with the results obtained, it is possible to establish a monetary relationship for
each chosen space in addition to pointing out the monthly contribution portion of each
location in relation to the total energy cost of the campus. Having the same priority list of the
indicator by area constructed and as previously discussed, it is not possible to disregard the
particularities of each studied area.

Journal of Environmental Science and Sustainable Development 4(1): 137-159
DOI: https://doi.org/10.7454/jessd.v4i1.1059 152
3.2. Energy efficiency projects
The first stage of the PEE UFLA-CEMIG was approved in 2016. During the execution of the
project, LED lamps replaced 7,349 conventional lamps and 33 old air conditioners were
replaced by more efficient ones. The institutional coordination of power planning and
management chose the locations of its installation strategically to serve areas of higher
energy consumption based on UFLA’s energy indicators. The energy indicators are detailed
discussed in the next section and has been used for decision-making of investments directed
for electricity.
Figure 8 shows a night aerial photo of the UFLA University Restaurant and Community
Center, one of the places where the exchange for LED lamps was implemented in the first
stage of the project. It is observed the region of greater circulation of people already with
LED lighting (lighter lamps) and still others with traditional lighting. In the first stage, the
total investment was R$1,561,712.03. 983.99 MWh/year. The second and third stages of the
project, approved in 2017 and 2018, has provided for the exchange of 17,329 and 8,886
lamps with LED technology respectively. Investments were R$ 1,737,886.13 and R$
1,117,088.98 for the second and third stages, respectively.
Figure 8. Superior Night View of the Community Center of the Federal University of Lavras
(Source: UFLA-DMA, 2019)
At the end of the execution of three stages of PEE, the institution estimated a decrease in
the peak demand of 433.24 kW and a decrease in electricity consumption of
2,264.22MWh/year. Figure 9 presents a night aerial photo of UFLA, where it is already
possible to observe that most of the public lighting in the most frequented areas already has
lighting with LED technology.

Journal of Environmental Science and Sustainable Development 4(1): 137-159
DOI: https://doi.org/10.7454/jessd.v4i1.1059 153
Figure 9. Superior Night View of the Federal University of Lavras at the end of the three stages of the PEE
UFLA-CEMIG
(Source: UFLA-DMA, 2019)
The implementation of these energy efficiency projects resulted in a 30% reduction in
installation consumption. This saved electricity serves more than 100 days of UFLA total
consumption. It still needs to be considered that the University continues to grow and
inaugurate new works. The installed equipment and lamps are more energy efficient and do
not contain heavy metals or polluting gases that cause damage to the atmosphere. In addition,
a specialized company carried out the replacement of the lamps, minimizing environmental
impacts as much as possible. At the end of each stage of the project, training was given at
UFLA on the conscious use of electric energy, aiming to reinforce the importance of the
participation of academic community for the project success.
3.3. Microgrid pilot and grid-connected photovoltaic system
Currently, UFLA is powered by a voltage of 13.8 kV through an exclusive feeder direct from
the substation of local Energy Distribution Company of Minas Gerais State– CEMIG-D,
located in the City of Lavras, as previously described. This feeder allows the possibility of
being served by two other non-exclusive feeders as a contingency, and the opening and
closing electrical networks can be performed remotely by CEMIG-D through 5
microprocessors.
At the connection point between Energy Distribution Company and UFLA, there is a
sheltered substation containing indirect measurement, a 15 kV circuit breaker operated via an
indirect relay of SEG MRI1 model with timed overcurrent protection and phase and neutral

Journal of Environmental Science and Sustainable Development 4(1): 137-159
DOI: https://doi.org/10.7454/jessd.v4i1.1059 154
instantaneous (ANSI 50, 50N, 51, 51N). There is no remote activation of this internal circuit
breaker, which is a problem in the case of temporary power outages that require the
displacement of a professional to reset the circuit breaker.
The own electricity distribution network at the University basically consists of a compact
protected 15 kV network, pole transformers located close to the consumption points and a
low voltage underground network. On campus, there are 5 ecobicycles with single-phase
inverters of 5 kW each, connected to the electrical network through the low voltage 220V
circuits in 4 transformers, with the structure showed in Figure 10.
Figure 10. Ecobicycle – 5kW
(Source: UFLA, 2016)
UFLA currently has 10 grid-connected inverters powered by photovoltaic panels and in
full operation. There are 7 three-phase inverters of 36 kW connected to an exclusive
13.8/0.38kV transformer installed on UFLA's solar parking lot, two inverters of 5kW and one
inverter of 4kW around the campus. In the implementation phase, twenty-seven more
inverters of 36 kW will be installed on the ground next to the solar parking lot, as shown in
Figure 11, totaling an installed power of 1.263 kW inverters.
Journal of Environmental Science and Sustainable Development 4(1): 137-159
DOI: https://doi.org/10.7454/jessd.v4i1.1059 155
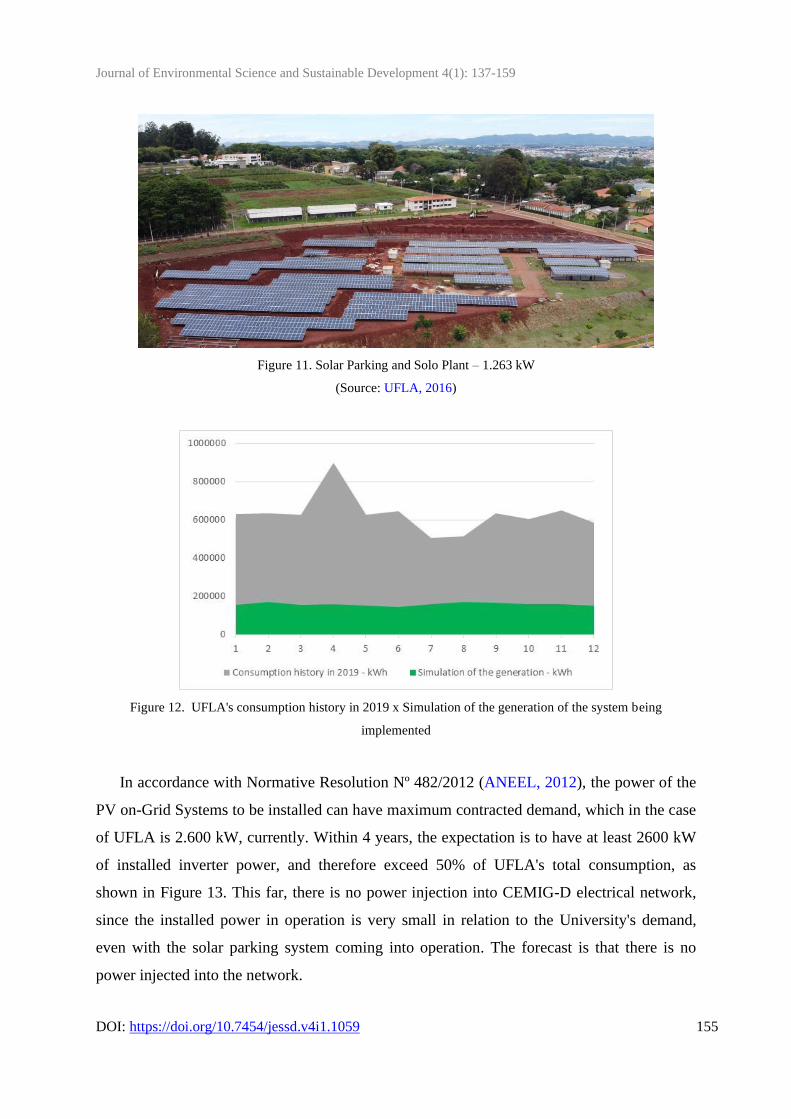
Figure 11. Solar Parking and Solo Plant – 1.263 kW
(Source: UFLA, 2016)
Figure 12. UFLA's consumption history in 2019 x Simulation of the generation of the system being
implemented
In accordance with Normative Resolution Nº 482/2012 (ANEEL, 2012), the power of the
PV on-Grid Systems to be installed can have maximum contracted demand, which in the case
of UFLA is 2.600 kW, currently. Within 4 years, the expectation is to have at least 2600 kW
of installed inverter power, and therefore exceed 50% of UFLA's total consumption, as
shown in Figure 13. This far, there is no power injection into CEMIG-D electrical network,
since the installed power in operation is very small in relation to the University's demand,
even with the solar parking system coming into operation. The forecast is that there is no
power injected into the network.

Journal of Environmental Science and Sustainable Development 4(1): 137-159
DOI: https://doi.org/10.7454/jessd.v4i1.1059 156
4. Conclusion
The energy indicators by built area, equivalent user, and finance allow the establishment of
priorities in the investment in energy efficiency within the Institutional Development Plan of
UFLA. Because of the implementation of energy efficiency projects that has a cost benefit
ratio, the return on investment of public money is around 3 to 4 years.
To date, there are no significant generation data at UFLA, with the entry into operation of
the Solar Parking and the system on the ground. In the future, it will have an expressive
amount of energy generated in the microgrid. This will bring greater complexity in the
operation and protection of the University's electrical system. Beside a great impact on the
operation of the University, it is may be required to implement the safe work practices and
specific training for electricians and workers. The implementation of a microgrid pilot project
will allow an assessment of ancillary services in an electrical grid infrastructure planned to
serve smart and human cities.
Acknowledgment
The energy efficiency project described in this paper was financed through the 2016, 2017
and 2018 calls of Energy Efficiency Program carried out by CEMIG distribution S.A. and
regulated by National Electric Energy Agency - ANEEL.
Author Contribution
Isadora Nascimento Della-Sávia Braga do a conceptualization and validation. 1*, Silvia
Costa Ferreira are responsible with the methodology and analysis. Marcelo Arriel Rezende
doing a data curation. The whole authors writing original draft preparation and Isadora
Nascimento Della-Sávia Braga doing a review before article publishes.
References
Aduda, K. O., Labeodan, T., Zeiler, W., Boxem, G., & Zhao, Y. (2016). Demand side
flexibility : Potentials and building performance implications. Sustainable Cities and
Society, 22, 146–163. https://doi.org/10.1016/j.scs.2016.02.011
ANEEL. (2010). Resolução Normativa no 414 de 9 de setembro de 2010.
ANEEL. (2012). Resolução Normativa No 482, de 17 de abril de 2012 (Vol. 66).

Journal of Environmental Science and Sustainable Development 4(1): 137-159
DOI: https://doi.org/10.7454/jessd.v4i1.1059 157
Ávila, L. V., Leal Filho, W., Brandli, L., Macgregor, C. J., Molthan-Hill, P., Özuyar, P. G., &
Moreira, R. M. (2017). Barriers to innovation and sustainability at universities around
the world. Journal of Cleaner Production, 164, 1268–1278.
https://doi.org/10.1016/j.jclepro.2017.07.025
Bianchini, I. L., Martins, M. A. I., Pica, C. Q., Zeni, V. S., & Rodrigues, N. (2017).
Microgrid test setup and procedures implemented on a real pilot project. 2017 IEEE 8th
International Symposium on Power Electronics for Distributed Generation Systems,
PEDG 2017, 1–4. https://doi.org/10.1109/PEDG.2017.7972476
CEMIG. (2012). Energy Conservation and Efficiency. CEMIG.
Claudia Roldán, M., Martínez, M., & Peña, R. (2014). Scenarios for a hierarchical assessment
of the global sustainability of electric power plants in México. Renewable and
Sustainable Energy Reviews, 33, 154–160. https://doi.org/10.1016/j.rser.2014.02.007
Dranka, G. G., & Ferreira, P. (2020). Towards a smart grid power system in Brazil:
Challenges and opportunities. Energy Policy, 136(September 2018).
https://doi.org/10.1016/j.enpol.2019.111033
Fathi, M., & Bevrani, H. (2017). Regulating power management in interconnected
microgrids. Journal of Renewable and Sustainable Energy, 9(5), 055502.
https://doi.org/10.1063/1.5003003
Fernandes, D. R. (2004). Uma contribuição sobre a construção de indicadores e sua
importância para a gestão empresarial. Revista FAE, 7(1), 1–18.
https://doi.org/10.1590/S1413-81232003000300010
Güney, T. (2019). Renewable energy, non-renewable energy and sustainable development.
International Journal of Sustainable Development and World Ecology, 26(5), 389–397.
https://doi.org/10.1080/13504509.2019.1595214
Hou, Q., Du, E., Zhang, N., & Kang, C. (2020). Impact of High Renewable Penetration on
the Power System Operation Mode: A Data-Driven Approach. IEEE Transactions on
Power Systems, 35(1), 731–741. https://doi.org/doi: 10.1109/TPWRS.2019.2929276
Jirdehi, M. A., Tabar, V. S., Ghassemzadeh, S., & Tohidi, S. (2020). Different aspects of
microgrid management: A comprehensive review. Journal of Energy Storage, 30(June
2019), 101457. https://doi.org/10.1016/j.est.2020.101457

Journal of Environmental Science and Sustainable Development 4(1): 137-159
DOI: https://doi.org/10.7454/jessd.v4i1.1059 158
Kathirgamanathan, A., Péan, T., Zhang, K., Rosa, M. De, Salom, J., Kummert, M., & Finn,
D. P. (2020). Energy & Buildings Towards standardising market-independent indicators
for quantifying energy flexibility in buildings. Energy & Buildings, 220, 110027.
https://doi.org/10.1016/j.enbuild.2020.110027
Li, M., & Tao, W. (2017). Review of methodologies and polices for evaluation of energy
efficiency in high energy-consuming industry. Applied Energy, 187, 203–215.
https://doi.org/10.1016/j.apenergy.2016.11.039
Machado, L. C. (2019). A gestão do projeto campus sustentável na Unicamp. Sínteses:
Revista Eletrônica do SimTec, (7), e019109-e019109.
https://doi.org/10.20396/sinteses.v0i7.11566
Mardani, A., Kazimieras, E., Streimikiene, D., Jusoh, A., & Khoshnoudi, M. (2017). A
comprehensive review of data envelopment analysis ( DEA ) approach in energy e ffi
ciency. Renewable and Sustainable Energy Reviews, 70, 1298-1322.
https://doi.org/10.1016/j.rser.2016.12.030
Mer, D. K., & Patel, R. R. (2016). The concept of distributed generation & the effects of its
placement in distribution network. International Conference on Electrical, Electronics,
and Optimization Techniques, ICEEOT 2016, 3965–3969.
https://doi.org/10.1109/ICEEOT.2016.7755458
Morales, C. (2007). Indicados de Consumo de Energia Elétrica: Classificação por
Prioridades de Atuação na Universidade de São Paulo. Universidade de São Paulo.
Moura, M. M. C., Frankenberger, F., & Tortato, U. (2019). Sustainability in Brazilian HEI:
practices overview. International Journal of Sustainability in Higher Education, 20(5),
832–841. https://doi.org/10.1108/IJSHE-01-2019-0021
Napitupulu, J., & Mawengkang, H. (2017). Model of Sustainable Electrical Power
Management : Lamp E ffi cacy of the National Street Lighting in North Sumatera
Province. Proceedings of MICoMS, 1, 609–619. https://doi.org/10.1108/978-1-78756-
793-1-00097
Onat, N., & Bayar, H. (2010). The sustainability indicators of power production systems.
Renewable and Sustainable Energy Reviews, 14(9), 3108–3115.
https://doi.org/10.1016/j.rser.2010.07.022
Østergaard, P. A., Duic, N., Noorollahi, Y., Mikulcic, H., & Kalogirou, S. (2020).
Sustainable development using renewable energy technology. Renewable Energy, 146,
2430–2437. https://doi.org/10.1016/j.renene.2019.08.094

Journal of Environmental Science and Sustainable Development 4(1): 137-159
DOI: https://doi.org/10.7454/jessd.v4i1.1059 159
Pitt, D., & Michaud, G. (2015). Assessing the Value of Distributed Solar Energy Generation.
Current Sustainable/Renewable Energy Reports, 2(3), 105–113.
https://doi.org/10.1007/s40518-015-0030-0
Rebelatto, B. G., Salvia, A. L., Reginatto, G., Branldi, L. L., & Frandoloso, M. A. L. (2020).
ENERGY EFFICIENCY INITIATIVES AT UNIVERSITIES: A SYSTEMATIC
LITERATURE REVIE. Revista Gestão & Sustentabilidade Ambiental, 9, 503-524.
https://doi.org/10.19177/rgsa.v9e0I2020503-524
Saidel, M. A., Favato, L. B., & Morales, C. (2005). Indicadores Energéticos E Ambientais :
Ferramenta Importante Na Gestão Da Energia Elétrica. In Congresso Brasileiro De
Eficiência Energética. https://repositorio.usp.br/item/001487521
Sharma, A., Saxena, B. K., & Rao, K. V. S. (2017). Comparison of smart grid development in
five developed countries with focus on smart grid implementations in India. Proceedings
of IEEE International Conference on Circuit, Power and Computing Technologies,
ICCPCT 2017. https://doi.org/10.1109/ICCPCT.2017.8074195
Silva, R. D. de S., Oliveira, R. C. de, & Tostes, M. E. de L. (2017). Analysis of the Brazilian
energy efficiency program for electricity distribution systems. Energies, 10(9), 1–19.
https://doi.org/10.3390/en10091391
UFLA-DMA. (2019). Plano de Logística Sustentável - UFLA.
UFLA. (2014). A universidade Centenária. Portal UFLA.
UFLA. (2016). Plano de Desenvolvimento Institucional 2016-2020.
Vigna, I., Pernetti, R., Pasut, W., & Lollini, R. (2018). New domain for promoting energy e
ffi ciency : Energy Flexible Building Cluster. Sustainable Cities and Society,
38(January), 526–533. https://doi.org/10.1016/j.scs.2018.01.038
Yoldaş, Y., Önen, A., Muyeen, S. M., Vasilakos, A. V., & Alan, İ. (2017). Enhancing smart
grid with microgrids: Challenges and opportunities. Renewable and Sustainable Energy
Reviews, 72(June 2016), 205–214. https://doi.org/10.1016/j.rser.2017.01.064
Yu, L., Xue, B., Stückrad, S., Thomas, H., Cai, G., Sustainability, A., & Iass, S. (2020).
Indicators for energy transition targets in China and Germany : A text analysis.
111(November 2019). https://doi.org/10.1016/j.ecolind.2019.106012