SUSTAINABLE FISHERIES MANAGEMENT PROJECT (SFMP)The USAID Ghana Sustainable Fisheries Management...
70
SUSTAINABLE FISHERIES MANAGEMENT PROJECT (SFMP) Ankobra Estuarine Community Climate Vulnerability Assessment
Transcript of SUSTAINABLE FISHERIES MANAGEMENT PROJECT (SFMP)The USAID Ghana Sustainable Fisheries Management...
SUSTAINABLE FISHERIES MANAGEMENT PROJECT (SFMP)
Ankobra Estuarine Community Climate Vulnerability Assessment
i
This publication is available electronically on the Coastal Resources Center’s website at
http://www.crc.uri.edu/projects_page/ghanasfmp/ and Hen Mpoano’s website at
http://www.henmpoano.org
For more information on the Ghana Sustainable Fisheries Management Project, contact:
USAID/Ghana Sustainable Fisheries Management Project
Coastal Resources Center
Graduate School of Oceanography
University of Rhode Island
220 South Ferry Rd.
Narragansett, RI 02882 USA
Tel: 401-874-6224 Fax: 401-874-6920 Email: [email protected]
Citation: Mensah J, Amoako O.A, Kankam, S. (2015). Ankobra River Estuarine
Community Climate Vulnerability Assessment. The USAID/Ghana Sustainable
Fisheries Management Project (SFMP). Narragansett, RI: Coastal Resources
Center, Graduate School of Oceanography, University of Rhode Island and Hen
Mpoano. GH2014_ACT023_HM 70 pp.
Authority/Disclaimer:
Prepared for USAID/Ghana under Cooperative Agreement (AID-641-A-15-00001) awarded
on October 22, 2014 to the University of Rhode Island and entitled; the USAID/Ghana
Sustainable Fisheries Management Project (SFMP).
This document is made possible by the support of the American People through the United
States Agency for International Development (USAID). The views expressed and opinions
contained in this report are those of the SFMP team and are not intended as statements of
policy of either USAID or the cooperating organizations. As such, the contents of this report
are the sole responsibility of the SFMP Project team and do not necessarily reflect the views
of USAID or the United States Government.
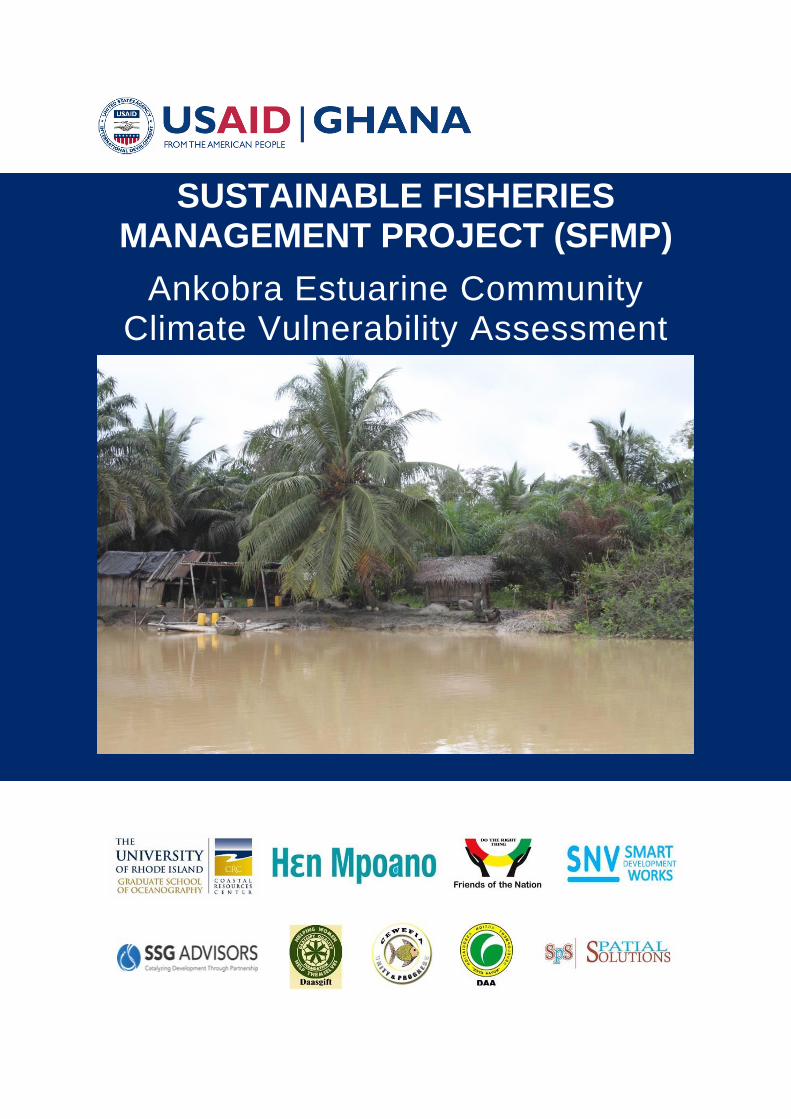
Cover photo: A small cottage along the bank of the Ankobra river
(Credit: Hen Mpoano Photo)
ii
Detailed Partner Contact Information: USAID/Ghana Sustainable Fisheries Management Project (SFMP)
10 Obodai St., Mempeasem, East Legon, Accra, Ghana Brian Crawford Chief of Party [email protected]
Najih Lazar Senior Fisheries Advisor [email protected]
Patricia Mensah Communications Officer [email protected]
Bakari Nyari Monitoring and Evaluation Specialist [email protected]
Don Robadue, Jr. Program Manager, CRC [email protected]
Justice Odoi USAID Administrative Officer Representative [email protected]
Kofi.Agbogah
StephenKankam
Hen Mpoano
38 J. Cross Cole St. Windy Ridge
Takoradi, Ghana
233 312 020 701
Andre de Jager
SNV Netherlands Development Oganization
#161, 10 Maseru Road,
E. Legon, Accra, Ghana
233 30 701 2440
Donkris Mevuta
Kyei Yamoah
Friends of the Nation
Parks and Gardens
Adiembra-Sekondi, Ghana
233 312 046 180
Peter Owusu Donkor
Spatial Solutions
#3 Third Nautical Close,
Nungua, Accra, Ghana
233 020 463 4488
Thomas Buck
SSG Advisors
182 Main Street
Burlington, VT 05401
(802) 735-1162
Victoria C. Koomson
CEWEFIA
B342 Bronyibima Estate
Elmina, Ghana
233 024 427 8377
Lydia Sasu
DAA
Darkuman Junction, Kaneshie Odokor
Highway
Accra, Ghana
233 302 315894
Gifty Asmah
Daasgift Quality Foundation
Headmaster residence, Sekondi College
Sekondi, Western Region, Ghana
233 243 326 178
For additional information on partner activities:
CRC/URI: http://www.crc.uri.edu
CEWEFIA: http://cewefia.weebly.com/
DAA: http://womenthrive.org/development-action-association-daa
Daasgift: https://www.facebook.com/pages/Daasgift-Quality-Foundation-
FNGO/135372649846101
Friends of the Nation: http://www.fonghana.org
Hen Mpoano: http://www.henmpoano.org
SNV: http://www.snvworld.org/en/countries/ghana
SSG Advisors: http://ssg-advisors.com/
Spatial Solutions: http://www.spatialsolutions.co/id1.html
iii
ACRONYMS ADRA Adventist Relief Agency
CBO Community-Based Organization
CCVI Coastal Community Vulnerability Index
CRC Coastal Resources Center at the Graduate School of Oceanography, University
of Rhode Island
EPA Environmental Protection Agency
FSSD Fisheries Statistics and Survey Division
GREL Ghana Rubber Estate Limited
GIS Geographic Information System
ICFG Integrated Coastal and Fisheries Governance
NADMO National Disaster Management Organization
NCCP National Climate Change Policy
NGO Non-Governmental Organization
SFMP Sustainable Fisheries Management Program
TCPD Town and Country Planning Department
UNFCCC United Nations Framework Convention on Climate Change
URI University of Rhode Island
USAID United States Agency for International Development
USA United States of America
WRC Water Resource Commission
iv
TABLE OF CONTENTS Acronyms ................................................................................................................................. iii
Introduction ................................................................................................................................ 1 Overview of coastal climate change trends, projections and implications in Ghana ............. 1 Natural hazards and coastal climate change issues in Western Region ................................. 2
Assessment of non-climate stressors, climate vulnerability and impacts in Ankobra estuarine
communities ............................................................................................................................... 4
Assessment Approach ............................................................................................................ 4 Socio-economic and governance dimensions of vulnerability .............................................. 6 Results .................................................................................................................................... 7 Non-climate and climate sources of vulnerability ................................................................. 7
Eziome ............................................................................................................................... 7
Kukuaveli ........................................................................................................................... 8 Sanwoma ............................................................................................................................ 9 Adelekazo ........................................................................................................................ 11
Ajomoro Eshiem .............................................................................................................. 12 Comparison across 5 communities ...................................................................................... 14 Coastal Community Vulnerability Index ............................................................................. 15
Way forward for building ecosystem and livelihood resilience .............................................. 16
Short term actions ................................................................................................................ 16 Long term actions ................................................................................................................ 17
References ................................................................................................................................ 17 Annex ....................................................................................................................................... 19
Summary Village Assessments ............................................................................................ 19 Eziome ............................................................................................................................. 19
Kukuaveli ......................................................................................................................... 26 Sanwoma .......................................................................................................................... 33 Adelekezo ........................................................................................................................ 41
Ajomoro Eshiem .............................................................................................................. 48 Land Cover mapping and Remote sensing data ................................................................... 54
Data Processing and Analysis .......................................................................................... 54 Land cover classification of Ankobra Ecosystem ................................................................ 55
Focus Group and Assessment Instrument ............................................................................ 56
v
LIST OF FIGURES Figure 1: Trend in Sea Surface Temperature, 2000 – 2010 ....................................................... 2
Figure 2: Annual rainfall and temperature trends for Ankobra lower basin, 1901 – 2012 ........ 4 Figure 3: Map of the study area showing the five estuarine communities ................................ 5 Figure 4: Data collection in some of the communities .............................................................. 6 Figure 5 Most vulnerable livelihoods of men in Eziome ........................................................... 7 Figure 6 Most vulnerable livelihoods for women in Eziome .................................................... 8
Figure 7 Most vulnerable livelihoods of men in Kukuaveli ...................................................... 9 Figure 8 Most vulnerable liveliohoods of women in Kukuaveli ............................................... 9 Figure 9 Most vulnerable livelihoods of men in Sanwoma ..................................................... 10 Figure 10 Most vulnerable livelihoods of women in Sanwoma .............................................. 11 Figure 11 Most vulnerable livelihoods of men in Adelekazo .................................................. 12
Figure 12 Most vulnerable livelihoods of women in Adelekazo ............................................. 12 Figure 13 Most vulnerable livelihoods of men in Ajomoro Eshiem ....................................... 13 Figure 14 Most vulnerable livelihoods of women in Ajomoro Eshiem ................................... 13
Figure 15 Factor contribution to overall vulnerability in 5 estuarine communities ................ 14 Figure 16 : Flood hazard map of Sanwoma showing vulnerable settlement areas and landing
site ............................................................................................................................................ 15 Figure 17 Resulting CCVI of 5 estuarine communities ........................................................... 16
Figure 18 Community map showing flood hazard areas in Eziome ........................................ 20 Figure 19 Community map showing flood hazard areas n Kukuaveli..................................... 28
Figure 20 Community map showing flood hazard areas in Sanwoma .................................... 35 Figure 21 Community map showing flood hazard areas in Adelekezo ................................... 42
Figure 22 Stands of mangroves in Adelekezo ......................................................................... 44 Figure 23 Community map showing flood hazard areas in Ajomoro Eshiem ......................... 49
Figure 24 The RapidEye image of the area with bands 5,3,2 displayed in RGB .................... 54 Figure 25 Land cover map of the study area............................................................................ 55
1
INTRODUCTION
The USAID Ghana Sustainable Fisheries Management Project (SFMP) is a five-year program
aimed at rebuilding Ghana’s marine fish stocks and catches through the adoption of
responsible fishing practices.
The (SFMP) project contributes to the Government of Ghana’s fisheries development
objectives and USAID’s Feed the Future Initiative goals of improved food security, economic
growth and poverty alleviation. Working closely with the Ministry of Fisheries and
Aquaculture Development and the Fisheries Commission, USAID/Ghana SFMP aims to end
overfishing of key stocks important to local food security through a multi-pronged approach:
Improved legal enabling conditions for co-management, use rights and effort-
reduction strategies
Strengthened information systems and science-informed decision-making
Increased constituencies that provide the political and public support needed to
rebuild fish stocks
Implementation of applied management initiatives for several target fisheries
ecosystems
Closely linked to the primary objective of the SFMP are activities aimed at resilience against
climate change impacts and strengthening coastal spatial planning and decision making
processes to foster protection of water-dependent uses of the coast and coastal adaptation to
climate change.
Against this background, climate vulnerability assessment was conducted in 5 estuarine
communities of the Ankobra river. A complementary analysis of spatial options – this is
available in a separate report - for managing the estuary and associated mangrove forest
ecosystem was also undertaken. The purpose of the vulnerability assessment was to uncover
the sources of livelihood vulnerability in the estuarine communities and identify opportunities
for building household, community as well as ecosystem resilience against climate and non-
climate stressors.
Overview of coastal climate change trends, projections and implications in Ghana
Ghana is endowed with a coastline that stretches 565 km and comprises a sandy east coast
and west coast on the extremities as well as a central coast characterized by rocky beaches
interspersed with short sections of sandy beaches (EPA, 2000). Dotted along this stretch of
coastline are major infrastructure of cultural and economic significance, notably fishing ports,
fishing settlements, harbours, energy processing facilities, tourism and recreation facilities,
forts and castles. In addition, this coastline is rich in biodiversity assets and characterized by
unique ecosystems that provide not only vital ecological services and functions but also the
basis of food and livelihood security for the predominantly poor coastal dwellers. About 90
lagoons along Ghana’s coast are also among the available habitats for marine resources, and
provide vital seasonal income and subsistence fish and crustacean catches for nearby
communities (Finegold et al., 2010).
Unfortunately, Ghana’s rich coastal ecosystems and biodiversity are being threatened and
subjected to rapid degradation from human activities including marine and land based
pollution, overexploitation of marine fisheries and unsustainable land use practices. Human
drivers as well as natural causes of coastal ecosystem degradation – notably shoreline erosion
2
- are influenced and magnified by climate change parameters such as sea level rise,
increasing air and sea surface temperatures, flooding and extreme weather events. Although
conclusions of various global climate models vary enormously, they all point to a common
trend and confirm coastal climate change and vulnerability in Ghana. Climate scenarios
developed for the first national communication to the UNFCCC indicated sea level rise of
2.1mm per year over the last 40 years with projections of 5.8cm, 16.5cm and 34.5cm by
2020, 2050 and 2080 respectively (NCCP, 2012). This will have devastating consequences
for communities within the 30m contour of the coastal zone. General rainfall levels have
been reducing and its patterns increasingly becoming erratic in the coastal areas. With less
predictable rainfall patterns, uncertain and heavy storm events are more likely to cause
flooding and storm damage in coastal areas. While rainfall projections are characterized by
high uncertainty, available estimates by Minia et.al (2004) indicate a decline by 1.1% and
20.5% between 2020 and 2080 respectively, and for the same period, they project
temperature increase of 0.8°C and 5.4°C respectively.
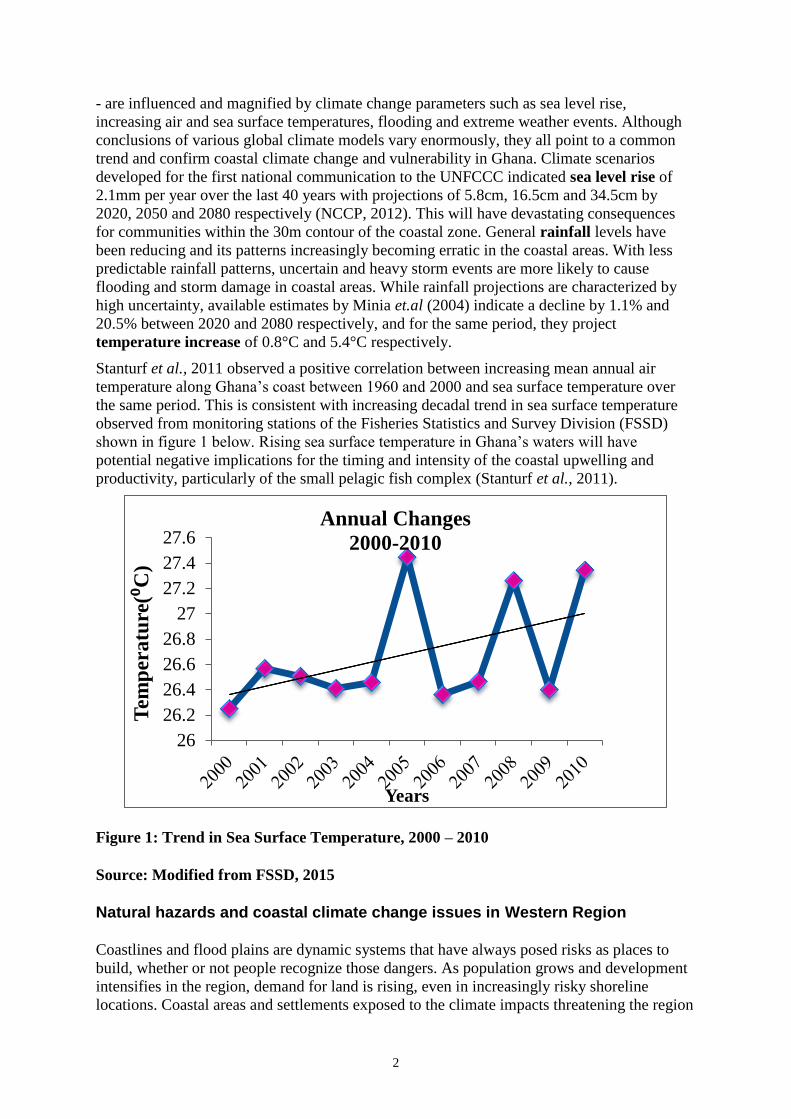
Stanturf et al., 2011 observed a positive correlation between increasing mean annual air
temperature along Ghana’s coast between 1960 and 2000 and sea surface temperature over
the same period. This is consistent with increasing decadal trend in sea surface temperature
observed from monitoring stations of the Fisheries Statistics and Survey Division (FSSD)
shown in figure 1 below. Rising sea surface temperature in Ghana’s waters will have
potential negative implications for the timing and intensity of the coastal upwelling and
productivity, particularly of the small pelagic fish complex (Stanturf et al., 2011).
Figure 1: Trend in Sea Surface Temperature, 2000 – 2010
Source: Modified from FSSD, 2015
Natural hazards and coastal climate change issues in Western Region
Coastlines and flood plains are dynamic systems that have always posed risks as places to
build, whether or not people recognize those dangers. As population grows and development
intensifies in the region, demand for land is rising, even in increasingly risky shoreline
locations. Coastal areas and settlements exposed to the climate impacts threatening the region
26
26.2
26.4
26.6
26.8
27
27.2
27.4
27.6
Tem
per
atu
re(⁰
C)
Years
Annual Changes
2000-2010
3
are sensitive to them in differing degrees, for example, some settlements are built in
dangerous low-lying areas while others are setback from eroding shorelines and flood-prone
wetlands. Sea level rise in the Western Region can have a number of impacts including
accelerating erosion; coastal flooding; threatening the functioning of piers, docks and
seawalls; shifting estuaries to ocean salinity levels; contaminating coastal fresh water wells;
and intruding on coastal river water supply intakes. The World Bank estimated that 170 km2
of the Western Region’s coast (defined as the area up to 30m in elevation) will be exposed to
sea level rise impacts, affecting an existing population of 16,830. In addition to the potential
economic effects of sea level rise and accelerated erosion, extensive coastal wetlands in the
Western Region will be impacted by sea level rise. As the rising ocean erodes the shoreline,
these wetlands will be transformed from closed to open lagoons, with a loss of vital fish
habitat and biodiversity in the process. Similarly, mangrove areas will be adversely impacted
by sea level rise.
Over 80 landing sites and beaches used to offload and process catch, moor or beach boats are
perilously exposed to shoreline erosion and flooding. In recent decades, many of them have
been buffeted by waves and erosion to such an extent that shore protection structures have
been installed. However, many of the structures did not adequately serve their intended
function or have simply failed, such as in Axim and Shama old town in the Nzema East and
Shama districts respectively.
Studies on shoreline erosion in the Western region show mixed results due to differences in
methodological approaches for estimating shoreline change. Based on estimates by Wiafe
(2011), between 1974 and 2005, shorelines in Western Ghana retreated at an average rate of
1m per year with considerable variation along the coast. Studies conducted by Boateng
(2012), also indicate annual erosion rate of 1.6m for segments of the region’s south east
facing shore. All these studies point to a progressive increase in shoreline erosion of the
region’s coast.
As with all future rainfall predictions, there is high degree of uncertainty in rainfall
projections for the Western region. Noteworthy however, are rainfall trends shown by data
recorded by local rainfall stations operated by the Ghana Meteorological Agency on the
Ankobra basin and included in the basin’s integrated water resources management plan.
These data, recorded between 1970 and 2001, show that the Ankobra basin is characterized
by a bi-modal rainfall regime with two seasons, extending from April to June and from
September to November, and records a mean annual rainfall of 1,700mm (WRC, 2009).
Available meteorological data also shows that the Ankobra Basin is characterized by
uniformly high temperatures throughout the year with a mean annual temperature of about
26°C. March is the hottest month in the basin with a mean monthly temperature of about 27-
29°C. August is the coolest month with a mean temperature of 24-25°C. Diurnal variation of
3o-5
oC from the mean is observed in the basin (WRC, 2009). These observations are
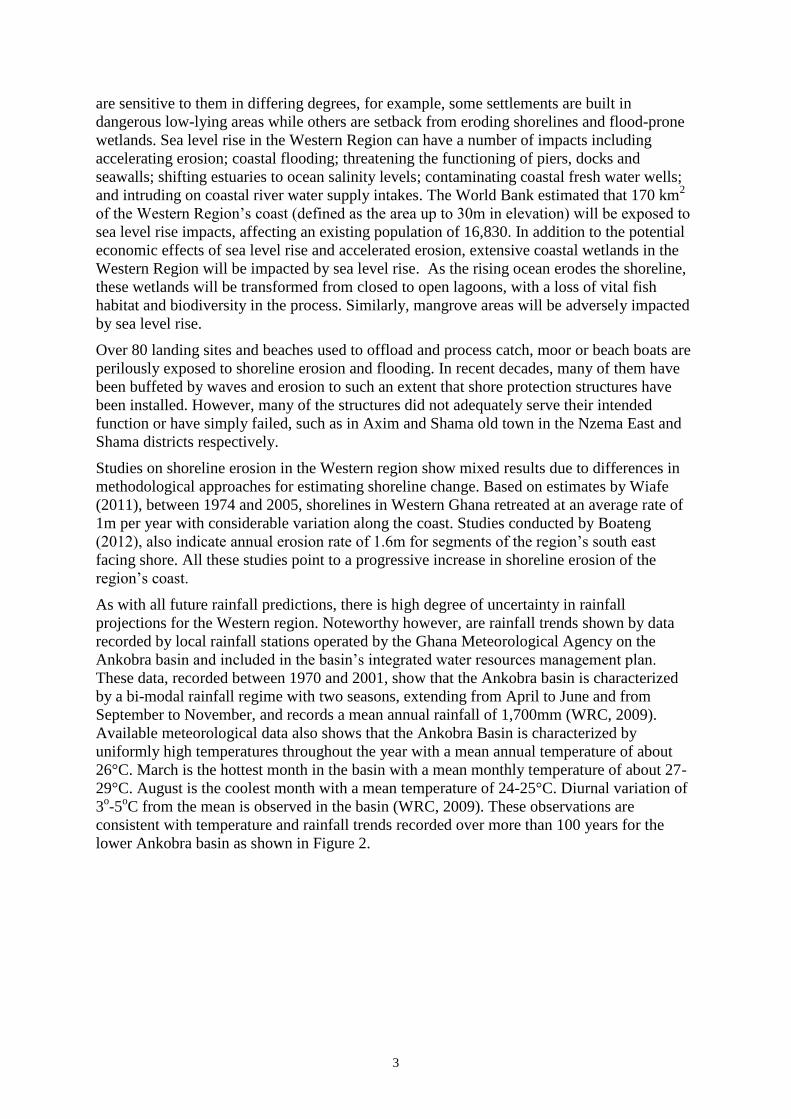
consistent with temperature and rainfall trends recorded over more than 100 years for the
lower Ankobra basin as shown in Figure 2.
4
Figure 2: Annual rainfall and temperature trends for Ankobra lower basin, 1901 – 2012
Source:http://sdwebx.worldbank.org/climateportalb/home.cfm?page=country_profile&CCod
e=GHA&ThisTab=ClimateBaseline
The relatively high annual temperatures and rainfall decline in the Ankobra basin contribute
to the reduction in river runoff (WRC, 2009), a phenomenon which is gaining prominence
during the dry seasons.
Livelihoods of the Western region’s coastal population as well as ecosystems are being
impacted significantly, and in ways that communities and district level planning processes are
not able to adequately respond. This is evident in the assessment conducted by the ICFG
initiative to examine adaptive capacity of 77 coastal communities in 4 districts of the Western
region, where the key findings show that majority of coastal communities have weak ability
to respond to emergencies generated by natural hazards, they suffer social and economic
development challenges that are worsening, and they have a relatively low ability to manage
coastal resources in a way that will ensure sustained productivity and environmental quality.
ASSESSMENT OF NON-CLIMATE STRESSORS, CLIMATE VULNERABILITY AND IMPACTS IN ANKOBRA ESTUARINE COMMUNITIES
Assessment Approach
This assessment was carried out in 5 Ankobra estuarine communities – Adelekazo, Eziome,
Ajomoro Eshiem, Kukuaveli and Sanwoma - locally referred to as ‘‘river state’’
communities. We conceptualized vulnerability as a characteristic of social and ecological
systems that is generated by multiple factors and processes. In this context, vulnerability is a
dynamic process generated by social and physical factors that shape people’s ability to cope
with, recover from, or adapt to external stresses placed on their livelihoods and well-being
(O’Brien et al., 2004 ; Kelly and Adger 200).
5
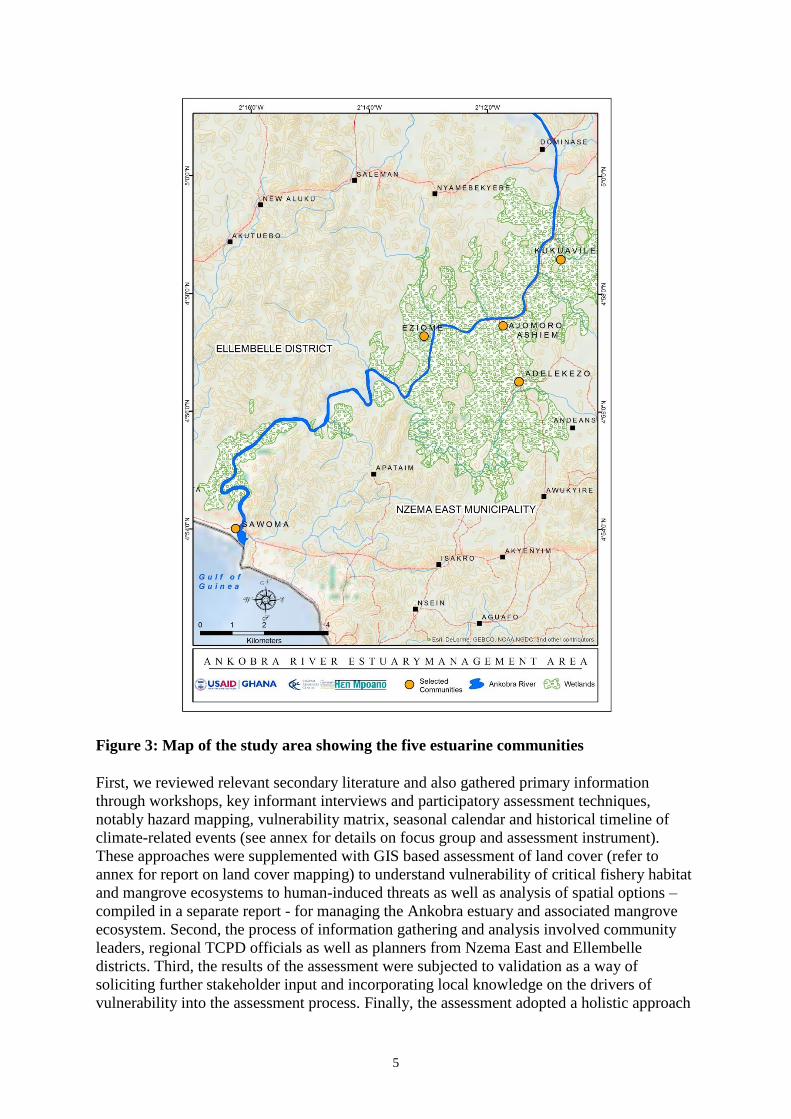
Figure 3: Map of the study area showing the five estuarine communities
First, we reviewed relevant secondary literature and also gathered primary information
through workshops, key informant interviews and participatory assessment techniques,
notably hazard mapping, vulnerability matrix, seasonal calendar and historical timeline of
climate-related events (see annex for details on focus group and assessment instrument).
These approaches were supplemented with GIS based assessment of land cover (refer to
annex for report on land cover mapping) to understand vulnerability of critical fishery habitat
and mangrove ecosystems to human-induced threats as well as analysis of spatial options –
compiled in a separate report - for managing the Ankobra estuary and associated mangrove
ecosystem. Second, the process of information gathering and analysis involved community
leaders, regional TCPD officials as well as planners from Nzema East and Ellembelle
districts. Third, the results of the assessment were subjected to validation as a way of
soliciting further stakeholder input and incorporating local knowledge on the drivers of
vulnerability into the assessment process. Finally, the assessment adopted a holistic approach
6
by taking into account the specific context of livelihood dependence on natural resources
within the Ankobra estuarine communities and how this influences socio-economic,
governance, livelihood, physical and climate-related dimensions of vulnerability.
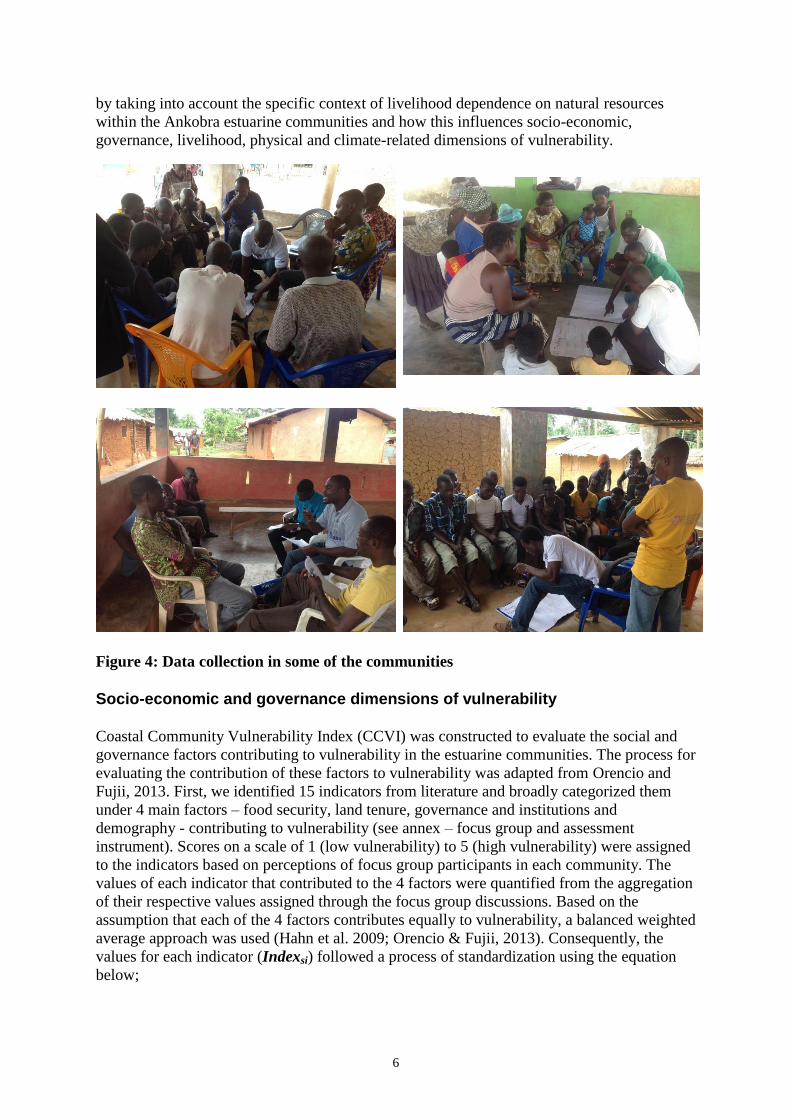
Figure 4: Data collection in some of the communities
Socio-economic and governance dimensions of vulnerability
Coastal Community Vulnerability Index (CCVI) was constructed to evaluate the social and
governance factors contributing to vulnerability in the estuarine communities. The process for
evaluating the contribution of these factors to vulnerability was adapted from Orencio and
Fujii, 2013. First, we identified 15 indicators from literature and broadly categorized them
under 4 main factors – food security, land tenure, governance and institutions and
demography - contributing to vulnerability (see annex – focus group and assessment
instrument). Scores on a scale of 1 (low vulnerability) to 5 (high vulnerability) were assigned
to the indicators based on perceptions of focus group participants in each community. The
values of each indicator that contributed to the 4 factors were quantified from the aggregation
of their respective values assigned through the focus group discussions. Based on the
assumption that each of the 4 factors contributes equally to vulnerability, a balanced weighted
average approach was used (Hahn et al. 2009; Orencio & Fujii, 2013). Consequently, the
values for each indicator (Indexsi) followed a process of standardization using the equation
below;
7
Vss is the score assigned an indicator, while Vmax and Vmin are respective maximum and
minimum scores respectively based on the scales set for each indicator. All Indexsi resulting
were respectively combined to determine the values of the 4 (food security, land tenure,
governance and institutions and demography) factors according to the following equation;
F is determined based on the average of indicator values (Indexsi), divided by the total
number of factors that contribute to that F. All levels of contribution of the 4 (four) factors
(F) were scaled from 0 (high contribution) to 1 (low contribution) and averaged for the
purposes of creating one CCVI value for each community. The results are summarized
below.
Results
Non-climate and climate sources of vulnerability
Eziome
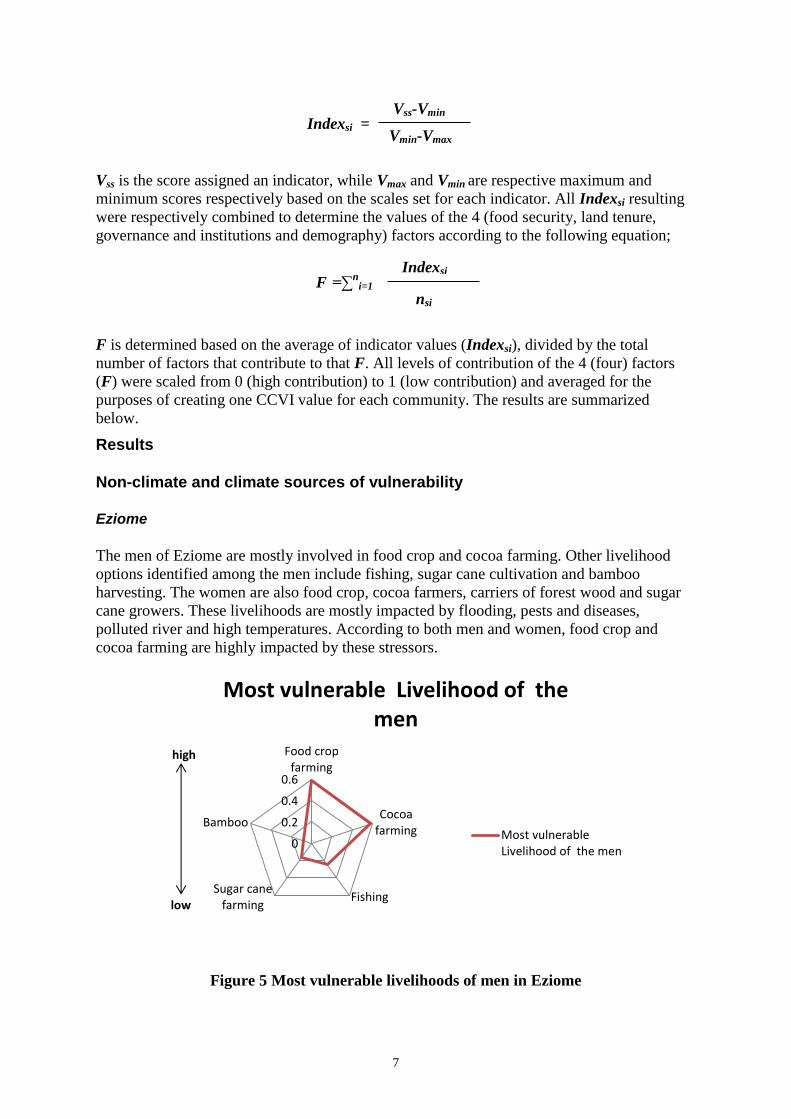
The men of Eziome are mostly involved in food crop and cocoa farming. Other livelihood
options identified among the men include fishing, sugar cane cultivation and bamboo
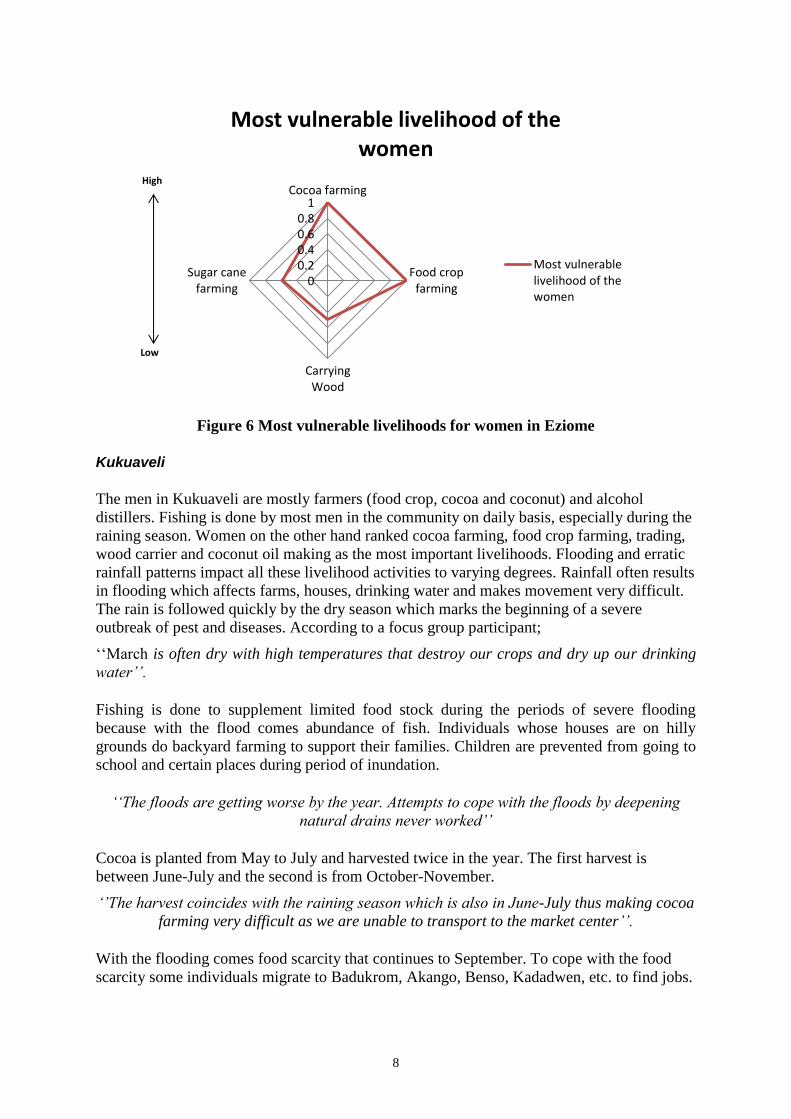
harvesting. The women are also food crop, cocoa farmers, carriers of forest wood and sugar
cane growers. These livelihoods are mostly impacted by flooding, pests and diseases,
polluted river and high temperatures. According to both men and women, food crop and
cocoa farming are highly impacted by these stressors.
Figure 5 Most vulnerable livelihoods of men in Eziome
0
0.2
0.4
0.6
Food cropfarming
Cocoafarming
FishingSugar cane
farming
Bamboo
Most vulnerable Livelihood of the men
Most vulnerableLivelihood of the men
low
high
Vmin-Vmax Indexsi =
Vss-Vmin
F =∑n
i=1 Indexsi
nsi
8
Figure 6 Most vulnerable livelihoods for women in Eziome
Kukuaveli
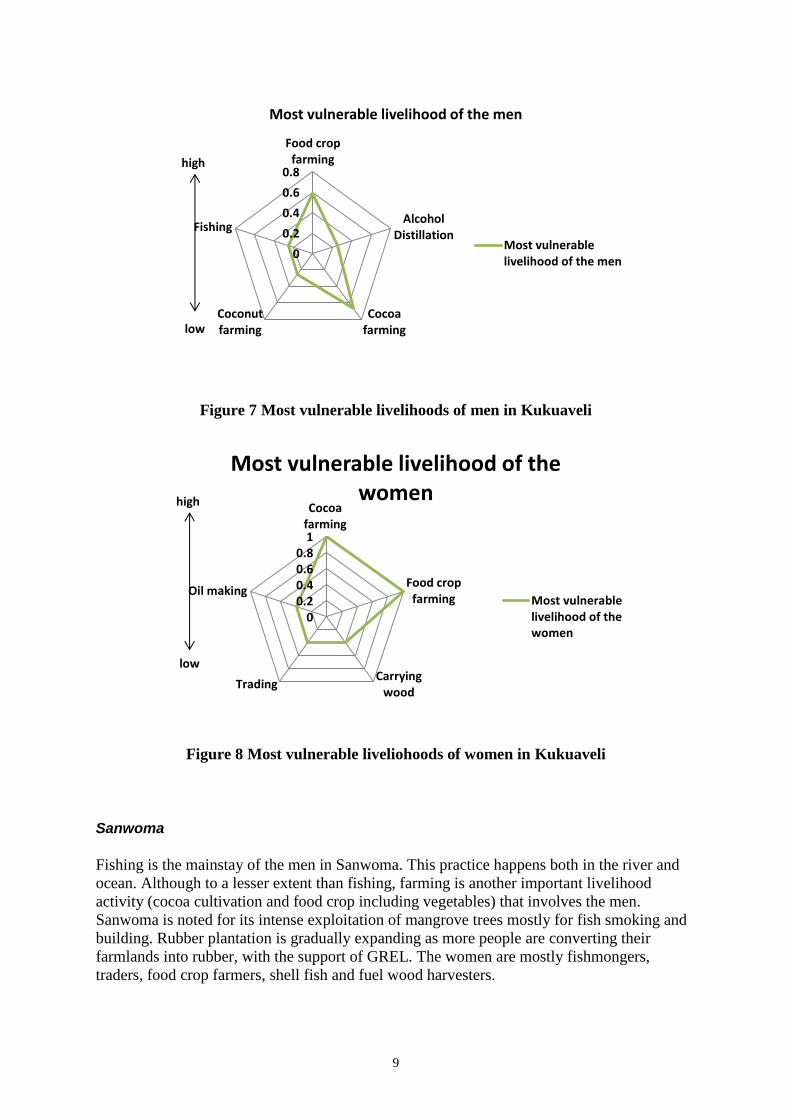
The men in Kukuaveli are mostly farmers (food crop, cocoa and coconut) and alcohol
distillers. Fishing is done by most men in the community on daily basis, especially during the
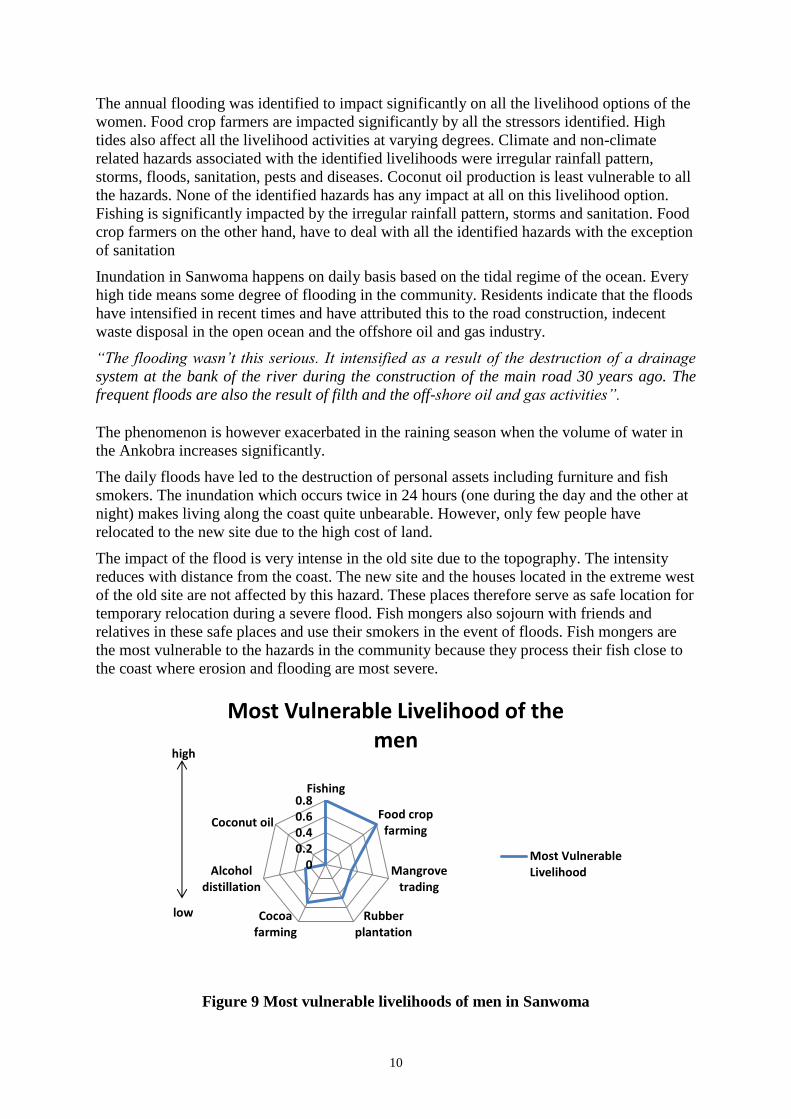
raining season. Women on the other hand ranked cocoa farming, food crop farming, trading,
wood carrier and coconut oil making as the most important livelihoods. Flooding and erratic
rainfall patterns impact all these livelihood activities to varying degrees. Rainfall often results
in flooding which affects farms, houses, drinking water and makes movement very difficult.
The rain is followed quickly by the dry season which marks the beginning of a severe
outbreak of pest and diseases. According to a focus group participant;
‘‘March is often dry with high temperatures that destroy our crops and dry up our drinking
water’’.
Fishing is done to supplement limited food stock during the periods of severe flooding
because with the flood comes abundance of fish. Individuals whose houses are on hilly
grounds do backyard farming to support their families. Children are prevented from going to
school and certain places during period of inundation.
‘‘The floods are getting worse by the year. Attempts to cope with the floods by deepening
natural drains never worked’’
Cocoa is planted from May to July and harvested twice in the year. The first harvest is
between June-July and the second is from October-November.
‘’The harvest coincides with the raining season which is also in June-July thus making cocoa
farming very difficult as we are unable to transport to the market center’’.
With the flooding comes food scarcity that continues to September. To cope with the food
scarcity some individuals migrate to Badukrom, Akango, Benso, Kadadwen, etc. to find jobs.
00.20.40.60.8
1Cocoa farming
Food cropfarming
CarryingWood
Sugar canefarming
Most vulnerable livelihood of the women
Most vulnerablelivelihood of thewomen
Low
High
9
Figure 7 Most vulnerable livelihoods of men in Kukuaveli
Figure 8 Most vulnerable liveliohoods of women in Kukuaveli
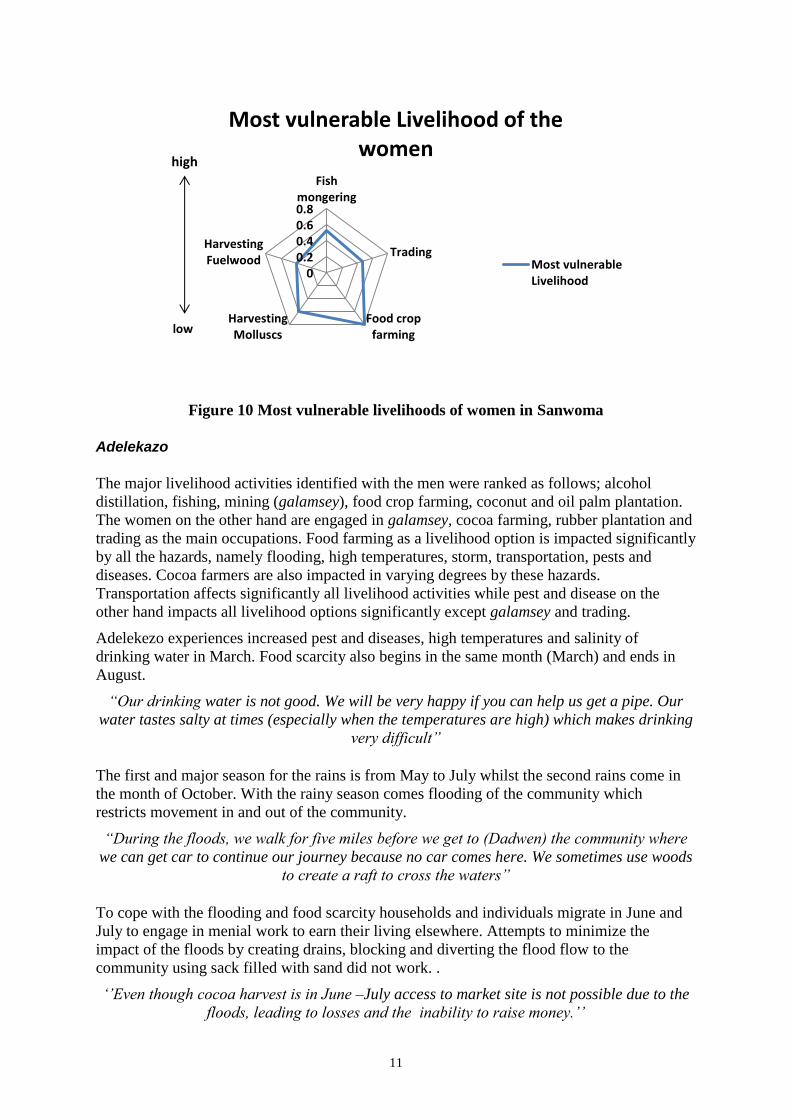
Sanwoma
Fishing is the mainstay of the men in Sanwoma. This practice happens both in the river and
ocean. Although to a lesser extent than fishing, farming is another important livelihood
activity (cocoa cultivation and food crop including vegetables) that involves the men.
Sanwoma is noted for its intense exploitation of mangrove trees mostly for fish smoking and
building. Rubber plantation is gradually expanding as more people are converting their
farmlands into rubber, with the support of GREL. The women are mostly fishmongers,
traders, food crop farmers, shell fish and fuel wood harvesters.
0
0.2
0.4
0.6
0.8
Food cropfarming
AlcoholDistillation
Cocoafarming
Coconutfarming
Fishing
Most vulnerable livelihood of the men
Most vulnerablelivelihood of the men
high
low
00.20.40.60.8
1
Cocoafarming
Food cropfarming
Carryingwood
Trading
Oil making
Most vulnerable livelihood of the women
Most vulnerablelivelihood of thewomen
high
low
10
The annual flooding was identified to impact significantly on all the livelihood options of the
women. Food crop farmers are impacted significantly by all the stressors identified. High
tides also affect all the livelihood activities at varying degrees. Climate and non-climate
related hazards associated with the identified livelihoods were irregular rainfall pattern,
storms, floods, sanitation, pests and diseases. Coconut oil production is least vulnerable to all
the hazards. None of the identified hazards has any impact at all on this livelihood option.
Fishing is significantly impacted by the irregular rainfall pattern, storms and sanitation. Food
crop farmers on the other hand, have to deal with all the identified hazards with the exception
of sanitation
Inundation in Sanwoma happens on daily basis based on the tidal regime of the ocean. Every
high tide means some degree of flooding in the community. Residents indicate that the floods
have intensified in recent times and have attributed this to the road construction, indecent
waste disposal in the open ocean and the offshore oil and gas industry.
“The flooding wasn’t this serious. It intensified as a result of the destruction of a drainage
system at the bank of the river during the construction of the main road 30 years ago. The
frequent floods are also the result of filth and the off-shore oil and gas activities”.
The phenomenon is however exacerbated in the raining season when the volume of water in
the Ankobra increases significantly.
The daily floods have led to the destruction of personal assets including furniture and fish
smokers. The inundation which occurs twice in 24 hours (one during the day and the other at
night) makes living along the coast quite unbearable. However, only few people have
relocated to the new site due to the high cost of land.
The impact of the flood is very intense in the old site due to the topography. The intensity
reduces with distance from the coast. The new site and the houses located in the extreme west
of the old site are not affected by this hazard. These places therefore serve as safe location for
temporary relocation during a severe flood. Fish mongers also sojourn with friends and
relatives in these safe places and use their smokers in the event of floods. Fish mongers are
the most vulnerable to the hazards in the community because they process their fish close to
the coast where erosion and flooding are most severe.
Figure 9 Most vulnerable livelihoods of men in Sanwoma
00.20.40.60.8
Fishing
Food cropfarming
Mangrovetrading
Rubberplantation
Cocoafarming
Alcoholdistillation
Coconut oil
Most Vulnerable Livelihood of the men
Most VulnerableLivelihood
high
low
11
Figure 10 Most vulnerable livelihoods of women in Sanwoma
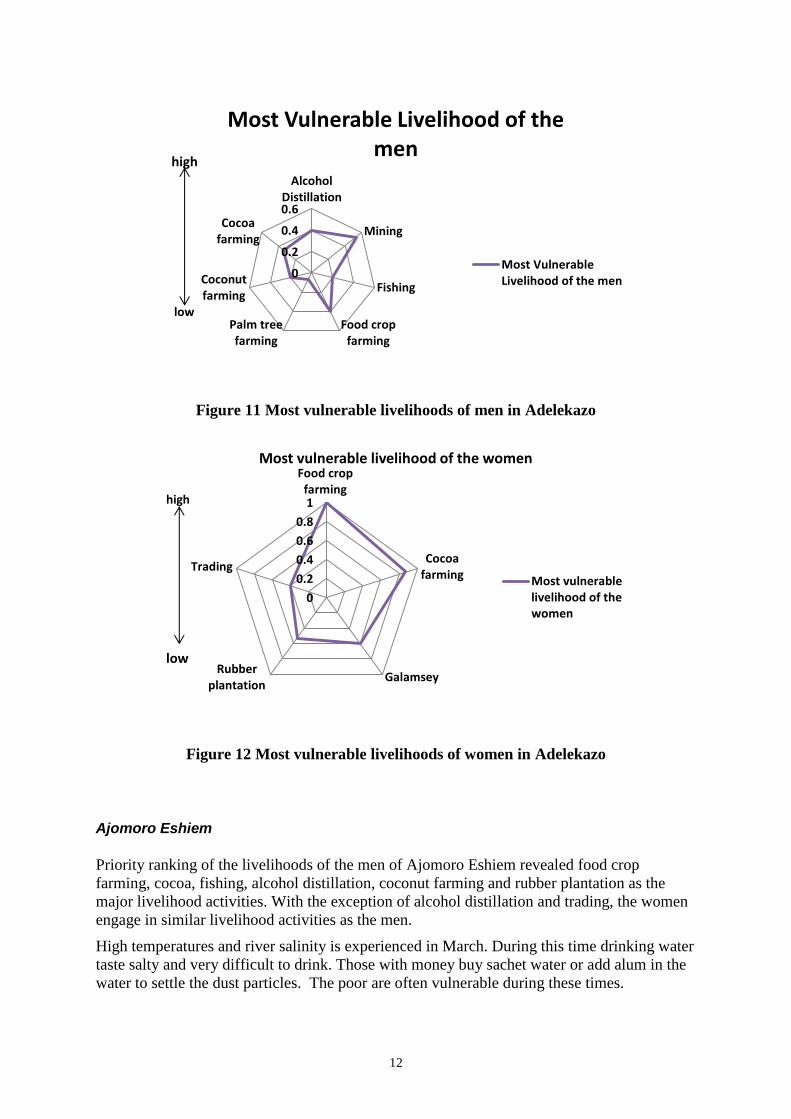
Adelekazo
The major livelihood activities identified with the men were ranked as follows; alcohol
distillation, fishing, mining (galamsey), food crop farming, coconut and oil palm plantation.
The women on the other hand are engaged in galamsey, cocoa farming, rubber plantation and
trading as the main occupations. Food farming as a livelihood option is impacted significantly
by all the hazards, namely flooding, high temperatures, storm, transportation, pests and
diseases. Cocoa farmers are also impacted in varying degrees by these hazards.
Transportation affects significantly all livelihood activities while pest and disease on the
other hand impacts all livelihood options significantly except galamsey and trading.
Adelekezo experiences increased pest and diseases, high temperatures and salinity of
drinking water in March. Food scarcity also begins in the same month (March) and ends in
August.
“Our drinking water is not good. We will be very happy if you can help us get a pipe. Our
water tastes salty at times (especially when the temperatures are high) which makes drinking
very difficult”
The first and major season for the rains is from May to July whilst the second rains come in
the month of October. With the rainy season comes flooding of the community which
restricts movement in and out of the community.
“During the floods, we walk for five miles before we get to (Dadwen) the community where
we can get car to continue our journey because no car comes here. We sometimes use woods
to create a raft to cross the waters”
To cope with the flooding and food scarcity households and individuals migrate in June and
July to engage in menial work to earn their living elsewhere. Attempts to minimize the
impact of the floods by creating drains, blocking and diverting the flood flow to the
community using sack filled with sand did not work. .
‘’Even though cocoa harvest is in June –July access to market site is not possible due to the
floods, leading to losses and the inability to raise money.’’
00.20.40.60.8
Fishmongering
Trading
Food cropfarming
HarvestingMolluscs
HarvestingFuelwood
Most vulnerable Livelihood of the women
Most vulnerableLivelihood
high
low
12
Figure 11 Most vulnerable livelihoods of men in Adelekazo
Figure 12 Most vulnerable livelihoods of women in Adelekazo
Ajomoro Eshiem
Priority ranking of the livelihoods of the men of Ajomoro Eshiem revealed food crop
farming, cocoa, fishing, alcohol distillation, coconut farming and rubber plantation as the
major livelihood activities. With the exception of alcohol distillation and trading, the women
engage in similar livelihood activities as the men.
High temperatures and river salinity is experienced in March. During this time drinking water
taste salty and very difficult to drink. Those with money buy sachet water or add alum in the
water to settle the dust particles. The poor are often vulnerable during these times.
0
0.2
0.4
0.6
AlcoholDistillation
Mining
Fishing
Food cropfarming
Palm treefarming
Coconutfarming
Cocoafarming
Most Vulnerable Livelihood of the men
Most VulnerableLivelihood of the men
high
low
0
0.2
0.4
0.6
0.8
1
Food cropfarming
Cocoafarming
GalamseyRubber
plantation
Trading
Most vulnerable livelihood of the women
Most vulnerablelivelihood of thewomen
high
low
13
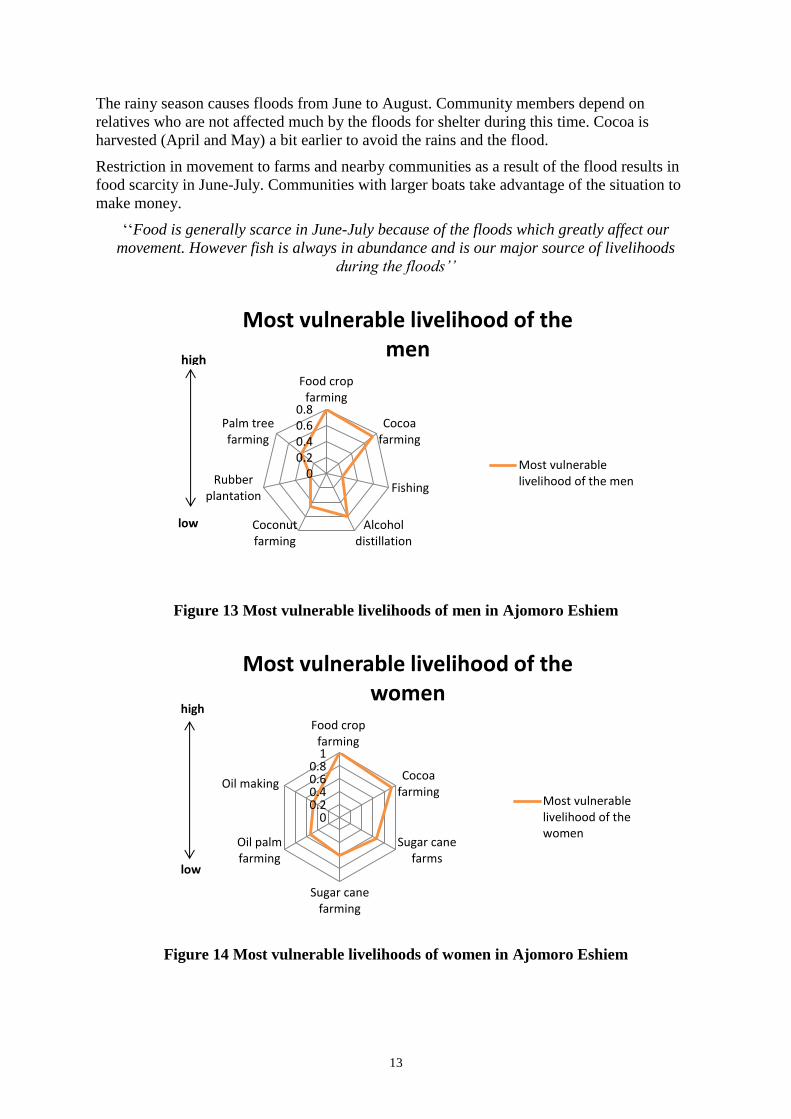
The rainy season causes floods from June to August. Community members depend on
relatives who are not affected much by the floods for shelter during this time. Cocoa is
harvested (April and May) a bit earlier to avoid the rains and the flood.
Restriction in movement to farms and nearby communities as a result of the flood results in
food scarcity in June-July. Communities with larger boats take advantage of the situation to
make money.
‘‘Food is generally scarce in June-July because of the floods which greatly affect our
movement. However fish is always in abundance and is our major source of livelihoods
during the floods’’
Figure 13 Most vulnerable livelihoods of men in Ajomoro Eshiem
Figure 14 Most vulnerable livelihoods of women in Ajomoro Eshiem
00.20.40.60.8
Food cropfarming
Cocoafarming
Fishing
Alcoholdistillation
Coconutfarming
Rubberplantation
Palm treefarming
Most vulnerable livelihood of the men
Most vulnerablelivelihood of the men
high
low
00.20.40.60.8
1
Food cropfarming
Cocoafarming
Sugar canefarms
Sugar canefarming
Oil palmfarming
Oil making
Most vulnerable livelihood of the women
Most vulnerablelivelihood of thewomen
low
high
14
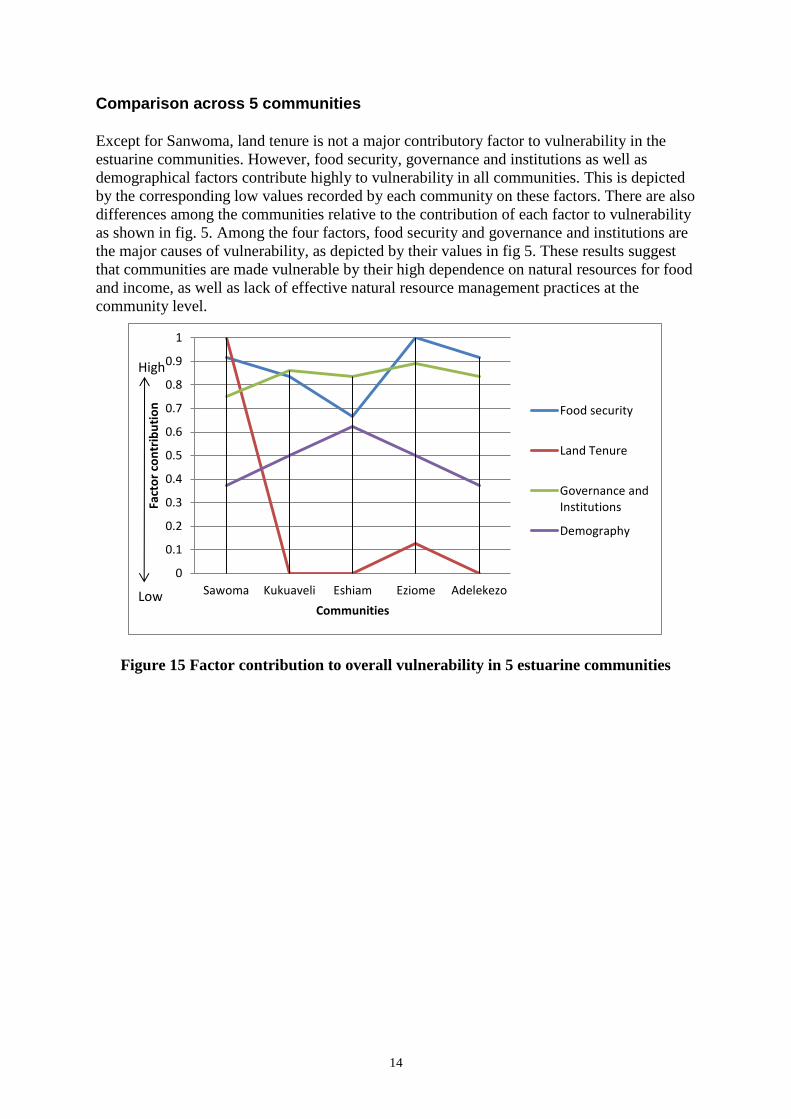
Comparison across 5 communities
Except for Sanwoma, land tenure is not a major contributory factor to vulnerability in the
estuarine communities. However, food security, governance and institutions as well as
demographical factors contribute highly to vulnerability in all communities. This is depicted
by the corresponding low values recorded by each community on these factors. There are also
differences among the communities relative to the contribution of each factor to vulnerability
as shown in fig. 5. Among the four factors, food security and governance and institutions are
the major causes of vulnerability, as depicted by their values in fig 5. These results suggest
that communities are made vulnerable by their high dependence on natural resources for food
and income, as well as lack of effective natural resource management practices at the
community level.
Figure 15 Factor contribution to overall vulnerability in 5 estuarine communities
0
0.1
0.2
0.3
0.4
0.5
0.6
0.7
0.8
0.9
1
Sawoma Kukuaveli Eshiam Eziome Adelekezo
Fact
or
con
trib
uti
on
Communities
Food security
Land Tenure
Governance andInstitutions
Demography
High
Low

15
Figure 16 : Flood hazard map of Sanwoma showing vulnerable settlement areas and
landing site
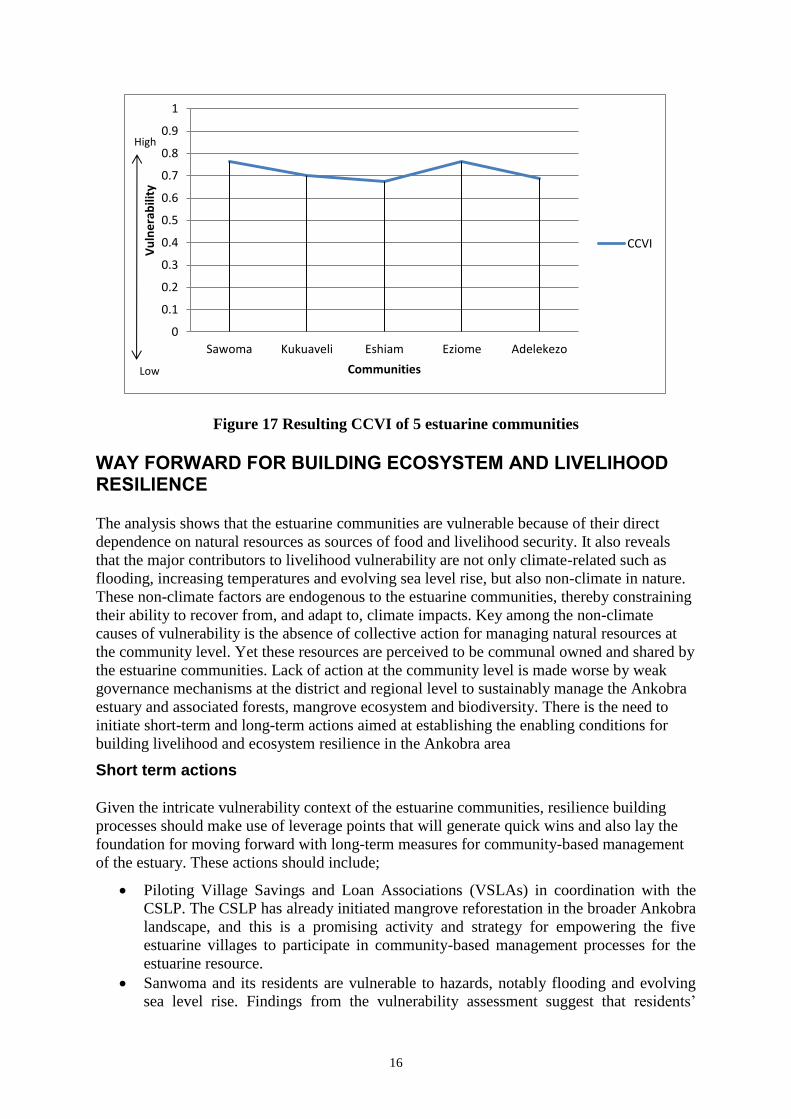
Coastal Community Vulnerability Index
While all the 5 estuarine communities recorded low CCVI, indicating high overall
vulnerability (fig.7), the case of Sanwoma and Eziome requires special mention because they
recorded the lowest among the 5 communities as shown in fig.7. Furthermore, the SFMP’s
focus on Sanwoma for fish processing technology dissemination requires that a climate
vulnerability lens is applied in order to target interventions effectively. Unlike the other
communities, land tenure insecurity, coupled with high costs involved in accessing land for
farming and or resettlement is a major source of vulnerability in Sanwoma. This partly
explains the reason resettlement will not be a viable adaptation option for the people of
Sanwoma, at least, in the short to medium term. The limited availability of land and space,
given the low elevation and physical vulnerability of this community, is a source of
additional constrain on siting of fish processing facilities. The highest elevation in this
community is 14 meters above sea level and over 341 buildings including fish smoking
facilities lie within the riparian buffer of 300 meters – development in this area is prohibited
according to TCPD regulations.
16
Figure 17 Resulting CCVI of 5 estuarine communities
WAY FORWARD FOR BUILDING ECOSYSTEM AND LIVELIHOOD RESILIENCE
The analysis shows that the estuarine communities are vulnerable because of their direct
dependence on natural resources as sources of food and livelihood security. It also reveals
that the major contributors to livelihood vulnerability are not only climate-related such as
flooding, increasing temperatures and evolving sea level rise, but also non-climate in nature.
These non-climate factors are endogenous to the estuarine communities, thereby constraining
their ability to recover from, and adapt to, climate impacts. Key among the non-climate
causes of vulnerability is the absence of collective action for managing natural resources at
the community level. Yet these resources are perceived to be communal owned and shared by
the estuarine communities. Lack of action at the community level is made worse by weak
governance mechanisms at the district and regional level to sustainably manage the Ankobra
estuary and associated forests, mangrove ecosystem and biodiversity. There is the need to
initiate short-term and long-term actions aimed at establishing the enabling conditions for
building livelihood and ecosystem resilience in the Ankobra area
Short term actions
Given the intricate vulnerability context of the estuarine communities, resilience building
processes should make use of leverage points that will generate quick wins and also lay the
foundation for moving forward with long-term measures for community-based management
of the estuary. These actions should include;
Piloting Village Savings and Loan Associations (VSLAs) in coordination with the
CSLP. The CSLP has already initiated mangrove reforestation in the broader Ankobra
landscape, and this is a promising activity and strategy for empowering the five
estuarine villages to participate in community-based management processes for the
estuarine resource.
Sanwoma and its residents are vulnerable to hazards, notably flooding and evolving
sea level rise. Findings from the vulnerability assessment suggest that residents’
0
0.1
0.2
0.3
0.4
0.5
0.6
0.7
0.8
0.9
1
Sawoma Kukuaveli Eshiam Eziome Adelekezo
Vu
lne
rab
ility
Communities
CCVI
High
Low
17
relocation from this community is remains elusive and at best, presents a long-term
adaptation option to these stressors. Furthermore the assessment revealed that impact
of flooding on fish processing as a livelihood option is disproportionately high. SpS in
coordination with CRC and HM should facilitate the development of flood risk plans
as part to inform siting decisions for fish processing facilities. This should be done in
parallel or prior to widespread dissemination of fish smoking technologies. Areas for
siting these facilities should also be designated in district spatial plans to ensure long
term protection of these sites for such uses.
Detailed analysis of satellite imagery will be conducted to build upon initial effort in
year one to produce land use land cover data for the Ankobra estuary ecosystem. The
land cover will be extracted from 2013 RapidEye imagery and will follow the same
protocol that was used during the ICFG initiative. The land cover data will provide
the baseline for detailed mangrove mapping in the Ankobra estuary. The products
from these mapping efforts will support improved management and lay the ground
work for updating the spatial plans for both Nzema East and Ellembelle districts to
incorporate uses that are conservation oriented and support the fishery habitat
protection.
Long term actions
River basin and catchment management approaches – maintenance of riparian
hydrological balance in the Ankobra basin is required for perpetual freshwater flow to
sustain a healthy estuarine and marine fishery. The present upstream land uses, which
include alluvial gold mining activities is a potential source of heavy metal pollution
that will likely impact estuarine fish recruitment and ultimately, productively. Long
term monitoring of water quality to inform basin- wide good management practices is
required among other measures to address weak river basin governance. Water quality
and estuarine fishery health monitoring as well as watershed management
programmes presents collaborative opportunities for UCC’s center for coastal
management and Hen Mpoano to model behavior for ICM practice in the Ankobra
region.
Land cover mapping to monitor change over time - key drivers such as mining,
farming and settlement development are rapidly transforming the landscape and
aquatic environment in the Ankobra region. The area deserves refined land cover
mapping to inform regional level terrestrial land use decision making processes and
also support long-term monitoring of land cover change.
REFERENCES Abramowitz, J. et al., 2002. Climate Change: Natural Resource Management and
Vulnerability Reduction. Background Paper to the Task Force on Climate Change,
Adaptation and Vulnerable Communities. International Institute for Suistanable, p.37.
Boateng, I (2012). An application of GIS and coastal geomorphology for large scale
assessment of coastal erosion and management: a case study of Ghana. Journal of
Coast Conservation (2012) 16:383–397
Chishakwe, N. & Murray, L., 2012. Building climate change adaptation on community
experiences
Environmental Protection Agency- Ghana. 2000. National communication to the
UNFCCC. Accra: Environmental Protection Agency.
Finegold, A. Gordon, D. Mills, L. Curtis, and A. Pulis. (2010). Western Region Fisheries
Sector Review. WorldFish Center. USAID Integrated Coastal and Fisheries
18
Governance Initiative for the Western Region, Ghana. 84 p.
http://www.cabdirect.org/abstracts/20093263953.html
http://pubs.iied.org/pdfs/10030IIED.pdf
Hunter, P., Burkitt, Z. & Trangmar, B., 2010. Local government adapting to climate change:
Managing infrastructure, protecting resources, & supporting communities. Climate
change adaptation in New Zealand: Future scenarios and some sectoral perspectives,
pp.122–133
Kelly, P.M. and Adger, W.N., 2000. Theory and practice in assessing vulnerability to climate
change and Facilitating adaptation. Climatic Change, 47(4): 325-352.
Lagos, R. & Wirth, T., 2009. Facilitating an international agreement on climate change:
Adaptation to climate change. Climate Change: Adaptation To Climate Change.
Minia, Z. (2004). Climate scenarios developed for climate change impacts assessment in
Ghana. The Netherlands Climate Change Studuies Assistance Programme
(NCCSAP). Phase2 - Part 1.
NCCP (National Climate Change Policy). (2012). Ministry of Environment, Science and
Technology EPA.
O’Brien, K., Eriksen, S., Schjolden, A. and Nygaard, L., 2004a. What’s in a word.
Conflicting interpretations of vulnerability in climate change research. Oslo, Senter
for klimaforskning: Working paper: 16.
Orencio, P.M. & Fujii, M., 2013. An Index to Determine Vulnerability of Communities in a
Coastal Zone : A Case Study of Baler , Aurora , Philippines. , (Unep 2002), pp.61–71
Pollner, J., Kryspin-Watson, J. & Nieuwejarr, S., 2010. Disaster Risk Management and
Climate Change Adaptation in Europe and Central Asia. , p.66. Available at:
http://sistemaprotezionecivile.it/allegati/1188_DRM-Climate_Change_Europe.pdf.
Qaun, J. & Dyer, N., 2008. Climate change and land tenure. Land Tenure Working paper,
p.62.
Sarkar, S. & Padaria, R.N., 2010. Farmers ’ Awareness and Risk Perception about Climate
Change in Coastal Ecosystem of West Bengal. , 10(2), pp.32–38.
Sekine, H., Fukuhara, K., Uraguchi, A., Knee Tan, C., Nagai, M. and Okada, Y., 2009. The
Effectiveness of Community-based Adaptation (CBA) to Climate Change: From the
Viewpoint of Social Capital and Indigenous Knowledge. GEIC Working Paper Series
2009-001
Stanturf, J., Melvin L. Warren, Jr., Susan Charnley, Sophia C. Polasky, Scott L. Goodrick,
Frederick Armah, and Yaw Atuahene Nyako. (2011) Ghana Climate Change
Vulnerability and Adaptation Assessment. U.S. Department of Agriculture Forest
Service, International Program, for review by USAID.
http://www.encapafrica.org/documents/biofor/Climate%20Change%20Assessment_G
hana_%20FINAL.pdf
The Asia Foundation, 2011. A Situation Analysis of Climate Change Adaptation Initiatives in
Bangladesh.
Undp, Uncdf & Unep, 2010. Local governance and climate change a discussion note :
December 2010. , (December), pp.1–32.
Water Resources Commission, 2009. Ankobra River Basin – Integrated Water Resources
Management Plan
Wiafe G (2011) Coastal and continental shelf processes in Ghana. Department of
Oceanography and Fisheries, University of Ghana.
19
ANNEX
Summary Village Assessments
Eziome
Physical hazards
Settlement
Eziome is situated on a hill about 100 meters west of the Ankobra River. It’s a small
community with about 20 houses. The buildings in this community are well spaced and
constructed with locally available resources like mud and bamboo. The size of the settlement,
according to the older members of the community, has reduced significantly over the years
after residents embarked on an en masse migration following a dispute between the leaders of
Eziome and Bokro. This has resulted in the collapse of the only school and toilet facility
after years of abandonment.
Road Network
Eziome has no motorable roads. The main means of transportation is water and land
(footpath). Residents need to cross the Ankobra River and trek several kilometers to access
some basic services like market, school, health facility, etc. in communities like Dominase,
Apatam and even Axim. Others walk through the wetlands to nearby Bokro and Saloma.
Drainage
The entire community of Eziome is perched on a small hill surrounded by wetlands and
rivers. The Ankobra and two other tributary rivers sandwich the community which is
deprived of engineered drains.
Waste Disposals
There are neither waste disposal sites nor toilet facilities in the community. Waste is
generally disposed of in the backyard.
Hazards
The major hazard in the community is periodic inundation. Community members indicate
that
”the frequency of the inundation has intensified after a major event in 2009. The community
has recorded at least one flood every year since this event,”
Though Eziome is situated on a hill, the surrounding lowlands are wetlands and flood prone.
The situation of the community notwithstanding, the drainage system of the area is also a
contributing factor to the hazard. The Ankobra River and two other tributary rivers- Ayeho
and Subanga rivers, sandwich the community making the inhabitants vulnerable during the
raining seasons.
During the raining season, especially in July, the heavy downpour causes the rivers to
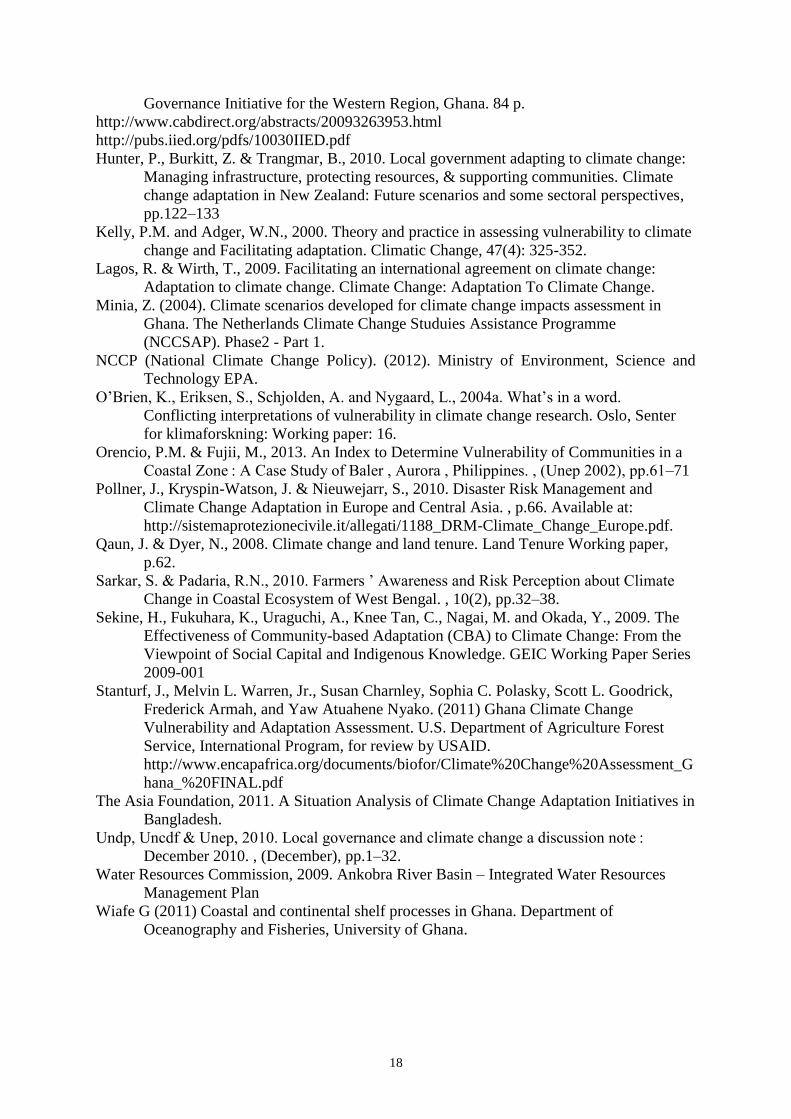
overflow their banks, flooding the surrounding wetlands causing the destruction of food and
20
cash crops and restricting movement of community members. All livelihood activities (except
fishing) come to a halt for several weeks during such floods
Figure 18 Community map showing flood hazard areas in Eziome
Community map showing flood hazard areas
Residents, however, depend on farm produce from their backyard garden and resort to fishing
as an alternative livelihood option to supplement the limited harvest. Farm produce that are
harvested before the floods are kept in the community and either shared among families or
sold after the event. Residents who have farms on the nearby hills may also access their farms
with canoes. Most vulnerable to this hazard are children and people whose farms are located
in the wetlands.
Socio economic and governance dimensions of vulnerability
Food Security
The level of fish catch is perceived to be very low and it is perceived that the decline in the
fishery begun in the 1990s. Illegal alluvial gold mining operation on the Ankobra and
mangrove degradation is perceived as some of the causes of depleting fish stock in the river
and estuary. Food crop is also perceived to be affected by seasonal inundation from the
Ankobra river. The nearest food market is Dominase which is about 5 kilometers from the
village. People from the community normally trek for more than 3 hours or boat ride for more
than 5 hours to the market destination. However, access to, and cost of land as well as its
availability for food and cash crop production does not pose vulnerability for this community
21
Governance and institutions
Leadership at the community level is weak and is partly the reason for poor community based
natural resource management decision making and governance. There is also the perception
that they are powerless in the face of the political and market forces driving degradation of
the Ankobra resources such as illegal mining and dumping of tailings from Adamus resources
operations
‘‘Even if we devise rules for managing natural resources, we will not be successful because
the resources are shared among several communities downstream and upstream of the
Ankobra River. We can decide to do the right thing but you don’t have control over what
others do.’’
While the Ankobra river has been the source of drinking water for this community, recent
mining operations have made drinking from this source unsafe. Drinking water is not within
the reach of this community. Presently, community folks trek over 3 hours to access sachet
drinking water. Despite these difficulties, NGOs operation does not reach this community.
Past efforts by Adventist Relief Agency (ADRA) resulted in the construction of a community
center. Furthermore; basic services from the local government are not forthcoming, partly
because their concerns are not articulated by the assemblyperson. They community is also
affected by changes in the electoral areas which sees them being placed under Ellembelle
district on certain occasions and at certain times, Nzema East Municipality.
Perceptions about climate change and its impacts were high among a cross-section of the
community and this included the mention of events such as extremely high morning
temperatures and changing rainfall patterns. Consequently, during the dry seasons, people
from this community migrate to other areas in search of livelihood opportunities This
temporal migration also occur in response to inundation from the river, which often result in
destruction of crops. Nonetheless, the community does not have existing plans and measures
in place to proactively respond to these impacts.
Despite the foregoing challenges, poverty is not perceived to be rife among community
members. They perceive the surrounding natural resources as source of survival and
wellbeing. In the words of a community leader,
‘‘It will be sad for anyone in this community to claim to be poor. Outsiders come to exploit
our resources for food and income, how much more those of us living with the resources.’’.
It is however, worthy to note that despite the perception of the resources as source of wealth,
little effort is being made to conserve and sustainably use these same resources which are the
essence of their lives.
22
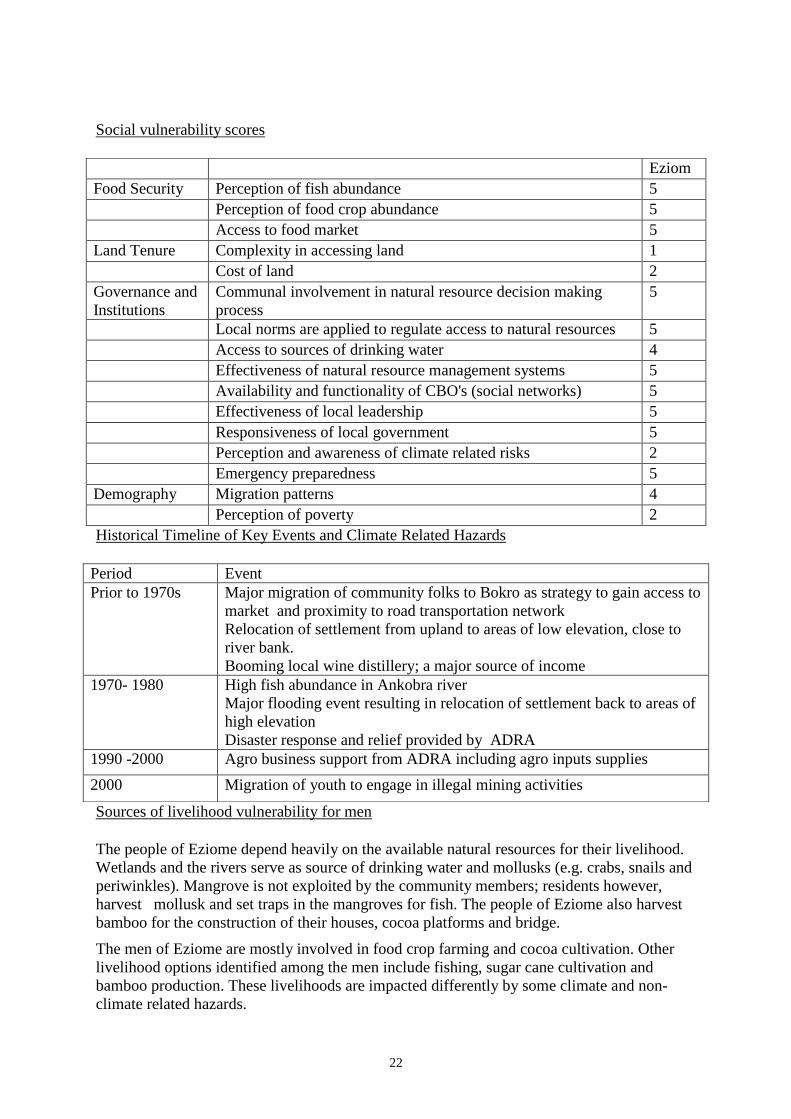
Social vulnerability scores
Historical Timeline of Key Events and Climate Related Hazards
Sources of livelihood vulnerability for men
The people of Eziome depend heavily on the available natural resources for their livelihood.
Wetlands and the rivers serve as source of drinking water and mollusks (e.g. crabs, snails and
periwinkles). Mangrove is not exploited by the community members; residents however,
harvest mollusk and set traps in the mangroves for fish. The people of Eziome also harvest
bamboo for the construction of their houses, cocoa platforms and bridge.
The men of Eziome are mostly involved in food crop farming and cocoa cultivation. Other
livelihood options identified among the men include fishing, sugar cane cultivation and
bamboo production. These livelihoods are impacted differently by some climate and non-
climate related hazards.
Eziom
Food Security Perception of fish abundance 5
Perception of food crop abundance 5
Access to food market 5
Land Tenure Complexity in accessing land 1
Cost of land 2
Governance and
Institutions
Communal involvement in natural resource decision making
process
5
Local norms are applied to regulate access to natural resources 5
Access to sources of drinking water 4
Effectiveness of natural resource management systems 5
Availability and functionality of CBO's (social networks) 5
Effectiveness of local leadership 5
Responsiveness of local government 5
Perception and awareness of climate related risks 2
Emergency preparedness 5
Demography Migration patterns 4
Perception of poverty 2
Period Event
Prior to 1970s Major migration of community folks to Bokro as strategy to gain access to
market and proximity to road transportation network
Relocation of settlement from upland to areas of low elevation, close to
river bank.
Booming local wine distillery; a major source of income
1970- 1980 High fish abundance in Ankobra river
Major flooding event resulting in relocation of settlement back to areas of
high elevation
Disaster response and relief provided by ADRA
1990 -2000 Agro business support from ADRA including agro inputs supplies
2000 Migration of youth to engage in illegal mining activities
23
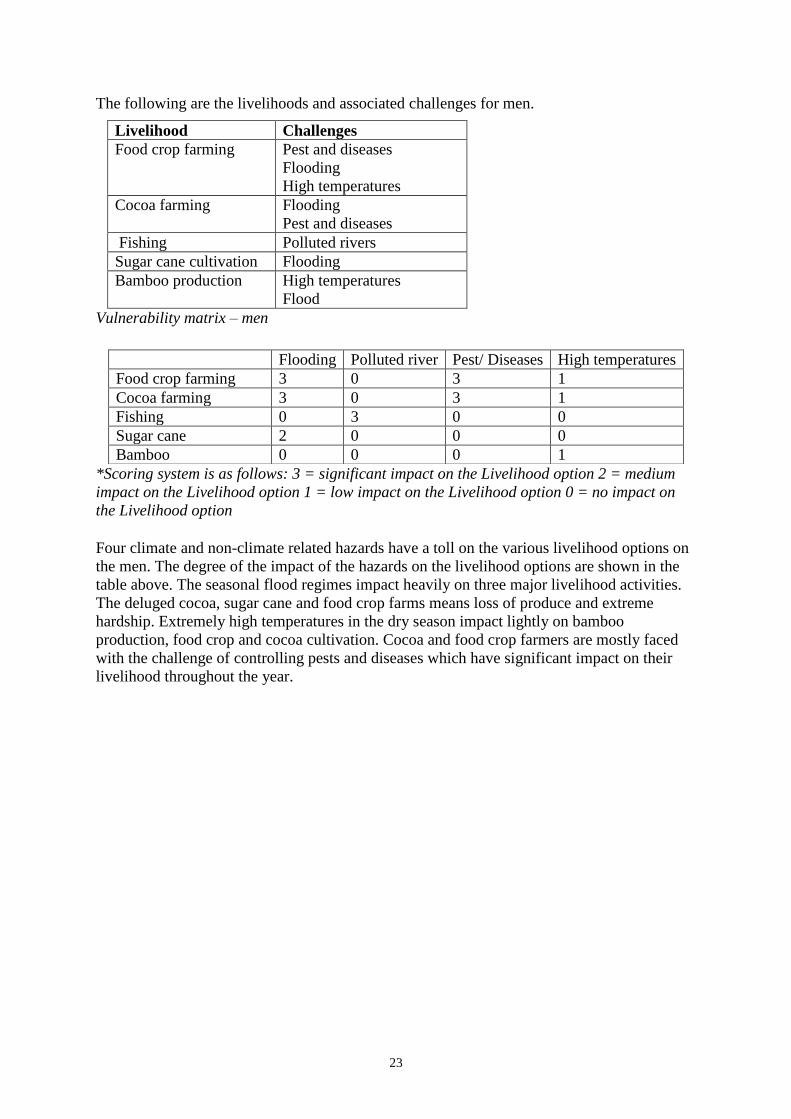
The following are the livelihoods and associated challenges for men.
Livelihood Challenges
Food crop farming Pest and diseases
Flooding
High temperatures
Cocoa farming Flooding
Pest and diseases
Fishing Polluted rivers
Sugar cane cultivation Flooding
Bamboo production High temperatures
Flood
Vulnerability matrix – men
*Scoring system is as follows: 3 = significant impact on the Livelihood option 2 = medium
impact on the Livelihood option 1 = low impact on the Livelihood option 0 = no impact on
the Livelihood option
Four climate and non-climate related hazards have a toll on the various livelihood options on
the men. The degree of the impact of the hazards on the livelihood options are shown in the
table above. The seasonal flood regimes impact heavily on three major livelihood activities.
The deluged cocoa, sugar cane and food crop farms means loss of produce and extreme
hardship. Extremely high temperatures in the dry season impact lightly on bamboo
production, food crop and cocoa cultivation. Cocoa and food crop farmers are mostly faced
with the challenge of controlling pests and diseases which have significant impact on their
livelihood throughout the year.
Flooding Polluted river Pest/ Diseases High temperatures
Food crop farming 3 0 3 1
Cocoa farming 3 0 3 1
Fishing 0 3 0 0
Sugar cane 2 0 0 0
Bamboo 0 0 0 1
24
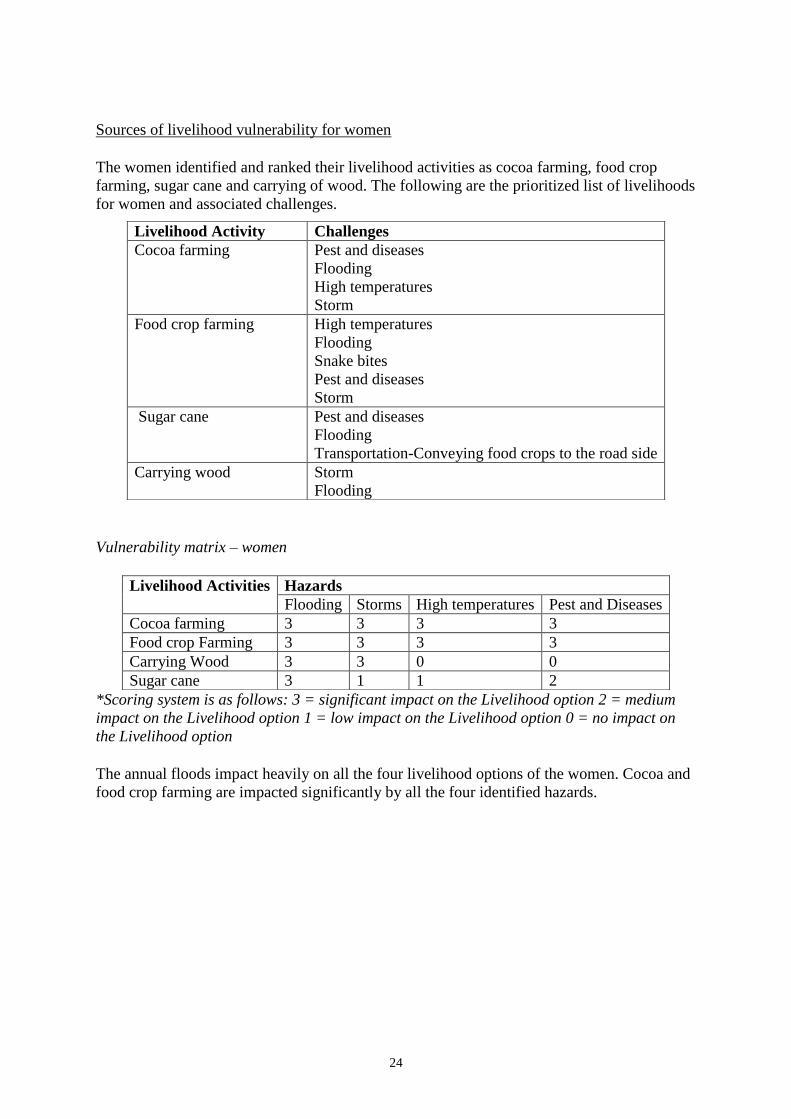
Sources of livelihood vulnerability for women
The women identified and ranked their livelihood activities as cocoa farming, food crop
farming, sugar cane and carrying of wood. The following are the prioritized list of livelihoods
for women and associated challenges.
Vulnerability matrix – women
*Scoring system is as follows: 3 = significant impact on the Livelihood option 2 = medium
impact on the Livelihood option 1 = low impact on the Livelihood option 0 = no impact on
the Livelihood option
The annual floods impact heavily on all the four livelihood options of the women. Cocoa and
food crop farming are impacted significantly by all the four identified hazards.
Livelihood Activity Challenges
Cocoa farming Pest and diseases
Flooding
High temperatures
Storm
Food crop farming High temperatures
Flooding
Snake bites
Pest and diseases
Storm
Sugar cane Pest and diseases
Flooding
Transportation-Conveying food crops to the road side
Carrying wood Storm
Flooding
Livelihood Activities Hazards
Flooding Storms High temperatures Pest and Diseases
Cocoa farming 3 3 3 3
Food crop Farming 3 3 3 3
Carrying Wood 3 3 0 0
Sugar cane 3 1 1 2
25
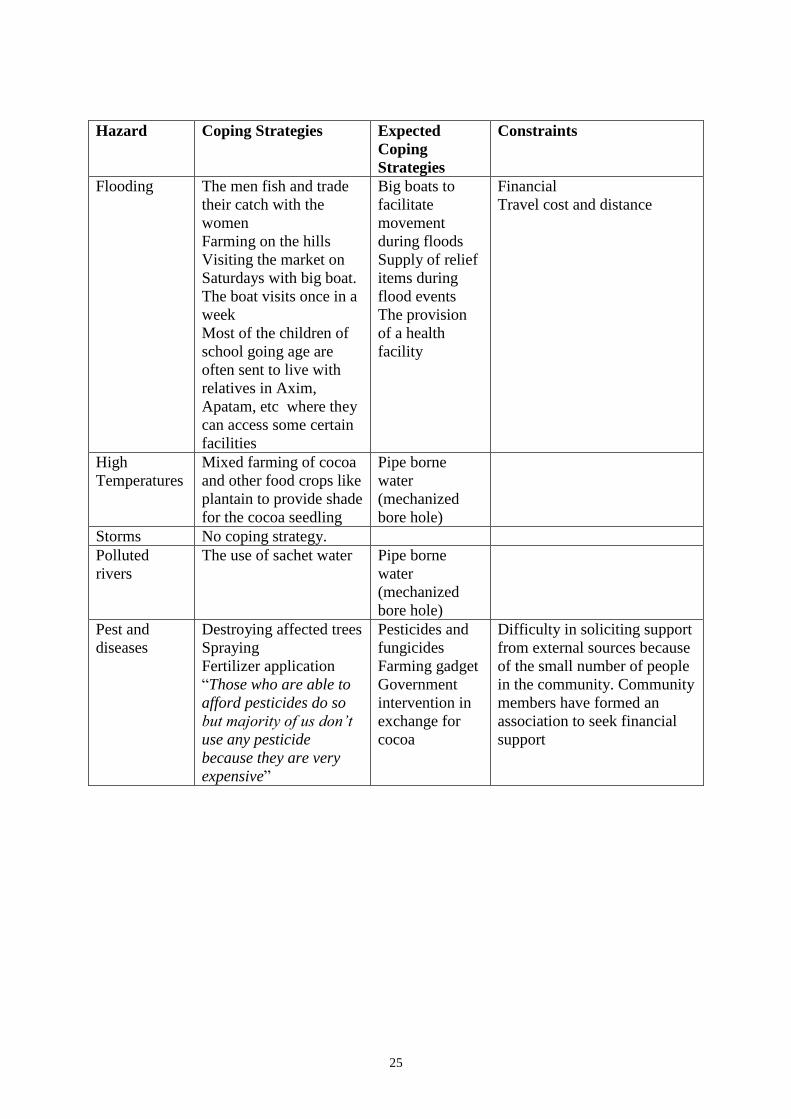
Hazard Coping Strategies Expected
Coping
Strategies
Constraints
Flooding The men fish and trade
their catch with the
women
Farming on the hills
Visiting the market on
Saturdays with big boat.
The boat visits once in a
week
Most of the children of
school going age are
often sent to live with
relatives in Axim,
Apatam, etc where they
can access some certain
facilities
Big boats to
facilitate
movement
during floods
Supply of relief
items during
flood events
The provision
of a health
facility
Financial
Travel cost and distance
High
Temperatures
Mixed farming of cocoa
and other food crops like
plantain to provide shade
for the cocoa seedling
Pipe borne
water
(mechanized
bore hole)
Storms No coping strategy.
Polluted
rivers
The use of sachet water Pipe borne
water
(mechanized
bore hole)
Pest and
diseases
Destroying affected trees
Spraying
Fertilizer application
“Those who are able to
afford pesticides do so
but majority of us don’t
use any pesticide
because they are very
expensive”
Pesticides and
fungicides
Farming gadget
Government
intervention in
exchange for
cocoa
Difficulty in soliciting support
from external sources because
of the small number of people
in the community. Community
members have formed an
association to seek financial
support
26
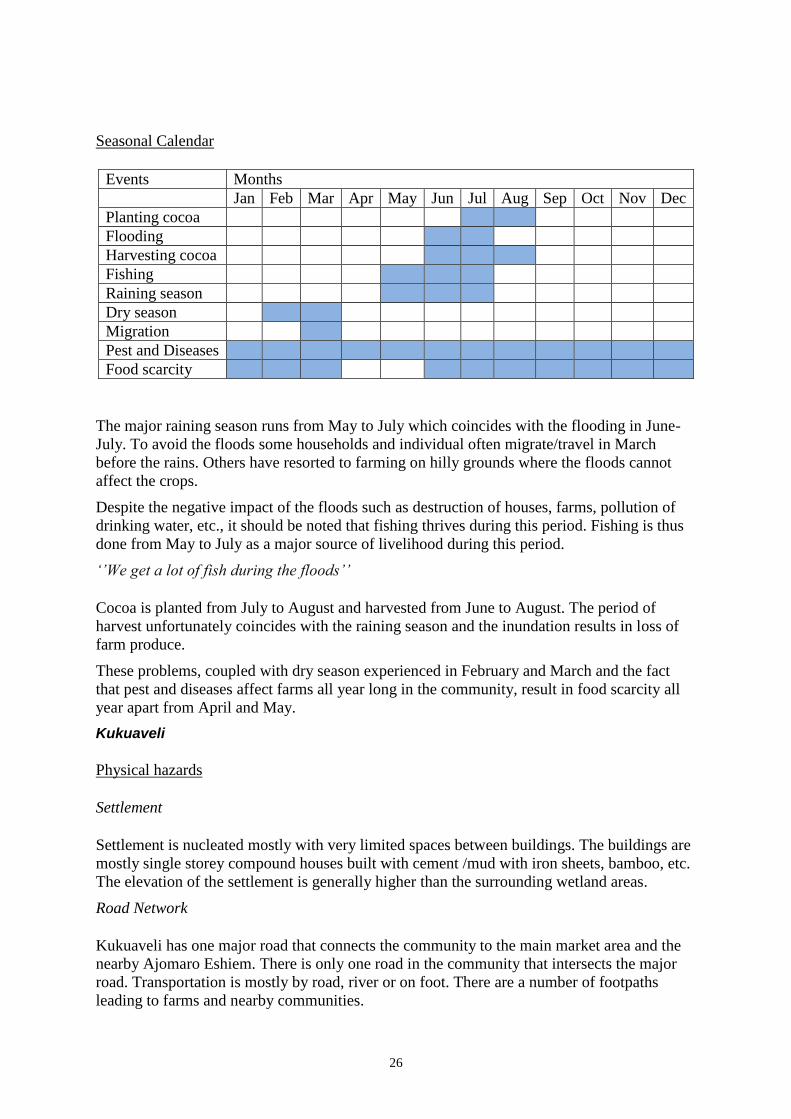
Seasonal Calendar
The major raining season runs from May to July which coincides with the flooding in June-
July. To avoid the floods some households and individual often migrate/travel in March
before the rains. Others have resorted to farming on hilly grounds where the floods cannot
affect the crops.
Despite the negative impact of the floods such as destruction of houses, farms, pollution of
drinking water, etc., it should be noted that fishing thrives during this period. Fishing is thus
done from May to July as a major source of livelihood during this period.
‘’We get a lot of fish during the floods’’
Cocoa is planted from July to August and harvested from June to August. The period of
harvest unfortunately coincides with the raining season and the inundation results in loss of
farm produce.
These problems, coupled with dry season experienced in February and March and the fact
that pest and diseases affect farms all year long in the community, result in food scarcity all
year apart from April and May.
Kukuaveli
Physical hazards
Settlement
Settlement is nucleated mostly with very limited spaces between buildings. The buildings are
mostly single storey compound houses built with cement /mud with iron sheets, bamboo, etc.
The elevation of the settlement is generally higher than the surrounding wetland areas.
Road Network
Kukuaveli has one major road that connects the community to the main market area and the
nearby Ajomaro Eshiem. There is only one road in the community that intersects the major
road. Transportation is mostly by road, river or on foot. There are a number of footpaths
leading to farms and nearby communities.
Events Months
Jan Feb Mar Apr May Jun Jul Aug Sep Oct Nov Dec
Planting cocoa
Flooding
Harvesting cocoa
Fishing
Raining season
Dry season
Migration
Pest and Diseases
Food scarcity
27
Drainage
Two tributary rivers of the Ankobra surround the community making flooding a recurrent
event. The Fenven river is the only source of drinking water in the community, It is also the
bathing place for community members There are no engineered drains in the community;
however, there are a number of natural drains which lead to the nearby wetlands.
Waste Disposals
There are no waste disposal sites in Kukuaveli. Waste is generally disposed of
indiscriminately in the wetlands. There are also no toilet facilities in the community.
Sanitation is therefore a major issue in the community.
Hazards
Due to the location of the community with surrounding low-lying wetland areas crisscrossed
by rivers, flooding happens to be the major hazard the community faces. The community
members recounted that there was a major flooding event in 1987 and another one in 2009.
The community has since 2009 been a victim of floods every year.
Though the settlement itself is not flooded, almost all the economic activities in the
community are halted during a flood event. Cocoa, rubber and food crop farms are
completely covered and the entire community is cut from other communities for weeks. The
settlement therefore becomes the haven for already harvested crops and wood.
Children are most at risk from the flood because they could easily drown. Moreover, the
hazard impacts all economic activities except fishing, which peaks when the rivers flood.
During the floods, residents depend on crops from their backyard garden and farm produce
that were harvested before the event. Owners of small canoes are able to transport some
goods across the water; however the community has very few canoes (less than 10). Some
residents, particularly fishermen, supplement the limited food stock of the family with their
catch.
28
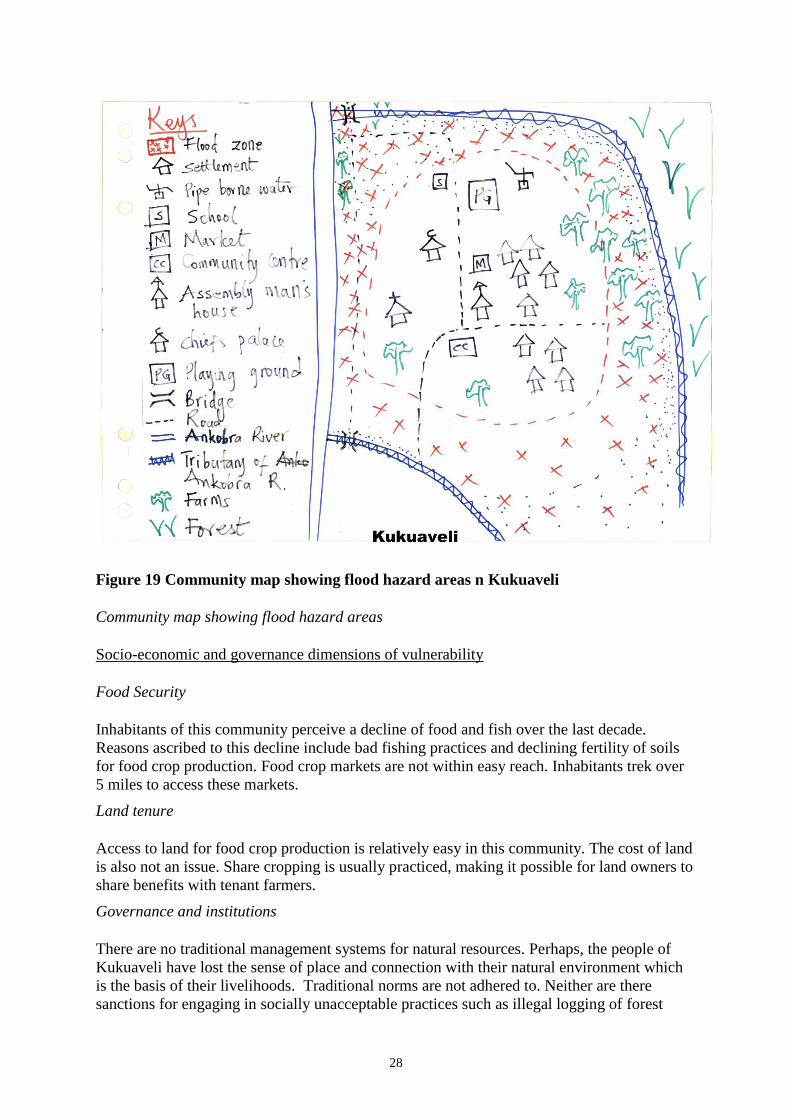
Figure 19 Community map showing flood hazard areas n Kukuaveli
Community map showing flood hazard areas
Socio-economic and governance dimensions of vulnerability
Food Security
Inhabitants of this community perceive a decline of food and fish over the last decade.
Reasons ascribed to this decline include bad fishing practices and declining fertility of soils
for food crop production. Food crop markets are not within easy reach. Inhabitants trek over
5 miles to access these markets.
Land tenure
Access to land for food crop production is relatively easy in this community. The cost of land
is also not an issue. Share cropping is usually practiced, making it possible for land owners to
share benefits with tenant farmers.
Governance and institutions
There are no traditional management systems for natural resources. Perhaps, the people of
Kukuaveli have lost the sense of place and connection with their natural environment which
is the basis of their livelihoods. Traditional norms are not adhered to. Neither are there
sanctions for engaging in socially unacceptable practices such as illegal logging of forest
29
timber. The community expressed a general sense of a disempowered society because the
drivers of ecosystem degradation, particularly mining is perceived to be uncontrollable at the
community level.
Demography
In the last few years, migration has increased in Kukuaveli. Emigrants are usually the youth
who find no options for a better quality of life in this community. It was expressed that
poverty has increased as a result of migration.
Social vulnerability scores for Kukuaveli
Historical Timeline of Key Events and Climate Related Hazards
Kukuaveli
Food Security Perception of fish abundance 5
Perception of food crop abundance 4
Access to food market 4
Land Tenure Complexity in accessing land 1
Cost of land 1
Governance and
Institutions
Communal involvement in natural resource decision
making process
5
Local norms are applied to regulate access to natural
resources
4
Access to sources of drinking water 4
Effectiveness of natural resource management
systems
5
Availability and functionality of CBO's (social
networks)
5
Effectiveness of local leadership 5
Responsiveness of local government 5
Perception and awareness of climate related risks 2
Emergency preparedness 5
Demography Migration patterns 4
Perception of poverty 2
Period Event
Prior to 1940 First settlement in the swamps of Ankobra tributary; major
livelihood was cultivation of high yielding Xanthosoma variety
1940 – 1950s flooding resulting in relocation from river bank to high elevation
area- present location of community
access to settlement is by crossing tributaries of Ankobra
1950 – 1990s Major construction activities such as construction of link road from
northern part of Nzema east to community by government;
construction of access road and wood bridge to community by
private timber company; construction of class room blocks
1968;1987;2009;
2014
Major flooding events hits community
30
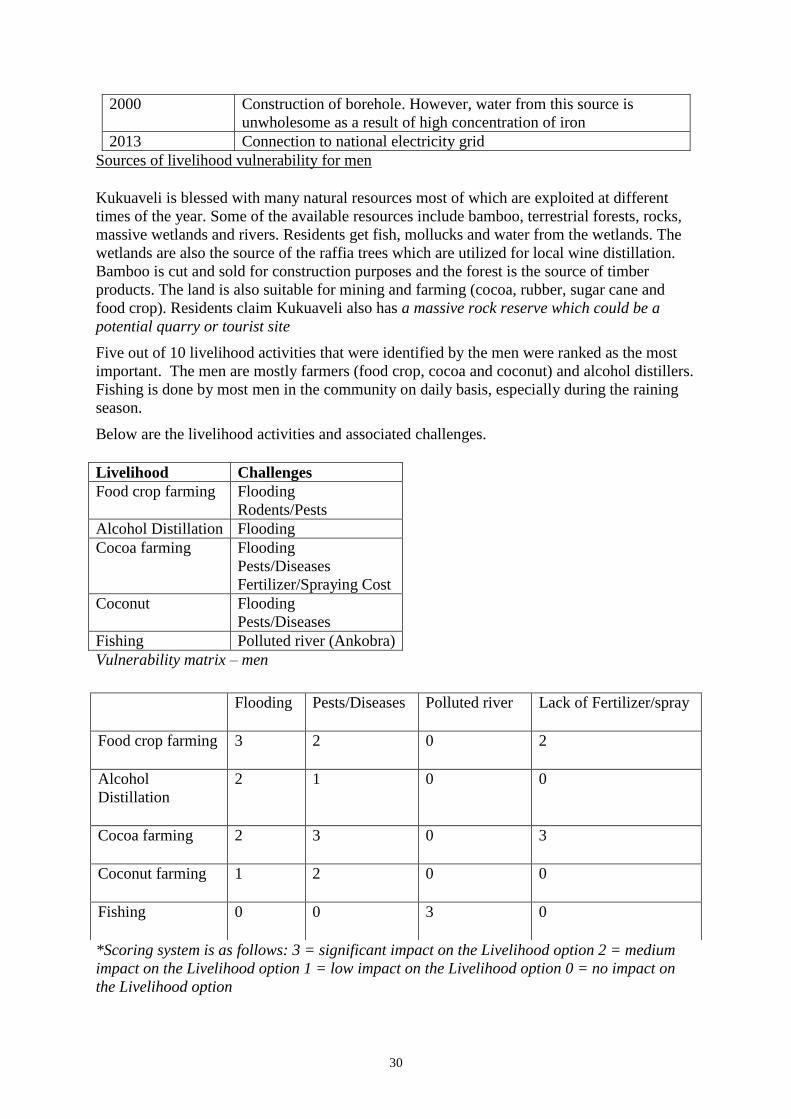
Sources of livelihood vulnerability for men
Kukuaveli is blessed with many natural resources most of which are exploited at different
times of the year. Some of the available resources include bamboo, terrestrial forests, rocks,
massive wetlands and rivers. Residents get fish, mollucks and water from the wetlands. The
wetlands are also the source of the raffia trees which are utilized for local wine distillation.
Bamboo is cut and sold for construction purposes and the forest is the source of timber
products. The land is also suitable for mining and farming (cocoa, rubber, sugar cane and
food crop). Residents claim Kukuaveli also has a massive rock reserve which could be a
potential quarry or tourist site
Five out of 10 livelihood activities that were identified by the men were ranked as the most
important. The men are mostly farmers (food crop, cocoa and coconut) and alcohol distillers.
Fishing is done by most men in the community on daily basis, especially during the raining
season.
Below are the livelihood activities and associated challenges.
Livelihood Challenges
Food crop farming Flooding
Rodents/Pests
Alcohol Distillation Flooding
Cocoa farming Flooding
Pests/Diseases
Fertilizer/Spraying Cost
Coconut Flooding
Pests/Diseases
Fishing Polluted river (Ankobra)
Vulnerability matrix – men
*Scoring system is as follows: 3 = significant impact on the Livelihood option 2 = medium
impact on the Livelihood option 1 = low impact on the Livelihood option 0 = no impact on
the Livelihood option
2000 Construction of borehole. However, water from this source is
unwholesome as a result of high concentration of iron
2013 Connection to national electricity grid
Flooding Pests/Diseases Polluted river Lack of Fertilizer/spray
Food crop farming 3 2 0 2
Alcohol
Distillation
2 1 0 0
Cocoa farming 2 3 0 3
Coconut farming 1 2 0 0
Fishing 0 0 3 0
31
Four most important hazards to the livelihoods of the men were identified as flooding, pests
and diseases, pollution (Ankobra River) and lack of funds for servicing farms. Four out of the
five livelihood activities (except fishing) are impacted at varying degrees by flooding and
pests/diseases. This is compounded by the lack of funds to service cocoa and food crop farms
through the application of fertilizer and spraying of pesticides. Farmers are to some extent
able to control rodents like grasscutters by setting traps in the farms. The polluted Ankobra
River affects the fish catch. Residents attribute the turbid waters of the Ankobra to the
activities of illegal miners who operate upriver. The two other rivers in the community-
Fenven and Mamawili are the mainstay of most of the fishing activities since they are not
polluted.
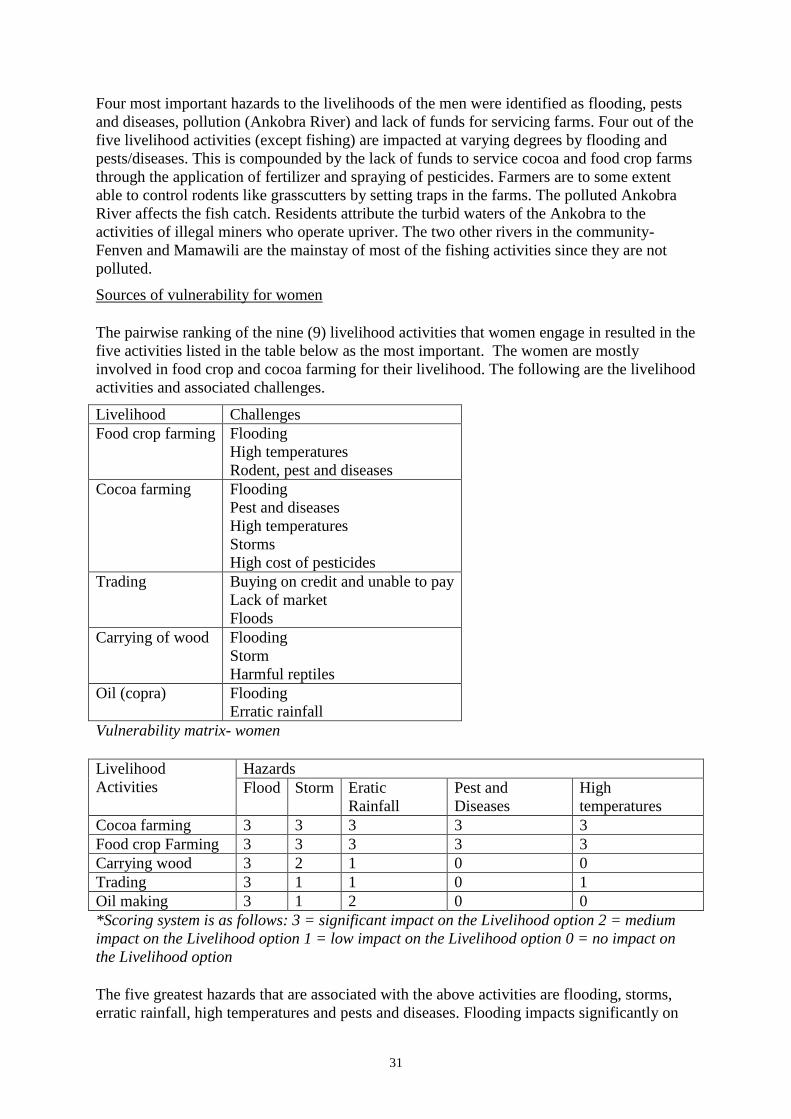
Sources of vulnerability for women
The pairwise ranking of the nine (9) livelihood activities that women engage in resulted in the
five activities listed in the table below as the most important. The women are mostly
involved in food crop and cocoa farming for their livelihood. The following are the livelihood
activities and associated challenges.
Livelihood Challenges
Food crop farming Flooding
High temperatures
Rodent, pest and diseases
Cocoa farming Flooding
Pest and diseases
High temperatures
Storms
High cost of pesticides
Trading Buying on credit and unable to pay
Lack of market
Floods
Carrying of wood Flooding
Storm
Harmful reptiles
Oil (copra) Flooding
Erratic rainfall
Vulnerability matrix- women
*Scoring system is as follows: 3 = significant impact on the Livelihood option 2 = medium
impact on the Livelihood option 1 = low impact on the Livelihood option 0 = no impact on
the Livelihood option
The five greatest hazards that are associated with the above activities are flooding, storms,
erratic rainfall, high temperatures and pests and diseases. Flooding impacts significantly on
Livelihood
Activities
Hazards
Flood Storm Eratic
Rainfall
Pest and
Diseases
High
temperatures
Cocoa farming 3 3 3 3 3
Food crop Farming 3 3 3 3 3
Carrying wood 3 2 1 0 0
Trading 3 1 1 0 1
Oil making 3 1 2 0 0
32
all the five major livelihood options women engage in. Storm and erratic rainfall also affect
all the five activities at varying degrees. Farmers are impacted more by high temperatures as
well as pests and diseases.
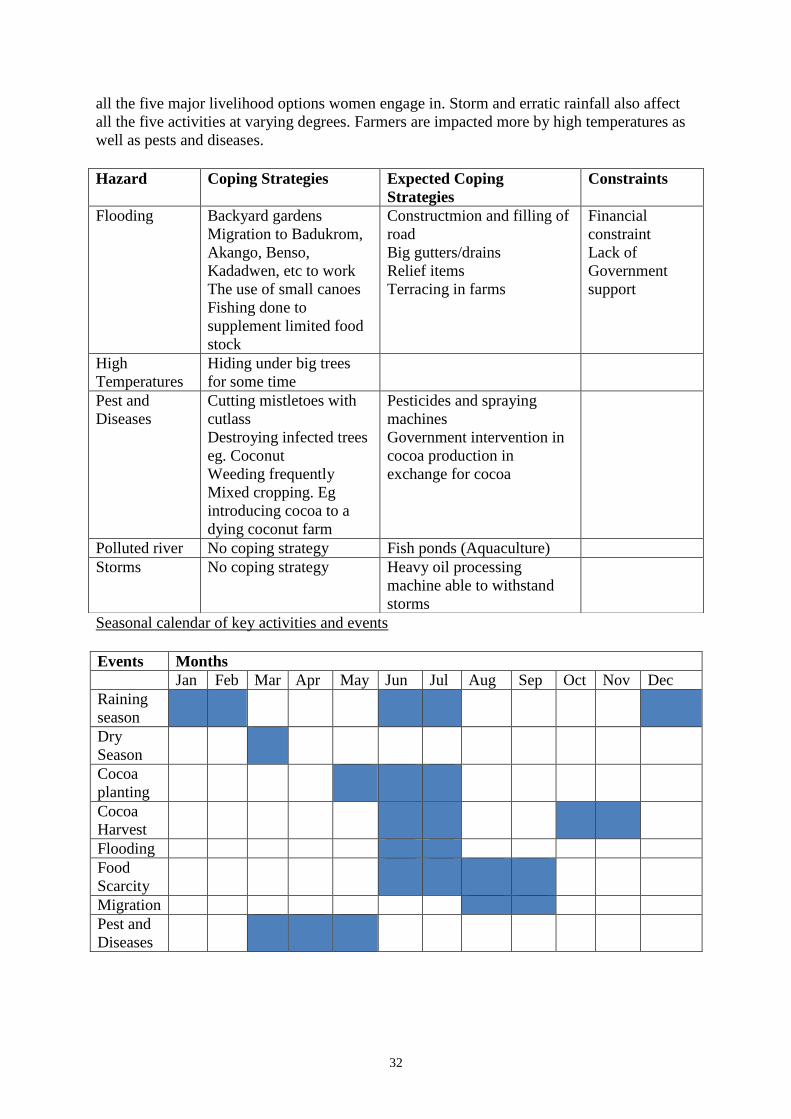
Seasonal calendar of key activities and events
Hazard Coping Strategies Expected Coping
Strategies
Constraints
Flooding Backyard gardens
Migration to Badukrom,
Akango, Benso,
Kadadwen, etc to work
The use of small canoes
Fishing done to
supplement limited food
stock
Constructmion and filling of
road
Big gutters/drains
Relief items
Terracing in farms
Financial
constraint
Lack of
Government
support
High
Temperatures
Hiding under big trees
for some time
Pest and
Diseases
Cutting mistletoes with
cutlass
Destroying infected trees
eg. Coconut
Weeding frequently
Mixed cropping. Eg
introducing cocoa to a
dying coconut farm
Pesticides and spraying
machines
Government intervention in
cocoa production in
exchange for cocoa
Polluted river No coping strategy Fish ponds (Aquaculture)
Storms No coping strategy Heavy oil processing
machine able to withstand
storms
Events Months
Jan Feb Mar Apr May Jun Jul Aug Sep Oct Nov Dec
Raining
season
Dry
Season
Cocoa
planting
Cocoa
Harvest
Flooding
Food
Scarcity
Migration
Pest and
Diseases
33
Rainfall in Kukuaveli is experienced two times in the year with the first one occurring from
June to July and the second from December through to February. The rainfall often results in
flooding which affects farms, houses, drinking water and makes movement very difficult.
The latter rain is followed quickly by the dry season. The dry season also marks the
beginning of a severe outbreak of pest and diseases which continues until May.
‘‘March is often dry with high temperatures that destroy our crops and dry up our drinking
water’’.
Fishing is done to supplement limited food stock during the periods of severe flooding
because with the flood comes abundance of fish. Individuals whose houses are on hilly
grounds do backyard farming to support their families. Children are prevented from going to
school and certain places during period of inundation.
‘’The floods are getting worse by the year. Attempts to cope with the floods by deepening
natural drains never worked’’
Cocoa in planted is from May to July and harvested twice in the year. The first harvest is
between June-July and the second is from October-November.
‘’The harvest coincides with the raining season which is also in June-July thus making cocoa
farming very difficult as we are unable to transport to the market centre’’.
With the flooding comes food scarcity that continues to September. To cope with the food
scarcity some individuals migrate to Badukrom, Akango, Benso and Kadadwen to work
between August and September after the rainfall.
Sanwoma
Physical hazards
Settlement
Sanwoma is comprises three nucleated settlement areas- Old site, New site and Anlo Village.
The new site is an emerging area to the north (across the Takoradi-Elubo road) of the original
settlement. The Anlo village on the other hand is an old settlement of migrant Ewe settlers.
Most of the buildings along the coast (old site and Anlo village) were built with local
materials including raffia, thatch, bamboo, and palm fronds. Buildings are mostly nucleated.
Smoking facilities are lined up along the coast for easy access and quick processing of the
fish from the landing sites. Most of these facilities are in groups and it includes the Cosmos
Energy funded fish smoking facility. Some individual fishmongers also have their smokers
close to their houses. Sanwoma is a major fishing community in this part of the region.
Road Network
Residents of Sanwoma have direct access to the first class N1 road which is in very good
condition. The settlement pattern also allows for the movement of vehicle in the sandy streets
that connect the coast to the main road during low tide. This makes transportation of fresh
and processed fish from the landing sites and processing facilities easy.
Drainage
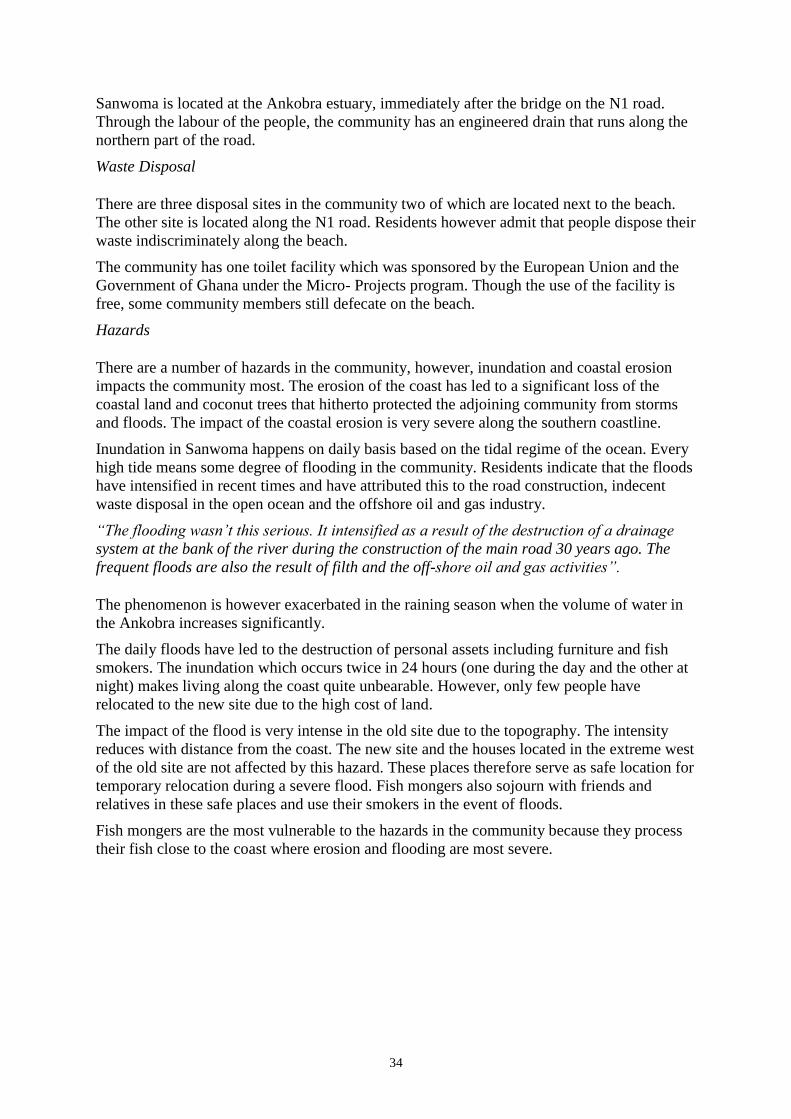
34
Sanwoma is located at the Ankobra estuary, immediately after the bridge on the N1 road.
Through the labour of the people, the community has an engineered drain that runs along the
northern part of the road.
Waste Disposal
There are three disposal sites in the community two of which are located next to the beach.
The other site is located along the N1 road. Residents however admit that people dispose their
waste indiscriminately along the beach.
The community has one toilet facility which was sponsored by the European Union and the
Government of Ghana under the Micro- Projects program. Though the use of the facility is
free, some community members still defecate on the beach.
Hazards
There are a number of hazards in the community, however, inundation and coastal erosion
impacts the community most. The erosion of the coast has led to a significant loss of the
coastal land and coconut trees that hitherto protected the adjoining community from storms
and floods. The impact of the coastal erosion is very severe along the southern coastline.
Inundation in Sanwoma happens on daily basis based on the tidal regime of the ocean. Every
high tide means some degree of flooding in the community. Residents indicate that the floods
have intensified in recent times and have attributed this to the road construction, indecent
waste disposal in the open ocean and the offshore oil and gas industry.
“The flooding wasn’t this serious. It intensified as a result of the destruction of a drainage
system at the bank of the river during the construction of the main road 30 years ago. The
frequent floods are also the result of filth and the off-shore oil and gas activities”.
The phenomenon is however exacerbated in the raining season when the volume of water in
the Ankobra increases significantly.
The daily floods have led to the destruction of personal assets including furniture and fish
smokers. The inundation which occurs twice in 24 hours (one during the day and the other at
night) makes living along the coast quite unbearable. However, only few people have
relocated to the new site due to the high cost of land.
The impact of the flood is very intense in the old site due to the topography. The intensity
reduces with distance from the coast. The new site and the houses located in the extreme west
of the old site are not affected by this hazard. These places therefore serve as safe location for
temporary relocation during a severe flood. Fish mongers also sojourn with friends and
relatives in these safe places and use their smokers in the event of floods.
Fish mongers are the most vulnerable to the hazards in the community because they process
their fish close to the coast where erosion and flooding are most severe.
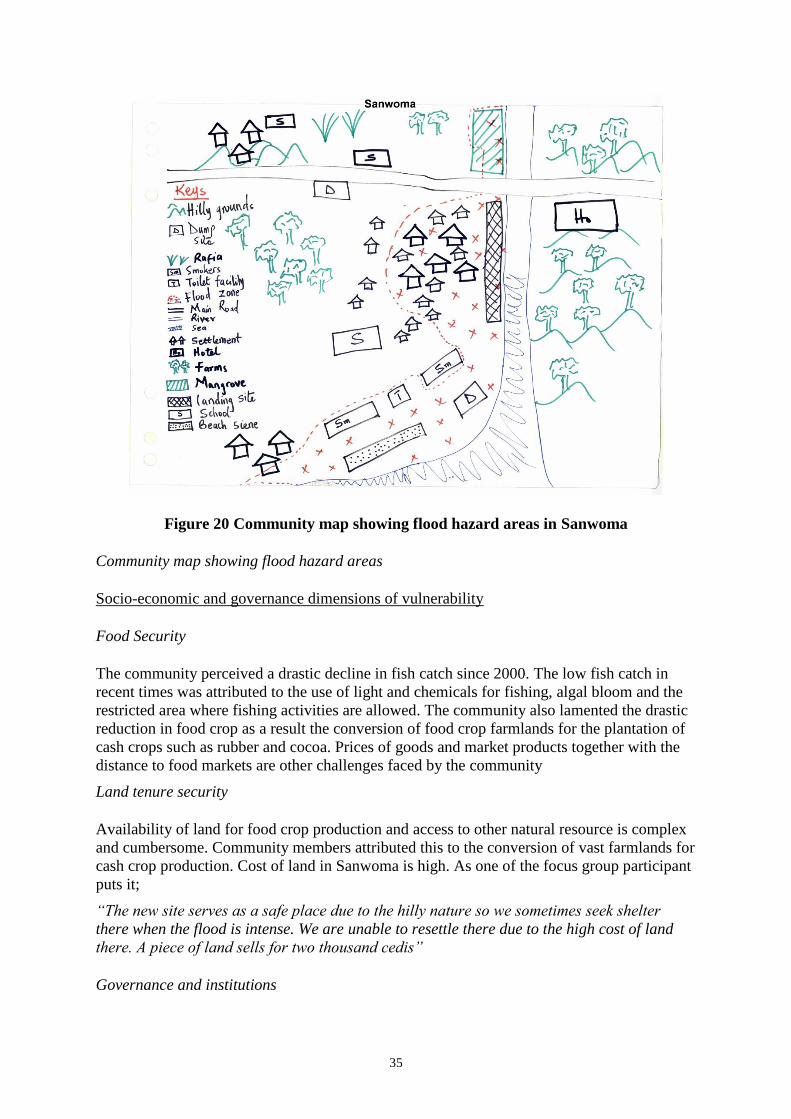
35
Figure 20 Community map showing flood hazard areas in Sanwoma
Community map showing flood hazard areas
Socio-economic and governance dimensions of vulnerability
Food Security
The community perceived a drastic decline in fish catch since 2000. The low fish catch in
recent times was attributed to the use of light and chemicals for fishing, algal bloom and the
restricted area where fishing activities are allowed. The community also lamented the drastic
reduction in food crop as a result the conversion of food crop farmlands for the plantation of
cash crops such as rubber and cocoa. Prices of goods and market products together with the
distance to food markets are other challenges faced by the community
Land tenure security
Availability of land for food crop production and access to other natural resource is complex
and cumbersome. Community members attributed this to the conversion of vast farmlands for
cash crop production. Cost of land in Sanwoma is high. As one of the focus group participant
puts it;
“The new site serves as a safe place due to the hilly nature so we sometimes seek shelter
there when the flood is intense. We are unable to resettle there due to the high cost of land
there. A piece of land sells for two thousand cedis”
Governance and institutions
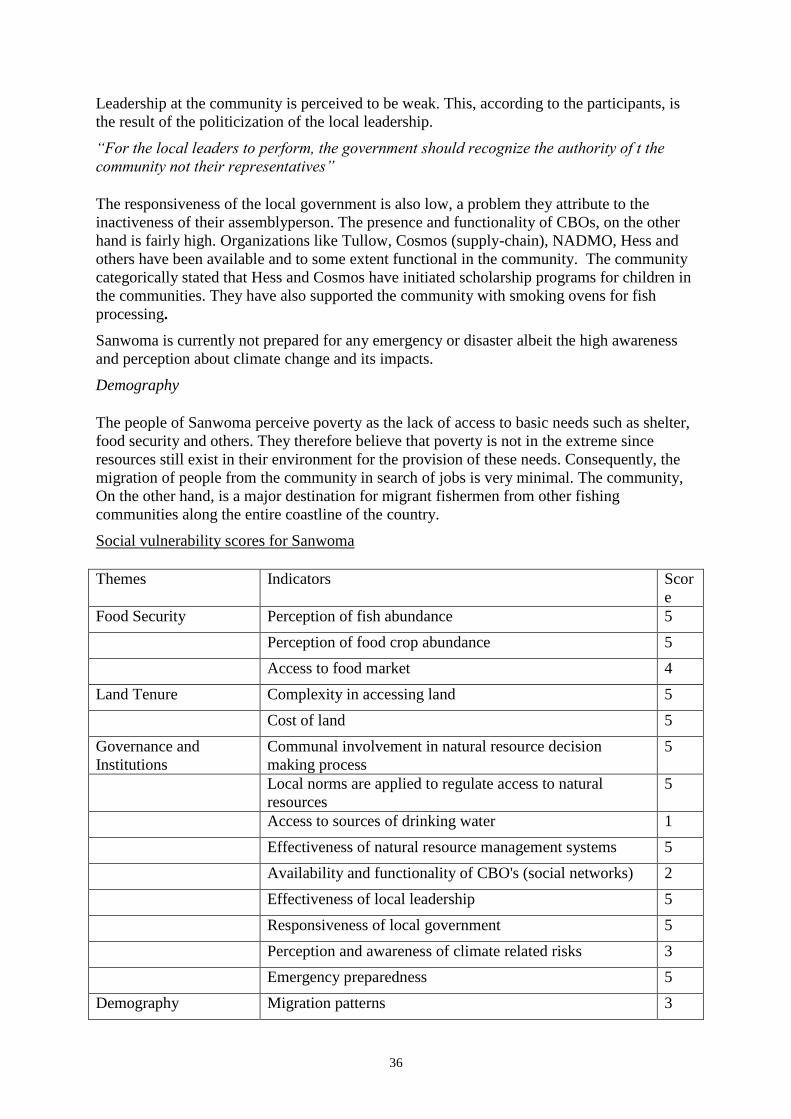
36
Leadership at the community is perceived to be weak. This, according to the participants, is
the result of the politicization of the local leadership.
“For the local leaders to perform, the government should recognize the authority of t the
community not their representatives”
The responsiveness of the local government is also low, a problem they attribute to the
inactiveness of their assemblyperson. The presence and functionality of CBOs, on the other
hand is fairly high. Organizations like Tullow, Cosmos (supply-chain), NADMO, Hess and
others have been available and to some extent functional in the community. The community
categorically stated that Hess and Cosmos have initiated scholarship programs for children in
the communities. They have also supported the community with smoking ovens for fish
processing.
Sanwoma is currently not prepared for any emergency or disaster albeit the high awareness
and perception about climate change and its impacts.
Demography
The people of Sanwoma perceive poverty as the lack of access to basic needs such as shelter,
food security and others. They therefore believe that poverty is not in the extreme since
resources still exist in their environment for the provision of these needs. Consequently, the
migration of people from the community in search of jobs is very minimal. The community,
On the other hand, is a major destination for migrant fishermen from other fishing
communities along the entire coastline of the country.
Social vulnerability scores for Sanwoma
Themes Indicators Scor
e
Food Security Perception of fish abundance 5
Perception of food crop abundance 5
Access to food market 4
Land Tenure Complexity in accessing land 5
Cost of land 5
Governance and
Institutions
Communal involvement in natural resource decision
making process
5
Local norms are applied to regulate access to natural
resources
5
Access to sources of drinking water 1
Effectiveness of natural resource management systems 5
Availability and functionality of CBO's (social networks) 2
Effectiveness of local leadership 5
Responsiveness of local government 5
Perception and awareness of climate related risks 3
Emergency preparedness 5
Demography Migration patterns 3
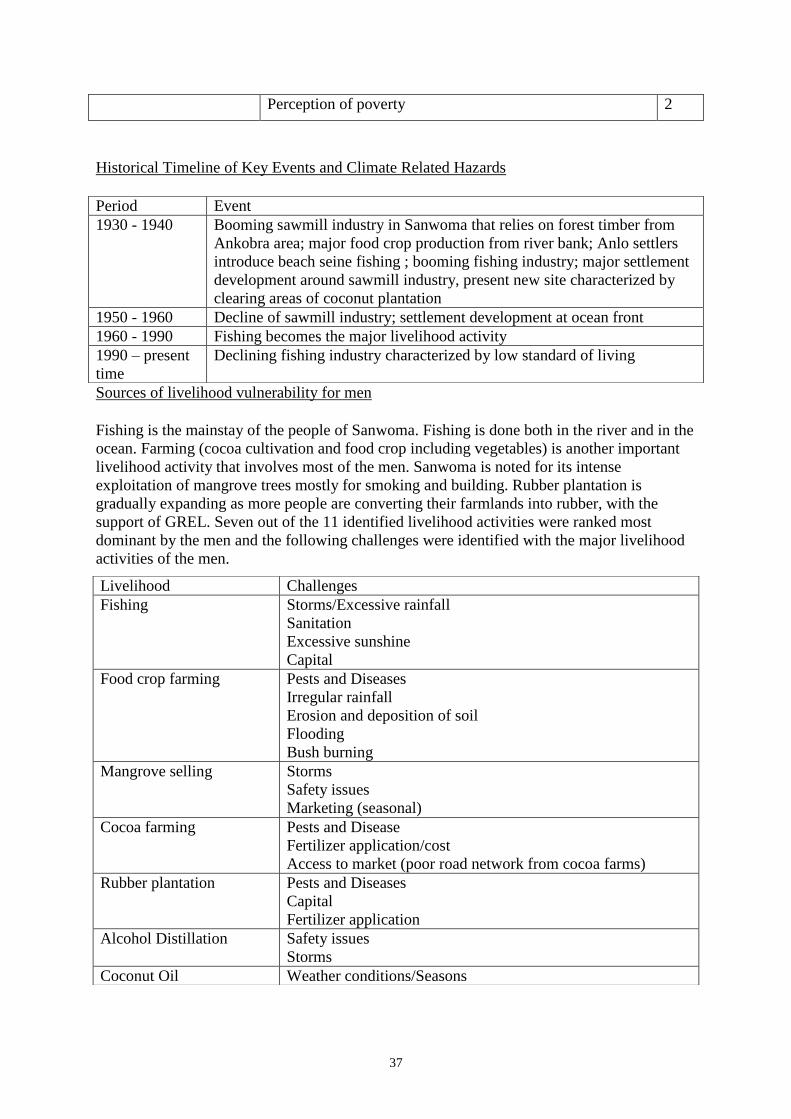
37
Perception of poverty 2
Historical Timeline of Key Events and Climate Related Hazards
Sources of livelihood vulnerability for men
Fishing is the mainstay of the people of Sanwoma. Fishing is done both in the river and in the
ocean. Farming (cocoa cultivation and food crop including vegetables) is another important
livelihood activity that involves most of the men. Sanwoma is noted for its intense
exploitation of mangrove trees mostly for smoking and building. Rubber plantation is
gradually expanding as more people are converting their farmlands into rubber, with the
support of GREL. Seven out of the 11 identified livelihood activities were ranked most
dominant by the men and the following challenges were identified with the major livelihood
activities of the men.
Period Event
1930 - 1940 Booming sawmill industry in Sanwoma that relies on forest timber from
Ankobra area; major food crop production from river bank; Anlo settlers
introduce beach seine fishing ; booming fishing industry; major settlement
development around sawmill industry, present new site characterized by
clearing areas of coconut plantation
1950 - 1960 Decline of sawmill industry; settlement development at ocean front
1960 - 1990 Fishing becomes the major livelihood activity
1990 – present
time
Declining fishing industry characterized by low standard of living
Livelihood Challenges
Fishing Storms/Excessive rainfall
Sanitation
Excessive sunshine
Capital
Food crop farming Pests and Diseases
Irregular rainfall
Erosion and deposition of soil
Flooding
Bush burning
Mangrove selling Storms
Safety issues
Marketing (seasonal)
Cocoa farming Pests and Disease
Fertilizer application/cost
Access to market (poor road network from cocoa farms)
Rubber plantation Pests and Diseases
Capital
Fertilizer application
Alcohol Distillation Safety issues
Storms
Coconut Oil Weather conditions/Seasons
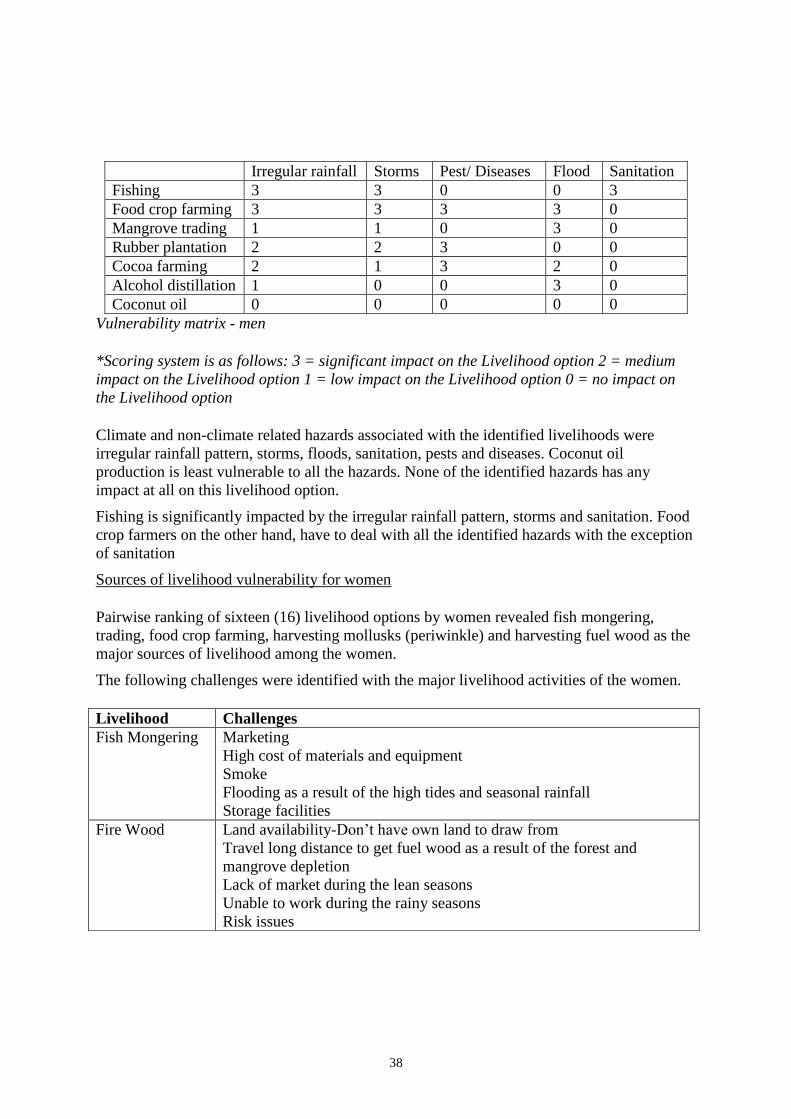
38
Vulnerability matrix - men
*Scoring system is as follows: 3 = significant impact on the Livelihood option 2 = medium
impact on the Livelihood option 1 = low impact on the Livelihood option 0 = no impact on
the Livelihood option
Climate and non-climate related hazards associated with the identified livelihoods were
irregular rainfall pattern, storms, floods, sanitation, pests and diseases. Coconut oil
production is least vulnerable to all the hazards. None of the identified hazards has any
impact at all on this livelihood option.
Fishing is significantly impacted by the irregular rainfall pattern, storms and sanitation. Food
crop farmers on the other hand, have to deal with all the identified hazards with the exception
of sanitation
Sources of livelihood vulnerability for women
Pairwise ranking of sixteen (16) livelihood options by women revealed fish mongering,
trading, food crop farming, harvesting mollusks (periwinkle) and harvesting fuel wood as the
major sources of livelihood among the women.
The following challenges were identified with the major livelihood activities of the women.
Irregular rainfall Storms Pest/ Diseases Flood Sanitation
Fishing 3 3 0 0 3
Food crop farming 3 3 3 3 0
Mangrove trading 1 1 0 3 0
Rubber plantation 2 2 3 0 0
Cocoa farming 2 1 3 2 0
Alcohol distillation 1 0 0 3 0
Coconut oil 0 0 0 0 0
Livelihood Challenges
Fish Mongering Marketing
High cost of materials and equipment
Smoke
Flooding as a result of the high tides and seasonal rainfall
Storage facilities
Fire Wood Land availability-Don’t have own land to draw from
Travel long distance to get fuel wood as a result of the forest and
mangrove depletion
Lack of market during the lean seasons
Unable to work during the rainy seasons
Risk issues
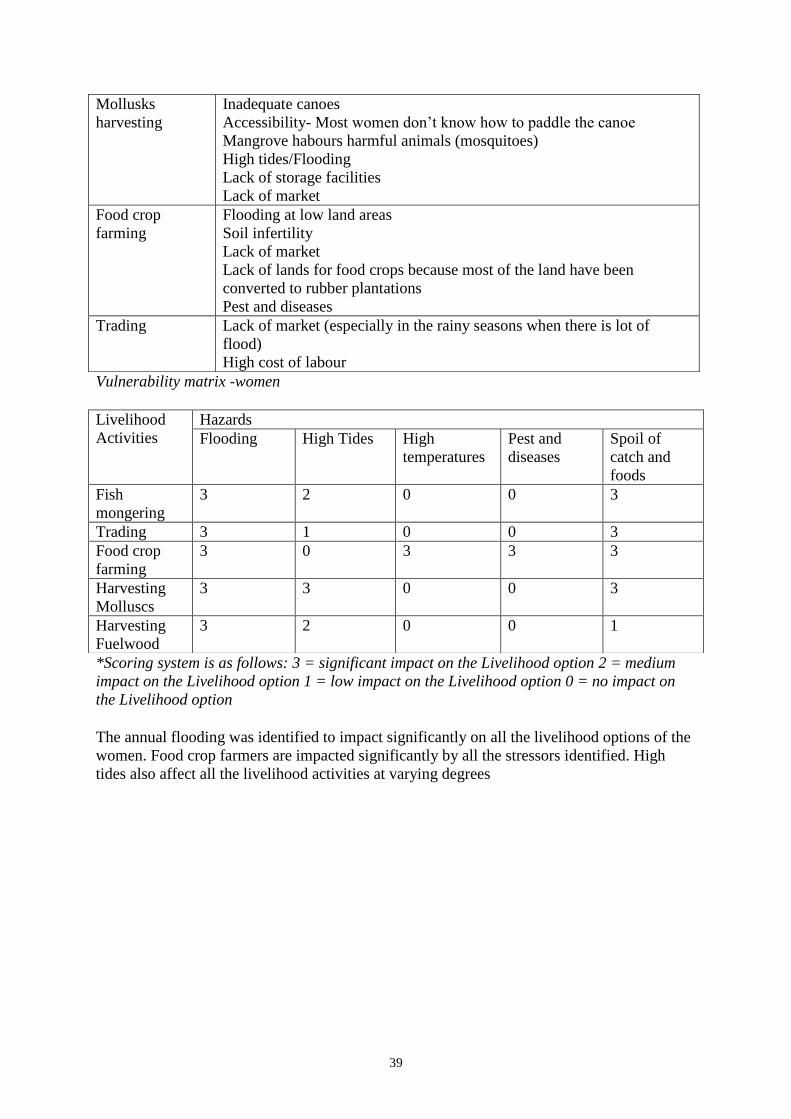
39
Vulnerability matrix -women
*Scoring system is as follows: 3 = significant impact on the Livelihood option 2 = medium
impact on the Livelihood option 1 = low impact on the Livelihood option 0 = no impact on
the Livelihood option
The annual flooding was identified to impact significantly on all the livelihood options of the
women. Food crop farmers are impacted significantly by all the stressors identified. High
tides also affect all the livelihood activities at varying degrees
Mollusks
harvesting
Inadequate canoes
Accessibility- Most women don’t know how to paddle the canoe
Mangrove habours harmful animals (mosquitoes)
High tides/Flooding
Lack of storage facilities
Lack of market
Food crop
farming
Flooding at low land areas
Soil infertility
Lack of market
Lack of lands for food crops because most of the land have been
converted to rubber plantations
Pest and diseases
Trading Lack of market (especially in the rainy seasons when there is lot of
flood)
High cost of labour
Livelihood
Activities
Hazards
Flooding High Tides High
temperatures
Pest and
diseases
Spoil of
catch and
foods
Fish
mongering
3 2 0 0 3
Trading 3 1 0 0 3
Food crop
farming
3 0 3 3 3
Harvesting
Molluscs
3 3 0 0 3
Harvesting
Fuelwood
3 2 0 0 1
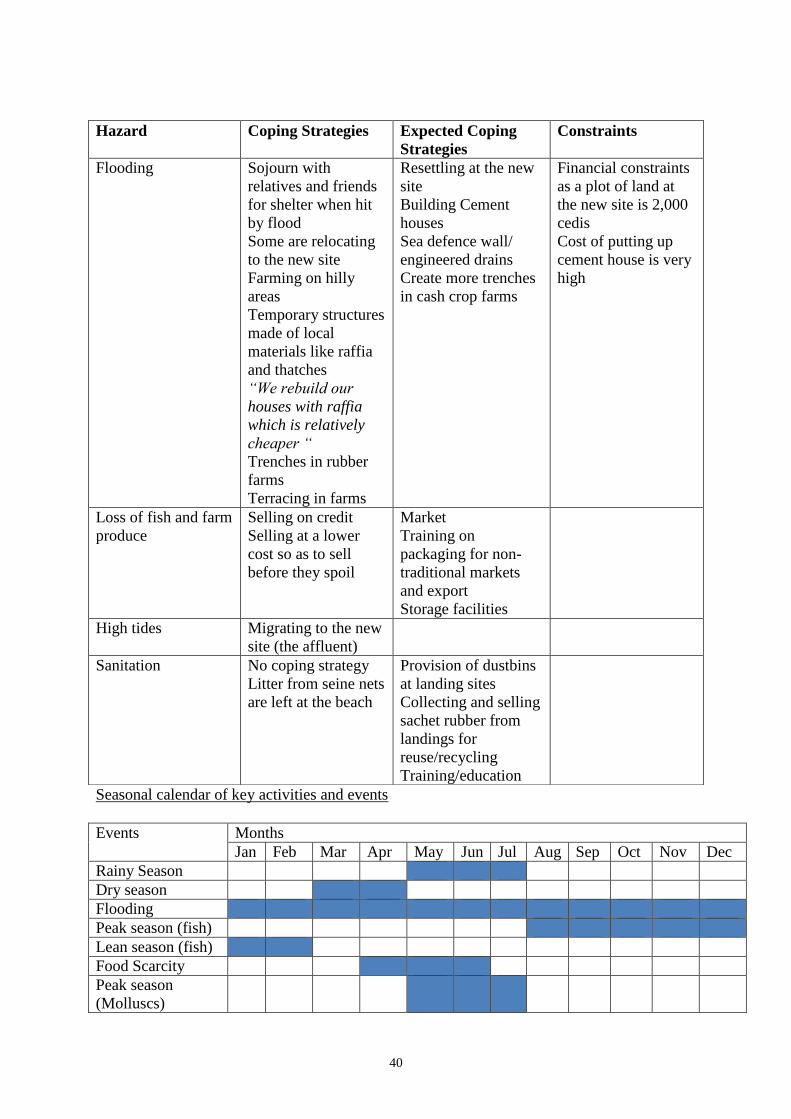
40
Seasonal calendar of key activities and events
Hazard Coping Strategies Expected Coping
Strategies
Constraints
Flooding Sojourn with
relatives and friends
for shelter when hit
by flood
Some are relocating
to the new site
Farming on hilly
areas
Temporary structures
made of local
materials like raffia
and thatches
“We rebuild our
houses with raffia
which is relatively
cheaper “
Trenches in rubber
farms
Terracing in farms
Resettling at the new
site
Building Cement
houses
Sea defence wall/
engineered drains
Create more trenches
in cash crop farms
Financial constraints
as a plot of land at
the new site is 2,000
cedis
Cost of putting up
cement house is very
high
Loss of fish and farm
produce
Selling on credit
Selling at a lower
cost so as to sell
before they spoil
Market
Training on
packaging for non-
traditional markets
and export
Storage facilities
High tides Migrating to the new
site (the affluent)
Sanitation No coping strategy
Litter from seine nets
are left at the beach
Provision of dustbins
at landing sites
Collecting and selling
sachet rubber from
landings for
reuse/recycling
Training/education
Events Months
Jan Feb Mar Apr May Jun Jul Aug Sep Oct Nov Dec
Rainy Season
Dry season
Flooding
Peak season (fish)
Lean season (fish)
Food Scarcity
Peak season
(Molluscs)
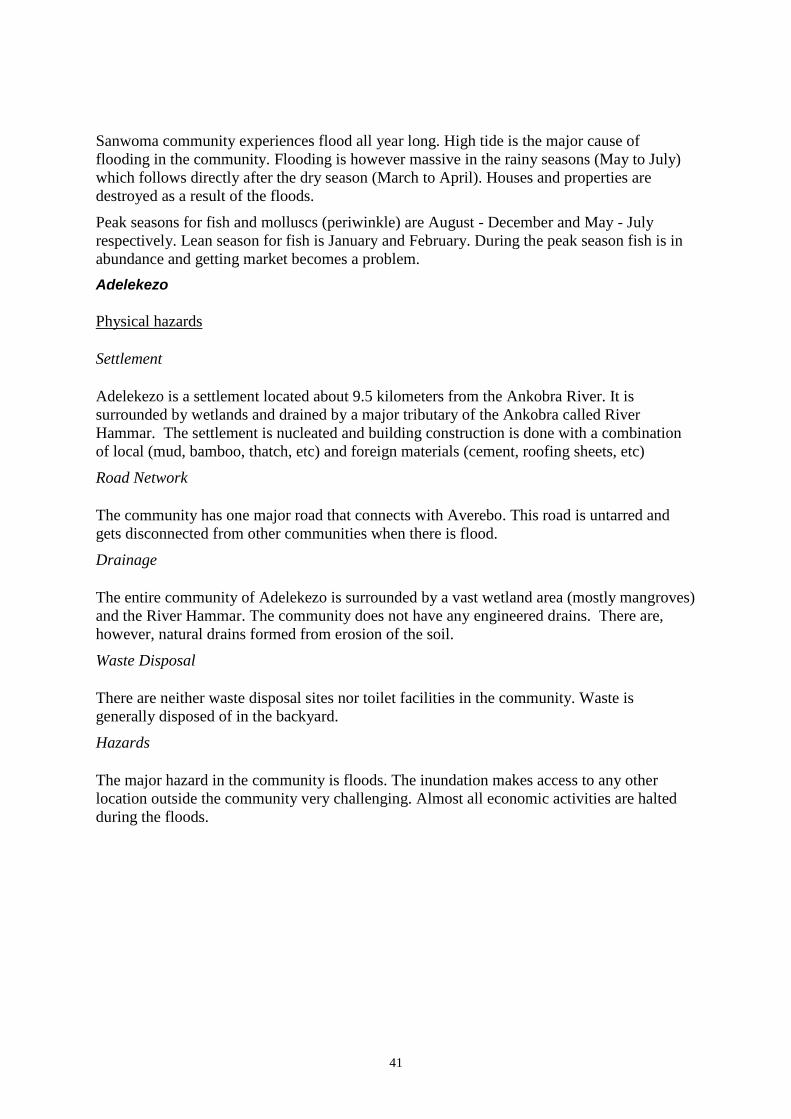
41
Sanwoma community experiences flood all year long. High tide is the major cause of
flooding in the community. Flooding is however massive in the rainy seasons (May to July)
which follows directly after the dry season (March to April). Houses and properties are
destroyed as a result of the floods.
Peak seasons for fish and molluscs (periwinkle) are August - December and May - July
respectively. Lean season for fish is January and February. During the peak season fish is in
abundance and getting market becomes a problem.
Adelekezo
Physical hazards
Settlement
Adelekezo is a settlement located about 9.5 kilometers from the Ankobra River. It is
surrounded by wetlands and drained by a major tributary of the Ankobra called River
Hammar. The settlement is nucleated and building construction is done with a combination
of local (mud, bamboo, thatch, etc) and foreign materials (cement, roofing sheets, etc)
Road Network
The community has one major road that connects with Averebo. This road is untarred and
gets disconnected from other communities when there is flood.
Drainage
The entire community of Adelekezo is surrounded by a vast wetland area (mostly mangroves)
and the River Hammar. The community does not have any engineered drains. There are,
however, natural drains formed from erosion of the soil.
Waste Disposal
There are neither waste disposal sites nor toilet facilities in the community. Waste is
generally disposed of in the backyard.
Hazards
The major hazard in the community is floods. The inundation makes access to any other
location outside the community very challenging. Almost all economic activities are halted
during the floods.
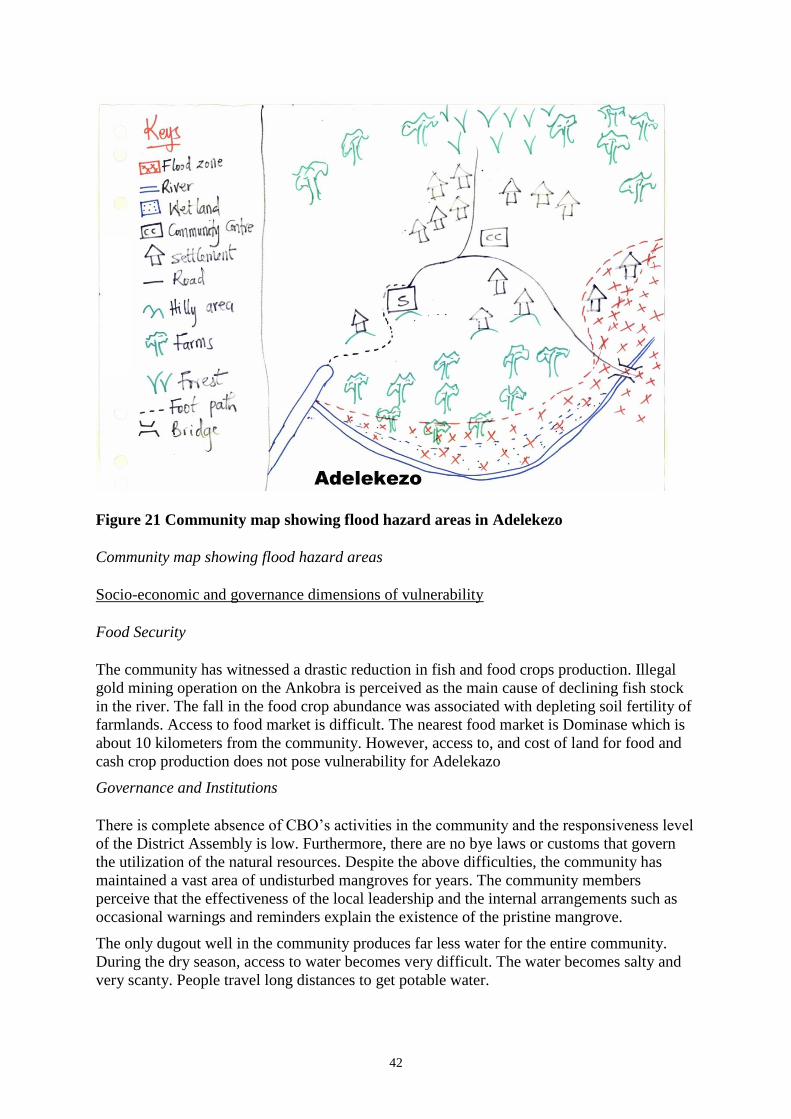
42
Figure 21 Community map showing flood hazard areas in Adelekezo
Community map showing flood hazard areas
Socio-economic and governance dimensions of vulnerability
Food Security
The community has witnessed a drastic reduction in fish and food crops production. Illegal
gold mining operation on the Ankobra is perceived as the main cause of declining fish stock
in the river. The fall in the food crop abundance was associated with depleting soil fertility of
farmlands. Access to food market is difficult. The nearest food market is Dominase which is
about 10 kilometers from the community. However, access to, and cost of land for food and
cash crop production does not pose vulnerability for Adelekazo
Governance and Institutions
There is complete absence of CBO’s activities in the community and the responsiveness level
of the District Assembly is low. Furthermore, there are no bye laws or customs that govern
the utilization of the natural resources. Despite the above difficulties, the community has
maintained a vast area of undisturbed mangroves for years. The community members
perceive that the effectiveness of the local leadership and the internal arrangements such as
occasional warnings and reminders explain the existence of the pristine mangrove.
The only dugout well in the community produces far less water for the entire community.
During the dry season, access to water becomes very difficult. The water becomes salty and
very scanty. People travel long distances to get potable water.
43
Perceptions about climate change and its impacts were relatively high among the community
members. This, according to the focus group participants, is evidenced by the change in
rainfall patterns. The community however, does not have any proactive measures or capacity
to curb or combat any emerging disaster. Migration among the youth in particular is
relatively high. This happens often before the raining season when individuals leave to
engage in menial work to earn their living elsewhere. Members of the community don’t
perceive themselves as poor, despite the many challenges they have to deal will. They
however believe that the current condition can best be described as hardship.
Social vulnerability scores for Adelekezo
Historical Timeline of Key Events and Climate Related Hazards
Sources of livelihood vulnerability for men
The major livelihood activities identified with the men were ranked as follows using pairwise
ranking method; Alcohol distillation, followed by fishing and illegal mining activities
(galamsey), food crop farming, coconut and palm tree farming. Interestingly, the people of
Adelekezo do not exploit mangroves at all. The large stretch of mangroves (about 10 km
from the confluence with Ankobra) looks pristine and undisturbed. The residents don’t seem
to know the importance and value of this ecosystem. The following challenges were
identified with the major livelihood activities of the men.
Themes Indicators Score
Food Security Perception of fish abundance 5
Perception of food crop abundance 5
Access to food market 4
Land Tenure Complexity in accessing land 1
Cost of land 1
Governance and
Institutions
Communal involvement in natural resource decision
making process
5
Local norms are applied to regulate access to natural
resources
5
Access to sources of drinking water 5
Effectiveness of natural resource management systems 5
Availability and functionality of CBO's (social networks) 5
Effectiveness of local leadership 2
Responsiveness of local government 5
Perception and awareness of climate related risks 2
Emergency preparedness 5
Demography Migration patterns 2
Perception of poverty 3
Period Event
1968;1987;2009 Major flooding event resulting in destruction of settlement and farmlands
1982 Incidence of cholera resulting in loss of more than 10 lives
Dry seasons Major water crisis hits community
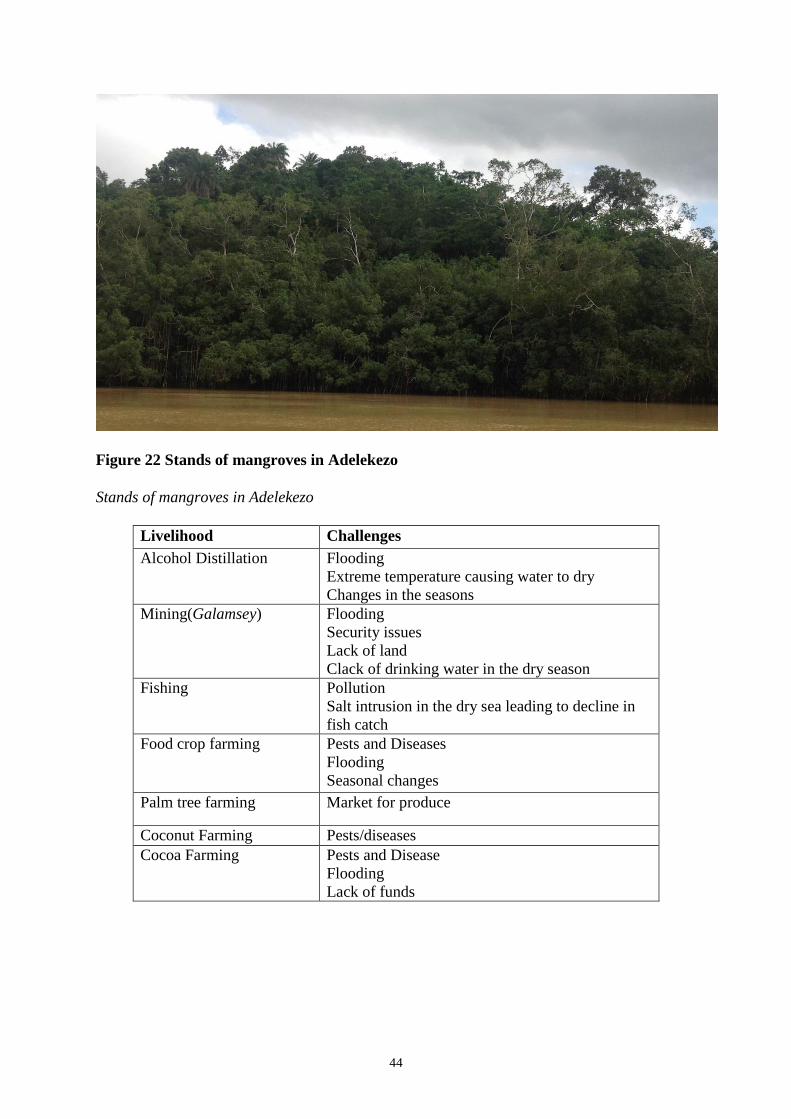
44
Figure 22 Stands of mangroves in Adelekezo
Stands of mangroves in Adelekezo
Livelihood Challenges
Alcohol Distillation Flooding
Extreme temperature causing water to dry
Changes in the seasons
Mining(Galamsey) Flooding
Security issues
Lack of land
Clack of drinking water in the dry season
Fishing Pollution
Salt intrusion in the dry sea leading to decline in
fish catch
Food crop farming Pests and Diseases
Flooding
Seasonal changes
Palm tree farming Market for produce
Coconut Farming Pests/diseases
Cocoa Farming Pests and Disease
Flooding
Lack of funds
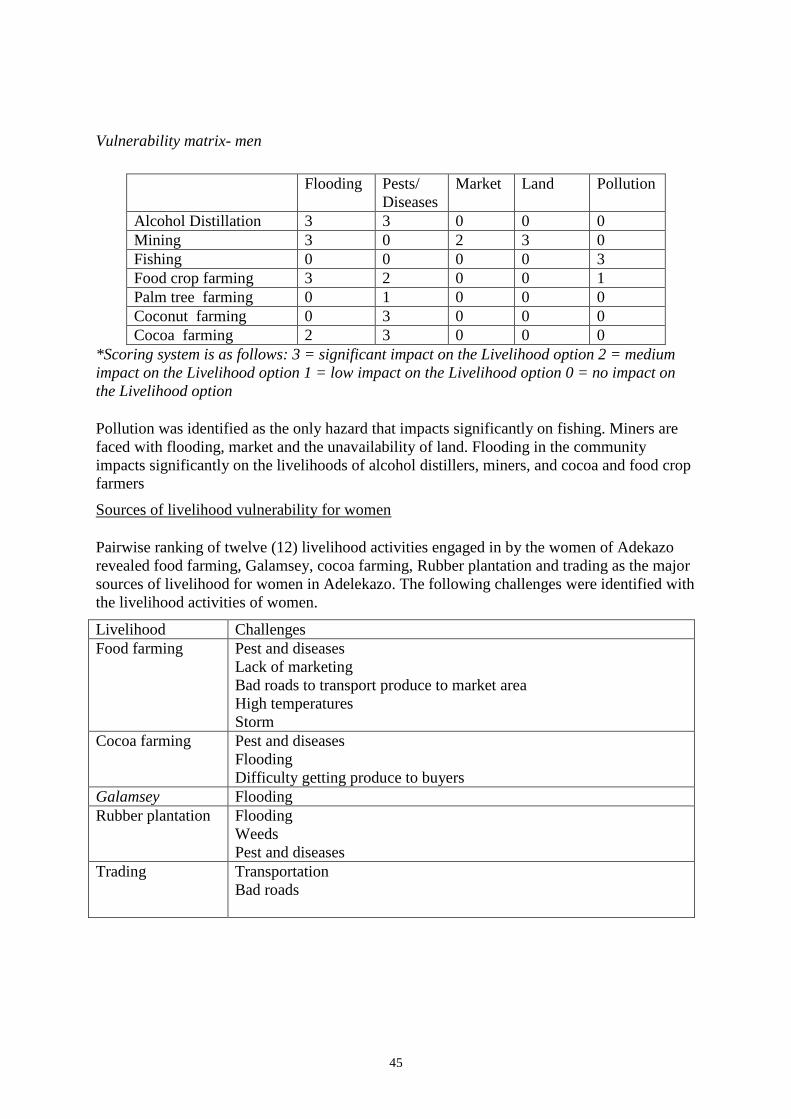
45
Vulnerability matrix- men
*Scoring system is as follows: 3 = significant impact on the Livelihood option 2 = medium
impact on the Livelihood option 1 = low impact on the Livelihood option 0 = no impact on
the Livelihood option
Pollution was identified as the only hazard that impacts significantly on fishing. Miners are
faced with flooding, market and the unavailability of land. Flooding in the community
impacts significantly on the livelihoods of alcohol distillers, miners, and cocoa and food crop
farmers
Sources of livelihood vulnerability for women
Pairwise ranking of twelve (12) livelihood activities engaged in by the women of Adekazo
revealed food farming, Galamsey, cocoa farming, Rubber plantation and trading as the major
sources of livelihood for women in Adelekazo. The following challenges were identified with
the livelihood activities of women.
Flooding Pests/
Diseases
Market Land Pollution
Alcohol Distillation 3 3 0 0 0
Mining 3 0 2 3 0
Fishing 0 0 0 0 3
Food crop farming 3 2 0 0 1
Palm tree farming 0 1 0 0 0
Coconut farming 0 3 0 0 0
Cocoa farming 2 3 0 0 0
Livelihood Challenges
Food farming Pest and diseases
Lack of marketing
Bad roads to transport produce to market area
High temperatures
Storm
Cocoa farming Pest and diseases
Flooding
Difficulty getting produce to buyers
Galamsey Flooding
Rubber plantation Flooding
Weeds
Pest and diseases
Trading Transportation
Bad roads
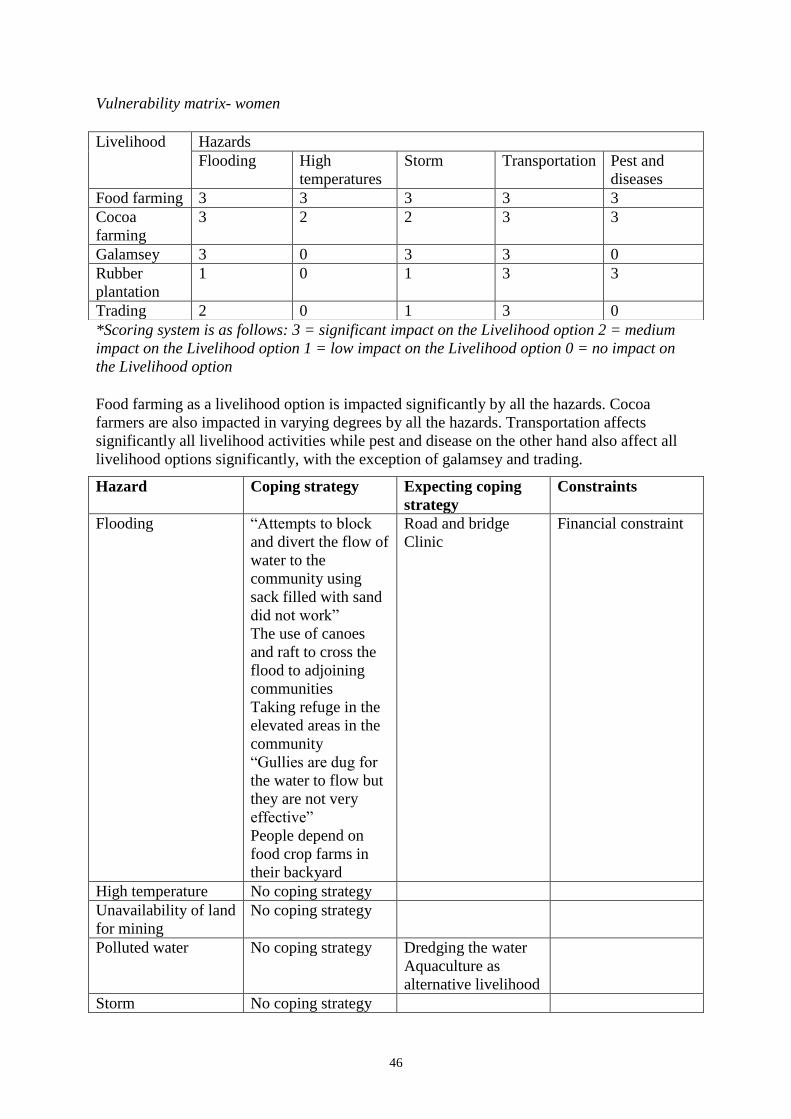
46
Vulnerability matrix- women
*Scoring system is as follows: 3 = significant impact on the Livelihood option 2 = medium
impact on the Livelihood option 1 = low impact on the Livelihood option 0 = no impact on
the Livelihood option
Food farming as a livelihood option is impacted significantly by all the hazards. Cocoa
farmers are also impacted in varying degrees by all the hazards. Transportation affects
significantly all livelihood activities while pest and disease on the other hand also affect all
livelihood options significantly, with the exception of galamsey and trading.
Hazard Coping strategy Expecting coping
strategy
Constraints
Flooding “Attempts to block
and divert the flow of
water to the
community using
sack filled with sand
did not work”
The use of canoes
and raft to cross the
flood to adjoining
communities
Taking refuge in the
elevated areas in the
community
“Gullies are dug for
the water to flow but
they are not very
effective”
People depend on
food crop farms in
their backyard
Road and bridge
Clinic
Financial constraint
High temperature No coping strategy
Unavailability of land
for mining
No coping strategy
Polluted water No coping strategy Dredging the water
Aquaculture as
alternative livelihood
Storm No coping strategy
Livelihood Hazards
Flooding High
temperatures
Storm Transportation Pest and
diseases
Food farming 3 3 3 3 3
Cocoa
farming
3 2 2 3 3
Galamsey 3 0 3 3 0
Rubber
plantation
1 0 1 3 3
Trading 2 0 1 3 0
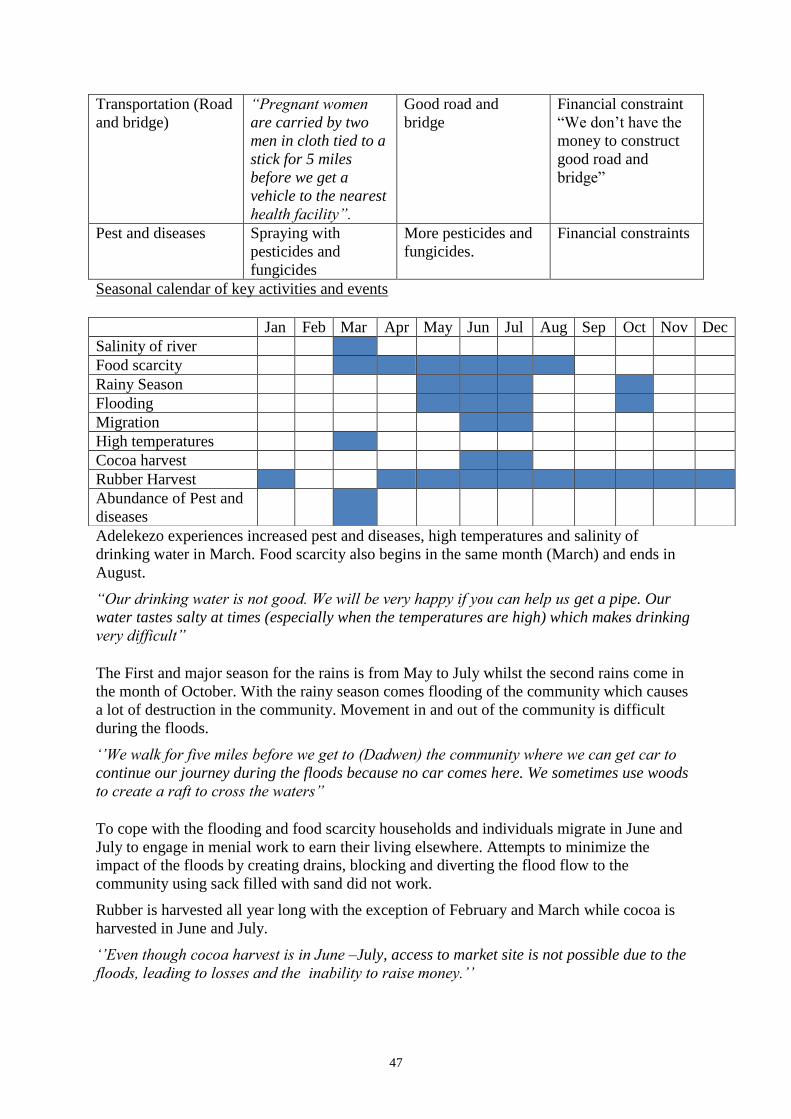
47
Transportation (Road
and bridge)
“Pregnant women
are carried by two
men in cloth tied to a
stick for 5 miles
before we get a
vehicle to the nearest
health facility”.
Good road and
bridge
Financial constraint
“We don’t have the
money to construct
good road and
bridge”
Pest and diseases Spraying with
pesticides and
fungicides
More pesticides and
fungicides.
Financial constraints
Seasonal calendar of key activities and events
Adelekezo experiences increased pest and diseases, high temperatures and salinity of
drinking water in March. Food scarcity also begins in the same month (March) and ends in
August.
“Our drinking water is not good. We will be very happy if you can help us get a pipe. Our
water tastes salty at times (especially when the temperatures are high) which makes drinking
very difficult”
The First and major season for the rains is from May to July whilst the second rains come in
the month of October. With the rainy season comes flooding of the community which causes
a lot of destruction in the community. Movement in and out of the community is difficult
during the floods.
‘’We walk for five miles before we get to (Dadwen) the community where we can get car to
continue our journey during the floods because no car comes here. We sometimes use woods
to create a raft to cross the waters”
To cope with the flooding and food scarcity households and individuals migrate in June and
July to engage in menial work to earn their living elsewhere. Attempts to minimize the
impact of the floods by creating drains, blocking and diverting the flood flow to the
community using sack filled with sand did not work.
Rubber is harvested all year long with the exception of February and March while cocoa is
harvested in June and July.
‘’Even though cocoa harvest is in June –July, access to market site is not possible due to the
floods, leading to losses and the inability to raise money.’’
Jan Feb Mar Apr May Jun Jul Aug Sep Oct Nov Dec
Salinity of river
Food scarcity
Rainy Season
Flooding
Migration
High temperatures
Cocoa harvest
Rubber Harvest
Abundance of Pest and
diseases
48
Ajomoro Eshiem
Physical hazards
Settlement
Ajomoro Eshiem is situated between Eziome and Kukuaveli, on the eastern bank of the
Ankobra River. Buildings are mostly nucleated and built with local materials. The elevation
of the Eshiem settlement is generally higher than the surrounding wetland areas
Road Network
Eshiem has one major road that connects the community to the main market in Domenase
through Kukuaveli. The graveled road is motorable in most part of the dry season. There are a
number of footpaths to nearby communities.
Drainage
In addition to the Ankobra River, the people of Eshiem have access to the Mamawili River
which is a tributary of Ankobra. There are no engineered drains in the community; however,
there are a number of natural drains which lead to the nearby wetlands
Waste Disposal
There are neither toilet facilities nor specific waste disposal sites in Eshiem. Residents admit
that waste is generally disposed of in the bushes and adjoining wetlands.
Hazards
The topography of the community coupled with the two adjacent rivers and their wetlands
make the residents of Eshiem susceptible to flooding. The settlement was built on top of a
small hill which drops gradually into the low lying wetlands which serve as reservoir for
water during the raining season. The flooding which is a yearly event was very severe in
1968, 1978, 2009 and 2013. The inundation makes access to any other location outside the
community very challenging. Almost all economic activities are affected in one way or the
other by the inundation which often takes long time to recede.
People cope in this situation by relocating temporarily with friends and relatives whose
houses are not affected by the hazard. Farmers who are able to harvest their crops before the
rains or flood share farm produce with relatives and friends. Other farmers who have
backyard gardens depend on the farm produce during the period. In some cases, traders from
surrounding communities take advantage of the flooding situation to sell food at high cost to
the people of Eshiem.
“Most vulnerable are the poor who are unable to buy food from the men from the Kuzaku
community during the flood”
Closely related to this hazard is the polluted water of the Ankobra River.
“The flood keeps getting worse with time and we believe the activities of galamsey operators
in the river is a contributing factor”
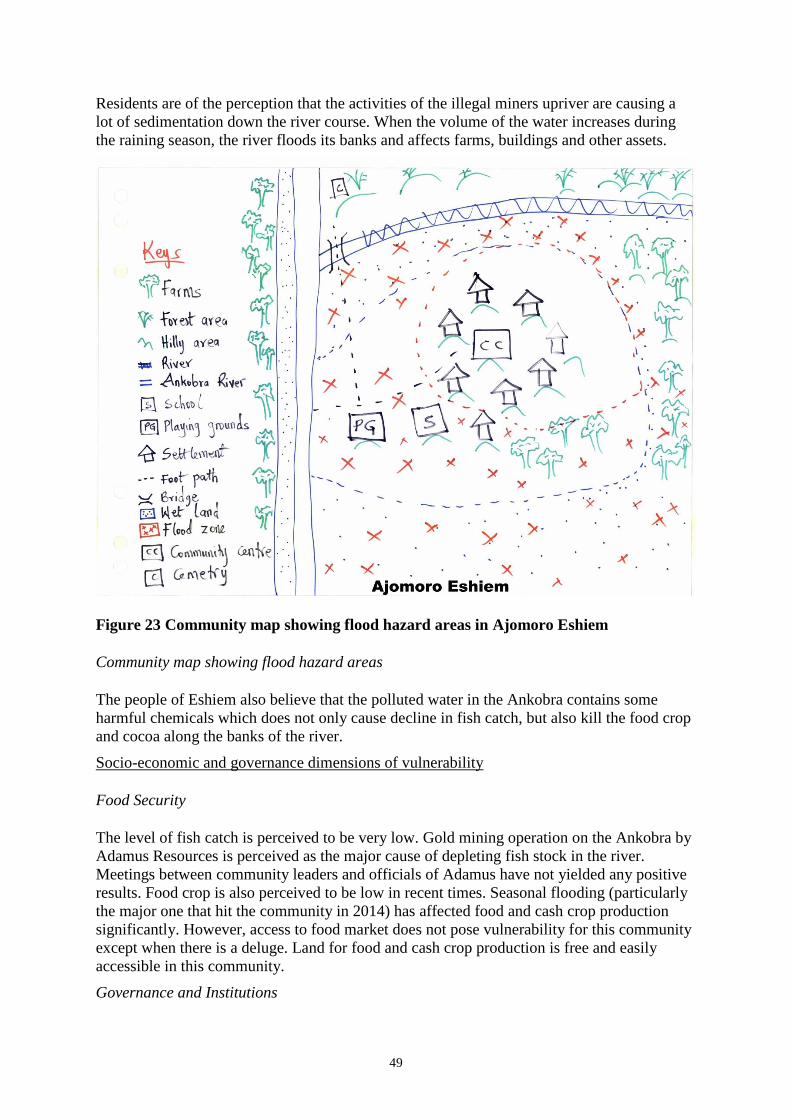
49
Residents are of the perception that the activities of the illegal miners upriver are causing a
lot of sedimentation down the river course. When the volume of the water increases during
the raining season, the river floods its banks and affects farms, buildings and other assets.
Figure 23 Community map showing flood hazard areas in Ajomoro Eshiem
Community map showing flood hazard areas
The people of Eshiem also believe that the polluted water in the Ankobra contains some
harmful chemicals which does not only cause decline in fish catch, but also kill the food crop
and cocoa along the banks of the river.
Socio-economic and governance dimensions of vulnerability
Food Security
The level of fish catch is perceived to be very low. Gold mining operation on the Ankobra by
Adamus Resources is perceived as the major cause of depleting fish stock in the river.
Meetings between community leaders and officials of Adamus have not yielded any positive
results. Food crop is also perceived to be low in recent times. Seasonal flooding (particularly
the major one that hit the community in 2014) has affected food and cash crop production
significantly. However, access to food market does not pose vulnerability for this community
except when there is a deluge. Land for food and cash crop production is free and easily
accessible in this community.
Governance and Institutions
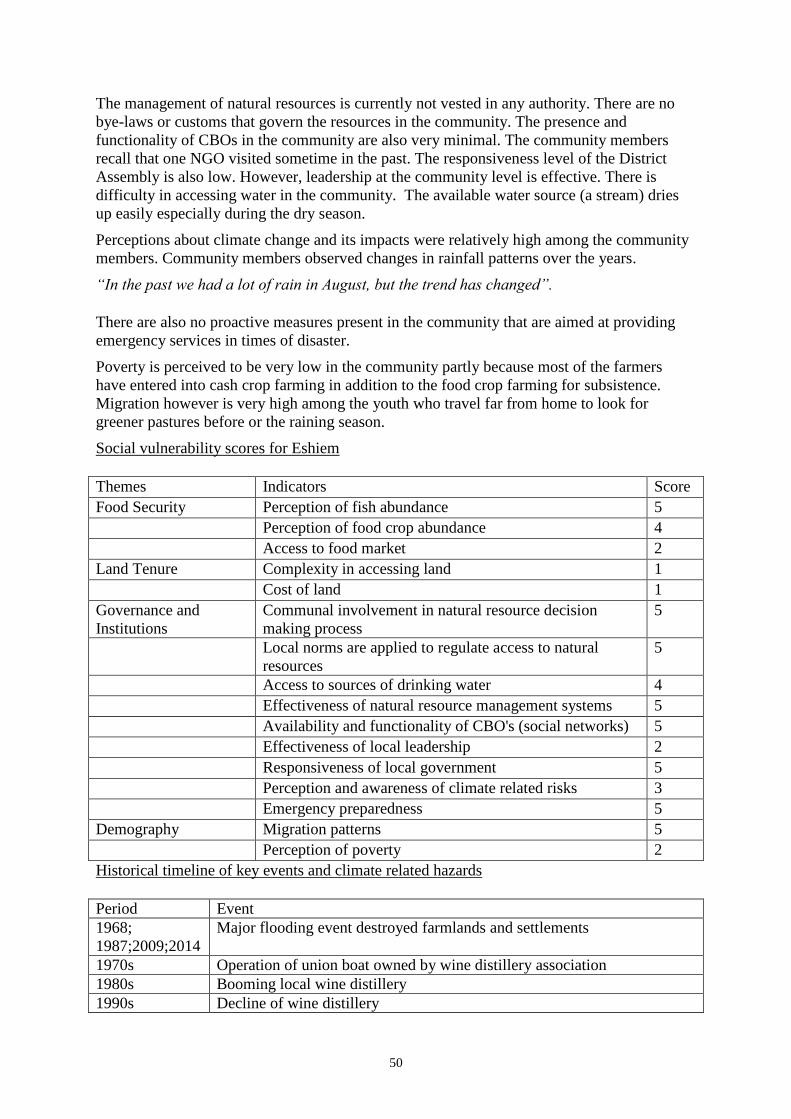
50
The management of natural resources is currently not vested in any authority. There are no
bye-laws or customs that govern the resources in the community. The presence and
functionality of CBOs in the community are also very minimal. The community members
recall that one NGO visited sometime in the past. The responsiveness level of the District
Assembly is also low. However, leadership at the community level is effective. There is
difficulty in accessing water in the community. The available water source (a stream) dries
up easily especially during the dry season.
Perceptions about climate change and its impacts were relatively high among the community
members. Community members observed changes in rainfall patterns over the years.
“In the past we had a lot of rain in August, but the trend has changed”.
There are also no proactive measures present in the community that are aimed at providing
emergency services in times of disaster.
Poverty is perceived to be very low in the community partly because most of the farmers
have entered into cash crop farming in addition to the food crop farming for subsistence.
Migration however is very high among the youth who travel far from home to look for
greener pastures before or the raining season.
Social vulnerability scores for Eshiem
Historical timeline of key events and climate related hazards
Themes Indicators Score
Food Security Perception of fish abundance 5
Perception of food crop abundance 4
Access to food market 2
Land Tenure Complexity in accessing land 1
Cost of land 1
Governance and
Institutions
Communal involvement in natural resource decision
making process
5
Local norms are applied to regulate access to natural
resources
5
Access to sources of drinking water 4
Effectiveness of natural resource management systems 5
Availability and functionality of CBO's (social networks) 5
Effectiveness of local leadership 2
Responsiveness of local government 5
Perception and awareness of climate related risks 3
Emergency preparedness 5
Demography Migration patterns 5
Perception of poverty 2
Period Event
1968;
1987;2009;2014
Major flooding event destroyed farmlands and settlements
1970s Operation of union boat owned by wine distillery association
1980s Booming local wine distillery
1990s Decline of wine distillery
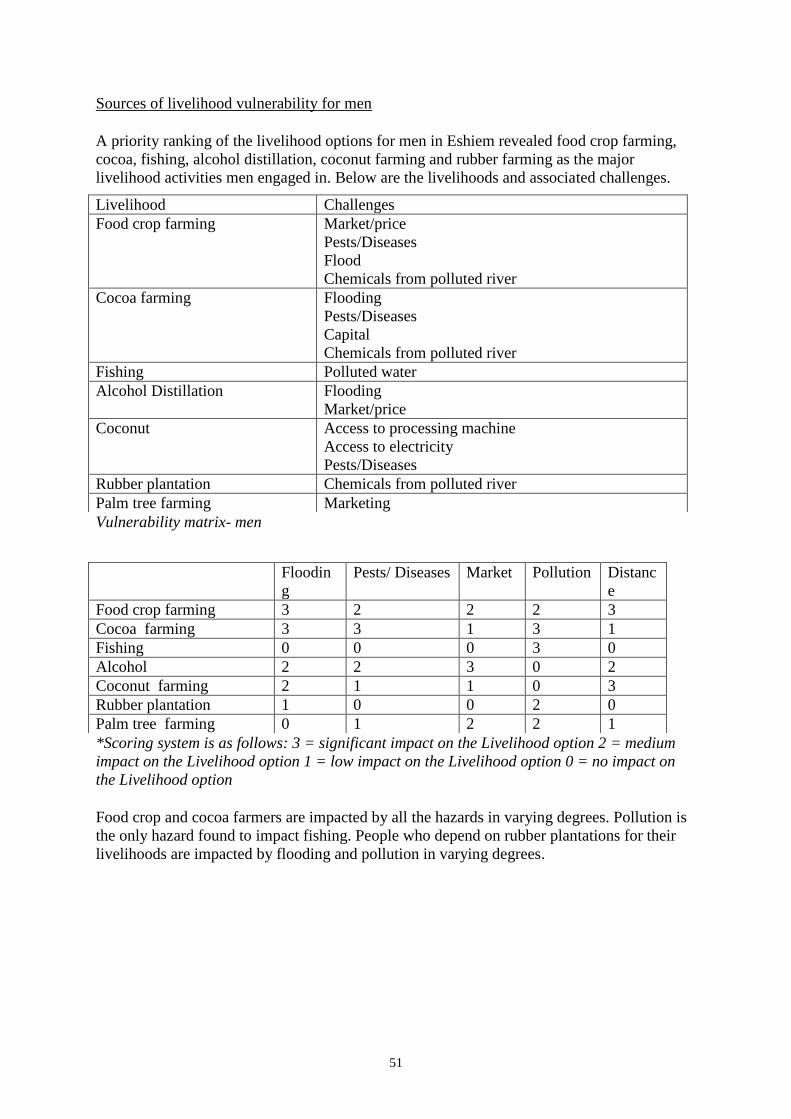
51
Sources of livelihood vulnerability for men
A priority ranking of the livelihood options for men in Eshiem revealed food crop farming,
cocoa, fishing, alcohol distillation, coconut farming and rubber farming as the major
livelihood activities men engaged in. Below are the livelihoods and associated challenges.
Vulnerability matrix- men
*Scoring system is as follows: 3 = significant impact on the Livelihood option 2 = medium
impact on the Livelihood option 1 = low impact on the Livelihood option 0 = no impact on
the Livelihood option
Food crop and cocoa farmers are impacted by all the hazards in varying degrees. Pollution is
the only hazard found to impact fishing. People who depend on rubber plantations for their
livelihoods are impacted by flooding and pollution in varying degrees.
Livelihood Challenges
Food crop farming Market/price
Pests/Diseases
Flood
Chemicals from polluted river
Cocoa farming Flooding
Pests/Diseases
Capital
Chemicals from polluted river
Fishing Polluted water
Alcohol Distillation Flooding
Market/price
Coconut
Access to processing machine
Access to electricity
Pests/Diseases
Rubber plantation Chemicals from polluted river
Palm tree farming Marketing
Floodin
g
Pests/ Diseases Market Pollution Distanc
e
Food crop farming 3 2 2 2 3
Cocoa farming 3 3 1 3 1
Fishing 0 0 0 3 0
Alcohol 2 2 3 0 2
Coconut farming 2 1 1 0 3
Rubber plantation 1 0 0 2 0
Palm tree farming 0 1 2 2 1
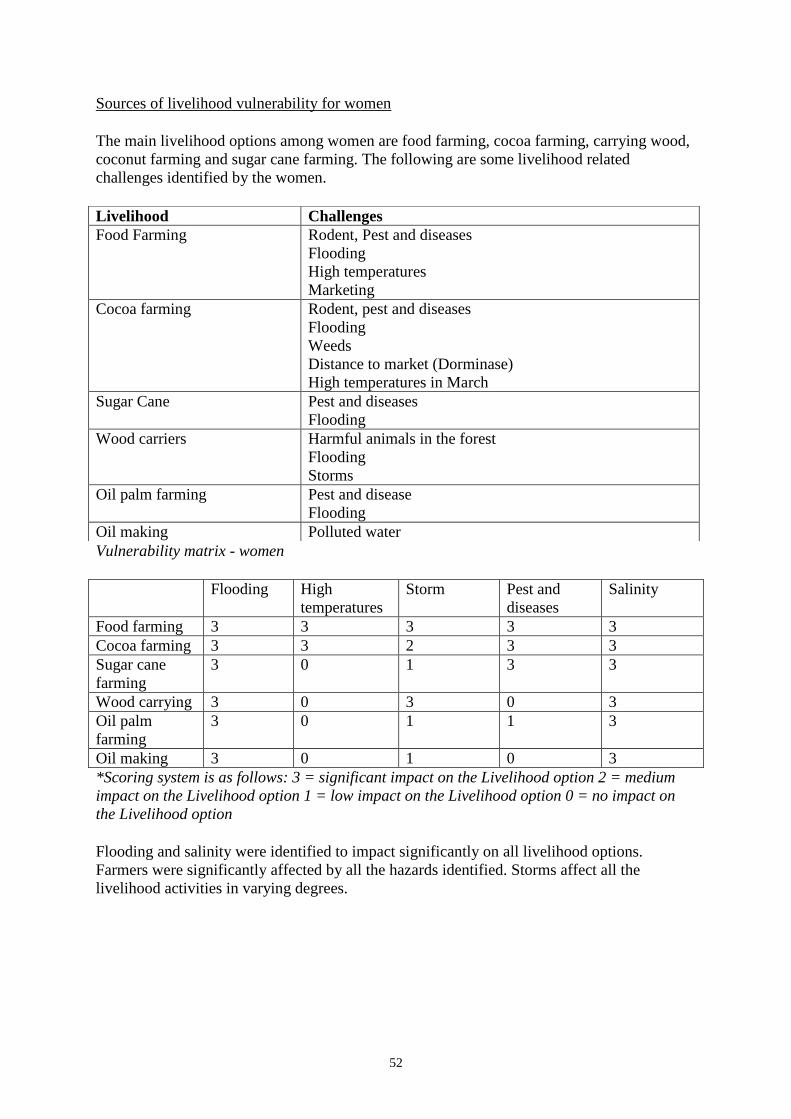
52
Sources of livelihood vulnerability for women
The main livelihood options among women are food farming, cocoa farming, carrying wood,
coconut farming and sugar cane farming. The following are some livelihood related
challenges identified by the women.
Vulnerability matrix - women
*Scoring system is as follows: 3 = significant impact on the Livelihood option 2 = medium
impact on the Livelihood option 1 = low impact on the Livelihood option 0 = no impact on
the Livelihood option
Flooding and salinity were identified to impact significantly on all livelihood options.
Farmers were significantly affected by all the hazards identified. Storms affect all the
livelihood activities in varying degrees.
Livelihood Challenges
Food Farming Rodent, Pest and diseases
Flooding
High temperatures
Marketing
Cocoa farming Rodent, pest and diseases
Flooding
Weeds
Distance to market (Dorminase)
High temperatures in March
Sugar Cane Pest and diseases
Flooding
Wood carriers Harmful animals in the forest
Flooding
Storms
Oil palm farming Pest and disease
Flooding
Oil making Polluted water
Flooding High
temperatures
Storm Pest and
diseases
Salinity
Food farming 3 3 3 3 3
Cocoa farming 3 3 2 3 3
Sugar cane
farming
3 0 1 3 3
Wood carrying 3 0 3 0 3
Oil palm
farming
3 0 1 1 3
Oil making 3 0 1 0 3
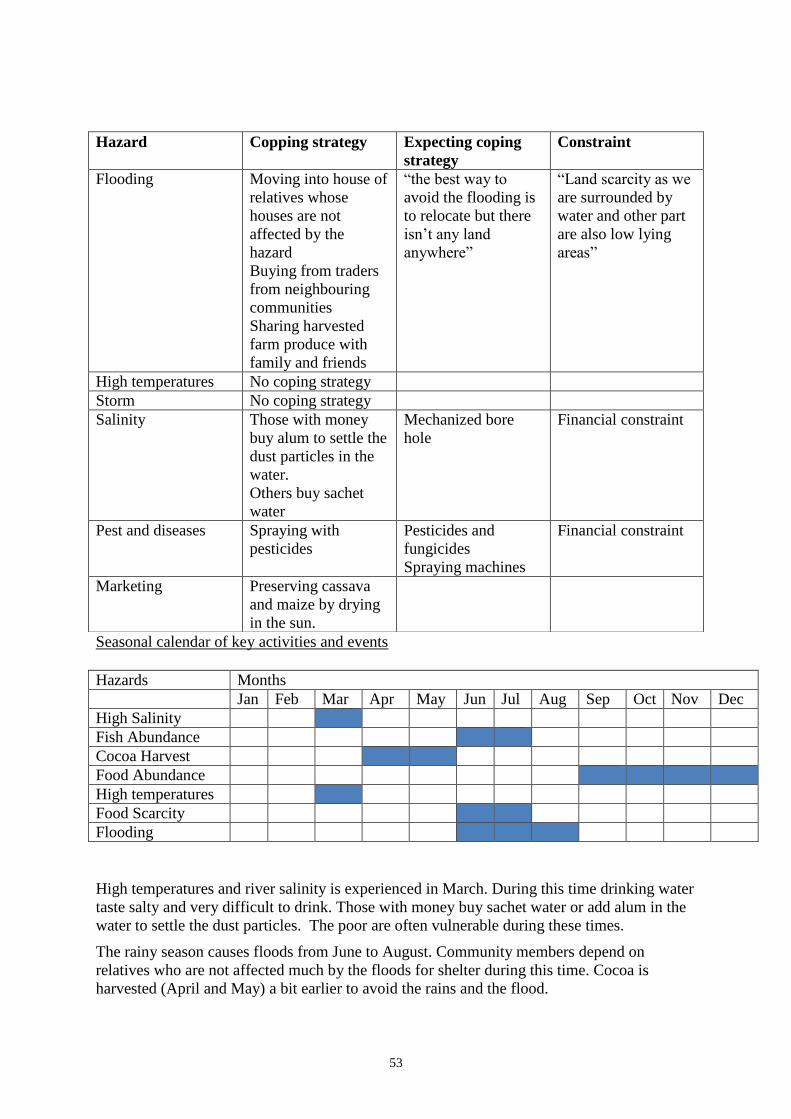
53
Seasonal calendar of key activities and events
Hazards Months
Jan Feb Mar Apr May Jun Jul Aug Sep Oct Nov Dec
High Salinity
Fish Abundance
Cocoa Harvest
Food Abundance
High temperatures
Food Scarcity
Flooding
High temperatures and river salinity is experienced in March. During this time drinking water
taste salty and very difficult to drink. Those with money buy sachet water or add alum in the
water to settle the dust particles. The poor are often vulnerable during these times.
The rainy season causes floods from June to August. Community members depend on
relatives who are not affected much by the floods for shelter during this time. Cocoa is
harvested (April and May) a bit earlier to avoid the rains and the flood.
Hazard Copping strategy Expecting coping
strategy
Constraint
Flooding Moving into house of
relatives whose
houses are not
affected by the
hazard
Buying from traders
from neighbouring
communities
Sharing harvested
farm produce with
family and friends
“the best way to
avoid the flooding is
to relocate but there
isn’t any land
anywhere”
“Land scarcity as we
are surrounded by
water and other part
are also low lying
areas”
High temperatures No coping strategy
Storm No coping strategy
Salinity Those with money
buy alum to settle the
dust particles in the
water.
Others buy sachet
water
Mechanized bore
hole
Financial constraint
Pest and diseases Spraying with
pesticides
Pesticides and
fungicides
Spraying machines
Financial constraint
Marketing Preserving cassava
and maize by drying
in the sun.
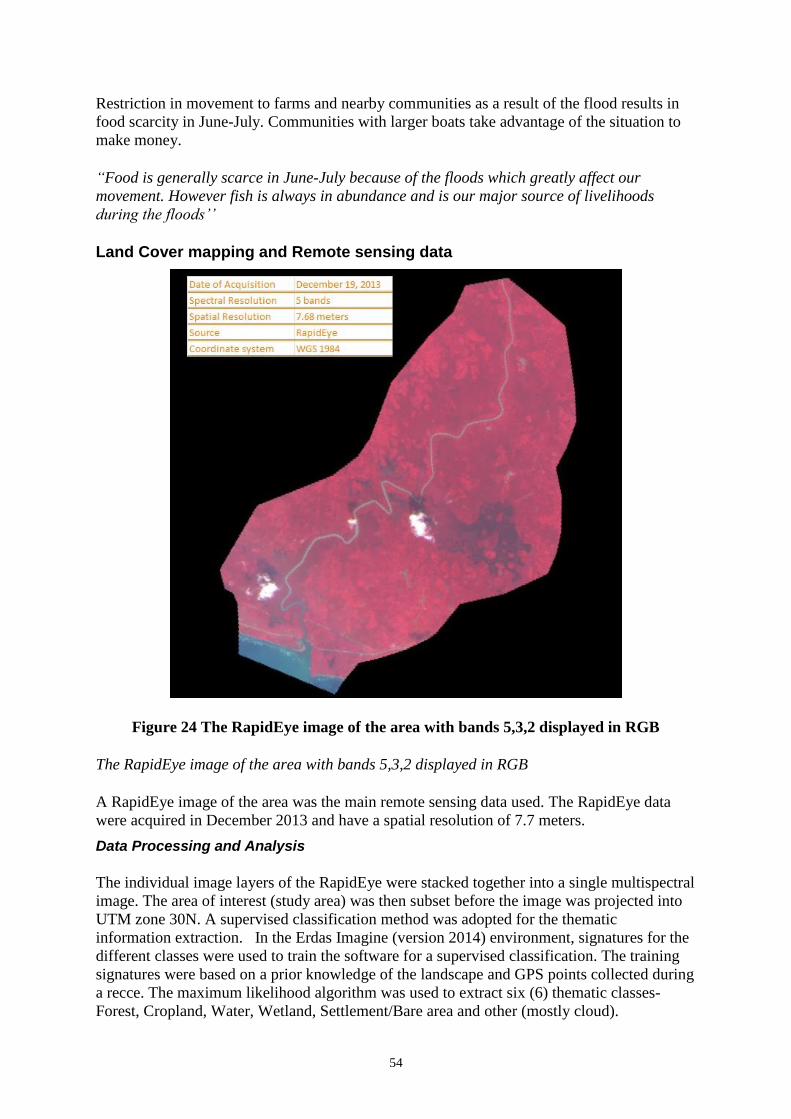
54
Restriction in movement to farms and nearby communities as a result of the flood results in
food scarcity in June-July. Communities with larger boats take advantage of the situation to
make money.
“Food is generally scarce in June-July because of the floods which greatly affect our
movement. However fish is always in abundance and is our major source of livelihoods
during the floods’’
Land Cover mapping and Remote sensing data
Figure 24 The RapidEye image of the area with bands 5,3,2 displayed in RGB
The RapidEye image of the area with bands 5,3,2 displayed in RGB
A RapidEye image of the area was the main remote sensing data used. The RapidEye data
were acquired in December 2013 and have a spatial resolution of 7.7 meters.
Data Processing and Analysis
The individual image layers of the RapidEye were stacked together into a single multispectral
image. The area of interest (study area) was then subset before the image was projected into
UTM zone 30N. A supervised classification method was adopted for the thematic
information extraction. In the Erdas Imagine (version 2014) environment, signatures for the
different classes were used to train the software for a supervised classification. The training
signatures were based on a prior knowledge of the landscape and GPS points collected during
a recce. The maximum likelihood algorithm was used to extract six (6) thematic classes-
Forest, Cropland, Water, Wetland, Settlement/Bare area and other (mostly cloud).
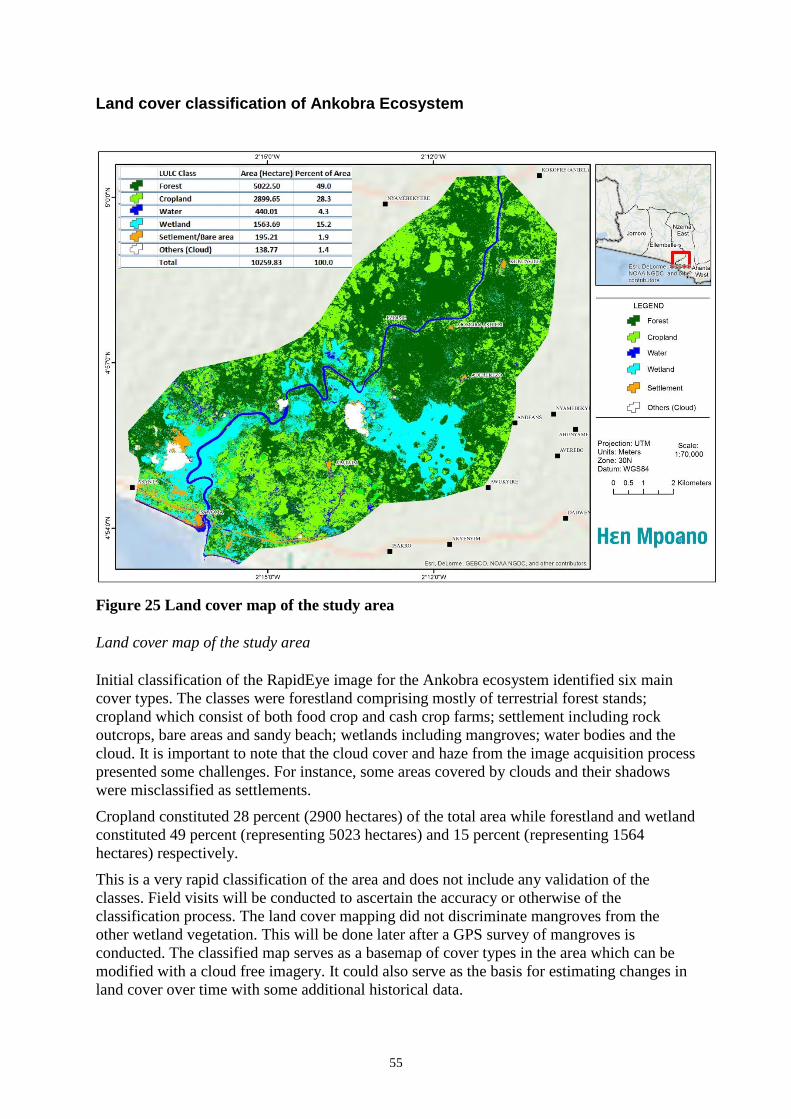
55
Land cover classification of Ankobra Ecosystem
Figure 25 Land cover map of the study area
Land cover map of the study area
Initial classification of the RapidEye image for the Ankobra ecosystem identified six main
cover types. The classes were forestland comprising mostly of terrestrial forest stands;
cropland which consist of both food crop and cash crop farms; settlement including rock
outcrops, bare areas and sandy beach; wetlands including mangroves; water bodies and the
cloud. It is important to note that the cloud cover and haze from the image acquisition process
presented some challenges. For instance, some areas covered by clouds and their shadows
were misclassified as settlements.
Cropland constituted 28 percent (2900 hectares) of the total area while forestland and wetland
constituted 49 percent (representing 5023 hectares) and 15 percent (representing 1564
hectares) respectively.
This is a very rapid classification of the area and does not include any validation of the
classes. Field visits will be conducted to ascertain the accuracy or otherwise of the
classification process. The land cover mapping did not discriminate mangroves from the
other wetland vegetation. This will be done later after a GPS survey of mangroves is
conducted. The classified map serves as a basemap of cover types in the area which can be
modified with a cloud free imagery. It could also serve as the basis for estimating changes in
land cover over time with some additional historical data.
56
Focus Group and Assessment Instrument
Background information
The Sustainable Fisheries Management Project (USAID/SFMP) is a five-year initiative
(October 1, 2014 – September 30, 2019) supported by the U.S. Agency for International
Development (USAID-Ghana). It is implemented through a cooperative agreement with the
University of Rhode Island (URI). The main goal of the USAID/SFMP Project is to rebuild
marine fisheries stocks and catches through adoption of responsible fishing practices.
Overfishing due to an increasing number of boats and fishers in an open access fishery and
weak governance all contribute to a fishery on the verge of collapse. At risk are not only the
livelihoods of more than 25,000 Ghanaians engaged in the fishery sector but also the food
security of the nation. In addition to the crisis in the fishery, coastal communities are
vulnerable to hazards and evolving impacts of climate change, particularly sea level rise,
flooding, less frequent rainfall as well as non-climate stressors including mangrove
degradation, poor land use, landlessness, poverty etc.
The SFMP strategy is to engage with you (stakeholders) to identify the vulnerabilities
specific to your community, and areas of greatest impact, and together, search for solutions to
reduce vulnerability and build your community’s resilience against climate change and other
stressors. Consequently, we invite you to participate in this vulnerability and resilience
assessment. The result of the assessment will be communicated back to the community and
validated at the district level in order to provide future planning orientations aimed at
improving livelihood resilience in the Ankobra region.
Your cooperation in answering the questions below and contributions to the focus group
discussions shall be very much appreciated. You are assured that answers will be handled
with strict confidentiality.
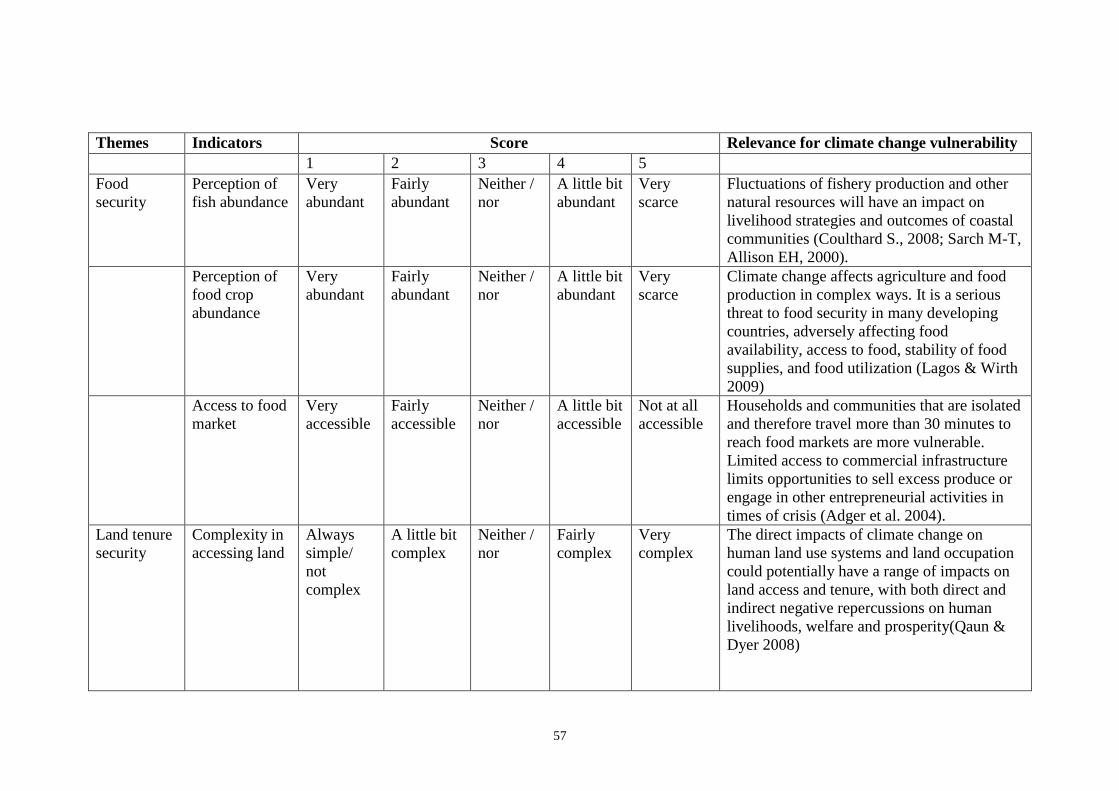
57
Themes Indicators Score Relevance for climate change vulnerability
1 2 3 4 5
Food
security
Perception of
fish abundance
Very
abundant
Fairly
abundant
Neither /
nor
A little bit
abundant
Very
scarce
Fluctuations of fishery production and other
natural resources will have an impact on
livelihood strategies and outcomes of coastal
communities (Coulthard S., 2008; Sarch M-T,
Allison EH, 2000).
Perception of
food crop
abundance
Very
abundant
Fairly
abundant
Neither /
nor
A little bit
abundant
Very
scarce
Climate change affects agriculture and food
production in complex ways. It is a serious
threat to food security in many developing
countries, adversely affecting food
availability, access to food, stability of food
supplies, and food utilization (Lagos & Wirth
2009)
Access to food
market
Very
accessible
Fairly
accessible
Neither /
nor
A little bit
accessible
Not at all
accessible
Households and communities that are isolated
and therefore travel more than 30 minutes to
reach food markets are more vulnerable.
Limited access to commercial infrastructure
limits opportunities to sell excess produce or
engage in other entrepreneurial activities in
times of crisis (Adger et al. 2004).
Land tenure
security
Complexity in
accessing land
Always
simple/
not
complex
A little bit
complex
Neither /
nor
Fairly
complex
Very
complex
The direct impacts of climate change on
human land use systems and land occupation
could potentially have a range of impacts on
land access and tenure, with both direct and
indirect negative repercussions on human
livelihoods, welfare and prosperity(Qaun &
Dyer 2008)
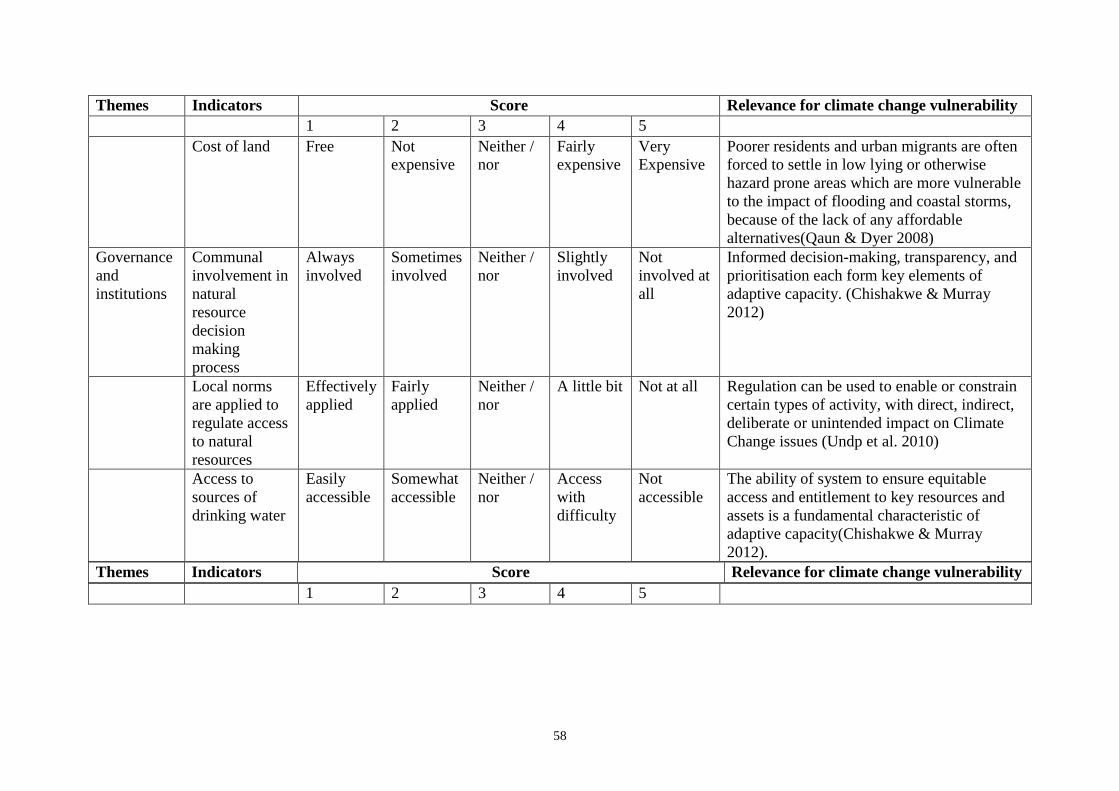
58
Themes Indicators Score Relevance for climate change vulnerability
1 2 3 4 5
Cost of land Free Not
expensive
Neither /
nor
Fairly
expensive
Very
Expensive
Poorer residents and urban migrants are often
forced to settle in low lying or otherwise
hazard prone areas which are more vulnerable
to the impact of flooding and coastal storms,
because of the lack of any affordable
alternatives(Qaun & Dyer 2008)
Governance
and
institutions
Communal
involvement in
natural
resource
decision
making
process
Always
involved
Sometimes
involved
Neither /
nor
Slightly
involved
Not
involved at
all
Informed decision-making, transparency, and
prioritisation each form key elements of
adaptive capacity. (Chishakwe & Murray
2012)
Local norms
are applied to
regulate access
to natural
resources
Effectively
applied
Fairly
applied
Neither /
nor
A little bit Not at all Regulation can be used to enable or constrain
certain types of activity, with direct, indirect,
deliberate or unintended impact on Climate
Change issues (Undp et al. 2010)
Access to
sources of
drinking water
Easily
accessible
Somewhat
accessible
Neither /
nor
Access
with
difficulty
Not
accessible
The ability of system to ensure equitable
access and entitlement to key resources and
assets is a fundamental characteristic of
adaptive capacity(Chishakwe & Murray
2012).
Themes Indicators Score Relevance for climate change vulnerability
1 2 3 4 5
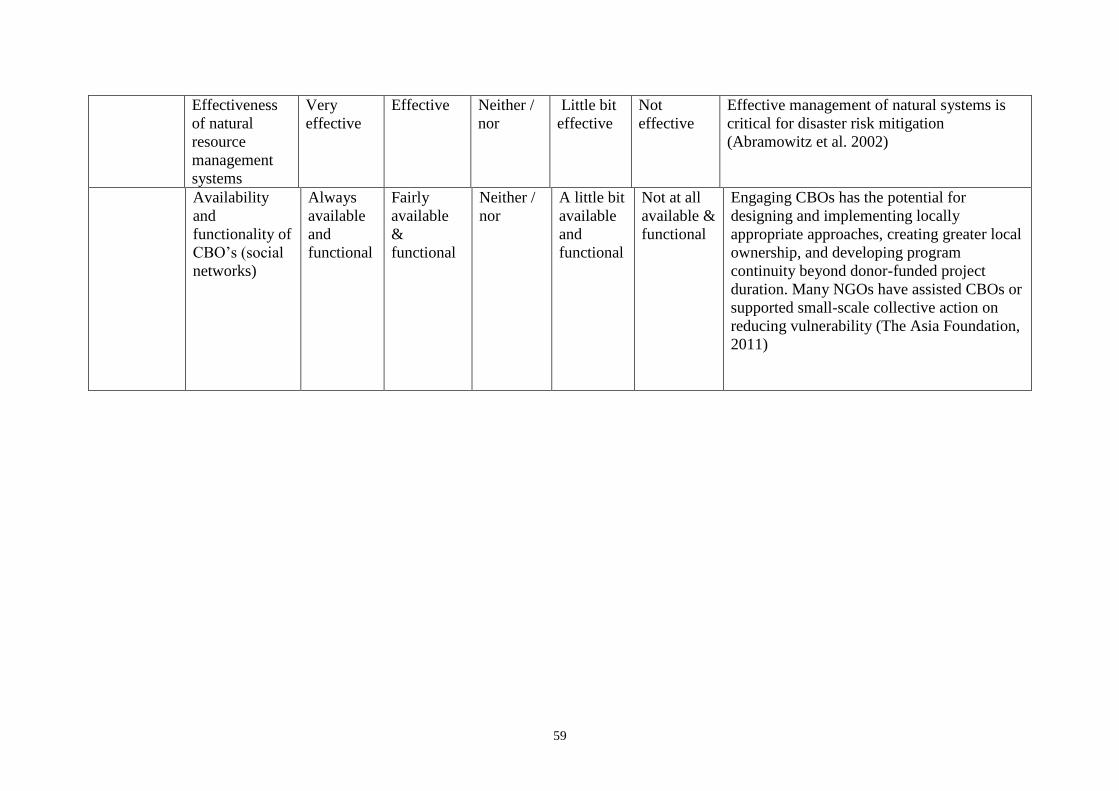
59
Effectiveness
of natural
resource
management
systems
Very
effective
Effective Neither /
nor
Little bit
effective
Not
effective
Effective management of natural systems is
critical for disaster risk mitigation
(Abramowitz et al. 2002)
Availability
and
functionality of
CBO’s (social
networks)
Always
available
and
functional
Fairly
available
&
functional
Neither /
nor
A little bit
available
and
functional
Not at all
available &
functional
Engaging CBOs has the potential for
designing and implementing locally
appropriate approaches, creating greater local
ownership, and developing program
continuity beyond donor-funded project
duration. Many NGOs have assisted CBOs or
supported small-scale collective action on
reducing vulnerability (The Asia Foundation,
2011)
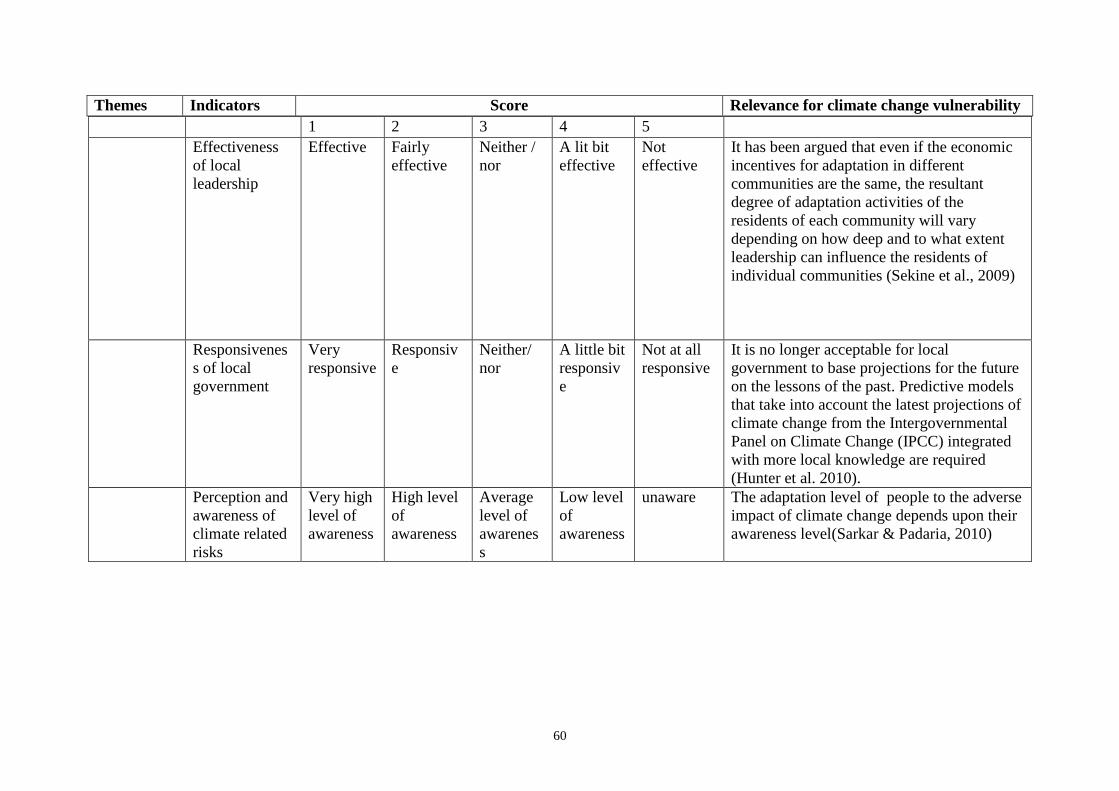
60
Themes Indicators Score Relevance for climate change vulnerability
1 2 3 4 5
Effectiveness
of local
leadership
Effective Fairly
effective
Neither /
nor
A lit bit
effective
Not
effective
It has been argued that even if the economic
incentives for adaptation in different
communities are the same, the resultant
degree of adaptation activities of the
residents of each community will vary
depending on how deep and to what extent
leadership can influence the residents of
individual communities (Sekine et al., 2009)
Responsivenes
s of local
government
Very
responsive
Responsiv
e
Neither/
nor
A little bit
responsiv
e
Not at all
responsive
It is no longer acceptable for local
government to base projections for the future
on the lessons of the past. Predictive models
that take into account the latest projections of
climate change from the Intergovernmental
Panel on Climate Change (IPCC) integrated
with more local knowledge are required
(Hunter et al. 2010).
Perception and
awareness of
climate related
risks
Very high
level of
awareness
High level
of
awareness
Average
level of
awarenes
s
Low level
of
awareness
unaware The adaptation level of people to the adverse
impact of climate change depends upon their
awareness level(Sarkar & Padaria, 2010)
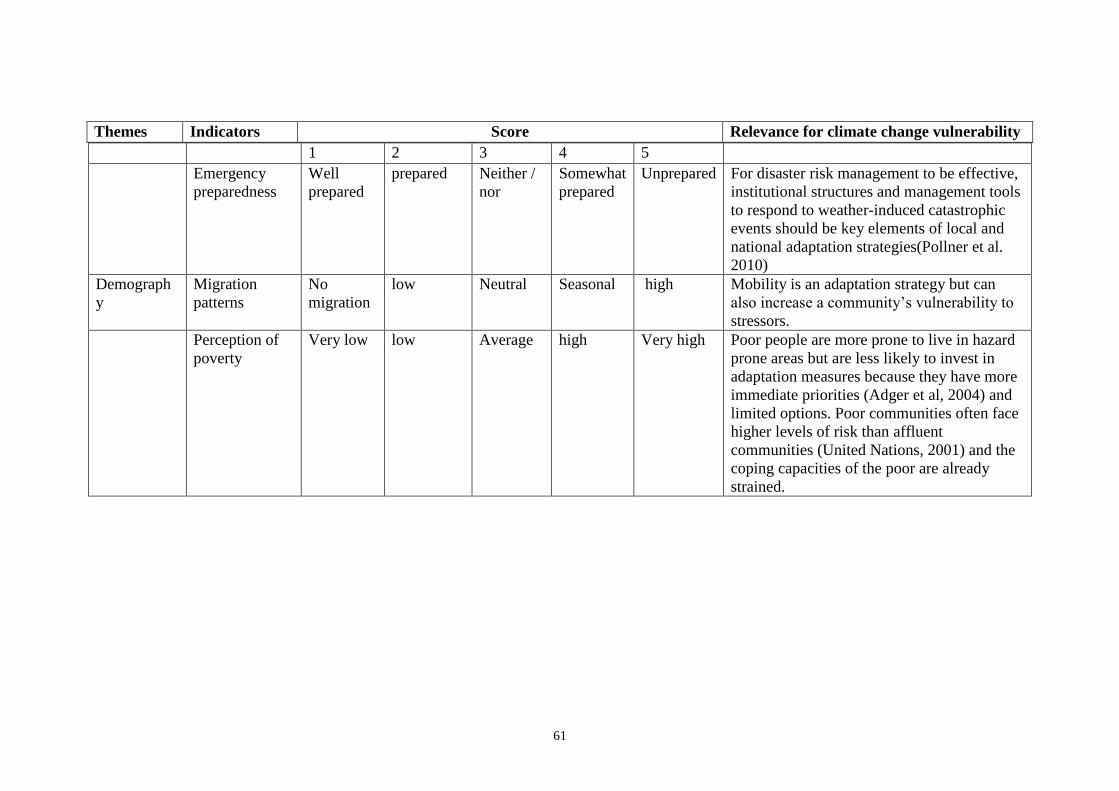
61
Themes Indicators Score Relevance for climate change vulnerability
1 2 3 4 5
Emergency
preparedness
Well
prepared
prepared Neither /
nor
Somewhat
prepared
Unprepared For disaster risk management to be effective,
institutional structures and management tools
to respond to weather-induced catastrophic
events should be key elements of local and
national adaptation strategies(Pollner et al.
2010)
Demograph
y
Migration
patterns
No
migration
low Neutral Seasonal high Mobility is an adaptation strategy but can
also increase a community’s vulnerability to
stressors.
Perception of
poverty
Very low low Average high Very high Poor people are more prone to live in hazard
prone areas but are less likely to invest in
adaptation measures because they have more
immediate priorities (Adger et al, 2004) and
limited options. Poor communities often face
higher levels of risk than affluent
communities (United Nations, 2001) and the
coping capacities of the poor are already
strained.
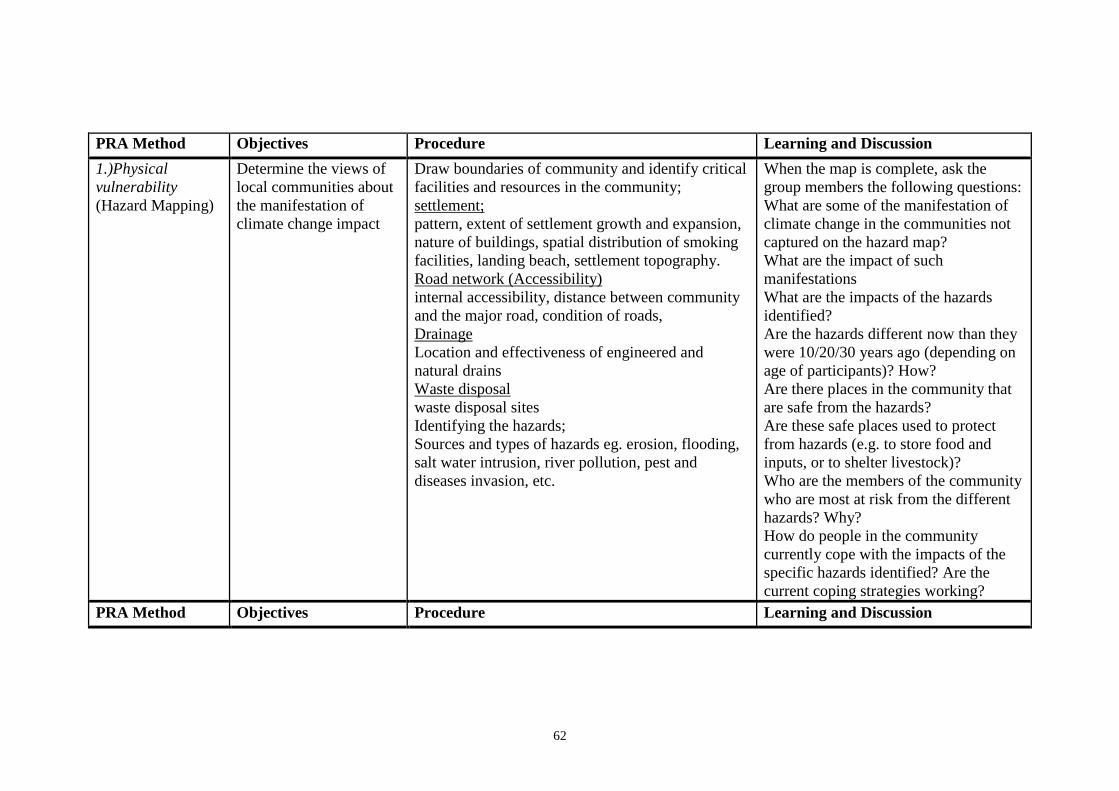
62
PRA Method Objectives Procedure Learning and Discussion
1.)Physical
vulnerability
(Hazard Mapping)
Determine the views of
local communities about
the manifestation of
climate change impact
Draw boundaries of community and identify critical
facilities and resources in the community;
settlement;
pattern, extent of settlement growth and expansion,
nature of buildings, spatial distribution of smoking
facilities, landing beach, settlement topography.
Road network (Accessibility)
internal accessibility, distance between community
and the major road, condition of roads,
Drainage
Location and effectiveness of engineered and
natural drains
Waste disposal
waste disposal sites
Identifying the hazards;
Sources and types of hazards eg. erosion, flooding,
salt water intrusion, river pollution, pest and
diseases invasion, etc.
When the map is complete, ask the
group members the following questions:
What are some of the manifestation of
climate change in the communities not
captured on the hazard map?
What are the impact of such
manifestations
What are the impacts of the hazards
identified?
Are the hazards different now than they
were 10/20/30 years ago (depending on
age of participants)? How?
Are there places in the community that
are safe from the hazards?
Are these safe places used to protect
from hazards (e.g. to store food and
inputs, or to shelter livestock)?
Who are the members of the community
who are most at risk from the different
hazards? Why?
How do people in the community
currently cope with the impacts of the
specific hazards identified? Are the
current coping strategies working?
PRA Method Objectives Procedure Learning and Discussion
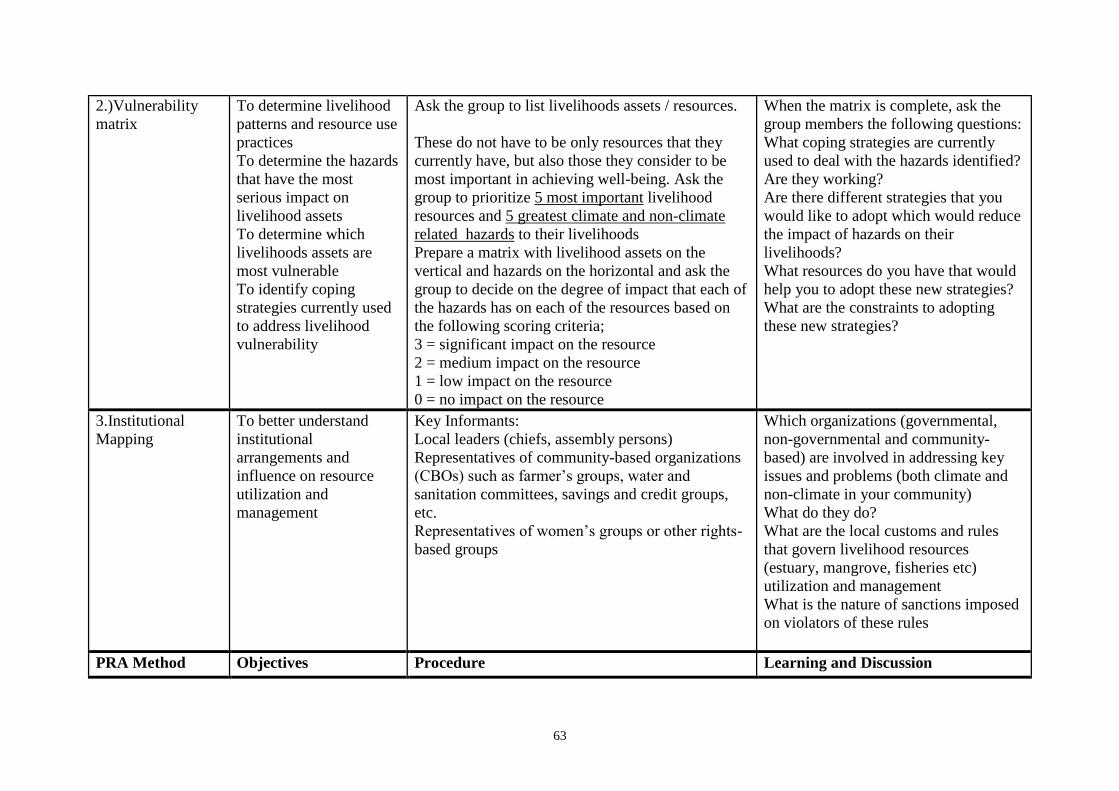
63
2.)Vulnerability
matrix
To determine livelihood
patterns and resource use
practices
To determine the hazards
that have the most
serious impact on
livelihood assets
To determine which
livelihoods assets are
most vulnerable
To identify coping
strategies currently used
to address livelihood
vulnerability
Ask the group to list livelihoods assets / resources.
These do not have to be only resources that they
currently have, but also those they consider to be
most important in achieving well-being. Ask the
group to prioritize 5 most important livelihood
resources and 5 greatest climate and non-climate
related hazards to their livelihoods
Prepare a matrix with livelihood assets on the
vertical and hazards on the horizontal and ask the
group to decide on the degree of impact that each of
the hazards has on each of the resources based on
the following scoring criteria;
3 = significant impact on the resource
2 = medium impact on the resource
1 = low impact on the resource
0 = no impact on the resource
When the matrix is complete, ask the
group members the following questions:
What coping strategies are currently
used to deal with the hazards identified?
Are they working?
Are there different strategies that you
would like to adopt which would reduce
the impact of hazards on their
livelihoods?
What resources do you have that would
help you to adopt these new strategies?
What are the constraints to adopting
these new strategies?
3.Institutional
Mapping
To better understand
institutional
arrangements and
influence on resource
utilization and
management
Key Informants:
Local leaders (chiefs, assembly persons)
Representatives of community-based organizations
(CBOs) such as farmer’s groups, water and
sanitation committees, savings and credit groups,
etc.
Representatives of women’s groups or other rights-
based groups
Which organizations (governmental,
non-governmental and community-
based) are involved in addressing key
issues and problems (both climate and
non-climate in your community)
What do they do?
What are the local customs and rules
that govern livelihood resources
(estuary, mangrove, fisheries etc)
utilization and management
What is the nature of sanctions imposed
on violators of these rules
PRA Method Objectives Procedure Learning and Discussion
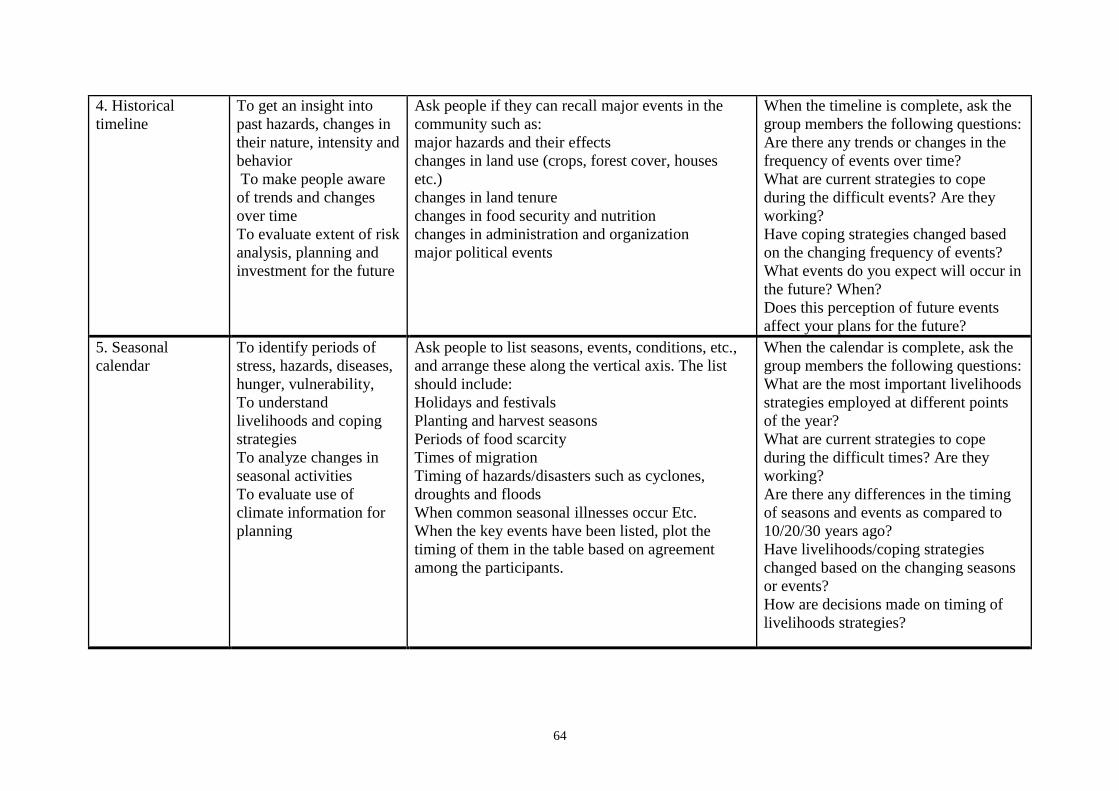
64
4. Historical
timeline
To get an insight into
past hazards, changes in
their nature, intensity and
behavior
To make people aware
of trends and changes
over time
To evaluate extent of risk
analysis, planning and
investment for the future
Ask people if they can recall major events in the
community such as:
major hazards and their effects
changes in land use (crops, forest cover, houses
etc.)
changes in land tenure
changes in food security and nutrition
changes in administration and organization
major political events
When the timeline is complete, ask the
group members the following questions:
Are there any trends or changes in the
frequency of events over time?
What are current strategies to cope
during the difficult events? Are they
working?
Have coping strategies changed based
on the changing frequency of events?
What events do you expect will occur in
the future? When?
Does this perception of future events
affect your plans for the future?
5. Seasonal
calendar
To identify periods of
stress, hazards, diseases,
hunger, vulnerability,
To understand
livelihoods and coping
strategies
To analyze changes in
seasonal activities
To evaluate use of
climate information for
planning
Ask people to list seasons, events, conditions, etc.,
and arrange these along the vertical axis. The list
should include:
Holidays and festivals
Planting and harvest seasons
Periods of food scarcity
Times of migration
Timing of hazards/disasters such as cyclones,
droughts and floods
When common seasonal illnesses occur Etc.
When the key events have been listed, plot the
timing of them in the table based on agreement
among the participants.
When the calendar is complete, ask the
group members the following questions:
What are the most important livelihoods
strategies employed at different points
of the year?
What are current strategies to cope
during the difficult times? Are they
working?
Are there any differences in the timing
of seasons and events as compared to
10/20/30 years ago?
Have livelihoods/coping strategies
changed based on the changing seasons
or events?
How are decisions made on timing of
livelihoods strategies?