Sustainable ETFs - bellpotter.com.au
22
Exchange Traded Funds Sustainable ETFs 21 September 2021 BELL POTTER SECURITIES LIMITED ACN 25 006 390 772 AFSL 243480 THIS REPORT MUST BE READ WITH THE DISCLAIMER AND DISCLOSURES ON PAGE 22 THAT FORM PART OF IT. Page 1 While we have previously discussed a quantitative framework in constructing and optimising portfolios on an ex-post basis in older editions of our ETF reports, the first step in the investment process is to adequately gauge a client’s objectives and constraints through the development of an Investment Policy Statement (IPS). Fundamental to the construction of any investment portfolio, return objectives and expectations must be tailored such that they consistent with risk objectives. An IPS may target this on an absolute basis or state a discrete rate of return, hurdle or benchmark, in order to appraise the delivery of investment objectives and aid in assessing relative portfolio performance. Risk and return objectives must also be consistent with any further circumstantial constraints, such as value and beliefs, which are likely to have a material impact on portfolio composition. In what is becoming an increasingly mainstream application, a large proportion of investors are now seeking to explicitly include non-financial considerations within their IPS formulation. Sustainable investing recognises that Environmental, Social and Governance (ESG) considerations may impact the long-term risk-return profile of financial assets while also acting to express the cultural conviction of clients. Conducted by BlackRock, an inaugural 2020 survey into sustainable investing affirmed that such considerations are becoming an increasingly central aspect of respondent investment approaches. Respondents included corporate and public pension plans, sovereign wealth funds, insurers, asset managers, endowments, foundations, and global wealth managers. In total, feedback from 425 separate investors, representing a total of 27 countries and an estimated US$25tn in assets under management (AUM) was received. Over half of the surveyed global respondents (54%) considered extra- financial considerations to be additive to investment processes and outcomes. The scale of adoption, however, was found to vary considerably by region. 86% of Europe, Middle East and African respondents stated that sustainable investing is already, or will become, central to their investment strategies, while 57% and 47% of respondents in Asia-Pacific and North and South America, respectively, shared this same view. Divergent acceptance is partly resultant of different political pressures and policies. Earlier in this year on 14 July 2021, the European Commission adopted a series of legislative proposals, in accordance with the European Green Deal, in an effort to reduce net greenhouse gas (GHG) emissions by at least 55% come 2030 (on 1990 levels). The framework broadly supports electrification of the economy, increases the binding target of uptake in renewable sources, mandates unsustainable forest harvesting, protects areas of high-biodiversity value and tightens carbon pricing while facilitating a cap and trade system on the total amount of GHG emissions by installations. Meanwhile the new Biden Administration has already issued an executive order for the U.S. to rejoin the Paris Climate Agreement, further pledging a commitment to achieve a 50-52% emissions reduction target by 2030 (on 2005 levels). A target of net-zero emissions has also been set for 2050. The U.S. Senate has also now successfully passed a US$1tn infrastructure bill aimed to revitalise transportation, water systems, broadband and manufacturing. The bill will need to pass the U.S. House of Representatives, with a vote scheduled for 27 September 2021. We anticipate these past and future government policies to be largely supportive of the normalisation in, and mainstream application of, sustainable investing. BlackRock respondents also claimed that they intend to double their amount of sustainable AUM over the next five years, rising from 18% of AUM on average today to 37% on average by 2025. Our analysis of the ASX and Chi-X Exchange Traded Fund Hayden Nicholson ETF/LIC Specialist [email protected] Fifty Shades of Green Domestic ETMFs INES Intelligent Investor Ethical Share Fund (Managed Fund) IMPQ eInvest Future Impact Small Caps Fund (Managed Fund) Domestic ETFs E200 SPDR S&P/ASX 200 ESG Fund GRNV VanEck MSCI Australian Sustainable Equity ETF FAIR Betashares Australian Sustainability Leaders ETF IESG iShares Core MSCI Australia ESG Leaders ETF VETH Vanguard Ethically Conscious Australian Shares ETF RARI Russell Investments Australian Responsible Investment ETF This report is to be read in conjunction with the PDS/ Prospectus of each Listed Managed Investment and the risks on page 21
Transcript of Sustainable ETFs - bellpotter.com.au
Exchange Traded Funds
Sustainable ETFs
21 September 2021
BELL POTTER SECURITIES LIMITED ACN 25 006 390 772 AFSL 243480
THIS REPORT MUST BE READ WITH THE DISCLAIMER AND DISCLOSURES ON PAGE 22 THAT FORM PART OF IT.
Page 1
While we have previously discussed a quantitative framework in constructing and
optimising portfolios on an ex-post basis in older editions of our ETF reports, the first
step in the investment process is to adequately gauge a client’s objectives and
constraints through the development of an Investment Policy Statement (IPS).
Fundamental to the construction of any investment portfolio, return objectives and
expectations must be tailored such that they consistent with risk objectives. An IPS
may target this on an absolute basis or state a discrete rate of return, hurdle or
benchmark, in order to appraise the delivery of investment objectives and aid in
assessing relative portfolio performance. Risk and return objectives must also be
consistent with any further circumstantial constraints, such as value and beliefs, which
are likely to have a material impact on portfolio composition. In what is becoming an
increasingly mainstream application, a large proportion of investors are now seeking to
explicitly include non-financial considerations within their IPS formulation. Sustainable
investing recognises that Environmental, Social and Governance (ESG) considerations
may impact the long-term risk-return profile of financial assets while also acting to
express the cultural conviction of clients.
Conducted by BlackRock, an inaugural 2020 survey into sustainable investing affirmed
that such considerations are becoming an increasingly central aspect of respondent
investment approaches. Respondents included corporate and public pension plans,
sovereign wealth funds, insurers, asset managers, endowments, foundations, and
global wealth managers. In total, feedback from 425 separate investors, representing a
total of 27 countries and an estimated US$25tn in assets under management (AUM)
was received. Over half of the surveyed global respondents (54%) considered extra-
financial considerations to be additive to investment processes and outcomes. The
scale of adoption, however, was found to vary considerably by region. 86% of Europe,
Middle East and African respondents stated that sustainable investing is already, or
will become, central to their investment strategies, while 57% and 47% of respondents
in Asia-Pacific and North and South America, respectively, shared this same view.
Divergent acceptance is partly resultant of different political pressures and policies.
Earlier in this year on 14 July 2021, the European Commission adopted a series of
legislative proposals, in accordance with the European Green Deal, in an effort to
reduce net greenhouse gas (GHG) emissions by at least 55% come 2030 (on 1990
levels). The framework broadly supports electrification of the economy, increases the
binding target of uptake in renewable sources, mandates unsustainable forest
harvesting, protects areas of high-biodiversity value and tightens carbon pricing while
facilitating a cap and trade system on the total amount of GHG emissions by
installations. Meanwhile the new Biden Administration has already issued an executive
order for the U.S. to rejoin the Paris Climate Agreement, further pledging a
commitment to achieve a 50-52% emissions reduction target by 2030 (on 2005 levels).
A target of net-zero emissions has also been set for 2050. The U.S. Senate has also
now successfully passed a US$1tn infrastructure bill aimed to revitalise transportation,
water systems, broadband and manufacturing. The bill will need to pass the U.S.
House of Representatives, with a vote scheduled for 27 September 2021. We
anticipate these past and future government policies to be largely supportive of the
normalisation in, and mainstream application of, sustainable investing.
BlackRock respondents also claimed that they intend to double their amount of
sustainable AUM over the next five years, rising from 18% of AUM on average today to
37% on average by 2025. Our analysis of the ASX and Chi-X Exchange Traded Fund
Hayden Nicholson
ETF/LIC Specialist
Fifty Shades of Green
Domestic ETMFs
INES Intelligent Investor Ethical Share Fund (Managed Fund)
IMPQ eInvest Future Impact Small Caps Fund (Managed Fund)
Domestic ETFs
E200 SPDR S&P/ASX 200 ESG Fund
GRNV VanEck MSCI Australian Sustainable Equity ETF
FAIR Betashares Australian Sustainability Leaders ETF
IESG iShares Core MSCI Australia ESG Leaders ETF
VETH Vanguard Ethically Conscious Australian Shares ETF
RARI Russell Investments Australian Responsible Investment ETF
This report is to be read in
conjunction with the PDS/
Prospectus of each Listed
Managed Investment and the risks
on page 21
Page 2
Exchange Traded Funds
21 September 2021
Figure 1 - Australian listed funds AUM growth
SOURCE: ASX, CHI-X.
Figure 2 - Australia’s aging population
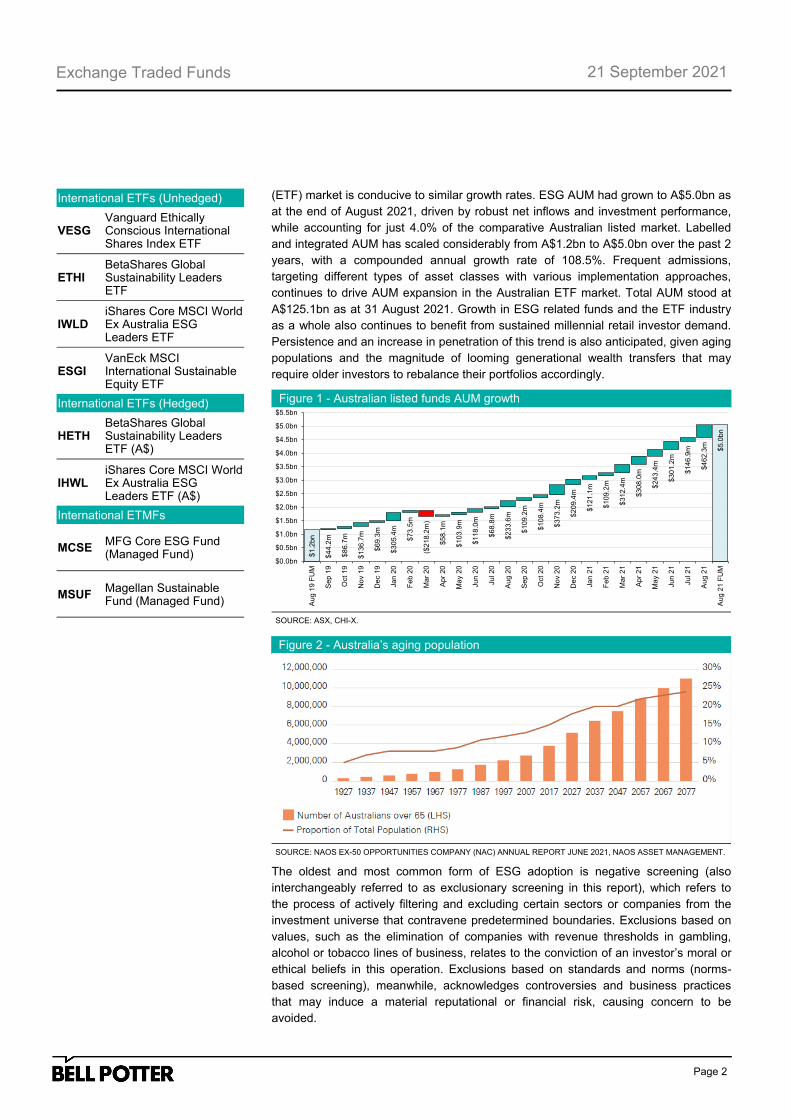
(ETF) market is conducive to similar growth rates. ESG AUM had grown to A$5.0bn as
at the end of August 2021, driven by robust net inflows and investment performance,
while accounting for just 4.0% of the comparative Australian listed market. Labelled
and integrated AUM has scaled considerably from A$1.2bn to A$5.0bn over the past 2
years, with a compounded annual growth rate of 108.5%. Frequent admissions,
targeting different types of asset classes with various implementation approaches,
continues to drive AUM expansion in the Australian ETF market. Total AUM stood at
A$125.1bn as at 31 August 2021. Growth in ESG related funds and the ETF industry
as a whole also continues to benefit from sustained millennial retail investor demand.
Persistence and an increase in penetration of this trend is also anticipated, given aging
populations and the magnitude of looming generational wealth transfers that may
require older investors to rebalance their portfolios accordingly.
International ETFs (Unhedged)
VESG Vanguard Ethically Conscious International Shares Index ETF
ETHI BetaShares Global Sustainability Leaders ETF
IWLD iShares Core MSCI World Ex Australia ESG Leaders ETF
ESGI VanEck MSCI International Sustainable Equity ETF
International ETFs (Hedged)
HETH BetaShares Global Sustainability Leaders ETF (A$)
IHWL iShares Core MSCI World Ex Australia ESG Leaders ETF (A$)
International ETMFs
MCSE MFG Core ESG Fund (Managed Fund)
MSUF Magellan Sustainable Fund (Managed Fund)
SOURCE: NAOS EX-50 OPPORTUNITIES COMPANY (NAC) ANNUAL REPORT JUNE 2021, NAOS ASSET MANAGEMENT.
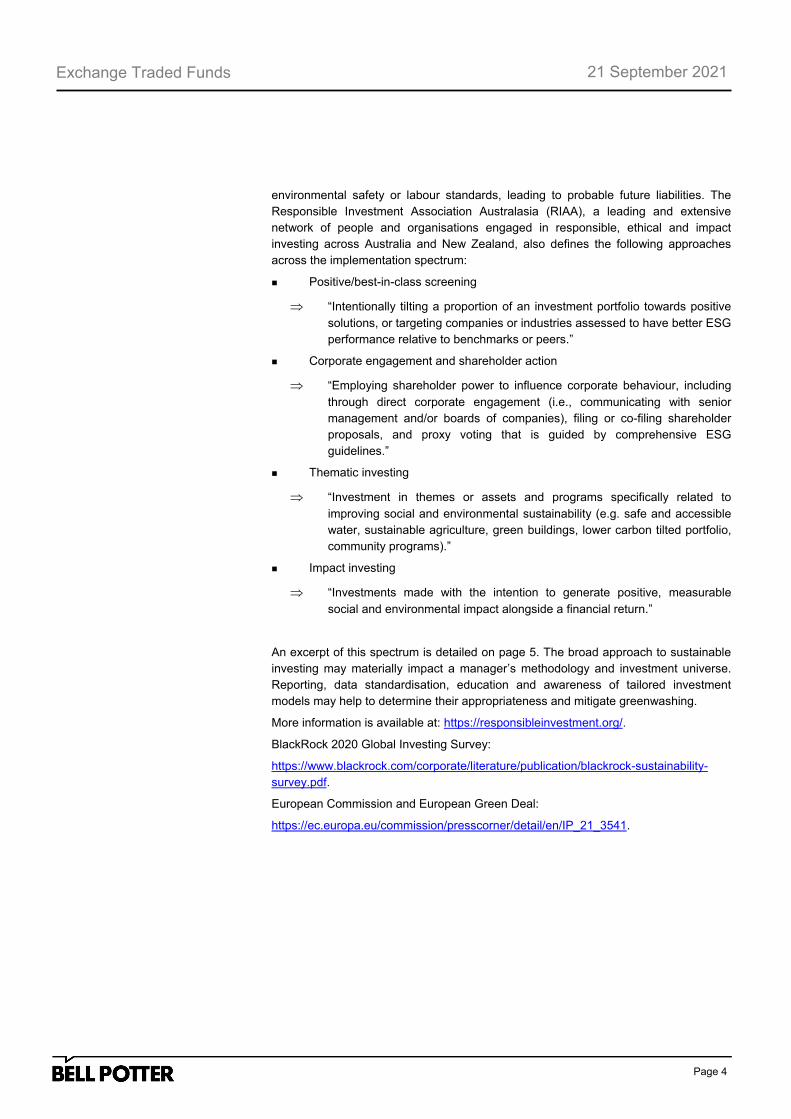
The oldest and most common form of ESG adoption is negative screening (also
interchangeably referred to as exclusionary screening in this report), which refers to
the process of actively filtering and excluding certain sectors or companies from the
investment universe that contravene predetermined boundaries. Exclusions based on
values, such as the elimination of companies with revenue thresholds in gambling,
alcohol or tobacco lines of business, relates to the conviction of an investor’s moral or
ethical beliefs in this operation. Exclusions based on standards and norms (norms-
based screening), meanwhile, acknowledges controversies and business practices
that may induce a material reputational or financial risk, causing concern to be
avoided.
$1.2
bn
$44.2
m
$86.7
m
$136.7
m
$69.3
m
$305.4
m
$73.5
m
($21
8.2
m)
$58.1
m
$103.9
m
$118.0
m
$68.8
m
$233.6
m
$109.2
m
$108.4
m
$373.2
m
$209.4
m
$121.1
m
$109.2
m
$312.4
m
$308.0
m
$2
43
.4m
$301.2
m
$146.9
m
$462.3
m $5.0
bn
$0.0bn
$0.5bn
$1.0bn
$1.5bn
$2.0bn
$2.5bn
$3.0bn
$3.5bn
$4.0bn
$4.5bn
$5.0bn
$5.5bn
Au
g 1
9 F
UM
Se
p 1
9
Oct
19
No
v 1
9
De
c 1
9
Ja
n 2
0
Fe
b 2
0
Ma
r 2
0
Apr
20
Ma
y 2
0
Ju
n 2
0
Ju
l 2
0
Au
g 2
0
Se
p 2
0
Oct
20
No
v 2
0
De
c 2
0
Ja
n 2
1
Fe
b 2
1
Ma
r 2
1
Apr
21
Ma
y 2
1
Ju
n 2
1
Ju
l 2
1
Au
g 2
1
Au
g 2
1 F
UM
Page 3
Exchange Traded Funds
21 September 2021
SOURCE: RESPONSIBLE INVESTMENT BENCHMARK REPORT 2021, RIAA.
Figure 3 - Australian AUM by ESG implementation approach
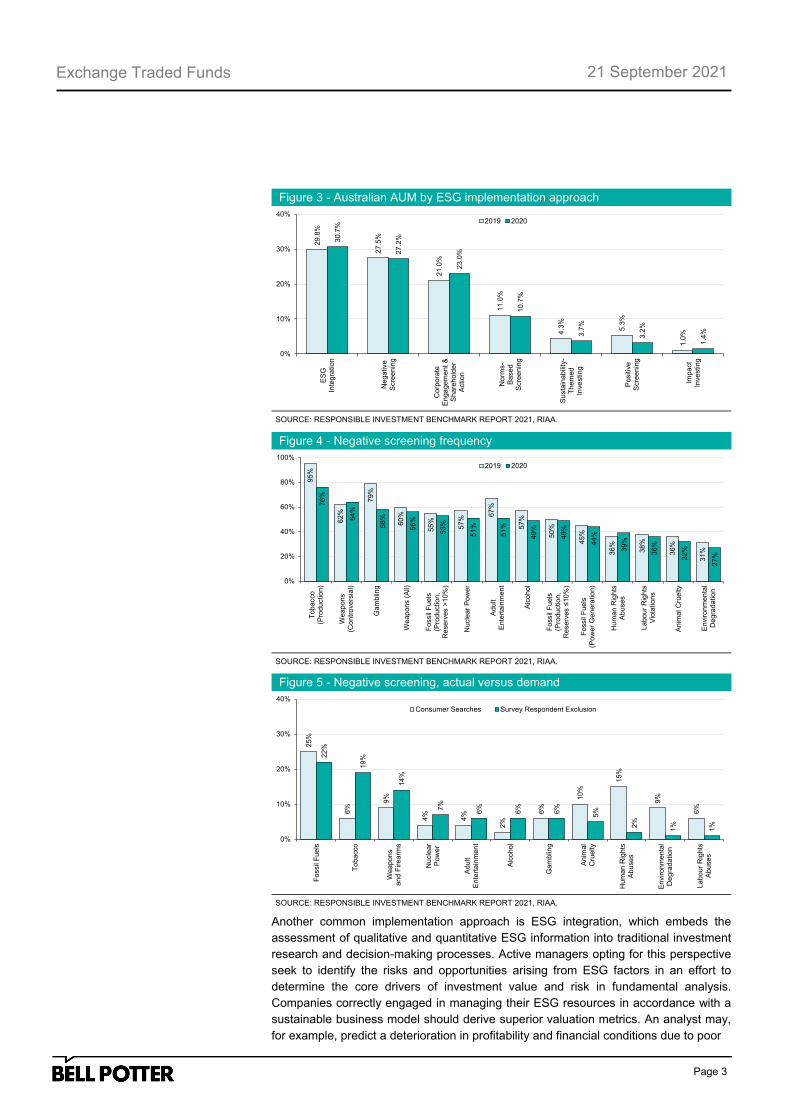
Another common implementation approach is ESG integration, which embeds the
assessment of qualitative and quantitative ESG information into traditional investment
research and decision-making processes. Active managers opting for this perspective
seek to identify the risks and opportunities arising from ESG factors in an effort to
determine the core drivers of investment value and risk in fundamental analysis.
Companies correctly engaged in managing their ESG resources in accordance with a
sustainable business model should derive superior valuation metrics. An analyst may,
for example, predict a deterioration in profitability and financial conditions due to poor
SOURCE: RESPONSIBLE INVESTMENT BENCHMARK REPORT 2021, RIAA.
Figure 4 - Negative screening frequency
Figure 5 - Negative screening, actual versus demand
SOURCE: RESPONSIBLE INVESTMENT BENCHMARK REPORT 2021, RIAA.
25%
6%
9%
4%
4%
2%
6%
10%
15%
9%
6%
22%
19%
14%
7%
6%
6%
6%
5%
2%
1%
1%
0%
10%
20%
30%
40%
Fo
ssil
Fu
els
To
ba
cco
We
ap
ons
an
d F
ire
arm
s
Nu
cle
ar
Po
we
r
Ad
ult
En
tert
ain
men
t
Alc
oho
l
Gam
blin
g
Anim
al
Cru
elty
Hu
man
Rig
hts
Ab
use
s
En
viro
nm
en
tal
De
gra
da
tio
n
La
bou
r R
ights
Ab
use
sConsumer Searches Survey Respondent Exclusion
29.8
%
27.5
%
21.0
%
11.0
%
4.3
%
5.3
%
1.0
%
30.7
%
27.2
%
23.0
%
10.7
%
3.7
%
3.2
%
1.4
%
0%
10%
20%
30%
40%
ES
GIn
tegra
tion
Ne
gative
Scre
enin
g
Co
rpora
teE
nga
gem
ent
&S
hare
hold
er
Action
No
rms-
Based
Scre
enin
g
Susta
inab
ility
-T
he
med
Inve
sting
Positiv
eS
cre
enin
g
Impact
Inve
sting
2019 2020
95%
62%
79%
60%
55%
57%
67%
57%
50%
45%
36%
38%
36%
31%
76%
64%
58%
56%
53%
51%
51%
49%
49%
44%
39%
36%
32%
27%
0%
20%
40%
60%
80%
100%
To
ba
cco
(Pro
du
ctio
n)
We
ap
ons
(Co
ntr
ove
rsia
l)
Ga
mb
ling
We
ap
on
s (
All)
Fo
ssil
Fu
els
(Pro
du
ctio
n,
Re
se
rve
s >
10%
)
Nu
cle
ar
Po
we
r
Ad
ult
En
tert
ain
men
t
Alc
oho
l
Fo
ssil
Fu
els
(Pro
du
ctio
n,
Re
se
rve
s ≤
10%
)
Fo
ssil
Fu
els
(Po
we
r G
en
era
tio
n)
Hu
man
Rig
hts
Ab
use
s
La
bou
r R
igh
tsV
iola
tio
ns
An
ima
l C
ruelty
En
viro
nm
en
tal
De
gra
da
tio
n
2019 2020
Page 4
Exchange Traded Funds
21 September 2021
environmental safety or labour standards, leading to probable future liabilities. The
Responsible Investment Association Australasia (RIAA), a leading and extensive
network of people and organisations engaged in responsible, ethical and impact
investing across Australia and New Zealand, also defines the following approaches
across the implementation spectrum:
Positive/best-in-class screening
“Intentionally tilting a proportion of an investment portfolio towards positive
solutions, or targeting companies or industries assessed to have better ESG
performance relative to benchmarks or peers.”
Corporate engagement and shareholder action
“Employing shareholder power to influence corporate behaviour, including
through direct corporate engagement (i.e., communicating with senior
management and/or boards of companies), filing or co-filing shareholder
proposals, and proxy voting that is guided by comprehensive ESG
guidelines.”
Thematic investing
“Investment in themes or assets and programs specifically related to
improving social and environmental sustainability (e.g. safe and accessible
water, sustainable agriculture, green buildings, lower carbon tilted portfolio,
community programs).”
Impact investing
“Investments made with the intention to generate positive, measurable
social and environmental impact alongside a financial return.”
An excerpt of this spectrum is detailed on page 5. The broad approach to sustainable
investing may materially impact a manager’s methodology and investment universe.
Reporting, data standardisation, education and awareness of tailored investment
models may help to determine their appropriateness and mitigate greenwashing.
More information is available at: https://responsibleinvestment.org/.
BlackRock 2020 Global Investing Survey:
https://www.blackrock.com/corporate/literature/publication/blackrock-sustainability-
survey.pdf.
European Commission and European Green Deal:
https://ec.europa.eu/commission/presscorner/detail/en/IP_21_3541.
Page 5
Exchange Traded Funds
21 September 2021
Fig
ure
6 -
Respon
sib
le Investm
ent
Associa
tion A
ustr
ala
sia
(R
IAA
) re
spon
sib
le a
nd e
thic
al in
vestm
ent
spectr
um
SO
UR
CE
: R
ES
PO
NS
IBL
E I
NV
ES
TM
EN
T B
EN
CH
MA
RK
RE
PO
RT
20
21
, R
IAA
.
Tra
dit
ion
al
Inve
stm
en
tsR
esp
on
sib
le a
nd
Eth
ica
l In
ve
stm
en
ts
ES
G Inte
gra
tion
Engagem
ent
Negative
/
Exclu
sio
nary
Scre
enin
g
Norm
s-B
ased
Scre
enin
g
Positiv
e/B
est-
In-C
lass
Scre
enin
g
Them
atic
Impact
Inve
sting
Agnostic
Avo
ids h
arm
Benefit
s s
takehold
ers
Lim
ited o
r no r
egard
for
ES
G facto
rsF
ocu
s
Conis
dera
tion o
f
ES
G facto
rs a
s
part
of in
vestm
ent
decis
ion
Usin
g s
hare
hold
er
pow
er
to influ
ence
corp
ora
te
behavi
our
Imp
act
Inte
nti
on
Industr
y s
ecto
rs
or
com
panie
s
exclu
ded/d
iveste
d
to a
void
ris
k a
nd
bett
er
alig
n w
ith
valu
es
Scre
enin
g o
ut
inve
stm
ents
that
do n
ot
meet
min
imum
sta
ndard
s a
nd
inclu
din
g
inve
stm
ents
that
meet
defin
ed
ES
G c
rite
ria
Inve
stm
ents
that
targ
et
com
panie
s
or
industr
ies w
ith
bett
er
ES
G
perform
ance
Inve
stm
ents
that
specifi
cally
targ
et
susta
inabili
ty
them
es
Inve
stm
ents
that
targ
et
positiv
e
socia
l and
envi
ronm
enta
l
impact
and p
rovi
de
either
a m
ark
et
or
belo
w m
ark
et
rate
Contr
ibute
s t
o s
olu
tions
Imp
act
Inte
nti
on
Deliv
ers
com
petitive
fin
ancia
l re
turn
s
Manages E
SG
ris
ks
Purs
ure
s E
SG
opport
unitie
s
Inte
ntionalit
y:
deliv
ery
of im
pact
is
centr
al to
underlyin
g a
sset/
inve
stm
ent
Impact
of
inve
stm
ent
is
measure
d/r
eport
ed
Page 6
Exchange Traded Funds
21 September 2021
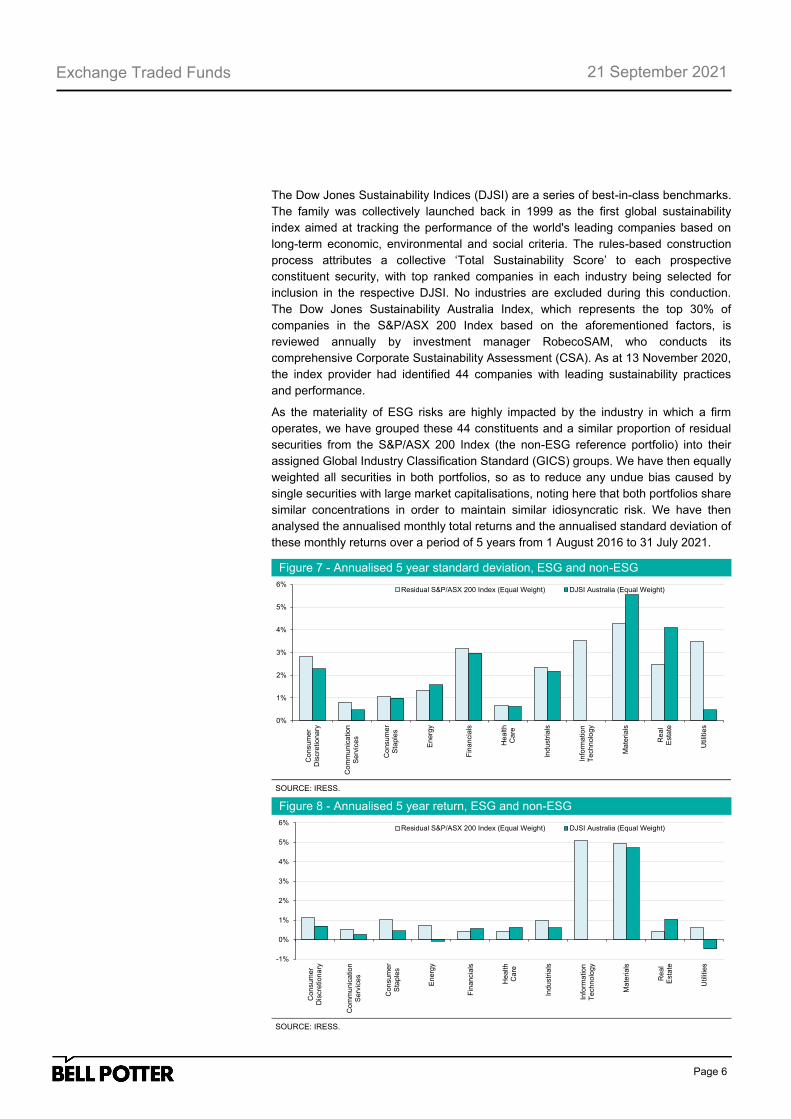
The Dow Jones Sustainability Indices (DJSI) are a series of best-in-class benchmarks.
The family was collectively launched back in 1999 as the first global sustainability
index aimed at tracking the performance of the world's leading companies based on
long-term economic, environmental and social criteria. The rules-based construction
process attributes a collective ‘Total Sustainability Score’ to each prospective
constituent security, with top ranked companies in each industry being selected for
inclusion in the respective DJSI. No industries are excluded during this conduction.
The Dow Jones Sustainability Australia Index, which represents the top 30% of
companies in the S&P/ASX 200 Index based on the aforementioned factors, is
reviewed annually by investment manager RobecoSAM, who conducts its
comprehensive Corporate Sustainability Assessment (CSA). As at 13 November 2020,
the index provider had identified 44 companies with leading sustainability practices
and performance.
As the materiality of ESG risks are highly impacted by the industry in which a firm
operates, we have grouped these 44 constituents and a similar proportion of residual
securities from the S&P/ASX 200 Index (the non-ESG reference portfolio) into their
assigned Global Industry Classification Standard (GICS) groups. We have then equally
weighted all securities in both portfolios, so as to reduce any undue bias caused by
single securities with large market capitalisations, noting here that both portfolios share
similar concentrations in order to maintain similar idiosyncratic risk. We have then
analysed the annualised monthly total returns and the annualised standard deviation of
these monthly returns over a period of 5 years from 1 August 2016 to 31 July 2021.
Figure 7 - Annualised 5 year standard deviation, ESG and non-ESG
SOURCE: IRESS.
SOURCE: IRESS.
Figure 8 - Annualised 5 year return, ESG and non-ESG
0%
1%
2%
3%
4%
5%
6%
Co
nsu
me
rD
iscre
tio
na
ry
Co
mm
unic
atio
nS
erv
ice
s
Co
nsu
me
rS
taple
s
En
erg
y
Fin
ancia
ls
He
alth
Ca
re
Ind
ustr
ials
Info
rma
tio
nT
ech
no
log
y
Ma
teri
als
Re
al
Esta
te
Utilit
ies
Residual S&P/ASX 200 Index (Equal Weight) DJSI Australia (Equal Weight)
-1%
0%
1%
2%
3%
4%
5%
6%
Co
nsu
me
rD
iscre
tiona
ry
Co
mm
un
ica
tio
nS
erv
ice
s
Co
nsu
me
rS
taple
s
En
erg
y
Fin
ancia
ls
He
alth
Ca
re
Industr
ials
Info
rma
tio
nT
ech
no
log
y
Ma
teri
als
Re
al
Esta
te
Utilit
ies
Residual S&P/ASX 200 Index (Equal Weight) DJSI Australia (Equal Weight)
Page 7
Exchange Traded Funds
21 September 2021
Our modelling in this sample scenario predicts that in 7 out of 10 applicable industry
cases, selective ESG companies are shown to exhibit lower security return volatilities
than reference non-ESG companies. These finding would suggest that companies with
superior corporate sustainability practices display relatively less risk. Interestingly,
ESG company selections in energy and materials produced lower risk-adjusted
returns, that is, a combination of both higher volatility and lower return than reference
non-ESG companies over the investment horizon.
Page 8
Exchange Traded Funds
21 September 2021
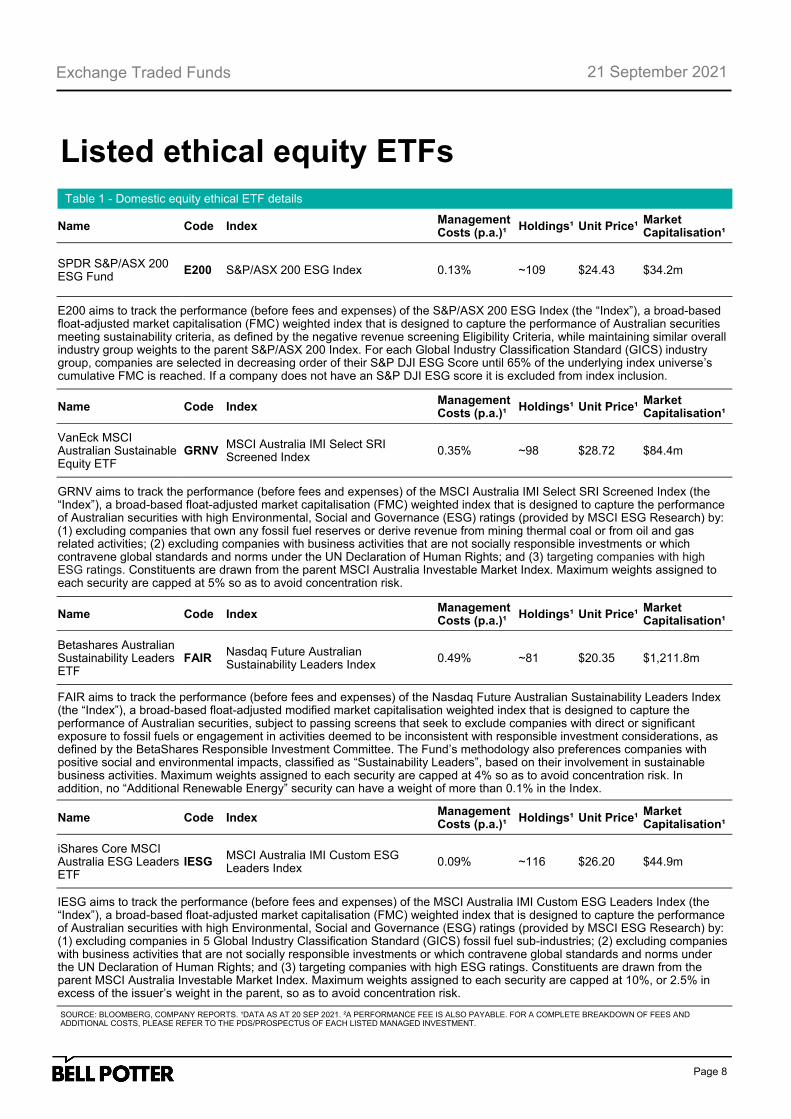
Table 1 - Domestic equity ethical ETF details
SOURCE: BLOOMBERG, COMPANY REPORTS. ¹DATA AS AT 20 SEP 2021. ²A PERFORMANCE FEE IS ALSO PAYABLE. FOR A COMPLETE BREAKDOWN OF FEES AND ADDITIONAL COSTS, PLEASE REFER TO THE PDS/PROSPECTUS OF EACH LISTED MANAGED INVESTMENT.
Name Code Index Management Costs (p.a.)¹
Holdings¹ Unit Price¹ Market Capitalisation¹
SPDR S&P/ASX 200 ESG Fund
E200 S&P/ASX 200 ESG Index 0.13% ~109 $24.43 $34.2m
E200 aims to track the performance (before fees and expenses) of the S&P/ASX 200 ESG Index (the “Index”), a broad-based float-adjusted market capitalisation (FMC) weighted index that is designed to capture the performance of Australian securities meeting sustainability criteria, as defined by the negative revenue screening Eligibility Criteria, while maintaining similar overall industry group weights to the parent S&P/ASX 200 Index. For each Global Industry Classification Standard (GICS) industry group, companies are selected in decreasing order of their S&P DJI ESG Score until 65% of the underlying index universe’s cumulative FMC is reached. If a company does not have an S&P DJI ESG score it is excluded from index inclusion.
Listed ethical equity ETFs
Name Code Index Management Costs (p.a.)¹
Holdings¹ Unit Price¹ Market Capitalisation¹
VanEck MSCI Australian Sustainable Equity ETF
GRNV MSCI Australia IMI Select SRI Screened Index
0.35% ~98 $28.72 $84.4m
GRNV aims to track the performance (before fees and expenses) of the MSCI Australia IMI Select SRI Screened Index (the “Index”), a broad-based float-adjusted market capitalisation (FMC) weighted index that is designed to capture the performance of Australian securities with high Environmental, Social and Governance (ESG) ratings (provided by MSCI ESG Research) by: (1) excluding companies that own any fossil fuel reserves or derive revenue from mining thermal coal or from oil and gas related activities; (2) excluding companies with business activities that are not socially responsible investments or which contravene global standards and norms under the UN Declaration of Human Rights; and (3) targeting companies with high ESG ratings. Constituents are drawn from the parent MSCI Australia Investable Market Index. Maximum weights assigned to each security are capped at 5% so as to avoid concentration risk.
Name Code Index Management Costs (p.a.)¹
Holdings¹ Unit Price¹ Market Capitalisation¹
Betashares Australian Sustainability Leaders ETF
FAIR Nasdaq Future Australian Sustainability Leaders Index
0.49% ~81 $20.35 $1,211.8m
FAIR aims to track the performance (before fees and expenses) of the Nasdaq Future Australian Sustainability Leaders Index (the “Index”), a broad-based float-adjusted modified market capitalisation weighted index that is designed to capture the performance of Australian securities, subject to passing screens that seek to exclude companies with direct or significant exposure to fossil fuels or engagement in activities deemed to be inconsistent with responsible investment considerations, as defined by the BetaShares Responsible Investment Committee. The Fund’s methodology also preferences companies with positive social and environmental impacts, classified as “Sustainability Leaders”, based on their involvement in sustainable business activities. Maximum weights assigned to each security are capped at 4% so as to avoid concentration risk. In addition, no “Additional Renewable Energy” security can have a weight of more than 0.1% in the Index.
Name Code Index Management Costs (p.a.)¹
Holdings¹ Unit Price¹ Market Capitalisation¹
iShares Core MSCI Australia ESG Leaders ETF
IESG MSCI Australia IMI Custom ESG Leaders Index
0.09% ~116 $26.20 $44.9m
IESG aims to track the performance (before fees and expenses) of the MSCI Australia IMI Custom ESG Leaders Index (the “Index”), a broad-based float-adjusted market capitalisation (FMC) weighted index that is designed to capture the performance of Australian securities with high Environmental, Social and Governance (ESG) ratings (provided by MSCI ESG Research) by: (1) excluding companies in 5 Global Industry Classification Standard (GICS) fossil fuel sub-industries; (2) excluding companies with business activities that are not socially responsible investments or which contravene global standards and norms under the UN Declaration of Human Rights; and (3) targeting companies with high ESG ratings. Constituents are drawn from the parent MSCI Australia Investable Market Index. Maximum weights assigned to each security are capped at 10%, or 2.5% in excess of the issuer’s weight in the parent, so as to avoid concentration risk.
Page 9
Exchange Traded Funds
21 September 2021
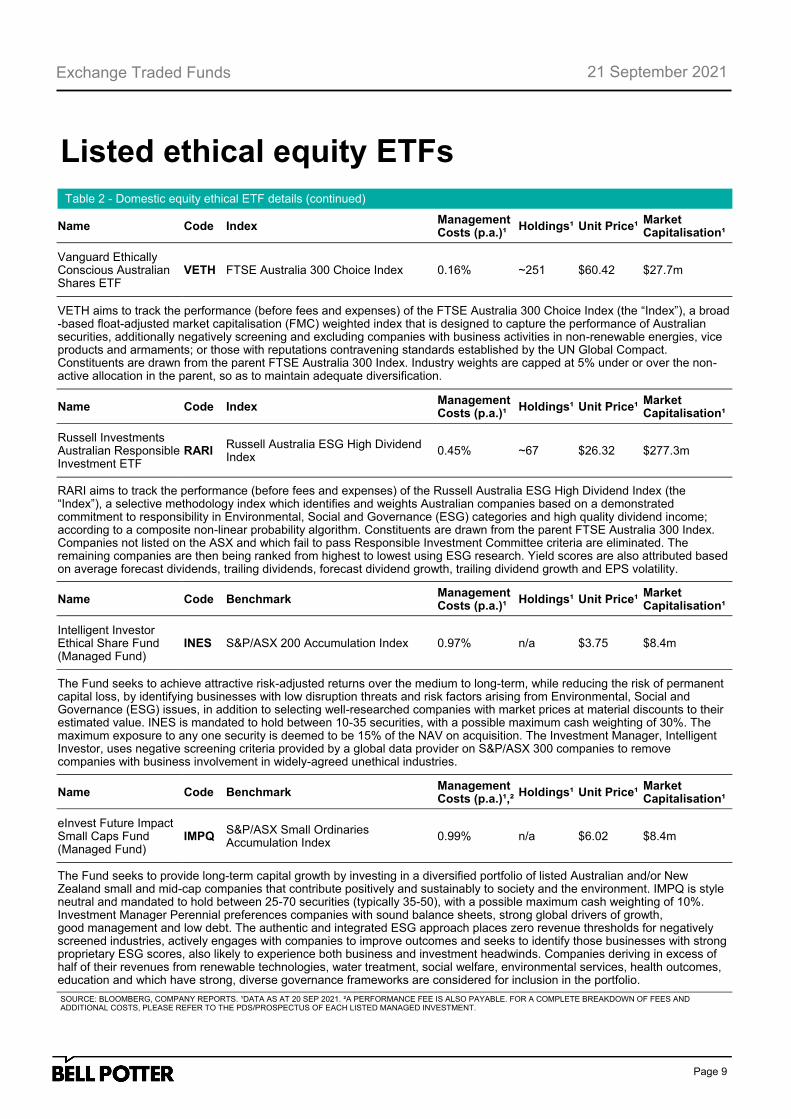
Table 2 - Domestic equity ethical ETF details (continued)
SOURCE: BLOOMBERG, COMPANY REPORTS. ¹DATA AS AT 20 SEP 2021. ²A PERFORMANCE FEE IS ALSO PAYABLE. FOR A COMPLETE BREAKDOWN OF FEES AND ADDITIONAL COSTS, PLEASE REFER TO THE PDS/PROSPECTUS OF EACH LISTED MANAGED INVESTMENT.
Name Code Index Management Costs (p.a.)¹
Holdings¹ Unit Price¹ Market Capitalisation¹
Vanguard Ethically Conscious Australian Shares ETF
VETH FTSE Australia 300 Choice Index 0.16% ~251 $60.42 $27.7m
VETH aims to track the performance (before fees and expenses) of the FTSE Australia 300 Choice Index (the “Index”), a broad-based float-adjusted market capitalisation (FMC) weighted index that is designed to capture the performance of Australian securities, additionally negatively screening and excluding companies with business activities in non-renewable energies, vice products and armaments; or those with reputations contravening standards established by the UN Global Compact. Constituents are drawn from the parent FTSE Australia 300 Index. Industry weights are capped at 5% under or over the non-active allocation in the parent, so as to maintain adequate diversification.
Listed ethical equity ETFs
Name Code Index Management Costs (p.a.)¹
Holdings¹ Unit Price¹ Market Capitalisation¹
Russell Investments Australian Responsible Investment ETF
RARI Russell Australia ESG High Dividend Index
0.45% ~67 $26.32 $277.3m
RARI aims to track the performance (before fees and expenses) of the Russell Australia ESG High Dividend Index (the “Index”), a selective methodology index which identifies and weights Australian companies based on a demonstrated commitment to responsibility in Environmental, Social and Governance (ESG) categories and high quality dividend income; according to a composite non-linear probability algorithm. Constituents are drawn from the parent FTSE Australia 300 Index. Companies not listed on the ASX and which fail to pass Responsible Investment Committee criteria are eliminated. The remaining companies are then being ranked from highest to lowest using ESG research. Yield scores are also attributed based on average forecast dividends, trailing dividends, forecast dividend growth, trailing dividend growth and EPS volatility.
Name Code Benchmark Management Costs (p.a.)¹
Holdings¹ Unit Price¹ Market Capitalisation¹
Intelligent Investor Ethical Share Fund (Managed Fund)
INES S&P/ASX 200 Accumulation Index 0.97% n/a $3.75 $8.4m
The Fund seeks to achieve attractive risk-adjusted returns over the medium to long-term, while reducing the risk of permanent capital loss, by identifying businesses with low disruption threats and risk factors arising from Environmental, Social and Governance (ESG) issues, in addition to selecting well-researched companies with market prices at material discounts to their estimated value. INES is mandated to hold between 10-35 securities, with a possible maximum cash weighting of 30%. The maximum exposure to any one security is deemed to be 15% of the NAV on acquisition. The Investment Manager, Intelligent Investor, uses negative screening criteria provided by a global data provider on S&P/ASX 300 companies to remove companies with business involvement in widely-agreed unethical industries.
Name Code Benchmark Management Costs (p.a.)¹,²
Holdings¹ Unit Price¹ Market Capitalisation¹
eInvest Future Impact Small Caps Fund (Managed Fund)
IMPQ S&P/ASX Small Ordinaries Accumulation Index
0.99% n/a $6.02 $8.4m
The Fund seeks to provide long-term capital growth by investing in a diversified portfolio of listed Australian and/or New Zealand small and mid-cap companies that contribute positively and sustainably to society and the environment. IMPQ is style neutral and mandated to hold between 25-70 securities (typically 35-50), with a possible maximum cash weighting of 10%. Investment Manager Perennial preferences companies with sound balance sheets, strong global drivers of growth, good management and low debt. The authentic and integrated ESG approach places zero revenue thresholds for negatively screened industries, actively engages with companies to improve outcomes and seeks to identify those businesses with strong proprietary ESG scores, also likely to experience both business and investment headwinds. Companies deriving in excess of half of their revenues from renewable technologies, water treatment, social welfare, environmental services, health outcomes, education and which have strong, diverse governance frameworks are considered for inclusion in the portfolio.
Page 10
Exchange Traded Funds
21 September 2021
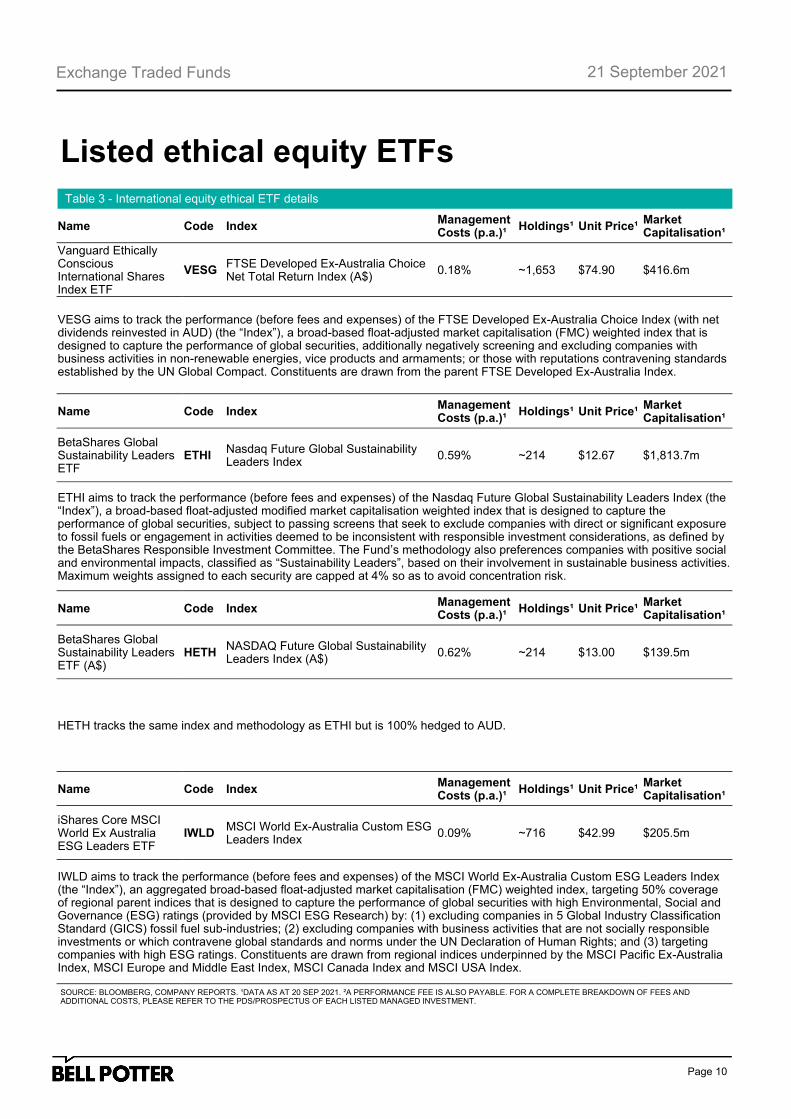
Table 3 - International equity ethical ETF details
SOURCE: BLOOMBERG, COMPANY REPORTS. ¹DATA AS AT 20 SEP 2021. ²A PERFORMANCE FEE IS ALSO PAYABLE. FOR A COMPLETE BREAKDOWN OF FEES AND ADDITIONAL COSTS, PLEASE REFER TO THE PDS/PROSPECTUS OF EACH LISTED MANAGED INVESTMENT.
Name Code Index Management Costs (p.a.)¹
Holdings¹ Unit Price¹ Market Capitalisation¹
Vanguard Ethically Conscious International Shares Index ETF
VESG FTSE Developed Ex-Australia Choice Net Total Return Index (A$)
0.18% ~1,653 $74.90 $416.6m
VESG aims to track the performance (before fees and expenses) of the FTSE Developed Ex-Australia Choice Index (with net dividends reinvested in AUD) (the “Index”), a broad-based float-adjusted market capitalisation (FMC) weighted index that is designed to capture the performance of global securities, additionally negatively screening and excluding companies with business activities in non-renewable energies, vice products and armaments; or those with reputations contravening standards established by the UN Global Compact. Constituents are drawn from the parent FTSE Developed Ex-Australia Index.
Listed ethical equity ETFs
Name Code Index Management Costs (p.a.)¹
Holdings¹ Unit Price¹ Market Capitalisation¹
BetaShares Global Sustainability Leaders ETF
ETHI Nasdaq Future Global Sustainability Leaders Index
0.59% ~214 $12.67 $1,813.7m
ETHI aims to track the performance (before fees and expenses) of the Nasdaq Future Global Sustainability Leaders Index (the “Index”), a broad-based float-adjusted modified market capitalisation weighted index that is designed to capture the performance of global securities, subject to passing screens that seek to exclude companies with direct or significant exposure to fossil fuels or engagement in activities deemed to be inconsistent with responsible investment considerations, as defined by the BetaShares Responsible Investment Committee. The Fund’s methodology also preferences companies with positive social and environmental impacts, classified as “Sustainability Leaders”, based on their involvement in sustainable business activities. Maximum weights assigned to each security are capped at 4% so as to avoid concentration risk.
Name Code Index Management Costs (p.a.)¹
Holdings¹ Unit Price¹ Market Capitalisation¹
BetaShares Global Sustainability Leaders ETF (A$)
HETH NASDAQ Future Global Sustainability Leaders Index (A$)
0.62% ~214 $13.00 $139.5m
HETH tracks the same index and methodology as ETHI but is 100% hedged to AUD.
Name Code Index Management Costs (p.a.)¹
Holdings¹ Unit Price¹ Market Capitalisation¹
iShares Core MSCI World Ex Australia ESG Leaders ETF
IWLD MSCI World Ex-Australia Custom ESG Leaders Index
0.09% ~716 $42.99 $205.5m
IWLD aims to track the performance (before fees and expenses) of the MSCI World Ex-Australia Custom ESG Leaders Index (the “Index”), an aggregated broad-based float-adjusted market capitalisation (FMC) weighted index, targeting 50% coverage of regional parent indices that is designed to capture the performance of global securities with high Environmental, Social and Governance (ESG) ratings (provided by MSCI ESG Research) by: (1) excluding companies in 5 Global Industry Classification Standard (GICS) fossil fuel sub-industries; (2) excluding companies with business activities that are not socially responsible investments or which contravene global standards and norms under the UN Declaration of Human Rights; and (3) targeting companies with high ESG ratings. Constituents are drawn from regional indices underpinned by the MSCI Pacific Ex-Australia Index, MSCI Europe and Middle East Index, MSCI Canada Index and MSCI USA Index.
Page 11
Exchange Traded Funds
21 September 2021
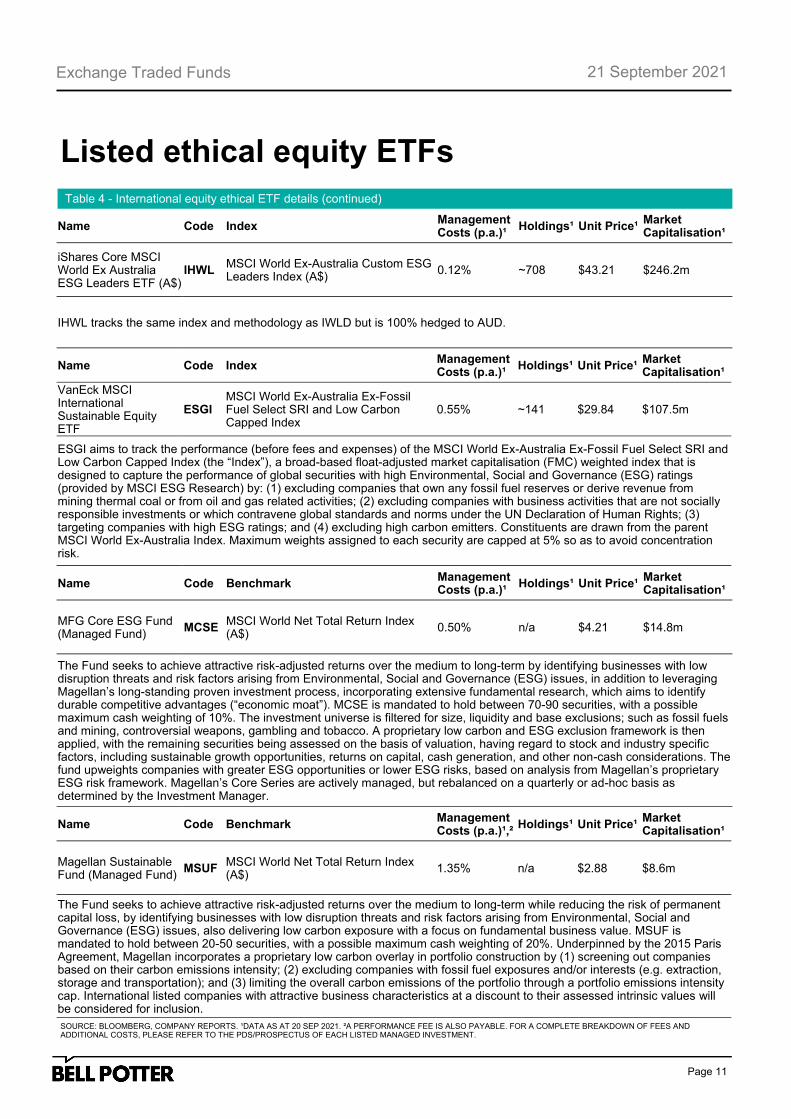
Table 4 - International equity ethical ETF details (continued)
SOURCE: BLOOMBERG, COMPANY REPORTS. ¹DATA AS AT 20 SEP 2021. ²A PERFORMANCE FEE IS ALSO PAYABLE. FOR A COMPLETE BREAKDOWN OF FEES AND ADDITIONAL COSTS, PLEASE REFER TO THE PDS/PROSPECTUS OF EACH LISTED MANAGED INVESTMENT.
Name Code Index Management Costs (p.a.)¹
Holdings¹ Unit Price¹ Market Capitalisation¹
iShares Core MSCI World Ex Australia ESG Leaders ETF (A$)
IHWL MSCI World Ex-Australia Custom ESG Leaders Index (A$)
0.12% ~708 $43.21 $246.2m
IHWL tracks the same index and methodology as IWLD but is 100% hedged to AUD.
Listed ethical equity ETFs
Name Code Index Management Costs (p.a.)¹
Holdings¹ Unit Price¹ Market Capitalisation¹
VanEck MSCI International Sustainable Equity ETF
ESGI MSCI World Ex-Australia Ex-Fossil Fuel Select SRI and Low Carbon Capped Index
0.55% ~141 $29.84 $107.5m
ESGI aims to track the performance (before fees and expenses) of the MSCI World Ex-Australia Ex-Fossil Fuel Select SRI and Low Carbon Capped Index (the “Index”), a broad-based float-adjusted market capitalisation (FMC) weighted index that is designed to capture the performance of global securities with high Environmental, Social and Governance (ESG) ratings (provided by MSCI ESG Research) by: (1) excluding companies that own any fossil fuel reserves or derive revenue from mining thermal coal or from oil and gas related activities; (2) excluding companies with business activities that are not socially responsible investments or which contravene global standards and norms under the UN Declaration of Human Rights; (3) targeting companies with high ESG ratings; and (4) excluding high carbon emitters. Constituents are drawn from the parent MSCI World Ex-Australia Index. Maximum weights assigned to each security are capped at 5% so as to avoid concentration risk.
Name Code Benchmark Management Costs (p.a.)¹
Holdings¹ Unit Price¹ Market Capitalisation¹
MFG Core ESG Fund (Managed Fund)
MCSE MSCI World Net Total Return Index (A$)
0.50% n/a $4.21 $14.8m
The Fund seeks to achieve attractive risk-adjusted returns over the medium to long-term by identifying businesses with low disruption threats and risk factors arising from Environmental, Social and Governance (ESG) issues, in addition to leveraging Magellan’s long-standing proven investment process, incorporating extensive fundamental research, which aims to identify durable competitive advantages (“economic moat”). MCSE is mandated to hold between 70-90 securities, with a possible maximum cash weighting of 10%. The investment universe is filtered for size, liquidity and base exclusions; such as fossil fuels and mining, controversial weapons, gambling and tobacco. A proprietary low carbon and ESG exclusion framework is then applied, with the remaining securities being assessed on the basis of valuation, having regard to stock and industry specific factors, including sustainable growth opportunities, returns on capital, cash generation, and other non-cash considerations. The fund upweights companies with greater ESG opportunities or lower ESG risks, based on analysis from Magellan’s proprietary ESG risk framework. Magellan’s Core Series are actively managed, but rebalanced on a quarterly or ad-hoc basis as determined by the Investment Manager.
Name Code Benchmark Management Costs (p.a.)¹,²
Holdings¹ Unit Price¹ Market Capitalisation¹
Magellan Sustainable Fund (Managed Fund)
MSUF MSCI World Net Total Return Index (A$)
1.35% n/a $2.88 $8.6m
The Fund seeks to achieve attractive risk-adjusted returns over the medium to long-term while reducing the risk of permanent capital loss, by identifying businesses with low disruption threats and risk factors arising from Environmental, Social and Governance (ESG) issues, also delivering low carbon exposure with a focus on fundamental business value. MSUF is mandated to hold between 20-50 securities, with a possible maximum cash weighting of 20%. Underpinned by the 2015 Paris Agreement, Magellan incorporates a proprietary low carbon overlay in portfolio construction by (1) screening out companies based on their carbon emissions intensity; (2) excluding companies with fossil fuel exposures and/or interests (e.g. extraction, storage and transportation); and (3) limiting the overall carbon emissions of the portfolio through a portfolio emissions intensity cap. International listed companies with attractive business characteristics at a discount to their assessed intrinsic values will be considered for inclusion.
Page 12
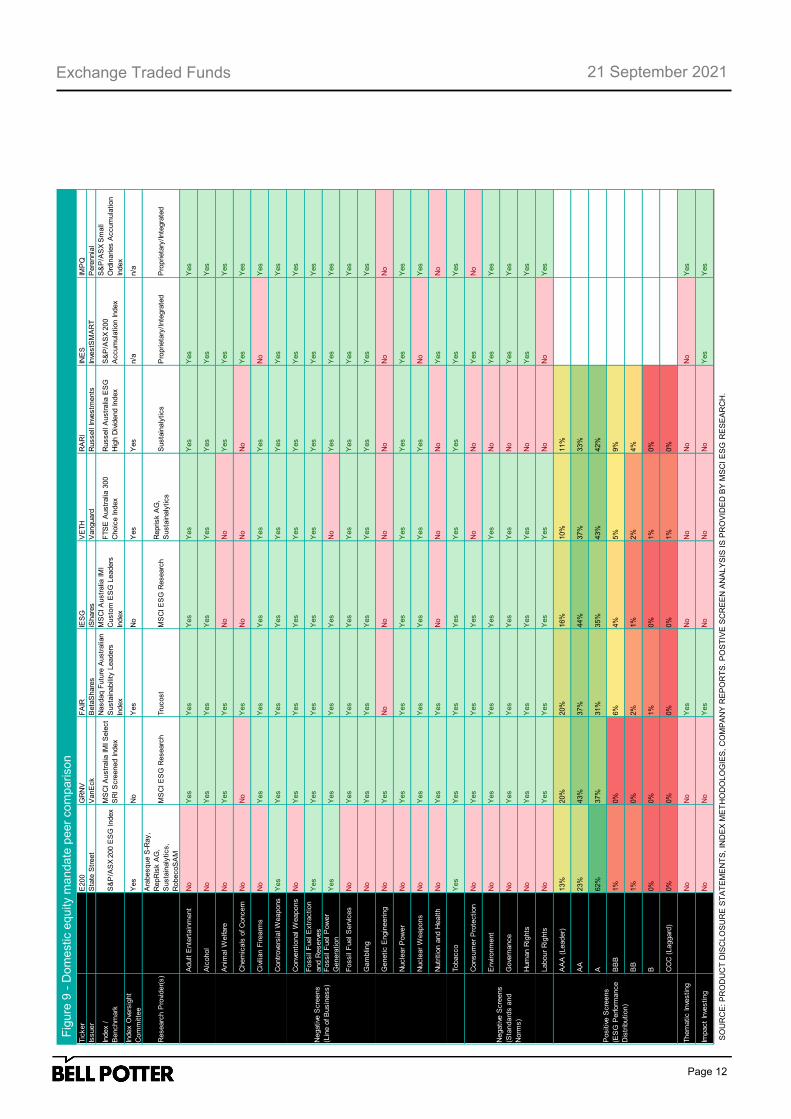
Exchange Traded Funds
21 September 2021 F
igure
9 -
Dom
estic e
qu
ity m
andate
peer
co
mparison
SO
UR
CE
: P
RO
DU
CT
DIS
CLO
SU
RE
ST
AT
EM
EN
TS
, IN
DE
X M
ET
HO
DO
LO
GIE
S,
CO
MP
AN
Y R
EP
OR
TS
. P
OS
TIV
E S
CR
EE
N A
NA
LY
SIS
IS
PR
OV
IDE
D B
Y M
SC
I E
SG
RE
SE
AR
CH
.
Tic
ker
E200
GR
NV
FA
IRIE
SG
VE
TH
RA
RI
INE
SIM
PQ
Issuer
Sta
te S
treet
VanE
ck
Beta
Share
siS
hare
sV
anguard
Russell
Inve
stm
ents
Inve
stS
MA
RT
Pere
nnia
l
Index /
Benchm
ark
S&
P/A
SX 2
00 E
SG
Index
MS
CI A
ustr
alia
IM
I S
ele
ct
SR
I S
cre
ened Index
Nasdaq F
utu
re A
ustr
alia
n
Susta
inabili
ty L
eaders
Index
MS
CI A
ustr
alia
IM
I
Custo
m E
SG
Leaders
Index
FTS
E A
ustr
alia
300
Choic
e Index
Russell
Austr
alia
ES
G
Hig
h D
ivid
end Index
S&
P/A
SX 2
00
Accum
ula
tion Index
S&
P/A
SX S
mall
Ord
inaries A
ccum
ula
tion
Index
Index O
vers
ight
Com
mitte
eY
es
No
Yes
No
Yes
Yes
n/a
n/a
Researc
h P
rovi
der(
s)
Ara
besque S
-Ray,
RepR
isk A
G,
Susta
inaly
tics,
RobecoS
AM
MS
CI E
SG
Researc
hTru
cost
MS
CI E
SG
Researc
hR
eprisk A
G,
Susta
inaly
tics
Susta
inaly
tics
Pro
prieta
ry/Inte
gra
ted
Pro
prieta
ry/Inte
gra
ted
Adult E
nte
rtain
ment
No
Yes
Yes
Yes
Yes
Yes
Yes
Yes
Alc
ohol
No
Yes
Yes
Yes
Yes
Yes
Yes
Yes
Anim
al W
elfa
reN
oY
es
Yes
No
No
Yes
Yes
Yes
Chem
icals
of C
oncern
No
No
Yes
No
No
No
Yes
Yes
Civ
ilian F
irearm
sN
oY
es
Yes
Yes
Yes
Yes
No
Yes
Contr
ove
rsia
l W
eapons
Yes
Yes
Yes
Yes
Yes
Yes
Yes
Yes
Conve
ntional W
eapons
No
Yes
Yes
Yes
Yes
Yes
Yes
Yes
Fossil
Fuel E
xtr
action
and R
eserv
es
Yes
Yes
Yes
Yes
Yes
Yes
Yes
Yes
Fossil
Fuel P
ow
er
Genera
tion
Yes
Yes
Yes
Yes
No
Yes
Yes
Yes
Fossil
Fuel S
erv
ices
No
Yes
Yes
Yes
Yes
Yes
Yes
Yes
Gam
blin
gN
oY
es
Yes
Yes
Yes
Yes
Yes
Yes
Genetic E
ngin
eering
No
Yes
No
No
No
No
No
No
Nucle
ar
Pow
er
No
Yes
Yes
Yes
Yes
Yes
Yes
Yes
Nucle
ar
Weapons
No
Yes
Yes
Yes
Yes
Yes
No
Yes
Nutr
itio
n a
nd H
ealth
No
Yes
Yes
No
No
No
Yes
No
Tobacco
Yes
Yes
Yes
Yes
Yes
Yes
Yes
Yes
Consum
er
Pro
tection
No
Yes
Yes
Yes
No
No
Yes
No
Envi
ronm
ent
No
Yes
Yes
Yes
Yes
No
Yes
Yes
Gove
rnance
No
Yes
Yes
Yes
Yes
No
Yes
Yes
Hum
an R
ights
No
Yes
Yes
Yes
Yes
No
Yes
Yes
Labour
Rig
hts
No
Yes
Yes
Yes
Yes
No
No
Yes
AA
A (
Leader)
13%
20%
20%
16%
10%
11%
AA
23%
43%
37%
44%
37%
33%
A62%
37%
31%
35%
43%
42%
BB
B1%
0%
6%
4%
5%
9%
BB
1%
0%
2%
1%
2%
4%
B0%
0%
1%
0%
1%
0%
CC
C (
Laggard
)0%
0%
0%
0%
1%
0%
Them
atic Inve
sting
No
No
Yes
No
No
No
No
Yes
Impact
Inve
sting
No
No
Yes
No
No
No
Yes
Yes
Negative
Scre
ens
(Lin
e o
f B
usin
ess)
Positiv
e S
cre
ens
(ES
G P
erform
ance
Dis
trib
ution)
Negative
Scre
ens
(Sta
ndard
s a
nd
Norm
s)
Page 13
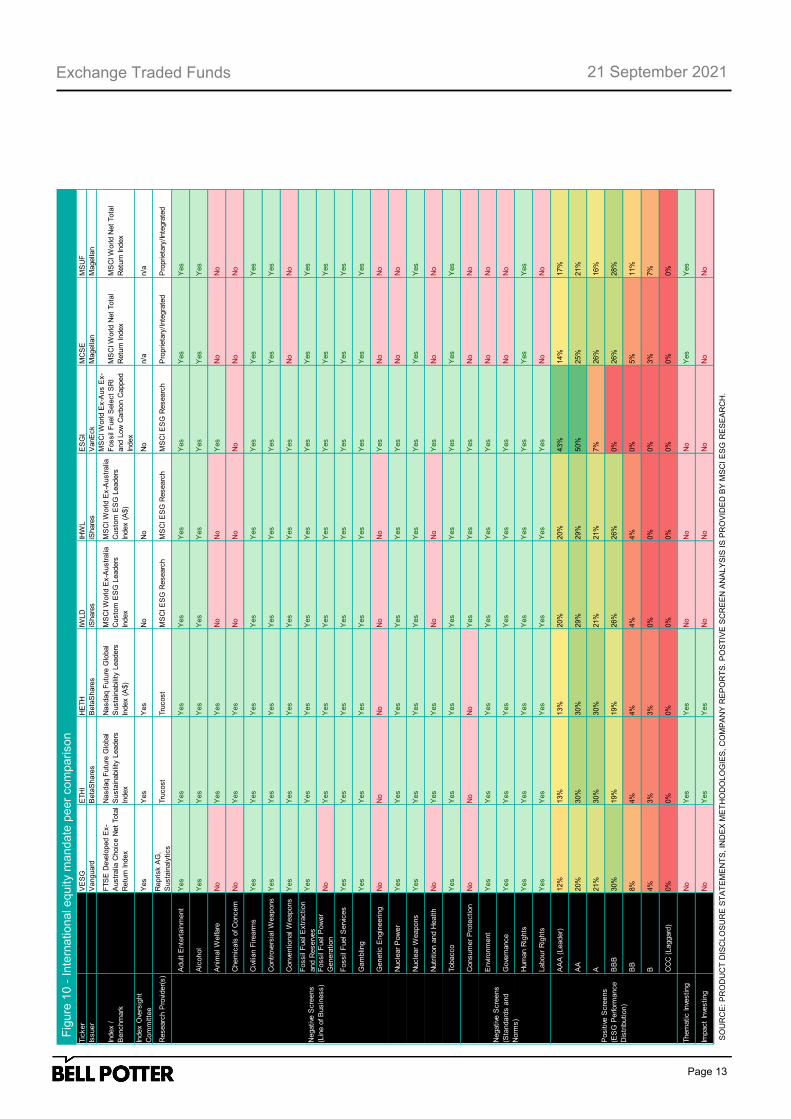
Exchange Traded Funds
21 September 2021 F
igure
10 -
Inte
rnational e
quity m
andate
peer
com
parison
SO
UR
CE
: P
RO
DU
CT
DIS
CLO
SU
RE
ST
AT
EM
EN
TS
, IN
DE
X M
ET
HO
DO
LO
GIE
S,
CO
MP
AN
Y R
EP
OR
TS
. P
OS
TIV
E S
CR
EE
N A
NA
LY
SIS
IS
PR
OV
IDE
D B
Y M
SC
I E
SG
RE
SE
AR
CH
.
Tic
ker
VE
SG
ETH
IH
ETH
IWLD
IHW
LE
SG
IM
CS
EM
SU
F
Issuer
Vanguard
Beta
Share
sB
eta
Share
siS
hare
siS
hare
sV
anE
ck
Magella
nM
agella
n
Index /
Benchm
ark
FTS
E D
eve
loped E
x-
Austr
alia
Choic
e N
et
Tota
l
Retu
rn Index
Nasdaq F
utu
re G
lobal
Susta
inabili
ty L
eaders
Index
Nasdaq F
utu
re G
lobal
Susta
inabili
ty L
eaders
Index (
A$)
MS
CI W
orld E
x-A
ustr
alia
Custo
m E
SG
Leaders
Index
MS
CI W
orld E
x-A
ustr
alia
Custo
m E
SG
Leaders
Index (
A$)
MS
CI W
orld E
x-A
us E
x-
Fossil
Fuel S
ele
ct
SR
I
and L
ow
Carb
on C
apped
Index
MS
CI W
orld N
et
Tota
l
Retu
rn Index
MS
CI W
orld N
et
Tota
l
Retu
rn Index
Index O
vers
ight
Com
mitte
eY
es
Yes
Yes
No
No
No
n/a
n/a
Researc
h P
rovi
der(
s)
Reprisk A
G,
Susta
inaly
tics
Tru
cost
Tru
cost
MS
CI E
SG
Researc
hM
SC
I E
SG
Researc
hM
SC
I E
SG
Researc
hP
roprieta
ry/Inte
gra
ted
Pro
prieta
ry/Inte
gra
ted
Adult E
nte
rtain
ment
Yes
Yes
Yes
Yes
Yes
Yes
Yes
Yes
Alc
ohol
Yes
Yes
Yes
Yes
Yes
Yes
Yes
Yes
Anim
al W
elfa
reN
oY
es
Yes
No
No
Yes
No
No
Chem
icals
of C
oncern
No
Yes
Yes
No
No
No
No
No
Civ
ilian F
irearm
sY
es
Yes
Yes
Yes
Yes
Yes
Yes
Yes
Contr
ove
rsia
l W
eapons
Yes
Yes
Yes
Yes
Yes
Yes
Yes
Yes
Conve
ntional W
eapons
Yes
Yes
Yes
Yes
Yes
Yes
No
No
Fossil
Fuel E
xtr
action
and R
eserv
es
Yes
Yes
Yes
Yes
Yes
Yes
Yes
Yes
Fossil
Fuel P
ow
er
Genera
tion
No
Yes
Yes
Yes
Yes
Yes
Yes
Yes
Fossil
Fuel S
erv
ices
Yes
Yes
Yes
Yes
Yes
Yes
Yes
Yes
Gam
blin
gY
es
Yes
Yes
Yes
Yes
Yes
Yes
Yes
Genetic E
ngin
eering
No
No
No
No
No
Yes
No
No
Nucle
ar
Pow
er
Yes
Yes
Yes
Yes
Yes
Yes
No
No
Nucle
ar
Weapons
Yes
Yes
Yes
Yes
Yes
Yes
Yes
Yes
Nutr
itio
n a
nd H
ealth
No
Yes
Yes
No
No
Yes
No
No
Tobacco
Yes
Yes
Yes
Yes
Yes
Yes
Yes
Yes
Consum
er
Pro
tection
No
No
No
Yes
Yes
Yes
No
No
Envi
ronm
ent
Yes
Yes
Yes
Yes
Yes
Yes
No
No
Gove
rnance
Yes
Yes
Yes
Yes
Yes
Yes
No
No
Hum
an R
ights
Yes
Yes
Yes
Yes
Yes
Yes
Yes
Yes
Labour
Rig
hts
Yes
Yes
Yes
Yes
Yes
Yes
No
No
AA
A (
Leader)
12%
13%
13%
20%
20%
43%
14%
17%
AA
20%
30%
30%
29%
29%
50%
25%
21%
A21%
30%
30%
21%
21%
7%
26%
16%
BB
B30%
19%
19%
26%
26%
0%
26%
28%
BB
8%
4%
4%
4%
4%
0%
5%
11%
B4%
3%
3%
0%
0%
0%
3%
7%
CC
C (
Laggard
)0%
0%
0%
0%
0%
0%
0%
0%
Them
atic Inve
sting
No
Yes
Yes
No
No
No
Yes
Yes
Impact
Inve
sting
No
Yes
Yes
No
No
No
No
No
Negative
Scre
ens
(Lin
e o
f B
usin
ess)
Positiv
e S
cre
ens
(ES
G P
erform
ance
Dis
trib
ution)
Negative
Scre
ens
(Sta
ndard
s a
nd
Norm
s)
Page 14
Exchange Traded Funds
21 September 2021
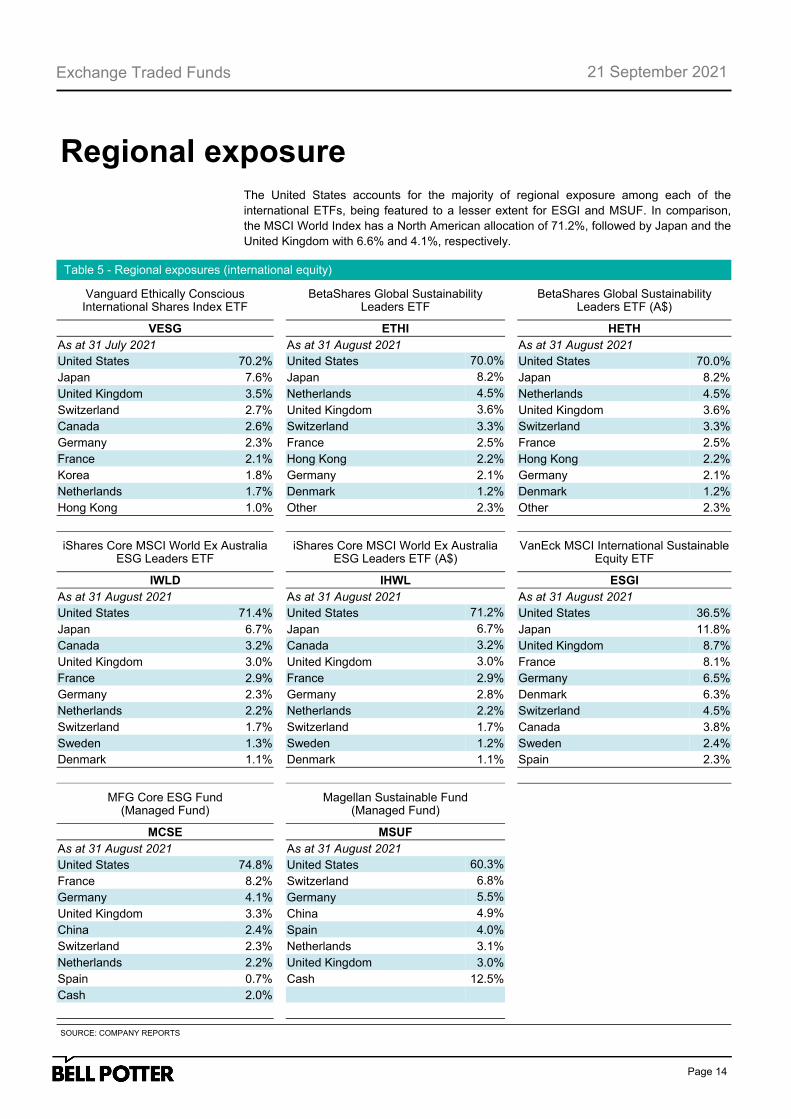
Regional exposure The United States accounts for the majority of regional exposure among each of the
international ETFs, being featured to a lesser extent for ESGI and MSUF. In comparison,
the MSCI World Index has a North American allocation of 71.2%, followed by Japan and the
United Kingdom with 6.6% and 4.1%, respectively.
Table 5 - Regional exposures (international equity)
Vanguard Ethically Conscious International Shares Index ETF
BetaShares Global Sustainability
Leaders ETF
BetaShares Global Sustainability Leaders ETF (A$)
VESG ETHI HETH
As at 31 July 2021 As at 31 August 2021 As at 31 August 2021
United States 70.2% United States 70.0% United States 70.0%
Japan 7.6% Japan 8.2% Japan 8.2%
United Kingdom 3.5% Netherlands 4.5% Netherlands 4.5%
Switzerland 2.7% United Kingdom 3.6% United Kingdom 3.6%
Canada 2.6% Switzerland 3.3% Switzerland 3.3%
Germany 2.3% France 2.5% France 2.5%
France 2.1% Hong Kong 2.2% Hong Kong 2.2%
Korea 1.8% Germany 2.1% Germany 2.1%
Netherlands 1.7% Denmark 1.2% Denmark 1.2%
Hong Kong 1.0% Other 2.3% Other 2.3%
iShares Core MSCI World Ex Australia ESG Leaders ETF
iShares Core MSCI World Ex Australia
ESG Leaders ETF (A$)
VanEck MSCI International Sustainable Equity ETF
IWLD IHWL ESGI
As at 31 August 2021 As at 31 August 2021 As at 31 August 2021
United States 71.4% United States 71.2% United States 36.5%
Japan 6.7% Japan 6.7% Japan 11.8%
Canada 3.2% Canada 3.2% United Kingdom 8.7%
United Kingdom 3.0% United Kingdom 3.0% France 8.1%
France 2.9% France 2.9% Germany 6.5%
Germany 2.3% Germany 2.8% Denmark 6.3%
Netherlands 2.2% Netherlands 2.2% Switzerland 4.5%
Switzerland 1.7% Switzerland 1.7% Canada 3.8%
Sweden 1.3% Sweden 1.2% Sweden 2.4%
Denmark 1.1% Denmark 1.1% Spain 2.3%
MFG Core ESG Fund (Managed Fund)
Magellan Sustainable Fund
(Managed Fund)
MCSE MSUF
As at 31 August 2021 As at 31 August 2021
United States 74.8% United States 60.3%
France 8.2% Switzerland 6.8%
Germany 4.1% Germany 5.5%
United Kingdom 3.3% China 4.9%
China 2.4% Spain 4.0%
Switzerland 2.3% Netherlands 3.1%
Netherlands 2.2% United Kingdom 3.0%
Spain 0.7% Cash 12.5%
Cash 2.0%
SOURCE: COMPANY REPORTS
Page 15
Exchange Traded Funds
21 September 2021
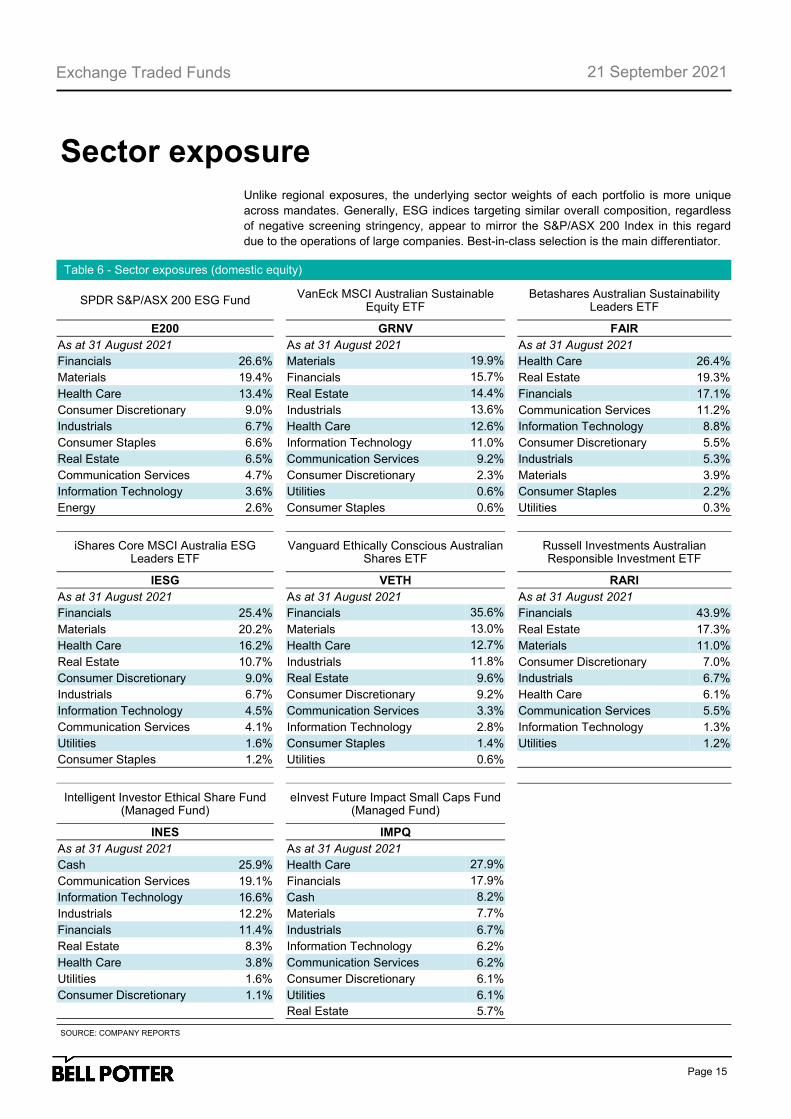
Sector exposure Unlike regional exposures, the underlying sector weights of each portfolio is more unique
across mandates. Generally, ESG indices targeting similar overall composition, regardless
of negative screening stringency, appear to mirror the S&P/ASX 200 Index in this regard
due to the operations of large companies. Best-in-class selection is the main differentiator.
Table 6 - Sector exposures (domestic equity)
SOURCE: COMPANY REPORTS
SPDR S&P/ASX 200 ESG Fund VanEck MSCI Australian Sustainable
Equity ETF
Betashares Australian Sustainability Leaders ETF
E200 GRNV FAIR
As at 31 August 2021 As at 31 August 2021 As at 31 August 2021
Financials 26.6% Materials 19.9% Health Care 26.4%
Materials 19.4% Financials 15.7% Real Estate 19.3%
Health Care 13.4% Real Estate 14.4% Financials 17.1%
Consumer Discretionary 9.0% Industrials 13.6% Communication Services 11.2%
Industrials 6.7% Health Care 12.6% Information Technology 8.8%
Consumer Staples 6.6% Information Technology 11.0% Consumer Discretionary 5.5%
Real Estate 6.5% Communication Services 9.2% Industrials 5.3%
Communication Services 4.7% Consumer Discretionary 2.3% Materials 3.9%
Information Technology 3.6% Utilities 0.6% Consumer Staples 2.2%
Energy 2.6% Consumer Staples 0.6% Utilities 0.3%
iShares Core MSCI Australia ESG Leaders ETF
Vanguard Ethically Conscious Australian
Shares ETF
Russell Investments Australian Responsible Investment ETF
IESG VETH RARI
As at 31 August 2021 As at 31 August 2021 As at 31 August 2021
Financials 25.4% Financials 35.6% Financials 43.9%
Materials 20.2% Materials 13.0% Real Estate 17.3%
Health Care 16.2% Health Care 12.7% Materials 11.0%
Real Estate 10.7% Industrials 11.8% Consumer Discretionary 7.0%
Consumer Discretionary 9.0% Real Estate 9.6% Industrials 6.7%
Industrials 6.7% Consumer Discretionary 9.2% Health Care 6.1%
Information Technology 4.5% Communication Services 3.3% Communication Services 5.5%
Communication Services 4.1% Information Technology 2.8% Information Technology 1.3%
Utilities 1.6% Consumer Staples 1.4% Utilities 1.2%
Consumer Staples 1.2% Utilities 0.6%
Intelligent Investor Ethical Share Fund (Managed Fund)
eInvest Future Impact Small Caps Fund
(Managed Fund)
INES IMPQ
As at 31 August 2021 As at 31 August 2021
Cash 25.9% Health Care 27.9%
Communication Services 19.1% Financials 17.9%
Information Technology 16.6% Cash 8.2%
Industrials 12.2% Materials 7.7%
Financials 11.4% Industrials 6.7%
Real Estate 8.3% Information Technology 6.2%
Health Care 3.8% Communication Services 6.2%
Utilities 1.6% Consumer Discretionary 6.1%
Consumer Discretionary 1.1% Utilities 6.1%
Real Estate 5.7%
Page 16
Exchange Traded Funds
21 September 2021
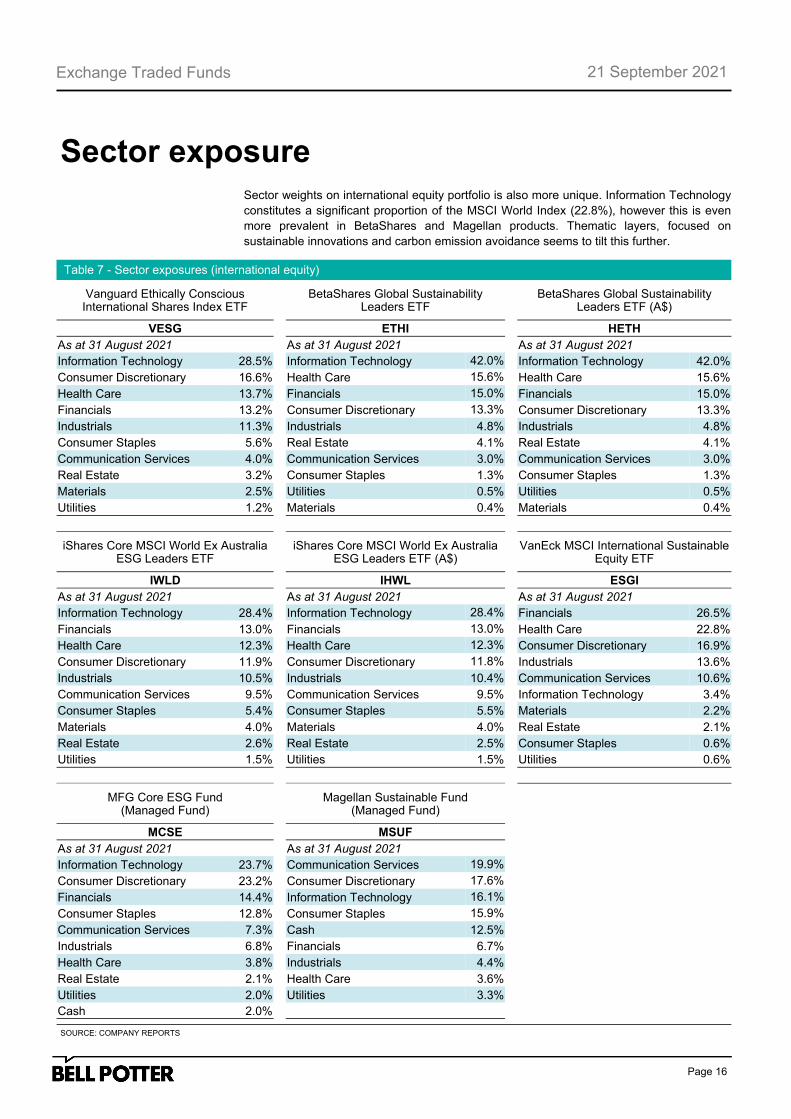
Sector exposure
Table 7 - Sector exposures (international equity)
SOURCE: COMPANY REPORTS
Vanguard Ethically Conscious International Shares Index ETF
BetaShares Global Sustainability
Leaders ETF
BetaShares Global Sustainability Leaders ETF (A$)
VESG ETHI HETH
As at 31 August 2021 As at 31 August 2021 As at 31 August 2021
Information Technology 28.5% Information Technology 42.0% Information Technology 42.0%
Consumer Discretionary 16.6% Health Care 15.6% Health Care 15.6%
Health Care 13.7% Financials 15.0% Financials 15.0%
Financials 13.2% Consumer Discretionary 13.3% Consumer Discretionary 13.3%
Industrials 11.3% Industrials 4.8% Industrials 4.8%
Consumer Staples 5.6% Real Estate 4.1% Real Estate 4.1%
Communication Services 4.0% Communication Services 3.0% Communication Services 3.0%
Real Estate 3.2% Consumer Staples 1.3% Consumer Staples 1.3%
Materials 2.5% Utilities 0.5% Utilities 0.5%
Utilities 1.2% Materials 0.4% Materials 0.4%
iShares Core MSCI World Ex Australia ESG Leaders ETF
iShares Core MSCI World Ex Australia
ESG Leaders ETF (A$)
VanEck MSCI International Sustainable Equity ETF
IWLD IHWL ESGI
As at 31 August 2021 As at 31 August 2021 As at 31 August 2021
Information Technology 28.4% Information Technology 28.4% Financials 26.5%
Financials 13.0% Financials 13.0% Health Care 22.8%
Health Care 12.3% Health Care 12.3% Consumer Discretionary 16.9%
Consumer Discretionary 11.9% Consumer Discretionary 11.8% Industrials 13.6%
Industrials 10.5% Industrials 10.4% Communication Services 10.6%
Communication Services 9.5% Communication Services 9.5% Information Technology 3.4%
Consumer Staples 5.4% Consumer Staples 5.5% Materials 2.2%
Materials 4.0% Materials 4.0% Real Estate 2.1%
Real Estate 2.6% Real Estate 2.5% Consumer Staples 0.6%
Utilities 1.5% Utilities 1.5% Utilities 0.6%
MFG Core ESG Fund (Managed Fund)
Magellan Sustainable Fund
(Managed Fund)
MCSE MSUF
As at 31 August 2021 As at 31 August 2021
Information Technology 23.7% Communication Services 19.9%
Consumer Discretionary 23.2% Consumer Discretionary 17.6%
Financials 14.4% Information Technology 16.1%
Consumer Staples 12.8% Consumer Staples 15.9%
Communication Services 7.3% Cash 12.5%
Industrials 6.8% Financials 6.7%
Health Care 3.8% Industrials 4.4%
Real Estate 2.1% Health Care 3.6%
Utilities 2.0% Utilities 3.3%
Cash 2.0%
Sector weights on international equity portfolio is also more unique. Information Technology
constitutes a significant proportion of the MSCI World Index (22.8%), however this is even
more prevalent in BetaShares and Magellan products. Thematic layers, focused on
sustainable innovations and carbon emission avoidance seems to tilt this further.
Page 17
Exchange Traded Funds
21 September 2021
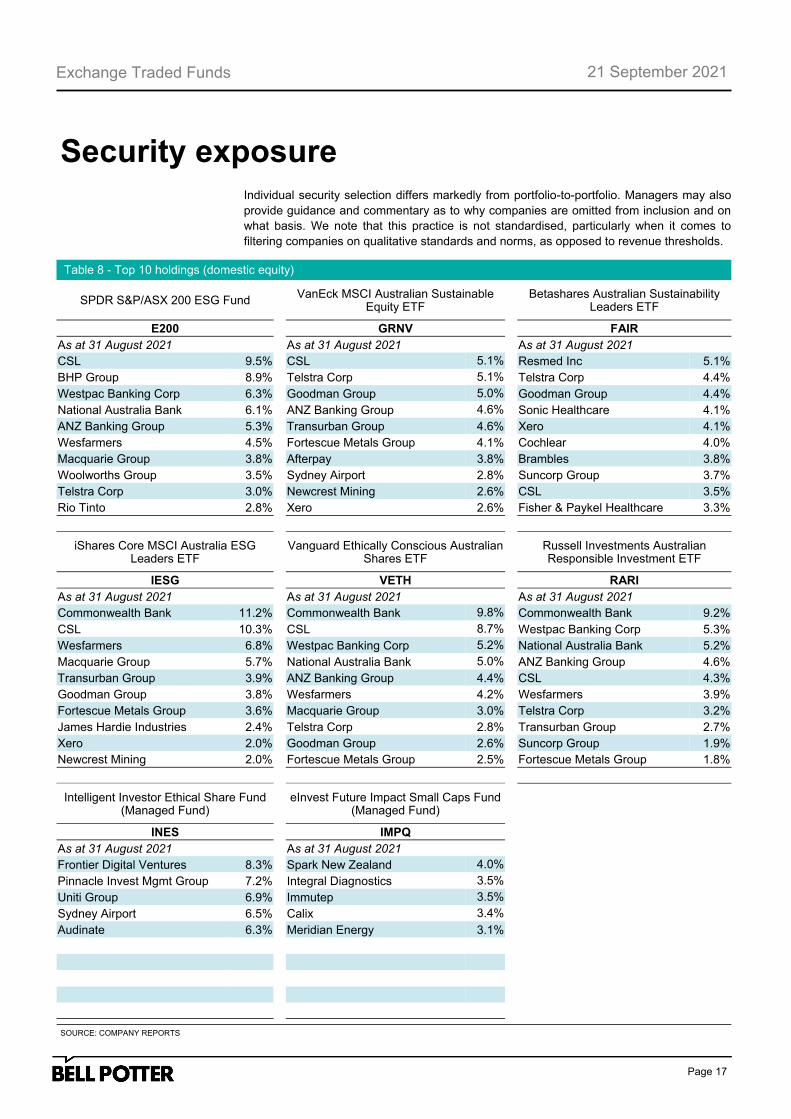
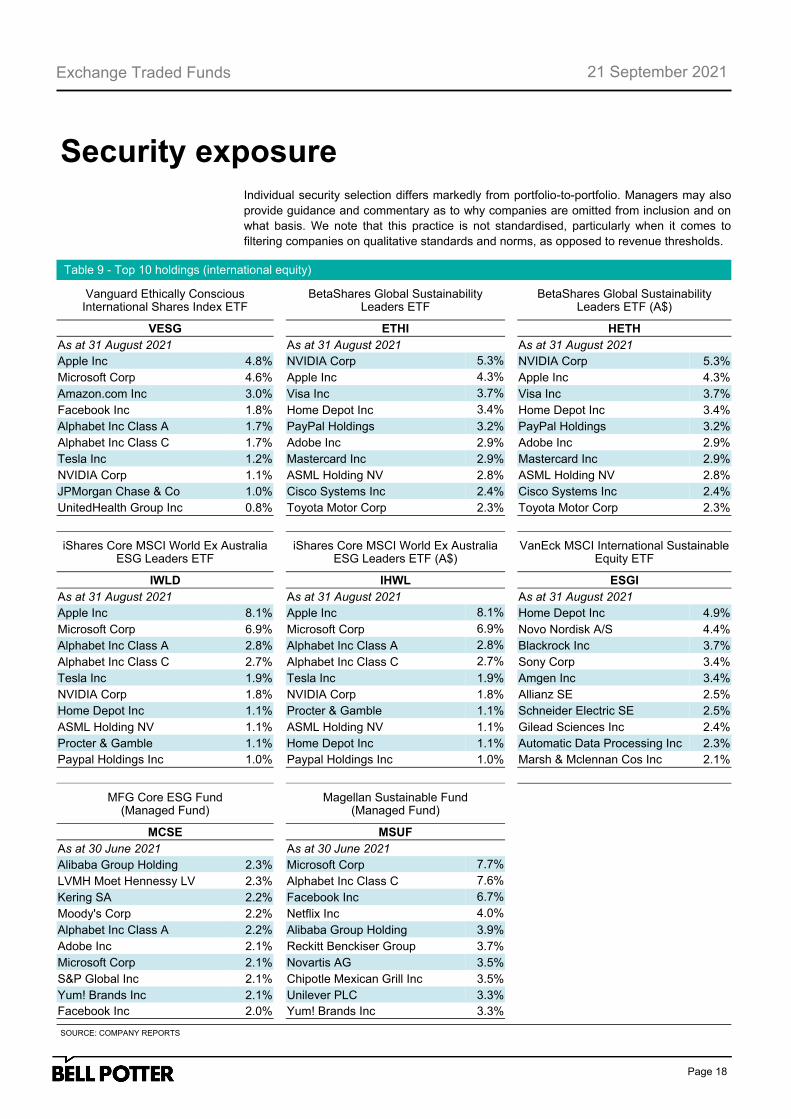
Security exposure Individual security selection differs markedly from portfolio-to-portfolio. Managers may also
provide guidance and commentary as to why companies are omitted from inclusion and on
what basis. We note that this practice is not standardised, particularly when it comes to
filtering companies on qualitative standards and norms, as opposed to revenue thresholds.
Table 8 - Top 10 holdings (domestic equity)
SOURCE: COMPANY REPORTS
SPDR S&P/ASX 200 ESG Fund VanEck MSCI Australian Sustainable
Equity ETF
Betashares Australian Sustainability Leaders ETF
E200 GRNV FAIR
As at 31 August 2021 As at 31 August 2021 As at 31 August 2021
CSL 9.5% CSL 5.1% Resmed Inc 5.1%
BHP Group 8.9% Telstra Corp 5.1% Telstra Corp 4.4%
Westpac Banking Corp 6.3% Goodman Group 5.0% Goodman Group 4.4%
National Australia Bank 6.1% ANZ Banking Group 4.6% Sonic Healthcare 4.1%
ANZ Banking Group 5.3% Transurban Group 4.6% Xero 4.1%
Wesfarmers 4.5% Fortescue Metals Group 4.1% Cochlear 4.0%
Macquarie Group 3.8% Afterpay 3.8% Brambles 3.8%
Woolworths Group 3.5% Sydney Airport 2.8% Suncorp Group 3.7%
Telstra Corp 3.0% Newcrest Mining 2.6% CSL 3.5%
Rio Tinto 2.8% Xero 2.6% Fisher & Paykel Healthcare 3.3%
iShares Core MSCI Australia ESG Leaders ETF
Vanguard Ethically Conscious Australian
Shares ETF
Russell Investments Australian Responsible Investment ETF
IESG VETH RARI
As at 31 August 2021 As at 31 August 2021 As at 31 August 2021
Commonwealth Bank 11.2% Commonwealth Bank 9.8% Commonwealth Bank 9.2%
CSL 10.3% CSL 8.7% Westpac Banking Corp 5.3%
Wesfarmers 6.8% Westpac Banking Corp 5.2% National Australia Bank 5.2%
Macquarie Group 5.7% National Australia Bank 5.0% ANZ Banking Group 4.6%
Transurban Group 3.9% ANZ Banking Group 4.4% CSL 4.3%
Goodman Group 3.8% Wesfarmers 4.2% Wesfarmers 3.9%
Fortescue Metals Group 3.6% Macquarie Group 3.0% Telstra Corp 3.2%
James Hardie Industries 2.4% Telstra Corp 2.8% Transurban Group 2.7%
Xero 2.0% Goodman Group 2.6% Suncorp Group 1.9%
Newcrest Mining 2.0% Fortescue Metals Group 2.5% Fortescue Metals Group 1.8%
Intelligent Investor Ethical Share Fund (Managed Fund)
eInvest Future Impact Small Caps Fund
(Managed Fund)
INES IMPQ
As at 31 August 2021 As at 31 August 2021
Frontier Digital Ventures 8.3% Spark New Zealand 4.0%
Pinnacle Invest Mgmt Group 7.2% Integral Diagnostics 3.5%
Uniti Group 6.9% Immutep 3.5%
Sydney Airport 6.5% Calix 3.4%
Audinate 6.3% Meridian Energy 3.1%
Page 18
Exchange Traded Funds
21 September 2021
Security exposure
Table 9 - Top 10 holdings (international equity)
SOURCE: COMPANY REPORTS
Vanguard Ethically Conscious International Shares Index ETF
BetaShares Global Sustainability
Leaders ETF
BetaShares Global Sustainability Leaders ETF (A$)
VESG ETHI HETH
As at 31 August 2021 As at 31 August 2021 As at 31 August 2021
Apple Inc 4.8% NVIDIA Corp 5.3% NVIDIA Corp 5.3%
Microsoft Corp 4.6% Apple Inc 4.3% Apple Inc 4.3%
Amazon.com Inc 3.0% Visa Inc 3.7% Visa Inc 3.7%
Facebook Inc 1.8% Home Depot Inc 3.4% Home Depot Inc 3.4%
Alphabet Inc Class A 1.7% PayPal Holdings 3.2% PayPal Holdings 3.2%
Alphabet Inc Class C 1.7% Adobe Inc 2.9% Adobe Inc 2.9%
Tesla Inc 1.2% Mastercard Inc 2.9% Mastercard Inc 2.9%
NVIDIA Corp 1.1% ASML Holding NV 2.8% ASML Holding NV 2.8%
JPMorgan Chase & Co 1.0% Cisco Systems Inc 2.4% Cisco Systems Inc 2.4%
UnitedHealth Group Inc 0.8% Toyota Motor Corp 2.3% Toyota Motor Corp 2.3%
iShares Core MSCI World Ex Australia ESG Leaders ETF
iShares Core MSCI World Ex Australia
ESG Leaders ETF (A$)
VanEck MSCI International Sustainable Equity ETF
IWLD IHWL ESGI
As at 31 August 2021 As at 31 August 2021 As at 31 August 2021
Apple Inc 8.1% Apple Inc 8.1% Home Depot Inc 4.9%
Microsoft Corp 6.9% Microsoft Corp 6.9% Novo Nordisk A/S 4.4%
Alphabet Inc Class A 2.8% Alphabet Inc Class A 2.8% Blackrock Inc 3.7%
Alphabet Inc Class C 2.7% Alphabet Inc Class C 2.7% Sony Corp 3.4%
Tesla Inc 1.9% Tesla Inc 1.9% Amgen Inc 3.4%
NVIDIA Corp 1.8% NVIDIA Corp 1.8% Allianz SE 2.5%
Home Depot Inc 1.1% Procter & Gamble 1.1% Schneider Electric SE 2.5%
ASML Holding NV 1.1% ASML Holding NV 1.1% Gilead Sciences Inc 2.4%
Procter & Gamble 1.1% Home Depot Inc 1.1% Automatic Data Processing Inc 2.3%
Paypal Holdings Inc 1.0% Paypal Holdings Inc 1.0% Marsh & Mclennan Cos Inc 2.1%
MFG Core ESG Fund (Managed Fund)
Magellan Sustainable Fund
(Managed Fund)
MCSE MSUF
As at 30 June 2021 As at 30 June 2021
Alibaba Group Holding 2.3% Microsoft Corp 7.7%
LVMH Moet Hennessy LV 2.3% Alphabet Inc Class C 7.6%
Kering SA 2.2% Facebook Inc 6.7%
Moody's Corp 2.2% Netflix Inc 4.0%
Alphabet Inc Class A 2.2% Alibaba Group Holding 3.9%
Adobe Inc 2.1% Reckitt Benckiser Group 3.7%
Microsoft Corp 2.1% Novartis AG 3.5%
S&P Global Inc 2.1% Chipotle Mexican Grill Inc 3.5%
Yum! Brands Inc 2.1% Unilever PLC 3.3%
Facebook Inc 2.0% Yum! Brands Inc 3.3%
Individual security selection differs markedly from portfolio-to-portfolio. Managers may also
provide guidance and commentary as to why companies are omitted from inclusion and on
what basis. We note that this practice is not standardised, particularly when it comes to
filtering companies on qualitative standards and norms, as opposed to revenue thresholds.
Page 19
Exchange Traded Funds
21 September 2021
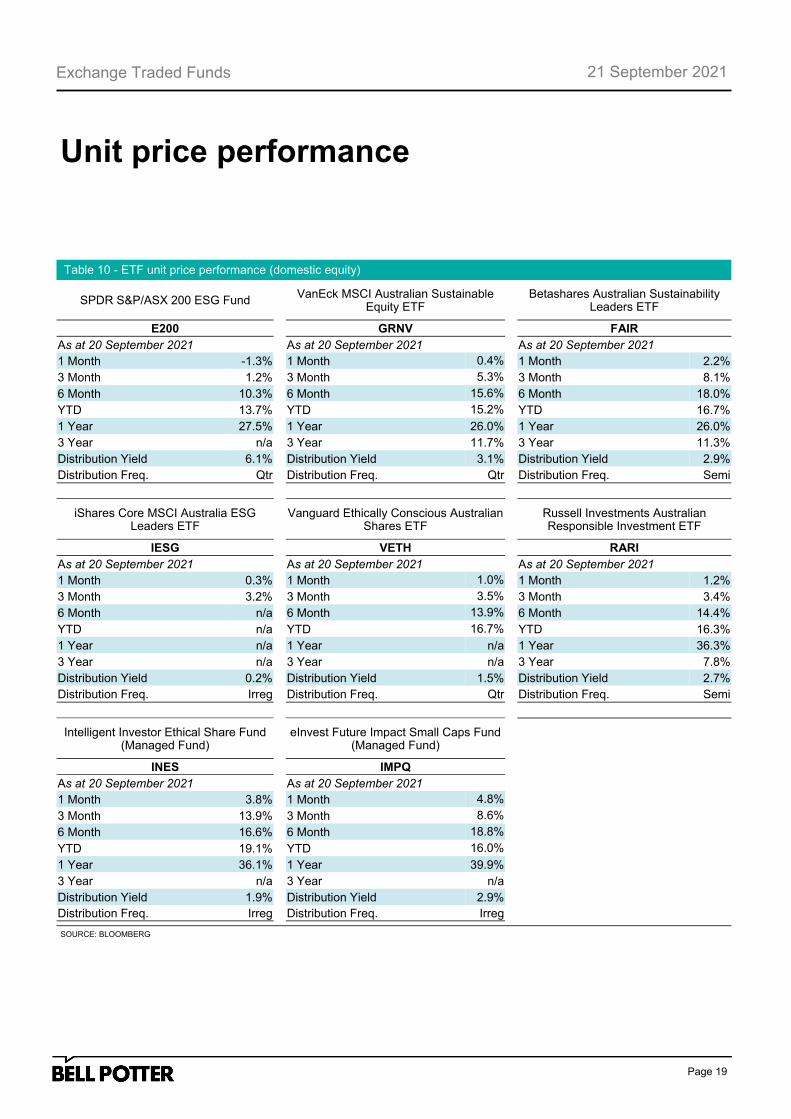
Unit price performance
Table 10 - ETF unit price performance (domestic equity)
SOURCE: BLOOMBERG
SPDR S&P/ASX 200 ESG Fund VanEck MSCI Australian Sustainable
Equity ETF
Betashares Australian Sustainability Leaders ETF
E200 GRNV FAIR
As at 20 September 2021 As at 20 September 2021 As at 20 September 2021
1 Month -1.3% 1 Month 0.4% 1 Month 2.2%
3 Month 1.2% 3 Month 5.3% 3 Month 8.1%
6 Month 10.3% 6 Month 15.6% 6 Month 18.0%
YTD 13.7% YTD 15.2% YTD 16.7%
1 Year 27.5% 1 Year 26.0% 1 Year 26.0%
3 Year n/a 3 Year 11.7% 3 Year 11.3%
Distribution Yield 6.1% Distribution Yield 3.1% Distribution Yield 2.9%
Distribution Freq. Qtr Distribution Freq. Qtr Distribution Freq. Semi
iShares Core MSCI Australia ESG Leaders ETF
Vanguard Ethically Conscious Australian
Shares ETF
Russell Investments Australian Responsible Investment ETF
IESG VETH RARI
As at 20 September 2021 As at 20 September 2021 As at 20 September 2021
1 Month 0.3% 1 Month 1.0% 1 Month 1.2%
3 Month 3.2% 3 Month 3.5% 3 Month 3.4%
6 Month n/a 6 Month 13.9% 6 Month 14.4%
YTD n/a YTD 16.7% YTD 16.3%
1 Year n/a 1 Year n/a 1 Year 36.3%
3 Year n/a 3 Year n/a 3 Year 7.8%
Distribution Yield 0.2% Distribution Yield 1.5% Distribution Yield 2.7%
Distribution Freq. Irreg Distribution Freq. Qtr Distribution Freq. Semi
Intelligent Investor Ethical Share Fund (Managed Fund)
eInvest Future Impact Small Caps Fund
(Managed Fund)
INES IMPQ
As at 20 September 2021 As at 20 September 2021
1 Month 3.8% 1 Month 4.8%
3 Month 13.9% 3 Month 8.6%
6 Month 16.6% 6 Month 18.8%
YTD 19.1% YTD 16.0%
1 Year 36.1% 1 Year 39.9%
3 Year n/a 3 Year n/a
Distribution Yield 1.9% Distribution Yield 2.9%
Distribution Freq. Irreg Distribution Freq. Irreg
Page 20
Exchange Traded Funds
21 September 2021
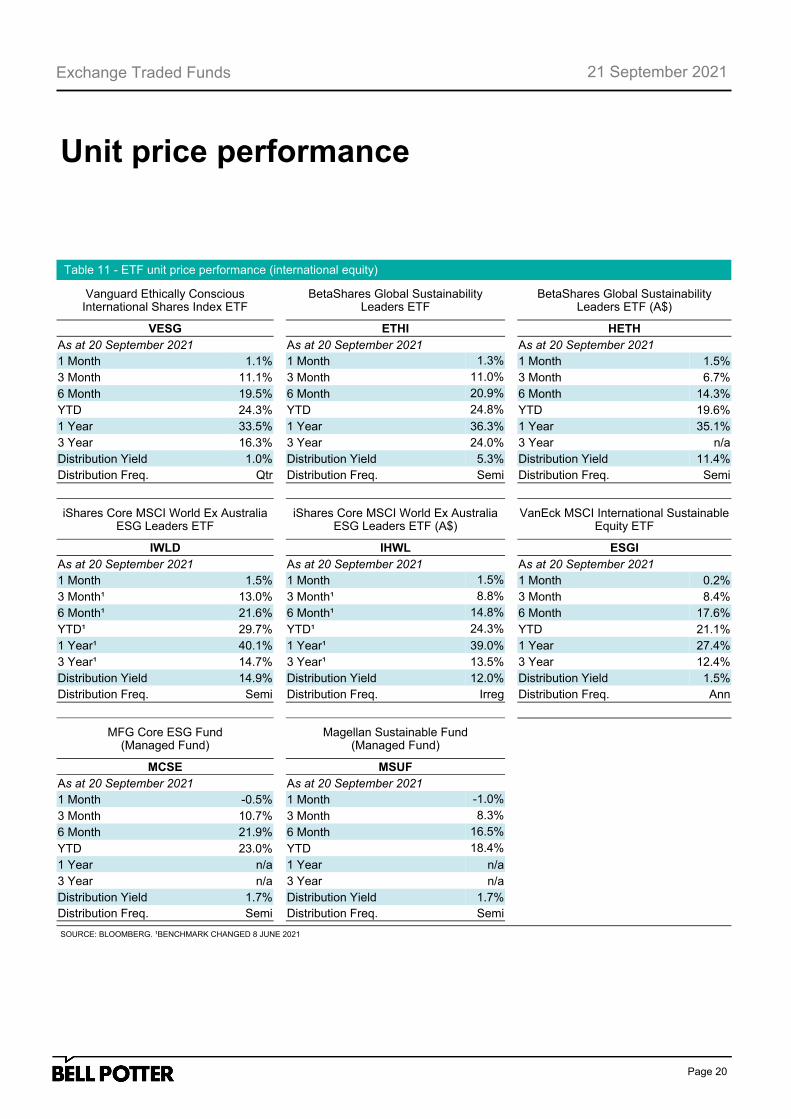
Unit price performance
Table 11 - ETF unit price performance (international equity)
SOURCE: BLOOMBERG. ¹BENCHMARK CHANGED 8 JUNE 2021
Vanguard Ethically Conscious International Shares Index ETF
BetaShares Global Sustainability
Leaders ETF
BetaShares Global Sustainability Leaders ETF (A$)
VESG ETHI HETH
As at 20 September 2021 As at 20 September 2021 As at 20 September 2021
1 Month 1.1% 1 Month 1.3% 1 Month 1.5%
3 Month 11.1% 3 Month 11.0% 3 Month 6.7%
6 Month 19.5% 6 Month 20.9% 6 Month 14.3%
YTD 24.3% YTD 24.8% YTD 19.6%
1 Year 33.5% 1 Year 36.3% 1 Year 35.1%
3 Year 16.3% 3 Year 24.0% 3 Year n/a
Distribution Yield 1.0% Distribution Yield 5.3% Distribution Yield 11.4%
Distribution Freq. Qtr Distribution Freq. Semi Distribution Freq. Semi
iShares Core MSCI World Ex Australia ESG Leaders ETF
iShares Core MSCI World Ex Australia
ESG Leaders ETF (A$)
VanEck MSCI International Sustainable Equity ETF
IWLD IHWL ESGI
As at 20 September 2021 As at 20 September 2021 As at 20 September 2021
1 Month 1.5% 1 Month 1.5% 1 Month 0.2%
3 Month¹ 13.0% 3 Month¹ 8.8% 3 Month 8.4%
6 Month¹ 21.6% 6 Month¹ 14.8% 6 Month 17.6%
YTD¹ 29.7% YTD¹ 24.3% YTD 21.1%
1 Year¹ 40.1% 1 Year¹ 39.0% 1 Year 27.4%
3 Year¹ 14.7% 3 Year¹ 13.5% 3 Year 12.4%
Distribution Yield 14.9% Distribution Yield 12.0% Distribution Yield 1.5%
Distribution Freq. Semi Distribution Freq. Irreg Distribution Freq. Ann
MFG Core ESG Fund (Managed Fund)
Magellan Sustainable Fund
(Managed Fund)
MCSE MSUF
As at 20 September 2021 As at 20 September 2021
1 Month -0.5% 1 Month -1.0%
3 Month 10.7% 3 Month 8.3%
6 Month 21.9% 6 Month 16.5%
YTD 23.0% YTD 18.4%
1 Year n/a 1 Year n/a
3 Year n/a 3 Year n/a
Distribution Yield 1.7% Distribution Yield 1.7%
Distribution Freq. Semi Distribution Freq. Semi
Page 21
Exchange Traded Funds
21 September 2021
Risks
Investment strategy risk: Historical performance is no guarantee of future
performance, and cannot be solely relied upon in evaluating a manager’s ability to
provide value. There is no guarantee that the strategy of a fund will be executed by
the manager/provider successfully or will deliver in meeting it’s desired objectives.
Manager/Responsible entity risk: A fund could unexpectedly terminate, change
its fees and expenses, or the responsible entity may be replaced by another entity.
Key personal from the investment manager of an actively managed fund may also
leave.
Currency risk: Unhedged investments in global securities are subject to
fluctuations in foreign exchange rates that may adversely affect the AUD value of the
portfolio. Conversely, hedged investment vehicles may underperform if there are
positive AUD movements in the foreign exchange market.
Concentration risk: A smaller number of holdings in a fund may increase the non-
systemic associated with the portfolio.
Underlying benchmark risk: Investors should understand the objective of the
index and in particular the selection criteria and methodology of individual weighting
in the benchmark. There is no guarantee that the benchmark used will meet its
objectives or produce a satisfactory return.
Geographic risk: A natural or other disaster could occur in a geographic area
that may have an adverse impact on a large proportion of the underlying companies’
operations and therefore the return of the fund.
Liquidity risk: ETFs are generally highly reliable on market makers making a
market in units to ensure stable liquidity. There may be times when market liquidity is
thin and spreads widen out which possesses a risk of trading at a price that is less
representative of the fair value of the ETF.
Tracking risk: The price at which the units trade on the ASX may not accurately
reflect the NAV at a particular point in time. The role of the market maker will be to
minimise the tracking error, not to eliminate it.
Refer to the PDS/Prospectus of each Listed Managed Investment for further
information on risks associated with each specific investment and the risks of
using ETFs.
Page 22
Exchange Traded Funds
21 September 2021
Exchange Traded Funds
The following may affect your legal rights. Important Disclaimer:
This document is a private communication to clients and is not intended for public circulation or for the use of any third party, without the prior approval of Bell Potter Securities Limited. In the USA and the UK this research is only for institutional investors. It is not for release, publication or distribution in whole or in part to any persons in the two specified countries. In Hong Kong, this research is being distributed by Bell Potter Securities (HK) Limited which is licensed and regulated by the Securities and Futures Commission, Hong Kong. In the United States, this research is issued and distributed by Bell Potter Securities (US) LLC which is a registered broker-dealer and member of FINRA. Any person receiving this report from Bell Potter Securities (US) LLC and wishing to transact in any security described herein should do so with Bell Potter Securities (US) LLC.
This is general investment advice only and does not constitute personal advice to any person. Because this document has been prepared without consideration of any specific client’s financial situation, particular needs and investment objectives (‘relevant personal circumstances’), a Bell Potter Securities Limited investment adviser (or the financial services licensee, or the representative of such licensee, who has provided you with this report by arrangement with Bell Potter Securities Limited) should be made aware of your relevant personal circumstances and consulted before any investment decision is made on the basis of this document.
While this document is based on information from sources which are considered reliable, Bell Potter Securities Limited has not verified independently the information contained in the document and Bell Potter Securities Limited and its directors, employees and consultants do not represent, warrant or guarantee, expressly or impliedly, that the information contained in this document is complete or accurate. Nor does Bell Potter Securities Limited accept any responsibility for updating any advice, views opinions, or recommendations contained in this document or for correcting any error or omission which may become apparent after the document has been issued.
Except insofar as liability under any statute cannot be excluded. Bell Potter Securities Limited and its directors, employees and consultants do not accept any liability (whether arising in contract, in tort or negligence or otherwise) for any error or omission in this document or for any resulting loss or damage (whether direct, indirect, consequential or otherwise) suffered by the recipient of this document or any other person.
Research Policies:
For Bell Potter’s Research Coverage Decision Making Process and Research Independence Policy, please refer to our company website:
https://www.bellpotter.com.au/topnavigation/private-clients/stockbroking/research
Disclosure of interest:
Bell Potter Securities Limited, its employees, consultants and its associates within the meaning of Chapter 7 of the Corporations Law may receive commissions, underwriting and management fees from transactions involving securities referred to in this document (which its representatives may directly share) and may from time to time hold interests in the securities referred to in this document.
ANALYST CERTIFICATION
Each research analyst primarily responsible for the content of this research report, in whole or in part, certifies that with respect to each security or issuer that the analyst covered in this report: (1) all of the views expressed accurately reflect his or her personal views about those securities or issuers and were prepared in an independent manner and (2) no part of his or her compensation was, is, or will be, directly or indirectly, related to the specific recommendations or views expressed by that research analyst in the research report.
Bell Potter Securities Limited ACN25 006 390 7721 Level 29, 101 Collins Street Melbourne, Victoria, 3000 Telephone +61 3 9256 8700 www.bellpotter.com.au
Bell Potter Securities (HK) Limited Room 1701, 17/F Prosperity Tower, 39 Queens Road Central, Hong Kong, 0000 Telephone +852 3750 8400
Bell Potter Securities (US) LLC Floor 39 444 Madison Avenue, New York NY 10022, U.S.A Telephone +1 917 819 1410
Bell Potter Securities (UK) Limited 16 Berkeley Street London, England W1J 8DZ, United Kingdom Telephone +44 7734 2929