Sustainable Energy Strategy for Iran - OPUS 4 ... · Sustainable Energy Strategy for Iran...
200
Saeed Moshiri Stefan Lechtenböhmer Sustainable Energy Strategy for Iran WUPPERTAL SPEZIAL 51 Wuppertal Institute for Climate, Environment and Energy
-
Upload
nguyenphuc -
Category
Documents
-
view
216 -
download
0
Transcript of Sustainable Energy Strategy for Iran - OPUS 4 ... · Sustainable Energy Strategy for Iran...

Saeed MoshiriStefan Lechtenböhmer
Sustainable Energy Strategy for Iran
W U P P E R T A L S P E Z I A L 5 1
Wuppertal Institute for Climate, Environment and Energy

Publisher:
Wuppertal Institute for Climate, Environment and Energy Döppersberg 19 42103 Wuppertal Germany
www.wupperinst.org
This work is published under a Creative Commons Attribution–NonCommercial–NoDerivatives License 3.0 Germany | http://creativecommons.org/licenses/by-nc-nd/3.0/de

German-Iranian Cooperation on Sustainable Energy
A Short History of the Genesis
The relationship between the Orient and the Occident in the 20th century was characterized by vested interests of the West in matters of security of energy supply. A respectful partnership in the field of energy research for the benefit of both sides was not an item on the agenda at this time, particularly not with regard to Iran. However, this one-dimensional geostrategic interest was not conductive to relieving stresses and conflicts, but instead reinforced them.
Despite the hegemonic “friend or foe” paradigm within the political arena, at the beginning of 2002 the Wuppertal Institute for Climate, Environment and Energy and Osnabrück University started a civil-society-oriented initiative with the objective of developing “Sustainable Energy Policies for Iran” together with Iranian partners. This project has been designed to generate cooperation, it is based on a win-win strategy, and it sends a signal of international understanding by means of scientific collaboration.
As these cooperative efforts have crystallized, it is clear they have been advantageous, instructive and productive for both sides. The book in hand is an important result of this collaboration. So its publication lends itself to taking stock of these twelve years of continued cooperation. This initiative set out to assemble acquired knowledge on strategies regarding sustainable energy from Germany as well as the rest of the world and make the most recent and up-to-date research on energy efficiency and renewable energies accessible to Iran and its scientific and political institutions. In the first years (2003-2005), the project focused on exchange in the form of topical discus sions on energy policies and the development of mutual understanding through several conferences and workshops.
Prominent professionals and energy experts from universities, Iranian ministries and the Energy Committee of the Iranian Parliament, and the private sector all joined in. The research team, which included Iranian and German energy experts, published its first report, “Investigation on Potentials, Barriers and Obstacles of Solar Thermal Energy Development in Iran” in 2005. This report documented the large economic potential of solar thermal power in Iran by using solar panels, which could also make an important contribution to the reduction of greenhouse gas (GHG) emissions.
Cooperation between the Iranian and German research teams continued with the Iranian Energy Association (IEA) joining as a new partner in 2006. The IEA is a young NGO, with members across academia and energy experts who are involved in scientific energy

studies and projects. The new research collaboration between Iranian and German research teams on energy studies led to several reports, papers, workshops and presentations on energy scenarios, energy efficiency, renewable energies and energy education over the years. The first series of reports on energy scenarios were influential, because they included the first study to model Iranian energy use in all sectors and show future trends under various scenarios. The study results showed that Iran could save a significant amount of energy and reduce its GHG emissions under the efficiency and renewable scenarios over the next 25 years. The energy project also provided a wonderful opportunity to exchange know ledge among energy experts from different backgrounds.
The present book is based on these earlier energy study projects in Iran, which started in 2006. The projects included energy scenario studies (2005-2030) and analyses of energy efficiency, renewable energy policies, energy price reforms and energy education programs in Iran and Germany. In this book, the energy scenarios, the energy efficiency analysis and information about renewable energies have all been updated and revised to demonstrate the most recent developments in the Iranian economy and the energy sector. The price reform section also reflects the recent changes after the 2010 energy removal subsidy program.
We thank Professor Mohammad Hassan Panjeshahi (University of Tehran and former chairman of IEA, Tehran), Dr. Farideh Atabi (Science and Research Branch, Islamic Azad University, Iran), Dr. Saeed Moshiri (University of Allameh Tabataba’i, Iran, STM College, University of Saskatchewan, Canada), Professor Dr. Stefan Lechtenböhmer (Wuppertal Institute, Germany, IMES, Lund University, Sweden), Dieter Seifried (Büro Ö-quadrat, Germany), Dr. Nikolaus Supersberger (formerly Wuppertal Institute, Germany) and Magdolna Prantner (Wuppertal Institute, Germany) for their active contribution in all workshops and as authors of the main studies of the project.
Quite certainly, the project was very fruitful with regard to international knowledge exchange and concerning its contribution to mutual understanding during a period of complicated geostrategic conditions.
Wuppertal / Berlin, December 2015
Professor Dr. P. Hennicke (Former President of Wuppertal Institute for Climate, Environment and Energy, Germany)
Professor Dr. M. Massarrat (Professor emeritus Osnabrück University, Germany)

Saeed MoshiriStefan Lechtenböhmer (eds)
Sustainable Energy Strategy for Iran
Co-Authors (in alphabetical order)· Farideh Atabi, Islamic Azad University, Iran· Katharina Knoop, Wuppertal Institute, Germany· Stefan Lechtenböhmer, Wuppertal Institute, Germany· Mohssen Massarrat, University of Osnabrück, Germany· Saeed Moshiri, University of Saskatchewan, Canada· Mohammad Hassan Panjeshahi, University of Tehran, Iran· Magdolna Prantner, Wuppertal Institute, Germany· Dieter Seifried, Büro Ö-quadrat, Germany· Nikolaus Supersberger, formerly Wuppertal Institute, Germany
Research Team· Kioumars Heydari, University of Allameh Tabataba‘i, Iran· Esfandiar Jahangard, University of Allameh Tabataba‘i, Iran· Dietmar Schüwer, Wuppertal Institute, Germany
Advisors· Peter Hennicke, Wuppertal Institute, Germany· Mohssen Massarrat, University of Osnabrück, Germany
W U P P E R T A L S P E Z I A L 5 1

© 2015 Wuppertal Institute for Climate, Environment and EnergyPublished by Saeed Moshiri and Stefan LechtenböhmerProofreading and correction supported by: Teresa Gehrs und Matthew Rees (LinguaConnect)Design and setting: Stephan Preuß Grafik + DesignPrinted by: mc3 Druck und Medienproduktions GmbHPrinted on 100% recycled paper “RecyStar Polar”
If no other source is indicated, figures and tables in this book have been created by the authors.
ISBN: 978-3-929944-98-3

1 Introduction 7
2 Economy and Energy in Iran; an Overview 112.1 Macroeconomic Structure and Trends 112.2 Energy Sector 132.3 Energy Policies 172.3.1 Energy Subsidies 182.3.2 Oil Policy 202.3.3 Natural Gas Development 212.3.4 Electrification 212.3.5 Other Energy Policies 22
3 Historical Trends and Future Energy Consumption 233.1 Introduction 233.2 Methodology 243.3 BAU Scenario 263.3.1 Households 273.3.2 Manufacturing Industries 353.3.3 Power Generation Plants 393.3.4 Transportation 413.3.5 Other Sectors 453.3.6 Total Energy Demand 493.3.7 Environmental Impacts of the BAU Scenario 52
4 Alternative Scenarios 554.1 Scenario I: Efficiency 564.1.1 Households 564.1.2 Manufacturing Industries 594.1.3 Transportation 624.1.4 Other Sectors 634.1.5 Total Energy Savings in the Efficiency Scenario 664.2 Scenario II: Renewables 684.2.1 Wind Power 684.2.2 Biomass 694.2.3 Geothermal 694.2.4 Solar Irradiance 704.2.5 Hydropower 714.2.6 Economic and Infrastructural Analysis 724.2.7 Final Energy Demand in the “Renewables” Scenario 75
Table of Contents

4.3 Scenario III: The Combined Scenario 764.4 A Comparison among Scenarios 774.5 Energy Intensity 794.6 Economic and Ecological Impacts of Scenarios 804.6.1 Economic Impacts 804.6.2 Ecological Impacts 824.7 Conclusion 84
5 Renewable Energy Sources 875.1 Introduction 875.2 Support Instruments for Renewable Energies 885.2.1 Why is government support needed? 885.2.2 Feed-In Tariff Systems 905.2.3 Quota System and Tradable Green Certificates 915.2.4 Comparison of FIT and Quota Systems 925.3 International Experiences in Renewable Energy Policies 935.3.1 India 965.3.2 Algeria 995.3.3 Lessons Learned from the Experiences in India and Algeria 1015.3.4 Germany 1025.4 Renewable Energies in Iran 1105.4.1 Development Objectives for Renewable Energies 1115.4.2 Renewable Energy Potentials 1115.4.3 Renewable Energy Organizations 1145.4.4 The Renewable Energy Development Act 1165.4.5 Power Generation Plant Applications 1165.4.6 SWOT Analysis of the Renewable Energy Organization in Iran 1175.4.7 Renewable Energy Challenges in Iran 1195.4.8 Improving the Feed-in Tariff System 121
6 Policies to Promote Energy Efficiency 1256.1 Introduction 1256.2 Energy Efficiency Challenges 1256.2.1 Widespread Deployment of Efficient Technology 1256.2.2 Energy Subsidies 1286.2.3 Rebound Effects 1286.2.4 Consumer Behavior 130

6.3 Energy Efficiency Policies; an Overview 1316.3.1 A Hybrid Efficiency Policy 1316.3.2 Policy Approaches to Increase Energy Efficiency 1326.4 Energy Efficiency Policies Concerning Buildings using the Example of Germany 1396.4.1 Background Information about Energy Efficiency in Buildings 1396.4.2 The Economics of Highly Efficient Buildings 1416.4.3 Policies and Measures to Improve Energy Efficiency in Buildings 1426.5 Energy Efficiency in Iran 1486.5.1 Background 1486.5.2 Energy Efficiency Policies in Iran 1506.6 Conclusion 161
7 Combined Heat and Power (CHP) 1637.1 Introduction 1637.2 Cogeneration in Germany 1657.2.1 Development of Cogeneration 1657.2.2 Policy Instruments Targeting Cogeneration 1667.3 Cogeneration in Iran 1687.3.1 Development of Cogeneration and Policy Instruments 1687.3.2 A Brief Feasibility Study 170
8 Energy Price Reform and Efficiency 1718.1 Introduction 1718.2 Energy Subsidies: Objectives and Challenges 1718.3 The Energy Price Reform in Iran 1748.3.1 Removal of Energy Subsidies 1748.3.2 The Effects of the Energy Price Reform 1758.4 Conclusion 181
Appendix 183 A. Work Flow for the Energy Scenario Analysis 184 B: Feed-in Tariff Laws in Iran 186 References 188

7
1Introduction
Iran is a country endowed with rich natural resources, including high amounts of fossil and renewable energies and a young and growing population. If properly utilized and appreciated, these are key assets for a bright future.
In spite of significant obstacles, economic activities and wealth have nevertheless con-tinued to grow over the past few decades. The recent international agreement, which involves the removal of the main sanctions on Iran, offers many options for the country to play a more active and constructive role in the global community. Through restrengthening ties with other countries and better integration with international developments, Iran will have great chances to make significant steps forward and to boost economic and social development. This includes better access to modern technologies to rebuild and develop its industries, increased chances to export goods, and opportunities to attract more capital for investment. All these chances have the potential to foster economic development as well as to create chances for better employment, income and education for the Iranian population.
However, in the past, energy has been used very inefficiently in all sectors. Energy de-mand has been growing at much higher rates than the economy overall and wealth, and energy intensity has increased rather than decreased. These trends have left Iran with a high per-capita energy consumption and very low economic output per unit of energy consumed, ranking the country lower than many other countries in the world.
Studies on the future development – such as the scenarios of Iran’s Second National Com-munication1 to the UNFCCC – indicate in their Business-as-Usual projections that energy consumption in Iran might continue to grow at more than double the pace of economic growth. This would more than halve the economic efficiency of energy use between 2007 and 2025 and would result in an even more dramatic picture than the one painted in our BAU scenario (see below). However, the National Communication also shows that policies to reduce energy consumption growth to almost a fifth of BAU rates could be made availa-ble.
This inefficiency in the use of energy poses several challenges to Iran. Among other effects, it is a major hurdle to innovation and economic development. Companies benefiting from low energy prices in the short term have little incentives to modernize and improve existing technologies. As a result, their competitiveness decreases on domestic as well
1 http://unfccc.int/resource/docs/natc/iranc2.pdf

8
Sustainable Energy Strategy for IranIntroduction
as international markets. This problem is further aggravated by the fact that energy efficiency, new renewable energy solutions and low carbon technologies are some of the core fields of innovation and economic progress globally. Low domestic energy prices and subsidies to energy consumption already have significant negative impacts on the public budget and create high barriers to the modernization and development of the energy system itself. The efforts taken in the past to reform energy prices show how difficult it is to change this situation and to depart from traditional ways of doing things. Finally, high and rising energy consumption and outdated technology also put stress on the environment by increasing pollution, creating serious threats for health and well-being, particularly in cities.
Currently, politicians have been very active on global climate policy in an effort to give climate protection more momentum, and a majority of countries, including the largest emitting countries such as China and the USA, are taking significant measures to reduce greenhouse gas emissions and thereby mitigate the threat of climate change. This requires not only industrialized countries committing to take action but also all countries of good will, and in particular those that have the capacity to do so should act on their emissions. To date, 155 countries covering around 87 percent of global emissions in 2010 and 88 percent of the global population have submitted their respective plans for emission reduction. Based on this broad movement, the Conference of Parties to the UN Climate Convention is obligated to create and implement incentives to direct global investment pathways into more sustainable energy infrastructures. Some of the incentives include broadly fostering investment in energy efficiency, renewable energies and low carbon technologies, as well as supporting joint efforts to speed up innovation and market uptake of new technology. This development has the potential to successfully divert global invest-ment patterns from still-dominant fossil fuels toward alternative energy systems. Follow-ing the traditional energy-intensive and emission-intensive pathways will put a country at risk of ending up on a one-way street on an expensive, high-carbon development trajectory. Following the “green pathway” could include huge opportunities for Iran by developing an efficient and clean industrial economy, which would profit not only from global developments but also from significant domestic benefits, such as increased competitiveness of businesses, rising employment, reduced pollution and higher revenues from national energy assets.
Changing existing trends into new and more promising developments requires a clear analysis of the current situation and the rationales behind it. It also involves a thorough analysis of the potentials for change and the challenges and opportunities associated with more active focusing of energy policy and a more efficient and sustainable energy system. The aim of this book is to provide some of the analyses needed to rethink the country’s energy strategy and to grasp the chances.
This book has been written to provide scientific foundations for the decisions to be made regarding the opportunities and challenges emerging from Iran’s national situation, as well

9
Sustainable Energy Strategy for Iran Introduction
as of that internationally. The book is based on long-term academic cooperation between Iranian researchers from several universities and the Iranian Energy Association and German researchers from the Wuppertal Institute for Climate, Environment and Energy and the University of Osnabrück. Our argumentation relies on solid joint groundwork performed in recent years. After an initial overview of the current situation in Iran in Chapter 2, the book starts with a bottom-up energy modeling exercise for different sectors of the economy, which is used to develop the BAU (Business-as-Usual; Chapter 3) scenario as well as alternative scenarios (Chapter 4). In order to support the alternative scenarios, the authors have carried out detailed analyses on the potentials for renewable energies, for energy efficiency and for the prospects and economics of combined heat and power production in Iran. The respective measures and good practice policies and instruments to implement have been collected and documented in several research reports as well as in Chapters 5 to 7 of this book. Lastly, Chapter 8 takes a closer look at energy price reform in Iran. This is a particularly crucial policy when discussing possibilities to follow a more sustainable and efficient energy trajectory and to implement the scenarios depicted in this book. Current approaches to reform consumer energy prices already constitute good first steps in the right direction. Such approaches must, however, be strengthened and consequently implemented in the framework of an overall clear picture of the future energy system.
The scenario analyses in Chapters 3 and 4 entail an in-depth study on energy use in Iran using bottom-up and econometric methods. These chapters provide a consistent outlook on how the strategies for a more sustainable energy system could be implemented in differ ent economic sectors and how they fit together. More specifically, grounded in detailed analyses of the available options, we developed a differentiated bottom-up scenario analysis con-sisting of four scenario-based outlooks for Iran until 2030. The basic scenario, presented in Chapter 3, examines a BAU development with no particularly strengthened emphasis on improving energy efficiency or the uptake of renewable energies. Under such assumptions, our detailed sector-by-sector and partly technology-specific analyses show that total energy consumption as well as total CO2 emissions will rise by more than 60 percent over the next 15 years. The analyses also show that such a BAU trend would result in a prolongation and even exacerbation of the problems already clearly visible in the Iranian energy system and economic activities. In the BAU scenario, domestic energy consumption would use in-creasing shares of production, thereby reducing the capability to generate revenues from the export of oil and natural gas, and emissions would remain at unsustainably high levels.
The three alternative scenarios presented in Chapter 4 take into account the broad range of technical options for energy efficiency, renewable energy generation and combined heat and power. These technologies and their potentials for implementation have been assessed for every energy-using sector in Iran including heavy industry, agriculture, transportation, commerce, public administration, and households as well as power plants. The analysis reveals that, by focusing on energy efficiency as well as renewable energies, there is high but realistically implementable potential to reduce the energy intensity and greenhouse

10
Sustainable Energy Strategy for IranIntroduction
gas emissions of the Iranian economy. If all strategies were to be implemented together, their combined result would be capable of stabilizing energy-related CO2 emissions in Iran at about current levels and of even slightly reducing them, without making any com-promises on economic growth or living standards. Furthermore, all sectors will become much more energy-efficient by using existing and available technologies, which are largely beneficial for Iran’s national economy. Through investing in modern technologies and saving on energy costs, the alternative paths would make domestic businesses more competitive, create more jobs in the energy efficiency and renewable energy industries, and allow the country to increase its income from the export of fossil fuels. Furthermore, in the context of a strong global climate policy, Iran could make a significant contribution to global greenhouse gas mitigation, and significantly reduce domestic damage from air pollution.
The authors of this book hope to make a contribution to the emerging and rapidly grow ing discussion within Iran as well as between Iran and other countries such as Germany on better energy alternatives and the respective opportunities for investment, innovation and modernization. Such a strategy would have multiple benefits for the country and for the international community. We therefore hope that the work presented here will provide ideas for such opportunities and create a vision of how this could contribute towards developing a more sustainable, efficient and prosperous future energy system for Iran.
The co-authors, research team members and advisors would like to thank Teresa Gehrs, Matthew Rees (both proofreading), Stephan Preuß (design and setting), Hans Kretschmer, Dorle Riechert and Jana George (all Wuppertal Institute) for their administrative and editorial help and support.

11
2Economy and Energy in Iran; an Overview
In this chapter, the structure and conditions of the Iranian economy and its energy sector will be briefly reviewed to set a ground for the scenario analysis in the next chapters.
2.1 Macroeconomic Structure and Trends
According to the article 44 of the constitution, the Iranian economy is divided in three sectors: Public, cooperative, and private. The public sector is in charge of the public and national institutions and enterprises such as the national oil and gas companies. The co-operative corporations are supported by the public sector, but run privately. In practice, the role of government in the economy has been increasing as it is the sole recipient of oil revenues and controls the lion’s share of production and trade. The general economic poli-cies are highlighted in the Five-Year-Development-Plans and the 20-year Vision. The most recent Five-Year-Plan calls for privatization and economic reforms and the Vision lays out the main socio-economic goals and targets according to which Iran will become a main economic power in the region.
In spite of diversification policies, the Iranian economy is still heavily dependent on oil export earnings and so is, therefore, the public sector. Oil exports account for more than 66 percent of total exports earnings; nearly 53 percent of the government revenue and 17 percent of GDP. The favorable conditions in the world oil market improved the external financial conditions considerably in the 2000s, although the recent fall in oil prices brought about pressures on the government budget and the economy. Regardless of the oil revenues fluctuations, the challenge still remains to make the best use of oil revenues, to promote growth, and to further diversify the economy. Despite high oil exports revenues, particularly in recent years, Iran continues to face budgetary pressure, which leaves the government with inadequate resources for development projects. Inefficient large public sector, subsidies on consumer goods and energy, state monopolies, and economic sanctions have led to increasing budget deficits and inflation. Diversification of the economy and energy-related activities require the creation of a more favorable investment environment for both local and foreign investors.
Iran is a mid-income country whose GDP in 2010 was US $ 888.4 billion (purchasing power parity), ranking 18 in the world, and GDP per capita was US $ 5,675, ranking 71 in the world (Table 2.1). The total GDP grew annually by 5.1 percent on average in 2000-09, but slowed down by about 1 percentage point until 2013. Although the recent economic growth rates are relatively high, thanks to the high oil prices, they are lower than the

12
Sustainable Energy Strategy for IranEconomy and Energy in Iran; an Overview
gov ernment targets under the third and the fourth five-year development plans. Agriculture accounts for about 6 percent, industry 26 percent, oil 18 percent, and service 50 percent of economic activities. The share of oil in GDP dropped significantly from 67 percent in the 1970s to less than 20 percent due to production cuts during the revolution and the Iran-Iraq war in the 1980s. It increased to more than 30 percent in the 1990s, but declined to less than 10 percent because of the US, EU, and the UN sanctions on oil exports. In addition to direct effects on GDP, the oil revenues play significant indirect roles in the entire economy (Figure 2.1).
Figure 2.1. GDP and its Components (constant 2005 billion rials)Source: Central Bank of Iran, Economic Data (2014)
Population was 74.7 million in 2010, with 72 percent living in urban areas and 28 percent in the rural areas. The recent population growth has been on average 1.54 percent per year (2000-2010), after very high rates of above 2 percent in the 1980s (Figure 2.2). The urbani-zation rate has been changing very fast in Iran, particularly since the 1990s, when only 55 percent of population were living in urban areas. The population structure is rather young with about 43 percent under the age of 24. The population density is 45.4 persons per square kilometer. In 2010, active population was 24 million, and unemployment rate about 14 percent, but it was twice as much among youth. Inflation has been in the range of 11-25 percent per year for the period 2005-2010 (15 percent on average), but has been rising since then. The price change has been much higher in housing, health care, and recreational activities. The current account balance was about US $ 27,554 billion and the trade balance about US $ 37 billion. The total external debt amounts to about US $ 20 billion ($11.5 billion short term external debt and $8.5 billion long term). Iran exports fuels (71%), chemical and petrochemical products, fruits and nuts, and carpets to China (17%), Japan (12%), India (11%), South Korea (7%), Italy (6%), the Netherlands (5%), Turkey (4%),
0
500,000
1,000,000
1,500,000
2,000,000
2,500,000
19591962
19651968
19711974
19771980
19831986
19891992
19951998
20012004
20072010
2013
Cons
t. 2
005
billi
on R
ials
ServicesIndustryOil and GasAgriculture

13
Sustainable Energy Strategy for Iran Economy and Energy in Iran; an Overview
France (4%), South Africa (4%), and Taiwan (4%). The imports consist of industrial raw materials and intermediate goods, capital goods, foodstuffs and other consumer goods, technical services, and military supplies. Iran imports from UAE (15%), China (13%), Germany (10%), Italy (7%), South Korea (7%), France (6%), Russia ( 5%) and India (4%).
Figure 2.2. Population Trends in Urban and Rural AreasSource: Central Bank of Iran, Economic Data (2014)
Table 2.1. Economic Indicators of Iran at a Glance, 2010GDP (PPP, $b.) $ 888.4GDP per capita $ 5,675Inflation Rate (%) 12.41Population (m) 74.7Unemployment Rate (%) 13.5Life expectancy (years) 73 Total fertility rate 1.7Literacy rate (%) 87
Source: Central Bank of Iran, 2010; World Bank, 2014; Central Bank of Iran, Annual Review, 2011-12
2.2 Energy Sector
Iran is a resource-rich country with immense oil and gas reserves. It, however, faces seri-ous challenges to capitalize on its resources because of low efficiency, poor policies, and barriers to foreign investment. Iran has the world forth, and the Middle East second larg-est proved oil reserves with 157 billion barrels of oil (BOE), and the world second largest proved natural gas reserves with 34 trillion m3 natural gas. In 2010, the total primary energy production was 2,563 million BOE, 114 million BOE imported, and 1,096 million BOE exported. The oil production in 2010 was about 3.5 mbl/day, from which 2.6 mbl/day
30,000
40,000
50,000
60,000
70,000
80,000
Thou
sand
Per
sons
20,000
,
Population Urban Rural

14
Sustainable Energy Strategy for IranEconomy and Energy in Iran; an Overview
were exported in 2010. Iran was the world’s third, and OPEC’s second largest oil exporter.2 Natural gas production in 2010 was 143 billion m3 (bcm), ranking forth in the world. Iran exported 9 bcm to Turkey, but imported 12 bcm from its Northern neighbors. The total electricity generation capacity in the country was 65 GW, out of which 24 percent generated by steam, 37 percent by gas, 23 percent by combined cycles, 13 percent by hydro, and 1.7 percent by renewable energy sources (wind, solar, and others). The electricity production in 2010 was 240 GWh, ranking 16th (in 2013) in the world.
Figure 2.3. Energy Intensity in Iran (Barrels of oil equivalent per million rials, constant 2005 prices)Source: Energy Balance, 2010
The total final energy consumption in 2010 was 1184.6 million BOE. The share of households of the total final energy consumption was 27 percent, industry 25 percent, transport 24 percent, agriculture, public, and commercial 9 percent, and others including non-energy use 15 percent. The higher shares of energy consumption by transport and households are consistent with the energy subsidies received by these sectors. Transport received 42 percent of the energy subsidies, household 30 percent, and industry 13.5 percent (Energy Balance, 2010).
The energy consumption indicators and efficiency measures in the past decades show an increasing trend of energy consumption as well as high level of inefficiency. The energy use per capita has been increasing on average by 4 percent annually for the period 2001-2010. However, as Figure 2.3 shows, the energy intensity has also been increasing on aver-age by 1 percent for the period 2001-2010, indicating a decreasing trend in efficiency of energy use. As it is evident in Figure 2.4, the energy intensity in Iran is 1.8 times as much as that in the EU and greater than that in MENA (Middle East and Northern Africa) and low-income countries. Figure 2.5 shows the primary energy supply and final consumption, and Table 2.2 summarizes the major energy production and uses in 2010.
2 The oil production and exports were dramatically declined after the tightening of the US, EU, and the UN sanctions on the Iranian energy and the financial sectors.
1.85
1.9
1.95
2
2.05
2.1
Barr
els p
er M
illio
n Ri
als
1.75
1.8

15
Sustainable Energy Strategy for Iran Economy and Energy in Iran; an Overview
Figure 2.4. Energy Intensity in Iran and Selected Regions (2010) (Kg oil equivalent per $1000 GDP, constant 2011 PPP)Source: World Bank, World Development Indicators (2014)
The primary energy supply and final consumption have been increasing smoothly during the 70s and the early 80s, but the rates of increase have risen since then. Figures 2.6-2.8 show the consumption of oil products, natural gas, and electricity by different sectors. Transport is the major user of oil products followed by households and industry. Households and Industry are also two major users of the natural gas and electricity. The energy factor, defined as the ratio of the growth rate of energy use to the GDP growth rate, has also been higher by 35 percentage points in Iran compared to the world for the period 2001-2011.
Figure 2.5. Primary Energy Supply and Final Consumption (MBOE) (2000-2010)Source: Energy Balance (2005 & 2010)
EUIranCountries
OECDLow-Income MENA
60
80
100
120
140
160
180
200
0
20
40
MBO
E
400
600
800
1,000
1,200
1,400
1,600
1,800
0
200
Primary Energy Supply Total Final Consumption

16
Sustainable Energy Strategy for IranEconomy and Energy in Iran; an Overview
Figure 2.6. Petroleum Products Consumption by SectorsSource: Energy Balance (2005 & 2010)
Table 2.2. Energy production and use in Iran (2010)Amount Note
Primary Energy Production (MBOE) 2562.9 Primary Energy Exports (MBOE) 1095.8 Primary Energy Imports (MBOE) 114.3 Primary Energy Use*(MBOE) 1060Oil Proven Reserve (bbl) 156.5 World rank: 4, Middle East rank: 2Oil Production (mbl/day) 4.3 World rank:4, OPEC rank: 2Oil use (mbl/day) 1.7 Oil Exports (mbl/day) 2.5 World rank: 3, OPEC rank: 2Natural Gas Reserves (tcm) 33.8 World rank: 2 Natural Gas Production (bcm/year) 230 World rank: 4 Natural Gas Use** (bcm/year) 152.7Natural Gas Exports (bcm/year) 9.5Natural Gas Imports (bcm/year) 11.8Electricity Nominal Capacity (GW) 65.2 Electricity Production (bkWh/year) 240.1 Energy Use per capita (BOE/cap) 15.85 Energy Intensity (boe/million rials) 1.94 Energy Factor (Final use growth/GDP growth) 0.97*** (2001-11)MBOE: million barrel oil equivalent , bbl: billion barrel, bcm: billion cubic meter, tcm: trillion cubic meter, GW: Giga Watt, bkWh: billion kilo watt hour*Including primary energy used by power plants ** Excluding natural gas that re-injected, vented, or flared. ***This is not consistent with the declining energy intensity trendSource: Energy Balance, (2010); OPEC Annual Statistical Bulletin, 2013; World Bank, World Development Indicators, 2014; IMF, World Economic Outlook, 2014
0
100
200
300
400
500
600
MBO
E
Residential & Public & Commercial IndustryTransport Agriculture Non-Energy Use
2011-12

17
Sustainable Energy Strategy for Iran Economy and Energy in Iran; an Overview
Figure 2.7. Natural Gas Consumption by Sectors Source: Energy Balance, 2005 & 2010
Figure 2.8. Electricity Consumption by SectorsSource: Energy Balance, 2005 & 2010
2.3 Energy Policies
Iran’s vast energy resources along with subsidization policy have led to an increasing consumption of energy without much being concerned about efficiency and the adverse effects on environment. As Figures 2.3 and 2.4 show, the energy intensity in Iran has been
MBO
E
100
200
300
400
500
600
700
0
Residential & Commercial & Public Transport Industry Non-Energy Use
2011-12
MBO
E
2011-12
40
60
80
100
120
0
20
Residential & Commercial & Public Industry TransportAgricultureOther

18
Sustainable Energy Strategy for IranEconomy and Energy in Iran; an Overview
increasing and is almost twice as high as world average. Although Iran has not had any comprehensive plan for energy, it has embarked some short run and medium run policies for energy production and consumption in different periods. We can identify four main policies that have influenced demand for energy for the period 1980-2010. The first and by far the most important energy policy in Iran has been the heavy subsidization of energy use, especially in households and transport sectors. The second policy has been to keep up with oil production according to the OPEC recommendations. Third policy is development and utilization of natural gas, and the fourth policy electrification of the rural areas. Here, we briefly outline the objectives and the outcomes of these policies in the energy sector.
2.3.1 Energy SubsidiesThere are many different estimates for energy subsidies in Iran, but it is generally agreed that Iran’s energy subsidies are one of the highest in the world. However, the subsidy esti-mates range between 0.5 to 12 percent of GDP depending on different measures and sources. The main discrepancy in the estimations of subsidies arises from different calculation methods used to estimate supply cost. Some use the strict version of subsidies that includes only the direct payments by government or a difference between marginal or average cost and the price paid by consumers. However, the agencies that report much higher estimates of subsidies include opportunity costs of energy products sales in the domestic market. These estimates compare domestic prices with the border prices and assess the differences as opportunity costs of forgone revenues and therefore as subsidies. The government estimation of subsidies is more relevant to the government budget accounting; however, the broader estimation of subsidies is more appropriate for policy making where the objectives are optimal use of resources and increasing social welfare.
Table 2.3 shows that transport receives about one third of the total energy subsidies, and household and industry each receive one quarter of the energy subsidies. The distri-bution of subsidies by energy type also shows that gas oil receives the highest share of energy subsidy followed by electricity and gasoline. Since the subsidies are calculated based on the border prices, its distribution among energy types changes as the prices for dif-ferent types of energy vary. For instance, it is expected that the share of gasoline and natural gas to increase as their prices rise rapidly.
Table 2.3. The Energy Subsidies by Sector and Energy Type, 2000 (percent)Household Industry Agriculture Transport Commercial Others Total
Gasoline - 0.1 0.0 17.6 0.0 0.1 17.8Kerosene 7.5 0.0 0.2 - 0.1 0.2 8.2Gas oil 1.3 3.8 4.2 15.0 0.6 1.4 26.3Heavy Fuel Oil - 9.9 0.1 0.6 1.2 0.2 11.9LPG 2.6 0.0 - 0.4 0.2 - 3.1Electricity 10 8 3.3 - 1.1 3.4 25.7Natural Gas 4 2.5 - - 0.5 - 7Total 25.4 24.4 7.8 33.5 3.6 5.3 100.0Source: Ministry of Energy, 2001

19
Sustainable Energy Strategy for Iran Economy and Energy in Iran; an Overview
Although government has raised the energy prices in the past 15 years, the real energy prices have decreased because of higher inflation rates. Since the start of the third FYDP, energy prices have risen on average by only 10 percent per year, but the average inflation rate in this period has been well above 10 percent. The fourth FYDP called for a more ag-gressive measure to reform the energy market, that is, to increase the gasoline prices to the border prices. However, the newly elected government and parliament did not continue with the plan and froze the fuel prices in 2006 and 2007.
The subsidy problem is more prominent in the case of gasoline consumption, which received one third of the total energy subsidies in 2010. Gasoline price was at around 10 cents per liter, which was about one fourth of the border price and about one fifteenth of the European prices. The very low price of gasoline has encouraged high level of gasoline consumption in large urban areas, especially in Tehran. The growth rate of gasoline consumption has averaged 10 percent annually over the period 2001-2010. It has also led to a high concentration of air pollutants along with other social and economic problems, such as more pressure on roads and infrastructures and congestions in large cities. In re-sponse to a rapid growth in gasoline consumption, government drew on the Oil Reserve Fund to import about 40 percent of domestic consumption in 2007 making Iran the second biggest gasoline importer in the world after United States. In June 2007, government instituted a gasoline rationing system to curb the rapidly growing consumption. In the new system, each private passenger car would receive 30 liters gasoline per month at the fixed price of 1,000 rials or about US$ 11 cents per liter. The rationing scheme did not have any significant effect on domestic consumption, but it apparently reduced the amount of gasoline smuggled to the neighboring countries.
The subsidy program in the energy sector is unsustainable because of increasing op-portunity costs associated with high international oil prices and pressure on government budget causing macroeconomic instability and uncertainties in providing basic public services. The high energy subsidies are also contributing to more inefficiency and environmental degradation. However, government is faced with many difficult issues regarding the removal of subsidies. These issues include macroeconomic impacts of price reform on inflation, unemployment, balance of payment, and income distribution, particularly in the short-run. Government also needs to have a plan on how to spend the additional revenues that will be generated by removing subsidies. The plan should identify the more vulnerable industries and social groups who would suffer the most under the new scheme and lay out the details on how to compensate for their loss of production and income.
Removing energy subsidies would impact prices, exchange rates, trade, and cost of living. Consumers would have to pay higher prices for energy as well as non-energy goods and services, particularly those whose prices are more energy dependent. While the im-pact of a price rise on energy goods would be immediate, the impact on non-energy goods and services might take time. Overall, a rise in energy prices would only have a short-run inflationary effect, since prices would adjust to their new equilibrium level after the tran-sitory period is over. In fact, the experiences of energy price reform in some developing countries suggest that inflation rate may even be lower after the reform. For instance,

20
Sustainable Energy Strategy for IranEconomy and Energy in Iran; an Overview
while a rise in diesel and kerosene prices in Indonesia and Turkey led to higher inflation rates by 0.6 and 16 percent, the inflation rates in Malaysia and Zimbabwe were lower by 80 percent and 40 percent, respectively, after two year of price change (Hope and Singh, 1995). A study by World Bank estimates that if energy prices in Iran rise to the border prices, inflation rate would rise by 40 percent in one year, and would remain the same afterward (World Bank, 2003). The higher energy prices will decrease the energy consumption by household, as they will use energy more efficiently. However, the changes in cost of living will vary in different income groups depending on their expenditure patterns as well as price elasticity of demand, energy consumption and energy elasticity of output. Government can return the additional revenues generated to the low- and mid- income households.
Removing energy subsidies will also increase the relative costs of energy intensive in-dustries, which will likely lead to a lower domestic production and changes in trade as Iran will import more energy-intensive goods and will export more crude oil. Exporting more crude oil will increase foreign reserves leading to an appreciation of the domestic currency that in turn will decrease exports and increase imports. This will have an adverse effect on domestic industries and non-traditional exports, similar to Dutch disease effect, which usually occurs in oil-exporting countries when they receive a huge windfall after a boom in the world oil prices.
Although energy price reform is inevitable in Iran, it may have striking adverse economic and social impacts, should it not be carried out properly. For an effective energy price reform, government should take measures beyond the subsidy removal. For instance, energy market structure needs to change in favor of more competition in production and distribution of energy, and a sound plan for the transition period to avoid major socio- economic disturbances is required. The reform also needs to ensure the relative energy prices remain high so that inflation does not absorb the effects of the initial higher energy prices. As it will be discussed in next chapters, a series of non-price policies are also required to help increase energy efficiency. Therefore, it is imperative to study the various effects of the policy using economic models that take into account all different sectors of the economy and analyze alternative scenarios. The outcome of such detailed studies would help policy makers to foresee the potential benefits and challenges and thus design appropriate policies that would capitalize on advantages and alleviate the adverse effects. Chapter 8 will examine the impacts of energy price reform on household consumption in more detail.
2.3.2 Oil PolicyIran is one of the founders and a long-standing member of OPEC and had the second largest production among its members after Saudi Arabia until 2010. Iran has maintained its production level in OPEC, but has recently cut its exports due to higher domestic consumption and sanctions. Faced with capital constraints, Iran recognized the importance of foreign investment in the oil sector to expand new fields and increase the recovery factor in the existing fields, and offered a “buy-back” contract to foreign investors. This

21
Sustainable Energy Strategy for Iran Economy and Energy in Iran; an Overview
new form of contract allowed foreign companies to invest in oil and gas fields and to share revenues with the Iranian counterparts. Through this new mechanism, many international oil and gas companies, except US companies that were banned from investing in Iran by the US sanction law, participated in exploration and development of the Iranian oil and gas fields in the 1990s and 2000s. The companies left Iran after the new sanctions on in-vestment, trade, and financial sectors were imposed in 2008, but they are expected to return after the removal of sanctions following the recent agreements between Iran and the 5+1 group. 2.3.3 Natural Gas Development The third important energy policy in Iran has been the fast development of natural gas fields since the 1990s. This policy gained momentum particularly when Iran discovered its share of the world largest gas reservoir in the Persian Gulf, i.e, the South Pars field. Iran has been using a large share of its ever-increasing gas production to substitute natural gas for domestic consumption of oil products in different sectors. Producing natural gas is rel-atively cheap and its exports to the world market is currently limited only to neighboring countries. Therefore, the policy of gas substitution has freed up crude oil for exports gen-erating more revenues for the government. In addition, since natural gas is more environ-mentally friendly, its use for domestic consumption helps reduce pollution. Although the lower price for natural gas has made the natural gas substitution policy successful, the rapidly rising and inefficient use of natural gas, especially in the residential sector, is a growing concern.
Natural gas has also been increasingly used for injection into oil wells. This policy has two positive effects. First, it leads to a higher production of oil as the recovery factor of oil wells increases. Second, it saves the injected natural gas for future extraction. Iran is also involved in natural gas international trade by importing from northern neighbors and exporting to Turkey through a pipeline. Iran is now a net importer of natural gas, but it is expected to become a major net exporter in future, if the necessary investments take place and domestic consumption permits. There are different projects such as exporting natural gas to India through Pakistan, and to Europe through Turkey and other Eastern E uropean countries.
2.3.4 Electrification The fourth energy policy is the electrification of rural areas by investing in new trans-mission lines to reach remote areas and by keeping the electricity prices more than 40 percent below the border prices. The policy that started in the 1980’s has led many rural areas to be connected to the national electricity grid, which changed the energy consumption and living conditions in those areas. The policy continues by encouraging rural residents to substitute electricity for oil products particularly for motor pumps. Electrification is seen as a way to free up crude oil for exports, since most power plants use natural gas to produce electricity. The policy has also helped many rural communi-ties access clean energy and reduce environmental problems such as deforestation.

22
Sustainable Energy Strategy for IranEconomy and Energy in Iran; an Overview
2.3.5 Other Energy PoliciesSome other important policies in the energy sector can be listed as follows.1. Ministry of Energy has established two organizations for studying and promoting in-
vestment in renewable energy resources: Iran Energy Efficiency Organization (SABA) in 1994 and Renewable Energy Organization (SUNA) of Iran in 1995. These two insti-tutes have conducted some projects on wind, solar, and geothermal energy resources in different parts of Iran, but their activities remain small compared to the level of energy consumption in the country.
2. Ministry of Oil established the Iran Fuel Conservation Organization (IFCO) in 2000 to study and invest in energy efficiency in different sectors. IFCO has audited some manufacturing industries and made recommendations for energy conservation in those units. Replacing inefficient and pollutant old taxies with new cars in large cities and using CNG as a substitute for gasoline are some of the projects undertaken by IFCO in recent years.
3. Iran has attempted to develop nuclear energy by completing the Bushehr nuclear plant and making investment in other new plants. The Bushehr plant, which started in the 1970s, has experienced many international challenges for the past three decades, but it has finally become operational in 2013. The capacity of the nuclear plants is at least 1000 MW.

23
3 Historical Trends and Future Energy Consumption
3.1 Introduction
In this part, we model the energy demand for different sectors of the economy and project their future trends assuming alternative scenarios for the 2010-2030 period. The economic sectors included in this study are households, manufacturing indus-tries, transportation, and others, including the agricultural, commercial and public sectors. We also study the energy consumption and production of electricity by power generation plants themselves. Our primary approach for modeling the energy demand is the end-use or computational approach, although econometric modeling is also used, data permitting. For instance, in modeling demand for the transportation sector, the relationship between the energy demand and its major drivers is estimated using econometric methods. In other cases, such as electricity, where survey data is available, the computational approach has been used. To model the energy demand for each sector, we first review the historical trends of energy uses and identify the fundamental drivers of demand and then project future energy demand using three scenarios: Business-as-Usual (BAU), efficiency and renewable energy. In our scenario development, we make use of all available information about current and future policies and plans with respect to the structure of the economy and, in particular, the energy sector.
The BAU scenario describes a consumption path that can be characterized as the development of demand if no far-reaching changes in consumption patterns are made. Therefore, it basically assumes that the economy and the energy sector will follow past trends. It also takes into account new developments in the economy based on patterns of world economic growth as well as policies outlined in the Five-Year Development Plan (FYDP) and the 20-Year Vision of the country. The efficiency scenario will apply technical efficiency measures to energy demand and electricity generation to derive an alternative consumption path for energy consumption in Iran. The renewable energy scenario will also apply certain assumptions to developing renewable energy sources in Iran to show impacts on energy demand for non-renewable energy and the environ-ment. At the end of chapter, we will compare the results of the alternative scenarios.

24
Sustainable Energy Strategy for IranHistorical Trends and Future Energy Consumption
3.2 Methodology
There are two general approaches to model final energy demand: top-down and bottom-up. The top-down or econometric method uses historical data at the macro level to estimate consumption trends and the effects of socio-economic variables on the demand for energy. These models draw on the economic theory of demand for inputs (derived demand), which suggests variables such as prices and income as the main determinants of the demand for energy. In contrast, the bottom-up, also called the techno-economic or the computational, approach uses energy billing data and detailed survey information on households, appliances and capital characteristics to determine the end-use energy consumption by each type of appliance or capital and to simulate the total energy consumption for a sector, region or the economy.3
Top-down and bottom-up approaches have been used extensively in the energy- demand modeling literature. For instance, Bentzen and Engsted (2001) used a simple econ ometric model to estimate energy consumption in Denmark. Haas and Schipper (1998) developed an econometric model to estimate energy elasticities in the US, Japan, Sweden, Germany and the UK for different time periods. Filippini and Hunt (2011) applied a stochastic frontier analysis to estimate energy demand and energy efficiency in the OECD countries for the 1978-2006 period. Crompton and Wu (2005) used the Bayesian Vector Autoregressive model to forecast China’s demand for energy. Examples of applica-tions of the bottom-up approach are Kohler et al. (1999) for the German construction sector, Huang and Broderick (2000) for the American building stock, Murakami et al. (2009) for the construction sector in Japan, Palmer et al. (2006) for housing energy demand in the UK, Farahbakhsh et al. (1998) for the Canadian housing stock, Lechtenböhmer and Schüring (2011) for the EU building stock and Griffith et al. (2007) for commercial buildings in the US. Koopmans and te Velde (2001) combined these approaches by using a top-down model and employing bottom-up information to estimate demand for energy in the Netherlands.
The techno-economic approach has some advantages over the conventional top-down or econometrics models that are commonly used in energy demand analysis. First, econo-metric models use historical data to capture trends and macro-economic and socio-economic effects, but they often require data that reflects market equilibrium, which may not be available in a developing country such as Iran due to government intervention in the market and distorted prices. Techno-economic models get around this problem by using non-price observations based on energy surveys, technical studies and energy audits. Second, techno-economic models generate more accurate predictions than econometric models in the long run as they are more flexible in taking into account all information and allowing for future policy changes in forecasting. Third, relying on continuous historical data,
3 The microeconometric approach also uses micro survey data at the household or firm level to estimate demand for energy. This method has an advantage over macro-level analysis, as it can control for the characteristics of the household and/or the firm, and makes use of detailed information on capital and its utilization. However, the results might not be applicable to long-run behavior as the data span for such surveys is limited.

25
Sustainable Energy Strategy for Iran Historical Trends and Future Energy Consumption
econometric models do not fully capture technological effects as well as structural changes, both of which are critical in the analysis of energy consumption. Therefore, those models often do not adequately address the effects of new technologies or a change in regime on energy consumption. Disadvantages of the bottom-up models are the requirement for detailed input information and many assumptions on household or firm behavior. They also do not use economic variables such as prices, and are computationally intensive.
In general, the selection of the approach depends on the objective of the study. If the aim is to study the trend, assuming that there would not be a discontinuity, or to obtain elasticities to conduct short-run macro policy analysis, the top-down approach may be the better option for modeling energy demand. However, as Swan and Ugursal (2009) have noted, if the objective is to generate long-run projections and to evaluate the effect of new technology or to examine different scenarios with significantly altered policies, the advan-tages of the bottom-up approach would outweigh its disadvantages and, therefore, it would be a better choice.4 Furthermore, as Bhattacharyya and Timilsina (2010) and Urban et al. (2007) point out, the econometrics approach is based on the idea of representative con-sumers or producers, and might generate biased results when applied to developing coun-tries where consumption behavior varies widely by income group and location. Therefore, the bottom-up approach is more appropriate for modeling energy in developing countries, because it can take into account factors such as individual heterogeneities, rural-urban differences, traditional and modern energy sources, the transition to a modern economy, and non-monetary transactions.
In this section, we use the techno-economic or end-use modeling approach to model demand for energy in Iran and to project long-run demand under alternative scenarios. The demand for energy is a derived demand, as energy is used to generate services such as heat or light for households or businesses. Therefore, it depends on whatever equipment (capital) uses energy. The demand for energy of type j in sector h with M capital at time t can be modeled as follows.
(1)
where Ehjt is the demand for energy of type j in sector h at time t, Kit is an ith energy- using capital or a consumer durable good, eijt is the type j energy coefficient (or specific energy intensity) for capital i and φit is the utilization rate of capital i. Although price and income, the main components of energy demand models in econometric models, are not present here, they affect E indirectly through their impacts on parameters e and φ (Pesaran et al., 1998). For instance, higher energy prices will lead consumers to use energy more efficiently, which means lower e, or less use of capital, which implies lower φ. Higher income will also increase φ and may increase or decrease e.
4 For a comparison between econometric models (conditional demand analysis) and end-use models, see Larsen and Nesbakken (2004); for a survey on modeling techniques, see Swan and Ugursal (2009).

26
Sustainable Energy Strategy for IranHistorical Trends and Future Energy Consumption
Any estimation of E requires detailed information on K as well as energy consumption behavior parameters: e and φ. This data is usually obtained from household or industry energy surveys, expert surveys, technical studies and energy audits. In some cases, where the desired disaggregated data is not available, we rely on econometric analysis to obtain a historical trend, but adjust the results for the likely structural and major policy shifts when we use them for long-run forecasting. In this study, we estimate demand for six types of energy (J = 6: fuel oil, gas oil, kerosene, gasoline, electricity and natural gas) in four sectors (H = 4: household, manufacturing industries, transportation and others: commercial, public sector and agriculture).
3.3 BAU Scenario
The BAU scenario describes a likely energy demand path if no far-reaching changes in consumption patterns are made. Therefore, it assumes that the variables will basically follow past trends, but it incorporates new developments in the economy and likely policy changes. For instance, the policies outlined in the national Five-Year Development Plan (FYDP) and the 20-Year Vision for the country, such as investment priorities in manufacturing industries and increasing the share of natural gas in domestic consumption, will be taken into account in the BAU scenario.
GDP and population are two major variables driving energy demand. Using past trends and recent developments and policies, we project the future values of those variables. Economic growth and population growth have been relatively high but volatile for the past 30 years. Specifically, the average economic growth rates changed between -1 and 10 percent for the 1961-2000 period. The negative and the slow growth rates in the 1970s and 1980s were mainly due to disruptions in economic activities during the 1979 revolution and the following eight-year war with Iraq, as well as the higher growth rates thereafter caused by favorable oil prices and post-war reconstruction activities. Growth rates were also negative in 2012-2014, mainly because of tightening international sanctions against the Iranian economy, particularly in the key sectors of energy and finance. The population has been growing on average by 2.3 percent over the past 40 years, ranging between 1.4 and 3 percent. The unprecedented high population growth rates in the 1980s were mainly due to the abandoning of family planning programs and to government support for larger family sizes in that period; the slower growth rates in the following years were due to changes in the policies and household behavior asso-ciated with the new economic conditions such as an increasing cost of living. Figure 3.1 shows the GDP and population growth rates for the 1961-2010 period.

27
Sustainable Energy Strategy for Iran Historical Trends and Future Energy Consumption
Figure 3.1. GDP and Population Growth Rates (1961-2010)Source: Economic Time Series Data, 2014.
We assume that economic growth rates will slow down and stabilize as the economy enters a higher stage of development in the next 20 years. Specifically, our BAU scenario will be based on 3.4 and 3 percent GDP growth for the 2010s and 2020s, respectively. Also, the population is expected to grow by 1.4 in the 2010s, but the growth will slow down to 1 percent as the economy develops in the 2020s. In the following sections, we present the results of the end-use model for energy demand in different sectors. The scenario model is calibrated in every sector to the base year 2010.5 Appendix A shows the work flow for the scenario analysis.
3.3.1 HouseholdsHouseholds are one of the major energy users in Iran, accounting for about 32 percent of the total final energy consumption. Specifically, households use about 20 percent of total oil products, 46 percent of natural gas and 28 percent of total electricity consump-tion. The energy mix in the household energy consumption basket has changed marked-ly since 1990, mainly because of the government’s policy of substituting natural gas for oil products. While household consumption of oil products has decreased, the consump-tion of natural gas and electricity has increased by 8 and 5 percent per year, respectively, for the 1996-2010 period.
We study household demand for energy in two separate sections: heat and electricity. In the heat section, we model the demand for oil products and natural gas using aggre-gate data, but we model the demand for electricity using micro data on appliances and electric devices.
5 An earlier version of this study used 2005 as its base year.
4%
6%
8%
10%
12%G
row
th in
% p
er Y
ear
-2%
0%
2%
GDP Growth Population Growth
1961-1970 1971-1980 1981-1990 1991-2000 2001-2010

28
Sustainable Energy Strategy for IranHistorical Trends and Future Energy Consumption
Fuel Natural gas is now a major source of energy in the residential sector. In 2010, Iranian households used about 55 MBOE of oil products (kerosene, gas oil and LPG) and about 273 MBOE of natural gas. About 9 million households, 45 percent of all households, had access to natural gas in 2010; this is projected to continue to grow on average by about 3.5 percent or 350,000 households every year that will join the natural gas grid. We estimate the relationship between the demand for fuel and its long-run determi-nants, population and income, using a regression equation. The estimation results show that GDP and population can explain more than 98 percent of the variations of house-hold demand for fuel; both have statistically significant coefficients. The population effect with a coefficient of 0.8, however, is stronger than the GDP effect with a coefficient of 0.5. Figure 3.2 shows actual and predicted demand for fuel for the 1993-2010 period. The future demand for fuel by households is projected using the estimation results and the assumptions on the future values of GDP and population as presented earlier. The demand for kerosene, gas oil, LPG and natural gas are estimated using the shares of each energy type based on existing and future government policies. Specifically, the gov ernment policy to increase the share of natural gas in the household energy basket from 79 to 95 percent has been incorporated in the estimation of the future shares of energy types in household demand for fuel. Accordingly, the shares of kerosene and LPG are projected to decrease from 12 and 2 percent in 2010 to 2 and 1 percent in 2030, respectively. Households had also started using solar energy by as much as 1 percent of the total fuel consumption in 2010, which will grow to 5 percent by 2030.
Figure 3.2. Actual and Predicted Household Demand for Fuel
The use of oil products and natural gas by households is broken down into space heating, cooking and water heating. It is assumed that 100 percent of kerosene is used for cooking,
100
150
200
250
300
350
400
MBO
E
0
50
Predicted Actual
1993 1995 1997 1999 2001 2003 2005 2007 2009

29
Sustainable Energy Strategy for Iran Historical Trends and Future Energy Consumption
80 percent of gas oil for space heating and 20 percent for water heating, and 50 percent of LPG for cooking and another 50 percent for water heating. The shares of space heating, cooking and water heating in natural gas consumption by household are assumed to be 75, 10 and 15 percent, respectively. These shares of consumption types are assumed to remain the same throughout the study period. Table 3.1 shows the BAU scenario for household consumption of oil products, natural gas and solar energy in different types of their use. The results indicate that household demand for kerosene and LPG will decline on average by 6 percent and 1 percent per year, respectively, while the demand for gas oil and natural gas will increase by 1.7 and 3.5 percent, respectively, over the 2010-2030 period. The de-mand for solar energy will also rise on average by 11.5 percent per year for the 2010-2030 period. The total demand for oil products, natural gas and solar energy by household is projected to grow by 3 percent per year on average, increasing from 332 MBOE in 2010 to 603 MBOE in 2030. Figure 3.3 shows the trend of the future household demand for oil products, natural gas and solar energy.
Figure 3.3. Household Demand for Oil Products, Natural Gas and Solar Energy, BAU Scenario (2010-2030) (MBOE)
200
300
400
500
600
700
MBO
E
0
100
2010 2015 2020 2025 2030
Kerosene Gas Oil LPG Natural Gas Solar Total

30
Sustainable Energy Strategy for IranHistorical Trends and Future Energy Consumption
Table 3.1. BAU Scenario Results for Household Demand for Fuel by Application (2010-2030)Share (%) 2010 (MBOE) 2030 (MBOE) Growth
(%/year)Kerosene 39 11 -6.0%Space Heating 0 0 0Cooking 100 39 11Water Heating 0 0 0Gas Oil 8 11 1.7%Space Heating 80 7 9Cooking 0 0 0Water Heating 20 2 2LPG 7 6 -1.1%Space Heating 0 0 0Cooking 50 4 3Water Heating 50 4 3Natural Gas 273 546 3.5%Space Heating 75 205 409Cooking 10 27 55Water Heating 15 41 82Solar* 3 29 11.5%Heating 2 21Cooking 1 3Warm Water 0 4Total 332 603 3.0%* The solar share will increase from 1 percent in 2010 to 5 percent in 2050. Sources: Energy Balance (2012); and authors’ calculations.
ElectricityHousehold demand for electricity is estimated using a bottom-up approach. This approach uses micro level data that allows for the analysis of various scenarios regarding changes in technology, penetration rates and other determinants of demand. Demand for electricity (E) by a household depends on electrical appliances, penetration rates and efficiency as follows:
(2)
where φ is the penetration rate and eljt is the amount of electricity used by each appliance measured by the number of appliances (K) multiplied by their energy coefficients (e). M is

31
Sustainable Energy Strategy for Iran Historical Trends and Future Energy Consumption
the total number of appliances in a household. The total demand for electricity (TE) can then be estimated using the information on population and family structure as follows:
(3)
where N is the population in the initial year, r the population growth rate, n the size of the household, C the number of customers and H the number of households.
We use data from reports by TAVANIR as well as a survey on household electricity consumption in Tehran by the Regional Electricity Company (TREC), a survey on house-hold energy consumption conducted by the Statistical Center (2010) and Energy Balance (2012) to estimate the household demand for electricity. General information about resi-dential electricity consumption in Iran is presented in Table 3.2. In 2010, about 22 million customers used electricity, of which 81 percent were urban. The ratio of customers to the overall population is 0.34 in urban areas, and 0.20 in rural areas.6 That is, on average an urban customer consists of three persons and a rural customer of five persons.
Table 3.2. Household Electricity Demand (2010)Urban Rural Total
Number of Customers (million) 18.040 4.185 22.225Population (million) 53.808 20.925 74.733
Persons per Customer 3.0 5.0 3.4
Consumption (GWh) 49,332 7,355 56,687Source: Energy Balance (2012), Household Energy Survey (2010) and the authors’ calculations.
The major appliances used by Iranian households are reported in Table 3.3. Most modern appliances are used by urban households, but as the economy develops, the penetration rates of new appliances and electronic devices will increase. The major changes are as-sumed to occur in the penetration of lamps, freezers, microwaves, air conditioners and computers. The government policy to encourage the use of low-consumption lamps (CFL) and the gradual realization of the benefits of using those lamps by households will lead to a higher penetration rate of new lamps. As income rises, the use of some appliances such as freezers, microwaves, tea/coffee makers, washing machines and, particularly, air condi-tioners and computers will also increase. There is no data on appliances for rural areas, but the penetration rates of appliances for rural households are estimated using general information about the living condition of households in those areas. For instance, the penetration rates for appliances such as freezers, microwaves and washing machines are assumed to be zero and for appliances such as TVs and refrigerators a fraction of urban penetration rates. The total penetration rates are obtained by applying the appropriate weights, which are the shares of urban and rural households using electricity. Table 3.3
6 The ratio for urban households was 0.25 in 2005.
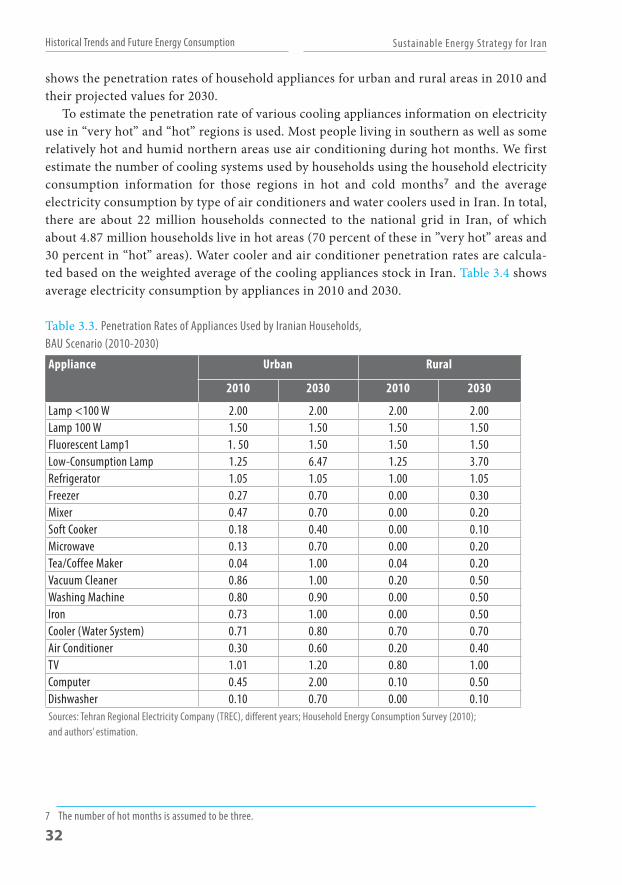
32
Sustainable Energy Strategy for IranHistorical Trends and Future Energy Consumption
shows the penetration rates of household appliances for urban and rural areas in 2010 and their projected values for 2030.
To estimate the penetration rate of various cooling appliances information on electricity use in “very hot” and “hot” regions is used. Most people living in southern as well as some relatively hot and humid northern areas use air conditioning during hot months. We first estimate the number of cooling systems used by households using the household electricity consumption information for those regions in hot and cold months7 and the average electricity consumption by type of air conditioners and water coolers used in Iran. In total, there are about 22 million households connected to the national grid in Iran, of which about 4.87 million households live in hot areas (70 percent of these in ”very hot” areas and 30 percent in “hot” areas). Water cooler and air conditioner penetration rates are calcula-ted based on the weighted average of the cooling appliances stock in Iran. Table 3.4 shows average electricity consumption by appliances in 2010 and 2030.
Table 3.3. Penetration Rates of Appliances Used by Iranian Households, BAU Scenario (2010-2030)Appliance Urban Rural
2010 2030 2010 2030
Lamp <100 W 2.00 2.00 2.00 2.00Lamp 100 W 1.50 1.50 1.50 1.50Fluorescent Lamp1 1. 50 1.50 1.50 1.50Low-Consumption Lamp 1.25 6.47 1.25 3.70Refrigerator 1.05 1.05 1.00 1.05Freezer 0.27 0.70 0.00 0.30Mixer 0.47 0.70 0.00 0.20Soft Cooker 0.18 0.40 0.00 0.10Microwave 0.13 0.70 0.00 0.20Tea/Coffee Maker 0.04 1.00 0.04 0.20Vacuum Cleaner 0.86 1.00 0.20 0.50Washing Machine 0.80 0.90 0.00 0.50Iron 0.73 1.00 0.00 0.50Cooler (Water System) 0.71 0.80 0.70 0.70Air Conditioner 0.30 0.60 0.20 0.40TV 1.01 1.20 0.80 1.00Computer 0.45 2.00 0.10 0.50Dishwasher 0.10 0.70 0.00 0.10Sources: Tehran Regional Electricity Company (TREC), different years; Household Energy Consumption Survey (2010); and authors’ estimation.
7 The number of hot months is assumed to be three.

33
Sustainable Energy Strategy for Iran Historical Trends and Future Energy Consumption
Table 3.4. Household Average Electricity Consumption by Appliances (kWh/year)2010 2030 Growth (%/year)
Lamp <100 W 169 156 -0.4Lamp 100 W 243 243 0.0Fluorescent Lamp 110 82 -1.5Low-Consumption Lamp 30 102 6.2Refrigerator 609 627 0.1Freezer 126 365 5.5Mixer 9 11 1.0Soft Cooker 21 50 4.5Microwave 14 95 10.0Tea/Coffee Maker 2 51 17.1Vacuum Cleaner 79 99 1.1Washing Machine 97 143 2.0Iron 149 258 2.8Cooler (Water) 95 99 0.2Air Conditioner 477 961 3.6TV 268 445 2.6Computer 30 190 9.6Dishwasher 20 138 10.1Total 2,551 4,115 1.9Growth rates are rounded. Sources: Tehran Regional Electricity Company (TREC), different years; Household Energy Consumption Survey (2010); and authors’ estimation.
Average electricity consumption by appliances will grow on average by 1.9 percent per year for the 2010-2030 period. Electricity consumption by appliances and electronic de-vices such as freezers, microwaves, tea and coffee makers, air conditioners, low-consump-tion lamps and computers will grow by between 1 and 17 percent, but consumption by traditional lamps will decrease. The number of households using electricity is linked to the population, and its future values are estimated using the household-to-population ra-tio, which was 0.34 for urban areas and 0.20 for rural areas in 2010. The total electricity demand by households for the 2010-2030 period is obtained by multiplying the number of households by the total electricity consumption per household using the penetration rates reported in Table 3.3.
Table 3.5 shows the results of the BAU scenario for the household electricity demand for the 2010-2030 period. The number of customers, consumption per household and total electricity consumption by households will grow on average more rapidly in urban areas than in rural areas. The ratio of urban-rural household electricity consumption will increase from about 7 in 2010 to 9 in 2030, and the per household consumption ratio from 1.5 to 1.6. The number of residential customers (households) will grow by 1.3 percent, and the total electricity use by households by 3.8 percent on average for the 2010-2030 period. Figure 3.4 shows future trends for the residential demand for electricity.

34
Sustainable Energy Strategy for IranHistorical Trends and Future Energy Consumption
Table 3.5. Residential Demand for Electricity, BAU Scenario (2010-2030)2010 2030 Growth (%/year)
UrbanNumber of Customers (million)
18.04
24.09
1.46
Consumption per Household per Year (kWh) 2,735 4,386 2.4Total Consumption (GWh) 49,332 105,521 3.9
RuralNumber of Customers (million)
4.18
4.80
0.68
Consumption per Household per Year (kWh) 1,758 2,782 2.3Total Consumption (GWh) 7,355 13,328 3.0
TotalNumber of Customers (million)
22.22
28.88
1.32
Total Consumption (GWh) 56,687 118,848 3.77Source: Tehran Regional Electricity Company (TREC), different years; Household Energy Consumption Survey (2010); and authors’ estimation.
Figure 3.4. Residential Demand for Electricity (2010-2030) (GWh)
Table 3.6 presents the total electricity consumption by appliances in 2010 and 2030. Lighting is the major component of electricity use by households, and will remain so in the future, despite the use of more efficient light bulbs. Refrigerators use 27 percent of the total electricity consumption by households, but its share will fall to 15 percent in 2030 as
40,000
60,000
80,000
100,000
120,000
140,000
GW
h
0
20,000
2005 2010 2015 2020 2025 2030
Urban Rural Total

35
Sustainable Energy Strategy for Iran Historical Trends and Future Energy Consumption
less efficient refrigerators are phased out. The share of other appliances and electronic devices such as air conditioning units, freezers, dishwashers and computers will increase because of urbanization and changes in households’ lifestyle.
Table 3.6. Total Electricity Consumption by Appliances, BAU Scenario (2010-2030) (GWh)Urban Rural Total Share (%)
2010 2030 2010 2030 2010 2030 2010 2030
Lamp <100W 3,055 3,746 709 745 3,764 4,491 6.6 3.8Lamp 100W 4,384 5,854 1,017 1,164 5,401 7,018 9.5 5.9Fluorescent Lamp 1,984 1,973 460 392 2,444 2,365 4.3 2.0LCL* 544 2,632 130 300 674 2,932 1.2 2.5Refrigerator 11,107 15,176 2,437 2,917 13,545 18,094 23.9 15.2Freezer 2,806 9,713 0 828 2,806 10,541 4.9 8.9Mixer 201 295 0 24 201 319 0.4 0.3Soft Cooker 468 1,388 0 69 468 1,457 0.8 1.2Microwave 316 2,631 0 125 316 2,755 0.6 2.3Tea/coffee Maker 40 1,431 9 52 49 1,483 0.1 1.2Vacuum Cleaner 1,676 2,602 90 259 1,766 2,860 3.1 2.4Washing Machine 2,158 3,740 0 397 2,158 4,137 3.8 3.5Iron 3,321 6,787 0 675 3,321 7,462 5.9 6.3Water Cooler 1,957 2,698 156 168 2,113 2,866 3.7 2.4Air Conditioner 9,175 24,499 1,419 3,248 10,594 27,747 18.7 23.3TV 5,052 11,274 894 1,569 5,947 12,843 10.5 10.8Computer 643 5,203 34 287 677 5,491 1.2 4.6Dishwasher 446 3,878 0 75 242 2,593 0.8 3.4Total 49,332 105,521 7,355 13,328 56,687 118,848 100 100*LCL: low-consumption lamp. Sources: Tehran Regional Electricity Company (TREC), different years; Household Energy Consumption Survey (2010); and authors’ calculations.
3.3.2 Manufacturing IndustriesIndustry accounts for about 20 percent of the Iranian GDP, and uses about 21 percent of the total energy consumption. Iranian manufacturing industries were mostly established in the 1960s and developed rapidly in the 1970s, when the oil price hike and rising oil pro-duction led to increasing national and foreign investment and imports of raw and inter-mediate goods. The government adopted an import substitution policy through a series of trade, financial and input protectionist means. The policy was continued and intensified after the Iranian revolution in 1979, as the government took over large manufacturing in-dustries and self-sufficiency became the major goal of industrial development, particularly during the imposed eight-year war and US economic sanctions. Despite new investments after the war and increasing growth in certain areas such as the auto, food, chemical and petrochemical industries, most manufacturing industries still rely heavily on government

36
Sustainable Energy Strategy for IranHistorical Trends and Future Energy Consumption
protection policy and, therefore, are uncompetitive on international markets. Cheap ener-gy has always been one of the protective means for the manufacturing industries in Iran, which has contributed to the development of many energy-intensive industries. However, the prolonged protectionist policy and the lack of domestic and foreign competition has led to inefficiencies, particularly in energy use.
We model energy demand in industry using the end-use approach and survey data on large (more than ten workers) manufacturing industries available from the Statistics Cen-ter of Iran and the Central Bank of Iran. The energy demand for the manufacturing indus-tries sector is specified as follows:
where E is the total energy demand, e is energy intensity for industry j and VA is the value added. Energy intensity is measured as energy used in MBOE divided by value added in constant 2005 billion rials for each industry. We use data at the two-digit ISIC8 level, in which the manufacturing industries are classified into nine main industry groups. Table 3.7 presents value added and energy used in each manufacturing industry in 2010. The “Ma-chinery and Equipment Manufacturing” sector is the largest industrial group in Iran, ac-counting for about 28 percent of the total value added of all manufacturing industries. “Chemicals” and “Refineries” each produce 14 and “Non-Metal Minerals” 13 percent of the total value added by manufacturing industries. The shares of “Basic Metals” and “Food and Beverages” are 10 percent each and “Textile and Leather” 4 percent in the total valued added.
The sector defined as “Basic Metals” has the highest energy use (26 percent) among the manufacturing industries, followed by Chemicals (19 percent), Non-Metal Minerals (18 percent), Refineries (15 percent) and Food and Beverages (7 percent). Overall, natural gas is the dominant source of energy in industry, which accounts for 56 percent of the total energy used in this sector. The share of natural gas in the total energy use by industry has been increasing because of the government’s aggressive policy of substituting natural gas for oil products. However, this has caused some difficulties to industries during cold winter months, when the National Gas Company cuts off the supply of natural gas to manufacturing industries in response to rising household demand. The shares of other energy type uses in the manufacturing industries are as follows: 19 percent fuel oil, 15 percent electricity, 2 percent liquefied petroleum gas (LPG), 1 percent gas oil, 0.6 percent gasoline and 0.3 percent kerosene.9 Energy intensity varies among industries depending on the type of the industry and their technology. Overall, energy intensity in 8 International Standard of Industry Codes9 There is a discrepancy between the data published by the Iranian Statistics Center (ISC) and the Ministry of Power’s document
entitled the Energy Balance (EB) regarding energy use by manufacturing industries. This is mainly due to the difference in the samples used by these two agencies. Here, we have taken the total energy use from the EB and distributed its differences with ISC among the industries using their shares from the ISC and the Central Bank.

37
Sustainable Energy Strategy for Iran Historical Trends and Future Energy Consumption
the manufacturing industry had been decreasing by 7 percent on average for the 1988-2005 period, but has started to increase recently. Specifically, it has been growing by 2.5 percent annually since 2005, with the Basic Metals and Refinery sectors leading the growth (3 and 1.7 percent, respectively), and some industries such as “Wood” and Food and Beverage experiencing negative growth rates (-1.5 and -1.1 percent, respectively). In 2010, Basic Metals had the highest energy intensity, followed by Non-Metal Minerals, Chemicals and Petrochemical, and Paper, Pulp and Printing industries.
The future energy demand for manufacturing industries is estimated using the energy intensity and the estimated value added for each industry and energy type for the 2010-2030 period. In deriving the BAU scenario, the recent trends in energy intensity and the gasification policy of the manufacturing industry, particularly in Food and Beverages, Wood and Wood Products, Textile and Leather, and Paper, Pulp and Printing, as well as the objectives outlined in the Ministry of Industry plans, the Fourth and Fifth FYDP and the 20-Year Vision are taken into account. It is also assumed that overall energy intensity in the manufacturing industry would decline slowly by one percentage point per year. The results are shown in Table 3.8. The manufacturing industries are projected to grow on average at a rate of 8 percent per year in 2010-2020 and 5 percent per year in 2020-2030. The total energy demand by manufacturing industries is projected to grow on average by 6 percent per year in 2010-2020 and by 4 percent in 2020-2030.
Table 3.7. Manufacturing Industries Value Added and Energy Use (2010)Value Added(constant 2005 billion rials)
Share(%)
Energy Use(MBOE)
Share(%)
Energy Intensity (MBOE/1,000 billion rials)
Food and Beverages 41,392 10 21 7 0.50Textile and Leather 15,178 4 6 2 0.39Wood and Wood Products 2,107 1 1 0.3 0.42Paper, Pulp and Printing 5,590 1 5 2 0.95Chemical and Petrochemical 60,125 14 56 19 0.93Refineries 59,435 14 43 15 0.72Non-Metal Minerals 53,443 13 53 18 1.00Basic Metals 43,133 10 77 26 1.79Machinery and Equipment 118,630 28 12 4 0.10Other Industrial 17,359 4 19 6 1.08Total 416,392 100 293 100 0.70Sources: Statistical Center of Iran (2012); Central Bank Economic Data, National Income Account (2014); and authors’ calculations.

38
Sustainable Energy Strategy for IranHistorical Trends and Future Energy Consumption
Table 3.8. Demand for Energy by Manufacturing Industries, BAU Scenario (2010-2030) (MBOE)
2010 2030 Growth (%/year)
Food and Beverages 21 60 5.5Textile and Leather 6 20 6.3Wood and Wood Products 1 1 1.1Paper, Pulp and Printing 5 17 6.1Chemical and Petrochemical 56 155 5.2Refineries 43 81 3.2Non-Metal Minerals 53 98 3.1Basic Metals 77 292 6.9Machinery and Equipment 12 45 6.9Other Industrial 19 31 2.5
Total 293 800 5.1
Sources: Energy Balance (2012); Statistical Center of Irany (2014); Central Bank National Income Account (2014); and authors’ calculations.
Table 3.9 presents the results of the demand for energy in manufacturing industries by energy types in the BAU scenario. The projections are based on the existing and future distri-bution of energy types among industries according to government policy, particularly pro-motion of the use of natural gas. Natural gas and gasoline demand will grow by 5.6 percent per year on average and the other energy types at a range of 3 to 5 percent. Figure 3.5 shows the total demand for energy in different manufacturing industries for the 2010-2030 period.
Table 3.9. Demand for Energy by Manufacturing Industries by Energy Types, BAU scenario (2010-2030) (MBOE)
2010 2030 Growth (% / year)Kerosene 0.9 1.8 3.5Gas Oil 20.0 53.7 5.2
Natural Gas* 164.7 512.0 5.5LPG 5.6 12.0 3.9Gasoline 1.7 5.2 5.6Fuel Oil 54.2 132.2 4.5Electricity** 44.5 80.8 3.5Renewables 1.2 1.3 0.4Total 292.9 799.5 5.1* Natural gas does not include CHP input. **Electricity is without own generation from CHP.Sources: Energy Balance (2012); Statistical Center of Iran (2014); Central Bank National Income Account (2014); and authors’ calculations.

39
Sustainable Energy Strategy for Iran Historical Trends and Future Energy Consumption
Figure 3.5. Total Energy Demand by Manufacturing Industries, BAU (2005-2030) (MBOE)
3.3.3 Power Generation PlantsPower generation plants are an important part of the energy sector, as they are both energy users and energy producers. In 2010, power generation plants used 365 MBOE oil and natural gas and generated 135 MBOE electricity. Power generation plants use different types of the energy depending on the type of technology they employ, and produce electricity for different sectors of the economy. The total installed capacity was about 59 GW using different technologies: 26 percent steam, 34 percent natural gas, 26 percent combined cycle, 15 percent hydropower and 0.1 percent renewable energies. Table 3.10 presents the structure of the existing power generation plants in Iran.
Table 3.10. Installed Capacities of Power Plants (2010)Type GW Share (%)Steam 15 26Natural Gas 20 34Combined Cycle 15 26Hydropower 9 15Renewable 0.1 0Total 59 100Source: Energy Balance (2010).
The electricity production by power generation plants is estimated in three steps as fol-lows. First, the future demand for electricity by each sector of the economy is estimated
100
200
300
2010 2015 2020 2025 2030
400
500
600
700
800M
BOE
0
Food Textile Wood Paper Chemical RefineryNon-Metal Mining Basic Metals Machinery and Equip. Other Industrial

40
Sustainable Energy Strategy for IranHistorical Trends and Future Energy Consumption
using the future value added as well as the energy (electricity) intensity. Second, the total electricity demand is obtained by adding the transmission and distribution losses as well as power plants’ own use, which are assumed to decline by 1 percent based on past trends. Finally, the total generation capacity by the power generation plants is then estimated using the average load factor. The new capacity needed is assumed to be met by a combi-nation of combined cycle, nuclear and renewable power generation plants, as outlined in the energy policies. The total electricity demand is estimated to grow on average by 3.4 percent annually for the 2010-2030 period. In 2010, thermal plants will produce 94 percent and renewable and nuclear plants 6 percent of 238 TWh total electricity production. It is assumed that combined cycle plants will generate 96 percent and gas turbine plants 4 percent of new thermal capacities. In addition, nuclear plants will generate 4 TWh, large hydropower 12 TWh, small hydropower 280 GWh, wind power 216 GWh, solar thermal 1.2 GWh and biogas 23 GWh. Table 3.11 shows the total electricity capacity generation by power generation plants in 2010 and 2030.
Table 3.11. Total Electricity Generation in Iran, BAU Scenario (2010-2030)2010 2030 Growth (%/year)
Total Electricity Consumption by All Sectors (GWh) 192,261 373,961 3.4Transmission and Distribution Losses (GWh) 37,951 58,281 2.2Power Plant Own Consumption (GWh) 8,399 12,813 2.1Total Electricity Generation (million KWh) 238,611 445,055 3.2Average Load Factor (h/year) 4,037 4,037 0.0Total Installed Capacity (GW) 59.11 110.24 3.2
Sources: Energy Balance (2010), and the authors’ calculations.
Table 3.12 shows electricity generation by existing and future power generation plants. It is assumed that thermal plants will generate the lion’s share of the total electricity and that nuclear plants will generate the base load with 1,000 MW capacity. Based on the Ministry of Energy plan, the new thermal plants will be combined cycle and the main renewable sources hydropower and wind power plants. Hydropower and wind power will contribute about 12 TWh and 2.5 TWh to electricity generation, respectively. Biogas and geothermal will generate 23 GWh and 10 GWh, small hydropower and solar 280 GWh and 2.4 GWh, respectively.

41
Sustainable Energy Strategy for Iran Historical Trends and Future Energy Consumption
Table 3.12. Electricity Generation by Renewable and Non-Renewable Sources, BAU Scenario (2010-2030) (GWh)
2010 2030 Growth (%/year)Total Electricity Generation 238,611 445,055 3.2Fossil-Fuel Power Plants 226,109 426,411 3.2Nuclear Power 0 3,935Renewable Sources 12,502 14,709 0.8
Hydropower 11,959 11,959 0.0Wind power 216 2,416 12.8Photovoltaic 0 6 20.4Geothermal 10 10 0.0Solar thermal power 1 2 3.5Small hydropower 280 280 0.0Biomass 23 23 0.0
Sources: Energy Balance (2010) and the authors’ calculations. Nuclear data is from the International Atomic Energy Agency (IAEA), Power Reactor Information System.
Fuel use by the power plants is estimated assuming that future thermal power plants will only use natural gas with an average efficiency rate of 46 percent. The results are presented in Table 3.13. The total fuel demand by power generation plants will grow on average by 1.3 percent per year for the 2010-2030 period. Demand for gas oil, heavy fuel and natural gas by existing plants will decrease slightly, but demand for natural gas by new power plants will increase by about 28 percent per year. It is also assumed that solar heat power plants, which will generate 2.4 GWh electricity, will need about 1 GWh of natural gas by 2030.
Table 3.13. Energy Demand by Power Generation Plants, BAU Scenario (2010-2030) (MBOE)2010 2030
Total Fuel 339 593Gas Oil 46 46Natural Gas (Existing Plants) 216 216Natural Gas (New Plants) - 254Solar Heat Power Plants - 0Heavy Fuel 76 76Average Efficiency Factor (%) 39 42
3.3.4 TransportationThe transportation sector uses about 26 percent of the total energy consumption in Iran, 53 percent of the total consumption of oil products, 2.5 percent of natural gas and 0.07 percent of electricity. About 636 billion passenger kilometers were traveled in 2010 by car, bus, train and airplane. The share of cars in passenger transportation is 62 percent, bus 35 percent, train 1 percent and airplane 2 percent. Also about 302 billion ton-kilometers

42
Sustainable Energy Strategy for IranHistorical Trends and Future Energy Consumption
of freight was transported, 92 percent of which went by truck and 8 percent by train. The main energy types used in the sector are gas oil, gasoline and jet fuel. Natural gas (LPG and CNG) has been also added to the energy basket of the sector and its share has been increasing rapidly, mainly because of the recent hike in gasoline prices and quotas. We use a time series data and regression method to estimate the demand for energy in car and freight transport. We then use the estimation results and apply the assumptions about the future economic and population growth to forecast future demand. Passenger TransportationPassenger transportation includes road (car, bus), train and air transportation. The basic information about road transportation is summarized in Table 3.14. There are four im-portant indicators in road transportation as follows: the number of vehicles, travel distance per vehicle and year, load factor, and the specific energy consumption. The number of passenger cars is more than 11 million in 2010, which will grow in line with per capita income. The regression results show that GDP and the population can explain more than 90 percent of the long-run demand for cars. The results indicate that in the past 35 years (1977-2010), for every one billion rials (in constant 2005 values) of additional income, on average 7.2 new vehicles are added to the transport system; for every 1,000 added to the population, 61 new vehicles are added. The results of the regression equation were then used to estimate future demand for cars based on the assumptions about the GDP and population growth. In addition to higher incomes and an increasing population, low gasoline prices have also contributed to the rapidly growing demand for cars in recent years. However, it is expected that the trend will flatten as gasoline prices approach market prices. According to the estimated results, demand for cars will grow on average by 4.4 percent per year, increasing to 26 million cars by 2030.
The average travel distance per car has been decreasing from 24,000 km per year to 21,500 km per year in 2010 as a result of a developing public transportation system, but is expected to remain the same until 2030. The load factor is 1.7 passenger-km per car/km, which will decrease to 1.5 passenger-km as more people will have a car. The average gasoline consumption by passenger cars is 10 liters per 100 kilometers, which is high compared to international standards. We assume that technology improvements and higher incomes will allow for the use of more efficient cars in the future, reducing the gasoline consumption to 7 liters per 100 km in 2030. Total gasoline consumption by passenger cars, obtained by multiplying the total travel distance by the specific energy consumption, is 24 billion liters or 127 MBOE in 2010, and will grow on average by 2.7 percent per year, reaching more than 40 billion liters in 2030.
The numbers of buses for public transportation is 233,000, which will increase to more than 1.2 million in 2030. The average total travel distance by bus is 45,150 km per bus per year, which should increase to 46,200 km in 2030. The total travel distance by bus will increase from 10 billion km in 2010 to 56 billion km in 2030. The average consumption of gas oil by buses, which is 47 liters per 100 km, will decrease to 30 liters per 100 km in 2030, that is, a 2.2 percent decline per year. The total gas oil consumption by buses can be

43
Sustainable Energy Strategy for Iran Historical Trends and Future Energy Consumption
calculated similar to gasoline consumption by car using the indicators above. It is 4.9 billion liters in 2010, but will increase on average by about 6 percent per year, reaching 16.8 billion liters in 2030.
In 2010, more than 6.5 billion passenger-km were traveled by train and more than 13 billion passenger-km by airplane. Since there is no detailed data on these two transpor-tation modes, we assume that they will grow on average by 4 percent per year. The average gas oil consumption by trains is 0.0085 liters per passenger-km and is assumed to remain unchanged. The total gas oil consumption by trains is 56 million liters, which is estimated to grow to 123 million liters in 2030. The total jet fuel consumption is 1.9 billion liters, which is expected to increase to 3.2 billion liters in 2030 assuming an annual efficiency increase of 1.5 percent.
CNG as an environmentally friendly, cheaper fuel has recently been introduced to the Iranian traffic system as a substitute for gasoline and gas oil. There is an ambitious plan to build the infrastructure required for the production and distribution of CNG, particularly in large cities. The share of CNG in road transportation energy consumption is 4 percent in 2010, which will rise to 6 percent in 2030.
Table 3.14. Passenger Transportation Indicators, BAU Scenario (2010-2030)2010 2030
PrivateNumber of Cars (in millions) 11 26Average Total Travel Distance by a Passenger Car per Year (in km/year) 21,500 21,500Total Travel Distance by Passenger Cars per Year (in million km/year) 237,736 564,467Average Load per Car (number of persons) 1.7 1.5Total Travel Distance by Passengers (in millions of person km/year) 394,641 846,700Average Gasoline Consumption per Car (in liters/100 km) 10 7Total Gasoline Consumption by Passenger Cars (in millions of liters) 23,774 39,513
PublicNumber of Buses (1,000) 233 1,213Average Travel Distance by Bus per Year (in km/year) 45,150 46,200Total Travel Distance by Bus (in millions of km/year) 10,520 56,052Total Travel Distance by Passengers – Bus (in millions of person km/year) 220,919 1,121,048
Average Gas Oil Consumption by Bus (in liters/100 km) 47 30
Total Gas Oil Consumption by Bus (in millions of liters) 4,923 16,434
Total Travel Distance by Train (in millions of person km) 6,615 14,494
Total Gas Oil Consumption by Train (in millions of liters) 56 123
Total Travel Distance by Air (in millions of person km) 13,365 29,284
Total Fuel Consumption by Airplane (in millions of liters) 1,941 3,166
Sources: IFCO (2010); Energy Balance (2010); and authors’ calculations.

44
Sustainable Energy Strategy for IranHistorical Trends and Future Energy Consumption
Freight Transportation Freight transportation in Iran consists of truck, train, air and sea. Truck accounts for 92 percent and train about 8 percent of the total freight transportation. The shares of air and sea are not significant. Using the travel distance by trucks and trains and their specific energy consumption, we obtain the total energy consumption by these two transportation modes. The results are presented in Table 3.15. Freight transportation by truck uses about 17 billion liters and by train 303 million liters of gas oil. This is projected to increase to about 20 billion liters and 600 million liters in 2030; that is, a growth rate of 1 and 3.5 percent on average per year, respectively. The total consumption of gas oil by freight transportation is 105 MBOE, which will increase to 121 MBOE in 2030. Sea transportation uses about 1 percent of the total Iranian gas oil consumption. Since there is no direct and reliable data on the details of this sector, we assume that this ratio will remain constant in the study period.
Table 3.15. Freight Transportation Indicators, BAU Scenario (2010-2030)2010 2030
Freight Transportation by Truck (in million ton km) 277,649 517,568Freight Transportation by Train (in million ton km) 24,276 47,980Total Fuel Consumption by Truck (in millions of liters) 17,103 20,703Total Fuel Consumption by Train (in millions of liters) 303 600Sources: IFCO (2010); Energy Balance (2010); and authors’ calculations.
Table 3.16 shows the total consumption of different energy types used by the transportation sector. Gasoline and gas oil will remain the major energy types used in the sector. The total final energy demand in the transportation sector, which is 286 MBOE in 2010, will grow on average by 2.8 percent per year, reaching 493 MBOE in 2030.
Table 3.16. Final Energy Demand by the Transportation Sector, BAU Scenario (2010-2030) (MBOE)2010 2030 Growth (%/year)
Gasoline 127 211 2.6Gas Oil (Buses and Trucks) 136 229 2.6Gas Oil (Trains) 2 4 3.6CNG 9 30 6.2Jet Fuel 9 15 2.5Ship Fuel 2.3 3.4 2.0Total 286 493 2.8Source: Energy Balance (2010); IFCO (2010); and authors’ calculations.
Figure 3.6 shows the current and BAU scenario for fuel consumption by transportation mode in the transportation sector.

45
Sustainable Energy Strategy for Iran Historical Trends and Future Energy Consumption
Figure 3.6. Energy Demand by Road Transportation, BAU Scenario (2010-2030) (MBOE)
3.3.5 Other Sectors In this section, we model energy consumption by the public, commercial and agriculture sectors. These three sectors account for about 60 percent of the total value added of the economy, but use less than 10 percent of the total energy consumption.
Public SectorThe public sector accounts for 6.5 percent of the GDP and uses about 2.8 percent of the total energy consumption in the economy. More than half of the energy used in the sector is electricity and one quarter is gas oil. Table 3.17 shows total consumption of different ty-pes of energy and their energy intensities in the public sector. Since there is no individual data for the consumption of natural gas by public sector, we estimate it by assuming that natural gas has substituted fuel oil for the past 15 years. Therefore, the consumption of natural gas for the 1996-2010 period will be equivalent to the reduction in fuel oil consumption in the public sector.
Table 3.17. Energy Demand by Public Sector, BAU Scenario (2010-2030)Energy Intensity (BOE/constant
2005 million rials) - 2010Energy Use
(MBOE) - 2010Energy Use
(MBOE) - 2030Growth (%)
Gasoline 0.01 1.16 2.20 3.2Kerosene 0.02 2.51 0.25 -10.8Gas Oil 0.06 8.05 10.10 1.1Fuel Oil 0.02 2.87 3.79 1.4Electricity 0.09 12.46 23.48 2.5Natural Gas 0.002 0.22 0.43 3.2Total 27.26 40.24 2.0
Source: Energy Balance (2010); Central Bank, Economic Data (2014); and authors’ calculations.
2010 2015 2020 2025 2030
100
200
300
400
500M
BOE
0
Gasoline Gas Oil CNG Jet Fuel Total

46
Sustainable Energy Strategy for IranHistorical Trends and Future Energy Consumption
The future energy consumption of the public sector is estimated by multiplying the future value added of the sector by future energy intensities. The share of the public sector in the economy has been fluctuating, but according to the privatization policy outlined in the Five-Year Plans and the 20-Year Vision, it is expected to decrease in the future. We assume the value added of the public sector will grow with the economy on average by 3.2 percent per year and its share will remain at 6.5 percent in the study period. The energy intensities for different energy types have been decreasing for the 2005-2010 period, and we assume that the trend will continue in the future, but at slower rates. The only exception is natural gas, the intensity of which has been growing and will continue to grow, albeit at a slower rate. The estimation results for energy demand by the public sector are shown in Table 3.17 The total energy demand in the public sector will grow on average by 2 percent per year for the 2010-2030 period. Electricity and natural gas will be the two major energy types used in the public sector in 2030. Figure 3.7 shows the future trend of the demand for energy in the public sector.
Figure 3.7. Demand for Energy in the Public Sector, BAU Scenario (2010-2030) (MBOE)
The Commercial SectorThe commercial sector accounts for about 48 percent of GDP, and has been growing by about 14 percent for the past ten years. It uses about 6 percent of the total energy consumption in the economy, of which 9 percent is electricity, 19 percent fuel oil, 8 percent gas oil, and 63 percent natural gas. Table 3.18 shows the consumption of different energy types in the sector and the energy intensities. Since no individual data is available for natural gas consumption, we estimate it by assuming that natural gas has been substituted for fuel oil in the sector since 1996.
2010 2015 2020 2025 2030
5
10
15
20
25
30
35
40
45
MBO
E
0
Gasoline Kerosene Gas Oil Fuel Oil Electricity Natural Gas Solar Total

47
Sustainable Energy Strategy for Iran Historical Trends and Future Energy Consumption
Table 3.18. Energy Demand by the Commercial Sector, BAU Scenario (2010-2030)Energy Intensity (BOE/constant
2005 billion rials)Energy Use
(MBOE) - 2010Energy Use (
MBOE) - 2030Growth (%/year)
Gasoline 0.1 0.1 0.0 -3.8Kerosene 0.4 0.4 0.2 -3.3Gas Oil 0.5 4.9 5.0 0.1Fuel Oil 10.8 10.8 5.5 -3.3Electricity 6.1 4.9 5.7 0.8Natural Gas 41.7 41.1 60.7 2.0Total 6.4 62.2 77.2 1.1Source: Energy Balance (2010); Central Bank, Economic Data (2014); and authors’ calculations.
The total demand for energy in the commercial sector is estimated using the future value added of the sector and energy intensities. The future value added of the commercial sector is estimated by assuming the share of the sector in GDP will increase from 48 percent in 2010 to 50 percent in 2030. This means that the sector will grow on average by 5.4 percent per year in the next 20 years. Energy intensities in the sector have been decreasing for all energy types apart from natural gas. We assume that future energy intensities for all energy types including natural gas will continue, albeit at slower rates. Table 3.18 shows the results of the BAU scenario for energy demand by the commercial sector for the years 2010 and 2030. Energy demand will decline for gasoline, kerosene and fuel oil at an average rate of about 3 percent, but will grow for electricity and natural gas by an average of 0.8 and 2 percent per year, respectively. The total demand for energy in the commercial sector will grow on average by 1.1 percent per year for the 2010-2030 period.
Figure 3.8 shows the future trend of energy demand in the commercial sector. Natural gas and electricity will remain the main sources of energy in this sector in 2030.
Figure 3.8. Demand for Energy in the Commercial Sector (2010-2030) (MBOE)
20102005 2015 2020 2025 2030
20
30
40
50
60
70
80
90
MBO
E
0
10
Gasoline Kerosene Gas Oil Fuel Oil Electricity Natural Gas Solar Total

48
Sustainable Energy Strategy for IranHistorical Trends and Future Energy Consumption
AgricultureAgriculture accounts for about 6 percent of GDP and uses 46 MBOE or 4 percent of the total final energy consumption. The main source of energy in agriculture is gas oil, which accounts for 60 percent of fuel consumption in the sector. The use of electricity has been increasing dramatically in recent decades, reaching 39 percent of the total energy use in the sector. Table 3.19 shows the use of different energy types in 2010 and their energy in-tensities in the sector in 2004.
Table 3.19. Energy Demand by Agriculture, BAU Scenario (2010-2030)Energy Intensity (BOE/constant 2005 million rials)
Energy Use (MBOE) 2010
Energy Use (MBOE) 2030
Growth (%/year)
Gasoline 0.0005 0.10 0.14 1.6Kerosene 0.003 0.6 0.2 -5.13Gas Oil 0.139 27.4 32.1 0.8Electricity 0.149 17.7 39.8 4.14Total 45.8 72.3 2.31
Sources: Energy Balance (2010); Central Bank, Economic Data (2014); and authors’ calculations.
Similar to other sectors, we use valued added and the energy intensities to project the future consumption of energy in agriculture. The future value added of the sector is obtained assuming that the share of agriculture in GDP will remain at 6 percent in the next 20 years. This means that the agriculture sector will grow at a rate of 3.3 percent on average for the 2010-2030 period.10 The energy intensities for all energy types apart from electricity have been decreasing for the past ten years, with kerosene and fuel oil having the highest rates of decline. It is assumed that energy intensities will continue to decline, albeit at lower rates. Future demand for energy in agriculture is estimated using the future value added and energy intensities for the 2010-2030 period. The results are shown in Table 3.19.
Energy demand in agriculture is projected to grow on average by 2.3 percent per year, increasing from 46 MBOE in 2010 to 72 MBOE in 2030. Demand for kerosene will decline, but demand for gas oil, gasoline and, especially, electricity is expected to increase. The higher growth in electricity demand in the sector is mainly due to the current policy of making electricity accessible in all rural areas and particularly of encouraging farmers to switch from gasoline or gas oil water pumps to electrical pumps. The future trend of energy use in the agriculture sector is shown in Figure 3.9.
10 The Vision has set the future growth of agriculture at 6.5 and 5.6 percent for the next two decades, respectively. However, these growth rates seem to be too ambitious given past trends and growing restrictions on resources, particularly water.

49
Sustainable Energy Strategy for Iran Historical Trends and Future Energy Consumption
Figure 3.9. Energy Demand in Agriculture, BAU Scenario (2010-2030) (MBOE)
3.3.6 Total Energy Demand Economic SectorsThe total demand for final energy (without electricity) will increase on average by 3.5 percent per year from 966 MBOE in 2010 to 1,936 MBOE in 2030 in the BAU scenario (excluding energy use for power production). The manufacturing industries will have the highest growth in demand for energy with an average growth of 5.5 percent per year followed by the residential and transportation sectors with about 3 percent annual growth. The demand for energy in the commercial sector will grow on average by 1.6 percent annually, the public sector by 0.6 percent and agriculture by 0.7 percent. Table 3.20 and Figure 3.10 show the BAU scenario results for energy demand in different sectors for the 2010-2030 period.
Table 3.20. Energy Demand in Iran by Sector, BAU Scenario (2010-2030) 2010 (MBOE) Share (%) 2030 (MBOE) Share (%) Growth (%/year)
Households* 332 34 603 31 3.0Manufacturing Industry* 248 26 718 37 5.5Transportation* 286 29 493 25 2.9Public Sector* 15 2 17 1 0.6Commercial* 57 6 71 4 1.6Agriculture* 28 3 32 2 0.7Total* 966 100 1,936 100 3.5Power Plants 339 593 2.8Total (Including Power Plants) 1,305 2,528 3.4
* Final energy without electricity Source: Energy Balance (2010); and authors’ calculations.
MBO
E
2010 2015 2020 2025 2030
30
40
50
60
70
80
0
10
20
Gas Oil Kerosene GasolineFuel Oil Electricity Total

50
Sustainable Energy Strategy for IranHistorical Trends and Future Energy Consumption
Figure 3.10. Total Final Energy Demand by Sector, BAU Scenario (2010-2030) (MBOE)
The demand for electricity by all sectors is predicted to increase on average by 3.4 percent annually, starting at 192 TWh in 2010, and reaching 374 TWh in 2030. Electricity demand in manufacturing industries is expected to grow in line with the average growth rate of total electricity consumption, but households and agriculture should be above average; commercial and transportation industries will be below average. Figure 3.11 shows the demand for electricity by different sectors in the BAU scenario for the 2010-2030 period.
In 2030, 96 percent of electricity will be generated by fossil fuel power plants. The re-maining 4 percent will be produced by renewables and nuclear plants. Natural gas will be the main source (80 percent) of fuel for the power generation plants by 2030. Renewable sources in power generation plants are projected to grow on average by 1 percent per year, from 7.4 MBOE in 2010 to 8.7 MBOE in 2030. It is also assumed that nuclear energy will contribute to the electricity grid by producing about 4 TWh in 2030.
Figure 3.11. Demand for Electricity by Sector, BAU Scenario (2010-2030) (GWh)
2010 2015 2020 2025 2030
1,000
500
0
1,500
2,000
2,500
MBO
E
Household Manufacturing CommercialPublic Agriculture Transport
2010 2015 2020 2025 20300
50,000100,000150,000200,000250,000300,000350,000400,000
GW
h
Household Electricity Man. Ind. Electricity Commercial Electricity
Public Sector Electricity Agriculture Electricity

51
Sustainable Energy Strategy for Iran Historical Trends and Future Energy Consumption
The structure of energy demand will change according to the policies and technological changes in the next 20 years. Specifically, the share of manufacturing industries in total energy consumption will increase from 26 percent in 2010 to 37 percent in 2030. However, the shares of transportation, commercial, public and agriculture sectors will decrease from 29, 6, 2 and 3 percent in 2010 to 26, 4, 1 and 2 percent in 2030, respectively. The share of household use will also decline from 34 percent in 2010 to 31 percent in 2030. The increasing share of manufacturing industries in total demand for energy is mainly due to growing production in the sector; decreasing energy demand shares of transportation and other sectors are due to technological improvements and government policies. Figure 3.12 shows the structure of total energy demand in 2010 and 2030.
Figure 3.12. The Shares of Demand for Energy by Sector, BAU Scenario (2010-2030)
Energy TypesIn the BAU scenario, natural gas demand has the highest growth rate with 4.2 percent growth per year on average, increasing from 705 MBOE in 2010 to 1,608 MBOE in 2030. The demand for oil products (fuel oil, gas oil and gasoline) is expected to grow on average between 1 and 2 percent. Demand for kerosene, however, is forecast to decrease by 6 percent per year on average in this period. Renewable energies will grow on average by 11 percent per year for the next 20 years. Table 3.21 and Figure 3.13 show the total energy demand by type of energy in 2010 and 2030.
2010 2030
20%
30%
40%
50%
60%
70%
80%
90%
100%
0%
10%
Household Manufacturing Industries Commercial
Public Agriculture Transport

52
Sustainable Energy Strategy for IranHistorical Trends and Future Energy Consumption
Table 3.21. Total Primary Energy Demand by Type of Energy, BAU Scenario (2010-2030) (MBOE)*2010 Share (%) 2030 Share (%) Growth (%/year)
Gasoline 130 10 219 9 2.6Kerosene 44 3 14 1 -5.5Gas Oil 255 19 396 16 2.2Fuel Oil 144 11 218 9 2.1Natural Gas 696 54 1,589 63 4.2LPG 13 1 18 1 1.6CNG 9 1 30 1 6.2Renewables 4 1 30 1 10.0Jet Fuel 9 1 15 1 2.5Total 1,305 100 2,528 100 3.4* The figures include power plants’ demand for gas oil, fuel oil and natural gas. Sources: Energy Balance (2010); and author’s calculations.
Figure 3.13. Total Primary Energy Demand by Energy Type, BAU Scenario (2010-2030) (MBOE)
3.3.7 Environmental Impacts of the BAU ScenarioFossil fuels produce greenhouse gases such as carbon dioxide (CO2), carbon monoxide (CO), nitrogen oxides (NOx) and sulfur dioxide (SO2). In 2010, the energy users in the economy produced in total 547 million tons (mt) CO2, 8.7 mt CO, 1.8 mt NOx and 1.4 mt SO2. The transportation sector is by far the most polluting sector in the economy, followed
2010 2015 2020 2025 2030
1,000
1,500
2,000
2,500
3,000
MBO
E
0
500
Kerosene Gas Oil LPG Natural Gas Gasoline CNG Fuel Oil

53
Sustainable Energy Strategy for Iran Historical Trends and Future Energy Consumption
by households, industry and power generation plants. The transportation sector generated 126 mt CO2, which is about 23 percent of the total CO2 generated in 2010. The CO2 gener-ation in residential, commercial and public sectors were 136 mt (25 percent), in power generation plants 165 mt (30 percent), manufacturing industries 106 mt (19 percent), and agriculture 12 mt (2 percent).11 Although the substitution of natural gas for oil products and the development of renewable resources in power generation plants will mitigate CO2 emission problems, an increase in energy demand – especially by manufacturing indus-tries and households – will raise the aggregate pollution level significantly. Table 3.22 shows a summary of the CO2 emissions from primary energy use; Figure 3.14 presents to-tal emissions by energy type; and Table 3.23 shows the shares of different energy types in total emissions for the 2010-2030 period. In the BAU scenario, total CO2 emissions will grow on average by 2.8 percent per year, increasing from 547 mt in 2010 to 950 mt in 2030. CO2 emissions will grow faster in the household, commercial, public and manufacturing industry sectors mainly because of an increasing consumption of natural gas. The total CO emission is expected to grow at a rate of 3 percent per year on average, with a 5 percent growth in manufacturing industries and 3 percent in transportation and power generation plants. NOx will grow on average by 4.4 percent, with a 5.5 percent growth in the manu-facturing and transportation sectors. The main source of CO emission is natural gas; its share will increase from 30 percent in 2010 to 40 percent in 2030. SO2 emissions will grow on average by 2.9 percent, with manufacturing industries and transportation sectors hav-ing the fastest growth rates, exceeding 5 percent. Fuel oil and gas oil will be the main cont-ributors to SO2 emissions, with a share of 64 percent and 34 percent, respectively.
CO2 emission intensities, measured by the ratio of emissions to GDP, are 256 and 102 tons per billion rials in the manufacturing and agriculture sectors, respectively, in 2010, but will decrease to 206 tons/billion rials in manufacturing and increase to 116 tons/billion rials in agriculture. The decline in CO2 in the manufacturing industries is due to a faster increase in GDP than CO2 emissions in the sector because of the use of natural gas. The emission intensity for CO, NOx and SO2 range between 0.3 and 0.6 tons per billion rials in 2010, and will increase to 0.12 to 0.6 tons per billion rials in 2030. The social cost of emis-sions, which captures the compensation expenses for the negative externalities associated with energy consumption, is estimated at 302 trillion rials, which is about 7.25 percent of GDP in 2010.12 It will grow on average at a rate of 3 percent, reaching 560 trillion rials in 2030.
11 The emission figures do not include the CO2-equivalent emissions resulting from conduction losses and burning off during oil production as well as methane and other GHG emissions.
12 Our cost/GDP ratio is much less than reported in the Energy Balance (2010). Using the World Bank and the Environmental Protection Organization studies, the Energy Balance presents the social costs (1000 rials per ton) in 2001 prices as follows: CO2: 80; CO:1,500; NOx: 4,800; and SO2: 14,600. It also uses GDP at 1995 prices to calculate the cost/GDP ratio, which is 19 percent. The reported value is an overestimate, as it uses two different base years for costs and GDP. In this study, we use both costs and GDP calculated at 2010 prices. Numbers are rounded.

54
Sustainable Energy Strategy for IranHistorical Trends and Future Energy Consumption
Table 3.22. Total Emissions and Sectorial Share (2010-2030)Sectors 2010 2030
CO2 CO NOx SO2 CO2 CO NOx SO2
Household, Commercial, Public (%) 28 1 6 4 24 1 5 4Manufacturing Industry (%) 19 3 9 13 29 5 10 19Agriculture (%) 2.4 0.2 3.3 4.4 1.4 0.1 1.5 2.8Transportation (%) 24 95 47 29 21 93 61 48Power Generation Plants (%) 27 2 34 50 24 2 22 26Total Emissions (million tons) 537 8.25 1.84 1.43 1032 14.5 4.61 2.68Emissions from jet fuel are included in gasoline. Emissions from renewable sources are negligible and are not included.Source: Energy Balance (2010); World Bank Indicators (2014); and authors’ calculations.
Figure 3.14. Emissions by Energy Type (2010-2030) (million tons)
Table 3.23. Emission Shares by Energy Type (2010-2030) (%)Energy Source 2010 2030
CO2 CO NOx SO2 CO2 CO NOx SO2
Kerosene 3.6 0.1 0.0 0.7 0.6 0.0 0.0 0.1Gas Oil 21.8 2.8 41.8 52.0 17.9 2.8 35.9 66.1LPG 0.9 0.2 0.1 0.0 0.6 0.1 0.0 0.0Fuel Oil 13.1 1.0 9.8 45.6 10.4 0.6 7.1 31.8Natural Gas 48.5 1.9 29.6 0.0 59.1 2.9 39.5 0.0Gasoline 10.7 93.6 16.7 0.1 9.6 93.1 15.6 0.2CNG 0.7 0.0 0.0 0.0 1.2 0.0 0.0 0.0Total (million tons) 537 8.25 1.84 1.43 1032 14.5 4.61 2.68Emissions from jet fuel are included in gasoline. Emissions from renewable sources are negligible and are not included. Sources: Energy Balance (2010); World Bank Indicators (2014); and authors’ calculations.
0 200 400 600 800 1,000 2,000
2010
2030
2010
2030
2010
2030
COMill
ion
Tons
2010
2030
CO2
Kerosene Gas Oil LPG Fuel Oil Natural Gas Gasoline CNG
SO2
No x

55
4Alternative Scenarios
This chapter lays out alternative scenarios for the energy demand in Iran, using the results of the BAU scenario presented in Chapter 3 as a reference. Specifically, we consider three alternative scenarios as follows:1. An “Efficiency” scenario2. A “Renewables” scenario 3. A “Combined Efficiency and Renewables” scenario
In the Efficiency scenario, we focus efficiency parameters in energy use in each sector of the economy, leaving renewable resources at the BAU levels. In the Renewables scenario, we assume that the potential for renewable resources will be highly utilized, keeping the efficiency parameters constant as in the BAU level. In the Combined Efficiency and Renewable scenario, we assume that the country will optimize both its efficiency potential and its renewable capabilities in the future.
An underlying assumption in all three scenarios is that the policies regarding energy prices will change in a way to reflect the real cost of energy to consumers. This will encourage higher efficiency in energy use and will allow for investment in renewable resources in different sectors of the economy. One of the most important reasons why the Iranian energy system is quite inefficient is the fact that energy prices are kept low compared to international energy prices. The subsidies for the energy sector, which account for more than 10 percent of GDP13, have led to government budget deficits as well as increasing demand for energy in different sectors. As long as domestic energy prices are so low, there is less incentive to invest in technologies that are more efficient and to change energy- wasting behavior in different sectors of the economy. The energy price reform policy will be discussed in further detail in Chapter 8.
The energy market in Iran is fully controlled by the state. Specifically, the government is the sole producer and controls the distribution in the energy sector. This monopoly power allows the government to set the production quantities (domestic, exports and im-ports) and prices on different energy carriers and products. The lack of competition in production and distribution results in energy prices being determined by political factors rather than by economic and market conditions. This may well be one additional reason why energy efficiency is so low and why there is no incentive to invest in renewable energy resources. If domestic energy consumption continues to grow as projected in the BAU 13 In this text, energy subsidies include direct and indirect or implicit subsidies. The former is reflected in the government
budget, but the latter is the difference between domestic prices and international (border) prices. Although there is no direct payment to consumers involved in this subsidy, it is critical to include it in the calculation of the total subsidy, as it presents opportunity costs to the budget and the economy. See Chapter 2 for a more thorough discussion.

56
Sustainable Energy Strategy for IranAlternative Scenarios
scenario, Iran’s ability to export oil will be greatly diminished. This obviously poses a prob-lem for the government, whose budget is heavily dependent on oil export revenues.
4.1 Scenario I: Efficiency
“Efficiency” is the first scenario we propose for the future energy demand management in Iran. In this scenario, we focus on the efficiency parameters in the end-use demand model in different sectors, keeping all other things, including renewable potentials, at the BAU scenario level. The most important efficiency parameter is energy intensity, which changes with advancements in technology and changes in the structure of the economy. All other things being equal, more efficient technology decreases energy intensity. A change in the structure of the economy in favor of less energy-intensive production will also reduce energy intensity. Our primary concern in this scenario will be a change in energy intensity due to a change in technology. For instance, in the household sector, we assume that light bulbs and other appliances that are more efficient will replace the older, more inefficient devices. Likewise, in the transportation sector, we assume that cars with more efficient engines will phase out cars with less efficiency. In addition to the technological effect, we assume that price reform will induce a higher level of awareness among consumers, both in the residential and industrial sectors, so that they will be more vigilant in their use of energy. Structural changes, in the form of changes in the sectorial shares of economic activities as well as changes within industry, are mostly taken into account in the BAU scenario and, therefore, will not be important factors in deriving the Efficiency scenario results.
4.1.1 Households Similar to the BAU scenario, the Efficiency scenario in the residential sector is analyzed in two sections: fuel and electricity.
FuelThe following assumptions are made for fuel consumption, which is mostly used by house-holds for heating and cooking services:
For existing buildings, a renovation rate of 2 percent has been assumed. This means that during a period of 50 years, all buildings will be renovated to a better standard. The energy saving per building is assumed to be 50 percent on average; this figure has already been shown to be feasible in several case studies in Iran. The technical potential to make a building more efficient is about 90 percent. These are the results of many projects and studies in Germany.For new buildings constructed in 2010 or later, we assume a standard that is about 80 percent better than the average consumption of today’s buildings.We also assume that by the year 2030, 10 percent of all houses will be demolished and replaced by new and better buildings, and that there will be a 10 percent increase in the size of the living area per person in Iran.
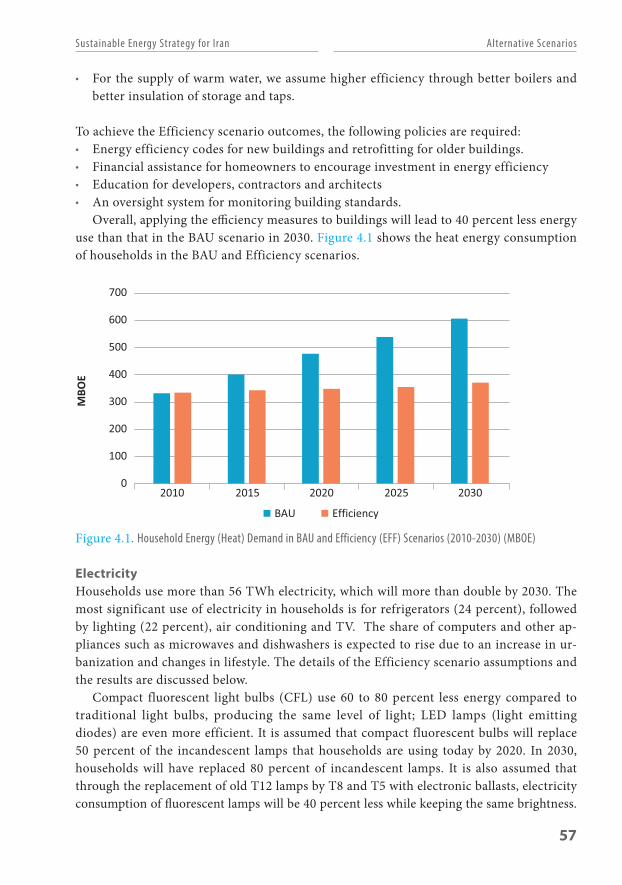
57
Sustainable Energy Strategy for Iran Alternative Scenarios
For the supply of warm water, we assume higher efficiency through better boilers and better insulation of storage and taps.
To achieve the Efficiency scenario outcomes, the following policies are required:Energy efficiency codes for new buildings and retrofitting for older buildings. Financial assistance for homeowners to encourage investment in energy efficiencyEducation for developers, contractors and architects An oversight system for monitoring building standards.Overall, applying the efficiency measures to buildings will lead to 40 percent less energy
use than that in the BAU scenario in 2030. Figure 4.1 shows the heat energy consumption of households in the BAU and Efficiency scenarios.
Figure 4.1. Household Energy (Heat) Demand in BAU and Efficiency (EFF) Scenarios (2010-2030) (MBOE)
ElectricityHouseholds use more than 56 TWh electricity, which will more than double by 2030. The most significant use of electricity in households is for refrigerators (24 percent), followed by lighting (22 percent), air conditioning and TV. The share of computers and other ap-pliances such as microwaves and dishwashers is expected to rise due to an increase in ur-banization and changes in lifestyle. The details of the Efficiency scenario assumptions and the results are discussed below.
Compact fluorescent light bulbs (CFL) use 60 to 80 percent less energy compared to traditional light bulbs, producing the same level of light; LED lamps (light emitting diodes) are even more efficient. It is assumed that compact fluorescent bulbs will replace 50 percent of the incandescent lamps that households are using today by 2020. In 2030, households will have replaced 80 percent of incandescent lamps. It is also assumed that through the replacement of old T12 lamps by T8 and T5 with electronic ballasts, electricity consumption of fluorescent lamps will be 40 percent less while keeping the same brightness.
2010 2015 2020 2025 20300
100
200
300
400
500
600
700
MBO
E
BAU Efficiency

58
Sustainable Energy Strategy for IranAlternative Scenarios
Overall, the electricity use by lights in the residential sector in 2030 will be about 44 percent less in the Efficiency scenario compared to the BAU scenario.
The average consumption of an Iranian refrigerator in 2020 is assumed to be 20 percent higher than the consumption of an average refrigerator bought in Central Europe today. For the year 2030, average consumption may be 20 percent higher than that of the most efficient refrigerators sold in Europe today. The same relationship is assumed for freezers and combined appliances (refrigerator and freezer in one appliance). The overall electricity consumption by refrigerators and freezers in the residential sector in 2030 will be 72 percent less in the Efficiency scenario compared to the BAU scenario.
Using irons equipped with thermostat regulation would lead to a 50 percent reduction in electricity use for ironing. The electricity consumption of this appliance would remain the same in 2030, but still be five times higher than the consumption for ironing in Germany. For the water cooler system, it is assumed that there will not be a significant change, but efficiency will improve in new air-conditioning systems. Although the amount of electricity needed for an individual cooling unit may decrease, the amount of equipment and com-fort demand will increase, and as a result cooling loads will increase. Overall, the electricity consumption for cooling systems in the residential sector will be remain the same as that in the BAU scenario in 2030. The electricity consumption by TVs and computers will decrease by about one percent, mostly due to more efficient monitors. We assume no significant efficiency changes in other appliances. Figure 4.2 shows the average electricity use by household appliances in the BAU and Efficiency scenarios. According to the results, average electricity consumption by households in the Efficiency scenario will be 27 percent less than that of the BAU scenario despite higher penetration rates and higher comfort levels per household.
Figure 4.2. Average Household Electricity Demand in BAU and Efficiency Scenarios (2010-2030) To achieve the efficiency parameters in the household sector, a series of market and non-market policies is required. For instance, the electricity prices should reflect the indi-
2010 2015 2020 2025 2030
BAU Efficiency
0
5,00
1,000
1,500
2,000
2,500
3,000
3,500
4,000
4,500
KWh/
year

59
Sustainable Energy Strategy for Iran Alternative Scenarios
vidual and social costs of electricity consumption and there should be economic incentives for saving electricity as well as higher costs for overusing it. The non-price policies may include setting up minimum efficiency standards for appliances and raising public awareness about electricity consumption of appliances and their impacts on private and social costs. Futhermore, they could encompass energy efficiency labeling requirements and building standards for efficient cooling systems.
4.1.2 Manufacturing IndustriesThe energy savings in industry can be achieved by taking the following measures (Ecofys, 2007):
Installing efficient motor systems to reduce the electricity consumption of electric motor systems, which account for 65 percent of the electricity consumption use by industry;Improving monitoring and process control, which could lead to more efficient use of energy in industry. This includes monitoring and targeting, computer-integrated manu facturing and process (temperature, airflow, moisture, oxygen, etc.) control. These measures could account for 2 to 18 percent of energy savings. Performing process optimization and integration analyses (pinch analysis). This is especially important when there are multiple heating and cooling demands in a pro-duction plant. Process integration saves energy by matching components of the system in terms of size, function and capability. The potential savings by process optimization and integration is 10 to 25 percent. Recycling, especially in aluminum and steel production. Producing aluminum using recycled scrap would use only 5 to 10 percent of the energy used to produce aluminum, because it involves remelting the metal instead of using the electrochemical reduction process.Manufacturing industries in Iran have seen immense growth rates of almost 15 percent
per year over the 1990-2005 period, which has led to significant increases in energy consumption. In spite of decreases of energy intensity of about 7 percent per year between 1990 and 2005, the energy intensity of many industrial installations is still significantly above the world average (by about 36 percent). This is mainly due to low energy prices, a lack of capital for investment in new and/or more efficient machinery, government owner ship of major industries with little or no competition in the market and poor man-agement.
Between 2000 and 2007, the Iran Energy Efficiency Organization (SABA), a subsidiary of the Iran Power Generation, Transmission & Distribution Management Co. (Tavanir), and the Iran Fuel Conservation Organization (IFCO), a subsidiary of the National Iranian Oil Company, have conducted several studies and audited many manufacturing industries to estimate their energy-saving potential. Table 4.1 shows the auditing results for the four major aluminum plants by SABA in 1999. The metallic manufacturing industry consumes 25 percent of the energy used in the total manufacturing industries; aluminum plants consume 17 percent of the total energy consumed by the metal industry. Improved moni-

60
Sustainable Energy Strategy for IranAlternative Scenarios
toring and process control have been identified as the most important sources of energy savings in the audited plants.
Table 4.1. Energy Savings in the Aluminum Manufacturing IndustryUnit Product Electricity
Consump- tion (MWh/year)
Fuel Consump-tion (GJ/year)
Electricity- saving Potential (MWh/year)
Fuel- saving Potential (GJ/year)
Total Energy Saving Potential (BOE/year)
Electricity Savings (%)
Fuel Savings (%)
1 Aluminum Profile
5,117 82,988 1,463.2 37,509 8,713 29 45
2 Aluminum Profile
6,408 71,513 2,290.7 27,461 8,531 36 38
3 Aluminum Profile
3,397 166,174 1,222.8 53,175 10,848 36 32
4 Cable 3,654 47,520 438.4 20,433 4,113 12 43Source: Tavanir, SABA, 1999
Tables 4.2 and 4.3 summarize the auditing results by IFCO. They show the current energy consumption and the specific energy index for selected industries as well as the potential for energy saving in those industrial groups. Both studies demonstrate that using best practice technology would lead to remarkable energy savings of more than 40 percent on average as well as to a great deal of savings on energy costs.
Table 4.2. Energy Consumption in Selected Manufacturing IndustriesCurrent Energy Use Specific Energy Index
(GJ/ton)MBOE/year PJ/year Country
AverageBest Practice
World Average
Current Condition
New Plants
Glass 3.6 22.2 14.77 7.5 7.95 13.63 9.4Sugar 8.4 51.4 36 12 19.7 27.6 13.8Cooking Oil 1.8 11.4 10 5 6 7.5 6.4Tires 0.8 5.1 31.1 17 19 22.7 17.44Bricks 1.7 10.4 4.8 1.73 2.2 3.9 2.5Ceramics 3.7 22.7 0.13 0.06 0.07 0.12 0.09Cement 18.3 112.0 3.5 2.6 2.72 3.45 3Stucco 2.4 14.8 1.69 0.98 0.9 1.3 0.98Lime 0.6 3.5 6.21 3.8 3.8 4.32 3.78Iron and Steel 29.9 182.2 15 11 11 12.3 11.3Source: IFCO, 2007

61
Sustainable Energy Strategy for Iran Alternative Scenarios
Table 4.3. Energy Savings in Selected Manufacturing IndustriesSaving Potential Saving Potential (%)Million GJ Value
(bn. rials)Best Practice
Current Condition
New Plants
Glass 8 408 49 8 36Sugar 31 1,589 67 23 62Cooking Oil 4 209 50 25 36Tires 2.2 112 45 27 44Bricks 49.8 2,512 64 19 48Ceramics 6.9 352 54 8 31Cement 16 807 26 1 14Stucco 0.62 314 42 23 42Lime 1.3 70 39 30 39Iron and Steel 44.9 2,267 27 18 25Source: IFCO, 2007
In addition to the auditing results above, we make the following assumptions to derive the Efficiency scenario results in the manufacturing industries:
It is assumed that real monetary growth and physical production will be decoupled by a rate of 1 percent per year in the future (as in the BAU scenario), as is typical in more advanced economies. It is also assumed that existing plants will increase their production levels through higher capacity utilization and expansions by about 1 percent per year. The residual production will come from completely new production sites. By 2030, therefore, the number of plants will almost double, and new installations will account for about 50 percent of physical production.
For the technical standards of refurbished and new power plants, it is assumed that the current best available technology (BAT), as described in Tables 4.2 and 4.3, will be utilized. This standard will further improve by about 1 percent each year. For sectors not covered by SABA, an average savings factor of 50 percent by using BAT versus currently installed technology has been assumed based on detailed study results from Ecofys (2007).
It is further assumed that reinvestments will be made in the vast majority of existing plants (83 percent) by 2030. This would enable most existing plants to produce with BAT by 2030.
The average energy intensity of the manufacturing industries declined by more than 50 percent, at an average rate of 7 percent per year, during the 1990-2005 period. In the Effi-ciency scenario, a further decline by more than half, at an annual rate of 3.1 percent, is as-sumed by 2030. Although this decrease in energy intensity in industry is a continuation of the past trend, its realization requires strong policies to promote efficiency. The 3.1 percent annual decline in energy intensity in industry under the Efficiency scenario is in the same range as the German national target of doubling energy productivity, which would need about a 3 percent annual decrease in energy intensity by 2020. Figure 4.3 shows the total energy consumption in the industry sector under the BAU and Efficiency scenarios. The

62
Sustainable Energy Strategy for IranAlternative Scenarios
total energy consumption in the manufacturing industries in the Efficiency scenario will be 40 percent less than that in the BAU scenario in 2030.
Figure 4.3. Final Energy Demand in Industry in the BAU and Efficiency Scenarios (MBOE)
4.1.3 TransportationFuel efficiency in the transportation sector can be achieved in two ways:
A change in the number of cars and travel distanceA change in technology.The basic assumption in the transportation sector is that the price of gasoline and gas
oil will eventually increase to border prices.14 This will lead to a lower number of private vehicles and a shorter average yearly travel distance compared to the BAU scenario. Furthermore, the higher costs of private cars will increase the share of public transport. We assume that the number of private cars will grow from 11 million in 2010 to 24 million cars in 2030. The average travel distance per private car will decline from 24,000 to 17,600 km/year (a 20 percent decrease compared to the BAU scenario). This is still about 60 percent more than the average travel distance per car in developed countries such as Germany today.
Passenger cars can be more fuel efficient if they have better engines, less weight, friction and drag. Hybrid cars, which combine a conventional engine with an electric engine, currently consume about 4.3 liters per 100 km. This rate can decline further if new light materials and new propulsion technologies are used. The average specific energy consumption for Iranian private cars in 2020 is assumed to be the same as in Germany in 2006, which was 7.8 liters per 100 km, and, by 2030, will decrease further to 6 liters per 100 km, which is standard for a fairly efficient mid-sized car today. The efficiency of buses and trains will increase by 20 percent as a result of the utilization of new buses and engines.
14 This is still significantly less than in most OECD countries, which levy high taxes on transportation fuels.
2010 2015 2020 2025 20300
100
200
300
400
500
600
700
800
900
MBO
E
BAU Efficiency

63
Sustainable Energy Strategy for Iran Alternative Scenarios
The efficiency of aviation will be raised by 45 percent due to the introduction of newer and bigger planes.
In addition to changes in fuel prices according to the private and social costs, a series of non-price policies is needed to achieve the efficiency outcomes. These policies can include:
Expansion of public transit (buses and trains)Public awareness campaigns about the efficiency of cars and the environmentEfficiency labeling requirements for cars and trucksRegulation of imported cars to meet high efficiency standardsEducation courses for efficient drivingImprovement in road conditionsEfficiency improvement in domestic refineries.
Figure 4.4 shows the total energy consumption in the transportation sector under the BAU and Efficiency scenarios in 2010-2030. The total energy used in the transportation sector in the Efficiency scenario will be 33 percent lower than that in the BAU scenario.
Figure 4.4. Final Energy Demand in the Transportation Sector under the BAU and Efficiency Scenarios (2010-2030) (MBOE)
4.1.4 Other SectorsOther sectors include the public sector, the commercial sector and agriculture. Energy in the public and commercial sectors is mainly demanded in the form of heat and electricity for buildings. As the results of surveys show (see Table 4.4), public buildings, particularly hospitals, have extremely high energy intensities. Nevertheless, high saving potentials of between 30 and 50 percent have been proven even with current low energy prices. For existing buildings in the public sector, an average savings potential of 35 percent over the
2010 2015 2020 2025 20300
100
200
300
400
500
MBO
E
BAU Efficiency

64
Sustainable Energy Strategy for IranAlternative Scenarios
next 20 years has been assumed to be feasible by systematic upgrades. While savings of 35 percent or more seem to be easily achievable from a technical point of view, the crucial factor will be the possible speed of refurbishment. For new buildings, savings potentials of up to 80 percent compared to the current average are feasible. The average energy intensity of the sector will be 35 percent below BAU levels by 2030.
Table 4.4. Energy Savings in Selected BuildingsProject Energy Use
before the PlanEnergy Use after the Plan
Savings
(GJ) (MJ/m2) (GJ) (MJ/m2) (%)Hospital (600 beds) – Tehran 169,999 4,404 111,171 2,880 35Hospital (400 beds) – Tehran 109,216 3,248 68,530 2,038 37Hotel (5 stories, 60 rooms) – Tehran 62,311 1,648 4,040 1,068 35Public Building (13 stories) – Tehran 22,041 2,388 11,057 1,198 50Public Building – Fars 12,678 1,822 8,319 1,195 34Public Building – East Azerbaijan 13,369 1,774 7,552 1,002 44Public Building – Khorasan 10,843 1,807 6,220 1,037 43Residential Building (12 stories) – Tehran 81,447 1,616 48,485 962 40Residential Building (4 stories) – Tehran 3,376 2,153 1,624 1,036 52Residential Building (20 cases) – Tehran 22,638 1,417 12,123 759 46Educational Building 75,594 2,645 54,426 1,904 28Total 583,512 333,548 46Subtotal Public 413,740 267,276 35Source: Ministry of Energy, 2004
In order to achieve the efficiency outcomes above, the government should take the following measures:
Develop building codes for meeting energy efficiency standards;Regulate energy use in public buildings, such as monitoring the use of lamps during out-of-office and holiday hours;Replace inefficient light bulbs and appliances in public buildings with efficient bulbs and appliances;Implement minimum requirements for the public procurement of energy-consuming goods;Implement control systems to monitor building standards;Financially support public institutions so they can invest in energy efficiency;Implement Article 44 of the Constitution in ways that increase the role of the private sector in the economy.
Figure 4.5 shows the energy consumption in the public sector under the BAU and Effi-ciency scenarios in 2010-2030. The total energy consumption in the public sector in the Efficiency scenario will be 26 percent less than that in the BAU scenario in 2030.

65
Sustainable Energy Strategy for Iran Alternative Scenarios
Figure 4.5. Final Energy Demand in the Public Sector in the BAU and Efficiency Scenarios (2010-2030) (MBOE)
In commercial buildings, energy consumption and potential savings are similar to those in public buildings. However, due to more dynamic development in the commercial sector, higher refurbishment rates and new building rates are assumed. This leads to overall savings of about 56 percent over the BAU scenario by 2030. The results are presented in Figure 4.6. To achieve the Efficiency scenario outcomes, several policies and measures are required, including minimum standards for building design; minimum standards for elec-tric appliances, including air conditioning; information campaigns; and financial support for investment in energy efficiency.
Figure 4.6. Final Energy Demand in the Commercial Sector in the BAU and Efficiency Scenarios (2010-2030) (MBOE)
2010 2015 2020 2025 20300
5
10
15
20
25
30
35
40
45M
BOE
BAU Efficiency
2010 2015 2020 2025 2030
MBO
E
BAU Efficiency
0
10
20
30
40
50
60
70
80
90

66
Sustainable Energy Strategy for IranAlternative Scenarios
In the agricultural sector, achievable savings are likely lower than those in the public and commercial sectors. The main reasons for this are the more diverse use of energy and the often limited availability of capital and knowledge about technology due to remote loca-tions and socio-economic conditions. Nevertheless, savings of about 40 percent over BAU are projected for electricity and 20 percent for fuels. The results are shown in Figure 4.7. In addition to the measures applied in other sectors, it is particularly important in the agricultural sector to start targeted information campaigns and to provide financial support to make investment in energy-efficient technology (and thus more economical technology in the long run) affordable.
Figure 4.7. Final Energy Demand in the Agricultural Sector in the BAU and Efficiency Scenarios (2010-2030) (MBOE)
4.1.5 Total Energy Savings in the Efficiency ScenarioThe total final demand for energy under the Efficiency scenario will grow on average by 0.8 percent per year, growing from 1,305 MBOE in 2010 to 1,526 MBOE in 2030. This means that the energy demand growth will slow down on average by 2.3 percentage points per year compared to the BAU scenario. Figure 4.8 shows the total primary energy de-mand under the Efficiency and BAU scenarios.
In general, the Efficiency scenario shows more than 40 percent energy savings in the country by 2030. Figure 4.9 depicts the energy saving rate in different sectors according to the Efficiency scenario. The scenario predicts the greatest impact on energy savings to be in the commercial sector (46%) followed by in households (40%). Between 30 and 35 percent can be saved in the industrial, transportation and public sectors. It should be noted that even though the saving rates in the commercial and public sectors are higher than those in industry and transportation sectors, the amount of energy saved in the latter are much higher due to their higher level of energy consumption.
2010 2015 2020 2025 2030
BAU Efficiency
0
10
20
30
40
50
60
70
80
MBO
E
2010 2015 2020 2025 2030
BAU Efficiency
MBO
E
0
500
1,000
1,500
2,000
2,500
3,000

67
Sustainable Energy Strategy for Iran Alternative Scenarios
Figure 4.8. Total Primary Energy Demand in BAU and Efficiency Scenarios (MBOE)
The total energy demand by energy types under the BAU and Efficiency scenarios in 2030 are shown in Figure 4.10. Demand for all energy carriers will decline in the Efficiency scenario relative to the BAU scenario. The most significant decline is in natural gas consumption, which would decrease by almost 50 percent. Gasoline would also decrease considerably, by about 42 percent. The consumption of electricity would decrease by 35 percent, and gas oil, fuel oil and LPG by about one-third.
Figure 4.9. Savings in the Efficiency Scenario Compared with the BAU Scenario (2030)
0%
5%
10%
15%
20%
25%
30%
35%
40%
45%
50%
Household Industry CommercialPublic Sector Agriculture Transport
In the agricultural sector, achievable savings are likely lower than those in the public and commercial sectors. The main reasons for this are the more diverse use of energy and the often limited availability of capital and knowledge about technology due to remote loca-tions and socio-economic conditions. Nevertheless, savings of about 40 percent over BAU are projected for electricity and 20 percent for fuels. The results are shown in Figure 4.7. In addition to the measures applied in other sectors, it is particularly important in the agricultural sector to start targeted information campaigns and to provide financial support to make investment in energy-efficient technology (and thus more economical technology in the long run) affordable.
Figure 4.7. Final Energy Demand in the Agricultural Sector in the BAU and Efficiency Scenarios (2010-2030) (MBOE)
4.1.5 Total Energy Savings in the Efficiency ScenarioThe total final demand for energy under the Efficiency scenario will grow on average by 0.8 percent per year, growing from 1,305 MBOE in 2010 to 1,526 MBOE in 2030. This means that the energy demand growth will slow down on average by 2.3 percentage points per year compared to the BAU scenario. Figure 4.8 shows the total primary energy de-mand under the Efficiency and BAU scenarios.
In general, the Efficiency scenario shows more than 40 percent energy savings in the country by 2030. Figure 4.9 depicts the energy saving rate in different sectors according to the Efficiency scenario. The scenario predicts the greatest impact on energy savings to be in the commercial sector (46%) followed by in households (40%). Between 30 and 35 percent can be saved in the industrial, transportation and public sectors. It should be noted that even though the saving rates in the commercial and public sectors are higher than those in industry and transportation sectors, the amount of energy saved in the latter are much higher due to their higher level of energy consumption.
2010 2015 2020 2025 2030
BAU Efficiency
0
10
20
30
40
50
60
70
80
MBO
E
2010 2015 2020 2025 2030
BAU Efficiency
MBO
E
0
500
1,000
1,500
2,000
2,500
3,000

68
Sustainable Energy Strategy for IranAlternative Scenarios
Figure 4.10. Energy Demand by Energy Type in the BAU and Efficiency Scenarios (2030) (MBOE)
4.2 Scenario II: Renewables
This section focuses on renewable energy potentials in Iran. We first review all the potential resources and then present an estimation of the energy demand under a Renewables scenario for the 2010-2030 period. Different national and international studies were used as data sources. The main focus in the scenario is on electricity generation, but heat generation is also analyzed.
However, due to continuous progress in the area of renewable energy technologies, this analysis does not represent the very latest status. In general, it can be stated that renewable energy technology has been technically improved and that production costs have been reduced. This holds particularly true for photovoltaic technology, an area which experienced considerable cost reductions in recent years. In the scenario presented in the following concentrating solar thermal power plants (CSP) play a major role since they provide several advantages (e.g. their storage capacity, the possibility to combine it with gas-fired power plants, etc.) compared to other renewable energy technologies. Since the creation of the scenario, however, costs of photovoltaics declined much more steeply than those of CSP. In the light of this development an updated scenario would (among other changes) assume higher shares of PV electricity generation and lower shares of CSP.
4.2.1 Wind PowerEstimates of wind power potential in Iran vary according to different studies. They range from 6,500 MW by the World Bank to 12,000-16,000 MW by the Renewable Energy Organization of Iran (hereafter SUNA) (CEERS et al., 2006). Assuming 2,000 full load hours, the latter estimate leads to a potential generation of 32 TWh/year of electricity. A study by a German company (Hagenkort, 2004; Kipke, 2004) shows some exceptionally good wind power sites in northeastern Iran with high wind velocities. However, the German
0
200
400
600
800
1,000
1,200
1,400
1,600
1,800
Kerosene Gasoline
BAU Efficiency
MBO
E
Natural Gas Fuel OilGas Oil LPG

69
Sustainable Energy Strategy for Iran Alternative Scenarios
Aerospace Center (Deutsches Zentrum für Luft- und Raumfahrt, hereafter DLR, 2005) generated a wind map with satellite imaging, showing only a small wind power potential of 8 TWh/year. The DLR report argues that this is probably significantly under estimated. We assume that wind power will be able to generate 22 TWh/year electricity by 2030, which is still about eight times higher than electricity generation by renewable sources in the BAU scenario.
4.2.2 BiomassThe DLR (2005) lists a biomass potential of 24 TWh/year electricity, but this figure includes municipal waste. Since the data sources regarding biomass are unreliable, we ignore biomass as an electricity option almost totally and use only a very low figure, i.e. 0.018 TWh/year in all scenarios by 2030.
4.2.3 GeothermalGeothermal primary energy sources are relatively well investigated in Iran, but there is still a lack of knowledge on their economic and technical potential. Talebi (2004) from SUNA estimates a nationwide geothermal electricity potential in the range of 5,000 to 6000 MWel. As geothermal energy can be used for base load on a 24/7 basis, full load hours (FLH) are high. Assuming 7,500 FLH, about 37-45 TWh/year electricity could be produced. However, since geothermal “hot spots” are far from inhabited areas, heat could not be used. Therefore, it is likely that the only option for geothermal energy utilization would be electricity generation.
Figure 4.11. Geothermal Resources in IranSource: Own figure based on SUNA, 1998
Tehran
N
IranEshafan
Hamadan
Arak
Ahvaz
KermanZahedan
Bandar-e ‘Abbas
Zanjan
Tabriz
Areas with geothermal resources

70
Sustainable Energy Strategy for IranAlternative Scenarios
According to SUNA, there are 14 regions in Iran that appear promising for geothermal energy (Figure 4.11). These regions are divided into three categories (Talebi, 2004; Fotouhi, 1994):
Category 1: Sabalan/Meshkin-Shahr. This area has been explored in detail, its potential has been thoroughly studied, and the temperatures are well known. Iran’s first geothermal power plant is being built in this area. Category 2: Khoy-Maku, Sahand and Damavand. These regions were identified as potential geothermal sites in the 1970s. They have been explored relatively well and the details of their energy contents have been estimated. Category 3: Takab, Ramsar, Isfahan, Khur, Ferdows, Nayband, Bushehr, Lar, Bandar Abbas and Taftan-Bazman. These have been identified as potential geothermal regions, but detailed assessments are still needed.Table 4.5 presents information about the energy contents of Iran’s geothermal regions
as reported by various studies.
Table 4.5. Selected Current and Potential Geothermal Sites in Iran Location Energy Potential NotesSabalan* 32*1018 J – 48*1018 JMeshkin-Shahr Project 250 MWel Project budget: US$ 250 million Khoy-Maku** 30*1018 – 40*1018 J Surface temperatures between 25 and 63 °C*Fotouhi, 1995, 1994; Fotouhi, Noorollahi, 2000**Noorollahi, 2004
We assume that by 2030 geothermal sources will be able to produce 5.25 TWh/year elec-tricity, which is about 17 times more than electricity produced by geothermal in the BAU scenario. However, the utilized resources will nevertheless remain far behind the maxi-mum potential, due to the short period of time between now and 2030.
4.2.4 Solar IrradianceStudies show that solar irradiance is very high in Iran. For instance, using satellite imaging, the DLR (2005) found direct normal irradiance to be 2,200 kWh/m2/year and estimated the total economic potential for its use in concentrated solar power plants (CSP). It analyses the relevant topographic aspects of different areas in the country including water surfaces and high inclinations. One can also estimate the total area that could be used for the erection of other solar power solutions, such as photovoltaic power. In general, adequate surfaces in Iran are so large that they would not be a limiting factor for solar energy utilization.
In a nationwide analysis of irradiance, Samimi (1994) estimated that on 80 percent of Iran’s territory, solar irradiance is in the range of 1640-1970 kWh/m2/year. The highest fi-gures were found in the central Iranian region. Geyer (2007) has provided detailed measu-rements of solar intensities at selected sites. He calculated a maximum direct normal inso-lation in Shiraz of about 2,580 kWh/m2/year. The central province of Yazd also has a high solar energy potential. According to the Iranian Power Development Company (IPDC,

71
Sustainable Energy Strategy for Iran Alternative Scenarios
2001), solar insolation in Yazd is in the region of 2,500 kWh/m2/year. In our scenario analy sis, based on assumptions concerning the capacity installation rate and full load hours, we estimate that 94 TWh/year electricity will be produced by CSP and 0.007 TWh/year by photovoltaic generation. CSP generation is assumed to be 0.004 TWh/year in the BAU scenario. 4.2.5 HydropowerHydropower produces about 12 TWh/year electricity and, therefore, its contribution to energy production is not significant in Iran. However, there are plans to increase hydro-power’s share in the electricity mix. The World Energy Council (WEC) and the DLR estimate Iran’s hydropower potential to be 48 TWh/year (DLR, 2005; WEC, 2001). In our study, we estimate that large hydropower sources will contribute to electricity generation by producing 17.3 TWh/year.
Table 4.6 summarizes the renewable electricity performance indicators estimated by the DLR (2005). They define the representative average renewable electricity yield of a typical facility in Iran. Table 4.7 shows the economically viable renewable electricity supply side potential, which is estimated by the DLR (2005) for Iran. As mentioned before, the potentials need to be revised due to considerable improvements in renewable technologies over the last decade. Regarding the current state of technology particularly the potentials for PV and wind would be significantly higher.
Table 4.6. Basic Data on Renewable Energy Potential in IranHydro Geo Bio CSP Wind PVFull Load Hours per Year (h/year)
Temperature at 5,000 m Depth (°C )
Full Load Hours per Year (h/year)
Direct Normal Irradiance (kWh/m2/year)
Full Load Hours per Year (h/year)
Global Horizontal Irradiance (kWh/m2/year)
1,351 295 3,500 2,200 1,176 2,010
Rem
arks
Well documen-ted resource taken from literature
From 5,000 m temperature map considering areas with T>180°C as economically viable
Agricultural (bagasse) and municipal waste and renewable solid biomass
From DNI and CSP site mapping, taking sites with DNI > 2,000 kWh/m2/year as economically viable
From wind speed and site mapping, taking sites with a yield > 14 GWh/year and from literature (EU)
Source: DLR, 2005
Table 4.7. Summary of Economic Renewable Electricity Supply Potential in Iran (TWh/year)Hydro Geo Bio CSP Wind PV
Electricity Supply 48 11.3 23.7 20,000 8 16Source: DLR, 2005

72
Sustainable Energy Strategy for IranAlternative Scenarios
4.2.6 Economic and Infrastructural Analysis
Detailed data on renewable energy potentials in the MENA region are given by the DLR. In the TRANS-CSP report, basic data is also given for conventionally fueled power plants as a standard for comparison (see Table 4.8).
Table 4.8. Basic Parameters of Conventionally Fueled and of Renewable Energy Power PlantsPlants Economic Life
YearsEfficiency (%) Fuel Price
Escalation (%)Operation & Maintenance (% of inv./year)
Annual Full Load Hours (hours/year)
Steam Coal 40 40 1 3.5 5,000Steam Oil 30 40 1 2.5 5,000Combined Cycle 30 48 1 2.5 5,000Wind Power 15 1.5 2,000Solar Thermal 40 37 1 3 8,000Hydro 50 75 3 2,600Photovoltaics 20 10 1.5 1,800Geothermal 30 13.5 4 7,500Biomass 30 35 3.5 3,700Source: DLR, 2005
Full Load Hours (FLH)The DLR assumes high investment costs for hybrid CSP with combined feed of natural gas and solar radiation. The share of natural gas in CSP plants decreases greatly over time, and expensive storage technologies would become necessary. FLH of hybrid CSP are 8,000/year, which is exceptionally high. As CSPs fulfill peak load production in later decades, FLHs decrease over time. This is one option for calculating the basic characteristics of CSP, but other assumptions are also possible. For instance, the share of natural gas can decrease at a slower rate and therefore the need for expensive storage systems for solar radiation can be postponed. This leads to lower investment costs compared to what the DLR has estimated.
Investment CostsThe DLR has calculated the investment costs of renewable energy technologies at different stages of their development. According to these calculations, the investment costs would be reduced dramatically mainly because of learning curves as well as because of econo-mies of scale. The only exception is the investment cost of CSP plants, which would increase because of increasing solar shares (increased collector fields and storage) and increasing annual solar operating hours. The electricity cost, however, would continue to decline over time. Figure 4.12 shows the specific investment cost trend for the regions of North Africa and the Persian Gulf.
0
2,000
4,000
6,000
8,000
10,000
12,000
14,000
US$
/kW
Wind Photovoltaics Geothermal Biomass
CSP Plants Wave/Tidal Hydropower Oil/GAS
Coal
2000 2010 2020 2030 2040 2050

73
Sustainable Energy Strategy for Iran Alternative Scenarios
Figure 4.12. Investment Costs of Renewable Power PlantsSource: DLR, 2005
The World Bank (2006) has also estimated the investment costs of renewable energy plants, which are different from the DLR’s estimates. This data was processed by S upersberger (2007). The results are presented in Table 4.9.
Table 4.9. Investment Costs of Renewable Energy Resources in US$/kW2000 2010 2020 2030 2040 2050
Geothermal (hydrothermal) 2,500 2,300 2,150 2,050 2,000 2,000CSP 2,500 2,250 2,100 2,000 2,000 2,000Hydropower 1,800 1,800 1,800 1,800 1,800 1,800Source: DLR, 2005; Supersberger, 2007; World Bank, 2006
The costs of electricity generation by renewable energy technologies have been estimated by the DLR (2005). According to this estimation, none of the renewable technologies, except for hydropower, could compete with fossil fuels in 2000. By 2030, however, they will cost either the same or slightly less than fossil fuels, and 20 years later, they will all become cheaper. Figure 4.13 shows the electricity cost estimation by different renewable energy technologies.
4.2.6 Economic and Infrastructural Analysis
Detailed data on renewable energy potentials in the MENA region are given by the DLR. In the TRANS-CSP report, basic data is also given for conventionally fueled power plants as a standard for comparison (see Table 4.8).
Table 4.8. Basic Parameters of Conventionally Fueled and of Renewable Energy Power PlantsPlants Economic Life
YearsEfficiency (%) Fuel Price
Escalation (%)Operation & Maintenance (% of inv./year)
Annual Full Load Hours (hours/year)
Steam Coal 40 40 1 3.5 5,000Steam Oil 30 40 1 2.5 5,000Combined Cycle 30 48 1 2.5 5,000Wind Power 15 1.5 2,000Solar Thermal 40 37 1 3 8,000Hydro 50 75 3 2,600Photovoltaics 20 10 1.5 1,800Geothermal 30 13.5 4 7,500Biomass 30 35 3.5 3,700Source: DLR, 2005
Full Load Hours (FLH)The DLR assumes high investment costs for hybrid CSP with combined feed of natural gas and solar radiation. The share of natural gas in CSP plants decreases greatly over time, and expensive storage technologies would become necessary. FLH of hybrid CSP are 8,000/year, which is exceptionally high. As CSPs fulfill peak load production in later decades, FLHs decrease over time. This is one option for calculating the basic characteristics of CSP, but other assumptions are also possible. For instance, the share of natural gas can decrease at a slower rate and therefore the need for expensive storage systems for solar radiation can be postponed. This leads to lower investment costs compared to what the DLR has estimated.
Investment CostsThe DLR has calculated the investment costs of renewable energy technologies at different stages of their development. According to these calculations, the investment costs would be reduced dramatically mainly because of learning curves as well as because of econo-mies of scale. The only exception is the investment cost of CSP plants, which would increase because of increasing solar shares (increased collector fields and storage) and increasing annual solar operating hours. The electricity cost, however, would continue to decline over time. Figure 4.12 shows the specific investment cost trend for the regions of North Africa and the Persian Gulf.
0
2,000
4,000
6,000
8,000
10,000
12,000
14,000U
S$/k
W
Wind Photovoltaics Geothermal Biomass
CSP Plants Wave/Tidal Hydropower Oil/GAS
Coal
2000 2010 2020 2030 2040 2050

74
Sustainable Energy Strategy for IranAlternative Scenarios
Figure 4.13. Electricity Costs by Renewable Energy TechnologiesSource: DLR, 2005
Time Scale and Dynamics As the different options show different levels of market readiness and flexibility regarding technology implementation and construction times, the establishment of a certain chro-nology of renewables introduction is necessary. Renewable energy contributions vary strongly depending on the specific scenarios. In the BAU scenario, only hydropower plays a somewhat important role, with about 12 TWh/year in 2030. Wind power is the second largest contributor, but with less than 3 TWh/year. In the Renewables scenario, however, hydropower supplies 17.6 TWh/year. About 20 percent of the total possible geothermal electricity generation is utilized by 2030, which would contribute 5.25 TWh/year electricity to the system. Also in the scenario, the first concentrated solar power (CSP) plants enter the system, mainly as retrofitted natural gas fueled combined cycle power plants that were initially built as natural gas fueled plants. The plants are retrofitted with solar devices later, when costs come down significantly. CSP makes the largest contribution to electricity production among the renewable energy sources in the Renewables scenario, amounting to 94 TWh/year by 2030.
Concentrated solar power plants (CSP) are often planned as hybrid plants, using natu-ral gas during nighttime and solar radiation during the day. In general, it is possible to build natural gas power plants “CSP ready,” starting with a 100 percent natural gas share, and adding solar devices later. The major additional requirement is space to add the solar
Wind Photovoltaics Geothermal Biomass
CSP Plants Wave/Tidal Hydropower Oil/GAS
Coal
2000 2010 2020 2030 2040 20500
5
10
15
20
25
30
35
US$
cent
s/kW
h

75
Sustainable Energy Strategy for Iran Alternative Scenarios
panels. This arrangement of the hybrid CSP has the cost advantage of using inexpensive natural gas plants at the beginning and the solar devices some years later, after costs come down.
4.2.7 Final Energy Demand in the “Renewables” ScenarioIn the Renewables scenario, until 2030, the final energy demand includes only small shares of renewable energies in the supply. A summary of the utilization of the renewable energy sources in each sector of the economy is provided below.
Over the coming decades, solar thermal water heating will become a standard in Iranian homes, just as it already is in many households in the Mediterranean region. It is assumed that by 2030 about two-thirds of sanitary hot water will be produced by solar thermal heat. In addition, solar devices will be used for cooking, mainly in rural areas, supplying about 10 percent of the energy demand for this use. Overall, this leads to a share of about 10 percent of direct renewable energy use.
The share of renewable energy use in the manufacturing industries sector is expected to increase to 6 percent. This is relatively low, mainly because of the limited potential for residuals from production, biomass, geothermal and solar radiation. Biomass is in general very low and geothermal is not practical because of large distance between supply and consumption locations. There is, however, large potential for solar heat generation for in-dustrial processes, which will be realized to large extent in the longer time frame.
We assume no introduction of biofuels in the transportation sector, as the supply chain would be too expensive regarding the low biomass potential. However, renewable energies will contribute about 13 percent to fuel use in the agricultural sector. Biomass and solar radiation are two important renewable energy sources, as agricultural residues and locally grown oil seeds can be converted to liquid fuels and heat, and solar heat generation is a viable option. The share of renewables is assumed to remain relatively low for two reasons: the short timeframe and the limited potential for biomass. The renewable energy share in the commercial sector is 16 percent in this scenario, contributed mainly by solar thermal. Its share is relatively high due to the easy implementation of solar thermal systems together with the high rate of efficiency available. Finally, renewable energies will comprise up to 10 percent of fuel use in the public sector by 2030, mainly contributed by solar thermal.
Figure 4.14 shows the total primary energy demand under the Renewables scenario in comparison with the BAU scenario. In 2030, the total demand for energy will increase from 1,305 MBOE in 2010 to 2,151 MBOE, which means an average growth rate of 2.5 percent per year. The savings achieved in comparison to the BAU scenario will almost exclusively be achieved by the higher efficiency of renewable power generation technology.

76
Sustainable Energy Strategy for IranAlternative Scenarios
Figure 4.14. Total Primary Energy Demand in the BAU and Renewables Scenarios (MBOE)
4.3 Scenario III: The Combined Scenario
In the Combined scenario, we merge the Efficiency and Renewables scenarios. As a result, the level of energy savings under this scenario is expected to be higher than that of each individual scenario. Since we have already discussed the details of each scenario and their implications in each sector of the economy, we only present the final result of this scenario. Figure 4.15 shows the total energy demand under the Combined scenario compared with the BAU scenario. The total energy demand under the Combined scenario will slightly decrease by about 0.3 percent per year (on average) for the 2010-2030 period. This is much lower than the 3.5 percent growth in energy demand in the BAU scenario. The total energy demand in 2030 under this scenario will be 1,234 MBOE, which implies a savings rate of 51 percent compared to the BAU scenario.
Figure 4.15. Total Primary Energy Demand in the BAU and Combined Scenarios (MBOE)
BAU Renewables
MBO
E
2010 2015 2020 2025 20300
500
1,000
1,500
2,000
2,500
3,000
BAU Combined
MBO
E
2010 2015 2020 2025 20300
500
1,000
1,500
2,000
2,500
3,000

77
Sustainable Energy Strategy for Iran Alternative Scenarios
4.4 A Comparison among Scenarios
Table 4.10 shows a comparison of the demand for energy among four scenarios. As is evi-dent from the table, the Efficiency scenario would lead to about 40 percent savings in total energy consumption in 2030. This savings potential is very significant in an international context. Energy savings under the Renewables scenario would be about 11 percent in 2030. However, this savings rate in the Renewables scenario only reflects the efficiency gains in electricity production by the use of renewable energies. The Combined scenario, which brings the Efficiency and Renewables scenarios together, shows the highest energy savings in 2030. In total, the energy savings rate under this scenario would be 51 percent compared to the BAU scenario.
Table 4.10. A Summary of the Scenario Results (2010-2030)Scenario Primary Energy Demand (MBOE) Growth per Year (%) Savings Compared
to BAU by 2030 (%)2010 2030BAU 1,305 2,528 3.4 -Efficiency 1,305 1,526 0.8 40Renewables 1,305 2,151 2.5 15Combined 1,305 1,234 - 0.3 51
Total demand for electricity almost doubles in the BAU scenario by 2030. However, under the Efficiency scenario it only increases by about 16 percent; in the Renewables scenario, 72 percent. The most significant reductions in electricity consumption compared to Busi-ness-as-Usual come in the manufacturing industry, under the Efficiency and Combined scenarios. Figure 4.16 shows the total demand for final energy by sectors and scenarios (2030).
Figure 4.16. Total Demand for Final Energy by Sector and Scenario (2030)
MBO
E
Household Manufacturing IndustriesCommercial Public Sector Agriculture
0
1,000
500
1,500
2,000
2,500
BAU Efficiency Renewables Combined
Transport

78
Sustainable Energy Strategy for IranAlternative Scenarios
The sources of electricity generation vary with the scenarios and throughout the years. Overall, the share of renewable sources in electricity generation increases in all scenarios. Specifically, the share of renewable energy in producing electricity is about 2 percent in BAU in 2010, and will remain about the same in 2030. However, it will increase to 3 percent in the Efficiency scenario, to 20 percent in the Renewables scenario, and to 28 percent in the Combined scenario. The higher shares in the Combined scenario are due to two effects: employing more renewable resources under the Renewables scenario and the decreasing demand for electricity under the Efficiency scenario.
Figure 4.17 shows the final energy demand in alternative scenarios in different sectors of the economy. It is evident that under the Efficiency scenario, the highest potential for saving energy comes in the household sector. The industry and transportation sectors also show significant energy savings under the Efficiency scenario. Although energy savings in the public and commercial sectors are also relatively high, in absolute terms they are not comparable with those in the household, industry and transportation sectors.
MBO
E
Household Manufacturing Industries
Transportation Commercial
300
200
400
500
600
0
100
3020
405060708090
010
0100200300400500600700
800
0100200300400500600700800900
2010 2015 2020 2025 2030
MBO
E
2010 2015 2020 2025 2030
MBO
E
2010 2015 2020 2025 2030
2010 2015 2020 2025 2030
MBO
E
BAU Efficiency Renewables Combined

79
Sustainable Energy Strategy for Iran Alternative Scenarios
Figure 4.17. Summary of the Scenario Results (2010-2030) (MBOE)
4.5 Energy Intensity
Iran’s energy intensity is one of the highest in the world. We compare energy intensity in different scenarios in Iran with that of the rest of the world, and with an industrialized country with a low energy intensity such as Germany. In 2003, Iran’s energy intensity was more than 60 percent higher than the world average and more than twice as high as in Germany. In the Efficiency scenario, however, the energy intensity in 2030 declines by about 60 percent, making it lower than the world average, and lower than Germany today.
0
10
20
30
40
50
60
70
80AgriculturePublic
Total
BAU Efficiency Renewables Combined
0
500
1,000
1,500
2,000
2,500
15202530354045
05
10
2010 2015 2020 2025 20302010 2015 2020 2025 2030
MBO
E
MBO
EM
BOE
2010 2015 2020 2025 2030

80
Sustainable Energy Strategy for IranAlternative Scenarios
Figure 4.18. Energy Intensity in Iran in 2030 under Different Scenarios
4.6 Economic and Ecological Impacts of Scenarios
The different impacts of the scenarios are of great importance for policy-makers facing socio-economic challenges in the energy sector and the economy as a whole. For instance, in the BAU scenario, the export capacity of crude oil and natural gas will continually decrease because of increasing domestic consumption. With the current trend, it is likely that Iran may no longer be able to export any oil in the mid-2030s. The same might also apply to natural gas somewhat later. In the alternative scenarios discussed in this chapter, Iranian export capacities of oil and natural gas would decrease more slowly, maintaining the country’s export capacity at least until the middle of the century.
The BAU scenario also demonstrates significant negative impacts on the environment. CO2 emissions increase proportionally to oil and gas consumption, and thus will almost double by 2030. This also applies to other pollutants, such as nitrogen oxides, sulfur dioxide, dust and heavy metals. This means considerable additional financial costs as well as health risks for the public, especially in areas with high population densities. In the alternative scenarios, CO2 emissions and contamination by other pollutants would decrease considerably. For instance, in the Combined scenario, energy-related CO2 emissions in Iran would be reduced by about 50 percent compared to the BAU scenario.
4.6.1 Economic ImpactsWe examine the overall economic impacts of the scenarios by focusing only on the changes in export revenues. Since our assessment of the scenarios will depend directly on world oil prices, we will have to make an assumption about its long-term trend. Oil prices are one of the most volatile prices in the world, making its short-term prediction very difficult, if not impossible, but the overall trend of prices can be forecasted based on the fundamental forces in the market. Some of the basic market forces include increasing demand for crude
BAU Renewables Efficiency Combined
4
6
8
10
12
MJ/
$00
ppp
0
2

81
Sustainable Energy Strategy for Iran Alternative Scenarios
oil (particularly by emerging economies), limited supplies, technological progress in ex-tracting non-conventional oil, and the substitution of alternative energy sources. The first two factors would push oil prices up; the last two factors would do the opposite. Furthermore, changes in political and market structures towards the growing autonomy of oil-producing countries in OPEC and increasing competition among importing countries might also create pressure to increase oil prices. For the past few decades, several new technologies have been developed to extract oil from non-conventional sources, such as oil sand extraction techniques in Canada and hydraulic fracking in the United States. However, the costs of oil production from those reserves are still very high compared to oil production from conventional reserves. Since the development of new technologies and substitution of new energy sources take time, the upward pressure factors seem to have a dominant effect on oil prices in the next two or three decades. Our estimates for oil prices are on average US$ 100 for the 2020-2030 period (increasing from US$ 90 in 2020 to US$ 110 in 2030).
Figure 4.19 shows potential savings from the alternative scenarios for energy consumption in Iran. The total revenues from additional oil exports will be about US$ 900 billion in the Efficiency scenario, and US$ 300 billion in the Renewable scenario between 2020 and 2030. Potential revenues in the Combined scenario climb to US$ 1.1 trillion by 2030. Adopting more efficient energy production and consumption techniques will allow the country to obtain extra capital through higher exports of oil and natural gas and to invest in physical and human infrastructure and capital to ensure sustainable growth and pros perity.
Figure 4.19. Potential Revenues from Alternative Energy Scenarios (2020-2030)
The economic impact evaluation of the scenarios shows that the potential revenues generated by the modeled scenarios in Iran are remarkably high. To make these additional revenues a reality, however, there is a need for investment in new capital and training. Although an estimation of detailed investment costs requires further research, the results of some other studies, which can be used as references, look promising.
60,000
40,000
80,000
100,000
120,000
140,000
160,000
180,000
Mill
ion
US$
0
20,000
20102012
20142016
20182020
20222024
20262028
2030
Efficiency Renewables Combined

82
Sustainable Energy Strategy for IranAlternative Scenarios
One example of this is a thermal solar study for Tehran (CEERS et al., 2005), showing that adopting the technology for production of warm water would be beneficial in Iran. Calculating with a relatively low oil price of US$ 38 per barrel, the study estimates revenue of about US$ 168 per year for every solar thermal installation in a two-floor flat. Assuming a lifetime of 25 years, every solar thermal plant would yield economic net benefits (additional oil revenues minus capital and maintenance costs) of US$ 4,200. Assuming that solar heating systems would be installed in one quarter of all households in Tehran, the total net revenue would total US$ 1.800 billion for the Iranian economy. Since oil prices are actually much higher than what the study has assumed, the reported savings can been seen as the lower bound of different estimates.
Supersberger (2007) has estimated the revenues and investment costs of increasing efficiency and renewable energy sources in Iran for the 2005-2050 period. Given the assumption of oil price of US$ 47 per barrel in 2005 and investment costs equaling US$ 47.2 billion, the net benefit of implementing the Efficiency and Renewables scenarios would be US$ 403 billion.
International studies for Germany, Europe and others confirm this economically profit able development. For instance, in a comprehensive study published in 2002 by a commission of enquiry of the German Federal Parliament on sustainable energy supply, one point of interest is the assessment of different energy scenarios and their costs until 2050. The results of the study show that the additional costs of alternative scenarios, without taking into account external costs, are only slightly higher in comparison to the baseline scenario at extremely low oil price levels. When taking into account external costs, all Efficiency and Renewables scenarios perform better economically than the baseline scenario. Another recent study by the Federal Environment Ministry (BMU, 2008) shows that rene-wable energy technologies for power supply in Europe are already partly profitable and will be completely profitable in the medium term. Furthermore, electricity generation in hydropower plants is already cheaper today than conventional electricity generation. Given a dynamic view and further growth of world market prices for fossil fuels, geothermal energy and wind energy will reach their break-even point shortly after 2020. Only photo-voltaic panels will need more than three decades to become profitable for electricity gener-ation.15 The same study also shows that in Europe heat generation with biomass would be profitable by 2010, while heat generation using geothermal energy and solar collectors will become profitable between 2020 and 2025.
4.6.2 Ecological Impacts Climate change is a global challenge and the concentration of CO2 emissions is the main cause of global warming. Based on findings from the IPCC (2007), to prevent a climate catastrophe, CO2 emissions must be reduced by at least 50 percent of 1990 levels worldwide by 2050. The developed industrial countries are the main drivers of climate change and should, therefore, make the most contribution to reducing CO2 emissions. Nevertheless,
15 In fact, the cost decrease was much stronger than expected. In countries like Iran, PV would be already profitable today if investment cost were comparable to PV investment cost in Europe.

83
Sustainable Energy Strategy for Iran Alternative Scenarios
as expressed in the Bali Roadmap, the less-developed industrial countries and developing countries such as Iran can make their own contribution as well. The demand scenarios presented in this study can be used to assess the CO2 emission impacts under different scenarios. Since the total demand for primary energy in the Efficiency, Renewables and Combined scenarios are less than that in the BAU scenario, CO2 emissions are expected to be lower in those scenarios in comparison to the BAU scenario.
Crude oil contains 466 kg CO2 per barrel and natural gas contains about 340 kg CO2 per barrel of oil equivalent. For reasons of simplicity, CO2 emissions resulting from losses of gas and burning off during oil production are not taken into account. In addition, climate-relevant CO2 emissions from methane need to be examined separately. We use the results of energy savings under different scenarios presented in the previous sections to calculate the CO2 emission levels. Figure 4.20 shows the trends of CO2 emissions for four scenarios for the 2010-2030 period.
Figure 4.20. CO2 Emissions in Alternative Scenarios (2010-2030)
According to the bottom-up analysis described in Chapter 3, CO2 emissions in Iran rise by 3.3 percent per year under the BAU scenario. Although this increase is significantly lower than the one projected in Iran’s Second National Communication to the UNFCCC (which expects GHG emissions to grow by 8.4 percent/year from 2007 to 2025), the amount can be significantly decreased under the alternative scenarios. Total emissions increase by only 1.1 percent under the Efficiency scenario and decrease by 0.2 percent under the Combined scenario. This means that CO2 emissions slightly decrease from the current level of 535 million tons to 518 million tons in 2030. The alternative scenarios will not only generate additional revenues for Iran’s economy of more than US$ 1,000 billion in 20 years, but also enable Iran to stabilize or even slightly reduce CO2 emissions according to IPCC guidelines, following a responsible and climate-friendly development path and acquiring an internationally leading position.
400
600
800
1,000
1,200
Mill
ion
tons
0
200
2010 2020 2025 20302015
BAU Efficiency Renewables Combined

84
Sustainable Energy Strategy for IranAlternative Scenarios
CO2 is not the only pollutant that is generated by fossil fuels. Other pollutants such as SO2, NOx, dust, CO and heavy metals such as lead are also generated during the combustion of oil and gas. The main producers of SO2 are industry and power plants, and NOx is a byproduct of the transportation sector. These substances constitute a massive risk to humans and the environment. They induce numerous illnesses as well as soil and water pollution, which create immense follow-up costs for the economy. For instance, bronchitis, skin diseases and allergies are often caused by a concentration of the pollutants above that get into the human organism directly through the air or indirectly through the food chain. If these external costs imposed on health and environment are taken into account, the net benefits of the scenarios will be even higher than what are already shown in this study.
An estimation of these external costs falls outside the scope of this study and requires additional research, but to show the significance of those costs, we make a reference to a major study by the European Union. The European Commission predicts that, as a result of air polluted by SO2, NOx, dust and CO2, death will come early to many people, with 2,800,000 life-years lost by people over 30, 142,268 cases of chronic bronchitis, and 240,333,947 working days lost in the economy in 2020. However, if fossil final energy consumption is reduced by 30 percent, those losses would decrease by about 12 percent. The study estimates that the reduction of illnesses would lower healthcare costs in the European Union by € 19.9 billion (as a minimum estimate) to € 76.9 billion (on the high end). The consequences of fossil fuel combustion for health and the economy in Iran will have to be assessed in a separate study. The study by the European Union nevertheless shows that a great many human health problems and the resulting healthcare costs for the economy may be avoided by changing the current energy system.
4.7 Conclusion
This chapter examined the potential impacts of energy efficiency measures and renewable energy sources on energy consumption in Iran and on the country’s economy. The results indicate that Iran would strongly benefit from adopting alternative pathways (as in the Efficiency, Renewables, and Combined scenarios) and freeing its oil and natural gas resources up for exports over the next 20 years. In addition, following alternative scenarios would help Iran reduce its greenhouse gas emissions significantly and could thus contribute to the local and the global environmental quality. However, in order to obtain the benefits associated with the alternative scenarios, the following assumptions about price and non-price policy changes are made:
The price of fuel will continuously approach border prices. Electricity prices will rise and reflect the true cost of electricity production and distribution. A rise in relative energy prices will change people’s behavior in energy demand and their investment in efficient appliances, buildings, cars and power plants.
Any cost-related decision concerning energy efficiency at the individual level is based, more or less, on a trade-off between the up-front investment cost and the expected future

85
Sustainable Energy Strategy for Iran Alternative Scenarios
energy expenses. As the energy price increases, energy-efficient solutions, which typically have higher costs up front, become more attractive. Making an investment decision about energy-efficient appliances or industrial machinery and equipment requires price signals which reflect true market conditions.
To gain efficiency, the government may change its past policy of full provision to allow for private sector investment in the energy sector. The government would still be able to regulate the market to protect consumers from monopolies exercising market power and to ensure environmental quality and sustainability. Effective regulations will lead to energy prices that reflect the cost of energy supply, i.e. the long-term marginal cost for electricity and the long-term price of oil products in international markets for fossil fuels. They will also concern energy security, accessibility, as well as environmental protection and sustainability.
In addition to price and market reform, there are other measures that would help to remove the existing barriers to energy efficiency:
Increasing the availability of efficient appliances and production capital;Increasing the availability of information for consumers about efficient appliances, machines and equipment; Raising public awareness of energy efficiency, in particular end users’ awareness of the individual and national benefits of energy efficiency and climate protection;Removing other obstacles such as legal and administrative barriers; andIncreasing the availability of technical, commercial and financial services.
These policy measures are necessary in market economies to reinforce the role of energy prices, and to create a framework that provides cost-effective solutions for consumers. Any efficiency improvements in oil-consuming sectors, such as the transportation sector, will result in direct benefits to the balance of trade, because it will lead to less gasoline im-ports from other countries. Instead of subsidizing the consumed energy via the national budget, the resources saved could be sold on the world market. Improving energy efficiency in consumer products would have two major benefits. First, the electricity demand growth would slow down, which reduces the expansion of investment needs in the electricity sector. Second, the costs of the saved kilowatt-hours are usually lower than the costs of electricity production, i.e. that energy savings result in a macroeconomic gain.

86
Sustainable Energy Strategy for IranAlternative Scenarios

87
5 Renewable Energy Sources
5.1 Introduction
The rising concerns over energy scarcity and security as well as environmental problems have led developed countries to increase their investment in renewable energy sources as an alternative to conventional energy. Renewable energy development helps to address challenges such as climate change, environmental pollution and sustainability of energy sources. Furthermore, renewable energy technologies are becoming increasingly important for innovation and technological advancement, economic development and job creation. Governments across the developed world are increasingly supporting activities in research and development that will improve technologies to help alternative energies compete with fossil fuels. Recent achievements in wind and solar electricity generation as well as with hybrid and electric cars indicate that new energy sources will be used more extensively in the near future.
In several countries, renewable energy sources represent a rapidly growing share of total energy supply. As efficiency has increased and costs have fallen in the renewable energy sector, it was possible to build the first onshore wind and solar installations without subsidy support in several locations around the world in 2013 (GSR, 2014). According to the latest Global Renewable Status Report from 2014, the total investment in renewable energies increased from US$ 40 billion in 2004 to US$ 279 billion in 2011, an annual growth rate of 18 percent. It is interesting to note that developing countries are also playing an increasingly important role in the deployment of renewable energy use. While investment in renewable energies has been growing on average by 14 percent per year in developed countries, it has been growing by 28 percent in developing countries. Although total global investment in renewable energies declined in 2012-2013, global net investment in new renewable power capacity surpassed that in fossil fuels. China has become the leader among the top investor countries with an investment of US$ 54.2 billion (excluding R&D). Other countries include the United States (US$ 33.9 billion), Japan (US$ 28.6 billion), the United Kingdom (US$ 12.1 billion), Germany (US$ 9.9 billion), India (US$ 6 billion) and South Africa (US$ 4.9 billion) (GSR, 2014).
However, some fuel-rich countries have not yet recognized investment in renewable energy as an important measure for sustainable development. This is particularly true for Iran, where conventional energy sources such as oil and natural gas are abundant.
Iran is an energy-rich country with huge hydrocarbon reserves as well as abundant renewable energy sources. However, the country has not yet made major investments to fully develop its renewable energy sources. Since Iran is an exporter of fossil fuels,

88
Sustainable Energy Strategy for IranRenewable Energy Sources
development of renewable energies for domestic use will benefit the country by freeing up even more crude oil and natural gas for export. The Iranian energy and industrial sector can also benefit from the development of renewable energy, and national income can increase by active exploitation of the vast potential of these resources. Neverthe-less, new approaches and policies are required if Iran wants to make the best use of its energy sources in a new path of sustainable economic development based on renewable energy sources.
This chapter surveys Iran’s alternative energy resources. It reviews renewable energy objectives, its potential and the organizations involved within the sector. It also discusses current regulations and challenges confronting renewable energy development. The chapter is organized as follows. Sections 2 and 3 present a general overview of support schemes followed by three country case studies. Section 4 discusses the rationales and objectives for renewable energy investment in Iran, its potential as well as challenges for renewable energy in Iran and suggestions for improving current policies.
5.2 Support Instruments for Renewable Energies
In Section 2, we first discuss the necessity for government intervention in the renewable energy market and then analyze different types of support mechanisms.
5.2.1 Why is government support needed?
There are three main reasons why government support is needed to invest in renewable energy projects. First, investment in renewable energy projects requires high financial costs up front, and returns on investment will take time. If consumers are unwilling to make long-term investments, renewable energy projects will be under-invested. Consumers may also encounter liquidity constraints, and therefore cannot adopt renewable energy projects, particularly if there is no developed and effective financial market to overcome the liquidity problem. Second, the new technologies are often associated with uncertainties and, therefore, investors and users may rationally decide to delay their investments until the technology matures. Furthermore, the rapid pace of technological change in renewable energies makes the investment of early adopters more costly and riskier than those in fossil fuels which have a long record and established technologies. Finally, there are several positive external effects of increased renewable energy use that are not included in current energy prices. Economic theory suggests that resources will be under-allocated when there are positive externalities in production. Renewable energy resources generate electricity and at the same time reduce emissions overall. If producers of renewable energies are unable to fully capture the positive benefits of emission reduction due to the lack of a market for some form of emission compensation, they will not invest in those projects. In other words, in the case of positive externalities, such as emission reduction by renewable energy production, social benefits exceed private benefits, and the market system cannot deliver an optimally efficient outcome.

89
Sustainable Energy Strategy for Iran Renewable Energy Sources
Similar to the cases of other new technologies with economy-wide effects, renewable energies rely on government support systems in the early stage of their development. New technologies with general applications, such as steam, electricity, information and com-munication technology and renewable energy technology have direct and indirect effects on the economy. The direct effects emerge through the production process by firms and the use of new products by households as they substitute new inputs or products for older ones when the relative prices change. The indirect or spillover effects arise from the inter-action between the new technology and other production inputs or consumer products. For instance, the use of information and communication technology in a firm affects pro-ductivity not only directly through computerization of the production process, such as substituting high-speed computers for older machines, but also indirectly through effects on the quality of labor and organizational changes.16 To encourage technological change and to overcome the underinvestment problem, government can provide economic incen-tives to both producers and consumers. This support is particularly important in the early phases of technological change, when uncertainties and the inability to capture the positive externality may cause delays in investment.
Iran can invest in alternative sources (particularly wind and solar energy) and allocate oil and natural gas resources for export and, more importantly, also catch up with new re-newable energy technology and know-how. Environmental protection is one of the main reasons for an increased use of renewable energy sources. Burning fossil fuels will exacerbate the poor environmental conditions as well as CO2 emissions in large cities such as Tehran. According to the WHO (2011), four out of the top ten polluted cities world wide are in Iran.17 Furthermore, Iran is one of the largest emitters of CO2 in terms of total fossil-fuel CO2 emissions.18 The increased use of renewable energy sources will decrease air pollution in cities, thus improving the environment, public health and productivity.
Although Iran’s oil and natural gas resources are abundant, they will likely be exhausted by about the time renewable energies become the main sources of energy. The increasing trend of domestic demand for fossil fuel has led to an exhaustion of conventional energy sources, and Iran may turn from an oil-exporting to an oil-importing country (see Chapter 3).
Since Iran is also rich in renewable energy resources, it would be highly beneficial if the country started investing in alternative energy technologies, particularly in education
16 The spread of general-purpose technologies in the economy follows a Schumpeterian logistic S shape form. At the infancy stage, the use of technology is uncertain and costly. The term “destructive creation” applies to this stage of new technology development as it creates new means of production and novel products by “destroying” old technologies and products. In the second stage, when technology becomes cheaper and more widely available, the growth of new technology accelerates. Finally, at the end of the development process, the new technology dies out as it is replaced by another newer technology.
17 WHO Database: http://apps.who.int/ghodata/18 Carbon Dioxide Information Analysis Center: Top 20 Emitting Countries by Total Fossil-Fuel CO2 Emissions for 2008,
http://cdiac.ornl.gov/trends/emis/tre_tp20.html

90
Sustainable Energy Strategy for IranRenewable Energy Sources
and training. In fact, Iran can capitalize on its young population structure and high demand for education to become one of the leading countries in the region in the area of renewable energy technologies. This can help the economy significantly by creating new jobs and maintaining the standard of living, especially in a case in which oil and gas could no longer compete with the new energy resources or were no longer available.
The development of renewable energy sources would also enable Iran to produce and distribute electricity in rural and remote areas, which would play an important role in continuing to develop the infrastructure in these areas as well as increasing consumption while protecting the environment. This is particularly important since the level of poverty in areas with rich wind potential and solar radiation is rather high.
The two main categories of supporting instruments for electricity generation by renewable energy sources – feed-in tariffs and quota/certificate systems – are presented in the fol-lowing section.
5.2.2 Feed-In Tariff SystemsThe use of a feed-in tariff (FIT) system has become a widely adopted policy in many countries around the world to support the generation of electricity by renewable energy sources. Although FIT policies vary from country to country, this type of policy generally has two components: 1) it sets the purchase price for electricity generated by the renewable sources, and 2) it ensures a purchase obligation by utilities (supply companies or grid system operators). FIT programs differ in their level of tariffs and the duration of the subsidy. The level of tariffs and the duration are usually set at the levels that provide economic incentives to existing producers to switch to and new producers to invest in renewable energies. Moreover, the payment mechanism has to be supplemented by adequate grid connection conditions and a sufficient planning framework. There are several design options for FIT supporting schemes, including the options below:
Fixed FIT system versus fixed premium systems: A fixed FIT provides total payments per kWh, whereas the fixed premium system only fixes a premium to be added to the electricity price.Base calculations to fix the level of support: FIT can be calculated according to the “avoided costs” of conventional power or it can be linked to the average price of electricity to ensure competition between conventional and renewable technologies.Technology-specific support: Differentiation between different technologies is com-mon. Less mature technologies generally receive higher levels of support. The level of support usually declines over time. Location-based FIT: The level of tariff and the duration of the program might differ from one location to another based on their geographical conditions and the availability of the sources. Time-based FIT: The time of renewable electricity generation (within a day, season, or year) can be a factor in differentiating the subsidy.Frequency of adjusting the FIT: Tariffs can be fixed annually or for longer periods.Duration of FIT: Payment periods may be guaranteed for a shorter or longer period.

91
Sustainable Energy Strategy for Iran Renewable Energy Sources
The FIT incidence: The costs of the system can be financed by final consumers and/or by taxpayers.FIT coverage: FIT can be applied solely to new capacity installations and/or to the existing capacity as well (Río, Gual, 2007).
An FIT system sets up a legal framework for electricity market operation by providing clear and transparent requirements for electricity generation by supported technologies. The main advantage of an FIT is its flexible structure, which enables technology-specific sup-port. In addition, FITs often enable investors to plan more effectively, since they can decrease the investment risk involved. In principle, the level of the tariff for new plants can be changed at any time or removed by repealing the law (Gan et al., 2007).
5.2.3 Quota System and Tradable Green CertificatesThe primary objective of a quota-based system is to achieve a certain target for electricity generated by renewable energy sources. In this system, policy-makers usually set a mini-mum share for the renewable electricity generation of total electricity generation. This support scheme consists of two parts: 1) Market participants are required to have a certain share of their energy production or consumption coming from renewable sources. This is called a quota obligation. 2) Renewable electricity producers receive “Green Certificates” for the electricity they produce.
Market participants can meet their quota obligations by either increasing their installed renewable capacity or by purchasing Green Certificates. These certificates can be traded on a separate market, which can help market participants fulfill their renewable quota ob-ligations. The general principle of the quota system is to encourage electricity producers with the lowest marginal costs to increase their installation of renewable capacity, and producers with higher marginal costs to purchase Green Certificates to meet their own quota obligations. In theory, both the FIT and quota-based systems operate on this same basic principle of cost minimization; however, experience shows that the two systems differ in terms of efficiency and effectiveness (these differences will be discussed in Section 2.4). In terms of the practical operation of quota systems, electricity from renewable sources is ordinarily purchased on the power market and electricity producers receive revenues from the sale. Furthermore, renewable electricity producers receive Green Certificates from the State that can be sold in a separate market to provide extra revenue. This means that re-newable electricity producers receive revenues from two sources: the sale of electricity and Green Certificates. If a certificate market works effectively, the price will reflect the difference between the market price of electricity and the generation costs of the new renewable generating capacity. The value of a certificate represents the additional cost of producing renewable electricity compared to conventional sources.
The renewable quota obligation should increase over time in order to stimulate invest-ments in renewable power generation. Failure to comply with the quota obligation must lead to a sufficiently large penalty. If there is lack of legal and financial consequences or the severity of the penalty is not significant, market participants will not fulfill their obligations.

92
Sustainable Energy Strategy for IranRenewable Energy Sources
The system is designed to promote investments in the lowest-cost renewable electricity sources, and to introduce competition between different renewable energy technologies without differentiation.
Daily price changes in the certificate market make quota obligations riskier for renewable energy investors. Therefore, this support scheme is less suitable for immature technologies and market establishment (Gan et al., 2007; Ragwitz, 2007).
5.2.4 Comparison of FIT and Quota SystemsFIT systems and quota systems have been widely used to support investment in renewable energies. However, the question is which subsidy system – tariff or quota – better fosters renewable energies at the lowest cost. Economic models suggest that a price-based system will deliver a more efficient outcome than a quantity-based policy. However, the quota support system was adopted by most EU countries in the early stages of renewable energy policies. Nevertheless, electricity prices under the quota system were higher than the prices under the FIT policy (Grotz and Fouquet, 2005). For instance, in 2003, customers in countries with a quota system, such as the UK and Italy, paid an average of € 0.096 and € 0.13 per kWh respectively for wind power; this was significantly more than the € 0.064 in Greece or Spain, where FIT systems were in place. The newly installed capacity has also been much higher in countries under the FIT system than those under the quota system. For example, Spain and Germany, which adopted a FIT program, developed about 50 and 25 watts per capita, whereas the UK and Italy with quota programs generated 4 and 2.3 watts per capita, respectively, in 2004 (Grotz and Fouquet, 2005).
A study by the European Commission (2005) analyzed the subsidy schemes introduced for different renewable technologies. It concluded that the most effective systems for wind energy were the FIT systems in Germany, Spain and Denmark. In these cases, the price-based systems were mainly responsible for the additional installed renewable energy capacity. Additionally, it revealed that minimum price systems are especially beneficial to small projects and small and medium-sized enterprises (SME). The minimum price systems have also encouraged the development of local manufacturing industries. Despite the implementation of a variety of quota system designs in various countries, none of these countries have developed large independent industrial manufacturing sectors for re-newable-energy equipment and parts.
Apart from the efficiency and effectiveness of support policies, a long-term and stable policy environment is essential for the success of developing renewable energy markets. In other words, the environment in which a country applies any given policy has a huge impact on its success. For instance, a stable and supportive policy framework for renewable energy has been put in place in Germany and other European countries alongside feed-in tariff schemes; this step has contributed to the perceived success of the feed-in mechanism (Bürer, Wüstenhagen, 2009).

93
Sustainable Energy Strategy for Iran Renewable Energy Sources
5.3 International Experiences in Renewable Energy Policies
All economic activities require energy, and any changes in the energy sector will affect the entire economy. Therefore, renewable energy technologies can be categorized as general-purpose technologies that will change all sectors of an economy. Similar to the boom in information and communication technology (ICT) in the late 20th century, rene-wable energy technologies will be at the forefront of technological change that will impact production and consumption patterns as well as standards of living in the 21st century. Governments that have realized the importance of this new trend in technological change have already started to invest in renewable technologies, hoping to get a head start in the next technological revolution. There are now a number of different support schemes for developing renewable energy sources that have been employed in 138 countries across the world, and at least 144 countries have renewable energy targets (GSR, 2014). Most developed nations already have long-term plans and policies with specified targets and deadlines for advancing renewable energy technologies. However, developing nations face greater challenges than developed countries in changing their energy supply system. Developing countries often lack the inputs and – more importantly – the institutions required for a good supporting plan for technological change. Notwithstanding the overall technological gap, there have been some attempts in the developing world to catch up with the know-how of the developed world and to take advantage of vast and free renewable resources available in developing countries such as solar radiation, wind, water, geothermal sources and biomass. Table 5.1 shows a sample of subsidy systems in 20 developing countries from different regions around the world. Most of these countries have employed a feed-in tariff subsidy program to overcome key barriers to the development of renewable energies, such as investment uncertainty and unfair competition with conventional fuel.
94
Sustainable Energy Strategy for IranRenewable Energy Sources
Table 5.1. Targets and Supporting Programs of Renewable Energies in Developing CountriesCountry Current Share of
Electricity Generation from RES (2012)
Target Supporting MeasuresShare of RE in Total Electricity Generation
Year
Argentina 38.9% final energy 8% 2016 Renewable energy targets, feed-in tariff/premium, tendering, capital subsidy/rebate, tax exemption, regulations in sales, public loans
Brazil 85% Renewable energy targets, net metering, heat mandate, tax exemption, regulations in sales, public loans
Grenada 1% 20% share in primary energy
2020 Renewable energy targets, net metering, regulations in sales
St. Lucia 5% 2013 Renewable energy targets, net metering15% 2015
30% 2020Dominican Republic
14% 25% 2025 Renewable energy targets, feed-in tariff/premium, net metering, tendering, heat obligation, capital subsidy/rebate, tax exemption, preferential loans
Chile 38% 20% (excl. hydropower plants >40 MW)
2025 Renewable energy targets, electric utility quota obligation, net metering, tendering, heat obligation, capital subsidy/rebate, reductions in sales, public loans
Mexico 15% 35% 2026 Renewable energy targets, net metering, tendering, heat obligation, tax exemption, government fund, preferential loans
Panama 61% final energy Feed-in tariff/premium, net metering, tendering, tax exemption, import tariff exemption, production subsidies, energy production payment
Peru 55% Feed-in tariff/premium, tendering, reduction in sales, preferential access to transmission and distribution network
Egypt 9.2% 20% 2020 Renewable energy targets, net metering, tendering, capital subsidy/rebate, reduction in sales
Morocco 8.9% Renewable energy targets, tendering, public loans

95
Sustainable Energy Strategy for Iran Renewable Energy Sources
Senegal 10% 15% 2021 Renewable energy targets, electric utility quota obligation, heat obligation, reduction in sales
South Africa 2.6% 9% 2030 Renewable energy targets, electric utility quota obligation, net metering, tendering, capital subsidy/rebate, reduction in sales, government funds
Tunisia 1.2% 16% 2016 Renewable energy targets, net metering, capital subsidies, grants, rebates, tax incentives203040%
Indonesia 12% 26% 2025 Renewable energy targets, feed-in tariff/premium, electric utility quota obligation, tendering, capital subsidy/rebate, reduction in sales, tax incentives, govern-ment funds
Pakistan Renewable energy targets, feed-in tariff/premium, net metering, capital subsidy/rebate, reduction in sales, government funds
Vietnam 5% 2020 Renewable energy targets, feed-in tariff/premium, tradable REC, capital subsidy/rebate, reduction in sales, tax incentives
China 21% 9.5% share in final energy
2015 Renewable energy targets, feed-in tariff/premium, electric utility quota obligation, tendering, heat obligation, capital subsidy/rebate, reduction in sales, tax incentives, energy production payment, government funds
Blank cells indicate information is not available. Source: GSR, 2014
The following sections review three cases of renewable energy policies. Two cases are from developing countries (India and Algeria), and one from a developed country (Germany). These three cases provide sound learning experiences for countries, such as Iran, which are far behind regarding renewable energy investments but are trying to catch up with global developments.

96
Sustainable Energy Strategy for IranRenewable Energy Sources
5.3.1 IndiaRenewable Energy Development in IndiaIndia is one of the leading developing countries in terms of energy and environmental legislation. The first reforms to make the Indian energy sector more favorable to renewable energies were undertaken in 2003 and 2006 with the Electricity Act and the National Tariff Policy (Pew Center, 2008). These laws oblige the Central Electricity Regulatory Commission (CERC) to supply a certain share of total electricity from renewable sources and to buy the required amounts from suppliers. This Renewable Purchase Obligation was set at 5 percent for the year 2010, and has been expected to grow by one percentage point a year (CERC, 2009). CERC is also responsible for setting the feed-in tariffs (Gipe, 2009). The organization has specified that all renewable feed-in tariffs will be designed in the form of preferential tariffs for the time span of debt repayment to provide for an appropriate internal rate of return on the investments (ibid.). Tariffs are calculated before tax, and should grant a normal return on equity of 19 percent for the first ten years, and 24 percent thereafter. Furthermore, the discount rate on which the premiums are based is the average weighted costs of capital, taking into account the life expectancy of each technology. For wind-generated power, the feed-in tariffs also depend on the wind intensity at the respective sites (ibid.). Four bands of wind power density have been designed in order to specify the capacity factors (ibid.):
200-250 W/m²: 20%250-300 W/m²: 23%300-400 W/m²: 27%> 400 W/m²: 30%
Premiums are to be paid for 25 years for photovoltaic (PV) and concentrated solar power (CSP) projects, 35 years for small-scale hydropower (< 3 MW) and 13 years for all other technologies. Tariffs will be reviewed after three years, except for PV (after one year) (ibid.).
Recently, the Indian government has placed particular emphasis on solar power. In 2008, the government introduced its first National Action Plan on Climate Change (NAP-CC), which outlined eight national missions in different core areas (Pew Center, 2008). Among them is the Jawaharlal Nehru National Solar Mission, which was devised to run in three phases until 2022. The aim is to position India as a global leader in the solar energy domain and to set up the necessary political framework (MNRE, 2010). Table 5.2 displays the target capacities for solar energy in India.

97
Sustainable Energy Strategy for Iran Renewable Energy Sources
Table 5.2. Target Capacities for Solar Energy in IndiaApplication Segment Phase I
(2010-13)Phase II(2013-17)
Phase III(2017-22)
Solar Collectors 7 million m2 15 million m2 20 million m2
Off-Grid Solar 200 MW 1,000 MW 2,000 MWOn-Grid Solar 1,000-2,000 MW 4,000-10,000 MW 20,000 MW
Source: MNRE, 2010
In order to meet these targets, the government introduced a special Renewable Purchase Obligation for power utilities, with a given share for solar electricity that will increase over time from 0.25 percent in Phase I to 3 percent in Phase III, while the feed-in tariff for solar power is scheduled to decline (MNRE, 2010). Tariffs have been set at Rs. 18.44 per kWh for PV and Rs. 13.45 per kWh for CSP, and are guaranteed for 25 years (Appleyard, 2010). Concerning the legal framework, sector-specific regulations for solar power are to be set up in the long run. In the short run, however, in order to enable the rapid launch of the National Solar Mission, existing legislation – notably the 2003 Electricity Act – will be amended as required. Moreover, the mission document suggests the creation of a Renewable Energy Certificate system so that utilities can trade their renewable surpluses and deficits. Fiscal incentives are envisioned for specific capital equipment, critical materials, com-ponents and project imports. Furthermore, the government intends to promote domestic manufacturing capacities, R&D investment and pilot projects (MNRE, 2010).
The development of wind energy in India began in the 1990s, after the announcement of the private power policy, and has significantly increased since then. India’s wind power potential has been assessed to be 45,000 MW. The first wind farms were installed in the coastal areas of Tamilnadu, Gujarat, Maharasta and Orrisa, but projects have since been expanded to more than nine states of India. The growth of wind power in India is shown in Figure 5.1.
Figure 5.1. Growth of Wind Power in IndiaSource: GWEC, 2013
6,000
8,000
10,000
12,000
14,000
16,000
18,000
20,000
tTo
tal I
nsta
lled
Capa
city
(MW
)
0
2,000
4,000
2001 2002 2003 2004 2005 2006 2007 2008 2009 2010 2011 2012

98
Sustainable Energy Strategy for IranRenewable Energy Sources
In 2012, India ranked fifth in the world in installed wind power capacity with a total capacity of 18,421 MW (Figure 5.2).
Figure 5.2. Position of the Indian Wind Energy Sector Source: GWEC, 2013
While India had to depend on imported turbines in the 1990s, local manufacturing capacity has improved remarkably over the last 15 years. For example, Suzlon Energy is one Indian- owned wind turbine manufacturer; it has become one of the leading wind turbine producers worldwide, with manufacturing sites in China, Germany and Belgium as well as in India itself.
Renewable Energy Investment IncentivesAs the criterion of success for any feed-in tariff system is whether or not investors consi-der it profitable, Purohit and Purohit (2010) evaluate if investments in CSP generation plants are financially attractive in India. Using solar radiation data provided by the Indian Meteorological Department for 50 representative sites in India, they evaluated the financial feasibility for two types of CSP plants modeled on two existing generation units in Spain – the 50 MW ANDASOL-1 parabolic trough plant and the 11 MW PS-10 power tower. The calculations show that similar plants would generate electricity at costs ranging between Rs. 9.23 and 28.42 per kWh for ANDASOL-1 and between Rs. 8.75 and 27.04 per kWh for PS-10 at the selected 50 different sites. Assuming a feed-in tariff between Rs. 10 and 13 per kWh, investors would able to find profitable locations for CSP plants. Expected cost reductions between 20 and 30 percent for parabolic trough systems, and between 15 and 30 percent for power towers, would make even more locations worthy for investment by 2020. The same effect is achieved by accounting for possible CDM benefits. Calculating with a baseline of 800 to 850 g of CO2 emissions per kWh, and a CER (Certified Emission
70,000
80,000
60,000
50,000
40,000
30,000
20,000
10,000
0
Tota
l Ins
talle
d Ca
paci
ty (M
W)
Existing in 2011 Added in 2012PR China
USA
Germany
Spain
India UKIta
ly
France
Canada
Portuga
l

99
Sustainable Energy Strategy for Iran Renewable Energy Sources
Reduction) price of € 15, electricity costs are reduced to Rs. 8.56-27.64 per kWh for the ANDASOL-1 model, and to Rs. 7.97-26.26 per kWh for PS-10 type plants. Hence, there is substantial potential for financially attractive investment in CSP in India, especially con-sidering that with Rs. 13.45 per kWh, current feed-in tariffs for CSP are even higher than assumed in the case study.
Financial Management of Renewable Energy PoliciesHowever, it is not enough for the remuneration scheme to be attractive for investors; it also has to be financially feasible for the state budget. The Indian tariff system is based on some general considerations of the Ministry of New and Renewable Energy. The aim of the Solar Mission is to bring down the costs of solar technologies through economies of scale. Current electricity prices for coal generation, which accounts for more than half the electricity produced in India, are close to Rs. 7 per kWh for base load, and Rs. 8.50 for peak load, with the cost of diesel-generated electricity used in times of shortages at Rs. 15. The cost of coal-generated electricity is expected to rise as India starts importing coal, and the ministry assumes cost parity with solar-generated electricity to occur in 2022. These considerations show that the government expects to be able to provide investors with prof-itable tariffs without imposing an additional burden on its economy.
According to the Ministry of New and Renewable Energy, the National Solar Mission has been designed to take into account financial constraints from the outset. Funding is to be provided by two sources: the national budget and international funds under the United Nations Framework Convention on Climate Change (UNFCCC). The government is already working on a scheme intended to facilitate quick investments while limiting costs for the government. The National Mission has scheduled five evaluations of the Solar Mission by 2022, notably to protect the government from having to subsidize its solar plan. Thus, specific financing needs for Phase II of the plan were, for instance, to be devised in 2012. Feed-in tariffs for solar power have been designed to be reviewed annually according to current costs and technology trends. Furthermore, one possibility to mitigate financing pressures for the utilities (which are obliged to purchase renewable electricity) is to bundle solar power with unallocated electricity from less expensive plants and to sell this mix to utilities at the standard price set by the regulating agency (MNRE, 2010).
In sum, close market monitoring, regular evaluations and quick adjustments of the tariff policy can ensure that the financial burden of a remuneration scheme is consistent with the budget limit. 5.3.2 AlgeriaAlgeria is one country from the broader Middle Eastern region that has already intro-duced a feed-in tariff for electricity generated from renewable sources. The following sections describe and assess the Algerian legislative framework, based on project results by Wuppertal Institute/Adelphi Consult (2009) and Wuppertal Institute/CREAD (2010).

100
Sustainable Energy Strategy for IranRenewable Energy Sources
Description of the Algerian Incentive Scheme for Renewable EnergiesIn Algeria, legislation supporting renewable energy sources dates back to 2002, with the Law on Electricity and on Gas Distribution via Pipelines (Law No. 02-01). This law estab-lished the grounds for comprehensive liberalization reforms of the Algerian electricity sector and laid out a national program for the promotion of renewable energies. Thus, among other innovations, the law stipulates that anyone is allowed to construct power generation units. However, the newly established regulatory commission CREG (Commis-sion de Régulation de l’Electricité et du Gaz) needs to approve any new installation that feeds electricity into the national grid and exceeds a capacity of 25 MW. Similarly, CREG is responsible for granting concessions for the transmission of electricity via the national grid, which remains a monopoly even under the new law. The law further envisages the creation of a system operator for electricity distribution and of a market regulator for the electricity market, but these have yet to be introduced.
Further progress in the promotion of renewable energies was made in 2004 with Decree No. 04-92, which set up the first precisely defined feed-in tariff system for renewable elec-tricity in Africa. The scheme details the size of the premium to be paid for each type of re-newable energy in addition to the standard market price. It includes special rates for hybrid plants (gas and solar), with the premium depending on the share of solar in total electricity generation.The bonuses provided are:
Wind electricity 300%Solar electricity (PV or CSP) 300% CSP with gas co-firing:
Solar contribution of 20-25% 180%Solar contribution of 15-20% 160%Solar contribution of 10-15% 140%Solar contribution of 5-10% 100%Solar contribution of 0-5% 0%
Hydroelectricity 100%Cogeneration plants 160%Waste incineration plants 200%
Electricity prices are heavily subsidized in Algeria; hence, the devised remuneration scheme is not profitable for investors. On a case-by-case basis, some investors have negotiated special remuneration tariffs for individual investment projects. This has allowed for the completion of a few renewable energy ventures, with the biggest one being a hybrid plant (solar energy supplementing a gas-fired combined cycle process) at Hassi R’mel, which was constructed by the NEAL consortium, a semi-public joint venture.
Further development was made by new renewable energy legislation in 2004: the Law on the Promotion of Renewable Energies in the Context of Sustainable Development (Law No. 04-09). This law introduced the National Program for the Promotion of Renewable Energy, with elements such as public awareness campaigns and regular assessments of the

101
Sustainable Energy Strategy for Iran Renewable Energy Sources
beneficial effects of renewable energies. It also stipulated the introduction of a renewable certificate system, and the creation of a monitoring body (the Observatoire national de promotion des énergies renouvelables); these aspects have not yet been implemented.
Evaluation of the Algerian Incentive Scheme for Renewable EnergiesIn Algeria, one notices a disparity between the success of public renewable energy programs and the creation of incentives for private investment. While programs for the installation of solar water heaters in households and for rural and desert electrification have yielded considerable successes, the above-mentioned frameworks intended to incentivize private ventures have proven to be flawed. Shortcoming of the laws and decrees are:
New power plants for feed-in into the national grid that are bigger than 25 MW need to be approved by CREG.Electricity producers are entitled to sell either their whole production or only surpluses to Sonelgaz, the national utility. Due to its monopolistic position, Sonelgaz has the advantage in all negotiations.The subsidized electricity base price is so low that the premiums paid for renewable energies are ineffective. A realistic profitable fixed tariff (per kWh) would grant more security than the premium scheme.The system operator for electricity distribution and the market regulator for the electri-city market envisaged by the 2002 law as well as the Observatoire national de promotion des énergies renouvelables and the certificate system stipulated by the 2004 law have not yet been introduced. This means that the legal framework of the electricity market is not complete.
Overall, the current Algerian framework for renewable energies lacks financial and legal security for investors.
5.3.3 Lessons Learned from the Experiences in India and Algeria The Indian feed-in tariff system provides security for investors because it guarantees a fixed price per kWh and obliges retailers to buy solar-generated electricity. An especially con-venient aspect for investors is the fact that price calculations in India are based on the real cost of investments and include a profit margin. The differentiation according to tech-nologies, and even according to wind intensity, testifies to the thoroughness with which the scheme has been elaborated. Regular revision of tariffs ensures their appropriateness, and safeguards the state from excessive expenditure.
The techno-economic assessment by Purohit and Purohit (2010) shows how a country can determine financially attractive yet feasible feed-in tariffs. The rigorous methodology and investor-based approach of the case study lend themselves to similar calculations for different locations in Iran. In this context, it is important to have reliable, detailed potential data covering all climatic regions of the country, and to know specific investment costs such as the discount rate. In this way, it could be possible to design feed-in tariffs that are adjusted to local conditions in different countries.

102
Sustainable Energy Strategy for IranRenewable Energy Sources
The example of Algeria shows that it is of utmost importance to create financial incentives and legal security for investors. Therefore, first, feed-in tariffs have to be high enough to make investments attractive. Hence, actual investment and generation costs need to be considered when fixing premiums or feed-in tariffs. Specifying a time span for which the remuneration scheme is guaranteed creates additional security. Second, the purchase obli-gation for established electricity providers needs to be very clear and valid for the whole amount of renewable energies produced. This includes the duty to provide sufficient grid capacity for the integration of additional electricity from renewable sources.
5.3.4 GermanyGermany has dramatically increased the amount of renewable energy in its supply mix though ambitious policies since 1990. Biomass, wind and PV sources have been particu-larly successful fields in Germany. Germany has also stated a goal of reaching a generation share of electricity from renewables of at least 80 percent by 2050, and renewable energy sources should cover at least 60 percent of the primary energy production by 2050. In 2013, about 25.3 percent of electricity generation in Germany came from renewables.
The Federal Feed-In LawThe first German Act on Renewable Electricity Feed-In (StromEinspG, BGBl. I, p. 2633) was adopted in December 1990. This Act ensured grid access for electricity generated from renewable energy sources, and obliged utilities operating the public grid to pay pre-mium prices (feed-in tariffs) for the electricity supplied from these renewable energy power plants. The feed-in tariffs were calculated annually as a certain percentage of the average electricity price for every year.
Wind power plants and solar power plants received the highest remuneration, with 90 percent of mean specific revenues; next, hydropower, biomass and biogas power plants that were smaller than 500 kW received 75 percent (remuneration rose to 80 percent some years later). Hydropower, biomass and biogas power plants larger than 500 kW, but smaller than 5 MW, received 65 percent of mean specific revenues. The law did not cover plants larger than 5 MW. No public budget funds were involved in the policy, as the burden imposed by the law was exclusively borne by electricity suppliers who had to pay for the feed-in price. The premium prices, also referred to as tariffs, decreased after 1996. This was due to a general fall in the price of electricity as a result of the liberalization of power markets. The duration of the remuneration for an individual plant was not fixed; however, the constitutional protection of legitimate expectations provided some certainty to re new-able energy generators.
The law was amended in 1998. A “double cap” was introduced, limiting the amount of renewable energy electricity that had to be remunerated according to the law. Regional electricity suppliers only had to purchase a maximum share of 5 percent of renewable energy electricity of their total electricity supply. The same cap applied to upstream suppliers, leading to a total cap of 10 percent. This way, the total burden of the law was limited to individual utilities and their customers. The 10 percent threshold was almost reached in

103
Sustainable Energy Strategy for Iran Renewable Energy Sources
certain areas of northern Germany in 2000, which would have created a barrier for the further deployment of wind power technology. The law was considered to be the driving force behind the rapid expansion of wind power technology in Germany. The Renewable Energy Sources Act (Erneuerbare-Energien-Gesetz, EEG), based on the same general principles (but without the cap and the recalibrated feed-in tariffs), replaced the Electricity Feed-In Law in 2000 (IEA Country Homepage).
The German Renewable Energy Sources Act (EEG)The Renewable Energy Sources Act (EEG, BGBl. I p.305) came into effect in 2000 and has been adapted by many countries around the world. It has been amended on a regular basis with amendments passed in 2004, 2009, 2012 and 2014. This triggered a large boom in re-newable electricity production (compare Figure 5.3).
Figure 5.3. Development of Renewables-Based Electricity Generation in Germany (1990-2012), Including the Amendments of the German Feed-In Law Source: BMWi, 2015
The grid operators were obliged to provide grid access to renewable energy plants and to purchase the electricity at premium prices. The EEG covers the whole range of renewable energies and sets bonuses of different amounts according to market maturity and other aspects of the technologies employed. The tariffs are set for each individual technology, based on its actual generation cost. The EEG lays down fixed tariffs generated from hydro-power, landfill gas, sewage treatment and mine gas, biomass, geothermal, wind and solar
40,000
60,000
80,000
100,000
120,000
140,000
160,000
1990 1992 1994 1996 1998 2000 2002 2004 2006 2008 2010 2012
0
20,000
Hydropower Wind Energy Biomass**Solid and liquid biomass, biogas, sewage an landfill gas, biogenic fraction of waste, electricity from geothermal energy not presented
Photovoltaics
GW
h
StromEinspG: January 1991-March 2000
EEG: April 2000
EEG: August 2004
EEG: January 2009
EEG: January 2012

104
Sustainable Energy Strategy for IranRenewable Energy Sources
sources. The minimum payments (dependent on energy source) vary depending on the size of the installation. For an individual plant, the remuneration level stays fixed over 20 years. The remuneration for an individual plant is not adjusted for the inflation rate, which means a decrease in remuneration in real terms. From 2002 on, the remuneration paid for newly commissioned plants has been reduced annually to provide stronger incen-tives for cost reductions. This factor was 5 percent for photovoltaic installations and 1.5 percent for wind power plants. The Act also stipulates obligations concerning the costs of grid connection and reinforcement. Plant operators have to pay for the grid connection, but the grid operator has to bear the cost of grid reinforcement if necessary. No govern-mental budgets are involved in the program and the Act requires all electricity suppliers to have the same share of electricity from renewable energy in their fuel mix. Every two years, the parliament re-evaluates the Act on the basis of a report that is prepared by the Federal Ministry for Economic Affairs and Energy, in close consultation with the Federal Environ-ment Ministry and the Federal Agriculture Ministry.
The Act was amended for the first time in 2004, but maintained its general principles. It aimed to further develop renewable technologies for the generation of electricity, thus contributing to a reduction in costs. To this end, it defined a target to increase the share of renewable energies in the total electricity supply to at least 12.5 percent by 2010 and to at least 20 percent by 2020 in line with EU Directive 2001/77/EC. For 2005, fees under the new EEG ranged from € 0.0539 per kWh for electricity from wind energy (basic payment) and € 0.0665 per kWh for electricity from hydropower to € 0.5953 per kWh for solar elec-tricity from small façade systems. Compared to the EEG from 2000, the amendment pro-vided a more varied tariff structure, taking into account aspects of efficiency.
To improve transparency, the first amendment of the EEG required grid operators to publish energy volumes and payment figures. The German Renewable Energy Sources Act was next amended in 2009. This amendment stipulated a higher feed-in tariff for wind energy, and other measures to stimulate the development of both onshore and offshore wind power. The amendment was meant to reflect the increasing costs faced by wind tur-bine manufacturers, largely due to increases in the costs of raw materials such as steel and copper (IEA Country Homepage). The next amendment of the German Renewable Energy Sources Act was signed on July 1, 2010. It significantly reduced the feed-in tariffs for solar power generated by installations on buildings and in open spaces (Figure 5.4), because prices had dropped by around 30 percent (BMU, 2010).
In 2012, the feed-in tariffs were comprehensively revised. The feed-in tariffs for PV in particular were again reduced in order to correspond to the decreasing market prices for solar panels.

105
Sustainable Energy Strategy for Iran Renewable Energy Sources
Figure 5.4. Development of the German Feed-In Tariff (FIT) for Small Rooftop Systems (<10 KW)Source: IEA, 2014
Furthermore, an additional opportunity for selling directly on the market was introduced (market premium model). Instead of receiving a feed-in tariff, a renewable plant operator could sell its electricity on the commodities market and receive the market price and a market premium from the grid operator. Generally, plant operators could choose between the feed-in tariff or the new market premium system.
In 2014, the latest amendments of EEG were introduced. The law included several new elements:The feed-in tariffs were decreased again, especially for solar, biomass and wind technologies. Feed-in tariffs are to be gradually abolished. For newly commissioned renewable elec-tricity power plants, a mandatory direct-to-market system and market premiums will be obligatory from 2017. The market premium consists of a difference between the fixed statutory tariff of the renewable energy plant and the monthly average electricity price in the spot market. Small installations (below 100 kW) will continue to benefit from feed-in tariffs and are not obliged to sell on the market. The amendment introduced expansion corridors for all energy carriers with “breathing caps” (“atmender Deckel”) for the support of renewable power plants under the EEG. For example, for onshore wind technology the yearly expansion corridor is defined as 2400-2600 MW. If more wind turbines are installed, then support will decrease for the technology (“breathing cap“). The aim of the expansion corridors is to reduce the over-all average cost of subsidies for all technologies. From 2017 on, auctions should determine the financial support of renewables. Power generated by a plant operator but consumed by the plant itself will be seen as contributing to the costs for grid expansion.The most recent EEG amendments received a great deal of criticism from experts,
renewable industry representatives and professional associations.The long-term target of the German government is to reach a 40 to 45 percent share of
electricity production through renewable energy sources by 2025 as well as to integrate renewable energy into the market (GTAI, 2014).
2002 2003 2005 2007 2009 20112001 2004 2006 2008 2010 2012
0.20
0.30
0.40
0.50
0.60
0.70€/
kWh
0.00
0.10

106
Sustainable Energy Strategy for IranRenewable Energy Sources
Development of the German Wind Energy Industry under the EEGAt the end of 2012, about 23,030 wind turbines had been commissioned in Germany, with a total capacity of 31,307 MW (Figure 5.5). These turbines generated around 46 TWh elec-tricity (7.5 percent of net electricity consumption of Germany). At the end of 2012, 280.3 MW of offshore wind capacity was connected to the German grid. As onshore wind power is close to full capacity in Germany, the replacement of old and small installations by more modern and powerful ones (repowering) and the development of suitable offshore wind parks are seen as further ways of market development. In 2012, 252 wind generators were dismantled with a total capacity of 179 MW (Deutsche WindGuard, 2013). In 2012, the total turnover of the wind energy sector in Germany amounted to € 6.3 billion – equivalent to approximately 11 percent of global turnover. Moreover, some 117,900 people were directly employed in the wind energy sector in 2012.
Figure 5.5. Total Installed Wind Power Capacity in Germany (2001-2012) (MW)Source: BSW, 2014
The research, development and promotional measures of the German government and the favorable funding opportunities have further accelerated wind technology deployment since the 1990s. There is a very strong correlation between the adoption of the major in-centives laid down in the EEG and the development of the German wind energy market.
The producers of electricity from wind energy receive feed-in tariffs, which are defined in the EEG. These feed-in tariffs offer planning security for manufacturers, service pro-viders and wind energy investors. The initial tariff for new onshore wind turbines was € 0.092 per kWh as of January 1, 2009. This amount is decreased every year by 1 percent for newly commissioned wind turbines in order to take into account technical development. The “initial tariff ” is fixed for at least five years and up to 20 years for wind energy, de-pending on the wind turbine location. Over time, the initial tariff is reduced to a “basic tariff ” depending on how local wind conditions compare to the “reference yield”. Wind
10,000
15,000
20,000
25,000
30,000
35,000
2001 2002 2003 2005 2007 2009 20112004 2006 2008 2010 2012
Tota
l Ins
talle
d Ca
paci
ty (M
W)
0
5,000

107
Sustainable Energy Strategy for Iran Renewable Energy Sources
turbines at very good sites (with a reference yield of 150 percent) receive an initial tariff, e.g. for five years, while this period can be extended for turbines in less favorable sites. The tariffs are paid for 20 years.
If onshore wind turbines replace old ones, the initial feed-in tariff is increased by € 0.005 per kWh. The new turbines must be located in the same or a neighboring adminis-trative district; the new capacity must achieve at least double the old capacity; and the replaced turbines must be at least ten years old. The tariff of offshore turbines will be set at € 0.15 per kWh by the end of 2015, with a yearly decrease of 5 percent (dena, 2009).
The most recent amendment of the EEG introduced specific statutory tariffs for all re-newable electricity sources to be reached by granting a market premium on top of the market electricity price. For onshore wind plants, the EEG defines an initial tariff rate of € 0.089 per kWh for a period of at least five years. For offshore wind plants € 0.154 per kWh is offered for the first 12 years. Alternatively, offshore wind power plant operators can choose an “acceleration model” and receive a fixed rate of € 0.194 per kWh for the first eight years. Depending on the site, these time frames can be extended by the presence of special conditions (such as deep water or a long distance from the coast). Afterwards, the tariffs are decreased by a fixed yearly degression rate (GTAI, 2014).
The EEG is the core instrument of Germany’s renewables strategy, but it is not the only instrument to foster renewable energies and electricity from renewable energies. Another continuously important regulation for the success of wind energy development is the Federal Building Code (§ 35, para. 1, No. 5 BauGB). Under this law, wind energy plants are listed as “privileged projects”. Local authorities are in this respect asked to designate specific priority zones for wind energy utilization. Additionally, a bonus for improved grid compatibility was introduced for new wind turbines. This provides an additional € 0.005 cent per kWh on top of the initial remuneration.
Solar Energy Development in Germany under the EEGBy the end of 2013, a total of 1.4 million PV systems had been installed in Germany, with a total output of 35,700 MWp. Annual power generation through PV systems has grown to 29,700 GWh (BSW, 2014). There is a clear correlation between the creation of the political framework and the boom of the German PV industry, as is displayed in Figure 5.6. Since the introduction of the EEG in 2000, and particularly since its amendment in 2004, the photovoltaic industry has grown dramatically. Since 2013, the number of newly installed PV systems have fallen rapidly due to a decrease of the feed-in tariffs and more restrictive governmental policies.

108
Sustainable Energy Strategy for IranRenewable Energy Sources
Figure 5.6. Newly Installed Capacities in the German PV SectorSource: BSW, 2014
The solar energy industry has benefited from the EEG as well. Both private and institutional investors in photovoltaic systems have received generous guaranteed remuneration for solar electricity fed into the grid. The tariff has been calculated so as to make investment in PV systems economically attractive. The earlier versions of the EEG also provided plan-ning security for investors both in PV systems and in PV companies that operate based on the assumption of continuous growth in the PV market.
Similar to wind power, the feed-in law requires grid operators to pay producers of solar electricity a fixed remuneration for solar generated electricity that is fed into the utility grid, depending on the size of the system and the kind of installation. These tariffs vary in order to account for the different costs of rooftop or ground-mounted systems and in accordance with the size of the system. The EEG guarantees PV operators a feed-in tariff for 20 years and a purchase guarantee for the electricity produced, which makes investing in a solar electricity system an attractive investment for 20 years. The invest-ment security was one reason for the enormous increase in the number of jobs in this sector until 2010 (dena, 2009). Since 2010, employment in the solar sector has declined steadily due to an increase of international market competition and more restrictive governmental policies.
The 2009 amendment of the EEG decreased the feed-in tariffs for solar PV for all capacity sizes. For roof-mounted facilities, these were € 0.4301 per kWh up to 30 kW, € 0.4091 from 30 to 100 kW, € 0.3958 from 100 kW to 1 MW, and € 0.33 over 1 MW. For free-standing facilities, the tariff decreased to € 0.3194 per kWh. The 2010 amendment removed bonuses for building integrated facilities, but a new tariff of € 0.2501 per kWh was introduced for systems up to 30 kW if the electricity produced was used within the building or facility. This amendment of the EEG also decreased the feed-in tariffs for solar power generated by installations on buildings and in open spaces. The sharp market price decline by 30 percent made an additional tariff reduction on top of the original degression rate necessary. The
3,000
2,000
4,000
5,000
6,000
7,000
8,000
New
ly In
stal
led
Capa
city
(MW
p)
0
1,000
2001 2002 2004 2006 2008 2010 20122000 2003 2005 2007 2009 2011 2013

109
Sustainable Energy Strategy for Iran Renewable Energy Sources
feed-in tariff was reduced by 11 percent for new solar farms on land converted from other uses (conversion areas) and by 16 percent for new roof installations.
The 2014 amendment further decreased the solar feed-in tariffs and introduced man-datory direct-to-market pricing. Furthermore, all new installations will be charged for the electricity that operators produce and consume themselves; this is done in order to support the development of the electricity grid. PV development was (in addition to subsidies according to the EEG) also supported by the “100,000 Roofs” program, which made low-interest loans available for small-scale investors (BMU, 2009).
Macroeconomic Effects of the EEGGerman PV and wind turbine manufacturers are among the leading players in the inter-national renewable energy markets. Research and development are other fields in which German companies and institutes have gained a major position in international competition. Exports on global markets are increasing steadily, and today German companies are making a large share of their revenue internationally. This also means that German industry has required more workers, as non-German – international – market development creates jobs in Germany.
The renewable energy industry indeed created many jobs in the last decade. This is true for all types of renewables (Figure 5.7); however, the number of jobs has been decreasing in recent years. This is mainly due to the increased production in other (developing) coun-tries. Nevertheless, German manufacturing companies with high R&D capacities are still strong players nationally and internationally. The major job engines have been the wind power, the biomass and the solar energy industry (BMU, 2013).
Figure 5.7. Job Growth of the German Renewable Energy IndustrySource: BMU, 2013
450,000
400,000
350,000
300,000
250,000
200,000Empl
oyee
s
150,000
100,000
50,000
02004 2007 2010 2011 2012
Wind EnergySolar Energy HydropowerGeothermal Energy, Ambient Heat
Biomass
Publicly Assisted Research and Administration

110
Sustainable Energy Strategy for IranRenewable Energy Sources
5.4 Renewable Energies in Iran
Investment in renewable energies in an energy-rich country may not sound like an optimal economic decision, as the country can capitalize on its vast conventional energy resources to develop the economy. In addition, renewable energy technologies are still in their infancy, and therefore in some cases they are expensive and unaffordable in developing countries. Notwithstanding the facts above, developing countries, including energy-rich countries, will likely benefit from investing in renewable technologies. The rationales for investing in renewable energy programs can be summarized as follows:
Demand for energy in Iran as a developing country is rapidly rising. The energy scenario study in Chapter 3 shows that under the BAU scenario, the total demand for energy in Iran will almost double by 2030. The increasing trend of domestic demand for fossil fuel would also lead to an exhaustion of conventional energy sources, particularly oil, in a few decades, changing Iran from an oil-exporting to an oil-importing country. Therefore, although energy security may not be an urgent problem for Iran, it will soon be an issue of importance.There is a long-term economic benefit in investing in renewable energy projects in Iran. Table 5.3 compares the input costs of conventional power plants versus renewable energy power plants. The main benefit arises from the fact that cost-free inputs such as solar radiation or wind will substitute oil and natural gas, whose world market prices are positive. Power plants using renewable energies will require higher capital costs, but are less labor intensive than those using conventional oil or natural gas. The cost of capital will also decline as the technology is rapidly improving. Therefore, in sum, it is beneficial to construct new power plants based on renewable energy and to use the savings for investment in R&D for renewable energy technologies.
Table 5.3. Cost Structure in Conventional Versus Renewable Energy Power PlantsPower Plant Type Inputs
Fuel Capital Labor TechnologyConventional + +Renewable Energy + +“+” sign shows relatively higher intensity
The application of renewable energy will decrease emissions significantly. This is partic-ularly important for Iran, as the country is rapidly approaching an industrialization phase with increasing demand for energy and rising water and air pollution. As Chapter 3 shows, the level of CO2 emissions and other pollutants in the BAU scenario will double in Iran by 2030, but it increases only slightly in the Efficiency scenario and even decreases in the Combined scenario. Reducing emissions will decrease direct costs on measures to reduce pollution and to protect the environment as well as decreasing in-direct external costs such as healthcare costs. Renewable energy technologies are diverse, but growing fast. Scientific research on the topic is at the forefront of research agendas in universities and research institutes across

111
Sustainable Energy Strategy for Iran Renewable Energy Sources
developed nations. The outcome of such research will help bring down the cost of capital and equipment and increase efficiency, particularly in wind and solar energy technologies. Several developing countries, including Iran, have already started producing some parts for wind energy equipment, such as blades and gear boxes, but producing parts more efficiently and, more importantly, producing engines or solar cells are critical – this requires highly skilled labor. Countries like China and India have already success-fully built up their own industries for wind energy turbines and photovoltaics (in the case of China) and have become major players in the market. Investing in renewable energies will encourage investment in human capital and new technologies. This is par-ticularly important for Iran, as the country has a relatively young population structure with a high demand for higher education, and a large supply of labor.
5.4.1 Development Objectives for Renewable Energies Iran intends to acquire technologies pertaining the production of renewable energy re-sources in order to align itself with sustainable development objectives. Studies revealed that, with the development of renewable energy resources, the country would be able to generate as much as 2,000 MW electricity by the end of the Fifth Five-Year Development Plan (2010-2015). According to the objectives set forth in the 20-Year Vision, Iran should become a regional power in terms of the production and use of renewable energy resources by 2025. The objectives envisaged in the plan are as follows:
Electricity generated from renewable energy sources will account for 10 percent of the total electricity generated in the countryEnergy security through diversified energy resources in the energy basketEnvironmental conservation through reduced ecological pollutionImproved policy-making strategies in renewable energy resourcesFinancial support for research and development to increase technical knowledge and to improve the competitiveness of renewable energy sources vis-à-vis other sources of energy.
5.4.2 Renewable Energy PotentialsThe share of renewable energy in producing electricity is currently about 3 percent, but has the potential to increase to 38 percent by 2030. The share could even go higher – to 57 percent – if energy is used more efficiently in all sectors; this would reduce the overall demand for electricity. Iran’s Renewable Energy Headquarters has issued a report pro-posing the following targets for using renewable energy sources:
Wind: 6,500 MWHydropower: 90 MW in 15 yearsSolar and PV: 5 MW in independent power generation plants and 30 MW in power generation plants connected to the gridSolar water heaters: 10,000 units Electricity generation: more than 2 MW PVBiomass: 137 MBOEGeothermal: 200 MW in ten years
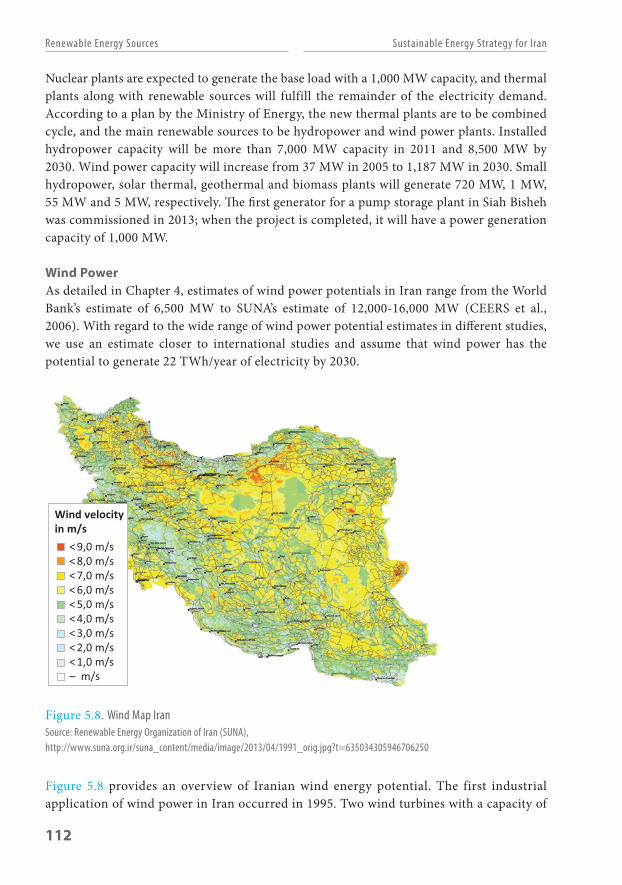
112
Sustainable Energy Strategy for IranRenewable Energy Sources
Nuclear plants are expected to generate the base load with a 1,000 MW capacity, and thermal plants along with renewable sources will fulfill the remainder of the electricity demand. According to a plan by the Ministry of Energy, the new thermal plants are to be combined cycle, and the main renewable sources to be hydropower and wind power plants. Installed hydropower capacity will be more than 7,000 MW capacity in 2011 and 8,500 MW by 2030. Wind power capacity will increase from 37 MW in 2005 to 1,187 MW in 2030. Small hydropower, solar thermal, geothermal and biomass plants will generate 720 MW, 1 MW, 55 MW and 5 MW, respectively. The first generator for a pump storage plant in Siah Bisheh was commissioned in 2013; when the project is completed, it will have a power generation capacity of 1,000 MW.
Wind PowerAs detailed in Chapter 4, estimates of wind power potentials in Iran range from the World Bank’s estimate of 6,500 MW to SUNA’s estimate of 12,000-16,000 MW (CEERS et al., 2006). With regard to the wide range of wind power potential estimates in different studies, we use an estimate closer to international studies and assume that wind power has the potential to generate 22 TWh/year of electricity by 2030.
Figure 5.8. Wind Map IranSource: Renewable Energy Organization of Iran (SUNA), http://www.suna.org.ir/suna_content/media/image/2013/04/1991_orig.jpg?t=635034305946706250
Figure 5.8 provides an overview of Iranian wind energy potential. The first industrial application of wind power in Iran occurred in 1995. Two wind turbines with a capacity of
< 9,0 m/s
Wind velocityin m/s
< 8,0 m/s< 7,0 m/s< 6,0 m/s< 5,0 m/s< 4,0 m/s< 3,0 m/s< 2,0 m/s< 1,0 m/s– m/s

113
Sustainable Energy Strategy for Iran Renewable Energy Sources
500 kW were purchased and installed in the province of Gilan. Currently, Iran has five wind farms with a total capacity of 128 MW. The wind farms are located in two provinces: Gilan (in the north) and Khorasan (in the northeast). The province Gilan is located in the north of Iran and is south of the Caspian Sea. There are two additional areas certified as having sufficient potential for wind power use: Manjil and Rudbar. Those areas are located in the “Manjil wind channel,” which has an average annual wind speed of 7 to 11 m/sec. In Manjil, a wind farm with a total capacity of 101.68 MW has already been commissioned. Another potential area for using wind power is in the Binalood mountain range near the city of Naishabur. A wind farm with a total capacity of 28 MW is already in operation in this area as well. The first wind farms in Iran were erected in cooperation with foreign companies. In this way, Iran has gained knowledge on how to design wind farms, including site selection, layout of the turbines, mechanical and electrical design and independent installation of wind turbines.
Saba Niroo was established as the first and only manufacturer of wind turbines in Iran – and in the entire Middle East – in 2000. It operates under the license and supervision of Vestas Wind Systems, a Danish firm. The Iranian manufacturer produces turbines with a capacity of 300-660 kW. Since the introduction of the Iranian feed-in tariff system, private investment has become more attractive in the wind energy sector. The government has al-ready issued licenses for 20 wind farms, with a total capacity of 712 MW, owned by private investors. These investors are facing problems in purchasing wind turbines with higher capacity, as Saba Niroo is unable to provide turbines with a capacity of more than 660 kW (Rasuli Hamed, 2010).
BiomassVarious estimates regarding biomass energy sources in Iran exist, but without a rigorous study, it is hard to rely on them. The scenario studies in Chapters 3 and 4 estimate 0.018 TWh/year of electricity generation by biomass in 2030.
GeothermalAlthough geothermal primary energy sources are relatively well investigated in Iran, there is still a lack of knowledge on their economic and technical potential. However, since geo-thermal “hot spots” are far from inhabited areas, heat cannot be used. Therefore it is likely that the only option remaining for utilization of geothermal energy is electricity generation.
Talebi (2004) from SUNA estimates the nationwide geothermal electricity potential to be in the range of 5,000 to 6,000 MWel. As geothermal energy can be used for base load electricity on a 24/7 basis, full load hours (FLH) are high. Assuming 7,500 FLH, about 37-45 TWh electricity could be produced per year. As mentioned in Chapter 4, it is expected that by 2030, geothermal sources will be able to produce 5.25 TWh/year of electricity.
Solar IrradianceSolar irradiance is very high in Iran and about 2,800 hours per year are sunny enough to be utilized (Atabi, 2004). While the DLR (2005) has found a direct normal irradiance of

114
Sustainable Energy Strategy for IranRenewable Energy Sources
2,200 kWh/m2/year, Samimi (1994)’s country-wide analysis of irradiance concluded that, on 80 percent of Iran’s territory, solar irradiation would be between 1,640 and 1,970 kWh/m2/year. Geyer (2007) presented a maximum direct normal insolation in Shiraz of about 2580 kWh/m2/year. According to the IPDC (2001), solar insolation in Yazd is in the region of 2,500 kWh/m2/year. Based on the assumptions on the capacity installation rate and the full load hours in the scenario analysis, for our scenario calculation it is estimated that 94 TWh/year electricity will be produced by CSP and 0.007 TWh/year by photovoltaic generation.
HydropowerHydropower produces less than 12 TWh/year of electricity and therefore its contribution to energy production is not significant in Iran. However, there are plans to increase hydro-power’s share in the electricity mix. The World Energy Council (WEC) and the DLR estimate Iran’s hydropower potential to be 48 TWh/year (DLR, 2005; WEC, 2001), and the scenario analysis estimates that large hydropower sources will contribute to electricity generation by producing 17.3 TWh/year.
Renewable electricity performance indicators by the DLR (2005), which define the repre-sentative average renewable electricity yield of a typical facility in Iran, are summarized in Table 4.6 in Chapter 4. Furthermore, Table 4.7 shows the economically viable renewable electricity supply side potential for Iran (DLR, 2005).
5.4.3 Renewable Energy OrganizationsThere are a number different organizations dealing with renewable energy development in Iran. Recently, the Iranian Deputy President for Scientific and Technology Affairs set up the “Renewable Energy Headquarters” to coordinate all activities concerning renewable energies. Multiple governmental organizations and ministries involved with the Iranian renewable energy sector include:
The Oil Industry Research Academy; Ministry of OilThe Renewable Energy Organization of Iran (SUNA); Ministry of EnergyThe Science and Industry Research Institute; Ministry of Science, Research and TechnologyThe Environmental Protection Organization, Vice PresidentThe Iranian Fuel Conservation Organization (IFCO); Ministry of Oil
The Oil Industry Research Academy has been chosen as the secretariat for the headquarters committee and seven sub-committees have been established for different technologies (hydropower, wind power, wave energy, hydrogen, solar energy, biomass and geothermal). The Oil Industry Research Academy, which was established in 1960, conducts research on oil and its derivatives, but has recently engaged in areas such as fuel quality, alternative fuels and additives, energy consumption optimization, waste solutions and pollution reduction. The academy’s main research area has recently turned toward renewable energies, particularly hydrogen.
The Renewable Energy Organization of Iran (SUNA) was set up in 1995 aiming to develop applications of the energy generated from renewable energy resources. SUNA’s

115
Sustainable Energy Strategy for Iran Renewable Energy Sources
main objectives are the stabilization and diversification of energy resources by expanding existing capacities and reducing the long-term costs of energy generation and protecting the environment. In order to achieve its mission, SUNA is charged with implementing the following principles:
Active participation in drawing up the “National Energy Plan” and other strategies concerning renewable energy sources in the countryActive participation in the creation and management of guaranteed markets for producers of renewable energy sourcesConducting feasibility studies for various types of renewable energy sourcesCreating communication between Iranian and international experts and organizations active in the fields of renewable energy sourcesIdentifying, attracting and channeling international sources toward Iran’s renewable energy sectorSetting up new strategies to develop technologies relating to renewable energy sources and supporting research centers active in the related fieldsMonitoring the latest developments in the field of renewable energy sources and communicating these findings with the research centersPreparing the groundwork for transferring, attracting and exporting the relevant technologiesSetting up criteria and rules for protecting production and R&D activities related to renewable energy sourcesEncouraging the use of renewable energy sources
The Science and Industry Research Institute, which is affiliated with the Ministry of Science, Research and Technology, has been working on renewable energy sources since 2004. The Institute’s main research focus has been on solar energy.
The Iranian Fuel Conservation Organization (IFCO), which was established in 2000, has been developing standards for energy use in the industrial, the transportation and the household sectors. It also provides technical and financial support to projects that facilitate higher levels of efficiency in energy use. The organization has also supported projects dealing with energy generation from renewable sources. Some recent activities by the organization include the following:
Production and installation of 15,000 residential solar water heaters Production and installation of 1,000 public solar water heaters (rural solar baths)Feasibility studies for the production of bio-ethanolFeasibility studies for bio-diesel fuelStudies on wind energy.
The Ministry of Energy has also carried out the following activities concerning renewable energy sources:
Assessing the country’s status on renewable energy resources in 2007Laying out a roadmap for renewable energy resources in IranStrengthening international cooperation in the field of renewable energy resources.

116
Sustainable Energy Strategy for IranRenewable Energy Sources
5.4.4 The Renewable Energy Development ActIn 2001, the Iranian parliament passed an important law to support private sector investment in renewable energy sources. Under Article 62 of the “Law of Government’s Financial Regulation” passed on 19 February 2001, the Ministry of Energy became obliged to purchase electricity produced by public and private power plants at guaranteed prices. The feed-in rates required by the law were 650 rials (US$ 0.067) per kWh for peak and regular times, and 450 rials (US$ 0.047) for off-peak times (for a maximum of four hours per day). SUNA was designated as the organization responsible for signing contracts with investors, providing services and monitoring the development of the renewable energy industry.
On February 24, 2005, the Ministry of Energy provided instructions on how to imple-ment Article 62 (see Appendix B for details), and on November 23, 2008, the government adjusted the feed-in rates to reflect increasing investment costs due to inflation. These rates doubled from 650 rials (US$ 0.067) per kWh to 1,300 rials (US$ 0.13) per kWh during peak consumption periods and from 450 rials (US$ 0.047) to 900 rials (US$ 0.094) during off-peak periods. The new rates were implemented between March 2008 and March 2009 (year 1387 according to the Iranian calendar), and have been subject to revisions in fol-lowing years.
The rate revision is based on inflation and changes in the exchange rate (rial to US dollars). The formula assigns weights to inflation and exchange rate movements, but allows investors to choose their own weights. The rate revision formula also discounts the adjustment factor by 2 percent each year to encourage innovation and technological advancement to reduce costs. Specifically, the rate adjustment is based on the following formula:
i=(Pn/Po)α(En/Eo)1-α /1.02t
where i is the rate adjustment, P is the consumer price index, E is the exchange rate, n and o are the number of periods and t is time. α and (1-α) are the weights assigned to the respec-tive changes in prices and exchange rates. The formula applies to current production. The law does not stipulate any explicit time period for the contracts; it only mentions long-term contracts. The Ministry of Energy (through SUNA) and investors negotiate the duration of the contract, which depends on the type of technology and the lifetime of the plant.
5.4.5 Power Generation Plant ApplicationsWind and solar are the most important and viable renewable energy sources in Iran. As mentioned previously, it has been estimated that in 26 areas of the country, as much as 6,500 MW electricity can be generated by wind (assuming an efficiency of 33 percent). As a result, wind energy projects in Iran are well ahead of all other alternative renewable energy sources. Up until 2010, there had been applications for wind power generation up to 2,000 MW.
Solar irradiance is also very high in Iran with central Iran appearing especially promi-sing, as the highest irradiance figures are found in this area. According to the IPDC (2001), solar insolation in Yazd is in the range of 2,500 kWh/m2/year. There have been

117
Sustainable Energy Strategy for Iran Renewable Energy Sources
some applications to develop solar energy in Iran, but in light of the immensity of the potential, this area is still highly unexplored. Unsurprisingly, the most important applica-tions for power plants have been drawn up for projects in central Iran, in Shiraz and Yazd, where tender documents for a solar thermal power plant are being prepared.
Another important renewable energy resource in Iran is biomass. Four projects with a total capacity of 26.1 MW have been approved and are underway. Three plants with a total capacity of 13.6 MW have signed guaranteed purchasing contracts with SUNA. In addition, there are feasibility studies for three more plants with a total capacity of 50 MW.
Finally, there are also several applications for small hydropower plants in different areas of the country. So far, there have been seven applications for small hydropower projects, which represent a capacity of 30 MW.
5.4.6 SWOT Analysis of the Renewable Energy Organization in IranA recent study conducted by Moradzadeh (2009) analyzes the strengths, weaknesses, op-portunities and threats (SWOT) for the Renewable Energy Organization (REO) in Iran. This section summarizes the findings from this analysis. The results are based on two questionnaires completed by a sample of 155 experts in the energy and renewable energy sectors. The first questionnaire asked 30 questions about the strengths, weaknesses, opportunities and threats; the second questionnaire asked experts to assign weights to SWOT cases and to rank the factors listed in the first questionnaire. The score results are summarized in two matrices: an Internal Factor Evaluation (IFE) and an External Factor Evaluation (EFE).

118
Sustainable Energy Strategy for IranRenewable Energy Sources
A list of SWOT of the REO is presented as follows: Strengths
Skilled labor Equipment and facilitiesMaintenance capabilitiesMarketingCapacity in installation, construction and operation of renewable energy systemsHigh interest and expertise among REO managers
OpportunitiesEducational programs to disseminate knowledge about renewable energy in IranPrivate sector involvement in renewable energy in IranInternational cooperation and participation in renewable energy investments in IranIran’s favorable geographical position in terms of renewable energy sourcesWorld Bank grants for renewable energy projectsTaxes on fossil fuelsThe security of renewable energy systems
WeaknessesHigh investment costs of renewable energies in IranLack of R&D Lack of financial resourcesLow ability in raising capital High cost of grid connectionLow level of human capital in REOLack of a scientific system and procedures for the decision-making process in REOLack of innovation High price of renewable energies in Iran
ThreatsLack of subsidies for renewable energiesTechnology transfer problemsOld technologies Lack of strategic planning for a renewable energy program in IranLack of legislation for renewable energy planning Lack of government fiscal policies to support renewable energy programsLack of consensus among policy-makersLack of acceptance of renewable energy by consumers
A score was assigned to each factor within the IFE and EFE matrices, and a final score was calculated given appropriate weights. This final score ranges from 1 to 5. A score that is equal to or less than 3 means weak performance of the organization, and a score greater than 3 means satisfactory performance.
The final score in the IFE matrix is 3, which shows that the Renewable Energy Or-ganization is a weak organization internally. The final score in the EFE matrix is greater than 3, which indicates that the organization possesses favorable external conditions and opportunities.
Using the SWOT matrix, four strategies for renewable energy development including strengths-opportunities (SO), strengths-threats (ST), weaknesses-opportunities (WO), and weaknesses-threats (WT) are obtained. The list of strategies is as follows:ST Strategies:
ST1: Plans to use local technologyST2: Comprehensive planning and managementST3: Human capital management ST4: Activities to change fiscal policies

119
Sustainable Energy Strategy for Iran Renewable Energy Sources
ST5: Public education and awareness of renewable energiesST6: Marketing for renewable energies
WT Strategies:WT1: Fiscal planning and financial management for renewable energy programsWT2: Plans for technology transfer and technology localization WT3: Fiscal and monetary policies for renewable energy developmentWT4: Investment in human capital for renewable energy developmentWT5: Preparation of a strategic plan for renewable energy development in Iran
SO Strategies:SO1: Education and training programs in the renewable energy organizationSO2: Coordination, merger or cooperation among different renewable energy organizationsSO3: Use of international quality control programs such as EFQM in the Renewable
Energy OrganizationSO4: Application for World Bank grants for renewable energiesSO5: Training on the maintenance of renewable energy equipmentSO6: Management of existing human capital
WO Strategies:WO1: Developing private-public participation projects in renewable energiesWO2: Reductions in project costsWO3: Investment in R&DWO4: Management and investment in human resources of the REO.WO5: Joint renewable energy research projects with other domestic and international
organizationsWO6: Financial management of REOWO7: Encouragement of innovation in renewable energy projects with the cooperation
of international organizationsWO8: Application for international loans for renewable energy investments in IranWO9: Education programs to encourage innovation WO10: Use of a scientific and systematic decision-making process in REO
5.4.7 Renewable Energy Challenges in IranAlthough a legal framework and some financial support exists for the development of re-newable energy in Iran, progress is rather slow. By enacting the feed-in tariff law, the Iranian parliament has demonstrated that developing renewable energy sources is important to Iranian policy-makers. However, although this legislation is similar to renewable energy development laws enacted in more than 60 other countries (GTZ, 2009), it has not been very effective. It is evident that laws by themselves cannot be effective if the environment for their implementation is not supportive and law enforcement is not strong. The main challenges for renewable energy development in Iran can be identified as follows:

120
Sustainable Energy Strategy for IranRenewable Energy Sources
One of the main barriers for the development of renewable energy sources in the world and in Iran is the low price of conventional energies relative to renewable energies. In Iran, this factor is even more pronounced, as the country is rich in conventional resources and energy prices have been subsidized for a long time. Any investment in alternative energy sources with the subsidized energy prices would not make economic sense and, therefore, not be welcomed by local and international investors.
The electricity market is subsidized on both supply and demand sides. On the supply side, fuel costs are kept low by government subsidies on oil and natural gas for power plants. On the consumption side, electricity prices are subsidized for businesses and households. The low input price along with a high transmission and distribution loss (17 percent) contribute to low efficiency rates in power plants, which makes the actual price of electricity (and therefore the subsidy) much higher than international standards.
As the SWOT analysis shows, there is no consensus among authorities and policy-makers about the importance of investment in renewable energy sources, and therefore a rigorous plan for renewable energy is lacking. Opponents of renewable energy subsidy programs argue that, since Iran has abundant fossil energy resources, investment in renewable energy is not a priority. They also argue that, since renewable energy tech-nology is still immature, it will be more beneficial to wait until the technology reaches a stage where it is able to compete with conventional energy resources.
Transaction costs, red tape and uncertainly with regard to policy change and imple-mentation increase risk premiums for investment in renewable energy projects; this diminishes the incentives provided by Iran’s feed-in law. Unfortunately, developing countries, including Iran, do not have a good record in governance indexes as reported by the World Bank. The 2008 Governance Report shows that Iran is at the bottom part of the list, ranking 25th from the bottom among 215 countries in various indexes such as government effectiveness, the rule of law, corruption control, regulatory quality, and voice and accountability (Kaufmann et al., 2009)
The feed-in-tariff law is a positive step towards attracting private sector investment in renewable energy. However, it has many shortcomings. For instance, the guaranteed feed-in price for electricity is subject to government approval and therefore increases investment uncertainty. Furthermore, law enforcement mechanisms and penalties for violating the law by government agencies are lacking, making the law less effective.
Sanctions by the UN and by the US have affected international trade and financial transactions with Iran, which has made technology transfer and financing renewable energy projects more difficult and expensive. The sanctions have also limited foreign investment in different sectors, including renewable energy (see the SWOT analysis).

121
Sustainable Energy Strategy for Iran Renewable Energy Sources
The recent deal on Iranian nuclear development between Iran and the 5+1 group, which entails the removal of international sanctions, is expected to boost international trade and facilitate the transfer of technology, including renewable energy technologies.
5.4.8 Improving the Feed-in Tariff SystemBesides its large fossil fuel resources, Iran also possesses huge renewable energy resources. The country has great potentials for wind, solar and geothermal energy use. Nevertheless, renewable energies currently make up only 3 percent of electricity production. As menti-oned before, however, the scenarios outlined in this book show that renewable energy could represent 38 percent of Iran’s generation by 2030. This share could go even higher – to 57 percent – assuming that energy is used more efficiently in every sector, leading to decreased demand for electricity. The Iranian energy and industrial sector could also be-nefit from the development of renewable energy. The country can invest in renewable energy sources and allocate oil and natural gas resources for export. For each unit of fossil energy saved domestically – either via substitution by renewable energies or energy effi-ciency – Iran can generate high revenues through fossil fuel energy exports in the interna-tional markets, increasing its national income. Furthermore, for remote areas isolated from the national grid, renewable energy technologies can deliver cheaper and cleaner supply solutions than conventional systems.
To improve the development of the renewable energy sector in Iran, various measures may prove effective:
Energy policy reform is necessary for Iran, as energy prices are much lower than their actual costs. The current system has led to the inefficient use of energy in all sectors of the economy, increased emissions, and to reduced incentives to invest in energy gener-ation. When energy prices reflect their actual costs, the measures taken to support development in renewable energy sources will be more effective.
The feed-in law currently sets up a guaranteed purchasing price for electricity pro-duced from renewable energy sources. Since the inflation rate in Iran is historically high and changes frequently, specifying a nominal price as the supporting price will not be effective. Furthermore, the base price of electricity with which the supporting price is compared is already subsidized and, therefore, does not reflect the actual costs of electricity production. An alternative method, in which the supporting price for renewable energy is specified as a proportion of actual production cost of electricity produced by conventional sources, would be more effective. In addition, setting up a mechanism through which prices would be guaranteed, quoted in a hard currency and in effect for a long period regardless of changes in government is necessary to reduce uncertainty. In addition, the feed-in tariffs should be set at levels that would cover the actual investment costs and would provide a competitive rate of return on investment.
The feed-in tariff law puts all the grid connection responsibility on renewable energy producers. Since the grid connection is a critical component of electricity generation

122
Sustainable Energy Strategy for IranRenewable Energy Sources
and transmission, its details and responsibilities should be specified clearly. Otherwise, this will add to uncertainties with regard to the purchasing program, making invest-ment in renewable energy projects less attractive.
According to the current feed-in tariff regulations, the grid administrator determines how much electricity would be purchased from renewable energy producers in an hour or a day. If an electricity generator produces more than the amount set by the grid ad-ministrator, it is fined. Although this arrangement may be necessary for the smooth performance of the grid, it also raises uncertainty regarding a renewable energy plant’s revenues. To alleviate this problem, the grid can give priority to renewable generating plants.
In addition to the purchase price scheme through the feed-in tariff law, there are other support arrangements for renewable energy development. For instance, a mandatory market share policy leads to a renewable portfolio standard by placing an obligation on suppliers of power to source a proportion of their power from renewable energy gen-eration. This policy can also be accompanied by tradable renewable energy certificates, similar to an emission trading program, so that suppliers can purchase renewable energy or renewable energy certificates. Through this policy the energy sector would produce a certain share of the energy by renewable energy sources in a specified period. While the feed-in tariff scheme is likely to increase market scale and encourage technological change, the mandatory market share program stimulates competition (Cherni and Kentish, 2007). Nevertheless, as Section 2 of this chapter notes, international comparisons show that, so far, feed-in systems have outperformed alternative approaches with regards to market growth as well as production costs for renewable electricity.
Furthermore, the government can provide a variety of other instruments of financial support and incentives to renewable energy producers. Allocating loans at discounted rates is crucial, as the upfront investment costs are rather high in renewable energy projects. Lowering tariffs on renewable energy production equipment, funding research and development, and reducing taxes on renewable energy producers would also facilitate growth in the sector. To avoid political cycles and changes in policies (which also increase uncertainties), the government could establish a renewable energy development fund to support activities in the sector, including the construction of renewable energy projects in different areas. It is critical that the management of the fund be depoliticized by allocating balanced voting rights to non-profit and non- governmental organizations within the board governing the fund.
The feed-in tariff law should also include a specific target for the proportion of renewable energy in terms of total electricity generation, a time frame in which the target should be reached, details of the government support scheme, and legal enforcement and penalties.

123
Sustainable Energy Strategy for Iran Renewable Energy Sources
As with any new technology, a high level of human capital is required for a country to adopt the technology and to catch up with the new developments. Therefore, if Iran plans to invest in renewable energy resources, it must also invest in its human capital through education and training in renewable energy technologies. The integration of renewable energy courses into a regular curriculum in vocational and formal education systems at different levels can help develop the knowledge and skills required for the development of renewable energy in the country.
There are different organizations working on renewable energy development, but, as the SWOT analysis indicates, their activities including research, production, construction, regulations and funding are not well coordinated. To make their efforts and decisions more efficient, renewable energy development activities need to be coordinated by a central government agency with a high level of authority. For instance, the Renewable Energy Organization of Iran (SUNA), which is affiliated with the Ministry of Energy, can be supported and strengthened by directly linking it to high-level decision-making bodies.
While new technology for renewable energy is developing rapidly in advanced econo-mies, countries that are behind need to obtain this technology through either foreign direct investment (FDI), which has proven to be helpful in technology transfer and knowledge spillover, or an active relation with scientific and research institutes. Iran also needs to develop a plan to facilitate FDI and effective communication with scientific and research institutes across the world, particularly in the area of renewable energy technologies.

124
Sustainable Energy Strategy for IranRenewable Energy Sources

125
6 Policies to Promote Energy Efficiency
6.1 IntroductionIn theory, the market ensures the efficient allocation of resources and maximum benefit for society. In certain cases, however, the market does not necessarily function perfectly, creating inefficient levels of production and consumption. The most serious cases of market failure occur when firms have market power to manipulate prices; when external costs or benefits are involved but not reflected in market prices; and when information is lacking. When the market fails, public intervention can make resource allocation more efficient. The energy sector is typical for some of the major causes of market failure. For instance, energy production is usually concentrated, allowing large producers to influence the mar-ket. Energy production and consumption also place external costs on the environment, which are not included in the business and consumption plan. A lack of information is another factor in the energy market’s difficulty to achieve an efficient outcome.
In this chapter, we start by reviewing some of the barriers that prevent the market from allocating resources efficiently. We then proceed to analyze policies that may help improve energy efficiency in general, as well as in cases such as Iran and Germany, which are taken as examples of developing and developed countries. We focus on policies that may help overcome barriers in construction and appliance markets.
6.2 Energy Efficiency Challenges
6.2.1 Widespread Deployment of Efficient TechnologyOne of the major drivers of energy consumption is the technical characteristics of the capital (appliances, buildings, vehicles, etc.) that uses energy. Improving energy efficiency therefore involves changing the current inefficient technology to a more efficient techno-logy. However, changes in technology require investment and take time. Moreover, house-holds and firms may be unable to invest in capital with new technology due to their lim-ited budgets and liquidity constraints, particularly in the absence of an effective financial market.
The relationship between capital and energy services can be elaborated further as follows. What consumers really need are useful energy services such as warm meals, com-fortable rooms and good lighting, and not kilowatt-hours. The use of energy is only a means to this end. Energy must, therefore, always be used in association with specific capital (technical equipment) to provide the desired service, and this technical equipment, or the use thereof, can be inefficient or efficient. For example, students need a light intensity of about 300 lux for their desks in the classroom. The desired useful energy service is “good

126
Sustainable Energy Strategy for IranPolicies to Promote Energy Efficiency
lighting”. This service can be provided by either a simple incandescent lamp, a fluorescent lamp, a fluorescent lamp in a better luminaire, or other systems like LED. The efficiency of lighting systems is not only dependent on the luminous flux of the lamp, but also on the efficiency of the luminaire (among other things).19 The lighting level (energy service) of the three solutions might be the same, but the electricity consumption and the costs of the service (good light) will be very different.
There are many more efficient solutions than using a traditional bulb. The traditional incandescent lamp can be substituted by more efficient alternatives, which provide the same light intensity while consuming less electricity. However, many incandescent lamps are still used today in spite of the fact that more efficient solutions are usually more cost- effective (for example, the energy savings are 30 percent for a halogen lamp Eco-Classic 50 (20 watt), 80 percent for a compact fluorescent lamp (CFL, 8 watt) and 80 to 90 percent for an LED (7 watt)).
To calculate the costs of the energy service, we use the costs for producing and delivering electricity to consumers. In Germany, this figure is about € 0.10 per kWh; the societal cost for 10,000 hours of lighting service is € 70 when using incandescent lamps and € 15 if the same lighting service is provided by CFLs.20
Table 6.1. Costs and Energy Savings of Various Lighting TechnologiesIncandescent Lamp CFL
Power (in watts) 60 11Price (in Euros) 1 4Lifetime of Lamp (in h) 1,000 10,000Total Cost over 5,000 Hours of Use (incl. Investment) (in Euros)
35 9.5
Total Cost over 10,000 Hours of Use (incl. Investment) (in Euros)
70 15
Energy Savings over Lifetime (in kWh) 0 490Cost Savings over Lifetime (in Euros) 0 55
Note: The cost of electricity production and transportation is assumed to be € 0.1 per kWh (societal perspective) Source: authors’ calculation
19 Luminous efficacy is the luminous flux of a lamp in relation to its power consumption. It is expressed in lumens per watt (lm/W). For example, a 60 W incandescent lamp produces approximately 850 lumen or 14 lm/W, and a 20 W compact fluore-scent lamp (CFL) generates approximately 60 lm/W, and in total about 1,200 lumen. This means that a CFL is about five times more efficient than an incandescent lamp. In other words, the same energy service can be provided with only one fifth of the energy. With an LED lamp, the same luminous flux can be achieved with 8 watts – which means that LED technology is eight times more efficient than an incandescent lamp.
20 Household consumers in Germany had to pay about € 0.25 to 0.28 per kWh in 2014 (price per delivered kWh, not including the fixed price component for reading the meter and handling the contract). Thus the energy cost savings for a household generated by using a CFL are more than twice the value shown in Table 1.

127
Sustainable Energy Strategy for Iran Policies to Promote Energy Efficiency
Table 6.1 shows that the energy service “good lighting” can be delivered at significantly lower cost when a CFL is used. In other words, if electricity providers delivered “good lighting” using a CFL, thus reducing electricity consumption, the economic cost for society would decline. The advantage to the economy as a whole could be split among the energy service companies and their customers. Figure 6.1 shows the cost structure and efficiency in the energy market. Marginal costs rise in line with production, because the most cost-effective power plants are built at the best sites first, and limited resources will cause the cost per kWh to increase for plants built later. The average cost is U-shaped: it declines with output up to a point (least-cost minimum), after which it will rise unless the produc-tion plant is expanded. The cost of efficiency rises, with the level of efficiency defined as lower energy consumption by the plant (shown on the horizontal axis from right to left). Point x represents the current level of energy use with the cost of efficiency lower than the cost of supply.
Figure 6.1. The Economic Optimum of the Total Costs for Energy ServiceSource: Hennicke, Seifried 1996
At point x (today), there is a high potential for energy efficiency. The more this potential is used, the more the costs per saving an additional kWh will rise. Hence the cost of effi-ciency curve increases (from right to left) as the efficiency potential is increasingly used. The least-cost minimum point is marked by the same gradient of the two curves; the average cost curve has its minimum. In theory, this would be the optimal combination of energy supply and efficiency efforts (not including external costs). If the external costs of fossil fuels and nuclear power plants are included in the calculation, the optimal point for the combination of electricity and saving technology will shift to the left. This means that
Costs
Supply of energy (x)
Least-Cost-Minimum
Costs ofEfficiency
Total Costsincl. (- - -) andexcl. (–––)external costs
Costs ofSupply
x (today)x (climate)
x(Min)(including external costs)
x(Min)(excluding external costs)

128
there should be more investment in efficient technologies instead of building new power plants. However, Germany and other countries are a long way from the optimum point. In other countries such as Iran, where prices for electricity and energy carriers have been heavily subsidized for a long period, the potential for cost-effective savings is even higher if energy prices reflect the actual costs.
This situation is not only limited to the power sector. There is also a huge, untapped saving potential in the building and transportation sectors. For this reason, national energy policies should attempt to close this gap by introducing suitable policy instruments. Policies that remove financial barriers would enable energy efficiency targets to be met. Examples of such policies include subsidizing the purchase of new capital goods or re-moving old capital goods; providing low-interest loans; and reducing the price of efficient capital goods by subsidizing producers of high-efficiency capital appliances, buildings and machinery.
6.2.2 Energy SubsidiesEnergy consumption, similar to other goods, is primarily a function of energy prices. Given other factors such as income, consumers increase their energy consumption as its price decreases relative to other goods, and vice versa. Since energy is used along with physical capital, demand for energy also depends on the demand for capital and its char-acteristics, hence derived demand. The traditional problem with fossil fuel energy sources is that their prices do not reflect their actual costs, including the negative external costs imposed on the environment and health. Therefore, even though governments do not provide direct subsidies to energy goods, energy prices are indeed subsidized. In some countries, governments levy taxes on energy goods to avoid the overconsumption of energy and to cover the external costs of energy consumption on society. Most developed c ountries, particularly energy-importing countries such as those in Europe, fall into this category. In North America, although energy consumption is taxed, fossil fuel production is subsidized, making the playing field uneven for energy efficiency and renewable energy production. In some countries, particularly energy-abundant and fossil fuel-exporting countries, energy goods are often subsidized either directly through government budgets or indirectly by keeping domestic prices lower than border prices. In either case, lower energy prices encourage energy consumption and make it uneconomical for consumers or producers to invest in energy efficiency.
Increasing energy efficiency requires the removal of all forms of energy subsidies on the consumption and production of fossil fuels, so that prices reflect both private and social costs and renewable and clean energies are able to compete with non-renewable energies.
6.2.3 Rebound EffectsImproving efficiency in the use of energy may not necessarily lead to a reduction in ener-gy use and CO2 emissions to the same extent. Parts of the savings resulting from efficiency improvements may be used in the form of higher energy consumption. This is the so-called rebound effect, which can be defined as non-realized savings in the use of resources
Sustainable Energy Strategy for IranPolicies to Promote Energy Efficiency

129
relative to potential savings (Schettkat, 2009). Researchers (Maxwell et al., 2011; Madlener, Alcott, 2011; and Santarius, 2012) have identified various driving forces behind rebound effects, such as price-induced and mental/psychological factors.21 The main reason for the-se rebound effects is that energy efficiency measures reduce the cost of services, which gener ates revenues for consumers and can have different micro- or macro-economic effects (Maxwell et al., 2011). In general, there are three sources of rebound effects, namely:
The direct rebound effect occurs when increased efficiency and the associated cost reduction and lower prices for a product/service result in the increased consumption of the product/service. This is also known as the price or substitution effect. The indirect rebound effect occurs when the savings generated from increased efficiency are spent on other energy-consuming goods. The economy-wide rebound effect, or general equilibrium effect, occurs when higher efficiency drives economic productivity, resulting in higher economic growth and consumption at the macro-economic level. Possible changes in the labor market due to changes in productivity, and changes in international trade due to changes in inputs also fall into this category. Figure 6.2 illustrates direct and indirect rebound effects. Replacing old bulbs with
modern energy-saving lamps improves energy efficiency, enabling households to save money. Rebound effects occur if consumers increase their consumption of the product/service, invest the amount saved in other energy-consuming products, such as more light bulbs (direct rebound effect), or other new electricity-consuming appliances (indirect rebound effect). Since products with a higher energy efficiency are often more expensive than standard products, the rebound effect typically occurs when the amount of energy costs saved is higher than the additional cost of the more efficient capital.
Figure 6.2. Direct and Indirect Rebound Effects (simplified illustration) Source: Own figure based on Madlener, Alcott, 2011
21 In this section, we concentrate on price-induced rebound effects.
Technicalimprovementin efficiency
Technical improvementin efficiency
DirectRebound
Effect
Indirect Rebound Effect
Sustainable Energy Strategy for Iran Policies to Promote Energy Efficiency

130
Yu et al. (2013), however, show that significant rebound effects in Beijing only occurred for some end use devices, such as air conditioners, washing machines, microwave ovens and cars. Furthermore, rebound effects are neither generally proportional to efficiency improvements, nor are they very sensitive to relative efficiency improvements. They found that improving the technical efficiency of end use devices continued to be an effective energy conservation measure in Beijing, and suggested further policies that can encourage households to use a minimum amount of energy. In addition, cross-sector collaborative policies are required, covering both domestic appliances and vehicles. In general, the results are in line with Saunders (2013), whose analysis of consumer energy consumption patterns and income levels revealed a clear correlation between income level and energy consumption. Although energy consumption per household generally declined, lower income earners reduced their household energy consumption to a lesser extent than high income earners. He suggests that overall increases in energy consumption are not linked to income improvements (ibid.).
According to various studies (Lechtenböhmer and Nilsson, 2014; Hauptstock, 2013; Schettkat, 2009; Sorrell, 2007), the volume of direct rebound effects is likely to be less than 30 percent for household heating and cooling. The direct rebound effect in personal automotive trans-portation in OECD countries may be about 10 percent, with considerable variation from country to country. For instance, Moshiri and Aliyev (2015) estimate that the rebound effect in passenger vehicle transportation in Canada is 82 percent, which means that a one-percent gain in car efficiency is associated with a 0.36 percent decrease in gasoline consumption. For less developed countries, rebound effects may be substantially higher in the short run (Sorrell, 2007).22 However, Lechtenböhmer and Nilsson (2014) strongly suggest that, given the ex-tremely narrow limitations of natural resources, achieving the most efficient use of energy is a core strategy for enabling all consumers to be supplied with sufficient energy services.
6.2.4 Consumer BehaviorEven though the cost-benefit analysis shows that the use of energy-efficient appliances has a positive net benefit in the long run, consumers may pay little attention to energy effi-ciency when purchasing appliances. Besides budget constraints, other challenges exist on the energy market that hamper efficiency. For instance, consumers and producers may be unaware of energy efficiency measures and policies, and how they might affect their budget. Furthermore, consumers may have insufficient information about energy efficiency labeling and the monetary values of energy-efficient products. In most cases, the energy ex-penditure share of a household’s total expenditure is relatively small, meaning that it may not be worth investing the time and energy to search for and obtain information about energy efficiency programs. Another challenge hampering energy efficiency is the existence of split incentives between the buyers and users of appliances. For instance, landlords (buyers) have little incentive to invest in energy-efficient appliances or buildings because their tenants (the users) are usually responsible for paying the energy bills.
22 This may especially be the case for the 1.6 billion households that have no access to electricity and the 2.5 billion households that rely on biomass as fuel for cooking (Sorrell, 2007).
Sustainable Energy Strategy for IranPolicies to Promote Energy Efficiency

131
6.3 Energy Efficiency Policies; an Overview
6.3.1 A Hybrid Efficiency PolicySince the obstacles to increasing energy efficiency are manifold and differ greatly, we endeavor to explain the situation using two specific products (combined refrigerator-freezer), which are comparable in design and quality, but differ when it comes to their level of efficiency (Figure 6.3).
Let us consider the first appliance, which has an A+++ efficiency rating, and the second A-class appliance, which is approximately 60 percent less efficient than the first. The more efficient appliance consumes 150 kWh each year, compared to 360 kWh consumed by the A-class device. Nevertheless, the more efficient product costs € 200 more than the A-class refrigerator-freezer. This may be why many households opt to purchase the less efficient product. Over the appliance’s lifetime, however, the choice of purchasing the less efficient appliance is more expensive, because the life-cycle costs of the highly efficient appliance are about € 570 less than with the “cheap” A-class appliance. To calculate the life-cycle costs, we assumed an interest rate of 4 percent, an annual 2 percent increase in the price of electricity, and a 15-year lifetime of the appliance. External costs were not included in the calculation.
Figure 6.3. Selling Price and Life-Cycle Cost of Two Different AppliancesSource: Boehm, 2011; authors’ calculation
Market surveys have shown that the share of A+++ cooling appliances in the market is rather small. For this reason, companies tend not to produce more efficient appliances, because there is little demand for them, owing to the higher costs involved – and therefore
400 €
600 €
800 €
1,000 €
1,200 €
1,400 €
1,600 €
-€
200 €
Investment CostIncluding 4%
Interest Cost of Electricityover 15 Years
Savings overlife cycle
A A+++
Sustainable Energy Strategy for Iran Policies to Promote Energy Efficiency

132
the higher purchase price. Even if electricity prices represent the true cost (including the external environmental costs), market forces alone will not lead to the best (most cost- effective) solution. A mix of instruments is therefore necessary to push high-efficient appliances into the market and to change customers’ purchasing behavior. In Figure 6.4, we show the range of policies and measures available to overcome the various barriers in order to safeguard energy and to provide energy services cost efficiently for cooling and other uses.
Figure 6.4. Instruments to Overcome the Market BarriersSource: Seifried, 1992
6.3.2 Policy Approaches to Increase Energy EfficiencyIn this section, we present a number of policies, measures and instruments that could transform the appliance market by increasing the efficiency of energy use.
Figure 6.5 shows the principle of market transformation from a low-efficiency regime towards a high-efficiency regime. Market penetration is sorted by market shares of product classes with different efficiencies (orange: inefficient devices; green: very efficient devices). There is typically a bell-shaped distribution of products: a small share of very inefficient products, a high share of less inefficient products and a small share of highly efficient products. Given this distribution, energy efficiency can be achieved by taking the following three steps:
service package
energy-efficiency ranking of products
information instrumentslack of awareness in energy efficiency
poor market overview
lack of product information
insufficient purchase advisory service
preference of short payback period
previous tariff arrangement
professional training of skilled workers
product labels
linear / time variable tariffs
energy-efficiency rebate programs
energy-related advisory service
correct and proper disposal of appliances (e.g. fridge)
layout of bills
needs
economic and environmentally friendly energy service packages
obstacles instruments targets
efficient service (e.g. cooled food)
Sustainable Energy Strategy for IranPolicies to Promote Energy Efficiency

133
1. Remove inefficient products from the market (LESS). This can be achieved by adopting minimum efficiency standards, levying taxes, providing information and performing tests.
2. Promote highly efficient products (MORE), for example, by introducing incentives such as rebate programs or tax credits, labeling, providing information and education, adopting procurement measures and issuing green certificates.
3. Develop better and more efficient appliances (NEW) by promoting research and development, introducing technology competition schemes that offer cash prizes and other benefits to manufacturers who develop better technology and so on.
Moreover, it may be possible to encourage electricity suppliers or grid operators to make their business strategy more sustainable.
Figure 6.5. Set of Instruments to Foster the Market Penetration of High-Efficiency Appliances Source: Own figure based on Bach, 2009
In the sections below, we explore the instruments available for improving and transform-ing the markets. Although in many cases instruments are listed in one group, they may have an impact on several aspects. For example, an instrument such as an energy tax, which helps remove inefficient appliances from the market, may also increase the share of more efficient products. Best practice examples are described in the boxes underneath the description of the respective instrument.
Remove Inefficient Appliances from the Market (LESS)Minimum efficiency standards: The world’s most frequently deployed energy efficiency programs are minimum energy performance standards (MEPS) and energy performance labeling for appliances and equipment. Minimum energy performance standards define a regulatory minimum of energy consumption. This regulation intends to take the most inefficient appliances or vehicles off the market and to encourage consumers to purchase products with a certain level of energy efficiency (Box 6.1).
Product Performance
LESS - Remove the bad
standards
MORE - Promote the good
Newt
Sustainable Energy Strategy for Iran Policies to Promote Energy Efficiency

134
Box 6.1. Minimum Energy Performance Standards in the EUto Phase Out Inefficient Lamps and RefrigeratorsBased on the Eco-Design Directive 2005/32/EC, the European Union legislated the gradual phase-out of energy-inefficient lamps in households by adopting Regulation 244/2009/EC. This regulation bans inefficient lamps such as non-directional incandescent bulbs and tungsten halogen lamps. It does not affect bulbs with reflective surfaces (e.g. spotlights and halogen down lighters) or special-purpose bulbs such as in ovens, fridges, traffic lights and infrared lamps. The first types of non-clear (frosted) bulbs have been banned from sale since September 2009. Also from September 2009 on, clear bulbs rated at 100 W had to meet higher efficiency criteria. These performance criteria were adjusted to lower wattages, and efficiency levels raised at the end of 2012. Furthermore, the EU has set 2016 as the target year by which all bulbs with an energy rating lower than “B” should be banned.B-class refrigerators have already been banned, and A-class cooling appliances were phased out from the European Market in 2012. However, minimum efficiency standards provide no incentives to produce appliances that are significantly better than the defined minimum. A dynamic minimum standard, such as Japan’s top-runner regulation, could be applied to make the instrument of minimum efficiency standards even more powerful.
Although MEPS and labeling programs can be effective regulatory solutions, the Asia Busi ness Council advises economies that are new to standard-setting and labeling to first introduce a voluntary labeling program (Box 6.2). MEPS should take into account the technical capability of local suppliers. Standards and labels must be revised regularly and upgraded to ensure continuous product improvement (Wuppertal Institute, 2012).
Independent testing institutes: Customers find it difficult to choose which type of goods to purchase due to the existence of asymmetric information in the market. Buyers are unsure which product to choose, and usually have no reliable information about the quality of products. Even dealers may not have detailed information about the quality and, in particular, the energy intensity of products. In many cases, buyers will opt for the cheaper product, which is most likely to have a lower quality and be less efficient than more expensive products. This is why it is very important to provide information about the quality of products, as certified by independent testing institutes. Labeling systems are usually established by independent testing institutes.
Box 6.2. Mandatory and Voluntary Programs in China and MalaysiaChina has the most comprehensive appliance standards and labeling program in the developing world. The program includes:Mandatory minimum energy efficiency standards for 23 types of appliances and equipmentVoluntary endorsement labels for 36 types of appliances, lighting and industrial products
Sustainable Energy Strategy for IranPolicies to Promote Energy Efficiency

135
In Malaysia, eight local motor manufacturers concluded the High Efficiency Electric Motor Agreement in December 2003. It is a voluntary agreement among dealers and importers to promote high-efficiency motors and to eliminate low-efficiency motors from the local market. At the same time, the Association of Manufacturers and Importers of Refrigerators adopted a voluntary program for promoting energy-efficient refrigerators. Both programs are implemented on a voluntary basis (Wuppertal Institute, 2012).
Tax policy: Prices should reflect overall economic costs, including external costs. Since profit-maximizing firms in the market system exclude external costs from their cost calculations, on behalf society, governments should intervene by levying taxes on products with a negative externality. Another public policy is to levy taxes on scarce and non-re-newable resources, while exempting a resource such as labor, which is not fully exhausted in many countries, from tax. Taxing fossil fuel, nuclear energy and other raw materials that have an impact on the environment makes it more expensive to use such energies or materials, making it more competitive to produce efficient equipment and renewable energy. Lower taxes on labor would put more people in work, reducing the social cost of unemployment. The higher prices for energy would give customers and investors an in-centive to seek more efficient products and technologies. The shift in demand for more efficient appliances would encourage producers to change their production lines to higher efficiency products.
Promote Better and Best Products (MORE)Incentives: Rebate programs deployed in the US and a number of European countries have been successful, giving consumers and firms an incentive to use the most efficient appli-ances or lighting systems. The rebate, given only to highly efficient products, may amount to around 10 to 30 percent of investment costs. The aim of the incentive is not to make energy-efficient technology profitable (in most cases, the efficient technology is the most profitable one in the longer term), but to raise awareness of high-efficiency appliances among more investors. This would lead to a transformation of the market, savings in electric-ity, and the development of better products in the long run. The incentive can be offered to consumers, dealers and producers alike (Box 6.3).
Box 6.3. “Break-Up Incentive” for Old Cooling AppliancesFrom September to December 2009, the Austrian government provided incentives to households to exchange old inefficient cooling appliances for A++ appliances (which was the best rated class at the time). Every household that purchased an A++ cooling appliance was given a € 100 cash rebate. Within the given period, 37,000 claims for a rebate were made. The scheme proved successful for households, which managed to reduce their energy costs considerably. The highly efficient appliances use 59 percent less electricity than the scrapped ones. It was also a success for the environment, due to the reduction of
Sustainable Energy Strategy for Iran Policies to Promote Energy Efficiency

136
CO2 emissions and the controlled disposal of waste, including HCFCs and CFCs from the old refrigerators and freezers.What is more, dealers – who are the key contact persons and source of advice for consumers – supported the scheme and announced that they would back further action in this field. As a result of this scheme, the sale of A++ class cooling appliances increased by more than 20 per cent and their market share grew from around 11 to 34 percent (UFH, 2010).
Labeling: Energy performance labeling is one of the most frequently used energy efficiency measures. It is often deployed together with minimum energy efficiency standards. Energy labeling systems provide a good overview of an appliance’s energy costs. The system should be easy to understand, and should show the costs over the lifetime of the product.
The mandatory labeling of electrical appliances exists in more than 54 countries. Some countries, such as Russia, Peru, Uruguay, Indonesia and Taiwan, also have voluntary labeling programs. Most countries focused initially on refrigerators and air conditioners, because these appliances account for a large part of household electricity consumption. Newer labels cover other appliances and equipment such as lamps, washing machines, tumble dryers, dishwashers, water heaters, boilers, computers, rice cookers and tires.
Labeling programs introduced in developing countries are based on the experience of OECD countries. The European model (Box 6.4 and Figure 6.6) has been adopted in similar forms in Brazil, Tunisia, Egypt, China and Iran; the Australian system served as a model for Thailand, Ghana and South Korea.
Box 6.4. EU Lamp Efficiency Labeling SystemIn the EU, all big energy-consuming appliances and lamps and their ballasts have to be labeled, showing the product’s efficiency. Until the adoption of Regulation 874/2012/EU, the lamp efficiency scale in the EU went from A (very efficient) to G (least efficient). However, due to the gradual phase-out of energy-inefficient lamps, labeling classes F and G became obsolete. The labeling system was therefore redesigned: classes F and G were abandoned, and class A was divided into A, A+ and A++. Thus, it is now easier to identify high-efficiency lamps.A++ is the most efficient class for lamps, but class A+++ also exists for washing machines, cooling appliances, and so on. The labeling system could be misleading to consumers if they are unaware of the existence of class A+++.
Sustainable Energy Strategy for IranPolicies to Promote Energy Efficiency

137
Figure 6.6. Examples of EU and Australian Energy LabelSource: Australian label from http://www.energyrating.gov.au/about/what-we-do/labelling
Since labeling programs alone are incapable of transforming the market, they are usually supplemented by minimum energy performance standards (ibid.) (Box 6.5). The com-bined use of labeling and minimum energy efficiency standards can enhance the distribution of more energy-efficient appliances and products. To be effective, labeling programs and performance standards must be upgraded regularly.
Box 6.5. Combination of Minimum Standards and Labeling SystemsThe effectiveness of minimum standards and labeling systems has been tested in many Asian countries. Countries such as China, Indonesia, Malaysia, the Philippines, Singapore, South Korea, Taiwan and Thailand have successfully introduced minimum energy performance standards (MEPS) for certain types of appliances. For example, energy consumption by refrigerators has fallen by 74 percent in South Korea over the past ten years. In Thailand, the share of high-efficiency refrigerators increased from 12 to 96 percent between 1995 and 1998. Mandatory labeling programmes also exist for certain types of appliances and equipment in China, the Philippines, South Korea and Thailand (Wuppertal Institute, 2012).
Information and education: Information and education on energy efficiency encourage people to use more energy-efficient products. Raising awareness can be achieved through information campaigns, exhibitions, demonstration projects, direct mailings and better education (Box 6.6). In addition to raising awareness about the types of appliances with regard to their efficiency rating, it is also important to provide information about how to operate the equipment. For example, a washing machine can be used efficiently or in-efficiently. Big differences in energy and water consumption by washing machines can be created depending on the washing temperature, washing loads and external hot water supplies.
EU Australia
Sustainable Energy Strategy for Iran Policies to Promote Energy Efficiency

138
Box 6.6. Information on Energy Efficiency Measures for Low-Income HouseholdsThe German Federal Ministry for the Environment, Nature Conservation and Nuclear Safety financed a pilot project to improve the efficiency of electricity use in low-income households. Owing to the pilot project’s success, the Ministry implemented the scheme nationwide. By the end of 2014, the scheme had been rolled out to more than 170 cities in Germany. More than 160,000 households had participated in it by 2010. The scheme is a combination of energy audits, the provision of advice, the direct application of efficiency measures, financial incentives and micro-credits.All participating low-income households received a free energy audit. The energy audit was combined with a set of measures called the “instant help package” – the use of compact fluorescent light bulbs, the elimination of stand-by losses through switched extension leads, as well as water-saving measures and timers to reduce losses caused by electric water heating.
Sustainable public procurement: Every purchasing decision influences the environment and society. Sustainable procurement involves consumers carefully considering how their shopping behavior affects the environment. Public authorities also spend large amounts on goods and services, influencing the market and the environment. For this reason, an increasing number of communities are working together in the field of sustainable pro-curement. The organization ICLEI23 developed tools, tender documents, manuals and training sessions to assist in capacity building for public authorities with regard to sustainable procurement.
White certificates: The use of white certificates (or Energy Savings Certificates, ESC) is a policy instrument issued by a government to achieve a certain energy saving target. In this program, a government requires energy companies to undertake energy efficiency meas-ures for final users that are consistent with a predefined percentage of their annual energy delivery. White certificates are usually tradable, and the producers concerned are suppliers or distributors of electricity, gas and oil. If energy producers fail to meet the mandated target for energy, they have to pay a penalty. This program can lead to projects where energy suppliers have an incentive to encourage their customers to purchase more efficient ap-pliances.
Develop Better and Highly Efficient Products (NEW)Research and development: Energy efficiency potentials may not fully materialize due to a lack of market incentives for producers. It is expensive to produce high-efficiency appliances; if consumers are unwilling to pay more for new products or if producers do not receive any compensation for the additional costs of developing more efficient technologies, then highly efficient products will not be manufactured. One important way to reduce produc-tion costs is to invest in R&D to develop new and better technologies, which will increase the energy efficiency of appliances. Companies will invest in R&D if they expect to gain from the development of new products or to increase the quality of their existing
23 ICLEI is the acronym for Local Governments for Sustainability
Sustainable Energy Strategy for IranPolicies to Promote Energy Efficiency

139
products. However, if production involves positive externality, profit-maximizing firms will be unable to fully recover their costs and to capture all the benefits. Hence govern-ment subsidies for R&D can encourage firms to innovate and to identify more efficient technologies that reduce energy consumption and emissions.
Competition for developing the most efficient technology: Setting a price for the development of more efficient technologies can offer companies an incentive to invest in new technolo-gies. Besides technical performance, the concept of market penetration by new products is also important. This explains why companies within the L-Prize competition work to-gether with utilities, energy saving companies and efficiency partners (Box 6.7). The aim of these companies is to support and accelerate the introduction of such products to the market.
Box 6.7. L-PrizeIn summer 2009, the US Department of Energy (DOE) launched the “Bright Tomorrow Lighting Competition” (L-Prize). This policy was intended to encourage the development and deployment of highly energy-efficient solid-state lighting (SSL or LED) products to replace several of the most common lighting products currently used in the United States, including 60 watt incandescent and PAR 38 halogen lamps. The LED products must perform similarly to the lamps they are intended to replace in terms of color, light output, light distribution, lamp shape, size, form factor, appearance and operating environment. They must be reliable, available through normal market channels, and competitively priced. Full performance specification criteria and competition details can be found at http://www.lightingprize.org.
6.4 Energy Efficiency Policies Concerning Buildings using the Example of Germany
Before discussing the specific instruments used to foster energy efficiency in buildings, we need to explain the importance of this sector and review the immense saving potential and enormous progress made, taking Germany as an example. We will also present the addi-tional costs involved in constructing highly efficient buildings and refurbishing existing buildings. The conditions for increasing efficiency in buildings differ to those in appliances. Nevertheless, we describe the policy measures within the same structure as for electricity efficiency.
6.4.1 Background Information about Energy Efficiency in BuildingsIn the EU, buildings consume more energy than the transportation and industrial sectors. Some 40 percent of total energy is consumed in buildings, approximately 85 percent of which is for heating and hot water generation (BMU, 2008).
Energy consumption in buildings is very heterogeneous across buildings in Europe. In general, however, buildings constructed between the end of World War II and 1980 consume
Sustainable Energy Strategy for Iran Policies to Promote Energy Efficiency

140
the most energy. Buildings in Germany consume an average of around 200 kWh/m2 per year (for heating only). Buildings constructed more recently have to comply with the Energy Saving Ordinance (EnEV), which has become increasingly strict over the past 20 years. The EnEV ensures that the insulation and technologies used in new buildings meet high standards. It also specifies prerequisites for renovation based on the latest tech-nological developments, while taking into account economic viability.
The latest Energy Saving Ordinance came into effect in 2013. From a technological point of view, energy consumption for heating new buildings can be reduced further com-pared to the previous EnEV. For instance, passive houses use less than 15 kWh/m2 per year. Energy consumption in passive buildings is already exceptionally low, but the “plus energy” concept takes it one step further. Not only do these structures use no additional energy, they are also designed to generate enough electricity to allow them to feed net energy back into the grid. More and more “plus-energy houses” are being built, which produce more energy than they use throughout the year. The construction of efficient buildings is supported by the state government of North Rhine-Westphalia and the Energy Agency of North Rhine-Westphalia (NRW). Together, they launched a campaign to con-struct 50 solar energy housing developments in NRW. The aim of the project was to greatly reduce energy requirements in buildings by adopting specific energy efficiency designs and to generate the majority of energy needs from solar energy (EnergieAgentur.NRW, 2012).
Passive and “plus energy” are the building designs of the future. Both systems are highly efficient, superbly insulated building types that drastically reduce heat and energy requirements. Thanks to the excellent insulation of the walls and ceilings, triple-glazed or vacuum-insulated windows, and heat exchangers between ingoing and outgoing air, passive buildings lose virtually no heat in winter. The main source of passive heating is the sun’s radiation through large windows. Houses are equipped with heat recovery ventilation systems. Such systems are only operational in airtight buildings because they recover heat from the stale, warm air in the room and transform it to fresh, incoming air by means of a heat exchanger (Wuppertal Institute, 2009). Consequently, very little additional heating is required in these buildings.
The EU also recognizes the importance of saving energy in the building sector. In May 2010, the European Parliament and the Council of the European Union decided to strength-en the energy performance requirements of new and existing buildings across the EU by passing Directive 2010/31/EU. For new buildings, the EU has set 2020 as the deadline for all new buildings to be “nearly zero-energy” (with an even earlier target for public build-ings – the end of 2018). For existing buildings, Member States are required to draw up national plans to increase the number of nearly zero-energy buildings, although no specific targets have been set. Article 2 specifies the features of “nearly zero-energy buildings” as follows: A “nearly zero-energy building” is a building that has a very high energy perfor-mance. The nearly zero or very low amount of energy required should be covered to a very significant extent by energy from renewable sources, including energy from renewable sources produced on-site or nearby (Eceee, 2011).
Sustainable Energy Strategy for IranPolicies to Promote Energy Efficiency

141
6.4.2 The Economics of Highly Efficient BuildingsCompared to standard construction (in this case the EnEV 2007), the added costs for new passive house buildings are considerable. Depending on the individual building, the addi-tional costs may be between 5 and 15 percent. On average, a passive house costs 8 percent more than a house built on the basis of the 2007 Energy Savings Ordinance standard (ibid).
If these additional investments are applied on an annual basis with a depreciation and credit period of 40 years and a real interest rate of 4 percent, the result is an additional an-nual cost burden of around € 6.50 per square meter for a passive building. This is balanced by energy cost savings of almost € 6 per square meter in the initial year of investment (Figure 6.7). Depending on the future price development, the average energy cost savings over the 40-year period are around € 8.80 per square meter for the high-price path and € 7.40 per square meter for the low-price path. It is therefore certainly economically attractive to invest in passive buildings, even if the energy cost savings over the first five to eight years are below the additional charge incurred by taking out a higher loan.
Figure 6.7. Costs and Benefits of New, Passive Building(8% additional costs compared to the 2007 Energy Savings Ordinance) Source: Own figure based on Wuppertal Institute, 2009
The costs and benefits of refurbishing older buildings differ to those of new buildings. The additional costs and savings for more extensive thermal refurbishment (less than 35 kWh/m2, which is close to the passive house standard) average around € 340 per square meter (Wuppertal Institute, 2009). Of this amount, almost € 130 per square meter covers the ad-ditional investment required to build more efficiently than specified by the 2007 Energy Savings Ordinance standard. This additional investment can lead to even greater annual savings of 70 kWh per square meter compared to a refurbishment based on the 2007 Energy Savings Ordinance. If the additional investment of almost € 130 per square meter
€/m2 /year
0
2
4
6
8
10
12
Annuity at 4% realinterest rate and over
a 40-year period
2008(0.08 €/kWh)
High-price path Low-price path
Energy cost savings per year
Average annual energy cost savings over a
40-year periodEnergy cost
savings in thefirst year
Addi"onal costs per year
Sustainable Energy Strategy for Iran Policies to Promote Energy Efficiency

142
for the more extensive refurbishment is made by taking out a loan with a real interest rate of 4 percent and a loan period of 40 years, it yields an annual cost burden of € 6.60 per square meter. At a final energy price of € 0.08 per kilowatt-hour, these costs are offset by initial savings of € 5.60 per square meter. Throughout the life of the refurbishment, this yields an average of € 8.50 per square meter for the high-price path, and € 7.10 per square meter for the low-price path.24 An example of a building retrofitted to passive house standard is given in Figure 6.8.
Figure 6.8. Costs and Benefits of Retrofitting Buildings to Passive House StandardSource: Own figure based on Wuppertal Institute, 2009
6.4.3 Policies and Measures to Improve Energy Efficiency in BuildingsEven though the passive house standard has been used in Germany as state-of-the-art technology for several years, it is not yet common practice for new construction and refurbishment. This may be due to differences between energy efficiency in appliances and buildings. The major difference between appliances and buildings is the supply chain in the construction sector. To produce highly efficient buildings, architects have to cooperate with energy planners, builders and many other professionals and suppliers. Furthermore, the financial requirement for investment is rather high and the payback time relatively high. Other reasons for untapped efficiency potential in buildings are:
Many building owners lack investment capital, while others shy away from tying up capital for a longer period of time.
24 The low-price path assumes a 1.5 percent real price increase in the cost of heating using oil and gas; the high-price path assumes an increase of 2.5 percent per year (Wuppertal Institute, 2009).
2007 EnergySavings
Ordinancestandard
Addi!onalinvestmentfor passive
building
Totalcosts
Energy-related refurbishment costs€/m2 living space per year
Final energy consump!on for hea!ngkWh/m2 living space per year
0
100
200
300
0
100
200
€10.60/m2per year
€210
€130 €340
2007 EnergySavings
Ordinancestandard
Ini!al state
Addi!onalinvestmentfor passivebuilding
* Annuity at 4% real interest rate and over a 40-year period
€6.60/m2per year
€17.20/m2per year
Sustainable Energy Strategy for IranPolicies to Promote Energy Efficiency

143
Landlords may not be able to pass on the added refurbishment costs to their tenants. Many craftsmen, planners and consultants are unfamiliar with the passive house standard. The project may be profitable in the long run, but many investors want a short break-even period and a high internal rate of return.The benefits of the investment depend on how market prices for energy carriers develop in the long run. Price uncertainty will mean that decision on current investments are postponed.
Building owners may wait until grants or soft loans are offered to finance the investment.This list is by no means exhaustive. Similar to energy policy in the electricity sector, energy policy in the building sector needs a mix of instruments to overcome the obstacles.
LESS Inefficient BuildingsMinimum efficiency standard: Minimum efficiency standards and energy saving ordinances for new and existing buildings may be one of the most effective energy-saving instru-ments. However, standards cannot be realized immediately due to technical constraints. Energy standards for buildings are especially important for market stakeholders, who can be informed about energy use when purchasing or renting new apartments or offices. Standards require a minimum level of energy efficiency. Most building standards are directed at new buildings or major refurbishments of existing ones. Standards usually cover insulation, air conditioning, lighting and, in some cases, mechanical equipment. Standards must be introduced gradually, and architects, engineers and builders need to be educated to ensure the standards are met.
Box 6.8: Energy Efficiency Standards for Buildings in AsiaFor the past ten years, investments in highly energy-efficient buildings have increased in Asia. Substantial government initiatives have been promoting energy efficiency in buildings since 2000. China has issued three new building standards in the past 12 years, and the energy performance targets for new buildings have been gradually tightened. Major cities have targets of 65 percent more efficient building standards at the same comfort level compared with the 1980s. Furthermore, targets have been introduced for retrofitting existing buildings in a bid to improve 25 percent of the building stock. India introduced its first national building energy standard in 2001. The aim was to reduce energy consumption in new buildings by 25 to 40 percent. In Singapore, commercial buildings, which have an outstanding energy performance, can be awarded an “Energy Smart” badge. Other South-East Asian countries also reviewed their housing standards during the 2000s. In addition, Asian governments have introduced new regulatory and non-regulatory policies to support greater efficiency in the building sector (Wuppertal Institute, 2012).
Sustainable Energy Strategy for Iran Policies to Promote Energy Efficiency

144
Energy tax: Investments to improve energy efficiency in buildings are usually a long-term matter, hence the cost-benefit analysis of the project will depend on future energy prices. Taxes on energy carriers can encourage investment in energy efficiency measures, while energy consumption subsidies may discourage investment in energy efficiency projects.
MORE Efficient BuildingsIncentives: Soft loans are a common and effective incentive to foster energy efficiency in buildings. Standards are recommended to supplement targeted financial incentives. Soft loans with a long time range and low interest rates will encourage builders to invest in energy-efficient buildings. To ensure the right incentives are given, soft loans should only be granted if the construction or investment meets the required standard. For special meas-ures such as vacuum insulation ‒ a new technology that may not yet be cost-effective ‒ grants may be the most efficient way to encourage investors to apply such technologies.
Labeling and rating systems: In order to stimulate innovation in buildings, regulators can introduce energy rating or labeling systems (an example of the German energy label for buildings is depicted in Figure 6.9). Energy rating systems and labeling building perfor-mance can be effective measures to encourage owners to go beyond obligatory minimum standards. Energy use is usually one of the highest operating costs for building owners. For tenants, energy costs more or less amount to a “second rent.” The building label has three main objectives:
To show a new tenant their future energy costs. Tenants compare rents, including energy costs, when renting a house.Low energy costs increase the value of the building, enabling owners to secure a higher rent for the building if energy costs are low. With the efficiency label program, builders would have an incentive to invest in energy efficiency measures.The energy label comes along with a set of possible improvements and the approximate savings. It provides an estimate of potential costs and cost savings.
Sustainable Energy Strategy for IranPolicies to Promote Energy Efficiency

145
Figure 6.9. Energy Label for Buildings in Germany Source: Marco Klaue, fotolia.com
Box 6.9. Rating and Labeling System in AsiaA voluntary rating and labeling system has been adopted in Singapore, South Korea and Hong Kong. Further measures, such as a green building rating and certification system, often complement the rating system. In South Korea, the Energy Efficient Labeling Programme for Buildings classifies newly built or renovated residential buildings into grades between 1 to 3, depending on their energy consumption. Buildings with a performance above a certain level can receive a certificate and lower interest loans for construction (Wuppertal Institute, 2012).
Box 6.10. Green Building ProgramsAnother policy to encourage investors to go beyond the minimum requested energy- efficiency requirements is the “Green Building Program”. In the past eight years, such a scheme has been introduced in several Asian countries such as China, India, Hong Kong, Singapore, Taiwan and South Korea.
Sustainable Energy Strategy for Iran Policies to Promote Energy Efficiency

146
The Chinese “Evaluation Standard for Green Building” was introduced in 2006. The requirements for the standard are similar to the US green rating system, Leadership in Environmental and Energy Design (LEED). The Chinese Ministry of Construction collects building energy consumption data, assesses energy performance based on the standard, and issues the “Green Building Certificate”. The programme promotes expertise in green building, involving the certification of projects by a professional authority. To obtain a professional accreditation, a building project must meet a certain number of prerequisites and performance benchmarks (Wuppertal Institute, 2012).
Information, education and demonstration: To meet new standards for sustainable new and refurbished buildings, we need better education at all levels. All stakeholders, from archi-tects, engineers and builders to investors and financial managers, must learn how to meet efficiency standards for new and old buildings. This is a huge task, not only because new architects and builders require training, but also because all existing architects who were trained based on the old system need to be retrained to learn about the new energy system. This means that they have to change their mindsets and attitudes on design and construc-tion. The education of architects differs to that of engineers and other professionals, but all stakeholders must work together to avoid inefficiencies and achieve new building standards, such as the passive house standard.
Raising awareness of energy efficiency should begin at school. To this end, new school curricula are required, as well as instructors who are able to teach these new subjects. Dem onstration projects will also help to achieve the transformation to more efficient buildings. Demonstration gives builders and building professionals the opportunity to learn about new materials and technologies, and to apply more efficient electrical equipment. Such projects show professionals and the public that sustainable buildings are possible and, in many cases, have positive net benefits for individuals and society.
In a democratic society, decisions that make a strong impact on the economy and society can only be made if they are acceptable to the public. On the other hand, people can also influence decision-makers and other stakeholders, encouraging them to adopt policies and take action to improve the environment. For this reason, information awareness strategies should not only include the building sector, but also society as a whole.
Procurement and public buildings: Governments own and operate numerous buildings, which means that public procurements and operation can influence the market signifi-cantly. Governments can support good practices by demanding higher efficiency stand-ards than the minimum level. New building codes will require considerable effort on the part of private investors and all of the organizations involved. If climate protection policy is declared a central goal of government policy, it should also be expressed in such a way that local and state governments use their own buildings as lighthouse projects for sustainable construction.
Sustainable Energy Strategy for IranPolicies to Promote Energy Efficiency

147
Box 6.11. Public Procurement in Frankfurt am MainThe city of Frankfurt passed a council resolution requiring the city and, in particular, the housing association in which the city owns a majority interest, to impose the passive house standard for all new municipal constructions as well as for public-private-partner ship projects and refurbishments. Only in exceptional cases may buildings be built or refurbished to a lower efficiency standard. This makes Frankfurt one of the first municipalities in Germany to routinely use the passive house standard as the building design.
Development of NEW and MORE Efficient BuildingsResearch and development: Companies have no interest in further developing materials and technologies if there is no market for them. To foster the development of new and more efficient technologies, the government can provide funds to promote research and development in these technologies, as well as incentives to apply these new technologies in the building sector. In addition, policies such as tax credits and targeted university/industry findings are important to encourage companies to invest in research and development.
Box 6.12. Special Programs for Government Buildings in AsiaGovernments own and operate numerous buildings. Public procurement and operation can therefore influence the market significantly. Governments can support good practices by demanding higher efficiency standards than the minimum levels. This model is common in Asia. Energy efficiency programs for government buildings have been introduced in China, India, Hong Kong, South Korea, the Philippines, Singapore and Taiwan.The Philippines launched its “Enercon Program” in 2000, which aimed to make government buildings a showcase for energy efficiency. The program required all government agencies, bureaus and offices to reduce their annual electricity and heat consumption by at least 10 percent. The participants had to report improvements monthly. The aim of the program was to recognize agencies in all government facilities that achieve this objective. The Government Energy Management Program implemented further energy-efficient technologies in all government facilities. The “Energy Spot Checks” program seeks to introduce energy ratings for national government agency buildings. These energy ratings are displayed in the entrance areas of the buildings as an information and marketing measure (Wuppertal Institute, 2012).
As was the case with electricity efficiency, no one instrument or policy measure will lead to a sustainable energy path in buildings. Instead, a set of coordinated policies and instruments is necessary to make the desired changes possible. As investments in buildings will have a long-lasting impact for the next 40 or 50 years or more, it is important to implement climate change policy immediately. Otherwise, the opportunity of investing in new and refurbished buildings may be lost for decades in the case of new and renovated buildings with low standards. Demonstration projects, targeted R&D, skill enhancement and training, and
Sustainable Energy Strategy for Iran Policies to Promote Energy Efficiency

148
energy audits can help raise public awareness of new building standards. A skilled work-force is a necessity to ensure the long-term success of such undertakings.
Box 6.13. Pilot Project: Chinese Sustainable Energy ProgramIn order to promote the implementation of energy efficiency policies at the local level, the Chinese government has chosen seven cities (Shanghai, Beijing, Shenzhen, Chongqing, Fuzhou, Xiamen and Tianjin) as pilot cities to develop local building energy management systems. The “Chinese Sustainable Energy Program” is a major component of these pilot projects. The aim is to advertise and promote energy-efficient technologies and practices. Pilot projects include: Establishing the best design system for energy efficiency in buildingsDevising local building codesImplementing an energy-efficient building rating and certification systemTraining architects and engineersPromoting the development of an energy-efficient materials and products market (Wuppertal Institute, 2012).
6.5 Energy Efficiency in Iran
6.5.1 BackgroundHigh energy consumption and its rapid growth in Iran is a major concern to policy-makers because of budgetary pressures, environmental damage, and high opportunity costs. If the current trend of energy consumption continues, the country’s oil and natural gas exports, which are major source of revenues, will fall dramatically, causing serious economic and social problems. It will also add to the already high level of pollution in large cities, exacerbating health and social problems. The scenario analysis presented in Chapter 4 shows that the increasing trend of energy consumption can be controlled by adopting a series of efficiency policies in different sectors of the economy. However, the study does not go into the details of energy efficiency measures. This section aims at identifying the energy efficiency problems and reviewing the measures and policies that can help increase energy efficiency in Iran. The focus will be on the household sector, which consumes more than one-third of total energy consumption and has a great potential for energy saving.
Using about 40 percent of the final energy, household, commercial and public sectors together are the largest energy consumers in Iran. The final energy use by these sectors has been growing by about 6 percent per year (2 percent faster than the total final energy consumption) since 1995, and is expected to strongly increase by 2030 under the Busi-ness-as-Usual (BAU) scenario (Table 3.20 in Chapter 3). The main factors driving the rapid increase in energy consumption in Iran are economic growth, an increase in population and low energy prices due to government subsidies. Households, commercial and public sectors use about 20 percent of total oil products, 65 percent of natural gas and 50 percent of total electricity consumption (Energy Balance, 2010). The sector’s energy consumption
Sustainable Energy Strategy for IranPolicies to Promote Energy Efficiency

149
pattern has changed markedly since 1990 because of the government’s policy of substituting oil products with natural gas. Household consumption of oil products has increased on average by about half a percent annually, whereas the consumption of natural gas and electricity has increased by 19 and 6 percent per year for the past 15 years, respectively. As the BAU scenario study shows, household demand for kerosene and LPG by 2030 will decline on average by 6 percent and 1 percent per year, while the demand for gas oil and natural gas will increase by 1.7 and 3.5 percent per year, respectively. Electricity consumption in the sector will also increase on average by 3.8 percent per year.
The energy (fuel) services consumed by households in Iran consist of 71 percent heat, 22 percent hot water and 7 percent cooking. These services are provided by natural gas in most cities, and gas oil and kerosene in a number of rural and remote areas. Electricity is used for lighting and appliances. Lighting and cooling appliances (refrigerators and freezers) are the major components of household electricity use, comprising 24 and 32 percent of the total electricity use by an average urban household, respectively. The shares of air conditioning and TVs/computers in household electricity consumption are 13 percent each. The scenario study also shows that household use of electricity by appliances such as TVs, computers, coolers (air conditioners), microwaves, tea/coffee makers, irons, washing machines, dishwashers, freezers and low-consumption lamps will grow on average between 2 and 17 percent per year until 2030. An increase in income, a continuous trend in urbanization and the associated change in lifestyle are the main factors behind the new patterns of the use of appliances in households. Figure 6.10 shows current and projected energy consumption patterns in Iran.
The energy consumption trend by households can be controlled by a mix of price and non-price policies. In this section, we focus on non-price energy efficiency policies; price-led policies will be discussed in detail in Chapter 8.
Figure 6.10. Household Fuel and Electricity consumption
HeatCookingHot Water
Household Electricity Consumption
2010 2030Household Fuel
Consumption
22%
2010
24%17%
71% 13%
13%
32%
Lighting Fridge/FreezerCooling TV/Computer
Others
18%
15%
13% 23%
31%
7%
Sustainable Energy Strategy for Iran Policies to Promote Energy Efficiency

150
6.5.2 Energy Efficiency Policies in IranEnergy efficiency is a relatively new concept in Iran. Although there have been some regu-latory measures and activities with respect to energy efficiency, a consistent and system-atic approach for designing energy efficiency policies and enforcing mechanisms has been lacking. The establishment of IFCO and SABA25 as energy efficiency organizations was one of the major steps taken towards providing education and training, and raising public awareness of energy efficiency standards in different sectors. Furthermore, the long over-due energy price reform, as a prerequisite for any energy efficiency policy, was also an im-portant step forward towards addressing Iran’s energy efficiency problems. However, a small organization with limited authority and a tight budget is unable to cope with the scale of Iran’s energy efficiency problems. Although the energy price reform was also necessary for initiating energy efficiency policies, flaws in the design and execution of the policy meant that the expected impacts of the reform on energy consumption and effi-ciency did not fully materialize (see Chapter 8). To achieve energy efficiency targets, as discussed in the previous section, no one policy alone can succeed; a package of policies, including price and non-price measures and regulations and incentives, will be required.
Price reform is the principal component of any energy efficiency policy, particularly in countries such as Iran, where energy prices are heavily subsidized. However, non-price mechanisms are equally important as price reforms, since the market system alone may not be able to promote efficiency in energy markets. For instance, energy-saving projects such as the production or purchase of high-efficiency appliances or combined heat and power plants have high pay-offs, but require significant initial investment costs and, therefore, take longer to break even than normal projects. If firms or households are under liquidity constraints and the financial system is incapable of providing liquidity and reducing risks, efficiency saving opportunities will probably not be seized by the private sector on the market. Another barrier to energy efficiency is the ownership-tenant relationship, which may also impede business investments in energy efficiency projects. Landlords have no incentive to invest in higher efficiency buildings and appliances, because they are unlikely to reap the benefits from energy savings. A lack of public knowledge and aware-ness of the private and social costs of high energy subsidies and consumption and the potential benefits of energy efficiency investments are important factors that contribute to high energy consumption and low efficiency. Furthermore, energy saving projects have positive spillovers to society by contributing to sustainability and a better environmental quality. However, the market system fails to allocate resources efficiently when social returns exceed private returns. The government can incorporate social costs and social benefits into the cost-benefit analysis, which would make energy efficiency projects economically feasible.
In general, the government can adopt policies to reduce the production costs of energy- intensive products, to increase demand for energy efficient products, or a combination of both. Some of the policy measures the government can take to promote energy efficiency on both the supply and demand sides are:
25 IFCO (Iranian Fuel Conservation Organization) and SABA (Iran Energy Efficiency Organization).
Sustainable Energy Strategy for IranPolicies to Promote Energy Efficiency

151
Monetary incentives for producers who adopt energy efficiency measures throughTax rebatesLong-term low-interest loans Flexible pricing of productsAccess to foreign exchange at preferred rates
Non-monetary incentives for producers who adopt energy efficiency measures by Transferring know-how Providing on-the-job training programs
Small loans to households for the purchase of new, efficient appliances The buying back of old inefficient appliances from householdsDistribution of inexpensive low-consumption lampsFormal and informal education on energy efficiency and know-howPublic awareness of energy efficiency, its impacts and how to achieve itLoans and technical assistance for retrofitting old buildingsThe setting of examples for energy-efficient buildings.
There is a huge potential for improving efficiency in the use of energy by the household, commercial and public sectors in Iran. The main areas where efficiency can be increased are building standards, appliances, raising public awareness and providing education. Since these measures cannot be initiated by the market, government policies are required. Fortunately, the recent energy price reform, which cut energy subsidies, has increased in-centives to use energy more efficiently in various sectors. However, since the price reform has its own limitations, some of which are discussed above, it cannot solve the efficiency problem alone. It is therefore essential that the price reform policy is implemented along with other complementary non-price policies. Some of these policies with regard to energy efficiency in building and appliances include:
Codes for new, high-efficiency buildingsRegulations and incentives for producers of building materialsRegulations and incentives for contractorsRegulations and incentives for ownersEducation (formal and informal)Research and developmentMonetary and non-monetary incentives for retrofitting old buildingsEfficiency labeling for appliancesRegulations and incentives for producersRegulations and incentives for consumers.
We analyze energy efficiency policies in buildings and appliances in more detail below.
Energy Efficiency in BuildingsHouseholds and the commercial sector use 37 percent of the total energy in Iran (Energy Balance, 2010). The average energy use in buildings is 310 kWh per square meter per year, which is 2.6 times more than the energy use in developed countries (120 kWh). House-
Sustainable Energy Strategy for Iran Policies to Promote Energy Efficiency

152
holds in Iran typically use most of their energy for heating/cooling, lighting and cooking. The main areas that contribute to energy waste in buildings are floors, walls and ceilings (31%), ductwork (15%), chimneys (14%), plumbing (13%), doors (11%), windows (10%), ventilation fans (4%) and electricity outlets (2%). Since the heating system and the building envelope are the main sources of energy waste, major efforts should be made to improve heating systems for existing and new buildings, as well as exterior materials and insulation, particularly for new buildings.
For the existing building stock, improvements in the heating system would lead to huge energy savings. Space and water heating currently comprises more than 90 percent of the fuels used in residential buildings. Heating systems differ, depending on the type of building. Most old buildings use kerosene or natural gas boilers. Large buildings often use fan coils for dual purposes (heating and cooling).
There are one million boiler rooms in the country, 30 to 40 percent of which are installed in Tehran. These boilers are usually used to provide space heating and water heating services. The boiler rooms’ structure and poor maintenance are the major factors contributing to energy waste in buildings. Heating systems in boiler rooms are rather complex and difficult to monitor. There are many pipes, valves and other equipment that needs to be monitored and adjusted manually on a regular basis.
One of the problems with current heating systems is that if the system generates heating water, it also generates a lot of heat that cannot be utilized. This is particularly important on mild and warm days (215 to 275 days, depending on the region) when there is no need for space heating. In addition, monitoring the running time of boilers when they are not needed for heating services would increase energy efficiency in buildings. This can be done by installing automatic intelligent control devices as part of the heating system, en-abling the indoor temperature to be adjusted automatically with the outdoor temperature. Retrofitting boiler rooms, which are relatively similar throughout the country, to enable the heat generated to be utilized in the building would save substantial amounts of energy. It is estimated that a 1 degree Celsius reduction in ambient room temperature would lead to a 7 to 8 percent reduction in energy use.
Radiators are also commonly used to heat rooms in Iran, but these are regulated manually. Installing thermostats on radiators would enable residents to monitor the heat service more efficiently, saving energy. This is particularly important in public buildings, where manual monitoring is ineffective. New radiators (packages) used in small apart-ments and commercial units have thermostats, enabling the heating level to be monitored automatically.
The notion of energy efficiency is almost foreign to the building and construction in-dustry in Iran, but mindsets have started to change, thanks in part to the recent energy price reform. In addition to poor materials and designs, there is a lack of knowledge and skills and a shortage of energy efficiency experts in the construction industry. Although there are new regulations and codes for energy efficiency in buildings, they are inconsistent, and there is lack of coordination between stakeholders. Enforcing the regulations is also a major challenge due to constantly changing regulations, multiple agents being responsible
Sustainable Energy Strategy for IranPolicies to Promote Energy Efficiency

153
for monitoring, and large-scale corruption. Builders are required to observe the regulations, but it is hard to assess the extent to which regulations are adhered to. Energy efficiency regulations for buildings are an essential component of achieving an efficient energy system, but they must be accompanied by a strict enforcement system and a series of price incentives. Otherwise, people may continue to ignore the regulations.
The potential energy savings generated by improving heating systems are 50 to 60 percent, which equates to 157 kWh/m2. A back–of-the-envelope calculation shows that energy efficiency measures applied to 424 government buildings with an average area of 3000 m2 would save US$ 86 million and avoid 0.61 million tons of CO2 emissions over 15 years. Installing solar water heaters for pre-heating in buildings would also save energy and reduce CO2 emissions. If solar water heating systems were installed in government buildings, they would save US$ 27 million and reduce CO2 emissions by 0.19 million tons over the next 15 years. Overall, retrofitting existing boiler rooms and installing solar water heating systems in government buildings would save a total of 375 million m3 natural gas, which translates to a saving of US$ 113 million, and reduce CO2 emissions by 0.8 million tons (UNDP, 2010).26
Chapter 19 of the “National Regulations for Building”, which was passed by the govern-ment in 1991 and amended in 2000, introduced new building codes for energy savings in buildings. The Ministry of Roads and Urban Development is responsible for monitoring these regulations. The energy-saving regulations must be applied to new government build ings and all private buildings in the country by 2014. The regulation covers the fol-lowing areas:
Insulation of exterior walls Double-glazed windowsInsulation of pipes and plumbing Installation of a control system such as thermostats on radiatorsInstallation of a central control system to monitor temperature.
Building permits are issued by the city based on the Energy Checklist and other information on the cooling/heating system, ventilation system, water heating and lighting system to ensure that the regulations are observed.27 Following on from Article 20 of the Fourth Development Plan and Chapter 11 of the Policies for Consumption Pattern Reform and Energy-Intensive Equipment Standards, a proposal was put forward by a joint committee involving the Ministry of Oil and the Ministry of Energy for using energy efficiency labeling
26 The following assumptions are made: the heating value of each cubic meter of natural gas = 10.46 kWh, CO2 emissions for each million m3 natural gas = 2,133 tons. Each solar power system contains 20 collectors, and each collector saves 700 m3 natural gas. The price of natural gas is assumed to be US$ 0.30 per m3.
27 The owner of the building must apply to the city for a construction permit. Once the permit has been issued, the city audits the building at different stages of construction to ensure that the regulations have been observed. Energy efficiency permits are quite new, and there is no data to verify how and to what extent the regulation is enforced. Based on the overall regulato-ry quality, however, the regulations will probably not be complied with fully.
Sustainable Energy Strategy for Iran Policies to Promote Energy Efficiency

154
for buildings. According to this proposal, an energy efficiency label would have to be ob-tained and installed for new buildings. The regulation would cover all small and large pub-lic and private buildings, but would initially be implemented in public buildings and other buildings under construction. Energy efficiency labeling would grade buildings from A to G based on their energy consumption. Buildings that fail to adopt the minimum energy efficiency measures would not be awarded a label. Here are some examples of policies that could help to improve energy efficiency in buildings:
Revise building codes to incorporate energy-saving measures, particularly with respect to heating systems, exterior walls, insulation, windows, air ducts and chimneys, taking into account regional characteristics. Regulate the manufacture of boilers and help the boiler industry to adopt new tech-nologies that reduce unwanted heat in the water heating process. Provide knowledge and financial support for retrofitting existing buildings, adopting energy efficiency measures. Train professionals, engineers and builders so that they can implement the energy effi-ciency regulations. Energy efficiency can be included in the school curriculum – in a general form at elementary schools and in more specialized courses and programs in higher education.Raise public awareness of energy-saving methods in buildings and the effect they have on the local and global environment. Incorporating useful information and guidelines about the use of energy and how to reduce energy consumption and emissions in energy bills would be an effective way of raising public awareness. The government can start implementing energy-saving measures in its own buildings to set an example to the public. Support the production of solar water heating systems for use in urban and rural buildings.28
Energy-Efficient AppliancesAppliances are the second most important source of high energy savings in the residential sector. Although a number of policies to improve the energy efficiency of appliances have been implemented by different organizations, the potential for energy savings in this area is very high. Appliances currently used in Iranian households are rather old, and the market share of low-efficiency appliances produced domestically is high. The first step taken by the Institute of Standard and Industrial Research of Iran (ISIRI) was to create energy efficiency labeling for different appliances based on the European model. According to the regulation set by ISIRI, energy efficiency labeling is now mandatory for all electrical appliances. There is also an efficiency labeling requirement for gas heaters and gas water heaters, calculated using the following formula:
28 IFCO has already initiated the installation of 2,100 baths heated by solar water heating systems in remote rural areas, and has provided assistance in the manufacture of solar-powered water heating systems.
Sustainable Energy Strategy for IranPolicies to Promote Energy Efficiency

155
Qs = [(A0 – AE)/A0] x 100
where A0 = 28,900 MJ is the base annual energy consumption for a gas water heater, AE is the actual energy consumption and Qs is the savings in percent compared to the reference system. Table 6.2 shows the grading results for gas water heaters.
Table 6.2. Energy Efficiency Ranking for Gas Water HeatersGrade Energy Saving (Qs, %)A Qs >35B 28 - 35C 21- 28D 14 - 21E 7 - 14F 0 - 7G -20 - 0Not Acceptable Qs< -20
Source: SABA, 2012
The energy efficiency label should have a specific size with predefined colors for each energy category, and must be installed on both packaging and the appliance itself. Energy efficiency labels for refrigerators and freezers are also determined based on the efficiency index as follows:
I = Annual Energy Use/Standard Energy Use
The efficiency ranking of a refrigerator or freezer is then determined based on the standard energy use, which is about 361.2 kWh per year for a refrigerator with an effective volume of 250 liters. The appliance is more efficient if it uses less energy than the standard level calculated for that appliance. The ranking is listed in Table 6.3.
Table 6.3. Energy Efficiency Ranking for Refrigerators and FreezersGrade I: Efficiency Index (%)
A <55B 55 - 75C 75 - 90D 90 - 100E 100 - 110F 110 - 125G 125 - 140Not Acceptable >140
Source: SABA, 2012
In the following section, we review a number of case studies that are important for energy efficiency in appliances in Iran.
Sustainable Energy Strategy for Iran Policies to Promote Energy Efficiency

156
Refrigerators and FreezersThere are 18 million refrigerators, freezers and fridge-freezers in Iran, and about 2 million units are added to the stock each year. Domestic products comprise 65 percent of the market; imports represent 35 percent. The ratio is 50:50 when values are taken into account. The average lifetime of a refrigerator or freezer in Iran is 12 years. 44 percent of refrigerators and freezers in Iran have no efficiency ranking, which implies that their grades are below G. Figure 6.11 shows that about 37 percent of refrigerators and freezers are between D-G, and only 0.29 percent are class A (Ismaielnia, 2010). The high share of low-grade refrigerators and freezers in Iran reflects a high potential for energy savings in this market. Table 6.4 shows the energy consumed by a typical refrigerator or freezer for different efficiency grades; the potential energy savings generated by improving the efficiency grade; and the net present value of savings. Domestic products have grade B or less; foreign products are graded C or above. The average lifetime of a refrigerator is assumed to be 12 years, with a real interest rate (nominal interest rate minus inflation rate) of 5 percent and an inflation rate of 10 percent. It is assumed that the price of electricity will rise in line with inflation for the sample period. The results show that the net present values for switching to grade A from a lower grade are positive for domestic appliances, ranging from 0.209 to 3.394 million rials (US$ 17 to 282 at the official exchange rate in 2012), and negative but negligible for foreign products (0.205 to 0.431 million rials or US$ 17 to 35). Table 6.4. Net Present Value of Investment in High-Efficiency Refrigerators Grade Energy
Consumption (kWh)
Energy Savings (thousand rials/year)
Price Difference (thousand rials)
Net Present Value (thousand rials)
Domestic Foreign Domestic ForeignA 304.039B 359.974 72.7 1,140 -431C 456.890 198.7 500 2,140 209 -205D 526.116 288.7 700 1,237E 581.496 360.7 800 2,014F 650.722 450.7 1,000 2,516G 733.793 558.7 1,000 3,394
Note: The fridge-freezer is a 60/40 unit with a 365 liter capacity. Domestic fridge-freezers are grade B and below; foreign fridge-freezers are grade C and above. Price differences are a rough estimate for the same size, but other factors such as brand name effect are not controlled for. The average lifetime of the fridge-freezer is assumed to be 12 years, the real interest rate 5 percent, and the price of electricity 1,300 rials per kWh, which increases by 10 percent annually due to inflation. Sources: Tavanir, 2012; Ismaielnia, 2010; authors’ calculations.
Although electricity prices in Iran do not yet reflect the actual marginal production cost, the net benefit of purchasing higher efficiency refrigerators is positive for domestic products and almost zero for foreign products. This implies that the government can encourage consumers to trade in their old refrigerator for a new high-efficiency unit by providing a subsidy towards the purchase of a new refrigerator. The policy would increase the market size for high-efficiency refrigerators, which would bring down the price of
Sustainable Energy Strategy for IranPolicies to Promote Energy Efficiency

157
high-efficiency refrigerators (economy of scale), ultimately saving energy and money while receiving the same service. However, as the survey results in Table 6.5 indicate, consumers give little consideration to energy consumption and savings when purchasing a new refrig-erator or freezer (Ismaielnia, 2010). The survey results show that more than two-thirds of consumers consider the appearance and price of fridges and freezers to be more important factors in their purchase decision than energy aspects. Energy efficiency is not a significant factor for about two-thirds of potential buyers. Reasons for the lack of importance attached to energy efficiency in purchase decisions for refrigerators and freezers may be the low energy prices before the energy price reform; the higher cost of purchasing high-efficiency refrigerators and freezers; budget constraints; and a lack of awareness of the potential for high-efficiency products to save energy. Sallee (2013) argues that households’ lack of regard for energy efficiency may be their optimal reaction to the high costs involved in obtaining detailed information about energy efficiency. This implies that the policy should seek to reduce the cost of obtaining attention, rather than incentivizing it. For example, current energy efficiency labeling requires effort in the form of calculating the costs and benefits associated with each efficiency level and the monetary amount saved given the utilization rate of appliances in a specific household. Households may pay more attention to energy efficiency labeling if they received information about efficiency savings in a more straight-forward manner, involving less time and effort.
Figure 6.11. The Share of Fridges/Freezers with Different Energy Efficiency Grades in Iran (%)Source: Ismaielnia, 2010
A 0,29 %
B
7 %
C11 %
D 12 %
No Rank
44 %
E5 %F
9 %G
12 %
Sustainable Energy Strategy for Iran Policies to Promote Energy Efficiency

158
Table 6.5. Important Factors Concerning the Purchase of Refrigerators and Fridge-Freezers by Consumers (%)Feature Very High High Medium LowRefrigeratorAppearance 21.3 38.1 35.8 4.8Price 20.8 33.3 45.9 0Energy Consumption 13.0 26.1 41.3 19.6Fridge/FreezerAppearance 23.8 53.8 19.9 2.5Price 11.3 41.3 34.9 12.5Energy 18.7 38.7 35.9 6.7Source: Filor and LG, cited in Ismaielnia, 2010
One of the policies to promote the use of more efficient appliances is to subsidize pro-ducers of high-efficiency products. A cost-benefit analysis shows that the net benefit of subsidizing high-efficiency refrigerator/freezer production is positive. Specifically, the policy can aim at increasing the level of efficiency from below D to above C (33% C, 33% B and 33% A). The policy would involve providing subsidies to domestic producers based on increments to a higher efficiency grade. The subsidy amount would be equal to the energy savings generated by the more efficient refrigerator over a period of five years. If the average lifetime of a refrigerator or freezer in Iran is assumed to be ten years and the price of electricity is 1,010 rials/kWh, with a 12 percent interest rate the net discounted value of subsidies would be 5,242 billion rials. The benefit-cost ratio would be 3.42 and the internal rate of return 117.8 percent. The project would take 48 months to break even (Ismaielnia, 2010).
A subsidy program may not be the best solution because it could generate disturbances in the market. If there is an opportunity in the energy efficiency market, profit-maximizing producers would soon learn about it and there would be no need for the government to intervene in this field. However, in many developing countries such as Iran, barriers such as red tape,29 price controls, weak financial institutions and uncertainties about macro-economic policies on exchange rates and trade prevent the market from working efficient-ly. The best solution would therefore be for the government to eliminate or reduce such barriers. In the short run, however, a well-designed and well-implemented subsidy program may be an effective way to increase efficiency.
Washing MachinesIn a survey conducted by SABA in June 2012, a total of 489 participants in two different seminars responded to a series of questions on the appliances used deployed in their households. The results for washing machines show that almost every household has a washing machine, and that about 80 percent of these devices are ten years old or less.30
29 Rigid conformity to formal rules and/or excess regulatory requirements.30 The sample may not be representative because the average age of the participants was 38 and most of the appliances were
between one and ten years old. This may indicate that the participants belong to new households.
Sustainable Energy Strategy for IranPolicies to Promote Energy Efficiency

159
They also indicate that 22 percent of these washing machines are grade A, 39 percent grade B and about 30 percent C or below. Table 6.6 shows the energy saving potential that could be generated by improving washing machine grades in Iran. There are a total of 10 million washing machines in Iran. Assuming that the energy efficiency ranking structure in Iran is identical to that used in the survey, the total electricity savings from improving washing machines to grade A would be 209 GWh, which is more than 18 percent of the total elec-tricity consumed by washing machines in Iran. The present net benefit of switching from a grade B to a grade A washing machine is positive (67,411 rials or US$ 6), making it econom-ical to invest in more efficient washing machines.31
Table 6.6. Energy Auditing Survey for Electricity Consumption by Washing MachinesGrade Number of
Washing Machines
Grade Share (%)
Electricity Consumption per Appliance (kWh/year)
Total Electricity Consumption (kWh)
Energy Savings per Appliance (kWh/year)
Total Energy Savings (kWh/year)
A 40 21.7 118.5 4,742B 72 39.1 143.5 10,333 25 1,798C 19 10.3 168.5 3,201 50 948D 11 5.9 193.5 2,128 75 824E 3 1.6 218.5 655 100 300Note: Energy savings are generated by upgrading washing machines with grade B and lower to grade A. The average utilization rate is twice a week, the average cycle per use is 2 hours, and the washing machine’s average capacity is 6 kg. Source: SABA, 2012; authors’ calculation.
Other appliancesTable 6.7 shows the results of the survey concerning the energy efficiency of appliances used by 489 households. The energy saving potential that can be generated by upgrading dishwashers and water coolers seems to be substantial. About 60 percent of dishwashers are older than ten years and are classified as grade B or lower; 40 percent of water coolers are grade C or lower. All water coolers are produced domestically. They have a low energy efficiency ranking, even though 70 percent of them are less than ten years old, suggesting the need for technological improvement.
31 The real interest rate is 5 percent, inflation rate 10 percent and the lifetime of the machine 12 years. The price of electricity is 1,300 rials/kWh, which increases in line with inflation. The price of a 7 kg grade A Bosch washing machine is about 1.663 million rials; the difference between grade A and grade B is assumed to be 15 percent.
Sustainable Energy Strategy for Iran Policies to Promote Energy Efficiency

160
Table 6.7. Electricity Consumption by Household Appliances (2012)Item Number of
Items per Household
Energy Efficiency Grade (%) Age (%)A B C and Lower 1-10 Years More Than
10 Years
Dish Washer 0.4 22 20 58 40 60Water Cooler 0.7 40 70 30Air Conditioner 0.4 80 20TV* 1.1 72Computer 1.0 85DVD 0.6 82Others (Microwave, Toaster, Tea/Coffee Maker, etc.) 1.2*The average time spent using the TV, computer and DVD each day is 7, 2 and 1 hours, respectively. More than 50 percent of TVs are larger than 40”; the three most popular makes are Samsung, Sony and LG. Source: SABA, 2012.
It is not possible to obtain an exact calculation of the energy savings generated by upgrading appliances because data on appliances used by households and their energy efficiency ranks is not readily available. However, we can estimate the energy savings generated for different appliances using the aggregate data and standards. Table 6.8 shows the energy consumed by appliance and the average energy efficiency grade in 2009. Given the quantity supplied (domestic production and imports) of each appliance, we can estimate the energy savings generated when the energy efficiency grade is improved to A or A+. The total energy saved by upgrading existing appliances to grade A or A+ would be 1,400 million kWh per year, which is equivalent to 0.83 BOE.32 Given a real price of US$ 50 per barrel of oil, energy savings would be US$ 42 million per year.
32 A potential rebound effect is not taken into account.
Sustainable Energy Strategy for IranPolicies to Promote Energy Efficiency

161
Table 6.8. Energy Savings Generated by Upgrading Energy Grades of AppliancesAppliance Current
Energy UseEnergy Efficiency Grade
Target Energy Use
Target Grade
Supply Total Energy Savings(GWh/year)
Refrigerator/Freezer (kWh/year)
404 D 235.70 A 1,730,734 291.28
Dish Washer (kWh/kg)
0.23 B 0.19 A 857,436 12.35
Water Cooler (EER)* 23 G 65 A+ 1,015,749 841.24Tea Maker (Wh/lit) 118 D 105.60 A 1,009,915 25.25Iron (kWh/year) 78.80 E & D ** 52 A & D*** 673,000 18.04Electric Heater (Wh/d)
3900 D 3200 A 644,218 162.34
Electric Water Heater (kWh/d)
4.77 D 2.04 A+ 80,400 65.85
Total 1416.35
* EER = kW cooling/kWe*100** E: dry, 30.14 kWh/year, D: steam, 99.7 kWh/year*** A: dry, 10.5 kWh/year, D: steam, 69.8 kWh/yearThe total energy savings are calculated as the difference between the total current energy use (current energy use multiplied by quantity supplied) minus the total target energy use (target energy use multiplied by quantity supplied).Source: Institute of Standard and Industrial Research of Iran (ISIRI)
6.6 Conclusion
The scenario study for energy consumption in Iran shows that total energy consumption will almost double over the next 25 years under the BAU scenario. This will certainly re-duce Iran’s ability to export oil and natural gas, and will affect its economic performance dramatically. However, the Efficiency scenario results indicate that adopting an active and ambitious energy efficiency strategy would enable Iran to reduce its domestic energy de-mand by more than 40 percent. According to these results, the residential sector is the major source for saving energy in Iran, of which the heating system and domestic appliances are the two most significant areas where energy efficiency can improve significantly.
In this chapter, we reviewed the energy savings that can be made in the household sec-tor by focusing on residential buildings and appliances, and analyzed energy efficiency policies in these areas in more detail. Although the energy price reform, which was intro-duced in 2010, was intended to curb the growing trend of energy consumption in Iran, it has been unable to increase energy efficiency because it was not accompanied by non-price energy efficiency policies. Hence there is still great potential for more efficient energy use in Iran.
Sustainable Energy Strategy for Iran Policies to Promote Energy Efficiency
162
We also showed that energy efficiency policies are an effective way of reducing energy consumption and increasing environmental quality. Most of the energy efficiency policies generate net economic and social benefits, particularly in the medium and long term; government support for energy efficiency projects are therefore wholly justified. Energy efficiency policy should be at the heart of the energy price reform, and revenues generated by raising prices should be allocated to energy efficiency projects in different sectors instead of used as nationwide cash handouts. For example, the revenues generated from raising prices could be allocated in order to promote energy-efficient products and systems by providing support on the supply and demand side. In time, such a policy would generate double benefits, because the growth in energy demand would be mitigated more effectively, and both private households and industry would benefit from lower energy bills due to reduced consumption levels.
In order to achieve the Efficiency scenario targets, a series of non-price policies are also required. For instance, the government could allocate resources to train skilled work-ers to implement energy efficiency measures in buildings and to raise public awareness of energy efficiency. The government could also build capacity in the private sector to encourage its involvement in energy efficiency projects on a small and large scale. In order for Iran’s energy reform to succeed, there must also be an improvement in energy efficiency regulations, better coordination between different government agencies, and an effective enforcement of regulations.
Sustainable Energy Strategy for IranPolicies to Promote Energy Efficiency
163
7Combined Heat and Power (CHP)
7.1 Introduction
The global average efficiency of fossil fuel-fired power plants is less than 40 percent. Two-thirds of the primary energy is lost through conversion, transportation and distribution processes; only around one-third of the primary energy reaches end users in the form of electricity. The majority of power plants do not utilize “waste” heat, which is a by-product of electricity production in thermal power plants. More than 40 percent of global CO2 emissions are related to electricity and heat production (IEA, 2014). These CO2 emissions could be reduced by using combined heat and power (CHP) technology or by trigeneration (combined cooling, heat and power – CCHP).
Combined heat and power production can achieve much greater energy efficiency compared to the separate generation of heat and power, saving between 10 and 40 percent on fuel input (Madlener and Schmid, 2003). The heat created as a by-product heat can also be used for cooling. Such set-ups can therefore offer considerable energy savings and a re-duction of greenhouse gases compared to separate heat and electricity production.
There is a large variety of cogeneration or trigeneration technologies and applications that can be used under various circumstances for different businesses. Continuous heat (or cold) demand is ideal for CHP utilization. Several industry branches as well as private and public services (e.g. paper, food and textile processing, laundries, hotels, hospitals, schools and administration buildings) therefore offer ideal conditions for applying this technology. Table 7.1 shows that CHP can be used in many different forms and on a broad scale.

164
Sustainable Energy Strategy for IranCombined Heat and Power (CHP)
Table 7.1. Potential Uses of Cogeneration Technology in Different Industries Feature CHP
IndustrialCHPCommercial/ Institutional
District Heating and Cooling
Typical customers Chemicals, pulp and paper, metallurgy, heavy processing (food, textiles, timber, minerals), brewing, coke ovens, glass furnaces, oil refineries
Light manufacturing, hotels, hospitals, large urban office buildings, agricultural operations
All buildings within reach of heat networks, including office buildings, individual houses, campuses, airports, industry
Ease of integration with renewables and waste energy
Moderate – high (particularly industrial energy waste streams)
Low – moderate High
Temperature level High Low to medium Low to medium
Typical system size 1 – 500 MWel 1 kWel – 10 MWel Any
Typical technology Steam turbine, gas turbine, reciprocating engine (compression ignition), gas combined cycle (larger systems)
Reciprocating engine (spark ignition), Stirling engines, fuel cells, micro-turbines
Gas engine, steam turbine, gas turbine, waste incineration, gas combined cycle
Energy/fuel source Any liquid, gaseous and solid fuels, industrial process waste gases (e.g. blast furnace gases, coke oven waste gases)
Liquid or gaseous fuels Any fuel
Main players Industry (power utilities) End users and utilities ESCOs, local and national utilities and industry
Ownership Joint ventures/third party Joint ventures/third party From wholly private to wholly public and part public
Heat/electricity load patterns
User- and process-specific User-specific Daily and seasonal fluctuations mitigated by load management and heat storage
Source: IEA, 2008

165
Sustainable Energy Strategy for Iran Combined Heat and Power (CHP)
In all the cases listed in Table 7.1, CHP can meet the base heat demand, and the electricity produced can be used for own supply and/or fed into the national grid. The use of CHP technology offers a number of direct benefits to industry:
It can reduce overall energy costs by creating greater energy efficiency.The technology increases the security of energy supplies. Many industrial processes also depend on the continuous availability of electricity, which can be provided through CHP. Any surplus electricity produced can be fed into the electricity grid, supporting the national supply of electricity.The process is easy to operate and involves low maintenance costs.Mobility: the whole system can be relocated from one place to another, because it comes in packages. It produces lower emissions. Positive net benefit, as power can be sold to the grid or to consumers.
However, there are also barriers and risks associated with CHP technology for industrial users, including the following issues:
CHP technology has higher initial capital costs than conventional heat-only boilers.There are longer break-even payback periods, which might exceed normal industrial development planning.There is a lack of information and skills related to CHP technology.Uncertainty looms over future fuel and electricity prices. A rising fuel price directly affects the CHP plant’s heat and power generation costs. Industrial CHP solutions can sell surplus electricity on the market and purchase electricity on top of the electricity it produces as required. The price of electricity relative to fuel prices therefore is the main determinant of savings generated by CHP plants (Brown, 1996).
Due to the financial risks involved, firms may need additional support before investing in CHP technology. In the following we describe the situation and support policies imple-mented in Germany as well as the current status of CHP in Iran.
7.2 Cogeneration in Germany
7.2.1 Development of CogenerationCHP plants in Germany produced 96 TWh of electricity in 2013, equivalent to 16.2 percent of the German net electricity production in 2013. The share of heat from CHP accounted for about 20 percent of the total heat market (below 300°C). In total, cogeneration plants saved 56 million tons of CO2 against an uncoupled generation of heat and power (Prognos, 2015). A study conducted by Prognos et al. 2014 identified a microeconomic CHP potential of 170 TWhel at the firm level and a macroeconomic potential of 240 TWhel at the national level.
Over 80 percent of electricity generated by CHP is produced by the public (50 TWh) and the industrial (30 TWh) sector. As Figure 7.1 shows, biomass-fired and small-scale

166
CHP plants grew the strongest between 2005 and 2013; CHP in the industrial sector grew only slightly and declined slightly in the public supply.
Figure 7.1. Development of Net Power Production by CHP Plants in GermanySource: Authors’ illustration, data taken from Prognos et al., 2015
One reason for the moderate development of CHP in Germany is that the large utilities had consistently attempted to stamp out the cogeneration efforts of businesses and commu nities, because such investments would have cut the sales revenues of their own large power plants.
The liberalization of the electricity market in Germany in 1998 led to even greater efforts to hamper cogeneration. Large power producers suffering from overcapacities lowered their prices to a level below costs, meaning that some of the cogeneration plants installed were unable to operate profitably.
7.2.2 Policy Instruments Targeting CogenerationTo take account of the negative effects of liberalization on cogeneration, Germany passed its Combined Heat and Power Act (KWKG) in March 2002. The goal was to reduce carbon emissions by 23 million tons annually by 2010 through cogeneration. This target was not met.
The Combined Heat and Power Act was revised in January 2009 and in July 2012. The objectives were to more or less double the share of electricity from cogeneration in Germany to 25 percent by 2020; to remove barriers in the electricity system; to foster the new construction of combined heat and power plants; and to provide incentives for investing in district heating or cooling grids and storage systems.
The current conditions for CHP plants in Germany are as follows:Electricity from CHP can be fed into the grid. Electricity companies must accept this electricity and pay for it accordingly. The feed-in tariff is fixed quarterly and coupled to the average base-load price at the Leipzig-based EEX exchange (between about € 0.03 and € 0.07 per kWh between 2006 and 201433).
33 See www.bhkw-infozentrum.de/statement/ueblicher_preis_bhkw.html
Industrial CHP Public CHP CHP < 1 MWel Biomass-Fired CHP
20
40
60
80
100
TWh e
l
02005 2006 2007 2008 2009 2010 2011 2012 2013
Sustainable Energy Strategy for IranCombined Heat and Power (CHP)

167
On top the operator of a CHP plant receives compensation for not using the upstream interconnected grid (about € 0.002 per kWh).An additional bonus of between € 0.021 (CHP plants > 2 MWel) and € 0.0541 (< 50 kWel and fuel cells, independent of size) per kilowatt-hour has to be paid by the grid opera-tor, who passes on the costs to customers as part of the grid tariffs.CHP producers are exempted from the energy tax. The tax on natural gas is € 0.0055 per kWhfuel.
In addition to the Combined Heat and Power Act, the Federal Environment Ministry has been subsidizing small CHP plants with an electric capacity of no more than 20 kW since April 2012.34 New CHP plants can obtain a state grant, which is related to the electric pow-er of the system. For very small CHP plants – typically installed in detached and semi-deta-ched homes – with an electric power capacity of 1 kW, the basic grant (see blue columns in Figure 7.2) is € 1,900. Bigger plants with an electric capacity below 20 kW can receive a grant of up to € 3,500. Since the revision of the funding directive on January 1, 2015, mini CHP plants can benefit from two additional bonus payments: “Power Efficiency Bonus” (red columns) is granted for plants with a minimum electric efficiency of more than 31 to 35 percent and a “Heat Efficiency Bonus” (green columns) is designated for plants with condensing boiler technology. Hence the maximum available funding is between € 3,515 for a 1 kWel plant and € 6,475 for a 20 kWel plant.
Figure 7.2. State Grants by the Federal Environment Ministry for Small CHP plants, Depending on Plant SizeSource: Authors’ illustration, data taken from BAFA 201535
34 Mini CHP Directive35 www.bafa.de/bafa/de/energie/kraft_waerme_kopplung/mini_kwk_anlagen
2,000 €
3,000 €
4,000 €
5,000 €
6,000 €
7,000 €
0 €<1 >2 >4 >6 >8 >10 >12 >14 >16 >18 <20
1,000 €
Electric outputBase Funding (100%)
Power Efficiency Bonus(60% of BF)
Heat Efficiency Bonus (25% of BF)
Sustainable Energy Strategy for Iran Combined Heat and Power (CHP)

168
To be eligible for the grant, the power system with a maximum of 20 kWel must meet the following conditions:
The overall efficiency of the system must average at least 85 percent over the year.The plant must be “highly efficient” (according to the definition of the EU CHP Directive), meaning that primary energy savings (against uncoupled production of heat and power) of at least 15 percent (up to 10 kWel) or 20 percent (up to 20 kWel) must be achieved.The power system must be combined with a heat storage system of at least 60 liters per installed kWth with intelligent heat storage management.The power plant must have a control system that can be used for heat and power- orientated operation.The power plant cannot be used in areas that must be connected to heat grids.A maintenance contract must be concluded.The information and communication technology must be capable of communicating with and reacting to the power market (for units of 10 kWel and more).
According to these provisions, small CHP plants with a capacity of 5-50 kW electric power can be used profitably if a corresponding demand for heat exists and the power generated is consumed on the owner’s premises. However, the latter condition can usually only be met by commercial buildings such as indoor swimming pools, hospitals, schools, hotels and sports centers or in bigger apartment buildings where the electricity generated from CHP can be sold to the households living there.
The theoretical potential of small-scale CHP in Germany is huge. About 26 million apartments use central heating, mainly gas boilers. Only about 10 percent of these boilers can be considered state of the art. Some 20 percent of these boilers are older than 24 years, with an energy efficiency of less than 65 percent (BMU, 2012). Many could be replaced by efficient mini or micro combined heat and power plants.
7.3 Cogeneration in Iran
7.3.1 Development of Cogeneration and Policy InstrumentsIn Iran, 45 CHP units have already been installed, with an overall capacity of 378 MW; the total capacity of issued licences exceeds 3,000 MW. The capacity of each unit is between 1 and 25 MW. The technologies involved come from Germany, Great Britain and China. The costs range from € 350 to € 450 per kW plus maintenance and operational costs which are about 10 percent of the installed costs per year. Due to high thermal efficiency (85 percent), much less fuel is burned than with steam turbines, gas turbines or even combined cycles. Assuming a 1 MW CHP system operates for 8,000 hours per year with 80 percent efficiency, an average of 1.5 million cubic meters of natural gas can be saved each year compared to conventional power plants. This saving is equivalent to US$ 270,000 per year.
Five or six different types of CHP generators are manufactured in Germany, Great Britain and China. Given the abundance of natural gas and its well-established grid in Iran, the CHP generators recommended for Iran are small gas turbine and gas engine plants. These
Sustainable Energy Strategy for IranCombined Heat and Power (CHP)

169
CHP plants are used in industry, hospitals, sports centers and large residential buildings. In 2010, the Ministry of Energy passed a regulation to support the use of CHP generators with a capacity of up to 25 MW in Iran. The regulation provides for the following support package.
Pre-payment of up to 15 percent of the sale contract (25 percent if sold in a bilateral agreement) for five yearsFinancial help to install the plant or connect it to the natural gas grid Financial help to connect the power generated to the gridAccess to a low-interest loan (up to 1.6 billion rials with an interest rate of 12 percent)Provision of free land Guaranteed fuel supply all year roundThe possibility to sell the power to consumers directly at a price 20 percent higher than the base price, which is 900 rials per kWh (US$ 0.035 at the 2015 exchange rate), pro-viding a guarantee to supply electricity to CHP customers A power purchase agreement with the utility company at the base rate plus 20 percent.
Furthermore, Iran has a support plan to encourage investment in small-scale generators. Small-scale generators are defined as generators that can be connected to the national electricity grid with a capacity of no more than 25 MW. The following types of small-scale generators exist:
Gas reciprocating enginesMini steam/gas turbineMicro turbineMicro wind powerMicro hydroPhotovoltaicFuel cell
This plan to support small-scale generators consists of the following items:A guaranteed rate for purchasing the power generated (prepayment of up to 25 percent)Low-interest loansA long-term lease for landA guaranteed supply of fuel (for nine months per year)A purchase agreement with the utility company at a guaranteed rate plus 10 percent
However, the development of CHP systems in Iran also faces the following problems and barriers:
A lack of simple ways to finance such projectsDifficulties in accessing foreign currencyEconomic recession and uncertainties for long-term investmentAn inefficient banking system for investors applying for industrial loansLow feed-in tariffs for the electricity produced
Sustainable Energy Strategy for Iran Combined Heat and Power (CHP)

170
Very long delays in payment when the Iran Power Generation and Transmission Company (Tavanir) purchases the electricity producedConstant feed-in tariffs in 2010, 2011 and 2012A lack of coordination between governmental organizations in supporting the develop-ment of CHP systemsFuel supply uncertainties in winter and after the 5-year periodA lack of appropriate infrastructure for developing CHP systems, such as consultancy, engineering, inspection and maintenance companies, as well as standards, and so on.
7.3.2 A Brief Feasibility Study We consider two scenarios with two different types of CHP. The first scenario is a CHP with a total capacity of 400 kW; the second scenario is a CHP with a total capacity of 1,000 kW. Based on the purchase price announced by the Ministry of Energy and installation and maintenance costs, both scenarios generate a profit. The details are as follows:
Scenario 1: Installation of a CHP plant with a capacity of 400 kW The purchasing prices announced by the Ministry of Energy for the next five years are presented in Table 7.2.
Table 7.2. The Purchase Price of Electricity (Rials/kWh)Year 1 2 3 4 5
Price* 900 990 1,090 1,200 1,320
* Based on 2015 exchange rates, 900 rials is equivalent to about US$ 0.035. Prices are expected to adjust to inflation rates (assumed to be 10 percent). These purchasing prices need to be adjusted with the new prices after the energy price reform.
Assuming 8,000 hours per year, the total revenue can be calculated using the following formula:
Total revenue = (400 kW) x (8,000 h/year) x (purchase price: rial/kWh)
The projected total revenues for five years will be 17,600 million rials. Given the initial investment costs of 7,680 million rials (US$ 600/kW and 32,000 rials/US$) and operation and maintenance costs of 768 million rials per year, the internal rate of return is 23 percent.
Scenario 2: Installation of a CHP plant with the capacity of 1,000 kW Assuming 8,000 hours per year and given the purchase prices above, the total revenues in five years will be 44,000 million rials. Given the initial investment costs of 16,000 million rials and operation and maintenance costs of 1,600 million rials per year, the internal rate of return is 31 percent.36
36 The figures should be interpreted cautiously, as electricity prices and exchange rates will continue to fluctuate. For instance, the US dollar was traded at about 40,000 rials in February 2013, and 35,000 rials in October 2012, but 32,000 rials in March 2015. Prices are expected to adjust according to inflation rates once prices have settled.
Sustainable Energy Strategy for IranCombined Heat and Power (CHP)

171
8Energy Price Reform and Efficiency
8.1 Introduction
Energy prices are often influenced directly or indirectly by government policies around the world. In many OECD countries, governments subsidize energy and levy taxes on energy consumers. The taxes, however, far exceed the subsidies37 (Guillaume and Zytek, 2010; Dube, 2003; Baig et al., 2007; Dartanto, 2013; IMF, 2008). For instance, in 2003, the total energy taxes in the seven largest OECD countries was US$ 223 billion, which was at least seven times more than the total amount of energy subsidies for the OECD as a whole (IEA, 2006). In recent years, the shares of subsidies by types of energy have changed in favor of renewable energy production. This policy is in line with the objectives of energy security, which involves reducing reliance on oil imports and protecting the environment by decreasing fuel oil or coal consumption and encouraging environmentally friendlier energy sources. In non-OECD countries, with the exception of China, most energy subsi-dies go to consumers to keep end-user prices below the economic cost of supply or inter-national prices. In many non-OECD countries, the lion’s share of energy subsidies is allocated to electricity. However, oil products such as gasoline are also subsidized in some oil- exporting countries such as Iran (IEA, 2011; World Bank, 2010).
In this chapter, we analyze energy price subsidies and their objectives and effects. We focus on the recent energy price reform in Iran.
8.2 Energy Subsidies: Objectives and Challenges
There are two main objectives behind providing energy subsidies in developing countries such as Iran. First, subsidies tend to make energy more affordable for poor households that would otherwise be unable to pay the full economic cost. Second, energy subsidies tend to protect domestic producers against foreign competition by keeping energy costs low (Fattouh and El-Katiri, 2013). Unfortunately, subsidies and their sectorial allocation fail to achieve these objectives in the long run. Despite the objective to help low-income groups, energy subsidies are regressive because they benefit high-income groups dispro-portionally due to their higher energy consumption (Vagliasindi, 2012; Arze del Grandado 37 We use a broad definition of the term ‘subsidy’ here. A subsidy can be a direct payment by the government to an agent,
producer or consumer to bring down the price and make the good affordable. However, a broader view of subsidy includes the opportunity costs associated with energy policy. For instance, granting a non-refundable tax credit to energy producers in developed countries and keeping energy prices lower than international prices in developing countries are also considered subsidies, even though no direct payment is involved. The former is used for accounting and budget analysis, whereas the latter is used for economic decision-making and analysis.

172
Sustainable Energy Strategy for IranEnergy Price Reform and Efficiency
et al., 2012; Lipton, 2013). This is particularly true in the case of oil products, due to the flat price for all levels of consumption, and the transportation sector, where the distribution of car ownership is very uneven.
The second objective, which is part of the “industrialization policy” or “infant industry policy” in economic development, may work if there is a scheduled, careful plan to invest in certain industries that would benefit from economic growth in the long run. Although industrialization policy has been a success in some East Asian countries such as South Korea, it has not worked well in Iran. To protect its domestic industries, Iran has provided capital and energy subsidies as well as regulatory support to its infant and growing indus-tries for more than three decades. And yet most of these industries are still unable to stand alone and compete in the global market. The long-term policy of providing cheap energy to industry has led to the inefficient use of energy and a lack of incentives to improve technology and to innovate. It is evident that the policy of heavily subsidizing industry cannot continue any longer due to domestic restrictions and international pressure, partic-ularly if Iran were to join the World Trade Organization.
The long-term energy subsidy program in Iran has caused many economic and social pro-blems, some of which are mentioned below.
Energy consumption and waste have increased.Energy intensity has increased (Figure 8.1) and there are fewer incentives to use more efficient technologies and to innovate. The energy intensity index in Iran has increased by an average of around 3.4 percent per year over the past 40 years. The index is 50 to 100 percent higher than that in the Middle East and European Union countries, respec-tively.The environment has been degraded due to a decline in air quality, particularly in urban areas.38 Energy consumption caused 480 million tons of CO2-equivalent emissions in 2012, which is expected to double by 2030 if the current trend continues (Moshiri et al., 2012). A heavy burden has been placed on the government budget due to higher direct pay-ments and foregone income owing to higher oil exports.39 Direct energy subsidies have increased from 2 to 8 percent of the government budget since 2004. Energy subsidies also crowd out government spending on infrastructure and social programs such as health care and education. Oil products are smuggled across borders to neighboring countries, where energy prices are higher than in Iran.The unfair distribution of income has been exacerbated by channeling more subsidies to richer households, because they consume more energy than their poorer counter-parts.
38 Fuel oil subsidies may have a positive effect on the environment if they discourage deforestation in rural areas. The size of this subsidy, however, would be very small given the small rural population and their low consumption level.
39 OPEC recommendations are for total production and not for exports. Iran can, therefore, always export more oil and earn foreign income without violating the OPEC decision, should its domestic consumption fall.

173
Sustainable Energy Strategy for Iran Energy Price Reform and Efficiency
The problems posed by energy subsidies have been more prominent in the case of gasoline consumption, which receives one-third of total energy subsidies. In 2010, the price of gasoline was around US$ 0.10 per liter, which is about a quarter of the price in the Persian Gulf and about one fifteenth of prices in Europe. The very low price of gasoline has en-couraged a high level of gasoline consumption in large urban areas, especially in Tehran. Gasoline consumption grew by an average of 10 percent annually over the period 2001-2008, with consumption levels exceeding 70 million liters per day. Energy subsidies have also led to a high concentration of air pollutants, in addition to other social and economic problems. To accommodate the rapid growth in gasoline consumption, the government drew on the Oil Reserve Fund to import about 40 percent of domestic consumption in 2007, which made Iran the second biggest gasoline importer in the world after the United States. In June 2007, the government instituted a gasoline rationing system to curb the rapid growth of consumption. The rationing system allowed every owner of a private passenger car to purchase 30 liters of gasoline per month at the fixed price of US$ 0.10 per liter; any gasoline purchased above this quantity was charged at US$ 0.40 per liter. The rationing scheme had no significant effect on domestic consumption, but appeared to reduce the amount of gasoline smuggled to neighboring countries.40
Figure 8.1. Total Primary Energy Consumption and Energy Intensity in IranNotes: Total Primary Energy Consumption (TPEC) is in quadrillion BTU (right axis); energy intensity is in TPEC (BTU) per 2005 US$ of GDP (market exchange rates).Source: The Titi Tudorancea Bulletin, Global Edition (https://www.tititudorancea.com/)
40 In 2008, Iran had one of the lowest prices for gasoline in the world (approximately US$ 0.10 per liter). In contrast, the price of gasoline in neighboring Turkey was one of the highest in the world (US$ 1.88 per liter), paving the way for smuggling (GTZ, 2008).
2
3
4
5
6
7
8
9
000
15,000
20,000
25,000
30,000
35,000
40,000
45,000
0
1
0
5,000
10,
Energy Intensity (TPEC/US$) TPEC (Quad. BTU)

174
8.3 The Energy Price Reform in Iran
8.3.1 Removal of Energy SubsidiesThe energy price reform law, also known as the Targeted Subsidies Plan or the Subsidy Removal Plan, was passed by the Iranian parliament in 2009; the government began im-plementing it in February 2010. According to the plan, energy prices were to be increased up to border prices over the course of five years, and 50 percent of the proceeds was to be distributed in the form of cash payments to households. The remaining 50 percent was to be used to support industries affected by the energy price hikes, such as public transportation and infrastructure (30 percent), and to cover discretionary expenses (20 percent). The subsidy removal law states:Article 1: The government is obliged to observe this law, and correct the prices of energy carriers.1. By the end of the Fifth Five-Year Development Plan, the price of gasonline, oil, liquefied
gas and kerosene may not be less than 90 percent of free on board (FOB) prices. 2. The price of natural gas will gradually increase to at least 75 percent of export prices
net of taxes, and transportation costs.
The plan increased the price of gasoline from 1,000 to 4,000 rials per liter for the monthly ration of 60 liters per passenger car, and 7,000 rials per liter exceeding that amount.41 The price of natural gas increased from 100-130 to 700 rials per cubic meter for households and from 50 to 800 rials per cubic meter for power plants. The price of electricity was raised from an average of 160 to 450 rials per kWh (Figure 8.2). The marginal rates increased with the level of consumption at various rates in different sectors and regions (Organization for the Support of Consumers and Producers, 2011). The total budget for the plan was 54,000 billion rials for a period of 15 months (44,000 billion rials for 12 months). To reduce the impact of higher prices, the government paid 455,000 rials (about US$ 45 based on the exchange rate at the time) per month to all individuals registered online.
The law was successfully implemented in the first year, raising prices and distributing the cash handouts to households as planned. However, it was not possible to initiate the second phase of the plan because problems started to occur. Following long and heated debates in parliament as well as serious challenges and opposition to the government’s proposal, the second phase of the reform was finally passed by parliament in May 2012. The main concerns of parliament with regard to the second phase of the plan were as follows:
The government failed to implement the redistribution allocation, particularly to in-dustry, as planned in the first phase.The new proposal required another hike in energy prices, rather than a smooth transition, which would lead to very high inflation rates. Some speculated that the proposal would increase the price of gasoline to 20,000 rials per liter, a five-fold increase.The government overestimated the revenue it would generate by removing subsidies, and it was not possible to realize the proposed budget.
41 Based on the exchange rate in 2010 (US$ 1 = 10,000 rials), the price of gas was about US$ 0.10 per liter, which increased to US$ 0.40 per liter.
Sustainable Energy Strategy for IranEnergy Price Reform and Efficiency

175
Figure 8.2. Energy Prices in Iran (rial/unit of energy)Notes: The price of gasoline is on the right axis. The prices of electricity and natural gas are for household consumption; the prices of gasoline are for regular gas for the 60 liter monthly quota.Sources: Energy Balance (2010) and Ministry of Oil and Ministry of Energy Report, Moshiri (2013)
The government’s initial proposal for the second phase included the following items:An increase of the plan’s budget to 135,000 billion rialsSelf-exclusion from the cash handout program for high-income households A 280,000 rial increase (61 percent increase) in cash handouts to those people remaining on the list.
Dissatisfied with the revisions to the second phase of the plan, the government was reluc-tant to implement the plan, and decided to postpone it. Another reason for stopping it was a development on the foreign exchange markets, which led to an approximately 70 percent depreciation of the rial within the space of under three months in late summer 2012. The new government has continued to adjust energy prices, but prices have not caught up with inflation rates. Given the budgetary pressure, cash handouts were also adjusted to exclude some high-income households.
8.3.2 The Effects of the Energy Price Reform The main two objectives of the plan were to decrease government spending on energy subsidies, particularly direct subsidies for gasoline, and to reduce energy consumption. Both objectives were met to a certain extent in the first year of implementing the policy. More specifically, the government collected 44,000 billion rials (55,000 billion rials in 15 months) in additional revenue due to the increase in energy prices, 90 percent of which was distributed to households in the form of monthly cash handouts. Furthermore, overall
500
1,000
1,500
2,000
2,500
3,000
3,500
4,000
4,500
200
400
600
800
1,000
1,200
1,400
0
500
0
Electricity (rial/kWh) Natural Gas (rial/m3)
Gasoline (rial/liter)
Sustainable Energy Strategy for Iran Energy Price Reform and Efficiency

176
energy consumption declined, albeit at an insignificant rate. For instance, gasoline consumption decreased from about 64 to 59 million liters per day, even though around 1 million cars per year were added to Iran’s fleet. It is not yet known how much of this decline in consumption was due to a reduction in smuggling to neighboring countries and changes in consumption behavior. Following a decline in electricity consumption during the first months of the plan, it rebounded, increasing by about 5 percent in the first three months of 2012.
Although the plan was relatively successful in partially removing energy subsidies and administrating regular cash handouts ‒ unprecedented action that was viewed with criticism in the general acceptance of the reform ‒ it could not continue as planned. This was due to shortcomings in the program’s design and the emergence of new challenges associated with government policies and a tightening of international sanctions against Iran’s oil exports and financial sector.
The main problem with the energy reform was its focus on price changes as the only mechanism to reduce energy consumption. Although energy prices are one of the main factors driving energy demand, their overall effect on energy consumption is limited. This is because price elasticities are low and income elasticities are high, and responses to higher prices differ across households with different income levels. A recent study by Moshiri (2015) provides important insights into the consumption and distribution effects of Iran’s energy price reform. According to this study, based on household budget surveys for the 2001-2008 period, the price elasticities of demand for energy are low, particularly among households with a higher level of energy consumption. This implies that the energy price reform will have no dramatic impact on energy consumption. Moreover, income elastici-ties of energy demand are high, particularly among low- and middle-income groups, indi-cating that any compensation package will likely more than cancel out the price effect on energy consumption.42 Therefore, if the objective of the energy price reform is to reduce energy consumption in Iran, the current policy of price increases alone would be unable to meet this objective. In fact, the uniform nationwide cash handout scheme, intended to alleviate the adverse impact of energy price increases on household budgets, would only have a redistribution effect, which may prove counterproductive to the objectives of energy consumption control.
The second concern with the energy price reform is its distributional effects. Energy subsidies are regressive since richer households consume more energy than their poorer counterparts (Figures 8.3 and 8.4). However, the share of household income spent on energy is higher for poorer than for richer households (Figure 8.5). Therefore, removing subsidies and increasing energy prices may disproportionately affect poorer households, since they would need to cut their basic level of energy and other necessities, such as food, when prices rise. To avoid such disproportionate impacts of higher energy prices on the
42 The US$ 45 compensation per person per month may seem to be too small to generate any significant change in energy and non-energy consumption. However, this may only be true for rich urban households, whose compensation-income ratio was about 6 percent, but not for low- and middle-income households whose compensation-income ratios exceeded 50 percent.
Sustainable Energy Strategy for IranEnergy Price Reform and Efficiency

177
poor, the government could spend the subsidies on programs mainly used by the poor. Alternatively, the government could return the proceeds from removing subsidies to households, either equally or to a targeted group. The energy price reform in Iran com-pensated all households equally by depositing a monthly sum directly into individuals’ bank accounts. This policy is usually difficult to implement in developing countries, where many poor households, particularly in rural areas, do not have a bank account. Nevertheless, the process worked reasonably well in Iran because the government was able to communicate the plan effectively to the public well in advance, providing the necessary infrastructure and manpower, first in selected cities and then throughout the country. The equal distri-bution of cash handouts helped low-income households more than high-income house-holds. This was because low-income households received a larger sum (on average more than 50 percent of their income) than their richer counterparts due to their larger house-holds and because the average handouts were much higher than their energy expenditure.43 However, the redistribution of income in favor of poorer households proved short-lived due to unfavorable changes in macroeconomic conditions, such as higher inflation and unemployment, which disproportionately affect poorer households.
Figure 8.3. Total Household Energy Expenditure by Income Group (2001-2008) (million rials)Note: The low-, middle- and high-income groups are the weighted average of the first three income deciles, the four middle income deciles, and the last three income deciles, respectively.Source: Moshiri (2015)
43 Salehi-Isfahani et al. (2014) show that the uniform cash handout program lessened income inequality in the first three months of the reform, during which households received cash in advance.
2
3
4
5
20012002
20032004
20052006
20072008
20012002
20032004
20052006
20072008
0
1
Low Income Middle Income High Income
Urban Rural
mill
ion
rial
s
2
3
4
5
0
1
mill
ion
rial
s
Sustainable Energy Strategy for Iran Energy Price Reform and Efficiency

178
Figure 8.4. Total Energy Expenditure by Household and Energy Types (Average 2001-2008) (million rials)Note: The low-, middle- and high-income groups are the weighted average of the first three income deciles, the four middle income deciles, and the last three income deciles, respectively
Figure 8.5. Household Energy Expenditure Shares by Income Group (2001-2008)Note: The low-, middle- and high-income groups are the weighted average of the first three income deciles, the four middle income deciles, and the last three income deciles, respectively.Source: Moshiri (2015)
High IncomeMiddle IncomeLow Income
15
20
25
30
0
5
10
15
20
25
30
0
5
10
GasolineNatural GasElectricity GasolineNatural GasElectricity
Urban
mill
ion
rial
s
mill
ion
rial
s
Rural
Urban Rural
4%
6%
8%
10%
12%
14%
0%
2%
4%
6%
8%
10%
12%
14%
0%
2%
Low Income Middle Income High Income
20012002
20032004
20052006
20072008
20012002
20032004
20052006
20072008
Sustainable Energy Strategy for IranEnergy Price Reform and Efficiency

179
The third major problem with the energy price reform was the lack of energy efficiency measures. An energy price reform was necessary, but it fell well short of being an adequate policy for addressing energy efficiency problems. Reform must involve explicitly initiating a program with a specific timeline and measures to achieve energy efficiency. In fact, energy efficiency should be the most important objective of the energy reform, as it will ensure less consumption and higher national savings and growth in the long run. Evidence suggests that the government’s efforts to raise energy efficiency have even declined because policy- makers and officials thought that price changes would automatically solve the inefficiency problem in the energy market.
The results of the scenario study presented in Chapters 3 and 4 show that Iran’s energy saving potential over the next 15 years exceeds 40 percent. Removing subsidies is a prerequi-site for instituting energy efficiency measures, but should be accompanied by a series of non-price policies before it can improve efficiency levels. For instance, the proceeds ge-nerated by removing subsidies could be used to offer monetary and non-monetary in-centives to producers who adopt energy efficiency measures. These energy efficiency support programs could include tax rebates, long-term subsidized loans, flexible output pricing, access to foreign exchange at preferred rates, transfer of know-how, on-the-job training programs, and research and development. The revenue generated by removing subsidies could also be used to increase demand for high efficiency products through programs such as providing small loans to households so that they can purchase new, efficient appliances; buying back old, inefficient appliances; distributing cheap, low-consumption lamps; providing loans and technical assistance to enable old buildings to be retrofitted; and raising public awareness of energy efficiency. For example, one of the policies to promote the use of more efficient appliances is to subsidize producers of high-efficiency refrigerators and freezers. The policy enables domestic producers to receive subsidies if the efficiency of their products is increased from below level D to above level C. A cost-benefit analysis shows that the net benefit of subsidizing the pro-duction of high-efficiency refrigerators and freezers is positive. The subsidy amount would equal the energy savings generated by higher efficiency refrigerators and freezers for five years (Ismaielnia, 2010).
The fourth problem with the plan was the lack of real support for industry. The govern-ment did not honor its commitment to support industries – after all, 90 percent of the proceeds generated by removing subsidies was allocated to the household cash handout program. Most Iranian industries were established a long time ago, based on the im-port-substitution strategy of the 1970s. As such, they relied heavily on government protection in the form of high tariffs and subsidies on capital, taxes and energy. The removal of energy subsidies placed a huge burden on energy-intensive industries, such as steel and car manufacturing, food and beverages, power plants and petrochemicals. Although the energy price reform was necessary to revitalize inefficient and uncompetitive industries, a sudden energy price shock led to disruptions in production and higher unemployment rates in many industries. Furthermore, the price control policy did not allow industries to raise prices to cover their increasing costs. The price reform should have laid out a detailed plan
Sustainable Energy Strategy for Iran Energy Price Reform and Efficiency

180
to support industries during the transition to a high-efficiency stage to avoid the high so-cial and economic costs of increasing inflation and unemployment.
The fifth concern is the inflationary effects of the reform. The higher inflation rate decreases the real price effect of the energy price reform. The inherent problem with the energy price reform, where nominal prices are targeted, is the race between energy prices and the overall price level. The energy price reform represents a one-time change in prices and does not necessarily need to increase inflation over time. However, if it feeds into in-flationary expectations and higher consumption by low-income groups due to a higher marginal propensity to consume, it may cause a spiral effect. If the energy price reform increases the overall price level, the relative price change for energy carriers will be reduced. In the extreme case, the price reform will have no effect on consumption if relative prices remain unchanged, that is, if overall prices increase by the same proportion as increases in energy prices.
The inflationary effects of removing subsidies started with a lag of about eight months, particularly in energy-intensive products such as food and beverages. Furthermore, a huge depreciation of the rial (more than 70 percent) in January 2011 and September 2012 spurred inflationary expectations.44 In addition, the government continued its expansionary fiscal and monetary policy, spending aggressively on public projects such as cheap housing on a large national scale. As a result, the budget deficit increased further, and financing deficits by borrowing from the Central Bank led to higher inflation rates. In the second year of the plan, energy prices increased by a factor of 4, but the inflation rate by a factor of 1.72 (the official statistics by the Central Bank indicate that inflation increased from 10 percent before the reform to 23 percent one year after the reform, and to about 40 percent in the second year of the reform). The distributional effect of cash handouts on household budgets is explained in Box 8.1.
The higher inflation rate had two major effects on the reform. First, since energy price targets were nominal prices, an increase in overall prices caused the change in the relative price of energy to decline, weakening its original effects on energy consumption. To ensure the desired effect on energy consumption, the reform needs to constantly revise prices to ensure that relative price targets are met. Otherwise, this would trigger a spiral effect, which would have an adverse impact on the entire economy. Second, the real value of cash handouts decreased and the distributional effects of the plan were reduced or neutralized. The equal payment of cash handouts to all individuals was intended to ensure that low-in-come groups benefit more than their high-income counterparts, alleviating the overall im-
44 Although the depreciation of the exchange rate was good news to exporters of manufactured and agricultural products, it led to downward pressure on imports of intermediate goods for exporting enterprises. When exports rely on imports of intermedi-ate goods, any depreciation of the local currency may not increase net exports, since higher revenues from exports may be offset by the higher cost of imports. Furthermore, the increase in volatility of the exchange rates due to uncertainties and the lack of consistent and transparent policy by the government was another reason why the huge depreciation of the rial failed to stimulate exports. As a recent firm-level study by Moshiri and Darvishi (2012) shows, the depreciation of the exchange rate was one of the significant factors affecting the exit rate of exporting firms in Iran. Therefore, the overall net effect of the depreciation of the rial on industry is unclear.
Sustainable Energy Strategy for IranEnergy Price Reform and Efficiency

181
pacts of rising prices on poorer households. The inflationary effect of the reform, however, eroded its distributional effect, weakening its general acceptance among those affected the most. The government must either continually raise cash handouts to keep up with inflation rates, or it must find alternative ways to support poorer households. Either way, significant amounts of revenue would be required to implement such social programs, putting con-siderable strain on the government budget.
The final issue is the lack of a program for generating structural change in the energy market and the economy. The energy market and many other industries in Iran are fully controlled by the public sector, which may not necessarily allocate resources efficiently. If no substantial structural changes are made in industry and the energy market, enabling the private sector to play a meaningful role in the economy, it will be very hard to achieve energy efficiency.
8.4 Conclusion
The energy price reform led to a dramatic increase in energy prices (a 400 percent in-crease in gasoline prices) by removing subsidies and distributing the proceeds equally to individuals to compensate for higher prices. The sudden spike in energy prices was ex-pected to curb energy consumption, but the response was not overwhelming due to the low price elasticity; the income effect of cash handouts; and increasing inflation.
The empirical studies based on household budget surveys show that the energy price elasticities of demand are low among all income groups, particularly high-income house-holds, implying that an increase in energy prices will not have any dramatic impact on household energy consumption. In addition, low-income households will not reduce their energy consumption significantly, due to their already low energy consumption level and
Box 8.1. The Real Effect of Cash Handouts on the Household Budget at Different Income LevelsA back–of-the-envelope calculation indicates that an urban low-income household of five with an annual income of 65 million rials in 2010 received 27.3 million rials in cash handouts for one year, increasing its total income to 92.3 million rials. The real income (adjusted by the after-reform inflation rate minus the before-reform inflation rate) would be 81.62 and 67.23 million rials at the end of the first and second year of the reform, respectively. In other words, the net benefit of the reform to a typical low-inco-me household was positive. However, an urban middle-income household of four with an annual income of 130 million rials would have benefited in the first year, but been worse off in the second. A typical urban high-income household of 3.5 with an annual income of 270 million rials would have been worse off in both years of the reform. The same pattern applies to rural households.Note: The average income of households is calculated using the Household Budget Survey (2008); a 10 percent annual increase was applied for subsequent years.
Sources: Statistical Center of Iran, and Central Bank of Iran.
Sustainable Energy Strategy for Iran Energy Price Reform and Efficiency

182
the income effect of the cash handout. Given the small amount of energy consumed by low-income households and their high marginal propensity to consume, part of the cash handout will be used to cover higher energy prices and the rest on non-energy items. If these non-energy items include energy-intensive capital, such as larger TV sets and newer, larger appliances, then the cash handout policy may lead to even higher energy consumption.
Overall, the energy price reform was a breakthrough in the Iranian energy sector, which could raise productivity and bring prosperity to the economy. The cash handout system was designed well, contributing to its successful implementation and public acceptance of the reform. However, focusing mainly on the monetary aspect of the plan and administrative affairs, the reform paid too little attention to energy efficiency. It is true that higher energy prices will partly induce energy efficiency, and that the effect will take a long time to materialize because of the capital changes required. Nonetheless, relative prices of energy need to remain high for a long period for the public to consider and develop efficiency measures. Furthermore, a series of efficiency policies and regulations are needed to facilitate the transition to a high energy efficiency regime. One of the main weaknesses of the reform was the lack of efficiency measures for households and industry in the transition period. Focusing on the household redistribution scheme, the reform treated industry as a residual, and failed to provide the much-needed support, even at the level stipulated in the Energy Reform Policy law.
The energy price reform is a golden opportunity to raise awareness and educate people and businesses about the importance of energy conservation and efficiency measures. It also represents a great opportunity to embark on a long-term investment plan for developing large-scale alternative renewable energy resources in Iran.
Sustainable Energy Strategy for IranEnergy Price Reform and Efficiency

183
Appendix

184
Sustainable Energy Strategy for IranAppendix
A. Work Flow for the Energy Scenario Analysis
Sectors
Energy Forms
Drivers
Policy
Data
Assump!ons
Results
EfficiencyBAU
Households Industry Transport Other
Popula!on, GDP,policy and plans
Value added, technology, energy intensity,
structural changes, industry plan and policies,
penetra!on rate
Popula!on, GDP, specific energy consump!on,
technology, policy, structural changes
Popula!on, GDP, structural changes,
policy and plans
Gasifica!on, rural electrifica!on
Gasifica!on, energy management
for large plants
Public transport, road quality upgrades,
efficient vehicles
Gasifica!on,rural electrifica!on,
priva!za!on
Household surveys, aggregate fuel consump!on
2-digit manufacturing survey, audi!ng reports
Aggregate and survey data Aggregate data
39% fuel and42% electricity saving
under Efficiency scenario
36% saving under Efficiency scenario
33% saving under Efficiency scenario
26% saving under Efficiency scenario
Structural changes, gasifica!on, rural electrifica!on, fourth and fi#h development plan, 20-year vision
Energy efficiency regula!ons in housing and manufacturing industry, lower energy intensity, technological changes, structural changes,
renova!ons, energy price reform, educa!on
Kerosene, gas oil, LPG, natural gas, electricity
Kerosene, gas oil, LPG, natural gas, electricity
Gasoline, gas oil, CNG Kerosene, gas oil, LPG, natural gas, electricity

185
Sustainable Energy Strategy for Iran
Sectors
Energy Forms
Drivers
Policy
Data
Assump!ons
Results
EfficiencyBAU
Households Industry Transport Other
Popula!on, GDP,policy and plans
Value added, technology, energy intensity,
structural changes, industry plan and policies,
penetra!on rate
Popula!on, GDP, specific energy consump!on,
technology, policy, structural changes
Popula!on, GDP, structural changes,
policy and plans
Gasifica!on, rural electrifica!on
Gasifica!on, energy management
for large plants
Public transport, road quality upgrades,
efficient vehicles
Gasifica!on,rural electrifica!on,
priva!za!on
Household surveys, aggregate fuel consump!on
2-digit manufacturing survey, audi!ng reports
Aggregate and survey data Aggregate data
39% fuel and42% electricity saving
under Efficiency scenario
36% saving under Efficiency scenario
33% saving under Efficiency scenario
26% saving under Efficiency scenario
Structural changes, gasifica!on, rural electrifica!on, fourth and fi#h development plan, 20-year vision
Energy efficiency regula!ons in housing and manufacturing industry, lower energy intensity, technological changes, structural changes,
renova!ons, energy price reform, educa!on
Kerosene, gas oil, LPG, natural gas, electricity
Kerosene, gas oil, LPG, natural gas, electricity
Gasoline, gas oil, CNG Kerosene, gas oil, LPG, natural gas, electricity
Appendix

186
Sustainable Energy Strategy for IranAppendix
B: Feed-in Tariff Laws in Iran
The law of Government’s Financial Regulation February 19, 2001 Article 62 – The Ministry of Energy is obliged to purchase the electricity produced by public and private power plants at guaranteed prices. Rates will be proposed by the Budget and Plan Organization, to be approved by the Economic Council. However, due to the positive environmental impacts of renewable energies and fossil fuel energy savings, and in order to encourage the private sector to generate electricity using renewable resources, the following guaranteed rates will be in effect: 650 rials (US$ 0.067) per kWh at peak and regular times, and 450 rials (US$ 0.047) at off-peak times (a maximum of four hours per day).
Instruction on how to implement Article 62February 24, 2005In line with implementing Article 62 of the Fourth Five-Year Development Plan and in order to attract and support private sector investment in electricity generation from renewable energy sources, the Ministry of Energy called on the Renewable Energy Organization of Iran (SUNA) in 2005 to carry out the following tasks:
Chapter 1:Article VIII It is agreed that the connection costs, to be determined by the Ministry of
Energy, will be paid by the producer of renewable energy.
Chapter 2: Article I The organization (SUNA) is given three months to collect the necessary
i nformation concerning the potential of renewable energy resources in Iran and to initiate the step-by-step process of preparing a relevant feasibility study report. SUNA is also required to prepare the following items: A draft of an electricity purchase contract with the applicant1 and An outline of the standards applicable to the electricity generated.
Article II SUNA is tasked with communicating with the applicants. Within 15 days of submitting the necessary documents, the applicant will be given permission to conduct a feasibility study. Clause: If more than one applicant wishes to conduct the feasibility study for generating electricity from renewable energy sources, SUNA will be tasked with selecting the applicant with the best offer.
Article III SUNA will receive the results of the comprehensive feasibility study conducted by the applicant.
1 A non-governmental entity that has notified SUNA of its willingness to produce electricity from renewable energy sources

187
Sustainable Energy Strategy for Iran Appendix
Article IV SUNA will submit the results of the feasibility study to the Ministry of Energy, Deputy for Energy Affairs. The Deputy will then grant permission for constructing a power plant.
Article V According to the construction permission issued by the Ministry of Energy, SUNA will enter into a long-term electricity purchase contract with the applicant (henceforth called the electricity producer).
Article VI The electricity producer will be responsible for studying and identifying the site’s location, securing land for power plants, obtaining the necessary permits from the respective government departments/organizations, securing the capital required, constructing roads, erecting electricity poles and paying the full capital cost of connecting the power plants to the local or national electricity network.
Article VII The electricity producer will notify SUNA of the volume of renewable electricity generated – measured in kilowatt hours – and, in return, will receive the market value of the electricity.
Article VIII The renewable electricity generated will be offered for sale based on the following rates:
At peak times: 650 rials (US$ 0.068) per kWhAt regular times: 650 rials per kWhAt off-peak times: 450 rials (US$ 0.047) per kWh (for four hours per day)
The consumption types will be announced by the grid management according to regulatory board guidelines.
Article IX SUNA will determine the new maximum installable capacity for renewable energy sources via its subsidiary company.
Article X The Ministry of Energy will include the differential costs arising from this program in its annual budget submitted to the Budget and Planning Organization.
Price Adjustment for Purchasing Electricity Generated by Renewable SourcesNovember 23, 2008 According to the government’s decision on November 23, 2008, the rates for purchasing electricity generated by the private sector using renewable energy sources will be raised from 650 rials (US$ 0.068) per kWh to 1,300 rials (US$ 0.13) per kWh at peak consumption times and from 450 rials (US$ 0.047) to 900 rials (US$ 0.094) at off-peak times. The new rates apply for the Iranian year of 1387 (March 2008 - March 2009) and will be revised in later years.

188
Sustainable Energy Strategy for IranReferences
References
Chapter 2
Central Bank of Iran (different years): Annual Review. Central Bank of Iran (various issues): Economic Indicators. Economist Intelligence Unit (2006): Iran: Energy and Electricity Profile.Economist Intelligence Unit (2006): Iran: Energy and Electricity Forecast.Hope, E. and Singh, B. (1995): Energy Price Increases in Developing Countries: Case Studies of Colombia, Ghana, Indonesia,
Malaysia, Turkey, and Zimbabwe, Policy Research Working Paper, 1442, World Bank. IEA, International Energy Agency (2004, 2008): World Energy Outlook, OECD. IEA, International Energy Agency (2004): Oil Crisis and Climate Challenges, 30 Years of Energy Use in IEA Countries, OECD/IEA, 2004.IEA, International Energy Agency (2006), Carrots and Sticks: Taxing and Subsidizing Energy, Note on Energy Subsidies and Taxes,
Economic Analysis Division.IEA, International Energy Agency (different years): Energy Balance for OECD and Non-OECD countries. IELDB, Iranian Economic Research Center (2007): Iranian Economic Literature and Data, University of Allameh Tababaie.IMF, International Monetary Fund (2014), World Economic Outlook Database.IPCC, Intergovernmental Panel on Climate Change (2001): Climate Change 2001: Mitigation. A Report of Working Group III
of the Intergovernmental Panel on Climate Change, Accra.IPDC, Iranian Power Development Company (2001): The integrated solar combined cycle (ISCCS) power plant project in Yazd, Iran.
Project description and Status of October 2001, www.ystpp.comIRI Rail Road, Islamic Republic Iran (1381): Rail Road Statistics.Management and Plan Organization (various years): Economic Reports.Management and Plan Organization (various years): Energy Reports.Management and Plan Organization (various years): Transportation Reports. McKinsey Global Institute (2008): Fuelling sustainable development: The energy productivity solution.Ministry of Energy (various years): Energy Balance.OPEC (2013): Annual Statistical Bulletin.Statistical Center of Iran (2004): The Large Manufacturing Industries Survey.WEC, World Energy Council (2001): Survey of energy resources 2001, Laxenburg,
https://www.worldenergy.org/wp-content/uploads/2012/10/PUB_Survey-of-Energy-Resources_2001_WEC.pdf.World Bank (1999): Economic Aspects of Increasing Energy Prices to Border Price Levels in Islamic Republic of Iran,
Middle East and North Africa Region.World Bank (2003): Iran Medium Term Framework for Transition, Converting Oil Wealth to Development, A Country Economic
Memorandum, Report No. 25848-IRN, Social and Economic Development Group, Middle East and North Africa Region. World Bank (2006): Clean Energy and Development: Towards an Investment Framework, Washington, D. C.World Bank (2014), World Development Indicator Database.
Chapter 3
Bentzen, J. and Engsted, T. (2001): A revival of the autoregressive distributed lag model in estimating energy demand relationships, Energy, Elsevier.
Bhattacharyya, S. and Timilsina, G. (2010): A Review of Energy System Models, International Journal of Energy Sector Management, Vol. 4, issue 4.
Central Bank of Iran (2014): Economic Time Series Data, www.cbi.ir. Central Bank of Iran (various issues): Economic Indicators.

189
Sustainable Energy Strategy for Iran References
City of Tehran (various years): Tehran Transportation and Traffic Studies.Crompton, P. and Wu, Y. (2005): Energy Consumption in China: Past Trends and Future Directions, Energy Economics, 27, 1, 195-208.DLR, Deutsches Zentrum für Luft- und Raumfahrt e.V. (2005): Concentrating Solar Power for the Mediterranean Region, Stuttgart. Economist Intelligence Unit (2006): Iran: Energy and Electricity Profile.Economist Intelligence Unit (2006): Iran: Energy and Electricity Forecast.Farahbakhsh, H., Ugursal, V. I. and Fung, A. S. (1998): A residential end-use energy consumption model for Canada, International
Journal of Energy Research, 22, 13, 1133-1143.Filippini, M. and Hunt, L. (2011): Energy demand and energy efficiency in the OECD countries: a stochastic demand frontier
approach, The Energy Journal, 32 (2), 2011, 59-80.Griffith, B., Long, N., Torcellini, P., Judkoff, R., Crawley, D. and Ryan, J. (2007): Assessment of the Technical Potential for Achieving Net
Zero-Energy Buildings in the Commercial Sector, National Renewable Energy Laboratory, Technical Report NREL/TP-550-41957. Haas, R. and Schipper, L. (1998): Residential Energy Demand in OECD Countries and the Role of Irreversible Efficiency Improvements:
Evidence from the period 1970-1993, Energy Economics, 20. Hagenkort, B. (2004): (Wind-)Verhältnisse im Iran. Erneuerbare Energien, no. 7/2004.Huang, Y. J. and Broderick, J. (2000): A Bottom-up Engineering Estimate of the Aggregate Heating and Cooling Loads of the Entire
U.S. Building Stock, Proceedings of the 2000 ACEEE Summer Study on Energy Efficiency in Building, August 2000, Pacific Grove, CA. IAEA, International Atomic Energy Agency, Power Reactor Information System, https://pris.iaea.org/Home/Pris.asp.IEA, International Energy Agency (2004): Oil Crisis and Climate Challenges, 30 Years of Energy Use in IEA Countries, OECD/IEA.IEA, International Energy Agency (2006): Carrots and Sticks: Taxing and Subsidizing Energy, Note on Energy Subsidies and Taxes,
Economic Analysis Division.IEA, International Energy Agency (2012): Energy Balance for OECD and Non-OECD countries. IEA, International Energy Agency and OECD (various years): World Energy Outlook. IFCO, Institute for Fuel Conservation Organization (2007): Optimizing Energy Consumption in Industry Sector in the Next 20 Years.IFCO, Institute for Fuel Conservation Organization (2010), Transportation Report. Iran Energy Association and Wuppertal Institute for Climate, Environment, and Energy (2009): Energy Scenarios for Iran.IRI Rail Road, Islamic Republic Iran (1381): Rail Road Statistics.Kohler, N. (1999): The relevance of Green Building Challenge: an observer‘s perspective, Building Research & Information,
Volume 27, Issue 4-5.Koopmans, C. C. and te Velde, D. W. (2001): Bridging the Efficiency Gap: Using Bottom-up Information in a Top-down
Energy Demand Model, Energy Economics, 23, 57-75.Larsen, B. M. and Nesbakken, R. (2004): Household Electricity End-Use Consumption: Results from Econometric and Engineering
Models, Energy Economics, 2004, 26(2), 179-200.Management and Plan Organization (various years): Energy Reports.McKinsey Global Institute (2008): Fuelling sustainable development: The energy productivity solution.Ministry of Energy (different years): Iran Energy Balance.Ministry of Road and Transportation (2005): Comprehensive Transportation Studies of Iran, Tehran.Ministry of Road and Transportation (various years): Road Transportation Annual Report.Moshiri, S., Atabi, F., Panjeshahi, M. H. and Lechtenböhmer, S. (2012): Long Run Demand for Energy in Iran; A Scenario Analysis,
International Journal of Energy Sector Management, 6, 1, 120-144. Murakami, S. et al. (2009): Overview of energy consumption and GHG mitigation technologies in the building sector of Japan,
Energy Efficiency 2, 179-194. Production, Transmission, and Distribution Company (various years): Reports by “The Consumption Management Office”, Tavanir.Statictics Center of Iran (2010): Household Energy Consumption Survey.Statistical Center of Iran (various years): The Large Manufacturing Industries Survey.Supersberger, N. (2007): Szenarien eines diversifizierten Energieangebots in OPEC-Staaten am Beispiel Irans, Dissertation,
University of Osnabrueck.Swan, L. G. and Ugursal, V.I. (2009): Modeling of End-use Energy Consumption in the Residential Sector: A Review of Modeling
Techniques, Renewable and Sustainable Energy Reviews 13, 8, 1819-1835.Talebi, B. (2004): Geothermal Energy Sources in Iran, Renewable Energy Organization of Iran.

190
Sustainable Energy Strategy for IranReferences
Tehran Police (various years): Traffic Police Reports. TREC, Tehran Regional Electricity Company (various reports): Energy Savings in Audited Industries 1999-2005, Tavanir.TREC, Tehran Regional Electricity Company (various years): A study of household’s electricity consumption pattern and their
satisfaction in Tehran.Urban, F., Benders, R. H. J. and Mol, H.C. (2007): Modelling energy systems for developing countries, Energy Policy,
Vol. 36, Issue 6, 3473-3482.WEC, World Energy Council (2001): Survey of energy resources 2001, Laxenburg,
https://www.worldenergy.org/wp-content/uploads/2012/10/PUB_Survey-of-Energy-Resources_2001_WEC.pdf.Wina, G. and Harmelink, M. (2006): Global Low Energy Demand Scenarios 2003-2050, Ecofys BV, Project No. ECS05100.World Bank (1999): Economic Aspects of Increasing Energy Prices to Border Price Levels in Islamic Republic of Iran,
Middle East and North Africa Region.World Bank (2014): World Development Indicator Database.
Chapter 4
BMU, Federal Ministry fort he Environment, Nature Conservation and Nuclear Safety (2008): Leitstudie 2008. Berlin.CAN Europe, Health & Environment Alliance and WWF: The Cost-Benefits to Health of a Strong EU Climate Change Policy.” A Mutual
Study of CAN Europe (www.climnet.org), Health & Environment Alliance (www.env-health.org) and WWF (www.panda.org/eu). CEERS, Center for Environment and Energy Research and Studies; WI, Wuppertal Institute for Climate, Environment, Energy and HBS
Industriedienste (2005): Case Study: Solar Thermal Energy in Iran, Executive Summary, University of Osnabrueck, Wuppertal/Tehran.CEERS, Center for Environment and Energy Research and Studies; WI, Wuppertal Institute for Climate, Environment, Energy and HBS
Industriedienste (2006). Evaluation of Long-Term Energy Policies in Iran, Projektbericht, Heinrich Böll Stiftung.Central Bank of Iran (different years), Annual Review. Central Bank of Iran, Economic Time Series, (http://www.cbi.ir/section/1372.aspx).City of Tehran (various years), Tehran Transportation and Traffic Studies.Department of Environment Iran (2011): Iran‘s Second National Communication to the UNFCCC.Deutscher Bundestag, The Parliament of the Federal Republic of Germany (2002): Nachhaltige Energieversorgung unter den
Bedingungen der Globalisierung und Liberalisierung, Zur Sache 6/2002, Berlin.DLR, Deutsches Zentrum für Luft- und Raumfahrt e.V. (2005): Concentrating Solar Power for the Mediterranean Region, Stuttgart.Economist Intelligence Unit (2006): Iran: Energy and Electricity Profile.Economist Intelligence Unit (2006): Iran: Energy and Electricity Forecast.Fettini, Habib (2003): Iran: Medium Term Framework for Transition, Converting Oil Wealth to Development, A Country Economic
Memorandum, World Bank, Social and Economic Development Group, Middle East and North Africa Region, Report No. 25848-IRN, April 30, 2003.
Fotouhi, M. (1994): Iran’s Geothermal Potential. International Geothermal Association, IGA News, Nr. 17, p. 5.Fotouhi, M. (1995): Geothermal Development in Sabalan, Iran. Proceedings World Geothermal Congress, Florenz.Fotouhi, M. and Noorollahi, Y. (2000): Updated Geothermal Activities in Iran, Proceedings World Geothermal Congress 2000,
Kyushu-Tohoku, 28.5.-10.6.2000. Geyer, M. (2007): International Market Introduction of Concentrated Solar Power – Policies and Benefits, Proceedings of ISES World
Congress 2007 (Vol. I – Vol. V).Hagenkort, B. (2004): (Wind-)Verhältnisse im Iran. Erneuerbare Energien, No. 7/2004. IEA, International Energy Agency (2002-2003): Energy Balance for OECD and Non-OECD countries. IEA, International Energy Agency (2004): Oil Crisis and Climate Challenges, 30 Years of Energy Use in IEA Countries, OECD/IEA, 2004.IEA, International Energy Agency (2006): Carrots and Sticks: Taxing and Subsidizing Energy, Note on Energy Subsidies and Taxes,
Economic Analysis Division.IEA, International Energy Agency and OECD (2010): World Energy Outlook.IELDB, Iranian Economic Research Center, Iranian Economic Literature and Data Bank (2007): University of Allameh Tababaie.IFCO, Iranian Fuel Conservation Organization (2007): Optimizing Energy Consumption in Industry Sector in the Next 20 Years.

191
Sustainable Energy Strategy for Iran References
IMF, International Monetary Fund (2014), World Economic Outlook Database.IPCC, Intergovernmental Panel on Climate Change (2001): Climate Change 2001: Mitigation. A Report of Working Group III
of the Intergovernmental Panel on Climate Change, Accra.IPDC, Iranian Power Development Company (2001): The integrated solar combined cycle (ISCCS) power plant project in Yazd, Iran,
www.ystpp.com.IRI Rail Road, Islamic Republic Iran (1381), Rail Road Statistics.Kipke, R. (2004): Personal communication (phone conversation), 25.10.2004.Management and Plan Organization (various years): Economic Reports.Management and Plan Organization (various years): Energy Reports.Management and Plan Organization (various years): Transportation Reports. McKinsey Global Institute (2008): Fuelling sustainable development: The energy productivity solution.Ministry of Energy (2004): Energy Statistics in Iran and the World.Ministry of Energy (various years): Energy Balance.Ministry of Road and Transportation (2005): Comprehensive Transportation Studies of Iran, Tehran. Ministry of Road and Transportation (various years): Road Transportation Annual Report.Noorollahi, Y. (2004): Personal communication with Javad Nouraliee, Niroo Research Institute NRI, 4.10.2004, Teheran.OPEC (2013): Annual Statistical Bulletin.PTDC, Productions, Transmission, and Distribution Company (various years): Reports by The Consumption Management Office, Tavanir.Samimi, J. (1994): Estimation of height-dependent solar irradiation and application to the solar climate of Iran. Solar Energy 52, 401-409.Statistical Center of Iran (2004): The Large Manufacturing Industries Survey.SUNA (1998): Renewable Energy Organization of Iran, www.suna.org.ir. Supersberger, N. (2007): Szenarien eines diversifizierten Energieangebots in OPEC-Staaten am Beispiel Irans, Dissertation,
University of Osnabrueck.Tehran Police (different years): Traffic Police Reports. TREC, Tehran Regional Electricity Company (various reports): Energy Savings in Audited Industries 1999-2005, Tavanir.WEC, World Energy Council (WEC) (2001): Survey of energy resources 2001, Laxenburg,
https://www.worldenergy.org/wp-content/uploads/2012/10/PUB_Survey-of-Energy-Resources_2001_WEC.pdf.Wina, G. and Harmelink, M. (2006): Global Low Energy Demand Scenarios 2003-2050, Ecofys BV, Project No. ECS05100,
Deutsches Zentrum für Luft-und Raumfahrt (DLR). World Bank (1999): Economic Aspects of Increasing Energy Prices to Border Price Levels in Islamic Republic of Iran,
Middle East and North Africa Region. World Bank (2006): Clean Energy and Development: Towards an Investment Framework. Worldbank, Washington, D. C.World Bank (2014): World Development Indicator Database.
Chapter 5
Appleyard, D. (2010): India’s Solar Spree, Renewable Energy World, 10 March, 2010. http://www.renewableenergyworld.com/rea//news/article/2010/03/solar-energy.
Atabi, F. (2004): Renewable Energy in Iran, Challenges and Opportunities for Sustainable Development, International Journal of Environmental Science and Technology, Vol. 1, No. 1, 69-80.
Bechberger, M. (2009): Erneuerbare Energien in Spanien, Erfolgsbedingungen und Restriktionen; Ecological Energy Policy, issue 10, ibidem-Verlag, Stuttgart.
BGBl I, Federal Law Gazette Part 1 (1990): No. 67 of 14.12.1990, p.2633, http://www.bgbl.de/xaver/bgbl/start.xav?startbk=Bundesanzeiger_BGBl&jumpTo=bgbl190s2633b.pdf.
BGBl I, Federal Law Gazette Part 1 (2000): No. 13 of 31.03.2000, p.305, http://www.bgbl.de/xaver/bgbl/start.xav?startbk=Bundesanzeiger_BGBl&jumpTo=bgbl100s0301.pdf.
BMUB, Federal Ministry for the Environment, Nature Conservation, Building and Nuclear Safety (2013): Development of renewable energy sources in Germany in 2012, Graphics and tables dowloaded from: http://www.erneuerbare-energien.de.

192
Sustainable Energy Strategy for IranReferences
BMU, Federal Ministry for the Environment, Nature Conservation and Nuclear Safety (2010): Pressemitteilung vom 06.05.2010: Änderung der Solarvergütung beschlossen, No. 063/10, Berlin, 06.05.2010, http://www.erneuerbare-energien.de.
BMU, Federal Ministry for the Environment, Nature Conservation and Nuclear Safety (2009): Renewable energy sources in figures - national and international development; http://www.erneuerbare-energien.de.
BMU, Federal Ministry for the Environment, Nature Conservation, Building and Nuclear Safety (2007): Entwicklung der Offshore-Windenergienutzung in Deutschland/ Offshore wind energy deployment in Germany, http://www.bmu.bund.de.
BMWi, Federal Ministry for Economic Affairs and Energy (2015): Zahlen und Fakten Energiedaten, http://www.bmwi.de/DE/Themen/Energie/energiedaten.html.
BSW-Solar (2013): Argumente Kosten+Nutzen der Energiewende, http://www.solarwirtschaft.de/fileadmin/media/pdf/bsw_hintergr_kostendisk.pdf.
BSW, Beamtenselbsthilfewerk (2014): Fact sheet on solar power (4/2014), http://www.solarwirtschaft.de/fileadmin/media/pdf/2013_2_BSW-Solar_fact_sheet_solar_power.pdf.
Bürer, M.J. and Wüstenhagen, R. (2009): Which renewable energy policy is a venture capitalist‘s best friend? Empirical evidence from a survey of international cleantech investors, Energy Policy, 37 (2009), 4997-5006.
Butler, L. and Neuhoff, K. (2004): Comparison of Feed-In Tariff, Quota and Auction Mechanism to Support Wind Power Development, Cambridge Working Papers in Economics, CWPE 0503.
BWE, Bundesverband WindEnergie e.V. (2009): http://www.wind-energie.de.BWE, Bundesverband WindEnergie e.V. (2014): Statistics, http://www.wind-energie.de/en/infocenter/statistics.Carbon Dioxide Information Analysis Center (2008): Top 20 Emitting Countries by Total Fossil-Fuel CO2 Emissions for 2008,
http://cdiac.ornl.gov/trends/emis/tre_tp20.html.CEERS, Center for Environment and Energy Research and Studies and WI, Wuppertal Institute for Climate, Environment, Energy
(2005): Case Study: Solar Thermal Energy in Iran (2005). Executive Summary, University of Osnabrueck, Wuppertal/Tehran.CERC, Central Electricity Regulatory Commission (2009): Press release. CERC notifies tariff regulations for green power. Cherni, J. A., and Kentish, J. (2007): Renewable Energy Policy and Electricity Market Reforms in China, Energy Policy, 35, 3616-3629.DANIDA, Danish International Development Agency (2010): Provision of Technical Support/Services for an Economical,
Technological and Environmental Impact Assessment of National Regulations and Incentives for Renewable Energy and Energy Efficiency. Desk Study Algeria.
dena, Deutsche Energie-Agentur (2009): Renewables Made in Germany catalogue, http://www.renewables-made-in-germany.com.dewi, Deutsche WindGuard (2013): Status of wind energy development in Germany, http://www.wind-energie.de.DLR, Deutsches Zentrum für Luft- und Raumfahrt e.V. (2005): Concentrating Solar Power for the Mediterranean Region, Stuttgart.EC, European Commission (2005): European Wind Energy at the Down of 21st Century. Fotouhi, M. (1994): Iran’s Geothermal Potential. International Geothermal Association (IGA), News, No. 17, 5.Fotouhi, M. (1995): Geothermal Development in Sabalan, Iran. Proceedings World Geothermal Congress, Florence.Fotouhi, M. and Noorollahi, Y. (2000): Updated Geothermal Activities in Iran. Proceedings World Geothermal Congress 2000,
Kyushu-Tohoku, 28.5-10.6.2000, 183-185.Gan, L., Eskeland, G. S. and Kolshus, H. H. (2007): Green electricity market development: Lessons from Europe and the US,
Energy Policy, 35 (2007), 144-155.Geyer, M. (2007): International Market Introduction of Concentrated Solar Power-Policies and Benefits, Proceedings of
ISES World Congress 2007 (Vol. I – Vol. V), 75-82.Gipe, P. (2009): India’s 1.1 Billion Move to Feed-in Tariffs, Renewable Energy World, http://www.renewableenergyworld.com.Grotz C. and Fouquet D. (2005): Fixed prices work better, A comparison of renewable energy promotion gives thumbs up to
feed-in schemes and opposes premature EU harmonisation, new energy, 2/2005, 18-21. GTAI, Germany Trade and Invest (2014): Industry overview, The Wind Energy Industry in Germany, Issue 2014/2015,
http://www.gtai.de.GTZ, Gesellschaft für technische Zusammenarbeit (2009): Energy-Policy Framework Conditions for Electricity Market and
Renewable Energies, 16 Country Analysis, Eschborn.GWEC, Global Wind Energy Council (2013): Global wind report: annual market update 2012.Hamed, R. (2010): http://news.tavanir.org.ir.IEA, International Energy Agency (2014): Photovoltaic power systems programme: annual report 2014.

193
Sustainable Energy Strategy for Iran References
IEA, International Energy Agency, Country Homepage Germany, http://www.iea.org.IEA, International Energy Agency (2007): Energy Policies of IEA Countries; Germany, 2007 Review, OECD, Paris.IEA, Iran Energy Association and Wuppertal Institute for Climate, Environment, Energy (2009): Energy Scenarios for Iran,
German-Iranian cooperation project, and Iran Energy Association.IPCC, Intergovernmental Panel on Climate Change (2001): Climate Change 2001: Mitigation. A Report of Working Group III
of the Intergovernmental Panel on Climate Change. Accra.IPDC, Iranian Power Development Company (2001): The integrated solar combined cycle (ISCCS) power plant project in Yazd, Iran.
Project description and Status of October 2001, Iranian Power Development Company, www.ystpp.com.Kaufmann, D., Kraay, A. and Mastruzzi, M. (2009): Governance matters VIII: Aggregate and Individual Governance Indicators
1996–2008, World Bank Working Paper No. 4978, Washington D.C.Kipke, R. (2004): Personal communication (telephone conversation), 25.10.2004.Lechtenböhmer, S. and Schüring, A. (2011): The potential for large scale savings from insulating residential buildings in the EU,
Energy Efficiency, Volume 4, Issue 2. Ministry of Energy (various reports): Renewable energy resources. MNRE, Ministry of New and Renewable Energy (2010): Jawaharlal Nehru National Solar Mission: Towards Building Solar India,
Mission Document. Moradzadeh, F. (2009): Strengths, Weaknesses, Opportunities, and Threats for Renewable Energy in Iran, MS thesis, Azad University. Nitsch, J. (2008): Lead Study 2008: Further development of the “Strategy to increase the use of renewable energies” within the
context of the current climate protection goals of Germany and Europe, Study commissioned by the German Federal Ministry for the Environment, Nature Conservation and Nuclear Safety (BMU), http://www.bmub.bund.de.
Nouraliee, Y. (2004): Persönliche Kommunikation mit Javad Nouraliee, Niroo Research Institute NRI, Teheran.Oil Industry Research Academy (2009): Renewable Energy Technology Development.Pew Center on Global Climate Change (2008): Summary: India’s National Action Plan on Climate Change. Government of India. Purohit, I. and Purohit, P. (2010): Techno-economic evaluation of concentrating solar power generation in India,
Energy Policy, 38 (2010), 3015-3029.Ragwitz, M. et al (2007): Assessment and optimalisation of renewable energy support schemes in the European electricity market,
OPTRES Final Report, Karlsruhe.REN21, Renewable Energy Policy Network for the 21st Century (2009): Global Status Report: Energy Transformation Continues
Despite Economic Slowdown, http://www.ren21.net.REN21, Renewable Energy Policy Network for the 21st Century (2014): Renewables 2014 Global Status Report, http://www.ren21.net.Río, P. del and Gual, M. A. (2007): An integrated assessment of the feed-in tariff system in Spain, Energy Policy, 35 (2007), 992-1012.Samimi, J. (1994): Estimation of height-dependent solar irradiation and application to the solar climate of Iran. Solar Energy,
52, 401-409.SUNA, Renewable Energy Organization of Iran: www.suna.org.ir.Talebi (2004): Geothermal Energy Sources in Iran, Renewable Energy Organization of Iran (SUNA). WEC, World Energy Council (2001): Survey of energy resources 2001. Laxenburg. www.worldenergy.org.WHO: Database, http://apps.who.int/ghodata/.World Bank (2008): 2008 Governance Report, World Bank, Washington D.C.Wuppertal Insitute for Climate, Environment and Energy and CREAD (2010): Algeria – A Future Supplier of Electricity from
Renewable Energies for Europe? Algeria’s Perspective and Current European Approaches, July 2010.Wuppertal Institute for Climate, Environment and Energy and Adelphi Consult (2009): Energy Systems in OPEC Countries of the
Middle East and North Africa: System Analytic Comparison of Nuclear Power, Renewable Energies and Energy Efficiency.
Chapter 6
Bach, P. (2009): Energy efficiency and the road to Copenhagen, presentation at eceee-Conference 2009.BMU, Federal Ministry for the Environment, Nature Conservation and Nuclear Safety (2008): Energy Efficiency – Made in Germany.
Energy Efficiency in Industry and Building Services Technology, www.efficiency-from-germany.info.

194
Sustainable Energy Strategy for IranReferences
BMU, Federal Ministry for the Environment, Nature Conservation and Nuclear Safety (2011): Renewable Energy Sources in Figures National and International Development, http://www.erneuerbare-energien.de.
BMU, Federal Ministry for the Environment, Nature Conservation and Nuclear Safety (2012): Mini-KWK-Anlagen werden wieder durch das Bundesumweltministerium gefördert, http://www.bmub.bund.de.
BMWI, Federal Ministry of Economics and Technology (2011): Forschung für eine umweltschonende, zuverlässige und bezahlbare Energieversorgung, Das 6. Energieforschungsprogramm der Bundesregierung.
Boehm, P., Bosch-Siemens Haushaltsgeräte GmbH (2011): Supereffiziente Haushaltsgeräte. Vortrag im Rahmen der Fachkonferenz “Stromsparen in privaten Haushalten“, Berlin.
EC, European Commission (2009): Commission Regulation, Implementing Directive 2005/32/EC of the European Parliament and of the Council with regard to ecodesign requirements for household refrigerating appliances, (EC) No. 643/2009 of 22 July 2009.
Eceee (2011): Steering through the maze #2, http://www.eceee.org.EnergieAgentur.NRW (2012): 50 Solarsiedlungen in NRW,
http://www.energieagentur.nrw.de/solarsiedlungen/50-solarsiedlungen-in-nrw-5526.asp.facility-manager.de (2011): Grüne Sanierung,
http://www.freiburger-stadtbau.de/fileadmin/pdf/facility_man_passivhaus_01062011.pdf.Hauptstock, D.; Vondung, F. and Hennicke, P. (2013): Trialogreihe zur Energiewende Informationspapiere für den Untertrialog
„Energieeffizienz“ am 21.01.2013. Thema: Prozessverantwortung für die Umsetzung der Energiesparziele der Energiewende.Hennicke, P.; Seifried, D. (1996): Das Einsparkraftwerk – eingesparte Energie neu nutzen. Berlin, Basel, Boston.Herring, H. (2006): Energy efficiency – a critical view, Energy, 31 (2006), 10-20.IEA, International Energy Agency (2008): Combined Heat and Power. Evaluating the benefits of greater global investment,
http://www.iea.org.IEA, International Energy Agency (2009): China country profile, http://www.iea.org.IEA, International Energy Agency (2011): CO2 emissions from fuel combustion, http://www.iea.org.IEA, Iranian Energy Association and Wuppertal Institute for Climate, Envorinment and Energy (ed.) (2009): Energy Scenarios for Iran,
Wuppertal.IEA, Iranian Energy Association and Wuppertal Institute for Climate, Environment and Energy (2010): German-Iranian Co-operation
VI, Development of three cornerstones for a sustainable Energy future in Iran, Work package 1, Feed-in laws and other support schemes in international perspective.
ISIRI, Institute for Standard and Industrial Research of Iran: The Energy Standard Labeling, www.isiri.org.Ismaielnia, A.A. (2010): Economic Analysis of Subsidizing High-Efficient Fridge Producers, SABA,
http://www.saba.org.ir/saba_content/media/image/2012/04/3588_orig.pdf.Lechtenböhmer, S. and Nilsson, L. (2014): Sustainable Energy Systems – unpublished manuscript.Madlener, A. (2011): Herausforderungen für eine technisch-ökonomische Entkoppelung von Naturverbrauch und Wirtschaftswachstum
unter besonderer Berücksichtigung der Systematisierung von Rebound-Effekten und Problemverschiebungen; Enquete-Kommission “Wachstum, Wohlstand, Lebensqualität” des Deutschen Bundestages.
Maxwell, D. et al. (2011): Addressing the Rebound Effect, a report for the European Commission DG Environment.Ministry of Commerce (2012): The Organization for Support of Consumer and Producers.Ministry of Energy (various years): Energy Balance 2006-2009.Moshiri, S. (2013): The Effects of Energy Price Reforms on Household Energy Consumption in Iran, IAEE/SSRN working paper series,
http://papers.ssrn.com/sol3/papers.cfm?abstract_id=2335755.Moshiri, S. and Aliyev, K. (2015): The Rebound Effect in Vehicle Transportation in Canada, Working paper, University of Saskatchewan. Moshiri, S. and Darvishi, B. (2012): Determinants of Exit and Entry Rates in the Export Markets, unpublished paper.REN21, Renewable Energy Policy Network for the 21st Century (2011): Renewables 2011 Global Status Report, http://www.ren21.net.SABA (2012): http://www.saba.org.ir/saba_content/media/image/2012/04/3588_orig.pdf.Sallee, M. J. (2013): Rational Inattention and Energy Efficiency, NBER working paper series, W19545. Santarius, T. (2012): Der Rebound-Effekt - Über die unerwünschten Folgen der erwünschten Energieeffizienz, Impulse
zur Wachstumswende No. 5.Saunders. H. (2013): Is what we think of as ‘‘rebound’’ really just income effects in disguise? Energy Policy, Volume 57, June 2013, 308-317.Schettkat, R. (2009): Analyzing Rebound Effects, Wuppertal Papers No. 177, January 2009, ISSN 0949-5266.

195
Sustainable Energy Strategy for Iran References
Seifried, D. and Witzel, W. (2010): Renewable Energy – the Facts, Earthscan, London, Washington, DC. Seifried, D., (1992): Least-Cost-Planning. Der Weg zum Umbau unseres Energieversorgungssystems, Greenpeace.Sorrell, S (2007): The Rebound Effect: an assessment of the evidence for economy-wide energy savings from improved energy
efficiency. A report produced by the Sussex Energy Group for the Technology and Policy Assessment function of the UK Energy Research Centre. UKERC.
Stadtwerke Hannover AG (1995): Integrated Resource Planning. The Case Study Hannover. Report by Öko-Institute and Wuppertal Institute for Climate, Environment and Energy.
Taban Energy Sepehr (2011): How to use CHP systems.Tavanir (2010): Guide to Develop Small Scale Generators.Tavanir (2012): Electricity Prices. UFH, Umweltforum Haushalt (2010): Erfolgsstory UFH Trennungsprämie: Kühlgerätetausch mit 2,94 Millionen Euro gefördert,
http://www.ufh.at/index.php?i_ca_id=412&CMSFRONT=vueumft.UNDP, United Nations Development Programme (2010): LGGE Policy Reforms and Market Transformation of the Energy
Efficient Buildings Sector in the I.R. Iran, GEF Trust Fund. WEC, World Energy Council (2010): Energy Efficiency: A Recipe for Success, www.worldenergy.org.Weizsäcker, E. U., Lovins, A. B. and Lovins, H. L. (1995): Faktor vier. Doppelter Wohlstand – halbierter Naturverbrauch, München.Weizsäcker, E. U. (2009): inter alia: Factor Five. Transforming the Global Economy through 80% Improvements in Resource
Productivity. Earthscan. London.Wuppertal Institute for Climate, Environment and Energy (2009): Sustainable Urban Infrastructure. Munic Edition – path toward
a carbon free future. Wuppertal Institute for Climate, Environment and Energy (2012): Big EE: Bridging the Information Gap on Energy Efficiency
in Buildings, Interim project report.Yu, B.; Zhang, J. and Fujiwara, A. (2013): Evaluation of the direct and indirect rebound effects in household energy consumption
behaviour: A case study in Beijing, Energy Policy, Volume 57, June 2013, 441-453.
Chapter 7
BMU, Federal Ministry for the Environment, Nature Conservation and Nuclear Safety (2012): Mini-KWK-Anlagen werden wieder durch das Bundesumweltministerium gefördert, http://www.bmub.bund.de.
Brown, K. and Minett, S. (1996): History of CHP developments and current trends, Applied Energy, Volume 53, Issues 1–2, 1996, 11–22.Cogeneration (2008): http://www.cospp.com.IEA, International Energy Agency (2008): Combined Heat and Power. Evaluating the benefits of greater global investment,
http://www.iea.org.IEA, International Energy Agency (2014): CO2 emissions from fuel combustion – Highlights, www.iea.org.Madlener, R. and Alcott, B. (2011): Herausforderungen für eine technisch-ökonomische Entkoppelung von Naturverbrauch
und Wirtschaftswachstum unter besonderer Berücksichtigung der Systematisierung von Rebound-Effekten und Problemverschiebungen; Enquete-Kommission “Wachstum, Wohlstand, Lebensqualität” des Deutschen Budestages.
Madlener, R. and Schmid, C. (2003): Combined Heat and Power Generation in Liberalised Markets and a Carbon-Constrained World, GAIA - Ecological Perspectives in Science, Humanities, and Economics, 12(2), 114-120.
Prognos (2015): Potenzial und Einsatzmöglichkeiten von Kraft-Wärme-Kopplung. Presentation of Marco Wünsch on the „19. Fachkongress Zukunftsenergien“ in Essen, 10th February 2015; www.energieagentur.nrw.de.
Prognos et al. (2014): Potenzial- und Kosten-Nutzen-Analyse zu den Einsatzmöglichkeiten von Kraft-Wärme-Kopplung (Umsetzung der EU-Energieeffizienzrichtlinie) sowie Evaluierung des KWKG im Jahr 2014. Endbericht zum Projekt IC 4 - 42/13, Prognos AG / Fraunhofer IFAM / IREES / BHKW-Consult by order of the Federal Ministry for Economic Affairs and Energy, www.bmwi.de.
SABA (2012): http://www.saba.org.ir/saba_content/media/image/2012/04/3588_orig.pdf.

196
Sustainable Energy Strategy for IranReferences
Chapter 8
Arze del Grandado, J.; Coady, D. and Gillingham, R. (2012): The Unequal Benefits of Fuel Subsidies: A Review of Evidence for Developing Countries, World Development, 40, 2234-2248.
Baig, T.; Mati, A. and Coady, D. (2007): Domestic Petroleum Product Prices and Subsidies: Recent Developments and Reform Strategies, IMF working paper, WP/07/71.
Clements, B. (2013): Case Studies on Energy Subsidy Reform: Lessons and Implications, IMF report by a staff team. Dartanto, T. (2013): Reducing Fuel Subsidies and the Implications on Fiscal Balance and Poverty in Indonesia: A Simulation Analysis,
Energy Policy, 58, 117-134. Demirkol, O. et al. (2014): Islamic Republic of Iran, Selected Issues, IMF Country Report No. 14194, IMF, Washington, D.C. Dube, I. (2003): Impact of Energy Subsidies on Energy Consumption and Supply in Zimbabwe. Do the Urban Poor Really Benefit?,
Energy Policy, 31, 1635-1645. Fattouh, B., and El-Katiri, L. (2013): Energy Subsidies in the Middle Easet and North Africa, Energy Strategy Reviews, 2, 108-115. GTZ, Gesellschaft für technische Zusammenarbeit (2008): International Fuel Prices, 6th Edition, Data Preview.Guillaume, D. and Zytek, R. (2010): The Economics of Energy Price Reform in the Islamic Republic of Iran, IMF Country Report No.
10/76, Middle East and Central Asia Department, Washington.Guillaume, D.; Zytek, R. and Farzin, M.R. (2011): Iran - The Chronicles of the Subsidy Reform, IMF Working Paper, Middle East and
Central Asia Department, WP/11/167, Washington.Gupta, S. et al. (2000): Equity and Efficiency in the Reform of Price Subsidies: A Guide for Policymakers, International Monetary
Fund, Washington. IEA, International Energy Agency (2006): Carrots and Sticks: Taxing and Subsidizing Energy, Note on Energy Subsidies and Taxes,
Economic Analysis Division.IEA, International Energy Agency (2010): Analysis of the Scope of Energy Subsidies and Suggestions for G20 Initiatives, A Joint
Report by IEA, World Bank, OECD, and OPEC, www.oecd.org.IEA, International Energy Agency (2011): Development in Energy Subsidies, World Energy Outlook, Paris. IMF, International Monetary Fund (2008): Fuel and food Price Subsidies, Issues and Reform Options, Washington, www.imf.org.Iran Central Bank (various years): Time Series Data, http://www.cbi.ir.Iran Statistical Center (various years): Household Budget Survey Data 2001-2008. Ismaielnia, A.A. (2010): Economic Analysis of Subsidizing High-Efficient Fridge Producers, SABA, http://www.saba.org.ir/saba_cont-
ent/media/image/2012/04/3588_orig.pdf.Lipton, David (2013): Energy Subsidy Reform: The Way Forward, International Monetary Fund Report. Ministry of Energy (various years): Iran Energy Balance.Moshiri, S. and Darvishi, B. (2012): Determinants of Entery and Exit of Firms in Iranian Manufacturing Industries, Working paper,
University of Allameh Tabatabaie. Moshiri, S. (2013): Energy Price Reform and Energy Efficiency in Iran, Energy Forum, International Association for Energy Economics
(IAEE), Second Quarter. Moshiri, S. (2015): The Effects of the Energy Price Reform on Households Consumption in Iran, Energy Policy, 79, 177-188. Moshiri, S. et al. (2012): Long Run Energy Demand in Iran, International Journal of Energy Sector Management, 6, 1, 120-144. Salehi-Isfahani, D.; Stucki, B.W. and Deutschman, J. (2014): The Reform of Energy Subsidies in Iran: The Role of Cash Transfers,
Virginia Tech.The Titi Tudorancea Bulletin, Global Edition, http://www.tititudorancea.com/. Vagliasindi, M., (2012): Implementing Energy Subsidy Reforms: An Overview of Key Issues, Policy Research Working Paper No. 6122,
World Bank. World Bank (2010): Subsidies in the Energy Sector: An Overview, Background Paper for the World Bank Group, Energy Sector
Strategy, Washington.

Wuppertal Institute for Climate, Environment and EnergyP.O. Box 10048042004 WuppertalGermanyhttp://wupperinst.org ISBN: 978-3-929944-98-3