Halotolerant Plant Growth-Promoting Fungi and Bacteria as ...

SUSTAINABLECULTIVATIONOFMARINE,HALOTOLERANTANDHALOPHILICMICROALGAE
TasneemaIshika
AthesissubmittedinpartialfulfillmentoftherequirementforthedegreeofDoctorofPhilosophy
inBiotechnology
SchoolofVeterinaryandLifeSciences
MurdochUniversityWA,Australia
November2017

i
Abstract There has been a worldwide interest in mass microalgal production. As fresh water is a
limited resource, seawater must be used for sustainable production of microalgal bio-
mass. If an open pond cultivation system relies only on seawater, the salinity of the
growth media will rise over time. It is not possible for any microalgal species to achieve
high biomass under continuous salinity increase (from low salinity up to salt saturation).
Therefore, cultivation of microalgae with different salinity optima would be the best
possible approach to produce high biomass under continuously increased salinity. In
this study, the effect of increased salinity on microalgal biomass productivity was
assessed. Main targeted products were biofuel (low priced commodity) and fucoxanthin
(high-value pigment).
To identify high biomass producing species under constantly increased salinity, nine
microalgae of three different salinity ranges were selected. Of them six are marine or
low saline microalgae (Chrysotila carterae, Chaetoceros muelleri, Nannochlo-
ropsis sp., Pheodactylum tricornutum, Tisochrysis lutea and Tetraselmis
suecica), two are halotolerant or mid saline microalgae (Amphora sp. and Navicula
sp.), and a halophilicor hypersaline microalgae (Dunaliella salina). All these species
have already been successfully cultivated in outdoor condition and are also commercial-
ly important.
Among six marine microalgae, Tetraselmis suecica showed the widest salinity range,
i.e., 35 to 109 ppt (parts per thousand) with overall high biomass and lipid productivity
32 mg L-1 d-1 and 13.6 mg L-1 d-1 of AFDW (ash-free dry weight), respectively. Between
two halotolerant microalgae, Navicula sp. showed 3% higher biomass productivity
than Amphora sp. However, Amphora sp. was chosen for the further experiment since
Navicula sp. have been reported to achieve high growth only in winter. Halophilic mi-

ii
croalgae Dunaliella salina showed widest salinity range (35 and 233 ppt) among
the selected species with highest lipid content 56.2% of AFDW; hence, these three
species were selected for further study to produce high biomass and lipid under in-
creased salinity.
Among the nine selected species, six marine species, e.g., Chrysotila carterae,
Chaetoceros muelleri, P. tricornutum, and Tisochrysis lutea and; two halotoler-
ant species Amphora sp. and Navicula sp. are able to produce fucoxanthin, a high-
value pigment. Their fucoxanthin producing ability wastested under incremental salinity
increase. The results showed that at salinity below 55 ppt marine microalgae Chaetoc-
eros muelleri produced higher fucoxanthin than any other marine species. Both halotol-
erant microalgae Amphora sp. and Navicula sp. were able to produce high fucoxanthin
at salinity above 55 ppt; however, Amphora sp. was selected for further study as Navic-
ula sp. was reported to show good growth only in winter.
The results indicated that the highest biomass, lipid, and fucoxanthin production could
only be achieved at the optimal salinity ranges of tested microalgae. However, the opti-
mal salinity ranges of marine, halotolerant and halophilic microalgae are not continu-
ous. There are non-optimal salinity zones in between the optimal salinity ranges where
the biomass productivity is found low. Therefore, to produce high biomass at non-
optimal salinity zone, two cultivation methods namely co-cultivation and stepwise cul-
tivation were performed.
The overall biomass productivity of Tetraselmis suecica and Amphora sp.co-culture
showed no significant differences with the overall biomass productivity of Tetraselmis
suecica and Amphora sp. monocultures. However, the lipid productivity in Amphora sp.
monoculture was found 23% higher than the lipid productivity of co-culture. Similarly,
no significant difference was also observed between the biomass productivity of Am-

iii
phora sp. and D. salina co-culture and their monocultures. The overall lipid productivi-
ty in co-culture was approximately 40% less than that of D. salina monoculture. In
addition, fucoxanthin producing species, i.e., Chaetoceros muelleri and Amphora sp.
co-culture showed 38% and 50% less overall biomass and fucoxanthin productivity,
respectively than the overall biomass and fucoxanthin productivity of Amphora sp.
monoculture.
As co-cultivation showed low biomass, lipid and fucoxanthin productivity, stepwise
cultivation was performed to check whether it helped to improve the biomass, lipid and
fucoxanthin productivity. During stepwise culture, halotolerant microalgae were grown
in the filtrate of marine microalgae and halophilic species was cultivated in the filtrate
of halotolerant microalgae. No negative effect of recycled media was observed on the
growth and biochemical content of microalgae.
The biomass and lipid productivity in Tetraselmis suecica and Amphora sp. stepwise
culture was found 10% and 30%, respectively higher than that of Tetraselmis suecica
and Amphora sp. co-culture within the same salinity range. No significant differences
were observed between the biomass productivity of Amphora sp. and D. salina co-
culture and stepwise culture. However, the lipid productivity in Amphora sp. and D.
salina stepwise culture was found 40% higher than that of their co-culture within the
same salinity range. In stepwise culture, fucoxanthin producing Chaetoceros muelleri
and Amphora sp. showed 63% and 46.6% higher biomass and fucoxanthin productivity,
respectively than that of their co-culture at the same salinity range.
A preliminary economic assessment was also carried out to estimate the biomass and
fucoxanthin production cost. The results indicated that monoculture integrated with
stepwise culture offered lowest microalgal biomass production cost (≈1.37 Aus $ kg-1 of
dry biomass). This biomass cost was 9%, 15%, and 36% lower than the cost of biomass

iv
produced during halophilic, halotolerant and marine microalgae monoculture, respec-
tively. The lowest fucoxanthin production cost (58.2 Aus $ kg-1) was also achieved us-
ing monoculture integrated with stepwise culture system.
The outcome of this study clearly indicated that an integration of monoculture with
stepwise culture is the most effective approach for producing sustainable and high bio-
mass, lipid and fucoxanthin under incremental salinity increase.

v
Declaration
I hereby declare that this submission is my own work and that, to the best of my
knowledge, it contains no material previously published or written by another person
nor material which to a substantial extent has been accepted for the award of any other
degree or diploma of the university or other institute of higher learning, except where
due acknowledgement has been made in the text.
Tasneema Ishika
November 2017

vi
Dedicated to My Parents

vii
Acknowledgements I would like to express my special appreciation and thanks to my supervisor Dr. Navid
R. Moheimani, he has been a tremendous mentor for me. I would like to thank him for
encouraging my research and for allowing me to grow as a research scientist. His advice
on both research as well as on my career has been invaluable. I always received valua-
ble guidance, scholarly inputs, unconditional support, positive disposition and con-
sistent encouragement throughout the research work. He always made himself available
to clarify my doubts despite busy schedules and it is a great opportunity to pursue my
doctoral programme under his guidance and to learn from his research expertise.
I would also like to thank my co-supervisor Professor Parisa A. Bahri. She has been
very encouraging and supportive. She is a great inspiration for me as a successful re-
searcher. I am extremely grateful to Dr. Damian W. Laird for the academic support, the
facilities provided to carry out the research work, for his valuable suggestions and con-
cise comments on my research papers.
I am really thankful to all my colleagues, Risa, Ankitha, Nora, Ashiwin, Emeka, Javad,
Jason, Brent, Jack, Jeremy, Bianca, Stephani, Luisa, Roberta and Sandra. I really en-
joyed spending time with you. I am also thankful to Mahamudul Hassan for always be-
ing there. He is more like a family than a friend.
A special thanks to my family. Words cannot express how grateful I am to each of
them. I would also like to thank to my beloved husband Iqbal. Thank you for supporting
me and especially I can’t thank you enough for encouraging me throughout this experi-
ence. Finally, I am thankful to my parents who have always been the source of my in-
spiration and strength.

viii
Publications and Conference Peer reviewed publications Ishika, T., Moheimani, N.R., Bahri, P.A., Laird, D.W., Blair, S. and Parlevliet, D.
(2017) Halo-adapted microalgae for fucoxanthin production: Effect of incremen-tal increase in salinity. Algal Research 28, 66-73.
Ishika, T., Moheimani, N.R. and Bahri, P.A. (2017) Sustainable saline microalgae co-
cultivation for biofuel production: A critical review. Renewable and Sustainable Energy Reviews 78, 356-368.
Ishika, T., Moheimani, N.R., Bahri, P.A. and Laird, D.W. (2018) Effect of gradual in-
crease in salinity on the productivity, biochemical composition and photosynthe-sis of several marine, halotolerant and halophilic microalgae. Journal of Applied Phycology1-12.
Ishika, T., Moheimani, N.R., Bahri, P.A., Laird, D.W. Co-cultivation and stepwise cul-tivation of microalgae to produce high biomass and lipid under continuous salin-ity increase. In preparation. Targeted journal is: Journal of Applied Phycology.
Ishika, T., Moheimani, N.R., Bahri, P.A., Laird, D.W. Co-cultivation and stepwise cul-tivation of marine and halotolerant microalgae for producing high fucoxanthin under increased salinity. In preparation. Targeted journal is: Algal Research.
Conferences Ishika, T., Moheimani, N.R., Bahri, P.A. and Laird, D.W. (2017) Saline microalgae for
fucoxanthin production: Effect of incremental increase in salinity. 6th Congress of the International Society for Applied Phycology, June 18-23, 2017, Nantes, France (Oral).
Ishika, T., Moheimani, N.R. and Bahri, P.A. (2016) Effect of gradual salinity increase
on the biomass productivity of saline microalgae with commercial interest. 9th Asia-Pacific Conference on Algal Biotechnology, November 15-18, 2017, Bangkok, Thailand (Oral).

ix
Table of Contents
ABSTRACT .................................................................................................................................. I
DECLARATION ........................................................................................................................ V
ACKNOWLEDGEMENTS .................................................................................................... VII
PUBLICATIONS AND CONFERENCE ............................................................................ VIII
Table of contents ....................................................................................................................... IX
Chapter 1 ...................................................................................................................................... 1
Introduction .................................................................................................................................. 1
1.1 MICROALGAE 11.2 DEVELOPMENTOFMICROALGAEINDUSTRY 31.3 MICROALGAECULTIVATIONSYSTEMS 41.3.1 OPENPONDS 41.3.2 CLOSEDPHOTOBIOREACTORS 81.3.3 HYBRIDSYSTEM 91.3.4 OPENPONDVSCLOSEDCULTIVATIONSYSTEM 101.4 THEEFFECTSOFSALINITYRISESONTHEGROWTHANDPHYSIOLOGYOFMICROALGAE 111.5 SUSTAINABLESALINEMICROALGAECO-CULTIVATIONFORBIOFUELPRODUCTION 171.6 CO-CULTIVATIONFORCOMPREHENSIVEUSEOFNUTRIENTS 281.6.1 CULTIVATIONSTRATEGY 291.6.2 MODELINGFORTHEPROPOSEDCULTIVATION 311.6.3 NUTRIENTRECYCLINGINTEGRATEDWITHCO-CULTIVATION 361.6.4 COMPREHENSIVEEVALUATIONOFBIOFUELPRODUCTIONFROMMICROALGAE 391.7 COMMERCIALLYAVAILABLEHIGH-VALUEPRODUCTSFROMMICROALGAE 411.8 RESEARCHOBJECTIVES 51
Chapter 2 .................................................................................................................................... 52
General materials and methods ................................................................................................ 52
2.1 SOURCESOFMICROALGAESPECIES 522.2 CLEANINGANDSTERILIZATIONPROCEDURE 522.3 MEDIAPREPARATION 532.4 CULTUREMAINTENANCE 542.5 ANALYTICALPROCEDURES 552.5.1 GENERALPRECAUTIONS 552.5.2 MEASUREMENTOFALGALGROWTH 562.5.3 DETERMINATIONOFBIOCHEMICALCONTENT 582.5.4 PHOTOSYNTHETICMEASUREMENT 632.6 DATAANALYSIS 64
Chapter 3 .................................................................................................................................... 65
Effect of gradual salinity increase on biomass production and biochemical composition .. 65
3.1 INTRODUCTION 653.2 MATERIALSANDMETHODS 673.2.1 SPECIESSELECTION,CULTURECONDITIONANDCULTIVATION 673.2.2 SALINITYTOLERANCERANGE 68

x
3.2.3 ANALYTICALTECHNIQUES 683.2.4 STATISTICALANALYSIS 683.3 RESULTS 683.3.1 EFFECTSOFHALO-ACCLIMATIONANDINCREASINGSALINITYONCULTUREPERFORMANCE 683.3.2 CELLVOLUME 763.3.3 MAXIMUMQUANTUMYIELD 763.3.4 EFFECTOFSALINITYINCREASEONBIOCHEMICALCOMPONENTS 773.4 DISCUSSION 783.4.1 SALINITYRANGE 793.4.2 BIOMASSPRODUCTIVITYANDCELLVOLUME 793.4.3 MAXIMUMQUANTUMYIELD 803.4.4 BIOCHEMICALCOMPONENTS 813.5 CONCLUSION 82
Chapter 4 .................................................................................................................................... 85
Effect of incremental increase in salinity on fucoxanthin production .................................. 85
4.1 INTRODUCTION 854.2 MATERIALSANDMETHODS 884.2.1 SPECIESSELECTION,CULTURECONDITIONANDCULTIVATION 884.2.2 ANALYTICALTECHNIQUES 884.2.3 STATISTICALANALYSIS 884.3 RESULTS 884.3.1 PRODUCTIONOFFUCOXANTHIN 884.3.2 EFFECTOFSALINITYONBIOMASSPRODUCTIVITYANDPIGMENTCONTENT 914.4 DISCUSSION 924.4.1 POTENTIALADVANTAGESOFMICROALGAEOVERCURRENT(MACROALGAL)PRODUCTION 944.5 CONCLUSIONS 99
Chapter 5 .................................................................................................................................. 101
Co-cultivation and stepwise cultivation for ........................................................................... 101
Biomass and lipid production ................................................................................................. 101
5.1 INTRODUCTION 1015.2 MATERIALSANDMETHODS 1035.2.1 SPECIESSELECTION,CULTURECONDITIONANDCULTIVATION 1035.2.2 ANALYTICALTECHNIQUES 1055.2.3 STATISTICALANALYSIS 1065.3 RESULTS 1065.3.1 CO-CULTURE 1065.3.2 STEPWISECULTURE 1115.4 DISCUSSION 1165.4.1 GROWTH 1165.4.2 MAXIMUMQUANTUMYIELD(FV/FM) 1185.4.3 LIPID 1185.5 CONCLUSIONS 119
Chapter 6 .................................................................................................................................. 121
Co-cultivation and stepwise cultivation for fucoxanthin production .................................. 121
6.1 INTRODUCTION 1216.2 MATERIALSANDMETHODS 1226.2.1 SPECIESSELECTION,CULTURECONDITIONANDCULTIVATION 122

xi
6.2.2 ANALYTICALTECHNIQUES 1236.2.3 STATISTICALANALYSIS 1236.3 RESULTS 1246.3.1 CO-CULTURE 1246.3.2 STEPWISECULTURE 1276.4 DISCUSSION 1306.5 CONCLUSIONS 132
Chapter 7 .................................................................................................................................. 134
Preliminary economic assessment .......................................................................................... 134
7.1 INTRODUCTION 1347.2 GEOGRAPHICALLOCATION,ANNUALEVAPORATIONANDRAINFALLRATE 1357.3 APPROACHESANDASSUMPTIONSUSEDFORANALYSIS 1377.3.1 ASSUMPTIONSRELATEDTOCULTIVATION 1377.3.2 ASSUMPTIONSRELATEDTOCAPITALEXPENDITURES(CAPEXS) 1427.3.3 ASSUMPTIONFOROPERATIONALEXPENDITURES(OPEXS) 1437.3.4 ASSUMPTIONRELATEDTOFUCOXANTHINANDΒ-CAROTENEPRODUCTION 1447.4 SENSITIVITYANALYSIS 1447.5 RESULTS 1447.5.1 BASELINEECONOMICS 1447.5.2 FUCOXANTHINANDΒ-CAROTENEPRODUCTION 1507.6 DISCUSSION 1537.7 CONCLUSIONS 156
Chapter 8 .................................................................................................................................. 157
Conclusion and future directions ........................................................................................... 157
8.1 GENERALCONCLUSION 1578.2 FUTUREDIRECTIONS 160
References ................................................................................................................................. 163
Appendix ................................................................................................................................... 180

1
Chapter 1 Introduction
1.1 Microalgae
Microalgae are prokaryotic or eukaryotic, unicellular or simple multicellular
photosynthetic microorganisms (Mata et al., 2010). Microalgae have much higher
biomass and oil productivity (73 ton of biomass ha-1 y-1 with 25-40% of oil content in
open ponds) compared to first generation (e.g., food and oil crops) and second
generation (e.g. non-food feedstock) biofuel (Borowitzka & Moheimani, 2013b; Posten
& Schaub, 2009; Schenk et al., 2008). In addition to their high biomass and oil produc-
tivity, they usually double their biomass within a day (Ahmad et al., 2011). They are
easier to cultivate and can produce higher yield per hectare than other crops over the
similar land areas (Posten & Schaub, 2009; Schenk et al., 2008). Furthermore, due to
the possibility of nutrient recycling, microalgae mass cultivation require 10–70% less
fertilizers, than sunflower, canola, jatropha, and soybean (Borowitzka & Moheimani,
2013b; Brittaine & Lutaladio, 2010; Dale Grey, 2006; Grant & Bailey, 1993; Serafin &
Belfield). Table 1.1 shows the comparative analysis of oil productivity and nutrient re-
quirement between conventional agricultural crops and microalgae. Additionally, mi-
croalgae do not compete for land with food crops (Huang et al., 2010) and could poten-
tially be grown in an unsuitable environment for conventional agriculture such as non-
arable land using non-potable water (e.g., brackish, saline, hypersaline and waste water)
(Borowitzka & Moheimani, 2013b). Thus, the cultivation of microalgae for fuel produc-
tion could end the issues related to ‘food versus fuel’ (i.e., dependency on fresh water,
agricultural land) (Fon Sing et al., 2013).

2
Table1.1Amountoffertilizersrequiredforcropsandmicroalgae
Crops
Oilproductivity(Lha-1year-1)
Oilproductivityofmicroalgaeincompari-sontoothercrops(%)
FertilizerRequiredAmountoffertilizersaved
duringmicroalgaecultivationincomparisontoothercrops
Nitrogen(kgha-1)
Phosphorus(kgha-1)
Nitrogen(%)
Phosphorus(%)
Conventionalagriculturalcrops
Soybean636
(Mataetal.,2010)97.4 -
11(DaleGrey,2006)
- 9
Sunflower1070
(Mataetal.,2010)95.6
40(Serafin&Belfield)
5(Serafin&Belfield)
25 20
Canola974
(Mataetal.,2010)96
62(Grant&Bailey,1993)
11(Grant&Bailey,1993)
16 9
Jatropha741
(Mataetal.,2010)97
14.3-34.3(Brittaine&Lutaladio,2010)
7(Brittaine&Lutaladio,2010)
29-70 14.3
Microalgae24333
(Borowitzka&Moheimani,2013b)
-10
(Borowitzka&Moheimani,2013b)
1(Borowitzka&Moheimani,
2013b)
-
*ha=Hectare
3
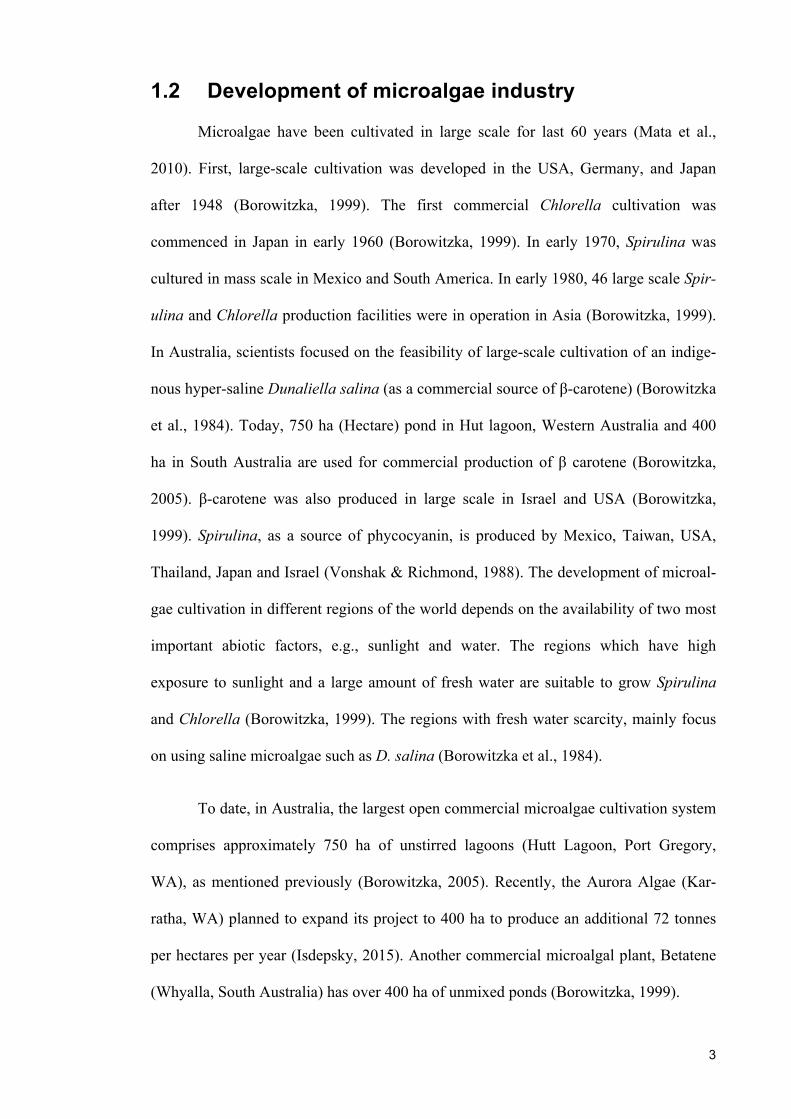
1.2 Development of microalgae industry
Microalgae have been cultivated in large scale for last 60 years (Mata et al.,
2010). First, large-scale cultivation was developed in the USA, Germany, and Japan
after 1948 (Borowitzka, 1999). The first commercial Chlorella cultivation was
commenced in Japan in early 1960 (Borowitzka, 1999). In early 1970, Spirulina was
cultured in mass scale in Mexico and South America. In early 1980, 46 large scale Spir-
ulina and Chlorella production facilities were in operation in Asia (Borowitzka, 1999).
In Australia, scientists focused on the feasibility of large-scale cultivation of an indige-
nous hyper-saline Dunaliella salina (as a commercial source of β-carotene) (Borowitzka
et al., 1984). Today, 750 ha (Hectare) pond in Hut lagoon, Western Australia and 400
ha in South Australia are used for commercial production of β carotene (Borowitzka,
2005). β-carotene was also produced in large scale in Israel and USA (Borowitzka,
1999). Spirulina, as a source of phycocyanin, is produced by Mexico, Taiwan, USA,
Thailand, Japan and Israel (Vonshak & Richmond, 1988). The development of microal-
gae cultivation in different regions of the world depends on the availability of two most
important abiotic factors, e.g., sunlight and water. The regions which have high
exposure to sunlight and a large amount of fresh water are suitable to grow Spirulina
and Chlorella (Borowitzka, 1999). The regions with fresh water scarcity, mainly focus
on using saline microalgae such as D. salina (Borowitzka et al., 1984).
To date, in Australia, the largest open commercial microalgae cultivation system
comprises approximately 750 ha of unstirred lagoons (Hutt Lagoon, Port Gregory,
WA), as mentioned previously (Borowitzka, 2005). Recently, the Aurora Algae (Kar-
ratha, WA) planned to expand its project to 400 ha to produce an additional 72 tonnes
per hectares per year (Isdepsky, 2015). Another commercial microalgal plant, Betatene
(Whyalla, South Australia) has over 400 ha of unmixed ponds (Borowitzka, 1999).

4
1.3 Microalgae cultivation systems
Microalgal culture is one of the modern biotechnological processes. The success
of large-scale production mainly depends on the development of cost-effective culture
systems (Borowitzka, 1999). Scaling up from laboratory scale to industrial scale is the
major challenge to maintain the high biomass productivity and culture stability (Fon
Sing et al., 2013). The large-scale commercial cultivation of microalgae commenced in
the early 1960s in Japan (Fon Sing et al., 2013). There are two predominant cultivation
systems: open ponds and closed photobioreactors (Borowitzka, 1999).
1.3.1 Open ponds
Cultivation of algae in open ponds has been extensively studied (Boussiba et al.,
1988). The open pond is the only algae cultivation system which is used commercially
(Doucha & Lívanský, 2014). The biggest advantage of open pond system is the simplic-
ity of construction. The system also uses the outdoor light efficiently and is less difficult
to scale up compared to closed photobioreactors (Borowitzka, 1999). Commercially the
open pond system is also used to treat wastewater (Craggs et al., 2012). However, it has
some drawbacks, e.g., excess rainfall could cause culture loss; contamination can easily
take place, difficult to maintain temperature and not easy to ensure sufficient light for
every microalgal cell in a very dense culture (Borowitzka, 1999). Four main types of
open ponds are presently in use, and these are shallow ponds, raceway ponds, circular
ponds and inclined system (Moheimani, 2005).

5
Figure 1.1DifferentopenpondsA. lagoons, B. racewaypond, C. circular pond,D. inclinedpond (A courtesy https://www.basf.com/nz/en/company/news-and-media/blog/pretty-in-pink.html,Bcourtesyhttps://meristemjourneys.wordpress.com/2015/05/19/algae-biofuels-a-blooming-business/, C courtesy http://making-biodiesel-books.com/about-algae/open-pond-biofuels/,DcourtesyDouchaandLívanský(2014).
1.3.1.1 Lagoons
Lagoons are the most economical and least technical cultivation system
(Moheimani, 2005). These are large ponds with an area more than 250 ha, and the aver-
age depth is approximately 0.3 m (Borowitzka, 1999). The lagoon is constructed from
natural ponds with or without uncovered beds (Moheimani, 2005). These are unmixed
ponds; still, natural mixing takes place due to wind and convection (Borowitzka, 1999;
Tredici, 2004). In South and Western Australia, this type of ponds are used for cultiva-
tion of D. salina to produce β-carotene (Isdepsky, 2015).
A B
C D

6
1.3.1.2 Raceway ponds
Raceway pond is the most widely used cultivation system for commercial pro-
duction of microalgae. It has been used since the late 1970s for the cultivation of algae
to produce nutraceuticals and to treat wastewater and also used to capture CO2 and pro-
duce biodiesel (Liffman et al., 2013). The system is like an oblong basin equipped with
a dividing wall at the center which makes a circuit of parallel channels. A paddle wheel
is attached to it which circulates microalgal culture inside the pond (Zittelli et al., 2013).
It can be constructed using concrete or dug in the ground and covered with a plastic
liner. During construction, pond liner must be carefully laid at the bottom to prevent
wrinkling at the bottom or water accumulation beneath the lining (Doucha & Lívanský,
2014). The depth of most paddle-wheel driven raceway ponds are between 20 and 30
cm, and the depth depends on the balance of few factors like adequate light supply, ade-
quate water depth for mixing and changes in ionic composition due to evaporation.
Raceway ponds are used by several companies, e.g., Earthrise Nutritionals, LLC (Cali-
fornia, USA) use raceway pond for growing Arthrospira and Cyanotech Co. (Hawaii,
USA) use it for the cultivation of Haematococcus pluvialis etc. (Zittelli et al., 2013).
Although its design is simpler and construction is cheaper it shows the same drawbacks
as open ponds (see section 1.4.2). Beside those, another major drawback of raceway
pond is the loss of energy while circulating the culture around the raceway, particularly
at the hairpin bends; however, the raceway pond designed by Liffman et al. (2013)
showed that it would be possible to reduce the energy consumption at the conventional
bend by 87%.
1.3.1.3 Circular ponds
Circular ponds are built with a centrally pivoted long rotating arm that controls
mixing. The pond is used to construct with concrete, and the culture is maintained at 20

7
-40 cm depth (Doucha & Lívanský, 2014). The circular ponds are usually limited to 1
ha area due to inability to rotate the arm to evenly mix the culture in a larger pond
(Borowitzka, 2005). These are the oldest and widely used culture system for wastewater
treatment (Moheimani, 2005). The main drawbacks of the system are low culture densi-
ties, low mixing efficiency especially in the middle of the pond, insufficient supply of
CO2 by nozzles located on the arm, high consumption of energy during mixing (Doucha
& Lívanský, 2014). The circular ponds are widely used in Japan, Taiwan, and Indonesia
(Lee, 2001; Zittelli et al., 2013).
1.3.1.4 Inclined systems
Inclined system or thin layer culture technology offers high surface-volume
ratio, and the microalgae cultures flow in a very thin layer, at (maximum) 10 mm in
depth. It enhances the light using efficiency and also increases the chance of high bio-
mass productivity (Masojídek et al., 2011). The inclined system contains slop that al-
lows microalgae culture to flow down through the surface and the cultures are pumped
back to the top of the incline after accumulating in a retention tank (Borowitzka &
Moheimani, 2013a; Zittelli et al., 2013). The circulation of culture usually takes place
during day time, and at night the cultures are kept in an aerated tank (Doucha &
Lívanský, 2014). During day, the flowing velocity was maintained 50-60 cms-1 which
results in a high frequency of light/dark periods of single cells. Thus it increases the
light utilization efficiency and decreases the photoinhibitory effect (Doucha &
Lívanský, 2014). It also provides the opportunity to quickly secure the culture in case of
emergency (e.g. unfavourable climate conditions) (Borowitzka & Moheimani, 2013a;
Zittelli et al., 2013). Inclined ponds are widely used in the Czech Republic for cultivat-
ing Spirulina platensis, Chlorella sp. and Scenedesmus sp. (Moheimani, 2005).

8
1.3.2 Closed photobioreactors
Considering all the difficulties of open pond cultivation such as control over
temperature, evaporation, and growth limited to the warmer months, closed photobiore-
actors are designed to provide a controlled environment to grow microalgae with high
biomass productivity. For cultivation purposes, a number of closed photobioreactors
have been investigated, e.g., Tubular photobioreactor, Flat (plate) photobioreactor.
Figure1.2DifferentclosedphotobioreactorsA.tubularphotobioreactorB.flatphotobioreac-tor(AcourtesyKoller(2015),BcourtesyNationalresearchcouncil,USA).
1.3.2.1 Tubular photobioreactor
A tubular photobioreactor is the most preferred system for commercial produc-
tion of microalgae (Tredici, 2004). These reactors are usually constructed either with
glass or plastic tubes with diameters ≈ 3-6 cm and lengths ranging from 10 to 100 m
(Moheimani, 2005). The cultures are mixed in the tubes with the help of pumps or using
airlift systems. The tubes are arranged in different ways, e.g., vertical, vertical helical,
horizontal, conical horizontal or as straight tubes (Moheimani, 2005). Different designs
allow different light penetration and flow. Some proposed design of tubular
photobioreactors are as follows: horizontal straight tubes connected by U-bends (Tredici
& Materassi, 1992), flexible tubing coiled around a vertical cylindrical framework
(Borowitzka, 1999), reactors with cross tubes arranged at an angle with the horizontal
A B

9
(Lee et al., 1995), vertical (Pirt et al., 1983) and inclined arrangement (Ugwu et al.,
2002). In these photobioreactors, the temperature is controlled by evaporative cooling or
through a heat exchanger installed in the reactor circuit. The airlift device is a combina-
tion of a pump and gas exchanger that removes oxygen produced during photosynthesis
and circulates cells throughout the tube without any damage. Tubular photobioreactors
also offer the advantages of lower contamination and constant controlled temperature
(Moheimani, 2005).
1.3.2.2 Flat photobioreactor
The flat photobioreactor is a transparent rectangular container. The culture flow
inside the reactor is maintained by air through a pierced tube from the bottom of the
reactor. Several designs of flat photobioreactors are also available. For example, a flat-
cuvette photobioreactor designed by Nedbal et al. (2008) can accurately control culture
irradiance, temperature, pH, and gas composition combined with real-time monitoring
by a build-in fluorometer and densitometer (Nedbal et al., 2008). Pleurochrysis carterae
has been successfully grown by Moheimani et al. (2011) in a V-shape based flat reactor.
Simpler construction, the absence of U-shaped bends, better gas exchange and reduced
light path, are the advantages of flat photobioreactor compared to tubular photobioreac-
tor.
1.3.3 Hybrid system
The hybrid cultivation system is a combination between the open pond and
closed photobioreactor where closed photobioreactor is used to cultivate microalgae in
indoor under controlled condition, and open pond system utilizes natural resources. In a
hybrid system, photobioreactor produces continuous culture with high biomass produc-
tivity in a contamination-free controlled condition. When microalgae culture is trans-
ferred and cultivated in uncontrolled outdoor condition, microalgal cells are stressed and

10
thereby produce high intracellular lipid (Huntley & Redalje, 2007). Su (2011) cultivated
Nannochloropsis oculata in both controlled and uncontrolled condition sequentially and
produced 2.82 times higher lipid yield than a single cultivation system. The hybrid cul-
tivation system is also practiced with Haematococcus pluvialis in the USA (Borowitzka,
1999).
1.3.4 Open pond VS closed cultivation system
Closed photobioreactors have low illumination surface areas and are mostly op-
erated indoor (Ugwu, 2008). However, cultivation in indoor photobioreactors with arti-
ficial light results in very high energy cost (Ugwu, 2008). Only small number of them
can effectively exploit solar energy; but those are difficult to scale up mainly due to
difficulties in maintaining optimum light, temperature, and mixing. Photoinhibition and
temperature control in cultures are common problems in outdoor photobioreactors. At-
tachment of cells to the tubes’ walls may also prevent light penetration (Ugwu, 2008).
Accumulation of dissolved oxygen concentrations is another difficulty, faced by photo-
bioreactors and high dissolved oxygen (DO) levels may cause intoxication of the culture
(Acién et al., 2012). In addition, bio-fouling, cell damage by shear stress and deteriora-
tion and expensive building and maintenance are some other technological challenges
with photobioreactors (Ugwu, 2008). The comparison between the open pond and
closed photobioreactors is represented in Table 1.2.

11
Table1.2ComparisonofOpenpondandPhotobioreactors
*Inmostcasesthereisaneedforalargeamountoffreshwaterforcooling.
However, the selection of a particular system is dependent on the intrinsic prop-
erties of microalgae, local climatic condition and cost of land and water (Borowitzka,
1994). For determining the most efficient culture system, all prevailing systems need to
be compared on the basis of their light utilization efficiency, ability to control
temperature, the hydrodynamic stress placed on microalgae, the ability to maintain the
culture, how easy they are to scale up from laboratory to large scale and finally on their
cost (Borowitzka, 1999). The ultimate choice of the system is always a compromise
between all the above considerations to get an economically acceptable system
(Borowitzka, 1999). Considering all these, it can be said that, open raceway ponds
might be the most viable solution for the mass outdoor production of microalgae and
closed photobioreactors are better for indoor cultivation purposes.
1.4 The effects of salinity rises on the growth and physiology of microalgae
Salinity is the key eco-physiological parameter for estimating the effect of salt
on microalgae and also determines the responses, tolerances and the way in which mi-
croalgae adapt to salinity changes. The physiological and biochemical responses of mi-
croalgae to salinity have been extensively studied, and it has been found that salinity
tolerance of microalgae differs across different species based on the ecological distribu-
Features Openpond Photobioreactor(PBR)Construction CheaperthanPBR Expensivetoveryexpensive(Borowitzka,1999)Operatingprocess Simpler Complex(Borowitzka,1999)Evaporationrate High Low*(Borowitzka,1999)Contaminationrisk High Low(Borowitzka,1999)
Light Onlypenetratetocertaindepth
Betterlightpenetrationifathinlayerisused(Ugwu,2008)
Chanceofoxygenintoxication Low Veryhigh(Aciénetal.,2012)
Chanceofbio-fouling Low Veryhigh(Ugwu,2008)

12
tion and physiology of microalgae (Lionard et al., 2005). Some studies have reported
that coastal species have higher levels of salinity tolerance compared to oceanic species
(Balzano et al., 2011; Brand, 1984). The relative level of marine phytoplankton toler-
ance to low salinities is, estuarine species tolerance range is greater than costal species
is greater than ocean species (Brand, 1984; Kirst, 1990).
Every microalga has an optimum salinity (Brand, 1984). However, it has also
been found that microalga can adapt a wide range of salinity (Strizh et al., 2004).
Microalga with a wide range of salinity tolerance can easily adapt the low and high
saline environment (Strizh et al., 2004); e.g., Tetraselmis indica (isolated from a salt
pan) was able to tolerate the salinity started from sea water level, i.e., 35 ppt (ppt, parts
per thousand) of NaCl concentration up to salt saturation state, i.e., 350 ppt of NaCl
concentration (Arora et al., 2013). The hypersaline microalga Dunaliella salina has also
been shown to grow from 25 ppt to 300 ppt of NaCl concentration (Al-Hasan et al.,
1987). Conversely, microalga with narrow salinity tolerance range has the opposite re-
sponse (Gu et al., 2012; Loeblich, 1982; McLachlan, 1961; Renaud & Parry, 1994).
Salinity is a growth-limiting factor that directly affects the biomass productivity
of microalgae; however, it should be noted that the effects are highly species-specific
(Cho et al., 2007). A number of studies have shown that under optimal saline condi-
tions, microalga has the highest biomass productivity and chlorophyll content (Gu et al.,
2012; Loeblich, 1982; McLachlan, 1961). The biomass productivity of a particular spe-
cies drops when the salinity rises beyond its tolerance range; for example, when salinity
increased to 5%, the specific growth rate of Tetraselmis chuii was found to decline from
its usual productivity level (Ghezelbash et al., 2008b). In general, increases in salinity
beyond optimal tolerance ranges lead to reduced growth rates across almost all species
(Ben-Amotz et al., 1985).

13
Salinity changes may cause osmotic stress, ion stress and cellular ionic ratio
changes in microalgae (Moheimani, 2005). The major effect of salinity on microalgal
growth relates to osmoregulation. Further, a change in salinity can lead to either plas-
molysis or cells bursting due to the exosmosis or endosmosis process (Fogg, 2001;
Kirst, 1990). Under osmotic stress, saline microalgae acclimatize to different mecha-
nisms to accustomed unfavourable salt stress (e.g., regulated uptake of ions) (Kirst,
1977; Strizh et al., 2004). It has been reported that Dunaliella salina can eliminate chlo-
ride and sodium ion, respectively in response to high levels of salt stress (Eppley, 1958;
Katz et al., 2009). Dunaliella salina has also been found to have an efficient sodium ion
homeostasis mechanism that maintains the constant sodium ion concentration in the
cytoplasm (Pick et al., 1986). Researchers have also shown that in response to high sa-
linity some blue-green algae accumulate sulfate that acts as a trace metal to balance
chloride rise in the cell (Guillard, 1962).
Another strategy for regulating osmotic imbalances is the synthesis of low-
molecular-weight osmotica (e.g., glycerol, mannitol, sucrose, and proline) (Borowitzka
& Brown, 1974; Kirst, 1990; Kirst, 1988; Reed & Stewart, 1988). Dunaliella salina has
been shown to produce and increase glycerol content in response to high levels of sa-
linity stress (Avron, 1992). D. salina has also been shown to enhance photosynthetic
CO2 assimilation in increased saline conditions and diverts that carbon for the synthesis
of glycerol (Katz et al., 2009). In D. tertiolecta, a special isoform of dihydroxy acetone
phosphate reductase, an enzyme, has been identified that catalyzes massive glycerol
synthesis at an increased salinity (Gee et al., 1993).
It has also been reported that salinity induced extracellular polysaccharides
(Mishra & Jha, 2009). Four monosaccharides like glucose, galactose, xylose, and fruc-
tose have been shown to increase with high salinity stress (Mishra & Jha, 2009). Fur-

14
thermore, a linear increase in intracellular mannitol concentration has been observed
with increases in salinity which indicates that mannitol appears to be involved in osmo-
regulation (Ghezelbash et al., 2008a; Hellebust, 1976).
In response to an unfavorable condition, microalgae increase the synthesis of li-
pids (Bartley et al., 2013; Hodgson et al., 1991). A number of researchers have investi-
gated that salt stress can be protected by lipid accumulation (Huflejt et al., 1990;
Khomutov et al., 1990). Additionally, other studies have shown that an increase in salin-
ity also changes intracellular lipid composition. In Dunaliella, the concentration of satu-
rated and monounsaturated fatty acids have been found to increase, as polyunsaturated
fatty acid content decreases in response to high saline stress (Takagi & Yoshida, 2006).
The fatty acid compositions of polar lipids have also been found to change (Peeler et al.,
1989).
Increased saline conditions have also been reported to cause the active synthesis
of protein and produce a remarkable change in protein composition (Katz et al., 2009).
Hypersalinity has also been found to induce the accumulation of proteins in the plasma
membrane that increases CO2 uptake and causes enhanced photosynthetic activity (Katz
et al., 2009). In species with rigid cell walls, osmotic pressure is counterbalanced with
turgor pressure (e.g., some cyanobacteria can synthesize trehalose to create positive
turgor within the cells) (Kirst, 1988; Reed & Stewart, 1988).
Increases in salinity can also produce some biochemical changes; e.g. an
increase in ash content (Ben-Amotz et al., 1985), an increase in carotenoids in
Dunaliella salina (mainly the proportion of β-carotene increased, but the proportion of
α-carotene remained unchanged) (Borowitzka et al., 1990; Loeblich, 1982) and
astaxanthin content in Haematococcus pluvialis (Boussiba & Vonshak, 1991; Takagi &

15
Yoshida, 2006). Microscopic observation has shown that the size of most microalgae
cells decreases in response to increased salinity (Takagi & Yoshida, 2006).
The effect of salt stress on photosynthetic activity of microalgae has been widely
studied and has received considerable attentions, as the effects may change with adapta-
tion mechanisms; for example, a sudden change in salinity can cause marked inhibition
in normal photosynthetic activity (Satoh et al., 1983). To balance the sudden osmotic
changes, microalgae expend most of their energy producing compatible solutes and in-
creasing their ion exchange mechanisms to produce a transient repression in photosyn-
thesis until a new steady state of growth is achieved (Hellebust, 1976; Lu & Vonshak,
1999; Vonshak & Richmond, 1981). Satoh et al. (1983) noted that due to osmotic stress,
the excitation energy expended to reach photo-system II (PS II) reaction centers reduced
and inhibited the oxidizing side of PS II, resulting in a decrease in PS II activity (Satoh
et al., 1983). Gilmore et al. (1985) and Endo et al.(1995) also associated the decrease of
photosynthesis due to osmotic shock with the inhibition of PS II activity (Endo et al.,
1995; Gilmour et al., 1985). Lu and Vonshak (1999) found that salt stress in Spirulina
platensiswas associated with a decrease in PS II activity (Lu & Vonshak, 1999). Salt
stress can also induce an increase in non-photochemical quenching and a decrease in
photochemical quenching (Lu & Vonshak, 2002).
Conversely, photosynthesis remains relatively unaffected and shows a partial re-
covery when saline microalgae adapt to low salinities are transferred to high salinities
(Hellebust, 1976). At high salinity, photosynthetic activity is usually reduced by the
reduced availability of CO2 (Booth & Beardall, 1991). To prevent the reduction in CO2
assimilation and to recover the reduced photosynthetic activity, hypersaline microalgae
induce the up-regulation of a key enzyme in carbon uptake and assimilation in response
to an increased saline condition (Zamir et al., 2004). In Dunaliella salina, the accumula-

16
tion of three different carbonic anhydrases (enzymes related to the uptake of CO2 at the
surface of the plasma membrane) has been found to be induced by salinity (Dionisio-
Sese & Miyachi, 1992; Fisher et al., 1996). Additionally, it has also been reported that
the up-regulation of five central enzymes in Calvin cycle that mediates the assimilation
of CO2 at an increased saline condition, is induced by salinity rise also (Katz et al.,
2009).
Salinity integrated with other abiotic parameters, e.g., nutrient concentration,
light, temperature, and CO2 are able to change the growth and biochemical content of
microalgae. Microalgae are found to survive at an increased salinity in a nutrient-rich
condition; although their growth was found to be reduced at that condition (Yeesang &
Cheirsilp, 2011). It has also been found that nitrogen deficiency and salt stress induces
the accumulation of lipids in microalgae (Ben-Amotz et al., 1985). The same study
showed that under nutrient sufficient condition, the ash content of microalgae increased
at high salinity. Nutrient replete condition with low salinity is found to offer higher spe-
cific growth rate and chlorophyll content than that of high salinity with sufficient nutri-
ents. The production of specific product can also be manipulated by changing the nutri-
ent composition and salinity of media. Excess nitrogen and low salinity are found
favourable for producing high biomass. Conversely, low nitrogen and high salinity max-
imizes carotene production (Hu, 2008). High salinity in conjunction with high light in-
tensity and high temperature is also found to produce high content of β-carotene in Du-
naliella (Borowitzka & Borowitzka, 1988).
Optimal temperature and salinity are necessary for the high biomass productivity
of microalgae (Renaud et al., 1995), although the effect is species specific. For example,
a very low saline microalgal species is reported to show better growth at low tempera-
ture (15 and 20°C) under low salinity (10 and 20 ppt). Conversely, marine microalgae

17
show better growth at high temperature (25 and 30°C) with 30 ppt salinity (Jiménez &
Niell, 1991).
The addition of carbon dioxide (CO2) also influences the growth and biochemi-
cal composition of microalgae. Under optimal salinity and temperature, the addition of
CO2 is found to enhance the growth of microalgae (de Castro Araújo & Garcia, 2005).
CO2 addition is also found to increase protein and lower carbohydrates content, alt-
hough no effect on lipid content is observed (de Castro Araújo & Garcia, 2005).
1.5 Sustainable Saline Microalgae Co-Cultivation for Biofuel Production
Microalgal cultivation is preferable in the arid regions with high annual insola-
tion using seawater or saline groundwater rather than fresh water because the fresh wa-
ter supply is a limiting factor and must be used for food crops (Borowitzka, 2008). In
recent decades, fresh water scarcity has increased from 69% to 77% (Connor et al.,
2009). While over the last 50 years, water withdrawals have tripled (Connor et al.,
2009). Therefore, using fresh water for microalgal biofuel production is unrealistic in
regions with limited fresh water resource such as Australia where 20-30% of wastewater
(approximately 300,000 ML year-1) is recycled every year to meet fresh water demand
(Whiteoak et al., 2012). So, the use of seawater to cultivate microalgae provides an ideal
solution for the production of biofuel, as in addition to reducing the pressure placed on
fresh water consumption, it would also reduce production costs; thus, making the
biofuel economically viable (Brennan & Owende, 2010; Doan et al., 2012; John et al.,
2011).
Fertilizer is another important limited non-renewable resource. Microalgae and
conventional agricultural crops require large amounts of fertilizer to ensure higher

18
productivity (Borowitzka & Moheimani, 2013b). Nitrogen fertilizer represents up to
45% of the effective energy input of microalgae cultivation (Greenwell et al., 2009).
Both phosphorus and nitrogen fertilizers are finite, and their reserves are currently de-
pleting; for example, it is estimated that phosphate rock reserves will be fully depleted
within 100 years (Cordell et al., 2009; Steen, 1998). Additionally, the on-going price of
fertilizer reduces the sustainability of low-cost biofuel production. Consequently, to
produce cost-effective biofuel and reduce the direct competition between microalgae
and food crops for the fertilizers, the conservation and recycling of fertilizer are critical
in microalgae cultivation (Borowitzka & Moheimani, 2013b).
Regions with high algal productivity receive high solar irradiance and thus have
high evaporation rates (Fon Sing et al., 2014). If a saline microalgae cultivation system
relies only on seawater and recycled media, its salinity will increase overtime due to
evaporation and continuous media recycling (Figure 1.3). This review sought to com-
pare annual evaporations and rainfall rates of three potential locations in Western Aus-
tralia (namely Karratha, Geraldton, and Perth) for microalgae cultivation depending on
the annual evaporation and rainfall rate of those places (Table 1.3).

19
Table1.3Salinity increase from35ppt to295pptbasedonevaporation, rain fall rateand80%mediarecycling
Places Evaporation(my-1)
Rainfall(my-1)
Salinityincreaseday-1
(ppt) DaysRequired
Karratha 3.2(Meteorology,2008)
0.3(Meteorology,2008) 0.07 376
Geraldton 2.4(Meteorology,2008)
0.4(Meteorology,2008) 0.05 527
Perth 1.8(Meteorology,2008)
0.6(Meteorology,2008) 0.03 881
Figure1.3CulturemediumsalinitychangesovertimeinthreedifferentlocationsinWesternAustralia(openpondscultivationusingseawaterwith50%mediadilutionandrecycling)
If a marine microalgal species with a narrow range of salinity tolerance was cul-
tivated only with seawater, it would fail to grow beyond a certain salinity range, as the
salinity would increase over time (Gu et al., 2012; Sigaud & Aidar, 1993). Consequent-
ly, despite containing enough nutrients to sustain the microalgal cultivation, the existing
culture media needs to be regularly discharged. Of the overall input, it has been found
that up to 36% of nitrate and 26% of phosphate remain in the growth media every day
(Fon Sing et al., 2014). If not recycled, this leftover nutrient will waste and thereby in-

20
crease production costs. The recycling of growth media is estimated to reduce the use of
water and nutrients by 84% and 55%, respectively and thus a system becomes more
sustainable both energetically and economically (Yang et al., 2011). Figure 1.4 summa-
rizes a feasible cultivation strategy of saline microalgae using recycled saline media
(Moheimani et al., 2015).
Figure1.4Cultivationstrategyofsalinemicroalgaeinopenpondbyusingonlyseawaterandrecycled media (media are recycled after harvesting and extraction) (Moheimani et al.,2015).
To date, no single species has been found that is capable of growing through the
entire salinity range (i.e., from a low salinity to a salt saturation state) with sufficient
biomass productivity. Thus, the selection of different microalga species that can grow
over a broad range of salinity is necessary. The species of interest must be first analyzed
based on their salinity range, commercial applications and potential advantages
throughout the cultivation process (see some examples in Table 1.4).

21
Table1.4Industriallyimportantsalinemicroalgaewithvarioussalinityoptimumgrowthrange.
MicroalgaeCommercialimportance Biomassproductivity Lipidcontent
(%ofdryweight)
AdvantagesandLimitationsassociat-edwithcultivationFuel Feed High-value
product gm-2d-1 gL-1d-1
VeryLowsaline(10-30ppt)
Nitzschiasp.√
(Renaudetal.,1995)
√(Borowitzka,
1997)
√(Renaudetal.,1994)
45-47(Demirbas&Demirbas,2011)
Both microalgae usually show opti-mum growth range between 20 and25 ppt (Lee, 2002). But the normalrange of salinewater is between 30-36 ppt (Emery & Meincke, 1986),which is higher than the optimumgrowth range of these organisms,making their commercial cultivationcostintensive.
Isochrysissp.√
(Napolitanoetal.,1990)
√(Borowitzka,
1997)
√(Grimaetal.,
1994)
28(Griffiths&Harrison,2009)
22
(Griffiths&Harrison,2009)
Chlorellaemersonii √(Borkensteinetal.,2011)
√(Malisetal.,
1993)
0.04(Scraggetal.,
2002)
25-34(Scraggetal.,
2002)
C. emersonii produces three fold bio-mass in the presence of flue gas(Borkensteinetal.,2011).
C.salina√
(Wong&Chan,1990)
√(Becker,2007)
0.17
(Talebietal.,2013)
11(Talebietal.,
2013)
It shows better productivity only inhighly modified media coupled withartificial illumination, that makes thecultivation process costly (Becker,2007). Furthermore, It can captureonly 2.5% of solar energy (Becker,2007).
Cyclotellacryptica
√(Griffiths&Harrison,2009)
27(Griffiths&Harrison,2009)
24
(Griffiths&Harrison,2009)
Valuable candidate for biofuel withconsistent productivity (20 gm−2 d−1)in outdoor ponds (Traller &Hildebrand,2013).Higherconcentrationsofhydrocarbon(1 mg L-1) inhibit growth (Karydis &Fogg,1980).
Dunaliellaprimolecta
√(Demirbas& 12.9
(Thomaset 23(Demirbas& -

22
Demirbas,2011)
al.,1984) Demirbas,2011)
MicroalgaeCommercialimportance Biomassproductivity Lipidcontent
(%ofdryweight)
AdvantagesandLimitationsassociat-edwithcultivationFuel Feed High-value
product gm-2d-1 gL-1d-1
Emilianahuxleyi√
(d’Ippolitoetal.,2015)
0.23(Moheimani
&Borowitzka,
2011)
19-26(Moheimani&Borowitzka,
2011)
Difficult to maintain in semi-continuous mode and used to clampand stick to the reactor wall at re-duced pH (Moheimani & Borowitzka,2011).
Nannochlorisatomus
√(Brennanetal.,2012)
√(Reitanetal.,
1994)
15(Reitanetal.,
1994)
Phosphorus limitation decreases thelipidcontent(Reitanetal.,1994).
Nannochloropsisgaditana
√(Simionatoetal.,2011)
Suitable for outdoor cultivation invariable conditions (Simionato et al.,2011).
Tetraselmissub-cordiformis
√(Huangetal.,
2013)
29.77-35.85(Huangetal.,
2013)-
Thalassiosiraweissflogii
√(d’Ippolitoetal.,2015)
.012-.024
(d’Ippolitoetal.,2015)
23.48-38.8(d’Ippolitoetal.,2015)
Undernitrogenlimitedconditionlipidlevels significantly increased. Theeffectwaslesspronouncedincultureswhere siliconwas reduced to 20% ofthe standard supply (d’Ippolito et al.,2015).
Phaeodactylumsp.√
(Fajardoetal.,2007)
√(Brown,2002)
√(Kimetal.,2012a)
.07-1.4(Griffiths&Harrison,
2009;Halletal.,2003)
20-30(Demirbas&Demirbas,2011)
Biomass productivity of Phaeodacty-lum is limitedby low light availabilityduring winter (Fajardo et al., 2007)andalsoby irondeficiency (Hayward,1968).
Scenedesmusobliquus
√(Hoetal., 48
(Griffiths& 12-14(Demirbas&
ScenedesmusobliquushashigherCO2consumption ability and lipid produc-

23
2010) Harrison,2009)
Demirbas,2011)
tivity(Hoetal.,2010).
MicroalgaeCommercialimportance Biomassproductivity Lipidcontent
(%ofdryweight)
AdvantagesandLimitationsassociat-edwithcultivation Fuel Feed High-value
product gm-2d-1 gL-1d-1
Stichococcusbacil-laris
√(Olivierietal.,
2011)
~0.06(Olivierietal.,2011)
~25(Olivierietal.,
2011)
Stichococcus bacillaris is used to cap-ture CO2 from power, steel, and ce-ment plants and convert it intohighamountof lipids (Olivierietal.,2013;Sahooetal.,2012).
Marine(30-50ppt)
Amphoracoffeaeformis
√(FonSing,2010)
√
(Renaudetal.,1999)
30(FonSing,2010)
Suitable for long-term cultivation inopenpondbut it has a lower salinitytoleranceupto5%(FonSing,2010).
Chaetocerosmuelleri
√(Barrosetal.,
2014)
√(Borowitzka,
1997)
26(Griffiths&Harrison,2009)
26
(Griffiths&Harrison,2009)
Higheryieldoftotallipidwasreportedat relatively higher salinity (Barros etal., 2014) with lipid productivity 21.8mgL−1day−1(Rodolfietal.,2009).Shearstresshadanadverseeffectonthe viability of Chaetoceros muelleri(Michelsetal.,2010).
Chlorellavulgaris√
(Lvetal.,2010)
√(Maruyamaetal.,1997)
16(Griffiths&Harrison,2009)
20
(Griffiths&Harrison,2009)
Short doubling timewith higher lipidcontent(Griffiths&Harrison,2009).
Tetraselmissuecica√
(Rodolfietal.,2009)
√(Brown,2002)
19(Griffiths&Harrison,2009)
22
(Griffiths&Harrison,2009)
-
Pavlovalutheri√
(Eichenberger&Gribi,1997)
√(Borowitzka,
1997) 0.14(Rodolfi
etal.,2009)
35.5(Rodolfietal.,
2009)
The growth of Pavlova is easilyinhibited by bacterial contaminants(Munroetal.,1995).
Pavlovasalina √ √ √ 0.16 30.9 -

24
(Mataetal.,2010)
(Patiletal.,2007)
(Zhouetal.,2007)
(Mataetal.,2010)
(Mataetal.,2010)
MicroalgaeCommercialimportance Biomassproductivity Lipidcontent
(%ofdryweight)
AdvantagesandLimitationsassociat-edwithcultivation
Fuel Feed High-valueproduct gm-2d-1 gL-1d-1
Chrysotilacarterae
√(Moheimani&Borowitzka,
2006)
0.19(Moheimani
&Borowitzka,
2006)
33(Moheimani&Borowitzka,
2006)
Sensitive to early morning low tem-peratures. Sticking, clumping, andself-shading are other problems thatmakethemdifficulttocultivateunderoutdoor condition (Moheimani &Borowitzka, 2006). In addition, it ishighly sensitive to shear (Moheimani,2005).
Neochlorisoleoabundans
√(Giovanardiet
al.,2013)
0.4(Lietal.,2008)
7-40.3(Lietal.,2008)
Shows a low biomass productivity(Kloketal.,2013).
Dunaliellatertiolecta
√(Lakaniemietal.,2011;Tangetal.,2011)
√(Carballo-Cárdenasetal.,2003)
.031
(Chinnasamyetal.,2010)
36-42(Kishimotoetal.,1994;
Tsukahara&Sawayama,
2005)
Successfullygrowinwastewaterwithconsiderablebiomassproductivityandlipid content (Chinnasamy et al.,2010).
D.baradawill√
(Ben-Amotzetal.,1982a)
√
(Ben-Amotzetal.,1982a)
18
(Ben-Amotzetal.,1982a)
-
Chaetoceroscalcitrans
√(Rodolfietal.,
2009)
√(Borowitzka,
1997)
.04(Rodolfietal.,2009)
39.8(Rodolfietal.,
2009)
Usually forms resting spores at anincreased saline condition (40 ppt to45.5 ppt) and the spores are seen tobeeasily affectedbybacteria (Oku&Kamatani,1997).
Nannochloropsissp.
√(Gouveia&
√(Borowitzka,
√(Sukenik,
15(Griffiths& 21
(Griffiths&Nannochloropsis sp. is easy tocultivate, and its growth rate is rapid

25
Oliveira,2009) 1997) 1999) Harrison,2009)
Harrison,2009) (Gouveia & Oliveira, 2009;Huerlimannetal.,2010).
MicroalgaeCommercialimportance Biomassproductivity Lipidcontent
(%ofdryweight)
AdvantagesandLimitationsassociat-edwithcultivationFuel Feed High-value
product gm-2d-1 gL-1d-1
Nannochloropsissalina
√(Bartleyetal.,
2013) √(Hoffmann
etal.,2010)
25(Griffiths&Harrison,2009)
16
(Griffiths&Harrison,2009)
Highest growth rate and biomassproductivity achieved at low salinerange (between 22 and 34 PSU) andhighest lipid content at 34 PSU(Bartleyetal.,2013).
Tetraselmischuii √(Chinnasamyetal.,2010)
√(Monteroetal.,2011)
37(FonSingetal.,2014)
Fast growing green microalga withmore consistent and stable growth(Moheimani, 2013b). It is a suitablemicroalga for outdoor large-scalecultivation in recycled media andshowed good performance and highproductivity.Thisalgaisabletotoler-ateawiderangeofshearproducedbymixing(Moheimani,2013b).
Thalassiosirapseudonana
√(Mataetal.,
2010)
√(Brown,2002)
√(Mataetal.,
2010)
.08(Mataetal.,
2010)
20.6(Mataetal.,
2010)-
Halotolerant(60-130ppt)
Naviculasp.√
(Matsumotoetal.,2010)
√(Borowitzka,
1997)
√(Kangetal.,
2011)
Easy to control the growth of bothdiatoms.At higher silicate concentra-tionthesediatomsusuallyshowhigh-er growth and their growth can beinhibitedbyusinggermaniumdioxide(Lewin, 1966; Martin-Jézéquel et al.,2000).
Amphorasp.√
(Csavinaetal.,2011)
√
(Brown,2002)
39(Griffiths&Harrison,2009)
40
(Griffiths&Harrison,2009)
Tetraselmissp.(MUR233)
√(FonSinget 20
(FonSing,2010)Better growth in outdoor conditionwithhighlipidcontent(FonSingetal.,

26
al.,2014) 2014).
Asteromonasgracilis
√(Wegmannetal.,1980)
Grow over a wide range of salinity(Wegmannetal.,1980).
MicroalgaeCommercialimportance Biomassproductivity Lipidcontent
(%ofdryweight)
AdvantagesandLimitationsassociat-edwithcultivation Fuel Feed High-value
product gm-2d-1 gL-1d-1
Dunaliellaparva√
(Ben-Amotz,1975)
25
(Evansetal.,1982)
-
Halophilic(above150ppt)
Dunaliellasalina√
(Borowitzka&Brown,1974)
√(Borowitzka
&Borowitzka,
1988)
0.30(Griffiths&Harrison,2009)
35(Griffiths&
Harrison,2009)
Dunaliella salina is one of the bestsalinity and temperature tolerantmicroalgae(Borowitzka&Borowitzka,1988a;Ginzburg, 1988). It is the onlystrain that can sustain growth at thesalinity at 35 ppt to 350 ppt of NaCl(Chen et al., 2009) and temperaturefrom <0oC to >38oC (Borowitzka &Borowitzka, 1988a). It contains largeamount of β-carotene, lipid and glyc-erol (Borowitzka & Brown, 1974;Borowitzka&Borowitzka,1988).
27
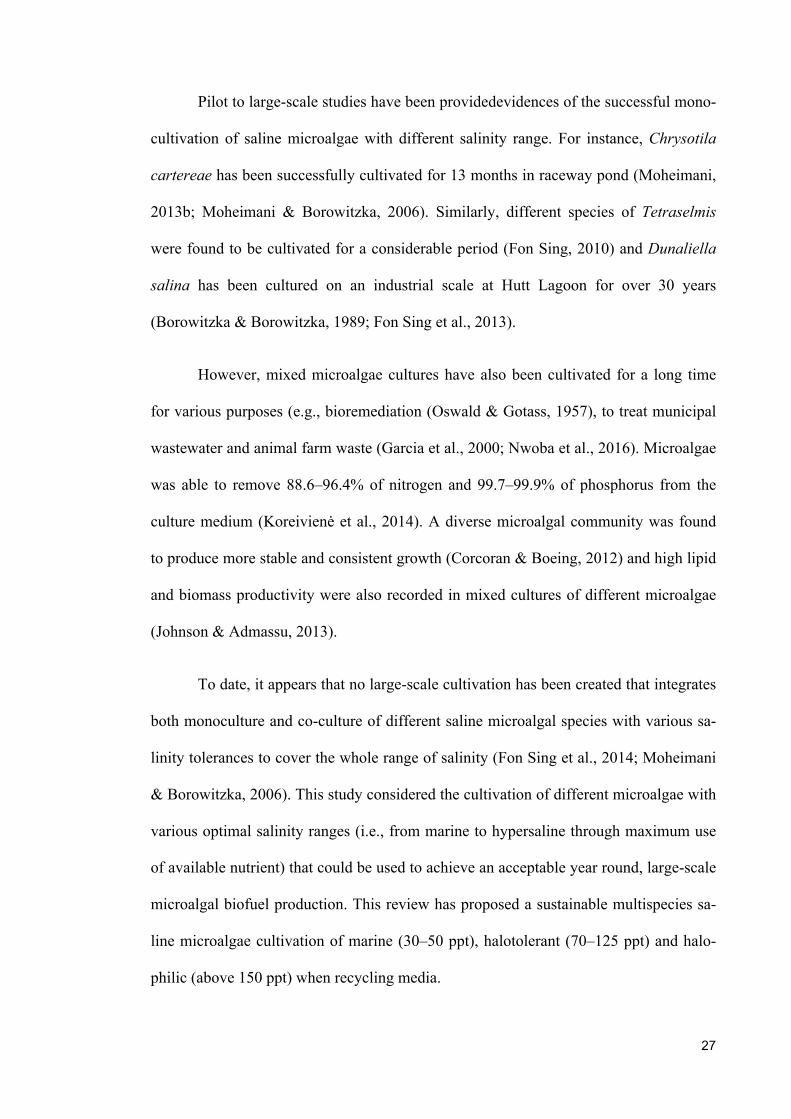
Pilot to large-scale studies have been providedevidences of the successful mono-
cultivation of saline microalgae with different salinity range. For instance, Chrysotila
cartereae has been successfully cultivated for 13 months in raceway pond (Moheimani,
2013b; Moheimani & Borowitzka, 2006). Similarly, different species of Tetraselmis
were found to be cultivated for a considerable period (Fon Sing, 2010) and Dunaliella
salina has been cultured on an industrial scale at Hutt Lagoon for over 30 years
(Borowitzka & Borowitzka, 1989; Fon Sing et al., 2013).
However, mixed microalgae cultures have also been cultivated for a long time
for various purposes (e.g., bioremediation (Oswald & Gotass, 1957), to treat municipal
wastewater and animal farm waste (Garcia et al., 2000; Nwoba et al., 2016). Microalgae
was able to remove 88.6–96.4% of nitrogen and 99.7–99.9% of phosphorus from the
culture medium (Koreivienė et al., 2014). A diverse microalgal community was found
to produce more stable and consistent growth (Corcoran & Boeing, 2012) and high lipid
and biomass productivity were also recorded in mixed cultures of different microalgae
(Johnson & Admassu, 2013).
To date, it appears that no large-scale cultivation has been created that integrates
both monoculture and co-culture of different saline microalgal species with various sa-
linity tolerances to cover the whole range of salinity (Fon Sing et al., 2014; Moheimani
& Borowitzka, 2006). This study considered the cultivation of different microalgae with
various optimal salinity ranges (i.e., from marine to hypersaline through maximum use
of available nutrient) that could be used to achieve an acceptable year round, large-scale
microalgal biofuel production. This review has proposed a sustainable multispecies sa-
line microalgae cultivation of marine (30–50 ppt), halotolerant (70–125 ppt) and halo-
philic (above 150 ppt) when recycling media.

28
To be significant in the fuel market and compete with other existing fuels, large-
scale commercial productions of microalgal biofuel is needed (Borowitzka &
Moheimani, 2013b). It is highly unlikely that microalgal biofuel will be able to meet all
the demands for chemical energy; however, microalgal biofuel could provide one poten-
tial energy source and could be used to replace a portion of transport energy needs. With
this in mind, estimates are proposed through this review which would determine the
number of open ponds required for the production of 100,000 BBL of oil year-1 from a
single production plant using a full spectrum of seawater up to saturation state.
1.6 Co-cultivation for comprehensive use of nutrients
To produce sustainable microalgal biomass for biofuel production, microalgae
have been found co-cultured with different microorganisms (i.e., microalgae/bacteria,
microalgae/fungus, microalgae/blue-green algae, microalgae/microalgae) that ensure
stable growth, improve biomass and lipid productivity, efficient removal of nutrients
and the ease of harvest (Keshtacher-Liebso et al., 1995; Novoveská et al., 2016;
Sanders, 2001). In a co-cultivation system, if the relationship between two microorgan-
isms is synergistic; thus, the overall biomass productivity of a culture can improve
(Angell et al., 2006; Bode, 2006). In addition, significant increases in total lipid content
and changes in lipid composition have also been observed (Cai et al., 2007; Yen et al.,
2015). To mimic this positive, interactive relationship, a co-cultivation process between
different saline microalgae has been proposed to ensure the best use of available nutri-
ents. Since the main aim of the proposed review was to lower the biofuel production
cost by ensuring effective use of nutrients, it was expected that the collaboration
between two different salinity tolerant microalgae (both lower and higher saline strains)
could withstand a gradual increase in salinity and thus would confer the proper use of
nutrients in recycled media.

29
1.6.1 Cultivation strategy
A potential strategy for co-culturing saline microalgae is summarized in Figure
1.5. Under the proposed strategy, cultivation would start at a seawater salinity level (i.e.,
35 ppt) and continue to a salt saturation level (i.e., 300 ppt). Consequently, rather than
discarding growth media with increased salinity, the microalgal species would change
based on their salinity tolerance levels. The cultivation process should begin with ma-
rine species and change to halotolerant and halotolerant to halophilic microalgae with
respect to salinity.
Under this co-cultivation technique, the marine microalgae (that usually grow in a salin-
ity range of 35–50 ppt) would be co-cultivated with halotolerant microalgae (in a 70–
125 ppt salinity tolerance range). These two strains would be cultivated between ranges
beyond the optimum ranges of both species (i.e., 50–70 ppt). Additionally, the halotol-
erant species was co-cultivated with halophilic microalgae (salinity range > 150 ppt).
These two different strains would be cultured within a range of 125-150 ppt.

30
Figure1.5Co-cultivationofmarine,halotolerantandhalophilicmicroalgaeusingwholesalin-ityspectrafromseawater(35ppt)tosaltsaturationstate(300ppt).
During co-cultivation, highest productivity can be achieved by maintaining the
culture under a semi-continuous mode. The semi-continuous cultivation system should
maintain a constant volume of inoculums and thus ensure steady and continuous pro-
duction. This consistency would be maintained via the removal of a constant volume of
cultures at regular intervals of time, which, in turn, should reduce the chance of contam-
ination (Reichert et al., 2006).
The cultivation should be implemented at a higher number of ponds and main-
tained at up to 200 ppt of salinity. Above 200 ppt, the pond number should decrease
gradually with the increase of salt concentration in the media (as the productivity of

31
halophilic microalgae should drop with the increase of salinity beyond their optimum
tolerance levels) (Ben-Amotz et al., 1982b).
1.6.2 Modeling for the proposed cultivation
Mathematical modeling is used to anticipate the process under investigation by
providing the required observation. To build a sustainable microalgae cultivation sys-
tem, a proper combination of a cultivation technique and a large-scale production sys-
tem is necessary. It is highly unlikely that microalgal biofuel will be able to meet all the
demands for chemical energy; however, microalgal biofuel could provide one potential
energy source and could be used to replace a portion of transport energy needs. With
this in mind, estimates are proposed through this review which would determine the
number of open ponds required for the production of 100,000 BBL (barrel) of oil year-1
from a single production plant using a full spectrum of seawater up to saturation state.
However, irrespective of the species used, a process will only be successful if the instal-
lation and maintenance costs are lower than the production costs. Considering all these
issues, for converting the microalgae biomass to biofuel economically, open pond culti-
vation system was proposed to ensure the production of 100,000 BBL of oil year-1.
Under the present design, cultivation will rely only on seawater. The salinity of
the pond media will be increased gradually due to evaporation and only stock seawater,
and recycled growth media will be used for pond fill and evaporative top up. It has been
considered that, it would take three days to recycle the pond water. Therefore, the salini-
ty of the recycled pond water will also be increased. To maintain a considerable
required productivity, the species should be changed (based on their optimal growth
salinity range) as salinity increases.

32
Thus, everyday 50% of the total culture volume will be harvested and the ponds
refilled with 40% recycled media and 10% stock seawater. The following equation
(Equation 1) will be used to calculate any changes in pond salinity:
Salinity change (pond) = 2P
+ 10S
+ 2.5R
1
1
Where, P = Prevailing salinity of the particular pond media, S = salinity of the
stock seawater, R = salinity of the recycled media.
Notably, equation 1 (the change of pond salinity) is entirely based on the salinity
change that occurs as a result of the addition of stock seawater and recycling of the me-
dia.
The following equation (Equation 2) expresses the salinity change that occurs in
response to the introduction of new microalgae in the system:
Salinity change (pond) = 4P
+ 4N
+ 10S
+ 2.5R
2
Where, P = prevailing salinity of the particular pond media, N = salinity of the
newly introduced culture media, S = salinity of the stock seawater, R = salinity of the
recycled media.
Equation 3 assumes that after harvesting 50% of the culture, 25% of the old cul-
ture would have been removed from the pond and the remaining 25% of the old culture
will be cultivated with 25% of the new culture. The remainder of the pond will then be
filled with 10% of stock sea water and 40% of recycled media.

33
Using the proposed model it would be possible to calculate the number of ponds
required to produce 100,000 BBL (Barrel) of oil in year-1 at three different places in
WA (Table1.5). The mathematical expression used to calculate the amount of oil is as
follows (Equation 3):
Algal oil production (BBL) = 159) x 1000 x (0.86410000) x D x Oc x Bp x (P
3
Where, P = number of ponds, Bp = biomass productivity, Oc = oil content and D
= day required for cultivation. The total production area and biomass productivity are
calculated in hectares and ton ha -1 d -1, respectively. The oil content and density is con-
sidered to be 30% and 0.864 kg L-1, respectively (Borowitzka & Moheimani, 2013b;
Brennan & Owende, 2010). To convert square meters into hectares, the values have
been multiplied by 10,000 and to convert milliliters to liters and liters to barrels the val-
ues have been divided by 1,000 and 159, respectively.
The production of 100,000 BBL of oil year-1 by using open ponds has been
proposed by Borowitzka and Moheimani in 2013, which is the foundation of the pro-
posed design (Borowitzka & Moheimani, 2013b). However, in their review, the com-
plete salinity spectrum was not considered; rather, the same productivity was
maintained throughout the year. Additionally, for the annual average productivities of
20 g m-2 d-1 and 30 g m-2 d-1, required pond areas were calculated 653 ha and 436 ha,
respectively.
The proposed design improves the earlier concept of Borowitzka and Mohei-
mani by considering the whole salinity range (i.e., low salinity to saturation state). It
also recognizes that a greater number of ponds should be maintained at the lower salini-
ty concentration and the pond number will have to be reduced gradually (Figure 1.6), as

34
productivity will decrease at higher salinity levels (Ben-Amotz et al., 1982b). Five dif-
ferent productivities 30, 25, 20, 15 and 10 g m-2 d-1 were considered for the respective
salinity ranges of 35–50, 50–70, 70–230, 230–250 and beyond 250 ppt. Compared to
Borowitzka and Moheimani’s calculations, these considerations will increase the pond
number by 10–40%. Further, the co-cultivation through nutrient recycling was also
taken into account.
Figure1.6Thegradualdecreaseinpondnumberwiththeeventualincreaseofsalinityfrom35pptto300pptduetoevaporationandmediarecycling.

35
Table1.5Cultivationofsalinemicroalgaeatanincreasedsalinity(35ppt-300ppt)inthreelocationsinWesternAustralia.
Karratha Geraldton Perth
Day
No.ofponds Salinity
(ppt)
TypeofMicroalgaecultured
Day
No.ofponds Salinity
(ppt)
TypeofMicroalgaecultured
Day
No.ofponds Salinity
(ppt)
TypeofMicroalgaecultured(1 pond =
1ha)(1 pond =1ha)
(1 pond =1ha)
1 800 35 M 1 700 35 M 1 750 35 M20 800 50 M+H 28 700 50 M+H 48 750 50 M+H47 800 70 H 67 700 70 H 114 750 70 H73 800 125 H+HL 107 700 125 H+HL 174 750 125 H+HL161 800 150 HL 227 700 150 HL 381 750 150 HL197 800 200 HL 277 700 200 HL 441 750 200 HL276 693 230 HL 387 650 230 HL 607 730 230 HL305 250 250 HL 427 600 250 HL 714 587 250 HL343 100 280 HL 467 500 270 HL 781 250 270 HL376 10 300 HL 507 100 290 HL 847 100 290 HL 527 10 300 HL 881 10 300 HL*M=Marinemicroalgae,H=Halotolerantmicroalgae,HL=Halophilicmicroalgae

36
1.6.3 Nutrient recycling integrated with co-cultivation
The use of recycled growth media in microalgal cultivation to improve the eco-
nomic sustainability has not yet been implemented commercially. Lowry et al. (2016)
found that after the modest initial growth of Chlorella protothecoides, 65–91% of cop-
per, magnesium, nitrogen, iron, manganese, sulfur and over 95 % of the other nutrients
remained in the growth media (Lowrey et al., 2016). It has also been found that after
hydrothermal liquefaction (HTL) the aqueous phase comprised 40–70% nitrogen and
phosphorous and a high portion of iron, calcium, magnesium, potassium; however,
other minerals and polar organics as dissolved nutrient (Levine et al., 2013; Ross et al.,
2010). It should be noted that successful laboratory experiments have revealed that a
suitable recycling technique could save a considerable amount of nutrient and thereby
reduce the production cost of the total process (Hadj-Romdhane et al., 2012; Lowrey et
al., 2016; Xinyi et al., 2016). The recycled medium has already been effectively execut-
ed as a secondary culture media during cultivation of Scenedesmus acutus, Chlorella
vulgaris and Nannochloropsis gaditana (Biller et al., 2012; Du et al., 2012; González-
López et al., 2013; Xinyi et al., 2016). Evidence has also been found of long-term mi-
croalgae cultivation in recycled media in photobioreactor (for eight weeks) and open
raceway pond (for 5 months) without any significant loss in biomass productivity (Fon
Sing et al., 2014; Hadj-Romdhane et al., 2012). This review highlighted the amount of
nutrient waste during monocultivation process with nutrient recycling and showed how
adopting a co-cultivation process reduces the waste of nutrients.
The amount of nutrient waste was calculated for the three locations in Western
Australia (WA) and also compared with the nutrient loss found in co-cultivation with
mono-cultivation systems (Table 1.6). Irrespective of location, the overall waste of nu-
trients during the cultivation of saline microalgae (across different salinity tolerance

37
ranges) should be as follows: marine > halotolerant > halophilic microalgae cultivation
(Table 1.6). During cultivation of marine microalga, the consumption of nutrients would
be lower (~4%), and the waste of nutrients would be higher (~96%) than that of the co-
cultivation process. Conversely, halotolerant and halophilic microalgae cultivation
would loss less nutrients and use more nutrients than marine microalgae. However, de-
pending on the climatic condition of the three different locations in WA, the loss of nu-
trients during co-cultivation has been found to be significantly low (Table 1.6).

38
Table1.6Totalfertilizerwasteduringindividualspeciescultivationandco-cultivationfrom35pptto300pptofsalinityinthreedifferentlocationsinWesternAustralia.NotethatKarrathaandGeraldtonarepreviouslyidentifiedaspotentialplacesformassalgalcultivationbyBoruffetal.(Boruffetal.,2015).
PlacesKarratha Geraldton Perth
(20°42'43"South,116°46'23"East) (28°46'0"South,114°36'0"East) (31o57'0"Southand115o52'0"East)Microalgae *M *HLT *HLP *CC *M *HLT *HLP *CC *M *HLT *HLP *CCWasteofN(kgha-1) 1701.9 399.8 336.9 64 728.7 153.3 45.6 32 562.3 231.1 143.9 6WasteofN(%)comparetoCo-cultivation** 96.2 83.9 81 95.6 79.1 29.8 98.9 97.4 95.8 WasteofP(kgha-1) 98.9 11.9 5.2 4.5 58.6 14.3 8.8 7.8 140.6 9.6 8.8 2.3WasteofP(%)comparetoCo-cultivation** 95.5 62.2 13.8 86.8 46.1 11.5 98.4 76.6 74.4 *M=Marine,HLT=Halotolerant,HLP=Halophilicmicroalgaemonoculture,CC=Co-culture**Wasteofnutrients(N/P)(%)comparetoCo-cultivation= !"#$%'()*$+,%-$,-.'/.*0$*+%
!"#$%'(),-1"+,-%,,3"0'$'0%+"-$,3"0'43,0,.1,.+'"05"%1'-'.*0$*+% ×100%

39
1.6.4 Comprehensive evaluation of biofuel production from microalgae
Renewable energy production offer advantages such as less pollution and less
dependency on fossil fuels (Liu, 2014). Algal biofuel is attractive because of their fast
growth, higher biomass productivity and higher lipid content (e.g., up to 75% on the dry
weight basis) than other biofuel feed stock (e.g., conventional forestry, agricultural
crops, and other aquatic plants) (Mata et al., 2010). Extensive studies have been per-
formed for the last 50 years to produce cost-effective microalgal biofuel (Mata et al.,
2010). However, there is yet to be any large-scale biofuel production facility; and con-
siderable research and development are still required to produce sustainable biofuel
from microalgae. The main issues resulting in high cost of algal biofuel production are
as below (Borowitzka & Moheimani, 2013b; Fon Sing et al., 2013):
1) Requiring large amount of fertilizers (see section 1)
2) Low photosynthetic efficiency (2%) resulting in maximum 20 g m-2 d-1 biomass
productivity
3) Crop protection due to high contamination issues
4) High Capex
5) Very high energy intensive dewatering, extraction and conversion process
To achieve sustainable production of microalgal biofuel research and develop-
ment must focus on:
1) Combine wastewater treatment and algal production to meet the fertilizers re-
quirement (Ji et al., 2013)
2) Maximum water recycling to utilize the left over nutrients in post-harvest media
(Borowitzka & Moheimani, 2013b)
3) Developing cultivation process relying solely on the use of seawater (proposed
in this review). Such a process will be more sustainable as fresh water use will

40
be minimized and nutrients can be recycled (see section 5). Gradual increase in
salinity will also reduce the contamination issue (Borowitzka & Moheimani,
2013b)
4) Making sure to use CO2 from industrial flue gas (Li et al., 2012; Moheimani,
2016; Rezvani et al., 2016)
5) Reduce the overall Capex and Opex (Rodolfi et al., 2009)
6) Use energy efficient harvesting technique (Vandamme et al., 2013)
7) Cultivation of microalgae as biofilm to reduce fresh water consumption and the
cost of harvesting (Moheimani et al., 2014; Wijihastuti et al., 2017)
8) Integration of photovoltaic filter for the efficient transmission of light for the
cultivation of microalgae and generation of electricity (Moheimani & Parlevliet,
2013; Vadiveloo et al., 2015)
9) Develop the processes to extract the oil from microalgae more efficiently by us-
ing less energy (e.g. milking) (Chaudry et al., 2015)
10) Introducing a biorefinery approaches to produce co-product such as high value
products (e.g. pigments PUFA) (González-Delgado & Kafarov, 2011)
All these techniques will need to be integratedin order to produce potential cost-
effective biofuel from microalgae. However, cost is not the only aspect of sustainability
(Liu, 2014). There are other two important criteria of sustainability a) environmental
protection and b) social development (Liu, 2014). The sustainability of any renewable
energy systems should consider the extended spectrum of social development, environ-
mental and economic aspects (Liu, 2014). The evolution of the sustainability in renewa-
ble energy systems is very complicated and to develop such system, the sustainability
indicator concept, basic and general indicators, assessment criteria and scales need to be
reviewed very carefully (Liu, 2014). Considering all these aspects, Liu found that CO2

41
emission was the most accepted sustainability indicator for environmental aspects (Liu,
2014). Overall cost of production is the best indicator for economic growth and availa-
bility of jobs for resident (Liu, 2014). Biofuel price is by far the most widely used social
indicator to develop sustainability in renewable energy system (Liu, 2014).
As the algae industry is still developing, the addition of new cultivation strate-
gies is very common. However, to be feasible, these strategies must be dynamic in
terms of their economic and environmental sustainability. There has been limited re-
search on the downsizing of nutrients and, to date, no research has considered using
novel co-cultivation schemes to diminish the waste of nutrients and thus production
costs. Though the possibility of initial capital investment is high, once the plan is
established it could reduce the biofuel production cost by saving our natural assets.
1.7 Commercially Available High-Value Products from microalgae
Microalgae are well known for their nutraceutical values. Recent scientific re-
searches confirm the numerous health benefits of functional foods from microalgae. For
example, omega-3 polyunsaturated fatty acids (PUFAs) (such as eicosapentaenoic acid
(EPA) and docosahexaenoic acid (DHA)) (Lee, 1997) are known to reduce blood pres-
sure and lower the risk of abnormal heartbeat and blockage of blood vessels by choles-
terol (Miyashita et al., 2011). Several microalgal pigments, e.g., lutein, astaxanthin,
phycobilins, zeaxanthin, β-carotene, and fucoxanthin have gained public attention be-
cause of their application in cosmaceuticals, nutraceuticals and as functional foods
(Borowitzka, 2013) (Table 1.7). Of them, lutein, astaxanthin, phycobilins, zeaxanthin
and β-carotene have been cultivated commercially for many years. At present, lutein,
astaxanthin, phycobilins, zeaxanthin, and β-carotene are commercially produced from
three different species, e.g., Muriellopsis sp., Haematococcus pluvialis, Spirulina sp.,

42
and Dunaliella salina (Borowitzka, 2013; Kim et al., 2012a). Fucoxanthin is the most
recently identified pigment,and because of its nutraceutical values, e.g., bioactive
properties against cancer, obesity, inflammation, and diabetics (Miyashita et al., 2011),
researchers have paid much attention to screening of high fucoxanthin producing
microalgal strains that can be commercialized eventually (see details in 1.8 section).

43
Table1.7Commerciallyusedmicroalgaeforhigh-valueproductsandtheircommercialproducers
High-ValueProducts
Commerciallyusedspecies Application CommercialProducers References
PUFAs(PolyUnsatu-ratedFattyAcids)
EPA(Eicosapentaenoicacid)
NannochloropsisCrypthecodinium,
Schizochytrium,UlkeniaNitzschiaalbaPhaeodactylumtricornutum,
Monodussubterraneus
NutritionalsupplementHelpfulinreducingTriglycerides
AuroraAlgaePronovaBiopharma
NikkenSohonshaCorporationMartekBiosciencesofColumbia,
USAOmegaTechofBoulder,Colora-
do,USABlueBiotech(Germany)
InnovaIG(France)XiamenHuisonBiotechCo.(Chi-
na)
(Borowitzka,2013;Lee,1997)
(Enzingetal.,2014)
DHA(Docosahexaenoicacid)
CrypthecodiniumcohniiSchizochytriumIsochrysissp.Ulkeniasp.
Nutritionalsupplement(mainlyinfantformula)HelpfulinreducingTriglycerides
PronovaBiopharmaNikkenSohonshaCorporation
MartekBiosciencesofColumbia,USA
OmegaTechofBoulder,Colora-do,USA
BlueBiotech(Germany)InnovaIG(France)
XiamenHuisonBiotechCo.(Chi-na)
(Lee,1997)(Enzingetal.,2014)
Lutein Muriellopsissp.Scenedesmussp.
AntioxidantFeedadditives
Delaydevelopmentofcataractsandmaculardegenerationandprogressionofearlyathero-
sclerosis
(DelCampoetal.,2007)
Astaxanthin Hematococcuspluvialis
AntioxidantFeedadditives
ActivityagainstcoloncancercelllinesHelpfulintreatingAlzheimer'sandParkinson's
CyanotechinHawaii,USABioRealinSweden
AlgatechnologiesinIsraelMeraPharmaceuticalsinHawaii,
(Lee,1997)(DelCampoetal.,
2007)(Guedesetal.,2011)

44
diseases,maculardegenerationandofferprotec-tionagainstcancer,spinalcordinjuries,andother
typesofcentralnervoussysteminjuries
USAFujiHealthScienceinHawaii,
USABlueBiotech(Germany)
(Dufosséetal.,2005)(Enzingetal.,2014)
ZeaxanthinDunaliellasalina/
D.bardawilChlorellaellipsoidea
AntioxidantFeedadditivePigmenter
(Borowitzka,2013;Kimetal.,2012a)
β-carotene Dunaliellasalina/D.bardawil
Antioxidant,Feedadditive
PigmenterinfoodproductsAdditivetocosmeticsandmultivitamin
preparationVitaminsupplementsandhealthfoodproductsPro-vitaminA(retinol)infoodandanimalfeedReducetheincidenceofseveraltypesofcancer
anddegenerativediseases
KoorFoods(NatureBetaTech-nology)inIsrael
WesternBiotechnologyLtd.inAustralia
BetateneLtd.inAustraliaCognisAustralia/BASF(Austral-
ia/DE)NaturalBetaTechnologies
(Australia)NutraliteintheUSA.
smallproductionplantsintheCzechRepublic,Germany,andSpain,Chile,Mexico,Cuba,IranUnisynandNeutriliteinCalifor-
nia,USAJapan,USA,KoreaandEuropeAquaCaroteneinAustralia
CyanotechinHawaiiInnerMongoliaBiologicalEngin
ChinaTianjinLantaiBiotechnologyin
ChinaParryAgroIndustriesinIndia
NikkenSohonsa(Japan)ProAlgen(India)Biotech
ShaanxiScipharBiotechnology
(Lee,1997)(DelCampoetal.,
2007)(Enzingetal.,2014)

45
Co.
Fucoxanthin Laminariajaponica Antioxidant (Kimetal.,2012b)
Phycobilins
Phycoerythrin(Red)
Porphyridiumaerugineum
PorphyridiumcruentumRhodellaandGaldieria
Pigmenter(foodandcosmeticcolours)Antioxidantsincosmetics,
Acomponentoffunctionalfoods,Photosensitisersinphotodynamictherapyfor
treatmentofcancers
(Borowitzka,2013;Dufosséetal.,2005)
Phycocyanin(Blue) Spirulina(Arthrospira)
DICCorp.,JapanBlueBiotech(Germany)
SandaKing(Japan)InnerMongoliaBiomedical
Eng.(Mongolia)
(Borowitzka,2013)(Enzingetal.,2014)

46
1.7.1.1 Fucoxanthin
Fucoxanthin, a major carotenoid present in the chloroplasts of brown algae, con-
tributes to more than 10% of the estimated total production of carotenoids in nature
(Miyashita et al., 2011). This pigment is bound to several proteins and chlorophyll (Chl)
a to form fucoxanthin-Chl protein complexes in the thylakoids, where it acts as a prima-
ry carotenoid to harvest light and transfer energy. This pigment-protein complex has
been widely investigated for its role in photosynthesis in microalgae (Kim et al., 2012a).
To date, fucoxanthin has been studied extensively as an important dietary nutrient with
antioxidant potential (Miyashita et al., 2011). Several reports confirmed the metabolism,
safety, and bioactivities of fucoxanthin (Miyashita et al., 2011; Peng et al., 2011). Fuco-
xanthin effectively inhibits intracellular singlet oxygen formation, DNA damage, and
apoptosis (Heo et al., 2008). It is also reported that fucoxanthin intake can reduce a) the
viability and proliferation of human colon cancer cell lines (Das et al., 2005; Hosokawa
et al., 2004), b) the viability of three prostate cancer cell lines (Kotake-Nara et al., 2001)
and c) the growth of human hepatocellular carcinoma (Yoshiko & Hoyoku, 2007). In
addition, fucoxanthin shows significant antiangiogenic effect against obesity (Sugawara
et al., 2006). The anti-obesity affect includes oxidation of fatty acids, heat production
and energy dissipation in the white adipose tissue (Maeda et al., 2007a). Fucoxanthin
can also decrease the blood glucose and plasma insulin levels significantly (Maeda et
al., 2007b). Fucoxanthin protects skin against photo-damage induced by exposure to
ultraviolet B radiation by reducing intracellular singlet oxygen (Heo et al., 2008). Fur-
ther, fucoxanthin shows activities against cerebrovascular diseases (Ikeda et al., 2003).
It also acts as an efficient and safe anti-proliferative agent for human lens epithelial cell
line. It can be used to the formulation of ocular implant products used in cataract treat-
ment for the prevention of after-cataract (Moreau et al., 2006).

47
1.7.1.2 Fucoxanthin in Macroalgae and Microalgae
Fucoxanthin is the most abundant carotenoids in brown macro- and microalgae.
However, most commercial sources of this pigment are macroalgae (Kim et al., 2012a).
Four macroalgae have been widely studied as fucoxanthin source, e.g., Eisenia bicyclis,
Laminaria japonica, Undaria pinnatifida and Sargassum horneri, particularly the wast-
ed parts of L. japonica (Kim et al., 2012a). Although microalgae are also rich in fuco-
xanthin, till date only macroalgae are used as a commercial source of this pigment. The
only reason that complemented macroalgae over microalgae is the biomass harvesting
process, which is less complicated in macroalgae than in microalgae (Kim et al.,
2012b). Fucoxanthin contents in different macro- and microalgae are summarized in
Table 1.8. In general, macroalgae contain less fucoxanthin than microalgae (Kim et al.,
2012a). For example, Phaedactylum tricornutum (microalgae) was reported to contain
16.33 mg g-1 (dry weight) of fucoxanthin, whereas Eisenia bicyclis (macroalgae) con-
tained approximately 1.3 mg g-1 (dry sample) of fucoxanthin. Therefore, fucoxanthin
content of dry E. bicyclis was approximately 12.5 times lower than that of P.
tricornutum (Kim et al., 2012a). Although microalgae possess higher amounts of fuco-
xanthin than those in macroalgae, no studies have reported on the commercial produc-
tion of fucoxanthin derived from microalgae. Therefore, more microalgae need to be
screened as a potential commercial source of fucoxanthin.

48
Table1.8Fucoxanthincontentinmacroalgaeandmicroalgae
Macroalgae
Nameofspecies AmountofFucoxanthin(mgg-1ofdryweight) Samplecondition References
Alariacrassifolia 1.1±0.4 Dried (Terasakietal.,2009)Analipusjaponicus 1.4±1.0 Dried (Terasakietal.,2009)Cystoseirahakodatensis 2.4±0.9 Dried (Terasakietal.,2009)Desmarestiaviridis 0.1±0.1 Dried (Terasakietal.,2009)Eiseniabicyclis 0.26 Fresh (Kimetal.,2012a)Eiseniabicyclis 0.08 Fresh (Kimetal.,2012a)Fucusdistichus 0.16 Fresh (Kimetal.,2012a)Fucusdistichus 0.9±0.3 Dried (Terasakietal.,2009)Hizikiafusiformis 0.02 Fresh (Kimetal.,2012a)Laminariajaponica 0.12 Fresh (Kimetal.,2012a)Laminariajaponica 0.19 Fresh (Kimetal.,2012a)Laminariareligiosa 0.24 Fresh (Kimetal.,2012a)Laminariasaccharina 0.24 Fresh (Kimetal.,2012a)Leathesiadifformis 0.3±0.1 Dried (Terasakietal.,2009)Melanosiphonintestinalis 1.9±0.9 Dried (Terasakietal.,2009)Petaloniabinghamiae 0.43–0.58 Fresh (Kimetal.,2012a)Sargassumconfusum 1.6±0.8 Dried (Terasakietal.,2009)Sargassumfusiforme 1.1±0.6 Dried (Terasakietal.,2009)Sargassumfulvellum 0.06 Fresh (Kimetal.,2012a)Sargassumhorneri 3.7±1.6 Dried (Terasakietal.,2009)Sargassummuricum 0.29 Fresh (Kimetal.,2012a)Sargassumthunbergii 1.8±1.0 Dried (Terasakietal.,2009)Saccharinasculpera 0.7±0.4 Dried (Terasakietal.,2009)Scytosiphonlomentaria 0.24–0.56 Fresh (Kimetal.,2012a)Scytosiphonlomentaria 0.5±0.1 Dried (Terasakietal.,2009)Silvetiababingtonii 0.7±0.2 Dried (Terasakietal.,2009)Sphaerotrichiadivaricata 0.2±0.1 Dried (Terasakietal.,2009)Undariapinnatifida 0.32 Fresh (Kimetal.,2012a)Undariapinnatifida 0.87 Dried (Kimetal.,2012a)Undariapinnatifida 0.11 Fresh (Kimetal.,2012a) Microalgae Chaetocerosgracilis 2.24±0.01 Dried (Kimetal.,2012b)Cylindrothecaclosterium 5.23 Dried (Pasquetetal.,2011a)Isochrysisgalbana 6.04±0.28 Dried (Kimetal.,2012b)Isochrysisaff.galbana 18.23±0.54 Dried (Kimetal.,2012b)Nitzschiasp. 4.92±0.11 Dried (Kimetal.,2012b)Phaeodactylumtricornutum 8.55±1.89 Dried (Kimetal.,2012b)Phaeodactylumtricornutum 15.33 Dried (Kimetal.,2012a)Phaeodactylumtricornutum 1.81 Dried (Kimetal.,2012a)Odontellaaurita 18.47 Dried (Xiaetal.,2013)
1.7.1.3 Fucoxanthin production and biorefinery concept
While production of fucoxanthin is a worthy goal, the pigment comprises only
0.1 to 2% of the total biomass of saline microalgae (Kim et al., 2012a; Kim et al.,

49
2012b). Therefore, it would be logical to use the remaining biomass to produce com-
modity products such as biofuel (bio-oil, bio-diesel, bioethanol, biomethane) or animal
and aquaculture feed. This is consistent with current literature on the economics of mi-
croalgal products which shows that production of a single product from microalgal bi-
omass is generally not sustainable as the production cost is too high (Nobre et al., 2013;
Vanthoor-Koopmans et al., 2013). However, integration of co-product or processing
through biorefinery concept can reduce the production cost by making the best use of
available biomass. If cultured in a biorefinery context it should be possible to extract
different products (high-value products like β carotene, fucoxanthin, EPA, and DHA)
from the same biomass in linear production chains (Figure 1.7) (González-Delgado &
Kafarov, 2011). After extraction of commercially attractive biomolecules, the resultant
biomass can be anaerobically digested. The main advantages of anaerobic digestion are
biomethane production and ability to recycle the nutrients (Borowitzka & Moheimani,
2013b). Further, microalgae are known to accumulate up to 60–65% of (dry weight) of
both lipids and carbohydrates when cultivated under stressful conditions (very high or
low: temperature, salinity, light intensity; and nutrient starvation/limitation) (Ho et al.,
2012; Rodolfi et al., 2009). Fon Sing (2010) reported that Amphora coffeneformis con-
tained up to 60% organic weight as lipids under saline stress. The transesterification
process can be used to convert algal lipid to renewable, biodegradable and non-toxic
biodiesel (Miao & Wu, 2006). Bioethanol yield from brown microalgae is found higher
in comparison to other microalgae species (Moen, 2008). Therefore, simultaneous pro-
duction of fucoxanthin and biofuel from microalgal biomass might allow the whole
production process to be economically feasible.

50
Biomass
Aquaculturefeed
HighValueProduct Pigment(β carotene)
PUFA(EPA,DHA)
Bio-oil
BioethanolBiobutanolLacticacid
Effluent
Bio-methane
Transesterification
fermentation
Anaerobicdigestion
Microalgaecultivation
Sunlight
CO2
Media
Harvest
Recycledmedia
1)withorwithoutsolvent2)SupercriticalliquidextractionwithCO2
Extraction
1)Usingedibleoilwithorwithoutsolvent2)LiquidorsupercriticalCO2extraction3)Crystallization
1)Microwaveassisted
2)SupercriticalCO23)Pressurizedliquid4)Enzymeassisted
Pigment(Fucoxanthin)
Residualbiomass
Residualbiomass
Residualbiomass
Residualbiomass
Biodiesel
Residualbiomass
Fertilizer
HydrothermalLiquefaction
Residualbiomass
Electricity
Figure1.7Theproductionofhigh-valueproductintegratedwithotherbiorefinerytechnologyinalinearproductionchaintogetmoreproductsfromsamebi-omass

51
1.8 Research Objectives
As highlighted earlier, if seawater is used for filling up the ponds and as atop up
to replace evaporation, the culture salinity will rise. The overarching aim of this Ph.D.
was to test the suitability of microalgal cultivation under gradual salinity rise between
seawater salinity level (35 ppt NaCl) and hypersaline (233 ppt NaCl) condition. To
cover the whole spectrum of salinity from seawater salinity level up to salt saturation,
microalgae with three different salinity ranges namely marine, halotolerant and halo-
philic microalgae were cultivated under increased salinity. In addition, the effect of sa-
linity on biomass, lipid and fucoxanthin productivity was also monitored. To the best
my knowledge, this is the first study which is aimed to produce high biomass of marine,
halotolerant and halophilic microalgae continuously using monoculture, monoculture
integrated with stepwise culture or co-culture.
To accomplish main research objective, following sub-aims were studied:
1) Effect of gradual salinity increase on the growth and biochemical content of
marine, halotolerant and halophilic microalgae (Chapter 3).
2) Effect of incremental increase in salinity on fucoxanthin production of
brown marine and halotolerant microalgae (Chapter 4).
3) Effect of increased salinity on co-cultivation and stepwise cultivation of ma-
rine and halotolerant and; halotolerant and halophilic microalgae (Chapter 5
and 6).
4) Preliminary economic analyses of saline microalgae biomass production for
both biofuel and fucoxanthin production (Chapter 7).
Further, I summarized the general materials and methods in Chapter 2.

52
Chapter 2
General Materials and Methods
2.1 Sources of microalgae species
Nine microalgae were selected for this study. Of them six species were marine,
two species were halotolerant, and one was halophilic in origin. Among the selected
species three were green microalgae (Nannochloropsis sp., Tetraselmis suecica,
Dunaliella salina), four were diatoms (Chaetoceros muelleri, Pheodactylum
tricornutum, Amphora sp., Navicula sp.) and two were haptophytes (Chrysotila
carterae, Tisochrysis lutea). These species were obtained from Murdoch University
Microalgae Culture Collection. All these species were already successfully cultured in
open pond. The origins of these species are described below:
Table2.1Originofmicroalgaeusedinthisstudy
MicroalgaeOrigindetails
Code Source
Marine
Chrysotilacarterae CCMP647 SaltonSea,SaltLake,CA,USAChaetocerosmuelleri CS176 USA,NorthPacificNannochloropsissp. MUR267 MurdochUniversity,WA
Pheodactylumtricornutum CS-29/7 UnitedKingdom
Tisochrysislutea CS-177/7 Mataiva,SocietyIslands,Tahiti
Tetraselmissuecica CS187 Unknown
Halotolerant Amphorasp. MUR258 Perth,WANaviculasp. MUR259 Perth,WA
Halophilic Dunaliellasalina MUR8 HuttLagoon,WASupplier:NCMA,CSIRO,MurdochUniversityCultureCollection.
2.2 Cleaning and sterilization procedure
Before starting the experiments, all glassware (Erlenmeyer flasks, Schott bottles)
were cleaned and sterilized. The first step was to soak the glasswares overnight in 10%
of 1 M hydrochloric acid to remove any residual chemicals. Then other culturing
equipment and glassware were washed with Decon-90 (a phosphate-free detergent). All
culturing equipments were again rinsed with tap water and de-ionized water and dried at

53
70oC in the oven. After that, all glass wares and culturing equipments were sterilized by
autoclaving (121oC, 15 PSI (pressure per square inch), 15 minutes). Aseptic techniques
were maintained during media preparation, sub-culturing, inoculation and sampling.
The whole process was carried out in front of a Bunsen burner flame, inside the laminar
flow hood and the bench top surface was cleaned with 70% ethanol.
2.3 Media preparation
Natural seawater was used to prepare media for microalgae cultivation. Seawater
was collected from Hillary’s Boat Harbour, Perth, Western Australia (WA) and stored
in the dark to prevent algal growth (in a 10,000 L holding tank at the Algae R & D Cen-
tre, Murdoch University). Seawater was charcoal filtered prior to prepare media for de-
sired salinity (Guillard, 1975). Seawater of desired saline concentration was obtained by
adding salt (NaCl), then it was autoclaved and cooled before adding sterile nutrient
solutions to prepare F, F+Si, and F+Se media for green microalgae (Guillard & Ryther,
1962), diatoms (Guillard & Ryther, 1962) and haptophytes (Moheimani & Borowitzka,
2011), respectively. The salinity of seawater was determined by an automated Atago
refractometer (model PAL-03S).

54
Table2.2FmediumbasedonGuillardandRyther(1962)
ComponentStocksolution(g.L-1.dH2O)
Quantityper1Lofseawater
Concentrationinfinalmedium(M)
NaNO3 150 1mL 1.76x10⁻³NaH2PO4.H2O 10 1mL 7.24x10⁻⁵Vitaminssolution (seebelow) 0.5mL VitaminsStockSolution -Thiamine.HCl - 400mg 5.92x10⁻⁷Biotin(vitaminH) 2 1mL 4.10x10⁻⁹Cyanocobalamin 2 1mL 3.69x10⁻¹⁰Tracemetalssolution 1mL -TracemetalStockSolutionFeCl3.6H2O - 6.30g 2.34x10⁻⁵Na2EDTA.2H2O - 8.72g 2.34x10⁻⁵MnCl2.4H2O 360 1mL 1.82x10⁻⁶ZnSO4.7H2O 44 1mL 1.53x10⁻⁷CoCl2.6H2O 20 1mL 8.40x10⁻⁸CuSO4.5H2O 19.6 1mL 7.86x10⁻⁸Na2MoO4.2H2O 12.6 1mL 5.20x10⁻⁸
After preparing F media of desired salinity, Na2SiO3.9H2O and SeO2 were added
to the F media to prepare F+Si media for diatoms and F+Se media for haptophytes, re-
spectively (Table 2.3).
Table2.3AmountofNa2SiO3.9H2OandSeO2inF+SiandF+Semedium,respectivelybasedonGuillardandRyther(1962)
Component Stocksolution(g.L-1.dH2O)
Quantityper1Lofsea-water
Concentrationinfinalmedium(M)
Na2SiO3.9H2O 60 1mL 2.12x10⁻⁴SeO2 0.0129 1mL
2.4 Culture maintenance
The stock cultures were maintained in 250 mL conical flasks containing 100 mL
of culture medium, and after every 3 to 4 weeks all stock cultures were sub-cultured in
fresh medium. The cultures were grown at a constant temperature (25 ± 3 °C) and irra-
diance (150 µ mol photons m-2 s-1) with 12:12 h light dark cycle and not aerated. Irradi-
ance was measured using a Li-185B quantum meter equipped with a PAR quantum sen-
sor, Li-190SB. The cultures were mixed using 40 mm magnetic stirrer (mixing at 100

55
rpm), and the mixing speed was 0.2 s-1. The mixing speed wasdetermined by using fol-
lowing method: 250 mL conical flasks containing 150 mL of culture medium was
placed on magnetic stirrer machine. While the media was mixing one drop of ink was
added. The time required for India Ink to mix completely in culture media was recorded.
The procedure was repeated several times to get an accurate value (Moheimani, 2013a).
All stock cultures were maintained at 35 ppt salinity prior tostart the experiment.
During the experiment, all species were cultivated in 250 mL Erlenmeyer flasks con-
taining 150 mL of culture. The same cultivation conditions were maintained as de-
scribed above for stock culture. Salinity was gradually increased (2 ppt after every 72
hours, using NaCl) from 35 ppt up to the highest salinity range of each species to
simulate the rate of salinity increase in Geraldton (Ishika et al., 2017a), a potential area
for large-scale microalgae cultivation in WA (Boruff et al., 2015).
All experiments were carried out in four replicates (n=4). The cultures (n=4)
were maintained in a semi-continuous manner. The culture conditions were regularly
monitoring through cell counting, salinity and temperature measurements. Culture sam-
pling was carried out after every 72 hours. A maximum 50% of culture volume was
harvested, and the same amount of fresh medium with higher salinity (to increase salini-
ty in the resulting medium by 2 ppt) was added to the culture flask (Moheimani, 2013b).
The detailed procedure of analytical and biochemical methods performed were
described below.
2.5 Analytical procedures
2.5.1 General precautions
Analytical grade solvents and solutions were used for the analyses, and all
equipments were cleaned properly (see section 2.2) before starting the analysis.

56
2.5.2 Measurement of algal growth
2.5.2.1 Cell counting
Cell densities were determined using Neubauer haemocytometer. Samples were
homogenized gently in a 5 mL glass tissue grinder to prevent large cells clumping to-
gether before counting. One drop of Lugol’s solution was added to the sample prior to
loading haemocytometer. The Lugol’s solution was used to immobilize the microalgal
cells. The haemocytometer and the coverslip were cleaned with 70% ethanol, and the
coverslip was placed over the grid on the haemocytometer. A drop of sample was
placed at the edge of the coverslip. The haemocytometer containing sample was placed
under microscope. The cell number in (at least) three separate squares was counted and
recorded. The following equation was used to get the cell density per mL Moheimani et
al. (2013).
Cell density (cells mL-1) = (CellNumber Numberofsquarescounted)× 104
2.5.2.2 Specific growth rates
The specific growth rate (µ) was determined by measuring the doubling time in
the exponential growth phase from semi-log cell density plots. The specific growth was
calculated using the following equation as described in Moheimani et al. (2013):
µ =Ln2d
=0.693d
where, d is the time taken to double the cell number (i.e., the doubling time).
2.5.2.3 Determination of dry weight and ash-free dry weight
To determine dry weight (DW) and ash-free dry weight (AFDW), 5 mL of each
of microalgal culture was collected and filtered through pre-weighed 2.5 µm GF/C filter
paper (Whatman) using a Millipore filtration unit. Before filtration, the GF/C filters

57
were washed in deionized water and dried at 75˚C for 24h (Hour), and the dry weights
of filters were determined. After filtration, the saline microalgal cells were rinsed with
equal volumes of isotonic ammonium formate to remove excess salt from the filter pa-
per. As all saline species were grown from 35 ppt of salinity up to their highest salinity
range, different concentration of ammonium formate was adjusted to match the osmo-
larity of the algal culture at different stages of salinities (NaCl concentration) (Fon Sing,
2010).
Table2.4Concentrationofammoniumformateindifferentsalinityranges
Salinityrange Ammoniumformateconcentration(M)35-70ppt 0.6570-125ppt 1.3Above125ppt 2.6
After rinsing with ammonium formate solution, filters with microalgae were
dried at 90˚C for four hours and then placed in a vacuum desiccator overnight before re-
weighing. Dry weights of filters were determined by subtracting the weight of the filter
from the total dry weight. To determine the ash-free dry weights, the above filters were
ashed at 450˚C for seven hours and then cooled overnight in a vacuum desiccator and
then weighted again. The ash-free dry weight was determined by further subtraction of
ash weight from the total algal dry weight (Moheimani et al., 2013).
2.5.2.4 Cell volume estimation
Firstly, samples were homogenized gently using glass tissue grinder to prevent
clumping. Then one drop of Lugol’s solution was added to the sample to immobilize the
microalgal cells. One drop of sample was taken to a clean slide, covered with cover slip
and placed under the Leica Dialux 22 compound microscope. A top-mounted Tucsen 9
MP camera was used to take image, and the image was downloaded with TSView 7

58
software. For each sample, at least 16 microalgal cells were examined. The ruler tool in
TSView 7 software was used to measure the cell size.
Cell volume of each microalga was estimated using equations for spherical
(Chrysotila carterae, Nannochloropsis sp., Tisochrysis lutea), cylindrical (Chaetoceros
muelleri), half elliptic prism (Phaeodactylum tricornutum and Amphora sp), elliptical
prism (Navicula sp.) and prolate spheroid shaped (Tetraselmis suecica and Dunaliella
salina) microalgae as described by Hillebrand et al. (1999).
Cell volumes were normalized (if necessary) using:
Zi = ABCADBEADFGCADBE
where, X is cell volume, and Zi is the new normalized value.
2.5.2.5 Determination of salinity range
The salinity range can be determined using growth or rates of survival, photo-
synthesis, and respiration (Kirst, 1990). In the present study, significantly low biomass
productivity was used to determine the range of salinity. The significantly low biomass
productivity at low and high salinity levels indicated the lower and upper limits of the
salinity range (Ishika et al., 2017b).
2.5.3 Determination of biochemical content
2.5.3.1 Pre-treatment of sample before extraction
After filtration, the filters were folded and blotted to remove excess water from
the filters. Then the filters were stored in plastic zip lock bags at -80oC until further use.
Before extraction, frozen filters were first treated with liquid nitrogen to rupture the cell
wall (Fon Sing, 2010). Then the samples were left for a while to thaw before extraction
procedure began.

59
2.5.3.2 Total Carbohydrates extraction
Total carbohydrate content was determined based on the method described by
Kochert (1978) and Ben-Amotz et al. (1985) and modified by Mercz (1994). Microalgae
(5 mL sample) containing filters were first placed in acid resistant plastic centrifuged
tubes. Then the filters were homogenized using glass rod with 2 mL of 1 M H2SO4 and
the final volume in each tube was made up to 5 mL with additional 3 mL of 1 M H2SO4.
The lids of the centrifuge tubes were tightly screwed, and tubes were incubated in a wa-
ter bath at 100ºC for 60 min. The sample containing tubes were then cooled at room
temperature. After cooling, tubes were centrifuged at 3000 rpm for 10 min. 2mL of the
supernatant from each tube was transferred to separate tubes and 1 mL of 5% (w/v)
phenol solution was added and rapidly mixed with a vortex. Then, 5 mL of concentrated
H2SO4 was added and shaken 3 times by hand. The tubes were then cooled for 30 mins
and then shaken 3 times again manually before the absorbance of the sample was ana-
lyzed using UV-visible spectrophotometry at 485 nm.
The carbohydrate content was then calculated from the standard curve using the
following equation:
Carbohydrate yield (mg L-1) = HFIJKLMNIFOPQRFSTPUIKDQOFENFINVTIRPWKSTDPKUNBXPQOPNDFOPIBFS×VTSOTIPRKSTDP
The glucose standard curve was prepared by preparing a set of tubes containing
0, 40, 80, 120, 160 and 200 µg glucose as standards and then topped up to 2 mL with
dH2O (deionized water). The standards were then analyzed in the same way as the sam-
ples.
Table2.5Setoftheglucosestandardcurvesamples
Finalglucoseamount(μg) 0 40 80 120 160 200Standardsolution(mL) 0 0.4 0.8 1.2 1.6 2.0dH2O(mL) 2 1.6 1.2 0.8 0.4 0

60
2.5.3.3 Total Lipid analysis extraction
Lipid extraction was performed following the method of Bligh and Dyer (1959),
modified by Kates and Volcani (1966) and adapted by Mercz (1994). 5 mL sample con-
taining filters were kept inside plastic centrifuge tubes. Microalgae containing filters
were treated with liquid nitrogen to rupture the cell wall (Moheimani et al., 2013) and
left for a while to thaw. Ruptured cells were then crushed with 5.7 mL of solvent com-
prising of methanol: chloroform: deionized water 2:1:0.8 (v/v/v) until a smooth green
paste was obtained. The lids of tubes were then tightly screwed to prevent evaporation
of the solvent and the sample containing tubes were centrifuged at 3000 rpm for 10 min
at room temperature. The supernatants were separated into another 10 mL of glass
tubes. The pellets were resuspended in 5.7 mL of the same solvent and mixed well by
vortexing. Then supernatants were separated again by centrifugation at 3000 rpm for 10
min. 3 mL of deionized water and 3 mL of chloroform were added to the supernatant
and mixed before overnight storage in a dark, cool place for phase separation. On the
following day, the top phase (non-lipid components, methanol/water) was removed
carefully with a very fine Pasteur pipette connected to a syringe and discarded. 6-8
drops of toluene were added to the bottom phase (chloroform phase containing the li-
pids) and mixed by hand. The toluene/water was then removed from the surface of the
chloroform layer and the chloroform layer containing lipid was then transferred to a dry
and pre-weighed 10 mL vial. The vials were immediately evaporated on a heating plate
at 38oC under a stream of ultra pure N2 gas. After evaporation, vials were weighed im-
mediately using analytical balance. Lipid weight was determined by subtracting the
weight of the empty vial from the weight of the vials with lipid.

61
2.5.3.4 Chlorophyll a extraction
Jeffrey and Humphrey (1975) method was used to determine Chlorophyll a con-
tent using cold 90% acetone as extracting solvent for green microalgae and cold 100%
acetone as extracting solvent for brown microalgae (diatoms and haptophytes). Before
extraction, a pinch of MgCO3 was added to the cold acetone to remove any trace of ac-
ids from the microalgal samples or glassware which might degrade the chlorophyll mol-
ecules (Moheimani et al., 2013). The sample containing filters were placed in centri-
fuged tubes and treated with liquid nitrogen to rupture the cell wall (Moheimani et al.,
2013) and left for a while to thaw. Then cells were crushed with acetone solvent until all
the chlorophyll was dissolved in the acetone. After crashing, the tubes containing sam-
ples were centrifuged at 1500 rpm for 10 min, and the supernatant was transferred to
another tube. The pellet was re-extracted and centrifuged as described above. The su-
pernatants were combined. The whole process was executed under low light to avoid the
breakdown of chlorophyll by light. Chlorophyll contents were identified using UV-
visible spectrophotometry, at 664 nm and 647 nm wave length for green microalgae and
at 664 nm and 630 nm wave length for brown microalgae using equation derived from
Jeffrey and Humphrey (1975) (results were expressed in µg mL-1 culture volume).
For green algae the total Chlorophyll a content was then calculated according to
the following equation:
Chlorophyll a (µg mL-1) = 11.93E[[\ − 1.93E[\^
For brown algae the total Chlorophyll a content was then calculated according to
the following equation:
Chlorophyll a (µg mL-1) = 11.47E[[\ − 0.40E[ab

62
2.5.3.5 Total carotenoids extraction
Total carotenoids were extracted using the method described in Abu-Rezq et al.
(2010). 10 mL filtered microalgal samples were kept in 20 mL centrifuged tube and
treated with liquid nitrogen to rupture the cell wall of microalgae. Then samples were
crushed with 10 mL 90% (v/v) cold acetone containing a pinch MgCO3 until the pig-
ment dissolved fully in acetone. All the procedure was done under the low light condi-
tion to prevent the breakdown of the pigments. Then the tubes were centrifuged at
3000-5000 rpm for 2-3 min. The supernatants were then transferred to other tubes, and
the volumes of supernatants were recorded. The absorbance of the supernatant was
measured using UV-visible spectrophotometry at 452 nm (results were expressed in µg
mL-1 culture volume) against an acetone blank. If absorbance was found greater then
2.0, then the absorbance was recorded again after diluting the sample. The total carote-
noids content (in µg mL-1 culture volume) was calculated using the following equation
(Abu-Rezq et al., 2010):
TotalCarotenoids = ABS452×3.86×Totalvolumeofextract(mL)
TotalvolumeofCultureSample(mL)
2.5.3.6 Fucoxanthin extraction and quantification
The fucoxanthin extracted using the total carotenoids extraction method as de-
scribed above (Abu-Rezq et al., 2010).
2.5.3.7 HPLC quantification
HPLC quantification was done using the method described in Ishika et al.
(2017b). All HPLC analysis and preparation of standard solutions was performed in a
darkened room using yellow light illumination in order to eliminate pigment degrada-
tion. The extracted supernatants were collected and filtered through a 0.33 µm syringe
filter into brown 2 mL HPLC sample vials. Extracts were analyzed using gradient elu-

63
tion on a Shimadzu Prominence HPLC equipped with an Apollo-C18 analytical column
(5 µm, 4.6 mm × 150 mm; Grace Discovery Sciences) and a PDA detector. Fucoxanthin
was monitored at an absorbance of 450 nm. The following mobile phases and gradients
were used, adapted from Louda et al. (Louda et al., 1998): Solvent A (0.5 M ammonium
acetate in 85:15 v/v methanol: water), Solvent B (90:10,v/v acetonitrile: water) and
Solvent C (100% ethyl acetate) and programmed as follows: 0~5 min 60:40 Solvent
A:Solvent B isocratic 5-10 min linear gradient to 100 B; 10~20 min linear gradient from
100 B to 23:77 B:C, hold for 1 minute, then to 100 C over 4 minutes. Re-equilibration
of the HPLC column consisted of running 100 B for 1 min then gradient to 60:40 A: B
over 4 minutes, hold for 5 minutes. Total time from injection to injection (including re-
equilibration) was 35 mins.
Identification and quantification of fucoxanthin were achieved using a commer-
cially available standard solution (Nova-Chem, Melbourne, Australia). Retention time
for fucoxanthin standard was 14.19 mins. An external calibration curve using peak area
was constructed for quantification. Fucoxanthin content in samples was expressed as
mg g-1 of ash-free dry weight (AFDW) of the sample. Fucoxanthin productivity was
determined by multiplying fucoxanthin content with biomass productivity, and the value
was expressed as mg L-1 d-1 of the sample (AFDW).
2.5.4 Photosynthetic Measurement
2.5.4.1 Maximum quantum yield
Maximum quantum yield for dark-adapted samples was measured using a WA-
TER-PAM chlorophyll fluorometer (WATER-PAM WALZ, Germany). The maximum
quantum yield of PS II is termed as Fv/Fm. Fv (=Fm-Fo) represents the variation of chlo-
rophyll fluorescence between the maximal fluorescence signal (Fm) of dark-adapted

64
cells induced by a saturating pulse, and the minimal fluorescence signal (Fo) of dark-
adapted cells. Fv/Fm was used to check the effect of salinity on the photosynthetic appa-
ratus of PS II.
2.6 Data Analysis
Significant differences between treatments of a particular species were analyzed
with a one-way analysis of variance (ANOVA). When normality and equal variance test
failed, the Tukey pair wise comparison method based on ranks was applied using Sig-
ma-Plot 13.0 package. In each case, P value <0.05 was considered significant with a
sample size of (n=) 4. Pearson’s correlations were used to determine the direction of
relationships between variables. Pearson’s correlations were also performed using Sig-
ma-Plot 13.0 package.

65
Chapter 3 Effect of Gradual Salinity Increase on Biomass
Production and Biochemical Composition
3.1 Introduction
Although microalgae have been cultured at commercial scale since the early
1960s (Borowitzka, 1999), production of a low priced commodity, such as biofuel, is
still regarded as economically unviable due to the necessities of large amounts of
limited resources like fresh water and nutrients (Ishika et al., 2017a). One potential
strategy to lower the production cost is to reduce the consumption of a cost-intensive
and limited resource input such as fresh water. A cost analysis report on biodiesel pro-
duction from microalgae indicated that 3.7 kL of fresh water is needed to produce 1.2 L
of biodiesel (Yang et al., 2011). Being able to culture in seawater would seem to be a
convenient option for mass microalgal cultivation to produce a more environmentally
and economically sustainable biomass (Borowitzka & Moheimani, 2013b).
Marine, halotolerant and halophilic microalgae species, being already tolerant to
relatively high salinity levels, would be the practical choice during cultivation using
only seawater. However, only a handful of saline microalgae (e.g., Dunaliella salina, D.
tertiolecta, Tetraselmis suecica, T. chuii, Amphora coffeaeformis and Chrysotila
carterae) have been cultivated successfully in large-scale open pond systems (Fon Sing,
2010). One of the difficulties encountered in an open pond cultivation system is that the
salinity of the system increases gradually over time due to evaporation. If seawater is
used for initial pond filling and evaporative volume makeup, this would further exacer-
bate the situation. Most marine microalgae investigated to date has an optimal biomass
productivity over a relatively narrow salinity range (e.g., less than 45 ppt of salinity)
(Fujii et al., 1995; Moheimani, 2005; Pal et al., 2011). If a marine microalga with a nar-

66
row range of salinity tolerance is cultivated only with sea water, it would fail to grow
beyond a certain salinity range due to the salinity increase over time. Consequently,
despite containing enough nutrients to sustain the microalgal cultivation, the existing
culture media would need to be discharged regularly or diluted the salinity using fresh
water.
A recent study showed that every day 36% of nitrate and 26% of phosphate is
found to remain in the growth media in a 2 m2 open raceway pond (2 x1 x 0.4 m,
Length x Width x Height) (Fon Sing et al., 2013). If not recycled, this leftover nutrient
is wasted and thereby increasing production costs. However, if the media is recycled to
capture un-utilized nutrient, the salinity of the media will consistently increase. The
constant increase in salinity makes it almost impossible to maintain a single species of
microalgae with sufficient biomass productivity for economic exploitation. There are
two ways that this problem could be addressed. Firstly, the cultivation of different saline
microalgae (one after another) with different salinity optima. For example, stepwise
cultivation of marine (low saline; 35-50 ppt salinity), halotolerant (mid saline; 70-120
ppt salinity) and halophilic (hypersaline; >150 ppt salinity) microalgae based on the
salinity of the media, could be a sustainable solution to produce sufficient biomass with
minimum nutrient waste. It would also help to cover the whole spectrum of salinity
(from 35 ppt to 300 ppt) experienced during cultivation in seawater based open ponds. It
has been reported that stepwise cultivation combined with co-cultivation reduces overall
nutrient waste, compared to the monoculture, by 95%, 74% and 51% for marine, halo-
tolerant and halophilic microalgae, respectively (Ishika et al., 2017a). The second solu-
tion is to find species that exhibit optimal biomass productivity over a wide salinity
range. Researchers have reported that microalga with a naturally wide salinity tolerance
range could acclimate to relatively low and high salinity (Strizh et al., 2004). Therefore,

67
marine, halotolerant, and halophilic microalgae that exhibit these characteristics would
be better selections to produce sustainable biomass over the whole spectrum of salinity
conditions likely to be encountered in commercial open pond cultivation.
Although saline microalgae have been successfully cultured outdoors by main-
taining a particular salinity condition; there is no published data on biomass, lipid and
carbohydrate productivity during incremental increases in salinity combined with halo-
acclimation. Most studies addressing the effect of salinity on microalgae have been fo-
cused on the effect of a sudden change in salinity rather than gradual acclimation (Ben-
Amotz et al., 1985; Takagi et al., 2006). However, in this study, we focused on gradual
acclimation to salinity postulating that acclimation to saline conditions may allow suffi-
cient time for saline microalgae to acclimate, and thus continue to grow, without photo-
synthetic activity being affected (Hellebust, 1976). Microalgal culture media salinity
change when grown outdoor ponds (based on only seawater) will be gradual; therefore,
it is possible to use microalgal species cultured in such a way to provide insights into
the physiological and biochemical changes that occur under continuously increasing
saline conditions. The overarching aim of this study is to investigate the effects of a
gradual increase in salinity on the overall biomass productivity, biochemical content
(lipid/carbohydrate) and photosynthesis of marine, halotolerant and halophilic microal-
gae with the goal of identifying species that could be grown continuously between 35
ppt salinity and salt saturation.
3.2 Materials and methods
3.2.1 Species selection, culture condition, and cultivation
Nine microalgal species with three different optimal salinity ranges e.g. six
marine microalgae (Chrysotila carterae, Chaetoceros muelleri, Nannochloropsis sp.,

68
Pheodactylum tricornutum, Tisochrysis lutea, Tetraselmis suecica), two halotolerant
microalgae (Amphora sp. and Navicula sp.), and one halophilic microalgae Dunaliella
salina were selected based on their ability to grow successfully at commercial scale in
paddle wheel driven raceway ponds as described in Chapter 2. The culture media and
condition used to grow selected species is already discussed in Chapter 2.The cultures
were maintained in a semi-continuous manner as described in Chapter 2.
3.2.2 Salinity range
Determination of salinity range is described in Chapter 2.
3.2.3 Analytical techniques
Determination of cell number, cell volume, biomass productivity, specific
growth rate, maximum quantum yield and extraction of lipids and carbohydrates were
performed as described in Chapter 2. Cell volumes were normalized using the equation
described in Chapter 2.
3.2.4 Statistical Analysis
One-way analysis of variance (ANOVA) and Tukey test was, and Pearson’s cor-
relations were conducted as described in Chapter 2.
3.3 Results
3.3.1 Effects of halo-acclimation and increasing salinity on
culture performance
Under the halo-acclimation condition, five of the six marine microalgae showed
extended salinity range compared to that previously reported in the literature (Table 3.1,
3.2). It was not possible to determine a salinity range for Chrysotila carterae as contam-
ination of the culture meant that data collected for salinity conditions greater than 43 ppt

69
(parts per thousand) was compromised. Both halotolerant microalgae (Navicula sp. and
Amphora sp.) were able to grow from 35 ppt up to 129 ppt. The halophilic microalgae
D. salina was found to have the greatest salinity range, growing in conditions ranging
between 35 and 233 ppt salinity (Table 3.1).
Table3.1Salinityrangeforthemicroalgaeusedinthisstudy
Salinemicroalgae Salinityrange(ppt)
Marine
Chrysotilacarterae 35-43Chaetocerosmuelleri 35-55Nannochloropsissp. 35-55
Pheodactylumtricornutum 35-65Tisochrysislutea 35-75
Tetraselmissuecica 35-109
Halotolerant Amphorasp. 35-129Naviculasp. 35-129
Halophilic Dunaliellasalina 35-233
Table3.2Previouslyreportedsalinityrangeforthemicroalgaeofsamegenus
Salinemicroalgae ReportedSalinityrange(ppt)
References
Marine
Chrysotilacarterae 33 Moheimani(2005)Chaetocerosmuelleri upto46.4 Fujiietal.(1995)
Nannochloropsissp. upto40 Paletal.(2011)Pheodactylumtricornutum 7-30 Santosetal.(2002)
Tisochrysislutea 5-65 AlkhamisandQin(2013);Kaplanetal.(1986)
Tetraselmissuecica 0-35 Fabregasetal.(1984)
HalotolerantAmphorasp. 10-120 CookseyandChansang
(1976);Indrayani(2017)Naviculasp. 0-70 Gibsonetal.(2006)
Halophilic Dunaliellasalina uptosaltsaturation(250ppt)
BrownandBorowitzka(1979)
Even though the salinity range for the marine species was greatly extended, e.g.,
up to 100+ ppt for Tetraselmis suecica, the optimal salinity (i.e., where biomass produc-
tivity was highest) of the majority of tested marine species generally occurred at salini-
ties of less than 49 ppt (Figure 3.1). Tetraselmis suecica was an exception with maxi-
mum biomass productivity of 42 mg L-1 d-1 at 59 ppt salinity (Figure 3.1). Tetraselmis

70
suecica consistently had higher biomass productivity than other marine species with
biomass productivity vs. salinity profile very similar to that of the halotolerant species,
up to its maximum measured salinity of 109 ppt (Tables 3.1 and 3.2). The average bio-
mass productivities of Tetraselmis suecica and other marine species (e.g., Chrysotila
carterae, Chaetoceros muelleri, Nannochloropsis sp., Phaeodactylum tricornutum and
Tisochrysis lutea) are summarized in Table 3.3.
Both halotolerant species had their highest biomass productivity between 75-80
ppt salinity (Figure 3.2). Amphora sp. exhibited 3% lower biomass productivity (aver-
age) than Navicula sp. (25 mg L-1 d-1 and 25.8 mg L-1 d-1, respectively) and the biomass
productivity of Navicula sp. was more consistent across a wider salinity range (Figure
3.2, Table 3.1). At the extreme ends of the salinity range (129 ppt), the biomass produc-
tivity of Navicula sp. dropped by approximately 45% of the value obtained at optimal
salinity, compared to a 75% reduction for Amphora sp. (Figure 3.2).
While the known halophilic Dunaliella salina had the widest salinity range, the
highest biomass productivity for this microalga (26.7 mg L-1 d-1) was observed at low
salinity (59 ppt). In fact, biomass productivity for D. salina continually decreased as
salinity was increased reaching a minimum of only 6.7 mg L-1 d-1 when grown at 233
ppt (Fig. 3.3). The average biomass productivity of D. salina was found to be 15.4 mg
L-1 d-1.
All microalgae showed statistically significant (one-way ANOVA, P<0.05) dif-
ferences in biomass productivity between optimal and non-optimal saline conditions for
each species (Figure 3.1-3.3, Appendix A). Pearson’s correlation showed that biomass
productivity for four of the nine species, e.g., Nannochloropsis sp., Tisochrysis lutea,
Tetraselmis suecica, and D. salina, had a strong negative correlation to salinity, i.e.,

71
biomass productivity decreased with the increase in salinity; however, Chaetoceros
muelleri showed weakly positive correlation to salinity increase (Appendix A).

72
Table3.3Averagebiomass,lipid,carbohydrateproductivityandaveragelipidandcarbohydratecontent(Mean±SE)ofmicroalgaeusedinthisstudy.
SalineMicroalgaeAverageBiomass
Productivity(mgL-1d-1)
AverageLipidContent
(%ofAFDW)
AverageLipidProductivity(mgL-1d-1)
AverageCarbohydrate
Content(%ofAFDW)
AverageCarbohydrateProductivity(mgL-1d-1)
Marine
Chrysotilacarterae 21.1±1.3 30.8±2 9.9±0.6 27.1±2.9 6.7±0.6Chaetocerosmuelleri 20.5±1.1 35.4±0.6 6.9±0.5 17.9±1.1 3.7±0.3Nannochloropsissp. 25.1±0.9 29.1±1.2 10.2±0.6 15.5±0.8 3.9±0.3
Pheodactylumtricornutum 17.7±0.9 34.6±0.9 9.1±0.9 24.2±0.8 4.5±0.4
Tisochrysislutea 14.4±1 36±0.9 7.8±0.7 19.73±0.5 3±0.2Tetraselmissuecica 32±1.5 32.9±1.9 13.6±0.3 23.8±0.6 7.6±0.3
Halotolerant Amphorasp. 25±1.2 37.2±1.9 10.4±0.3 28.2±0.6 5.6±0.4Naviculasp. 25.8±1.1 43.7±1.2 11.9±0.6 20.5±1 7.6±0.4
Halophilic Dunaliellasalina 15.4±1.1 56.2±0.9 9.4±0.2 13.7±0.7 2.1±0.07

73
35 40
1020304050
30 40 50 30 40 50 30 40 50 60 40 50 60 70 40 60 80 100
1020304050
20
40
60
20
40
6005
101520
05101520
05
10152025
0510152025
0
20
40
60
0
20
40
60
Bio
mas
s pr
oduc
tivity
(mg
L-1
d-1 )
Car
bohy
drat
e co
nten
t (%
of o
rgan
ic
cont
ent)
Lipi
d co
nten
t (%
of o
rgan
ic
cont
ent)
Car
bohy
drat
e pr
oduc
tivity
(mg
L-1 d
-1)
Lipi
d pr
oduc
tivity
(mg
L-1 d
-1)
Salinity (ppt)
0.0
0.5
1.0
0.0
0.5
1.0
Cel
l vol
ume
(Nor
mal
ized
va
lues
)Chrysotila carterae
Chaetoceros muelleri
Nannochloropsis (MUR 267)
Phaeodactylum tricornutum
Tisochrysis lutea
Tetraselmis suesica
0.4
0.6
0.8
1.0
0.4
0.6
0.8
1.0
F v/F
m
Bio
mas
s pr
oduc
tivity
(mg
L-1
d-1 )
Car
bohy
drat
e co
nten
t (%
of o
rgan
ic
cont
ent)
Lipi
d co
nten
t (%
of o
rgan
ic
cont
ent)
Car
bohy
drat
e pr
oduc
tivity
(mg
L-1 d
-1)
Lipi
d pr
oduc
tivity
(mg
L-1 d
-1)
Cel
l vol
ume
(Nor
mal
ized
va
lues
)
F v/F
m
Figure3.1Theeffectofagradualincreaseinsalinityonthebiomassproductivity,lipidandcarbohydratecontentandproductivity,cellvolumeandmaximumquantumyield(Fv/Fm)ofselectedmarine,halotolerantandhalophilicmicroalgae.Means±S.E.,n=4.(ForsignificantdifferencesinresultsseeAppendixA).

74
40 60 80 100 120
1020304050
40 60 80 100 120
1020304050
20
40
60
20
40
6005
101520
05101520
05
10152025
0510152025
0
20
40
60
0
20
40
60
0.5
1.0
0.5
1.0
Amphora sp.Navicula sp.
0.4
0.6
0.8
1.0
0.4
0.6
0.8
1.0
F v/F
m
Bio
mas
s p
rod
uct
ivit
y (
mg
L-1
d-1
)
Car
bo
hyd
rate
co
nte
nt
(% o
f o
rgan
ic
con
ten
t)
Lip
id c
on
ten
t (%
of
org
anic
co
nte
nt)
Car
bo
hyd
rate
p
rod
uct
ivit
y (
mg
L-1
d-1
)
Lip
id
pro
du
ctiv
ity
(m
g L
-1d
-1)
Cel
l vo
lum
e(N
orm
aliz
ed
valu
es)
F v/F
m
Salinity (ppt)
Bio
mas
s p
rod
uct
ivit
y (
mg
L-1
d-1
)
Car
bo
hyd
rate
co
nte
nt
(% o
f o
rgan
ic
con
ten
t)
Lip
id c
on
ten
t (%
of
org
anic
co
nte
nt)
Car
bo
hyd
rate
p
rod
uct
ivit
y (
mg
L-1
d-1
)
Lip
id
pro
du
ctiv
ity
(m
g L
-1d
-1)
Cel
l vo
lum
e(N
orm
aliz
ed
valu
es)
Figure3.2Theeffectofagradualincreaseinsalinityonthebiomassproductivity, lipidandcarbohydratecontentandproductivity,cellvolumeandmaximumquantumyield(Fv/Fm)ofselectedmarine,halotolerantandhalophilicmicroalgae.Means±S.E.,n=4.(ForsignificantdifferencesinresultsseeAppendixA).

75
50 100 150 200
1020304050
1020304050
20
40
60
20
40
6005
101520
05101520
05
10152025
0510152025
0
20
40
60
0
20
40
60
0.0
0.5
1.0
0.0
0.5
1.0
Dunaliella salina
0.4
0.6
0.8
1.0
0.4
0.6
0.8
1.0
Bio
mas
s pr
oduc
tivity
(mg
L-1
d-1 )
Car
bohy
drat
e co
nten
t (%
of o
rgan
ic
cont
ent)
Lipi
d co
nten
t (%
of o
rgan
ic
cont
ent)
Car
bohy
drat
e pr
oduc
tivity
(mg
L-1 d
-1)
Lipi
d pr
oduc
tivity
(mg
L-1 d
-1)
Cel
l vol
ume
(Nor
mal
ized
va
lues
)
F v/F
m
Salinity (ppt)
Bio
mas
s pr
oduc
tivity
(mg
L-1
d-1 )
Car
bohy
drat
e co
nten
t (%
of o
rgan
ic
cont
ent)
Lipi
d co
nten
t (%
of o
rgan
ic
cont
ent)
Car
bohy
drat
e pr
oduc
tivity
(mg
L-1 d
-1)
Lipi
d pr
oduc
tivity
(mg
L-1 d
-1)
Cel
l vol
ume
(Nor
mal
ized
va
lues
)
F v/F
m
Figure3.3Theeffectofagradualincreaseinsalinityonthebiomassproductivity, lipidandcarbohydratecontentandproductivity,cellvolumeandmaximumquantumyield(Fv/Fm)ofselectedmarine,halotolerantandhalophilicmicroalgae.Means±S.E.,n=4.(ForsignificantdifferencesinresultsseeAppendixA).

76
3.3.2 Cell volume
The cell volume of each microalga decreased when grown in saline conditions
greater than the optimal salinity range. Marine microalgae showed reduced cell volume
at higher salinity level which was species-specific (Figure 3.1). Both halotolerant mi-
croalgae Navicula sp. and Amphora sp. showed reduced cell volume at salinities below
55 ppt and over 85 ppt (Figure 3.2). The halophilic D. salina followed the same trend as
the halotolerant species, i.e., a very small cell volume was exhibited at very low (35
ppt) and very high (233 ppt) salinity (Figure3.3).
3.3.3 Maximum quantum yield
Marine species tested in this study exhibited maximum quantum yield (Fv/Fm)
greater than 0.6, in their optimal salinity range. However, below or beyond that range
those species showed low Fv/Fm values. All marine species showed Fv/Fm values less
than 0.6 at salinities higher than 45 ppt. Between the two halotolerant species, Amphora
sp. showed low Fv/Fm values at salinities less than 45 ppt and more than 100 ppt. Navic-
ula sp. was the only species that did not show an obvious correlation between salinity
increase and maximum quantum yield (Appendix A). Conversely, halophilic D. salina
showed Fv/Fm value lower than 0.6 at very low (35 ppt) and very high (233) salinity
(Figure 3.3). Six of the nine tested species showed a negative correlation, and two
showed a positive correlation between salinity increase and Fv/Fm values (Appendix A).
Fv/Fm values were found to correlate with biomass productivity; i.e., maximum quantum
yield of Tisochrysis lutea, Tetraselmis suecica, Navicula sp. and D. salina showed a
positive correlation with biomass productivity (Appendix A).

77
3.3.4 Effect of salinity increase on biochemical components
3.3.4.1 Lipid content and productivity
Among all species studied, D. salina showed the highest average lipid content
(56.2 % of AFDW) (Table 3.3). For the two halotolerant species, Navicula sp. showed
higher lipid content (average) (43.7 %) than Amphora sp. (37.2%). Among the marine
microalgae, the highest lipid content was observed in Tisochrysis lutea (36 % of
AFDW). The total lipid content in Chaetoceros muelleri was found to increase with
salinity (Pearson’s correlation coefficient 0.894, P<0.05), while in P. tricornutum and
Tisochrysis lutea, lipid content was found to reduce by 50% with salinity increase (a
very strong negative correlation, Pearson’s correlation coefficient -0.754 and -0.752,
respectively) (Appendix A). No significant change in lipid content was found for Tetra-
selmis suecica throughout the period of increased salinity (Appendix A).
The average lipid productivity of Tetraselmis suecica was the highest (13.6 mg
L-1 d-1 of AFDW) among all tested species (Table 3.3). Amphora sp. showed less (aver-
age) lipid productivity (10.4 mg L-1 d-1 of AFDW) compared to Navicula sp. (11.9 mg L-
1 d-1 of AFDW) (Table 3.3). The lipid productivity of three of the nine species (e.g.
Nannochloropsis, Tisochrysis lutea and D. salina) showed a strong inversely propor-
tional correlation with salinity increase while, lipid productivity of Tetraselmis suecica
was weakly negatively correlated to salinity (Pearson’s coefficient -0.55, P<0.05) (Ap-
pendix A). In eight of nine species, biomass and lipid productivities were found to be
strongly correlated (Appendix A).
3.3.4.2 Carbohydrate content and productivity
The highest carbohydrate content for all species (28.2% of AFDW) was found in
Amphora sp. (Table 3.3), of the maximum average carbohydrate content found showed
the following pattern: Amphora sp.> Chrysotila carterae> P. tricornutum> Tetraselmis

78
suecica> Navicula sp.> Tisochrysis lutea> Chaetoceros muelleri> Nannochloropsis
sp.> D. salina (Table 3.3). The carbohydrate content in Chaetoceros muelleri and Na-
vicula sp. was found to be correlated to salinity increase (Pearson’s coefficient 0.949
and 0.610, respectively), whereas in P. tricornutum the carbohydrate content was
strongly inversely correlated to salinity (-0.822, P <0.05) (Appendix A).
The highest (average) carbohydrate productivity (7.6 mg L-1 d-1 of AFDW) was
found in Tetraselmis suecica and Navicula sp. There is no generalized pattern of corre-
lation between carbohydrate productivity and salinity increase. The carbohydrate
productivity in Chaetoceros muelleri, Tisochrysis lutea, Tetraselmis suecica and D.
salina was found to reduce (strongly inversely proportional) with an increase in salinity
(Appendix A).
Eight of the nine species showed a strong positive relationship between biomass
and carbohydrate productivity and six of the nine microalgae showed a strong positive
relationship between lipid and carbohydrate productivity (Appendix A).
3.4 Discussion
To be commercially feasible, a large scale microalgae cultivation system must
produce a significant amount of biomass consistently and reliably over a long period
(Moheimani, 2013b). At the same time, the cultivation system needs to be environmen-
tally sustainable in relation to limiting resources (Ishika et al., 2017a). If the cultivation
system uses only seawater, the salinity of the media will increase naturally and this will
cause salinity stress to algal cells (Ishika et al., 2017a), which will significantly reduce
both the photosynthetic activity and biomass productivity of the microalgae (Fabregas
et al., 1984; Kromkamp & Peene, 1999). It has been postulated that microalgae can be
acclimatized to increased salinity to overcome the adverse effects of salinity stress

79
(Hellebust, 1976). If this could be achieved for commercially exploitable species, the
extended salinity range offers a longer growth period with a subsequent increase in
overall biomass productivity which will be economic for the system. To the best of au-
thors’ knowledge, this is the first study examining the effect of incremental salinity in-
crease on the growth, productivity, biochemical composition and photosynthesis of var-
ious halo-acclimated microalgal species.
3.4.1 Salinity range
Implementation of slow stepped and gradual culture medium salinity increase
(usual experiences in open pond), increased microalgae salinity growth range when
compared of reported previously. The marine species, Tetraselmis suecica showed a
broad salinity growth range (35 ppt to 109 ppt) which is 70% more extended than that
of a previous study (Fabregas et al., 1984). No marine Tetraselmis sp. has been reported
to show such an extended salinity range. Amphora sp. was found to grow over an ex-
tended salinity range (by approximately 7%) compared to that reported in the previous
literature (Indrayani, 2017). The halophilic microalga D. salina showed the widest sa-
linity range (35 ppt to 233 ppt of salinity) which was supported by the findings of
Brown and Borowitzka (1979).
3.4.2 Biomass productivity and cell volume
In this study, we tested the effect of gradual salinity increase on the growth of
nine microalgae known to be exploitable at commercial scale. As expected, salinity
stress was found to decrease the biomass productivity of all species (Fabregas et al.,
1984). Even the biomass productivity of halophilic D. salina was found to decrease by
about 60% from the maximum biomass productivity at a very high saline concentration
(>200 ppt of salinity), and this finding is in line with previous studies (Al-Hasan et al.,
1987; Takagi et al., 2006). Slow growth rate at high salinity resulted in low biomass

80
productivity when cells are grown outside of their optimum growth salinity range
(Takagi et al., 2006). It has been reported previously that under salinity stress microal-
gae expend most of their energy to maintain cell turgor pressure and to resist the osmot-
ic stress rather than increase their growth which led to a reduction in biomass productiv-
ity (Kirst, 1990; Kirst, 1988).
The gradual salinity increase not only affected biomass productivity but also
markedly affected cell volumes. In the present study, the cell volume of each species
reduced with increasing salinity. It has been reported that increased NaCl concentrations
stimulate the Na+ channel blocker and in response the cytoplasmic volume decreases
(Allakhverdiev et al., 2000; Takagi et al., 2006). Smith and Berry (1986) suggested that
hyperosmotic dehydration could be a reason for cell volume reduction at high salinity.
3.4.3 Maximum quantum yield
Maximum quantum yield (Fv/Fm) was used to determine the physiological salini-
ty stress of the cultured microalgae. Maximum quantum yield (Fv/Fm) shows the light
utilizing capability of an organism during photosynthesis and also indicates the stress on
photosynthetic apparatus (Bhola et al., 2016; Cosgrove & Borowitzka, 2010; Dao &
Beardall, 2016; Kromkamp & Peene, 1999; Ramanna et al., 2014). AFv/Fm value higher
than 0.6 indicates that cells are in ‘good health', however, any value less than 0.6 con-
firms cells are under stress (Bhola et al., 2016; White et al., 2013). Seven of the nine
species tested in this study showed Fv/Fm values less than 0.6 when the salinity was be-
low/beyond the optimal salinity range (Figure 3.1-3.3) and osmotic stress is probably
the main reason for the reduction in Fv/Fm value (Frank & Wegmann, 1974).
McLachlan (1961) reported that salinity stress leads to a decrease in photosyn-
thetic activity followed by a reduction in the supply of photosynthetic compounds nec-

81
essary for growth and cellular synthesis of microalgae. Hart et al. (1991) also showed
that the reduced growth at high salinities was due to the decrease in photosynthetic rate
in some marine microalgae. Therefore, the low photosynthetic activity can be a good
indicative to predict reduced biomass productivity under salinity stress.
3.4.4 Biochemical components
It has been reported that a broad range of salinity tolerance is a typical feature of
euryhaline microalgae which can easily acclimate to variations in external salinity due
to unique osmoregulatory characteristics, i.e., tolerance to high ionic strength and low
water activity (Hellebust, 1985). It could be possible that in the present study, slow ac-
climation and gradual increase in salinity offer the tested species sufficient time to pro-
duce osmoregulatory substances and thus they endured that increased saline environ-
ment. A number of osmotic solutes have been reported that help to adjust the internal
osmotic pressure in response to external saline stress. Kirst (1990) identified a number
of low-molecular-weight organic solutes that contribute to osmoregulation. The organic
solutes were comprised of lipids (fatty acids and glycerol), and carbohydrates (mono
and disaccharides).
Under unfavorable conditions, many algal species change their lipid biosynthetic
pathways toward the formation and accumulation of free fatty acids as the stored form
of lipids rather than the formation of structural lipid compounds (Gu et al., 2012; Pal et
al., 2011). In our study lipid accumulation in D. salina was also found to increase with
an increased saline condition which could be due to oxidative stress created by salinity
could be another reason of increased lipid content (Kan et al., 2012). However, in other
species, the lipid contents were found to increase up to the optimal salinity of those spe-
cies and again decreased while the salinity exceeded their optimal salinity which is con-
sistent with the work of Gu et al. (2012). It has been found that under salinity stress the

82
respiration rate is enhanced which is an energy consuming process and it could be pos-
sible that stored lipids in microalgae may be acting as a source of energy for increased
respiration and probably this is the reason behind low lipid content in non-optimal salin-
ities.
The intracellular carbohydrate content in selected species was found to reduce in
response to salinity increase. Even species that accumulated increased lipid in response
to high salinity showed a gradual decrease in carbohydrate content. This could be
explained in two ways. Firstly, high salinity could limit the accumulation of carbohy-
drate as suggested by Vazquez-Duhalt and Arredondo-Vega (1991). Secondly, it could
be possible that increased salinity stimulates the activation of enzymes/pathways that
break down stored carbohydrate to form an increased amount of lipid that enables the
cell to endure changes in turgor pressure, as has been shown for the halophilic
microalgae D. salina, where intracellular starch (carbohydrate) was broken down and
shunted to glycerol (lipid) biosynthesis under salt stress (Brown & Borowitzka, 1979).
This explains why reduced carbohydrate content was observed in D. salina, while lipid
content increased.
3.5 Conclusion
The ideal species to cultivate at an increased salinity should grow over a wide
salinity range and should have high biomass productivity over that range. Salinity range
and the biomass productivity results indicated that among all marine microalgae, Tetra-
selmis suecica had wider salinity range with higher biomass productivity compared to
other tested marine species. Early evidence from open raceway pond experiments
showed that the average biomass and lipid productivity of Tetraselmis sp. can be up to
36 g m-2 d-1 and 12 g m-2 d-1, respectively with 40% lipid content (Isdepsky, 2015). Be-
tween two halotolerant species, the salinity range of both species were found to be simi-

83
lar and the biomass productivity of Navicula sp. was 3% greater than Amphora sp., alt-
hough the latter would be preferred for mass culture since Navicula sp. have been
shown to achieve high growth only in winter (Indrayani, 2017). D. salina was the only
halophilic species tested which can grow at high saline conditions (>150 ppt). Hence,
the present experiment confirmed that Tetraselmis suecica, Amphora sp. and D. salina
are the best performing candidates from the marine, halotolerant and halophilic species
tested as they offer broad salinity range with high biomass productivity. Besides, it
would be possible to maintain the continuous high biomass production by cultivating
these selected marine, halotolerant and halophilic species one after another when the
salinity in the open pond increased.
This is the first study comparing the effect of agradual increase in salinity on saline
microalgae with different salinity ranges known to be culturable in commercial scale
open raceway ponds. Our results demonstrate that 1) a cultivation strategy that
incorporates halo-acclimation (achieved by slow stepped salinity increase) results in an
expanded salinity range for all strains, 2) the extended salinity ultimately leads to
improved biomass productivity over a range of saline conditions likely to be
encountered in open raceway ponds that utilize sea water for cultivation and evaporative
volume top-up, 3) under salt stressed conditions, microalgae used to sacrifice their
biomass productivity as the cells are trying to protect themselves from osmotic stress
(created by high salt concentration) rather than cell division, 4) based on the results of
the present experiment (mainly salinity range and biomass productivity), Tetraselmis
suecica (as marine), Amphora sp. (as halotolerant) and D. salina (as halophilic) would
be the best combination for continuous biomass production using the whole salinity
spectrum. Importantly, this work provides a template for the continuous cultivation of

84
different saline microalgae from low salinity up to salt saturation likely to be encoun-
tered in large-scale open raceway ponds.

85
Chapter 4 Effect of Incremental Increase in Salinity on Fu-
coxanthin Production
4.1 Introduction
In Chapter 3, the effect of increased salinity on the biomass and lipid production
of six marine, two halotolerant and a halophilic microalgaewere discussed. Of them,
four marine and two halotolerant microalgae are able to produce fucoxanthin. In current
chapter, the effect of increased salinity on fucoxanthin production of four marine and
two halotolerant microalgae is discussed.
Saline microalgae are well known for their production of high-value products
such as β-carotene and omega 3 fatty acids (eicosapentaenoic acid (EPA) and do-
cosahexaenoic acid (DHA)) (Borowitzka, 2013). Recently fucoxanthin, one of the pre-
dominant pigments contained in brown saline algae, has drawn public attention due to
its wide range of bioactive properties. Reports have shown positive effects of fucoxan-
thin in inflammatory, cancer, obesity, arthritis, bone and cerebrovascular disease states
(Kim et al., 2012b). A problem with more wide spread assessment and utilization of this
compound is supply at a reasonable cost. Macroalgae (e.g., Eisenia, Laminaria,
Undaria, Sargassum) are currently the major source of fucoxanthin (Kim et al., 2012a;
Kim et al., 2012b), but recent studies have found that macroalgal fucoxanthin
production is not economically feasible due to low fucoxanthin content (0.28–2.4 mg
g−1 dry weight (DW) of culture) (Airanthi et al., 2011; Terasaki et al., 2012). However,
fucoxanthin is much more abundant in some saline microalgae, e.g., brown saline
microalgae (e.g. diatoms and haptophytes) contain about 65 times more fucoxanthin
(per gram) than macroalgae (Table 4.1) (Airanthi et al., 2011; Conde et al., 2015; Kim
et al., 2012b; Terasaki et al., 2009; Xia et al., 2013). On the other hand, microalgae of-

86
fer advantages like high biomass productivity, high tolerance to salinity, and continuous
stock supply, etc. (Fon Sing et al., 2013). Identification of more fucoxanthin producing
microalgae can expand the opportunity of selecting suitable species from a broad range
of commercial exploitation.
Table4.1Comparisonsbetweenfucoxanthincontentofsalinemicroalgaeandmacroalgae.
Macroalgae
(mgg-1ofDW)
Ref.Microalgae (mgg-1ofDW)
Ref.Publishedliterature
Cystoseirahakodatensis
1.3(Terasakietal.,2012)
Phaeodactylumtricornutum
8.55-16.52(Kimetal.,2012b)
Sargassumhorneri
2.4(Terasakietal.,2012)
Isochrysisgalbana 6.04-18.23(Kimetal.,2012b)
Sargassummuticum
0.55(Condeetal.,2015)
Chaetocerosgracilis
2.24±0.01(Kimetal.,2012b)
Undariapinnatifida
2.3(Terasakietal.,2012)
Odontellaaurita 18.47(Xiaetal.,2013)
Alariacrassifolia 0.28(Airanthietal.,2011)
Nitzschiasp. 4.92±0.1(Kimetal.,2012b)
For commercial production of microalgal biomass and products derived from
this biomass, open ponds are widely used as a sustainable cultivation system because
they are easier to build and operate than other available systems (Ugwu et al., 2008). To
be truly sustainable the open pond systems should rely on seawater thus reducing de-
pendence on a limited fresh water resource. If only seawater is used as a culture media
in open ponds, the salinity of the media will rise due to evaporation from the pond itself.
Therefore, microalgae with a wide salinity tolerance range that can sustain sufficient
biomass productivity under saline conditions require for sustainable, economical pro-
duction of fucoxanthin. To date, microalgae investigated as alternate sources of fuco-
xanthin, have been grown at, or below, normal seawater salinity levels (35 ppt) (Kim et
al., 2012a; Kim et al., 2012b). Such conditions are not representative of open pond cul-
tivation where no fresh water will be added to maintain a particular salinity, and other
abiotic factors will be uncontrolled. Thus investigating species adapted to highly saline

87
conditions should give a more realistic assessment of the potential of microalgae for
commercial fucoxanthin production in open ponds.
The organic content of saline microalgae is known to respond to changes in sa-
linity in natural seawater (Takagi et al., 2006). For example, artificial production of β-
carotene, the most common commercially produced saline microalgal pigment, is re-
ported to be positively influenced by culturing in increased salinity, as were other caro-
tene and xanthophyll pigments such as zeaxanthin (Borowitzka et al., 1990). However,
this is not a universal response for pigment production, as the same study showed that
lutein production exhibited an inverse correlation to salinity increase. Although salinity
is a key driver of microalgal productivity and pigment synthesis, surprisingly there are
no reports on the effect of salinity on fucoxanthin production in the open literature.
Therefore, it is necessary to investigate the effect of salinity on the fucoxanthin content
in saline microalgae before selection of a potential strain/s for commercialization.
Given the lack of specific information regarding the effects of open pond
cultivation conditions on fucoxanthin production in saline microalgae, the purpose of
the study was twofold: (1) to investigate the growth characteristics of marine and
halotolerant brown microalgae known to have been cultured successfully in outdoor
ponds, and; (2) to investigate the effects of salinity on fucoxanthin production in those
microalgae. Chlorophyll a and total carotenoids content were also monitored to deter-
mine if a causal link existed between Chlorophyll a and total carotenoids content and
fucoxanthin production.

88
4.2 Materials and methods
4.2.1 Species selection, culture condition, and cultivation
Four diatoms (Amphora sp., Chaetoceros muelleri, Navicula sp. and
Pheodactylum tricornutum) and two haptophytes (Chrysotila carterae and Tisochrysis
lutea (T.Iso)) from two different salinity tolerance ranges (marine and halotolerant)
were selected for this study (see Table 3.1).
4.2.2 Analytical techniques
Extraction of fucoxanthin, total carotenoids, chlorophyll a and lipids were
performed as described in Chapter 2. Pigment extraction analyses were done only for
specific saline concentrations (e.g. 35, 45, 55, 65, 75, 85, 95, 105, 115 and 125 ppt sa-
linity).
4.2.3 Statistical Analysis
One-way analysis of variance (ANOVA) and Tukey test and Pearson’s correla-
tions were conducted using Sigmaplot (version 13.0) software as described in Chapter
2.
4.3 Results
4.3.1 Production of fucoxanthin
Six different saline microalgae from two distinct salinity tolerance ranges were
selected as potential sources of fucoxanthin by published literature (Kim et al., 2012a;
Kim et al., 2012b). All saline microalgae were tested for fucoxanthin production under a
range of increasing saline conditions starting from 35 ppt up to their extreme salinity
tolerance range. Fucoxanthin content and productivity levels were found to be different
for each species at each saline concentration and ranged from 0.18 to 2.92 mg g-1 and
0.002 to 0.072 mg L-1 d-1 (of AFDW), respectively (Figure 4.1). Fucoxanthin was found

89
at all salinity levels tested in each microalga with maximum production correlated with
the maximum biomass productivity. At a low salinity level (35 ppt to 45 ppt), all marine
microalgae showed 1.04 mg g-1 to 2.92 mg g-1 (of AFDW) content. However, at 35 ppt
salinity, Navicula sp. and Amphora sp. (halotolerant species) showed 60–80% less fu-
coxanthin content than that of Chrysotila carterae (1.04 mg g-1), the lowest fucoxanthin
producer among the marine microalgae. Among the marine microalgae, Chaetoceros
muelleri showed the highest fucoxanthin content and productivity of 2.92 mg g-1 and
0.072 mg L-1 d-1 (of AFDW), respectively, at 45 ppt salinity (Table 4.2). However, the
fucoxanthin content in all marine microalgae was found to decrease at salinities > 45
ppt. For example, beyond the optimal salinity range of marine microalgae (> 45 ppt), P.
tricornutum and Tisochrysis lutea (T.Iso) had a fucoxanthin content of 0.60 ± 0.07 mg
g-1 and 0.76 ± 0.02 of mg g-1 (of AFDW) at 65 and 75 ppt, respectively, a drop in the
fucoxanthin productivity (greater than 90 %) from the optimal level (Figure 4.1).
In halotolerant microalgae, fucoxanthin content was up to 80 % less at low (<45
ppt) and high concentrations of NaCl (>105 ppt) compared to that at optimal salinity
level (Figure 4.1). However, throughout all salinity conditions, Navicula sp. contained
more fucoxanthin than Amphora sp.; but Amphora sp. showed a larger range of fuco-
xanthin productivity than Navicula sp. (Figure 4.1).

90
1
2
3
1
2
3
Fuco
xant
hin
cont
ent
(AFD
W)(m
g g-
1 )
1
2
3
1
2
3
Salinity (ppt)
Amphora sp.Navicula sp.Tisochrysis (T. Iso)P. tricornutumC. muelleri
10
20
30
40
50
60
2
4
6
8
35 40 45 50 55 35 40 45 50 55 60 65 40 50 60 70 45 60 75 90 105 120 45 60 75 90 105 1200.00
0.02
0.04
0.06
0.08
0.02
0.04
0.06
0.08
0.10
2
4
6
8
35 400.00
0.02
0.04
0.06
0.08
10
20
30
40
50
60
C. carterae
0.02
0.04
0.06
0.08
0.10
TotalCaroten
oids
prod
uctiv
ity
(AFD
W)(mgL
-1d-1
)
Chloroph
yllaconten
t(m
gg-1of
AFD
W)
Biom
assp
rodu
ctivit
y(AFD
W)(mgL
-1d-1
)Fucoxanthinp
rodu
ctivit
y
(AFD
W)(mgL
-1d-
1 )To
tal c
arot
enoi
dsco
nten
t (A
FDW
)(mg
g-1 )
Fuco
xant
hin
cont
ent
(AFD
W)(m
g g-
1 )
TotalCaroten
oids
prod
uctiv
ity
(AFD
W)(mgL
-1d-1
)
Chloroph
yllaconten
t(m
gg-1of
AFD
W)
Biom
assp
rodu
ctivit
y(AFD
W)(mgL
-1d-1
)Fucoxanthinp
rodu
ctivit
y
(AFD
W)(mgL
-1d-
1 )To
tal c
arot
enoi
dsco
nten
t (A
FDW
)(mg
g-1 )
Figure4.1.Thechangesinfucoxanthinproductivityandcontentalongwithtotalcarotenoidsproductivityandcontent,chlorophyllacontent,andbiomassproductivity(AFDW)infivedifferentsalinemicroalgaecultivatedatdifferentsalinity(from35to125ppt).mean±SE,n=4.ThemeanvaluesweretestedbyTukey’stestattheconfidencelevelofP<0.05.*SeeAppendixBfortheresultsofstatisticalanalysis.

91
Fucoxanthin production in all saline microalgae was found to be highest at salin-
ity optimal for growth conditions. A comparison of the amount of fucoxanthin for the
selected species at their optimal saline concentration was as follows: Chaetoceros
muelleri> Tisochrysis lutea (T. Iso)> P. tricornutum> Navicula sp.> Amphora sp.>
Chrysotila carterae (Table 4.2). Among the tested species, the trend of fucoxanthin
productivity at optimal saline concentration was as follows: Chaetoceros muelleri>
Tisochrysis lutea (T. Iso) ≈ Navicula sp. ≈ Amphora sp.> P. tricornutum> Chrysotila
carterae (Table 4.2). There was a significant difference in the highest fucoxanthin con-
tent and productivity between Chaetoceros muelleri and Chrysotila carterae (P-value
0.009, 0.005, respectively). Additionally, fucoxanthin content in Chaetoceros muelleri
and Amphora sp. was significantly different (P-value 0.03). The results indicate that,
among marine species, Chaetoceros muelleri contained the most fucoxanthin and had
the highest productivity.
Table4.2Thesalinitygrowthrangeoffollowingfucoxanthinproducingsalinemicroalgaeandfucoxanthinproductionatoptimalsalinity(dataaremean±SE).
SalinemicroalgaeSalinity
growthrange(ppt)
Optimalsalinity(ppt)
Maximumamountoffucoxanthin
(mgg-1ofAFDW)
Maximumfucoxan-thinproductivity
(mgL-1d-1ofAFDW)Chrysotilacarterae 35-43 35 1.04±0.01 0.024±0.001Chaetocerosmuelleri 35-55 45 2.92±0.03 0.072±0.003
Pheodactylumtricornutum 35-65 45 1.87±0.03 0.041±0.003
Tisochrysislutea(T.Iso) 35-75 45 2.05±0.07 0.055±0.002
Naviculasp. 35-125 75 1.49±0.13 0.054±0.006Amphorasp. 35-125 85 1.21±0.18 0.53 0.008
4.3.2. Effect of salinity on biomass productivity and pigment content
The biomass productivity results are showed in Chapter 3. In all tested species,
biomass productivity increased to a maximum within the defined optimal salinity toler-
ance level of the individual species and then decreased once the salinity level exceeded
the optimal concentration range. Among all species studied, the halotolerant species

92
showed higher biomass productivity (37.3 and 47.2 mg L-1 d-1 (of AFDW) for Navicula
sp. and Amphora sp., respectively) than the marine species (Figure 4.1). Among the
marine microalgae, Tisochrysis lutea (T. Iso) showed the highest biomass productivity
of 26.9 mg L-1 d-1 (of AFDW) at 45 ppt salinity (Figure 4.1).
With a few exceptions, the chlorophyll a and total carotenoids content in all se-
lected species were strongly correlated with biomass productivity (Appendix B). Except
for the halotolerant species, all microalgae produced the highest amount of chlorophyll
a and total carotenoids at maximum biomass productivity (Figure 4.1). Among the ma-
rine species, the highest chlorophyll a and carotenoids content were recorded in P.
tricornutum and Chaetoceros muelleri, respectively. Between two halotolerant species,
Amphora sp. showed higher chlorophyll a content than Navicula sp., while Navicula sp.
showed higher total carotenoids than that of Amphora sp. (Figure 4.1).
Fucoxanthin productivity was also found to be strongly correlated with biomass
productivity in each species (correlation coefficient varied from 0.83 to 0.98 with a P
value <0.5) (Appendix B). Similarly, the productivity of total carotenoids was strongly
related to fucoxanthin productivity (correlation coefficient varied from 0.79 to 0.98 with
a P value <0.5) (Appendix B). However, except for Chaetoceros muelleri and Ampho-
ra sp., the chlorophyll a content in all selected species was strongly correlated with fu-
coxanthin content (correlation coefficient varied from 0.73 to 0.84 with a P value <0.5)
(Appendix B).
4.4 Discussion
There have been limited studies on the overall fucoxanthin content of microal-
gae. This study represents the first report of fucoxanthin content and productivity of
Chrysotila carterae, Chaetoceros muelleri, Amphora sp., and Navicula sp. While

93
comparing the amount of fucoxanthin (extracted using acetone) in P. tricornutum and
Tisochrysis lutea (T.Iso) (1.87 and 2.05 mg g−1 of AFDW at 45 ppt salinity,
respectively) with published literature, it was noted that the quantities measured in this
study were ~4 times lower than those previously reported by Kim et al. (2012b). Com-
parison of microalgal pigment concentrations with data published in the open literature
can be extremely difficult as a universal solvent, or even process, for extraction of
pigments, does not exist (Hashihama et al., 2010). The extraction efficiency is
dependent on sample pre-treatment (e.g. wet/lyophilised, treated with liquid nitrogen),
growth phase of particular species and strain (Kim et al., 2012a), cell wall structure
(Buffan-Dubau & Carman, 2000; Macías-Sánchez et al., 2009; Schumann et al., 2005);
extraction time, solvent utilized, and extraction method employed (e.g. accelerated/non-
accelerated, sonication). Even data concerning the solvent utilized in more traditional
solvent extraction methods can be contradictory. For example, Kim et al. (2012a)
showed ethanol was the most efficient solvent with which to extract P. tricornutum. Xia
et al. (2013) found that using methanol as an extraction solvent produced a higher yield
than both ethanol and acetone but the differences in yield were much smaller. In con-
trast, both Shannon and Abu-Ghannam (2017) and Kim et al. (2012b) have reported that
acetone produced higher yields than ethanol, methanol, DMSO, hexane, or ethyl ace-
tate. This diversity in approaches is highlighted in Cuellar- Bermudez et al. (2015) re-
view on the extraction of high-value metabolites from microalgae. The solvent issue
could be related to the fact that algal pigments have differing polarities and while one
solvent works well for, say, β-carotene, it won’t work well for fucoxanthin (Hashihama
et al., 2010). A number of authors who are focused on the use of microalgal pigment
profiles for taxonomic purposes are beginning to advocate the use of mixed solvents
containing dimethyl formamide (DMF) for pigment extraction (e.g. Suzuki and
Ishimaru (1990) and Suzuki et al. (2015)) suggesting a methanol:acetone:DMF:water

94
mixture for efficient and stable extraction of all pigments. Still, no large-scale studies
are looking at sample pre-treatment, extraction process, extraction solvent, and across
numbers of species. Acetone was utilized as in this study as is known as a robust
extraction solvent for most photosynthetic pigments (Abu-Rezq et al., 2010; del Pilar
Sánchez-Camargo et al., 2017; Jeffrey & Humphrey, 1975; Pasquet et al., 2011a;
Wiltshire et al., 2000) and provided a single sample preparation and extraction protocol
across all species examined.
Both Kim et al. (2012b) and Carreto and Catoggio (1976) have also noted that
minor changes in abiotic culture conditions, or even the origin of the microalgal species,
can change pigment composition and concentration, making a direct comparison be-
tween studies even more difficult. For example, Kim et al. (2012a) and Kim et al.
(2012b) reported that P. tricornutum and I. galbana from two different origins had dif-
ferences of up to 300 % in the fucoxanthin content in different strains of the same spe-
cies.
A rough comparison of the fucoxanthin content of the species cultured in this
work with that of Kim et al. (2012a) and Kim et al. (2012b) could be achieved by
simply taking their extraction efficiencies for acetone and ethanol and scaling our data
(multiply by 4), resulting in fucoxanthin concentrations ranging from 0.32 – 11.68 mg
g-1. However, such a comparison is not particularly robust given the arguments present-
ed above.
Chaetoceros muelleri was found to contain the highest amount of fucoxanthin
(2.92 ± 0.03 mg g-1 of AFDW, at 45 ppt, acetone extraction) among all tested species
and the concentration is larger than that reported for the related species Chaetoceros
gracilis (2.24 ± 0.01 mg g-1 of DW) (Kim et al., 2012b) and compares favourably with

95
the fucoxanthin content of other high yielding microalgae reported (Buffan-Dubau &
Carman, 2000; Kim et al., 2012a; Kim et al., 2012b). This suggests that exploring other
species within the genus Chaetoceros may unveil high fucoxanthin yielding microalgae.
Subsequent to the completion of the analysis in the present study, Guo et al.
(2016) have reported that light irradiance may also have an effect on fucoxanthin con-
tent, with Cyclotella cryptica having highest concentrations at low light intensity (10 to
30 µ mol photons m-2 s-1). The literature may represent another factor that needs to be
taken into account when optimizing culture conditions for fucoxanthin production from
microalgae.
At the optimal saline condition, fucoxanthin content was found to be higher in
marine microalgae than in halotolerant species. On the other hand, the biomass produc-
tivity of halotolerant microalgae was almost double that of the marine species. This
suggests that the absolute amount of fucoxanthin produced would be similar whether
using the best performing marine or halotolerant species. Thus Chaetoceros muelleri
and Amphora sp. would be suited to commercial exploitation. In fact, halotolerant spe-
cies may have greater potential as they have a wide salinity tolerance range (>35 ppt to
<125 ppt) more typical of what would be expected in commercial outdoor ponds. Un-
fortunately, a comparison of biomass productivity with that of previous work (Kim et
al., 2012a; Kim et al., 2012b) has not been possible as those studies don’t appear to con-
tain sufficient data to calculate biomass productivity.
Fucoxanthin is found in thylakoids as part of a fucoxanthin-Chl a- protein com-
plex where it acts as an accessory light harvesting pigment (Jin et al., 2003; Kim et al.,
2012a). Caron et al. reported that fucoxanthin was able to transfer photosynthetic ener-
gy and it also helped marine brown algae to survive in changing environmental condi-

96
tions (Caron et al., 1996). In this experiment, it was found that fucoxanthin content in
selected species had a direct relationship to chlorophyll a content and biomass produc-
tivity (Appendix B). Not surprisingly, fucoxanthin content and productivity was related
to the total carotenoid content and productivity (Appendix B), as it is the major carote-
noid in brown microalgae (Kim et al., 2012a).
Based on the results of the present experiment, it can be concluded that Chae-
toceros muelleri (from the marine species) and Amphora sp. (from the halotolerant
species) were the best fucoxanthin producers. Additionally, it is clear that halo-
adaptation and optimal salinity concentration positively affect the fucoxanthin content
of saline microalgae as biomass productivity was found to be higher at optimal salinity.
4.4.1 Potential advantages of microalgae over current (ma-croalgal) production
Due to simpler harvesting methods, marine brown seaweeds (e.g., Eisenia, Cys-
toseira, Fucus, Laminaria, Undaria, Sargassum) are the most common source of fuco-
xanthin at present (Kim et al., 2012a; Terasaki et al., 2012). On the other hand, biomass
recovery process is a challenge in microalgal biomass production process as the cell
size are very small (3–30 µm diameter), cultures are relatively dilute (< 0.5 kg m−3 dry
biomass) and large volume of culture needs to be processed for biomass recovery
(Molina Grima et al., 2003). However, the cost of fucoxanthin dietary supplements de-
rived from this source is approximate $US 0.6 per capsule or soft gel, a price the market
is not willing to accept (Wu et al., 2016). Clearly, microalgae can produce much greater
concentrations of fucoxanthin than macroalgae (up to about 8 fold) (Table 4.1), suggest-
ing that microalgae may be a viable alternative source of this nutraceutical-like pigment
(Airanthi et al., 2011). Microalgae also have advantages regarding greater biomass
productivity than macroalgae – a doubling of biomass per day for microalgae vs. 3%

97
biomass increase per day for macroalgae and macroalgal growth is seasonally depend-
ent resulting in interruptions to feedstock requirements (Borowitzka & Moheimani,
2013b; Zou, 2005). Macroalgae require approximately nine (9) months to reach a har-
vestable size (Aitken et al., 2014), but fucoxanthin producing microalgae can readily
adapt to the conditions present in commercial microalgal cultivation resulting in contin-
uous production throughout the year (Figure 4.2). Large scale macroalgae cultivations
also experience the issue like contamination (Lawton et al., 2017). Thus microalgae
ensure the availability of feedstock for fucoxanthin over macroalgae.
Figure4.2SalinityincreaseinthreepotentialmicroalgaecultivationregionsinWA(basedontheevaporationandrainfallrate)(SeecalculationinAppendixB).
Another major advantage offered by brown saline microalgae is that they grow,
and are productive, over a wider range of salinity (>35 ppt to <125 ppt) than macroal-
gae (Steinke & Kirst, 1996). This salinity range is particularly beneficial when saline
microalgae are cultivated in open raceway ponds using only seawater (where salinity
35
55
75
95
115
135
1 51 101 151 201 251
Salin
ity(ppt)
Days
KarrathaGeraldtonPerth

98
will gradually increase due to evaporation) and makes it possible to get continuous fu-
coxanthin production over the period without having to maintain a culture within a nar-
row salinity range. Maintenance of a particular salinity in a commercial system can be
quite expensive. Obviously, if a particular salinity needs to be maintained, either fresh
water has to be added to dilute the salt concentration or the cultivation may need to be
started with fresh media. If the latter occurs, any remaining old media, which still con-
tains a lot of nutrients, would be wasted.
Both fresh water and nutrients are limiting and expensive resources, and if it is
not possible to make the best use of these assets, the production cost will be
subsequently increased. Therefore, culturing microalgae with only seawater (without
maintaining salinity control) and nutrient recycling (to reduce loss) could make the
whole production process cost-effective. Therefore, this type of cultivation should be
started with marine or low saline species and when salinity increases due to evaporation
and nutrient recycling, the marine species will be replaced by halotolerant species
(Ishika et al., 2017a). The outcomes of the present study showed that Chaetoceros
muelleri was able to grow and produce fucoxanthin between 35 ppt and 55 ppt salinity.
Amphora sp. showed to grow well at salinities >55 ppt. In a potential co-cultivation,
Amphora sp. could be introduced into Chaetoceros muelleri culture system when cul-
ture salinities reached 55 ppt. With the gradual increase in salinity, Chaetoceros
muelleri culture will be replaced by Amphora sp. Such a cultivation strategy should
reduce the cost related to the complete harvest of Chaetoceros muelleri culture from
the cultivation system and also help to maintain continuous biomass productivity with-
out a drastic fall in biomass production rate. This cultivation strategy can also offer con-
tinuous production of fucoxanthin without any addition of fresh water and minimal loss
of nutrients over the wide range of salinity (35 ppt to 125 ppt).

99
In a large-scale cultivation process (semi-continuous cultivation coupled with
nutrient recycling technique) it is likely that nutrient levels will increase gradually and
failure to recycle the media will cause up to 95% of nutrient loss (Ishika et al., 2017a).
Studies on similar microalgae that have utilised recycling of culture media have shown
no negative effect on biomass productivity (Fon Sing et al., 2014; Moheimani, 2016), in
fact, there may be an increase (Fon Sing et al., 2014), provided that the recycled media
is settled overnight to remove cell wall debris and dead cells. This particulate matter
may contain growth inhibitors, and removal of these is essential in a cultivation system
relying on media recycling. While it is acknowledged that the cultivation strategy
suggested above has not explicitly tested the effects of culture media recycling. Before
commercial utilization of such a strategy, the bioavailability of nutrients at elevated
salinity needs to be specifically addressed.
The response of the microalgae to the halo-acclimation strategy described indi-
cate that, in a system that relies only on seawater and recycled nutrients, halotolerant
species will come to dominate the culture as salinity increases and biomass productivity
will be maintained across the entire salinity range experienced.
Considering the advantages of 1) higher biomass productivity, 2) higher growth
rate, 3) higher fucoxanthin content and productivity, 4) accessibility to biomass year
round and, 5) higher tolerance to increased saline conditions this study and others (Wu
et al., 2016; Xia et al., 2013) suggest that saline microalgae, rather than macroalgae,
should be utilized for commercial fucoxanthin production.
4.5 Conclusions
While the potential of saline microalgae as an economic source of fucoxanthin
has been acknowledged, challenges in production still exist regarding finding species

100
and strains with significant fucoxanthin content and optimizing conditions for maxi-
mum pigment production. In this study, four new fucoxanthin containing microalgae
(Chaetoceros muelleri, Chrysotila carterae, Amphora sp. and Navicula sp.) were
identified. The fucoxanthin content of these and two additional species were monitored
over a range of salinities from 35 ppt up to 125 ppt to determine suitability for incorpo-
ration into current commercial microalgal culture conditions. Halotolerant species pro-
duced fucoxanthin over much greater salinity range than marine only species.
Fucoxanthin was directly correlated with biomass productivity suggesting that
manipulation of factors that are likely to increase chlorophyll a production, e.g., light
intensity/length/wavelength and/or maximizing biomass, are likely to result in increased
fucoxanthin concentration. Advantages for microalgae regarding biomass productivity,
continuous culture and high salinity tolerance suggest that these species could be
exploited for commercial fucoxanthin production.

101
Chapter 5 Co-cultivation and Stepwise Cultivation for
Biomass and Lipid Production
5.1 Introduction
Results of Chapter 3 showed that it is possible to grow microalgae from sea-
water salinity level (35 ppt NaCl) up to salt saturation condition (233 ppt NaCl) and to
maintain high microalgal biomass and lipid at the optimal salinity range. However, the
optimal salinity range of most marine, halotolerant and halophilic microalgae is not
continuous, i.e., there are non-optimal or intermediate salinity zones between the opti-
mal salinity ranges where the biomass productivity is found to be low (Araujo et al.,
2011). Hence, the focus of this chapter is to maintain high biomass and lipid productivi-
ty at the intermediate salinity zone using a sustainable, economic and eco-friendly culti-
vation method.
To maintain high biomass and lipid productivity at the intermediate salinity
zone, co-cultivation method was taken into consideration as it has already been
acknowledged by scientists to improve overall biomass and lipid in microalgae culture.
For example, Novoveská et al. (2016) cultivated Dunaliella sp. and Phaeodactylum
tricornutum together to produce high biomass. Mingazzini and Palumbo (2015) co-
cultivated Dunaliella tertiolecta and Phaeodactylum tricornutum to produce a high
amount of lipid. Therefore, co-cultivation of marine and halotolerant; and halotolerant
and halophilic microalgae could potentially be a viable way to produce high biomass
and lipid at the intermediate salinity range of marine and halotolerant; and halotolerant
and halophilic microalgae (Figure 5.1).
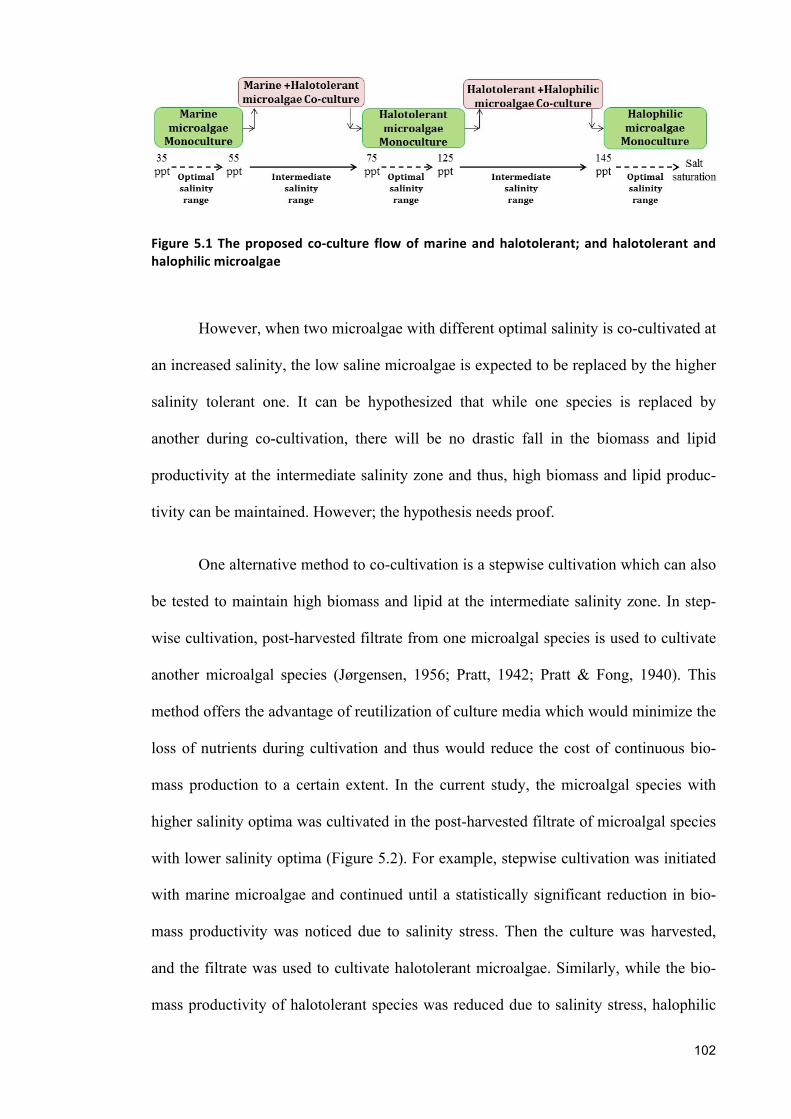
102
Figure5.1Theproposed co-culture flowofmarineandhalotolerant; andhalotolerantandhalophilicmicroalgae
However, when two microalgae with different optimal salinity is co-cultivated at
an increased salinity, the low saline microalgae is expected to be replaced by the higher
salinity tolerant one. It can be hypothesized that while one species is replaced by
another during co-cultivation, there will be no drastic fall in the biomass and lipid
productivity at the intermediate salinity zone and thus, high biomass and lipid produc-
tivity can be maintained. However; the hypothesis needs proof.
One alternative method to co-cultivation is a stepwise cultivation which can also
be tested to maintain high biomass and lipid at the intermediate salinity zone. In step-
wise cultivation, post-harvested filtrate from one microalgal species is used to cultivate
another microalgal species (Jørgensen, 1956; Pratt, 1942; Pratt & Fong, 1940). This
method offers the advantage of reutilization of culture media which would minimize the
loss of nutrients during cultivation and thus would reduce the cost of continuous bio-
mass production to a certain extent. In the current study, the microalgal species with
higher salinity optima was cultivated in the post-harvested filtrate of microalgal species
with lower salinity optima (Figure 5.2). For example, stepwise cultivation was initiated
with marine microalgae and continued until a statistically significant reduction in bio-
mass productivity was noticed due to salinity stress. Then the culture was harvested,
and the filtrate was used to cultivate halotolerant microalgae. Similarly, while the bio-
mass productivity of halotolerant species was reduced due to salinity stress, halophilic

103
microalgae were cultivated in the post-harvested filtrate of halotolerant microalgae as
shown in Figure 5.2.
Figure5.2Theproposedstepwisecultureflowofmarine,halotolerantandhalophilicmicro-algae
To the best of my knowledge, there are no previous studies dealing with the
continuous production of saline microalgae using co-cultivation or stepwise cultivation
under constant salinity increase. The overarching aim of this study was to investigate
the growth characteristics of marine, halotolerant and halophilic microalgae during co-
cultivation and stepwise cultivation.
5.2 Materials and methods
5.2.1 Species selection, culture condition, and cultivation
Tetraselmis suecica, marine microalga; Amphora sp., halotolerant microalga and
Dunaliella salina, halophilic microalga were selected based on the outcomes of Chapter
3.
During monoculture and stepwise culture, T. suecica, Amphora sp. and D. salina
were cultivated using the same culture media as described in Chapter 2. In both co-
cultures, F+Si media was used. The same cultivation conditions were used for mono,
co- and stepwise culture as described in Chapter 2 except for the salinity.

104
Two different salinity ranges were maintained for two sets of co-cultivation as
summarized in Figure 5.3. Co-culture of marine and halotolerant microalgae, i.e., T.
suecica and Amphora sp. was started from 55 ppt and co-culture of halotolerant and
halophilic microalgae, i.e., Amphora sp. and D. salina was initiated from 125 ppt. Both
cultivations were continued until one species was completely replaced by another.
It is also noteworthy that T. suecica and Amphora sp. were adapted to 55 ppt sa-
linity and Amphora sp. and D. salina were adapted to 125 ppt salinity for more than 2
weeks prior to start the experiment. Monoculture of each species was grown as a con-
trol. The monocultures were grown within the same salinity range as co-cultures. For
monoculture and co-culture, the initial cell density was maintained 6-10 × 104 cells
mL−1.
Figure 5.3 Co-culture betweenmarine and halotolerant microalgae; and halotolerant andhalophilicmicroalgaeattheirintermediatesalinityzone
For stepwise cultivation, Amphora sp. was grown at 69 ppt salinity in the filtrate
of T. suecica (Figure 5.4). Before cultivating Amphora sp., the culture of T. suecica was
harvested, and the culture media was filtered using Advantec filter paper (diameter: 47
mm, pore size: 0.45 µm). Then the filtrate was reused for the cultivation of Amphora sp.
Using the same procedure, D. salina was cultivated in the filtrate of Amphora sp. at 129
ppt (after harvesting the culture of Amphora sp. at 129 ppt) (Figure 5.4). Stepwise culti-
vation of Amphora sp. and D. salina were continued until a significant increase in bio-

105
mass productivity was achieved. The initial cell density in stepwise culture was also
maintained 6-10 × 104 cells mL−1.
Figure5.4Stepwisecultureattheintermediatesalinityzone
The harvesting procedure and time was identical in mono, co- and stepwise cul-
ture as outlined in Chapter 2. The harvested biomass from mono, co- and stepwise cul-
tures was used for measuring biomass productivity, cell number, cell volume, lipid
content, and productivity. All experiments were carried out in four replicates.
5.2.2 Analytical techniques
Determination of cell number, cell volumes, biomass productivity, maximum
quantum yield and extraction of lipids were performed using the methods described in
Chapter 2.
Cell number, cell volumes, biomass productivity and maximum quantum yield
determination,were done for all available samples. Lipid extraction analyses were done
only for specific saline concentrations (e.g. 55, 59, 61, 65, 69, 71 and 75 ppt salinity for
T. suecica and Amphora sp. mono, co- and stepwise culture; 125, 129, 131, 135, 139,
141 and 145 ppt for Amphora sp. and D. salina mono and co-culture and 125, 129, 131,
133 and 135 ppt for Amphora sp. and D. salina stepwise culture).

106
5.2.3 Statistical Analysis
One-way analysis of variance (ANOVA) and Tukey test was conducted as de-
scribed in Chapter 2.
5.3 Results
5.3.1 Co-culture
Chapter 3 results showed that T. suecica and Amphora sp. usually produce high
biomass and lipid between salinity range 35 and 55 ppt; and 75 and 125 ppt, respective-
ly. Therefore, the co-culture of T. suecica and Amphora sp. was started from 55 ppt
until all cells of T. suecica was replaced by Amphora sp. At 75 ppt no cells of T.
suecicawas observed in culture media.
The outcomes of Chapter 3 also showed that Amphora sp. produced low biomass
at salinities above 125 ppt. To maintain high biomass the co-culture of Amphora sp. and
D. salina was initiated from 125 ppt and continued until 145 ppt because at 145 ppt
salinity no Amphora sp. cell was found in culture media. The results are shown below:
5.3.1.1 T. suecica and Amphora sp. co-culture
Overall biomass productivity of co-culture between T. suecica and Amphora sp.
and that of their monocultures was shown in Figure 5.5. The overall biomass produc-
tivity of T. suecica and Amphora sp. co-culture was 28 mg L-1 d-1 and no statistically
significant differences were observed between the biomass productivities of T. suecica
and Amphora sp. monocultures and their co-culture (One-way ANOVA, P<0.05).
In co-culture, the cell density of T. suecica was found high (8.6 x10⁵ cells mL-1)
at 55 ppt which was decreased by 45% at 57 ppt (4.8 x10⁵ cells mL-1) followed by a
gradual decrease up to 73 ppt and at 75 ppt no cell of T. suecica was seen in co-culture
(Figure 5.5). However, at the same salinity range (between 55 to 75 ppt), the overall cell

107
density of T. suecica monoculture was found 6.2 x10⁵ cells mL-1 which was significant-
ly different than that of T. suecica in co-culture (One-way ANOVA, P<0.05) (Figure
5.5). Similarly, the average cell density of Amphora sp. in co-culture was found to be
20% less than that of Amphora sp. in monoculture (One-way ANOVA, P<0.05) (Figure
5.5).
While it comes to cell volume, no significant differences in cell volume of T.
suecica in co-culture and monoculture were observed (One-way ANOVA, P<0.05) and
in both cultures the cell volume was found to be reduced with increased salinity (Figure
5.5). The overall cell volume of Amphora sp. in co-culture was also found to be similar
to that of monoculture between salinity 55 and 75 ppt. However, the changing pattern in
Amphora sp. cell volume in co-and monoculture was different as shown in Figure 5.5.
The maximum quantum yield (Fv/Fm) in co-culture and T. suecica monoculture
was found to be reduced with the increased salinity (Figure 5.5); however, in both cul-
tures Fv/Fm values were found to be higher than 0.6. On the other hand, Fv/Fm value in
Amphora sp. monoculture was found to be almost stable (0.65) throughout the period of
increased salinity.
The variations in lipid content and productivity are summarized in Figure 5.5.
No significant differences were observed between lipid content in co-culture and T.
suecica and Amphora sp. monocultures. Unlike lipid content, T. suecica monoculture
showed similar overall lipid productivity to that of co-culture (Figure 5.5). However,
the lipid productivity in Amphora sp. monoculture was found 23% higher than that of
co-culture (One-way ANOVA, P<0.05) (Figure 5.5).

108
55 60 65 70 75Bio
mas
s P
rodu
ctiv
ity(m
g L-
1 d-
1 of
AFD
W)
0
10
20
30
40
55 60 65 70 750
10
20
30
40
Lipi
d P
rodu
ctiv
ity(m
g L-
1 d-
1 of
AFD
W)
68
10121416
6810121416
Tetraselmis suecica monoculture
Amphora sp. monoculture
55 60 65 70 75
Cel
l Num
ber
(cel
ls m
L-1 )
2e+5
4e+5
6e+5
8e+5
1e+6
2e+5
4e+5
6e+5
8e+5
1e+6
Cel
l Vol
ume
(um
3 )
400600800
10001200
40060080010001200
Salinity (ppt)
0.6
0.7
0.8
0.6
0.7
0.8
F v/F
m
20
30
40
50
60
20
30
40
50
60
Lipi
d C
onte
nt(%
of A
FDW
)
Bio
mas
s P
rodu
ctiv
ity(m
g L-
1 d-
1 of
AFD
W)
Lipi
d P
rodu
ctiv
ity(m
g L-
1 d-
1 of
AFD
W)
Cel
l Num
ber
(cel
ls m
L-1 )
Cel
l Vol
ume
(um
3 )F v
/Fm
Lipi
d C
onte
nt(%
of A
FDW
)
Co-culture
Figure5.5Biomassproductivity,cellvolumeandcellnumber,maximumquantumyieldandlipidcontentandproductivityinmonocultureandco-cultureofT.suecicaandAmphorasp.betweensalinity55pptand75ppt.ThefilledcircleindicatesT.suecicaandtheblankcircleindicatesAmphorasp.

109
5.3.1.2 Amphora sp. and D. salina co-culture
The overall biomass productivity of Amphora sp. and D. salina co-culture was
19.2 mg L-1 d-1, and no significant difference was observed between the biomass
productivity of Amphora sp. and D. salina co-culture and their monocultures (Figure
5.6).
The overall cell density of D. salina in co-culture was found 5.2 x10⁵ cells mL-1
which was similar to the overall cell density of D. salina in monoculture (Figure 5.6).
Conversely, the cell density of Amphora sp. in co-culture was 105 cells mL-1 at 125 ppt
salinity, which was approximately 4 times less than that of Amphora sp. in monoculture
at the same salinity. Between salinity 125 and 145 ppt, the cell density of Amphora sp.
in co-culture was found to be decreased continuously with increased salinity and at 145
ppt salinity no cell of Amphora sp. was observed in co-culture (Figure 5.6). The overall
cell density of Amphora sp. in co-culture was found significantly different than that of
Amphora sp. in monoculture (One-way ANOVA, P<0.05) (Figure 5.6).
In co-culture, the cell volume of both D. salina and Amphora sp. was found to
be reduced with increased salinity. The same reduction trend was also observed in
monoculture of D. salina and Amphora sp. (Figure 5.6).
The combined Fv/Fm value of D. salina and Amphora sp. in co-culture was
found 0.73 ±0.004, which is almost similar to that of D. salina in monoculture. Con-
versely, Amphora sp. monoculture showed a gradual reduction in Fv/Fm values under
increased saline condition; however, the values were always above 0.6 throughout the
period of increased salinity (Figure 5.6).
In co-culture, the overall lipid content was 25% of ash-free dry weight (AFDW)
which was significantly less (by 21% and 40%) than the lipid content of both D. salina
and Amphora sp. monoculture, respectively. Similarly, overall lipid productivity in co-

110
culture was significantly less (approximately by 40%) than that of D. salina monocul-
ture (One-way ANOVA, P<0.05) (Figure 5.6). However, Amphora sp. monoculture
showed similar lipid productivity to that of co-culture.
125 130 135 140 1450
10
20
30
40
125 130 135 140 1450
10
20
30
40
125 130 135 140 145
369
1215
3691215
Co-culture Amphora sp. monoculture
Bio
mas
s P
rod
uct
ivity
(mg
L-1
d-1
of A
FD
W)
Lip
id P
rod
uct
ivity
(mg
L-1
d-1
of A
FD
W)
Bio
mas
s P
rod
uct
ivity
(mg
L-1
d-1
of A
FD
W)
Lip
id P
rod
uct
ivity
(mg
L-1
d-1
of A
FD
W)
Dunaliella salina monoculture
3.00e+5
6.00e+5
9.00e+5
1.20e+6
3.0e+5
6.0e+5
9.0e+5
1.2e+6
200
400
600
800
1000
200
400
600
800
1000
Cel
l Nu
mb
er
(cel
ls m
L-1
)C
ell V
olu
me
(um
3 )
Cel
l Nu
mb
er
(cel
ls m
L-1
)C
ell V
olu
me
(um
3 )
Salinity (ppt)
F v/F
m
0.6
0.7
0.8
0.6
0.7
0.8
F v/F
m
20
30
40
50
60
20
30
40
50
60
Lip
id C
on
ten
t(%
of A
FD
W)
Lip
id C
on
ten
t(%
of A
FD
W)
Figure5.6Biomassproductivity,cellvolumeandcellnumber,maximumquantumyieldandlipidcontentandproductivityinmonocultureandco-cultureofAmphorasp.andD.salinabetweensalinity125pptand145ppt.ThefilledcircleindicatesD.salinaandtheblankcircleindicatesAmphorasp.
111
Although the biomass productivity in both co-cultures was not significantly dif-
ferent than that of monocultures; however, the lipid productivity in D. salina and Am-
phora sp. co-cultures was found to be significantly less than the lipid productivity of
Amphora sp. monocultures. Similarly, D. salina monoculture showed higher lipid
productivity than that of D. salina and Amphora sp. co-culture. Hence, co-cultivation
was not the best cultivation method to achieve high lipid productivity at the intermedi-
ate salinity zone under increased saline condition. To get high lipid productivity at the
intermediate salinity zone, stepwise cultivation could be an option. However, it is nec-
essary to select the ideal saline condition to start cultivating the second species during
stepwise cultivation. The biomass productivity results of mono and co-culture would
help to find out the ultimate salinity to start with.
5.3.2 Stepwise culture
5.3.2.1 T. suecica Amphora sp. stepwise culture
It is seen from Figure 5.5 that T. suecica monoculture showed high biomass
productivity (8% and 14% higher than that of Amphora sp. monoculture and; T. suecica
and Amphora sp. co-culture, respectively) at salinities below 69 ppt. On the other hand,
the biomass productivity of Amphora sp. was high above 69 ppt. Therefore, to maintain
high biomass productivity T. suecica (in monoculture) was grown between 55 and 69
ppt, and then harvested, and the filtrate was used to culture Amphora sp. (in monocul-
ture) above 69 ppt.
During stepwise cultivation, the overall biomass productivity was found to be
increased by 10% in comparison to that of T. suecica and Amphora sp. co-culture (One-
way ANOVA, P 0.023) (Figure 5.7). The overall cell density in stepwise culture was
found similar to that of T. suecica and Amphora sp. in monoculture and significantly
different than that of co-culture (One-way ANOVA, P <0.05) (Figure 5.7). The cell

112
volume of Amphora sp. in stepwise culture was found similar to that of mono and co-
culture (Figure 5.7). Fv/Fm value in stepwise culture showed no significant difference
with co-culture or any of the monoculture and the value was above 0.6 throughout the
period of increased salinity. Additionally, in stepwise culture, the lipid content and
productivity was found approximately 26% and 30%, respectively higher than that of
co-culture (between salinity 69 and 75 ppt) (One-way ANOVA, P <0.05) (Figure 5.7).

113
55 60 65 70 750
10
20
30
40
0
10
20
30
40
Stepwise culture
T. suecica
2.0e+5
4.0e+5
6.0e+5
8.0e+5
1.0e+6
2.0e+5
4.0e+5
6.0e+5
8.0e+5
1.0e+6
400600
800
1000
1200
400600
800
1000
1200
Salinity (ppt)
Amphora sp.
0.6
0.7
0.8
0.6
0.7
0.8
F v/F
mLi
pid
Prod
uctiv
ity(m
g L-
1 d-
1 of
AFD
W)
Cel
l Num
ber
(cel
ls m
L-1 )
Bio
mas
s Pr
oduc
tivity
(mg
L-1
d-1
of A
FDW
)C
ell V
olum
e (u
m3 )
Amphora sp.
Amphora sp.
Amphora sp.
Amphora sp.
T. suecica
T. suecica
T. suecica
T. suecica 20
30
40
50
60
20
30
40
50
60Li
pid
Con
tent
(%of
AFD
W)
Amphora sp.T. suecica
F v/F
mLi
pid
Prod
uctiv
ity(m
g L-
1 d-
1 of
AFD
W)
Cel
l Num
ber
(cel
ls m
L-1 )
Bio
mas
s Pr
oduc
tivity
(mg
L-1
d-1
of A
FDW
)C
ell V
olum
e (u
m3 )
Lipi
d C
onte
nt(%
of A
FDW
)
68
10121416
6810121416
Figure5.7Biomassproductivity,cellvolumeandcellnumber,maximumquantumyieldandlipidcontentandproductivityinthestepwisecultureofT.suecicaandAmphorasp.betweensalinity55pptand75ppt.ThefilledcircleindicatesT.suecicaandtheblankcircleindicatesAmphorasp.

114
5.3.2.2 Amphora sp. D. salina stepwise culture
Amphora sp. and D. salina co-culture showed low biomass productivity at 129
ppt and above 141 ppt. If the result was compared with monoculture, it was seen that
above 141 ppt, monoculture of D. salina also showed reduced biomass productivity.
Therefore, 141 ppt was not the preferred salinity to start the stepwise cultivation with D.
salina.
Monoculture of Amphora sp. showed 16% increased biomass productivity below
129 ppt salinity in comparison to D. salina monoculture. Conversely, D. salina mono-
culture showed 45% improved biomass productivity above 129 ppt salinity than that of
Amphora sp. monoculture (Figure 5.8). Therefore, to get improved biomass productivity
in stepwise cultivation at intermediate salinity zone, Amphora sp. was cultivated from
125 ppt up to 129 ppt salinity and then D. salina was cultured in the filtrate of Amphora
sp. above129 ppt salinity.
The overall biomass productivity of stepwise culture showed no significant dif-
ferences with that of co-culture (Figure 5.8). The cell density and cell volume of D. sa-
lina in stepwise culture was found similar to that of D. salina in monoculture and co-
culture. No significant differences were also observed between the Fv/Fm value in step-
wise culture and co-culture. In stepwise culture, the overall lipid content was found
23% higher than that of co-culture (One-way ANOVA, P <0.05) (Figure 5.8). Similarly,
the lipid productivity in stepwise culture was 40% higher than that of co-culture at the
same salinity range (One-way ANOVA, P <0.05) (Figure 5.8).

115
126 129 132 1350
10
20
30
40
0
10
20
30
40
D.salina
Stepwise culture
Bio
mas
s P
rodu
ctiv
ity(m
g L-
1 d-
1 of
AFD
W)
Lipi
d P
rodu
ctiv
ity(m
g L-
1 d-
1 of
AFD
W)
Bio
mas
s P
rodu
ctiv
ity(m
g L-
1 d-
1 of
AFD
W)
Lipi
d P
rodu
ctiv
ity(m
g L-
1 d-
1 of
AFD
W)
Amphora sp.
3.00e+5
6.00e+5
9.00e+5
1.20e+6
3.00e+5
6.00e+5
9.00e+5
1.20e+6
200
400
600
800
1000
200
400
600
800
1000
Cel
l Num
ber
(cel
ls m
L-1 )
Cel
l Vol
ume
(um
3 )
Cel
l Num
ber
(cel
ls m
L-1 )
Cel
l Vol
ume
(um
3 )
Salinity (ppt)
Amphora sp.
D.salina
0.6
0.7
0.8
0.6
0.7
0.8
F v/F
m
Amphora sp.
F v/F
m
Lipi
d C
onte
nt(%
of A
FDW
)
Lipi
d C
onte
nt(%
of A
FDW
)
Amphora sp.
Amphora sp.
D.salina
D.salina
D.salina
D.salina
Amphora sp.
0
10
20
30
40
0
10
20
30
40
3
6
9
12
15
3
6
9
12
15
Figure5.8Biomassproductivity,cellvolumeandcellnumber,maximumquantumyieldandlipidcontentandproductivityinthestepwisecultureofAmphorasp.andD.salinabetweensalinity125pptand135ppt.ThefilledcircleindicatesD.salinaandtheblankcircleindicatesAmphorasp.

116
5.4 Discussion
5.4.1 Growth
In the previous chapter, I have investigated the effect of gradual salinity increase
on promising marine, halotolerant and halophilic microalgae (see Chapter 3). The re-
sults indicated that Tetraselmis suecica, Amphora sp. and Dunaliella salina could be
suitable for their respective salinity range. In the present study, two different cultivation
methods namely co-cultivation and stepwise cultivation between marine and halotoler-
ant species; as well as halotolerant and halophilic species were studied at intermediate
salinity range.
The overall cell density of T. suecica and Amphora sp. in co-culture was found
less than that of their monocultures. Similarly, the cell density of Amphora sp. in (Am-
phora sp. and D. salina) co-culture was found less than that of Amphora sp. in mono-
culture.
The continuous increase in salinity was not the reason behind low cell density,
as the reduction in cell density was only found in co-culture and not in monoculture at
the same salinity range. Therefore, the competition between cells for survival under
continuous salinity stress could be the reason for low cell density.
According to published literature, mixed culture is a common phenomenon in
nature, although studies showed that while the population of one species increased an-
other one reduced (Behrenfeld, 2011; Kheiralla et al., 2014). Early evidence reported
that some species produce growth inhibitory substances in different circumstances such
as to survive over each other or at stressed condition (Imada et al., 1991; Jørgensen,
1956; Stewart, 1974; Venâncio et al., 2017; Yingying et al., 2008). It has also been
found that the production of inhibitory substances is a common feature in algae metabo-
lism (Rice, 1954). High concentration of these substances could be inhibitory to the

117
growth of other species in a mixed culture (Pratt, 1942; Regan & Ivancic, 1984). The
growth inhibitory material such as poly phenols, cyclic sulfur compound, etc. could be
produced extracellularly or intracellularly (Körner & Nicklisch, 2002; Wium-Andersen
et al., 1982); and would affect the growth of another species during growth phase or
upon death of the cell (Hill, 2005; Jørgensen, 1956; Stewart, 1974). Most likely, the
secreted growth inhibitory material was the cause of reduced cell density in co-cultures.
Although, the individual cell density in co-culture was found to be reduced
compared to that of monocultures; however, the combined cell density in co-culture was
approximately similar to that of each monoculture. Therefore, the overall biomass
productivity between co-cultures and monocultures showed no significant differences.
On the other hand, the stepwise culture of T. suecica and Amphora sp. showed
higher biomass productivity compared to their co-culture. Increased cell density com-
pared to that of co-culture was the reason behind improved biomass productivity in
stepwise culture. However, growth inhibitory substances didn’t show any negative ef-
fect on the biomass productivity of stepwise culture. It could be possible that growth
retarding substances were absent in the filtrate as both marine and halotolerant species
were grown in monoculture, so there was no one to compete. Otherwise, if secreted any
growth inhibitory materials as a part of its metabolism, the concentration was too low to
negatively affect the growth of other species (Jørgensen, 1956). It could also be possible
that filtration helps to remove growth inhibitory materials from the culture media. In
addition, 50% dilution of the culture media after every harvest (following the semi-
continuous cultivation method), would also help to reduce the load of growth inhibitory
materials (if present) during stepwise culture.

118
5.4.2 Maximum quantum yield (Fv/Fm)
Maximum quantum yield (Fv/Fm) indicates the efficacy of a photosynthetic or-
ganism to use light for photosynthetic process. It also shows the effect of stress on pho-
tosynthetic apparatus (Cosgrove & Borowitzka, 2010). In the present study, maximum
quantum yield (Fv/Fm) of PS II photochemical process was used as a parameter to ob-
serve the stress in microalgae. Some previous works of literature also used this parame-
ter to measure physiological stress or limitations on the growth of cells (Bhola et al.,
2016; Dao & Beardall, 2016; Kromkamp & Peene, 1999; Ramanna et al., 2014). If
Fv/Fm values are higher than 0.6, it indicates that cells are not stressed or in ‘good
health’, however, any value less than 0.6 confirms the stress (Bhola et al., 2016; White
et al., 2013). Bhola et al. have reported that the Fv/Fm value decreases when cells are
stressed (Bhola et al., 2016). Ramanna et al. reported that salinity stress used to generate
very low Fv/Fm values (Kromkamp & Peene, 1999). Dao and Beardall stated that a de-
crease in maximum quantum yield of PSII is the most common approach to show PSII
impairment (Dao & Beardall, 2016). The low Fv/Fm value could result from a decrease
in photochemistry rate constant, changes at antenna level or reaction center level, and
/or increase in non-photochemical quenching (Dao & Beardall, 2016). According to the
observation of present study, the cells were not stressed in any of the cultures as the
Fv/Fm value in mono, co- and stepwise culture was found above 0.6.
5.4.3 Lipid
In both co-cultures, lipid productivity was found low compared to that of mono-
cultures. Due to low lipid content in cells, the overall lipid productivity was decreased
during co-culture. It has been shown in Chapter 3 that lipid content of every microalga
species decreased beyond their optimal salinity range. As T. suecica in T. suecica and
Amphora sp. co-culture and; Amphora sp. in D. salina and Amphora sp. co-culture was

119
cultivated beyond their optimal salinity range their lipid content and productivity de-
creased. Additionally, it could also be possible that during co-culture both the species
struggled to survive over each other rather than producing more lipids.
Conversely, both stepwise cultures showed higher lipid content and productivity
than that of co-culture. High cell density and high biomass were found to be the reason
behind high lipid content and productivity which is in accordance with Griffiths and
Harrison (2009). Sheehan et al. also showed that lipid productivity increased with in-
creased growth (Sheehan et al., 1998).
The above results suggested that stepwise cultivation is a better cultivation
method and a viable approach to produce and maintain high biomass and lipid at the
intermediate salinity zone compared to co-culture.
5.5 Conclusions
For producing low commodity like microalgal biofuel at an industrial scale un-
der continuous salinity increased condition, it is necessary to establish a cultivation
method that would ensure continuous production of high amount biomass and lipid in
that situation. Stepwise culture between T. suecica and Amphora sp. showed overall
10% extra biomass productivity and 30% higher lipid productivity than co-culture. On
the contrary, the stepwise culture of Amphora sp. and D. salina showed no significant
differences in biomass productivity; however, the lipid productivity was increased by
40% during stepwise cultivation than that of co-cultivation within the same salinity
range. Therefore, stepwise cultivation was found to be more competent, economical and
sustainable in producing high lipid than that of co-culture. The outcome of the chapter
also confirmed that high biomass and lipid production not only depends on cultivation
method but also on the ability of the desired species to produce consistently high bio-

120
mass and lipid under the increased saline condition, the interaction between species
during co-culture and the selection of the proper salinity to start the stepwise cultiva-
tion.

121
Chapter 6 Co-cultivation and Stepwise Cultivation for
Fucoxanthin Production
6.1 Introduction
The results of Chapter 4 showed that there is a positive correlation between high
biomass and high fucoxanthin production (Ishika et al., 2017b). Therefore, if the bio-
mass productivity can be maintained high during cultivation, the fucoxanthin productiv-
ity will also be high. However, the biomass and fucoxanthin productivity was found
high only at optimal salinity and low at non-optimal or intermediate salinity zone salini-
ty zone (see Figure 3.1). Therefore, to maintain high biomass at intermediate salinity
zone, fucoxanthin producing marine and halotolerant microalgae were cultivated using
co- and stepwise cultivation method based on the design of Chapter 5. There are no rec-
ords in the public literature on co-cultivation of microalgae for fucoxanthin production.
Therefore, it is necessary to investigate whether co-cultivation helps to maintain high
fucoxanthin containing biomass production in an increased saline condition. In addition,
stepwise cultivation method can also be testedin order to produce high biomass (see
section 5.3.2.1 of Chapter 5). In stepwise cultivation, halotolerant microalgae can be
cultivated in the filtrate of the marine microalgae, and it also offers a possible approach
to reutilize the culture media and thus the nutrient loss could be minimized.
The overarching aim of this study was to investigate the biomass and fucoxan-
thin productivity of marine and halotolerant microalgal species with the potential of
high fucoxanthin production using co-cultivation and stepwise cultivation strategies.

122
6.2 Materials and methods
6.2.1 Species selection, culture condition, and cultivation
Based on the results of Chapter 4, Chaetoceros muelleri, a marine microalga and
Amphora sp., a halotolerant microalga were selected for this study. The same cultiva-
tion conditions and media were used for mono, co- and stepwise culture as described in
Chapter 2.
The co-cultivation of C. muelleri and Amphora sp. was initiated from 55 ppt sa-
linity. The cultivation was carried out until one species was completely replaced by
another. It is to be noted that C. muelleri and Amphora sp. were adapted to 55 ppt salini-
ty for more than 2 weeks prior to start the experiment.
Figure6.1Theproposedco-culturebetweenC.muelleriandAmphorasp.
The stepwise cultivation of Amphora sp. was started from 59 ppt salinity in the
filtrate of C. muelleri. Before starting the cultivation with Amphora sp., C. muelleri cul-
ture was harvested, and the growth media was filtered using Advantec filter paper (di-
ameter: 47 mm, pore size: 0.45 µm). Then the filtrate was reused for the cultivation of
Amphora sp. and carried out until a significant increase in biomass productivity was
observed.

123
Figure6.2TheproposedstepwiseculturebetweenC.muelleriandAmphorasp.
Monocultures of each species were grown as a control. The cultivation of mono-
cultures of C. muelleri and Amphora sp. were grown within the same salinity range as
co-culture. The initial cell density was maintained 6-10 × 104 cells mL−1 for monocul-
ture, co-culture and stepwise culture. The harvesting procedure and time was identical
in mono, co- and stepwise cultivation as outlined in Chapter 2. The harvested biomass
from mono, co- and stepwise cultures was used for measuring biomass productivity, cell
number, cell volume, fucoxanthin and lipid productivity. All experiments were carried
out in four replicates.
6.2.2 Analytical techniques
Determination of cell number, cell volume, biomass productivity, maximum
quantum yield and extraction of lipids were performed as described in Chapter 2. Ex-
cept for extraction solvent, the same fucoxanthin extraction method was performed as
described in Chapter 2. 100% ethanol was used as the extraction solvent in the current
study in place of 100% acetone.
6.2.3 Statistical analysis
One-way analysis of variance (ANOVA), Tukey test and Pearson’s correlation
were conducted as described in Chapter 2.

124
6.3 Results
6.3.1 Co-culture
The biomass productivity of monocultures and co-cultures are summarized in
Figure 6.3. In co-culture of C. muelleri and Amphora sp. the biomass productivity de-
creased 84% when salinity increased from 55 ppt to 67 ppt. (Figure 6.3). However, at
69 ppt, the biomass productivity showed a sharp increase (85%) and reached the maxi-
mum of 30 mg L-1 d-1. The overall biomass productivity of C. muelleri and Amphora sp.
co-culture was 40% higher than C. muelleri monoculture and 38% less than
monoculture of Amphora sp. (One-way ANOVA, P<0.05) (Figure 6.3).
The cell density of C. muelleri in co-culture reduced gradually with increased
salinity, and no C. muelleri cells were observed at 69 ppt. It is to be noted that the
growth of this microalgal species in mono and co-culture was significantly different
(One-way ANOVA, P<0.05) (Figure 6.3). The cell density of Amphora sp. was also
found to be decreased gradually between 55 and 67 ppt salinity, which was opposite to
the monoculture of this microalgal species (One-way ANOVA P <0.05). When the co-
culture salinity reached to 69 ppt, the cell density of Amphora sp. started increasing and
reached to original cell density (Figure 6.3).
The specific growth rate of C. muelleri and Amphora sp. in co-culture was ap-
proximately 50% less than that of monocultures (One-way ANOVA, P<0.05). The cell
volume of C. muelleri in co-culture reduced gradually with the increased saline condi-
tion, which is approximately similar to that of monoculture of this species (Figure 6.3).
It is noteworthy that the cell volume of Amphora sp. in co-culture was smaller than that
of monoculture (One-way ANOVA, P<0.05) (Figure 6.3). The combined maximum
quantum yield (Fv/Fm) of co-culture was found above 0.6 throughout the period of in-
125
creased salinity, although the Fv/Fm value of C. muelleri monoculture was found to re-
duce with increased salinity.
In co-culture, the overall fucoxanthin productivity was found to be decreased
gradually from 55 ppt up to 67 ppt; however, at 69 ppt salinity, a 50% increase in fuco-
xanthin productivity was observed (Figure 6.3). The overall fucoxanthin productivity in
co-culture was similar to that of C. muelleri monoculture and approximately 50% less
than that of Amphora sp. monoculture (One-way ANOVA, P<0.05) (Figure 6.3).
Pearson’s correlations showed a strong positive correlation between lipid
productivity and biomass productivity in co-culture (r = 0.730, P<0.05) (Figure 6.3).
However, the overall lipid productivity in co-culture was found almost similar to that of
Amphora sp. monoculture and 45% higher than that of C. muelleri monoculture (One-
way ANOVA, P<0.05) (Figure 6.3).

126
56 58 60 62 64 66 68 7054 56 58 60 62 64 66 68 700
1020304050
56 58 60 62 64 66 68 7001020304050
Bio
ma
ss
Pro
du
cti
vit
y
(mg
L-1
da
y-1
)
5.0e+51.0e+61.5e+62.0e+62.5e+6
5.0e+51.0e+61.5e+62.0e+62.5e+6
Ce
ll d
en
sit
y(C
ell
s m
L-1
)
Salinity
5001000150020002500
5001000150020002500
Ce
ll v
olu
me
(um
3)
0.10.20.30.40.50.6
Sp
ec
ific
gro
wth
ra
te
(da
y-1
)
0.10.20.30.40.50.6
0.5
0.6
0.7
0.5
0.6
0.7
Fv
/Fm
Fv
/Fm
Sp
ec
ific
gro
wth
ra
te
(da
y-1
)
Bio
ma
ss
Pro
du
cti
vit
y
(mg
L-1
da
y-1
)
0.20.40.60.81.0
0.20.40.60.81.0
5
10
15
5
10
15
Co-cultureC.muelleri+Amphora sp.
MonocultureC. muelleri
MonocultureAmphora sp.
Fu
co
xa
nth
in
Pro
du
cti
vit
y
(mg
L-1
da
y-1
)
Lip
id P
rod
uc
tivit
y(m
gL
-1d
ay
-1)
Fu
co
xa
nth
in
Pro
du
cti
vit
y
(mg
L-1
da
y-1
)
Lip
id P
rod
uc
tivit
y(m
gL
-1d
ay
-1)
Ce
ll d
en
sit
y(C
ell
s m
L-1
)
Ce
ll v
olu
me
(um
3)
Figure 6.3 Biomass productivity, cell number, cell volume specific growth rate, maximumquantum yield (Fv/Fm), lipid and fucoxanthin productivity in monoculture, co-culture andstepwise culture at the increased saline condition. Filled circles indicate C. muelleri andblankcirclesindicateAmphorasp.

127
The study aimed to produce high biomass for producing a high amount of fuco-
xanthin; however, the overall biomass productivity in co-culture was found to be
reduced. Therefore, stepwise cultivation system was performed to find out whether it
helped to improve the overall biomass productivity at the intermediate salinity zone.
6.3.2 Stepwise culture
The proper salinity to start the stepwise cultivation was selected based on the bi-
omass productivity data of co-culture and C. muelleri and Amphora sp. monoculture. It
can be seen from Figure 6.3 that, the overall biomass productivity in co-culture and C.
muelleri monoculture was dropped by 50% at 59 ppt (15 mg L-1 d-1) from the initial
biomass productivity at 55 ppt. On the other hand, Amphora sp. monoculture showed
high biomass productivity above 59 ppt salinity. Hence, the stepwise cultivation of Am-
phora sp. was initiated from 59 ppt to keep the biomass productivity at least 15 mg L-1
d-1.
The biomass productivity of Amphora sp. in stepwise culture was similar to that
of Amphora sp. monoculture and 63% more than that of co-culture between 59 and 65
ppt salinity (One-way ANOVA, P <0.005) (Figure 6.4). Similarly, the overall cell den-
sity of Amphora sp. in stepwise cultivation was found 37% higher than that of co-
culture (One-way ANOVA, P<0.001). The variations in cell densities are summarized
in Figure 6.3 and 6.4. However, the overall specific growth rate of Amphora sp. showed
no significant differences to that of Amphora sp. in co-culture (Figure 6.4). The overall
cell volume of Amphora sp. in stepwise culture was found 20% larger than Amphora sp.
in co-culture, between 59 and 65 ppt salinity (One-way ANOVA, P<0.001) (Figure
6.4). The maximum quantum yield (Fv/Fm) of Amphora sp. in stepwise culture was
higher than 0.6 between 59 and 65 ppt salinity (Figure 6.4).

128
Pearson’s correlation showed a positive correlation between fucoxanthin
productivity and biomass productivity and specific growth rate (r = 0.819 and 0.694
respectively while P<0.05) in stepwise culture. The fucoxanthin productivity in step-
wise culture (between 59 to 65 ppt) was 46.6% higher than that of co-cultivation at the
same salinity range (One-way ANOVA, P<0.001) (Figure 6.4).
The lipid productivity in stepwise cultivation was found almost stable (12 mg L-
1 d-1) throughout the period of increased salinity from 59 to 65 ppt salinity (Figure 6.4).
However, the stepwise culture showed 54% more lipid productivity than that of co-
culture (One-way ANOVA, P<0.001).

129
56 58 60 62 64 660
1020304050
01020304050
Bio
mas
s Pr
oduc
tivity
(m
g L-
1 day
-1)
Cel
l den
sity
(Cel
ls m
L-1 )
Salinity
5.0e+51.0e+61.5e+62.0e+62.5e+6
5.0e+51.0e+61.5e+62.0e+62.5e+6
5001000150020002500
5001000150020002500
0.2
0.4
0.6
0.2
0.4
0.6
0.5
0.6
0.7
0.5
0.6
0.7
F v/F
mSp
ecifi
c gr
owth
rate
(d
ay-1
)
Fuco
xant
hin
Prod
uctiv
ity
(mgL
-1da
y-1 )
Lipi
d Pr
oduc
tivity
(mgL
-1da
y-1 )
0.20.40.60.8
0.20.40.60.8
5
10
15
5
10
15
Amphora sp.
C. muelleri
Cel
l vol
ume
(um
3 )
C. muelleri
C. muelleri
C. muelleri
C. muelleri
C. muelleri
C. muelleri
Amphora sp.
Amphora sp.
Amphora sp.
Amphora sp.
Amphora sp.
Amphora sp.
Bio
mas
s Pr
oduc
tivity
(m
g L-
1 day
-1)
Cel
l den
sity
(Cel
ls m
L-1 )
F v/F
mSp
ecifi
c gr
owth
rate
(d
ay-1
)
Fuco
xant
hin
Prod
uctiv
ity
(mgL
-1da
y-1 )
Lipi
d Pr
oduc
tivity
(mgL
-1da
y-1 )
Cel
l vol
ume
(um
3 )
Stepwise cultivation
Figure 6.4 Biomass productivity, cell density, cell volume, specific growth rate, maximumquantum yield (Fv/Fm), lipid and fucoxanthin productivity in monoculture, co-culture andstepwise culture at the increased saline condition. Filled circles indicate C. muelleri andblankcirclesindicateAmphorasp.

130
6.4 Discussion
In order to find out the most efficient cultivation method to improve the biomass
productivity of fucoxanthin containing microalgae at an intermediate salinity zone, first-
ly co-cultivation and then stepwise cultivation was performed.
The co-culture showed reduced biomass productivity under increased saline
condition. Due to overall reduced biomass productivity, the fucoxanthin productivity in
co-culture was also found low which is in accordance with Ishika et al. (2017b). Re-
duced cell density, specific growth rate, and cell volume were found to be the reason
behind low biomass productivity. As C. muelleri is a marine species, its cell density,
specific growth rate, and cell volume decreased with increased salinity which is in
accordance with the result of Chapter 3. In addition, being a marine species, C. muelleri
showed low fucoxanthin productivity at high salinity which is in accordance with Ishika
et al. (2017b). Early evidences also reported that an increased salinity beyond the
optimal salinity range affected the cell number, specific growth rate and cell volume
and thereby reduced the biomass productivity of microalgae (Bartley et al., 2013; Ben-
Amotz et al., 1985; Cho et al., 2007; Ghezelbash et al., 2008b; McLachlan, 1961; Pal et
al., 2011; Takagi et al., 2006). It could be possible that under continuously increased
salinity, both the species in co-culture were stressed as both of them struggled to sur-
vive over one another. So the cells are mostly involved to overcome that situation rather
than producing more biomass with more pigment. This explanation is also supported by
a previous study which showed that at stressed condition microalgae use most of their
energy to survive in that condition rather than an increase in biomass (Kirst, 1990).
Although the overall biomass and fucoxanthin productivity was low in co-
culture; the combined maximum quantum yield was always found above 0.6 which in-
dicated that cells were in ‘good health’ (Bhola et al., 2016; White et al., 2013). The in-

131
strument (WATER-PAM) which was used to measure Fv/Fm is unable to measure Fv/Fm
for individual species in a co-culture; rather it showed the combined value. As Amphora
sp. was growing well in co-culture, possibly that’s why the combined Fv/Fm was found
high.
Although Amphora sp. is a halotolerant microalgal species, its cell volume in co-
culture was also found to be reduced compared to monoculture. Population diversity
could be a reason of reduced cell volume in co-culture, and it is found to be negatively
correlated to cell size which is acknowledged by the study of Cermeño and Figueiras
(2008) and Finkel et al. (2010). Competition between species for survival could be an-
other reason for reduced cell volume. That’s why as soon as the cells of C. muelleri
eliminated from C. muelleri and Amphora sp. co-culture, Amphora sp. increased its cell
volume.
If salinity was the only reason for overall low biomass productivity, cell number,
and specific growth rate in co-culture, the reduction rate should be similar to that of
monoculture. Since the reduction rate was dissimilar, it could be possible another factor
such as secretion of growth inhibitory substances might be responsible for reduced cell
number, specific growth rate and biomass productivity in co-culture, which is acknowl-
edged by Phatarpekar et al. (2000) (please see section 5.4.1. in Chapter 5).
In Amphora sp. stepwise culture biomass productivity and fucoxanthin produc-
tivity was found higher compared to co-culture. A gradual increase in salinity favoured
the growth rate of halotolerant Amphora sp. which is supported by earlier studies
(Indrayani, 2017; Ishika et al., 2017b). Filtered culture media from C. muelleri culture
didn’t negatively affect the biomass and fucoxanthin productivity of Amphora sp. in
stepwise culture, and the possible reasons are as follows: firstly as C. muelleri was
grown in monoculture, so there was no one to compete and that’s why C. muelleri

132
might not secret any growth inhibitory substances; secondly, if C. muelleri culture
produced any growth inhibitory materials as a part of its metabolism, the concentration
was too low to negatively affect the growth of Amphora sp. (Jørgensen, 1956). It could
also be possible that filtration of culture media reduced the concentration of growth-
retarding substances if present. Thus stepwise cultivation was found to be the preferred
and most applicable cultivation method for maintaining continuous production of high
fucoxanthin at the intermediate salinity zone.
Fucoxanthin producing microalgae C. muelleri and Amphora sp. contain a high
portion of lipid (Figure 3.1, 3.2, 6.3). Therefore, after extraction of fucoxanthin, lipid
could be extracted from the same biomass which could reduce the overall biomass pro-
duction cost and make the process sustainable to a certain extent. In co-culture, the
overall lipid productivity was higher than C. muelleri monoculture and less than Am-
phora sp. monoculture. Salinity stress and overall low biomass productivity could be
responsible for low lipid productivity in co-culture of C. muelleri and Amphora sp.
which is in line with previous literature (Fon-Sing & Borowitzka, 2016). The lipid
productivity in stepwise cultivation was found higher than co-cultivation of C. muelleri
and Amphora sp. High biomass productivity favoured the production of high lipid in
stepwise cultivation which is in accordance with the report of Griffiths and Harrison
(2009). Griffiths and Harrison (2009) reviewed the lipid productivity of 55 microalgae
including C. muelleri and Amphora sp. and found that there is a dominant correlation
between lipid and biomass productivity. They also stated that high biomass producing
microalgal species show high lipid productivity.
6.5 Conclusions
The results presented in this chapter showed that production of high biomass of
fucoxanthin producing microalgae could be the most efficient way to produce high fu-

133
coxanthin. Stepwise cultivation is a better method compared to co-culture to maintain
high biomass at the intermediate salinity zone. Stepwise cultivation method showed
approximately 63% higher overall biomass productivity than that of co-culture between
59 and 65 ppt salinity. The highest overall fucoxanthin productivity was found during
stepwise cultivation which was 46.6% higher than that of co-culture, between salinity
59 and 65ppt salinity. Salinity stress, competition between species, production of
growth inhibitory materials and overall low biomass productivity was found as the pos-
sible reasons for overall reduced fucoxanthin productivity during co-cultivation. In
stepwise cultivation, the filtrate from C. muelleri culture didn’t show any negative im-
pact on biomass as well as fucoxanthin productivity of Amphora sp.

134
Chapter 7 Preliminary Economic Assessment
7.1 Introduction The potential of microalgae as a source of biofuel has already been discussed in previ-
ous chapters. In spite of being potential, the cost of biofuel production from microalgae
is still high, and one of the main reasons is high biomass production cost. In previous
chapters, I tested and evaluated several methods for growth of selected microalgae in a
wide range of salinities. The advantages of these methods were:
• seawater based microalgae cultivation as fresh water is a limiting resource,
• cultivation of microalgae with three different salinity optima, e.g., marine, halo-
tolerant and halophilic microalgae,
• co-cultivation and stepwise cultivation at non-optimal salinity.
In this chapter, I assessed the financial feasibility of production-based econom-
ics of low-cost biomass production process. This is an important step for determining
the commercial competitiveness of the process while considering the whole salinity
spectrum from seawater salinity up to salt saturation. In this study the cost of algal bio-
mass produced using a) monocultures, b) monoculture integrated with co-culture and c)
monoculture integrated with stepwise culture was assessed to identify the most signifi-
cant opportunity to reduce cost.
An economic assessment was also done to estimate the production cost of high-
value products, e.g., fucoxanthin and β-carotene obtained from the biomass during
monoculture, co-culture and stepwise culture of marine, halotolerant and halophilic mi-
croalgae.

135
7.2 Geographical Location, Annual Evaporation and Rainfall rate
According to Maxwell, selection of a particular location for microalgae cultiva-
tion depends on topography, weather, and climate, cost and availability of land and fi-
nally the engineering of the system (Maxwell et al., 1985). The biomass productivity of
microalgae is mostly dependent on the topographical parameters, i.e., solar irradiance,
temperature, length of the seasons, the rate of evaporation and rainfall and water availa-
bility. The current study was designed on the basis of the rate of salinity increase in
Geraldton, as it is one of the potential locations for producing microalgal biomass in
WA (Boruff et al., 2015). Based on the report of Bureau of Meteorology (2008) on to-
pography, it can be seen that the solar irradiance is very high in Geraldton (see Figure
7.3) which is necessary for the high biomass productivity of microalgae. The location is
near to sea which will ensure the availability of seawater and reduce the transportation
cost to a certain extent. The location of choice receives high solar irradiance resulting
high evaporation rate, on the other hand, the cultivation methods discussed here based
only on seawater, therefore; the salinity will rise over time depending on the evapora-
tion and rainfall rate of the particular location which has been already discussed in
Chapter 1 (Figure 1.1). The annual average evaporation, rainfall, and solar irradiance
are shown in Figures 7.1, 7.2 and 7.3, respectively.

136
Figure7.1AverageannualevaporationinAustralia.
Figure7.2AverageannualrainfallinAustralia.

137
Figure7.3AverageannualdailysolarexposureinAustralia.
7.3 Approaches and assumptions used for analysis
Several considerations were taken into account during this analysis. Details are
presented below:
7.3.1 Assumptions related to cultivation
1. The whole process was designed to produce continuous high biomass through-
out the period of increased salinity from seawater salinity level up to salt satura-
tion state. A nutrient recycling technique was assumed to be incorporated into
the system which would make the process more sustainable by reusing the lim-
ited resources (nutrients) and also help to construct a cost-effective biomass
production process.
2. The economic model assessed the biomass production cost and the cost of high-
value pigment produced from that biomass.

138
3. Based on the results of Chapter 3, Tetraselmis suecica (green marine species),
Amphora sp. (brown halotolerant species), and Dunaliella salina (green halo-
philic species) were selected as the microalgae of interest for low-cost biomass
production.
4. Chaetoceros muelleri (fucoxanthin producing brown marine species) and Am-
phora sp. (fucoxanthin producing brown halotolerant species) were selected for
fucoxanthin production based on the results of Chapter 4. Halophilic species D.
salina was selected for β-carotene production at salinity above 125 ppt.
5. It was estimated that the facility operates for a period of 330 days as the chosen
site receives high solar irradiance round the year.
6. The length of cultivation of each species in mono, co- and stepwise culture was
estimated based on the calculation of salinity increase in Chapter 1 (Figure 1.1)
which is summarized in Table 7.1. It can be seen from Figure 1.1 that the rate of
salinity increase is varied with locations as the evaporation and rainfall rate is
different in different locations. In Geraldton, it takes 330 days to reach salinity
above 200 ppt based on the evaporation and rainfall rate. It should be noted that,
during pigment production, biomass produced between salinity range 35 and
125 ppt was considered for fucoxanthin production and biomass produced above
125 ppt was considered for β-carotene production.

139
Table7.1Thelengthofcultivationofeachspeciesinmono,co-andstepwisecultureatdif-ferentsalinityranges
Salinity(ppt) Microalgaeculture Lengthofcultivation(Days)35-50 Marinemonoculture 27
50-70 Marine+Halotolerantco-culture/MarineHalotolerantstepwiseculture 39
70-125 Halotolerantmonoculture 40
125-150 Halotolerant+Halophilicco-culture/HalotolerantHalophilicstepwiseculture 120
150-200 Halophilicmonoculture 50>200 Halophilicmonoculture 54
7. Marine species, e.g., Tetraselmis suecica / Chaetoceros muelleri, was grown in
monoculture between salinity 35 ppt and 55 ppt and within this salinity range,
the nutrient recycling was also conducted. However, once the salinity reached
above 55 ppt, the growth media was discarded, and again a new cultivation was
started from 35 ppt.
8. The same approach was also considered for monoculture of Amphora sp., the
halotolerant species. Amphora sp. was assumed to be cultivated in monoculture
between salinity range 35 and 125 ppt. Once the salinity was reached above 125
ppt, the growth media was discarded, and the cultivation was again started from
35 ppt salinity.
9. For D. salina monoculture, the whole salinity spectrum was considered, i.e.,
from seawater salinity level (35 ppt) up to salt saturation state (>200 ppt).
10. In monoculture integrated with co-/stepwise culture system, it was assumed that
marine, halotolerant and halophilic microalgae were cultivated in monoculture at
their optimal salinity range, e.g., between 35 and 50 ppt, between 70 and 125 ppt
and; above 140 ppt, respectively. At non-optimal salinity zone, e.g., between 50
and 70 ppt marine species was cultivated (as co-/stepwise culture) with halotol-
erant species and; between 125 and 140 ppt, halotolerant species was cultivated
(as co-/stepwise culture) with halophilic species (see Figure 5.1 and 5.2 in Chap-
ter 5).

140
11. The cultivation process was semi-continuous as described in Chapter 2. The sa-
linity changed due to the addition of recycled media, seawater, and a new cul-
ture was described in Chapter 1 in detail.
12. The baseline biomass productivity of three kinds of microalgae i.e. Tetraselmis
suecica, (marine), Amphora sp., (halotolerant) and D. salina (halophilic) was
based on currently achievable open pond cultivation data (Fon Sing et al., 2014;
Indrayani, 2017; Isdepsky, 2015; Mata et al., 2010; Moheimani, 2005). The bi-
omass productivity data of current study was not used as baseline biomass
productivity because all the experiments were done in indoor controlled condi-
tion. The data obtained from outdoor culture is more useful to estimate the actu-
al biomass production cost compared to that of indoor experimental data.
13. The baseline biomass productivity of fucoxanthin producing microalgae Chae-
toceros muelleri (marine) and Amphora sp. (halotolerant) was based on open
pond cultivation data available in the open literature (Griffiths & Harrison,
2009; Indrayani, 2017).
14. a. At non-optimal salinity, the biomass productivity of Tetraselmis suecica and
Amphora sp. co-culture was assumed to be 10% less than that of stepwise cul-
ture based on the experimental outcomes of Chapter 5. However, the biomass
productivity of Amphora sp. and D. salina co-culture was assumed to be similar
to that of stepwise culture as in Chapter 5 no significant differences in biomass
productivity was found between stepwise culture and co-culture.
b. Biomass productivity of fucoxanthin producing microalgae co-culture (Chae-
toceros muelleri and Amphora sp.) was assumed to be 60% less than that of
stepwise culture based on the results of Chapter 6.
c. The biomass productivity in both cultivation systems (i.e., for biomass and pig-
ment production) was considered to be depended on the salinity of the culture

141
media, the method of cultivation and microalgae cultivated (Table 7.2). The only
difference between biomass and pigment production was, during pigment pro-
duction biomass productivity of co-culture at non-optimal salinity (between 50-
70 ppt) was considered 8 g m-2 d-1 (i.e., 60% less than stepwise culture as men-
tioned above) based on the result of Chapter 6.
Table7.2Thebiomassproductivityofco-culture, stepwisecultureandmonocultureatdif-ferentsalinityrangesinGeraldton
Salinity(ppt)
Co-CultureStep-wiseCulture
Monoculture Marine
microalgaeHalotolerantmicroalgae
Halophilicmicroalgae
Biomassproductivity(gm-2d-1)35-50 25 25 25 10 2050-70 18 20 - 15 1570-125 20 20 - 20 15125-150 20 20 - - 10150-200 15 15 - - 10>200 10 10 - - 10
d. The cost of biomass production was calculated for Geraldton. The cost was
presented as per kilogram of biomass produced.
e. Based on the report of Borowitzka and Moheimani (2013b) and Ishika et al.
(2017a), this study made all the assumption to produce low-cost microalgal bi-
omass for ultimate production of 100,000 BBL of oil in a year.
f. The area required for producing 100,000 BBL of oil in a year was calculated
based on the equation presented in Chapter 1 (Please see Appendix C for de-
tails). The area of the production system was summarized in Table 7.3.
Table7.3Area (Hectare) required forproducing100,000BBLofoilduringco-culture, step-wisecultureandmonoculture.
Co-Culture(ha*)StepwiseCulture(ha)
Monoculture Marine
Microalgae(ha)Halotolerant
Microalgae(ha)Halophilic
Microalgae(ha)
781 771 556 901 1155*ha=Hectare

142
g. The lipid content was consideredconstant, i.e., 30% of ash-free dry weight bio-
mass according to Chapter 1.
h. It was considered that at least 2% fucoxanthin was present in biomass based on
the earlier reports (Kim et al., 2012a; Kim et al., 2012b).
i. D. salina was assumed to produce 0.09% β-carotene based on the available liter-
ature (Borowitzka & Borowitzka, 1990; Moheimani, 2005).
j. Area of each pond was considered 1 Hectare with a depth of 30 cm and the mix-
ing velocity was considered 30 cm s-1.
7.3.2 Assumptions related to capital expenditures (CAPEXs)
It was assumed that the land acquisition was free. It was also assumed that the
numbers of inoculums were varied with cultivation methods as shown in Appendix C.
Most of the fixed capital expenditures (CAPEXs) e.g., ponds with paddle wheel;
buildings, roads, and drainage; water and nutrient supply, electrical supply and
distribution, CO2 (flue gas + distribution) were adopted from Benemann and Oswald
(1996), a widely cited report which provided a unique level of analysis on equipment
cost for algae cultivation. In Benemann study the costs were presented as USD/ha (US
dollars/Hectare). However, the cost of 1996 was adjusted using inflation rate (Appendix
C) and further converted into Australian Dollars (Aus $). Besides Benemann study, the
inoculums cost was adapted from Hoffman (2016). The cost of tax and bank interest
were adapted from Wijihastuti (2017). The harvesting cost was adapted from Lee et al.
(2013). The engineering fee, contingency, and working capital were adapted from
Moheimani (2005). According to Moheimani (2005), engineering fees, contingencies
and working capital was at 15%, 5%, and 5% of total fixed capital costs, respectively.

143
All of the capital expenditures were assumed to be a loan from a bank based on a
10-year lifetime project with an annual interest of 6.35% (based on the interest rate of
Westpac Banking Corporation, September 2017). It was assumed that the bank’s annual
interest would be constant for 10 years. The annual installment calculation was adopted
from the equated monthly installment (EMI) (Bose & Mukherjee, 2009).
7.3.3 Assumption for operational expenditures (OPEXs)
The operating costs include power, labour, nutrients, maintenance, and tax and
all operating costs were also based on public literature. As the power cost was adopted
from Benemann and Oswald (1996), it was adjusted for Australia’s average electricity
price which is 27 cents per kWh (Electricity Generation and Retail Corporation (AU)
(http://www.energynetworks.com.au/sites/default/files/electricity-prices-and-network-
costs_2.pdf) (https://www.synergy.net.au/Global/ARP17-Price-changes), as the
electricity price for the USA, is 8 cents per kWh (Wijihastuti, 2017).
The number of employees needed for plant operation and monitoring the pro-
duction system were adapted from Wijihastuti (2017), and the labour costs were mainly
based on the skill and service of the employee. The salary per hour was calculated based
on Pay Scale In’s Pay scale Human Capital, Western Australia (Wijihastuti, 2017). The
average working hour was considered 8 per day. The number of employees is showed in
Appendix C. The number of technician was varied with the production area (please see
Appendix C). The harvesting cost, i.e., cost of electroflocculation was calculated based
on Lee et al. (2013). According to their study, electroflocculation takes $0.19 (Aus Dol-
lar) to process 1kg of dry biomass which includes capital investment, electrical energy,
and electrode dissolution cost.

144
7.3.4 Assumption related to fucoxanthin and β-carotene pro-duction
The assumptions for CAPEXs and OPEXs were identical for both production
processes (low-cost biomass production and high-value pigment production) except for
biomass productivity (Please see section 7.3.1). The monoculture and co-
culture/stepwise culture of Chaetoceros muelleri and Amphora sp. were considered for
fucoxanthin production and the monoculture of D. salina and co-/stepwise culture of
Amphora sp. and D. salina were considered for β-carotene production.
7.4 Sensitivity analysis
Sensitivity analysis was performed to find out the percentage of the cost of each
element to the final biomass production cost. The effect of 50% increase or decrease in
the cost of element such as biomass productivity, power, labour, nutrients, harvesting,
maintenance, and tax was taken into consideration. The selection of the cost parameter
was based on parameters that could have the possibility to change throughout the year.
As the assumptions for CAPEXs and OPEXs were same for both production system
(high-value pigment and low-cost biomass), a sensitivity analysis was only shown for
low-cost biomass production system.
7.5 Results
7.5.1 Baseline economics
7.5.1.1 Biomass production using whole salinity spectrum
The resulting biomass cost for monoculture, co-culture and stepwise culture are
summarized in the Figure 7.4. The scenario for the cost of biomass production is as fol-
lows: stepwise culture < co-culture < monoculture of halophilic microalgae < monocul-
ture of halotolerant microalgae < monoculture of marine microalgae. The price was
varied from $1.37 – $2.17 (Aus. Dollar) per kg of dry biomass.

145
Figure7.4Biomasscostformonoculture,co-cultureandstepwiseculture
7.5.1.2 Cost comparison between cultivation methods
The total CAPEXs and OPEXs for three different cultivation methods are sum-
marized below (Table 7.4). It can be seen from Table 7.4 that, the capital and operation-
al cost of stepwise culture was lower than any other cultivation methods whereas, mon-
oculture of marine microalgae showed the highest operational cost than other cultiva-
tion methods. The power consumption during halophilic microalgae monoculture was
approximately 25% and 55% higher than monocultures of marine and halotolerant mi-
croalgae, respectively and; 35% higher than that of co- and stepwise cultures. On the
other hand, the monoculture of marine microalgae showed the highest maintenance and
tax expenditure (up to 60%) than that of co-culture, stepwise culture, halotolerant and
halophilic microalgae monoculture.
0.00 0.50 1.00 1.50 2.00 2.50
Co-culture
Stepwiseculture
Marinemicroalgaemonoculture
Halotolerantmicroalgaemonoculture
Halophilicmicroalgaemonoculture
$perKgofdrybiomass

146
Table7.4.TotalCAPEXsandOPEXs
*A$=AustralianDollar
CAPEXs
Co-cultureStepwiseculture
MonocultureMarine
microalgaeHalotolerantmicroalgae
Halophilicmicroalgae
*A$(x1,000,000)Land Free Free Free Free FreeBuildings,roadsanddrainage
3.17 3.00 2.16 3.51 4.50
Waterandnutrientsupply
8.25 7.81 5.63 9.13 11.71
Electricalsupplyanddistribution
3.17 3.00 2.16 3.51 4.50
Pondswithpaddlewheel
13.49 12.78 9.23 14.93 19.14
Inoculumsystem 39.06 36.99 108.51 44.68 18.48CO2(fluegas+distribu-tion)
6.83 6.46 4.66 7.55 9.68
Electroflocculation 3.29 3.30 3.25 3.16 6.05Engineeringfees 11.14 11.01 20.34 12.97 11.11Contingency 3.71 3.67 6.78 4.32 3.70TotalFixedCapitalInstallment
89.13 88.06 162.73 103.79 88.90
Workingcapital 44.56 4.40 8.14 5.19 4.44TotalCAPEXs 93.58 92.46 170.87 108.98 93.34
OPEXs*A$(x1,000,000)
Power 8.98 8.86 6.39 10.36 13.28Nutrient(N&P) 1.22 1.26 1.62 1.30 1.38Electroflocculation 5.53 5.56 5.46 5.31 6.05Labour 1.58 1.52 1.22 1.78 2.13Maintenance/Insurance 8.91 8.81 1.63 10.38 8.89Tax 24.50 24.21 44.75 28.54 24.45TotalOPEXs 50.72 50.22 61.07 57.67 56.18

147
7.5.1.3 Contribution to different cost element to CAPEXs and OPEXs
Among capital expenditures, the inoculum cost covered the majority of the total
capital expenditure (up to 68%). The cost of ponds and paddle wheels covered 13-20%
of the total CAPEXs. Engineering fees and; water and nutrient supply cost cover up to
12% and 20% of the total capital expenditure, respectively. The CAPEXs for marine
microalgae monoculture method was higher than any other cultivation method (Appen-
dix C). Conversely, the CAPEX of stepwise culture was found to be up to 59% lower
than any other cultivation method. During stepwise cultivation, the contribution to dif-
ferent cost element to CAPEXs in Figure 7.5 (Please see the rest of the figures in Ap-
pendix C)
Figure7.5ThecontributionofdifferentcostelementstoCAPEXsforstepwiseculture.
14%3%
8%
3%
40%
7%
4%
12%
4%
5%
Stepwiseculture
Pondswithpaddlewheel
Buildings,roads,drainage
Waterandnutrientsupply
Electricalsupplyanddistribution
Inoculumsystem
CO2(fluegas+distribution)
Electroflocculation
Engineeringfees
Contingency
Workingcapital

148
Irrespective of cultivation methods, more than 50% of the operational costs were
covered by the tax. After tax, power and maintenance contributed approximately 20%
of the overall operational cost. Harvesting system contributed half of the power cost,i.e.,
10-12% of the operational cost. Nutrients and labour only covered 2-3% of total opera-
tional expenditure. The contribution to different cost element to CAPEXs and OPEXs
of stepwise culture is shown in Figure 7.6 (Please see the rest of the figures in Appendix
C).
Figure7.6ThecontributionofdifferentcostelementstoOPEXsforstepwiseculture.
18%2%
11%
3%18%
48%
Stepwiseculture
Power
Nutrient(N&P)
Electroflocculation
Labour
Maintainance/Insurance
Tax

149
7.5.1.4 Sensitivity analysis
A sensitivity analysis was performed by changing several cost parameters, to
evaluate the effect of changes in variables on the overall economics. The changes in
biomass cost due to changes of these parameters were illustrated in Figure 7.7 for step-
wise cultivation (Please see the rest of the cultivation methods in Appendix C). 50%
reduction in tax resulted up to 20% reduction in biomass production cost. A 50% de-
crease in harvesting cost reduced the total biomass production cost by 11%. Besides
harvesting, power and maintenance affected the final biomass production cost more
than that of nutrients and labour.
Figure7.7Sensitivityanalysesforstepwiseculture.

150
7.5.2 Fucoxanthin and β-carotene production
Unlike biomass production cost, fucoxanthin production costs were also found lower
during stepwise cultivation than that of other cultivation method (Figure 7.8). It was
clear from the result that it would be possible to produce fucoxanthin by $58.2 kg-1 us-
ing stepwise cultivation. However, in other three cultivation methods, the cost of fuco-
xanthin varied between $72.5 and $108.3 (Aus. Dollar). Table 7.5 shows the production
cost of fucoxanthin using co-culture, stepwise culture and monoculture of marine and
halotolerant microalgae under increased salinity.
Figure7.8Fucoxanthinproductioncostusingco-culture,stepwiseculture,andmonocultureofmarineandhalotolerantmicroalgae.
0.00 20.00 40.00 60.00 80.00 100.00 120.00
Co-culture
Stepwiseculture
Marinemicroalgaemonoculture
Halotolerantmicroalgaemonoculture
$perKgofFucoxanthincost

151
However, the cost of β-carotene was found less during co-culture compared to mono-
culture and stepwise culture. It can be seen from Figure 7.9 that, the cost of β-carotene
varied from $16.49-$16.76 kg-1. Table 7.5summarizes the total biomass production cost,
amount of fucoxanthin and β-carotene in that biomass and fucoxanthin and β-carotene
production cost per kg.
Figure7.9β-caroteneproductioncostusingco-culture,stepwisecultureandhalophilicmi-croalgaemonoculture.
14.00 15.00 16.00 17.00
Co-culture
Stepwiseculture
Halophilicmicroalgaemonoculture
$perKgofβ-carotene

152
Table7.5TotalcostofpigmentproductionatGeraldtonusingco-culture,stepwisecultureandmonoculture.
Co-culture Stepwiseculture MonocultureMarinemicroalgae Halotolerantmicroalgae Halophilicmicroalgae
*F *C *F *C *F *F *CTotalBiomassProductioncost *A$(x1,000,000)/Year 20.23 42.77 20.24 42.76 99.34 72.72 69.07
TotalBiomass Tonnes/Year 13,956 28,818 17,386 28,449 45,870.00 44,599.50 45,795
Totalpigment Tonnes/Year 279 2,593 347 2,560 917.40 891.99 4,121
CostperTonne A$/Tonnes 72,503 16,488 58,196 16,701 108,279.58 81,529.93 16,758
$/kgofpigment 72.50 16.49 58.20 16.70 108.28 81.53 16.76
*F=Fucoxanthin,C=β-carotene,A$=AustralianDollar

153
7.6 Discussion
To date, most attention has been given to sustainable and cost-effective
microalgal biomass production (Borowitzka & Moheimani, 2013b) and there is also no
doubt thatnutrientand fresh water are some of the main contributors to the overall cost
of production (Fon Sing et al., 2014; Yang et al., 2011). Therefore, if one can recycle
nutrient and limit the use of fresh water, the whole process will be more feasible and
eco-friendly. It was also previously shown that some saline microalgae can be cultivat-
ed for long-term using recycled media (Fon Sing et al., 2014; Moheimani, 2016). This
economic assessment combined all possible approaches (described above), to establish
a sustainable and economic biomass production system at an industrial scale using three
cultivation methods described in previous chapters.
Results indicated that stepwise cultivation offers the lowest biomass cost in
comparison to other cultivation methods. High biomass productivity, the requirement of
less cultivation area and less use of nutrient, power, and labour consumption were the
reasons behind less biomass production cost in stepwise culture in comparison to co-
culture and monoculture.
In the current study, the biomass production cost was found $1.37 per kg of dry
biomass. However, in the open literature, dry biomass cost of Nannochloropsis sp., a
marine microalga, was found $0.34 (USD) ≈ $0.44 (Aus $) per kg (Ben-Amotz, 2008).
In Ben-Amotz (2008) study fresh water is used during cultivation, which raised the is-
sue of sustainability. On the other hand, in the present study, although the production
cost was found 3 times higher than that of Ben-Amotz (2008) study; the production sys-
tem was more sustainable as no fresh water was used.

154
In the current study, the land cost was not included in the capital cost for the
simplicity of the calculation. However, in practical, the land might not be for free which
would add an extra cost in capital expenditure and thus the total biomass production
cost could be increased.
The highest biomass production cost was found in marine microalgae monocul-
ture, as both CAPEXs and OPEXs were higher in comparison to other cultivation meth-
ods. The CAPEXs and OPEXs of halophilic microalgae monoculture were approxi-
mately similar to that of co- and stepwise culture; however, the cost of biomass was
higher than that of co- and stepwise culture. As the overall biomass productivity of hal-
ophilic microalgae monoculture was less than that of co- and stepwise culture, the over-
all biomass cost was found to be increased. Some earlier work of literature also
acknowledged that low biomass productivity was one of the main reasons for high bio-
mass production cost (Norsker et al., 2011; Shen et al., 2009). According to the study of
Ben-Amotz (2008), the production cost of D. salina dry biomass was found $17 (USD)
≈ $22 (AUD) per kg due to low biomass productivity (2 g m-2 d-1) and reports of
Norsker et al. (2011) and Shen et al. (2009) also supported the fact.
When it comes to low-cost pigment production, it can be seen that due to high
biomass productivity, fucoxanthin production cost was also low in stepwise cultivation.
At present, the market price of fucoxanthin (per kg) as food supplement varies between
$50 and $1000 (USD), depending on the percentage of fucoxanthin present. In addition,
various chemical companies (e.g., Sigma-Aldrich) sell 10 mg of fucoxanthin (95%
pure) by $215 (USD). According to Wu et al. (2016), the market price of fucoxanthin
dietary supplements derived from macroalgae is approximately $0.6 per capsule or soft
gel, a price the market is not willing to accept. If it is possible to apply the stepwise cul-
tivation method described in current study at an industrial scale, it would be possible to

155
reduce the price of fucoxanthin in the market and make it viable for everyone willing to
get the benefit.
The cost of per kg of β-carotene in co-culture was found 2% less compared to
stepwise culture. Although in co-culture and stepwise culture the biomass productivity
was identical, the total area of cultivation is approximately 2% larger than that of step-
wise culture. Therefore, the total biomass and total pigment obtained from that system
were higher than that of stepwise culture which in turn reduced the cost by 2%. Accord-
ing to Borowitzka (2013),the market price of β-carotene is at least $300 kg−1 (USD)
depending on its formulation. The current study showed that using the co-cultivation
method; it would be possible to produce low-cost β-carotene which would be approxi-
mately 15 times less than the available market price.
However, in the present calculation, the cost of pigment extraction process was
not considered, and in reality, it contributes a large portion of the cost in both CAPEXs
and OPEXs. Beside extraction cost, extraction efficiency is another cost introducing
factor which depends on selectivity, rapidity, yield, reproducibility of the process and
protection of pigment against chemical transformation or thermal denaturation (Pasquet
et al., 2011b). According to earlier literature, up to ~95% fucoxanthin (Kim et al.,
2012b) and 65%, β-carotene recovery is achievable (Marchal et al., 2013). As it is not
possible to extract all the pigment present in biomass, it could add an extra cost to the
system; therefore, the actual price would be higher than the price calculated in the
current study. If the extraction process would add another 30% extra cost to the total
production cost, still the pigment production cost would be lower than the current mar-
ket price.

156
7.7 Conclusions
This is the first attempt to assess the economic feasibility to produce microalgal
biomass using the whole salinity spectrum. This study also compared between monocul-
ture, monoculture integrated with co-culture and stepwise culture and showed that mon-
oculture integrated with stepwise cultivation was the best possible way to produce low-
cost biomass resulting $1.37 kg−1 of dry biomass. In addition to low-cost biomass, the
current study also highlighted on the production of low-cost fucoxanthin ($58.2 kg−1)
using stepwise cultivation method. The cost of β-carotene was found to vary between
$16.49 -$16.76 kg−1 in co-culture, stepwise culture and halophilic microalgae monocul-
ture. However, the estimated pigment cost was devoid of any extraction process. It
should be noteworthy that, selection of species with high biomass and pigment produc-
tivity and wide salinity range, and selection of location with high solar irradiance and
easy access to seawater is necessary to get low-cost product from microalgae.

157
Chapter 8 Conclusion and Future Directions
8.1 General Conclusion
Sustainable cultivation of microalgae using only seawater can be a viable ap-
proach to produce eco-friendly and economic microalgal biomass. Seawater-based cul-
tivation process not only helps to minimize the excessive use of the limited natural asset
like fresh water but also offers an opportunity to produce revenue from an extensively
available unexploited natural recourse such as seawater. However, if an open pond cul-
tivation system uses only seawater for pond fill and evaporative volume makeup, the
salinity of the growth media will increase gradually. It is difficult to maintain a micro-
algal species with high biomass productivity from seawater salinity level up to salt satu-
ration state, as every microalgal species has particular salinity optima. To solve this
issue in the current study, microalgae with three different salinity optima, e.g., marine
or low saline microalgae, halotolerant or mid saline microalgae and halophilic or hyper-
saline microalgae were cultivated at an increased salinity. This study investigated the
effect of salinity on the growth and biochemical content of marine, halotolerant and
halophilic microalgae. It also tested co-cultivation and stepwise cultivation with a pur-
pose to produce continuously high biomass at an increased salinity started from sea-
water salinity level up to salt saturation state with an ultimate aim to produce low-cost
biofuel and high-value pigment.
For this study six marine (Chrysotila carterae, Chaetoceros muelleri, Nan-
nochloropsis sp., Pheodactylum tricornutum, Tisochrysis lutea and Tetraselmis
suecica), two halotolerant (Amphora sp. and Navicula sp.) and a halophilic
microalgae (Dunaliella salina) were selected. These species were chosen based on
their, salinity range, commercial importance, and growth in outdoor condition. The ef-

158
fect of continuous salinity increase on the growth and biochemical content was studied.
Based on the results of salinity range, biomass and lipid productivity, Tetraselmis
suecica (marine), Amphora sp. (halotolerant) and D. salina (halophilic) were selected
for further co-cultivation and stepwise cultivation studies. These species were found to
produce high biomass and lipid productivity at their optimal salinity range.
Among the selected species, marine microalgae Chrysotila carterae, Chae-
toceros muelleri, P. tricornutum and Tisochrysis lutea and; halotolerant micro-
algae Amphora sp. and Navicula sp. are able to produce fucoxanthin. Therefore,
the effect of salinity on the fucoxanthin productivity of these species was also tested.
Marine microalgae Chaetoceros muelleri was found to produce the high fucoxanthin
at salinity below 55 ppt and halotolerant species Amphora sp. was found to produce
high fucoxanthin above 55 ppt salinity.
Results showed that high biomass, lipid, and fucoxanthin productivity was ob-
tained only at the optimal salinity zone of marine, halotolerant and halophilic microal-
gae. However, the optimal salinity zones of marine, halotolerant and halophilic micro-
algae are not continuous. There are non-optimal salinity ranges in between the optimal
salinity ranges (Chapter 5, Figure 5.1). The non-optimal salinity zones are found to be
responsible for overall low biomass productivity (Araujo et al., 2011). Therefore, to
maintain high biomass at the non-optimal salinity zone, co-cultivation and stepwise
cultivation were performed.
Marine microalgae Tetraselmis suecica and halotolerant microalgae Amphora
sp. were cultivated together at the non-optimal salinity zone of both marine and halo-
tolerant species. Similarly, halotolerant microalgae Amphora sp. was co-cultivated
with halophilic microalgae D. salina at the non-optimal salinity zone of both species.
The overall biomass productivity of Tetraselmis suecica and Amphora sp. co-culture

159
showed no significant differences with that of their monoculture. However, the lipid
productivity in Amphora sp. monoculture was found 23% higher than that of co-culture.
In Amphora sp. and D. salina co-culture, no significant difference was also observed
between the biomass productivity of co-culture and their monocultures. The overall
lipid productivity in co-culture was approximately 40% less than that of D. salina mon-
oculture. In addition, fucoxanthin producing species Chaetoceros muelleri and Ampho-
ra sp. was also co-cultured at the non-optimal salinity zone of both species. The results
showed that the overall biomass and fucoxanthin productivity of co-culture was 38%
and 50% less, respectively than that of monoculture of Amphora sp.
Co-culture was not found to be the best cultivation method to maintain high bi-
omass, lipid and fucoxanthin productivity at non-optimal salinity. Therefore, stepwise
cultivation was performed to check whether it helped to improve the biomass, lipid and
fucoxanthin productivity. During stepwise culture, the filtrate of marine microalgae was
used to culture halotolerant microalgae, and the filtrate of halotolerant microalgae was
used to culture halophilic species. In both stepwise cultures, no negative effect of recy-
cled nutrient was observed on the growth and biochemical content of microalgae.
Results showed that Tetraselmis suecica and Amphora sp. stepwise culture pro-
duce 10% higher biomass and 30% higher lipid than that of Tetraselmis suecica and
Amphora sp. co-culture within the same salinity range. Although, the biomass produc-
tivity results of Amphora sp. and D. salina stepwise culture showed no statistically sig-
nificant difference with Amphora sp. and D. salina co-culture; however, the stepwise
culture showed 40% higher lipid productivity than that of co-culture at the same salinity
range. On the other hand, Chaetoceros muelleri and Amphora sp. stepwise culture
showed 63% higher biomass productivity and 46.6% higher fucoxanthin productivity

160
than that of co-culture, indicated that stepwise culture is a better cultivation method to
produce high lipid and fucoxanthin at non-optimal salinity zone than co-culture.
A preliminary economic analysis was carried out to estimate the cost of biomass
and fucoxanthin production in Geraldton, Western Australia (WA). The results indicat-
ed that the cost of producing microalgal biomass could be as low as 1.37 Aus $ kg-1 of
dry biomass in monoculture integrated with stepwise culture system. The monoculture
of marine species showed 36%higher biomass production cost compared to the stepwise
system. Similarly, the cost of production of fucoxanthin ($58.2) was also found to be
significantly lower in monoculture integrated with stepwise culture compared to other
cultivation systems.
8.2 Future Directions
This study clearly showed that it is possible to use only seawater and whole sa-
linity spectrum from seawater salinity up to salt saturation for the cultivation of micro-
algae. Previous studies showed that the selected species were successfully grown in
outdoor conditions. Having said that current proof of concept studies was carried out
under laboratory controlled condition, the further research works in following areas
need to be done.
1. The selected marine, halotolerant and halophilic microalgae should be grown
under continuous salinity increased condition in outdoor paddle wheel driven
raceway ponds using the stepwise cultivation method.
2. While the advantages of the nutrient recycling process were discussed, no nutri-
ent recycling technique was carried out except for stepwise cultivation. There-
fore, further nutrient recycling studies need to be undertaken while growing mi-
croalgae using proposed processes.

161
3. Steady state pond salinity (rather than constant salinity increase) can be
maintained through incomplete media recycling during microalgae cultivation.
A detail study on maintenance of steady state salinity using purge stream will
enrich the knowledge of microalgae cultivation in open pond using seawater.
4. A detailed study to compare species acclimatized or non-acclimatized to salinity
would add more valuable information.
5. The interactions between species during co-culture need to be studied in detail to
explore algal growth inhibitory substances.
6. A detailed analysis of accumulated lipid due to salinity increase in mono, co-
and stepwise cultures needs to be carried out to understand lipid synthesis during
different growth conditions.
7. The production of fucoxanthin should be tested under constantly increased salin-
ity in outdoor condition to check the integrated effect of salinity with other pa-
rameters. Especially the solar irradiance on the production of fucoxanthin.
8. There is also a need to establish a method for sufficient fucoxanthin extraction.
9. Optimization of light wave length and irradiance; and temperature needs to be
carried out to get high fucoxanthin productivity from desired microalgae. Fur-
ther study on genetic manipulation should be explored to increase the content of
fucoxanthin in microalgae.
10. A detailed techno-economic analysis on pigment production was not possible
due to the limitation of data regarding the effective extraction process of fuco-
xanthin. Further research in this field can open up a new direction to produce
low-cost fucoxanthin from microalgae of interest.

162
11. A biorefinery concept can be implemented during the production of fucoxanthin
as the fucoxanthin producing microalgae are also rich in lipid. If it is possible to
produce fucoxanthin and lipid from the same biomass, the cost of products can
be reduced to a certain extent.

163
References Abu-Rezq, T.S., Al-Hooti, S., Jacob, D., Al-Shamali, M., Ahmed, A., Ahmed, N. 2010. Induction and
extractionofβ-carotenefromthe locally isolatedDunaliellasalina.AlgalBiomassUtln,1,58-83.
Acién, F., Fernández, J.,Magán, J.,Molina, E. 2012. Production cost of a realmicroalgae productionplantandstrategiestoreduceit.BiotechnologyAdvances,30(6),1344-1353.
Ahmad,A.L.,Yasin,N.H.M.,Derek,C.J.C.,Lim,J.K.2011.Microalgaeasasustainableenergysourceforbiodieselproduction:Areview.RenewableandSustainableEnergyReviews,15(1),584-593.
Airanthi, M., Hosokawa,M., Miyashita, K. 2011. Comparative antioxidant activity of edible Japanesebrownseaweeds.JournalofFoodScience,76(1),C104-C111.
Aitken, D., Bulboa, C., Godoy-Faundez, A., Turrion-Gomez, J.L., Antizar-Ladislao, B. 2014. Life cycleassessmentofmacroalgaecultivationandprocessingforbiofuelproduction.JournalofCleanerProduction,75,45-56.
Al-Hasan,R.,Ghannoum,M.,Sallal,A.,Abu-Elteen,K.,Radwan,S.1987.Correlativechangesofgrowth,pigmentationandlipidcompositionofDunaliellasalinainresponsetohalostress.Microbiology,133(9),2607-2616.
Alkhamis, Y., Qin, J.G. 2013. Cultivation of Isochrysis galbana in phototrophic, heterotrophic, andmixotrophicconditions.BioMedResearchInternational,2013,9.
Allakhverdiev,S.I.,Sakamoto,A.,Nishiyama,Y.,Inaba,M.,Murata,N.2000.IonicandosmoticeffectsofNaCl-induced inactivation of photosystems I and II in Synechococcus sp. Plant Physiology,123(3),1047-1056.
Angell,S.,Bench,B.J.,Williams,H.,Watanabe,C.M.2006.Pyocyanin isolatedfromamarinemicrobialpopulation:synergisticproductionbetweentwodistinctbacterialspeciesandmodeofaction.Chemistry&Biology,13(12),1349-1359.
Araujo,G.S.,Matos,L.J.B.L.,Gonçalves,L.R.B.,Fernandes,F.A.N.,Farias,W.R.L.2011.Bioprospectingforoil producingmicroalgal strains: Evaluation of oil and biomass production for tenmicroalgalstrains.BioresourceTechnology,102(8),5248-5250.
Arora,M.,Anil,A.C.,Leliaert,F.,Delany,J.,Mesbahi,E.2013.Tetraselmisindica(Chlorodendrophyceae,Chlorophyta), a new species isolated from salt pans in Goa, India. European Journal ofPhycology,48(1),61-78.
Avron,M.1992.Osmoregulation. in:Dunaliella:Physiology,biochemistry,andbiotechnology, (Eds.)M.Avron,A.Ben-Amotz,CRC.Florida,USA,pp.135-164.
Balzano,S.,Sarno,D.,Kooistra,W.H.C.F.2011.EffectsofsalinityonthegrowthrateandmorphologyoftenSkeletonemastrains.JournalofPlanktonResearch,33(6),937-945.
Barros, M.U.G., da Cruz Coelho, A.A., da Silva, J.W.A., Bezerra, J.H.C., Moreira, R.T., Farias, W.R.L.,Moreira, R.L. 2014. Lipid content of marine microalgae Chaetoceros muelleri Lemmermann(Bacillariophyceae)grownatdifferentsalinities.Biotemas,27(2),1-8.
Bartley,M.L.,Boeing,W.J.,Corcoran,A.A.,Holguin,F.O.,Schaub,T.2013.Effectsofsalinityongrowthand lipid accumulation of biofuel microalgaNannochloropsis salina and invading organisms.BiomassandBioenergy,54,83-88.
Becker,E.2007.Micro-algaeasasourceofprotein.BiotechnologyAdvances,25(2),207-210.Behrenfeld,M.2011.Biology:uncertainfutureforoceanalgae.NatureClimateChange,1(1),33.Ben-Amotz, A. 2008. Bio-fuel and CO2 capture by algae. 11th International Conference on Applied
Phycology,Galway,Ireland,Jun.pp.22-27.Ben-Amotz,A.,Katz,A.,Avron,M.1982a.Accumulationofβ-caroteneinhalotolerantalge:purification
and characterization of β-carotene-rich globules from Dunaliella bardawil (Chlorophyceae)JournalofPhycology,18(4),529-537.
Ben-Amotz,A.,Sussman,I.,Avron,M.1982b.GlycerolproductionbyDunaliella.Experientia,38(1),49-52.
Ben-Amotz,A.,Tornabene,T.G.,Thomas,W.H.1985.Chemicalprofileofselectedspeciesofmicroalgaewithemphasisonlipids.JournalofPhycology,21(1),72-81.

164
Ben-Amotz,A.1975.AdaptationoftheunicellularalgaDunaliellaparvatoasalineenvironment.JournalofPhycology,11(1),50-54.
Benemann,J.R.,Oswald,W.J.1996.Systemsandeconomicanalysisofmicroalgaepondsforconversionof CO2 to biomass. California University, Berkeley, California. DOE/PC/93204--T5; Other: ON:DE97052880; TRN: 97:004328 United States 10.2172/493389 Other: ON: DE97052880; TRN:97:004328OSTIasDE97052880NETLEnglish.
Bhola, V.K., Swalaha, F.M., Nasr, M., Kumari, S., Bux, F. 2016. Physiological responses of carbon-sequestering microalgae to elevated carbon regimes. European Journal of Phycology, 51(4),401-412.
Biller, P., Ross, A.B., Skill, S., Lea-Langton, A., Balasundaram, B., Hall, C., Riley, R., Llewellyn, C. 2012.Nutrient recycling of aqueous phase for microalgae cultivation from the hydrothermalliquefactionprocess.AlgalResearch,1(1),70-76.
Bligh,E.G.,Dyer,W.J.1959.Arapidmethodoftotallipidextractionandpurification.CanadianJournalofBiochemistryandPhysiology,37(8),911-917.
Bode,H.B.2006.Noneedtobepure:mixthecultures!Chemistry&Biology,13(12),1245-1246.Booth,W.,Beardall, J.1991.Effectsof salinityon inorganiccarbonutilizationandcarbonicanhydrase
activityinthehalotolerantalgaDunaliellasalina(Chlorophyta).Phycologia,30(2),220-225.Borkenstein,C.G.,Knoblechner, J., Frühwirth,H., Schagerl,M.2011.CultivationofChlorellaemersonii
withfluegasderivedfromacementplant.JournalofAppliedPhycology,23(1),131-135.Borowitzka,L.,Borowitzka,M.1989.β-carotene(provitaminA)productionwithalgae.in:Biotechnology
ofVitamins,PigmentsandGrowthFactors,(Ed.)E.J.Vandamme,ElsevierScience.England,pp.15-26.
Borowitzka, L., Moulton, T., Borowitzka, M. 1984. The mass culture of Dunaliella salina for finechemicals: from laboratory to pilot plant. in:Developments in Hydrobiology (Eds.) B. C.J., R.M.A.,Vol.22,Springer.Dordrechtpp.115-121.
Borowitzka, L.J., Borowitzka,M.A. 1990. Commercial production of β-carotene byDunaliella salina inopenponds.BulletinofMarineScience,47(1),244-252.
Borowitzka,L.J.,Brown,A.D.1974.Thesaltrelationsofmarineandhalophilicspeciesoftheunicellulargreenalga,Dunaliella.ArchivesofMicrobiology,96(1),37-52.
Borowitzka,M.2005.Culturingmicroalgae inoutdoorponds. in:Algal culturing techniques, (Ed.)R.A.Andersen,AcademicPress.USA,pp.205-218.
Borowitzka,M.,Borowitzka,L.1988.Limitstogrowthandcarotenogenesisinlaboratoryandlarge-scaleoutdoorculturesofDunaliellasalina.in:AlgalBiotechnology,(Eds.)T.Stadler,J.Mollion,M.-C.Verdus,Y.Karamanos,H.Morvan,E.Christiaen,ElsevierAppliedScience.Essex,UK,pp.371-381.
Borowitzka, M.A. 1999. Commercial production of microalgae: ponds, tanks, tubes and fermenters.JournalofBiotechnology,70(1),313-321.
Borowitzka, M.A. 2013. High-value products from microalgae—their development andcommercialisation.JournalofAppliedPhycology,25(3),743-756.
Borowitzka, M.A. 2008. Marine and halophilic algae for the production of biofuels. Journal ofBiotechnology,136,S7.
Borowitzka,M.A. 1997.Microalgae for aquaculture: opportunities and constraints. Journal of AppliedPhycology,9(5),393-401.
Borowitzka,M.A. 1994. Products fromalgae. in:Algal Biotechnology in theAsia-Pacific Region (Eds.)S.M.Phang,K. Lee,M.A.Borowitzka,B.Whitton, InstituteofAdvancedStudies,UniversityofMalaya.KualaLumpur,pp.5-15.
Borowitzka,M.A., Borowitzka, L.J. 1988a.Algal growthmedia and sources of cultures. in:Micro-algalBiotechnology(Eds.)M.A.Borowitzka,L.J.Borowitzka,CambridgeUniversityPress.UK,pp.456-465.
Borowitzka, M.A., Borowitzka, L.J., Kessly, D. 1990. Effects of salinity increase on carotenoidaccumulationinthegreenalgaDunaliellasalina.JournalofAppliedPhycology,2(2),111-119.
Borowitzka, M.A., Moheimani, N.R. 2013a. Open pond culture systems. in: Algae for Biofuels andEnergy,(Eds.)M.A.Borowitzka,N.R.Moheimani,Vol.5,Springer.Dordrecht,pp.133-152.

165
Borowitzka,M.A.,Moheimani,N.R.2013b.Sustainablebiofuelsfromalgae.MitigationandAdaptationStrategiesforGlobalChange,18(1),13-25.
Boruff, B.J.,Moheimani, N.R., Borowitzka,M.A. 2015. Identifying locations for large-scalemicroalgaecultivationinWesternAustralia:AGISapproach.AppliedEnergy,149,379-391.
Bose,S.,Mukherjee,D.2009.Onthemeritsofequatedmonthlyinstallmentsmethodoftermfinancing:Someanalyticsandarithmetics.IUPJournalofBankManagement,8(1),73.
Boussiba, S., Sandbank, E., Shelef, G., Cohen, Z., Vonshak, A., Ben-Amotz, A., Arad, S., Richmond, A.1988. Outdoor cultivation of the marine microalga Isochrysis galbana in open reactors.Aquaculture,72(3-4),247-253.
Boussiba, S., Vonshak, A. 1991. Astaxanthin accumulation in the green algaHaematococcus pluvialis.PlantandCellPhysiology,32(7),1077-1082.
Brand, L.E. 1984. The salinity tolerance of forty-sixmarine phytoplankton isolates. Estuarine, CoastalandShelfScience,18(5),543-556.
Brennan,L.,Fernández,A.B.,Mostaert,A.S.,Owende,P.2012.EnhancementofBODIPY505/515 lipidfluorescence method for applications in biofuel-directed microalgae production. Journal ofMicrobiologicalMethods,90(2),137-143.
Brennan, L., Owende, P. 2010. Biofuels from microalgae—A review of technologies for production,processing, and extractions of biofuels and co-products. Renewable and Sustainable EnergyReviews,14(2),557-577.
Brittaine, R., Lutaladio, N. 2010. Jatropha: a smallholder bioenergy crop: the potential for pro-poordevelopment.FoodandAgricultureOrganizationoftheUnitedNations(FAO).
Brown, A., Borowitzka, L.J. 1979. Halotolerance of Dunaliella. in: Biochemistry and physiology ofprotozoa,(Eds.)M.Levendowsky,S.H.Hunter,AcademicPress.NewYork,pp.139-190.
Brown, M.R. 2002. Nutritional value and use of microalgae in aquaculture. Avances en NutriciónAcuícolaVI.MemoriasdelVISimposiumInternacionaldeNutriciónAcuícola,3,281-292.
Buffan-Dubau, E., Carman, K.R. 2000. Extraction of benthic microalgal pigments for HPLC analyses.MarineEcologyProgressSeries,204,293-297.
Cai,S.,Hu,C.,Du,S.2007.Comparisonsofgrowthandbiochemicalcompositionbetweenmixedcultureofalgaandyeastandmonocultures.JournalofBioscienceandBioengineering,104(5),391-397.
Carballo-Cárdenas, E.C., Tuan, P.M., Janssen, M., Wijffels, R.H. 2003. Vitamin E (α-tocopherol)production by themarinemicroalgaeDunaliella tertiolecta and Tetraselmis suecica in batchcultivation.BiomolecularEngineering,20(4),139-147.
Caron,L.,Douady,D.,Quinet-Szely,M.,deGoër,S.,Berkaloff,C.1996.Genestructureofachlorophylla/c-binding protein froma brown alga: Presence of an intron andphylogenetic implications.JournalofMolecularEvolution,43(3),270-280.
Carreto,J.,Catoggio,J.1976.VariationsinpigmentcontentsofthediatomPhaeodactylumtricornutumduringgrowth.MarineBiology,36(2),105-112.
Cermeño, P., Figueiras, F.G. 2008. Species richness and cell-size distribution size structure ofphytoplanktoncommunities.MarineEcologyProgressSeries,357,79-85.
Chaudry,S.,Bahri,P.A.,Moheimani,N.R.2015.Pathwaysofprocessingofwetmicroalgaeforliquidfuelproduction:Acriticalreview.RenewableandSustainableEnergyReviews,52,1240-1250.
Chen,H.,Jiang,J.-G.,Wu,G.-H.2009.EffectsofsalinitychangesonthegrowthofDunaliellasalinaanditsisozymeactivitiesofglycerol-3-phosphatedehydrogenase.JournalofAgriculturalandFoodChemistry,57(14),6178-6182.
Chinnasamy, S., Bhatnagar, A., Hunt, R.W., Das, K. 2010. Microalgae cultivation in a wastewaterdominated by carpet mill effluents for biofuel applications. Bioresource Technology, 101(9),3097-3105.
Cho,S.H.,SungChoon,J.,Hur,S.B.,Bae,J.,Park,I.S.,Song,Y.C.2007.Optimumtemperatureandsalinityconditions forgrowthofgreenalgaeChlorellaellipsoideaandNannochlorisoculata.FisheriesScience,73(5),1050-1056.
Conde, E.,Moure, A., Domínguez, H. 2015. Supercritical CO2 extraction of fatty acids, phenolics andfucoxanthin from freeze-driedSargassummuticum. Journal ofAppliedPhycology,27(2), 957-964.

166
Connor,R.,Faurès,J.,Kuylenstierna,J.,Margat,J.,Steduto,P.,Vallée,D.,vanderHoek,W.2009.Waterinachangingworld.
Cooksey, K., Chansang, H. 1976. Isolation and physiological studies on three isolates of Amphora(Bacillariophyceae)JournalofPhycology,12(4),455-460.
Corcoran,A.A.,Boeing,W.J.2012.BiodiversityIncreasestheProductivityandStabilityofPhytoplanktonCommunities.PLOSONE,7(11),e49397.
Cordell,D.,Drangert, J.-O.,White,S.2009.Thestoryofphosphorus:globalfoodsecurityandfoodforthought.GlobalEnvironmentalChange,19(2),292-305.
Cosgrove, J.J., Borowitzka, M.A. 2010. Chlorophyll fluorescence terminology: an introduction. in:Chlorophyll a fluorescence in aquatic sciences:methods and applications, (Eds.) D.J. Suggett,M.A.Borowitzka,O.Prášil,Springer.Dordrecht,pp.1-17.
Craggs,R.,Sutherland,D.,Campbell,H.2012.Hectare-scaledemonstrationofhighratealgalpondsforenhancedwastewater treatmentandbiofuelproduction. JournalofAppliedPhycology,24(3),329-337.
Csavina, J., Stuart, B., Guy Riefler, R., Vis, M. 2011. Growth optimization of algae for biodieselproduction.JournalofAppliedMicrobiology,111(2),312-318.
Cuellar-Bermudez,S.P.,Aguilar-Hernandez,I.,Cardenas-Chavez,D.L.,Ornelas-Soto,N.,Romero-Ogawa,M.A., Parra-Saldivar, R. 2015. Extraction and purification of high-value metabolites frommicroalgae: essential lipids, astaxanthin and phycobiliproteins.Microbial Biotechnology,8(2),190-209.
d’Ippolito, G., Sardo, A., Paris, D., Vella, F.M., Adelfi, M.G., Botte, P., Gallo, C., Fontana, A. 2015.Potential of lipid metabolism in marine diatoms for biofuel production. Biotechnology forBiofuels,8(1),1.
DaleGrey,C.2006.GrowingSoybean.Dao,L.H.,Beardall,J.2016.Effectsofleadongrowth,photosyntheticcharacteristicsandproductionof
reactiveoxygenspeciesoftwofreshwatergreenalgae.Chemosphere,147,420-429.Das, S.K., Hashimoto, T., Shimizu, K., Yoshida, T., Sakai, T., Sowa, Y., Komoto, A., Kanazawa, K. 2005.
FucoxanthininducescellcyclearrestatG0/G1phaseinhumancoloncarcinomacellsthroughup-regulation of p21 WAF1/Cip1. Biochimica et Biophysica Acta (BBA)-General Subjects,1726(3),328-335.
de Castro Araújo, S., Garcia, V.M.T. 2005. Growth and biochemical composition of the diatomChaetoceros cf.wighamii brightwell underdifferent temperature, salinity and carbondioxidelevels.I.Protein,carbohydratesandlipids.Aquaculture,246(1–4),405-412.
Del Campo, J.A., García-González, M., Guerrero, M.G. 2007. Outdoor cultivation of microalgae forcarotenoid production: current state and perspectives. Applied microbiology andbiotechnology,74(6),1163-1174.
delPilarSánchez-Camargo,A.,Pleite,N.,Herrero,M.,Cifuentes,A., Ibáñez,E.,Gilbert-López,B.2017.New approaches for the selective extraction of bioactive compounds employing bio-basedsolventsandpressurizedgreenprocesses.TheJournalofSupercriticalFluids,128,112-120.
Demirbas,A.,Demirbas,M.F.2011.Importanceofalgaeoilasasourceofbiodiesel.EnergyConversionandManagement,52(1),163-170.
Dionisio-Sese,M.L.,Miyachi, S. 1992. Theeffect of sodium chlorideon carbonic anhydrase activity inmarinemicroalgae.JournalofPhycology,28(5),619-624.
Doan,Q.C.,Moheimani,N.R.,Mastrangelo, A.J., Lewis, D.M. 2012.Microalgal biomass for bioethanolfermentation: Implications for hypersaline systems with an industrial focus. Biomass andBioenergy,46,79-88.
Doucha,J.,Lívanský,K.2014.HighDensityOutdoorMicroalgalCulture. in:AlgalBiorefineries, (Eds.)R.Bajpai,A.Prokop,M.Zappi,Vol.1,Springer,Dordrecht.Dordrecht,pp.147-173.
Du,Z.,Hu,B.,Shi,A.,Ma,X.,Cheng,Y.,Chen,P.,Liu,Y.,Lin,X.,Ruan,R.2012.CultivationofamicroalgaChlorella vulgaris using recycled aqueous phase nutrients from hydrothermal carbonizationprocess.BioresourceTechnology,126,354-357.
Dufossé, L., Galaup, P., Yaron, A., Arad, S.M., Blanc, P., ChidambaraMurthy, K.N., Ravishankar, G.A.2005.Microorganismsandmicroalgaeassourcesofpigmentsforfooduse:ascientificoddityoranindustrialreality?TrendsinFoodScience&Technology,16(9),389-406.

167
Eichenberger, W., Gribi, C. 1997. Lipids of Pavlova lutheri: cellular site and metabolic role of DGCC.Phytochemistry,45(8),1561-1567.
Emery,W.,Meincke,J.1986.Globalwatermasses-summaryandreview.OceanologicaActa,9(4),383-391.
Endo,T.,Schreiber,U.,Asada,K.1995.SuppressionofquantumyieldofphotosystemIIbyhyperosmoticstressinChlamydomonasreinhardtii.PlantandCellPhysiology,36(7),1253-1258.
Enzing,C.,Ploeg,M.,Barbosa,M., Sijtsma, L.2014.Microalgae-basedproducts for the foodand feedsector:anoutlookforEurope.IPTSInstituteforProspectivetechnologicalStudies,JRC,Seville.
Eppley, R.W. 1958. Sodium exclusion and potassium retention by the red marine alga, Porphyraperforata.TheJournalofGeneralPhysiology,41(5),901-911.
Evans, R., Kates, M., Ginzburg, M., Ginzburg, B.-Z. 1982. Lipid composition of halotolerant algae,Dunaliella parva Lerche andDunaliella tertiolecta.Biochimica etBiophysicaActa (BBA)-LipidsandLipidMetabolism,712(1),186-195.
Fabregas, J., Abalde, J., Herrero, C., Cabezas, B., Veiga, M. 1984. Growth of the marine microalgaTetraselmis suecica in batch cultures with different salinities and nutrient concentrations.Aquaculture,42(3),207-215.
Fajardo, A.R., Cerdan, L.E.,Medina, A.R., Fernández, F.G.A.,Moreno, P.A.G., Grima, E.M. 2007. Lipidextraction from themicroalgaPhaeodactylum tricornutum.European Journal of Lipid ScienceandTechnology,109(2),120-126.
Finkel,Z.V.,Beardall,J.,Flynn,K.J.,Quigg,A.,Rees,T.A.V.,Raven,J.A.2010.Phytoplanktoninachangingworld:cellsizeandelementalstoichiometry.JournalofPlanktonResearch,32(1),119-137.
Fisher,M.,Gokhman,I.,Pick,U.,Zamir,A.1996.Asalt-resistantplasmamembranecarbonicanhydraseisinducedbysaltinDunaliellasalina.JournalofBiologicalChemistry,271(30),17718-17723.
Fogg,G.2001.Algaladaptationtostress—somegeneralremarks.in:AlgalAdaptationtoEnvironmentalStresses,(Eds.)L.Rai,J.Gaur,Springer.Heidelberg,pp.1-19.
Fon-Sing,S.,Borowitzka,M.A.2016.IsolationandscreeningofeuryhalineTetraselmisspp.suitableforlarge-scale outdoor culture in hypersaline media for biofuels. Journal of Applied Phycology,28(1),1-14.
Fon Sing, S. 2010. Strain selection andoutdoor cultivation of halophilicmicroalgaewith potential forlarge-scalebiodieselproduction,PhDThesis.MurdochUniversity,WesternAustralia,pp.221.
Fon Sing, S., Isdepsky, A., Borowitzka,M., Lewis, D. 2014. Pilot-scale continuous recycling of growthmedium for the mass culture of a halotolerant Tetraselmis sp. in raceway ponds underincreasingsalinity:anovelprotocolforcommercialmicroalgalbiomassproduction.BioresourceTechnology,161,47-54.
Fon Sing, S., Isdepsky, A., Borowitzka, M.A., Moheimani, N.R. 2013. Production of biofuels frommicroalgae.MitigationandAdaptationStrategiesforGlobalChange,18(1),47-72.
Frank, G., Wegmann, K. 1974. Physiology and biochemistry of glycerol biosynthesis in Dunaliella.BiologischesZentralblatt,93,707.
Fujii, S., Nishimoto, N., Notoya, A., Hellebust, J.A. 1995. Growth and osmoregulation of Chaetocerosmuelleriinrelationtosalinity.PlantandCellPhysiology,36(5),759-764.
Garcia, J., Mujeriego, R., Hernandez-Marine, M. 2000. High rate algal pond operating strategies forurbanwastewaternitrogenremoval.JournalofAppliedPhycology,12(3-5),331-339.
Gee, R., Goyal, A., Byerrum, R.U., Tolbert, N.E. 1993. Two isoforms of dihydroxyacetone phosphatereductasefromthechloroplastsofDunaliellatertiolecta.PlantPhysiology,103(1),243-249.
Ghezelbash,F.,Farboodnia,T.,Heidari,R.,Agh,N.2008a.BiochemicaleffectsofdifferentsalinitiesandluminanceongreenmicroalgaeTetraselmischuii.ResearchJournalofBiologicalSciences,3(2),217-221.
Ghezelbash,F.,Farboodnia,T.,Heidari,R.,Agh,N.2008b.EffectsofdifferentsalinitiesandluminanceongrowthrateofthegreenmicroalgaeTetraselmischuii.ResearchJournalofBiologicalScience,3,311-314.
Gibson,J.A.E.,Roberts,D.,VandeVijver,B.2006.SalinitycontrolofthedistributionofdiatomsinlakesoftheBungerHills,EastAntarctica.PolarBiology,29(8),694-704.

168
Gilmour, D., Hipkins, M., Webber, A., Baker, N., Boney, A. 1985. The effect of ionic stress onphotosynthesisinDunaliellatertiolecta.Planta,163(2),250-256.
Ginzburg,M.1988.Dunaliella:agreenalgaadaptedtosalt.AdvancesinBotanicalresearch,14,93-183.Giovanardi,M.,Ferroni,L.,Baldisserotto,C.,Tedeschi,P.,Maietti,A.,Pantaleoni,L.,Pancaldi,S.2013.
Morphophysiological analyses of Neochloris oleoabundans (Chlorophyta) grownmixotrophicallyinacarbon-richwasteproduct.Protoplasma,250(1),161-174.
González-Delgado, Á.-D., Kafarov, V. 2011. Microalgae based biorefinery: Issues to consider. CT&F-Ciencia,TecnologíayFuturo,4(4),5-22.
González-López,C.,Cerón-García,M.,Fernández-Sevilla,J.,González-Céspedes,A.,Camacho-Rodríguez,J., Molina-Grima, E. 2013. Medium recycling for Nannochloropsis gaditana cultures foraquaculture.BioresourceTechnology,129,430-438.
Gouveia, L., Oliveira, A.C. 2009. Microalgae as a raw material for biofuels production. Journal ofIndustrialMicrobiology&Biotechnology,36(2),269-274.
Grant,C.,Bailey,L.1993.Fertilitymanagementincanolaproduction.CanadianJournalofPlantScience,73(3),651-670.
Greenwell, H., Laurens, L., Shields, R., Lovitt, R., Flynn, K. 2009. Placing microalgae on the biofuelspriority list: a review of the technological challenges. Journal of the Royal Society Interface,7(46),703-726
Griffiths,M.J.,Harrison,S.T.2009.Lipidproductivityasakeycharacteristicforchoosingalgalspeciesforbiodieselproduction.JournalofAppliedPhycology,21(5),493-507.
Grima,E.M.,Pérez,J.S.,Camacho,F.G.,Sevilla,J.F.,Fernandez,F.A.1994.Effectofgrowthrateontheeicosapentaenoic acid and docosahexaenoic acid content of Isochrysis galbana in chemostatculture.AppliedMicrobiologyandBiotechnology,41(1),23-27.
Gu, N., Lin, Q., Li, G., Tan, Y., Huang, L., Lin, J. 2012. Effect of salinity on growth, biochemicalcomposition, and lipid productivity of Nannochloropsis oculata CS 179. Engineering in LifeSciences,12(6),631-637.
Guedes, A.C., Amaro, H.M.,Malcata, F.X. 2011.Microalgae as sources of carotenoids.Marine drugs,9(4),625-644.
Guillard,R.1962.Saltandosmoticbalance.PhysiologyandBiochemistryofAlgae,929,529-540.Guillard, R.R. 1975. Culture of phytoplankton for feedingmarine invertebrates. in:Culture ofmarine
invertebrateanimals,(Eds.)M.H.Chanley,W.L.Smith,Springer.Boston,MA,pp.29-60.Guillard,R.R.,Ryther, J.H.1962.Studiesofmarineplanktonicdiatoms: I.CyclotellananaHustedt,and
Detonulaconfervacea(Cleve)Gran.CanadianJournalofMicrobiology,8(2),229-239.Guo, B., Liu, B., Yang, B., Sun, P., Lu, X., Liu, J., Chen, F. 2016. Screening of Diatom Strains and
Characterization of Cyclotella cryptica as A Potential Fucoxanthin Producer.Marine Drugs,14(7),125.
Hadj-Romdhane,F.,Jaouen,P.,Pruvost,J.,Grizeau,D.,VanVooren,G.,Bourseau,P.2012.DevelopmentandvalidationofaminimalgrowthmediumforrecyclingChlorellavulgarisculture.BioresourceTechnology,123,366-374.
Hall, D.O., Acién Fernández, F., Guerrero, E.C., Rao, K.K., Grima, E.M. 2003. Outdoor helical tubularphotobioreactorsformicroalgalproduction:Modelingoffluid-dynamicsandmasstransferandassessmentofbiomassproductivity.BiotechnologyandBioengineering,82(1),62-73.
Hart,B.T.,Bailey,P.,Edwards,R.,Hortle,K.,James,K.,McMahon,A.,Meredith,C.,Swadling,K.1991.Areviewof thesalt sensitivityof theAustralian freshwaterbiota.Hydrobiologia,210(1-2),105-144.
Hashihama,F.,Umeda,H.,Hamada,C.,Kudoh,S.,Hirawake,T.,Satoh,K.,Fukuchi,M.,Kashino,Y.2010.Light acclimation states of phytoplankton in the Southern Ocean, determined usingphotosyntheticpigmentdistribution.MarineBiology,157(10),2263-2278.
Hayward,J.1968.StudiesonthegrowthofPhaeodactylumtricornutum.JournaloftheMarineBiologicalAssociationoftheUnitedKingdom,48,295-302.
Hellebust,J.A.1976.Effectofsalinityonphotosynthesisandmannitolsynthesis inthegreenflagellatePlatymonassuecica.CanadianJournalofBotany,54(15),1735-1741.

169
Hellebust, J.A. 1985. Mechanisms of response to salinity in halotolerant microalgae. Plant and Soil,89(1),69-81.
Heo,S.-J.,Ko,S.-C.,Kang,S.-M.,Kang,H.-S.,Kim,J.-P.,Kim,S.-H.,Lee,K.-W.,Cho,M.-G.,Jeon,Y.-J.2008.CytoprotectiveeffectoffucoxanthinisolatedfrombrownalgaeSargassumsiliquastrumagainstH2O2-inducedcelldamage.EuropeanFoodResearchandTechnology,228(1),145-151.
Hill, M. 2005. The composition of sea-water comparative and descriptive oceanography. HarvardUniversityPress,USA.
Hillebrand, H., Dürselen, C.D., Kirschtel, D., Pollingher, U., Zohary, T. 1999. Biovolume calculation forpelagicandbenthicmicroalgae.JournalofPhycology,35(2),403-424.
Ho,S.-H.,Chen,C.-Y.,Chang,J.-S.2012.EffectoflightintensityandnitrogenstarvationonCO2fixationand lipid/carbohydrateproductionofan indigenousmicroalgaScenedesmusobliquusCNW-N.BioresourceTechnology,113,244-252.
Ho,S.-H.,Chen,W.-M.,Chang,J.-S.2010.ScenedesmusobliquusCNW-NasapotentialcandidateforCO2mitigationandbiodieselproduction.BioresourceTechnology,101(22),8725-8730.
Hodgson,P.A.,Henderson,R.J.,Sargent, J.R., Leftley, J.W.1991.Patternsofvariation in the lipidclassand fatty acid composition of Nannochloropsis oculata (Eustigmatophyceae) during batchculture.JournalofAppliedPhycology,3(2),169-181.
Hoffman,J.2016.Techno-economicassessmentofmicro-algaeproductionsystems.in:MechanicalandAerospaceEngineering,Vol.MSThesis,UtahStateUniversity.USA,pp.36.
Hoffmann, M., Marxen, K., Schulz, R., Vanselow, K.H. 2010. TFA and EPA productivities ofNannochloropsis salina influenced by temperature and nitrate stimuli in turbidostaticcontrolledexperiments.MarineDrugs,8(9),2526-2545.
Hosokawa,M., Kudo,M.,Maeda, H., Kohno, H., Tanaka, T.,Miyashita, K. 2004. Fucoxanthin inducesapoptosisandenhancestheantiproliferativeeffectofthePPARγligand,troglitazone,oncoloncancercells.BiochimicaetBiophysicaActa(BBA)-GeneralSubjects,1675(1),113-119.
Hu, Q. 2008. Environmental effects on cell composition. in: Handbook of Microalgal Culture:BiotechnologyandAppliedPhycology,(Ed.)A.Richmond,Vol.1,JohnWiley&Sons.Oxford,UK,pp.584.
Huang,G.,Chen,F.,Wei,D.,Zhang,X.,Chen,G.2010.Biodieselproductionbymicroalgalbiotechnology.AppliedEnergy,87(1),38-46.
Huang,X.,Huang,Z.,Wen,W.,Yan,J.2013.Effectsofnitrogensupplementationoftheculturemediumon the growth, total lipid content and fatty acid profiles of three microalgae (Tetraselmissubcordiformis, Nannochloropsis oculata and Pavlova viridis). Journal of Applied Phycology,25(1),129-137.
Huerlimann, R., De Nys, R., Heimann, K. 2010. Growth, lipid content, productivity, and fatty acidcompositionoftropicalmicroalgaeforscale-upproduction.BiotechnologyandBioengineering,107(2),245-257.
Huflejt,M.E.,Tremolieres,A.,Pineau,B.,Lang,J.K.,Hatheway,J.,Packer,L.1990.ChangesinmembranelipidcompositionduringsalinegrowthofthefreshwatercyanobacteriumSynechococcus6311.PlantPhysiology,94(4),1512-1521.
Huntley,M.E., Redalje,D.G. 2007. CO2mitigation and renewableoil fromphotosyntheticmicrobes: anewappraisal.MitigationandAdaptationStrategiesforGlobalChange,12(4),573-608.
Ikeda,K.,Kitamura,A.,Machida,H.,Watanabe,M.,Negishi,H.,Hiraoka, J.,Nakano,T.2003.EffectofUndariapinnatifida(Wakame)onthedevelopmentofcerebrovasculardiseasesinstroke-pronespontaneously hypertensive rats. Clinical and Experimental Pharmacology and Physiology,30(1-2),44-48.
Imada,N., Kobayashi, K., Tahara, K.,Oshima, Y. 1991. Productionof an autoinhibitor bySkeletonemacostatumanditseffectonthegrowthofotherphytoplankton.NipponSuisanGakkaishi,57(12),2285-90.
Indrayani, I.2017. Isolationandcharacterizationofmicroalgaewithcommercialpotential,PhDThesis.MurdochUniversity,WesternAustralia214pp.
Isdepsky, A. 2015. Salinemicroalgae for biofuels: Outdoor culture from small-scale to pilot scale. in:School of Vaterinary and Life Sciences, Vol. PhD Thesis, PhD Thesis Murdoch University,WesternAustralia240pp.

170
Ishika, T.,Moheimani,N.R., Bahri, P.A. 2017a. Sustainable salinemicroalgae co-cultivation for biofuelproduction:Acriticalreview.RenewableandSustainableEnergyReviews,78,356-368.
Ishika, T., Moheimani, N.R., Bahri, P.A., Laird, D.W., Blair, S., Parlevliet, D. 2017b. Halo-adaptedmicroalgae for fucoxanthin production: Effect of incremental increase in salinity. AlgalResearch,28,66-73.
Jeffrey,S.W.,Humphrey,G.F.1975.Newspectrophotometricequationsfordeterminingchlorophyllsa,b,c1andc2 inhigherplants,algaeandnaturalphytoplankton.BiochemieundPhysiologiederPflanzen,167(2),191-194.
Ji,M.-K.,Abou-Shanab,R.A.,Hwang,J.-H.,Timmes,T.C.,Kim,H.-C.,Oh,Y.-K.,Jeon,B.-H.2013.Removalof nitrogen and phosphorus from piggery wastewater effluent using the green microalgaScenedesmusobliquus.JournalofEnvironmentalEngineering,139(9),1198-1205.
Jiménez,C.,Niell,F.X.1991.GrowthofDunaliellaviridisTeodoresco:effectofsalinity,temperatureandnitrogenconcentration.JournalofAppliedPhycology,3(4),319-327.
Jin,E.,Polle,J.E.,Lee,H.-K.,Hyun,S.-M.,Chang,M.2003.Xanthophyllsinmicroalgae:frombiosynthesisto biotechnological mass production and application. Journal of microbiology andbiotechnology,13(2),165-174.
John,R.P.,Anisha,G.,Nampoothiri,K.M.,Pandey,A.2011.Microandmacroalgalbiomass:arenewablesourceforbioethanol.BioresourceTechnology,102(1),186-193.
Johnson, K.R., Admassu,W. 2013.Mixed algae cultures for low cost environmental compensation incultures grown for lipid production and wastewater remediation. Journal of ChemicalTechnologyandBiotechnology,88(6),992-998.
Jørgensen,E.G.1956.Growthinhibitingsubstancesformedbyalgae.PhysiologiaPlantarum,9(4),712-726.
Kan,G.,Shi,C.,Wang,X.,Xie,Q.,Wang,M.,Wang,X.,Miao,J.2012.Acclimatoryresponsestohigh-saltstress in Chlamydomonas (Chlorophyta, Chlorophyceae) from Antarctica. Acta OceanologicaSinica,31(1),116-124.
Kang,K.-H.,Qian,Z.-J.,Ryu,B.,Kim,S.-K.2011.Characterizationofgrowthandproteincontents frommicroalgae Navicula incerta with the investigation of antioxidant activity of enzymatichydrolysates.FoodScienceandBiotechnology,20(1),183-191.
Kaplan,D.,Cohen,Z.,Abeliovich,A.1986.Optimalgrowthconditions for Isochrysisgalbana.Biomass,9(1),37-48.
Karydis, M., Fogg, G. 1980. Physiological effects of hydrocarbons on the marine diatom Cyclotellacryptica.MicrobialEcology,6(4),281-290.
Kates,M.,Volcani,B.1966.Lipidcomponentsofdiatoms.BiochimicaetBiophysicaActa(BBA)-LipidsandLipidMetabolism,116(2),264-278.
Katz,A.,Paz,Y.,Pick,U.2009.SalinityToleranceandIronDeprivationResistanceMechanismsRevealedbyProteomicAnalyzesinDunaliellasalina.in:TheAlgaDunaliella,(Eds.)A.Ben-Amotz,J.Polle,S.Rao,SciencePublishers,pp.341-358.
Keshtacher-Liebso,E.,Hadar,Y.,Chen,Y.1995.Oligotrophicbacteriaenhancealgalgrowthunderiron-deficientconditions.AppliedandEnvironmentalMicrobiology,61(6),2439-2441.
Kheiralla,K.,Eshag,A.,Elzien,S.,Saud,S.,Al-Imam,O.2014.SeasonalVariationofAlgaeTypes,CountsandTheirEffectonPurifiedWaterQualityCaseStudy:Al-MogranandBurriPlants,KhartoumState,Sudan.JournalofBiodiversity&EndangeredSpecies.
Khomutov,G.,Fry,I.V.,Huflejt,M.E.,Packer,L.1990.Membranelipidcomposition,fluidity,andsurfacechargechangesinresponsetogrowthofthefreshwatercyanobacteriumSynechococcus6311underhighsalinity.ArchivesofBiochemistryandBiophysics,277(2),263-267.
Kim, S.M., Jung, Y.-J., Kwon, O.-N., Cha, K.H., Um, B.-H., Chung, D., Pan, C.-H. 2012a. A potentialcommercial sourceof fucoxanthin extracted from themicroalgaPhaeodactylum tricornutum.AppliedBiochemistryandBiotechnology,166(7),1843-1855.
Kim,S.M.,Kang,S.-W.,Kwon,O.-N.,Chung,D.,Pan,C.-H.2012b.FucoxanthinasamajorcarotenoidinIsochrysisaff.galbana:Characterizationofextractionforcommercialapplication.JournaloftheKoreanSocietyforAppliedBiologicalChemistry,55(4),477-483.
Kirst,G.1977.Coordinationofionicrelationsandmannitolconcentrationsintheeuryhalineunicellularalga,Platymonassubcordiformis(Hazen)afterosmoticshocks.Planta,135(1),69-75.

171
Kirst,G.1990.Salinitytoleranceofeukaryoticmarinealgae.AnnualReviewofPlantBiology,41(1),21-53.
Kirst, G. 1988. Turgor pressure regulation in marine macroalgae, Cambridge University Press:Cambridge,UK,pp.203-209.
Kishimoto, M., Okakura, T., Nagashima, H., Minowa, T., Yokoyama, S.-Y., Yamaberi, K. 1994. CO 2fixation and oil production using micro-algae. Journal of Fermentation and Bioengineering,78(6),479-482.
Klok, A.J., Martens, D.E., Wijffels, R.H., Lamers, P.P. 2013. Simultaneous growth and neutral lipidaccumulationinmicroalgae.BioresourceTechnology,134,233-243.
Kochert, G. 1978. Carbohydrate determination by the phenol-sulfuric acid method. in: Handbook ofPhycologicalMethods,(Eds.)J.A.Helebust,J.S.Craig,CambridgeUniversityPress.London,pp.95-97.
Koller,M.2015.DesignofClosedPhotobioreactorsforAlgalCultivation.in:AlgalBiorefineries:Volume2:ProductsandRefineryDesign,(Eds.)A.Prokop,R.K.Bajpai,M.E.Zappi,SpringerInternationalPublishing.Cham,pp.133-186.
Koreivienė, J., Valčiukas, R., Karosienė, J., Baltrėnas, P. 2014. Testing of Chlorella/Scenedesmusmicroalgae consortia for remediation of wastewater, CO2 mitigation and algae biomassfeasibility for lipid production. Journal of Environmental Engineering and LandscapeManagement,22(2),105-114.
Körner, S., Nicklisch, A. 2002. Allelopathic growth inhibition of selected phytoplankton species bysubmergedmacrophytes.JournalofPhycology,38(5),862-871.
Kotake-Nara,E.,Kushiro,M.,Zhang,H.,Sugawara,T.,Miyashita,K.,Nagao,A.2001.Carotenoidsaffectproliferationofhumanprostatecancercells.TheJournalofnutrition,131(12),3303-3306.
Kromkamp,J.,Peene,J.1999.EstimationofphytoplanktonphotosynthesisandnutrientlimitationintheEasternScheldtestuaryusingvariablefluorescence.AquaticEcology,33(1),101-104.
Lakaniemi,A.-M.,Hulatt,C.J.,Thomas,D.N.,Tuovinen,O.H.,Puhakka,J.A.2011.BiogenichydrogenandmethaneproductionfromChlorellavulgarisandDunaliellatertiolectabiomass.BiotechnologyforBiofuels,4(1),1.
Lawton,R.J.,Cole,A.J.,Roberts,D.A.,Paul,N.A.,deNys,R.2017.The industrialecologyof freshwatermacroalgaeforbiomassapplications.AlgalResearch,24,486-491.
Lee,A.K.,Lewis,D.M.,Ashman,P.J.2013.Harvestingofmarinemicroalgaebyelectroflocculation:Theenergetics,plantdesign,andeconomics.AppliedEnergy,108(SupplementC),45-53.
Lee, J.-B. 2002. Growth characteristics of five microalgal species isolated from Jeju Island and fourmicroalgalstockstrainsinhatchery.Algae,17(2),117-125.
Lee, Y.-K. 1997. Commercial production of microalgae in the Asia-Pacific rim. Journal of AppliedPhycology,9(5),403-411.
Lee,Y.-K.2001.Microalgalmassculturesystemsandmethods:theirlimitationandpotential.JournalofAppliedPhycology,13(4),307-315.
Lee,Y.-K.,Ding,S.-Y.,Low,C.-S.,Chang,Y.-C.,Forday,W.L.,Chew,P.-C.1995.Designandperformanceofan α-type tubular photobioreactor for mass cultivation of microalgae. Journal of AppliedPhycology,7(1),47-51.
Levine, R.B., Sierra, C.O.S., Hockstad, R., Obeid, W., Hatcher, P.G., Savage, P.E. 2013. The use ofhydrothermal carbonization to recycle nutrients in algal biofuel production. EnvironmentalProgress&SustainableEnergy,32(4),962-975.
Lewin, J. 1966. Silicon metabolism in diatoms. V. Germanium dioxide, a specific inhibitor of diatomgrowthPhycologia,6(1),1-12.
Li,Y.,Horsman,M.,Wang,B.,Wu,N.,Lan,C.Q.2008.EffectsofnitrogensourcesoncellgrowthandlipidaccumulationofgreenalgaNeochlorisoleoabundans.AppliedMicrobiologyandBiotechnology,81(4),629-636.
Li,Y.,Moheimani,N.R.,Schenk,P.M.2012.CurrentresearchandperspectivesofmicroalgalbiofuelsinAustralia.Biofuels,3(4),427-439.

172
Liffman, K., Paterson, D.A., Liovic, P., Bandopadhayay, P. 2013. Comparing the energy efficiency ofdifferenthigh rate algal racewayponddesignsusing computational fluiddynamics.ChemicalEngineeringResearchandDesign,91(2),221-226.
Lionard,M.,Muylaert,K.,VanGansbeke,D.,Vyverman,W.2005. Influenceof changes in salinityandlight intensity on growth of phytoplankton communities from the Schelde river and estuary(Belgium/TheNetherlands).Hydrobiologia,540(1-3),105-115.
Liu,G.2014.Developmentofageneralsustainabilityindicatorforrenewableenergysystems:Areview.RenewableandSustainableEnergyReviews,31,611-621.
Loeblich, L.A. 1982. Photosynthesis and pigments influenced by light intensity and salinity in thehalophileDunaliella salina (Chlorophyta). Journal of theMarine Biological Association of theUnitedKingdom,62(03),493-508.
Louda, J.W., Li, J., Liu, L.,Winfree,M.N., Baker, E.W. 1998. Chlorophyll-a degradation during cellularsenescenceanddeath.OrganicGeochemistry,29(5),1233-1251.
Lowrey,J.,Armenta,R.E.,Brooks,M.S.2016.Nutrientandmediarecyclinginheterotrophicmicroalgaecultures.AppliedMicrobiologyandBiotechnology,100(3),1061-1075.
Lu, C., Vonshak, A. 1999. Characterization of PSII photochemistry in salt-adapted cells ofcyanobacteriumSpirulinaplatensis.NewPhytologist,141(2),231-239.
Lu,C.,Vonshak,A.2002.EffectsofsalinitystressonphotosystemIIfunctionincyanobacterialSpirulinaplatensiscells.PhysiologiaPlantarum,114(3),405-413.
Lv, J.-M., Cheng, L.-H., Xu, X.-H., Zhang, L., Chen, H.-L. 2010. Enhanced lipid production of Chlorellavulgarisbyadjustmentofcultivationconditions.BioresourceTechnology,101(17),6797-6804.
Macías-Sánchez,M.D.,Mantell, C., Rodríguez,M.,Martínez de laOssa, E., Lubián, L.M.,Montero, O.2009.Comparisonof supercritical fluidandultrasound-assistedextractionofcarotenoidsandchlorophyllafromDunaliellasalina.Talanta,77(3),948-952.
Maeda, H., Hosokawa, M., Sashima, T., Funayama, K., Miyashita, K. 2007a. Effect of medium-chaintriacylglycerolsonanti-obesityeffectoffucoxanthin.JournalofOleoScience,56(12),615-621.
Maeda,H.,Hosokawa,M.,Sashima,T.,Miyashita,K.2007b.Dietarycombinationoffucoxanthinandfishoil attenuates the weight gain of white adipose tissue and decreases blood glucose inobese/diabeticKK-Aymice.JournalofAgriculturalandFoodChemistry,55(19),7701-7706.
Malis, S.A., Cohen, E., Ben Amotz, A. 1993. Accumulation of canthaxanthin in Chlorella emersonii.PhysiologiaPlantarum,87(2),232-236.
Marchal, L., Mojaat-Guemir, M., Foucault, A., Pruvost, J. 2013. Centrifugal partition extraction of β-carotene from Dunaliella salina for efficient and biocompatible recovery of metabolites.BioresourceTechnology,134(SupplementC),396-400.
Martin-Jézéquel,V.,Hildebrand,M.,Brzezinski,M.A.2000.Siliconmetabolismindiatoms: implicationsforgrowth.JournalofPhycology,36(5),821-840.
Maruyama, I., Nakao, T., Shigeno, I., Ando, Y., Hirayama, K. 1997. Application of unicellular algaeChlorella vulgaris for themass-culture ofmarine rotifer Brachionus.Hydrobiologia,358(1-3),133-138.
Masojídek, J., Kopecký, J., Giannelli, L., Torzillo, G. 2011. Productivity correlated to photobiochemicalperformance of Chlorella mass cultures grown outdoors in thin-layer cascades. Journal ofindustrialmicrobiology&biotechnology,38(2),307-317.
Mata, T.M., Martins, A.A., Caetano, N.S. 2010. Microalgae for biodiesel production and otherapplications:Areview.RenewableandSustainableEnergyReviews,14(1),217-232.
Matsumoto, M., Sugiyama, H., Maeda, Y., Sato, R., Tanaka, T., Matsunaga, T. 2010. Marine diatom,Navicula sp. strain JPCC DA0580 and marine green alga, Chlorella sp. strain NKG400014 aspotential sources forbiodieselproduction.AppliedBiochemistryandBiotechnology,161(1-8),483-490.
Maxwell, E.L., Folger, A.G., Hogg, S.E. 1985. Resource evaluation and site selection for microalgaeproduction systems. Solar Energy Research Institute. SERI/TR-215-2484; Other: ON:DE85008807United States 10.2172/5585709Other:ON:DE85008807NTIS, PCA05/MFA01.NRELEnglish.
McLachlan,J.1961.Theeffectofsalinityongrowthandchlorophyllcontentinrepresentativeclassesofunicellularmarinealgae.CanadianJournalofMicrobiology,7(3),399-406.

173
Mercz, T.I. 1994.A studyofhigh lipidyieldingmicroalgaewithpotential for large-scaleproductionoflipidsandpolyunsaturatedfattyacids,PhDThesis.MurdochUniversity,WestermAustralia278pp.
Meteorology,B.o.2008.ClimatestatisticsforAustralianlocations.AustralianGovernment.Miao,X.,Wu,Q.2006.Biodieselproductionfromheterotrophicmicroalgaloil.BioresourceTechnology,
97(6),841-846.Michels, M.H., van der Goot, A.J., Norsker, N.-H., Wijffels, R.H. 2010. Effects of shear stress on the
microalgaeChaetocerosmuelleri.BioprocessandBiosystemsEngineering,33(8),921-927.Mingazzini,M.,Palumbo,M.T.2015.Openmassculturesofmarinemicroalgaeforbiodieselproduction:
Laboratoryapproachtostudyspeciescompetitioninmixedcultures.NaturalResources,6(03),174.
Mishra,A.,Jha,B.2009.Isolationandcharacterizationofextracellularpolymericsubstancesfrommicro-algaeDunaliellasalinaundersaltstress.BioresourceTechnology,100(13),3382-3386.
Miyashita,K.,Nishikawa,S.,Beppu,F.,Tsukui,T.,Abe,M.,Hosokawa,M.2011.Thealleniccarotenoidfucoxanthin,anovelmarinenutraceuticalfrombrownseaweeds.JournaloftheScienceofFoodandAgriculture,91(7),1166-1174.
Moen, E. 2008. Biological degradation of brown seaweeds. The potential of marine biomass foranaerobicbiogasproduction.Argyll,Scotland:ScottishAssociationforMarineScienceOban,9,157-166.
Moheimani,N.R. 2005. The cultureof coccolithophorid algae for carbondioxidebioremediation, PhDThesis.MurdochUniversity,WesternAustralia252pp.
Moheimani,N.R.2013a.InorganiccarbonandpHeffectongrowthandlipidproductivityofTetraselmissuecica and Chlorella sp (Chlorophyta) grown outdoors in bag photobioreactors. Journal ofAppliedPhycology,25(2),387-398.
Moheimani, N.R. 2013b. Long-term outdoor growth and lipid productivity of Tetraselmis suecica,DunaliellatertiolectaandChlorellasp(Chlorophyta)inbagphotobioreactors.JournalofAppliedPhycology,25(1),167-176.
Moheimani,N.R.2016.TetraselmissuecicacultureforCO2bioremediationofuntreatedfluegasfromacoal-firedpowerstation.JournalofAppliedPhycology,28(4),2139-2146.
Moheimani,N.R.,Borowitzka,M.A.2011.IncreasedCO2andtheeffectofpHongrowthandcalcificationof Pleurochrysis carterae and Emiliania huxleyi (Haptophyta) in semicontinuous cultures.AppliedMicrobiologyandBiotechnology,90(4),1399-1407.
Moheimani, N.R., Borowitzka,M.A. 2006. The long-term culture of the coccolithophorePleurochrysiscarterae(Haptophyta)inoutdoorracewayponds.JournalofAppliedPhycology,18(6),703-712.
Moheimani,N.R., Borowitzka,M.A., Isdepsky, A., Fon Sing, S. 2013. Standardmethods formeasuringgrowth of algae and their composition. in: Algae for Biofuels and Energy, (Eds.) Michael A.Borowitzka,N.R.Moheimani,Springer.Dordrecht,pp.265-284.
Moheimani,N.R.,Matsuura,H.,Watanabe,M.M.,Borowitzka,M.A.2014.Non-destructivehydrocarbonextraction from Botryococcus braunii BOT-22 (race B). Journal of Applied Phycology, 26(3),1453-1463.
Moheimani, N.R., Parlevliet, D. 2013. Sustainable solar energy conversion to chemical and electricalenergy.RenewableandSustainableEnergyReviews,27,494-504.
Moheimani,N.R.,Parlevliet,D.,McHenry,M.P.,Bahri,P.A.,deBoer,K.2015.Past,presentandfutureofmicroalgaecultivationdevelopments. in:BiomassandBiofuels fromMicroalgae, (Eds.)M.N.,M.M.,d.B.K.,B.P.,Springer.Cham,pp.1-18.
MolinaGrima,E.,Belarbi, E.H.,AciénFernández, F.G.,RoblesMedina,A.,Chisti, Y. 2003.Recoveryofmicroalgalbiomassandmetabolites:processoptionsandeconomics.BiotechnologyAdvances,20(7–8),491-515.
Montero,M.F., Aristizábal,M., Reina, G.G. 2011. Isolation of high-lipid content strains of themarinemicroalga Tetraselmis suecica for biodiesel production by flow cytometry and single-cellsorting.JournalofAppliedPhycology,23(6),1053-1057.
Moreau,D.,Tomasoni,C.,Jacquot,C.,Kaas,R.,LeGuedes,R.,Cadoret,J.-P.,Muller-Feuga,A.,Kontiza,I., Vagias, C., Roussis, V. 2006. Cultivated microalgae and the carotenoid fucoxanthin from

174
Odontella aurita as potent anti-proliferative agents in bronchopulmonary and epithelial celllines.EnvironmentalToxicologyandPharmacology,22(1),97-103.
Munro, P., McLean, H., Barbour, A., Birkbeck, T. 1995. Stimulation or inhibition of growth of theunicellularalgaPavlovalutheribybacteriaisolatedfromlarvalturbotculturesystems.JournalofAppliedBacteriology,79(5),519-524.
Napolitano, G.E., Ackman, R.G., Ratnayake, W. 1990. Fatty acid composition of three cultured algalspecies (Isochvysisgalbana,ChaetocerosgracilisandChaetoceroscalcitrans)usedas food forbivalvelarvae.JournaloftheWorldAquacultureSociety,21(2),122-130.
Nedbal, L., Trtílek, M., Červený, J., Komárek, O., Pakrasi, H.B. 2008. A photobioreactor system forprecision cultivation of photoautotrophic microorganisms and for high-content analysis ofsuspensiondynamics.BiotechnologyandBioengineering,100(5),902-910.
Nobre,B.P.,Villalobos, F., Barragán,B.E.,Oliveira,A.C., Batista,A.P.,Marques, P.A.S.S.,Mendes,R.L.,Sovová,H.,Palavra,A.F.,Gouveia,L.2013.AbiorefineryfromNannochloropsissp.microalga–Extraction of oils and pigments. Production of biohydrogen from the leftover biomass.BioresourceTechnology,135,128-136.
Norsker,N.-H.,Barbosa,M.J.,Vermuë,M.H.,Wijffels,R.H.2011.Microalgalproduction—Acloselookattheeconomics.BiotechnologyAdvances,29(1),24-27.
Novoveská, L., Franks,D.T.,Wulfers, T.A.,Henley,W.J. 2016. Stabilizing continuousmixed cultures ofmicroalgae.AlgalResearch,13,126-133.
Nwoba, E.G., Ayre, J.M., Moheimani, N.R., Ubi, B.E., Ogbonna, J.C. 2016. Growth comparison ofmicroalgaeintubularphotobioreactorandopenpondfortreatinganaerobicdigestionpiggeryeffluent.AlgalResearch,17,268-276.
Oku, O., Kamatani, A. 1997. Resting spore formation of the marine planktonic diatom Chaetocerosanastomosans induced by high salinity and nitrogen depletion.Marine Biology, 127(3), 515-520.
Olivieri,G.,Gargano,I.,Andreozzi,R.,Marotta,R.,Marzocchella,A.,Pinto,G.,Pollio,A.2013.Effectsofphotobioreactors design and operating conditions on Stichococcus bacillaris biomass andbiodieselproduction.BiochemicalEngineeringJournal,74,8-14.
Olivieri, G., Marzocchella, A., Andreozzi, R., Pinto, G., Pollio, A. 2011. Biodiesel production fromStichococcus strains at laboratory scale. Journal of Chemical Technology and Biotechnology,86(6),776-783.
Oswald,W.,Gotass,H.1957.Photosynthesisinsewagetreatment.TransactionsoftheAmericanSocietyofCivilEngineers,122(1),73-105.
Pal, D., Khozin-Goldberg, I., Cohen, Z., Boussiba, S. 2011. The effect of light, salinity, and nitrogenavailabilityonlipidproductionbyNannochloropsissp.AppliedMicrobiologyandBiotechnology,90(4),1429-1441.
Pasquet,V.,Chérouvrier,J.-R.,Farhat,F.,Thiéry,V.,Piot,J.-M.,Bérard,J.-B.,Kaas,R.,Serive,B.,Patrice,T.,Cadoret,J.-P.2011a.Studyonthemicroalgalpigmentsextractionprocess:Performanceofmicrowaveassistedextraction.ProcessBiochemistry,46(1),59-67.
Pasquet,V.,Chérouvrier,J.-R.,Farhat,F.,Thiéry,V.,Piot,J.-M.,Bérard,J.-B.,Kaas,R.,Serive,B.,Patrice,T., Cadoret, J.-P., Picot, L. 2011b. Study on the microalgal pigments extraction process:Performanceofmicrowaveassistedextraction.ProcessBiochemistry,46(1),59-67.
Patil,V.,Källqvist,T.,Olsen,E.,Vogt,G.,Gislerød,H.R.2007.Fattyacidcompositionof12microalgaeforpossibleuseinaquaculturefeed.AquacultureInternational,15(1),1-9.
Peeler, T.C., Stephenson, M.B., Einspahr, K.J., Thompson, G.A. 1989. Lipid characterization of anenriched plasmamembrane fraction ofDunaliella salina grown in media of varying salinity.PlantPhysiology,89(3),970-976.
Peng, J., Yuan, J.-P.,Wu, C.-F.,Wang, J.-H. 2011. Fucoxanthin, amarine carotenoid present in brownseaweedsanddiatoms:metabolismandbioactivitiesrelevanttohumanhealth.Marinedrugs,9(10),1806-1828.
Phatarpekar, P., Sreepada, R., Pednekar, C., Achuthankutty, C. 2000. A comparative study on growthperformance and biochemical composition of mixed culture of Isochrysis galbana andChaetoceroscalcitranswithmonocultures.Aquaculture,181(1),141-155.

175
Pick,U.,Karni,L.,Avron,M.1986.DeterminationofioncontentandionfluxesinthehalotolerantalgaDunaliellasalina.PlantPhysiology,81(1),92-96.
Pirt, S.J., Lee, Y.K.,Walach,M.R., Pirt,M.W., Balyuzi, H.H., Bazin,M.J. 1983. A tubular bioreactor forphotosyntheticproductionofbiomassfromcarbondioxide:designandperformance.JournalofChemicalTechnologyandBiotechnology,33(1),35-58.
Posten, C., Schaub, G. 2009.Microalgae and terrestrial biomass as source for fuels—a process view.JournalofBiotechnology,142(1),64-69.
Pratt, R. 1942. Studies on Chlorella vulgaris. V. Some properties of the growth-inhibitor formed byChlorellacells.AmericanJournalofBotany,142-148.
Pratt, R., Fong, J. 1940. Studies on Chlorella vulgaris II. Further evidence that Chlorella cells form agrowth-inhibitingsubstance.AmericanJournalofBotany,431-436.
Ramanna,L.,Guldhe,A.,Rawat,I.,Bux,F.2014.TheoptimizationofbiomassandlipidyieldsofChlorellasorokinianawhenusingwastewatersupplementedwithdifferentnitrogensources.BioresourceTechnology,168,127-135.
Reed,R.,Stewart,W.1988.Theresponsesofcyanobacteriatosaltstress.Regan, D., Ivancic, N. 1984. Mixed populations of marine microalgae in continuous culture: Factors
affecting species dominance and biomass productivity. Biotechnology and Bioengineering,26(11),1265-1271.
Reichert, C.d.C., Reinehr, C.O., Costa, J.A.V. 2006. Semicontinuous cultivation of the cyanobacteriumSpirulinaplatensisinaclosedphotobioreactor.BrazilianJournalofChemicalEngineering,23(1),23-28.
Reitan,K.I.,Rainuzzo,J.R.,Olsen,Y.1994.Effectofnutrientlimitationonfattyacidandlipidcontentofmarinemicroalgae1.JournalofPhycology,30(6),972-979.
Renaud, S., Parry, D. 1994.Microalgae for use in tropical aquaculture II: Effect of salinity on growth,grosschemicalcompositionandfattyacidcompositionofthreespeciesofmarinemicroalgae.JournalofAppliedPhycology,6(3),347-356.
Renaud,S.,Parry,D.,Thinh,L.-V.1994.MicroalgaeforuseintropicalaquacultureI:GrosschemicalandfattyacidcompositionoftwelvespeciesofmicroalgaefromtheNorthernTerritory,Australia.JournalofAppliedPhycology,6(3),337-345.
Renaud,S.,Zhou,H.,Parry,D.,Thinh,L.-V.,Woo,K.1995.Effectof temperatureon thegrowth, totallipidcontentandfattyacidcompositionofrecentlyisolatedtropicalmicroalgae Isochrysissp.,Nitzschia closterium, Nitzschia paleacea, and commercial species Isochrysis sp.(clone T. ISO).JournalofAppliedphycology,7(6),595-602.
Renaud,S.M.,Thinh,L.-V.,Parry,D.L.1999.Thegrosschemicalcompositionandfattyacidcompositionof 18 species of tropical Australianmicroalgae for possible use in mariculture.Aquaculture,170(2),147-159.
Rezvani, S., Moheimani, N., Bahri, P. 2016. Techno-economic assessment of CO2 bio-fixation usingmicroalgae in connection with three different state-of-the-art power plants. Computers &ChemicalEngineering,84,290-301.
Rice, T.R. 1954. Biotic influences affecting population growth of planktonic algae, Vol. 54, Fish andwildlifeservice,TheUnitedStatesofAmerica.Washington.
Rodolfi,L.,ChiniZittelli,G.,Bassi,N.,Padovani,G.,Biondi,N.,Bonini,G.,Tredici,M.R.2009.Microalgaeforoil:Strainselection,inductionoflipidsynthesisandoutdoormasscultivationinalow-costphotobioreactor.BiotechnologyandBioengineering,102(1),100-112.
Ross, A., Biller, P., Kubacki, M., Li, H., Lea-Langton, A., Jones, J. 2010. Hydrothermal processing ofmicroalgaeusingalkaliandorganicacids.Fuel,89(9),2234-2243.
Sahoo,D.,Elangbam,G.,Devi,S.S.2012.Usingalgaeforcarbondioxidecaptureandbiofuelproductiontocombatclimatechange.Phykos,42(1),32-38.
Sanders, W.B. 2001. Lichens: The Interface between mycology and plant morphology whereas mostother fungi live as an absorptive mycelium inside their food substrate, the lichen fungiconstruct a plant-like body within which photosynthetic algal symbionts are cultivated.Bioscience,51(12),1025-1035.

176
Santos,M.M.D.,Moreno-Garrido,I.,Gonçalves,F.,Soares,A.M.,Ribeiro,R.2002.Aninsitubioassayforestuarine environments using the microalga Phaeodactylum tricornutum. EnvironmentalToxicologyandChemistry,21(3),567-574.
Satoh,K.,Smith,C.M.,Fork,D.C.1983.EffectsofsalinityonprimaryprocessesofphotosynthesisintheredalgaPorphyraperforata.PlantPhysiology,73(3),643-647.
Schenk, P.M., Thomas-Hall, S.R., Stephens, E., Marx, U.C., Mussgnug, J.H., Posten, C., Kruse, O.,Hankamer, B. 2008. Second generation biofuels: high-efficiency microalgae for biodieselproduction.BioenergyResearch,1(1),20-43.
Schumann, R., Häubner, N., Klausch, S., Karsten, U. 2005. Chlorophyll extraction methods for thequantificationofgreenmicroalgaecolonizingbuildingfacades.InternationalBiodeterioration&Biodegradation,55(3),213-222.
Scragg,A.,Illman,A.,Carden,A.,Shales,S.2002.Growthofmicroalgaewithincreasedcalorificvaluesinatubularbioreactor.BiomassandBioenergy,23(1),67-73.
Serafin,L.,Belfield,S.Sunflowerproductionguidelinesforthenortherngrainsregion.Shannon, E., Abu-Ghannam, N. 2017. Optimisation of fucoxanthin extraction from Irish seaweeds by
responsesurfacemethodology.JournalofAppliedPhycology,29(2),1027-1036.Sheehan, J., Dunahay, T., Benemann, J., Roessler, P. 1998. A Look Back at the U.S. Department of
Energy’s Aquatic Species Program—Biodiesel from Algae. National Renewable Energy Lab.NREL/TP-580-24190; TRN: US200420%%272 United States 10.2172/15003040 TRN:US200420%%272NRELEnglish.
Shen,Y.,Yuan,W.,J.Pei,Z.,Wu,Q.,Mao,E.2009.Microalgaemassproductionmethods.TransactionsoftheASABE,52(4),1275.
Sigaud,T.C.S.,Aidar,E.1993.Salinityandtemperatureeffectsonthegrowthandchlorophyll-αcontentofsomeplanktonicaigae.BoletimdoInstitutoOceanográfico,41(1-2),95-103.
Simionato, D., Sforza, E., Carpinelli, E.C., Bertucco, A., Giacometti, G.M., Morosinotto, T. 2011.Acclimation ofNannochloropsis gaditana to different illumination regimes: effects on lipidsaccumulation.BioresourceTechnology,102(10),6026-6032.
Smith,C.M.,Berry,J.A.1986.Recoveryofphotosynthesisafterexposureof intertidalalgaetoosmoticand temperature stresses: comparative studies of specieswith differing distributional limits.Oecologia,70(1),6-12.
Steen,I.1998.Managementofanon-renewableresource.PhosphorusandPotassium(217),25-31.Steinke, M., Kirst, G.O. 1996. Enzymatic cleavage of dimethylsulfoniopropionate (DMSP) in cell-free
extractsofthemarinemacroalgaEnteromorphaclathrata(Roth)Grev.(Ulvales,Chlorophyta).JournalofExperimentalMarineBiologyandEcology,201(1),73-85.
Stewart,W.D.P.1974.AlgalPhysiologyandBiochemistry.UniversityofCaliforniaPress,USA.Strizh, I., Popova, L., Balnokin, Y.V. 2004.Physiological aspectsof adaptationof themarinemicroalga
Tetraselmis(Platymonas)viridistovariousmediumsalinity.RussianJournalofPlantPhysiology,51(2),176-182.
Su, C.-H. 2011. Factors affecting lipid accumulation by Nannochloropsis oculata in a two-stagecultivationprocess.JournalofAppliedPhycology,23(5),903-908.
Sugawara,T.,Matsubara,K.,Akagi,R.,Mori,M.,Hirata,T.2006.Antiangiogenicactivityofbrownalgaefucoxanthin and its deacetylated product, fucoxanthinol. Journal of Agricultural and FoodChemistry,54(26),9805-9810.
Sukenik,A.1999.ProductionofeicosapentaenoicacidbythemarineeustigmatophyteNannochloropsis.ChemicalsfromMicroalgae,41-56.
Suzuki, K., Kamimura, A., Hooker, S.B. 2015. Rapid and highly sensitive analysis of chlorophylls andcarotenoids frommarine phytoplanktonusing ultra-highperformance liquid chromatography(UHPLC)withthefirstderivativespectrumchromatogram(FDSC)technique.MarineChemistry,176,96-109.
Suzuki,R.,Ishimaru,T.1990.AnimprovedmethodforthedeterminationofphytoplanktonchlorophyllusingN,N-dimethylformamide.JournalofOceanography,46(4),190-194.

177
Takagi,M.,Karseno,Yoshida,T.2006.Effectofsaltconcentrationonintracellularaccumulationoflipidsand triacylglyceride in marine microalgae Dunaliella cells. Journal of Bioscience andBioengineering,101(3),223-226.
Takagi, M., Yoshida, T. 2006. Effect of salt concentration on intracellular accumulation of lipids andtriacylglycerideinmarinemicroalgaeDunaliellacells.JournalofBioscienceandBioengineering,101(3),223-226.
Talebi,A.F.,Mohtashami, S.K., Tabatabaei,M., Tohidfar,M., Bagheri,A., Zeinalabedini,M.,HadavandMirzaei, H., Mirzajanzadeh, M., Malekzadeh Shafaroudi, S., Bakhtiari, S. 2013. Fatty acidsprofiling:A selective criterion for screeningmicroalgae strains forbiodieselproduction.AlgalResearch,2(3),258-267.
Tang,H.,Abunasser,N.,Garcia,M.,Chen,M.,Ng,K.S.,Salley,S.O.2011.PotentialofmicroalgaeoilfromDunaliellatertiolectaasafeedstockforbiodiesel.AppliedEnergy,88(10),3324-3330.
Terasaki,M.,Hirose,A.,Narayan,B.,Baba,Y.,Kawagoe,C.,Yasui,H.,Saga,N.,Hosokawa,M.,Miyashita,K. 2009. Evaluation of recoverable functional lipid components of several brown seaweeds(Phaeophyta)fromjapanwithspecialreferencetofucoxanthinandfucosterolcontents.JournalofPhycology,45(4),974-980.
Terasaki, M., Narayan, B., Kamogawa, H., Nomura, M., Stephen, N.M., Kawagoe, C., Hosokawa, M.,Miyashita,K.2012.Carotenoidprofileofediblejapaneseseaweeds:AnimprovedHPLCmethodfor separationofmajorcarotenoids. JournalofAquaticFoodProductTechnology,21(5),468-479.
Thomas,W.,Seibert,D.,Alden,M.,Neori,A.,Eldridge,P.1984.Yields,photosyntheticefficienciesandproximatecompositionofdensemarinemicroalgalcultures.III.Isochrysissp.andMonallantussalinaexperimentsandcomparativeconclusions.Biomass,5(4),299-316.
Traller, J.C., Hildebrand, M. 2013. High throughput imaging to the diatom Cyclotella crypticademonstrates substantial cell-to-cell variability in the rate and extent of triacylglycerolaccumulation.AlgalResearch,2(3),244-252.
Tredici,M.,Materassi,R.1992.Fromopenponds toverticalalveolarpanels: the Italianexperience inthedevelopmentofreactorsforthemasscultivationofphototrophicmicroorganisms.JournalofAppliedPhycology,4(3),221-231.
Tredici, M.R. 2004. Mass production of microalgae: photobioreactors. in: Handbook of microalgalculture:Biotechnologyandappliedphycology,(Ed.)A.Richmond,Vol.1,JohnWiley&Sons,pp.178-214.
Tsukahara, K., Sawayama, S. 2005. Liquid fuel production using microalgae. Journal of the JapanPetroleumInstitute,48(5),251.
Ugwu,C.,Ogbonna,J.,Tanaka,H.2002.Improvementofmasstransfercharacteristicsandproductivitiesof inclined tubular photobioreactors by installation of internal static mixers. AppliedMicrobiologyandBiotechnology,58(5),600.
Ugwu,C.U.,Aoyagi,H.,Uchiyama,H.2008.Photobioreactorsformasscultivationofalgae.BioresourceTechnology,99(10),4021-4028.
Ugwu,C.U.,Aoyagi,H.,Uchiyama,H.2008.Photobioreactors formasscultivationofalgae.Bioresourcetechnology,99(10),4021-4028.
Vadiveloo,A.,Moheimani,N.R., Cosgrove, J.J., Bahri, P.A., Parlevliet,D. 2015. Effect of different lightspectraonthegrowthandproductivityofacclimatedNannochloropsissp.(Eustigmatophyceae).AlgalResearch,8,121-127.
Vandamme, D., Foubert, I., Muylaert, K. 2013. Flocculation as a low-cost method for harvestingmicroalgaeforbulkbiomassproduction.TrendsinBiotechnology,31(4),233-239.
Vanthoor-Koopmans,M.,Wijffels,R.H.,Barbosa,M.J.,Eppink,M.H.2013.Biorefineryofmicroalgaeforfoodandfuel.BioresourceTechnology,135,142-149.
Vazquez-Duhalt,R.,Arredondo-Vega,B.O.1991.HaloadaptationofthegreenalgaBotryococcusbraunii(racea).Phytochemistry,30(9),2919-2925.
Venâncio,C.,Anselmo,E.,Soares,A.,Lopes, I.2017.Does increasedsalinity influencethecompetitiveoutcomeoftwoproducerspecies?EnvironmentalScienceandPollutionResearch,24(6),5888-5897.

178
Vonshak, A., Richmond, A. 1988. Mass production of the blue-green alga Spirulina: an overview.Biomass,15(4),233-247.
Vonshak,A.,Richmond,A.1981.Photosyntheticandrespiratoryactivity inAnacystisnidulansadaptedtoosmoticstress.PlantPhysiology,68(2),504-505.
Wegmann, K., Ben-Amotz, A., Avron, M. 1980. Effect of temperature on glycerol retention in thehalotolerantalgaeDunaliellaandAsteromonas.PlantPhysiology,66(6),1196-1197.
White, S., Anandraj, A., Trois, C. 2013. The effect of landfill leachate on hydrogen production inChlamydomonas reinhardtii as monitored by PAM Fluorometry. International Journal ofHydrogenEnergy,38(33),14214-14222.
Whiteoak, K., Jones, P., Pickering, P. 2012. Progress against the national target of 30% of Australia’swastewater being recycled by 2015. Department of Sustainability, Environment, Water,PopulationandCommunities(DSEWPaC)
Wijihastuti,R.,Moheimani,N.,Bahri,P.,Cosgrove,J.,Watanabe,M.2017.Botryococcusbrauniigrowthandphotosyntheticactivityinbiofilm.JournalofAppliedPhycology
Wijihastuti, R.S. 2017. Botryococcus braunii growth and photosynthetic activity in biofilm, M. Phil.Thesis,MurdochUniversity.Perth.
Wiltshire,K.H.,Boersma,M.,Möller,A.,Buhtz,H.2000.ExtractionofpigmentsandfattyacidsfromthegreenalgaScenedesmusobliquus(Chlorophyceae).AquaticEcology,34(2),119-126.
Wium-Andersen, S., Anthoni, U., Christophersen, C., Houen, G. 1982. Allelopathic effects onphytoplanktonbysubstancesisolatedfromaquaticmacrophytes(Charales).Oikos,187-190.
Wong,P.,Chan,K.-Y.1990.GrowthandvalueofChlorellasalinagrownonhighlysalinesewageeffluent.Agriculture,Ecosystems&Environment,30(3),235-250.
Wu, S., Xie, X., Huan, L., Zheng, Z., Zhao, P., Kuang, J., Liu, X., Wang, G. 2016. Selection of optimalflocculantforeffectiveharvestingofthefucoxanthin-richmarinemicroalgaIsochrysisgalbana.JournalofAppliedPhycology,28(3),1579-1588.
Xia,S.,Wang,K.,Wan,L., Li,A.,Hu,Q.,Zhang,C.2013.Production, characterization,andantioxidantactivity of fucoxanthin from themarinediatomOdontella aurita.MarineDrugs,11(7), 2667-2681.
Xinyi, E., Crofcheck, C., Crocker, M. 2016. Application of recycled media and algae-based anaerobicdigestate in Scenedesmus cultivation. Journal of Renewable and Sustainable Energy, 8(1),013116.
Yang, J., Xu, M., Zhang, X., Hu, Q., Sommerfeld, M., Chen, Y. 2011. Life-cycle analysis on biodieselproduction frommicroalgae:water footprint and nutrients balance.Bioresource Technology,102(1),159-165.
Yeesang,C.,Cheirsilp,B.2011.Effectofnitrogen,salt,andironcontentinthegrowthmediumandlightintensity on lipid production by microalgae isolated from freshwater sources in Thailand.BioresourceTechnology,102(3),3034-3040.
Yen, H.-W., Chen, P.-W., Chen, L.-J. 2015. The synergistic effects for the co-cultivation of oleaginousyeast-Rhodotorula glutinis and microalgae-Scenedesmus obliquus on the biomass and totallipidsaccumulation.BioresourceTechnology,184(0),148-152.
Yingying,S.,Changhai,W.,Jing,C.2008.Growthinhibitionoftheeightspeciesofmicroalgaebygrowthinhibitor fromthecultureof Isochrysisgalbanaand its isolationand identification. JournalofAppliedPhycology,20(3),315-321.
Yoshiko,S.,Hoyoku,N.2007.Fucoxanthin,anatural carotenoid, inducesG1arrestandGADD45geneexpressioninhumancancercells.Invivo,21(2),305-309.
Zamir,A.,Azachi,M.,Bageshwar,U.,Fisher,M.,Gokhman, I.,Premkumar,L.,Sadka,A.,Savchenko,T.2004.Molecular and functional adaptations underlying the exceptional salt tolerance of thealgaDunaliellasalina.in:HalophilicMicroorganisms,(Ed.)A.Ventosa,Springer.Heidelberg,pp.165-176.
Zhou, X.-R., Robert, S.S., Petrie, J.R., Frampton, D.M., Mansour, M.P., Blackburn, S.I., Nichols, P.D.,Green, A.G., Singh, S.P. 2007. Isolation and characterization of genes from the marinemicroalga Pavlova salina encoding three front-end desaturases involved in docosahexaenoicacidbiosynthesis.Phytochemistry,68(6),785-796.

179
Zittelli, G.C., Biondi, N., Rodolfi, L., Tredici, M.R. 2013. Photobioreactors for mass production ofmicroalgae.in:Handbookofmicroalgalculture:Appliedphycologyandbiotechnology,(Eds.)A.Richmond,Q.Hu,Vol.2,JohnWiley&Sons,pp.225-266.
Zou,D.2005.EffectsofelevatedatmosphericCO2ongrowth,photosynthesisandnitrogenmetabolismin the economic brown seaweed,Hizikia fusiforme (Sargassaceae, Phaeophyta).Aquaculture,250(3),726-735.

180
Appendix

181
Appendix A Table1Pearson’scorrelationbetweendifferentparametersinselectedsalinemicroalgaePearson’srelationship S&B S&L S&Crb S&LC S&CrbC
r P r P r P r P r PChrysotilacarterae - - - - - - - - - -Chaetocerosmuelleri .0521 .01 - - -0.948 0.014 0.894 0.041 0.949 0.014Nannochloropsissp. -0.925 0.024 -0.894 0.041 - - - - - -P.tricornutum - - - - - - -0.754 0.05 0.822 0.023Tisochrysislutea -0.833 0.005 -0.759 0.018 -0.807 0.009 -0.752 0.019 - -Tetraselmissuecica -0.813 <.00001 -0.553 0.026 -0.707 0.002 - - - -Naviculasp. - - - - - - - - 0.601 0.005Amphorasp. - - - - - - - - - -D.salina -0.953 <.00001 -0.763 <.00001 -0.934 <.00001 - - - - S&Fv/Fm B&L B&Cr L&Crb B&Fv/FmChrysotilacarterae 0.998 0.038 - - 0.998 0.04 - - - -Chaetocerosmuelleri -0.878 0.050 0.997 <.00001 0.843 0.073 - - - -Nannochloropsis -0.925 0.025 0.929 .023 - - - - - -P.tricornutum -0.978 <.00001 0.918 .004 0.952 0.001 0.989 <.00001 - -Tisochrysislutea -0.926 <.00001 0.978 <.00001 0.983 <.00001 0.969 <.00001 0.890 0.001Tetraselmissuecica -0.692 0.003 0.883 <.00001 0.797 <.00001 0.620 0.010 0.627 0.009Naviculasp. - - 0.822 <.00001 0.933 <.00001 0.853 <.00001 0.629 0.003Amphorasp. 0.774 <.00001 0.964 <.00001 0.945 <.00001 0.950 <.00001 - -D.salina -0.480 0.001 0.846 <.00001 0.964 <.00001 0.866 <.00001 0.460 0.003*r=Pearson’scorrelationcoefficient,P=p-value,S=Salinity,B=Biomassproductivity,L=Lipidproductivity,Crb=Carbohydrateproductivity,LC=Lipidcon-tent,CrbC=Carbohydratecontent,Fv/Fm=Maximumquantumyield

182
Table2Statisticalanalysisresults.DifferentlettersrepresentedthevalueswhicharesignificantlydifferentandthesignificanceofthemeanvaluesweretestedbyTurkey’stestattheconfidencelevelofP<0.05.
CM N PT TL TS NV AM DSSalinity(ppt) BiomassProductivity 35 C A C A A DEF DEF ABD39 A A B A A CDEF CDEF ABC45 AB B AB E A CDEF CDEF AB49 BC B A A A CDEF CDEF ABD55 D B B AB A DEF DEF B59 C BD A CDEF CDEF AB65 C BC A BCD BCD ABE69 CD A A AB ABF75 A AB A ABE79 C A A AF85 C BC BC CDEFG89 BC BCDE BCDE CDEFG95 BC CDE CF DEF99 BC BCDEF BCDEF GJKL105 BC EF EF GJK109 B EF EF GJK115 EF EF FGJK119 EF EF GJKL125 EF EF FGJK129 F F EFGJ135 DEFGH139 CDFG145 EFGI149 GJK155 GJKLM159 HIJKLM165 IJKLM169 HIJKLM175 IJKL179 IJKL185 JKLM189 JKLM195 KLM

183
199 KLM205 KLM209 KLM215 LM219 LM225 LM229 M233 M LipidContent 35 B C A C A BD B B39 A A A B A BD B B45 A A C AB A BD AB AB49 A AB A A A BD AB AB55 A B B C A BCD AB AB59 B C A BD AB AB65 B C A BD A AB69 C A BD AB AB75 C A BD A AB79 A ABCD AB AB85 A ABC A AB89 A AE A AB95 A E A AB99 A A A AB105 A AB A AB109 A D AB AB115 D A AB119 D A AB125 D A AB129 CD A AB135 AB139 AB145 AB149 AB155 AB159 AB165 AB169 AB175 AB

184
179 AB185 AB189 AB195 AB199 AB205 AB209 AB215 AB219 AB225 AB229 AB233 A CarbohydrateContent 35 A B AB A A GI A AB39 AB A A A AB GHI AB AB45 CD AB AB A D HI ABCD AB49 CD B AB A D GI ACD AB55 D B BC A C F ACD AB59 C A C E ACD AB65 C A ABC AB CD AB69 ABC AB CD AB75 ABC AC AD AB79 C ABD AD AB85 ABC BCE AD AB89 ABC CD AD A95 ABC F AD AB99 ABC F AD AB105 ABC GI BD AB109 AB I ABD AB115 GHI ABCD AB119 GHI ABCD AB125 GI ABCD AB129 GI ABCD AB135 AB139 AB145 AB149 AB155 AB

185
159 AB165 AB169 AB175 AB179 AB185 AB189 AB195 AB199 AB205 AB209 AB215 AB219 AB225 AB229 AB233 B LipidProductivity 35 AB A B A AB D A EF39 A AB A A AB CDE A CDEF45 A AB A C AB CDE AB ABC49 AB AB A D AB CDE AB AB55 B B B AB AB DE AB A59 BC B AB CD AB AB65 C B AB BCDE AB ABCDE69 B A BCDE AB ABCDE75 B AB AB B ABCDE79 AB A AB ABCD85 AB A B ABCDE89 AB AB AB ABCDE95 AB AB AB BCDE99 AB ABC AB EF105 B DE AB BCDE109 B DE AB CDE115 DE AB BCDE119 DE AB CDEF125 DE AB BCDE129 E AB BCDE135 ABCDE

186
139 ABCDE145 BCDE149 BCDE155 BCDE159 CDE165 CDEF169 CDEF175 CDEF179 CDEF185 DEF189 DEF195 DEF199 EF205 EF209 F215 F219 F225 F229 F233 F CarbohydrateProductivity 35 A A B AB DE E F ADE39 A B A AB DE E F AD45 AB A A A A D F AC49 AB A A A A CD F ACD55 B A B ABC B CD DE AB59 B BC AB C CDE AB65 B BC BC AB BC ACD69 C BC AB B ACD75 C BCD A A AD79 CDE A A AC85 DE B A AD89 EF C BCD A95 EF CD CD ACD99 EF C CDE G105 EF D E D109 F E F D115 E F D

187
119 E F G125 E F D129 E F CD135 BCD139 BCD145 CD149 DE155 DG159 DG165 DG169 DG175 DG179 DFG185 DFG189 DFG195 DFG199 DFG205 DFG209 DFG215 DFG219 DFG225 DFG229 FG233 F Fv/Fm 35 B A C AC AB AB D AB39 A AB C E AB AB D AB45 A AB AC A A AB E AB49 A A AB AB A AB EFG AB55 C B AB BCD AB AB FG AB59 B BCD AB AB FG AB65 B CD AB AB CFG AB69 D AB C CG AB75 D AB AB CG AB79 AB AB FG AB85 AB AB BC AB89 AB AB ABC AB95 AB AB ABC AB

188
99 AB AB ABC B105 AB AB ABC AB109 B AB ABC AB115 AB AB AB119 AB A AB125 B ABC AB129 BC CG AB135 AB139 AB145 AB149 AB155 AB159 AB165 AB169 AB175 AB179 AB185 AB189 AB195 AB199 AB205 AB209 AB215 AB219 AB225 AB229 AB233 A CellVolume 35 A AB B C AB AB B E39 AB A A A C AB AB A45 AB AB A AB AB AB AB A49 AB B A AB AB AB AB ABC55 B AB AB BC BCD A AB AC59 AB BC ABCD A AB A65 AB BC ABCD A AB AC69 BC A AB AB AC75 C BCD A AB D

189
79 ABCD AC A BC85 ABCD AB AB CD89 CD AB AB D95 BCD AB AB C99 BCD AB A D105 D AB A D109 E AB AB AC115 AB AB BC119 AB AB BC125 BC AB AC129 B B AC135 AC139 AC145 AC149 AC155 AC159 C165 D169 C175 C179 C185 CD189 CD195 CD199 CD205 C209 BC215 C219 CD225 D229 D233 D*CM=C.muelleri,N=Nannochloropsissp.,P=P.tricornutum,TL=T.lutea,TS=T.suesica,NV=Naviculasp.,AM=Amphorasp.,DS=D.salina

190
Table3StatisticalanalysisresultsofC.carterae.DifferentlettersrepresentedthevalueswhicharesignificantlydifferentandthesignificanceofthemeanvaluesweretestedbyTurkey’stestattheconfidencelevelofP<0.05.
Salinity(ppt)
BiomassProductivity
LipidContent
Carbohydratecontent
LipidProductivity
CarbohydrateProductivity
Fv/Fm CellVolume
35 A AB A AB A A A39 B A A A A B B43 BC B B B B C C

191
Appendix B Table4Correlationbetweenfucoxanthin,biomassproductivityandotherpigments
Biomass&fucoxanthinproductivityMicroalgae Pearsoncorrelationcoefficient Pvalue
Chaetocerosmuelleri 0.982 5.1x10⁻¹³Phaeodactylumtricornutum 0.941 5.6x10⁻¹³Tisochrysislutea 0.843 1.2x10⁻¹¹Naviculasp. 0.831 2.9x10⁻¹⁶Amphorasp. 0.881 3.6x10⁻¹⁹
Totalcarotenoids&fucoxanthinproductivityChaetocerosmuelleri 0.978 3.9x10⁻¹⁰Phaeodactylumtricornutum 0.891 3.8x10⁻⁹Tisochrysislutea 0.785 1.1x10⁻⁸Naviculasp. 0.817 7.2x10⁻¹²Amphorasp. 0.869 7.4x10⁻¹⁴
Chlorophylla&fucoxanthincontentPhaeodactylumtricornutum 0.826 4.3x10⁻⁸Tisochrysislutea 0.837 1.8x10⁻⁹Naviculasp. 0.494 1.5x10⁻⁸Amphorasp. 0.725 2.3x10⁻¹³

192
Table5Correlationbetweenbiomassproductivity,chlorophyllacontent,totalcarotenoidsproductivityandmaximumquantumyield
Biomassproductivity&chlorophyllacontentMicroalgae Pearsoncorrelationcoefficient PvalueChaetocerosmuelleri 0.877 1.9x10⁻⁶Phaeodactylumtricornutum 0.795 1.9x10⁻⁶Tisochrysislutea 0.770 7.9x10⁻⁷Amphorasp. 0.894 2.9x10⁻¹¹
Biomass&totalcarotenoidsproductivityChaetocerosmuelleri 0.995 3.5x10⁻¹¹Phaeodactylumtricornutum 0.953 1.6x10⁻⁹Tisochrysislutea 0.852 5.4x10⁻⁸Naviculasp. 0.829 1.6x10⁻¹¹Amphorasp. 0.941 1.02x10⁻¹⁴

193
Table6Statisticalanalysisresults.DifferentlettersrepresentedthevalueswhicharesignificantlydifferentandthesignificanceofthemeanvaluesweretestedbyTurkey’stestattheconfidencelevelofP<0.05.
Salinity(ppt) FucoxanthinproductivityC.muelleri P.tricornutum Tisochrysis Naviculasp. Amphorasp.
35 A AC A C A45 B A B BC C55 C AC C AB BC65 BC A ABC BC75 A AC BC85 AB B95 AB BC105 ABC BC115 BC BC125 C A
Fucoxanthincontent35 A A AB AC B45 B B B B AB55 AB C A B AB65 A CB B AB75 C B A85 B A95 B AB105 B AB115 B AB125 C B
Chlorophyllacontent35 AB A B D A45 A B C B AB55 B C A AB AB65 A A A AB75 D A AB85 A B95 ABC B

194
105 BD AB115 CD AB125 CD AB
Totalcarotenoidsproductivity35 A AC A F A45 A B B BF AB55 B A A CDEF AB65 C A B AB75 A A AB85 A B95 BC AB105 BD AB115 BE AB125 E A
Totalcarotenoidscontent35 AB AB G A45 A A CF AB55 A B DEF AB65 B AB CE AB75 B AB AB85 A B95 BC AB105 BCD AB115 CF AB125 FG AB

195
Table7Salinityincreasefrom35pptto125pptbasedonevaporationandrainfallrate.
Places Evaporationrate(my-1)
Rainfallrate(my-1)
Salinityincreaseday-1(ppt) DaysRequired
Karratha 3.2(Meteorology,2008)
0.3(Meteorology,2008) ~0.07 129
Geraldton 2.4(Meteorology,2008)
0.4(Meteorology,2008) ~0.05 180
Perth 1.8(Meteorology,2008)
0.6(Meteorology,2008) ~0.03 300
*Salinityincreaseperday = 0123
43;
where,P=Initialsalinityofculturemedia(ppt),AS=Totaladdedsalt(gm)perday(duetoevaporativetopup,basedonevaporationandrainfallrate),IS=Initialamountofsalt(gm)inculturemedia

196
Appendix C
Equation1Inflationrate
Inflationrate(2016)=56789:;<=<6>9?@A7>;1A7BCDE
56789:;<=<6>9?@A7>;1A7DFFE
Pricein2016=Pricein1996xInflationrate

197
Equation2Areacalculation
Area(ha)=GH×G>×DCCC×DJF
K=×G?×L×DCCCC
whereOa=Oilproducedfromalgae(100,000BBL)Od=Densityofoil(0.864kgL-1)Oc=Oilcontent(30%)Bp=BiomassproductivityD=Dayrequiredforcultivation1000=toconvertmillilitersintoliter
10000=toconvertsquaremetersintohectares159=toconvertlitersintobarrels

198
Table8Numberofinoculums
Co-culture Stepwiseculture Monoculture
Marinemicroalgae Halotolerantmicroalgae Halophilicmicroalgae2 2 12 3 1Numberofinoculums=
M6@HN>HO86P?9N@AQH@A67
R1=;?@;>>HO86P?9N@AQH@A67SA@TA7H=H<@A?9NH<8HNA7A@O<H7U;

199
Table9Labourcost
Employee Co-culture Stepwiseculture
MonocultureSalary
(peremployee)Marinemicroalgae Halotolerantmicroalgae Halophilicmicroalgae
NumberofemployeesPlantManager 1.00 1.00 1.00 1.00 1.00 113520Engineer 1.00 1.00 1.00 1.00 1.00 84480LabAnalist 1.00 1.00 1.00 1.00 1.00 63360Administration 1.00 1.00 1.00 1.00 1.00 60720Technician/PondOperator PleaseseeTable10 50160Workinghourperday 8Hour=480minutesTimeneededforharvestingone-hectarearea 15min
Thenumberofunitsharvestedperdaybyatechnician=V9:W;<6PS6<XA7UT69<6PH@;?T7A?AH7
YH<Q;8@A7U@A:;=;<H<;H
Numberofareasharvestedbyonetechnician 32Hectare
Numberofworkersneeded= NumberofareaharvestedNumberofareaharvestedbyonetechnician
Table10Numberoftechnician
Co-culture Stepwiseculture Monoculture
MarineMicroalgae
HalotolerantMicroalgae
HalophilicMicroalgae
25 24 18 29 36

200
Table11Nutrientconsumption
Biomassproductivity(kgha-1d-1)
NaNO3required(kgha-1d-1)
NaH2PO4required(kgha-1d-1)
250 12.5 1.25200 10 1180 9 0.9150 7.5 0.75100 5 0.580 4 0.4*ThecalculationisbasedonthereviewofBorowitzkaandMoheimani(2013b)*AccordingtoBorowitzkaandMoheimani(2013b)forproductionof1000kgalgalbiomass50kgofnitrateand5kgofphosphateisrequired*ThecostofnutrientswereadoptedfromAlibaba.com

201
Table12TheannualinstallmentoftheCAPEX.
Unit Co-culture Stepwiseculture
Monoculture Marinemicroalgae Halotolerantmicroalgae Halophilicmicroalgae
Capitalcost A$ 97,457,081 92,460,321 170,868,095 108,981,245 93,340,123Loanterm years 10 10 10 10 10Interest % 6.35 6.35 6.35 6.35 6.35Annualinstalment* A$year-1 13,461,733.09 12,771,531.33 23,601,986.21 15,053,564.21 12,893,058.17
BasedontheEquatedMonthlyInstalment(EMI)(Bose&Mukherjee,2009)
*Theannualinstallmentwascalculatedas:
Theannualinstalment = ^× _(Da_)c
(Da_)cdD,where,A=Capitalcost
r :Bankinterestn :Loanterm

202
Figure1ThecontributionofdifferentcostelementtoCAPEXs.
14%3%
9%
3%
40%
7%
3%
12%
4% 5%
Co-culture
5%1% 3%1%
64%
3%2%
12%
4% 5%
Marinemicroalgaemonoculture
Pondswithpaddlewheel
Buildings,roads,drainage
Waterandnutrientsupply
Electricalsupplyanddistribution
Inoculumsystem
CO2(fluegas+distribution)
Electroflocculation
Engineeringfees
Contingency
Workingcapital
14%3%
8%
3%
41%
7%
3%
12%
4% 5%
Halotolerantmicroalgaemonoculture
20%
5%
13%
5%20%
10%
6%
12%
4% 5%
Halophilicmicroalgaemonoculture Pondswithpaddlewheel
Buildings,roads,drainage
Waterandnutrientsupply
Electricalsupplyanddistribution
Inoculumsystem
CO2(fluegas+distribution)
Electroflocculation
Engineeringfees
Contingency
Workingcapital

203
Figure2ThecontributionofdifferentcostelementtoOPEXs.
18%
2%
11%
3%18%
48%
Co-culture
8%2%
7% 2%
22%59%
Marinemicroalgaemonoculture
Power
Nutrient(N&P)
Electroflocculation
Labour
Maintainance/Insurance
Tax
18%
2%
9%
3%
18%
50%
Halotolerantmicroalgaemonoculture
24%
2%
11%
3%16%
44%
Halophilicmicroalgaemonoculture
Power
Nutrient(N&P)
Electroflocculation
Labour
Maintainance/Insurance
Tax

204
5 10 15 20 25-25 -20 -15 -10 -5 0
Tax
Maintenance/InsuranceLabour
ElectroflocculationNutrients
PowerH
alo
ph
ilic
Mic
roalg
ae
Mo
no
cu
ltu
reH
alo
tole
ran
t M
icro
alg
ae
Mo
no
cu
ltu
reM
ari
ne M
icro
alg
ae
Mo
no
cu
ltu
reC
o-c
ult
ure
Change in biomass production cost (%)
Tax
Maintenance/InsuranceLabour
ElectroflocculationNutrients
Power
Tax
Maintenance/InsuranceLabour
ElectroflocculationNutrients
Power
Tax
Maintenance/InsuranceLabour
ElectroflocculationNutrients
Power
50% Baseline- 50% Baseline
Figure3Sensitivityanalyses.