Sustainability Strategies in IKEA with the focus on Production and …1327632/FULLTEXT01.pdf ·...
83
Sustainability Strategies in IKEA with the focus on Pro- duction and Suppliers 26.04.2019 Master Thesis Author: Lilia Yang, Nanxiang Shao Supervisor: Petra Andersson Examiner: Åsa Guvstasson Term: VT19, 4FE25E Subject: Project Degree
Transcript of Sustainability Strategies in IKEA with the focus on Production and …1327632/FULLTEXT01.pdf ·...

Sustainability Strategies in
IKEA with the focus on Pro-
duction and Suppliers
26.04.2019
Master Thesis
Author: Lilia Yang, Nanxiang Shao
Supervisor: Petra Andersson
Examiner: Åsa Guvstasson
Term: VT19, 4FE25E
Subject: Project Degree
Level: [Level]
Course code: 4FE25E

2
Abstract
“Waste of resources is a mortal sin at IKEA.” – Ingvar Kamprad
IKEA, as one of the biggest furniture companies in the world (Alänge, 2015), makes
it interesting to have a look into their practices to gain a deeper insight by looking at
how they work on a more sustainable and environmental friendlier world. Since
Ingvar Kamprad, the founder of this company, mentioned sustainability from the ear-
liest years, this work will provide an insight on how the sustainability annual reports
of IKEA present their sustainability strategies to the reader every year.
The researchers use the secondary analysis method to provide the theoretical frame-
work and apply a case study to conduct the empirical data of the company IKEA.
Since (Harte et al., 1991) pointed out that annual reports are an important source of
environmental information. The database is in form of annual reports from the year
2010 till 2018 that were provided by the company IKEA itself. Through the pattern
matching method the numbers over the years are compared and discussed due to their
development. Furthermore, the areas “production” and “supplier” are selected from
the supply chain management and also included in the analyzes section, since both,
the development of other organizational relationships in the supply chain and the en-
vironmental corporation can become an integral part of the company (Seuring & Mül-
ler, 2008). Through diagrams in the empirical chapter this work will provide a com-
parison between the different factors in the mentioned areas of the supply chain man-
agement and discuss the actual development and partly improvements of the factor’s
“energy”, “waste”, “production” etc. and the promises and goals from the IKEA’s
side.
Keywords
Sustainability, Sustainability Supply Chain Management, Global Companies, Annual
Reports, Strategies, Energy Efficiency, CO2 emissions, Waste, Environment

3
Acknowledgments
Coming from the different fields of Environmental Systems Sciences and Supply
Chain Management, it was very interesting to work on this project together. Since
both of us are originally from China but live in Europe, the topic pollution and the
environment has been discussed with high interest. After discussing several topics
that could become a Master Thesis, we both decided to choose to analyze the sustain-
ability part of the company IKEA in the field of their supply chain management be-
cause we were both passionate about this topic. Furthermore, we agreed on taking the
effort on us to try our best to get interviews with the company IKEA that is based in
Småland because it is very close to where we are writing our Master Thesis.
We would like to offer our great appreciation to our examiner, Åsa Guvstasson for
her patience and consistent interest in helping us and supporting our work. Further-
more, we would like to thank her for encouraging us improving different parts of our
thesis to ensure that we are unfolding our potential. Under her supervision we learned
not only how to increase the quality of our work but also gained tips on how to re-
search in a proper way.
Furthermore, we would like to express our special thanks to our tutor and supervisor
Petra Andersson. She did not only make a lot of time for us to help us with the central
theme but also discussed with us different methods on how we can do a better re-
search. Her methods were applied each time after our meetings. Dedicating so much
of her time for not only reading through our different versions of work but also com-
municating with us through emails is greatly appreciated by both of us.
Moreover, we would like to thank Joakim Jansson for taking the time sitting down
with us and giving us a deeper insight into the company IKEA.
Last but not least, we want to thank all of our opponents for giving us constantly
constructive reviews on our work that helped to improve our Master Thesis a lot every
time.

4
Table of contents
1 Introduction .................................................................................................................... 1
1.1 Background ............................................................................................................. 1
1.2 Problem discussion ................................................................................................. 3
1.3 Research Question .................................................................................................. 5
1.4 Purpose ................................................................................................................... 5
2 Methodology ................................................................................................................... 6
2.1 Scientific perspective .............................................................................................. 6
2.2 Scientific approach ................................................................................................. 6
2.3 Research method ..................................................................................................... 7 2.3.1 Yin methodology ................................................................................................ 7
2.4 Sampling method ..................................................................................................... 8
2.5 Data collection ........................................................................................................ 8
2.6 Analysis methods ..................................................................................................... 9
2.7 Scientific credibility .............................................................................................. 10
2.8 Ethical considerations .......................................................................................... 10
2.9 Delimitation .......................................................................................................... 11
2.10 Division of work .................................................................................................... 12
2.11 Summary of the Methodology part ........................................................................ 12
3 Theoretical Framework ............................................................................................... 13
3.1 Sustainability ......................................................................................................... 13 3.1.1 Sustainable Development ................................................................................. 13 3.1.2 Sustainable Development Goals ....................................................................... 14
3.2 Sustainable Economy ............................................................................................ 15
3.3 Short introduction of supplier ............................................................................... 19 3.3.1 Supplier Development ...................................................................................... 19 3.3.2 Sustainability requirements for supplier ........................................................... 20

5
3.4 Customer ............................................................................................................... 21 3.4.1 Sustainable products ......................................................................................... 21 3.4.2 Customer Engagement ...................................................................................... 21 3.4.3 Zero Waste theory ............................................................................................ 22
3.5 Environment and Distribution .............................................................................. 23 3.5.1 Energy use ........................................................................................................ 23 3.5.2 Distribution ....................................................................................................... 24
3.6 Certificates ............................................................................................................ 26 3.6.1 RSPO – Roundtable of Sustainable Palm Oil ................................................... 26 3.6.2 Internal Score Cards of Companies .................................................................. 27 3.6.3 UTZ certification .............................................................................................. 28 3.6.4 CIWF ................................................................................................................ 28 3.6.5 GSCP – Global Social Compliance Programme .............................................. 29 3.6.6 ISO14001 .......................................................................................................... 29 3.6.7 GHG Protocol Corporate Standard ................................................................... 30 3.6.8 DEFRA ............................................................................................................. 31 3.6.9 IEA ................................................................................................................... 32
4 Empirical Chapter ....................................................................................................... 33
4.1 IKEA ...................................................................................................................... 33
4.2 IKEA and sustainability ........................................................................................ 34
4.3 Sustainability Annual Report 2010 ....................................................................... 36 4.3.1 Presentation of their sustainability action ......................................................... 36 4.3.2 Suppliers ........................................................................................................... 37 4.3.3 Customers ......................................................................................................... 39 4.3.4 Environment ..................................................................................................... 40
4.4 Sustainability Annual Report 2014 ....................................................................... 42 4.4.1 Presentation of their sustainability action ......................................................... 42 4.4.2 Suppliers ........................................................................................................... 44 4.4.3 Customers ......................................................................................................... 44 4.4.4 Environment ..................................................................................................... 45

6
5 Discussion/Analyzation ................................................................................................ 51
5.1 Overview of IKEA’s sustainability strategy result each year ............................... 51 5.1.1 Supplier section ................................................................................................ 51 5.1.2 Production section ............................................................................................ 54
5.2 Diagrams ............................................................................................................... 59 5.2.1 Supplier ............................................................................................................. 59 5.2.2 Production ......................................................................................................... 62
6 Conclusion .................................................................................................................... 65
7 Literature/Reference ................................................................................................... 67
8 Appendix ....................................................................................................................... 77

1
1 Introduction
1.1 Background “The earth’s interlocking resources – the global system of nature in which we all live
– probably cannot support present rates of economic and population growth much
beyond the year 2100, if that long, even with advanced technology.” (Limits of
Growth, Club of Rome, 1972).
After “Limits of Growth” has been published, more and more scholars engaged with
that topic. Sustainability, a word that has taken on new significance in those following
periods, were discussed by many aspects from that point on. According to Brundtland,
Sustainability is defined as “Sustainable development meets the needs of the present
without compromising the ability of future generations to meet their own needs.”1
However, this term has still not been consistently defined. Therefore, this work is
providing a deeper insight into one of the sustainability aspects, the environment part
(Craig, 2008). In the field of business economics, the term sustainability is defined as
the implicit recognition of social and economic responsibilities and explicitly incor-
porated the social, environmental stewardship, and social equity. Hence, it has the
potential to reduce costs of companies in the long term and equal weightings for eco-
nomic stability, ecological compatibility and social equilibrium (Craig, 2008, p. 363).
This sustainable aspect can be applied in various fields of the company. Some sus-
tainability approaches can be applied practically in ways that back casting can be used
on a high strategic level in corporations and social utility is included as a natural part
for entrepreneurial ventures (Alänge, 2015). Since sustainable supply chain manage-
ment is part of the whole sustainability development, this paper is focusing on the
areas “production” and “suppliers” in the supply chain management and also using
the company IKEA as a case study. “Supply chain is defined as a group of inter-
connected participating companies that add value to a stream of transformed inputs
from their source of origin to the end products or services that are demanded by the
1 World Commission on Environment and Development. (1987). Our common future, Oxford, Oxford University Press.

2
designated end-consumers.” (Lu, 2011). Since sustainability research deals with is-
sues like reducing energy use, pollution and waste, recent developments like globali-
zation and fragmentation of supply chain have turned firms toward their supply chain
for customer value creation, resulting in the integration of suppliers into sustainability
discourse of firms (Mariadoss, 2014, p. 3407). Furthermore, researchers examined
several stand-alone topics of environmental and social issues, including the develop-
ment of environmental logistics strategies, environmental purchasing, selection for
transportation, improvement of fuel efficiency and emission reduction from transpor-
tation equipment (Craig, 2008, p. 364).
Since 2011, the number of studies increased that started to deal with the social dimen-
sion in the global supply chain field. It shows that the brand image of companies, is
in danger when they are not respecting their codes of conduct and working conditions.
Moreover, sustainable supply chain and even their second- or third-level supplier
have been gaining increased attention due to the customers’ demands. In the study of
“Sustainable supply chain management: Trends and challenges”, the authors define
sustainable supply chain as the integration of economic, environmental and social
dimensions into the management of intra- and inter-organizational flows, through in-
novative and collaborative approaches, with the objective of creating sustainable
value. To ensure to have an efficient supply chain management system and to increase
the sustainability part in the business strategies, changes in the field of design, pur-
chase, transportation, storage, production, distribution and reverse logistic systems
need to be done (Bentahar, 2018). The management system as the organization/oper-
ations are viewed as one of the most important systems in the company when it comes
to decisions and changes. Since Managers are able to decide between alternatives and
in the end draw conclusion what is the best for a company, it goes within hands, that
they have a big impact on quality loss, product development and efficiency optimiza-
tion frameworks in the product life-cycle management and logistic part of a company.
To gain a deeper look into IKEA’s management system, it is noticeable that they do
have a strong cultural system that is guiding the behavior of manager. According to
(Alänge, 2015) this company is the world’s largest furniture company; hence, for this
work it is interesting to have a closer look on how they are implementing SSCM into
their business strategies.

3
1.2 Problem discussion Because of the unobservability of most organizational activities, the external public
has come to rely on words and figures (i.e., annual reports and financial statements)
as imperfect proxies for their activities (Gjesdal, 1981). Environmental disclosure in
annual reports provides an effective way for organizations to manage external im-
pressions. The annual report is a major source of information for investors, creditors,
employees, environmental groups and governments. (Neu, Warsame & Pedwell,
1998). Both institutional and individual investors rely on annual reports for financial
and non-financial information, just like environmental groups and government regu-
lators (Gamble, 1995). Although organizations use a variety of communication media
such as brochures and advertisements to maintain legitimacy, the annual report seems
to be the preferred public relation method compared to these (Marx, 1993).
(Harte et al., 1991) pointed out that annual reports are an important source of envi-
ronmental information. These institutional investors seek information on the organi-
zation's environmental responsibilities, environmental litigation and environmental
policy from its annual reports. In terms of non-institutional investors, 82% of inves-
tors would like to see environmental disclosure included in the annual report. Most
of them say that environmental management is more important than increasing divi-
dends, and environmental issues also enter into the consideration of risk and return of
shareholders (Epstein and Freedman, 1994).
However, beside the perspective of investors another stakeholder group – the cus-
tomer should also evaluate the quality and the understanding of the annual reports of
companies. Since most of the papers concerns the importance of annual reports for
manager, investor and other stakeholder groups this paper will analyze the sustaina-
bility annual reports of IKEA from the consumer perspective and discuss how this
company is presenting their sustainability strategies and if they are really promising
what they preach.
By combining environmental initiatives in the supply chain with organizational per-
formance, it has the resources to develop capabilities and provide competitive ad-
vantage. More and more environmental issues cannot be managed separately from
other supply chain activities. Not only does the relationship between buyer and

4
supplier develop and mature over time, but with the development of other organiza-
tional relationships in the supply chain, environmental cooperation can become an
integral part. Therefore, the researchers focus on the “production” and “supplier” part
of the supply chain management to not only analyzing the relationship between IKEA
and its supplier but also how they are acting to convince or force their supplier to
fulfill the sustainability requirements. The production process is usually distributed
around the world. Suppliers, key companies and customers are linked through infor-
mation, materials and capital flows. Corresponding to the product value is the envi-
ronmental and social burden produced in different production stages. This is espe-
cially true for companies with brands, as they may come under pressure from stake-
holders, such as NGO’s. These companies are asked to consider environmental and
social issues throughout their supply chains. Operations, procurement, and supply
chain managers have seen the integration of environmental and social issues, includ-
ing those embedded in standards such as ISO 14001, into their day-to-day tasks
(Seuring & Müller, 2008).

5
1.3 Research Question To fulfill the purpose of this work, this paper will answer the following research ques-
tions:
The main question is as follows:
1.) In what areas of the supply chain management do IKEA focusing their sus-
tainability strategies and how are they presenting them in their sustainability
annual reports?
2.) What kind of measurement do they use to show their results?
1.4 Purpose This paper is describing the annual sustainable strategies of the company IKEA in the
distribution and supplier part of the supply chain management. The goal of this work
is to identify potential improvements and impacts in the area’s transportation, food
supply, production and energy usage.

6
2 Methodology
2.1 Scientific perspective Social research depends on different paradigms which can distinguished based on
their ontological and epistemological positions, methodological approaches and as
well as ethical standards (Haq, 2014). In the epistemological position, “positivism” is
known as the position that affirms the importance of imitating the natural sciences
and entail principles like only knowledge confirmed by the senses can genuinely be
warranted as knowledge and science must be conducted in a way that is value free
(Bryman and Bell, 2011). In contrast there is the term “interpretivism”, which stands
for a view that the social sciences are fundamentally different from that of the natural
sciences (Bryman and Bell, 2011). This paper is dealing with social sciences where
business and management belongs to (Greener, 2008). Therefore, this work is using
the position of “interpretivism” to analyse and describe the annual sustainable strate-
gies of the company IKEA.
2.2 Scientific approach However, when it comes to the approach, understanding the differences of the deduc-
tive and the inductive approach are significant. In the deductive approach, the work
will start by looking at theory, produces hypothesis from that theory and then test that
theory by analyzing empirical testing (Greener, 2008). According to (Bryman and
Bell, 2011) “It represents the most common view of the nature of the relationship
between theory and research.” In comparison, the inductive approach starts with the
organization, a business problem or an economic issue and investigate various re-
search methods to generate a new theory from the research (Greener, 2008). Since
this paper doesn’t start with an existing problem, it will apply the deductive approach
to answering the research questions and to fulfill the aim and the purpose of this work.
It will start with existing theories and using empirical data to formulate a new theory
in the last part.

7
2.3 Research method There are different types of research designs that can be applied to a work. Firstly,
the experimental design is rather rare in business and management research, due to
the problems of achieving the requisite level of control. It is frequently used for causal
findings which tend to be very strong when it comes to internal validity. Secondly,
the cross-sectional design which is also called the social survey in form of question-
naires and structured interviewing. Thirdly, there is the case study design which en-
tails the detailed and intensive analysis of a single case. In business research, this
method is very popular and can be applied on a single organization or location (Bry-
man and Bell, 2011). This paper will use the last method of research designs. It will
use a case study that will analyse the sustainability annual reports provided by IKEA
for the years 2010 till 2018.
2.3.1 Yin methodology
Especially for the case study this work focuses on the research strategy of (Yin, 2003)
to do social science research. The goal is to investigate an empirical topic by follow-
ing a set of prespecified procedures and illuminate a set of decision and ask why they
were taken, how they were implemented, and with what result (Yin, 2003). This work
will focus on describing and analyzing the way how the company IKEA is presenting
their sustainability strategies each year in the empirical part, supported by materials
gathered from the company IKEA in form of reports. According to Yin, the technical
definition of this case study lies in the investigation of a contemporary phenomenon
with its real-life context, especially when the boundaries between phenomenon and
context are not clearly evident. Therefore, using the case study method is due to cover
contextual conditions, believing that they might be highly pertinent to the phenome-
non of study. Furthermore, the case study copes with much more data points and dis-
tinctive situations and with many variables (Yin, 2003).

8
2.4 Sampling method Sampling of informants in ethnographic research is often a combination of conven-
ience sampling and snowball sampling. In the ethnographers’ work, most of the time,
every information of whatever sources are gathered. There are two common sampling
methods in the qualitative field that are used frequently. Both are falling under the
category of the purposive sampling which is a non-probability form that sample cases
and participants in a strategic way. However, the theoretical sampling is a process
that is mainly controlled by the researchers and is an ongoing process. Therefore, it
is meant to be an alternative strategy to the probability sampling that is mostly used
in the quantitative field (Bryman and Bell, 2011). Since this work is focusing on only
one company IKEA and especially analyzing the areas production and supplier in the
supply chain management, the aim is to get a better understanding of how IKEA is
presenting their sustainability strategies in their sustainability annual reports.
2.5 Data collection According to (Bryman and Bell, 2011) a robust model of the motives for corporate
ecological responsiveness, or “greening” is an analytic induction approach because it
enables existing theories of corporate greening. Data sources can be annual reports
and corporate environmental reports of companies (Bryman and Bell, 2011).
In this work the researchers used documents and records as data collection method. It
consists of examining existing data in the form of databases like reports. The reason
to choose this strategy is on the hand due to this inexpensive way to gather infor-
mation but also due to limitation of time during the course and difficulties to get fur-
ther inside data of the company IKEA.
Firstly, the researchers tried to get more information and data from the company by
interviews. Unfortunately, it was very hard to find the right person and additionally
to get data and information as a student from such a big company. However, IKEA
has a archive on their website with all of their reports they published so far. With a
closer look the researchers found out that they only started with the year 2010 till
now. The sustainability annual reports from the years 2017 and 2018 are not published

9
on their website but on INGKA Group. That was an additional effort to find them.
For the reports 2015 and 2016 the cover of their sustainability annual report included
UK and Ireland. Hence, the researchers were not sure if the data and the content only
belongs to IKEA companies in UK & Ireland. After reading through those reports the
first one 2010 revealed that they had data from previous years 2008 and 2009. How-
ever, those reports could not be found at all. Moreover, after two weeks the research-
ers found out that the website deleted the sustainability annual report 2010 and 2011.
Interestingly most of the data analysis was in the sustainability annual report 2010
with the exact goals they wanted to achieve in different years. Mostly targets for 2015
was mentioned. Since the report of 2015 was only consisting of a few numbers and
belonged to IKEA’s in UK and Ireland, the researchers decided to use the report 2010
and 2014 to have a closer look on the reported numbers and IKEA’s results. Espe-
cially in the first report 2010 IKEA mentioned a couple of areas that belongs to supply
chain management. Since most of the data were documented from the part “produc-
tion” and “suppliers”, the researchers choose to analyse those areas in more detail.
2.6 Analysis methods The researchers will analyse the empirical data with help of the “Pattern matching”
method, which is comparing two or more patterns in order to determine whether pat-
terns match or do not match. It is comparing an observed pattern with an expected
pattern which is a non-statistical test of the correctness of the hypothesis and a form
of data analysis in the qualitative field. It involves the comparison of a predicted the-
oretical pattern with an observed empirical pattern with the assumption that human
beings are able to make sense of the world by comparing what they observe externally
to internal mental models (Sinkovics, 2018). Since students usually have time and
financial limits there is the secondary analysis that include the collection of other
researchers work. For students conducting a small research project in a given time,
this analyzing method has advantages for the researchers. Furthermore, it is not only
suitable for students but also popular in the Economic and Social Research field by
all business researchers (Bryman and Bell, 2011). This work will use the secondary
analysis with help of the annual reports as suitable datasets for the empirical part. For

10
the “pattern-matching” method data from different years are compared to see the de-
velopment over time with different environmental factors of the environmental areas
of the company IKEA. The goal is to see different tendencies to gain conclusion how
the company IKEA is presenting their strategies to fulfill their intended sustainability
goals of the different factors like renewable energy, sustainability products etc.
2.7 Scientific credibility For the scientific credibility and especially reliability, the research design needs to
represent a logical set of statements, so that the quality can be easily judged according
to logical tests. Those concepts offered for this test include trustworthiness, credibil-
ity, confirmability, and data dependability (Bryman and Bell, 2011). The case study
tactic was tested on its trustworthiness and quality and was chosen due to its reliability
for this work. For the construct validity the case study uses multiple sources of evi-
dence, establish chain of evidence and have key informants review draft in forms of
reports. For the internal validity it does pattern-matching, explanation building, ad-
dress rival explanations and use logic models. For the external validity it uses theory
in single-case studies and for the reliability there is a case study protocol that will be
included in this work (Yin, 2013).
2.8 Ethical considerations Ethical issues relate to moral choices that affecting decisions and standards, touching
the philosophical aspect and can be broad sometimes. Especially in research, when it
comes to how to deal with someone changing their mind about being part of a study
can contribute to a feeling of doubt and worry about what to do for the best (Greener,
2008). Many writers differ over what is and is not ethically acceptable (Bryman and
Bell, 2011). Both participants agreed on the same ethical foundation and baseline for
this work. Furthermore, this work was conducted in a way that it gives as much in-
formation as might be needed to make solid assumptions. For this whole work, it is
necessary to sacrifice wide and broad information and in-depth research in one field.
Since every student is having a time limit it is the task of each researcher to find the

11
right amount of balance between the quality of work and the achievement of the task
during a period of time. In this work, both students will stick to a time schedule and
try their best to collect as much data as they can get from the company IKEA and the
internet. Depending on the range of information, the task of the course and the assign-
ment will be done in the most appropriate way. Each researcher will try to fulfill every
task carefully and in their best intention.
Figure 1 Time schedule for this thesis
2.9 Delimitation Since there is a given time schedule, researchers need to calculate and manage their
time efficiently and properly. Therefore, it was important to apply some limitations
to this work. Firstly, the term “Sustainability” has different aspects like “Environ-
mental”, “Economics” and “Society”. This work will focus on the environmental as-
pect of sustainability. Secondly, in the supply chain management there are variety of
areas that could be analyzed. However, researchers decided to pick out two main areas
“production” and “suppliers” from this list to analyze those in more detail. Due to
some lack of information this work could not include accurate data of the IKEA re-
ports since some numbers were not presented on a consistent level. Hence, the accu-
racy of the diagrams in the empirical part is not accurate. Moreover, IKEA did not
mention their weighting system, where IKEA explains the relatively improvements
of their factors in relation to each other, at all which would be necessary for a more
12
in-depth study in the eyes of the researchers. Last but not least the reports before 2010
cannot be included because IKEA didn’t provide them online. Furthermore, the report
2019 will be probably published in the end of this year which is hence not possible to
analyze for the researchers.
2.10 Division of work For the division of work, both students met regularly to discuss about how to write
each chapter and section. For chapter one the tutor was involved and together the first
draft of the introduction part was constructed. The problem discussion and the intro-
duction of IKEA was written by Shao Nanxiang and the rest was written by Lilia
Yang. The methodology part of this work was operated by both participants. In Chap-
ter three the expertise knowledge of those two fields sustainability and supply chain
management is combined in the theoretical framework from both students. The first
part of the theoretical framework, sustainability, was written by Lilia Yang and the
Supply Chain Management part by Shao Nanxiang. Another session with the tutor
was held to communicate further steps in the empirical part of this work. In the em-
pirical part and conclusion part both students participated and worked together espe-
cially under the supervision of the tutor.
2.11 Summary of the Methodology part
Method Choice
Research strategy Case study
Scientific view Interpretivism
Scientific approach Deductive
Research method Qualitative
Data collection Secondary data
13
3 Theoretical Framework
3.1 Sustainability A sustainable system is a process that can be continued without depleting any of the
material or energy resources required to keep it running. The early examples for that
terms were in human endeavors to monitor the growth and reproduction phase of nat-
ural populations like forestry and fisheries. It was significant to harvest a certain per-
centage of trees or fish every year without reducing the population below a stable
number to avoid a bifurcation point (Wright, 2011, p. 16).
3.1.1 Sustainable Development
This term was firstly brought into common use by the World Commission on Envi-
ronment and Development, a group by the United Nations. In their report “Our Com-
mon Future”, published in 1987, their definition was “meets the needs of the present
without compromising the ability of future generations to meet their own needs.”
(Brudtland & Wright, 2011). Development refers to the continued improvement of
human-being in both developed and developing countries. Both implemented the term
“Sustainable Development” even though developed countries are more concerned
about environmental sustainability while developing countries focuses more on the
economic development (Wright, 2011). When it comes to the term “Sustainable De-
velopment” there are three main ideas and fields behind it. Firstly, the economical
field that is important for Economists. They are concerned with growth, efficiency,
and the optimum of resources. Secondly, the social field which is in the eyes of Soci-
ologists important for human needs, equity, empowerment, the social cohesion and
the cultural identity. Thirdly, the Ecologists show interest for preserving the integrity
of natural systems, for living and biodiversity and dealing with pollution (Wright,
2017). Since there are different perspectives on this topic and it concerns the environ-
mental, social, economic and political dimension, it serves as an ideal and goal toward
which all human society need to be moving by for example improve the quality of
air, preserve and protect natural ecosystems, reduce soil erosion and reduce toxic
chemicals from the environment (Wright, 2017). To achieve the goal, it is necessary
to recognize the finite limits of the ability of Earth’s systems to produce resources

14
and absorb wastes and to try to increase a stable human population, transition to a
Steady State Economy, technology transition to environmentally friendly processes,
political and sociological transition to societies that eliminates large-scale poverty,
community transition to developed countries with “smart growth” concepts. Not
achieving the goal means famine, disease, and deprivation (Wright, 2017).
Figure 2 Sustainable Development Dimensions with solutions
3.1.2 Sustainable Development Goals
The United Nation created an agenda for sustainable development and transforming
the world till 2030 with the intention to support this goal by 17 sustainable develop-
ment goals and 169 targets. Those goals seek to build on the Millennium Develop-
ment Goals and complete what they did not achieve. Their aim is to seek to realize
the human rights of all and to achieve gender equality and the empowerment of all
women and girls. The three dimensions of the sustainable development are integrated.
Their plan to contribute to a better plan according to them is as follows “We are de-
termined to protect the planet from degradation, including through sustainable con-
sumption and production, sustainably managing its natural resources and taking ur-
gent action on climate change, so that it can support the needs of the present and future
generations.” (SDG, 2030).
15
With their Goal 12 – Ensure sustainable consumption and production patterns they
want to implement the 10-Year Framework of Programs on Sustainable Consumption
and Production Patterns where all countries take action. They want to reduce global
food waste, reduce pollution of companies to minimize their adverse impacts on hu-
man health and the environment, encourage companies to adopt sustainable practices
and integrate sustainable information into their reporting cycle, promote public pro-
curement practices that are sustainable, increase awareness in this matter, implement-
ing tools to monitor sustainable development impacts and switch to renewable energy.
Figure 3 Sustainable Development Goals, source: Wikipedia
3.2 Sustainable Economy Economics deals with production, distribution and consumption of goods and services
that are all connected to environmental goods and services, and therefore needs to be
grounded in an understanding of the biological and physical world. Through ex-
changes of goods and services between the economy and the society, the impact on
the environment increases more and more. Hence, problems brought on by economic
activity were created like sickness due to inadequate sanitation or water treatment,

16
urban air pollutants such as sulfur dioxide, particulate matter, and carbon monoxide,
suburban sprawl, municipal wastes, and CO2 emissions (Wright, 2017).
Since globalization the whole economy became very complex. Currently, there are
two economic systems which are the centrally planned economies, characteristic of
dictatorships, and free-market or capitalist economies, characteristic of democracies.
In reality all countries use a hybrid form of economic system and trade became one
of the most dominant forces in society. The World Trade Organization (WTO) that
was created in 1993, was the attempt to enforce trade rules between nations and to
help to solve problems like manipulation of market in the favor of governments and
poverty of the bottom earner. However, they have established a reputation for elevat-
ing free trade over concerns about human rights and environmental resources.
Figure 4 Environmental problems and per capita income
In this graphic some of the most serious environmental problems can be improved
with income growth that is showed in graphic with the blue line (a). Other problems
get worse and then improve as stated with the green line (b) and there are also prob-
lems that get worse shown by the red line (c) (Wright, 2017, p. 25).
Since there is a direct connection and correlation between economic development and
environmental problem the need for a sustainable economy is unavoidable. More and

17
more people are gaining higher life expectancy, well-being is rising, and countries are
getting wealthier over time. Aircraft, cars, computers and digitalization in general
opened a new lifestyle that bring new opportunities for a huge amount of people.
Controversially, this lifestyle is also creating environmental problems that harm hu-
man well-being, creating biodiversity loss, increase child slavery in fisheries due to
the recent decline in fish stocks, increasing poverty and hunger in developing coun-
tries, decline of ecosystem goods and services, rising global temperatures and sea
levels. Those results force many people to think about a new economy, a sustainable
green economy. While the classical economics define labor and capital as the most
important components in the economy new ecological economists sees the environ-
ment as a big part that is intertwined with the economy and society since the economy,
is constrained by the limits of resources in the environment.
“Since unlimited economic growth is not possible on a finite planet, there is little
discussion of an alternative economic system that can meet our needs without
growth.” (The Report of the Steady State Economy Conference, 2010).
An economy based on enough is worth striving for since the increase in economic
activity has resulted in an imbalance of the whole stability of the system. Furthermore,
an economy that forever chases more is destines to fail since this growing economy
failed to deliver lasting solutions to unemployment and poverty. As an alternative the
steady state economy could be one of the solutions for a more sustainable economy.
It stabilizes resource use and waste production and increase renewable resources.
Moreover, the population also needs to be stabilized by policies that provide educa-
tion, access to birth control, and equal rights for women everywhere. Another point
in this new economy would be to limit the inequality of the richest and the poorest by
progressive taxation, social programs and moving towards a steady state democracy
where employees receive more rights and are able to determine wages and salary dif-
ferentials for themselves. Changing the way of measuring progress is also one of the
important steps towards a steady state economy. Nowadays, the gross domestic prod-
uct (GDP) is used to measure the wealth of a country and to compare different rich
and poor countries. It is the main economic indicator to measure economic activities
like spending on food, entertainment, investment in education (The Report of the
Steady State Economy Conference, 2010). However, GDP does not include goods
18
created and services performed by a family for itself, emissions, clean air or well-
being of human. Alternative, other possible indicators are the Index of Sustainable
Economic Welfare (ISEW) which takes into account a wide array of economic activ-
ities and their effects on human well-being and the Human Development Index (HDI)
including the health indicators life expectancy, and literacy rates. Since one problem
of those measurements is still that they do not include natural capital or wealth meas-
urement that include sustainability the ecological footprint is important to support
those indexes (Wright, 2017).
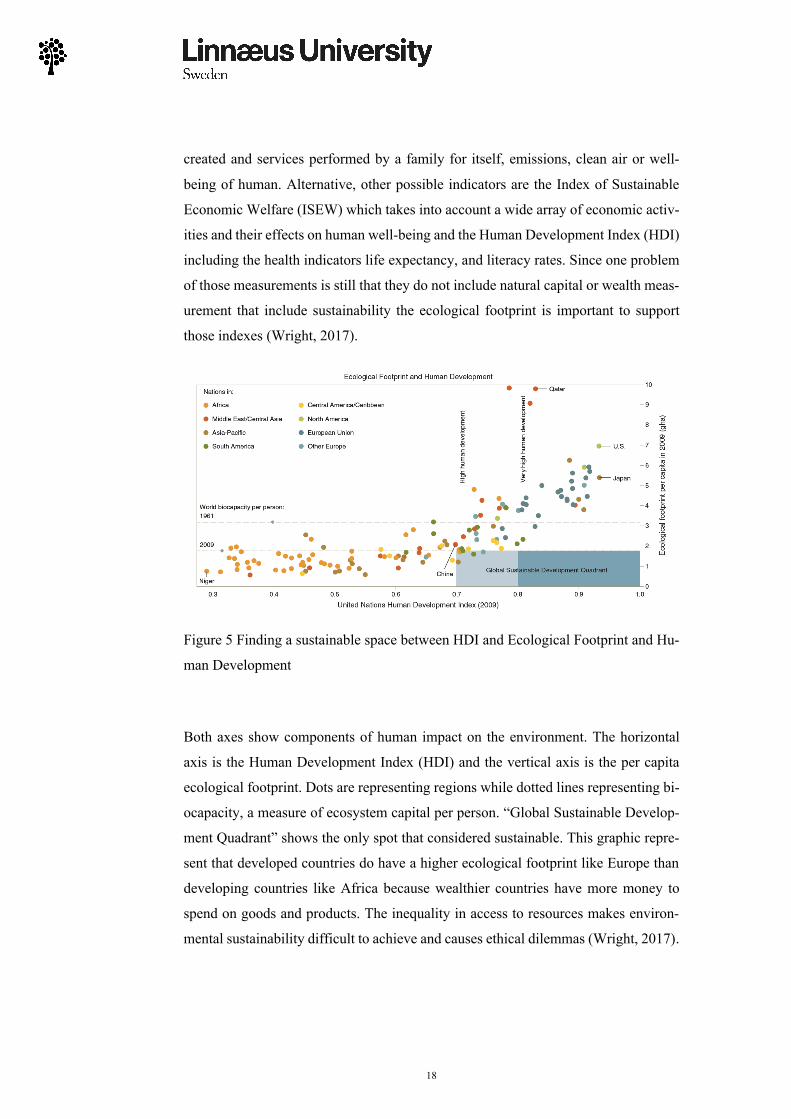
Figure 5 Finding a sustainable space between HDI and Ecological Footprint and Hu-
man Development
Both axes show components of human impact on the environment. The horizontal
axis is the Human Development Index (HDI) and the vertical axis is the per capita
ecological footprint. Dots are representing regions while dotted lines representing bi-
ocapacity, a measure of ecosystem capital per person. “Global Sustainable Develop-
ment Quadrant” shows the only spot that considered sustainable. This graphic repre-
sent that developed countries do have a higher ecological footprint like Europe than
developing countries like Africa because wealthier countries have more money to
spend on goods and products. The inequality in access to resources makes environ-
mental sustainability difficult to achieve and causes ethical dilemmas (Wright, 2017).
19
3.3 Short introduction of supplier
3.3.1 Supplier Development
Leenders (1966) First used the term "supplier development" to describe the efforts of
manufacturers (buyers) to increase the number of feasible suppliers and improve the
performance of suppliers. More specifically, supplier development is defined as “a
long-term cooperative effort by a company to upgrade its suppliers' technical capa-
bilities, quality delivery, and costs in view of continuous improvement” (Hahn,
Watts, & Kim, 1990). As a key supply chain management practice, supplier develop-
ment aims to improve supplier performance or capability to meet buyer's short - and
long-term supply needs (Scannell, et al., 2000).
Supplier development practice by buyer to develop supplier's performance or capa-
bility on a supplier basis. Supplier development practices are also known as supplier
development activities (Nagati and Rebolledo, 2013). In terms of buyer's participation
and resource commitment to supplier development, supplier development practices
can be said to be indirect or direct (Wagner, 2009). In indirect supplier development,
the buyer invests limited resources and provides incentives to implement supplier im-
provements. Increasing business potential, or communicating performance objectives
and supplier assessment results, such as supplier ratings or performance management
(Krause et al.,2000; Paul et al.,2010) Through supplier evaluation, the buyer can iden-
tify the performance of suppliers, compare with other suppliers and provide improve-
ment direction. In indirect supplier development, the buyer uses market forces or
communication-as known as influence strategies (Paul et al.,2010) to achieve supplier
performance improvement. Direct supplier development includes resource - capital
and/or human relations or transaction - specific investments. Another direct supplier
development practice is to integrate suppliers into the buyer's product development
system (Wagner, 2009). In a supply chain or network environment, buyers and sup-
pliers engage in interactions with other participants who can positively and/or nega-
tively affect the relationship between the two (Gadde et al., 2010). Through interac-
tions between participants, the potential for performance improvement can be identi-
fied and provided through a combination of resources or activity configurations across
firm boundaries. Through substantial adjustment of resources and adjustment

20
activities, actors participate in long-term relationships. Individually or jointly, the ac-
tors decide what activities to undertake and what resources should be used in carrying
them out. The supplier controls the resources and maintains the capabilities used by
the buyer to varying degrees. To make better use of supplier resources, buyers can
call or use resources themselves, or they can encourage suppliers to modify their re-
sources to better accommodate buyers (Snehota and Hakansson, 1995).
3.3.2 Sustainability requirements for supplier
Research on green innovation shows that the success of green innovation increasingly
depends on the ability of enterprises to create ecological and social value for stake-
holders (Chen,2008). Similarly, in order to integrate social issues into its strategy and
diversify the highly sustainable green entrants, more emphasis will be placed on the
multifaceted needs of its stakeholders (Calic and Mosakowski, 2016). In today's so-
cially conscious environment, suppliers may consider social and environmental fac-
tors, among which supplier participation is one of the most influential factors in the
process of enterprise innovation (Trapp and Sarkis,2016). Although diversification of
green entrants with high sustainability orientation can produce excellent green inno-
vation performance, the influence of sustainability orientation is not uniform. Instead,
they rely on firms' ability to understand the needs of stakeholders and to capture and
trans-form their knowledge into innovation (Dangelico et al. 2013). Specifically, as
organizations tend to incorporate social and environmental issues into their strategies,
firms with a high degree of sustainability orientation will place great-er emphasis on
understanding the multiple needs of current and future stake-holders (Du et al.2016).
Such organizations tend to understand the multiple needs of stakeholders, which is a
strong motivation to develop unique new products to meet their needs (Claudy et al.,
2016). Since the participation of suppliers can directly access external stakeholders,
enterprises can enhance their complementary or heterogeneous knowledge to meet
the needs of stake-holders, thus helping them develop new products (Isaksson et al.,
2016). Therefore, with the same level of sustainable development orientation, the
high-level green supplier participation should be able to create better performance of
new green products.
21
3.4 Customer
3.4.1 Sustainable products
Sustainable products are those that have the smallest possible impact on the environ-
ment during their life cycle. The life cycle in this simple definition includes the ex-
traction, production, use, and eventual recovery (or deposition) of raw materials. Ma-
terials in the product and materials (or elements) used to generate energy are also
included here. A good sustainable product must give the user as much satisfaction as
possible. Otherwise, it will fail in the aspect of market and economy (Ljungberg,
2007). The need to develop sustainable products is one of the major industrial chal-
lenges of the 21st century, given the increasing pressure to adopt more sustainable
product design and manufacturing methods. The sustainable product development
program (primarily through ecological design) has been developed for some time to
support the company in developing more sustainable products (Maxwell & Van der
Vorst, 2003). In order to develop more sustainable products, some important points
are found: Products that reduce the use of raw materials and energy include services
throughout their lives; To reduce the emission, diffusion and production of toxic sub-
stances throughout their life cycle; Increase the amount of recyclable materials; Max-
imize sustainable use of renewable resources; Maximize sustainable use of renewable
resources; Minimize the service intensity of products and services; Long product life;
Assess and minimize the environmental impact of products during their use; Using
"reverse logistics" means that all efforts are made to reuse products and materials,
improve product efficiency during use (Ljungberg, 2007).
3.4.2 Customer Engagement
Cognitive, emotional and behavioral dimensions are the most comprehensive defini-
tions that constitute the concept of customer engagement (CE) (Vivek, Beatty and
Morgan2012; Hollebeek,2011). In developing their definitions, these authors, typi-
cally, are available from relevant field literature (e.g., social psychology). Several
marketing literatures (Brodie et al., 2011; Kumar et al., 2010) discuss CE as a measure
of the outcome of a company's activities. It is defined as a mechanism by which cus-
tomers add value to the company through direct and/or indirect contributions (Pansari

22
and Kumar 2017). Direct contributions include customer purchases, indirect contri-
butions include motivational recommendations from customers, social media conver-
sations about brands, and customer feedback/Suggestions on the company (Kumar
and Pansari 2016a). They are the only studies that focus on at least one aspect of the
CE framework. Other studies have shown that cultural differences affect word-of-
mouth behavior (Lin and Kalwani 2018), the purpose for which people use social
media (Papacharissi and Rubin 2000) and so on. In today's highly dynamic and inter-
active business environment, the role of CE in co-creating customer experience and
value is attracting increasing attention from business practitioners and academia. Alt-
hough the concept of “engagement” in business relations is not new, it has received
considerable interest in the past decade (Brodie, Hollebeek, Juri & Ili, 2011). In an
interactive, dynamic business environment, customer engagement represents the stra-
tegic need to improve business performance, including sales growth, superior com-
petitive advantage, and profitability. The rationale for these assertions is that engag-
ing customers play a key role in viral marketing campaigns by offering specific prod-
ucts, services and/or brand recommendations to others. Dedicated customers can also
play an important role in the development of new products/services (Hoyer et al.,
2010).
3.4.3 Zero Waste theory
Waste is a symbol of low efficiency in any modern society, as well as a manifestation
of the improper allocation of resources. Any waste will consume natural resources,
consume energy and water, put pressure on land, pollute the environment, and finally,
increase the economic cost of waste management. We need to go to a place where
there is no waste, only change; This position is called zero waste. "Zero waste" is one
of the most farsighted concepts to solve the problem of waste (Zaman & Lehmann,
2013). Zero waste means systematically designing and managing products and pro-
cesses to avoid and eliminate waste and recover all resources from waste streams
(Zaman and Lehmann, 2011). Zero waste means no unnecessary or undesirable
waste at any stage of the product life cycle. Zero waste covers many concepts devel-
oped for sustainable waste management systems, Includes avoidance, reduction, re-
use, redesign, recycling, recycling, repair, remanufacturing, resale and redistribution
of waste resources. As a result, zero-waste strategies are becoming increasingly

23
popular as best practices. Zero waste and sustainable development have significant
preventive potential (Greyson, 2007). Zero waste not only encourages the recycling
of products, but also aims to adjust their design, production and distribution to prevent
waste from appearing in the first place (Myrdal, 1968). Most modern societies are
implementing integrated waste management systems to recover resources from waste.
However, the concept of zero waste is not limited to optimal recycling or resource
recovery; In addition, zero waste also requires a re-screening of unnecessary waste in
the first phase of product design. Therefore, the "zero waste" design principle goes
beyond recycling, focusing on the innovative product design to avoid and reduce
waste, and then recycling and composting the rest (City of Austin,2008).
3.5 Environment and Distribution
3.5.1 Energy use
Renewable energy usually includes wind, solar, wave and biomass energy (Lund,
2007). The future of sustainable energy depends on the increase of the proportion of
renewable energy, especially in developing countries (Goldemberg, 2007). Sustaina-
ble development strategies typically involve three major technological changes: en-
ergy conservation on the demand side, increased energy productivity, and a variety of
renewable energy sources to replace fossil fuels. The large-scale renewable energy
implementation plan must therefore include a strategy for integrating renewable en-
ergy into coherent energy systems affected by energy-saving and efficiency measures
(Lund, 2007). From the perspective of sustainable energy development, renewable
energy has been widely used to ensure greater security of energy supply. Renewable
energy is less polluting, both in terms of local emissions (such as particulate matter,
sulphur and lead) and greenhouse gases (carbon dioxide and methane) that contribute
to global warming (Goldemberg, 2007). The interaction between sustainable devel-
opment and supply chain is a key next step in the study of operation and sustainable
development (Kleindorfer et al., 2005). The focus on the supply chain is a step to-
wards wider adoption and development of sustainability, as the supply chain consid-
ers products from the initial processing of raw materials to delivery to customers.
However, sustainability must also integrate issues and processes that go beyond the
core of supply chain management: product design, manufacturing by-products, by-

24
products generated during the use of the product, product life extension, product life
termination, and recovery processes at end-of-life (Linton, Klassen & Jayaraman,
2007). Sustainability introduces quantifiable considerations related to the natural
environment and, in some cases, social issues - the triple bottom line (Elkington,
1998). Referring to retailers' sensitivity to sustainability policies, it is important to
consider the interaction between economic factors and social and environmental is-
sues - such as noise pollution, congestion and carbon dioxide emissions (Linton, Klas-
sen & Jayaraman, 2007).
3.5.2 Distribution
Ballou (1976) established the ABC method of inventory location and proposed the
search heuristic algorithm for the multi-item allocation problem in the retail distribu-
tion network. The authors include the outbound transportation, inventory cost and
service opportunity cost involved in assigning a product to a distribution center (DC)
type. The service opportunity cost is the penalty cost, which is directly related to the
distance between the allocated DC type and the relevant store. Operation excellence
in the business environment is the primary goal of a company providing products and
services. Its goal is to maintain the leading position in price, reduce cost and optimize
operation (Shavarini et al., 2013). Baker (2004) said the DC strategy classification
depends on SC priorities: demand or supply, which involve agile (service-level em-
phasis) or lean (cost emphasis) SC, respectively. While the strategy focuses on re-
quirements (agile concepts), DC's projects are designed to respond quickly to opera-
tions in order to seize opportunities in volatile markets. Therefore, the aim is to reduce
response time with high accuracy. Here, agility is similar to the concept of volatile
markets; Therefore, the ability to respond quickly to market opportunities is a key
factor (Vonderembse et al., 2006). Therefore, the success of the company's distribu-
tion strategy plays a key role in supporting DC's internal operations. The mission of
DC is to efficiently deliver products to the next node in the distribution network with-
out changing its form (Tompkins et al., 2003). Supply strategy (lean concept) focuses
on reducing SC waste, such as resource surplus, high inventory level and long deliv-
ery cycle (Christopher and Towill, 2002). Lean SC can accelerate inventory turnover
and reduce the inventory of the whole supply chain (Vonderembse et al., 2006). In

25
addition, once the project is approved, the goal of improving quality and flexibility
can be pursued while reducing costs (Booth, 1996). However, due to the uncertainty
and speed of such environmental changes, the performance of warehouse operation is
affected by the logistics strategic planning process DC is the core of retail industry
retail supply network architectures. While other traffic types (e.g., direct store-to-
store deliveries from suppliers) also play a role in retail distribution, the vast majority
of products are shipped through retail operated DCs in several sectors for example
grocery retailing (Kuhn&Sternbeck, 2013). The product is temporarily stored in the
DCs until it is picked up according to the store order and shipped to the store. Retail
logistics networks usually consist of DCs belonging to different types of DCs. Retail
supply networks can include central, regional, and local DCs, for example. Central
DC (a site) - for example - all stores for a country to provide services, regional DC
(some sites) can be dedicated to service specific area (for example, a few states or
province) stores a subset of the local DC (many) in a particular area of the relatively
small (for example, a single state or community) service shops are relatively few.
Referring to Fleischmann (2016), we call this structure the European retail distribu-
tion system. In most cases, DCs are supplied directly from the supplier shipping point
(e.g., manufacturer, industrial warehouse or wholesale warehouse), which means
there is no supply relationship between different types of DCs (Kuhn&Sternbeck,
2013). Downstream, volume flows are often merged in internal transfer points (TP),
also known as merge points, where product flows from different DC types are com-
bined without breaking the loaded carrier packaged for a specific store in the corre-
sponding DC. The supply chain segmentation research process provides additional
insight into stock keeping unit (SKU) assignment tasks. Delivery through differ-
ent DC types is considered to be a different type of structural flow, each of which
favors a product with different characteristics. Depending on the situation, geographic
concentration is considered a design option for creating appropriate subdivisions
(klaas-wissing, 2007). Lovell et al (2005) more specifically elaborated the qualitative
dependence between product features and preferred DC types. Some relevant rules of
thumb are derived about the throughput of product characteristics, demand change
and value density as the combination standard of product physical quantity and value.
Products with high demand variability and high value density should be distributed

26
through the central DC due to the inventory pool effect and relatively low transport
intensity. In contrast, a product with a low value density is sensitive to transportation
due to its physical size but insensitive to inventory due to its relatively low value.
However, SKUs with high turnover are considered suitable for regional or local DCs
because key capacity usage in inbound transport is easier to achieve and the total
distance is shorter. Inbound transportation includes transportation tasks between the
manufacturer's supply point and DC. The shipping work depends on the number of
goods and the distance from the supplier to a particular DC. The quantity of goods
required to DC depends on the volume of sales and the physical quantity of the prod-
uct delivered. From the single-product point of view, assuming that the truck is always
at full capacity, the allocation of the DC type with the lowest volume-weighted aver-
age distance can save inbound transport costs. Transport costs are particularly im-
portant for the distribution of products with high sales and physical quantities.
3.6 Certificates
3.6.1 RSPO – Roundtable of Sustainable Palm Oil
Oil palm is one of the fastest growing crops in the world, especially in Malaysia and
Indonesia. Oil palm plantations are also growing rapidly in tropical regions such as
New Guinea, Africa, Central America and the amazon (Koh&Wilcove 2009. Oil
palm is an important driver of tropical deforestation (Fitzherbert et al,2008), The
spread of oil palm endangers lowland rain forests and peat bog forests (Butler&
Laurance, 2009. The rapid expansion of oil palm seems likely to continue for many
years due to its high profitability and the growing global demand for edible oils and
biofuel feedstocks. However, from the perspective of climate change and biodiver-
sity, palm oil production is greatly reduced when deforestation is directly or indirectly
caused (Gibbs et al,2008). Growing concerns about palm oil's environmental im-
pact have led to the Roundtable of Sustainable Palm Oil (RSPO), a nonprofit trade
group led by the nonprofit industry with a mission to bring RSPO -certified palm oil
to market, Transparent and promotes sustainable palm oil growth and use. As the term
roundtable suggests, the RSPO advocates a balanced multi-stakeholder approach, and
there is a strong emphasis on environmental sustainability. Although it was

27
established in 2004, it is strategically positioned in the palm oil industry and is par-
ticularly influential in Malaysia (Laurance et al, 2010). The RSPO aims to limit
the environmental impact of growing and processing palm oil. The standards focus
on issues such as herbicide reduction, air pollution and biodiversity loss, and social
and legal issues (RSPO 2006).
3.6.2 Internal Score Cards of Companies
Traditional scorecard has limitations in stakeholder management, product chain man-
agement and so on. The European Corporate Sustainability Framework (ECSF) pro-
ject distinguishes several levels of ambition in Corporate Sustainability/Corporate re-
sponsibility. The traditional balanced scorecard applies to companies targeted by
compliance driven Corporate Sustainability and Corporate Responsibility (CS/CR) or
profit-driven CS/CR, where the financial bottom line is the ultimate indicator of suc-
cess. More ambitious companies want to balance economic, social and ecological
goals in a community-driven CS/SR or a synergistically driven CS/CR. For ambitious
companies, we have a Responsive Business Scorecard (RBS) format. RBS enabled
the company to score points in terms of profits, people and planet, while integrating
the needs of stakeholders into internal projects to improve performance. We will refer
to the scorecard with a clear focus on social and environmental aspects as RBS, which
includes five perspectives: customers and suppliers, financiers and owners, society
and planet, internal processes and employees and learning. Traditional topics such as
finance, customers and employees are easy, but this sustainability topic chain man-
agement (supplier) and environment-psychological performance (earth) need further
refinement (Van Der Woerd & Van Den Brink, 2004). Zingales, O 'rourke and Hock-
erts (2002) have recently reviewed the experience of scorecard IN several large com-
panies. They say that scorecard, including-sustainability-topics, is IN its infancy (IN-
insead, 2003), but it is of course applicable to practical applications. On the Respon-
sive Scorecard, the three sustainability Ps(profit, people, planet) have a clear, clear
format (financier/owner, employee, society/community & planet/ecology). Score-
cards are particularly useful for companies wishing to achieve community-driven
CS/CR levels and cooperatively driven CS/CR levels (Van Der Woerd & Van Den
Brink, 2004).

28
3.6.3 UTZ certification
UTZ label system (formerly known as UTZ Kapeh) is a recently established standard.
It was founded in 1999 by Dutch roaster Ahold Coffee Company but is now used by
other European Coffee companies and restaurant chains (Chiputwa, Spielman &
Qaim, 2015). In the Netherlands, certified coffee, especially fair trade, has a long
history. In the first few years, only fair trade/organic coffee was sold, accounting for
about 3%. In the Netherlands, certified coffee, especially fair trade, has a long history.
In the first few years, only fair trade/organic coffee was sold, accounting for about
3%. In 2002, the situation changed and other types of certified coffee (especially UtZ)
became more prominent (Kolk, 2013). UTZ's primary focus is on traceability and
sustainable production processes, based on the Good Agricultural Practice (GAP)
specified by Global GAP. The GlobalGAP standards require manufacturers to comply
with the international Labor organization’s Labor laws on wages and working hours
and to use pesticides responsibly. UTZ-certified farmers have to be trained at GAP,
and the idea is that this training will help increase coffee production and quality,
thereby increasing coffee prices (Chiputwa, Spielman & Qaim, 2015). "Through the
UTZ program, farmers can grow better crops, generate more income, and protect the
environment and the earth's natural resources"(UTZ Certified,2013). For many
companies, corporate social responsibility has begun to include sustainable coffee
supply, which in general leads to all market channels now including certification, but
only a few chains adopt a global strategy (Choose a certified coffee that is available
anywhere); Ikea with UTZ certified coffee is a prominent example (Kolk, 2013).
3.6.4 CIWF
Compassion in World Farming (CIWF) is an international organization that advocates
the humane treatment of farm animals (D 'silva, 2006) ,It is also the UK's leading
animal welfare organization (Langley& D 'silva, 1998). The environment in which
these individuals, such as chickens or cows, live may also hinder many of the genetic
behaviors they so strongly desire to perform. In order to inhibit the harmful abnormal
behavior, such as pecking chicken feathers, we sometimes take the method of injuring
animals. In many places, chickens are usually debeaked through a hot metal guillotine
(D 'silva, 2006). The CIWF campaign led to a ban on cruel feeding systems in the

29
UK, such as placing calves in cramped boxes and restricting pregnant sows to corrals
and leashes (Langley& D 'silva, 1998). CIWF believes it is unethical to treat sentient
beings in this way. We have a responsibility to respect the feelings of farm animals,
to provide them with housing conditions that take into account their needs and aspi-
rations, and to restore the use of slower growing breeds with good potential. Current
methods of agricultural production are replaceable, and we are responsible for ani-
mals and our conscience (D 'silva, 2006). In 1997, animals were officially recognized
as "sentient beings" in the Amsterdam treaty, largely due to a 10-year campaign by
the CIWF. CIWF campaigns against genetic engineering of farm animals as a new
threat to their welfare (Langley& D'Silva, 1998).
3.6.5 GSCP – Global Social Compliance Programme
Global Social Compliance Programme (GSCP) is an initiative of consumer goods
BBS (benoit-norris et al, 2011) ,and a third-party organization that reviews supplier
conditions (Lewis, 2016). It aims to address audit fatigue and duplication, audit qual-
ity, and problems that have not met expectations in improving social impact. It pro-
motes greater standardization of methods and tools by bringing together key enter-
prise members and brand holders and putting them on the task of developing the so-
lution (benoit-norris et al, 2011). The mission of GSCP is to coordinate existing work
and provide a common, consistent and global approach across departments to contin-
uously improve work and environmental conditions in the global supply chain (Vidal-
León, 2013). GSCP is available to purchasing companies in all industries and regions
(brands and retailers) (Vidal-León, 2013), many suppliers adhere to the GSCP be-
cause of ethical trade issues (Müller, Vermeulen & Glasbergen, 2009). GSCP pro-
vides a global platform to facilitate the exchange of knowledge and existing best prac-
tices in order to establish comparability and transparency between existing social and
environmental compliance systems (Klassen & Vereecke, 2012).
3.6.6 ISO14001
ISO14001 is one of the most popular and widely used standards in the environmental
management system, especially in Europe, as part of the ISO14000 series of environ-
mental standards. Since 1996, when the ISO14001 standard was first published, the

30
number of certified companies has risen dramatically. As time goes by, more and
more companies develop EMS according to this international standard (Von Zharen,
1996). The ISO14000 series of environmental standards seeks to "provide a practical
toolbox to assist in implementing actions to support sustainable development" (ISO,
2002), which includes standards, guidelines and recommendations for such important
environmental management, environmental audit, environmental labeling or life cy-
cle assessment. However, the only standard in this series is ISO14001, which provides
a list of specifications and requirements that EMS should meet. The ISO14001 stand-
ard is divided into five major parts :(a) environmental policies, including statements
of environmental policies and principles; (b) planning, requiring the company to in-
dicate the procedures used to identify the environmental problems to be addressed
and to set out specific objectives and targets; (c) implementation and operations, in-
cluding the identification of the system's responsibilities and ensuring the identifica-
tion of training needs, internal and external knowledge of the system, control docu-
mentation and operations, and emergency preparedness and response; (d) inspection
and corrective action, which requires procedures to monitor operations and prevent
and mitigate non-compliance with targets and targets; (e) management review, which
means the senior manager's setup process reviews the suitability and effectiveness of
the system and introduces appropriate changes (Von Zharen, 1996).
3.6.7 GHG Protocol Corporate Standard
The Greenhouse Gas Protocol provides the most widely used accounting standard for
Greenhouse gases in the world. Companies using the GHG Protocol can target climate
leaders (indeed, adopting the GHG Protocol is known as "climate savers"). The
Greenhouse Gas Protocol initiative has two accounting standards, one at the corporate
level and one at the project level. Corporate accounting measures the emissions gen-
erated by a company's activities (Green, 2010). The GHG Protocol Corporate Ac-
counting and Reporting Standard aims to become a "generally accepted Accounting
Standard for greenhouse gases", which is equivalent to The generally accepted Ac-
counting Standard for financial Reporting (Green, 2010).The GHG Protocol Corpo-
rate Accounting and Reporting Standard provides requirements and guidance for
companies and other organizations to prepare a list of greenhouse gas emissions at
The Corporate level. Greenhouse gas accounting provides a detailed and reproducible

31
report of greenhouse gas emissions from a specific location or actor. The protocol
provides the concept of dividing emissions into different "ranges". Scope1: emission
refers to the emission from the control of the owner of the company. Scope 2 includes
those emissions from the purchase of electricity. Scope 3 includes all other indirect
emissions (such as transportation or extraction of procured materials). The concept of
scope has become very common in the language and practice of greenhouse gas pro-
jects (Green, 2010).
3.6.8 DEFRA
Increasing scientific evidence related to global warming significantly influences de-
cision makers to take decisive measures to manage greenhouse gas (GHG) emissions
(Boston & Lempp, 2011). In response to this new threat, the British government
launched a series of initiatives known as the "climate change initiative" (Wordsworth
& Grubb, 2003). These actions contributed to the promulgation of the Climate Change
Act (CCA) 2008. In addition, the CCA (2008) recognizes that measuring and report-
ing greenhouse gas emissions is critical to combating global emissions, article 83 calls
for the government to issue guidance on this (Tauringana & Chithambo, 2015). There-
fore, in September 2009, the UK government issued the GHG emission measurement
and reporting guidelines through Environment, Food & Rural Affairs (DEFRA). The
main aim of the 2009 guidelines is to support UK organizations in decreasing their
contribution to climate change. The guidelines, based on GHG Protocol (2004), out-
line GHG emission measurement and reporting standards (Department for Environ-
ment, 2009) and are consistent with other voluntary GHG reporting frameworks, such
as ISO 14064-1, a specific standard that specifies GHG emissions accounting and
reporting. Although other greenhouse gas reporting guidelines already exist, The
2009 DEFRA guidelines, which were backed by the government, brought momentum
and clarity to British firms, Although companies can voluntarily measure and report
emissions, government-supported initiatives such as regulation provide a reasonable
basis for companies to invest in new technologies and other green energy initiatives
(Bowen and Wittneben,2011).

32
3.6.9 IEA
In recent years, global energy governance has become a major research topic in the
literature on international relations, governance and public policy (Florini and Sova-
cool, 2009). The critical importance of the International Energy (IEA) Agency is
widely recognized by academics working in the field. The International Energy
Agency was created in response to the 1973 oil crisis to coordinate the Energy policies
of its 28 member countries, all of which are members of the organization for economic
cooperation and development (OECD). Most observers believe that despite its limited
mandate and membership, the IEA remains the most important organization for en-
ergy importers (Colgan,2009). Due to the emergence of a globally integrated oil mar-
ket in the 1980s (Verleger, 1987), IEA member states are now less concerned about
oil resistance and more concerned about climate change, gas supply disruptions and
China's entry into the African oil industry. These trends - the rise of new energy con-
sumers, the challenges associated with new energy and the new international energy
BBS - threaten to make the IEA increasingly redundant. Once a pre-eminent multi-
lateral energy organization, the IEA is struggling to maintain a central role in global
energy governance, this changing environment means that the IEA must adapt to
maintain its effectiveness, legitimacy and relevance (Van de Graaf, 2012).

33
4 Empirical Chapter
4.1 IKEA IKEA was founded seven decades ago in Småland, Sweden, where people had to be
thrifty and innovative to make a living. It is the world’s largest furniture company
now and has 328 stores and operations in 43 countries, 155.000 co-workers and a total
sale of 31.9 billion euro in 2015. (IKEA 2015) IKEA started as a small business es-
tablished by Ingvar Kamprad. During a couple of decades, he achieved to create a
major retail international company out of the small business and sell furniture at a
very low price but still make good profit. (Histroy – IKEA)
IKEA is a global company with manufacturing and distribution centers around the
world. Its supply chain is large and complex, and it is a pioneer that has introduced a
systematic and sustainable approach to its operations ( Alänge , Clancy &
Marmgren,2016). IKEA advocate sustainable living project which means save en-
ergy, conserve water, recycle and reduce waste, live healthier in people’s home.
(IKEA, 2018) IKEA's vision is to "create a better daily life for many people". Their
business philosophy is to provide all kinds of well-designed functional home products
at a low price to make them affordable for as many people as possible (IKEA Supply
AG,2008). IKEA is not only a signatory of the ten principles of the United Nations
global compact, which Outlines the fields of human rights, labor, environment and
anti-corruption, but also actively tracks the progress of IKEA's sustainable develop-
ment in each principle (IKEA Group,2016). Ikea also supports the United Nations
sustainable development goals (SDG); A framework consisting of 17 goals aimed at
eliminating poverty, inequality and injustice, and tackling climate change (IKEA
Group, 2016). In this regard, IKEA's progress also corresponds to sustainable devel-
opment, sustainable development mechanism and sustainable development goals
(Laurin & Fantazy, 2017). They focus on sustainable growth, which is achieved
through a combination of function, quality, design, and value in sustainability ways.
(IKEA, 2018).
IKEA can implement sustainable development policies successfully throughout the
supply chain, including all stakeholders and their various interests, while maintaining

34
a strong economic position. Ikea has developed a set of formal, effective and reusable
best practices to successfully implement SSCM practices. Despite widespread con-
cern that the adoption of sustainability efforts would lead to economic erosion and
the loss of competitive advantage, (Nidumolu,Prahalad,&Rangaswami,2009)
IKEA, on the other hand, is a leader in innovative sustainability practices throughout
the supply chain and a model for the effective integration of sustainability and growth
(Laurin & Fantazy, 2017).
4.2 IKEA and sustainability Sustainability can be successfully integrated into product development in large firms.
However, depending on the culture of the company and their logic of their existing
management system they can have different strategies. Since corporate social respon-
sibility (CSR) is an integrated part of companies’ strategic decision making more and
more integrate sustainability into their companies and even argue that it is the primary
driver of innovation. There are four different rationales that CSR should be based on.
Reducing cost and risk, developing reputation and legitimacy, gaining competitive
advantage, and creating win-win outcomes through synergistic value creation some
management system standards like ISO 14001 is therefore used. (Alänge, 2016)
IKEA is a private company that received international recognition for its unique and
innovative business model letting customer take their order directly from the shelves,
transport the items home, and assemble the products by themselves. With this concept
the products are much cheaper and affordable to a majority of consumer. In the 1990s,
this company was one of the pioneering firms that introduced sustainability in the
company. After 2006 they introduced the integration of sustainability in their product
development with around 800 employees working in this unit. IKEA’s management
system builds on a strong culture that guides behaviour including socialization pro-
cesses, training, hiring young people, and requiring network. Through an annual
Christmas speech, they present the founder’s basic ideas from the firm and it serves
as the major communication channel for strategy and culture change. It provides a
foundation for a guideline how employees should behave and make decisions in dif-
ferent situations and understand why things are done in a certain way.

35
Figure 6 IKEA's integration of sustainability in product development
In product development, it is important to relate success stories to specific products
or product areas through the story-telling method that is deeply anchored in the cul-
ture of this company. Mostly, these stories start with a problem or challenge and de-
cisions in the end are made in informal networks and with help of long-term experi-
enced individuals that go through learning processes. Beside focusing on encourages
testing, experiences and learning it also values failure. One of the new challenges was
the new legal requirements concerning the emission of chemical substances that could
affect health which would damage the brand’s image when not handled and fixed.
Since this company already focused on product safety, the customers’ needs for a
broader focus on sustainability was integrated into its culture in the 1990s. Afterwards
sustainability thinking was also continually communicated in the form of success sto-
ries from the firm’s activities. In the management system culture is probably the most
important component in this company. IKEA also attempted to utilize the life-cycle
assessment (LCA) tool in product development.

36
4.3 Sustainability Annual Report 2010
4.3.1 Presentation of their sustainability action
In the first annual report of the company IKEA 2010, they are presenting the IKEA
sustainability direction that leads the way forward and influences their whole value
chain. With their renewable energy implementation, they want to install solar panels
in 150 stores. Till 2011 they wanted to increase this number to around 40 buildings.
Furthermore, they introduced the IKEA sustainability product score card which is the
new internal tool for more sustainable product development. The aim is to steer them
to select the best possible alternatives within 11 criteria that have an impact on their
product’s sustainability profile. In those steps towards a more sustainable IKEA this
company is presenting a list of sustainability mile stones including introducing
IKEA’s first environmental manager in 1989, establishing “A waste Management
Manual” in 1999, their energy project of “IKEA Goes Renewable” and different cor-
porations with NGO’s like WWF, UNIVEF, Save the Children child right programs
in India and Pakistan’s cotton areas and so on.
For their goal to offer a range of products that are more sustainable their goal till 2015
is to have 90% of their sales coming from home furnishing products classified as
“more sustainable” in the IKEA Sustainability Product Score Card. All of the materi-
als for home furnishing products should be renewable, recyclable recycled and their
energy-consuming products should be 50% more efficient than in 2008. They aim to
integrating Sustainability into everything they are doing like taking social responsi-
bility, reducing their water footprint, turning waste into resources and lower their car-
bon emissions by using more renewable energy in their own operations, the supply
chain and customer travelling to IKEA stores to create a positive impact on the cli-
mate.
In IKEA’s vision, business idea and sustainability they want to offer a wide range of
well-designed, functional home furnishing products at prices so low that as many
people as possible will be able to afford them. It’s about creating a better everyday
life for the many people and creating awareness on limited resources of the planet.

37
4.3.2 Suppliers
IKEA wants to motivate and support suppliers to continuously improve. With the
code of conduct IWAY, IKEA wants to ensure a positive development. In this code
of conduct social and environmental requirements are written down and expected by
the suppliers to fulfill. This concept had significant outcomes especially in the supply
chain field for the company. IKEA claimed that their suppliers experienced that in-
vestments in working conditions and the environment often lead to more orders, better
productivity and improved profitability, thereby improving their competitiveness.
4.3.2.1 The Ikea supply chain
IKEA has thousands of suppliers for the wide range of products and services but also
for food products and goods transports like sub-suppliers. Their focus is on IKEA
home furnishing suppliers and on supporting them to take responsibility for people
and the environment. They are also a member of the Global Social Compliance Pro-
gramme (GSCP) that are working towards a sustainable approach for the improve-
ment of working and environmental conditions in the global supply chains. IKEA had
1,074 Home Furnishing suppliers, 251 Transport service providers, 90 globally food
suppliers and 39 catalogue suppliers in 2010.
4.3.2.2 Code of conduct – IWAY
Some of the key points of IWAY are as follow:
1. The legal compliance where the suppliers have to meet the requirements not
only of IKEA IWAY but also relevant laws.
2. No child labour, no forced or bonded labour, no severe environmental pollu-
tion, no severe safety hazards, transparent and reliable system for records of
working hours and wages and insurance for all workers.
3. Environmental standards need to be meet by suppliers in forms of working to
reduce energy consumption, prevent pollution to air, ground and water, han-
dle chemicals in an environmentally safe manner and ensure that workers
handling chemicals and hazardous waste are adequately trained.
4. IKEA expects its suppliers to respect human rights and provide safe and
healthy working environment, providing health and safety training for work-
ers and ensure their buildings are safe, pay minimum legal wage and more.

38
Figure 7 IKEA furnishing suppliers list
In two years, IKEA aimed to require all regions of furnishing suppliers to fulfill the
IWAY special requirements of their company by 100%. Furthermore, the current sta-
tistic of fulfilling the requirements of IWAY is that 62% of their suppliers are from
Europe and fulfill the rate of IWAY by 100% already. While 34% of their suppliers
are from Asia and would need to improve 7% to fulfill the requirements of 100%
IWAY rates. There are just 4% of suppliers that are from North America with the
lowest fulfillment rate 94% yet.
Figure 8 Transport service providers of IKEA

39
For IKEA’s transport service providers, they have the same goal. They also want them
to fulfill 100% of their IWAY rates in two years. Their distribution of transport modes
is 73% on the road, 16% on the ocean, 2% on rail and 9% are combined transports.
4.3.3 Customers
For the customer the IKEA sustainability product score card was introduced to ensure
that customers can freely choose among their products, knowing that IKEA is com-
mitted to sustainable practices and that they do not have to choose between sustaina-
bility, style, function or price. For the score card there are different criteria that will
classify a product and makes it easier to compare on the market. Products of suppliers
needs to meet the requirements in the IKEA code of conduct IWAY. Furthermore,
IKEA of Sweden is responsible for developing the range of home furnished products
where all eight business areas have a dedicated sustainability leader, responsible for
product development and supply chain. Furthermore, there are product developers,
technicians and others invited to take part in three training modules on waste, energy
and water issues. IKEA also decided on purchasing Roundtable of Sustainable Palm
Oil (RSPO) which is a Certificate to help stimulate more sustainable palm oil produc-
tion. For their food operations in the stores they are trying to get a better understand-
ing of how to reduce energy and water consumption and minimize waste and food
packaging to reduce the overall environmental impact. For customers who are buying
coffee in the company IKEA will receive a 100% UTZ Certified coffee so that they
are able to trace the beans that used all the way back to the plantations through a code
on the packaging. Moreover, the standard for chicken was also regulated since they
require chicken having natural light through windows, perching and pecking objects
and access to straw bales to encouraging foraging in corporation with CIWF. Also,
the salmon is standard is recreated since the company wanted to ensure that criteria
like environmentally, socially and economically are ensured. IKEA is also working
towards encouraging their customer to contribute to positive social and environmental
developments through campaigns and activities run by IKEA and their partners in
forms of donation and community projects as the IKEA FAMILY club member, to
make a difference. Customers globally, nationally and locally are invited to help re-
cycling and life a more sustainable life at home.

40
This graphic is showing the intention of IKEA to meet their goals in 2015 by making
their products 90% more sustainable, 100% renewable, recyclable and double the ef-
ficiency of their energy consumption and water consumption.
4.3.4 Environment
The IWAY Forestry requirements is applied throughout the supply chain. Their cer-
tified wood volumes increased substantially in 2010 from 16.2% to 23.6%. Caused
by certified wood and supported certification efforts in some of their key wood sourc-
ing areas, Russia in cooperation with WWF and the national FSC organization. Fur-
thermore, the Chinese certified forest areas also increased substantially as a result of
corporation between IKEA, WWF and other parties. Moreover, Swedwood and
Swedspan production units are also now Forest Management-certified. In 2010 IKEA
joined two alliances to promote legal wood trade through functional market regula-
tion.
4.3.4.1 Strategic approach
IKEA’s long-term goal is to source all wood used in IKEA products from forests
verified as responsibly managed fulfill the standard of Forest Stewardship Council
(FSC), Forest Management (FM) and Chain of Custody (CoC) standards. The goal is
to reach 35% by the end of 2012. Furthermore, they are searching for new techniques
to get the best possible return from every tree trunk and actively supporting certifica-
tion development in countries like China and Russia. IKEA’s suppliers must report
Figure 9 Sustainability Goals of the company IKEA

41
the origin of their wood every four months and they are monitored not only by IKEA
but also by other certificated schemes of FSC of independent auditors. Through the
cooperation with WWF they are supporting responsible forestry. Another long-term
goal is to source all wood in the outdoor furniture range from forests that are inde-
pendently verified by a third party.
Figure 10 Forestry management
The goal for IKEA is to improve the wood acquirements. They want to improve the
purchase of certified responsible forest manager from 24% to 35% in two years and
also archive 100% audited wood that meets the requirements of the minimum IKEA
forestry standards. IKEA is using pine, beech, spruce, birch and acacia tree species
because they don’t want to rare materials that take long time to grow. The countries
where they are buying the wood products are Poland, China, Russia, Romania and
Sweden.
4.3.4.2 Renewable Energy
For the energy consumption and energy use in IKEA buildings this company wanted
to get to 100% renewable energy usage. They want to increase their energy efficiency
in stores, distribution, Swedwood and Swedspan. They committed to the ten princi-
ples of the UN Global Compact with the goal to communicate how they work and
what their progress in the environmental field is.

42
4.4 Sustainability Annual Report 2014
4.4.1 Presentation of their sustainability action
In 2014 IKEA used 41% of wood from more sustainable sources and saved 66 million
euro in energy efficiency efforts since 2010. Furthermore over 75% of cotton is used
from more sustainable sources due to their investment of EUR 1.34 million in projects
to help 110,000 farmers improve their incomes and produce cotton using less water
and chemicals. All of their home furnished suppliers are 100% IWAY approved and
they introduced a 100% FSC certified IKEA catalogue. Furthermore, they made en-
ergy efficient LED lighting more affordable supporting sustainability in their custom-
ers life and reducing their electricity costs.
They introduced a new strategy called “People & Planet Positive strategy” with the
aim to have a positive impact on the world with their business. In their vision to create
a better life for the many people, living more sustainably is included. With this new
strategy they wanted to focus on three areas. To inspire and enable millions of cus-
tomers to live a more sustainable life at home, to strive for resource and energy inde-
pendence and to take a lead in creating a better life for the people and communities
impacted by their business.
Figure 11 Goals of IKEA

43
The objectives of IKEA are to become the leader in life at home as a furniture com-
pany and to growth, have long-term profitability and become a better IKEA. For their
growing they want to offering better products at lower prices, developing a more vital
IKEA and becoming more accessible to the many people. Their goal is to target three
main areas. Firstly, people who are working in their company should have a great
place and beside that they also want to strengthen their culture. Secondly, sustaina-
bility should become a bigger and more important topic especially with help of their
new strategy “people and planet positive” to always act in a responsible way. Last but
not least, to lower their costs through lowering their overall cost structure in the com-
pany and to simplifying their way of work.
The goal of their new strategy is to ensure to meet the goal by 2017. They want to
reach 95% of share of IKEA co-workers that agree with the statement that “sustaina-
bility is a natural part of my everyday work”, that co-workers and suppliers view
IKEA as a company that takes social and environmental responsibility. They also
want to reach 70% of customer to view IKEA as a responsible company.
Figure 12 People & Planet Positive key performance indicators
For the energy consumption their goal is to increase their efficiency through sustain-
able wood and cotton products, using renewable energy, recyclable materials and re-
ducing carbon emissions from their own operations by 50%. Everything should be
100% IWAY approved.

44
4.4.2 Suppliers
IKEA is arming to encourage their suppliers to share with each other more. They
organized a “bringing our suppliers together” event in Älmhult, Sweden where they
invited 12 suppliers with good performance in sustainability to attend their first
“Global Sustainability Days” to share their experiences, best practices and highlight
the importance of new, more efficient technology, and the opportunities for on-site
energy production. The event included workshops on topics like Product Sustainabil-
ity Scorecard and providing feedback on how to improve these tools. Their goal is to
work with all their suppliers to improve energy efficiency as part of their normal busi-
ness relationship. They have completed 40 energy projects with suppliers in more
than 15 countries where they are trying to reach their goals by 2015. The IKEA’s in-
house sustainability developers are also gaining the skills and experiences to lead by
support of energy assessment tool that identifies and quantifies energy efficiency po-
tential. For the next steps IKEA wanted to share their knowledge with more suppliers
so that they are also able to implement new strategies to improve their sustainable
performance. Through four years of work sustainability developers convinced the
supplier that sustainability doesn’t only mean cost but can also save money, result in
a better workplace and creating a better business. One of the companies that changed
small things but made a big difference was “Nafoco” one of IKEA’s biggest furniture
suppliers from Vietnam. They just changed the running of ventilation system when
they needed and saved more than EUR 44,000 on their energy bills. This company is
convinced that by making small changes over time they are able to reduce their energy
use and therefore their costs.
4.4.3 Customers
Their strategy towards a more sustainable life at home was to encourage their cus-
tomer and to increase their customers engagement. In 2013 their consumer tracker
survey showed that more than 85% of their consumers wanted to reduce energy, waste
and water use but only half of them new that IKEA had the solutions. Therefore, their
goal was to increase customer awareness of this. For creating awareness 29 IKEA
stores in France participated in a “Zero Waste Cook-Off” to show how IKEA products
can be used to create sustainable, delicious food. IKEA used organic products,

45
producing zero waste and using minimal water. Furthermore, IKEA tried to inspire
their customers to live a more sustainable life at home by including sustainability
information on many of their price tags, websites, in-stores and their catalogue. In
February of 2014 IKEA first launched their sustainability marketing campaign in the
UK and Ireland including television advert and used radio and social media to give
tips and ideas how to make their homes more waste, energy and water efficient. With
their concept “Future home” they also invited people to evaluate and work on an eas-
ier and more sustainable life at home with the idea called “flexible space” where peo-
ple can live comfortably in a smaller space. Moreover, with their IKEA Family card
customer can join the IKEA club to enjoy lower prices. IKEA also engage their mem-
bers in their sustainability efforts. They created two big events that are inspiring their
members to live a more sustainable life at home. One of them is the sustainability
themed day held in a single store, designed to engage, inspire and inform. On those
days IKEA is offering special products and give free LED bulbs to IKEA FAMILY
members. Till that year 19 stores already held this event. The other one is the home
furnishing workshop from a quick 10-minute workshop to a longer in-depth discus-
sion. It also should serve as an inspiration to move members to make changes to the
way they live right now and encourage them to replace their old lifestyle with a more
sustainable one.
4.4.4 Environment
4.4.4.1 Towards climate positive
In the eyes of IKEA, they saw potential in climate change for their company to be-
come more innovative, bringing new jobs and offers huge opportunities for economic
growth and energy security. They thought that it is a chance to make their business
even better. Since some of the countries are vulnerable to the effects of climate
change, IKEA is working to make their business even more climate positive in sense
of becoming energy independent by investing in renewable energy and energy effi-
ciency, cutting emissions in their supply chain and inspiring millions of customers to
reduce their energy use and generate clean energy at home. Their main strategy is to
make a more sustainable home life by affordable energy-efficient LED lighting, tran-
sition to 100% renewable energy, using 100% sustainable sources for cotton and

46
wood and advocating for ambitious policies to address climate change, individually
and through coalitions.
4.4.4.2 Leader in sustainable furniture production
One of their goals is to become the leader in sustainable furniture production by 2020.
They are making around 15% of their products by themselves. With the plan “People
& Planet positive” they want to make boards and furniture from recycled wood or
wood coming entirely from well-managed forests. Their products are made without
sending any waste to landfill and use the least amount of resources possible. They
aim to be carbon neutral in all IKEA Industry operations, including fuel for vehicles
by the end of 2020 by increasing the use of biomass to generate their own green en-
ergy and purchasing more renewable energy to improving their energy efficiency.
4.4.4.3 Saving energy
They installed a voltage optimizer to save 5.5% of the energy used in 2014 compared
to the year before without changing any electrical equipment. Therefore, it is not only
protecting the electrical equipment from damage but also save them money on energy
bills and repairing or replacing equipment. Through this positive outcome this pilot
project is communicated across IKEA to encourage the installation of the units from
the year 2015.
Figure 13 Improvement of energy efficiency

47
This graphic is showing the goal of 2015 to increase the energy efficiency in stores,
distribution centres, IKEA Industry Group, Solid Wood, IKEA Industry Group Divi-
sion Board and IKEA Components by decreasing the energy use by 20%.
Michael Schmidt, an energy specialist at IKEA Germany, worked across the country
to improve energy efficiency where he provided stores with updates and best practices
to support them. Throughout the help of this specialist stores across Germany reduced
their energy use by 11% in 2014 which is more than double the target.
4.4.4.4 Sustainable Store
Ensuring a more sustainable stores meant to making progress to improve their loca-
tion, design and efficiency. Furthermore, IKEA also launched a sustainable store pro-
ject with workers that are specialists in sustainable buildings, store operations, mate-
rials, architecture, working environment, urban living and mobility to take part in
their creative workshops. Together they established 12 principles for what a sustain-
able store should be like. With their Kaarst store in Germany and Maebashi store in
Japan, IKEA aim to implement all 12 principles not only for a great shopping experi-
ence but also an opportunity for their customer to learn how to live a more sustainable
life at home. Some of the principles are installing LED lights at the store, implement-
ing photovoltaic plant, hot water from heat recovered by heat pumps in the spring,
summer and autumn and offering free bike trailers, cargo bikes and wagons if they
return them within three hours. Furthermore, IKEA tried to sorting waste and recy-
cling in a country that didn’t have it as norm there to help them reducing their carbon
footprint.
4.4.4.5 Renewable energy
In 2014 IKEA started engineering works to install an 80 MW biomass boiler to reduce
75% of the carbon footprint of the factory in Novgorod, Russia which ran with a gas
boiler. Furthermore, it invested in many solar and wind projects to get closer to being
energy independent. They also made further investments in renewable energy like the
Hoopeston wind farm in Illinois, USA where they are able to produce 165% of the
electricity consumed by the whole of IKEA USA each year. Other projects are wind
farm in Dalarna, Sweden, their solar system in Australia, and PV installations in 20
states in the USA.

48
4.4.4.6 Transportation
Since IKEA is selling millions of products in countries around the world every day,
they want to make sure that the distribution process of the products are efficiently
moved from suppliers to distribution centres and to the stores by rail, road and sea by
reducing the number of journeys and distances travelled to a minimum. Furthermore,
they take care that they are using all of the room in the container for their products so
that fewer journeys are needed which also result in reducing their CO2 emissions.
Figure 14 Transportation of IKEA's products
In 2014 IKEA reduced their CO2 emissions per cubic metre of products by 12.8%
which leads them closer to their goal for 2016.
4.4.4.7 Saving resources
IKEA collaborated with their suppliers to improve their water efficiency and quality.
They also meet every year to exchange their best practices and to develop their ap-
proach to water stewardship throughout their supply chain. Most importantly is their
work in China, India and Pakistan and other areas where water is scarce, but the use
of water is high. Normally, suppliers can reduce their water use by between 10% and
20%. IKEA’s “Water Guidelines for Textile Suppliers” is written with details to im-
prove the water impacts of their suppliers. In 2014 they also held sustainability event
for the top 20 suppliers in South Asia and local experts to discuss water management,

49
trends and strategies and shared ideas on how to engage in water projects involving
external stakeholders and the community.
Figure 15 Water use of suppliers of IKEA
In three years, IKEA already achieved to save a big amount of water. Compared to
the 2012 in 2014 they could almost reduce 1,00,000 m3 water. Therefore, they im-
proved their water efficiency by 33%.
Furthermore, they used only FSC Mix Credit certified paper for their 2015 catalogue
which made their catalogue the biggest FSC certified print production in the world.
Through this catalogue they can show customers their products and provide them
some inspiration. Due to their improved data collection methodologies which in-
cluded third party audits to check the accuracy of data provided by their suppliers,
updated emissions factors used to calculate emissions arising from production and
transport from forest to paper mill, and calculation methodologies recommended in
the Global Reporting Initiative’s G4 guidelines. Moreover, for a more sustainable
catalogue, IKEA did its first step with the digital catalogue. By that the only resource
they are using is the energy consumption when they are creating their app and website.
Therefore, they tried to map their digital supply chain so that they could start gather-
ing reporting environmental data from their digital suppliers next year. Their aim in
this field is to make both the printed and the digital form of their IKEA catalogue as
sustainable as possible. In 2014 they printed 217 million copies of the IKEA catalogue
in 32 languages, using 37 paper and print suppliers. For their suppliers, IKEA re-
quested them to conduct a self-assessment of their compliance against IWAY and the
industry-specific requirements for pulp, paper, print and digital. Through these infor-
mation IKEA can select the best performed suppliers. Their collection about the en-
vironmental data was verified by third party auditors.

50
Figure 16 Data for IKEA's environmental performance of IKEA catalogues
The significant increase of the carbon emission from the catalogues production is due
to their improved data collection methodology. Still, they are working on reducing
their carbon emissions, their total energy use, their total water use and working on
improving their sustainable printing.

51
5 Discussion/Analyzation
5.1 Overview of IKEA’s sustainability strategy result each year
5.1.1 Supplier section
For this part the sustainability annual report of IKEA was analyzed from the year
2010 till 2018. For each year there were different categories with a summary of the
environmental data. The reason why for the supplier part only years from 2010 till
2014 are shown is due to the lack of data in the reports of the following years.
In those tables, categories of the suppliers’ section were selected, summarized and
analyzed. One of the supplier sections was divided into the global, national and local
food section. Since they started to focus on the national and local food in 2012 there
are no data available in the first two years 2010 and 2011. According to the report in
2010 their goal was to achieve 100% global and 100% national food suppliers by the
year 2015. With the global food supply, they already achieved their goal the next year
in 2012. However, for the national and local food section they did not achieve it by
far since 30% is widely under the goal they set for their company.
The FSC chain was published in 2013 under “Audits of our wood supply chain” which
summarizes the share of total wood volume from suppliers audited during the year as
part of the FSC chain of custody audit or IKEA audit. Under those share of total wood
there are categories like “Share of IKEA suppliers that are FSC Chain of Custody
certified”, “Share of total wood volume from FSC Chain of Custody certified suppli-
ers”, “Number of IKEA audits – under IWAY Forest Standard and IKEA wood
Figure 17 Supplier for food, catalogue and FSC chain – created by authors from Excel
52
supply chain audits with number performed form 3rd party auditors”, “Share of total
wood volume from suppliers which underwent an IKEA audit during the years” and
“Wood volumes that underwent an IKEA audit that comply with IKEA minimum
forestry requirements”. In the reports IKEA claimed that nine suppliers were not able
to provide full documentation on the source of their wood, which meant they could
not be sure that the wood they were supplying was from legal sources. Therefore, they
stopped working with those suppliers until they were able to meet their standards of
traceability. How the calculation of the “Share of total wood volume from suppliers
audited during the year” is not mentioned.
For the catalogue part they had different requirements, firstly to fulfill the ISO 14001
standards of paper. Only if all of their suppliers provided paper that fulfilled the stand-
ard of the ISO 14001, they were able to write 100% fulfillment. However as can be
seen in the table, in the year 2011 they already seemed to achieve their goal to have
100% but the next year 2012, it decreased again to 94%. According to IKEA it is due
to their change of measurement and since they had other numbers in 2012 but already
published the percentages in the previous years, they couldn’t change it anymore and
worked with the wrong numbers in the following years. However, they whether ex-
plained how they measured it the years before nor how they changed their measure-
ment to make it more accurate and realistic in the reports 2010 till 2013. Another
requirements IKEA measured was the “Share of catalogue paper and print suppliers
that are approved according to the IKEA Catalogue Sustainability Requirements”.
They mentioned in the IKEA catalogue suppliers’ part on page 85 in the report 2014
that they have twice a year a self-assessment of their compliance against IWAY and
the industry-specific requirements for pulp, paper, print and digital. This method was
applied in 2014 but they carried out 20 IWAY audits in co-operation with IKEA In-
direct Material and Services which means that the data in 2014 is more accurate than
in 2013. That is also the reason why the numbers in 2014 and 2013 are decreasing
from 82%% to 55%. As can be seen the self-assessment tests were resulted in higher
numbers which meant that the supplier thought that they were providing more sus-
tainable products. However, through in corporation with IWAY audits and the Indi-
rect Material and Services the numbers decreased significantly. Another proof, that

53
the measurement of the outcome plays a significant role in the data analysis of com-
panies.
Figure 18 Supplier for IWAY certificates and different forms of transports – created by authors from Excel
With the Supplier IWAY section IKEA tried to have IWAY-approved home furnish-
ing suppliers from all regions. In the report of 2012, they have published different
numbers than the one showed above. The reason is that they excluded back then 117
new suppliers that have to be still approved in one year. The goal of 2010 to reach
100% of IWAY approved home furnishing suppliers was almost fulfilled with 96%
and was even closer in the following years 2013 and 2014.
For the transport section the goal to achieve 100% IWAY approval for the suppliers
of land transport and ocean transport. They achieved their goal by stopping to work
with 8% of their suppliers, who didn’t meet the IWAY requirements. The hardest part
was to ensuring transport suppliers use modern, fuel-efficient trucks with low emis-
sions. Since their target for the customer delivery was till the year 2012, 75% they
also not only achieved their goal but exceeded their targets by 16%. Nonetheless, even
though IKEA is presenting their goals in a nice way and show readers that they faced
the challenge to convince their suppliers to use low emission trucks, there is whether
evidence that those supplier did nor did IKEA mention most of their reports their
methods to verify their suppliers to meet their IWAY requirements. Reducing CO2
emissions would mean that they would need some kind of accurate measurement.
However, there are many different ways to measure it. When it comes to comparing
the data and, in the end, presenting a diagram with a tendency on increasing or de-
creasing emissions, it is important to have the right weight to do so. The results could
be “green” polished if those weights are not included or fairly distributed at all. Ex-
ample given, changes in the efficiency of printer in comparison to the whole change

54
of their transport system. As an example, electricity cars would make a huge differ-
ence since changes from gas car to electricity car would weight a lot more than a small
change in the company itself. How much this weighting should be is also a very frag-
ile topic. As can been seen with the example of the “Catalogue - IWAY” the outcome
of the self – assessment and the result of an examination by a third party can vary a
lot. Therefore, they must ensure somehow, that third neutral party is able to monitor
the whole process and also to decide on a realistic process where the results are reli-
able.
5.1.2 Production section
When it comes to the production part IKEA focuses on the areas wood, cotton, waste,
renewable energy and sustainable products in general. This production section is hav-
ing results in 2015 till 2018 whereas there were no years in the supplier part. The
reason is that in 2015 IKEA only published a sustainability annual report from the
UK & Ireland. Therefore, it is not sure if the numbers are representing whole IKEA
and their improvements and also if those numbers are connected to the numbers that
were published before. For the years 2016 and 2017 there were also a change in their
reports. Instead of giving the overview of the most important numbers to see the
Figure 19 Production of materials and waste recycling – created by authors from Excel

55
results of the different performances, there were rarely boxes with important infor-
mation about the actual sustainability performance of the company IKEA in those
different fields.
For certificated wood in the forestry section IKEA had the goal to reach 35% in 2012.
However, as can be seen above this goal is never met in 2012 since they just reached
23,5%.
For the sustainable cotton IKEA had the goal in 2010 to reach 100% in 2015. As can
been seen in 2014 this goal is still far away with 76%. As their strategy IKEA claims
to reduce the need for cotton and substitute it with a blend of cotton and linen. Alter-
native materials also play an important role. In the coming years IKEA also wants to
use Lyocell textile products to increase sustainability and decrease the use of cottons.
For the waste recycling part IKEA distributed it into four sections: “Distribution”,
“Swedwook”, “Swedspan” and “Stores”. Their goal for 2015 is to reach 100% in
every category which means a 100% total waste reduction. Their strategy is to mini-
mize the amount of waste generated in the manufacturing process and also in-home
furnishing products. In 2012 reports claim to exclude waste wood used for energy
recovery or reused. Additionally, numbers were restarted from previously reported
data to exclude waste wood according to IKEA. As an example, for their innovative
employees, the products “Lusy Blom cushion” is made out of their leftovers which
can still be qualified as save and healthy. With that it can be assured that a lot of waste
was reduced by those methods. Another example is the “Buy & Sell” website for used
IKEA products to prolong their life which is free of charge for IKEA FAMILY mem-
ber. It sounds like a pretty good deal and a good intention. However, it should not be
forgotten that they are having a big advantage through this website since IKEA prod-
ucts are sold again and especially only IKEA FAMILY members can get a free access
to it. However, even though the presentation of their strategies in the waste reduction
part seems very promising, the results are showing that their goal was never met.
Moreover, the percentage from the UK and Ireland might not serve as an accurate
indicator of their performance in the waste section, but it still can be assumed that the
real number was also around 89% Which is 10% under their actual promises in 2010.

56
The renewable energy that was purchased increased over the years. Those renewable
energy levels are concerning the building of IKEA and the total consumption of the
renewable energy of stores, distribution, Swedwood and Swedspan parts in the com-
pany. Their strategy to increase the energy efficiency of IKEA buildings are caused
by Swedwood. IKEA claims that even though their energy efficiency is increasing,
the energy consumption is not increasing as much as the productivity, while their
distribution centers reduced their energy consumption faster than their productivity
decreased. In other words, it is a big compliment to the company to be that efficient
with energy and at the same time reaches a bigger amount to include renewable en-
ergy. However, firstly there are no numbers proofing that they are saving energy at
all nor are there evidences that their energy consumption is really “green”. There are
no documents concerning their energy measurements nor are there further in detail
information in their sustainability annual report 2010. Furthermore, their goal to hav-
ing 100% renewable energy is far from achieved since the data are showing that they
reached 59% in 2014. Here it can also be seen, that in the years 2015 and 2016 are no
data at all. This is due to the UK and Ireland sustainability annual report that do not
have numbers nor accurate data in forms of performance indicators anymore. The
only number that was mentioned beside the 89% of recycled waste in the report of
2015, was that in those percentages 10,14% was actually waste to energy recovered
Figure 20 Renewable energy purchased, produced and sustainable products– created by authors from Excel

57
and 0,54% was sent to landfill. Again, there is no more detailed description on how
they measured that and additional information like place, time etc. are missing too.
The energy part is divided into two sections. The first section was already described
above. The second section is concerning the energy production. Since IKEA started
in 2012 there are no data in 2010 nor in 2011. For the renewable energy part that
IKEA is producing by itself they are not reaching their goal to have 100% in 2015 at
all. Beside the fact, that there are no available data in 2015, 2016 and 2018 again, the
number of 2017 is also showing 73% which is widely under the goal to achieve 100%.
For the sustainable products, IKEA mentioned their goal for IKEA home furnishing
products classified as more sustainable should be 90% by 2015. Renewable, recycla-
ble and recycled materials should increase to 100% by 2015. In 2010 they set those
goals and had no data in this year. However, as can be seen above IKEA just men-
tioned in 2011 that their sustainable products increased to 2% which is a very slow
development. Probably because of this IKEA stopped mention it in the following
years so that no numbers about that section could be found in any further sustainabil-
ity annual report.
Since IKEA mentioned that some changes of their numbers are caused by a change
in their measurement, the authors tried to contact the apartment for sustainability re-
ports. In the sustainability annual report 2012 they mentioned on their last page, that
any questions about their reports are welcome and should be addressed to the Email:
“[email protected]”. However, after an Email was sent on the 10.
05.2019 with the question if it would be possible to get more information about their
detailed measurement, no answer came. In the sustainability annual report 2017 which
was first published on the webpage “INGKA GROUP” and needed to be find with
extra effort, the authors couldn’t see a full documentation about the numbers that were
mentioned years before. On the last pages they included “about our reporting” which
was a new section in the sustainability annual reports. There, they described their
scope and data. Beside explaining that they cooperated with an externally party to
measure their energy and carbon footprint, they also admitted, that their data might
be affected by uncertainties in scientific knowledge or in the contextual data used in
calculations since there used emission factors from publicly available sources like
DEFRA and IEA. Beside that the reports especially in 2017 and 2018 published by

58
INGKA Group have a significantly bigger focus on presenting their best sides. Eve-
rything that they reached is summarized in beautiful pictures in the first pages with
big numbers of environmental efficiency improvements and pictures. That their sus-
tainability production for example were not reached was just eliminated and ignored.
The only thing that could be find was the actual numbers of sustainable products they
produced. However, without knowing how many products they are producing in total
every number can seem big but just make a couple of percentages in relative meas-
urement. That means that those thousands of products might seem big if they are put
like this but in comparison to millions of products that were produced over the years
don’t seem having such a big impact. Another thing is that IKEA is mentioning their
strategies like raising awareness through events or organize meetings to exchange
sustainability knowledge around the earth sounds very impressive. However, a closer
look will reveal that in sum those little events are not as effective as if they would
work on a bigger project where they are changing their whole energy production pro-
cesses or use 100% sustainable materials and taking care of a more sustainable trans-
portation system. Last but not least, IKEA is mentioning multiple times that they are
cooperating with several NGO companies like FSC, WWF, UNICEF, Save the Chil-
dren etc. This do not only raise their reputation but also strengthen the organizations
in a good way. In that case if IKEA is really contributing in those different areas, the
effect might be highly positive in the end for the whole economy and environmental
cycle. Hence, this point could be one that other companies might look up to. As
showed in the theory before, the sustainable development goal 12 – “Ensure sustain-
able consumption and production patterns” were definitely targeted by IKEA. In their
goal they include “reduce global food waste, pollution to reduce adverse impacts on
human health and the environment and adopt sustainable practices and integrating
sustainable information into their reporting system.” The sustainability annual report
2017 mention their contribution to the sustainable development goals and write that
they “support the United Nations Sustainable Development Goals in their ambition to
achieve a better world for all. As a global business, we have a role to play in contrib-
uting to achieving the SDG’s.”

59
5.2 Diagrams
5.2.1 Supplier
In this section the improvements of the different areas of production and supplier are
shown in a graph to see the improvements of the single variables over the years.
In figure 22 it can be seen that the development of global food was very successful,
and IKEA also met their goal in 2011 already. However, with the national and local
food section they still got some troubles since they are far away from their end goal.
0%
20%
40%
60%
80%
100%
2010 2011 2012 2013 2014
Supplier - Transportation
Land Transport Ocean Transport Customer Delievery
0%10%20%30%40%50%60%70%80%90%
100%
2010 2011 2012 2013 2014
Supplier - Food
Global Food National and Local Food
Figure 21 Environmental improvements over the years of 2010 and 2014 of supplier food
Figure 22 Environmental improvements over the years of 2010 and 2014 of supplier transportation

60
In the figure 23 different suppliers from the transportation section is shown. In 2014
all of them met their goal to reach 100%. However, as can be seen in the customer
delivery section, which is represented by the green line, it needed an exponential
growth to reach the 90% in 2012. That means in the year 2010 and 2011 this company
needed extreme steps to reach their goals. However, those steps were not mentioned
in their reports in detail.
Figure 23 Environmental improvements over the years of 2010 and 2014 of supplier IWAY & FSC
The Supplier section with IWAY certificated products and the FSC chain which is
provided to ensure the suppliers are meeting different requirements when it comes to
buying the material wood. As can be seen in this section in the year 2010 only 50 –
60% of the suppliers met the requirements of IKEA. However, from 2011 till 2012
there is a huge development and increasing suddenly. It is not clear if almost 40% of
the suppliers of IKEA really fulfilled their IWAY requirements in one year that quick
or if it is kind of “green washing” on the side of IKEA. Furthermore, there are just
minor improvements from 2012 onwards. For the FSC chain IKEA tend to have a
more consistent growth rate. The year 2010 and 2012 are showing a similar develop-
ment and the environment aspects is increasing in those year significantly. However,
from the year 2013 it is decreasing by around 10% again which can be due to their
measurement changes.
0%10%20%30%40%50%60%70%80%90%
100%
2010 2011 2012 2013 2014
Supplier - IWAY & FSC
Supplier IWAY FSC chain

61
For the catalogue section they
In figure 25 the suppliers that provide the materials for the printing catalogue are
listed above. First, there is the ISO 14001 standard that need to be passed by the sup-
plier. As can be seen in the year 2010 they immediately reached 100% and fulfilled
their goal by that. However, there is a drop in the year 2011 by more than 10%. IKEA
explained the reason with their measurement again. They had new numbers that
causes the reason why they were starting by 94% in 2012 again. However, since they
couldn’t change the numbers before, they just continued with the right ones. As can
be seen they still achieved their goal by 2014 already with 100% suppliers that met
the requirements of ISO 14001. However, for the supplier that should meet IWAY
there is a significant drop. IKEA excused by saying that first they had self-assessment
which led to better results. After a couple of years, they decided to include a third
party to examine their suppliers and the results dropped by more than 30% in the year
from 2013 to 2014. That raises the question why they didn’t include a third party
before. Furthermore, how can the IKEA IWAY minimum requirements not be ful-
filled by half of their supplier if that is the basis for IKEA to choose their suppliers.
Those questions could only be answered by a deeper further research and with more
accurate data that IKEA used and also their measurement strategies.
50%55%60%65%70%75%80%85%90%95%
100%
2010 2011 2012 2013 2014
Supplier - Catalogue
Catalogue - ISO 14001 Catalogue - IWAY
Figure 24 Environmental improvements over the years of 2010 and 2014 of supplier catalogue

62
5.2.2 Production
For the “Environment” part the production of different materials but also acquisition
of energy and their waste recycling development are shown in the following three
diagrams. Since in 2015 and 2016 there is a huge amount of lack in the IKEA sus-
tainability annual report, those diagrams could not be finished completely. Nonethe-
less, the tendencies and the directions can both still be seen.
Figure 25 Environmental improvements over the years of 2010 and 2014 of production material
In the first figure 26 the materials wood, cotton and other sustainable products are
shown. Starting with wood, which is represented by the yellow line, there is con-
sistency over two years from 2010 till 2012 before it actually increases. Even though
the direction of the environmental improvement is increasing from the year 2012 there
is still a big space above them since they only reached 40% in 2014. For the next
material cotton, there is a bigger improvement that can be seen in 2012. With almost
40% increased development it made a huge difference. The sustainable products had
the smallest change from all factors that has been analyzed so far. It did not only
increase by 2% from the year 2010 till 2011 but the recordings of those products also
stopped in the following year completely. The only reports that mentioned those
0%10%20%30%40%50%60%70%80%90%
100%
2010 2011 2012 2013 2014
Production - Material
Certified wood Sustainable Cotton Sustainable Products

63
sustainable products were with numbers instead of percentages. However, without
percentages the development or improvement cannot be seen by the reader anymore.
Figure 26 Environmental improvements over the years of 2010 and 2017 of production energy
For the figure 27 there are two different ways that IKEA take their renewable energy.
The first method of IKEA is to purchase renewable energy from outside. That means
they are buying external “green” energy to run the IKEA stores and produce their
products. However, as can be seen the improvements over the years were kind of
slow. From the year 2010 till 2014 they improved their renewable energy consump-
tion by around 10%. Since they are also working on their energy efficiency one could
argue that they are making more improvements than it can be presented in this graph
above. That could be the case if this company would document their exact numbers
correctly over time and writing about their measurements and also from which com-
panies, they are actually purchasing their “green energy”. Without that it can only be
assumed that in reality they couldn’t increase their renewable energy part as they try
to present. Since they started producing their own energy in 2012 there are no num-
bers from 2010 till 2012. However, both documentations ended in 2014 when no ex-
act numbers could be found in the further sustainability annual reports. In 2017 they
mentioned renewable energy, but it was not sure how they reached it and what they
did.
0%10%20%30%40%50%60%70%80%90%
100%
2010 2011 2012 2013 2014 2015 2016 2017
Production - Energy
Renewable Energy purchased Renewable Energy produced

64
Figure 27 Environmental improvements over the years of 2010 and 2018 of production waste recycling
For the last part figure 28 is showing their waste recycling processes over the years.
It needs to be mentioned that they were also changing their measurement in this area
but without saying how. Therefore, there is probably this decrease between the years
2015 and 2017. The improvements of their recycling part are almost not given. Con-
trariwise, it even shows that they were not doing good in this area at all. For the waste
recycling part IKEA mentioned different strategies that they presented with pictures
and beautiful graphics. Beneath reducing their waste in the food production manufac-
turing area, they also mentioned that they are using leftover products to create new
product lines that are “100%” sustainable. However, even though those methods seem
very promising and put IKEA into a good light their results are not in line with what
they are promising. As with many companies, IKEA is focusing on not only gaining
the trust of their customer and the public but also to ensure to earn enough profits.
The balance between those aspects are not easy to keep.
0%
10%
20%
30%
40%
50%
60%
70%
80%
90%
100%
2010 2011 2012 2013 2014 2015 2016 2017 2018
Production - Waste recycling

65
6 Conclusion
For most of the research the goal is to get closer to the truth. However, this world is
built by a complexity that is very hard to understand. Getting to the truth is a very
exhausting and difficult task sometimes, hence different measurements, methods and
theories are trying to support finding the core of a phenomenon or a problem. Since
the world is not black or white everything can be seen from a different angle, a dif-
ferent perspective. Depending on who is observing and what background this person
is having the results can varying from person to person, especially when it comes to
social sciences.
This work is trying to provide another perspective of how to look at annual reports
that companies are presenting to their customer and stakeholder. Furthermore, it tries
to reveal how they are presenting their sustainability strategies to clear out that some
pages could have a slightly manipulating background with the goal to not only present
the absolute best side of the company IKEA but also to convince the reader that they
are doing great and people should buy their products. With their sustainability annual
reports that they started more than 10 years ago, they want to contribute to the sus-
tainable development goals till 2030 (SDG’s). Beside this intention they are also
thinking like a company and want to reach as many customers as they can. With sus-
tainability they discovered that not only their reputation is improved but they are also
willing to change due to the fact that they are able to reduce their costs in some ways
as they explained the reason for increase energy efficiency and decrease unnecessary
materials and general waste of resources.
To answer the research question: “In what areas of the supply chain management do
IKEA focusing their sustainability strategies and how are they presenting them in
their sustainability annual reports” and “What kind of measurement do they use to
show their results”, it must be said that some of the analysis brought out interesting
facts. Firstly, IKEA is focusing on two different area of the supply chain management.
The part “production” includes materials like sustainable cotton, certificated wood,
waste recycling and energy usage. The second part is the supplier area with a focus
on transportation systems like ocean transport, land transport and customer delivery

66
systems and provider of the catalogue materials to print the IKEA catalogues. These
areas were documented every year in form of percentages and showed in graphics.
However, after asking for more information about their measurement no answer came
in a couple of weeks back from the department of sustainability report of IKEA.
Therefore, it cannot be said with certainty if IKEA is improving their sustainability
and environmental processes in their company over the year in such a great way like
they are presenting. In this case two major parts are missing. First, a well-documented
measurement method of IKEA for every area they are talking about and secondly, a
weighting system where the reader and the stakeholder can see how they choose to
weight their strategies and their application. Without that additional information, it is
very easy for the company to “green wash” their reports and present their company
in a very positive way even though the reality looks different. Furthermore, a lack in
their publishing sustainability annual report makes them more suspicious, since those
numbers are missing when it comes to comparing if they kept their promises. Without
a consistency it is hard to compare in a proper and right way. Moreover, looking
through their reports from 2010 till 2017 it can be noticed that more and more im-
portant numbers are missing, and IKEA is filling their reports with advertisement that
is representing their good side and strengthen their image. In the authors opinion it is
understandable that companies need to take care of their reputation and could struggle
to fulfill their goals they set when they are actually too hard to realize. However, it is
the responsibility of every human being to be accountable for their decisions and ac-
tions and have a basic set of moral that they should follow. Companies are still gov-
erned by people; therefore, it should be a matter of course to protect the environment
and nature by supporting sustainable resource acquisition and protecting employees
and customer from dangerous chemicals to ensure their health. With the sustainability
annual reports companies could “green polish” their actions. However, it is at the
same time also a great opportunity to really proof their contribution to the society and
the environment and be a role model for other companies. Gaining the trust of cus-
tomer and stakeholder can be done by well-documented results and true facts even
though they might not always show what IKEA, or their customer might want to see
or expect. Last but not least it can be said, that further researches could be done in the
future to have a more in-depth insight into the “green wash” possibility of IKEA’s
sustainability annual reports.

67
7 Literature/Reference
Alänge, S., Clancy, G., & Marmgren, M. (2016). Naturalizing sustainability in prod-
uct development: A comparative analysis of IKEA and SCA. Journal of Cleaner Pro-
duction, 135, 1009-1022.
Baker, P. (2004). Aligning distribution center operations to supply chain strategy. The
International Journal of Logistics Management, 15(1), 111-123.
Ballou, R. H. (1976). Improved stock location in the physical distribution channel.
In Business Logistics (pp. 190-199). Springer, Boston, MA.
Bastas A., Liyanage K., 2018. Sustainable supply chain quality management: A sys-
tematic review, Journal of Cleaner Production
Benoît-Norris, C., Vickery-Niederman, G., Valdivia, S., Franze, J., Traverso, M.,
Ciroth, A., & Mazijn, B. (2011). Introducing the UNEP/SETAC methodological
sheets for subcategories of social LCA. The international journal of life cycle assess-
ment, 16(7), 682-690.
Booth, R. (1996). Agile manufacturing. Engineering Management Journal, 6(2), 105-
112.
Boston, J., & Lempp, F. (2011). Climate change: explaining and solving the mismatch
between scientific urgency and political inertia. Accounting, Auditing & Accounta-
bility Journal, 24(8), 1000-1021.
Bowen, F., & Wittneben, B. (2011). Carbon accounting: negotiating accuracy, con-
sistency and certainty across organisational fields. Accounting, Auditing & Account-
ability Journal, 24(8), 1022-1036.
Brodie, R. J., Hollebeek, L. D., Jurić, B., & Ilić, A. (2011). Customer engagement:
Conceptual domain, fundamental propositions, and implications for research. Journal
of service research, 14(3), 252-271.
Butler, R. A., & Laurance, W. F. (2009). Is oil palm the next emerging threat to the
Amazon? Tropical Conservation Science, 2(1), 1-10.

68
Çakmak Z., Akgün I. H., 2017. A Theoretical Perspective on the Case Study Method,
Journal of Education and Learning, Vol. 7, No. 1
Calic, G., & Mosakowski, E. (2016). Kicking off social entrepreneurship: How a sus-
tainability orientation influences crowdfunding success. Journal of Management
Studies, 53(5), 738-767.
Carter, C. R., & Liane Easton, P. (2011). Sustainable supply chain management: evo-
lution and future directions. International journal of physical distribution & logistics
management, 41(1), 46-62.
Carter, C. R., & Rogers, D. S. (2008). A framework of sustainable supply chain man-
agement: moving toward new theory. International journal of physical distribution &
logistics management, 38(5), 360-387.
Chen, Y. S. (2008). The driver of green innovation and green image–green core com-
petence. Journal of business ethics, 81(3), 531-543.
Chiputwa, B., Spielman, D. J., & Qaim, M. (2015). Food standards, certification, and
poverty among coffee farmers in Uganda. World Development, 66, 400-412.
Christopher, M., & Towill, D. R. (2002). Developing market specific supply chain
strategies. The international journal of logistics management, 13(1), 1-14.
City of Austin, 2008. Zero Waste Strategic Plan. City of Austin, Austin, TX.
Colgan, J. D. (2009). The international energy agency. Challenges for the 21st Cen-
tury. GPPi Energy Policy Paper, 6.
Craig R. C., Dale S. R., 2008. A framework of sustainable supply chain management:
moving toward new theory, International Journal of Physical Distribution & Logistics
management, Vol. 38 No 5, pp. 360-387
Department for Environment, F. R. A. (2009). Guidance on How to Measure and Re-
port Your Greenhouse Gas Emissions.
D'SILVA, J. (2006). Adverse impact of industrial animal agriculture on the health and
welfare of farmed animals. Integrative Zoology, 1(1), 53-58.

69
Elkington, J. (1998). Cannibals with forks: The triple bottom line of 21st century
business. Gabriola Island. British Columbia: New Society Publishers.
Fitzherbert, E. B., Struebig, M. J., Morel, A., Danielsen, F., Brühl, C. A., Donald, P.
F., & Phalan, B. (2008). How will oil palm expansion affect biodiversity? Trends in
ecology & evolution, 23(10), 538-545.
Fleischmann, B. (2016). The impact of the number of parallel warehouses on total
inventory. OR spectrum, 38(4), 899-920.
Florini, A., & Sovacool, B. K. (2009). Who governs energy? The challenges facing
global energy governance. Energy Policy, 37(12), 5239-5248.
Gadde, L. E., Håkansson, H., & Persson, G. (2010). Supply network strategies. John
Wiley & Sons.
Gibbs, H. K., Johnston, M., Foley, J. A., Holloway, T., Monfreda, C., Ramankutty,
N., & Zaks, D. (2008). Carbon payback times for crop-based biofuel expansion in the
tropics: the effects of changing yield and technology. Environmental research let-
ters, 3(3), 034001.
Goldemberg, J. (2007). Ethanol for a sustainable energy future. science, 315(5813),
808-810.
Golicic, S. L., & Smith, C. D. (2013). A meta‐analysis of environmentally sustainable
supply chain management practices and firm performance. Journal of supply chain
management, 49(2), 78-95.
Gómez-Luciano C., Domínguez F. R. R., Gonzáles-Andrés F., Lópes De Menses B.,
U., 2018. Sustainable supply chain management: Contributions of supplies markets,
Journal of Cleaner Production
Gong M., Gao Y., Koh L., Sutcliffe C., Cullen J., 2019. The role of customer aware-
ness in promoting firm sustainability and sustainable supply chain management, Jour-
nal of Production Economics

70
González‐Benito, J., & González‐Benito, O. (2005). An analysis of the relationship
between environmental motivations and ISO14001 certification. British Journal of
Management, 16(2), 133-148.
Green, J. F. (2010). Private standards in the climate regime: the greenhouse gas pro-
tocol. Business and Politics, 12(3), 1-37.
Greyson, J. (2007). An economic instrument for zero waste, economic growth and
sustainability. Journal of Cleaner Production, 15(13-14), 1382-1390.
Hahn, C. K., Watts, C. A., & Kim, K. Y. (1990). The supplier development program:
a conceptual model. Journal of Purchasing and Materials Management, 26(2), 2-7.
Hartmann, J., & Moeller, S. (2014). Chain liability in multitier supply chains? Re-
sponsibility attributions for unsustainable supplier behavior. Journal of operations
management, 32(5), 281-294.
Hollebeek, L. D. (2011). Demystifying customer brand engagement: Exploring the
loyalty nexus. Journal of marketing management, 27(7-8), 785-807.
Hoyer, W. D., Chandy, R., Dorotic, M., Krafft, M., & Singh, S. S. (2010). Consumer
cocreation in new product development. Journal of service research, 13(3), 283-296.
ISO (2002): Environmental Management. The ISO14000 Family of International
Standards, International Organization for Standarization, Ginebra.
Khalili Shavarini, S., Salimian, H., Nazemi, J., & Alborzi, M. (2013). Operations
strategy and business strategy alignment model (case of Iranian industries). Interna-
tional Journal of Operations & Production Management, 33(9), 1108-1130.
Klaas-Wissing, T. (2007). Logistics configurations and supply chain design.
Klassen, R. D., & Vereecke, A. (2012). Social issues in supply chains: Capabilities
link responsibility, risk (opportunity), and performance. International Journal of Pro-
duction Economics, 140(1), 103-115.
Kleindorfer PR, Singhal K, Van Wassenhove LN. Sustainable operations manage-
ment. Production and operations management. 2005 Dec;14(4):482-92.

71
Koberg E., Longoni A., 2018. A systematic review of sustainable supply chain man-
agement in global supply chains, Journal of Cleaner Production
Koh, L. P., & Wilcove, D. S. (2009). Oil palm: disinformation enables deforesta-
tion. Trends in Ecology & Evolution, 24(2), 67-68.
Kolk, A. (2013). Mainstreaming sustainable coffee. Sustainable Development, 21(5),
324-337.
Krause, D. R., Scannell, T. V., & Calantone, R. J. (2000). A structural analysis of the
effectiveness of buying firms' strategies to improve supplier performance. Decision
sciences, 31(1), 33-55.
Kuhn, H., & Sternbeck, M. G. (2013). Integrative retail logistics: an exploratory
study. Operations Management Research, 6(1-2), 2-18.
Kumar, V., & Pansari, A. (2016). Competitive advantage through engagement. Jour-
nal of Marketing Research, 53(4), 497-514.
Kumar, V., Aksoy, L., Donkers, B., Venkatesan, R., Wiesel, T., & Tillmanns, S.
(2010). Undervalued or overvalued customers: capturing total customer engagement
value. Journal of service research, 13(3), 297-310.
Langley, G., & D'Silva, J. (1998). Animal Organs in Humans: Uncalculated Risks &
Unanswered Questions. British Union for the Abolition of Vivisection and Compas-
sion in World Farming.
Laurance, W. F., Koh, L. P., Butler, R., Sodhi, N. S., Bradshaw, C. J., Neidel, J. D.,
... & Mateo-Vega, J. (2010). Improving the performance of the roundtable on sustain-
able palm oil for nature conservation.
Laurin, F., & Fantazy, K. (2017). Sustainable supply chain management: a case study
at IKEA. Transnational Corporations Review, 9(4), 309-318.
Leenders, M. R. (1966). Supplier development. Journal of Purchasing, 2(4), 47-62.
Lewis, J. K. (2016). Corporate Social Responsibility/Sustainability Reporting Among
the Fortune Global 250: Greenwashing or Green Supply Chain?. In Entrepreneurship,
Business and Economics-Vol. 1 (pp. 347-362). Springer, Cham.

72
Lin, H. C., & Kalwani, M. U. (2018). Culturally contingent electronic word-of-mouth
signaling and screening: a comparative study of product reviews in the United States
and Japan. Journal of International Marketing, 26(2), 80-102.
Linton, J. D., Klassen, R., & Jayaraman, V. (2007). Sustainable supply chains: An
introduction. Journal of operations management, 25(6), 1075-1082.
Ljungberg, L. Y. (2007). Materials selection and design for development of sustaina-
ble products. Materials & Design, 28(2), 466-479.
Lovell, A., Saw, R., & Stimson, J. (2005). Product value-density: managing diversity
through supply chain segmentation. The International Journal of Logistics Manage-
ment, 16(1), 142-158.
Lu D. W., 2011. Fundamentals of Supply Chain Management, Dr. Dawei Lu & Ven-
tus Publishing ApS
Lund, H. (2007). Renewable energy strategies for sustainable development. En-
ergy, 32(6), 912-919.
Mariadoss B. J., Chi T., Tansuhaj P., Pomirleanu N., 2016. Influences of Firm Orien-
tations on Sustainable Supply Chain Management, Journal of Business Research
Maxwell, D., & Van der Vorst, R. (2003). Developing sustainable products and ser-
vices. Journal of Cleaner Production, 11(8), 883-895.
Meadows D. H., Meadows D. L., Randers J., Behrens III W. W., 1972. The limits to
growth. New York: Universe Books
Müller, C., Vermeulen, W. J., & Glasbergen, P. (2009). Perceptions on the demand
side and realities on the supply side: A study of the South African table grape export
industry. Sustainable Development, 17(5), 295-310.
Myrdal, G. (1968). Twenty years of the United Nations economic commission for
Europe. International Organization, 22(3), 617-628.
Nagati, H., & Rebolledo, C. (2013). Supplier development efforts: The suppliers'
point of view. Industrial Marketing Management, 42(2), 180-188.

73
Nidumolu, R., Prahalad, C. K., & Rangaswami, M. R. (2009). Why Sustainability Is
Now the Key Driver of Innovation.
Oelze N., Brandenburg M., Jansen C., Warasthe R., 2018. Applying Sustainable Sup-
ply Chain Management Framework to Two German Case Studies, IFAC Paper-
sOnLine
Olga C., 2012. Sustainable supply chain management: Theoretical literature over-
view, International Institute for Industrial Environmental Economics, Lund Univer-
sity
Pansari, A., & Kumar, V. (2017). Customer engagement: the construct, antecedents,
and consequences. Journal of the Academy of Marketing Science, 45(3), 294-311.
Papacharissi, Z., & Rubin, A. M. (2000). Predictors of Internet use. Journal of broad-
casting & electronic media, 44(2), 175-196.
Paul, W. T., Semeijn, J., & Ernstson, S. (2010). Supplier satisfaction and commit-
ment: The role of influence strategies and supplier development. Journal of purchas-
ing and supply management, 16(1), 17-26.
Porter M, van der Linde C. SeptembereOctober 1995. Green and competitive: ending
the stalemate. Harvard Business Review.;73(5):120-34.
RSPO (Roundtable on Sustainable Palm Oil). 2006. RSPO principles and criteria for
sustainable palm oil production. RSPO, Selangor, Malaysia. Available from:
www.rspo.org/resource_centre/RSPO%20Criteria%20Final%20Guid-
ance%20with%20NI%20Document.pdf (Accessed May 2019).
Scannell, T. V., Vickery, S. K., & Droge, C. L. (2000). Upstream supply chain man-
agement and competitive performance in the automotive supply industry. Journal of
Business Logistics, 21(1), 23.
Seuring, S., & Müller, M. (2008). From a literature review to a conceptual framework
for sustainable supply chain management. Journal of cleaner production, 16(15),
1699-1710.

74
Snehota, I., & Hakansson, H. (Eds.). (1995). Developing relationships in business
networks. London: Routledge.
Tauringana, V., & Chithambo, L. (2015). The effect of DEFRA guidance on green-
house gas disclosure. The British Accounting Review, 47(4), 425-444.
Tompkins, J. A., White, J. A., Bozer, Y. A., & Tanchoco, J. M. A. (2010). Facilities
planning. John Wiley & Sons.
Trapp, A. C., & Sarkis, J. (2016). Identifying Robust portfolios of suppliers: a sus-
tainability selection and development perspective. Journal of Cleaner Produc-
tion, 112, 2088-2100.
UTZ Certified (2013). Available from: https://www.utzcertified.org (Accessed May
2019).
Vachon S, Klassen RD. Environmental management and manufacturing performance:
The role of collaboration in the supply chain. International journal of production eco-
nomics. 2008 Feb 1;111(2):299-315.
Van de Graaf, T. (2012). Obsolete or resurgent? The International Energy Agency in
a changing global landscape. Energy Policy, 48, 233-241.
Van Der Woerd, F., & Van Den Brink, T. (2004). Feasibility of a responsive business
scorecard–a pilot study. Journal of business ethics, 55(2), 173-186.
Verleger, P. K. (1987). The evolution of oil as a commodity. Energy: Markets and
Regulation, 161-186.
Vidal-León, C. (2013). Corporate social responsibility, human rights, and the world
trade organization. Journal of International Economic Law, 16(4), 893-920.
Vivek, S. D., Beatty, S. E., & Morgan, R. M. (2012). Customer engagement: Explor-
ing customer relationships beyond purchase. Journal of marketing theory and prac-
tice, 20(2), 122-146.
Von Zharen, W. M. (1996). ISO 14000: Understanding the environmental standards.
Rockville, MD: Government Institutes.

75
Vonderembse, M. A., Uppal, M., Huang, S. H., & Dismukes, J. P. (2006). Designing
supply chains: Towards theory development. International Journal of production eco-
nomics, 100(2), 223-238.
Wagner, S. M. (2009). Indirect and direct supplier development: performance impli-
cations of individual and combined effects. IEEE Transactions on Engineering Man-
agement, 57(4), 536-546.
Wordsworth, A., & Grubb, M. (2003). Quantifying the UK's incentives for low car-
bon investment. Climate Policy, 3(1), 77-88.
Zaman, A. U., & Lehmann, S. (2011). Urban growth and waste management optimi-
zation towards ‘zero waste city’. City, Culture and Society, 2(4), 177-187.
Zaman, A. U., & Lehmann, S. (2013). The zero-waste index: a performance measure-
ment tool for waste management systems in a ‘zero waste city’. Journal of Cleaner
Production, 50, 123-132.
Zhang M., Tse Y. K., Doherty B., Akhtar P., 2016. Sustainable supply chain manage-
ment: Confirmation of a higher-order model, Resources, Conservation and Recycling
Zingales, F. G., O'Rourke, A., & Hockerts, K. (2002). Balanced scorecard and sus-
tainability state of the art review. INSEAD.
Reports of IKEA
IKEA Group. (2010). Sustainability Report 10 [online]. Available from:
https://www.ikea.com/ms/en_JP/this-is-ikea/reports-downloads/ [accessed 20 April
2019]
IKEA Group. (2011). Sustainability Report 11 [online]. Available from:
https://www.ikea.com/ms/en_JP/this-is-ikea/reports-downloads/ [accessed 20 April
2019]

76
IKEA Group. (2012). Sustainability Report 12 [online]. Available from:
https://www.ikea.com/ms/en_JP/this-is-ikea/reports-downloads/ [accessed 20 April
2019]
IKEA Group. (2013). Sustainability Report 13 [online]. Available from:
https://www.ikea.com/ms/en_JP/this-is-ikea/reports-downloads/ [accessed 20 April
2019]
IKEA Group. (2014). Sustainability Report 14 [online]. Available from:
https://www.ikea.com/ms/en_JP/this-is-ikea/reports-downloads/ [accessed 20 April
2019]
IKEA Group. (2015). Sustainability Report 15 [online]. UK & Ireland: Available
from: https://www.ikea.com/ms/en_JP/this-is-ikea/reports-downloads/ , [accessed 20
April 2019]
IKEA Group. (2016). Sustainability Report 16 [online] UK & Ireland: Available
from: https://www.ikea.com/ms/en_JP/this-is-ikea/reports-downloads/ [accessed 20
April 2019]
INGKA Holding B.V. and its controlled entities. (2017). Sustainability Summary Re-
port 17 [online]. Available from: https://www.ingka.com/about-us/annual-and-sus-
tainability-summary-reports/ [accessed 30 April 2019]
INGKA Holding B.V. and its controlled entities. (2018). Annual & Sustainability
Summary Report 18 [online]. Available from: https://www.ingka.com/about-us/an-
nual-and-sustainability-summary-reports/ [accessed 30 April 2019]
IKEA Supply AG. (2008). IWAY Standard. INGKA Holding B.V. IKEA. Retrieved
from http://www.ikea.com/gb/en/doc/general-document/ikea-iway-standard-
.pdf__1364450371470.pdf

77
8 Appendix
Mail to respondents:
Email: [email protected] Dear Sir or Madam, We are two students from the Linné University of Sweden, Växjö and are writing on our Master thesis for the course "Degree Project in Business Administration“. In our thesis we are focusing on your company IKEA and classify and analyse your sustainability strategies from the years 2010 till today with help of the sustainability reports provided on your webpage. For a deeper and better research, we would like to ask you for some information about your methodology of measurement that you used for your statistical evalua-tion in those reports. Since in the report of 2014 you mentioned that there was a change due to your im-provements to your data collection methodology, we would like to ask you if it is possible for you to also send us some further details on that. We would be highly interested on what measurements you used before and after-wards to gain a deeper understanding on your sustainable improvements in your company, since it would help us a lot to do our further analysis and also to improve our whole work. To fulfil our deadlines of our university, we would like to ask for a response as soon as possible. Our phone number is: +43 660 27 94 610 +46 76 809 99 66 (We are available at any time until next week) We want to thank you in advance for your time and effort. Sincerely, Lilia Yang & Nanxiang Shao