SUSTAINABILITY REPORT - corporate.evonik.com · Status of our sustainability targets for 2018 T02...
116
2018 SUSTAINABILITY REPORT Creating the future is our business
Transcript of SUSTAINABILITY REPORT - corporate.evonik.com · Status of our sustainability targets for 2018 T02...

2018
SUSTAINABILITYREPORT
Creating the future is our business
CONTENTS Strategy and growth 10 Business model 11 Fiscal 2018 12 Our philosophy 13 Our sustainability strategy 13 Organization and management 14 Creating extensive value 14 Engaging with our stakeholders 16 UN Sustainable Development Goals of relevance for Evonik 19 Extensive update of our materiality analysis 21
Governance and compliance 25 Our philosophy 26 Voluntary commitments 26 Human rights 27 Corporate governance 28 Compliance 29 Opportunities and risks 34 Donations and sponsorship 34
Employees 36 Our philosophy 37 HR organization and management 37 Leadership—clear, consistent, cooperative 37 Digitalization of working processes 38 Appeal as an employer 38 Diversity and equal opportunity 40 Vocational training and continuing professional development 42 Health protection and promotion 43 Further facts and figures 46
Value chain and products 47 Our philosophy 48 Impact valuation 49 “Upstream”: supply chain 49 “Gate to gate”: raw materials, production, and processes 54 “Downstream”: customers and end-customer applications 56 Product stewardship 57 Sustainability analysis of the business 60 Efficient use of scarce resources/circular economy 61
The environment 64 Our philosophy 65 Strategy and management 65 Climate change and emissions into the air 67 Evonik carbon footprint 69 Water management 71 Waste management 73 Biodiversity 74
Safety 77 Our philosophy 78 Occupational and plant safety 78 Transportation safety and logistics 80
Society 83 Our philosophy 84 Education and science 84 Social projects 85 Culture and the arts 86 Sport 86 Annex 87 About this report 88 GRI content index 90 Independent practitioner’s limited assurance report 109 Principal locations 111 Glossary 112 List of tables and charts 113 Ratings and indices 2018 114 Sustainability awards 2018 114 Credits 115
The chapters “Strategy and growth,” “Governance and compliance,” “Employees,” “Value chain and products,” “The environment,” and “Safety” were subject to a limited assurance review by PricewaterhouseCoopers GmbH (PwC) (indicated by ).
2

Overview of sustainability indicators T01
The following overview contains the main indicators for our six sustainability areas of action. You can find more detailed information in the relevant chapters.
2015 2016 2017 2018
Sales in € million 13,507 12,732 14,383a 15,024Adjusted EBITDA in € million 2,465 2,165 2,357a 2,601 Adjusted EBITDA margin in % 18.2 17.0 16.4 17.3 ROCE in % 16.6 14.0 11.2 12.1 Value added in € million 4,838 4,616 4,684a 5,065
Female supervisory board members in % 20 35 35 35Female executive board members in % 20 20 25 25Training rate b antitrust law in % 493 937 59 74Training rate b fighting corruption in % 1,600 828 84 83Training rate b code of conduct in % 2,823 12,025 71 77Internal investigations 27 33 27 90c
Disciplinary measures 11 17 12 106d
Commitment index e 151 – – 68Employee turnover in % 4.7 4.7 5.8 6.2Average length of service in years 15 14.9 14.6 14.7Continuing professional development per employee in hours f 13 16 12 16Female managers in % g 20.8 22.0 23.2 23.8Health ratio in % h 95.4 95.4 93.7 94.9Occupational Health Performance index i 5.3 5.5 5.4 5.5Occupational Disease Rate j 0.3 0.36 0.22 k
Procurement expenses in € billion 8.3 7.6 9.1 9.9No. of sustainability audits (TfS) 179 241 441 358No. of sustainability audits (Evonik) 35 29 28 22No. of sustainability assessments (TfS) 2,580 1,773 1,794 1,491No. of sustainability assessments (Evonik) 118 145 149 130Use of renewable raw materials in production in % 8.6 9.2 10.4 9.7R&D expenses in € million 434 438 476 l 459Proportion of resource-saving productsm in % ~ 50 ~ 50 – –External sales of chemicals segments covered by life cycle assessmentsm in % ~ 70 ~ 70 – –
Scope 1 greenhouse gas emissions in million metric tons n 5.6 5.4 5.6 5.7Scope 2 greenhouse gas emissions in million metric tons o 1.0 1.0 0.9 0.9Water consumption in million m3 p 71.3 65.7 66.5 70.2Output in million metric tons 10.36 10.58 10.98 11.03Hazardous production waste in thousand metric tons 213 227 244 240Non-hazardous production waste in thousand metric tons 153 124 153 154
Accident frequency q 0.97 1.24 1.16 0.87Incident frequency r 55 43 1.11s 1.08Outgoing shipments, hazardous goods in thousand metric tons 5,531 4,025 4,141 5,005Outgoing shipments, other goods in thousand metric tons 3,438 4,078 4,469 4,504
a Prior-year figures adjusted in some cases due to IFRS 15. | b For 2017, the training rates are given as a percentage for the first time; the prior-year data are absolute figures and are therefore not comparable. The training rate is defined as the number of training candidates with a valid certificate relative to the total number of training candidates as of December 31, 2018. | c In 2018, reporting was extended to include all internal investigations in the Evonik Group. | d In some cases, more than one measure was taken as a result of an investigation. | e The commitment index showing employee satisfaction is compiled every three years. The method used to compile this index was altered in 2018, so the figures are not comparable. The weighted benchmark based on employee distribution in the Evonik regions is 72. It comprises 411 companies worldwide and more than 2.4 million interviews. | f Since 2016 the figure excludes apprentices in Germany. | g Management circles 1 – 3. | h Refers to Germany; calculated as: (target working hours – sickness-related hours lost)/target working hours. | i Max 6.0 (index takes account of key aspects of occupational medicine, health promotion, and emergency medical management). | j Number of newly identified cases of occupational illnesses per 1 million working hours. | k The ODR for 2018 will probably be available in spring 2019 and will be published on our “ Responsibility” website. | l The costs of the Corporate Innovation unit are included from 2017; 2017 figure restated. | m Data only available for 2016. | n CO2 equivalents. | o CO2 equivalents, net (market-based). | p Includes water used to generate steam, in the manufacture of products, to cover evaporation losses, and process water. | q This indicator contains all work-related accidents (excluding traffic accidents) resulting in absences of at least one full shift, per 1 million working hours (reference base: 2008). | r Number of incidents per 1 million working hours (reference base: 2008) | s From 2017, the indicator is shown as an absolute amount defined as the number of incidents per 1 million working hours (previous years in percent).
Stra
tegy
and
gr
owth
Gov
erna
nce
and
co
mpl
ianc
eVa
lue
chai
n an
d
prod
ucts
Empl
oyee
sTh
e en
viro
nmen
tSa
fety
3

Status of our sustainability targets for 2018 T02
This is an overview of the targets we set for 2018. Except where otherwise stated, the data refer to 2018.
Target achieved Target partially achieved or target horizon extends beyond 2018 Target not achievedTarget attainment Page
Strategy and growthValidate the materiality analysis 24Identify the SDGs of relevance for Evonik and their contribution to the business 24
Governance and complianceProportion of female executive board members: 25 percent up to June 30, 2022 35Women at the first two management levels below the executive board: 20 percent at each level by year-end 2019 35Implement the defined antitrust and anti-money laundering measures 35Review and revise internal regulations on gifts and hospitality 35
EmployeesMeasure and increase employee satisfaction 43Drive forward global digitalization 43Encourage greater diversity in the Evonik Group, especially by increasing the number of female managers 43Occupational Health Performance Index ≥ 5.0 45Include further sites in the calculation of the Occupational Health Performance Index (15 in three years, 2017 – 2019) 45
Value chain and products Extend monetary valuation of the impact of our business along the value chain (impact valuation) to further regions and indicators 49Conduct at least 20 supplier sustainability audits under the shared audit principle of the Together for Sustainability (TfS) initiative 53Continue the supplier analysis by reviewing at least 80 TfS assessments 53Evaluate the sustainability performance of 90 percent of suppliers of critical raw materials by 2020 53Implement the new training concept and conduct internal sustainability training for all relevant procurement employees 53Increase sales of products and applications developed in the past five years to 16 percent in the mid term 56More than €1 billion additional sales in the identified innovation growth fields by 2025 56Establish a risk estimate for >99 percent of substances placed on the market in quantities of >1 metric ton p.a. (by 2020) 60Make GPS safety summaries available via the Evonik website and the ICCA’s GPS portal 60Conduct a more far-reaching assessment of all products containing >0.1 percent hazardous chemicals of high concern (hChC)a, e.g., CMRb 1A/1B, PBT c (CMSPLUS) 60Complete the ongoing development of the sustainability analysis of our businesses 63Perform the next sustainability analysis using the extended methodology in 2019 63
The environmentReduce specific greenhouse gas emissions by 12 percent by 2020 (reference base: 2012) 76Reduce specific water intake by 10 percent by 2020 (reference base: 2012) 76Further reduce production waste, including hazardous production waste 76
SafetyAccident frequency rated should be ≤ 1.30 80Incident frequency ratee should be ≤ 1.10 80Create greater transparency and harmonize group-wide ESHQ processes. Take the first steps towards introducing a new tech-nical platform 80Establish a requirements profile for warehouse services 82Establish minimum global standards for logistics service-providers 82Evaluate European rail logistics providers using SQAS Rail f 82
a hChC = hazardous chemicals of high concern. | b CMR = carcinogenic, mutagenic, toxic for reproduction. | c PBT = persistent, bioaccumulative, toxic. | d Number of accidents at work resulting in absence from work per 1 million working hours. | e Number of incidents per 1 million working hours. | f SQAS Rail is a Cefic safety and quality evaluation system for rail transport.
4
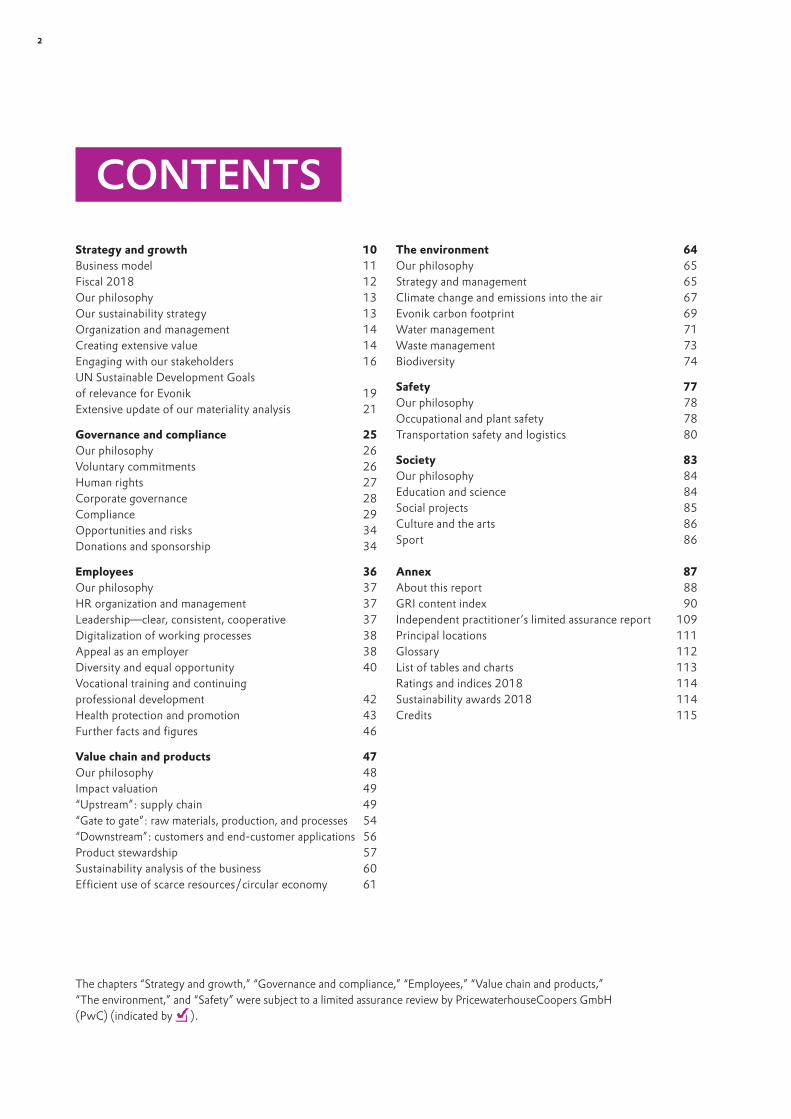
Our sustainability targets for 2019 and beyond T03
Our sustainability strategy is geared to integrating sustainability even more firmly into our operating units and establishing it in our regions. The following targets are intended to play a central part in this.
Planned deadline
Strategy and growthAnchor sustainability in strategy dialogues 2019Synchronize the publication date of financial and non-financial indicators 2019Review the SDGs of relevance for Evonik (from 2020) 2020
Governance and complianceProportion of female executive board members: 25 percent up to June 30, 2022 2019 ff.Women at the first two management levels below the executive board: 20 percent at each levela Year-end 2019Structure and implement the revised internal regulations on gifts and hospitality 2019Introduce uniform group-wide standards on monitoring business partners 2019Update the rules on internal investigations 2019
EmployeesAnalyze the results of the global employee survey 2019Ongoing development of the global development strategy 2019Discuss and implement Evonik’s new corporate values worldwide 2019Further support for diversity at Evonik 2020Occupational Health Performance Index ≥5.0 2019 ff. Include further sites in the calculation of this index (+ 15 in 2019) 2019
Value chain and productsImpact valuation: • Complete the worldwide monetary valuation of the impact of our business along the value chain 2019 • Update the data to include 2017 and 2018 2019Conduct at least 20 supplier sustainability audits p.a. under the shared audit principle of the Together for Sustainability initiative 2019 ff.Continue the analysis of suppliers by reviewing at least 80 TfS assessments 2019 ff.Evaluate the sustainability performance of 90 percent of suppliers of critical raw materials 2020Develop recommendations for action on palm oil, palm kernel oil, and their derivatives at Evonik 2019 ff.External monitoring of suppliers of renewable raw materials and in-house supplier criteria 2019 ff.More than €1 billion additional sales in the six innovation growth fields 2025Increase sales of products and applications developed in the past five years to 16 percent in the mid term b
Establish a risk estimate for >99 percent of substances placed on the market in quantities of >1 metric ton p.a. Year-end 2020Conduct a more far-reaching assessment of all products containing > 0.1 percent hazardous chemicals of high concern (hChC)c, e.g., CMRd 1A/1B, PBTe (CMSPLUS) Year-end 2020Conduct a sustainability analysis of our businesses using the extended methodology 2020
The environmentReduce absolute scope 1 and scope 2 emissions by 50 percent (reference base: 2008) 2025Introduce a global water management system, including site-specific action plans 2019 ff.Further reduce production waste 2019 ff.
SafetyAccident frequency ratef should be ≤ 1.30 2019 ff.Incident frequency rate g should be ≤ 1.10 2019 ff.
ESTER pilot phase; global rollout of ESTER, starting in the second half of the year 2019Locomotive strategy: replace two old shunters in Rheinfelden by one modern locomotive and a road/rail shunter 2019 ff.Implement the requirements profile for warehouse service-providers 2019 ff.Implement the global minimum standard for logistics service providers 2019 ff.Define details of the evaluation of European rail logistics providers using SQAS Railh 2019 ff.
a 27.3 percent for the first management level below the executive board and 20.0 percent for the second management level achieved (December 2018). | b From 12 percent in 2018 to 16 percent in the mid term. | c hChC = hazardous chemicals of high concern. | d CMR = carcinogenic, mutagenic, toxic for reproduction. | e PBT = persistent, bioaccumulative, toxic. | f Number of accidents at work resulting in absence from work per 1 million working hours. | g Number of incidents per 1 million working hours. | h SQAS Rail is a Cefic safety and quality evaluation system for rail transportation.
5

Creating the future is our business—the title of this year’s sustainability report sets out our agenda. Because chemicals form the basis and the driving force for innovations in almost all areas of daily life. That gives our sector a key role in solving important future issues, whether they relate to climate protection, efficient use of limited resources, or enabling more and more people on our planet to share in growth and prosperity. To achieve that, it is vital to take an integrated approach to economic strength and ecological and social responsibility. We do that because we are convinced that only companies that act responsibly, enjoy people’s trust, and are open to continuous improvement can be successful in the long term. That includes listening very carefully to the concerns of our customers, employees, owners, the capital markets, politicians, and other stakeholders. We need that interaction so we can respond rapidly to key future trends, global developments, and changing market requirements. Consequently, over the past year we once again ensured there was plenty of scope for dialogue with our stakeholders—at various events and through a new global employee survey.
CHRISTIAN KULLMANNChairman of the Executive Board
THOMAS WESSELChief Human Resources Officer
Ladies and gentlemen:
6

This understanding of partnership is important to us. Gone are the days when men in white coats developed new molecules in the isolation of their labs. A new generation of chemical innovations is being created in close cooperation with customers, suppliers, and research partners, through collaboration between global corporations and enthusiastic start-ups, and at the interface between different disciplines and fresh business models. The topics of particular importance to us are reflected in our updated materiality analysis. Many of these topics, such as the contribution Evonik makes to climate protection, are becoming vital drivers of innovation and growth. One example is the Rheticus research project. In this project we are working with Siemens to combine electrolysis and fermentation in order to achieve something the experts call artificial photosynthesis. The first pilot plant is currently under construction at our site in Marl (Germany). It is scheduled to come into operation in 2021 and will enable low-cost, environment-friendly production of high-value chemicals such as butanol and hexanol from eco-power and CO2 with the aid of bacteria. With this and many other projects, we are making a direct contribution to meeting the United Nations’ Sustainable Development Goals. A systematic review of our contribution is a new feature in this report. We have also further refined our monetary evaluation of the economic, ecological, and social impact of our business activities. We are happy to have achieved that because extensive reporting of the costs and benefits of our activities is essential to ensure that society accepts industrial production. Similarly, we are especially pleased that we have been able to reduce our specific green-house gas emissions by about 30 percent since 2008. We aim to reduce emissions by another 20 percent by 2025. At the same time, Evonik already generates around half of its sales with products and solutions that demon-strably help to improve resource efficiency in our customers’ applications. These are good reasons why we are proud to present this report to you and can sincerely say: Creating the future is our business.
CHRISTIAN KULLMANNChairman of the Executive Board
THOMAS WESSELChief Human Resources Officer
7

Shareholder structure
Living better with Evonik
We do quite a lot to make things better. What exactly? This selection gives an indication.
Car tires more fuel-efficientDiapers more absorbent
Stadium seats more fade-resistantPlastics more sustainable
Food healthierTablets more effective
Haircare gentlerAirplanes lighter
Car paint more scratch-resistantMonuments more weather-proof
We make ...
If you’d like to know what else gets better withEvonik specialty chemicals:www.better-with-evonik.com
€ 15.0 billionsales
17.3 %adjusted
EBITDA margin
€ 2.6 billionadjusted EBITDA
Approx.
240new patents
filed
12%ROCE
€ 20.3 billiontotal assets
as of December 31, 2018
€ 2.00earnings per share
1 Fiscal 2018.
Evonik at a glance1
Free float 35.7 % RAG-Stiftung 64.3 %
C01
8 SUSTAINABILITY REPORT 2018 EVONIK INDUSTRIES

As one of the world’s leading specialty chemicals companies, Evonik stands for attractive businesses and innovative capability. Our strengths include the balanced spectrum of our business activities, end-markets, and regions, and working closely with customers.
We see responsibility and long-term business success as two sides of the same coin. Sustainability has long been a growth driver in many of our businesses. Our leading technology positions enable us to offer customers a wide range of solutions that contribute to efficient use of resources and reduce their impact on the environment. Examples are amino acids for animal nutrition, additives for hydraulic fluids, and functional silanes to protect building façades.
At Evonik, good sustainability management goes beyond our own products and production processes. As a founding member of the Together for Sustainability sector initiative, we drive forward transparency and sustainability in the supply chain.
Evonik focuses on finding innovative solutions that help make life healthier, more sustainable, and more comfortable.
We accept responsibility
9BRIEF PROFILE OF EVONIK
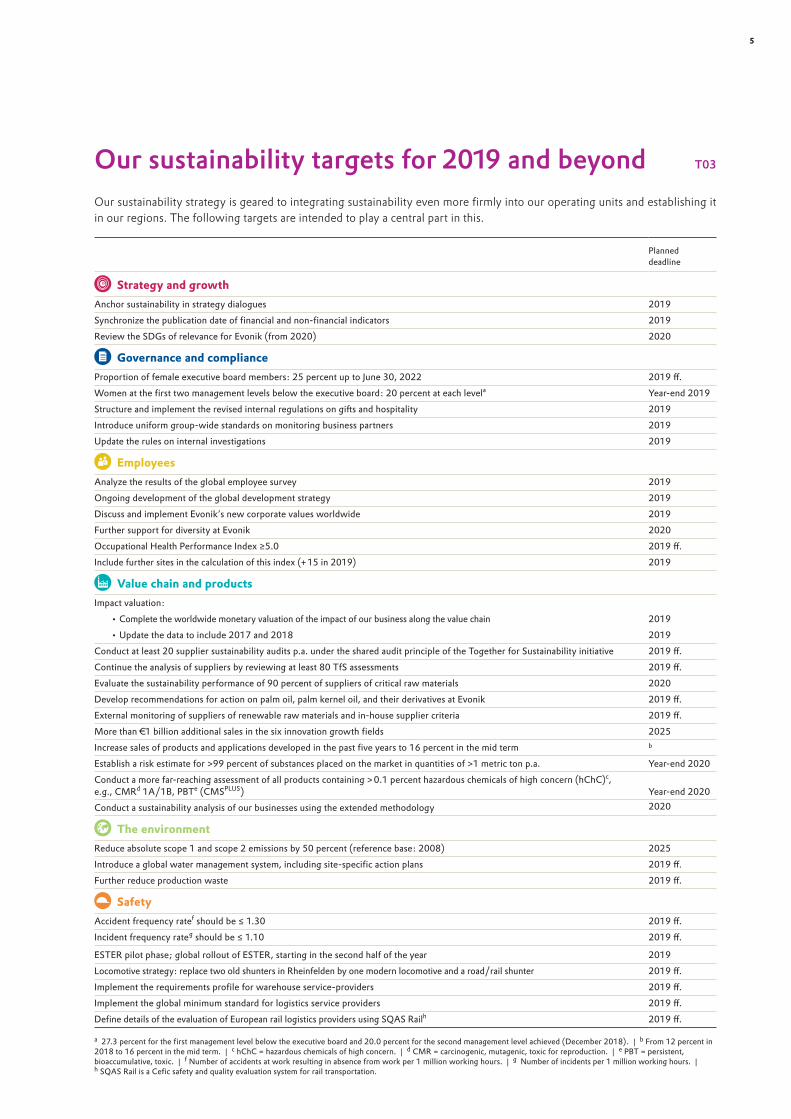
Page Topic | GRI indicators11 Business model | 102-15, 102-612 Fiscal 2018 | 102-15, 102-2, 102-7, 102-10, 103-1, 201-114 Sustainability management | 102-15, 102-18, 102-19, 102-20, 102-21, 102-32, 102-3316 Stakeholder management | 102-41, 102-13, 102-40, 102-42, 102-43, 102-44, 102-21, 102-37, 402-1, 403-1, 407-1, 413-119 UN Sustainable Development Goals of relevance for Evonik |21 Materiality analysis | 102-46, 102-47, 102-48, 102-49, 102-43, 102-44
STRATEGY AND GROWTH
At Evonik Perspectives on November 20, 2018 stakeholders gave Evonik online feedback on sustainability topics.
Evonik plans to build a new production com-plex for the high-performance polymer poly-amide 12, which is used in attractive growth markets, for example, in the automotive sector, oil and gas pipelines, and 3D printing.
FOCUS IN 2018Reviewing our materiality analysis and establishing the SDGs
of relevance for Evonik were the main focus of our work in 2018. We also defined details of our sustainability strategy.
Contribution to the UN Sustainable Development Goals C07
SDG 1 No poverty: Evonik supports many social and ecological projects at its sites.
SDG 2 Biolys® promotes healthy growth of pigs and poultry.
SDG 3 VESTAKEEP® makes spinal implants transparent for x-rays.
SDG 4 Quality education: Highly trained employees contribute to the sustainable development of society.
SDG 5 Our Global Social Policy stipulates equality of opportunity regardless of gender.
SDG 6 Our ESHQ Values define protecting people and the environment as core elements of our actions. REWOFERM® is a biodegradable surfactant based on sophorolipids, which are produced in nature from a yeast found, for example, in bumblebee honey.
SDG 7 VESTAMIN® composites facilitate the production of high-performance rotor blades for wind turbines.
SDG 8 1:7.1 jobsa: Every Evonik employee secures an average of 7.1 jobs in the value chain (including jobs at Evonik).
SDG 9 PROTECTOSIL® protects buildings and bridges from water and therefore prevents corrosion of steel-reinforced concrete structures.
SDG 10 Our code of conduct for suppliers stipulates equal opportunities and equal treatment within the supply chain.
SDG 11 CALOSTAT® is a non-combustible, fully recyclable high-performance thermal insulation material.
SDG 12 ULTRASIL® reduces the rolling resistance of auto tires and helps save fuel.
SDG 13 DYNAVIS® for formulating hydraulic fluids reduces fuel consumption, e. g., of excavators, and raises productivity.
SDG 14 DL-methionine for aquaculture™ is an essential amino acid for aquatic species.
SDG 15 AMINONIR® analysis delivers a reliable amino acid profile of raw materials to ensure optimal use of animal feed.
SDG 16 The Evonik Code of Conduct requires fair, reliable, and transparent business conduct.
SDG 17 Together for Sustainability. As a founding member of this sector initiative, Evonik drives forward transparency and sustainability in the supply chain.
a Data outside the scope of the limited assurance review.
SDGs of relevance to
Evonik
The UN Sustainable Development Goals that are relevant for Evonik are highlighted. The products and solutions are examples.
Chart C07—Contribution to the UN Sustainable Development Goals
Materiality analysis 2018 C09
No. Key topic Area of action
1 Plant safety
2 Occupational safety
3 Responsible management and human rights
4 More sustainable products/solutions for our customers
5 Product stewardship
6 R&D/innovation
7 Responsibility within the supply chain
8 Transportation safety/logistics
9 Waste management
No. Key topic Area of action
10 Effi cient use of scarce resources/circular economy
11 Appeal as an employer
12 Training/advanced training
13 Strategy and growth
14 Water management
15 Climate change and emissions into the air
16 Health protection and promotion
17 Diversity and equal opportunity
18 Biodiversity
19 Digitalization
Increasing relevance for Evonik(including positive/negative impacts of Evonik’s business activities along the value chain)
Incr
easin
g re
leva
nce
for s
take
hold
ers 16
14
10
171112
18
9
7
519
1
2
13
6
15
4
3
8
Top 3 sustainability topics of relevance for Evonik Top 10 sustainability topics of relevance for Evonik
Areas of action: Strategy and growth Governance and compliance Employees Value chain and products The environment Safety
Chart C09— Materiality analysis
2018
SDGs of relevance for Evonik in order of relevance (top to bottom)
Chart C10—Areas of action and impact of Evonik’s business along the
value chain
Influence along the value chain
Areas of action and impact of Evonik’s business along the value chain C10
a Only direct suppliers and direct customers.
Areas of action and key topics
SDGs of relevance for Evonik
Reporting boundary
STRATEGY AND GROWTH
• Strategy and growth• Digitalization
internal/external Medium High Medium
GOVERNANCE AND COMPLIANCE
• Responsible management and human rights
internal/external Medium High Low
EMPLOYEES• Appeal as an employer• Training/advanced training• Protecting and promoting
health• Diversity and equal
opportunity
internal Low High None
VALUE CHAIN AND PRODUCTS
• More sustainable products/solutions for our customers
• Product stewardship• R&D/innovations• Responsibility within the
supply chain• Efficiently use of
scarce resources/circular economy
internal/external Medium High Medium
THE ENVIRONMENT• Waste management• Water management• Climate change and
emissions into the air• Biodiversity
internal Low High None
SAFETY• Plant safety•Occupational safety• Transportation safety/
logistics
internal/external Medium High Low
Customer/end-customer applications a
Evonik-production/
processesSupply chain/raw materialsa
10 SUSTAINABILITY REPORT 2018 EVONIK INDUSTRIES
Business model
Evonik is one of the world’s leading specialty chemicals companies. Our strengths include the balanced spectrum of our business activities, end-markets, and regions. Around 80 percent of sales come from market-leading positions1, which we are systematically expanding. Our strong competitive position is based on close collaboration with customers, high innovative capability, and integrated technology platforms.
Our specialty chemicals products make an indispensable contribution to the benefits of our customers’ products, which generate their success in global competition. Close cooperation with our customers enables us to build up a deep knowledge of their business, so we can offer products tailored to their specifications and extensive technical service. Our technology centers and customer competence centers play an important role in this around the world.
Market-oriented research and development is a key driver of profitable growth. This is based on our strong innovation culture, which is rooted in our innovation management and management development. Good ideas are rapidly recog-nized, driven forward, and implemented with our customers.
Highly trained employees are a key success factor. They drive forward the company on a daily basis through their hard work and identification. We have therefore developed a wide range of activities to gain and develop talented and qualified employees and to position Evonik as a preferred employer in order to retain them.
As preconditions for Evonik’s future viability, sustainable business activities and responsible conduct are cornerstones of our business model. We drive forward our sustainability activities along the value chain in close dialogue with our stakeholders. As well as our own production processes and the products we market, we always consider the supply chain
and the product benefits for our customers and their customers. We have observed rising demand for products that demon-strate a good balance of economic, ecological, and social factors. That opens up a broad spectrum of future-oriented business opportunities for Evonik in attractive markets. Sustainability has long been a growth driver in many of our business.
In view of this, we defined our sustainability strategy in more detail in 2018, especially as regards foresighted resource management and integrating sustainability into strategic management processes.
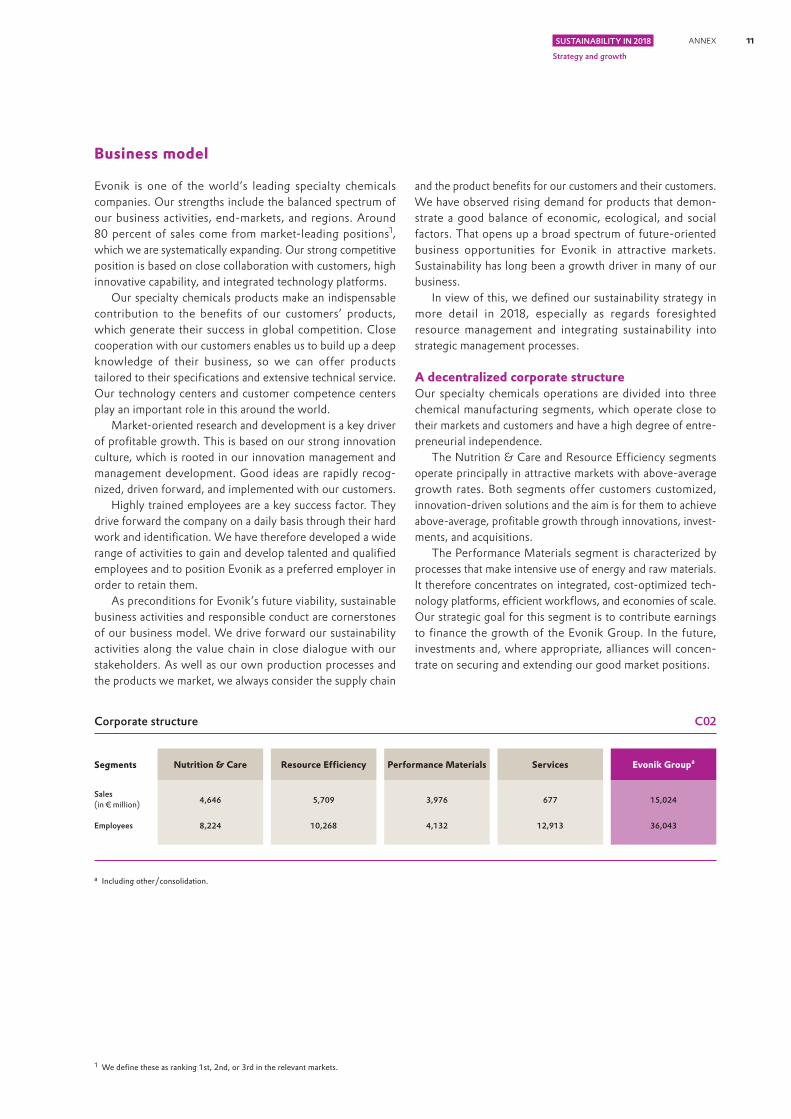
A decentralized corporate structureOur specialty chemicals operations are divided into three chemical manufacturing segments, which operate close to their markets and customers and have a high degree of entre-preneurial independence.
The Nutrition & Care and Resource Efficiency segments operate principally in attractive markets with above-average growth rates. Both segments offer customers customized, innovation-driven solutions and the aim is for them to achieve above-average, profitable growth through innovations, invest-ments, and acquisitions.
The Performance Materials segment is characterized by processes that make intensive use of energy and raw materials. It therefore concentrates on integrated, cost-optimized tech -nology platforms, efficient workflows, and economies of scale. Our strategic goal for this segment is to contribute earnings to finance the growth of the Evonik Group. In the future, investments and, where appropriate, alliances will concen-trate on securing and extending our good market positions.
1 We define these as ranking 1st, 2nd, or 3rd in the relevant markets.
a Including other/consolidation.
Segments
Corporate structure C02
Nutrition & Care
4,646
8,224
Resource Efficiency
5,709
10,268
Performance Materials
3,976
4,132
Services
677
12,913
Evonik Groupa
15,024
36,043
Sales (in € million)
Employees
11ANNEX
Strategy and growth
SUSTAINABILITY IN 2018

Evonik is driving forward digitalizationDigitalization entails fundamental changes to processes in the chemical industry. That starts with the use of artificial intelli-gence in research and development and continues through the procurement of raw materials, and the planning and operation of production facilities, to marketing and sales. For Evonik that means new security requirements and new oppor-tunities. It is also reflected in the results of our materiality analysis, where this topic was added in 2017.
Evonik is driving forward digitalization throughout the Group. For example, we are building up and bundling digital competencies at Evonik Digital GmbH. The role of this com-pany is, above all, to explore new business models, solutions, and services for customers, and to qualify employees for the digital world. Further information on the digitalization of working processes can be found in the chapter “Employees.”
To extend our position in the digital world in the long term, we enter into strategic partnerships with technology companies, universities, and cross-business networks.
Fiscal 2018
A successful year strategically and operationallyThe Evonik Group grew sales 4 percent to €15,024 million. The 5 percent organic sales growth was driven by higher selling prices, resulting in some cases from passing on higher raw material costs. Overall, volumes were on the same level as in the previous year, partly due to the restrictions on the trans-portation of goods in fall 2018 caused by low water levels in the river Rhine. 1 percentage point of the rise in sales came from the initial consolidation of the silica business acquired from J. M. Huber Corporation, Atlanta (Georgia, USA) effective September 1, 2017. Negative exchange rate movements had a counter-effect.
Adjusted EBITDA up considerably year-on-yearAdjusted EBITDA rose 10 percent to €2,601 million, driven by higher earnings in all segments and the initial success of the program to reduce selling and administrative expenses. The adjusted EBITDA margin improved to 17.3 percent, up from 16.4 percent in 2017.
Another good return on capital employedWithin our value-oriented management approach, our suc-cess is measured principally by ROCE, which was 12.1 percent in 2018 and therefore above our cost of capital. In our regular review in 2018, the cost of capital was confirmed as being 10.0 percent before taxes, unchanged from the previous year.
Total value addedValue added is calculated from sales and other revenues less the cost of materials, depreciation, amortization, and other expenses. Overall, value added increased 8 percent to €5,065 million in 2018. The largest share of value added—71 percent (2017: 72 percent)—went to our employees.
6 percent (2017: 7 percent) was paid to the state in income and other taxes. A further 4 percent (2017: 5 percent) went on interest payments. Shareholders of Evonik Industries AG received 18 percent of value added (2017: 15 percent).
Breakdown of value added T04
in € million 2017 2018
Total value added 4,684 5,065
Split
Employees 3,374 3,595
State 337 306
Creditors 243 210
Non-controlling interests 17 22
Net income 713 932
Prior-year figures restated in accordance with IFRS 15.
Major eventsOn November 7, 2018, we signed an agreement with One Equity Partners, Chicago (Illinois, USA) to acquire the US company PeroxyChem, Philadelphia (Pennsylvania, USA) for US$625 million. PeroxyChem is a manufacturer of hydrogen peroxide and peracetic acid and is well positioned in high-margin specialty applications. This acquisition expands our portfolio of environmentally friendly and high-growth specialty applications in the Resource Efficiency segment. Furthermore, it gives us an attractive business characterized by above-average growth, moderate capital intensity, and low cyclicality. The transaction should be closed in mid-2019. It is subject to the approval of the relevant authorities.
12 SUSTAINABILITY REPORT 2018 EVONIK INDUSTRIES

Our philosophy
Evonik focuses on finding innovative solutions that help make life healthier, more sustainable, and more comfortable. We strive for regular dialogue with our stakeholders to improve our understanding of the demands made on us. Different dialogue formats help us identify potential opportunities and risks for Evonik as early as possible, so we can draw the necessary conclusions.
The assessments of many internal and external stakeholders were also included in the extensive update of our materiality
analysis. Our sustainability activities and reporting are system-atically aligned to our materiality analysis.
As a member of the UN Global Compact, we are also aware of our responsibility to gain an extensive understanding of the positive and negative contributions made by Evonik’s business operations to achieving the UN Sustainable Develop-ment Goals (SDGs). We have therefore determined the SDGs of relevance to us and used them to define further details of our sustainability strategy.
Our sustainability strategy
Defining further details of our sustainability strategy was an important focus of our work in 2018. Our strategy is based on five pillars:
1. Sustainability is part of Evonik’s market proposition
We report extensively on our production footprint and the handprint of our business activities, i.e., the beneficial effects of using our products. We engage in constant dialogue with our stakeholders on social and ecological requirements.
2. Evonik is committed to foresighted resource management
We have defined ambitious new climate and water targets; see chapter “The environment.” By 2025 we aim to reduce our absolute greenhouse gas emis-sions by 50 percent compared with 2008 (reference base). In future, internal CO2 pricing will be an additional criterion in the management of major investments.
3. Evonik has defined growth engines with a clear focus on sustainability
Our business activities have both positive and nega-tive impacts, which affect the UN SDGs. More than
80 percent of the Evonik Group’s sales make a positive contribution to achieving the UN SDGs. We systematically examine relevant sustainability aspects along the value chain. Further information can be found in the chapter “Value chain and prod-ucts.”
4. Evonik integrates sustainability into its strategic management processes
In 2018, we continued to develop our sustainability portfolio analysis, including testing and integration into our strategy process. The new process will be rolled out group-wide starting in 2019. It is based on the framework published by the Business Council for Sustainable Development (WBCSD), which Evonik played a key role in developing.
5. Evonik sets high standards for continuous improvement of reporting
We focus on measurability and transparency, and have brought forward the publication date of our sustainability report to coincide with publication of our financial report.
13ANNEX
Strategy and growth
SUSTAINABILITY IN 2018

Organization and management
The executive board bears overall responsibility for sustain-ability at Evonik, and direct responsibility is assigned to the chief human resources officer, who is also responsible for all climate-related aspects. The Corporate Responsibility division sets the strategic framework for sustainability management and coordinates group-wide implementation in close collaboration with other central functions and the operational segments.
Responsibility for sustainability management at Evonik is set out in a corporate policy. The HR Executive Committee monitors the global implementation of Evonik’s sustainability strategy. It comprises the chief human resources officer, the industrial relations directors of the segments, and the heads of Corporate ESHQ, Corporate Responsibility, and Corporate Human Resources.
Decision-making competence for group-wide sustainability projects is delegated to the CR Panel, which is chaired by the head of Corporate Responsibility. The members are the stra-tegic CR partners of the segments, the corporate functions, and representatives of the workforce. As defined in its rules of procedure, the CR Panel meets at least twice a year.
The work of the CR Panel is supported by the global cor-porate responsibility committee, which is responsible for the operational realization and promotion of sustainability aspects. Where necessary, specialist input is provided by project-based CR Expert Circles.
Creating extensive value
Our sustainability strategy underscores our endeavors to gain a precise understanding of the principal influences and impacts on the value created by Evonik.
Chart C04 “Resources and value contributed” contains examples of the resources we need to run our business and compares them with the value created. This presentation gives us a valuable insight into economic, ecological, and social impacts and into how efficiently we use resources. Our aim is
to integrate the findings into our ongoing management processes to strengthen the positive results of our business activity and minimize the negative effects.
Chart C19 in the chapter “Value chain and products” illustrates the initial findings of our impact valuation. In the intermediate term, we want to merge the impact valuation with our sustainability analysis.
Sustainability management at Evonik C03
HR Executive Committee
Corporate Responsibility Panel
Global Corporate Responsibility Committee
CR Expert Circles
Executive Board | Overall responsibility for sustainability
Chief Human Resources Officer | Responsible executive board member
Corporate Divisions
Regions
Segments
14 SUSTAINABILITY REPORT 2018 EVONIK INDUSTRIES

Resources and value contributed in 2018 C04
Our resources Value contributed
Nutrition & Care
Applications in consumer goods for daily
needs, animal nutrition, and healthcare products
Resource Efficiency
High-performance materials and specialty additives for environment-friendly and energy-efficient system
solutions for the automotive, paints, coatings, adhesives, and construction industries,
and many other sectors
Performance Materials
Production of polymer materials and intermediates, mainly
for the rubber, plastics, and agriculture industries
Services
Services at Evonik’s sites and standardized
administrative services for internal and external
customers
Stakeholders
36,043employees
Approx. 35,000suppliers
Approx. 40,000customers
€ 9.9 billionprocurement volume
The environment
9.86 million metric tonsraw material inputs
9.7 %renewable
raw materials72.91 PJ
net energy input6.6 million metric tons
direct and indirect CO2eq emissions a
70.2 million m3water consumption in production processes
Financials
€ 6,785 millionproperty, plant and equipment
€ 1,050 millioncapital expenditures
Knowledge
€ 459 millionR&D expenses
Approx. 2,800R&D employees
Production
> 100production sites
6 km2largest production site
Marl (Germany)
Society
€ 63 millionspending on vocational training
94.9 %employee health ratio
€ 2.9 billionwages and salaries€ 7.4 millionb
donations and sponsorship
The environment
€ 43 millioninvestment in
environmental protection– 17 percentage points
reduction in specific greenhouse gas emissions c
101.8 million metric tons CO2eq avoided by using
Evonik products d
70 %of sales covered by life cycle analyses
Financials
€ 15.0 billionsales
€ 250 millionincome taxes
Knowledge
Approx. 240 new patents filed
Approx. 26,000 patents and patent applications
Products and solutions
> 4,000products and solutions
Approx. 50 %of sales generated with
resource-efficient productse
a Scope 1 and 2 (market-based).b Not included in the limited assurance review.c Reference base 2012.d In accordance with WBCSD Avoided Emissions Guidance 2013. Figure refers to 2017.e Products that are proven to make a contribution to resource efficiency during production. Data from 2016.
15ANNEX
Strategy and growth
SUSTAINABILITY IN 2018

Engaging with our stakeholders
We are convinced that only companies that act responsibly, enjoy people’s trust, and are open to continuous improve-ment can be successful in the long term. That includes listen-ing very carefully to the concerns of our stakeholders. We actively seek interaction so we can respond rapidly to key future trends, global developments, and changing market requirements. Consequently, over the past year we once again ensured there was plenty of scope for dialogue with
our stakeholders—at various events and through another global employee survey; see chapter “Employees.”
We have systematically refined our engagement with stake-holders in recent years. This has ranged from analyzing and clustering the stakeholder groups of relevance to us to stringent process documentation. Among other things, this helps us in the regular validation of our materiality analysis.
We have developed various formats for our dialogue with stakeholders. These help us engage with both direct and indirect stakeholders. Evonik’s regions and their wide- ranging contacts are included in this. At the same time, we take care to ensure the widest possible coverage of opera-tional, political, social, and community perspectives.
102-40
102-42
102-44
Dire
ct in
fluen
ceIn
dire
ct in
fluen
ce
Shareholders
Lenders
Legislators
Authorities
Society/communityFinancial markets Regulatory bodiesThe business
Local residents
Non-governmentalorganizations
Scientific community
Media
Analysts/rating agencies PoliticiansAssociations
Competitors
Customers
Employees
Suppliers
Stakeholder groups and their influence on Evonik C05
102-48
Intense discussion of climate protection at the Evonik Perspectives stakeholder conference on November 20, 2018.
102-43
Brainstorming workshop on cyber security in Brussels in June 2018.
102-40
16 SUSTAINABILITY REPORT 2018 EVONIK INDUSTRIES

Stakeholder engagement 2018 C06
• Quality, reliability of supply, prices• Innovations• Governance and compliance• Support to help customers achieve their
sustainability targets
Customers
• Talks with customers, reports, analyses• Stakeholder dialogue :“The two-degree goal—How
industry can help meet climate targets”• Workshop: “FReSH Dietary Shifts Proteins”• Customer project: “Prevention of spreading
antimicrobial resistance from livestock”• Customer project: “Socially and environmentally more
sustainable pharma supply chain”• Meeting customers at trade events, e.g., Convention on
Pharmaceutical Ingredients (CPhI)
• Ratings and rankings• Current business performance and outlookCreditors • Talks with rating agencies
• Talks with lenders
• Governance and compliance• Safety• Environmental protection• Appeal as an employer
Legislators• Stakeholder dialogue “The Future of Europe”• Brainstorming workshop “Pathways to enhance
cybersecurity in the EU”
• Wages and salaries• Vocational and advanced training; development
opportunities• Safety• Combining work with raising a family• Leadership quality• Current business development• In-house changes• Customer focus• Diversity• Digitalization
Employees
• Employee development reviews• Intranet, employee magazine• “Roundtable” discussions and networks• Internal social media platforms (“communities”)• Interactive careers website• Employee survey
• Price, quality, payment practice• Governance and compliance• Safety• Environmental protection• Social standards
Suppliers
• Together for Sustainability (TfS) at the ABIQUIM Sustainability Conference in São Paulo (Brazil)
• Evonik and TfS support the Chemie3 pilot project “ Sustainability in the supply chain”
• Supplier training in Shanghai
• Attractive dividend policy• Current business development and outlookShareholders • Annual shareholders’ meeting
• Roadshows/conferences
• Safety• Appeal as an employer• Local activities• Current business performance and outlook• In-house changes
Local residents• Magazines for local residents• Environmental and neighborhood hotlines• Open days at twelve sites
a Only includes stakeholders with a direct influence.
Key issuesExamples of stakeholder engagementStakeholder groups a
• Environmental protection• Safety• Permitting procedures• Governance and compliance• Appeal as an employer• Circular economy
Authorities
• Stakeholder dialogue “The two-degree goal—How industry can help meet climate targets”
• Brainstorming workshop “Pathways to enhance cybersecurity in the EU”
• Talks with authorities
102-43
102-44
17ANNEX
Strategy and growth
SUSTAINABILITY IN 2018
AdvocacyEvonik plays an active part in many societal debates and is a partner in opinion-forming processes at regional, national, European, and international level. Our offices in Berlin and Brussels are important interfaces for dialogue between rep-resentatives of politics and public life. Our employees there network closely with politicians, trade associations, and the general public, support them in shaping political conditions, and take up issues in the areas of digitalization, energy and climate protection, sustainability and the environment, research and development, and agricultural policy. We took part in consultations, hearings, and discussions. In the environ-mental area, activities concentrated on the draft version of the German Clean Air Act (TA-Luft), EU requirements for the circular economy, and the ongoing development of the bioeconomy strategy. Consultations on the EU winter package, amendments to the German Renewable Energies Act (EEG), and the regulation of grid fees were the main issues relating to energy and climate policy.
Trustful collaborationEvonik’s success is based on trustful collaboration between representatives of the management and employees. This takes account of operating conditions and the laws applicable in the various countries.
In Germany, the fundamental rights of our employees and their representatives to be consulted are anchored in statutory regulations such as the Codetermination Act and the legislation on executive staff councils. There are elected bodies represent-ing our employees at all sites in Germany. Works councils rep-resent exempt and non-exempt employees, while executive staff councils represent our executives. Timely discussion of all major changes with these bodies is ensured. These take place several weeks or months prior to implementation of such mea-sures, depending on the significance of the upcoming changes. Where necessary, during this period written agreements are made on the upcoming measures and their impact on our workforce. There are comparable rules on the type and scope
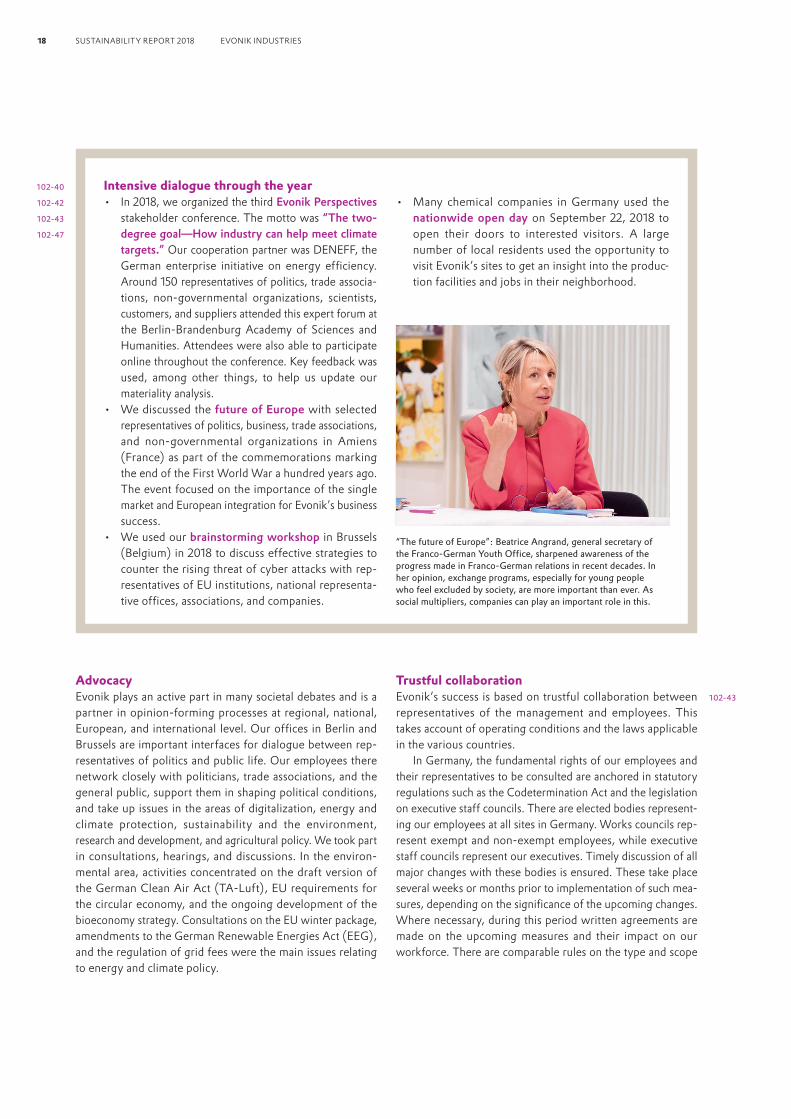
Intensive dialogue through the year• In 2018, we organized the third Evonik Perspectives
stakeholder conference. The motto was “The two- degree goal—How industry can help meet climate targets.” Our cooperation partner was DENEFF, the German enterprise initiative on energy efficiency. Around 150 representatives of politics, trade associa-tions, non-governmental organizations, scientists, customers, and suppliers attended this expert forum at the Berlin-Brandenburg Academy of Sciences and Humanities. Attendees were also able to participate online throughout the conference. Key feedback was used, among other things, to help us update our materiality analysis.
• We discussed the future of Europe with selected representatives of politics, business, trade associations, and non-governmental organizations in Amiens (France) as part of the commemorations marking the end of the First World War a hundred years ago. The event focused on the importance of the single market and European integration for Evonik’s business success.
• We used our brainstorming workshop in Brussels (Belgium) in 2018 to discuss effective strategies to counter the rising threat of cyber attacks with rep-resentatives of EU institutions, national representa-tive offices, associations, and companies.
• Many chemical companies in Germany used the nationwide open day on September 22, 2018 to open their doors to interested visitors. A large number of local residents used the opportunity to visit Evonik’s sites to get an insight into the produc-tion facilities and jobs in their neighborhood.
102-40
102-42
102-43
102-47
“The future of Europe”: Beatrice Angrand, general secretary of the Franco-German Youth Office, sharpened awareness of the progress made in Franco-German relations in recent decades. In her opinion, exchange programs, especially for young people who feel excluded by society, are more important than ever. As social multipliers, companies can play an important role in this.
102-43
18 SUSTAINABILITY REPORT 2018 EVONIK INDUSTRIES
of consultation and negotiation in many other regions where Evonik has employees.
The information and consultation rights of employees on cross-border European issues are represented by the Evonik Europa Forum, which is composed of employee and employer representatives.
At company level in Germany, employees’ interests are
represented by employee representatives on the supervisory board.
Evonik does not restrict employees’ rights to freedom of association or the right to collective bargaining. These rights are also ensured in countries where freedom of association is not protected by the state. Based on our sites worldwide, there are employee representatives for about 96 percent of our employees.
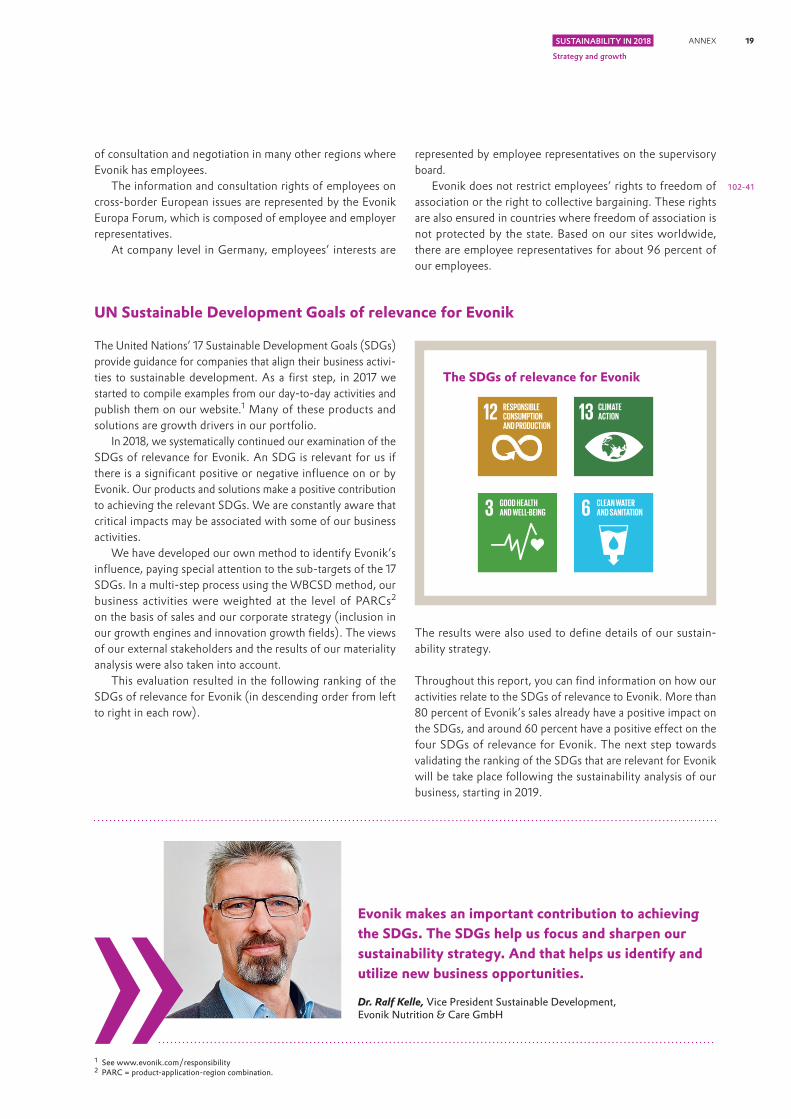
UN Sustainable Development Goals of relevance for Evonik
The United Nations’ 17 Sustainable Development Goals (SDGs) provide guidance for companies that align their business activi-ties to sustainable development. As a first step, in 2017 we started to compile examples from our day-to-day activities and publish them on our website.1 Many of these products and solutions are growth drivers in our portfolio.
In 2018, we systematically continued our examination of the SDGs of relevance for Evonik. An SDG is relevant for us if there is a significant positive or negative influence on or by Evonik. Our products and solutions make a positive contribution to achieving the relevant SDGs. We are constantly aware that critical impacts may be associated with some of our business activities.
We have developed our own method to identify Evonik’s influence, paying special attention to the sub-targets of the 17 SDGs. In a multi-step process using the WBCSD method, our business activities were weighted at the level of PARCs 2 on the basis of sales and our corporate strategy (inclusion in our growth engines and innovation growth fields). The views of our external stakeholders and the results of our materiality analysis were also taken into account.
This evaluation resulted in the following ranking of the SDGs of relevance for Evonik (in descending order from left to right in each row).
The results were also used to define details of our sustain-ability strategy.
Throughout this report, you can find information on how our activities relate to the SDGs of relevance to Evonik. More than 80 percent of Evonik’s sales already have a positive impact on the SDGs, and around 60 percent have a positive effect on the four SDGs of relevance for Evonik. The next step towards validating the ranking of the SDGs that are relevant for Evonik will be take place following the sustainability analysis of our business, starting in 2019.
102-41
1 See www.evonik.com/responsibility2 PARC = product-application-region combination.
Evonik makes an important contribution to achieving the SDGs. The SDGs help us focus and sharpen our sustainability strategy. And that helps us identify and utilize new business opportunities.
Dr. Ralf Kelle, Vice President Sustainable Development, Evonik Nutrition & Care GmbH
The SDGs of relevance for Evonik
19ANNEX
Strategy and growth
SUSTAINABILITY IN 2018
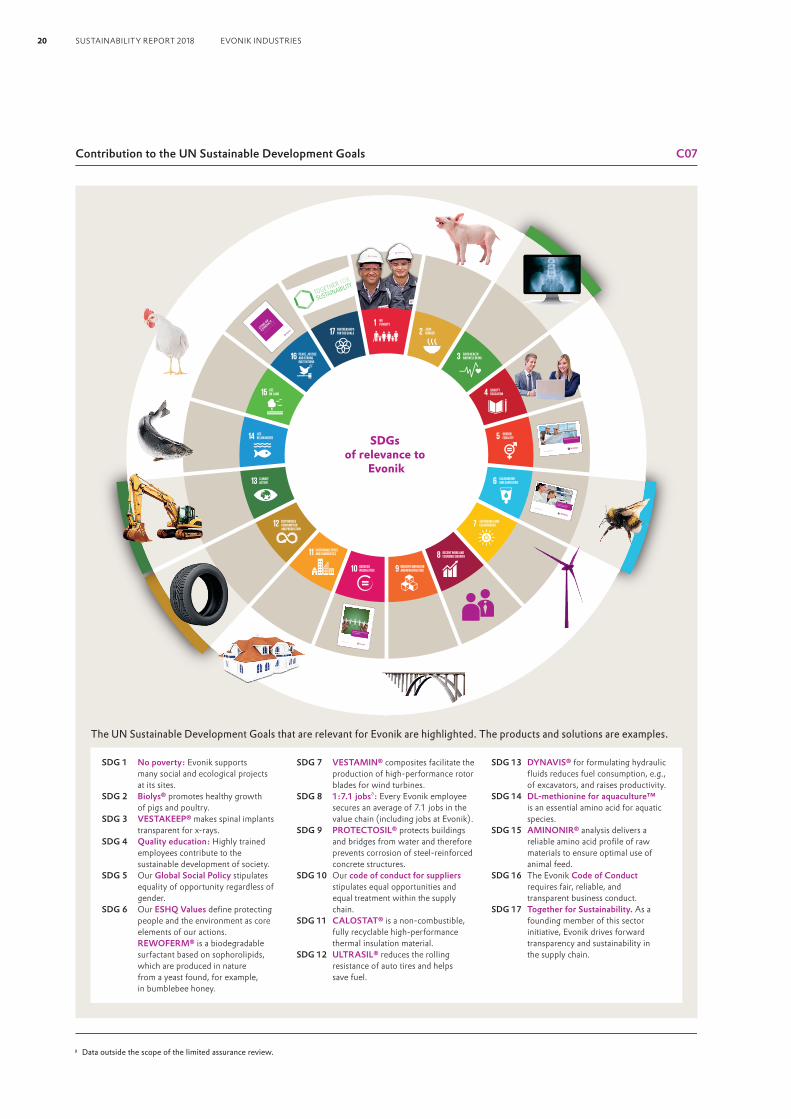
Contribution to the UN Sustainable Development Goals C07
SDG 1 No poverty: Evonik supports many social and ecological projects at its sites.
SDG 2 Biolys® promotes healthy growth of pigs and poultry.
SDG 3 VESTAKEEP® makes spinal implants transparent for x-rays.
SDG 4 Quality education: Highly trained employees contribute to the sustainable development of society.
SDG 5 Our Global Social Policy stipulates equality of opportunity regardless of gender.
SDG 6 Our ESHQ Values define protecting people and the environment as core elements of our actions. REWOFERM® is a biodegradable surfactant based on sophorolipids, which are produced in nature from a yeast found, for example, in bumblebee honey.
SDG 7 VESTAMIN® composites facilitate the production of high-performance rotor blades for wind turbines.
SDG 8 1:7.1 jobsa: Every Evonik employee secures an average of 7.1 jobs in the value chain (including jobs at Evonik).
SDG 9 PROTECTOSIL® protects buildings and bridges from water and therefore prevents corrosion of steel-reinforced concrete structures.
SDG 10 Our code of conduct for suppliers stipulates equal opportunities and equal treatment within the supply chain.
SDG 11 CALOSTAT® is a non-combustible, fully recyclable high-performance thermal insulation material.
SDG 12 ULTRASIL® reduces the rolling resistance of auto tires and helps save fuel.
SDG 13 DYNAVIS® for formulating hydraulic fluids reduces fuel consumption, e.g., of excavators, and raises productivity.
SDG 14 DL-methionine for aquaculture™ is an essential amino acid for aquatic species.
SDG 15 AMINONIR® analysis delivers a reliable amino acid profile of raw materials to ensure optimal use of animal feed.
SDG 16 The Evonik Code of Conduct requires fair, reliable, and transparent business conduct.
SDG 17 Together for Sustainability. As a founding member of this sector initiative, Evonik drives forward transparency and sustainability in the supply chain.
a Data outside the scope of the limited assurance review.
SDGs of relevance to
Evonik
The UN Sustainable Development Goals that are relevant for Evonik are highlighted. The products and solutions are examples.
20 SUSTAINABILITY REPORT 2018 EVONIK INDUSTRIES
Extensive update of our materiality analysis
Our sustainability activities are systematically aligned to materiality. Our sustainability topics are based on the themes identified in our materiality analysis in 2015. We reviewed, validated, and in some cases revised these themes in a wide range of stakeholder dialogues and discussions with internal experts in 2016 and 2017. As a result, we added digitalization, biodiversity, and the circular economy as new topics. The concept and the results of this validation are presented annu-ally to the CR Panel for approval.
One goal we set ourselves for 2018 was an extensive validation of our materiality analysis to make prioritization even more meaningful. The scope of our stakeholder survey in 2018 was broadened considerably compared with previous years and stakeholders were asked about the most important sustainability issues for Evonik. A distinction was made between stakeholders with direct and indirect influence; see chart C05. The participants at our stakeholder dialogues formed the basis for our survey.
In addition, we asked internal experts, employee represen-tatives, and specialists from the Evonik regions for their opinions. Particular attention was paid to both positive and negative impacts of Evonik’s business activities along the value chain.
102-40
102-42
102-43
102-46
102-48
102-49
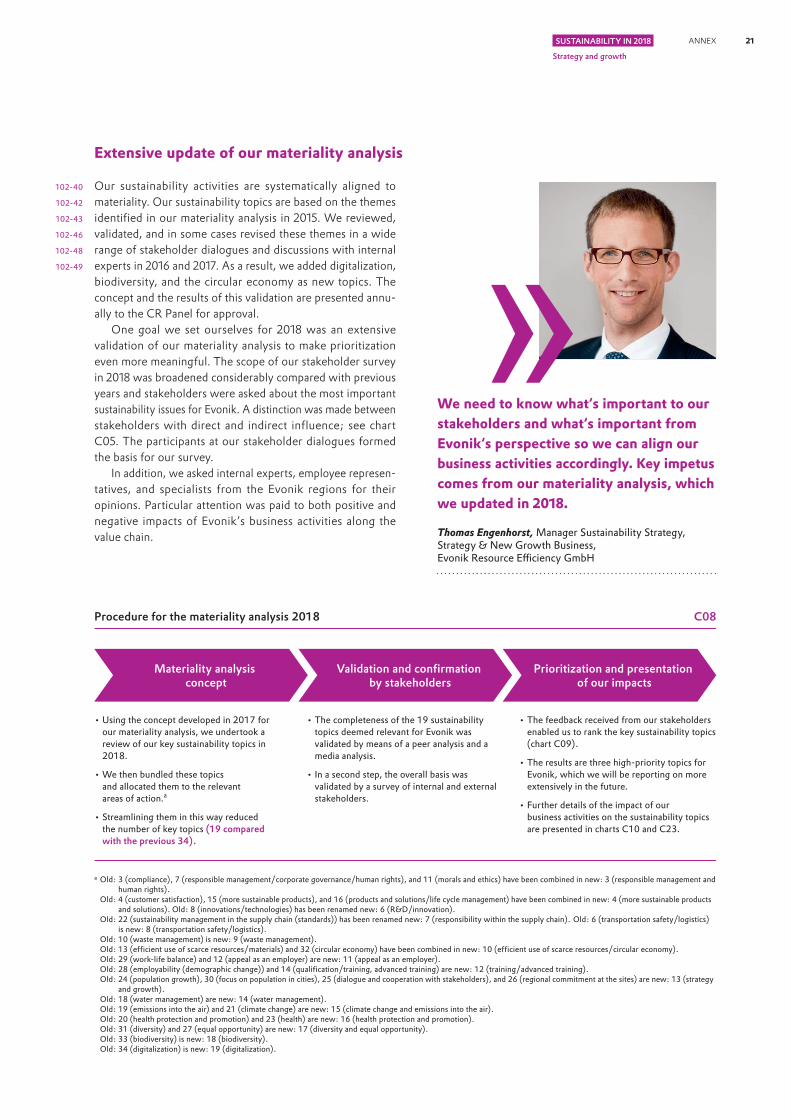
We need to know what‘s important to our stakeholders and what‘s important from Evonik‘s perspective so we can align our business activities accordingly. Key impetus comes from our materiality analysis, which we updated in 2018.
Thomas Engenhorst, Manager Sustainability Strategy,Strategy & New Growth Business,Evonik Resource Efficiency GmbH
Procedure for the materiality analysis 2018 C08
• Using the concept developed in 2017 for our materiality analysis, we undertook a review of our key sustainability topics in 2018.
• We then bundled these topics and allocated them to the relevant areas of action.a
• Streamlining them in this way reduced the number of key topics (19 compared with the previous 34).
• The completeness of the 19 sustainability topics deemed relevant for Evonik was validated by means of a peer analysis and a media analysis.
• In a second step, the overall basis was validated by a survey of internal and external stakeholders.
• The feedback received from our stakeholders enabled us to rank the key sustainability topics (chart C09).
• The results are three high-priority topics for Evonik, which we will be reporting on more extensively in the future.
• Further details of the impact of our business activities on the sustainability topics are presented in charts C10 and C23.
Materiality analysis concept
Validation and confirmation by stakeholders
Prioritization and presentation of our impacts
a Old: 3 (compliance), 7 (responsible management/corporate governance/human rights), and 11 (morals and ethics) have been combined in new: 3 (responsible management and human rights).
Old: 4 (customer satisfaction), 15 (more sustainable products), and 16 (products and solutions/life cycle management) have been combined in new: 4 (more sustainable products and solutions). Old: 8 (innovations/technologies) has been renamed new: 6 (R&D/innovation).
Old: 22 (sustainability management in the supply chain (standards)) has been renamed new: 7 (responsibility within the supply chain). Old: 6 (transportation safety/logistics) is new: 8 (transportation safety/logistics).
Old: 10 (waste management) is new: 9 (waste management). Old: 13 (efficient use of scarce resources/materials) and 32 (circular economy) have been combined in new: 10 (efficient use of scarce resources/circular economy). Old: 29 (work-life balance) and 12 (appeal as an employer) are new: 11 (appeal as an employer). Old: 28 (employability (demographic change)) and 14 (qualification/training, advanced training) are new: 12 (training/advanced training). Old: 24 (population growth), 30 (focus on population in cities), 25 (dialogue and cooperation with stakeholders), and 26 (regional commitment at the sites) are new: 13 (strategy
and growth). Old: 18 (water management) are new: 14 (water management). Old: 19 (emissions into the air) and 21 (climate change) are new: 15 (climate change and emissions into the air). Old: 20 (health protection and promotion) and 23 (health) are new: 16 (health protection and promotion). Old: 31 (diversity) and 27 (equal opportunity) are new: 17 (diversity and equal opportunity). Old: 33 (biodiversity) is new: 18 (biodiversity). Old: 34 (digitalization) is new: 19 (digitalization).
21ANNEX
Strategy and growth
SUSTAINABILITY IN 2018

102-46
102-47
102-44
102-48
102-49
Influence along the value chain
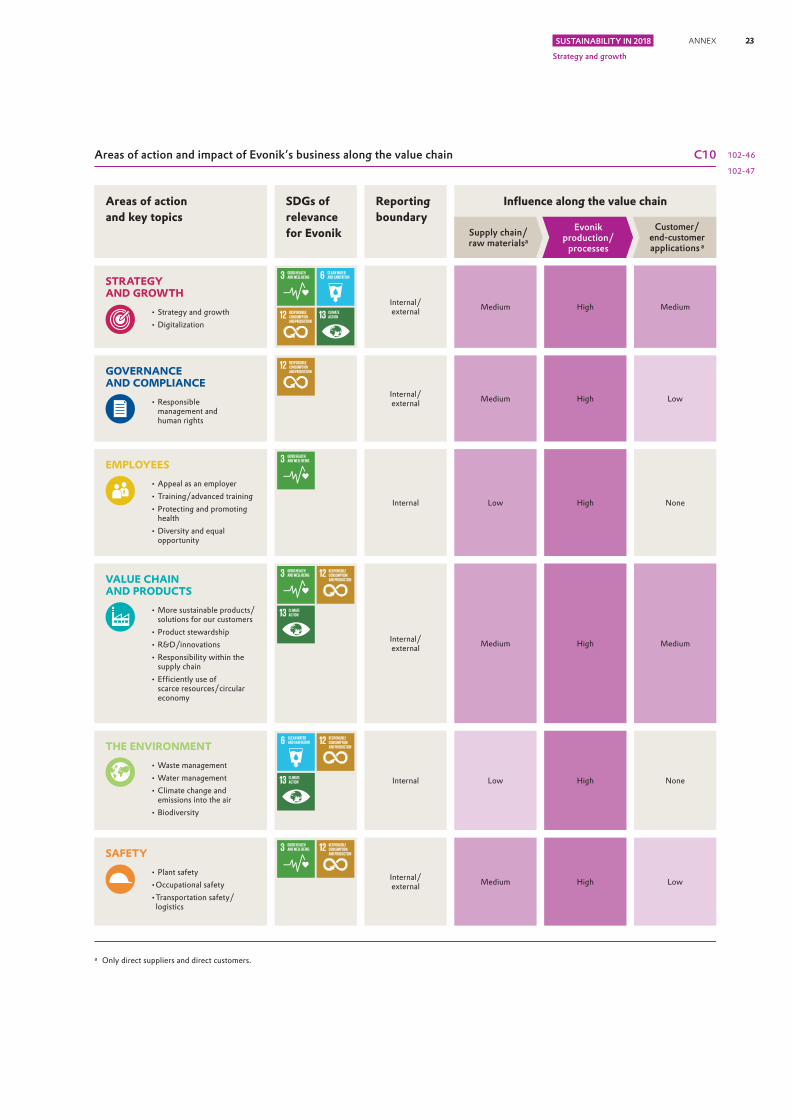
Areas of action and impact of Evonik’s business along the value chain C10
a Only direct suppliers and direct customers.
Areas of action and key topics
SDGs of relevance for Evonik
Reporting boundary
STRATEGY AND GROWTH
• Strategy and growth• Digitalization
Internal/external Medium High Medium
GOVERNANCE AND COMPLIANCE
• Responsible management and human rights
Internal/external Medium High Low
EMPLOYEES• Appeal as an employer• Training/advanced training• Protecting and promoting
health• Diversity and equal
opportunity
Internal Low High None
VALUE CHAIN AND PRODUCTS
• More sustainable products/solutions for our customers
• Product stewardship• R&D/innovations• Responsibility within the
supply chain• Efficiently use of
scarce resources/circular economy
Internal/external Medium High Medium
THE ENVIRONMENT• Waste management• Water management• Climate change and
emissions into the air• Biodiversity
Internal Low High None
SAFETY• Plant safety•Occupational safety• Transportation safety/
logistics
Internal/external Medium High Low
Customer/ end-customer applications a
Evonik production/
processesSupply chain/raw materialsa
102-46
102-47
Materiality analysis 2018 C09
No. Key topic Area of action
1 Plant safety
2 Occupational safety
3 Responsible management and human rights
4 More sustainable products/solutions for our customers
5 Product stewardship
6 R&D/innovation
7 Responsibility within the supply chain
8 Transportation safety/logistics
9 Waste management
No. Key topic Area of action
10 Efficient use of scarce resources/ circular economy
11 Appeal as an employer
12 Training/advanced training
13 Strategy and growth
14 Water management
15 Climate change and emissions into the air
16 Health protection and promotion
17 Diversity and equal opportunity
18 Biodiversity
19 Digitalization
Increasing relevance for Evonik(including positive/negative impacts of Evonik’s business activities along the value chain)
Incr
easin
g re
leva
nce
for s
take
hold
ers 16
14
10
171112
18
9
7
519
1
2
13
6
15
4
3
8
Top 3 sustainability topics of relevance for Evonik Top 10 sustainability topics of relevance for Evonik
Areas of action: Strategy and growth Governance and compliance Employees Value chain and products The environment Safety
22 SUSTAINABILITY REPORT 2018 EVONIK INDUSTRIES
Influence along the value chain
Areas of action and impact of Evonik’s business along the value chain C10
a Only direct suppliers and direct customers.
Areas of action and key topics
SDGs of relevance for Evonik
Reporting boundary
STRATEGY AND GROWTH
• Strategy and growth• Digitalization
Internal/external Medium High Medium
GOVERNANCE AND COMPLIANCE
• Responsible management and human rights
Internal/external Medium High Low
EMPLOYEES• Appeal as an employer• Training/advanced training• Protecting and promoting
health• Diversity and equal
opportunity
Internal Low High None
VALUE CHAIN AND PRODUCTS
• More sustainable products/solutions for our customers
• Product stewardship• R&D/innovations• Responsibility within the
supply chain• Efficiently use of
scarce resources/circular economy
Internal/external Medium High Medium
THE ENVIRONMENT• Waste management• Water management• Climate change and
emissions into the air• Biodiversity
Internal Low High None
SAFETY• Plant safety•Occupational safety• Transportation safety/
logistics
Internal/external Medium High Low
Customer/ end-customer applications a
Evonik production/
processesSupply chain/raw materialsa
102-46
102-47
23ANNEX
Strategy and growth
SUSTAINABILITY IN 2018

We obtained more than 400 responses. Chart C09 shows the opinion of our stakeholders and internal experts on the most important sustainability topics for Evonik. The top 3 topics are more sustainable products/solutions for our customers, climate change and emissions into the air, and efficient use of scarce resources/circular economy. We will be stepping up our focus on these topics in the future, because they have become significantly more important since our last extensive materiality analysis in 2015.
In the future, we intend to conduct an extensive update of our materiality analysis roughly every three years. Between updates, we will continue to drive forward the topics identified on the basis of their prioritization.
Six areas of action for sustainabilityThe results of our materiality analysis are grouped in six areas of action, which provide the basic structure for this report.
We have defined reporting boundaries for these areas of action and the related topics. These specify whether we monitor and manage the area of action within our organization or externally. Chart C10 provides an insight into the possibilities and limits of our influence within the value chain—for example, through our procurement volume, our management systems, or current business processes.
Chart C04 “Resources and value contributed” shows the impact of our business activities structured by social, ecological, and economic aspects. In addition, chart C19 in the chapter “Value chain and products” provides a breakdown of the impact along the value chain.
For the topics defined in our materiality analysis, there is a complaints mechanism for both employees and external stake-holders. This includes our whistleblower system; see chapter “Governance and compliance.”
If significant new topics are added, we will review our processes and adapt them as necessary.
Evonik Perspectives, November 20, 2018: Stakeholders give Evonik feedback on sustainability issues.
102-47
102-46
TARGET ATTAINMENT IN 2018 Validate the materiality analysis: We extensively
updated the materiality analysis and subsequently prioritized the topics.
Identify the SDGs of relevance for Evonik and their contribution to the business: We have developed and implemented an in-house method to identify the SDGs of relevance for Evonik.
TARGETS FOR 2019 AND BEYOND Anchor sustainability in strategy dialogues.
Synchronize the publication date of financial and non-financial reports.
Review the SDGs of relevance for Evonik (from 2020).
Target achieved Target partially achieved or target horizon extends beyond 2018 Target not achieved
24 SUSTAINABILITY REPORT 2018 EVONIK INDUSTRIES
GOVERNANCE AND COMPLIANCE
Diversity Champions: Evonik still in the top 10
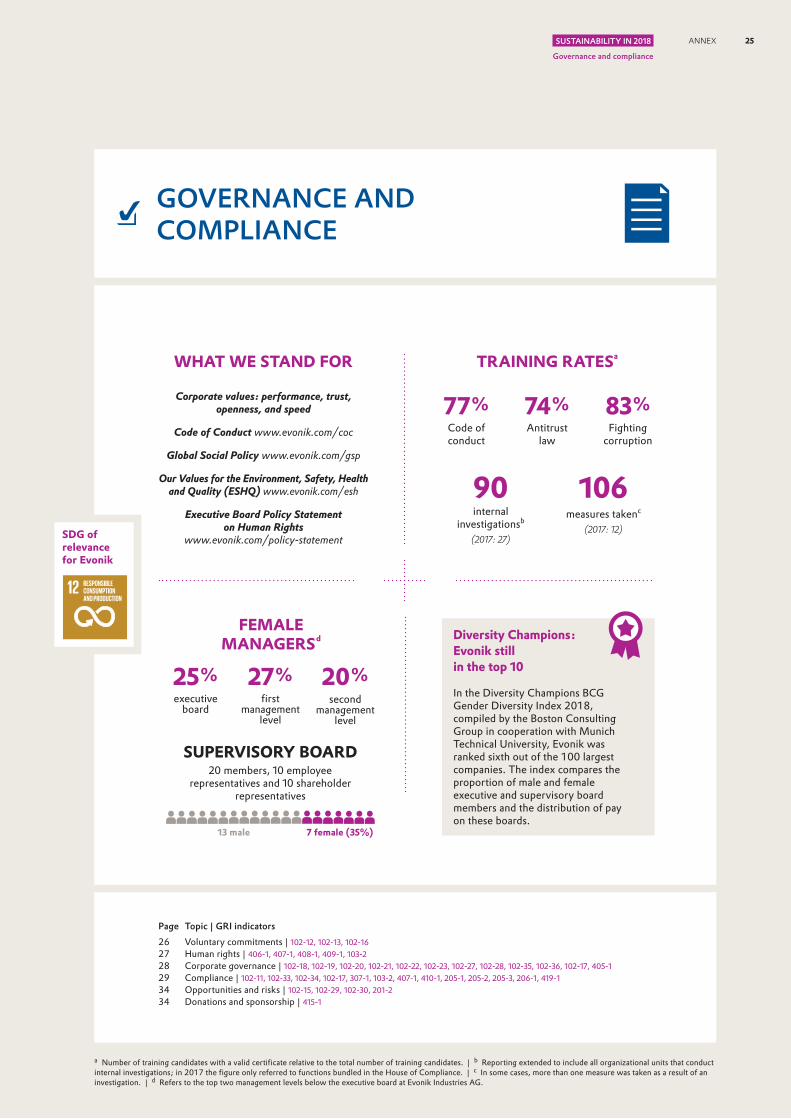
In the Diversity Champions BCG Gender Diversity Index 2018, compiled by the Boston Consulting Group in cooperation with Munich Technical University, Evonik was ranked sixth out of the 100 largest companies. The index compares the proportion of male and female executive and supervisory board members and the distribution of pay on these boards.
Corporate values: performance, trust, openness, and speed
Code of Conduct www.evonik.com/coc
Global Social Policy www.evonik.com/gsp
Our Values for the Environment, Safety, Health and Quality (ESHQ) www.evonik.com/esh
Executive Board Policy Statement on Human Rights
www.evonik.com/policy-statement
WHAT WE STAND FOR
a Number of training candidates with a valid certificate relative to the total number of training candidates. | b Reporting extended to include all organizational units that conduct internal investigations; in 2017 the figure only referred to functions bundled in the House of Compliance. | c In some cases, more than one measure was taken as a result of an investigation. | d Refers to the top two management levels below the executive board at Evonik Industries AG.
77 % Code of conduct
74 %Antitrust
law
83 % Fighting
corruption
90internal
investigationsb
(2017: 27)
106measures takenc
(2017: 12)
TRAINING RATESa
SDG of relevance for Evonik
25 % executive
board
27 % first
management level
20 % second
management level
FEMALE MANAGERS d
13 male 7 female (35%)
SUPERVISORY BOARD20 members, 10 employee
representatives and 10 shareholder representatives
Page Topic | GRI indicators26 Voluntary commitments | 102-12, 102-13, 102-1627 Human rights | 406-1, 407-1, 408-1, 409-1, 103-228 Corporate governance | 102-18, 102-19, 102-20, 102-21, 102-22, 102-23, 102-27, 102-28, 102-35, 102-36, 102-17, 405-129 Compliance | 102-11, 102-33, 102-34, 102-17, 307-1, 103-2, 407-1, 410-1, 205-1, 205-2, 205-3, 206-1, 419-134 Opportunities and risks | 102-15, 102-29, 102-30, 201-234 Donations and sponsorship | 415-1
25ANNEX
Governance and compliance
SUSTAINABILITY IN 2018

Our philosophy
We are convinced that reliable and responsible management of the company is the basis for our long-term business success and acceptance by society. As well as complying with the law, that includes internal regulations and binding voluntary com-mitments that go beyond the minimum legal requirements.
Evonik has extensive governance and compliance activities and has established management systems to document com-pliance with the law. We are continuously refining these tools.
Respecting human rights in business activities is an integral part of good corporate governance and fair competition. Being a global company, we are particularly exposed to a risk of human rights violations. We are aware of the importance of this issue for us and our stakeholders.
The importance of responsible corporate management and respect for human rights is also reflected in the SDGs that are relevant to us.
Voluntary commitments
Evonik is committed to observing internationally recognized standards and its own more far-reaching guidelines and principles of conduct.1
The starting point for responsible corporate management at Evonik is our code of conduct, together with our global social policy, and our environment, safety, health, and quality (ESHQ) values. In addition, the executive board has adopted a policy statement on human rights. Human rights are included in the updated code of conduct that came into effect in spring 2017.
In our global social policy, we set out the principles of social responsibility for our employees.
As a member of the UN Global Compact, we have given an undertaking that, within our sphere of influence, we will respect and promote labor rights and human rights, avoid discrimination, protect people and the environment, and fight against corruption. In addition, we want to make a contribution to achieving the United Nations’ 17 Sustainable Development Goals (SDGs). We have therefore identified the SDGs that are most relevant for us; see chapter “Strategy and growth.”
1 http://evonik.com/responsibility
Voluntary commitments C11
a See glossary for further information.
Inte
rnal
Exte
rnal
a
Chemie3
econsense—Forum for
SustainableDevelopment
of GermanBusiness
Global Reporting Initiative
ILO—International
LabourStandards
Responsible Care
OECD Guidelinesfor Multinational
Enterprises
Together for Sustainability
Code ofResponsibleConduct for
Business
UN Global Compact
WBCSDLow CarbonTechnologyPartnerships
Initiative
World Business Council for Sustainable
Development(WBCSD)
Our Valuesfor the
Environment,Safety, Health
and Quality
Code ofConduct for
Evonik’semployees
Code ofConduct for
Suppliers
PolicyStatementon Human
Rights
Global Social Policy
26 SUSTAINABILITY REPORT 2018 EVONIK INDUSTRIES
Evonik is committed to the Code of Responsible Conduct for Business, which includes fair competition, social partnership, the merit principle, and sustainability.
As a signatory to the chemical industry’s Responsible Care® Global Charter, we have an obligation to continuously improve our performance in health protection, environmental protection, product stewardship, and safety. Our ESHQ values define protecting people and the environment as core elements of our actions. Together with more detailed policies and procedures, they form Evonik’s ESHQ regulations.
For information on our code of conduct for suppliers and our activities as a founding member of the chemical industry’s Together for Sustainability initiative, see chapter “Value chain and products.”
Evonik is involved in many national and international com-petency networks in the area of sustainability. These include
econsense, an association of leading German companies that operate in the global arena, and Chemie³, the sustainability initiative of the German chemical industry. Evonik is also a member of the World Business Council for Sustainable Development (WBCSD) and is committed to its Vision 2050. We regularly report our climate and water performance to CDP.
Our sustainability reporting complies with the Global Reporting Initiative (GRI) and we are a member of GRI Community.
Human rights
Evonik looks at human rights at all stages in the value chain, including suppliers, its own processes, and customer applica-tions. Our actions are based on the code of conduct for Evonik employees, our global social policy, and the executive board’s policy statement on human rights. In addition, we are committed to the principles of the Global Compact.
The demands made on our suppliers are set out in a separate code of conduct. We regularly check compliance through our supplier validation and evaluation processes; see chapter “Value chain and products.”
In fall 2017, we introduced a new whistleblower system to supplement our established system for reporting compliance violations. This is operated by an independent third party on behalf of Evonik and guarantees the anonymity of the whistleblower. It enables employees and third parties (e.g., local residents, suppliers, customers) to report suspected breaches of human rights. The Corporate Responsibility division examines all allegations. No suspected breaches of human rights were reported in 2018.
In the year under review, we continued to develop our human rights risk map, which is used to compile and evaluate potential human rights risks such as child labor, modern slavery, and non-signature of the ILO International Labour Standards. Building on this, we designed, developed, and conducted training on human rights. More than ten human rights training courses were held for employees from Germany, Brazil, and India. The courses give participants a
basic overview of human rights, present the relevant Evonik regulations, and show how they relate to the applicable human rights and labor rights.
Further human rights training courses are planned for spring 2019.
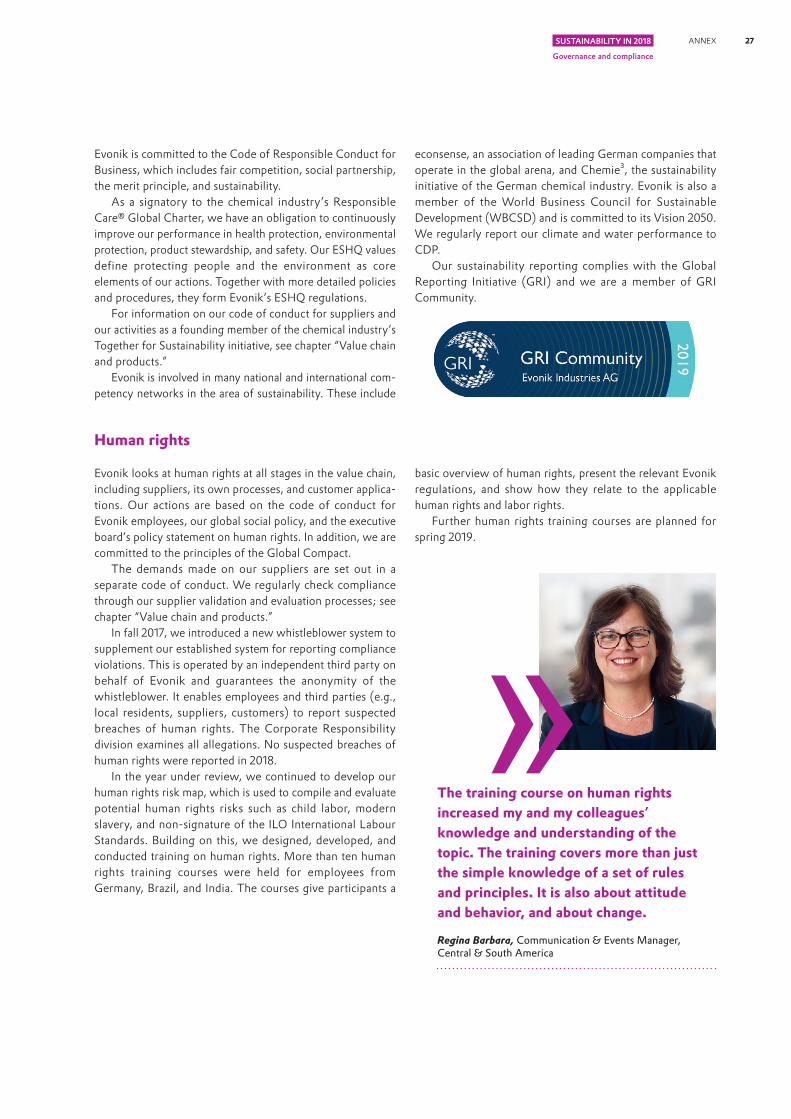
The training course on human rights increased my and my colleagues’ knowledge and understanding of the topic. The training covers more than just the simple knowledge of a set of rules and principles. It is also about attitude and behavior, and about change.
Regina Barbara, Communication & Events Manager, Central & South America
27ANNEX
Governance and compliance
SUSTAINABILITY IN 2018
DiscriminationOur code of conduct and global social policy forbid discrimi-nation on the basis of origin, race, religion, age, gender, sexual orientation, and disability. Employees who feel they have been discriminated against have a right to lodge a complaint. Contacts for reporting cases of discrimination are available at all sites.
Information on complaints procedures is available to all employees via internal media and personal discussions in all
regions. We have introduced additional measures and activities to prevent discrimination. These reach over 90 percent of our workforce. Twelve cases of discrimination were reported to us in 2018. In each case, action was taken to clarify and remedy the situation. Five of these cases are no longer active. The remainder will be pursued until they have been clarified or remedied.
Corporate governance
As a specialty chemicals company with a presence through-out the world, good corporate governance with a focus on sustainability is essential to Evonik. The executive board and supervisory board are explicitly committed to responsible corporate governance and identify with the goals of the German Corporate Governance Code. Respecting and apply-ing the principles of corporate governance are important management tasks.
These principles relate mainly to collaboration within the executive board and supervisory board and between these two boards. They also include the relationship between Evonik and its shareholders and other people and organizations that have a business relationship with the company.
As provided for by the foreword to the German Corpo-rate Governance Code, Evonik reserves the right not to implement certain provisions if departure from the recom-mendations is justified. The latest declaration of conformity with the requirements of the German Corporate Governance Code has been published on our website.1 According to the declaration of conformity as of December 2018, there are only two deviations from the Corporate Governance Code. These relate to transmission of the annual shareholders’ meeting via modern communication media and the ability to contact voting proxies during the annual shareholders’ meeting. The reasons for both exceptions are primarily organizational.
Executive boardThe executive board of Evonik Industries AG is responsible for running the company in the company’s interests, taking into account the interests of the shareholders, employees, and other stakeholders. For details of the executive board’s overall responsibility for sustainability, see chapter “Strategy and growth.” The executive board discusses sustainability at its meetings several times a year, especially aspects relating to the environment, safety, and society.
When making appointments to the executive board, the supervisory board considers both the professional qualifications of the candidates and the other criteria it has defined for the executive board as part of the diversity concept. These include, for example, a suitable mixture of ages, professional compe-tencies, and fulfillment of the targets for the proportion of women on the executive board.
Percentage of women on the executive board and in managementFor the period from July 1, 2017 to June 30, 2022, the super-visory board has raised the target for the proportion of women on the executive board from 20 percent to 25 percent. At present, one member of the executive board is female and three are male, so it meets this target.
For the period from January 1, 2017 to December 31, 2019, the executive board has set a target of 20 percent female managers for each of the first two management levels below the executive board. The proportion of female managers is currently 27.3 percent at the first management level (2017: 25.0 percent) and 20.0 percent at the second management level (2017: 15.4 percent).
Supervisory boardThe supervisory board advises and supervises the executive board. It appoints the members of the executive board and names one member as the chairperson of the executive board. It also decides on the remuneration of the members of the executive board. The supervisory board examines the com-pany’s annual financial statements, the executive board’s proposal for the distribution of the profit, the consolidated financial statements for the Evonik Group, and the combined management report. The executive board is required to obtain the approval of the supervisory board on decisions of funda-mental importance, which are defined in a separate list. The supervisory board has the following committees: an executive committee, an audit committee, a finance and investment committee, a nomination committee, and the mediation com-mittee required by the German Codetermination Act. The newly established innovation and research committee took up its work in 2018. This committee has an equal number of employer and employee representatives. Its role is to examine trends in the chemical industry and topics of relevance for Evonik and to work with the executive board to align Evonik’s innovation and research activities accordingly.
The executive board provides regular, timely, and extensive information for the supervisory board on all matters of rele-vance for the company. Major sustainability aspects are included in context. On this basis, Evonik’s sustainability activities are also discussed at meetings of the supervisory board. For exam-ple, the executive board’s report to the supervisory board meeting in June 2018 included current sustainability issues.1 www.evonik.com/investorrelations
28 SUSTAINABILITY REPORT 2018 EVONIK INDUSTRIES

Composition of the supervisory boardIn accordance with the provisions of the German Codetermi-nation Act, the supervisory board comprises twenty members, ten of whom are representatives of the shareholders while ten are representatives of the workforce.
A minimum quota of 30 percent women is set by law. The supervisory board continued to meet this requirement after the elections held in May 2018 as it currently comprises seven women and thirteen men. Women therefore make up 35 per-cent of the total. The supervisory board takes diversity into account, both in its own composition and in appointments to the executive board. The supervisory board’s diversity concept includes rules on the independence and age of supervisory board members and their maximum term of office. Supple-mentary criteria apply for the profile of skills and expertise of the supervisory board as a whole. These relate to the necessary knowledge and abilities of the members of the supervisory board, for example, international experience, a knowledge of business administration and science, and experience in man-aging a company.
You can find further information on corporate governance in the corporate governance report and declaration on corporate governance, which is available on our website and also forms part of Evonik’s financial report.
Performance-oriented remuneration of senior managementThe supervisory board is responsible for the employment contracts with the members of the executive board. It sets the total remuneration package for each member of the executive board, comprising a basic salary, variable short- and long-term components, pension benefits, the reimbursement of expenses, insurance, and various other fringe benefits. The con-tracts with members of the executive board and all executives include remuneration elements based on personal performance and the overall performance of the Group. As one of our sig-nificant sustainability topics, occupational safety (accident frequency and severity) influences the remuneration of the executive board. The remuneration report in the financial report 2018 contains further information on the remuneration of the executive board and supervisory board.
Compliance
Every employee is required to observe compliance rules and the applicable laws and internal regulations. This strengthens the trust of business partners, shareholders, and the general public in Evonik and its employees. The main compliance rules are set out in our code of conduct.
House of ComplianceThe compliance areas of specific relevance to Evonik are bun-dled in a House of Compliance. The principal focus in recent years was on our code of conduct, fighting corruption, and
antitrust law. The scope and intensity of our compliance measures are derived from specific risk analyses carried out at our operating units. Activities mainly comprise training, raising awareness, and systematic investigation of allegations of compliance violations.
Functional responsibility for the environment, safety, health, and quality are bundled in a corporate division with the same name; see chapter “The environment.”
House of Compliance C12
Executive Board
Compliance Committee
Ant
itrus
t
Figh
ting
Corr
uptio
n,
Mon
ey L
aund
erin
g
and
Frau
d
Cod
e of
Con
duct
Fore
ign
Trad
ean
d C
usto
ms L
aw
Cap
ital M
arke
t Law
Dat
a Pr
otec
tion
Taxe
s
Hum
an R
esou
rces
Cor
pora
te A
udit
Chief Compliance OfficerHead of
DataProtection
Head ofTaxes
Head ofHR
Head of Corporate
Audita
Compliance Management System
a Advisory function.
29ANNEX
Governance and compliance
SUSTAINABILITY IN 2018

Minimum group-wide standards have been defined for the compliance management systems for the areas covered by the House of Compliance and we ensure that they are imple-mented. Final responsibility rests with the executive board, which defines the key elements of the compliance manage-ment system and ensures that it is observed. The supervisory board’s audit committee monitors the effectiveness of the system.
The process of forming a consensus, sharing experience, and coordinating compliance activities takes place in the com-pliance committee, which is composed of the heads of the respective units, who have independent responsibility for their areas, and the head of the Corporate Audit division.
Corporate Audit supports the executive board and sub-sequent management levels in the performance of their supervisory duties and continuous improvement of business
processes by performing independent audits. A key focus is auditing the internal control system and the risk management system.
Compliance management systemThe compliance management system is based on the values and targets adopted by the executive board. The main aim of the compliance management system is to avoid, or at least minimize, actual violations and the associated risks. The objective is to identify violations and impose sanctions based on their severity. The relevant compliance organizations ensure that the compliance management system is appropriate for the risks and is effective.
Principle of preventionTools used to avoid potential compliance risks include risk analysis, training, raising awareness, and providing advice.
Risk analysisTo identify potential risks as early as possible, every unit is required to perform regular risk analyses. These take up the relevant rules and voluntary commitments entered into by Evonik that affect their area of operation and ensure timely identification and implementation of any changes. Based on the results of this risk analysis, each organizational unit issues binding standards and processes for the precautions to be taken with regard to business activities where there are specific compliance risks.
TrainingGroup-wide training concepts have been developed for all aspects bundled in the House of Compliance. They define the type, frequency, and content of training and the target groups. Each organizational unit is responsible for their realization. We pay special attention to training in the areas of antitrust law,
fighting corruption, and our code of conduct. Participants are allocated to three groups on the basis of risk. For example, all employees with contact to competitors are assigned to the highest risk category in the area of antitrust law, while customer service employees are allocated to the medium level. They receive training every two or three years, depending on the risk category, with training alternating between face-to-face and online sessions. Completion of these training sessions is documented via an electronic system.
Awareness and adviceEvery organizational unit is responsible for raising its employ-ees’ awareness of the importance and scope of the rules on each compliance issue. In this way, advice and support can be provided as close as possible to specific functions. Moreover, this allows timely identification and evaluation of risks.
Compliance Management System (CMS) C13
Responsibility of Management
Con
tinuo
us Im
prov
emen
t
Ade
quac
y, E
ffec
tiven
ess
Values and Objectives
Prevention Detection Response
Compliance Reporting
• Whistleblower System• Investigations• Monitoring & Audits
• Corrective Measures• Sanctions• Lessons learned
• Risk Analysis• Standards• Processes• Training• Sensitization/Communication• Advice & Support
Compliance Organization
30 SUSTAINABILITY REPORT 2018 EVONIK INDUSTRIES
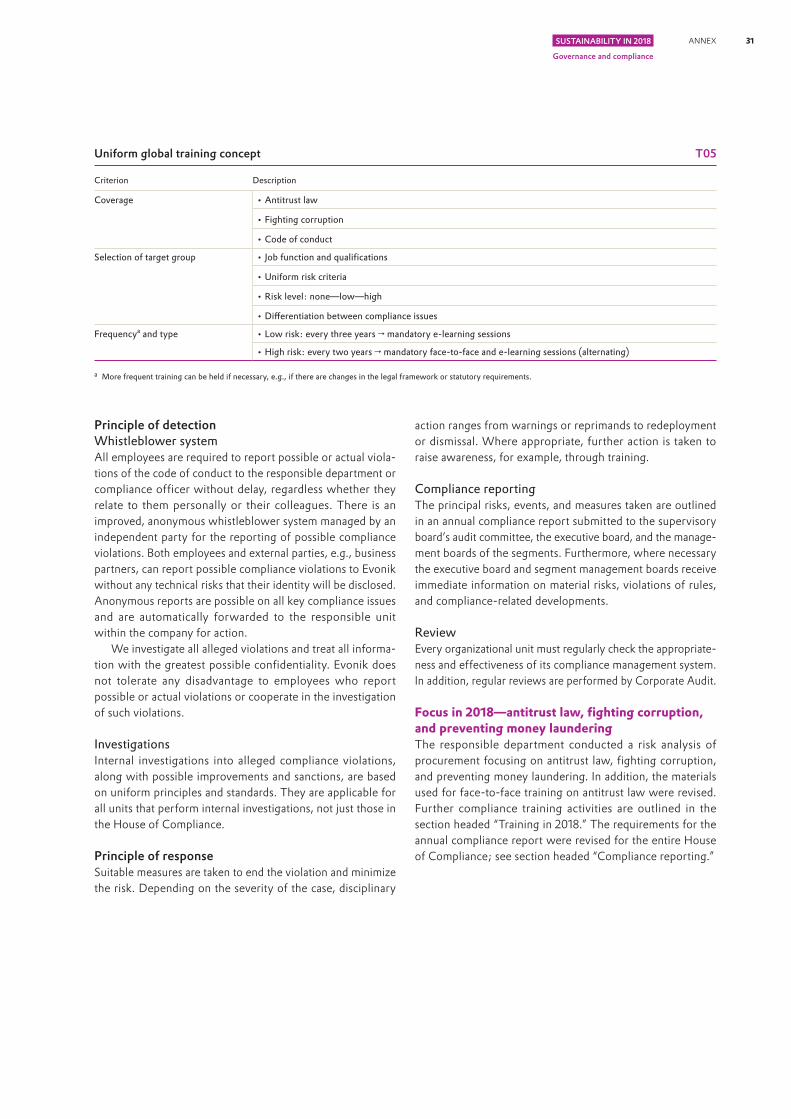
Uniform global training concept T05
Criterion Description
Coverage • Antitrust law
• Fighting corruption
• Code of conduct
Selection of target group • Job function and qualifications
• Uniform risk criteria
• Risk level: none—low—high
• Differentiation between compliance issues
Frequencya and type • Low risk: every three years → mandatory e-learning sessions
• High risk: every two years → mandatory face-to-face and e-learning sessions (alternating)
a More frequent training can be held if necessary, e.g., if there are changes in the legal framework or statutory requirements.
Principle of detectionWhistleblower systemAll employees are required to report possible or actual viola-tions of the code of conduct to the responsible department or compliance officer without delay, regardless whether they relate to them personally or their colleagues. There is an improved, anonymous whistleblower system managed by an independent party for the reporting of possible compliance violations. Both employees and external parties, e.g., business partners, can report possible compliance violations to Evonik without any technical risks that their identity will be disclosed. Anonymous reports are possible on all key compliance issues and are automatically forwarded to the responsible unit within the company for action.
We investigate all alleged violations and treat all informa-tion with the greatest possible confidentiality. Evonik does not tolerate any disadvantage to employees who report possible or actual violations or cooperate in the investigation of such violations.
InvestigationsInternal investigations into alleged compliance violations, along with possible improvements and sanctions, are based on uniform principles and standards. They are applicable for all units that perform internal investigations, not just those in the House of Compliance.
Principle of responseSuitable measures are taken to end the violation and minimize the risk. Depending on the severity of the case, disciplinary
action ranges from warnings or reprimands to redeployment or dismissal. Where appropriate, further action is taken to raise awareness, for example, through training.
Compliance reportingThe principal risks, events, and measures taken are outlined in an annual compliance report submitted to the supervisory board’s audit committee, the executive board, and the manage-ment boards of the segments. Furthermore, where necessary the executive board and segment management boards receive immediate information on material risks, violations of rules, and compliance-related developments.
Review Every organizational unit must regularly check the appropriate-ness and effectiveness of its compliance management system. In addition, regular reviews are performed by Corporate Audit.
Focus in 2018—antitrust law, fighting corruption, and preventing money launderingThe responsible department conducted a risk analysis of procurement focusing on antitrust law, fighting corruption, and preventing money laundering. In addition, the materials used for face-to-face training on antitrust law were revised. Further compliance training activities are outlined in the section headed “Training in 2018.” The requirements for the annual compliance report were revised for the entire House of Compliance; see section headed “Compliance reporting.”
31ANNEX
Governance and compliance
SUSTAINABILITY IN 2018

Training in 2018Since 2017, Evonik has reported a training rate for antitrust law, fighting corruption, and the code of conduct, i.e., the number of training candidates with a valid certificate as a proportion of total training candidates. The data refer to both face-to-face training and e-learning.
To improve group-wide participation in face-to-face and e-learning training sessions, an extensive concept to deal with employees who fail to take part in training has been implemented. In addition, in the year under review we rolled out a new e-learning training course for the code of conduct in 20 languages.
Compliance rules for business partnersEvonik has issued a special code of conduct for suppliers, setting out binding requirements, see chapter “Value chain and prod-ucts.”
Intermediaries, above all sales intermediaries, are subject to a compliance check before the establishment of the business relationship and every five years thereafter. They also have to sign a compliance declaration.
Risk-based compliance checks (due diligence) and any necessary measures are also applied to business partners involved in acquisitions, joint ventures, corporate venture projects, and major investment projects. These are based on uniform rules for the Evonik Group.
Compliance training and training ratea T06
Antitrust law Fighting corruption Code of conduct
Training candidates,
totalTraining rate
in %
Training candidates,
totalTraining rate
in %
Training candidates,
totalTraining rate
in %
Worldwide 4,497 74 11,445 83 30,984 77
Management functions 2,893 70 6,790 76 7,769 73
Management circle 1b 127 85 177 50 177 49
Management circle 2c 338 87 561 63 568 61
Management circle 3d 2,428 67 6,052 78 7,024 75
Non-management functions 1,604 80 4,655 92 23,215 78
Functions
Production & Technology 142 77 3,244 87 12,912 75
Innovation Management 633 77 1,751 90 4,846 86
Marketing & Sales 2,704 72 2,485 74 2,904 71
Administrative functions 1,018 75 3,965 81 8,870 78
Other functionse 0 0 0 0 1,452 67
Regions
Asia-Pacific North (APN) 695 87 1,274 91 2,355 75
Asia-Pacific South (APS) 327 45 668 91 1,437 72
Middle East & Africa (MEA) 86 44 101 78 155 57
North America (NAM) 782 66 1,877 83 4,803 70
Eastern Europe (EEU) 122 60 174 76 298 50
Western Europe (EUW) 2,311 79 7,083 80 21,254 80
of which Germany 2,087 86 6,719 81 20,144 82
Central & South America (CSA) 174 63 268 80 681 49
a The training rate is defined as the number of training candidates with a valid certificate relative to the total number of training candidates on December 31, 2018. All training reported in the system is included.
b Management circle 1 = executive functions, i.e., senior management functions in the Evonik Group.c Management circle 2 = senior management functions, i.e., key functions in the segments, regions, service units, and corporate divisions.d Management circle 3 = further management functions.e Other functions = apprentices, apprentices outside Germany, non-permanent staff.
32 SUSTAINABILITY REPORT 2018 EVONIK INDUSTRIES

Internal investigations in 2018Group-wide, 90 internal investigations into suspected viola-tions of compliance rules were conducted in 2018. As a result of these internal investigations, 106 disciplinary measures were taken: seven employees were dismissed, 19 warnings/reprimands were issued, and one employee was transferred to a different position. In twelve cases, training or other action to enhance awareness was undertaken. Security consulting was provided in 14 cases, the return or deletion of data was demanded in nine cases, and criminal or civil proceedings were initiated in seven cases. Various individual measures were taken in 37 other cases.
The increase in the number of investigations and measures taken compared with previous years was due to the fact that the scope of reporting was extended to cover all internal investigations in the Evonik Group. Until 2017, data was only reported for the units in the House of Compliance. The reporting now also includes the IT Security, ESHQ, Group Security, and Corporate Responsibility units.
Internal investigations in 2018 T07
2016 2017 2018
Reported potential compliance violations 33 27 90
Disciplinary measures taken 17 12 106a
of which
Termination of employment contract 4 6 7
Warning or reprimand 6 1 19
Redeployment 1 1 1
Awareness-raising/ training 6 4 12
Security consulting – – 14
Return/deletion of data – – 9
Civil/criminal proceedings – – 7
Other b – – 37
a In some cases, more than one measure was taken in connection with an investigation.b Various individual measures, e.g., termination of collaboration with a service pro-
vider or termination of a contract.
Fines and other sanctionsIn 2018, the annual compliance reporting for all units included in the House of Compliance was supplemented by a structured survey to identify significant fines and non-monetary sanctions resulting from failure to comply with laws or regulations. No fines or sanctions of this type were imposed on Evonik in the areas included in the House of Compliance.
Legal proceedings resulting from anti-competitive conduct or the formation of cartels and monopolies Following a fine imposed by the EU Commission in 2002 on
various methionine producers (including Evonik), in 2012 the Brazilian antitrust authorities filed proceedings against Evonik in connection with the delivery of methionine to Brazil in the period prior to 2000. In our opinion, a fine cannot be imposed due to the statute of limitations.
In one foreign country, a case has been brought against Evonik by a former dealer for compensation for alleged damage by a former cartel, which was ended in 2004. The proceedings are currently inactive.
In Germany, a claim for damages resulting from a cartel has been filed against the parties involved in the European hydrogen peroxide cartel, which was ended in 2001. Since Evonik concluded a settlement with the plaintiff years ago, it is not a defendant and is merely a party cited in the case.
Confirmed incidents of corruption and action takenThere were no confirmed incidents or related measures in 2018.
Cyber securityThe protection of data and information systems at Evonik is based on the international information security management system ISO 27001. We aim to obtain validation of conformance with this standard. There are binding policies and rules on IT security for the entire Evonik Group. We are driving forward and monitoring implementation of security measures for the operation and use of office IT with the aid of an internal control system. That ensures we keep a constant eye on the present threats and align our security measures to them.
To identify and counter cyber attacks, Evonik constantly invests in technical and organizational measures as part of a special cyber security enforcement program. In 2018, we also set up our own cyber security operation center. We carry out penetration tests in order to check and steadily improve the security of IT systems.
Evonik regularly trains employees and provides timely infor-mation in the intranet on the latest incidents. In addition, we use face-to-face training to raise the awareness of our senior executives on how to handle information that is strictly confidential. Our company is insured against cyber attacks. The insurance covers business interruption risks, breaches of data protection, and the cost of recovering data.
Evonik is a member of various professional cyber security associations and working groups.
We have started to develop our own information security rules for IT in production (operational technology). Further details will be provided in the future.
33ANNEX
Governance and compliance
SUSTAINABILITY IN 2018

Management of data protectionIncreasing global data sharing at Evonik requires additional technical and organizational security measures. These are monitored continuously. Target group-specific data protec-tion training of employees is mandatory. Information on the relevant requirements and responsibilities is available to all employees on the Evonik intranet. The organization of data protection and rules on reliable processing of personal data,
including customer data, are set out, among other things, in the compliance policy and the group-wide data protection policy. The aim of data protection management at Evonik is to ensure compliance with the regulations, support the orga-nizational units in implementing them, and monitor the correct use of software in the processing of personal data. In 2018, Evonik did not receive any complaints relating to the loss or incorrect protection of customer data.
Opportunities and risks
As a specialty chemicals company with a presence throughout the world, Evonik is exposed to a range of influences that may constitute either opportunities or risks. Timely identifi-cation and mitigation of risks is therefore the basis of our extensive risk and opportunity and risk management.
Since 2017, non-financial risks have been integrated more closely into our conventional risk reporting. Our established risk management system now systematically captures and
monitors non-quantifiable sustainability risks over a longer time horizon. All units are required to update their risk reports, including sustainability risks, every quarter and to report any ad-hoc risks immediately outside the regular reporting intervals.
Further information can be found in the opportunity and risk report in the financial report 2018.
Donations and sponsorship
The executive board defines the aims and conditions for Evonik’s donations and sponsorship. It has delegated coordi-nation and monitoring to the Board Office/Communications division on the basis of specific policies and guidelines. For example, individual donations of supra-regional significance and sponsorship from a threshold of € 100,000 require the approval of the executive board. The segments and regions can decide on regional and site-specific activities within an annual budget approved by the executive board. At the Evonik Foundation, the management is responsible for coordinating and supervising donations. The executive board of the Evonik Foundation defines the areas of focus.
Evonik made many donations and was involved in many sponsorship projects in 2018; see chapter “Society.” These included donations totaling € 200,000 to political parties in Germany. Of this amount, € 80,000 was donated to the CDU/CSU, € 80,000 to the SPD, € 20,000 to Bündnis 90/Die Grünen, and € 20,000 to the FDP.
In 2018, Evonik renewed and refined its entry in the Transparency Register, the list of lobbyists maintained jointly by the European Commission and European Parliament.
TARGET ATTAINMENT IN 2018 Proportion of female executive board members:
25 percent up to June 30, 2022: 25 percent female executive board members since July 1, 2017.
Women at the first and second management levels below the executive board: 20 percent at each level: first management level 27.3 percent; second management level 20.0 percent.
Implement the defined antitrust and anti-money laundering measures: The antitrust and anti-money laundering risk analysis has been completed. The measures defined in consultation with the responsible managers to minimize risks were implemented as planned.
Review and revise group-wide regulations on gifts and hospitality: A concept to develop internal regulations on gifts and hospitality was drawn up in consultation with the regional compliance officers. In particular, a revised framework for the regulations was defined at Group level and in the regions.
TARGETS FOR 2019 AND BEYOND Proportion of female executive board members:
25 percent up to June 30, 2022.
Women at the first and second management levels below the executive board: 20 percent at each level by year-end 2019.
Structure and implement the revised internal regulations on gifts and hospitality.
Introduce uniform group-wide standards on monitoring business partners.
Update the rules on internal investigations.
Target achieved Target partially achieved or target horizon extends beyond 2018 Target not achieved
The whistleblower system enables employees and third parties around the world to alert us anonymously to potential compliance violations. That means we can take prompt counteraction to avoid damage to our company, our employees, and our business partners.
Christine Heykena, Lawyer, Corporate Legal & Compliance
34 SUSTAINABILITY REPORT 2018 EVONIK INDUSTRIES

Evonik made many donations and was involved in many sponsorship projects in 2018; see chapter “Society.” These included donations totaling € 200,000 to political parties in Germany. Of this amount, € 80,000 was donated to the CDU/CSU, € 80,000 to the SPD, € 20,000 to Bündnis 90/Die Grünen, and € 20,000 to the FDP.
In 2018, Evonik renewed and refined its entry in the Transparency Register, the list of lobbyists maintained jointly by the European Commission and European Parliament.
TARGET ATTAINMENT IN 2018 Proportion of female executive board members:
25 percent up to June 30, 2022: 25 percent female executive board members since July 1, 2017.
Women at the first and second management levels below the executive board: 20 percent at each level: first management level 27.3 percent; second management level 20.0 percent.
Implement the defined antitrust and anti-money laundering measures: The antitrust and anti-money laundering risk analysis has been completed. The measures defined in consultation with the responsible managers to minimize risks were implemented as planned.
Review and revise group-wide regulations on gifts and hospitality: A concept to develop internal regulations on gifts and hospitality was drawn up in consultation with the regional compliance officers. In particular, a revised framework for the regulations was defined at Group level and in the regions.
TARGETS FOR 2019 AND BEYOND Proportion of female executive board members:
25 percent up to June 30, 2022.
Women at the first and second management levels below the executive board: 20 percent at each level by year-end 2019.
Structure and implement the revised internal regulations on gifts and hospitality.
Introduce uniform group-wide standards on monitoring business partners.
Update the rules on internal investigations.
Target achieved Target partially achieved or target horizon extends beyond 2018 Target not achieved
35ANNEX
Governance and compliance
SUSTAINABILITY IN 2018

a Introduction of the global development portal (GDP) and the Learning and Individualized Library (LILY). | b Employees leaving within a year of being hired. | c Figure for Germany.
TRAINING
Official opening of the new childcare facility at Evonik’s site in Marl in August 2018.
EMPLOYEES
Participation rate in employee survey
85.2 %
14.7 yearsaverage length of service
0.9 %early turnover b
Number of employees
36,043
SDG of relevance for Evonik
DIVERSITY
24.9 % women group-wide
28 %of new hires are female
104nationalities
42 %international managers
€17 million
Continuing professional development
New learning strategy
implemented
Digital learninga
Page Topic | GRI indicators37 HR organization and management | 102-1937 Leadership | 404-238 Appeal as an employer | 102-36, 102-37, 102-41, 202-2, 401-2, 404-1, 405-240 Diversity and equal opportunity | 401-1, 401-2, 401-3, 405-142 Vocational training and continuing professional development | 404-2, 404-343 Health protection | 403-3, 403-446 Further facts and figures | 102-8, 401-1
EMPLOYEES
8 %employees with disabilities c
42 yearsaverage age
Vocational training
€63 million
99 %pass rate in vocational training
HEALTH PROTECTIONOccupational Health Performance Index
5.55.4
2018 2017 Long-term target ≥ 5.0
36 SUSTAINABILITY REPORT 2018 EVONIK INDUSTRIES

Our philosophy
Evonik wants to be a best-in-class specialty chemicals company. Therefore, appeal as employer, diversity and equal opportunity, and training/advanced training are very impor-tant to us. In view of the progressive digitalization of working processes, developing new forms of working is another focus of Evonik’s human resources work. The significance of digi-talization was upgraded in our materiality analysis in 2017 and we continued to drive forward our work on this topic in 2018. In addition, we give high priority to health protection and health promotion. To provide a full overview of all employee-
related issues, we have transferred this topic from our safety area of action to our employees area of action.
As part of our annual strategy process, we make sure that the continuous development of our personnel activities is in keeping with our materiality analysis and our human resources strategy, which is divided into the strategic drivers attract, develop, perform, retain, and lead. The key perfor-mance indicators used to measure our success in implementing these measures are the same as those we use to manage our global HR work.
HR organization and management
The Corporate Human Resources (HR) division bundles group- wide strategic management and coordination of personnel. The head of Corporate HR reports directly to the relevant member of the executive board, the chief human resources officer. The HR Executive Committee is the highest decision- making body for HR. It adopts the global HR strategy and takes decisions on the group-wide HR organization. It comprises the chief human resources officer, the industrial relations directors of the segments, and the heads of Corporate ESHQ, Corporate Responsibility, and Corporate Human Resources. The Global HR Committee supports the HR Executive Committee in defining the global HR strategy and takes further decisions on its implementation in the Evonik Group. The permanent members of the Global HR Committee are representatives of the HR departments in the segments, regions, corporate functions, and global service units.
Operational support comes from HR expert circles comprising specialists on specific issues. The development of corporate executives is allocated directly to the chairman of the execu-tive board.
Leadership—clear, consistent, cooperative
Our executives have a special responsibility to drive forward the cultural change within Evonik, on the basis of our new corporate values: performance, trust, openness, and speed. Following on from an executive conference held in August 2018, all senior executives are required to attend culture mindset workshops, where they develop a common under-standing of how these values should be lived in the company.
The Valley to Alley program enables executives to strengthen their business mindset by learning from organiza-tions that “work differently” and gaining inspiration, for example, from start-ups.
In addition, the Being Digital program was launched in 2018. Here, experienced executives work through future scenarios and possible solutions for Evonik to prepare our company for the challenges of the digital transformation.
Talent managementThe development of future senior executives is a structured process. Job rotation, evaluation of potential, and succession scenarios are discussed and analyzed in detail at regular personnel conferences attended by members of the executive board. Alongside ongoing development, for example through job rotation and project work, Evonik works with the Inter-national Institute for Management Development in Lausanne (Switzerland). Together, we run programs for various groups of talented employees. The focus is on content of direct relevance to the business and on day-to-day management requirements. We support the personal development of executives using formats that center on personal motivation, attitudes, and the assumption of social responsibility.
HR Executive Committee
Structure of Human Resources steering bodies C14
Global HR Committee
HR Expert Circles
37ANNEX
Employees
SUSTAINABILITY IN 2018

Digitalization of working processes
Flexibilization and individualization, digitalization and network-ing are bringing massive changes in how we work. In order to utilize the resultant opportunities, Evonik systematically taps into employees’ ideas and experience.
In 2018, further topics were added to our New Work Labs tool, which provide an opportunity to test new ways of working. A group of volunteers spends a defined period of time testing alternative forms of cooperation. Formats explored in this model cover working methods and conditions, career paths and job descriptions, leadership and organization, learning and competencies, and culture and values. When the lab phase ends, a decision is taken on whether the working model can be rolled out either group-wide or for specific parts of the Evonik organization.
People are at the heart of the digital transformation at Evonik. #HumanWork, which is part of Evonik Digital GmbH, pro-vides cross-unit support for the digitalization initiatives of our segments, regions, and service units, and for the New Work Lab. In addition, #HumanWork provides access to new working and learning formats such as the agile method, design thinking, and working out loud. It also promotes internal use of collab-orative tools such as IBM Connections and Microsoft Teams. #HumanWork uses targeted communication ranging from analog media to social networks to network both with employees and beyond the company. In this way, it helps our executives prepare for future corporate reality, where tradi-tional and agile organizational forms will work hand in hand.
Appeal as an employer
Innovative approaches to employer branding and recruitmentIn our employer branding campaign, #HumanChemistry, employees from various regions share their experience and perspectives of working at Evonik. A sharp rise in the number of visitors to our careers site shows that reaching out to the target groups in this way achieves a good response. Evonik received the Leading Employer 2018 award in Germany and is the best employer in the chemical sector. In the overall ranking of over 70,000 companies, Evonik is ranked 22nd. The current employer ranking by the Universum polling institute ranks Evonik as one of the three most attractive companies in the German chemical sector. In China, Evonik was once again included in the list of the most popular employers (Top Employer Institute) in 2018. Evonik was honored with the
German award for online communication for the digital com-munication performance of its #HumanChemistry employer branding campaign.
Employee satisfactionWe conducted our fifth Evonik-wide employee survey in November 2018. Around 35,000 employees were asked to anonymously share their views on their working environment. The survey comprised 53 strategic questions on topics of relevance for employees such as our company, team and collaboration, and innovation and customer focus. Employees were also invited to make comments. The participation rate was 85.2 percent, exceeding the participation rate in the previous survey in 2015 (83.9 percent).
It is important to provide specific examples of how business creates value through digitalization and how we get employees on board. Because focusing on people is essential if we want to become a best-in-class specialty chemicals company: #HumanWork.
Nils Gleim, Evonik Digital GmbH
102-43
38 SUSTAINABILITY REPORT 2018 EVONIK INDUSTRIES

Key indicators calculated using the employee survey are the commitment index, the leadership index, and the agility index. This time, a new method was used to calculate these indicators. In the past, the five-point scale used for answers to the survey was converted to a scale of 0–200 and the mean was taken as the indicator. In the employee survey 2018, by con-trast, the indicators are the mean of the percentage of the two positive reply options (“fully agree” and “agree”). On this basis the 2018 survey gives scores of 68 (commitment), 72 (leader-ship), and 71 (agility). Taking into account challenging projects such as examining all options for the ongoing development of our methacrylates business and further optimization of administrative units, the employee satisfaction scores are acceptable. At the same time, they show further scope for improvement. Following a detailed analysis of the results of the survey, we intend to work out specific measures in the first half of 2019.
Low turnover of newly hired employees in the past three years compared with other companies also indicates a good level of identification and high employee satisfaction. Looking at employees giving notice within the first year, we score very well compared with our competitors with a rate of 1.0 percent in the USA and 0.7 percent in Germany.
Employee turnover T08
2016 2017 2018
Early employee turnover in % 1.2 1.4 0.9
Total employee turnover in % 4.7 5.8 6.2
Length of service in years 14.9 14.6 14.7
Work-life balanceFrom talking to present and prospective employees, we are aware of the importance of combining working and private life. Evonik’s HR policy is family-friendly and geared to differ-ent phases in people’s lives. About 94 percent of our employees around the world have access to initiatives to help them com-bine their work and their private life. At the heart of this approach are flexible worktime models, along with support
for people caring for close relatives and assistance with child-care. In 2018, our site in Marl (Germany) opened a new child-care facility for employees’ children. Another berufundfamilie recertification audit was carried out by the Hertie Foundation in the year under review. In addition, Evonik was honored by the German parenting magazine ELTERN as one of the most family-friendly companies (issue 10/2018).
We have wide-ranging offers to foster the physical and mental fitness of our employees. In 2018, we introduced a new concept at all canteens at our German sites to encourage healthy eating. Worldwide, many of our sites offer a variety of sports activities.
Our generation pact was extended to actively address the challenges of demographic change. Take-up was once again high. This personnel policy tool enables people to retire far earlier while ensuring that we are still able to offer employment to qualified apprentices at the end of their training.
784 employees took parental leave in 2018. About 44 percent of employees on parental leave were male. In 2018, they took an average of 1.5 months parental leave, while female employees took an average of 6.5 months. Apart from a few exceptions, all employees who returned to work after parental leave in 2017 were still working for us a year later.
The regular, contractually defined working hours for approxi-mately 75 percent of our employees are based on collective agreements. We limit employees’ working hours to 48 hours a week, unless shorter working hours are applicable. 81 percent of our employees benefit from annual vacation rules that exceed the statutory provisions in their country. Since there is no statutory ruling in the USA, the situation there is based on regional custom.
Some employees ask about the possibility of taking paid or unpaid leave for an extended period, for example, to ensure the compatibility of private and professional phases in their lives. However, interest is very low. In percentage terms it is in the low single-digit range, based on our total headcount.
Nearly 9 percent of employees Western Europe take up the option of working part-time to balance work and private life. By contrast, this option is hardly used in other regions because it has no social relevance there.
39ANNEX
Employees
SUSTAINABILITY IN 2018

Ability to take extended periods of leavea T09
in % Employees
Western Europe 95
Eastern Europe 90
Asia-Pacific North 100
Asia-Pacific South 59
Central & South America 100
North America 93
Middle East & Africa 65
a Option to take an extended period of paid or unpaid leave (more than three months).
Employee groupsWe work with staffing agencies in Germany to cover short-term or temporary bottlenecks. All agencies must provide evidence of a valid operating permit. If agency staff have been used for a job for more than six months, we examine whether it is a permanent job for which a permanent employee can be hired. Alongside appropriate remuneration, we make sure that agency staff are covered by the high social and safety standards applicable for our own staff. Since the chemical industry mainly requires highly qualified employees, fewer agency staff are used than in other sectors of manu-facturing industry. Evonik had around 700 agency staff in
Germany as of December 31, 2018. That was around 3 percent of our total workforce in Germany.
Employees by contractual status and gender T10
2018of which
female in %
Employees 36,043 24.9
of which employees on permanent contracts 32,543 24.4
of which employees on limited-term contracts 2,014 33.7
of which apprentices/trainees 1,486 a 24.0
a Including a proportion of apprentices abroad and apprentices with an Evonik contract who are being trained for third parties.
Employees by contractual status and region T11
in % Employees
of which employees
on permanent
contracts
of which employees
on limited-term
contracts
of which apprentices/
trainees
Evonik 36,043 32,543 2,014 1,486
Asia-Pacific North 3,675 2,477 1,198 0
Asia-Pacific South 1,846 1,785 61 0
Central & South America 678 663 3 12
Eastern Europe 569 540 24 5
Western Europe 24,340 22,152 725 1,463
Middle East & Africa 182 177 3 2
North America 4,753 4,749 0 4
Diversity and equal opportunity
Evonik does business in many markets worldwide. Diversity is therefore normal in our business activities. Employees with different backgrounds and personalities enrich our teams and our company. That makes diversity a key to Evonik’s eco-nomic success because it enhances our creativity, innovative capability, and proximity to customers.
Our diversity council ensures that diversity is a success factor that is deeply embedded in our organization and drives it forward through cross-business criteria. The council includes members of the executive board, the heads of the segments and regions, and executives from various organiza-tional units. Fostering diversity goes well beyond this group of individuals and is a central demand made on all manage-ment functions at Evonik. In 2018, we therefore anchored diversity in the annual process of setting objectives for our executives.
Our diversity strategy comprises three levers:
Measurability: The parameters we use to manage diversity often exceed the legal requirements. The executive board is informed quarterly of the development of key diversity indi-cators. It is important to us to ensures that the gender ratio and cultural mix are transparent across organizational levels.
Communication: We raise our employees’ awareness of the importance of diversity in our day-to-day work through our corporate media and inclusive activities.
Training: We train our executives and employees to deal with both conscious and unconscious bias. All Group execu-tives and selected talents have received training in this.
40 SUSTAINABILITY REPORT 2018 EVONIK INDUSTRIES

AgeIn 2018, the average age of Evonik employees was 42.0 years. Longer working lives and altered job requirements are start-ing to change the world of work. In line with this, we foster and stretch our employees in all phases of their working lives, for example, through our well@work initiative and the Learning and Individualized Library (LILY) online platform for lifelong learning.
GenderIncreasing the proportion of women in our company worldwide and at all levels is one of Evonik’s declared objectives.
Overall, the proportion of female employees in management functions increased from 16.6 percent in 2011 to 23.8 percent in 2018. When recruiting staff for management functions, we focus on academic disciplines of relevance to us.
An extensive range of measures supports us in the attainment of these targets. These include development activities, net-working events, mentoring, and support programs. Examples are special offerings to increase the compatibility of work and
family life and a new job-sharing platform. The offer is grad-uated so it is available to women at all management levels. We are starting to see initial positive effects, especially among younger age groups. The proportion of female employees in the under-40s age group is now nearly 30 percent.
To provide further social impetus, since 2018 Evonik has been part of the “Chefsache” gender equality initiative since 2018.1
Percentage of women in management T12
in % 2011 2017 2018
Executivesa 8.2 10.0 11.3
Executives and senior managementb 8.1 9.6 10.6
Managementc 17.8 24.6 25.1
All management functions 16.6 23.2 23.8
a Management circle 1.b Management circles 1 + 2.c Management circle 3.
Nationality As a global company, it is particularly important to us to ensure that our workforce includes a broad spectrum of dif-ferent nationalities. Evonik currently employs people of 104 different nationalities at 210 sites in more than 50 countries. The proportion of employees in management functions who come from countries other than Germany is stable at around 42 percent. Group-wide the proportion is 23.2 percent.
Integrating people with disabilitiesThe employment and inclusion of people with disabilities is an expression of how we embrace diversity. We focus on providing a working environment where every individual can use their personal strengths optimally for the development of themselves and the company. In 2018, employees with dis-abilities accounted for 7.9 percent of Evonik’s workforce in Germany.
Female Male
Age structure at Evonik C15
in %
Under 21 years
21– 30 years
31– 40 years
41– 50 years
51– 60 years
Over 60 years
2510 10 15 205 50
1 See https://initiative-chefsache.de
Indonesia’s national motto is “United in Diversity.” That means we all work towards the same goal even though we are different. That applies to Evonik too—diversity makes our colleagues more open to different ideas, perspectives, and change. That enables employees to grow beyond their personal boundaries so that together we can achieve our corporate objectives.
Venny Novriani, assistant to country head and managing director of Evonik Indonesia
41ANNEX
Employees
SUSTAINABILITY IN 2018
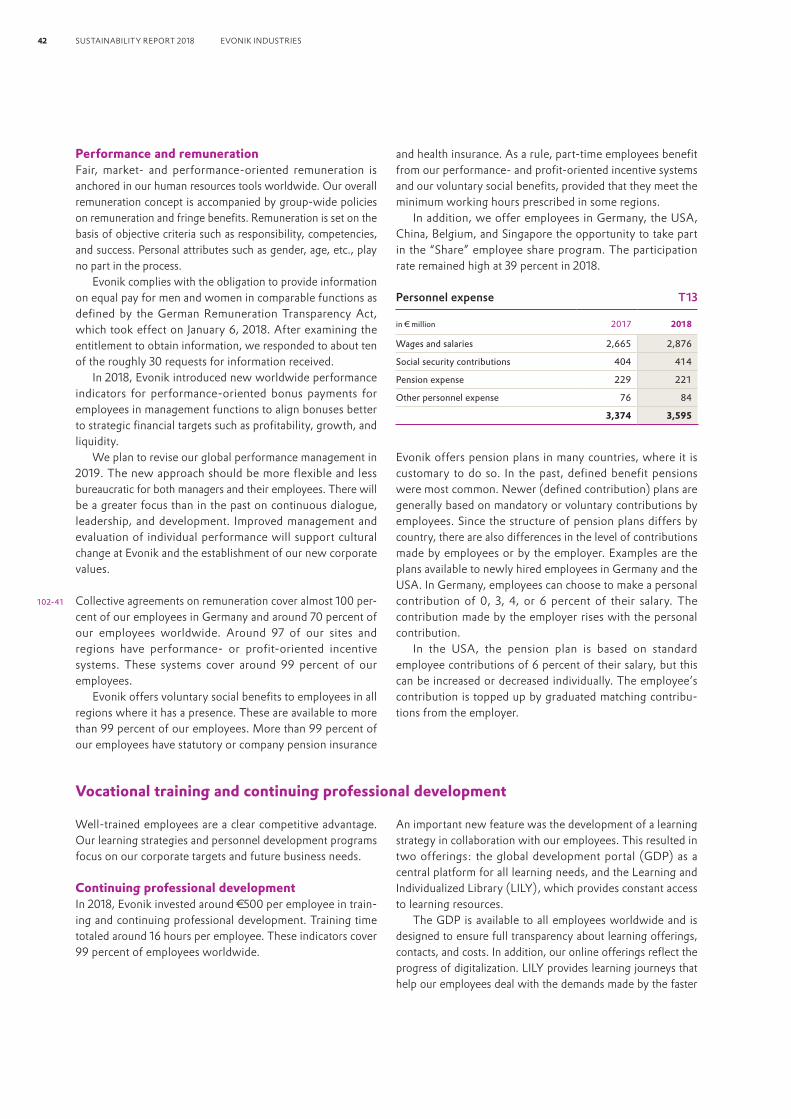
Performance and remunerationFair, market- and performance-oriented remuneration is anchored in our human resources tools worldwide. Our overall remuneration concept is accompanied by group-wide policies on remuneration and fringe benefits. Remuneration is set on the basis of objective criteria such as responsibility, competencies, and success. Personal attributes such as gender, age, etc., play no part in the process.
Evonik complies with the obligation to provide information on equal pay for men and women in comparable functions as defined by the German Remuneration Transparency Act, which took effect on January 6, 2018. After examining the entitlement to obtain information, we responded to about ten of the roughly 30 requests for information received.
In 2018, Evonik introduced new worldwide performance indicators for performance-oriented bonus payments for employees in management functions to align bonuses better to strategic financial targets such as profitability, growth, and liquidity.
We plan to revise our global performance management in 2019. The new approach should be more flexible and less bureaucratic for both managers and their employees. There will be a greater focus than in the past on continuous dialogue, leadership, and development. Improved management and evaluation of individual performance will support cultural change at Evonik and the establishment of our new corporate values.
Collective agreements on remuneration cover almost 100 per-cent of our employees in Germany and around 70 percent of our employees worldwide. Around 97 of our sites and regions have performance- or profit-oriented incentive systems. These systems cover around 99 percent of our employees.
Evonik offers voluntary social benefits to employees in all regions where it has a presence. These are available to more than 99 percent of our employees. More than 99 percent of our employees have statutory or company pension insurance
and health insurance. As a rule, part-time employees benefit from our performance- and profit-oriented incentive systems and our voluntary social benefits, provided that they meet the minimum working hours prescribed in some regions.
In addition, we offer employees in Germany, the USA, China, Belgium, and Singapore the opportunity to take part in the “Share” employee share program. The participation rate remained high at 39 percent in 2018.
Personnel expense T13
in € million 2017 2018
Wages and salaries 2,665 2,876
Social security contributions 404 414
Pension expense 229 221
Other personnel expense 76 84
3,374 3,595
Evonik offers pension plans in many countries, where it is customary to do so. In the past, defined benefit pensions were most common. Newer (defined contribution) plans are generally based on mandatory or voluntary contributions by employees. Since the structure of pension plans differs by country, there are also differences in the level of contributions made by employees or by the employer. Examples are the plans available to newly hired employees in Germany and the USA. In Germany, employees can choose to make a personal contribution of 0, 3, 4, or 6 percent of their salary. The contribution made by the employer rises with the personal contribution.
In the USA, the pension plan is based on standard employee contributions of 6 percent of their salary, but this can be increased or decreased individually. The employee’s contribution is topped up by graduated matching contribu-tions from the employer.
Vocational training and continuing professional development
Well-trained employees are a clear competitive advantage. Our learning strategies and personnel development programs focus on our corporate targets and future business needs.
Continuing professional developmentIn 2018, Evonik invested around €500 per employee in train-ing and continuing professional development. Training time totaled around 16 hours per employee. These indicators cover 99 percent of employees worldwide.
An important new feature was the development of a learning strategy in collaboration with our employees. This resulted in two offerings: the global development portal (GDP) as a central platform for all learning needs, and the Learning and Individualized Library (LILY), which provides constant access to learning resources.
The GDP is available to all employees worldwide and is designed to ensure full transparency about learning offerings, contacts, and costs. In addition, our online offerings reflect the progress of digitalization. LILY provides learning journeys that help our employees deal with the demands made by the faster
102-41
42 SUSTAINABILITY REPORT 2018 EVONIK INDUSTRIES

pace of work and by disruptive changes. Indicators of digital use that we keep a special eye on are page views and the total num-ber of users. In 2018, usage of the two portals was as follows:
• GDP: 28,469 page views (2,373 per month); average: 997 users per month
• LILY: 16,903 page views, 2,180 hours learning, 4,651 reg-istered learners/users
Vocational trainingIn 2018, Evonik trained around 1,800 young people in Germany, including about 400 on behalf of other companies. Our training covered more than 33 recognized vocational training courses and combined vocational training and study programs at 16 sites. In 2018, 90 places for young people who were not yet ready for an apprenticeship were taken up on the “Start in den Beruf” pre-apprenticeship program. That figure includes the
20/20/20 training initiative of the Evonik Foundation, which financed 40 places, including 20 for young refugees.
More than 530 new apprentices were given a digital start to their working life in the present academic year. Every apprentice received a tablet PC as a tool, giving them digital access to more than 10,000 exam questions and answers and hundreds of interactive learning media. In this way, we enable our future employees to engage in practice-based individual learning—anytime, anywhere, independently of the curriculum at their technical school.
Apprentices accounted for around 6.8 percent of our work-force in Germany, which is still well above the national average of around 5 percent. In all, we invested € 63 million in vocational training of employees. Our high commitment to vocational training is also reflected in their examination results. Over 99 percent of our apprentices passed their examinations and more than 9 percent received an overall grade of “very good.”
Health protection and promotion
Global management of health protection and promotion at Evonik takes a long-term, holistic approach, covering employees, the working situation, and the general working environment. This approach includes high-quality medical care where necessary, applying ergonomic and health-related
measures to structure working conditions, and a functioning emergency management system at plant level. In addition, we offer a selective range of health promotion measures, which are bundled in the Group-wide well@work initiative. In this way we help our employees adopt a healthy lifestyle.
TARGET ATTAINMENT 2018 Measure and increase employee satisfaction:
A global employee survey was conducted. Measures to increase employee satisfaction will be defined in 2019.
Drive forward global digitalization: This was implemented through New Work Labs and #HumanWork and will continue in the future.
Encourage greater diversity in the Evonik Group by increasing the number of female managers: The proportion of female employees in management functions increased from 16.6 percent in 2011 to 23.8 percent in 2018.
TARGETS FOR 2019 AND BEYOND Analyze the results of the global employee survey and
implement measures in all units.
Ongoing development of the global development strategy supported by modern learning tools.
Discuss and implement Evonik’s new corporate values worldwide.
Further support for diversity at Evonik:
• Increase the percentage of women in middle and senior management.
• Recruitment of women for management functions should reflect the gender distribution in relevant disciplines.
• Increase the proportion of international managers in middle management.
Target achieved Target partially achieved or target horizon extends beyond 2018 Target not achieved
43ANNEX
Employees
SUSTAINABILITY IN 2018

The main goals and aspects of our occupational health strat-egy are outlined in the Evonik Global Health Program. The cor porate policy “Occupational Health and Health Promotion” sets binding worldwide standards.
In Germany, issues relating to occupational safety and health protection have to be agreed with the employee repre-sentatives. On this basis, policies are worked out for the global workforce. In line with statutory requirements, at our German sites we have occupational safety committees that meet at least four times a year to discuss issues relating to occupational safety and the protection of health. These are composed of employee and employer representatives, safety specialists, safety officers, and occupational medicine specialists and cover more than 99 percent of our employees in Germany. There are also comparable bodies at sites outside Germany.
Fulfillment of the requirements is checked regularly by corporate audits and regional environment, safety, and health audits, and an extensive occupational health and reporting system. Action is taken if there are indications of scope for improvement or deviations from the applicable guidelines. Where necessary, improvements are suggested or required. As an overriding indicator, we have established an occupa-tional health performance index.
Occupational Health Performance IndexThis index shows the extent to which internal requirements and goals have been implemented. It enables us to measure progress in the area of occupational health and drive forward continuous improvement. The index is calculated from two parameters from each of the following areas: occupational medicine, health promotion, and emergency medical manage-ment. Both the quality and the scope of the measures are taken into account. The index is calculated annually. In 2018, it covered 87 sites and 87 percent of Evonik employees.
We have defined a target of ≥ 5.0 for the Occupational Health Performance Index. In 2018, the index was 5.5 compared with 5.4 in 2017 (maximum: 6.0).
For Germany, we also calculate a health ratio, which was 94.9 percent in 2018 (2107: 95.1 percent). This is the ratio of target working hours less sickness-related hours lost to target working hours.
Emergency medical managementThe “Medical Incident and Emergency Management” standard defines binding basic requirements for emergency medical management at Evonik’s sites worldwide. The exact equipment and human resources required depend on production-related risks and the availability and quality of local medical infra-structure.
Specific procedures have been defined for accidents where employees come into contact with chemicals and require special medical treatment.
Emergency medical management also includes pandemic plans and regular training exercises. An extensive preventive health and risk management program is in place for employees on business trips and foreign assignments.
Feedback from our employees helps us tackle change processes together and continuously improve our day-to-day working relationships. Regular employee surveys ensure we have our finger on the pulse of time. They also help us make improvements that drive forward the development of Evonik and enhance employees’ identification with the company.
Christina Franke, Consultant, Organizational Development, Global HR, Strategy & Workforce Analytics Services
Occupational Health Performance Index C16
Calculated from occupational medicine, health promotion,and emergency medical management
2016
2017
2018
1.5 3.0 4.5 6.00.0
5.5
5.5
5.4
44 SUSTAINABILITY REPORT 2018 EVONIK INDUSTRIES
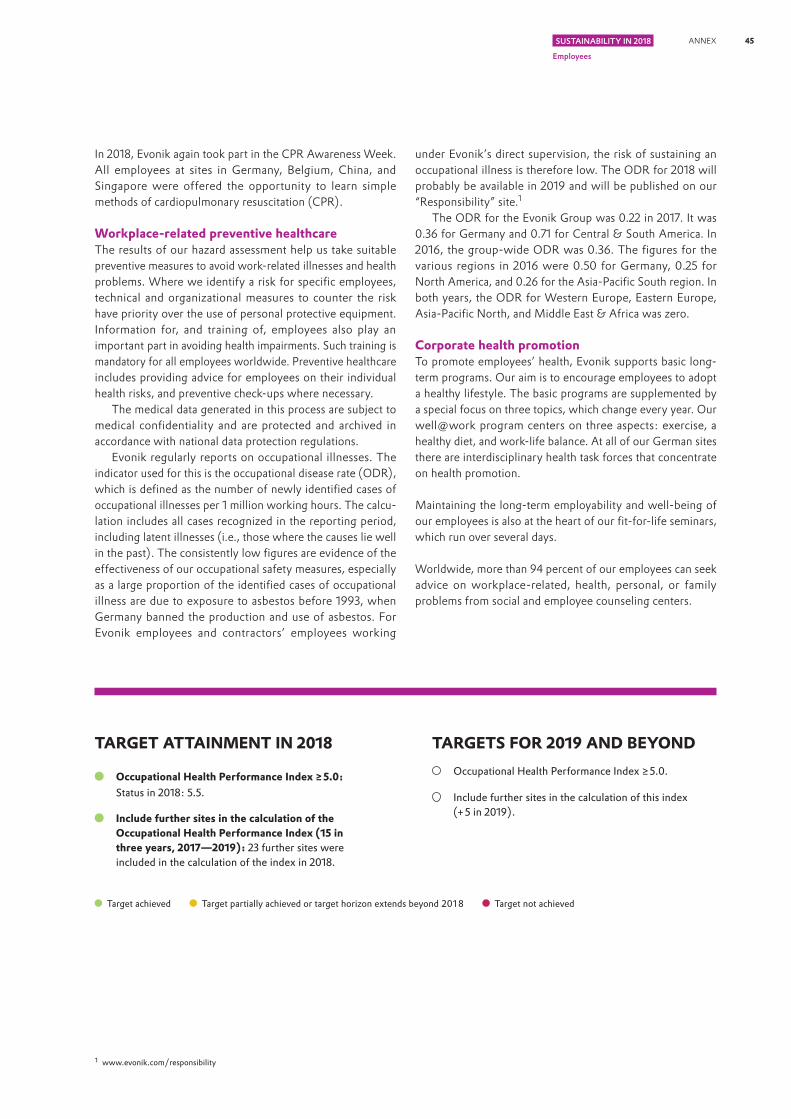
In 2018, Evonik again took part in the CPR Awareness Week. All employees at sites in Germany, Belgium, China, and Singapore were offered the opportunity to learn simple methods of cardiopulmonary resuscitation (CPR).
Workplace-related preventive healthcareThe results of our hazard assessment help us take suitable preventive measures to avoid work-related illnesses and health problems. Where we identify a risk for specific employees, technical and organizational measures to counter the risk have priority over the use of personal protective equipment. Information for, and training of, employees also play an important part in avoiding health impairments. Such training is mandatory for all employees worldwide. Preventive healthcare includes providing advice for employees on their individual health risks, and preventive check-ups where necessary.
The medical data generated in this process are subject to medical confidentiality and are protected and archived in accordance with national data protection regulations.
Evonik regularly reports on occupational illnesses. The indicator used for this is the occupational disease rate (ODR), which is defined as the number of newly identified cases of occupational illnesses per 1 million working hours. The calcu-lation includes all cases recognized in the reporting period, including latent illnesses (i.e., those where the causes lie well in the past). The consistently low figures are evidence of the effectiveness of our occupational safety measures, especially as a large proportion of the identified cases of occupational illness are due to exposure to asbestos before 1993, when Germany banned the production and use of asbestos. For Evonik employees and contractors’ employees working
under Evonik’s direct supervision, the risk of sustaining an occupational illness is therefore low. The ODR for 2018 will probably be available in 2019 and will be published on our “Responsibility” site.1
The ODR for the Evonik Group was 0.22 in 2017. It was 0.36 for Germany and 0.71 for Central & South America. In 2016, the group-wide ODR was 0.36. The figures for the various regions in 2016 were 0.50 for Germany, 0.25 for North America, and 0.26 for the Asia-Pacific South region. In both years, the ODR for Western Europe, Eastern Europe, Asia-Pacific North, and Middle East & Africa was zero.
Corporate health promotionTo promote employees’ health, Evonik supports basic long-term programs. Our aim is to encourage employees to adopt a healthy lifestyle. The basic programs are supplemented by a special focus on three topics, which change every year. Our well@work program centers on three aspects: exercise, a healthy diet, and work-life balance. At all of our German sites there are interdisciplinary health task forces that concentrate on health promotion.
Maintaining the long-term employability and well-being of our employees is also at the heart of our fit-for-life seminars, which run over several days.
Worldwide, more than 94 percent of our employees can seek advice on workplace-related, health, personal, or family problems from social and employee counseling centers.
1 www.evonik.com/responsibility
TARGET ATTAINMENT IN 2018
Occupational Health Performance Index ≥ 5.0: Status in 2018: 5.5.
Include further sites in the calculation of the Occupational Health Performance Index (15 in three years, 2017 — 2019): 23 further sites were included in the calculation of the index in 2018.
TARGETS FOR 2019 AND BEYOND Occupational Health Performance Index ≥ 5.0.
Include further sites in the calculation of this index (+ 5 in 2019).
Target achieved Target partially achieved or target horizon extends beyond 2018 Target not achieved
45ANNEX
Employees
SUSTAINABILITY IN 2018

Further facts and figures
Employees by region C17
Asia-Pacific South 5.1 %1,846 employeesAsia-Pacific North 10.2 %3,675 employees
Eastern Europe 1.6 %569 employees
North America 13.2 %4,753 employees
Central & South America 1.9 %678 employees
Middle East & Africa 0.5 %182 employees
Western Europe 67.5 %
24.340 employees
Employees by gender C19
Female 24.9 %
8,991 employees
Male 75.1 %
27,052 employees
External hires by age C21
Under 30 years 49.1 %
927 employees
Over 50 years 6.5 %
123 employees
30 to 50 years 44.4 %
837 employees
External hires by gender C20
Female 27.6 %
520 employees
Male 72.4 %
1,367 employees
External hires by region C18
Asia-Pacific South 14.7 %
278 employees
Asia-Pacific North 11.4 %
216 employees
Eastern Europe 2.5 %
47 employees
North America 22.4 %
422 employees
Central & South America 3.8 %
72 employees
Middle East & Africa 0.6 %
11 employees
Western Europe 44.6 %
841 employees
Employee turnover in 2018 a T14
Fluctuation
rate in %
No. of employees
who left the company
By gender
Female 5.9 539
Male 6.3 1,718
By age
Under 30 years 6.4 506
30 to 50 years 4.5 797
Over 50 years 8.8 954
6.2 2,257
thereof dismissed by employer 2.3 828
a Reference base: no. of employees in each category as of December 31, 2017.
46 SUSTAINABILITY REPORT 2018 EVONIK INDUSTRIES
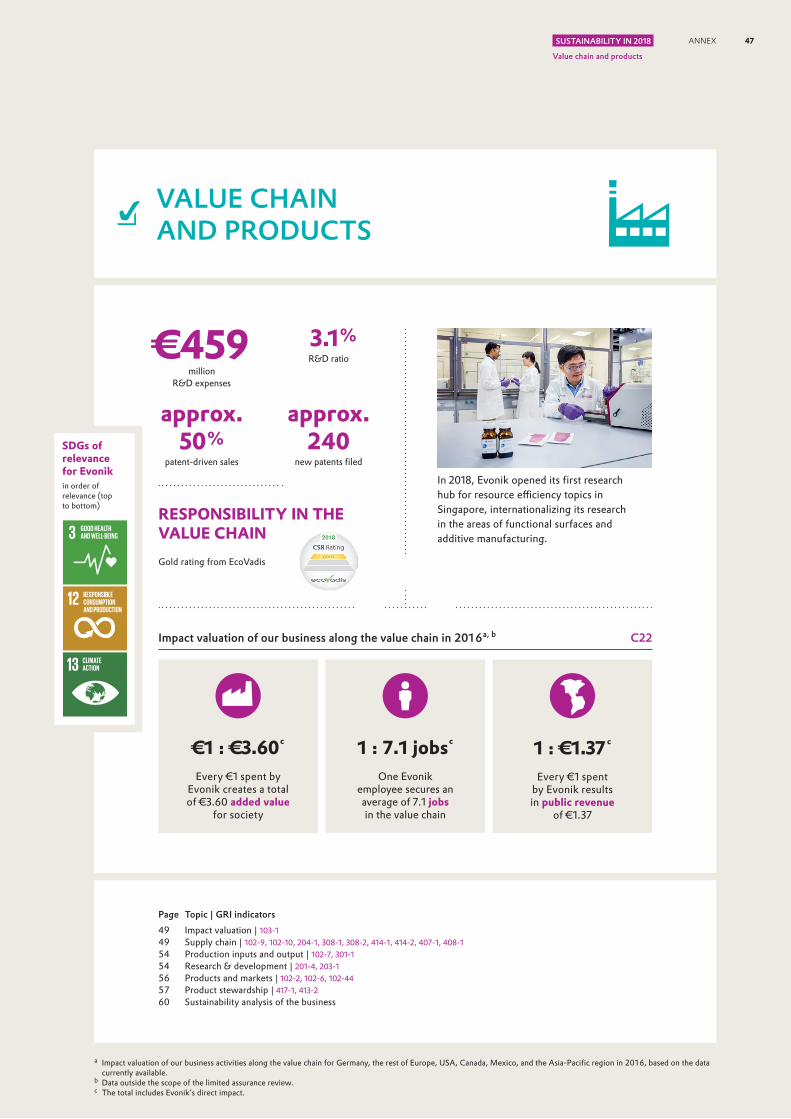
a Impact valuation of our business activities along the value chain for Germany, the rest of Europe, USA, Canada, Mexico, and the Asia-Pacific region in 2016, based on the data currently available.
b Data outside the scope of the limited assurance review.c The total includes Evonik’s direct impact.
SDGs of relevance for Evonik in order of relevance (top to bottom) RESPONSIBILITY IN THE
VALUE CHAIN
Impact valuation of our business along the value chain in 2016 a, b C22
€ 1 : € 3.60 c
Every €1 spent by
Evonik creates a total of €3.60 added value
for society
1 : 7.1 jobs c
One Evonik
employee secures an average of 7.1 jobs in the value chain
1 : € 1.37 c
Every €1 spent
by Evonik results in public revenue
of €1.37
approx. 50 %
patent-driven sales
3.1 %R&D ratio
Gold rating from EcoVadis
€ 459million
R&D expenses
approx. 240
new patents filed
Page Topic | GRI indicators49 Impact valuation | 103-149 Supply chain | 102-9, 102-10, 204-1, 308-1, 308-2, 414-1, 414-2, 407-1, 408-154 Production inputs and output | 102-7, 301-154 Research & development | 201-4, 203-156 Products and markets | 102-2, 102-6, 102-4457 Product stewardship | 417-1, 413-260 Sustainability analysis of the business
VALUE CHAIN AND PRODUCTS
In 2018, Evonik opened its first research hub for resource efficiency topics in Singapore, internationalizing its research in the areas of functional surfaces and additive manufacturing.
47ANNEX
Value chain and products
SUSTAINABILITY IN 2018
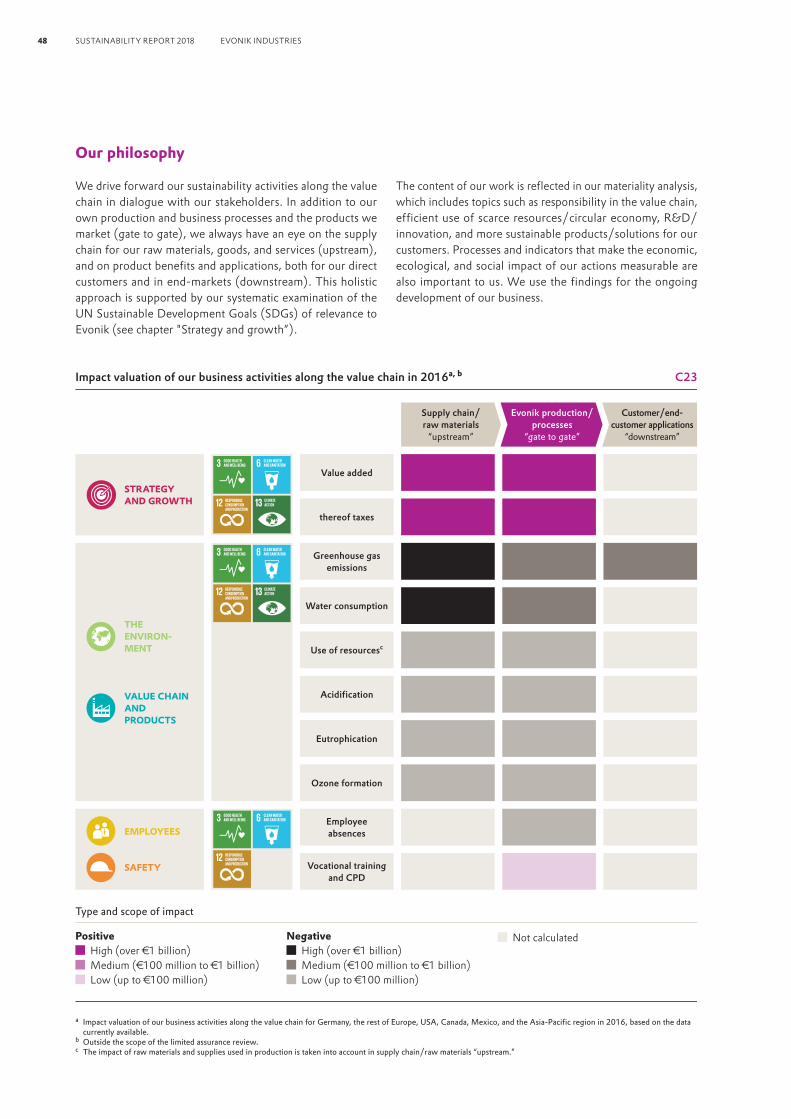
Our philosophy
We drive forward our sustainability activities along the value chain in dialogue with our stakeholders. In addition to our own production and business processes and the products we market (gate to gate), we always have an eye on the supply chain for our raw materials, goods, and services (upstream), and on product benefits and applications, both for our direct customers and in end-markets (downstream). This holistic approach is supported by our systematic examination of the UN Sustainable Development Goals (SDGs) of relevance to Evonik (see chapter "Strategy and growth”).
The content of our work is reflected in our materiality analysis, which includes topics such as responsibility in the value chain, efficient use of scarce resources/circular economy, R&D/innovation, and more sustainable products/solutions for our customers. Processes and indicators that make the economic, ecological, and social impact of our actions measurable are also important to us. We use the findings for the ongoing development of our business.
Impact valuation of our business activities along the value chain in 2016a, b C23
Positive High (over €1 billion) Medium (€100 million to €1 billion) Low (up to €100 million)
Negative High (over €1 billion) Medium (€100 million to €1 billion) Low (up to €100 million)
Not calculated
a Impact valuation of our business activities along the value chain for Germany, the rest of Europe, USA, Canada, Mexico, and the Asia-Pacific region in 2016, based on the data currently available.
b Outside the scope of the limited assurance review.c The impact of raw materials and supplies used in production is taken into account in supply chain/raw materials “upstream.”
Type and scope of impact
STRATEGY AND GROWTH
THE ENVIRON-MENT
VALUE CHAIN AND PRODUCTS
EMPLOYEES
SAFETY
Customer/end- customer applications
“downstream”
Evonik production/ processes
“gate to gate”
Supply chain/ raw materials
“upstream”
thereof taxes
Value added
Water consumption
Greenhouse gas emissions
Acidification
Use of resourcesc
Ozone formation
Eutrophication
Vocational training and CPD
Employee absences
48 SUSTAINABILITY REPORT 2018 EVONIK INDUSTRIES

TARGET ATTAINMENT IN 2018 Extend monetary valuation of the impact of our
business along the value chain (impact valuation) to further regions and indicators: We extended our impact valuation to include further indicators and further regions in the value chain.
TARGETS FOR 2019 AND BEYOND Impact valuation:
• Complete the worldwide monetary valuation of the
impact of our business along the value chain.
• Update the data to include 2017 and 2018.
Target achieved Target partially achieved or target horizon extends beyond 2018 Target not achieved
Evonik‘s business activities have positive and negative impacts on the environment, the economy, and society. We have now calculated many of the key influences along our value chain in monetary terms. In this way we can reliably describe our contribution to the sustainable development of society, build on positive factors, and reduce undesirable effects.
Guido Vornholt, Impact valuation expert in the Corporate Responsibility division
Impact valuation
We use an impact valuation to analyze the direct and indirect impact of our business activities from an economic, ecological, and social perspective. The impact valuation was first applied to our value chain in Germany in 2017 and was extended to other regions in 2018. In each case, the analysis was based on
the figures for 2016. The impact valuation was outside the scope of the PwC’s limited assurance engagement.
Chart C23 outlines Evonik’s impact along the value chain, without taking into account induced effects, which were calculated separately.
“Upstream”: supply chain
Evonik has a significant influence on society and the environ-ment through its procurement volume. We are aware of this responsibility.
By selecting suppliers carefully, we do not simply secure and increase their sustainability standards, we also enhance the quality of the entire value chain. On the one hand, we focus on validating and evaluating suppliers, while on the other, we specifically monitor certain raw materials. These include
renewable raw materials and those where there is a potential supply risk or reputational risk. We have implemented strate-gic procurement concepts for these critical raw materials, whose availability is vital for our production processes. The processes are integrated into a management system, where they are mapped. We aim to perform a sustainability evalua-tion of 90 percent of suppliers of critical raw materials by the end of 2020.
49ANNEX
Value chain and products
SUSTAINABILITY IN 2018

Strategy and managementOur goal is an efficient procurement organization to guarantee long-term reliability of supply for the production of Evonik products and to secure competitive advantages for our operating businesses.
Alongside economic requirements, our procurement strategy takes account of sustainability aspects such as health, quality, safety, social factors, and environmental protection. As a member of the UN Global Compact, we are committed to its principles. These requirements are documented in our code of conduct for suppliers, which is based on our corporate values, the principles of the UN Global Compact, the Interna-tional Labour Standards issued by the International Labour Organization (ILO), and the topics addressed by the Respon-sible Care® initiative.
Validation and evaluation of our suppliers is an integral part of sustainable supply chain management at Evonik. The validation of new suppliers includes checking that they meet the requirements of our code of conduct for suppliers. Special attention is paid to evaluating our strategic suppliers and suppliers of strategic raw materials. We work systematically both to extend strategic relationships with suppliers and to validate new suppliers. To supplement our code of conduct for suppliers, our approach includes self-assessments, audits, and validation of suppliers through Together for Sustainability.
Together for SustainabilityHarmonizing global standards in the supply chain creates transparency and makes it easier for both suppliers and custom-ers to reliably assess and evaluate sustainability performance. The chemical industry set up the Together for Sustainability (TfS) initiative for this purpose in 2011. Evonik is one of the six founding members of this initiative. The aim of TfS is the joint development and implementation of a global assessment and audit program for responsible procurement of goods and services. As well as helping to make environmental and social standards measurable, TfS contributes to improving them.
Organization and competenciesProcurement is organized globally at Evonik and comprises direct procurement (raw materials, logistics, and packaging) and indirect procurement (general and technical goods and services). Both are subdivided into strategic and operational procurement activities. Global procurement is managed from Germany, with the support of regional units in Asia and in North and South America.
To further increase the competencies of our employees, we have developed the Shaping Procurement and Developing Excellence (SPADE) training and continuing professional development program. This program helps to promote inter-national and interdisciplinary sharing of experience.
In addition, in 2017 a new training concept was developed with content covering the TfS initiative. Local training is designed to make procurement staff aware of the importance of sustainability in the supply chain and inform them of new developments. We used this concept to train all relevant pro-curement staff in 2018.
ProcessAs a responsible company, we are continuously driving for-ward transparency and sustainability along the supply chain. If suppliers have particularly serious shortcomings and no improvement can be identified, we reserve the right to end our collaboration with them. One supplier was dropped in 2018.
In addition to ongoing contact to Evonik’s procurement organization, employees at supplier companies always have the option of contacting our externally operated whistleblower hotline if they have any issues or problems to report. All such cases are examined promptly so that appropriate action can be taken. We did not receive any such reports from our suppliers in 2018.
Validation and evaluation of suppliersWe expect our suppliers to share our principles and to act correctly in all respects, which means accepting responsibility towards their employees, business partners, society, and the environment. Validation is the first step in every new supply relationship. For this purpose, we use an in-house validation
Executive Board
Global & Western Europe, Eastern Europe, Middle East & Africa
North America, Central &
South America
Asia-Pacific North
Asia-Pacific South
Head of Procurement
Evonik’s procurement organization C24
Direct procurement
Indirect procurement
50 SUSTAINABILITY REPORT 2018 EVONIK INDUSTRIES
process, which is based on the values defined in our code of conduct for suppliers. Alongside quality, environmental pro-tection, safety, health, and energy management, the assessment of potential risk factors includes corruption prevention, anti-trust law, labor and social standards (the right to freedom of association and collective bargaining), human rights (compul-sory or forced labor), conflict minerals, and responsibility within the supply chain. All details are collected via a questionnaire and evaluated using a validation matrix. All suppliers are informed about corruption prevention and the related measures in our code of conduct for suppliers and our general terms and conditions of purchase.
In addition, successfully completed TfS assessments can be used as evidence of validation. Overall, suppliers are evaluated using a method that identifies and quantifies risk factors. The aim is to safeguard the supply of raw materials and technical goods to Evonik and gain access to new procurement markets and suppliers. In the year under review, around 1,350 new suppliers of raw materials, technical goods, and services were screened.
We apply the same care to the evaluation of existing rela-tionships with suppliers. Strategic suppliers are examined regularly as a basis for initiating improvements where neces-sary. To minimize the risk to Evonik, as part of our manage-ment of contractors, we obtained and evaluated evidence and self-assessments on compliance with the relevant German legislation (MiLOG, AEntG, SGB, and HwO)1. In addition, the requirements for the employment of external staff at Evonik were examined in 2018.
Optimization of construction and technical services contin-ued in 2018 to address the challenges resulting from the skills shortage and the construction boom in Germany. Here, we made significant progress in validating new suppliers and extending long-term supply relationships.
Our activities in 2018In 2018, we sourced raw materials and supplies, technical goods, services, energy, and other operating supplies with a total value of around €9.9 billion (2017: €9.1 billion) from some 35,000 suppliers. Local sourcing2 accounted for around 76 percent of this amount (2017: 77 percent).
Raw materials and supplies accounted for 60 percent of procurement volume (2017: 60 percent). Spending on petro-chemical feedstocks was around € 3.9 billion and accounted for 67 percent of our raw material base.
TfS activities in 2018The TfS member companies initiated more than 350 audits and around 1,500 assessments worldwide in 20183. About 80 percent of direct, and over 50 percent of indirect, procure-ment volume was covered by TfS assessments.
In 2018, we evaluated about 83 percent (2017: 74 percent) of suppliers of critical raw materials using sustainability criteria. These criteria include country risks, the supply situation, and market availability. TfS assessments and audits were also used to review further significant suppliers.
A particular focus in 2018 was the process for following up on audits and assessments. Corrective measures were initiated with twelve suppliers, where major or critical deviations were identified during audits. In 14 cases, supplier assessments showed that insufficient attention had been paid to sustain-ability aspects. In these cases as well, corrective action was initiated. Shortcomings in the implementation of environmen-tal measures and potential for improvement in occupational safety were also identified in 2018 at suppliers audited by TfS. None of the suppliers evaluated had significant negative impacts on the environment or considerable scope to improve social aspects of their business activities. No cases of child labor or forced labor were identified in on-site inspections, nor were there any cases of discrimination or restriction on the freedom of association.
’Together for Sustainability‘ enhances transparency and sustainability in the supply chain. More and more companies are recognizing the benefits and joining this initiative. Evonik is proud to be one of the founders.
Shirley Qi, Vice President, Procurement Asia-Pacific North
51ANNEX
Value chain and products
SUSTAINABILITY IN 2018

In 2018, we audited sustainability standards at 22 supplier sites and arranged for 130 sustainability assessments to be conducted by an external service provider.
The total of 1,508 suppliers evaluated comprises audits, assessments, and pre-validation performed both directly by Evonik and by TfS.
Active involvement in TfS is important to us. That is also evidenced by the fact that our chief procurement officer con-tinues to serve the initiative as president following his re-election in 2017. Evonik employees are members of TfS workstreams in Germany, North and South America, and Asia.
In 2018, Evonik organized a TfS conference on sustain-ability within the supply chain in Shanghai (China). As a mem-ber of the initiative, Evonik is also subject to TfS assessments. Our gold rating positioned us among the top-rated companies in 2018.
Evonik also supported the sustainability in the supply chain pilot project run by Chemie3, the sustainability initiative of the German Chemical Industry Association (VCI).
Procurement of raw materials
Critical raw materialsWe have established special procurement strategies and risk management systems for our critical raw materials. Examples of critical raw materials are conflict minerals and renewable raw materials, including palm oil.
Conflict mineralsThe Dodd-Frank Act requires companies listed on the US stock market to disclose whether their products contain potential conflict minerals. These are mineral raw materials from the Democratic Republic of Congo and its neighboring countries that are often used to finance armed conflicts. In addition, human rights are often violated in the production of conflict minerals.
Evonik is not listed on US stock exchanges and therefore has no legal obligation to comply with the reporting require-ments of the US stock market regulator. At the same time, as a responsible company, Evonik meets its duty of care with regard to conflict minerals in the supply chain and checks the origin of such substances. Moreover, Evonik requires new suppliers to provide evidence of origin in the pre-validation process. In 2018, we screened 1,350 new suppliers and did not identify any use of conflict minerals.
Renewable raw materialsIn its production processes, Evonik uses dextrose and saccha-rose, mainly as substrates in fermentative production of amino acids. Natural fats and oils and their derivatives are used to produce precursors for the cosmetics, detergents, and cleaning agents industry and in technical processing aids.
Renewable raw materials are classed as “critical raw materials” for procurement purposes, especially with a view to reliability of supply. Consequently, they are subject to a special examination.
Supplier validation and evaluation C25
a Alternatives.
TfS process Evonik process
Before entering into a business relationship
During the business relationship
TfS assessmentsa TfS assessments Risk evaluation
Supplier validationa TfS audits Supplier
evaluationSupplier
development
Evonik Code of Conduct for Suppliers
52 SUSTAINABILITY REPORT 2018 EVONIK INDUSTRIES

We endeavor to raise the proportion of renewable raw mate-rials wherever this makes sense from a technical, economic, ecological, and social perspective. In view of the rising signif-icance of renewable raw materials for our customers and in public debate, this topic is discussed internally by specialists in a cross-unit expert circle.
Palm oilSmall amounts of palm oil, palm kernel oil, and their deriva-tives are used in our production processes, for example to produce ingredients for the cosmetics and consumer goods industries. The strategy, objectives, and activities relating to palm oil, such as Evonik’s palm oil roadmap, are discussed internally by our expert circle on renewable raw materials.
Evonik supports the sustainable use of palm oil in the supply chain. We have therefore been a member of the Roundtable
on Sustainable Palm Oil (RSPO) since 2010 and publish our targets for palm oil in the RSPO’s annual progress report.
All production sites operated by our Care Solutions business line that use palm oil derivatives have now been certified by external auditors as conforming to the RSPO standard. This shows that our organizational structure at these sites meets the RSPO requirements, which is a basic precondition for the continuous transition to certified raw materials. The Care Solutions business line has therefore defined additional supply chain criteria in cooperation with its customers1. This allows continuous monitoring and improves traceability back to refineries and plantations.
In collaboration with our customers and suppliers, we aim to further extend our portfolio of RSPO-certified palm oil derivatives.
1 See https://personal-care.evonik.com/product/personal-care/en/sustainability/sustainability-insights/Responsible-Sourcing/Pages/default.aspx
TARGET ATTAINMENT IN 2018 Conduct at least 20 supplier sustainability audits
under the shared audit principle of the Together for Sustainability initiative: 22 audits were conducted.
Continue the analysis of suppliers by reviewing at least 80 TfS assessments: As of year-end 2018: A total of 130 supplier assessments had been performed.
Evaluate the sustainability performance of 90 percent of suppliers of critical raw materials by 2020: As of year-end 2018: 83 percent.
Implement the new training concept and conduct internal sustainability training for all relevant procurement employees: We trained all relevant procurement staff using this concept in 2018.
TARGETS FOR 2019 AND BEYOND Conduct at least 20 supplier sustainability audits p.a.
under the shared audit principle of the Together for Sustainability initiative.
Continue the analysis of suppliers by reviewing at least 80 TfS assessments.
Evaluate the sustainability performance of 90 percent of suppliers of critical raw materials by 2020.
Develop recommendations for action on palm oil, palm kernel oil, and their derivatives at Evonik.
External monitoring of suppliers of renewable raw materials and in-house supplier criteria.
Target achieved Target partially achieved or target horizon extends beyond 2018 Target not achieved
53ANNEX
Value chain and products
SUSTAINABILITY IN 2018

“Gate to gate”: raw materials, production, and processes
The biggest direct influence on sustainability requirements in the value chain comes from our production and business pro-cesses and the products we market. In many cases, we develop and use our own production processes that enable us to combine safety and efficient use of resources with innova-tive capability and cost-efficiency.
At many of our sites, we have backwardly integrated production complexes where key precursors are produced in adjacent production facilities. That ensures high reliability of supply for our customers. Our world-scale facilities are also a high entry barrier for potential competitors.
We generate 83 percent of our sales outside Germany. That shows the global focus of our business. We have pro-duction facilities in 28 countries on six continents and are therefore close to our markets and our customers. Our largest production sites—Marl, Wesseling, and Rheinfelden (Germany),
Antwerp (Belgium), Mobile (Alabama, USA), Shanghai (China), and Singapore—have integrated technology platforms used by various units. This results in valuable economies of scale and maximizes the use of material flows.
Continuous process optimization and efficient use of resources have always been very important for our produc-tion activities. That is reflected in our environmental targets; see chapter “The environment.”
Production inputs and outputEvonik uses a wide range of raw materials in the production of its products. Like technical goods and services, they are sourced from a variety of suppliers. Production inputs increased from 9.55 million metric tons to 9.86 million metric tons in 2018. Our output was around the prior-year level at 11.03 million metric tons.
Production inputs and output T15
in million metric tons 2014 2015 2016 2017 2018
Raw material inputs 8.75 8.66 9.32 9.55 9.86
of which renewable raw materials 0.77 0.74 0.86 0.99 0.96
Use of renewable raw materials in production in % 8.8 8.6 9.2 10.4 9.7
Production 10.35 10.36 10.58 10.98 11.03
Renewable raw materialsIn 2018, renewable raw materials accounted for 9.7 percent of production inputs (2017: 10.4 percent).
Research and developmentA combination of innovative capability and proximity to cus-tomers is a key success factor for Evonik and drives profitable growth. Within the growth engines of relevance for Evonik—Specialty Additives, Smart Materials, Animal Nutrition, and Health & Care—we identify future-oriented innovation growth fields, which we use to achieve our ambitious targets. Our vision is to be an innovation leader. We have therefore defined clear and ambitious targets. Our guiding principles on innovation help us meet these targets. Evonik sees itself as an open and learning organization with a constructive approach to errors. Sustainability is an important aspect of our innovation activities.
We work with customers and external partners across internal departmental boundaries and provide incentives for new discoveries so that good ideas can be turned into
marketable innovations. Research and development (R&D) in our strategic innovation unit Creavis and in the Nutrition & Care and Resource Efficiency segments is aligned to six inno-vation growth fields:• Sustainable Nutrition: establishing additional products
and services for sustainable nutrition of livestock and people
• Healthcare Solutions: developing new materials for implants, as components of cell culture media, and for custom-tailored, innovative drug formulations
• Advanced Food Ingredients: creating a portfolio of health-enhancing substances and nutritional supplements as a contribution to healthy nutrition
• Membranes: extending SEPURAN® technology for efficient gas separation to further applications
• Cosmetic Solutions: developing further products based on natural sources for cosmetics and sensorially optimized formulations for skin care products
• Additive Manufacturing: developing products and tech-nologies for additive manufacturing
54 SUSTAINABILITY REPORT 2018 EVONIK INDUSTRIES

Evonik’s global R&D network comprises around 40 locations with approximately 2,780 R&D employees. R&D expenses declined 4 percent to € 459 million in 2018 due to more target-oriented management.
The ratio of R&D expenses to sales was 3.1 percent (2017: 3.3 percent). Our R&D projects are managed using the multi-step Idea-to-Profit process developed by Evonik to support the systematic development of projects right up to profitable commercialization.
Successful innovationsOur innovation pipeline includes both completely new busi-ness options and securing and enhancing the prospects of existing businesses. Equal attention is paid to product and process innovations and to business model and systems innova-tions. Our project portfolio is aligned to the differing strategies of the various business entities. In the reporting period, some of our projects received funding from the European Union or the Federal Republic of Germany. In all, we received funding of around €4.2 million.
Evonik has an extensive patent strategy to protect new products and processes. The value and quality of our patent portfolio have increased steadily in recent years. Around 240 new patent applications were filed in 2018 and we had around 26,000 patents and pending patents. Patent-driven sales accounted for about 50 percent of total sales.
Sustainability as a growth driverThe good market development of new products with specific sustainability benefits is gratifying. At in-cosmetics, the global trade show for the cosmetics industry in Paris, our Care Solu-tions business (Nutrition & Care segment) received an award for RHEANCE® One, a glycolipid cleansing agent for skin and hair. This new development is produced from sugar using a
fermentation process without tropical oils. The Veramaris joint venture that grew out of the successful research collaboration between Evonik’s Nutrition & Care segment and DSM pro-duces omega-3 fatty acids from algae. The aim is to meet 15 percent of annual demand from the salmon industry for the omega-3 fatty acids EPA1 and DHA2 with algal oil. So far, wild fish stocks have been the main source of algal acid. The construction of a production facility in Blair (Nebraska, USA) is proceeding on schedule and commercial quantities of algal oil will be available in mid-2019.
Examples of new sustainable products from our Resource Efficiency segment included POLYVEST ST®, an additive used in combination with silica and silanes that helps achieve a further significant reduction in the rolling resistance of tires and thus reduces fuel consumption and CO2 emissions. CALOSTAT®, a high-performance insulating material based on silicon dioxide, won the German Design Council’s German Innovation Award 2018 in the category Building & Elements. Since the start of 2018, Evonik and Siemens have been working together on the Rheticus3 project on artificial photosynthesis. Renewable materials and bacteria are converted into valuable specialty chemicals with the aid of carbon dioxide. A first pilot plant is under construction at our site in Marl (Germany). It will produce chemicals such as butanol and hexanol from 2021.
Organization and managementEvonik’s operating segments account for around 90 percent of R&D expenses. Their research is aligned principally to their core technologies and markets. An above-average proportion of our R&D funding is allocated to the growth segments, Nutrition & Care and Resource Efficiency. The Performance Materials segment focuses on process optimization and product improvements.
Includes the cost of Corporate Innovation from 2017; 2017 figure restated.
R&D expenses C26
in € million
2014
2015
2016
2017
2018
100 200 300 400 5000
413
434
438
476
459
1 EPA = eicosapentaenoic acid.2 DHA = docosahexaenoic acid.3 Funded by the Federal Ministry of Education and Research; funding reference 03SF0548A.
Breakdown of R&D expenses C27
Nutrition & Care Creavis
Performance Materials
Resource Efficiency
Other
55ANNEX
Value chain and products
SUSTAINABILITY IN 2018
Creavis focuses on mid- to long-term innovation projects that support Evonik’s growth and sustainability strategy and open up new business options. It works on transformative innovations, taking economic, ecological, and social aspects into account in the management of innovations. Creavis also identifies future topics and serves as an internal incubator. Cross- organizational projects and projects that build up fundamental competencies for Evonik are organized in project houses, where experts work together on a topic, normally for three years. As a rule, the products and technologies developed during this time are handed over to one of the operating seg-ments for commercialization. In some cases, a separate com-petence center or an internal start-up may be established. In all, Evonik has run eleven project houses since 2000. At present, the Tissue Engineering project house in the Healthcare Solu-tions innovation growth field is working on new solutions for the regeneration of human tissue after accidents and illness. The aim is to produce materials for biological implants for medical applications.
Evonik also obtains access to innovative technologies and new business options through its corporate venture capital activities. We invest specifically in specialized technology funds and start-ups of strategic relevance to Evonik. That gives us an insight into innovative developments at an early stage. Projects with our partners enable us to work on new products and technologies which speed up our own innovations. More than 24 investments have been made since 2012. In 2018, Evonik’s investments included the biotechnology start-up In Ovo. This firm has developed a particularly fast and reliable method of determining the sex of embryos, which avoids the killing of male chicks in poultry farming.
Digitalization and innovationEvonik aims to be the trailblazer in digitalization in the chemical industry. In this context, in 2018, we invested in the American high-tech start-up mySkin. mySkin is facilitating a break-through in how consumers can determine and improve their skin properties. The company has developed a mobile device that analyzes skin properties and recommends care products.
“Downstream”: customers and end- customer applications
Demand from customers for products for energy- and resource-efficient applications is rising. In many businesses, sustainability is becoming a growth driver. That is confirmed by the high priority given to more sustainable products/solutions for our customers in our latest materiality analysis.
Our products and marketsIn response to this interest we provide innovative solutions that utilize our expertise as a world-leading specialty chemicals company. Our special strength is working in close partnership
with our customers. That gives us a good basis so we can ensure timely identification of promising developments in our markets and gain access to new growth areas. Evonik’s prod-uct portfolio ranges from high-quality intermediates to com-plex formulations and system solutions. Our markets cover a balanced and diverse spectrum, including pharmaceuticals, consumer and care products, food and animal feed, paints and coatings, the automotive industry, mechanical engineer-ing, and construction.
TARGET ATTAINMENT IN 2018 More than €1 billion additional sales in the identified
innovation growth fields by 2025: We are making good progress, but do not want to report on interim results.
Increase sales of products and applications developed in the past five years to 16 percent in the mid term: increased to 12 percent in 2018.
TARGETS FOR 2019 AND BEYOND Generate more than €1 billion in additional sales by 2025
in our six innovation growth fields.
Increase sales of products and applications developed in the past five years to 16 percent in the mid term.
Target achieved Target partially achieved or target horizon extends beyond 2018 Target not achieved
102-44
56 SUSTAINABILITY REPORT 2018 EVONIK INDUSTRIES
None of the end-markets that we supply accounts for more than 20 percent of our sales.
Evonik’s customers are mainly industrial companies that use our intermediates in their own products and solutions. Our operating segments make a key contribution to enhanc-ing the product benefits that differentiate our customers in the market and make them successful in global competition.
Our in-depth knowledge of requirements, markets, and trends helps us tailor products individually to the specific needs of our customers. Regional specifics are taken into account through our numerous technology and competence centers.
Alongside products and solutions, many of our businesses sell services along the entire value chain. A good example is our Animal Nutrition business line, with its broad range of specialist services.
At Evonik, the operating businesses are responsible for customer relationship management, which is aligned to market and customer needs on a decentralized basis by our segments and business lines.
Close collaboration with our customersLeading market positions1 account for around 80 percent of Evonik’s sales. Our aim is to be integrated into our customers’ supply chains where possible. That allows optimal alignment of our research and development, production, marketing, and distribution workflows to our customers’ requirements. Systematic contact to our stakeholders along the value chain helps to improve our understanding of market developments and customer requirements.
At Group level, we have a marketing and sales excellence (MSE) team that offers special staff training and management tools to support the continuous development of our segments through customer focus. Examples include a digital approach for ongoing customer surveys and customer interaction.
Evonik’s twelve cross-business industry teams also make an important contribution to marketing. These teams pool solutions expertise for specific sectors or markets and provide a group-wide communication platform for dialogue with customers. In this way, we build expertise and, at the same time, increase our visibility in our key markets. At present we have automotive, food, pharmaceuticals, and paint and coatings industry teams.
Product stewardship
Product stewardship is a vital precondition for our business as our ”license to operate.” It includes timely identification and evaluation of the potential health and environmental risks in our portfolio. We therefore examine the entire value chain of each of our products—from procurement of the raw materials to delivery to our industrial customers, who receive all relevant information on the handling and disposal of our products. That includes, for example, safety data sheets and technical information sheets.
As well as complying with all statutory requirements such as the European chemicals regulation REACH2 and the Globally Harmonized System of Classification and Labelling of Chemicals (GHS), product stewardship at Evonik includes voluntary com-mitments that go beyond these regulations.
We have been committed for many years to the interna-tional Responsible Care® initiative and the Responsible Care® Global Charter of the International Council of Chemical Associations (ICCA), which includes the Global Product Strategy (GPS). The key elements of our product steward-ship have been defined in a product policy. To supplement this, an operating procedure defines how these commitments are to be implemented within Evonik, together with control mechanisms to monitor their observance.
Responsible handling of chemicalsIn the light of global trade in chemicals and chemical products, it is important to encourage broad communication on their safe handling and use. We ensure this through an extensive worldwide information system. This includes information portals, safety data sheets—not just for dangerous products—in more than 30 languages, technical data sheets, and extensive information on our website. There are also 24/7 emergency hotlines, including a translation service, and email addresses.
Trustful collaboration with our customersOur specialist departments provide advice for our customers at all stages in the product life cycle, from selection of the raw materials through dealing with possible toxicological, ecotoxicological, and physical chemistry risks and the resulting exposure-based risks. Our advice also includes regulatory requirements relating to the planned application, right up to transportation and disposal. Where necessary, we give cus-tomers training in how to handle our products.
1 We define these as ranking 1st, 2nd, or 3rd in the relevant markets.2 REACH = Registration, Evaluation, Authorisation and Restriction of Chemicals.
102-44
57ANNEX
Value chain and products
SUSTAINABILITY IN 2018
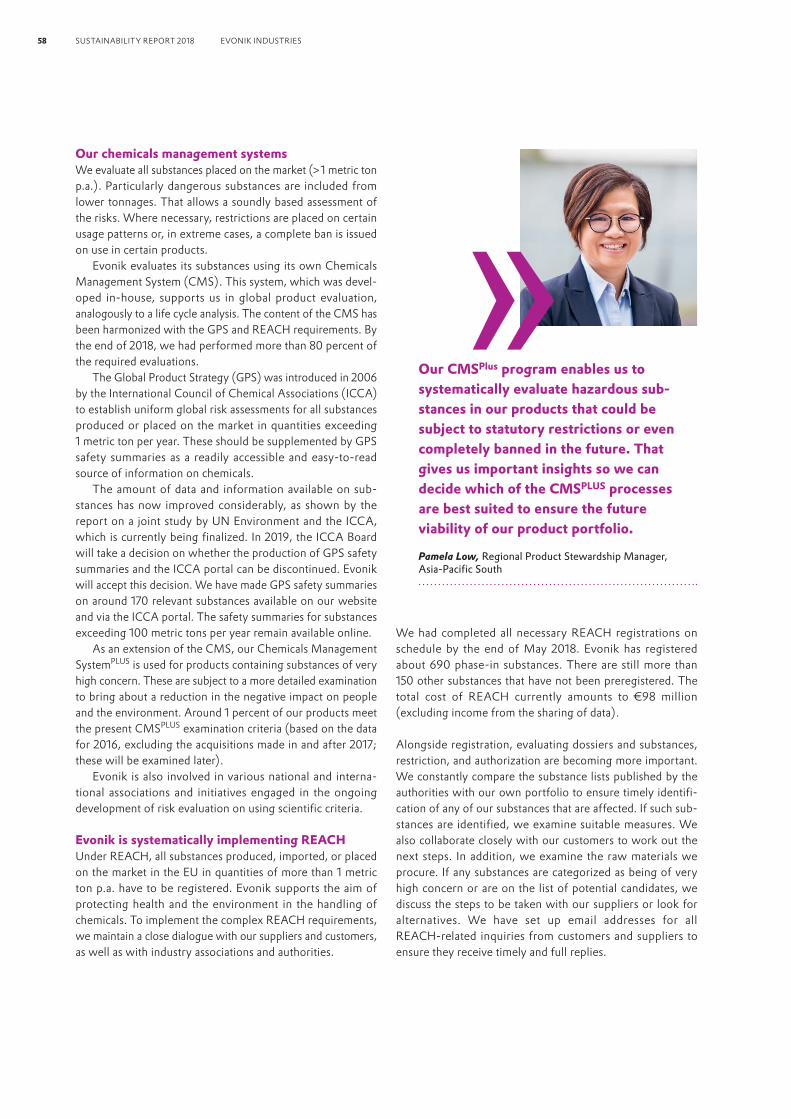
Our chemicals management systemsWe evaluate all substances placed on the market (> 1 metric ton p.a.). Particularly dangerous substances are included from lower tonnages. That allows a soundly based assessment of the risks. Where necessary, restrictions are placed on certain usage patterns or, in extreme cases, a complete ban is issued on use in certain products.
Evonik evaluates its substances using its own Chemicals Management System (CMS). This system, which was devel-oped in-house, supports us in global product evaluation, analogously to a life cycle analysis. The content of the CMS has been harmonized with the GPS and REACH requirements. By the end of 2018, we had performed more than 80 percent of the required evaluations.
The Global Product Strategy (GPS) was introduced in 2006 by the International Council of Chemical Associations (ICCA) to establish uniform global risk assessments for all substances produced or placed on the market in quantities exceeding 1 metric ton per year. These should be supplemented by GPS safety summaries as a readily accessible and easy-to-read source of information on chemicals.
The amount of data and information available on sub-stances has now improved considerably, as shown by the report on a joint study by UN Environment and the ICCA, which is currently being finalized. In 2019, the ICCA Board will take a decision on whether the production of GPS safety summaries and the ICCA portal can be discontinued. Evonik will accept this decision. We have made GPS safety summaries on around 170 relevant substances available on our website and via the ICCA portal. The safety summaries for substances exceeding 100 metric tons per year remain available online.
As an extension of the CMS, our Chemicals Management SystemPLUS is used for products containing substances of very high concern. These are subject to a more detailed examination to bring about a reduction in the negative impact on people and the environment. Around 1 percent of our products meet the present CMSPLUS examination criteria (based on the data for 2016, excluding the acquisitions made in and after 2017; these will be examined later).
Evonik is also involved in various national and interna-tional associations and initiatives engaged in the ongoing development of risk evaluation on using scientific criteria.
Evonik is systematically implementing REACHUnder REACH, all substances produced, imported, or placed on the market in the EU in quantities of more than 1 metric ton p.a. have to be registered. Evonik supports the aim of protecting health and the environment in the handling of chemicals. To implement the complex REACH requirements, we maintain a close dialogue with our suppliers and customers, as well as with industry associations and authorities.
We had completed all necessary REACH registrations on schedule by the end of May 2018. Evonik has registered about 690 phase-in substances. There are still more than 150 other substances that have not been preregistered. The total cost of REACH currently amounts to € 98 million (excluding income from the sharing of data).
Alongside registration, evaluating dossiers and substances, restriction, and authorization are becoming more important. We constantly compare the substance lists published by the authorities with our own portfolio to ensure timely identifi-cation of any of our substances that are affected. If such sub-stances are identified, we examine suitable measures. We also collaborate closely with our customers to work out the next steps. In addition, we examine the raw materials we procure. If any substances are categorized as being of very high concern or are on the list of potential candidates, we discuss the steps to be taken with our suppliers or look for alternatives. We have set up email addresses for all REACH-related inquiries from customers and suppliers to ensure they receive timely and full replies.
Our CMSPlus program enables us to systematically evaluate hazardous sub-stances in our products that could be subject to statutory restrictions or even completely banned in the future. That gives us important insights so we can decide which of the CMSPLUS processes are best suited to ensure the future viability of our product portfolio.
Pamela Low, Regional Product Stewardship Manager,Asia-Pacific South
58 SUSTAINABILITY REPORT 2018 EVONIK INDUSTRIES

In 2019, our REACH activities will concentrate on evaluation of dossiers and substances, and on reviewing and updating dossiers that have already been registered. Evonik is not yet affected by authorizations.
Some countries and regions are currently introducing chemicals legislation with requirements similar to REACH. Examples are South Korea and Turkey. Other countries, such as the USA, are also raising their standards significantly. Evonik is therefore driving forward global product steward-ship through its own task force. The focus in 2018 was on examining the necessary adjustments. The preregistration phase in South Korea and Turkey will start in 2019.
The Globally Harmonized System (GHS)The Globally Harmonized System of Classification and Label-ling of Chemicals (GHS) initiated by the United Nations classifies dangerous goods and substances for labeling on packaging and in safety data sheets. Evonik ensured timely implementation of the requirements of the CLP Regulation1 in 2015. The GHS is still not applied uniformly around the world. We have therefore set up an in-house database to gather information on progress, changes, and national requirements so it can be shared internally.
NanotechnologyNanotechnology is a generic term covering a wide range of developments and innovations as well as established technolo-gies. Their common feature is the investigation, production, and use of minute structures measuring around 1 to 100 nanometers. Some have been known for many decades, while others are new developments. Nanomaterials used in products and effi-cient system solutions for our customers make a substantial contribution to environmental protection and climate protection. We handle the associated technologies responsibly and utilize the possibilities they offer. For example, we see considerable opportunities in new materials for high-end batteries and energy-saving applications in the construction sector.
Based on our long-standing experience, we implement measures to protect employees, customers, and consumers when they handle nanomaterials. These measures are based on the latest assessment of the risks and dangers resulting from scientific investigations and epidemiological and toxico-logical studies. In addition, Evonik supports the establishment of new methods of investigation aligned to the specific effects of nanomaterials, which refine the evaluation of risks. We are also continuously investigating the potential hazards and safe handling of these materials.
We share the results of our research openly and transpar-ently with our stakeholders. Representatives of Evonik take part
in the German government’s NanoDialog, where experts from industry, science, authorities, and industry associations discuss the opportunities and risks of nanotechnology.
BiotechnologyEvonik utilizes the opportunities offered by biotechnology for efficient and environmentally compatible production processes and innovative products. We use micro-organisms for biocatalysis processes and fermentative production pro-cesses. Biotechnology is used to produce essential amino acids, probiotics, nutritional supplements, and pharmaceutical and cosmetic ingredients that are difficult or impossible to access through conventional chemical synthesis.
Such products have to be registered before they can be produced and placed on the market. That requires detailed explanations of the production processes and the micro- organisms used as well as safety aspects. We have issued guidelines on safe and responsible use of biotechnology. That meets the our customers’ desire for transparency, openness, and strict risk limitation.
MicroplasticsPollution of the environment and especially aquatic systems by plastics is a focus of public debate. Every year, between 4.8 and 12.7 million metric tons2 of plastic waste, including microplastics, get into the world’s oceans. Microplastics can be added to products intentionally, but can also be generated by the abrasion of plastics, for example, abrasion of tires and fragmentation of larger plastic items.
Evonik has been involved in the Zero Pellet Loss campaign since 2013 and became a signatory to Operation Clean Sweep in 2015. The aim of these two global initiatives is to reduce the pellet loss in production, processing, and transportation. In addition, we are working in industry associations to deal with this global problem. Evonik also offers alternatives that can replace microplastic particles in both rinse-off and leave-on cosmetic products.
Animal protectionWe need toxicological and ecotoxicological data to assess the safety of our products. As the first step, we examine all alter-natives in detail (QSAR3, read-across, literature, non-animal testing). Various task forces have therefore been set up, for example to pool expertise relating to in-silico methods and evaluate in-vitro methods for the skin sensitization endpoint. A first in-vitro feasibility study has been performed for the respiratory tract sensitization endpoint using various typical sensitization markers at protein and gene expression level, including distinguishing between skin and respiratory tract
1 CLP = Regulation EC No. 1272/2008 on the classification, labelling and packaging of substances and mixtures. 2 Jenna R. Jambeck et al. 2015. Plastic waste inputs from land into the ocean. Science, vol. 347, no. 6223, pp. 768-771; DOI: https://doi.org/10.1126/science.1260352 3 Quantitative structure-activity relationship (QSAR) analyses.
59ANNEX
Value chain and products
SUSTAINABILITY IN 2018
sensitization. This project has not yet been completed. The initial findings indicate that the respiratory tract irritation endpoint should be pursued so that in future substances can be tested in vitro to evaluate irritation thresholds.
Evonik is also a member of the European Partnership for Alternative Approaches to Animal Testing (EPPA) to drive forward cross-sector alternatives.
From a scientific and legal perspective, in many cases tests on animals are still the only way to meet the necessary data requirements. Evonik only arranges for animal tests to be per-formed by test institutes that are validated in accordance with the applicable national and international legal provisions and ensures that they meet animal protection standards. As a responsible company, we have also drawn up our own animal protection guidelines.
Sustainability analysis of the business
In 2018, we continued to develop the method used for the sustainability analysis of our business in collaboration with the operating units, and had it validated externally through a limited assurance review.
The findings of our sustainability analysis are designed to supplement established internal strategic business analyses. They should cover our entire portfolio of chemical businesses. Transparent and quantifiable evaluation of sustainability aspects is necessary to include this perspective in business decisions.
By taking these sustainability aspects into consideration when analyzing our businesses, we are able to identify both opportunities and risks in the value chain. In this way, we support our operating unities in product and business develop-ment in their markets.
MethodologyA sustainability analysis of all Evonik’s chemicals businesses is performed at the level of PARCs (= product-application- region combinations4). This analysis is based on the criteria outlined in chart C29, which reflect the value chains of our businesses. It takes account of sustainability aspects from the supply chain through production to subsequent use.
The core elements of our analysis are sustainability criteria relating to the ecological and social issues along the value chain, which Evonik classifies as material. These are closely based on the principles and content of the WBCSD Portfolio Sustainability Assessments (PSA). Together with other inter-national companies, Evonik has been actively involved in developing these principles since 2015. The framework for our sustainability analysis comprises the five process steps outlined in chart C29.
TARGET ATTAINMENT IN 2018 Establish a risk estimate for > 99 percent of
substances placed on the market in quantities of > 1 metric ton p.a. (by the end of 2020): Status: > 80 percent.
Make GPS safety summaries for these substances available via the Evonik website and the ICCA’s GPS portal (by 2020): Around 170 summaries were avail-able in 2018.
Conduct a more far-reaching assessment of all prod-ucts containing > 0.1 percent hazardous chemicals of high concern (hChC) 1 (by 2020): We conducted the first assessments in 2018 to identify ways of optimizing completion of the assessment form.
TARGETS FOR 2019 AND BEYONDEvonik has set the following targets for product stewardship by the end of 2020:
Establish a risk estimate for > 99 percent of substances placed on the market in quantities of > 1 metric ton p.a.
Conduct a more far-reaching assessment of all products containing >0.1 percent hazardous chemicals of high concern (hChC)1, e.g., CMR2 1A/1B, PBT3 (CMSPLUS).
Target achieved Target partially achieved or target horizon extends beyond 2018 Target not achieved
1 hChC = hazardous chemicals of high concern. | 2 CMR = carcinogenic, mutagenic, toxic for reproduction. | 3 PBT = persistent, bioaccumulative, toxic. | 4 A PARC comprises a product or group of products used for a defined application in a specific region.
60 SUSTAINABILITY REPORT 2018 EVONIK INDUSTRIES

The findings are used in a structured overall evaluation of the sustainability performance of our businesses, resulting in allocation to the performance category A++, A+, B, C –, or C – – on the basis of the PARCs analyzed. In this way, the full portfolio of PARCs should be analyzed for each strategic business entity.
The results of our sustainability analysis provide a transparent insight into:• our contribution to reducing our ecological footprint and
maximizing our handprint along the various value chains. • the extended possibilities of product development (e.g.,
the sustainability profiles expected by customers and end-markets).
• the benefits of our products and solutions in overcoming the social challenges of population growth (addressed, for example, in the UN Sustainable Development Goals).
• the exposure of our businesses to issues that are critical for their reputation (e.g., product stewardship, regulatory trends).
The new process will be performed for the first time in 2019 with all business lines at Evonik, in collaboration with the relevant specialist departments. In the first phase, the focus will be on the PARCs assigned high priority on the basis of their significance.
Life cycle assessmentsLife cycle assessments are a focal area of our sustainability analysis. The high expertise and strong operational involve-ment of the life cycle management group plays a key role in ensuring that Evonik has wide-ranging knowledge of the environmental impact of its operations and is able to quantify this. In 2016, we performed life cycle analyses covering around 70 percent of the external sales of our chemical segments.
Our procedure comprises a broad spectrum of methods, including life cycle assessments (LCA), which comprise either a cradle-to-gate analysis covering all stages from prod-uct development through raw material and energy inputs to production, or a cradle-to-grave analysis covering the entire life cycle including subsequent use and disposal. Another tool
is the life cycle-based calculation of the carbon footprint of our products. In addition, we use cross-referencing approaches, where findings, for example from existing LCAs, are used to evaluate similar products.
Resource-saving solutionsEvonik products offer customers resource-saving and energy- efficient solutions for a wide range of applications. In this way we play a part in meeting the rising sustainability require-ments of our markets. At the same time, we are continuing to develop our business opportunities in these markets.
Our sustainability analysis includes an extensive analysis of the contribution made by our products to improving resource efficiency in their respective applications. This covers energy savings and the reduction in greenhouse gas emissions, water consumption, and the use of raw materials. The results confirm that, based on 2016 data, around 50 percent of the sales generated by our chemical segments already come from products that make a measurable contribution to improving the resource efficiency of their applications.
Efficient use of scarce resources/circular economy
Our sustainability analysis in 2017 identified the circular economy as a key sustainability issue for Evonik. The circular economy is about maximizing the use of material flows, i.e., using by-products from one production process as inputs for
another production process. Ideally, renewable energy sources are used for this. The result is optimal use of resources and high value-added.
a Based on data for 2016.b Life cycle assessments are already planned for some of these.
Sales of our chemicals segments covered by life cycle analysesa C28
LCA (cradle to gate)
34 %
LCA (cradle to grave)
18 %
Not yet analyzed 30 %b
Life cycle-based analyses 7 %
Cross-referencing LCA 9 %
Cross-referencing life cycle-based 2 %
61ANNEX
Value chain and products
SUSTAINABILITY IN 2018

To sharpen understanding of the circular economy and drive it forward at Evonik, an interdisciplinary working group was set up in 2018. Evonik already uses the principles of the circular economy in various fields. The working group has reviewed the related contributions, products, and concepts at Evonik and documented them to share experience internally and externally. Here are some examples:
Evonik uses a closed cycle for catalysts containing precious metals. Optimized, broadly based processing technology allows recycling of spent catalysts with high precious metal yields.
VESTENAMER® helps provide sustainable circular flows of rubber. Old tires are recycled into ground rubber and added to asphalt along with a process aid produced by Evonik. The
Sustainability analysis of our business C29
Are there material strong
negative signals?
IDefining
objectives, scope, and process
IIDefining
assessment segments
Market signals
1 Critical substances2 Regulatory trends and global commissions3 Sustainability ambitions along the value chain4 Ecolabels, certification, and standards5 Environmental and social performance6 Contribution to ecological and social value creation7 Contribution to the SDGs8 Internal guidelines and objectives
VReporting
and using the results
IVCategorizing the portfolio
A+
A+
B
B
A++
A++
Are there material strong
positive signals?
Are there material positive signals?
Are there material
weak negative signals?
C –
C –
C – –
C – –
No No Yes
Yes Yes No No Yes
8
7
6
5
4
3
2
1
Product Application
Region
IIIDetecting
market signals
62 SUSTAINABILITY REPORT 2018 EVONIK INDUSTRIES
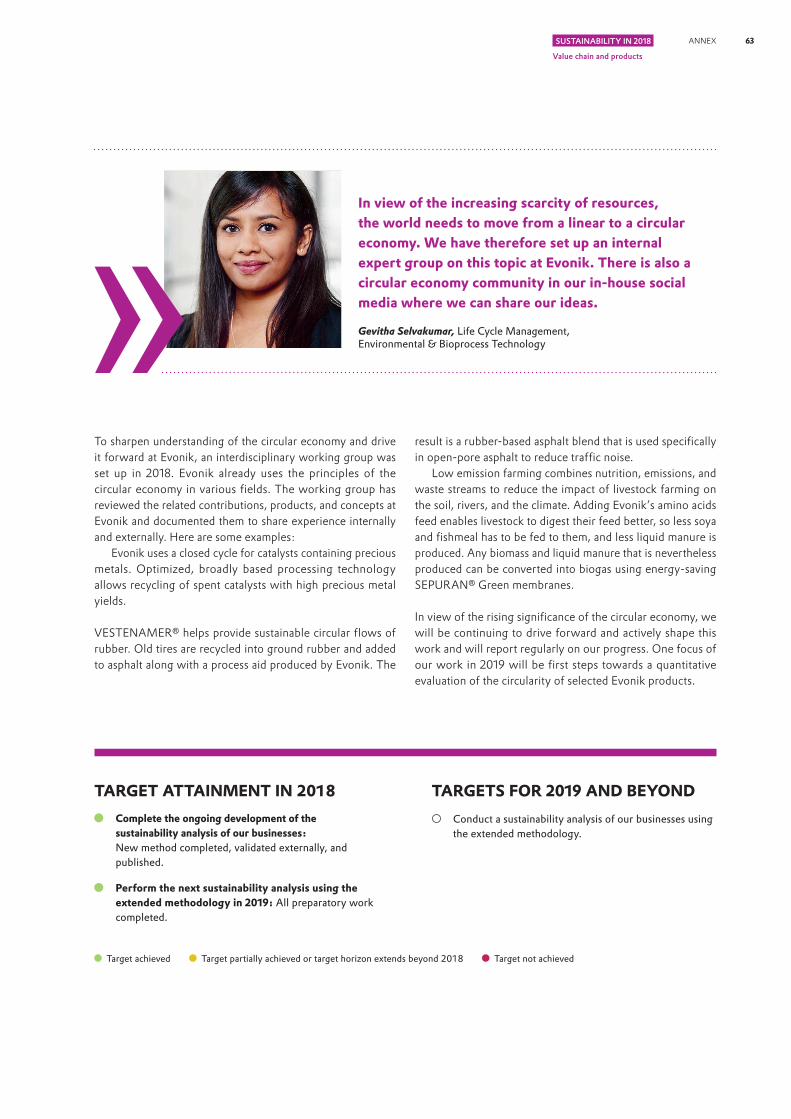
To sharpen understanding of the circular economy and drive it forward at Evonik, an interdisciplinary working group was set up in 2018. Evonik already uses the principles of the circular economy in various fields. The working group has reviewed the related contributions, products, and concepts at Evonik and documented them to share experience internally and externally. Here are some examples:
Evonik uses a closed cycle for catalysts containing precious metals. Optimized, broadly based processing technology allows recycling of spent catalysts with high precious metal yields.
VESTENAMER® helps provide sustainable circular flows of rubber. Old tires are recycled into ground rubber and added to asphalt along with a process aid produced by Evonik. The
result is a rubber-based asphalt blend that is used specifically in open-pore asphalt to reduce traffic noise.
Low emission farming combines nutrition, emissions, and waste streams to reduce the impact of livestock farming on the soil, rivers, and the climate. Adding Evonik’s amino acids feed enables livestock to digest their feed better, so less soya and fishmeal has to be fed to them, and less liquid manure is produced. Any biomass and liquid manure that is nevertheless produced can be converted into biogas using energy-saving SEPURAN® Green membranes.
In view of the rising significance of the circular economy, we will be continuing to drive forward and actively shape this work and will report regularly on our progress. One focus of our work in 2019 will be first steps towards a quantitative evaluation of the circularity of selected Evonik products.
Sustainability analysis of our business C29
Are there material strong
negative signals?
IDefining
objectives, scope, and process
IIDefining
assessment segments
Market signals
1 Critical substances2 Regulatory trends and global commissions3 Sustainability ambitions along the value chain4 Ecolabels, certification, and standards5 Environmental and social performance6 Contribution to ecological and social value creation7 Contribution to the SDGs8 Internal guidelines and objectives
VReporting
and using the results
IVCategorizing the portfolio
A+
A+
B
B
A++
A++
Are there material strong
positive signals?
Are there material positive signals?
Are there material
weak negative signals?
C –
C –
C – –
C – –
No No Yes
Yes Yes No No Yes
8
7
6
5
4
3
2
1
Product Application
Region
IIIDetecting
market signals
TARGET ATTAINMENT IN 2018 Complete the ongoing development of the
sustainability analysis of our businesses: New method completed, validated externally, and published.
Perform the next sustainability analysis using the extended methodology in 2019: All preparatory work completed.
TARGETS FOR 2019 AND BEYOND Conduct a sustainability analysis of our businesses using
the extended methodology.
Target achieved Target partially achieved or target horizon extends beyond 2018 Target not achieved
In view of the increasing scarcity of resources, the world needs to move from a linear to a circular economy. We have therefore set up an internal expert group on this topic at Evonik. There is also a circular economy community in our in-house social media where we can share our ideas.
Gevitha Selvakumar, Life Cycle Management, Environmental & Bioprocess Technology
63ANNEX
Value chain and products
SUSTAINABILITY IN 2018
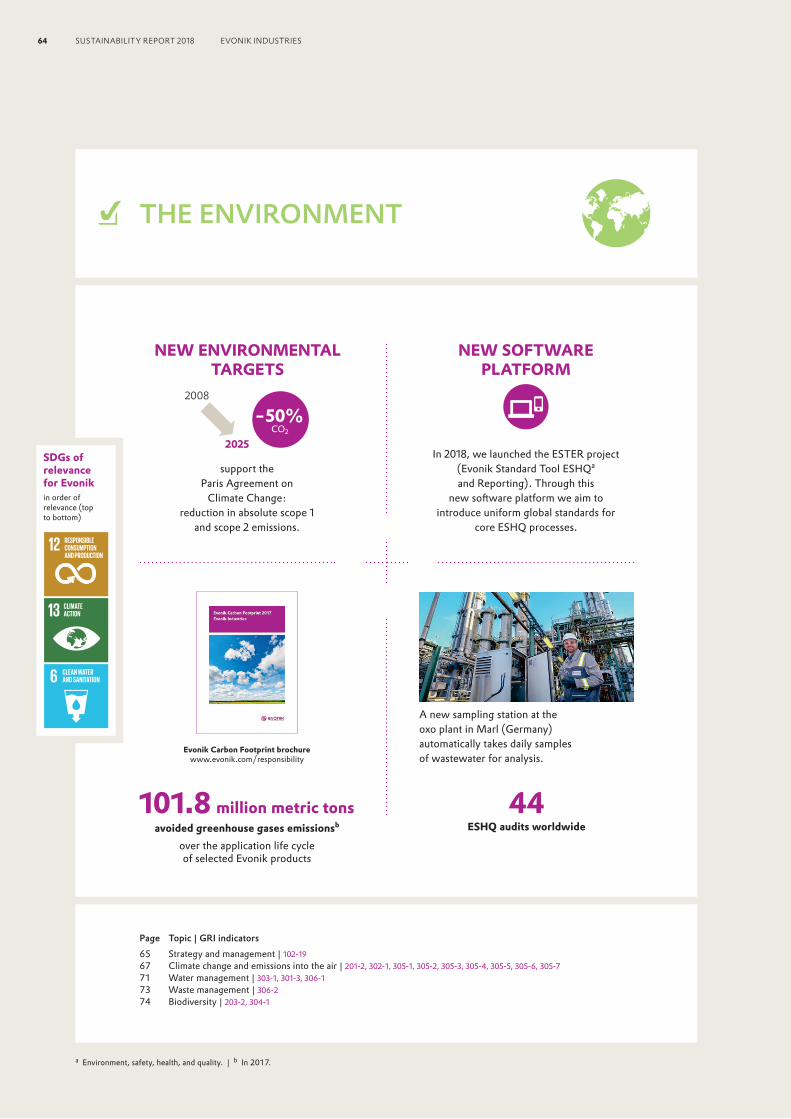
101.8 million metric tonsavoided greenhouse gases emissionsb
over the application life cycle of selected Evonik products
44ESHQ audits worldwide
THE ENVIRONMENT
a Environment, safety, health, and quality. | b In 2017.
Page Topic | GRI indicators65 Strategy and management | 102-1967 Climate change and emissions into the air | 201-2, 302-1, 305-1, 305-2, 305-3, 305-4, 305-5, 305-6, 305-771 Water management | 303-1, 301-3, 306-173 Waste management | 306-274 Biodiversity | 203-2, 304-1
SDGs of relevance for Evonikin order of relevance (top to bottom)
Evonik Carbon Footprint brochurewww.evonik.com/responsibility
A new sampling station at the oxo plant in Marl (Germany) automatically takes daily samples of wastewater for analysis.
NEW SOFTWARE PLATFORM
In 2018, we launched the ESTER project (Evonik Standard Tool ESHQa and Reporting). Through this
new software platform we aim to introduce uniform global standards for
core ESHQ processes.
NEW ENVIRONMENTAL TARGETS
support the Paris Agreement on
Climate Change: reduction in absolute scope 1
and scope 2 emissions.
– 50% CO2
2008
2025
64 SUSTAINABILITY REPORT 2018 EVONIK INDUSTRIES
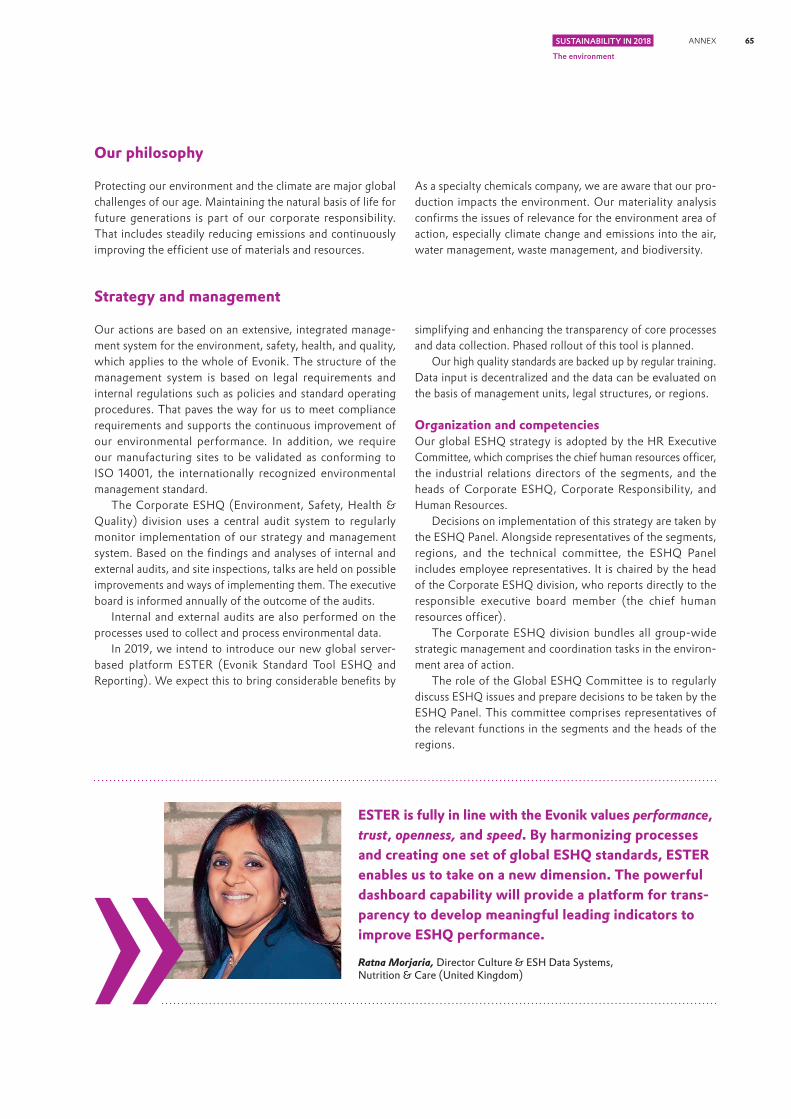
Our philosophy
Protecting our environment and the climate are major global challenges of our age. Maintaining the natural basis of life for future generations is part of our corporate responsibility. That includes steadily reducing emissions and continuously improving the efficient use of materials and resources.
As a specialty chemicals company, we are aware that our pro-duction impacts the environment. Our materiality analysis confirms the issues of relevance for the environment area of action, especially climate change and emissions into the air, water management, waste management, and biodiversity.
Strategy and management
Our actions are based on an extensive, integrated manage-ment system for the environment, safety, health, and quality, which applies to the whole of Evonik. The structure of the management system is based on legal requirements and internal regulations such as policies and standard operating procedures. That paves the way for us to meet compliance requirements and supports the continuous improvement of our environmental performance. In addition, we require our manufacturing sites to be validated as conforming to ISO 14001, the internationally recognized environmental management standard.
The Corporate ESHQ (Environment, Safety, Health & Quality) division uses a central audit system to regularly monitor implementation of our strategy and management system. Based on the findings and analyses of internal and external audits, and site inspections, talks are held on possible improvements and ways of implementing them. The executive board is informed annually of the outcome of the audits.
Internal and external audits are also performed on the processes used to collect and process environmental data.
In 2019, we intend to introduce our new global server- based platform ESTER (Evonik Standard Tool ESHQ and Reporting). We expect this to bring considerable benefits by
simplifying and enhancing the transparency of core processes and data collection. Phased rollout of this tool is planned.
Our high quality standards are backed up by regular training. Data input is decentralized and the data can be evaluated on the basis of management units, legal structures, or regions.
Organization and competenciesOur global ESHQ strategy is adopted by the HR Executive Committee, which comprises the chief human resources officer, the industrial relations directors of the segments, and the heads of Corporate ESHQ, Corporate Responsibility, and Human Resources.
Decisions on implementation of this strategy are taken by the ESHQ Panel. Alongside representatives of the segments, regions, and the technical committee, the ESHQ Panel includes employee representatives. It is chaired by the head of the Corporate ESHQ division, who reports directly to the responsible executive board member (the chief human resources officer).
The Corporate ESHQ division bundles all group-wide strategic management and coordination tasks in the environ-ment area of action.
The role of the Global ESHQ Committee is to regularly discuss ESHQ issues and prepare decisions to be taken by the ESHQ Panel. This committee comprises representatives of the relevant functions in the segments and the heads of the regions.
ESTER is fully in line with the Evonik values performance, trust, openness, and speed. By harmonizing processes and creating one set of global ESHQ standards, ESTER enables us to take on a new dimension. The powerful dashboard capability will provide a platform for trans-parency to develop meaningful leading indicators to improve ESHQ performance.
Ratna Morjaria, Director Culture & ESH Data Systems,Nutrition & Care (United Kingdom)
65ANNEX
The environment
SUSTAINABILITY IN 2018

Specialist knowledge of selected issues is bundled in the ESHQ expert circles, which are convened as required. They are responsible for proposing solutions to specific environmental issues. These are then implemented by the operational and service units. For example, there are expert circles on water stress, management & audits, and internal CO2 pricing.
Status of our environmental targets We set demanding environmental targets for the period 2013–2020. These targets are based on 1 metric ton of output
and the reference year is 2012:• Reduce specific greenhouse gas emissions by 12 percent• Reduce specific water intake by 10 percentA further reduction in production waste was set as an additional target.
The 17 percent reduction in specific greenhouse gas emissions (GHG emissions) compared with the reference base (2012) was in line with the very good level achieved in the previous year. We managed to offset the increase in GHG emissions resulting from acquisition of the J. M. Huber silica business, for example by scaling back electrolysis at our site in Lülsdorf (Germany), and by purchasing additional green certificates for the reduced power requirements at this site.
The water required for our production operations is prin-cipally for once-through cooling at established plants. The amount of surface water required for cooling increased in 2018 as a result of the long period of hot, dry weather in Germany and Belgium. At the same time, water requirements in China decreased due to some production stoppages. Our total specific water intake relative to 2012 was one percentage point lower than in 2017.
Total hazardous and non-hazardous production waste declined by 4,000 metric tons (– 1 percent) in 2018. This was due, among other things, to a reduction in sewage sludge in Antwerp (Belgium) and higher availability of the sulfuric acid cracking plant in Marl (Germany).
Status of our environmental targets 2013–2020 T16
in % compared with 2012 2015 2016 2017 2018 Target 2020
Reduction in specific greenhouse gas emissions a – 11 – 17 – 17 – 17 – 12
Reduction in specific water intake + 7 – 6 – 5 – 6 – 10
a Includes both scope 1 and scope 2 emissions. Scope 2 emissions are calculated using the market-based method in accordance with the GHG Protocol.
New environmental targetsEvonik’s present environmental targets are for the period until 2020 and the target reduction in specific greenhouse gases will be achieved before then. Therefore, we defined new environmental targets in the reporting period.
We are aiming for an absolute reduction in scope 1 and 2 emissions of 50 percent by 2025, compared with the level in 2008 (status of implementation in 2018: 30 percent). This affirms Evonik’s commitment to the Paris Agreement on Climate Change. The relatively short period up to 2025 reflects our view that it is not currently possible to predict technological and regulatory developments beyond this date with sufficient certainty.
We are continuing to pursue our goal of a group-wide reduction in specific water intake, but we are replacing the central indicator by introducing a global water management system and driving forward the related site-specific action plans.
Our activities in 2018Audits of our segments, regions, and sites are conducted to monitor compliance with ISO 14001 validation at our production locations. We conducted 44 ESHQ audits worldwide in 2018. The proportion of output covered by ISO 14001 validation varies because of the addition of new units. However, it is always between 95 and 100 percent.
In 2018, we invested € 43 million (2017: € 42 million) in mea-sures to achieve a further improvement in environmental pro-tection. Investment in environmental protection can fluctuate considerably because it depends on specific projects. The increase in 2018 was principally due to the increase in produc-tion capacity for fumed silica in Antwerp (Belgium).
Operating costs for environmental protection facilities decreased slightly to € 309 million in 2018 (2017: € 310 million), mainly as a result of the divestment of the site at Jayhawk (USA) and shutdown of the site in Kaba (Hungary).
HR Executive Committee
Global ESHQ Committee
ESHQ Expert Circles
ESHQ Panel
Structure of the environment, safety, health, and quality (ESHQ) steering bodies C30
66 SUSTAINABILITY REPORT 2018 EVONIK INDUSTRIES
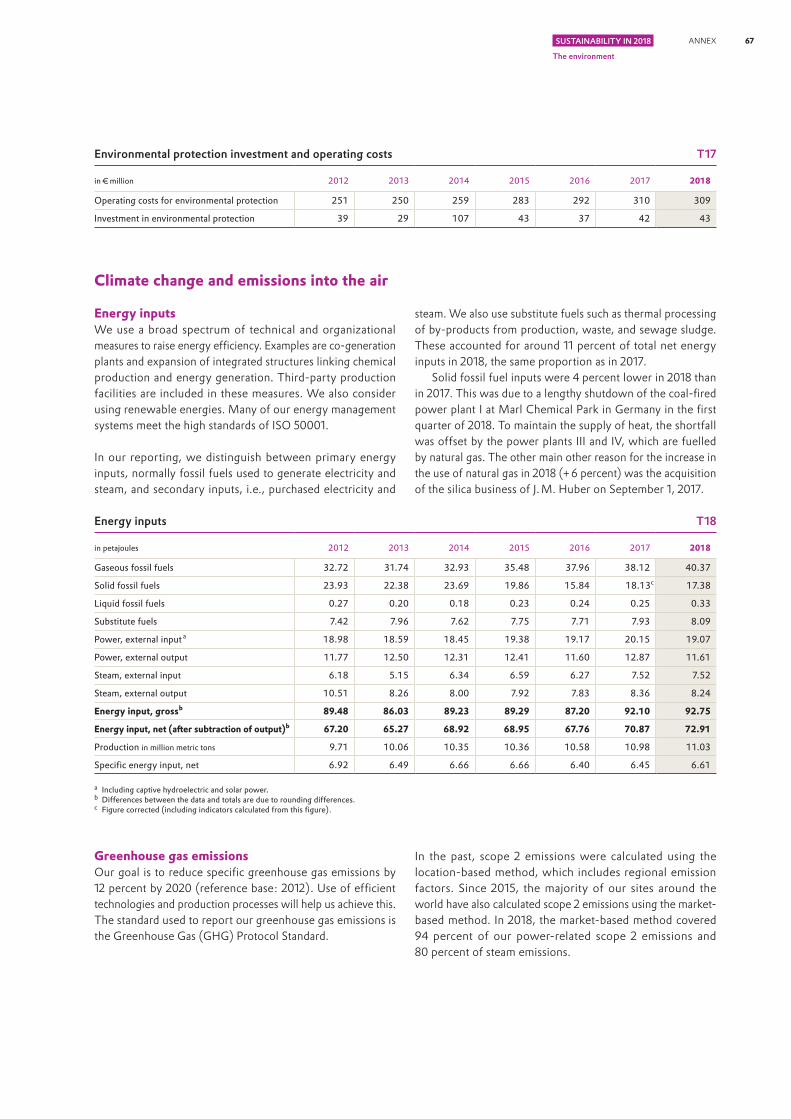
Environmental protection investment and operating costs T17
in € million 2012 2013 2014 2015 2016 2017 2018
Operating costs for environmental protection 251 250 259 283 292 310 309
Investment in environmental protection 39 29 107 43 37 42 43
Climate change and emissions into the air
Energy inputsWe use a broad spectrum of technical and organizational measures to raise energy efficiency. Examples are co-generation plants and expansion of integrated structures linking chemical production and energy generation. Third-party production facilities are included in these measures. We also consider using renewable energies. Many of our energy management systems meet the high standards of ISO 50001.
In our reporting, we distinguish between primary energy inputs, normally fossil fuels used to generate electricity and steam, and secondary inputs, i.e., purchased electricity and
steam. We also use substitute fuels such as thermal processing of by-products from production, waste, and sewage sludge. These accounted for around 11 percent of total net energy inputs in 2018, the same proportion as in 2017.
Solid fossil fuel inputs were 4 percent lower in 2018 than in 2017. This was due to a lengthy shutdown of the coal-fired power plant I at Marl Chemical Park in Germany in the first quarter of 2018. To maintain the supply of heat, the shortfall was offset by the power plants III and IV, which are fuelled by natural gas. The other main other reason for the increase in the use of natural gas in 2018 (+ 6 percent) was the acquisition of the silica business of J. M. Huber on September 1, 2017.
Energy inputs T18
in petajoules 2012 2013 2014 2015 2016 2017 2018
Gaseous fossil fuels 32.72 31.74 32.93 35.48 37.96 38.12 40.37
Solid fossil fuels 23.93 22.38 23.69 19.86 15.84 18.13c 17.38
Liquid fossil fuels 0.27 0.20 0.18 0.23 0.24 0.25 0.33
Substitute fuels 7.42 7.96 7.62 7.75 7.71 7.93 8.09
Power, external input a 18.98 18.59 18.45 19.38 19.17 20.15 19.07
Power, external output 11.77 12.50 12.31 12.41 11.60 12.87 11.61
Steam, external input 6.18 5.15 6.34 6.59 6.27 7.52 7.52
Steam, external output 10.51 8.26 8.00 7.92 7.83 8.36 8.24
Energy input, gross b 89.48 86.03 89.23 89.29 87.20 92.10 92.75
Energy input, net (after subtraction of output) b 67.20 65.27 68.92 68.95 67.76 70.87 72.91
Production in million metric tons 9.71 10.06 10.35 10.36 10.58 10.98 11.03
Specific energy input, net 6.92 6.49 6.66 6.66 6.40 6.45 6.61
a Including captive hydroelectric and solar power.b Differences between the data and totals are due to rounding differences.c Figure corrected (including indicators calculated from this figure).
Greenhouse gas emissionsOur goal is to reduce specific greenhouse gas emissions by 12 percent by 2020 (reference base: 2012). Use of efficient technologies and production processes will help us achieve this. The standard used to report our greenhouse gas emissions is the Greenhouse Gas (GHG) Protocol Standard.
In the past, scope 2 emissions were calculated using the location- based method, which includes regional emission factors. Since 2015, the majority of our sites around the world have also calculated scope 2 emissions using the market- based method. In 2018, the market-based method covered 94 percent of our power-related scope 2 emissions and 80 percent of steam emissions.
67ANNEX
The environment
SUSTAINABILITY IN 2018

Greenhouse gas emissions T19
in thousand metric tons CO2eq a 2012 2013 2014 2015 2016 2017 2018
Scope 1
Carbon dioxide (CO2) 5,879 5,725 5,846 5,525 5,312 5,546 5,636
Methane (CH4) 14 14 14 14 12 14 17
Dinitrogen oxide (N2O) 63 130 66 50 53 47 34
Fluorinated hydrocarbons (HFC) 7.0 6.3 8.1 3.6 3.2 2.8 1.1
Total 5,964.0 5,875.3 5,933.7 5,593.2 5,380.2 5,609.1 5,688.6
Scope 2 b
CO2 gross (location-based) 3,126 2,925 3,003 3,156 3,068 3,272 3,121
CO2 gross (market-based) 4,220 3,996 3,967 4,189 4,084 4,282 3,952
CO2 net c (location-based) 973 859 966 1,058 1,009 991 1,035
CO2 net c (market-based) 1,025 882 909 1,011 1,004 925 882
Production in million metric tons 9.71 10.06 10.35 10.36 10.58 10.98 11.03
GHG emissions, net (market-based) 6,989 6,757 6,843 6,604 6,384 6,534 6,571
GHG emissions, net (market -based) in metric tons CO2 equivalents per metric ton production 0.72 0.67 0.66 0.64 0.60 0.60 0.60
Changes compared with the reference year (2012) in % 100 93 92 89 83 83 83
Differences between the data and totals are due to rounding differences.a Global warming potential factors for a 100-year period for 2012—2017 based on IIPC (Intergovernmental Panel on Climate Change) 1995, and for 2018 based on IPCC 2007.b Recalculated from 2012 using the market-based method of calculating scope 2 emissions to ensure comparability.c Net scope 2 emissions = power and steam sourced externally less power and steam supplied to third parties. The table shows the CO2 emissions associated with the purchase of
electricity and steam as both gross and net values. The net figure shows the position after subtracting electricity and steam supplied to third parties from total inputs. That enables us to eliminate the proportion of energy-related CO2 emissions attributable to third parties at our large multi-users sites, and to generate company-specific indicators.
Greenhouse gases are clearly dominated by CO2 emissions. In line with Evonik’s fuel mix, most scope 1 CO2 emissions (73 percent) are due to the combustion of coal and natural gas. The 1 percent increase in scope 1 greenhouse gas emissions (GHG emissions) to 5.69 million metric tons CO2 equivalents in 2018 was mainly due to the increase in natural gas resulting from first-time inclusion of the J.M. Huber silica business. The business acquired comprises six production sites for silica and one site that produces sodium silicate. The sum of scope 1 and net scope 2 (market-based) GHG emissions also increased by 1 percent to 6.57 million metric tons CO2 equivalents in 2018. Scope 2 emissions are reported on a net basis by deducting electricity and steam sold to third parties from the electricity and steam produced for captive use. The 5 percent reduction in market-based net scope 2 emissions in 2018 was mainly attributable to increased purchases of green certifi-cates at the site in Lülsdorf (Germany) and the reduction in electrolysis activities at this site.
Evonik operates 30 facilities that fall within the scope of the EU Emissions Trading System (EU ETS). The plant in Kaba (Hungary) was shut down in the second quarter of 2018. A plant in Taavetti (Finland) was added as a result of the acquisition of the J. M. Huber silica business. An existing plant in Marl (Germany) was also included for the first time following amendment of the Greenhouse Gas Emissions
Trading Act (polymer production plants are now included in the EU ETS). The plants that fall within the scope of the EU ETS emitted 3.9 million metric tons of CO2 in 2018 (2017: 3.8 million metric tons of CO2).
We constantly strive to make the provision of energy more efficient, improve energy generation still further, and optimize the structure of our integrated energy and manage-ment systems. Our commitment in this area is shown by the fact that many of our sites have obtained, or aim to obtain, validation under ISO 50001. As well as reducing pressure on resources by using co-generation plants at several of our large sites, we have established many integrated structures linking chemical production and energy generation. For example, large amounts of steam generated in exothermic processes at various production facilities are supplied to other plants via steam networks. We also use liquid and gaseous by-products as substitute fuels for energy generation. In addi-tion, steam is generated from the exhaust heat from various incineration plants for waste, sewage sludge, exhaust gases, and wastewater.
The second-largest source of GHG emissions at Evonik, after CO2 emissions from combustion, are N2O emissions from production (in greenhouse gas equivalents). However, they account for less than 1 percent of the total.
68 SUSTAINABILITY REPORT 2018 EVONIK INDUSTRIES
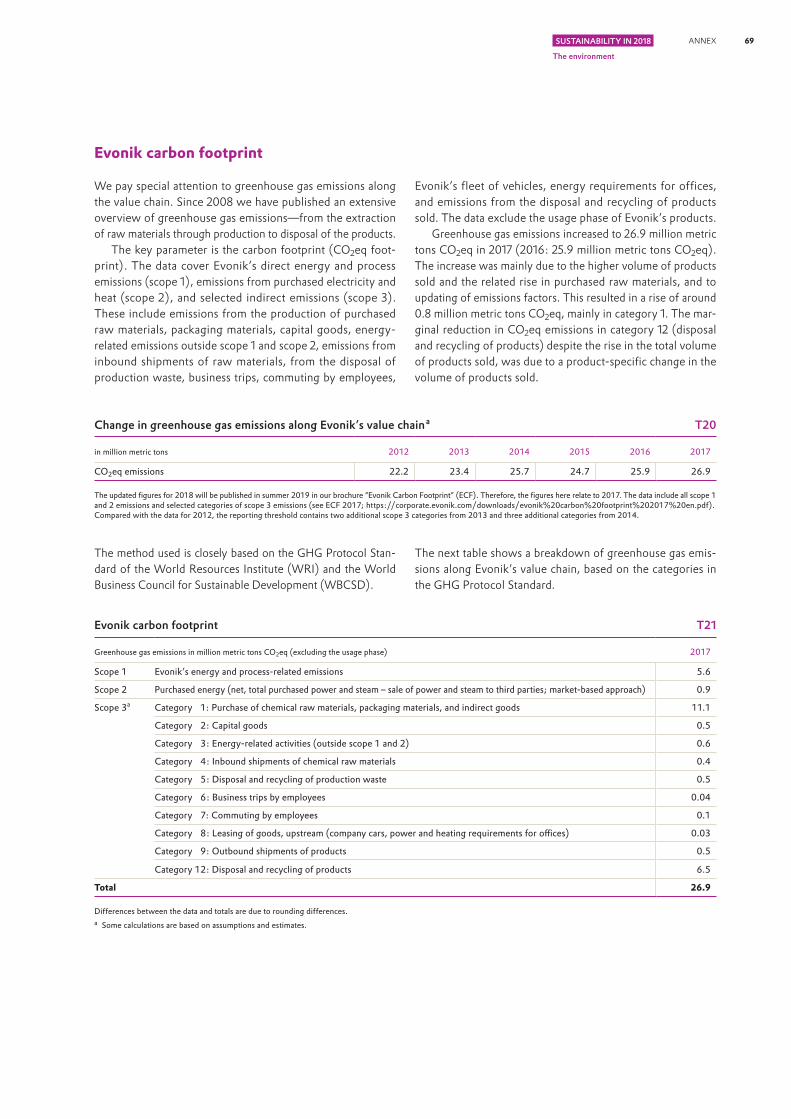
Evonik carbon footprint
We pay special attention to greenhouse gas emissions along the value chain. Since 2008 we have published an extensive overview of greenhouse gas emissions—from the extraction of raw materials through production to disposal of the products.
The key parameter is the carbon footprint (CO2eq foot-print). The data cover Evonik’s direct energy and process emissions (scope 1), emissions from purchased electricity and heat (scope 2), and selected indirect emissions (scope 3). These include emissions from the production of purchased raw materials, packaging materials, capital goods, energy- related emissions outside scope 1 and scope 2, emissions from inbound shipments of raw materials, from the disposal of production waste, business trips, commuting by employees,
Evonik’s fleet of vehicles, energy requirements for offices, and emissions from the disposal and recycling of products sold. The data exclude the usage phase of Evonik’s products.
Greenhouse gas emissions increased to 26.9 million metric tons CO2eq in 2017 (2016: 25.9 million metric tons CO2eq). The increase was mainly due to the higher volume of products sold and the related rise in purchased raw materials, and to updating of emissions factors. This resulted in a rise of around 0.8 million metric tons CO2eq, mainly in category 1. The mar-ginal reduction in CO2eq emissions in category 12 (disposal and recycling of products) despite the rise in the total volume of products sold, was due to a product-specific change in the volume of products sold.
Change in greenhouse gas emissions along Evonik’s value chain a T20
in million metric tons 2012 2013 2014 2015 2016 2017
CO2eq emissions 22.2 23.4 25.7 24.7 25.9 26.9
The updated figures for 2018 will be published in summer 2019 in our brochure “Evonik Carbon Footprint” (ECF). Therefore, the figures here relate to 2017. The data include all scope 1 and 2 emissions and selected categories of scope 3 emissions (see ECF 2017; https://corporate.evonik.com/downloads/evonik%20carbon%20footprint%202017%20en.pdf). Compared with the data for 2012, the reporting threshold contains two additional scope 3 categories from 2013 and three additional categories from 2014.
The method used is closely based on the GHG Protocol Stan-dard of the World Resources Institute (WRI) and the World Business Council for Sustainable Development (WBCSD).
The next table shows a breakdown of greenhouse gas emis-sions along Evonik’s value chain, based on the categories in the GHG Protocol Standard.
Evonik carbon footprint T21
Greenhouse gas emissions in million metric tons CO2eq (excluding the usage phase) 2017
Scope 1 Evonik’s energy and process-related emissions 5.6
Scope 2 Purchased energy (net, total purchased power and steam – sale of power and steam to third parties; market-based approach) 0.9
Scope 3a
Category 1: Purchase of chemical raw materials, packaging materials, and indirect goods 11.1
Category 2: Capital goods 0.5
Category 3: Energy-related activities (outside scope 1 and 2) 0.6
Category 4: Inbound shipments of chemical raw materials 0.4
Category 5: Disposal and recycling of production waste 0.5
Category 6: Business trips by employees 0.04
Category 7: Commuting by employees 0.1
Category 8: Leasing of goods, upstream (company cars, power and heating requirements for offices) 0.03
Category 9: Outbound shipments of products 0.5
Category 12: Disposal and recycling of products 6.5
Total 26.9
Differences between the data and totals are due to rounding differences.a Some calculations are based on assumptions and estimates.
69ANNEX
The environment
SUSTAINABILITY IN 2018
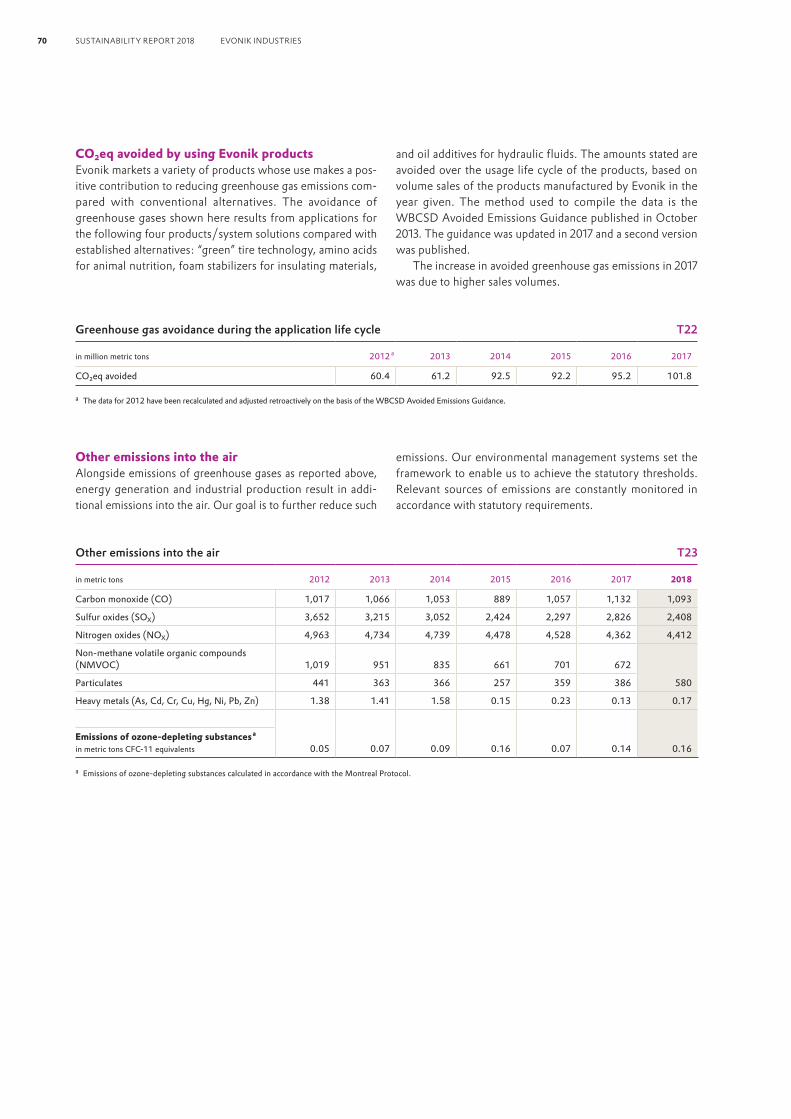
CO2eq avoided by using Evonik productsEvonik markets a variety of products whose use makes a pos-itive contribution to reducing greenhouse gas emissions com-pared with conventional alternatives. The avoidance of greenhouse gases shown here results from applications for the following four products/system solutions compared with established alternatives: “green” tire technology, amino acids for animal nutrition, foam stabilizers for insulating materials,
and oil additives for hydraulic fluids. The amounts stated are avoided over the usage life cycle of the products, based on volume sales of the products manufactured by Evonik in the year given. The method used to compile the data is the WBCSD Avoided Emissions Guidance published in October 2013. The guidance was updated in 2017 and a second version was published.
The increase in avoided greenhouse gas emissions in 2017 was due to higher sales volumes.
Greenhouse gas avoidance during the application life cycle T22
in million metric tons 2012 a 2013 2014 2015 2016 2017
CO2eq avoided 60.4 61.2 92.5 92.2 95.2 101.8
a The data for 2012 have been recalculated and adjusted retroactively on the basis of the WBCSD Avoided Emissions Guidance.
Other emissions into the airAlongside emissions of greenhouse gases as reported above, energy generation and industrial production result in addi-tional emissions into the air. Our goal is to further reduce such
emissions. Our environmental management systems set the framework to enable us to achieve the statutory thresholds. Relevant sources of emissions are constantly monitored in accordance with statutory requirements.
Other emissions into the air T23
in metric tons 2012 2013 2014 2015 2016 2017 2018
Carbon monoxide (CO) 1,017 1,066 1,053 889 1,057 1,132 1,093
Sulfur oxides (SOX) 3,652 3,215 3,052 2,424 2,297 2,826 2,408
Nitrogen oxides (NOX) 4,963 4,734 4,739 4,478 4,528 4,362 4,412
Non-methane volatile organic compounds (NMVOC) 1,019 951 835 661 701 672
Particulates 441 363 366 257 359 386 580
Heavy metals (As, Cd, Cr, Cu, Hg, Ni, Pb, Zn) 1.38 1.41 1.58 0.15 0.23 0.13 0.17
Emissions of ozone-depleting substances a in metric tons CFC-11 equivalents 0.05 0.07 0.09 0.16 0.07 0.14 0.16
a Emissions of ozone-depleting substances calculated in accordance with the Montreal Protocol.
70 SUSTAINABILITY REPORT 2018 EVONIK INDUSTRIES
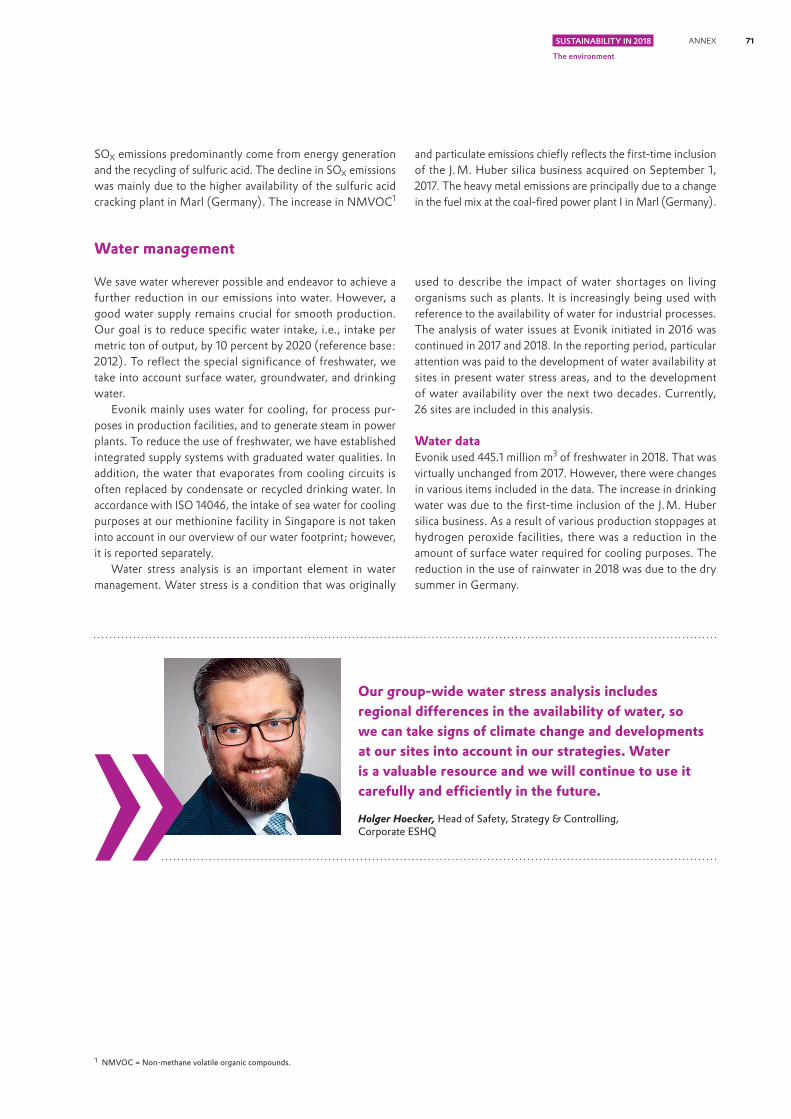
SOX emissions predominantly come from energy generation and the recycling of sulfuric acid. The decline in SOX emissions was mainly due to the higher availability of the sulfuric acid cracking plant in Marl (Germany). The increase in NMVOC1
and particulate emissions chiefly reflects the first-time inclusion of the J. M. Huber silica business acquired on September 1, 2017. The heavy metal emissions are principally due to a change in the fuel mix at the coal-fired power plant I in Marl (Germany).
Water management
We save water wherever possible and endeavor to achieve a further reduction in our emissions into water. However, a good water supply remains crucial for smooth production. Our goal is to reduce specific water intake, i.e., intake per metric ton of output, by 10 percent by 2020 (reference base: 2012). To reflect the special significance of freshwater, we take into account surface water, groundwater, and drinking water.
Evonik mainly uses water for cooling, for process pur-poses in production facilities, and to generate steam in power plants. To reduce the use of freshwater, we have established integrated supply systems with graduated water qualities. In addition, the water that evaporates from cooling circuits is often replaced by condensate or recycled drinking water. In accordance with ISO 14046, the intake of sea water for cooling purposes at our methionine facility in Singapore is not taken into account in our overview of our water footprint; however, it is reported separately.
Water stress analysis is an important element in water management. Water stress is a condition that was originally
used to describe the impact of water shortages on living organisms such as plants. It is increasingly being used with reference to the availability of water for industrial processes. The analysis of water issues at Evonik initiated in 2016 was continued in 2017 and 2018. In the reporting period, particular attention was paid to the development of water availability at sites in present water stress areas, and to the development of water availability over the next two decades. Currently, 26 sites are included in this analysis.
Water dataEvonik used 445.1 million m3 of freshwater in 2018. That was virtually unchanged from 2017. However, there were changes in various items included in the data. The increase in drinking water was due to the first-time inclusion of the J. M. Huber silica business. As a result of various production stoppages at hydrogen peroxide facilities, there was a reduction in the amount of surface water required for cooling purposes. The reduction in the use of rainwater in 2018 was due to the dry summer in Germany.
1 NMVOC = Non-methane volatile organic compounds.
Our group-wide water stress analysis includes regional differences in the availability of water, so we can take signs of climate change and developments at our sites into account in our strategies. Water is a valuable resource and we will continue to use it carefully and efficiently in the future.
Holger Hoecker, Head of Safety, Strategy & Controlling,Corporate ESHQ
71ANNEX
The environment
SUSTAINABILITY IN 2018

Water intake by source T24
in million m3 2012 2013 2014 2015 2016 2017 2018
Drinking water a 18.2 18.4 19.2 18.5 18.1 17.7 21.5
Groundwater 84.7 77.7 80.9 80.1 75.8 77.6 78.7
Surface water 313.9 315.0 394.9 371.8 331.6 347.2 341.6
Recycling of water from third parties and use of rainwater 4.0 2.9 2.6 4.3 3.4 3.8 3.3
Total freshwaterb 420.9 413.9 497.6 474.6 429.1 446.3 445.1
Salt water (sea water) – – – 41.9 130.9 130.2 108.7
Total 420.9 413.9 497.6 516.5 560.0 576.5 553.8
Production in million metric tons 9.71 10.06 10.35 10.36 10.58 10.98 11.03
Specific water intake b
in m3 freshwater per metric ton production 41.2 39.2 46.3 43.9 38.7 38.9 38.7
Changes compared with the reference year (2012) in % 100 95 112 107 94 95 94
Differences between the data and totals are due to rounding differences. a Water from municipal or other utilities.b Excluding water for remediation purposes.
About 77 percent of the freshwater used in 2018 was surface water, mainly from rivers. 1 percent comprised recycled water and rainwater. Around 96 percent (1,811 million m3) of our total water intake was used for cooling purposes in energy generation and production. Only 4 percent (70 million m3) was used for production purposes. Water used in closed cooling circuits is included when calculating the proportion
of total water that is used for cooling. 73 percent of cooling of production facilities used closed-circuit systems with recooling facilities. The remaining facilities were cooled using once-through systems. Most of the surface water and sea water reported was used for once-through cooling. In addition, around 63 percent of groundwater intake was for this type of cooling.
Cooling water and water discharge T25
in million m3 2012 2013 2014 2015 2016 2017 2018
Cooling circuitsa 1,101 1,141 1,250 1,293 1,262 1,327 1,327
Once-through cooling waterb 340.7 339.4 419.5 445.2 494.3 510.2 483.6
Process water (including drinking water and water from sanitary installations) c 55.4 54.6 55.3 54.0 53.0 52.4 58.2
Total water discharged d 396.1 394.0 474.8 499.2 547.3 562.7 541.8
Differences between the data and totals are due to rounding differences.a Water used in cooling circuits is reused several times. b Including salt water. c Direct and indirect discharge and water sold to third parties. d Total once-through cooling and process water.
The difference between water intake and water discharge is due to the use of water, among other things, to produce steam, in production, and to cover evaporation losses. In 2018, the difference was 12.0 million m3 (2017: 13.8 million m3).
Emissions into waterOur sites aim to make a contribution to protecting natural water resources. When planning new production plants, we
therefore consider the use of processes that generate little or no wastewater. We continue these efforts in the operational phase. We also have high technology standards, and infra-structure for the disposal of wastewater at our sites. Waste-water discharged from our sites is carefully monitored by regular sampling and continuous measuring equipment.
72 SUSTAINABILITY REPORT 2018 EVONIK INDUSTRIES

Wastewater loads a T26
in metric tons 2012 2013 2014 2015 2016 2017 2018
Chemical oxygen demand (COD) 4,787 4,767 4,302 4,808 4,633 5,399 5,261
Total nitrogen (N) 447 469 441 434 388 359 330
Total phosphorus (P) 96 97 95 84 107 100 104
Adsorbable organic halogen compounds (AOX) 1.8 1.7 1.9 1.7 1.9 1.7 1.7
Heavy metals (As, Cd, Cr, Cu, Hg, Ni, Pb, Zn) 5.5 5.1 5.1 5.6 5.6 5.7 5.7
a The data on wastewater loads comprise all direct discharges into receiving water and proportionate indirect discharges.
Chemical oxygen demand (COD) accounts for the highest proportion of wastewater loads. This is the concentration of all substances in the wastewater that can be oxidized under certain conditions.
The slight decline in COD and the total nitrogen load in 2018 was partly due to isolated changes in the product mix and to the shutdown of the production site in Kaba (Hungary). The remaining wastewater loads were unchanged or around the level of previous years.
Waste management
Our goal is to further reduce production waste. The follow-ing priorities have therefore been set for waste management. The first priority is to avoid waste through continuous process improvements and by extending integrated production systems. If this is not possible, waste should be recycled or used to generate energy and, as a last resort, it should be disposed of safely.
We use catalysts as one way to increase yields and reduce side reactions. Integrated material flows are another tool. We also use the benefits of integrated production sites and systems
for systematic waste management. Sewage sludge can also be reused within the integrated production structure. After dewatering, it is thermally processed by incinerating it in a separate incineration plant with integrated flue gas treatment. Some of the exhaust gases from the production plants are used as substitute fuels in this process. The incineration gases are then used to generate 20 bar steam. To conserve resources, at many of our sites we use substitute fuels such as liquid residues from production processes.
Waste T27
in thousand metric tons 2012 2013 2014 2015 2016 2017 2018
Hazardous production waste 227 218 212 213 227 244 240
of which reprocessed 138 137 131 132 133 145a 140
of which disposed of 89 81 81 81 94 98a 100
Non-hazardous production waste 160 152 156 153 124 153 154
of which reprocessed 104 104 110 93 71 91 84
of which disposed of 56 48 46 60 53 63 70
Subtotal production waste 387 370 368 366 351 397 393
Hazardous building and demolition rubble 32 23 19 8 14 42 20
of which reprocessed 4 3 6 2 5 22 3
of which disposed of 28 20 14 6 9 20 17
Non-hazardous building and demolition rubble 96 97 109 82 73 73 58
of which reprocessed 65 64 87 62 50 55 31
of which disposed of 31 33 22 20 23 18 27
Total 515 489 497 455 438 512 471
Differences between the data and totals are due to rounding differences.a Corrected data.
73ANNEX
The environment
SUSTAINABILITY IN 2018

In 2018, the total amount of waste decreased by 8 percent compared with 2017 to 471,000 metric tons. Total hazardous and non-hazardous production waste fell by 1 percent to 393,000 metric tons (2017: 397,000 metric tons), although non-hazardous production waste increased slightly, by 1,000 metric tons, mainly due the acquisition of the J. M. Huber silica business. Hazardous production waste declined
by 4,000 metric tons, principally because availability of the sulfuric acid cracking plant in Marl (Germany) was higher in the previous year.
Building and demolition rubble can fluctuate considerably between years because it depends on specific projects. In 2018, there was a substantial drop of 33 percent, mainly because building activity in Marl (Germany) was lower than in 2017.
Waste management T28
in thousand metric tons 2012 2013 2014 2015 2016 2017 2018
Incineration with recycling of heat energy 68 66 63 64 58 61 a 59
Disposal by incineration 84 84 90 82 93 97 a 105
Recycling (including composting) 181 185 224 176 127 189 154
Landfill 58 51 31 46 50 62 58
Chemical/physical/biological treatment 24 18 19 7 16 19 21
Other disposal methods 37 30 23 21 20 22 29
Other reprocessing methods 63 56 47 61 75 62 46
Total a 515 489 497 455 438 511 471
Differences between the data and totals are due to rounding differences.a Corrected data.
The percentage of waste reprocessed comprises recycled substances, incineration with recycling of heat energy, and other disposal methods. The reprocessing rate dropped to 55 percent in 2018 (2017: 61 percent). Due to the reduction in building activity, there was less construction and demolition
waste for reprocessing. Evonik develops methods of recycling waste in accordance with the statutory framework. For exam-ple, we recycle or re-use precious metal catalysts and industrial packaging; see the section headed “Circular economy” in the chapter “Value chain and products.”
Biodiversity
Biodiversity has been included in our materiality analysis since 2017 in response to feedback from internal and external stakeholders.
The starting points for our examination of biodiversity are conventional environmental topics such as emissions into water and the air, and responsible water and waste manage-ment. We have set targets for these and report regularly on their attainment.
We are aware that our business operations involve both opportunities and risks for biological diversity. This applies, above all, to our global production, but also includes the raw materials we purchase, and the use of our products. Declining
biodiversity has a negative effect on Evonik’s business activ-ities. At the same time, our value chains can harbor risks for biodiversity.
However, our products also make a contribution to main-taining biodiversity. Examples are amino acids for the nutrition of poultry, pigs, and cattle. These products greatly reduce the agricultural land required to produce feed. In this way, they protect habitats. The use of our amino acids in aquaculture as a replacement for fishmeal and fish oil helps protect marine biodiversity. Evonik and DSM have jointly developed an innovative process for biotechnological production of omega-3 fatty acids from algae This can avoid the use of fish oil, which is a limited resource.
74 SUSTAINABILITY REPORT 2018 EVONIK INDUSTRIES

Activities in 2018One focus of our work in 2018 was identifying which of the UN Sustainable Development Goals (SDGs) are relevant for Evonik (see chapter “Strategy and growth”). Biodiversity plays a part, in particular, in SDG 12 (responsible consump-tion and production), which is relevant for Evonik. In future, we will therefore be looking more closely at biodiversity, identifying links to our sites and business activities, and, in
the intermediate term, developing an Evonik position on biodiversity covering all value chains.
In view of this, in 2018 we extended our biodiversity analysis by introducing a geoinformation system. Based on data from the IBAT Alliance 1, we examine the potential impact of our global sites on areas of especial significance for biodiversity. The next table shows our ten largest production sites adjacent to conservation areas.
Evonik production sites adjacent to conservation areas T29
Production site Country Area in km² IUCNa categories Ramsarb area
Marl Germany 7.484 IV, V
Lafayette USA 7.004 V
Morrisburg Canada 1.132 Ia
Antwerp Belgium 1.077 IV
Lülsdorf Germany 1.003 V
Hanau Germany 0.774 IV, V
Rheinfelden Germany 0.555 V
Worms Germany 0.481 V
Weiterstadt Germany 0.418 V
Wesseling Germany 0.329 IV, V
a IUCN = International Union for Conservation of Nature.b Ramsar Convention = convention on wetlands, especially as habitats for waterfowl.
In principle, the industrial premises used by Evonik do not include any protected or restored natural habitats. However, some of our sites are adjacent to conservation areas.
For example, as part of a project for which authorization was required, a flora, fauna, and habitat study was conducted
at Marl Chemical Park in Germany to evaluate the potential adverse impact of our activities on the conservation area. Regular review and updating of environmental data is important to ensure that timely action can be taken in the event of any negative impact.
Maintaining biodiversity is an important issue for us all. For Evonik, it involves opportunities and risks. With our new geo information system we can now analyze our sites more effectively, making it easier to identify where action may be needed.
Denis Sepoetro, Life Cycle Management, Environmental & Bioprocess Technology
1 The IBAT Alliance comprises the following four non-governmental organizations: (1) BirdLife International, (2) Conservation International, (3) International Union for Conservation of Nature (IUCN), (4) United Nations Environment Programme World Conservation Monitoring Centre (UNEP-WCMC).
75ANNEX
The environment
SUSTAINABILITY IN 2018
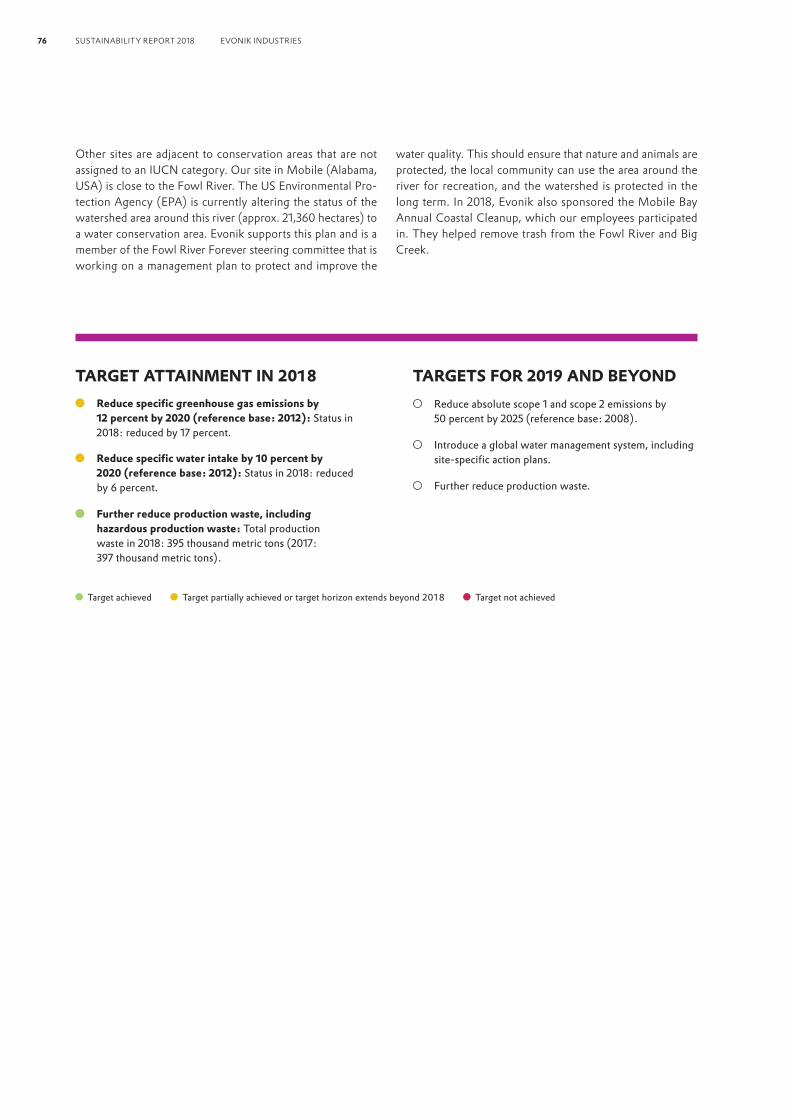
Other sites are adjacent to conservation areas that are not assigned to an IUCN category. Our site in Mobile (Alabama, USA) is close to the Fowl River. The US Environmental Pro-tection Agency (EPA) is currently altering the status of the watershed area around this river (approx. 21,360 hectares) to a water conservation area. Evonik supports this plan and is a member of the Fowl River Forever steering committee that is working on a management plan to protect and improve the
water quality. This should ensure that nature and animals are protected, the local community can use the area around the river for recreation, and the watershed is protected in the long term. In 2018, Evonik also sponsored the Mobile Bay Annual Coastal Cleanup, which our employees participated in. They helped remove trash from the Fowl River and Big Creek.
TARGET ATTAINMENT IN 2018 Reduce specific greenhouse gas emissions by
12 percent by 2020 (reference base: 2012): Status in 2018: reduced by 17 percent.
Reduce specific water intake by 10 percent by 2020 (reference base: 2012): Status in 2018: reduced by 6 percent.
Further reduce production waste, including hazardous production waste: Total production waste in 2018: 395 thousand metric tons (2017: 397 thousand metric tons).
TARGETS FOR 2019 AND BEYOND Reduce absolute scope 1 and scope 2 emissions by
50 percent by 2025 (reference base: 2008).
Introduce a global water management system, including site-specific action plans.
Further reduce production waste.
Target achieved Target partially achieved or target horizon extends beyond 2018 Target not achieved
76 SUSTAINABILITY REPORT 2018 EVONIK INDUSTRIES

SDGs of relevance for Evonik in order of relevance (top to bottom)
Page Topic | GRI indicators78 Occupational and plant safety | 102-11, 102-13, 102-43, 403-1, 403-280 Transportation safety and logistics | 403-3, 403-4, 416-1
SAFETY
SAFETY INDICATORS AT A VERY GOOD LEVEL
TRANSPORTATION SAFETY
5.0 million metric tonsoutgoing shipments of
hazardous goods(2017: 4.1 million metric tons)
4.5 million metric tonsoutgoing shipments of
other goods(2017: 4.5 million metric tons)
Training in the safe transportation of hazardous goods at Evonik’s site in Delfzijl (Netherlands).
Accident frequency rate
0.871.16
2018 2017 Target ≤ 1.3
Incident frequency rate
1.081.11
2018 2017 Target ≤ 1.1
“Maximum safety is the fundamental precondition for
the operation and performance of our facilities.”CHRISTIAN KULLMANN
Chairman of the Executive Board
77ANNEX
Safety
SUSTAINABILITY IN 2018
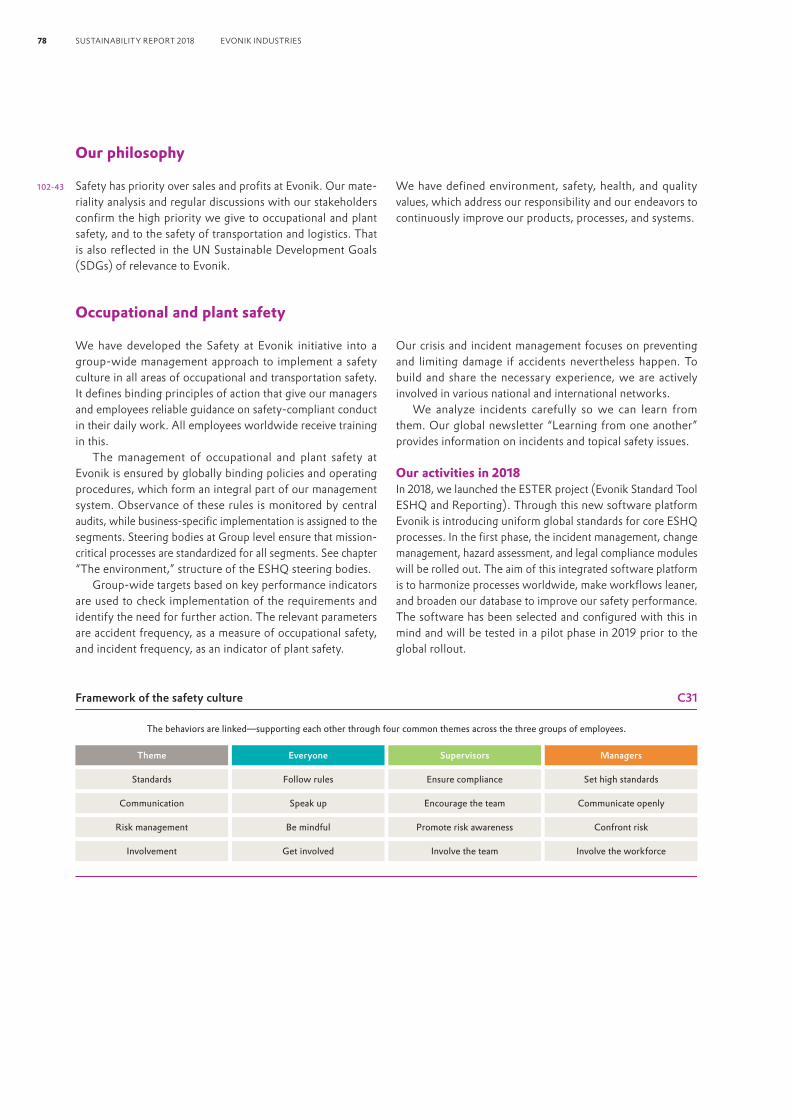
Our philosophy
Safety has priority over sales and profits at Evonik. Our mate-riality analysis and regular discussions with our stakeholders confirm the high priority we give to occupational and plant safety, and to the safety of transportation and logistics. That is also reflected in the UN Sustainable Development Goals (SDGs) of relevance to Evonik.
We have defined environment, safety, health, and quality values, which address our responsibility and our endeavors to continuously improve our products, processes, and systems.
Occupational and plant safety
We have developed the Safety at Evonik initiative into a group-wide management approach to implement a safety culture in all areas of occupational and transportation safety. It defines binding principles of action that give our managers and employees reliable guidance on safety-compliant conduct in their daily work. All employees worldwide receive training in this.
The management of occupational and plant safety at Evonik is ensured by globally binding policies and operating procedures, which form an integral part of our management system. Observance of these rules is monitored by central audits, while business-specific implementation is assigned to the segments. Steering bodies at Group level ensure that mission- critical processes are standardized for all segments. See chapter “The environment,” structure of the ESHQ steering bodies.
Group-wide targets based on key performance indicators are used to check implementation of the requirements and identify the need for further action. The relevant parameters are accident frequency, as a measure of occupational safety, and incident frequency, as an indicator of plant safety.
Our crisis and incident management focuses on preventing and limiting damage if accidents nevertheless happen. To build and share the necessary experience, we are actively involved in various national and international networks.
We analyze incidents carefully so we can learn from them. Our global newsletter “Learning from one another” provides information on incidents and topical safety issues.
Our activities in 2018In 2018, we launched the ESTER project (Evonik Standard Tool ESHQ and Reporting). Through this new software platform Evonik is introducing uniform global standards for core ESHQ processes. In the first phase, the incident management, change management, hazard assessment, and legal compliance modules will be rolled out. The aim of this integrated software platform is to harmonize processes worldwide, make workflows leaner, and broaden our database to improve our safety performance. The software has been selected and configured with this in mind and will be tested in a pilot phase in 2019 prior to the global rollout.
Theme Everyone Supervisors Managers
Standards
Risk management
Communication
Involvement
Follow rules
Be mindful
Speak up
Get involved
Ensure compliance
Promote risk awareness
Encourage the team
Involve the team
Set high standards
Confront risk
Communicate openly
Involve the workforce
Framework of the safety culture C31
The behaviors are linked—supporting each other through four common themes across the three groups of employees.
102-43
78 SUSTAINABILITY REPORT 2018 EVONIK INDUSTRIES
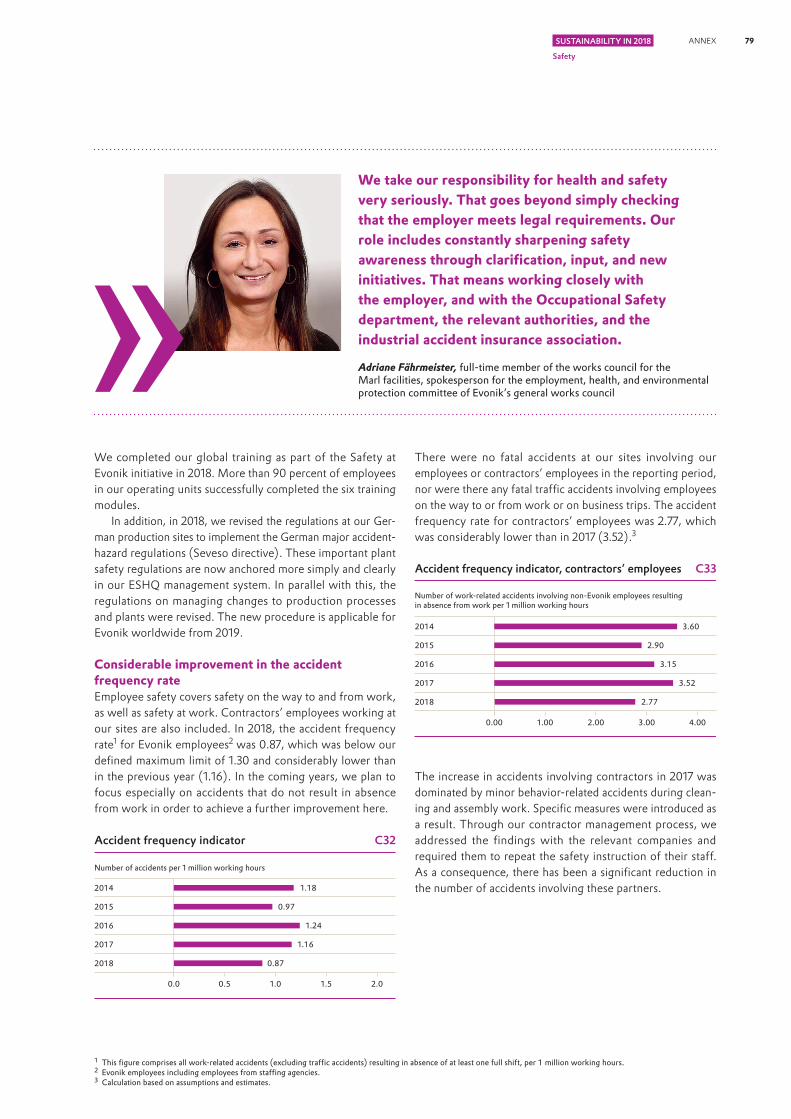
We completed our global training as part of the Safety at Evonik initiative in 2018. More than 90 percent of employees in our operating units successfully completed the six training modules.
In addition, in 2018, we revised the regulations at our Ger-man production sites to implement the German major accident- hazard regulations (Seveso directive). These important plant safety regulations are now anchored more simply and clearly in our ESHQ management system. In parallel with this, the regulations on managing changes to production processes and plants were revised. The new procedure is applicable for Evonik worldwide from 2019.
Considerable improvement in the accident frequency rateEmployee safety covers safety on the way to and from work, as well as safety at work. Contractors’ employees working at our sites are also included. In 2018, the accident frequency rate1 for Evonik employees2 was 0.87, which was below our defined maximum limit of 1.30 and considerably lower than in the previous year (1.16). In the coming years, we plan to focus especially on accidents that do not result in absence from work in order to achieve a further improvement here.
There were no fatal accidents at our sites involving our employees or contractors’ employees in the reporting period, nor were there any fatal traffic accidents involving employees on the way to or from work or on business trips. The accident frequency rate for contractors’ employees was 2.77, which was considerably lower than in 2017 (3.52).3
The increase in accidents involving contractors in 2017 was dominated by minor behavior-related accidents during clean-ing and assembly work. Specific measures were introduced as a result. Through our contractor management process, we addressed the findings with the relevant companies and required them to repeat the safety instruction of their staff. As a consequence, there has been a significant reduction in the number of accidents involving these partners.
1 This figure comprises all work-related accidents (excluding traffic accidents) resulting in absence of at least one full shift, per 1 million working hours.2 Evonik employees including employees from staffing agencies.3 Calculation based on assumptions and estimates.
Accident frequency indicator C32
Number of accidents per 1 million working hours
2014
0.87
2015
2016
2017
2018
0.5 1.0 1.5 2.00.0
1.18
0.97
1.24
1.16
Accident frequency indicator, contractors’ employees C33
Number of work-related accidents involving non-Evonik employees resultingin absence from work per 1 million working hours
2014
2.77
2015
2016
2017
2018
1.00 2.00 3.00 4.000.00
3.60
2.90
3.15
3.52
We take our responsibility for health and safety very seriously. That goes beyond simply checking that the employer meets legal requirements. Our role includes constantly sharpening safety awareness through clarification, input, and new initiatives. That means working closely with the employer, and with the Occupational Safety department, the relevant authorities, and the industrial accident insurance association.
Adriane Fährmeister, full-time member of the works council for the Marl facilities, spokesperson for the employment, health, and environmental protection committee of Evonik’s general works council
79ANNEX
Safety
SUSTAINABILITY IN 2018

Incident frequency indicator at a very good levelIn 2018, we once again documented the process safety of our plants based on the number of incidents involving the release of substances, fire, or explosion (process safety performance indicator defined by the European Chemical Industry Council, Cefic). There were 1.08 incidents per 1 million working hours. We were therefore within our target, which sets an upper limit of 1.10.
The development of the incident frequency indicator over the past three years shows that the measures introduced are having a long-term effect.
Transportation safety and logistics
Safe transportation of goods is extremely important for us. Logistics service providers for transportation are selected carefully using a uniform process and their performance is reviewed regularly. That includes evaluating the Responsible Care® performance of all transportation providers. Our aim is to minimize risk at all stages, from loading through transportation to unloading. The standards we set for the transportation of dangerous goods are even higher than the national and inter-national regulations.
Activities in 2018To support safe transportation by logistics partners, Evonik defines requirements profiles for logistics service providers and collection by customers. In addition to quality manage-ment, the specific aim of these profiles is to ensure safety and properly secured loading, and to make sure that environmen-tal and sustainability aspects are taken into account in the transportation of chemicals. We extended this concept in 2018. In this context, we examined warehouse services and started to introduce specific measures. This should be com-pleted in 2019.
Incident frequency indicator C34
Number of incidents per 1 million working hours
2014
2015
2016
2017
2018
0.5 1.0 1.5 2.00.0
1.08
1.40
1.29
0.95
1.11
TARGET ATTAINMENT IN 2018We set annual limits for the occupational safety and plant safety indicators. For 2018, these were:
Accident frequency rate should be ≤ 1.30: In 2018, it was 0.87.
Incident frequency rate should be ≤ 1.10: In 2018, it was 1.08.
Create greater transparency and harmonize group-wide ESHQ processes. Take the first steps towards introducing a new technical platform: This target was achieved by revising the regulations implementing the Seveso directive and anchoring them in the ESHQ management system. The ESTER project to introduce a new ESHQ platform was launched.
TARGETS FOR 2019 Accident frequency rate should be ≤ 1.30.
Incident frequency rate should be ≤ 1.10.
ESTER pilot phase; global rollout of ESTER, starting in the second half of the year.
Target achieved Target partially achieved or target horizon extends beyond 2018 Target not achieved
80 SUSTAINABILITY REPORT 2018 EVONIK INDUSTRIES
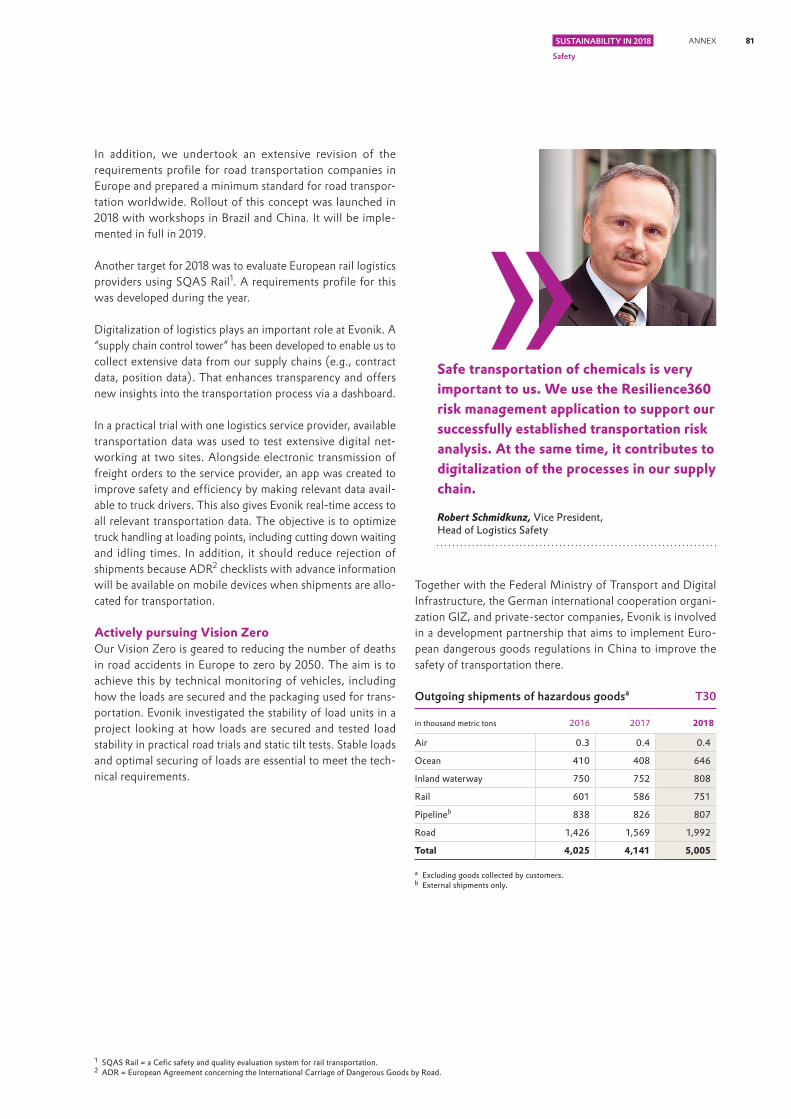
In addition, we undertook an extensive revision of the requirements profile for road transportation companies in Europe and prepared a minimum standard for road transpor-tation worldwide. Rollout of this concept was launched in 2018 with workshops in Brazil and China. It will be imple-mented in full in 2019.
Another target for 2018 was to evaluate European rail logistics providers using SQAS Rail1. A requirements profile for this was developed during the year.
Digitalization of logistics plays an important role at Evonik. A “supply chain control tower” has been developed to enable us to collect extensive data from our supply chains (e.g., contract data, position data). That enhances transparency and offers new insights into the transportation process via a dashboard.
In a practical trial with one logistics service provider, available transportation data was used to test extensive digital net-working at two sites. Alongside electronic transmission of freight orders to the service provider, an app was created to improve safety and efficiency by making relevant data avail-able to truck drivers. This also gives Evonik real-time access to all relevant transportation data. The objective is to optimize truck handling at loading points, including cutting down waiting and idling times. In addition, it should reduce rejection of shipments because ADR2 checklists with advance information will be available on mobile devices when shipments are allo-cated for transportation.
Actively pursuing Vision ZeroOur Vision Zero is geared to reducing the number of deaths in road accidents in Europe to zero by 2050. The aim is to achieve this by technical monitoring of vehicles, including how the loads are secured and the packaging used for trans-portation. Evonik investigated the stability of load units in a project looking at how loads are secured and tested load stability in practical road trials and static tilt tests. Stable loads and optimal securing of loads are essential to meet the tech-nical requirements.
Together with the Federal Ministry of Transport and Digital Infrastructure, the German international cooperation organi-zation GIZ, and private-sector companies, Evonik is involved in a development partnership that aims to implement Euro-pean dangerous goods regulations in China to improve the safety of transportation there.
Outgoing shipments of hazardous goodsa T30
in thousand metric tons 2016 2017 2018
Air 0.3 0.4 0.4
Ocean 410 408 646
Inland waterway 750 752 808
Rail 601 586 751
Pipelineb 838 826 807
Road 1,426 1,569 1,992
Total 4,025 4,141 5,005
a Excluding goods collected by customers. b External shipments only.
1 SQAS Rail = a Cefic safety and quality evaluation system for rail transportation.2 ADR = European Agreement concerning the International Carriage of Dangerous Goods by Road.
Safe transportation of chemicals is very important to us. We use the Resilience360 risk management application to support our successfully established transportation risk analysis. At the same time, it contributes to digitalization of the processes in our supply chain.
Robert Schmidkunz, Vice President, Head of Logistics Safety
81ANNEX
Safety
SUSTAINABILITY IN 2018

Outgoing shipments of other goodsa T31
in thousand metric tons 2016 2017 2018
Air 3 5 6
Ocean 1,106 1,221 1,332
Inland waterway 103 52 116
Rail 457 459 331
Pipelineb 40 20 36
Road 2,369 2,712 2,684
Total 4,078 4,469 4,504
a Excluding goods collected by customers. b External shipments only.
Since 2018, evaluation of accidents during shipment of our goods has been based on the criteria set out in section 1.8.5 ADR. The aim is to enhance transparency and bring Evonik into line with international standards. In 2018, a truck driver
in the USA died when he lost control of his vehicle as a result of a burst tire and collided with another vehicle. This accident resulted in spillage of around 500 liters of hydrogen peroxide. In Germany, there was an incident involving iso-phorone diamine leaking from the manhole cover on a truck. As a result, a highway had to be closed for two days for cleaning.
Sustainable logisticsEvonik has been optimizing its internal logistics fleet for several years. Our locomotive strategy includes stepwise replacement of seven locomotives in Marl (Germany) by modern models that are more powerful and have far lower diesel consumption. So far five new locomotives have been purchased, two of them in 2018. In 2019, two old shunters at the Rheinfelden site in Germany will be replaced by a modern locomotive and a road/rail shunter. By modernizing its fleet, Evonik is helping to reduce the wear of rails, fuel consumption, and emissions.
TARGET ATTAINMENT IN 2018 Establish a requirements profile for warehouse
services: Establishment of the requirements profile is nearing completion.
Establish minimum global standards for logistics service providers: Establishment of minimum global standards is nearing completion.
Evaluate European rail logistics providers using SQAS Rail1: The evaluation has been introduced successfully.
TARGETS FOR 2019 AND BEYOND Locomotive strategy: Replace two old shunters in Rhein-
felden by a modern locomotive and a road/rail shunter.
Implement the requirements profile for warehouse service providers.
Implement the global minimum standard for logistics service providers.
Define details of the evaluation of European rail logistics providers using SQAS Rail1.
Target achieved Target partially achieved or target horizon extends beyond 2018 Target not achieved
1 SQAS Rail = a Cefic safety and quality evaluation system for rail transportation.
SOCIETY
a Excluding sponsorship of the Borussia Dortmund soccer club.b Including donations of €200,000 to political parties in Germany: €80,000 was donated to the CDU/CSU, €80,000 to the SPD, €20,000 to Bündnis 90/Die Grünen, and
€20,000 to the FDP.
Startup House in Rwanda
The Westerwelle and Evonik foundations have opened a center for entrepreneurs and start-ups in Rwanda.
School project in Mumbai
Evonik provides school materials for children and teachers at Tarun Utkarsh Vidyamandir school in Mumbai (India).
Other 10 %b
Evonik provided €7.4 million for donations and sponsorship projects in 2018. This budget was used principally for culture and the arts, education and science, social projects, and sport.
DONATIONS AND SPONSORSHIPof public projects C35
Culture and the arts 36 %
Social projects 14 %
Sport 7 % a
Education and science 32 %
As a company, our aim is to create value for society that goes beyond our own growth targets.
Page Topic | GRI indicators83 Donations and sponsorship | 203-1, 415-184 Education and science85 Social projects86 Culture and the arts86 Sport
82 SUSTAINABILITY REPORT 2018 EVONIK INDUSTRIES

in the USA died when he lost control of his vehicle as a result of a burst tire and collided with another vehicle. This accident resulted in spillage of around 500 liters of hydrogen peroxide. In Germany, there was an incident involving iso-phorone diamine leaking from the manhole cover on a truck. As a result, a highway had to be closed for two days for cleaning.
Sustainable logisticsEvonik has been optimizing its internal logistics fleet for several years. Our locomotive strategy includes stepwise replacement of seven locomotives in Marl (Germany) by modern models that are more powerful and have far lower diesel consumption. So far five new locomotives have been purchased, two of them in 2018. In 2019, two old shunters at the Rheinfelden site in Germany will be replaced by a modern locomotive and a road/rail shunter. By modernizing its fleet, Evonik is helping to reduce the wear of rails, fuel consumption, and emissions.
TARGET ATTAINMENT IN 2018 Establish a requirements profile for warehouse
services: Establishment of the requirements profile is nearing completion.
Establish minimum global standards for logistics service providers: Establishment of minimum global standards is nearing completion.
Evaluate European rail logistics providers using SQAS Rail1: The evaluation has been introduced successfully.
TARGETS FOR 2019 AND BEYOND Locomotive strategy: Replace two old shunters in Rhein-
felden by a modern locomotive and a road/rail shunter.
Implement the requirements profile for warehouse service providers.
Implement the global minimum standard for logistics service providers.
Define details of the evaluation of European rail logistics providers using SQAS Rail1.
Target achieved Target partially achieved or target horizon extends beyond 2018 Target not achieved
1 SQAS Rail = a Cefic safety and quality evaluation system for rail transportation.
SOCIETY
a Excluding sponsorship of the Borussia Dortmund soccer club.b Including donations of €200,000 to political parties in Germany: €80,000 was donated to the CDU/CSU, €80,000 to the SPD, €20,000 to Bündnis 90/Die Grünen, and
€20,000 to the FDP.
Startup House in Rwanda
The Westerwelle and Evonik foundations have opened a center for entrepreneurs and start-ups in Rwanda.
School project in Mumbai
Evonik provides school materials for children and teachers at Tarun Utkarsh Vidyamandir school in Mumbai (India).
Other 10 %b
Evonik provided €7.4 million for donations and sponsorship projects in 2018. This budget was used principally for culture and the arts, education and science, social projects, and sport.
DONATIONS AND SPONSORSHIPof public projects C35
Culture and the arts 36 %
Social projects 14 %
Sport 7 % a
Education and science 32 %
As a company, our aim is to create value for society that goes beyond our own growth targets.
Page Topic | GRI indicators83 Donations and sponsorship | 203-1, 415-184 Education and science85 Social projects86 Culture and the arts86 Sport
83ANNEX
Society
SUSTAINABILITY IN 2018

Our philosophy
As a company, our aim is to create value for society that goes beyond our own growth targets. Our donations and sponsor-ship activities complement the wide-ranging contributions made by the personal commitment of our employees world-wide.
Evonik’s sponsorship is aligned to our four core competen-cies: creativity, specialization, self-renewal, and reliability. We only sponsor projects and initiatives that fit our core brand. In addition, our aim is to foster the positive development of society around our sites worldwide. Within binding strategic
guidelines, our operating units therefore support their own projects with a clear connection to their products and the local community. Overall, Evonik concentrates its social commitment on the areas of education and science, social projects, culture and the arts, and sport.
The Evonik Foundation has a special place in Evonik’s social commitment. It grants scholarships and provides dona-tions to support projects and organizations. The foundation’s mission defines young people, science, and integration as its areas of focus.
Education and science
Education and science are key drivers of the prosperity of society as a whole. Evonik and the Evonik Foundation therefore support corresponding activities from preschool education through elementary and secondary schools to university degrees, and vocational and specialist training. For years, we have also been involved in programs that prepare young people for work and improve their ability to use the opportunities on the labor market.
What the Evonik Foundation does The Evonik Foundation mainly supports measures aimed at upcoming scientists and educational programs for socially disadvantaged children and young people. It offers scholar-ships through the following programs:
Evonik Foundation scholarships: These scholarships provide support for scientific research for academic qualifications, especially doctoral degrees. The focal area changes each year. The aim is to support especially talented and committed young scientists. The scholarships ensure close links between scientific theory and practice. Each scholarship holder receives individual support from a personal mentor.
In 2018, the Evonik Foundation supported 16 students at eleven universities in Germany and in collaboration with foreign universities.
Germany scholarship: Since the start of the 2011/2012 aca-demic year, the Evonik Foundation has been one of the main sponsors of this scholarship set up by the Federal Ministry of Education and Research. Scholarships are awarded to students who demonstrate strong social commitment as well as a good academic record. At the start of the 2018/2019 academic year, 125 students at eleven universities received a Germany scholarship from the Evonik Foundation.
Scholarships at the Ruhr University in Bochum (RUB): In cooperation with RUB, the Evonik Foundation awards scholar-ships to refugees. This program is for engineering, science, and economics students working for a bachelor’s or master’s degree. 24 scholarships have been awarded in three scholarship rounds since 2016. The first students have already successfully completed their studies.
START scholarships: Since 2018 the Evonik Foundation has been involved in the START Foundation’s scholarship program, which awards scholarships to talented young people with a migration background. The START program is dedicated to fostering the potential and commitment of these young people and supporting them in their education. The three-year scholarships are granted to ninth- or tenth-grade students. The Evonik Foundation currently sponsors five START scholarships.
Together with the Westerwelle Foundation, the Evonik Foun-dation is also active in Africa, where it fosters the training and development of young people in Rwanda. The Westerwelle Startup House powered by the Evonik Foundation was opened in the capital Kigali in 2018 as a center for entrepreneurs and start-ups. The center offers all conventional elements and services of importance to young entrepreneurs, including a co-working space with a range of advisory and training offer-ings. One special feature of the Startup House is the “maker space” designed by Evonik and equipped to state-of-the-art standards. As well as traditional workbenches, there are laser cutters and 3D printers to encourage practical skills. The aim is to drive forward the professional abilities of young entrepre-neurs and open up new local business prospects.
84 SUSTAINABILITY REPORT 2018 EVONIK INDUSTRIES
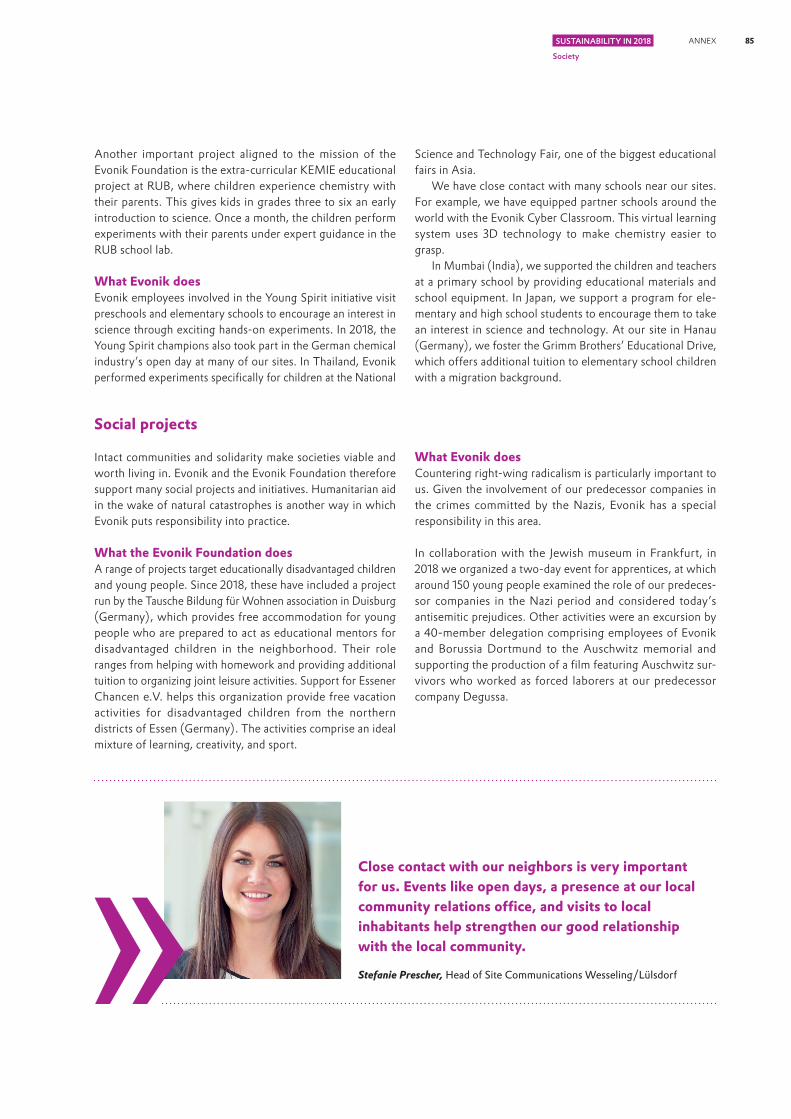
Another important project aligned to the mission of the Evonik Foundation is the extra-curricular KEMIE educational project at RUB, where children experience chemistry with their parents. This gives kids in grades three to six an early introduction to science. Once a month, the children perform experiments with their parents under expert guidance in the RUB school lab.
What Evonik doesEvonik employees involved in the Young Spirit initiative visit preschools and elementary schools to encourage an interest in science through exciting hands-on experiments. In 2018, the Young Spirit champions also took part in the German chemical industry’s open day at many of our sites. In Thailand, Evonik performed experiments specifically for children at the National
Science and Technology Fair, one of the biggest educational fairs in Asia.
We have close contact with many schools near our sites. For example, we have equipped partner schools around the world with the Evonik Cyber Classroom. This virtual learning system uses 3D technology to make chemistry easier to grasp.
In Mumbai (India), we supported the children and teachers at a primary school by providing educational materials and school equipment. In Japan, we support a program for ele-mentary and high school students to encourage them to take an interest in science and technology. At our site in Hanau (Germany), we foster the Grimm Brothers’ Educational Drive, which offers additional tuition to elementary school children with a migration background.
Social projects
Intact communities and solidarity make societies viable and worth living in. Evonik and the Evonik Foundation therefore support many social projects and initiatives. Humanitarian aid in the wake of natural catastrophes is another way in which Evonik puts responsibility into practice.
What the Evonik Foundation doesA range of projects target educationally disadvantaged children and young people. Since 2018, these have included a project run by the Tausche Bildung für Wohnen association in Duisburg (Germany), which provides free accommodation for young people who are prepared to act as educational mentors for disadvantaged children in the neighborhood. Their role ranges from helping with homework and providing additional tuition to organizing joint leisure activities. Support for Essener Chancen e.V. helps this organization provide free vacation activities for disadvantaged children from the northern districts of Essen (Germany). The activities comprise an ideal mixture of learning, creativity, and sport.
What Evonik doesCountering right-wing radicalism is particularly important to us. Given the involvement of our predecessor companies in the crimes committed by the Nazis, Evonik has a special responsibility in this area.
In collaboration with the Jewish museum in Frankfurt, in 2018 we organized a two-day event for apprentices, at which around 150 young people examined the role of our predeces-sor companies in the Nazi period and considered today’s antisemitic prejudices. Other activities were an excursion by a 40-member delegation comprising employees of Evonik and Borussia Dortmund to the Auschwitz memorial and supporting the production of a film featuring Auschwitz sur-vivors who worked as forced laborers at our predecessor company Degussa.
Close contact with our neighbors is very important for us. Events like open days, a presence at our local community relations office, and visits to local inhabitants help strengthen our good relationship with the local community.
Stefanie Prescher, Head of Site Communications Wesseling/Lülsdorf
85ANNEX
Society
SUSTAINABILITY IN 2018

In addition, Evonik initiated and supported many social and ecological projects in 2018, including Saber Viver (learning to live) at the Barra do Riacho site in Brazil. Through various educational and socio-cultural offerings, this initiative fosters children and young people in order to strengthen bonds with families, schools, and the community. At our site in Blair (Nebraska, USA), a combination of donations made by employees, proceeds from events, and an Evonik matching fund raised over US$57,000 for various charitable organiza-tions in 2018. In Antwerp (Belgium), Evonik supports the Breek De Stilte (break the silence) organization, which works with people with autism.
As examples of our collaboration with local authorities and other public bodies, in 2018 Evonik was involved in the Infra-structure, Mobility, and Land working group, which is part of the Wirtschaft für Krefeld action plan, and a cooperation that uses exhaust heat to heat residential and municipal buildings in Rheinfelden. Together with the German international cooperation organization GIZ, we also worked on a project to clean up the heavily polluted Atoyac river in Mexico.
Culture and the arts
Encounters with culture and the arts foster diversity, encour-age openness and creativity, and therefore make a significant contribution to the ongoing development of society.
What Evonik doesFor many years, Evonik has supported the Ruhr Festival in Recklinghausen (Germany) and the Küppersmühle museum in
Duisburg (Germany). In 2018, we also continued our partner-ship with Villa Schöningen in Potsdam, the Nibelungen festival in Worms, the intonations chamber music festival in Berlin, and conductor Thomas Hengelbrock and his Balthasar- Neumann choir and ensemble. At the same time, Evonik increased its support for the litRUHR literature festival, which was held in Essen for the second time.
Sport
Sport creates bonds that transcend cultural, social, and language barriers. It fosters tolerance, respect, and perfor-mance.
What Evonik doesEvonik supports both popular and professional sports activities. For example, through the BVB Evonik Soccer Academy we aim to encourage kids’ passion for soccer. In summer 2018, the academy toured the USA, where it offered training sessions for more than 1,000 children.
86 SUSTAINABILITY REPORT 2018 EVONIK INDUSTRIES
About this report 88
GRI content index 90
Independent practitioner’s limited assurance report 109
Principal locations 111
Glossary 112
List of tables and charts 113
Ratings and indices 2018 114
Sustainability awards 2018 114
Credits 115
ANNEX
87 ANNEX . SUSTAINABILITY IN 2018

About this report
Evonik’s sustainability report 2018This is the eleventh full sustainability report published by Evonik. The report covers the 2018 fiscal year (January 1 to December 31, 2018), except where otherwise indicated, and is based on Evonik’s organizational structure in 2018. The aim is to give our customers, employees, owners, and the general public an insight into how we run our business and drive for-ward sustainability in the Evonik Group. The sustainability report supplements the ecological and societal aspects included in the financial report 2018. The next sustainability report will be published in 2020.
Method This sustainability report has been prepared in compliance with the GRI Standards in accordance with the “core” option. Further, it takes account of the ten principles of the UN Global Compact and constitutes Evonik’s progress report on these principles.
The title of this year’s report is “Creating the future is our business.” Because chemicals form the basis and the driving force for innovations in almost all areas of daily life. That gives the sector a key role in solving important future issues.
In 2018, we undertook an extensive review and validation of our materiality analysis using methodology developed by Evonik. Both positive and negative impacts of Evonik’s business along the value chain were taken into account. The procedure and results are outlined in the chapter titled “Strategy and growth.” This sustainability report is systematically aligned to materiality. The reporting structure is therefore based on the six principal sustainability areas of action derived from this analysis, which form the basis of our sustainability activities: strategy and growth, governance and compliance, employees, value chain and products, the environment, and safety. To enhance consistency still further, we have altered the structure in two places. The information on health protection and product stewardship, which was previously included in the chapter on “Safety,” has been moved to “Employees” and “Value chain and products” respectively. For the first time, we report on the topics that were added to our materiality analysis in 2017: the circular economy and digitalization.
Our management approach is presented at the start of each chapter.
Non-financial risks have been given a more prominent place in our conventional risk reporting since 2017. Sustain-ability opportunities and risks are systematically identified, monitored, and reported via our risk management system.
The executive board bears overall responsibility for sustain-ability, and direct responsibility is assigned to the chief human resources officer, who is also responsible for all climate- related aspects. He approved the content of this report and confirmed that it addresses all material sustainability topics of relevance for Evonik and its stakeholders.
In 2018, the focus was on defining details of our sustain-ability strategy. One element is continuously improving sus-tainability reporting. As well as continuing to develop the content of the sustainability report, we have brought forward the publication date to coincide with publication of the financial report and the non-financial report. That brings us into line with the common practice of other large listed companies. In addition to this optimization, we initiated a number of other process improvements in 2018. These are highlighted by quotes from our employees.
In 2018, we stepped up our examination of the impact of our business activities along the value chain. Our impact valuation, which puts a monetary value on the direct and indirect impacts of our business activities, was previously confined to Germany. It has now been extended to include other regions.
Throughout this report, you will find information on the UN Sustainable Development Goals (SDGs). In 2018, we examined the SDGs and their relevance for Evonik on various levels. We have developed and implemented a special method for this.
Rapid access to key data and a clear structure are important to us. In view of this, reader-friendly overviews of our key sustainability indicators, target attainment, and future targets can be found at the start of this report. Additional charts have been included to enhance the content and improve transpar-ency.
Data capture, scope of reporting, and limitsOur data cover the relevant companies worldwide that were included in the scope of consolidation1 for the consolidated financial statements of Evonik Industries AG for the period from January 1 through December 31, 2018. The consolidated financial statements are prepared in accordance with the International Financial Reporting Standards (IFRS). Alongside Evonik Industries AG, they include all material German and foreign subsidiaries directly or indirectly controlled by Evonik Industries AG. Joint operations are included on a pro rata basis. Material associates and joint ventures are recognized at equity if Evonik is able to exert a significant influence. Initial consolidation or deconsolidation takes place as of the date on which the company gains or loses its controlling influence.
102-49
102-48
102-45
102-46
102-48
102-49
1 An overview of all companies included in the consolidated financial statements and all shareholdings pursuant to section 313 paragraph 2 of the German Commercial Code (HGB) is presented in the list of shareholdings. www.evonik.com/list-of-shareholdings
88 SUSTAINABILITY REPORT 2018 EVONIK INDUSTRIES

In fiscal 2018, the Evonik Group comprised 47 German and 124 foreign companies. Reporting focuses on the continuing operations. Relevant data on personnel and social indicators are based largely on the global SAP HR information system. For supplementary information, we use the HR information collector application (SAP notes management). The focus of our reporting and thus the limits of our report are based principally on the sustainability topics derived from our materiality analysis.
The ecological data comprise emissions and consumption data for around 100 production sites in 28 countries, and thus cover our entire production volume. Occupational safety data include other small production sites and non-production locations (mainly administration sites), so the data here cover 212 locations in 53 countries. The data are compiled using sustainability reporting software developed specifically for this purpose (SuRe 2.0). In the mid term, the data will be compiled using the new ESTER1 platform.
Since the date of publication of the sustainability report has been brought forward, quarterly reporting of data on environmental indicators has been stepped up, together with the use of projections for the fourth quarter.
The HR data obtained from the information collector are based on the actual data as of September 30, 2018. In this context, only the number of hours of continuous professional training and development have been projected for a twelve-month period.
The segmentation used in this report reflects Group and segment interests in order to provide a detailed reflection of production activities. In some cases, data are reported at plant level to ensure this.
All reporting units are clearly coded to allocate them to organizational and business entities and geographical region. This allows consolidation at management and legal entity level as well as a detailed regional analysis of the data. The ecological data are updated annually without taking changes in the Group into account. The prior-year figures are not adjusted for changes in the portfolio of companies consoli-dated. The figures for each company are included in full, without adjustment to reflect Evonik’s stake in them.
The key data in this report are rounded in line with standard commercial practice. In some cases, this may mean that individual values do not add up exactly to the totals given and percentages are not an exact reflection of the values stated.
This report is published in English and German and is available solely in electronic form. It can be downloaded from the Responsibility section of Evonik’s website.
To ensure it is up-to-date, we have included all relevant data available to us as of the editorial deadline on Feb-ruary 11, 2019.
Major acquisitions of relevance for ESHFor the first time, the key data on the Evonik Group pub-lished in this sustainability report include the silica business acquired from J. M. Huber Corporation (Huber), Atlanta (Georgia, USA) as of September 1, 2017, which has seven production sites. Evonik has integrated this business into the Resource Efficiency segment. In view of its complexity, this business has only been included in our key environmental data since January 2018. The data were compiled and consol-idated using the logic described under “Data capture, scope of reporting, and limits.”
Updated dataOur ESH data are constantly checked by a large number of internal and external audits. In addition, large amounts of data have to be reported to national authorities. In most cases, their submission and approval dates are later than the internal deadline for Evonik’s ESH data. To enhance efficiency, we endeavor to use a single set of data for both internal and external reporting. Since internal and external audit findings are examined for any possible change in ESH indicators, our databases are naturally subject to dynamic change. If such adjustments reveal discrepancies of more than 5 percent compared with published data for prior periods, the data are corrected and indicated accordingly. If the English version of this report differs from the German version, the statements and phrasing of the original German shall prevail.
External assurance The chapters titled “Strategy and growth,” “Governance and compliance,” “Employees,” “Value chain and products,” “The environment,” and “Safety” were subject to a limited assur-ance review by PricewaterhouseCoopers GmbH Wirtschafts-prüfungsgesellschaft (indicated by ). The independent practitioner’s limited assurance report is printed on pages 109 to 110.
1 ESTER = Evonik Standard Tool ESHQ and Reporting.
102-48
102-49
89 ANNEX . SUSTAINABILITY IN 2018
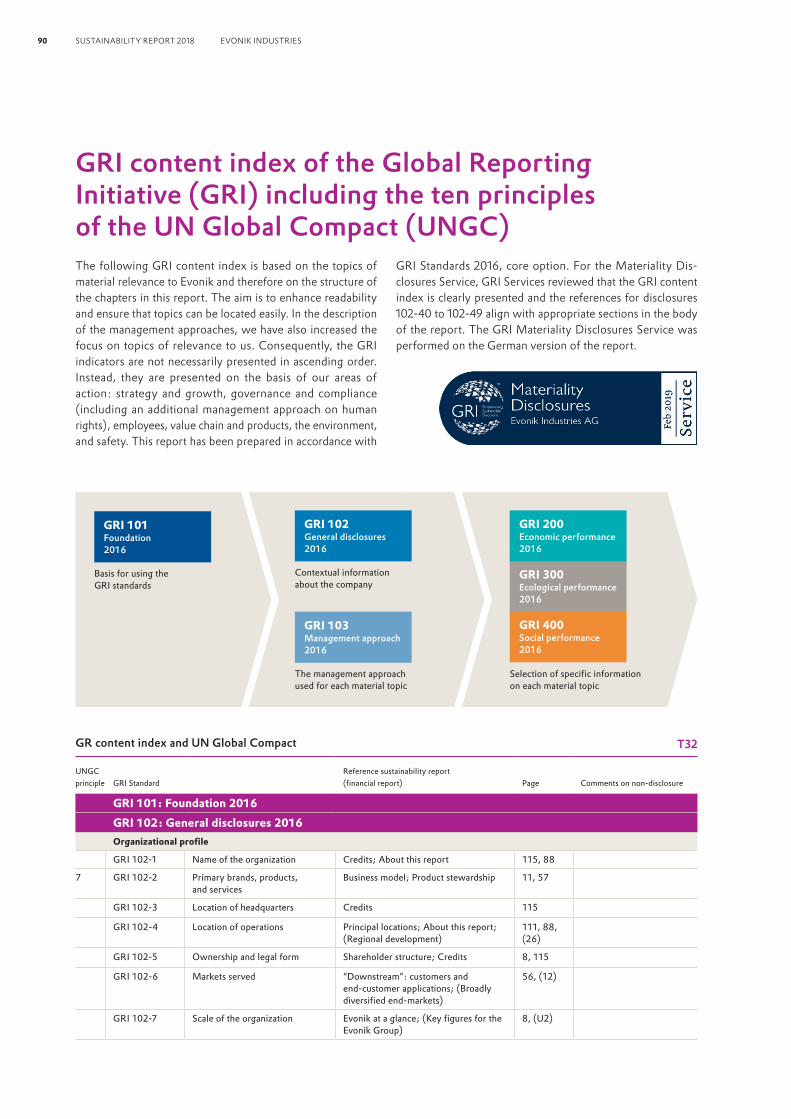
GRI content index of the Global Reporting Initiative (GRI) including the ten principles of the UN Global Compact (UNGC)
GR content index and UN Global Compact T32
UNGC principle GRI Standard
Reference sustainability report (financial report) Page Comments on non-disclosure
GRI 101: Foundation 2016 GRI 102: General disclosures 2016 Organizational profile
GRI 102-1 Name of the organization Credits; About this report 115, 88
7 GRI 102-2 Primary brands, products, and services
Business model; Product stewardship 11, 57
GRI 102-3 Location of headquarters Credits 115
GRI 102-4 Location of operations Principal locations; About this report; (Regional development)
111, 88, (26)
GRI 102-5 Ownership and legal form Shareholder structure; Credits 8, 115
GRI 102-6 Markets served “Downstream”: customers and end-customer applications; (Broadly diversified end-markets)
56, (12)
GRI 102-7 Scale of the organization Evonik at a glance; (Key figures for the Evonik Group)
8, (U2)
The following GRI content index is based on the topics of material relevance to Evonik and therefore on the structure of the chapters in this report. The aim is to enhance readability and ensure that topics can be located easily. In the description of the management approaches, we have also increased the focus on topics of relevance to us. Consequently, the GRI indicators are not necessarily presented in ascending order. Instead, they are presented on the basis of our areas of action: strategy and growth, governance and compliance (including an additional management approach on human rights), employees, value chain and products, the environment, and safety. This report has been prepared in accordance with
GRI Standards 2016, core option. For the Materiality Dis-closures Service, GRI Services reviewed that the GRI content index is clearly presented and the references for disclosures 102-40 to 102-49 align with appropriate sections in the body of the report. The GRI Materiality Disclosures Service was performed on the German version of the report.
90 SUSTAINABILITY REPORT 2018 EVONIK INDUSTRIES
GRI 101 Foundation 2016
Basis for using the GRI standards
GRI 102 General disclosures 2016
Contextual information about the company
GRI 103 Management approach 2016
The management approach used for each material topic
GRI 300 Ecological performance 2016
GRI 400 Social performance 2016
Selection of specific information on each material topic
GRI 200 Economic performance 2016
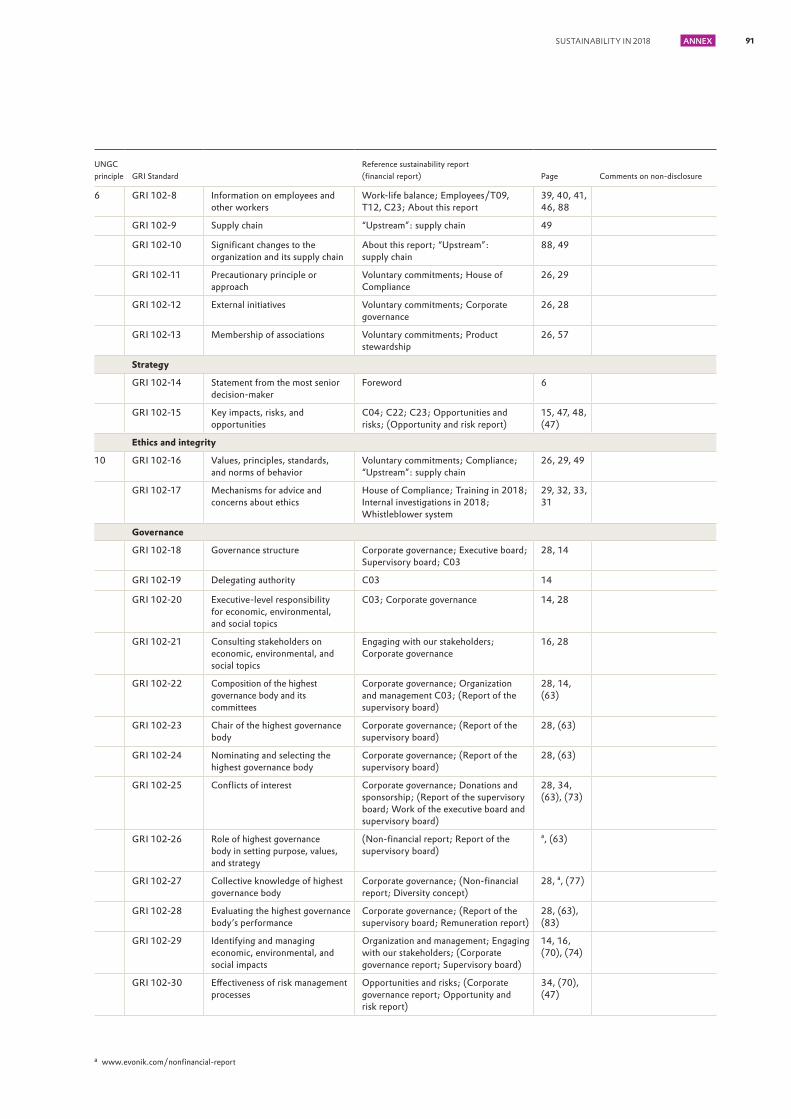
UNGC principle GRI Standard
Reference sustainability report (financial report) Page Comments on non-disclosure
6 GRI 102-8 Information on employees and other workers
Work-life balance; Employees/T09, T12, C23; About this report
39, 40, 41, 46, 88
GRI 102-9 Supply chain “Upstream”: supply chain 49
GRI 102-10 Significant changes to the organization and its supply chain
About this report; “Upstream”: supply chain
88, 49
GRI 102-11 Precautionary principle or approach
Voluntary commitments; House of Compliance
26, 29
GRI 102-12 External initiatives Voluntary commitments; Corporate governance
26, 28
GRI 102-13 Membership of associations Voluntary commitments; Product stewardship
26, 57
Strategy
GRI 102-14 Statement from the most senior decision-maker
Foreword 6
GRI 102-15 Key impacts, risks, and opportunities
C04; C22; C23; Opportunities and risks; (Opportunity and risk report)
15, 47, 48, (47)
Ethics and integrity
10 GRI 102-16 Values, principles, standards, and norms of behavior
Voluntary commitments; Compliance; “Upstream”: supply chain
26, 29, 49
GRI 102-17 Mechanisms for advice and concerns about ethics
House of Compliance; Training in 2018; Internal investigations in 2018; Whistleblower system
29, 32, 33, 31
Governance
GRI 102-18 Governance structure Corporate governance; Executive board; Supervisory board; C03
28, 14
GRI 102-19 Delegating authority C03 14
GRI 102-20 Executive-level responsibility for economic, environmental, and social topics
C03; Corporate governance 14, 28
GRI 102-21 Consulting stakeholders on economic, environmental, and social topics
Engaging with our stakeholders; Corporate governance
16, 28
GRI 102-22 Composition of the highest governance body and its committees
Corporate governance; Organization and management C03; (Report of the supervisory board)
28, 14, (63)
GRI 102-23 Chair of the highest governance body
Corporate governance; (Report of the supervisory board)
28, (63)
GRI 102-24 Nominating and selecting the highest governance body
Corporate governance; (Report of the supervisory board)
28, (63)
GRI 102-25 Conflicts of interest Corporate governance; Donations and sponsorship; (Report of the supervisory board; Work of the executive board and supervisory board)
28, 34, (63), (73)
GRI 102-26 Role of highest governance body in setting purpose, values, and strategy
(Non-financial report; Report of the supervisory board)
a, (63)
GRI 102-27 Collective knowledge of highest governance body
Corporate governance; (Non-financial report; Diversity concept)
28, a, (77)
GRI 102-28 Evaluating the highest governance body’s performance
Corporate governance; (Report of the supervisory board; Remuneration report)
28, (63), (83)
GRI 102-29 Identifying and managing economic, environmental, and social impacts
Organization and management; Engaging with our stakeholders; (Corporate governance report; Supervisory board)
14, 16, (70), (74)
GRI 102-30 Effectiveness of risk management processes
Opportunities and risks; (Corporate governance report; Opportunity and risk report)
34, (70), (47)
a www.evonik.com/nonfinancial-report
91 ANNEX . SUSTAINABILITY IN 2018
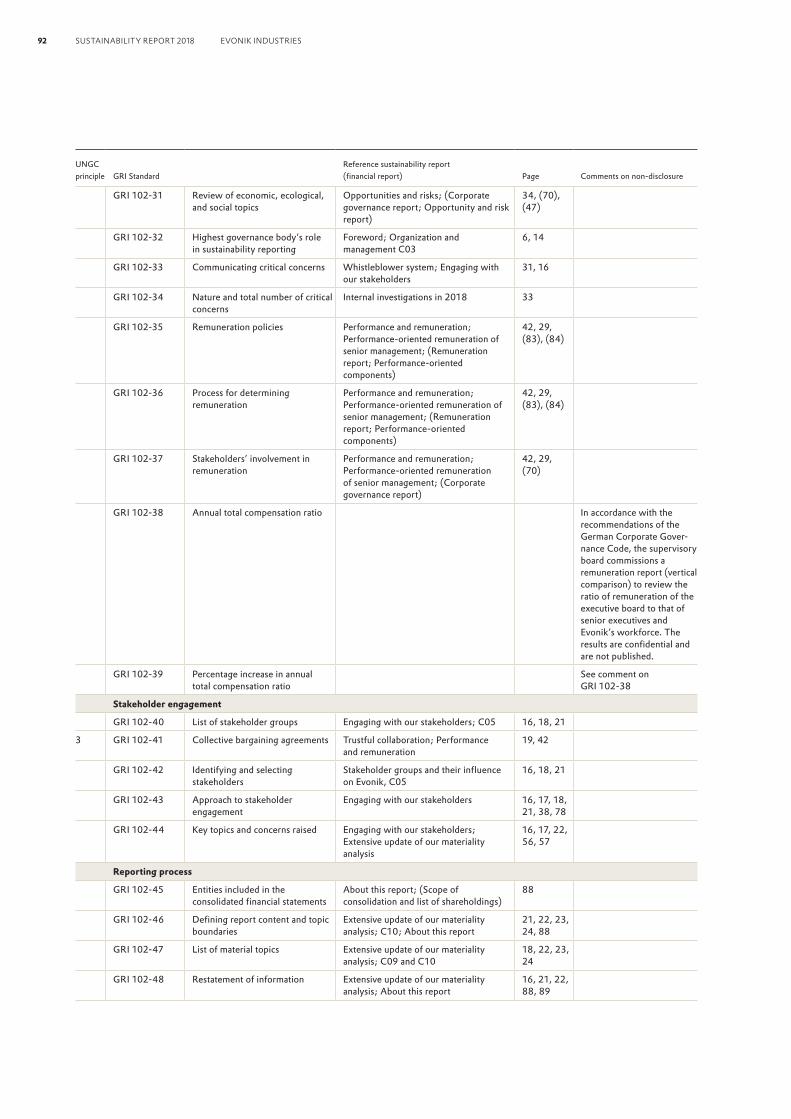
UNGC principle GRI Standard
Reference sustainability report (financial report) Page Comments on non-disclosure
GRI 102-31 Review of economic, ecological, and social topics
Opportunities and risks; (Corporate governance report; Opportunity and risk report)
34, (70), (47)
GRI 102-32 Highest governance body’s role in sustainability reporting
Foreword; Organization and management C03
6, 14
GRI 102-33 Communicating critical concerns Whistleblower system; Engaging with our stakeholders
31, 16
GRI 102-34 Nature and total number of critical concerns
Internal investigations in 2018 33
GRI 102-35 Remuneration policies Performance and remuneration; Performance-oriented remuneration of senior management; (Remuneration report; Performance-oriented components)
42, 29, (83), (84)
GRI 102-36 Process for determining remuneration
Performance and remuneration; Performance-oriented remuneration of senior management; (Remuneration report; Performance-oriented components)
42, 29, (83), (84)
GRI 102-37 Stakeholders’ involvement in remuneration
Performance and remuneration; Performance-oriented remuneration of senior management; (Corporate governance report)
42, 29, (70)
GRI 102-38 Annual total compensation ratio In accordance with the recommendations of the German Corporate Gover-nance Code, the supervisory board commissions a remuneration report (vertical comparison) to review the ratio of remuneration of the executive board to that of senior executives and Evonik’s workforce. The results are confidential and are not published.
GRI 102-39 Percentage increase in annual total compensation ratio
See comment on GRI 102-38
Stakeholder engagement
GRI 102-40 List of stakeholder groups Engaging with our stakeholders; C05 16, 18, 21
3 GRI 102-41 Collective bargaining agreements Trustful collaboration; Performance and remuneration
19, 42
GRI 102-42 Identifying and selecting stakeholders
Stakeholder groups and their influence on Evonik, C05
16, 18, 21
GRI 102-43 Approach to stakeholder engagement
Engaging with our stakeholders 16, 17, 18, 21, 38, 78
GRI 102-44 Key topics and concerns raised Engaging with our stakeholders; Extensive update of our materiality analysis
16, 17, 22, 56, 57
Reporting process
GRI 102-45 Entities included in the consolidated financial statements
About this report; (Scope of consolidation and list of shareholdings)
88
GRI 102-46 Defining report content and topic boundaries
Extensive update of our materiality analysis; C10; About this report
21, 22, 23, 24, 88
GRI 102-47 List of material topics Extensive update of our materiality analysis; C09 and C10
18, 22, 23, 24
GRI 102-48 Restatement of information Extensive update of our materiality analysis; About this report
16, 21, 22, 88, 89
92 SUSTAINABILITY REPORT 2018 EVONIK INDUSTRIES

UNGC principle GRI Standard
Reference sustainability report (financial report) Page Comments on non-disclosure
GRI 102-49 Changes in reporting Extensive update of our materiality analysis; C08 and C09; About this report
21, 22, 88, 89
GRI 102-50 Reporting period About this report 88
GRI 102-51 Date of the most recent report Credits; About this report 115, 88
GRI 102-52 Reporting cycle About this report 88
GRI 102-53 Contact point for questions regarding the report
Credits 115
GRI 102-54 Claims of reporting in accordance with the GRI Standards
About this report 88
GRI 102-55 GRI content index GRI content index 90
GRI 102-56 External assurance About this report; Independent practitioner’s limited assurance report
88, 109
Standards on specific topics Strategy and growth
GRI 201: Economic performance 2016
GRI 103: Management approach 2016
7, 8, 9 GRI 103-1 Explanation of the material topic and its boundary
Our philosophy; Engaging with our stakeholders; Extensive update of our materiality analysis; Charts C04, C08, C09, C10, C23
13, 16, 21, 15, 22, 23, 48
GRI 103-2 The management approach and its components
T01, T02, and T03; Business model; Fiscal 2018; Our philosophy; Details of our sustainability strategy; Organization and management; C03; Extensive update of our materiality analysis C08, C09, C10; Internal investigations in 2018; Performance and remuneration; C23; Donations and sponsorship
3, 4, 5, 11, 13, 14, 21, 22, 23, 33, 42, 48, 83
GRI 103-3 Evaluation of the management approach
Engaging with our stakeholders; Extensive update of our materiality analysis; About this report; T01, T02 and T03
16, 21, 88, 3, 4, 5
GRI 201-1 Direct economic value generated and distributed
Total value added; T04 12
7 GRI 201-2 Financial implications and other risks and opportunities due to climate change
Opportunities and risks; C23; ( Opportunity and risk report; Environmental risks)
34, 48, (47), (56)
GRI 201-3 Defined benefit plan obligations and other retirement plans
Performance and remuneration; ( Remuneration report; Company pension plan)
42, (83), (85)
GRI 201-4 Financial assistance received from government
Research and development We only report on financial assistance received from the EU or the German govern-ment for research purposes.
GRI 202: Market presence 2016
GRI 103: Management approach 2016
GRI 103-1 Explanation of the material topic and its boundary
Our philosophy; Engaging with our stakeholders; Extensive update of our materiality analysis; Charts C04, C08, C09, C10, C23
13, 16, 21, 15, 22, 23, 48
93 ANNEX . SUSTAINABILITY IN 2018

UNGC principle GRI Standard
Reference sustainability report (financial report) Page Comments on non-disclosure
GRI 103-2 The management approach and its components
T01, T02, and T03; Human rights; Internal investigations in 2018; C07; Our philosophy; HR organization and management; Trustful collaboration; Performance and remuneration; Diversity and equal opportunity; Corporate governance
3, 4, 5, 27, 33, 37, 18, 42, 40, 28
GRI 103-3 Evaluation of the management approach
Engaging with our stakeholders; Extensive update of our materiality analysis; About this report; Performance and remuneration; Further facts and figures
16, 21, 88, 42, 46
6 GRI 202-1 Ratios of standard entry level wage by gender compared to local minimum wage
Performance and remuneration 42 Evonik believes it is very important to offer market- oriented and performance- related salaries based on uniform global evaluation criteria. Evonik pays at least the local minimum wage worldwide, regardless of gender.
GRI 202-2 Proportion of senior management hired from the local community
Further facts and figures; Diversity and equal opportunity
46, 40 We report on external hires by region, not by function.
GRI 203: Indirect economic impacts 2016
GRI 103: Management approach 2016
7, 8, 9 GRI 103-1 Explanation of the material topic and its boundary
Our philosophy; Engaging with our stakeholders; Extensive update of our materiality analysis; Charts C04, C08, C09, C10, C23
13, 16, 21, 15, 22, 23, 48
GRI 103-2 The management approach and its components
T01, T02, and T03; Business model; Fiscal 2018; C03; Internal investigations in 2018; C23; Donations and sponsorship
3, 4, 5, 12, 14, 33, 48, 83
GRI 103-3 Evaluation of the management approach
Engaging with our stakeholders; Extensive update of our materiality analysis; About this report; Independent practitioner’s limited assurance report; C23; Donations and sponsorship
16, 21, 88, 48, 83
GRI 203-1 Infrastructure investments and services supported
C04; C23; Donations and sponsorship 15, 48, 83
GRI 203-2 Significant indirect economic impacts
C04; C23; (Regional development) 15, 48, (26)
Governance and compliance
GRI 205: Fighting corruption 2016
GRI 103: Management approach 2016
GRI 103-1 Explanation of the material topic and its boundary
Our philosophy; Engaging with our stakeholders; Extensive update of our materiality analysis; Charts C04, C08, C09, C10, C23
13, 16, 21, 15, 22, 23, 48
GRI 103-2 The management approach and its components
T01, T02, and T03; Our philosophy; Voluntary commitments; Compliance; Internal investigations in 2018; Whistleblower system; Human rights; Trustful collaboration
3, 4, 5, 26, 29, 33, 31, 27, 18
94 SUSTAINABILITY REPORT 2018 EVONIK INDUSTRIES
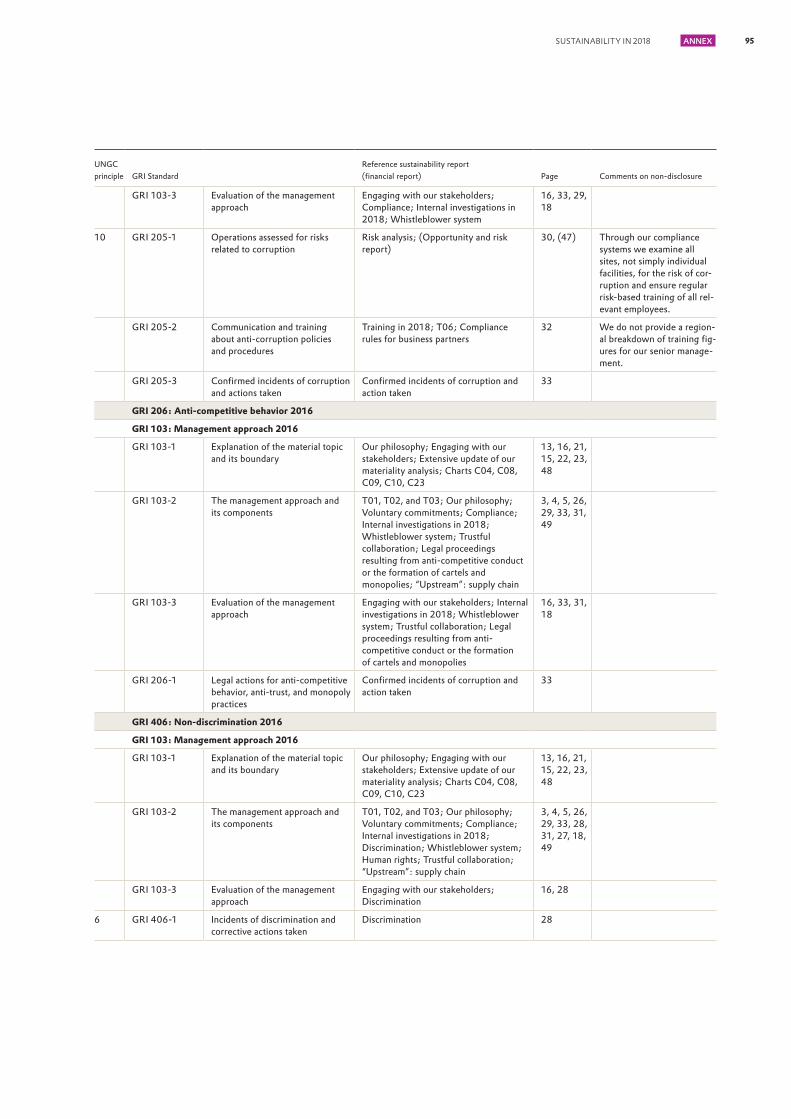
UNGC principle GRI Standard
Reference sustainability report (financial report) Page Comments on non-disclosure
GRI 103-3 Evaluation of the management approach
Engaging with our stakeholders; Compliance; Internal investigations in 2018; Whistleblower system
16, 33, 29, 18
10 GRI 205-1 Operations assessed for risks related to corruption
Risk analysis; (Opportunity and risk report)
30, (47) Through our compliance systems we examine all sites, not simply individual facilities, for the risk of cor-ruption and ensure regular risk-based training of all rel-evant employees.
GRI 205-2 Communication and training about anti-corruption policies and procedures
Training in 2018; T06; Compliance rules for business partners
32 We do not provide a region-al breakdown of training fig-ures for our senior manage-ment.
GRI 205-3 Confirmed incidents of corruption and actions taken
Confirmed incidents of corruption and action taken
33
GRI 206: Anti-competitive behavior 2016
GRI 103: Management approach 2016
GRI 103-1 Explanation of the material topic and its boundary
Our philosophy; Engaging with our stakeholders; Extensive update of our materiality analysis; Charts C04, C08, C09, C10, C23
13, 16, 21, 15, 22, 23, 48
GRI 103-2 The management approach and its components
T01, T02, and T03; Our philosophy; Voluntary commitments; Compliance; Internal investigations in 2018; Whistleblower system; Trustful collaboration; Legal proceedings resulting from anti-competitive conduct or the formation of cartels and monopolies; “Upstream”: supply chain
3, 4, 5, 26, 29, 33, 31, 49
GRI 103-3 Evaluation of the management approach
Engaging with our stakeholders; Internal investigations in 2018; Whistleblower system; Trustful collaboration; Legal proceedings resulting from anti- competitive conduct or the formation of cartels and monopolies
16, 33, 31, 18
GRI 206-1 Legal actions for anti-competitive behavior, anti-trust, and monopoly practices
Confirmed incidents of corruption and action taken
33
GRI 406: Non-discrimination 2016
GRI 103: Management approach 2016
GRI 103-1 Explanation of the material topic and its boundary
Our philosophy; Engaging with our stakeholders; Extensive update of our materiality analysis; Charts C04, C08, C09, C10, C23
13, 16, 21, 15, 22, 23, 48
GRI 103-2 The management approach and its components
T01, T02, and T03; Our philosophy; Voluntary commitments; Compliance; Internal investigations in 2018; Discrimination; Whistleblower system; Human rights; Trustful collaboration; “Upstream”: supply chain
3, 4, 5, 26, 29, 33, 28, 31, 27, 18, 49
GRI 103-3 Evaluation of the management approach
Engaging with our stakeholders; Discrimination
16, 28
6 GRI 406-1 Incidents of discrimination and corrective actions taken
Discrimination 28
95 ANNEX . SUSTAINABILITY IN 2018

UNGC principle GRI Standard
Reference sustainability report (financial report) Page Comments on non-disclosure
GRI 407: Freedom of association and collective bargaining 2016
GRI 103: Management approach 2016
GRI 103-1 Explanation of the material topic and its boundary
Our philosophy; Engaging with our stakeholders; Extensive update of our materiality analysis; Charts C04, C08, C09, C10, C23
13, 16, 21, 15, 22, 23, 48
GRI 103-2 The management approach and its components
T01, T02, and T03; Our philosophy; Voluntary commitments; Compliance; Internal investigations in 2018; Whistle-blower system; Human rights; Trustful collaboration; “Upstream”: supply chain
3, 4, 5, 26, 29, 33, 31, 27, 18, 49
GRI 103-3 Evaluation of the management approach
Engaging with our stakeholders; Extensive update of our materiality analysis; About this report; Validation and evaluation of suppliers; Human rights; Whistleblower system
16, 21, 88, 50, 27, 31
3 GRI 407-1 Operations and suppliers in which the right to freedom of association and collective bargaining may be at risk
Trustful collaboration; “Upstream”: supply chain; Validation and evaluation of suppliers; Human rights; Whistleblower system
18, 49, 50, 27, 31
Our supplier evaluation is based on compiling/ quantifying risk factors. Our evaluation includes the risk of forced and compulsory labor.
GRI 408: Child labor
GRI 103: Management approach 2016
GRI 103-1 Explanation of the material topic and its boundary
Our philosophy; Engaging with our stakeholders; Extensive update of our materiality analysis; Charts C04, C08, C09, C10, C23
13, 16, 21, 15, 22, 23, 48
GRI 103-2 The management approach and its components
T01, T02, and T03; Our philosophy; Voluntary commitments; Compliance; Internal investigations in 2018; Whistleblower system; Human rights; Trustful collaboration; “Upstream”: supply chain
3, 4, 5, 26, 29, 33, 31, 27, 18, 49
GRI 103-3 Evaluation of the management approach
Engaging with our stakeholders; Human rights; “Upstream”: supply chain
16, 27, 49
5 GRI 408-1 Operations and suppliers at significant risk for incidents of child labor
Human rights; “Upstream”: supply chain 27, 49 Human rights risks are currently only assessed at country level; not for individual business locations.
GRI 409: Forced and compulsory labor 2016
GRI 103: Management approach 2016
GRI 103-1 Explanation of the material topic and its boundary
Our philosophy; Engaging with our stakeholders; Extensive update of our materiality analysis; Charts C04, C08, C09, C10, C23
13, 16, 21, 15, 22, 23, 48
96 SUSTAINABILITY REPORT 2018 EVONIK INDUSTRIES

UNGC principle GRI Standard
Reference sustainability report (financial report) Page Comments on non-disclosure
GRI 103-2 The management approach and its components
T01, T02, and T03; Our philosophy; Voluntary commitments; Compliance; Internal investigations in 2018; Whistleblower system; Human rights; Trustful collaboration; “Upstream”: supply chain
3, 4, 5, 26, 29, 33, 31, 27, 18, 49
GRI 103-3 Evaluation of the management approach
Engaging with our stakeholders; Human rights; “Upstream”: supply chain
16, 27, 49
4 GRI 409-1 Operations and suppliers at significant risk for incidents of forced or compulsory labor
Human rights; “Upstream”: supply chain 27, 49 At present, this is only assessed at country level. Our supplier evaluation is based on compiling/ quantifying risk factors. Our evaluation includes the risk of forced and compulsory labor.
GRI 412: Human rights
GRI 103: Management approach 2016
GRI 103-1 Explanation of the material topic and its boundary
Our philosophy; Engaging with our stakeholders; Extensive update of our materiality analysis; Charts C04, C08, C09, C10, C23
13, 16, 21, 15, 22, 23, 48
GRI 103-2 The management approach and its components
T01, T02, and T03; Our philosophy; Voluntary commitments; Compliance; Internal investigations in 2018; Whistleblower system; Human rights; Trustful collaboration; “Upstream”: supply chain
3, 4, 5, 26, 29, 33, 31, 27, 18, 49
GRI 103-3 Evaluation of the management approach
Engaging with our stakeholders; Human rights; Training in 2018; Compliance rules for business partners
16, 27, 32
1 GRI 412-1 Operations that have been subject to human rights reviews or impact assessments
Human rights; Training in 2018; Rules for business partners
27, 32 We continued to develop our human rights risk map in 2018 and compiled potential human rights risks on a country-specific basis. Potential violations of human rights can be reported via our whistleblower system. In addition, more than ten human rights training courses were held for employees from Germany, Brazil, and India in 2018.
GRI 412-2 Employee training on human rights policies or procedures
Human rights; Training in 2018; Rules for business partners
27, 32 Human rights are an integral part of compliance training on our code of conduct. In addition, more than ten training courses were dedicated explicitly to human rights. We do not explicitly report on the number of hours of training. Training is performed continuously.
97 ANNEX . SUSTAINABILITY IN 2018
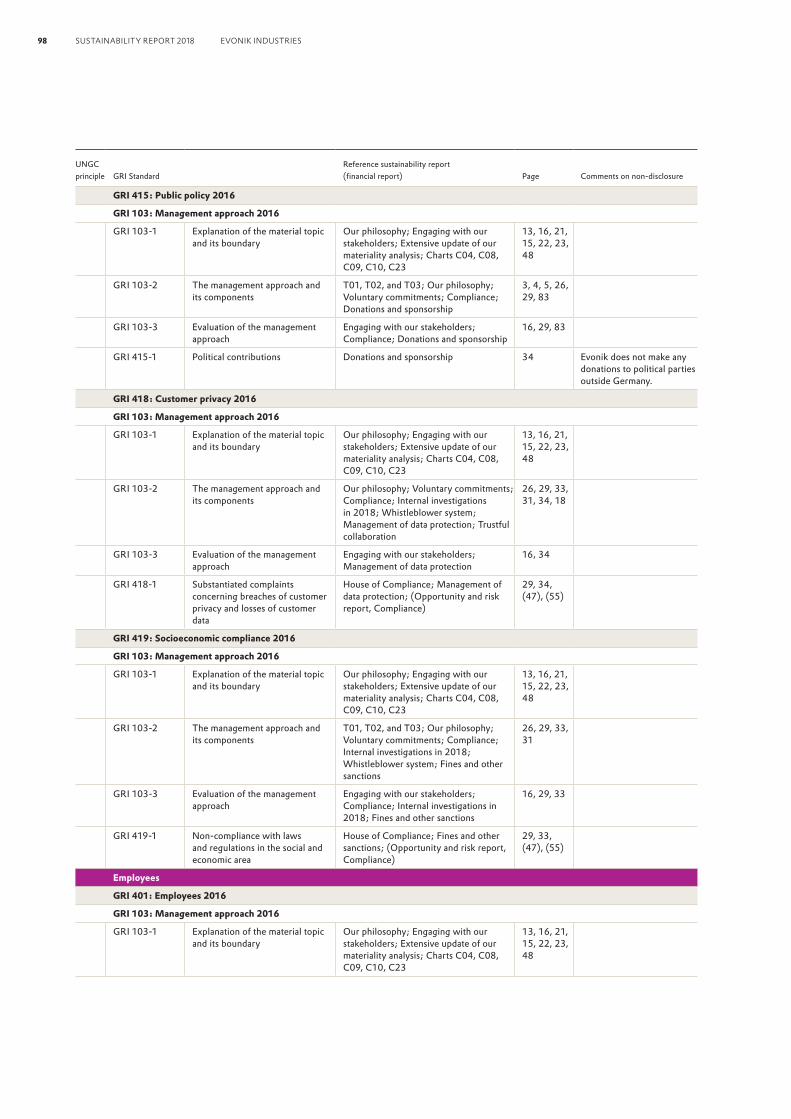
UNGC principle GRI Standard
Reference sustainability report (financial report) Page Comments on non-disclosure
GRI 415: Public policy 2016
GRI 103: Management approach 2016
GRI 103-1 Explanation of the material topic and its boundary
Our philosophy; Engaging with our stakeholders; Extensive update of our materiality analysis; Charts C04, C08, C09, C10, C23
13, 16, 21, 15, 22, 23, 48
GRI 103-2 The management approach and its components
T01, T02, and T03; Our philosophy; Voluntary commitments; Compliance; Donations and sponsorship
3, 4, 5, 26, 29, 83
GRI 103-3 Evaluation of the management approach
Engaging with our stakeholders; Compliance; Donations and sponsorship
16, 29, 83
GRI 415-1 Political contributions Donations and sponsorship 34 Evonik does not make any donations to political parties outside Germany.
GRI 418: Customer privacy 2016
GRI 103: Management approach 2016
GRI 103-1 Explanation of the material topic and its boundary
Our philosophy; Engaging with our stakeholders; Extensive update of our materiality analysis; Charts C04, C08, C09, C10, C23
13, 16, 21, 15, 22, 23, 48
GRI 103-2 The management approach and its components
Our philosophy; Voluntary commitments; Compliance; Internal investigations in 2018; Whistleblower system; Management of data protection; Trustful collaboration
26, 29, 33, 31, 34, 18
GRI 103-3 Evaluation of the management approach
Engaging with our stakeholders; Management of data protection
16, 34
GRI 418-1 Substantiated complaints concerning breaches of customer privacy and losses of customer data
House of Compliance; Management of data protection; (Opportunity and risk report, Compliance)
29, 34, (47), (55)
GRI 419: Socioeconomic compliance 2016
GRI 103: Management approach 2016
GRI 103-1 Explanation of the material topic and its boundary
Our philosophy; Engaging with our stakeholders; Extensive update of our materiality analysis; Charts C04, C08, C09, C10, C23
13, 16, 21, 15, 22, 23, 48
GRI 103-2 The management approach and its components
T01, T02, and T03; Our philosophy; Voluntary commitments; Compliance; Internal investigations in 2018; Whistleblower system; Fines and other sanctions
26, 29, 33, 31
GRI 103-3 Evaluation of the management approach
Engaging with our stakeholders; Compliance; Internal investigations in 2018; Fines and other sanctions
16, 29, 33
GRI 419-1 Non-compliance with laws and regulations in the social and economic area
House of Compliance; Fines and other sanctions; (Opportunity and risk report, Compliance)
29, 33, (47), (55)
Employees
GRI 401: Employees 2016
GRI 103: Management approach 2016
GRI 103-1 Explanation of the material topic and its boundary
Our philosophy; Engaging with our stakeholders; Extensive update of our materiality analysis; Charts C04, C08, C09, C10, C23
13, 16, 21, 15, 22, 23, 48
98 SUSTAINABILITY REPORT 2018 EVONIK INDUSTRIES
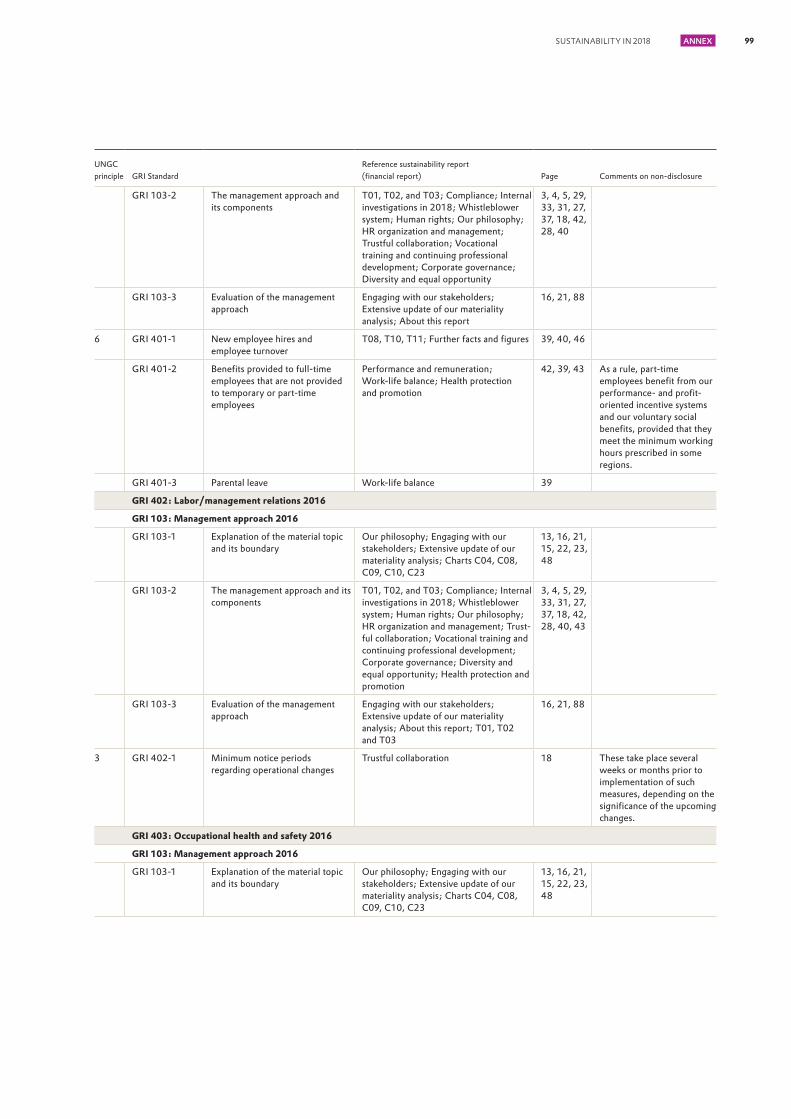
UNGC principle GRI Standard
Reference sustainability report (financial report) Page Comments on non-disclosure
GRI 103-2 The management approach and its components
T01, T02, and T03; Compliance; Internal investigations in 2018; Whistleblower system; Human rights; Our philosophy; HR organization and management; Trustful collaboration; Vocational training and continuing professional development; Corporate governance; Diversity and equal opportunity
3, 4, 5, 29, 33, 31, 27, 37, 18, 42, 28, 40
GRI 103-3 Evaluation of the management approach
Engaging with our stakeholders; Extensive update of our materiality analysis; About this report
16, 21, 88
6 GRI 401-1 New employee hires and employee turnover
T08, T10, T11; Further facts and figures 39, 40, 46
GRI 401-2 Benefits provided to full-time employees that are not provided to temporary or part-time employees
Performance and remuneration; Work-life balance; Health protection and promotion
42, 39, 43 As a rule, part-time employees benefit from our performance- and profit- oriented incentive systems and our voluntary social benefits, provided that they meet the minimum working hours prescribed in some regions.
GRI 401-3 Parental leave Work-life balance 39
GRI 402: Labor/management relations 2016
GRI 103: Management approach 2016
GRI 103-1 Explanation of the material topic and its boundary
Our philosophy; Engaging with our stakeholders; Extensive update of our materiality analysis; Charts C04, C08, C09, C10, C23
13, 16, 21, 15, 22, 23, 48
GRI 103-2 The management approach and its components
T01, T02, and T03; Compliance; Internal investigations in 2018; Whistleblower system; Human rights; Our philosophy; HR organization and management; Trust-ful collaboration; Vocational training and continuing professional development; Corporate governance; Diversity and equal opportunity; Health protection and promotion
3, 4, 5, 29, 33, 31, 27, 37, 18, 42, 28, 40, 43
GRI 103-3 Evaluation of the management approach
Engaging with our stakeholders; Extensive update of our materiality analysis; About this report; T01, T02 and T03
16, 21, 88
3 GRI 402-1 Minimum notice periods regarding operational changes
Trustful collaboration 18 These take place several weeks or months prior to implementation of such measures, depending on the significance of the upcoming changes.
GRI 403: Occupational health and safety 2016
GRI 103: Management approach 2016
GRI 103-1 Explanation of the material topic and its boundary
Our philosophy; Engaging with our stakeholders; Extensive update of our materiality analysis; Charts C04, C08, C09, C10, C23
13, 16, 21, 15, 22, 23, 48
99 ANNEX . SUSTAINABILITY IN 2018

UNGC principle GRI Standard
Reference sustainability report (financial report) Page Comments on non-disclosure
GRI 103-2 The management approach and its components
T01, T02, and T03; Compliance; Internal investigations in 2018; Whistleblower system; Human rights; Our philosophy; HR organization and management; Trustful collaboration; Corporate gover-nance; Health protection and promotion
3, 4, 5, 29, 33, 31, 27, 37, 18, 28, 43
GRI 103-3 Evaluation of the management approach
Engaging with our stakeholders; Extensive update of our materiality analysis; About this report
16, 21
GRI 403-3 Workers with high incidence or high risk of diseases related to their occupation
Workplace-related preventive healthcare 45
GRI 403-4 Health and safety topics covered in formal agreements with trade unions
Health protection and promotion 43
GRI 404: Training and education 2016
GRI 103: Management approach 2016
GRI 103-1 Explanation of the material topic and its boundary
Our philosophy; Engaging with our stakeholders; Extensive update of our materiality analysis; Charts C04, C08, C09, C10, C23
13, 16, 21, 15, 22, 23, 48
GRI 103-2 The management approach and its components
T01, T02, and T03; Compliance; Internal investigations in 2018; Whistleblower system; Human rights; Our philosophy; HR organization and management; Trustful collaboration; Vocational training and continuing professional development; Corporate governance; Diversity and equal opportunity
3, 4, 5, 29, 33, 31, 27, 37, 18, 42, 28, 40
GRI 103-3 Evaluation of the management approach
Engaging with our stakeholders; Extensive update of our materiality analysis; About this report; Vocational training and continuing professional development
16, 21, 88, 42
6 GRI 404-1 Average hours of training per year per employee
Vocational training and continuing professional development
42 Drawing a distinction by gender or employee category is not significant for us; our global development portal (GDP) and LILY are available to all employees.
GRI 404-2 Programs for upgrading employee skills and transition assistance programs
Continuing professional development 42 Our generation pact was extended to actively address the challenges of demo-graphic change. Take-up was once again high. The global development portal (GDP) is available to all employees worldwide and should ensure full transparency about learning offerings, contacts, and costs.
100 SUSTAINABILITY REPORT 2018 EVONIK INDUSTRIES

UNGC principle GRI Standard
Reference sustainability report (financial report) Page Comments on non-disclosure
GRI 404-3 Percentage of employees receiving regular performance and career development reviews
Performance and remuneration 42
GRI 405: Diversity and equal opportunity 2016
GRI 103: Management approach 2016
GRI 103-1 Explanation of the material topic and its boundary
Our philosophy; Engaging with our stakeholders; Extensive update of our materiality analysis; Charts C04, C08, C09, C10, C23
13, 16, 21, 15, 22, 23, 48
GRI 103-2 The management approach and its components
T01, T02, and T03; Compliance; Internal investigations in 2018; Whistleblower system; Human rights; Employees/ Our philosophy; HR organization and management; Trustful collaboration; Corporate governance; Diversity and equal opportunity
3, 4, 5, 29, 33, 31, 27, 37, 18, 42, 28, 40
GRI 103-3 Evaluation of the management approach
Engaging with our stakeholders; Extensive update of our materiality analysis; About this report; Diversity and equal opportunity
16, 21, 88, 40
6 GRI 405-1 Diversity of governance bodies and employees
Corporate governance; Diversity and equal opportunity
28, 40 We do not provide a percentage breakdown of members of our governance bodies by age. The diversity concept and profile of skills and expertise of the super-visory board and executive board contain various criteria, including age. The age structure of the Evonik Group is not reported explicitly by employee categories.
Value chain and products
GRI 204: Procurement practices 2016
GRI 103: Management approach 2016
GRI 103-1 Explanation of the material topic and its boundary
Our philosophy; Engaging with our stakeholders; Extensive update of our materiality analysis; Charts C04, C08, C09, C10, C23
13, 16, 21, 15, 22, 23, 48
GRI 103-2 The management approach and its components
T01, T02, and T03; Compliance; Internal investigations in 2018; Whistleblower system; Human rights; Our philosophy; “Upstream”: supply chain; Validation and evaluation of suppliers; TfS; “Gate to gate”: raw materials, production, and processes; “Downstream”: customers and end-customer applications
3, 4, 5, 29, 33, 31, 27, 48, 49, 50, 54, 56
GRI 103-3 Evaluation of the management approach
Engaging with our stakeholders; Extensive update of our materiality analysis; About this report
16, 21
GRI 204-1 Proportion of spending on local suppliers
“Upstream”: supply chain All facilities are taken into account.
101 ANNEX . SUSTAINABILITY IN 2018

UNGC principle GRI Standard
Reference sustainability report (financial report) Page Comments on non-disclosure
GRI 303: Materials 2016
GRI 103: Management approach 2016
GRI 103-1 Explanation of the material topic and its boundary
Our philosophy; Engaging with our stakeholders; Extensive update of our materiality analysis; Charts C04, C08, C09, C10, C23
13, 16, 21, 15, 22, 23, 48
GRI 103-2 The management approach and its components
T01, T02, and T03; Internal investiga-tions in 2018; Whistleblower system; Human rights; Our philosophy; “ Upstream”: supply chain; Validation and evaluation of suppliers; TfS; “Gate to gate”: raw materials, production, and processes; “Downstream”: customers and end- customer applications
3, 4, 5, 33, 31, 27, 48, 49, 50, 54, 56
GRI 103-3 Evaluation of the management approach
Engaging with our stakeholders; Extensive update of our materiality analysis; About this report
16, 21, 88
7, 8 GRI 301-1 Materials used by weight or volume
Production inputs and output; T15 54
GRI 308: Supplier environmental assessment 2016
GRI 103: Management approach 2016
GRI 103-1 Explanation of the material topic and its boundary
Our philosophy; Engaging with our stakeholders; Extensive update of our materiality analysis; Charts C04, C08, C09, C10, C23
13, 16, 21, 15, 22, 23, 48
GRI 103-2 The management approach and its components
T01, T02, and T03; Compliance; Internal investigations in 2018; Whistleblower system; Human rights; Our philosophy; “Upstream”: supply chain; Validation and evaluation of suppliers; TfS; “Gate to gate”: raw materials, production, and processes; “Downstream”: customers and end-customer applications
3, 4, 5, 29, 33, 31, 27, 48, 49, 50, 54, 56
GRI 103-3 Evaluation of the management approach
Engaging with our stakeholders; Extensive update of our materiality analysis; About this report
16, 21, 88
8 GRI 308-1 New suppliers that were screened using environmental criteria
“Upstream”: supply chain; Validation and evaluation of suppliers; TfS
49, 50 All new suppliers are screened.
GRI 308-2 Negative environmental impacts in the supply chain and actions taken
“Upstream”: supply chain; TfS 50 The number of suppliers with significant actual and potential negative environ-mental/social impacts is not currently reported, but is to be included in the next report in 2019. Percentages will not be reported.
102 SUSTAINABILITY REPORT 2018 EVONIK INDUSTRIES
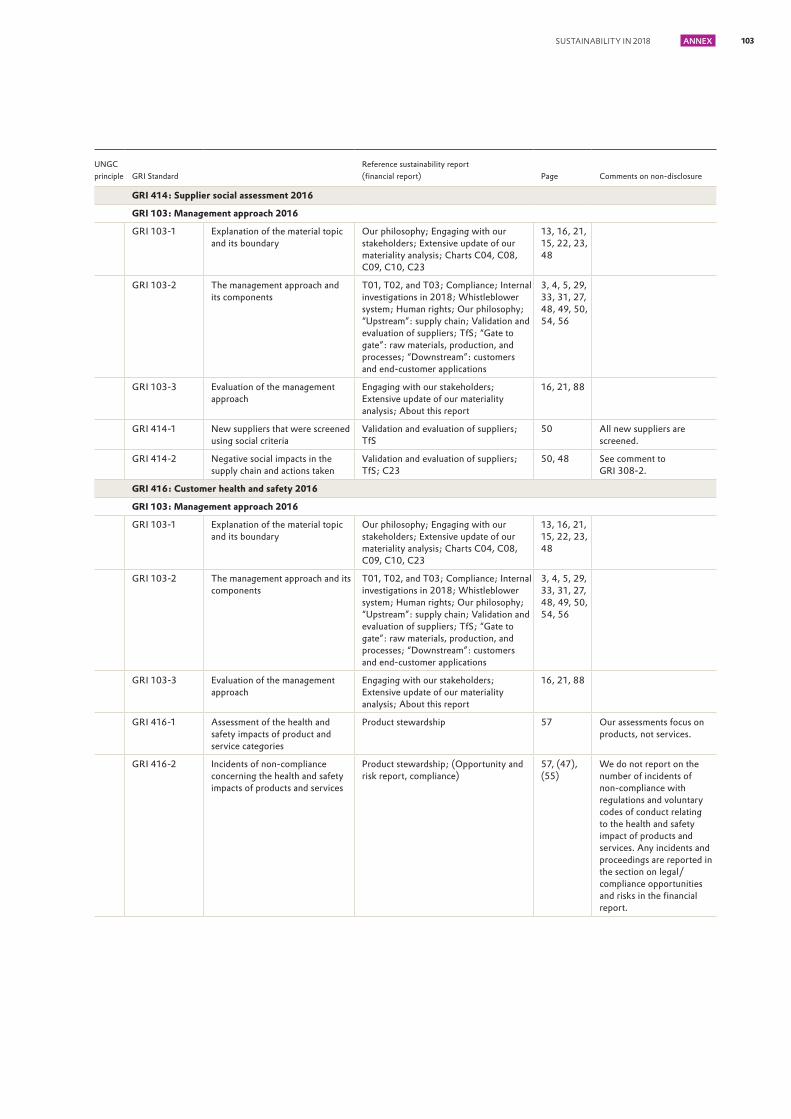
UNGC principle GRI Standard
Reference sustainability report (financial report) Page Comments on non-disclosure
GRI 414: Supplier social assessment 2016
GRI 103: Management approach 2016
GRI 103-1 Explanation of the material topic and its boundary
Our philosophy; Engaging with our stakeholders; Extensive update of our materiality analysis; Charts C04, C08, C09, C10, C23
13, 16, 21, 15, 22, 23, 48
GRI 103-2 The management approach and its components
T01, T02, and T03; Compliance; Internal investigations in 2018; Whistleblower system; Human rights; Our philosophy; “Upstream”: supply chain; Validation and evaluation of suppliers; TfS; “Gate to gate”: raw materials, production, and processes; “Downstream”: customers and end-customer applications
3, 4, 5, 29, 33, 31, 27, 48, 49, 50, 54, 56
GRI 103-3 Evaluation of the management approach
Engaging with our stakeholders; Extensive update of our materiality analysis; About this report
16, 21, 88
GRI 414-1 New suppliers that were screened using social criteria
Validation and evaluation of suppliers; TfS
50 All new suppliers are screened.
GRI 414-2 Negative social impacts in the supply chain and actions taken
Validation and evaluation of suppliers; TfS; C23
50, 48 See comment to GRI 308-2.
GRI 416: Customer health and safety 2016
GRI 103: Management approach 2016
GRI 103-1 Explanation of the material topic and its boundary
Our philosophy; Engaging with our stakeholders; Extensive update of our materiality analysis; Charts C04, C08, C09, C10, C23
13, 16, 21, 15, 22, 23, 48
GRI 103-2 The management approach and its components
T01, T02, and T03; Compliance; Internal investigations in 2018; Whistleblower system; Human rights; Our philosophy; “Upstream”: supply chain; Validation and evaluation of suppliers; TfS; “Gate to gate”: raw materials, production, and processes; “Downstream”: customers and end-customer applications
3, 4, 5, 29, 33, 31, 27, 48, 49, 50, 54, 56
GRI 103-3 Evaluation of the management approach
Engaging with our stakeholders; Extensive update of our materiality analysis; About this report
16, 21, 88
GRI 416-1 Assessment of the health and safety impacts of product and service categories
Product stewardship 57 Our assessments focus on products, not services.
GRI 416-2 Incidents of non-compliance concerning the health and safety impacts of products and services
Product stewardship; (Opportunity and risk report, compliance)
57, (47), (55)
We do not report on the number of incidents of non-compliance with regulations and voluntary codes of conduct relating to the health and safety impact of products and services. Any incidents and proceedings are reported in the section on legal/ compliance opportunities and risks in the financial report.
103 ANNEX . SUSTAINABILITY IN 2018

UNGC principle GRI Standard
Reference sustainability report (financial report) Page Comments on non-disclosure
GRI 417: Marketing and Labeling 2016
GRI 103: Management approach 2016
GRI 103-1 Explanation of the material topic and its boundary
Our philosophy; Engaging with our stakeholders; Extensive update of our materiality analysis; Charts C04, C08, C09, C10, C23
13, 16, 21, 15, 22, 23, 48
GRI 103-2 The management approach and its components
T01, T02, and T03; Compliance; Internal investigations in 2018; Whistleblower system; Human rights; Our philosophy; “Upstream”: supply chain; Validation and evaluation of suppliers; TfS; “Gate to gate”: raw materials, production, and processes; “Downstream”: customers and end-customer applications
3, 4, 5, 29, 33, 31, 27, 48, 49, 50, 54, 56
GRI 103-3 Evaluation of the management approach
Engaging with our stakeholders; Extensive update of our materiality analysis; About this report
16, 21, 88
GRI 417-1 Requirements for product and service information and labeling
Product stewardship 57 We monitor compliance with rules and regulations for all our products.
GRI 417-2 Incidents of non-compliance concerning product and service information and labeling
Product stewardship; (Opportunity and risk report, compliance)
57, (47), (55)
There were no violations of product labeling requirements in the reporting period.
The environment
GRI 302: Energy 2016
GRI 103: Management approach 2016
GRI 103-1 Explanation of the material topic and its boundary
Our philosophy; Engaging with our stakeholders; Extensive update of our materiality analysis; Charts C04, C08, C09, C10, C23
13, 16, 21, 15, 22, 23, 48
GRI 103-2 The management approach and its components
T01, T02, and T03; Compliance; Internal investigations in 2018; Whistleblower system; Our philosophy; Strategy and management, Climate change and emissions into the air
3, 4, 5, 29, 33, 31, 65, 67
GRI 103-3 Evaluation of the management approach
Engaging with our stakeholders; Extensive update of our materiality analysis; Strategy and management; Organization and competencies; Energy input T18; About this report
16, 21, 65, 67, 88
104 SUSTAINABILITY REPORT 2018 EVONIK INDUSTRIES

UNGC principle GRI Standard
Reference sustainability report (financial report) Page Comments on non-disclosure
7, 8 GRI 302-1 Energy consumption within the organization
Energy input T18; Our philosophy; About this report
67, 65, 88 We do not report separately on the consumption and sale of energy for heating and cooling purposes. They are included in the reported data.
8, 9 GRI 302-4 Reduction of energy consumption Energy input T18; Our philosophy; About this report
67, 65, 88 We constantly strive to make the provision of energy more efficient, improve energy generation still further, and optimize the structure of our integrated energy and management systems. However, the focus is on avoiding GHG emissions, for which we have set a target.
GRI 303: Water 2016
GRI 103: Management approach 2016
GRI 103-1 Explanation of the material topic and its boundary
Our philosophy; Engaging with our stakeholders; Extensive update of our materiality analysis; Charts C04, C08, C09, C10, C23
13, 16, 21, 15, 22, 23, 48
GRI 103-2 The management approach and its components
T01, T02, and T03; Compliance; Internal investigations in 2018; Whistleblower system; Our philosophy; Strategy and management; Water management; Biodiversity
3, 4, 5, 29, 33, 31, 65, 71, 74
GRI 103-3 Evaluation of the management approach
Engaging with our stakeholders; Extensive update of our materiality analysis; Strategy and management; Organization and competencies; About this report; Water management; T24, T25
16, 21, 65, 88, 71, 72
7, 8 GRI 303-1 Water withdrawal by source Water management, Our philosophy; About this report; Evonik production sites adjacent to conservation areas T29
71, 65, 88, 75
8 GRI 303-3 Water recycled and reused Water management; Our philosophy; About this report
71, 65, 88
GRI 304: Biodiversity 2016
GRI 103: Management approach 2016
GRI 103-1 Explanation of the material topic and its boundary
Our philosophy; Engaging with our stakeholders; Extensive update of our materiality analysis; Charts C04, C08, C09, C10, C23
13, 16, 21, 15, 22, 23, 48
GRI 103-2 The management approach and its components
T01, T02, and T03; Compliance; Internal investigations in 2018; Whistleblower system; Our philosophy; Strategy and management; Biodiversity
3, 4, 5, 29, 33, 31, 65, 74
GRI 103-3 Evaluation of the management approach
Engaging with our stakeholders; Extensive update of our materiality ana lysis; Strategy and management; Organization and competencies; About this report; Biodiversity
16, 21, 65, 88, 74
105 ANNEX . SUSTAINABILITY IN 2018
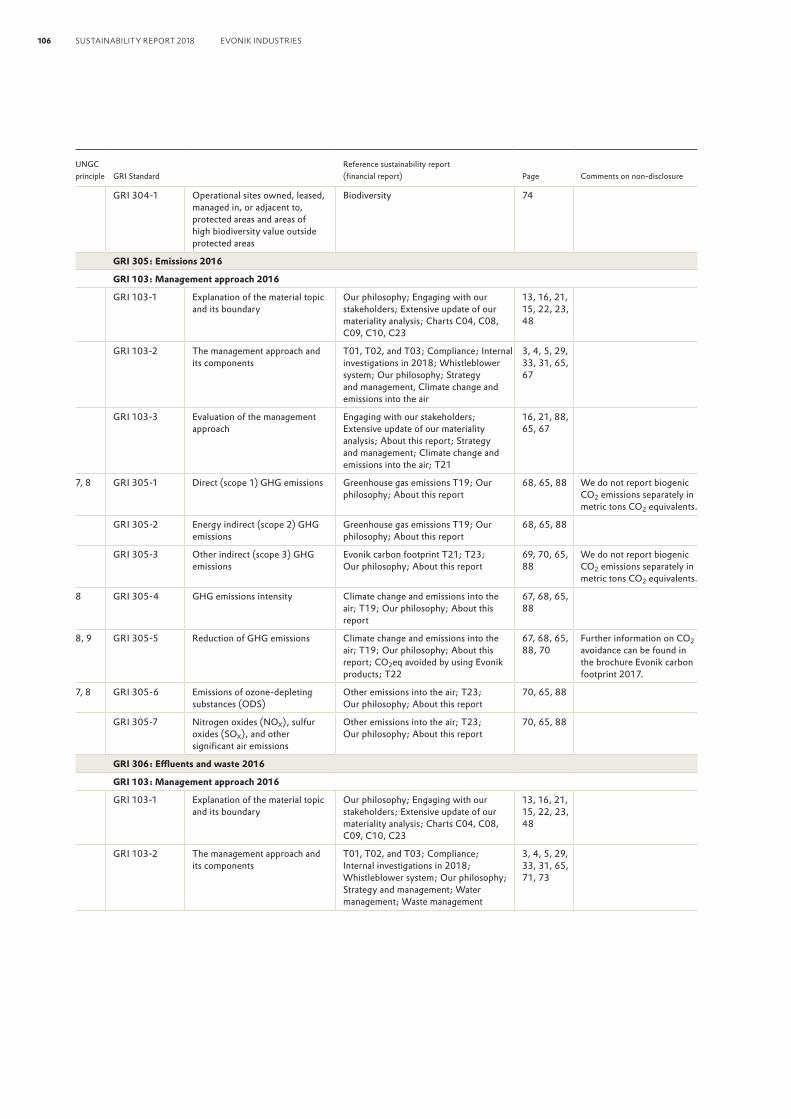
UNGC principle GRI Standard
Reference sustainability report (financial report) Page Comments on non-disclosure
GRI 304-1 Operational sites owned, leased, managed in, or adjacent to, protected areas and areas of high biodiversity value outside protected areas
Biodiversity 74
GRI 305: Emissions 2016
GRI 103: Management approach 2016
GRI 103-1 Explanation of the material topic and its boundary
Our philosophy; Engaging with our stakeholders; Extensive update of our materiality analysis; Charts C04, C08, C09, C10, C23
13, 16, 21, 15, 22, 23, 48
GRI 103-2 The management approach and its components
T01, T02, and T03; Compliance; Internal investigations in 2018; Whistleblower system; Our philosophy; Strategy and management, Climate change and emissions into the air
3, 4, 5, 29, 33, 31, 65, 67
GRI 103-3 Evaluation of the management approach
Engaging with our stakeholders; Extensive update of our materiality analysis; About this report; Strategy and management; Climate change and emissions into the air; T21
16, 21, 88, 65, 67
7, 8 GRI 305-1 Direct (scope 1) GHG emissions Greenhouse gas emissions T19; Our philosophy; About this report
68, 65, 88 We do not report biogenic CO2 emissions separately in metric tons CO2 equivalents.
GRI 305-2 Energy indirect (scope 2) GHG emissions
Greenhouse gas emissions T19; Our philosophy; About this report
68, 65, 88
GRI 305-3 Other indirect (scope 3) GHG emissions
Evonik carbon footprint T21; T23; Our philosophy; About this report
69, 70, 65, 88
We do not report biogenic CO2 emissions separately in metric tons CO2 equivalents.
8 GRI 305-4 GHG emissions intensity Climate change and emissions into the air; T19; Our philosophy; About this report
67, 68, 65, 88
8, 9 GRI 305-5 Reduction of GHG emissions Climate change and emissions into the air; T19; Our philosophy; About this report; CO2eq avoided by using Evonik products; T22
67, 68, 65, 88, 70
Further information on CO2 avoidance can be found in the brochure Evonik carbon footprint 2017.
7, 8 GRI 305-6 Emissions of ozone-depleting substances (ODS)
Other emissions into the air; T23; Our philosophy; About this report
70, 65, 88
GRI 305-7 Nitrogen oxides (NOX), sulfur oxides (SOX), and other significant air emissions
Other emissions into the air; T23; Our philosophy; About this report
70, 65, 88
GRI 306: Effluents and waste 2016
GRI 103: Management approach 2016
GRI 103-1 Explanation of the material topic and its boundary
Our philosophy; Engaging with our stakeholders; Extensive update of our materiality analysis; Charts C04, C08, C09, C10, C23
13, 16, 21, 15, 22, 23, 48
GRI 103-2 The management approach and its components
T01, T02, and T03; Compliance; Internal investigations in 2018; Whistleblower system; Our philosophy; Strategy and management; Water management; Waste management
3, 4, 5, 29, 33, 31, 65, 71, 73
106 SUSTAINABILITY REPORT 2018 EVONIK INDUSTRIES

UNGC principle GRI Standard
Reference sustainability report (financial report) Page Comments on non-disclosure
GRI 103-3 Evaluation of the management approach
Engaging with our stakeholders; Extensive update of our materiality analysis; About this report; Water management; Waste management
16, 21, 88, 71, 73
8 GRI 306-1 Water discharge by quality and destination
Water management; Our philosophy; About this report
71, 65, 88 The destination is not reported separately.
GRI 306-2 Waste by type and disposal method
Waste management; Our philosophy; About this report
73, 65, 88
GRI 306-3 Significant spills Waste management 73 There were no spills of hazardous substances in the reporting period resulting in serious injury or a significant impact on the soil, flora, or water, including ground-water.
GRI 306-4 Transport of hazardous waste Waste management 73 Data for this indicator has not yet been compiled.
GRI 307: Environmental compliance 2016
GRI 103: Management approach 2016
GRI 103-1 Explanation of the material topic and its boundary
Our philosophy; Engaging with our stakeholders; Extensive update of our materiality analysis; Charts C04, C08, C09, C10, C23
13, 16, 21, 15, 22, 23, 48
GRI 103-2 The management approach and its components
T01, T02, and T03; Compliance; Internal investigations in 2018; Whistleblower system
3, 4, 5, 29, 33, 31
GRI 103-3 Evaluation of the management approach
Engaging with our stakeholders; Extensive update of our materiality analysis; About this report; Compliance; Internal investigations in 2018
16, 21, 88, 29, 33
8 GRI 307-1 Non-compliance with environmental laws and regulations
Internal investigations in 2018; (Compliance)
57, (47), (55)
No significant fines exceeding € 25,000 and no non-monetary penalties were imposed on Evonik in 2018 for failure to comply with laws or regulations.
Safety
GRI 403: Occupational health and safety 2016
GRI 103: Management approach 2016
GRI 103-1 Explanation of the material topic and its boundary
Our philosophy; Engaging with our stakeholders; Extensive update of our materiality analysis; Charts C04, C08, C09, C10, C23
13, 16, 21, 15, 22, 23, 48
GRI 103-2 The management approach and its components
T01, T02, and T03; Compliance; Internal investigations in 2018; Whistleblower system; Our philosophy; Our sustainability strategy; Organization and management
3, 4, 5, 29, 33, 31, 78, 13, 14
107 ANNEX . SUSTAINABILITY IN 2018
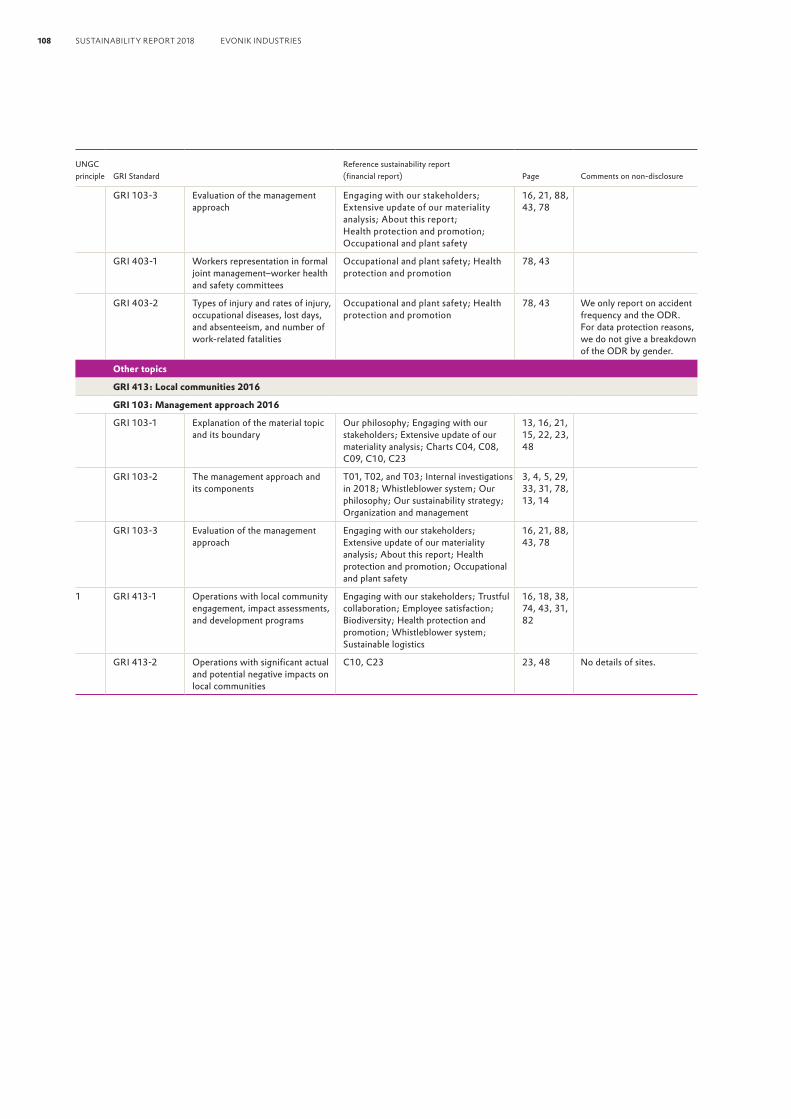
UNGC principle GRI Standard
Reference sustainability report (financial report) Page Comments on non-disclosure
GRI 103-3 Evaluation of the management approach
Engaging with our stakeholders; Extensive update of our materiality analysis; About this report; Health protection and promotion; Occupational and plant safety
16, 21, 88, 43, 78
GRI 403-1 Workers representation in formal joint management–worker health and safety committees
Occupational and plant safety; Health protection and promotion
78, 43
GRI 403-2 Types of injury and rates of injury, occupational diseases, lost days, and absenteeism, and number of work-related fatalities
Occupational and plant safety; Health protection and promotion
78, 43 We only report on accident frequency and the ODR. For data protection reasons, we do not give a breakdown of the ODR by gender.
Other topics
GRI 413: Local communities 2016
GRI 103: Management approach 2016
GRI 103-1 Explanation of the material topic and its boundary
Our philosophy; Engaging with our stakeholders; Extensive update of our materiality analysis; Charts C04, C08, C09, C10, C23
13, 16, 21, 15, 22, 23, 48
GRI 103-2 The management approach and its components
T01, T02, and T03; Internal investigations in 2018; Whistleblower system; Our philosophy; Our sustainability strategy; Organization and management
3, 4, 5, 29, 33, 31, 78, 13, 14
GRI 103-3 Evaluation of the management approach
Engaging with our stakeholders; Extensive update of our materiality analysis; About this report; Health protection and promotion; Occupational and plant safety
16, 21, 88, 43, 78
1 GRI 413-1 Operations with local community engagement, impact assessments, and development programs
Engaging with our stakeholders; Trustful collaboration; Employee satisfaction; Biodiversity; Health protection and promotion; Whistleblower system; Sustainable logistics
16, 18, 38, 74, 43, 31, 82
GRI 413-2 Operations with significant actual and potential negative impacts on local communities
C10, C23 23, 48 No details of sites.
108 SUSTAINABILITY REPORT 2018 EVONIK INDUSTRIES
Independent Practitioner’s Limited Assurance Report
Independent Practitioner’s Report on a Limited Assurance Engagement on Sustainability Information1
To the Evonik Industries AG, EssenWe have performed a limited assurance engagement on the chapters denoted with with the exception of disclosures marked as “non-audited” in the sustainability report of Evonik Industries AG, Essen (hereinafter: “the Company”), for the period from 01 January 2018 to 31 December 2018 (herein-after: “Report”). Our engagement in this context relates solely to the chapters denoted with the symbol with the exception of disclosures marked as “non-audited”.
Responsibilities of the Executive DirectorsThe executive directors of the Company are responsible for the preparation of the Report in accordance with the principles stated in the Sustainability Reporting Standards of the Global Reporting Initiative (hereinafter: “GRI-Criteria”) and for the selection of the disclosures to be evaluated.
This responsibility of Company’s executive directors includes the selection and application of appropriate methods of sustainability reporting as well as making assumptions and estimates related to individual sustainability disclosures, which are reasonable in the circumstances. Furthermore, the executive directors are responsible for such internal control as they have considered necessary to enable the preparation of a Report that is free from material misstatement whether due to fraud or error.
Independence and Quality Control of the Audit FirmWe have complied with the German professional provisions regarding independence as well as other ethical requirements.
Our audit firm applies the national legal requirements and professional standards – in particular the Professional Code for German Public Auditors and German Chartered Auditors (“Berufssatzung für Wirtschaftsprüfer und vereidigte
Buchprüfer“: “BS WP/vBP”) as well as the Standard on Quality Control 1 published by the Institut der Wirtschafts-prüfer (Institute of Public Auditors in Germany; IDW): Requirements to quality control for audit firms (IDW Qualitätssicherungsstandard 1: Anforderungen an die Qualitätssicherung in der Wirtschaftsprüferpraxis – IDW QS 1) – and accordingly maintains a comprehensive system of quality control including documented policies and procedures regarding compliance with ethical requirements, professional standards and applicable legal and regulatory requirements.
Practitioner’s ResponsibilityOur responsibility is to express a limited assurance conclusion on the chapters denoted with with the exception of dis-closures marked as “non-audited” in the Report based on the assurance engagement we have performed.
Within the scope of our engagement we did not perform an audit on external sources of information or expert opinions, referred to in the Report.
We conducted our assurance engagement in accordance with the International Standard on Assurance Engagements (ISAE) 3000 (Revised): Assurance Engagements other than Audits or Reviews of Historical Financial Information, issued by the IAASB. This Standard requires that we plan and per-form the assurance engagement to allow us to conclude with limited assurance that nothing has come to our attention that causes us to believe that the chapters denoted with with the exception of disclosures marked as “non-audited” in the Company’s Report for the period from 01 January 2018 to 31 December 2018 has not been prepared, in all material aspects, in accordance with the relevant GRI-Criteria. This does not mean that a separate conclusion is expressed on each chapter so denoted.
In a limited assurance engagement the assurance proce-dures are less in extent than for a reasonable assurance engagement and therefore a substantially lower level of assurance is obtained. The assurance procedures selected depend on the practitioner’s judgment.
1 PricewaterhouseCoopers GmbH has performed a limited assurance engagement on the German version of the sustainability report of the business report and issued an independent assurance report in German language, which is authoritative. The following text is a translation of the independent assurance report.
109 ANNEX . SUSTAINABILITY IN 2018
Within the scope of our assurance engagement, we performed amongst others the following assurance procedures and further activities:• Obtaining an understanding of the structure of the sus-
tainability organization and of the stakeholder engagement • Inquiries of personnel involved in the preparation of the
Report regarding the preparation process, the internal control system relating to this process and selected dis-closures in the Report
• Identification of the likely risks of material misstatement of the Report under consideration of the GRI-Criteria
• Analytical evaluation of selected disclosures in the Report• Performance of site visits or web conferences as part of
the inspection of processes and guidelines for data collection at the following locations Marl (Germany), Wesseling (Germany), Hanau (Germany), Chester (USA), Mobile (USA), Parsippany (USA).
• Comparison of selected disclosures with corresponding data in the consolidated financial statements and in the group management report
• Evaluation of the presentation of the selected disclosures regarding sustainability performance
Assurance ConclusionBased on the assurance procedures performed and assurance evidence obtained, nothing has come to our attention that causes us to believe that the chapters denoted with with the exception of disclosures marked as “non-audited” in the Company’s Report for the period from 01 January 2018 to 31 December 2018 have not been prepared, in all material aspects, in accordance with the relevant GRI-Criteria.
Intended Use of the Assurance ReportWe issue this report on the basis of the engagement agreed with the Company. The assurance engagement has been per-formed for purposes of the Company and the report is solely intended to inform the Company as to the results of the assurance engagement. The report is not intended to provide
third parties with support in making (financial) decisions. Our responsibility lies solely toward the Company. We do not assume any responsibility towards third parties.
Munich, February 19, 2019
PricewaterhouseCoopers GmbHWirtschaftsprüfungsgesellschaft
Hendrik Fink ppa. Pia SchnückWirtschaftsprüfer (German Public Auditor)
110 SUSTAINABILITY REPORT 2018 EVONIK INDUSTRIES
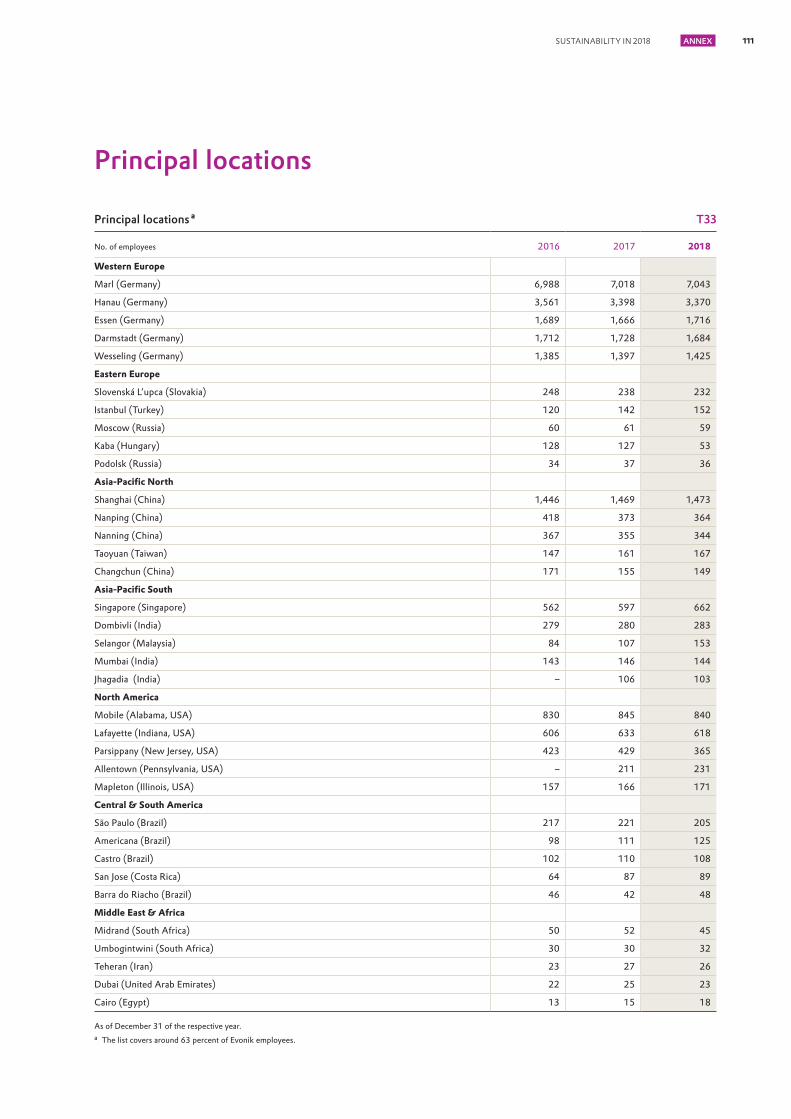
Principal locations
Principal locations a T33
No. of employees 2016 2017 2018
Western Europe
Marl (Germany) 6,988 7,018 7,043
Hanau (Germany) 3,561 3,398 3,370
Essen (Germany) 1,689 1,666 1,716
Darmstadt (Germany) 1,712 1,728 1,684
Wesseling (Germany) 1,385 1,397 1,425
Eastern Europe
Slovenská L’upca (Slovakia) 248 238 232
Istanbul (Turkey) 120 142 152
Moscow (Russia) 60 61 59
Kaba (Hungary) 128 127 53
Podolsk (Russia) 34 37 36
Asia-Pacific North
Shanghai (China) 1,446 1,469 1,473
Nanping (China) 418 373 364
Nanning (China) 367 355 344
Taoyuan (Taiwan) 147 161 167
Changchun (China) 171 155 149
Asia-Pacific South
Singapore (Singapore) 562 597 662
Dombivli (India) 279 280 283
Selangor (Malaysia) 84 107 153
Mumbai (India) 143 146 144
Jhagadia (India) – 106 103
North America
Mobile (Alabama, USA) 830 845 840
Lafayette (Indiana, USA) 606 633 618
Parsippany (New Jersey, USA) 423 429 365
Allentown (Pennsylvania, USA) – 211 231
Mapleton (Illinois, USA) 157 166 171
Central & South America
São Paulo (Brazil) 217 221 205
Americana (Brazil) 98 111 125
Castro (Brazil) 102 110 108
San Jose (Costa Rica) 64 87 89
Barra do Riacho (Brazil) 46 42 48
Middle East & Africa
Midrand (South Africa) 50 52 45
Umbogintwini (South Africa) 30 30 32
Teheran (Iran) 23 27 26
Dubai (United Arab Emirates) 22 25 23
Cairo (Egypt) 13 15 18
As of December 31 of the respective year.a The list covers around 63 percent of Evonik employees.
111 ANNEX . SUSTAINABILITY IN 2018
Glossary
CDPCDP is a non-profit organization that brings together investors from around the world. It encourages companies and local authorities to report data on greenhouse gas emissions and water use.
Chemie³This is a joint initiative of the German Chemical Industry Association (VCI), the German Mining, Chemical and Energy Industrial Union (IG BCE), and the German Chemical Industry Employers’ Federation (BAVC) to drive forward sustainable development.
Dodd-Frank Act, section 1502 (conflict minerals)The Dodd-Frank Wall Street Reform and Consumer Protection Act (known as the Dodd-Frank Act for short) was adopted in 2010. Its prime aim is regulation of the US financial market.
Section 1502 contains disclosure and reporting requirements for listed US companies on the use of certain minerals originat-ing from the Democratic Republic of Congo and neighboring states. The Dodd-Frank Act defines coltan, cassiterite, wol-framite and their derivatives (tantalum, tin, tungsten), and gold as conflict minerals if they are used to finance armed conflict.
econsense—Forum for Sustainable Development of German Businesseconsense is an association of leading German companies and organizations. The members aim to work together to promote sustainable economic development through open dialogue.
Global Reporting Initiative (GRI)The GRI is a global, network-based not-for-profit organiza-tion. It publishes the world’s most commonly used guidelines on sustainability reporting. This sustainability report has been prepared on the basis of the specifications of the GRI Standards, “core” level.
International Labour StandardsThe International Labour Organization (ILO), a sub-organiza-tion of the United Nations (UN), and its actions are defined by four basic principles: freedom of association and the right to collective bargaining, the elimination of forced labor, the abandonment of child labor, and the elimination of discrimi-nation in respect of employment and occupation. These basic principles are set out in eight conventions with the ILO.
Low Carbon Technology Partnerships InitiativeThe Low Carbon Technology Partnerships Initiative was set up by the World Business Council for Sustainable Development to accelerate the development of low carbon tech nology solutions.
OECD Guidelines for Multinational EnterprisesThe guidelines issued by the Organisation for Economic Cooperation and Development (OECD) are government recommendations to multinational enterprises operating in or from member states. They comprise principles and bench-marks for responsible corporate action, but are not legally binding.
Life cycle assessment A life cycle assessment comprises compiling and assessing the inputs and outputs and potential environmental impact of a product system during its life cycle, based on a standardized international method (DIN EN ISO 14040/44). Alongside life cycle assessments, Evonik performs life cycle-based analyses with reduced scope to obtain information on specific environ-mental impacts (e.g., carbon footprints).
Responsible Care®Responsible Care® is the global initiative of the chemical industry to bring about a continuous improvement in envi-ronmental protection, health, and safety. As well as complying with legislation, the industry cooperates with government agencies and stakeholders in various voluntary initiatives.
Sustainable Development GoalsIn fall 2015, the United Nations published 17 global sustainable development goals, to be achieved by 2030. They replace the eight Millennium Development Goals, which expired in 2015.
UN Global CompactThe Global Compact is an initiative of the United Nations based on ten principles for responsible action by companies.
World Business Council for Sustainable Development (WBCSD) / Vision 2050 The WBCSD is a company-led organization that aims to drive forward sustainable development worldwide. The WBCSD’s Vision 2050 describes the pathway to achieving a sustainable world with around nine billion people living well within the limits of the planet by 2050.
112 SUSTAINABILITY REPORT 2018 EVONIK INDUSTRIES
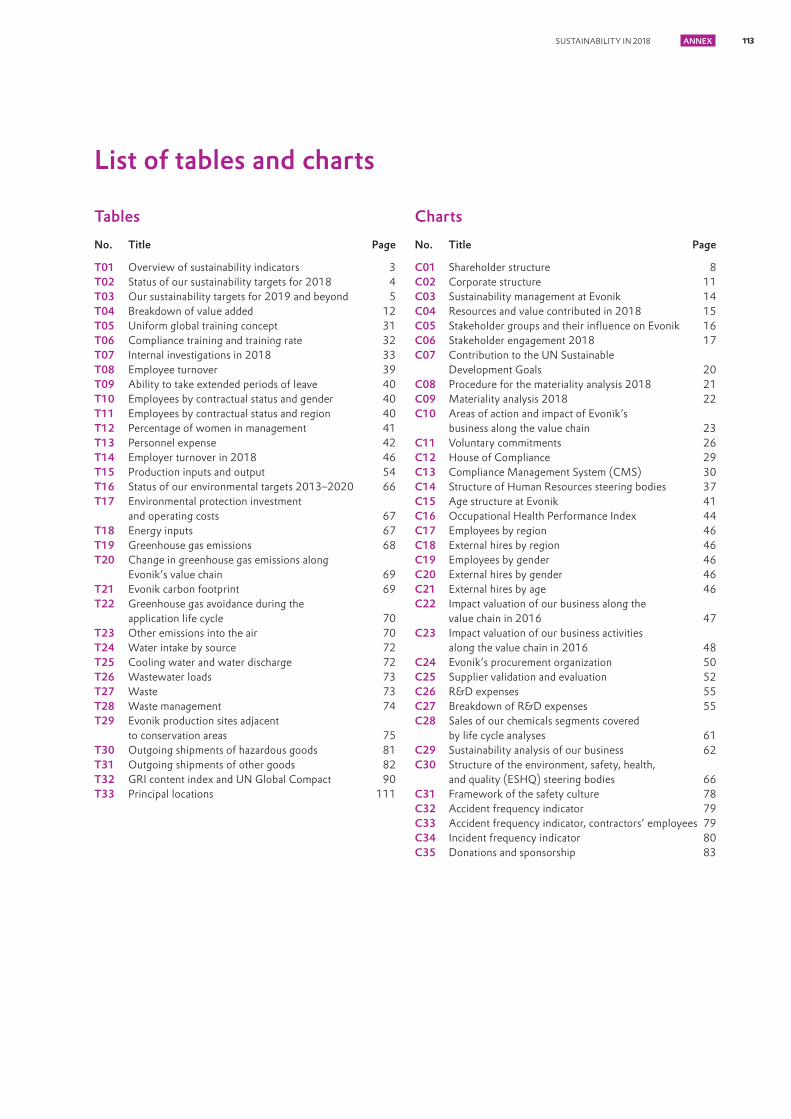
List of tables and charts
TablesNo. Title Page
T01 Overview of sustainability indicators 3T02 Status of our sustainability targets for 2018 4T03 Our sustainability targets for 2019 and beyond 5T04 Breakdown of value added 12T05 Uniform global training concept 31T06 Compliance training and training rate 32T07 Internal investigations in 2018 33T08 Employee turnover 39T09 Ability to take extended periods of leave 40T10 Employees by contractual status and gender 40T11 Employees by contractual status and region 40T12 Percentage of women in management 41T13 Personnel expense 42T14 Employer turnover in 2018 46T15 Production inputs and output 54T16 Status of our environmental targets 2013–2020 66T17 Environmental protection investment
and operating costs 67T18 Energy inputs 67T19 Greenhouse gas emissions 68T20 Change in greenhouse gas emissions along
Evonik’s value chain 69T21 Evonik carbon footprint 69T22 Greenhouse gas avoidance during the
application life cycle 70T23 Other emissions into the air 70T24 Water intake by source 72T25 Cooling water and water discharge 72T26 Wastewater loads 73T27 Waste 73T28 Waste management 74T29 Evonik production sites adjacent
to conservation areas 75T30 Outgoing shipments of hazardous goods 81T31 Outgoing shipments of other goods 82T32 GRI content index and UN Global Compact 90T33 Principal locations 111
ChartsNo. Title Page
C01 Shareholder structure 8C02 Corporate structure 11C03 Sustainability management at Evonik 14C04 Resources and value contributed in 2018 15C05 Stakeholder groups and their influence on Evonik 16C06 Stakeholder engagement 2018 17C07 Contribution to the UN Sustainable
Development Goals 20C08 Procedure for the materiality analysis 2018 21C09 Materiality analysis 2018 22C10 Areas of action and impact of Evonik’s
business along the value chain 23C11 Voluntary commitments 26C12 House of Compliance 29C13 Compliance Management System (CMS) 30C14 Structure of Human Resources steering bodies 37C15 Age structure at Evonik 41C16 Occupational Health Performance Index 44C17 Employees by region 46C18 External hires by region 46C19 Employees by gender 46C20 External hires by gender 46C21 External hires by age 46C22 Impact valuation of our business along the
value chain in 2016 47C23 Impact valuation of our business activities
along the value chain in 2016 48C24 Evonik’s procurement organization 50C25 Supplier validation and evaluation 52C26 R&D expenses 55C27 Breakdown of R&D expenses 55C28 Sales of our chemicals segments covered
by life cycle analyses 61C29 Sustainability analysis of our business 62C30 Structure of the environment, safety, health,
and quality (ESHQ) steering bodies 66C31 Framework of the safety culture 78C32 Accident frequency indicator 79C33 Accident frequency indicator, contractors’ employees 79C34 Incident frequency indicator 80C35 Donations and sponsorship 83
113 ANNEX . SUSTAINABILITY IN 2018

The League of American Communications Profes-sionals (LACP) presented Evonik with the Vision Award in silver for its Sustainability Report 2017. The jury awarded Evonik 97 out of 100 points.
Evonik was once again successful in the Sustainable Business Awards Singapore in 2018. It received special recognition in the categories Business Re -sponsibility & Ethics, and Supply Chain Management.
Evonik’s sustainability report 2017 won gold in the Fox Awards and silver in the Fox Visuals.
Sustainability awards 2018
As of: December 31, 2018.
MSCI once again included Evonik in its World ESG Leaders Index and the Socially Responsible Index Europe. MSCI is a US financial services company that mainly provides services for investment banking. In addition to international equity indices, it provides portfolio and risk analyses and research.
Evonik participates in CDP Climate Change, CDP Water, and CDP Supply Chain.
Evonik is included in the STOXX® Global ESG Leaders Index. This index, which was launched by Deutsche Börse among others, lists the best 25 percent of sustainable companies in the investment universe on transparency in environmental, social, and governance performance.
Evonik was included in the renowned Dow Jones sustainability indices Dow Jones Sustainability Index (DJSI) Europe and DJSI World for the third time in succession. We received particularly high scores for our reporting on environmental and social issues and customer relationship management.
Evonik’s sustainability performance was also evaluated by the independent rating agency Sustainalytics. Evonik is among the top 10 percent of the around 130 companies ranked in the chemical sector.
In the Euronext index family, Evonik gained a place in the Europe120 as one of the strongest companies in Europe, based on an evaluation of its corporate responsibility performance. The Europe120 index comprises leading companies from various sectors.
Evonik’s sustainability performance again received a B – rating from ISS-oekom. The company therefore has Prime Status, the highest level awarded, ranking it among the top 10 percent of companies in the chemical sector.
Evonik is a member of the FTSE4Good index. This index family of the London-based FTSE Group rates companies in categories such as environmental management, human and labor rights, health and safety, sustainability in the supply chain, and corporate governance.
As a founding member of the Together for Sustainability (TfS) initiative, Evonik drives forwards transparency and sustainability in the supply chain and is subject to annual assessments. Evonik received a gold rating for its sustainability performance from the rating agency EcoVadis, partner of TfS, for the fifth time in succession.
Ratings and indices 2018
114 SUSTAINABILITY REPORT 2018 EVONIK INDUSTRIES
Credits
PUBLISHEREvonik Industries AGRellinghauser Strasse 1 – 1145128 EssenGermanywww.evonik.com
CONTACTCorporate ResponsibilityHead of Corporate Responsibility:Stefan Haver [email protected]
Corporate Responsibility Relations: Hannelore Gantzer [email protected] Beermann [email protected] [email protected]
CONCEPT, DESIGN, AND REALIZATIONBISSINGER[+] GmbH
PICTURE CREDITSPage 6, 77 Bernd Brundert/EvonikPage 9, 16, 47, 58, 83 EvonikPage 10, 16 Mark AnsorgPage 18 Harald ReussmannPage 19, 21, 63 Stefan Wildhirt/EvonikPage 24 Mark AnsorgPage 27 Alex Silva/EvonikPage 34, 49 Frank Preuß/EvonikPage 36, 79 Dieter Debo/EvonikPage 38, 44 Anna-Lina Nikelowski/EvonikPage 41 PrivatePage 51 Bin YuPage 64 Dr. Torsten Stojanik/EvonikPage 64 Ratna MorjariaPage 65 Karen BaylissPage 71 Foto HannoPage 75 Renate SchüttPage 77 Bart Kooi/Dr. Markus Schwarz/EvonikPage 81 Markus Schmidt/EvonikPage 83 Tanmaya Telang/EvonikPage 85 Lukas Kröger/Evonik
This report contains forward-looking statements based on the present expectations, assumptions, and forecasts made by the executive board and the information available to it. These forward-looking statements do not constitute a guarantee of future developments and earnings expectations. Future performance and developments depend on a wide variety of factors, which contain a number of risks and unforeseeable factors and are based on assumptions that may prove incorrect.
As of: February 11, 2019

EVONIK INDUSTRIES AGRellinghauser Strasse 1–1145128 Essen, Germanywww.evonik.com