Sustainability Report - StarHub - Investor...
42
StarHub’s sixth annual sustainability report presents a balanced overview of our environmental, social and governance (ESG) performance for the calendar year 2016. Sustainability Report SR2016 Sustainability Report Sustainability Contents Value Creation 90 Our Stakeholders 92 Our Materiality Topics 96 – Our Environment 98 – Our Marketplace 104 – Our Workplace 108 – Our Community 114 Economic Performance 118 GRI Content Index 120 About This Report This report has been prepared in accordance with the Global Reporting Initiative (GRI) Standards: Core option, the latest set of standards issued by the GRI Global Sustainability Standards Board which will supersede the GRI G4 Guidelines from July 2018. We have decided to be an early adopter of the GRI Standards starting with this report. The report continues to include relevant indicators from GRI’s Telecommunications Sector Supplement and the G4 Media Sector Disclosures. In developing the report, we have also incorporated some of the International Integrated Reporting Council’s (IIRC) Integrated Reporting principles to communicate value created by our ESG strategies, wherever possible. A GRI Content Index has been included at the end of this report indicating the disclosures’ locations. This report covers ESG performance of all business divisions and subsidiaries which are under StarHub’s financial and operational control. Information presented in the report has been extracted from the primary internal records and documents to ensure accuracy using internationally accepted measurement data units. Reporting Principles As in our previous reports, we have followed the GRI principles for defining the sustainability report content and quality. We have determined the report content using the principles of stakeholder inclusiveness, sustainability context, materiality and completeness. To ensure quality of the report, we have applied the GRI principles of accuracy, balance, clarity, comparability, reliability and timeliness. Reporting Process StarHub’s Sustainability Committee, which includes senior executives from major functions, provides the overall direction for preparing the report. The Committee’s responsibilities include reviewing, assessing and determining the sustainability context, material ESG topics, report content and topic boundaries, scope and prioritisation of issues to be included in the report. The Committee also considers formal and informal feedback from a range of internal and external stakeholders received throughout the year to determine the most material topics to be covered in the report. The Committee is supported by a cross- functional project team which gathers and verifies ESG performance data. Our reporting cycle begins with a review of the current sustainability report to re-assess the material topics and their boundaries in the light of business environment changes, stakeholder feedback and sustainability trends. StarHub’s Corporate Sustainability and Responsibility (CSR) advocate has the responsibility for coordinating the entire reporting process. Restatements This report does not include any restatement of previously published data. Sustainability Report Significant Achievements FY2016 “I’m the one who watches the most StarHub TV programmes at home. I also love the fast speeds on StarHub fibre broadband to access my favourite apps & follow rugby and golf games.” Ethan Koh Young Hubber JAN Ranked 8 th in the Corporate Knights Global 100 Most Sustainable Corporations list. Remains the only local telco on the list MAY Raised $122,000 for Hair for Hope, with 122 StarHubbers and business partners shaving their heads JUN Contributed $200,000 to Central Singapore Community Development Council (CDC) to support learning opportunities and literacy for disadvantaged children AUG Organised annual StarHub Open and raised $209,700 for Metta School, MINDS Towner Garden School and Lighthouse School OCT Won the Sustainable Business category at the 2016 Singapore Apex Corporate Sustainability Awards NOV Won “Best Sustainability Report within an Annual Report” at the 2016 Asia Sustainability Reporting Awards (ASRA) Sustainability StarHub Ltd Annual Report 2016 87 86 Hubbing at Your Service
Transcript of Sustainability Report - StarHub - Investor...
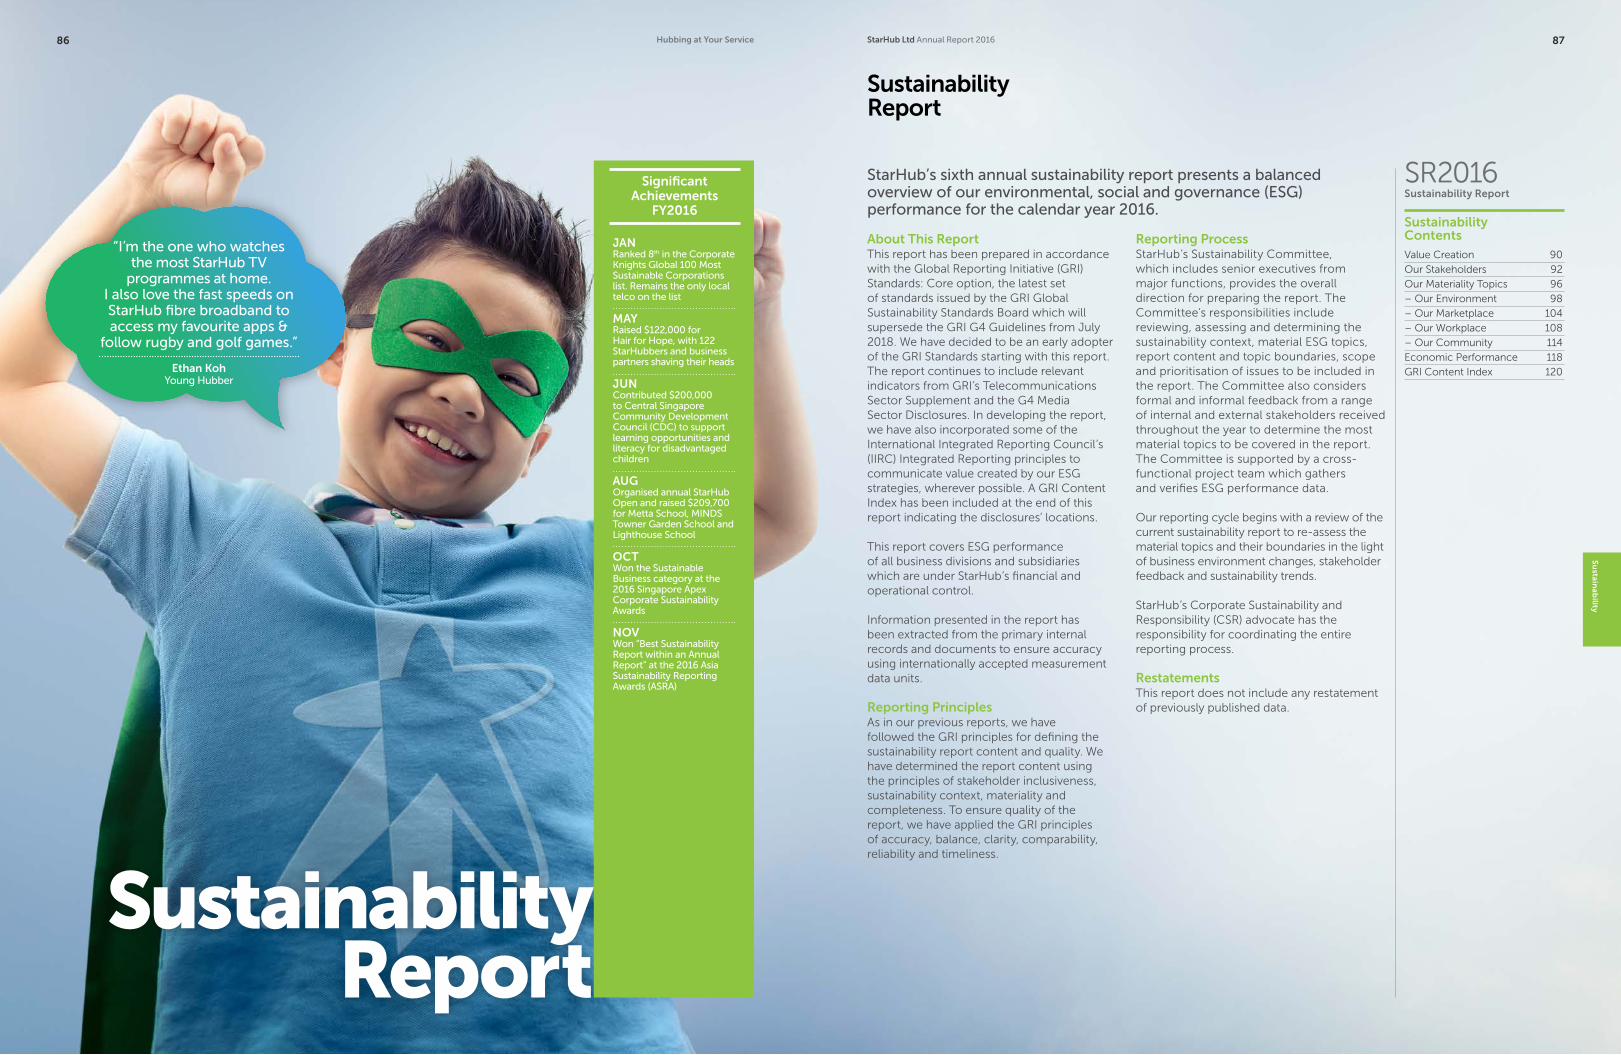
StarHub’s sixth annual sustainability report presents a balanced overview of our environmental, social and governance (ESG) performance for the calendar year 2016.
Sustainability Report
SR2016Sustainability Report
Sustainability ContentsValue Creation 90
Our Stakeholders 92
Our Materiality Topics 96
– Our Environment 98
– Our Marketplace 104
– Our Workplace 108
– Our Community 114
Economic Performance 118
GRI Content Index 120
About This ReportThis report has been prepared in accordance with the Global Reporting Initiative (GRI) Standards: Core option, the latest set of standards issued by the GRI Global Sustainability Standards Board which will supersede the GRI G4 Guidelines from July 2018. We have decided to be an early adopter of the GRI Standards starting with this report. The report continues to include relevant indicators from GRI’s Telecommunications Sector Supplement and the G4 Media Sector Disclosures. In developing the report, we have also incorporated some of the International Integrated Reporting Council’s (IIRC) Integrated Reporting principles to communicate value created by our ESG strategies, wherever possible. A GRI Content Index has been included at the end of this report indicating the disclosures’ locations.
This report covers ESG performance of all business divisions and subsidiaries which are under StarHub’s financial and operational control.
Information presented in the report has been extracted from the primary internal records and documents to ensure accuracy using internationally accepted measurement data units.
Reporting PrinciplesAs in our previous reports, we have followed the GRI principles for defining the sustainability report content and quality. We have determined the report content using the principles of stakeholder inclusiveness, sustainability context, materiality and completeness. To ensure quality of the report, we have applied the GRI principles of accuracy, balance, clarity, comparability, reliability and timeliness.
Reporting ProcessStarHub’s Sustainability Committee, which includes senior executives from major functions, provides the overall direction for preparing the report. The Committee’s responsibilities include reviewing, assessing and determining the sustainability context, material ESG topics, report content and topic boundaries, scope and prioritisation of issues to be included in the report. The Committee also considers formal and informal feedback from a range of internal and external stakeholders received throughout the year to determine the most material topics to be covered in the report. The Committee is supported by a cross-functional project team which gathers and verifies ESG performance data.
Our reporting cycle begins with a review of the current sustainability report to re-assess the material topics and their boundaries in the light of business environment changes, stakeholder feedback and sustainability trends.
StarHub’s Corporate Sustainability and Responsibility (CSR) advocate has the responsibility for coordinating the entire reporting process.
RestatementsThis report does not include any restatement of previously published data.
SustainabilityReport
Significant Achievements
FY2016
“I’m the one who watches the most StarHub TV
programmes at home. I also love the fast speeds on StarHub fibre broadband to access my favourite apps &
follow rugby and golf games.”
Ethan Koh Young Hubber
JANRanked 8th in the Corporate Knights Global 100 Most Sustainable Corporations list. Remains the only local telco on the list MAYRaised $122,000 for Hair for Hope, with 122 StarHubbers and business partners shaving their heads JUNContributed $200,000 to Central Singapore Community Development Council (CDC) to support learning opportunities and literacy for disadvantaged children AUGOrganised annual StarHub Open and raised $209,700 for Metta School, MINDS Towner Garden School and Lighthouse School OCTWon the Sustainable Business category at the 2016 Singapore Apex Corporate Sustainability Awards NOVWon “Best Sustainability Report within an Annual Report” at the 2016 Asia Sustainability Reporting Awards (ASRA)
Su
stainab
ility
StarHub Ltd Annual Report 2016 8786 Hubbing at Your Service
Sustainability Report continued
External AssuranceWhile the financial statements in the report are audited by independent auditors, we rely on our internal process to verify the accuracy of ESG performance data and information presented in the report.
AvailabilityA PDF version of the report is available for download on our website www.starhub.com. Smart device users can also download the StarHub Annual Report app to browse and experience the StarHub Annual Reports on their smart devices.
A small number of copies of this report have been printed on Forest Stewardship Council (FSC) certified sustainable paper to reduce environmental impact.
FeedbackWe welcome feedback from all stakeholders. Please send questions, comments, suggestions or feedback relating to this report or our sustainability performance to [email protected]
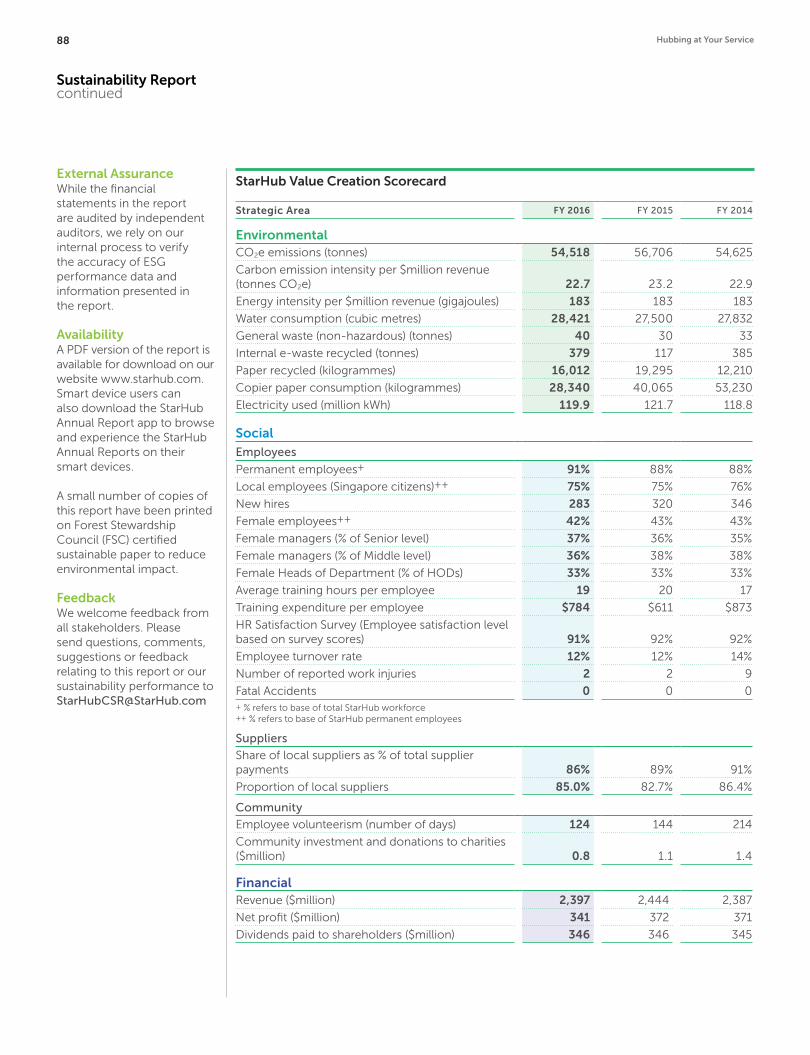
Strategic Area FY 2016 FY 2015 FY 2014
Environmental
CO2e emissions (tonnes) 54,518 56,706 54,625
Carbon emission intensity per $million revenue (tonnes CO2e) 22.7 23.2 22.9
Energy intensity per $million revenue (gigajoules) 183 183 183
Water consumption (cubic metres) 28,421 27,500 27,832
General waste (non-hazardous) (tonnes) 40 30 33
Internal e-waste recycled (tonnes) 379 117 385
Paper recycled (kilogrammes) 16,012 19,295 12,210
Copier paper consumption (kilogrammes) 28,340 40,065 53,230
Electricity used (million kWh) 119.9 121.7 118.8
Social
Employees
Permanent employees+ 91% 88% 88%
Local employees (Singapore citizens)++ 75% 75% 76%
New hires 283 320 346
Female employees++ 42% 43% 43%
Female managers (% of Senior level) 37% 36% 35%
Female managers (% of Middle level) 36% 38% 38%
Female Heads of Department (% of HODs) 33% 33% 33%
Average training hours per employee 19 20 17
Training expenditure per employee $784 $611 $873
HR Satisfaction Survey (Employee satisfaction level based on survey scores) 91% 92% 92%
Employee turnover rate 12% 12% 14%
Number of reported work injuries 2 2 9
Fatal Accidents 0 0 0+ % refers to base of total StarHub workforce++ % refers to base of StarHub permanent employees
Suppliers
Share of local suppliers as % of total supplier payments 86% 89% 91%
Proportion of local suppliers 85.0% 82.7% 86.4%
Community
Employee volunteerism (number of days) 124 144 214
Community investment and donations to charities ($million) 0.8 1.1 1.4
FinancialRevenue ($million) 2,397 2,444 2,387
Net profit ($million) 341 372 371
Dividends paid to shareholders ($million) 346 346 345
StarHub Value Creation Scorecard
88 Hubbing at Your Service

Sustainability Governance At StarHub, the Board of Directors has oversight of the Group’s sustainability strategy. The Board’s responsibilities include providing guidance on the material environmental, social and governance (ESG) factors that impact the Group’s activities.
In managing sustainability throughout the Group, the Board is assisted by the StarHub Sustainability Committee. The Sustainability Committee is headed by the CEO, and comprises senior executives of the Group representing key functions. The Sustainability Committee reviews and determines material ESG factors, develops sustainability strategy, considers stakeholder feedback and expectations, and establishes priorities, goals and targets.
StarHub’s CSR advocate is responsible for developing, managing and executing CSR programmes and is supported by a cross-functional project team which has the responsibility to collect, verify, monitor and provide ESG performance data for sustainability reporting.
StarHub Core Values: ExCITeOur approach to sustainable development of the business is guided by StarHub’s four pillars of Core Values:
Excellence
Creativity
Integrity—social, environmental and financial
Teamwork
Our sustainability strategy to create shared value for shareholders and stakeholders is deeply rooted in our core values.
Case Study
Advisor & Advisory
Panel
CSR Advocate
Network
Legal
Human Resource
Government & Strategic
Affairs
Business Continuity
Management
Corporate Administration
Corporate Purchasing
Customer Service
FinanceChairman
StarHub Sustainabilty Reporting Committee
StarHub in the
TOP 8OF THE GLOBAL 100 RANKINGStarHub’s ranking in the 2016 Global 100 Most Sustainable Corporations in the World index jumped to the 8th place from the previous 24th place. StarHub, ranked for the fourth consecutive year, is the only Singaporean info-communications provider included in this prestigious index.
The Global 100 is a list of the world’s 100 most sustainable corporations compiled by Corporate Knights based on an extensive data-driven sustainability assessment.
Asia Sustainability Reporting AwardsFor its reporting excellence, StarHub won Best Sustainability Report within an Annual Report at the Asia Sustainability Reporting Awards (ASRA) 2016.
Singapore Apex Corporate Sustainability Awards 2016StarHub was recognised for outstanding performance in corporate sustainability in the Sustainable Business category at the Singapore Apex Corporate Sustainability Awards, which recognise companies in Singapore for their commitment to sustainable business.
Su
stainab
ility
StarHub Ltd Annual Report 2016 89
Sustainability Report continued
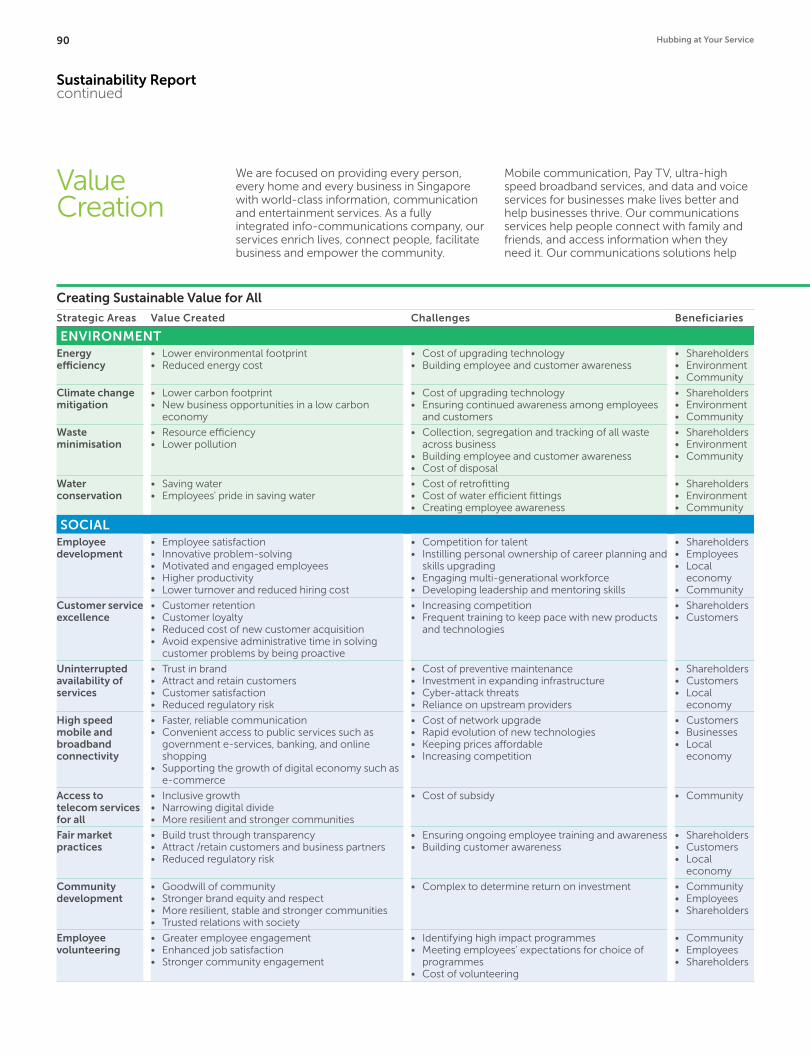
Value Creation
We are focused on providing every person, every home and every business in Singapore with world-class information, communication and entertainment services. As a fully integrated info-communications company, our services enrich lives, connect people, facilitate business and empower the community.
Mobile communication, Pay TV, ultra-high speed broadband services, and data and voice services for businesses make lives better and help businesses thrive. Our communications services help people connect with family and friends, and access information when they need it. Our communications solutions help
Strategic Areas Value Created Challenges Beneficiaries
ENVIRONMENTEnergy efficiency
• Lower environmental footprint• Reduced energy cost
• Cost of upgrading technology• Building employee and customer awareness
• Shareholders• Environment• Community
Climate change mitigation
• Lower carbon footprint• New business opportunities in a low carbon
economy
• Cost of upgrading technology• Ensuring continued awareness among employees
and customers
• Shareholders• Environment• Community
Waste minimisation
• Resource efficiency• Lower pollution
• Collection, segregation and tracking of all waste across business
• Building employee and customer awareness• Cost of disposal
• Shareholders• Environment• Community
Water conservation
• Saving water• Employees' pride in saving water
• Cost of retrofitting• Cost of water efficient fittings• Creating employee awareness
• Shareholders• Environment• Community
SOCIALEmployee development
• Employee satisfaction• Innovative problem-solving• Motivated and engaged employees• Higher productivity• Lower turnover and reduced hiring cost
• Competition for talent• Instilling personal ownership of career planning and
skills upgrading• Engaging multi-generational workforce• Developing leadership and mentoring skills
• Shareholders• Employees• Local
economy• Community
Customer service excellence
• Customer retention• Customer loyalty• Reduced cost of new customer acquisition• Avoid expensive administrative time in solving
customer problems by being proactive
• Increasing competition• Frequent training to keep pace with new products
and technologies
• Shareholders• Customers
Uninterrupted availability of services
• Trust in brand• Attract and retain customers• Customer satisfaction• Reduced regulatory risk
• Cost of preventive maintenance• Investment in expanding infrastructure• Cyber-attack threats• Reliance on upstream providers
• Shareholders• Customers• Local
economy
High speed mobile and broadband connectivity
• Faster, reliable communication• Convenient access to public services such as
government e-services, banking, and online shopping
• Supporting the growth of digital economy such as e-commerce
• Cost of network upgrade• Rapid evolution of new technologies• Keeping prices affordable• Increasing competition
• Customers• Businesses• Local
economy
Access to telecom services for all
• Inclusive growth• Narrowing digital divide• More resilient and stronger communities
• Cost of subsidy • Community
Fair market practices
• Build trust through transparency• Attract /retain customers and business partners• Reduced regulatory risk
• Ensuring ongoing employee training and awareness• Building customer awareness
• Shareholders• Customers• Local
economy
Community development
• Goodwill of community• Stronger brand equity and respect• More resilient, stable and stronger communities• Trusted relations with society
• Complex to determine return on investment • Community• Employees• Shareholders
Employee volunteering
• Greater employee engagement• Enhanced job satisfaction• Stronger community engagement
• Identifying high impact programmes• Meeting employees’ expectations for choice of
programmes• Cost of volunteering
• Community• Employees• Shareholders
Creating Sustainable Value for All
90 Hubbing at Your Service
businesses, both small and large, run their operations efficiently. Superfast and reliable connectivity that we offer allows people to access a host of public services from their mobile phones on the go. Our Pay TV services bring world-class entertainment to everyone’s home.
We operate an islandwide mobile and HFC network for delivering TV and cable broadband services. Both, part of the nation’s crucial info-communications infrastructure, enable inclusive growth and support economic development.
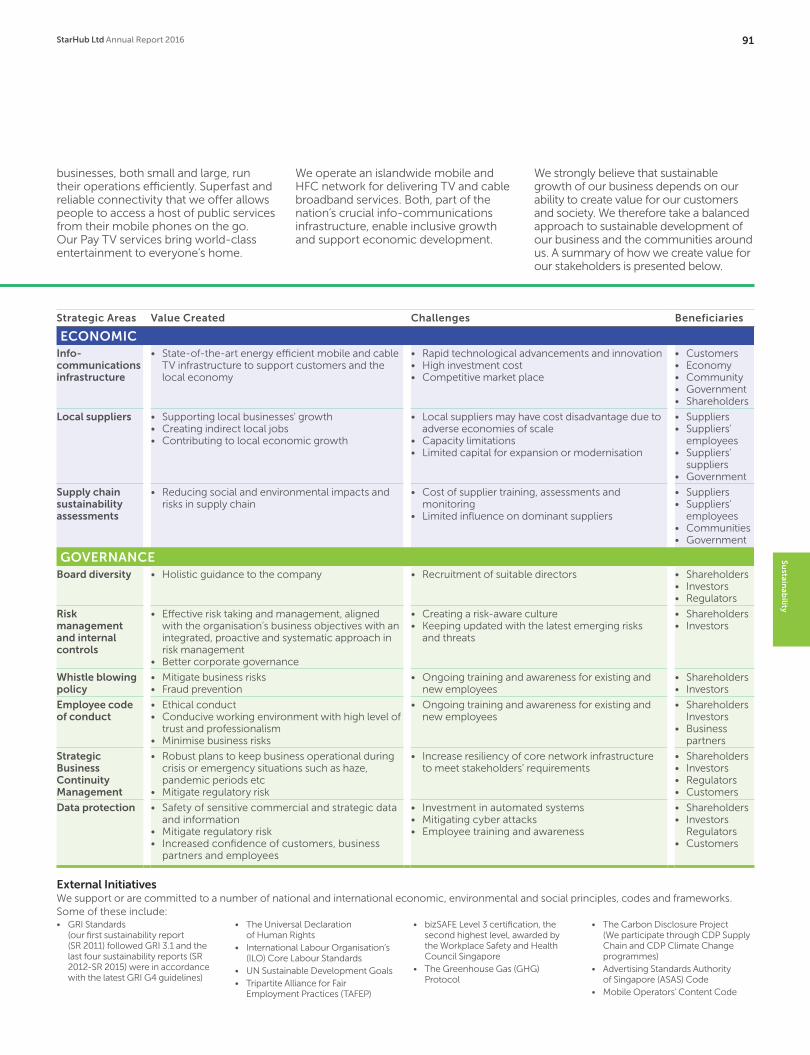
We strongly believe that sustainable growth of our business depends on our ability to create value for our customers and society. We therefore take a balanced approach to sustainable development of our business and the communities around us. A summary of how we create value for our stakeholders is presented below.
• GRI Standards (our first sustainability report (SR 2011) followed GRI 3.1 and the last four sustainability reports (SR 2012-SR 2015) were in accordance with the latest GRI G4 guidelines)
• The Universal Declaration of Human Rights
• International Labour Organisation’s (ILO) Core Labour Standards
• UN Sustainable Development Goals• Tripartite Alliance for Fair
Employment Practices (TAFEP)
• bizSAFE Level 3 certification, the second highest level, awarded by the Workplace Safety and Health Council Singapore
• The Greenhouse Gas (GHG) Protocol
• The Carbon Disclosure Project (We participate through CDP Supply Chain and CDP Climate Change programmes)
• Advertising Standards Authority of Singapore (ASAS) Code
• Mobile Operators' Content Code
Strategic Areas Value Created Challenges Beneficiaries
ECONOMICInfo-communications infrastructure
• State-of-the-art energy efficient mobile and cable TV infrastructure to support customers and the local economy
• Rapid technological advancements and innovation• High investment cost• Competitive market place
• Customers• Economy• Community• Government• Shareholders
Local suppliers • Supporting local businesses' growth• Creating indirect local jobs• Contributing to local economic growth
• Local suppliers may have cost disadvantage due to adverse economies of scale
• Capacity limitations• Limited capital for expansion or modernisation
• Suppliers• Suppliers'
employees• Suppliers'
suppliers• Government
Supply chain sustainabilityassessments
• Reducing social and environmental impacts and risks in supply chain
• Cost of supplier training, assessments and monitoring
• Limited influence on dominant suppliers
• Suppliers• Suppliers'
employees• Communities• Government
GOVERNANCEBoard diversity • Holistic guidance to the company • Recruitment of suitable directors • Shareholders
• Investors• Regulators
Risk management and internal controls
• Effective risk taking and management, aligned with the organisation’s business objectives with an integrated, proactive and systematic approach in risk management
• Better corporate governance
• Creating a risk-aware culture• Keeping updated with the latest emerging risks
and threats
• Shareholders• Investors
Whistle blowing policy
• Mitigate business risks• Fraud prevention
• Ongoing training and awareness for existing and new employees
• Shareholders• Investors
Employee code of conduct
• Ethical conduct• Conducive working environment with high level of
trust and professionalism• Minimise business risks
• Ongoing training and awareness for existing and new employees
• Shareholders Investors
• Business partners
Strategic Business Continuity Management
• Robust plans to keep business operational during crisis or emergency situations such as haze, pandemic periods etc
• Mitigate regulatory risk
• Increase resiliency of core network infrastructure to meet stakeholders’ requirements
• Shareholders• Investors• Regulators• Customers
Data protection • Safety of sensitive commercial and strategic data and information
• Mitigate regulatory risk• Increased confidence of customers, business
partners and employees
• Investment in automated systems• Mitigating cyber attacks• Employee training and awareness
• Shareholders• Investors
Regulators• Customers
Creating Sustainable Value for All
External InitiativesWe support or are committed to a number of national and international economic, environmental and social principles, codes and frameworks. Some of these include:
Su
stainab
ility
StarHub Ltd Annual Report 2016 91

Customers Employees
Our Stakeholders
Stakeholder engagement is at the core of our sustainability strategy. We engage with a range of stakeholders who may be impacted by our business operations or whose opinion may influence our business. Insights from our interactions with stakeholders enrich our decision making and enable us to create value for all.
We seek stakeholder feedback using both formal and informal channels. Ongoing stakeholder feedback allows us to offer the right products and services that meet our customers’ needs and expectations, create a fulfilling workplace for employees, and serve the community.
How we engage with diverse stakeholders, including how we respond to the topics and concerns raised by them, is presented below.
HOW WE ENGAGE:Customer surveys, Twitter®, Facebook® pages, advertisements, StarHub retail stores, online stores, Customer Service Hotlines.
STAKEHOLDERS’ EXPECTATIONS:Seamless, high-quality coverage, rich content, affordability, data security, prompt level of service.• Friendly processes and policies• Ease of use• Hassle-free sign up• Employees with excellent product knowledge • Easy to understand promotional packages and
mechanics
HOW WE RESPOND:By committing ourselves to respect consumers’ rights, provide clear product information, offer value for money, ensure product performance and quality, reliable service, prompt handling of complaints, and respect for privacy. Provide customers with fulfilment channels such as Retail, Online, Roadshow, Telesales and also self-help options like My StarHub app.
PROGRESS DURING 2016:• We continued to simplify processes at all touch
points for both sales and service transactions, launched e-appointments for existing and new customers at retail stores, created Hub Trooper experience corner at our StarHub retail stores for personalised solution sales, offered seamless customer experiences through launch of “click and collect” for mobile e-commerce sales
• Revamped the online My Account Manager for more digital self-services to be performed
• Outcomes measured in elevated NPS results for both retail and Hub Troopers
• Revamped My StarHub app with new look and feel and additional features
• Strengthened Social Media team to provide better response times to customers, better handling of queries, and greater engagement with customers
PLANS FOR 2017:• Focus on episodic NPS to reduce customer pain
points such as billing and relocation• Strengthen the image of our partner stores to be
more representative of our StarHub brand stores• Increased engagement across our Social Channels• Improve upon our Social Health Index rating• More effective query management during periods of
high traffic on social channels• Add new features to My StarHub app to encourage
higher use
HOW WE ENGAGE:Through social media platforms such as StarHub Community and HubbaVoice where they can share their comments and observations on topics of interest, be it local or world events, new technology/applications etc. We also continue to engage via Intranet, emails, internal newsletter, workshops, company-sponsored sporting and social activities such as in-house games organised for employees, small group discussions, twice-yearly employee communication sessions, twice-yearly video addresses by CEO, encouragement of employees to interact more personally in and out of the office, free health snacks on the last Friday of every month.
STAKEHOLDERS’ EXPECTATIONS:A caring and conducive environment where employees are equipped and motivated to do their best work and continue to excel in personal development.
HOW WE RESPOND:By adopting sound HR policies and practices that promote fair treatment, safe working conditions, reward and recognition for performance, teamwork and career growth, e.g. we promote work-life balance and a conducive work environment for employees through provision of nursing rooms, a well-equipped gym and encouraging employees to take part in sporting activities such as marathons, bowling, futsal, as well as giving employees early release from work on the last Friday of each quarter for them to spend meaningful family time with their loved ones. We also organised Bring-Your-Kids-to-Work Day for our employees.
PROGRESS DURING 2016:We continued to focus on bringing out the best in our people and building a high performing work culture through the following areas: • Revamped internal performance rating system to allow for greater
differentiation of employee performance• Equipped people managers with relevant skillsets to hold effective
performance conversations with their teams• Rolled out Leadership Development Program (5E2P) for senior managers
and above to inculcate key leadership traits and encouraged leaders to walk the talk
• Sustained our Career Development efforts for employees through internal Career Fairs and actively facilitated internal transfers and job expansion
• Achieved the People Developer (PD) certification in 2016 in recognition of our efforts to develop our people for the better
PLANS FOR 2017:We are putting in place an all-empowering Human Capital Management (HCM) system to empower our employees through digitisation to achieve collaboration, productivity and innovation at work.
To create a truly employee-centric experience through:• Spontaneous 360 Feedback tool to heighten self-awareness and
development• Transparency of shared goals to drive job clarity and accountability
among employees• Creating space and varied opportunities for learning, peer socialising and
cross-functional collaboration• Simplifying and automating processes in employee lifecycle e.g. benefits,
performance management, learning and engagement
Sustainability Report continued
92 Hubbing at Your Service
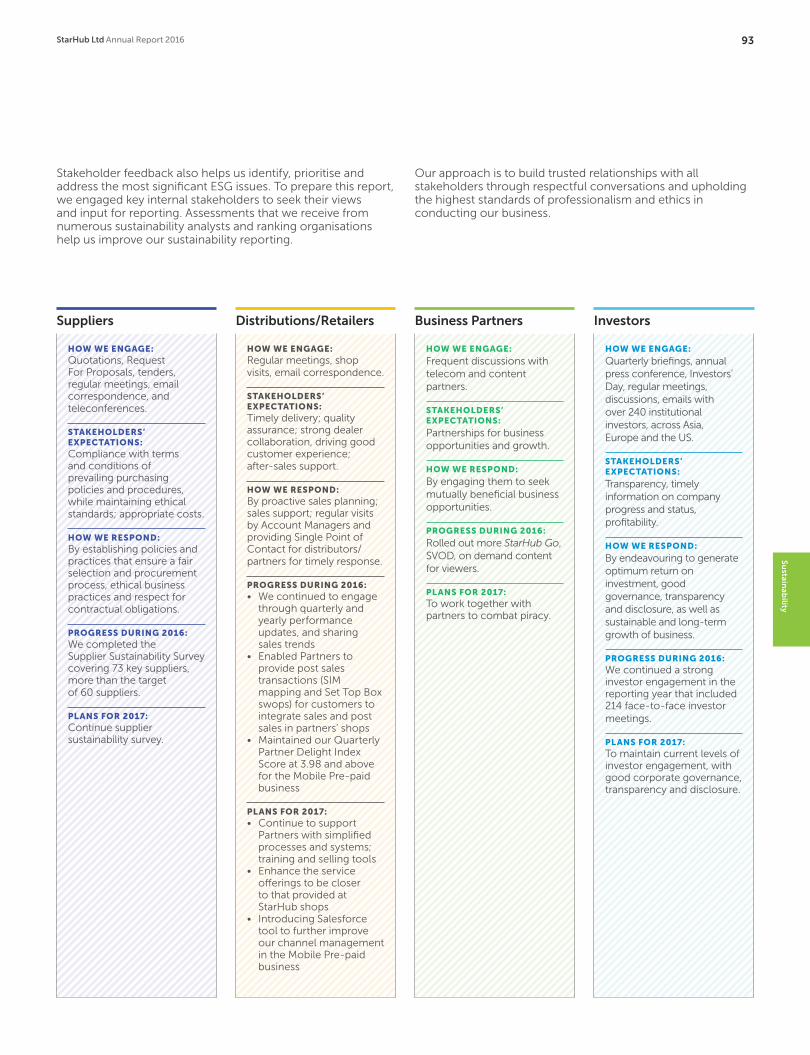
Suppliers Distributions/Retailers Business Partners Investors
HOW WE ENGAGE:Quotations, RequestFor Proposals, tenders, regular meetings, email correspondence, and teleconferences.
STAKEHOLDERS’ EXPECTATIONS:Compliance with terms and conditions of prevailing purchasing policies and procedures, while maintaining ethical standards; appropriate costs.
HOW WE RESPOND:By establishing policies and practices that ensure a fair selection and procurement process, ethical business practices and respect for contractual obligations.
PROGRESS DURING 2016:We completed the Supplier Sustainability Survey covering 73 key suppliers, more than the target of 60 suppliers.
PLANS FOR 2017:Continue supplier sustainability survey.
HOW WE ENGAGE:Regular meetings, shop visits, email correspondence.
STAKEHOLDERS’ EXPECTATIONS:Timely delivery; quality assurance; strong dealer collaboration, driving good customer experience; after-sales support.
HOW WE RESPOND:By proactive sales planning; sales support; regular visits by Account Managers and providing Single Point of Contact for distributors/ partners for timely response.
PROGRESS DURING 2016:• We continued to engage
through quarterly and yearly performance updates, and sharing sales trends
• Enabled Partners to provide post sales transactions (SIM mapping and Set Top Box swops) for customers to integrate sales and post sales in partners’ shops
• Maintained our Quarterly Partner Delight Index Score at 3.98 and above for the Mobile Pre-paid business
PLANS FOR 2017:• Continue to support
Partners with simplified processes and systems; training and selling tools
• Enhance the service offerings to be closer to that provided at StarHub shops
• Introducing Salesforce tool to further improve our channel management in the Mobile Pre-paid business
HOW WE ENGAGE:
Frequent discussions with telecom and content partners.
STAKEHOLDERS’ EXPECTATIONS:
Partnerships for business opportunities and growth.
HOW WE RESPOND:
By engaging them to seek mutually beneficial business opportunities.
PROGRESS DURING 2016:
Rolled out more StarHub Go, SVOD, on demand content for viewers.
PLANS FOR 2017:To work together with partners to combat piracy.
HOW WE ENGAGE:
Quarterly briefings, annual press conference, Investors’ Day, regular meetings, discussions, emails withover 240 institutional investors, across Asia, Europe and the US.
STAKEHOLDERS’ EXPECTATIONS:
Transparency, timely information on company progress and status,profitability.
HOW WE RESPOND:
By endeavouring to generateoptimum return on investment, good governance, transparency and disclosure, as well as sustainable and long-term growth of business.
PROGRESS DURING 2016:We continued a strong investor engagement in the reporting year that included 214 face-to-face investor meetings.
PLANS FOR 2017:To maintain current levels of investor engagement, with good corporate governance, transparency and disclosure.
Stakeholder feedback also helps us identify, prioritise and address the most significant ESG issues. To prepare this report, we engaged key internal stakeholders to seek their views and input for reporting. Assessments that we receive from numerous sustainability analysts and ranking organisations help us improve our sustainability reporting.
Our approach is to build trusted relationships with all stakeholders through respectful conversations and upholding the highest standards of professionalism and ethics in conducting our business.
Su
stainab
ility
StarHub Ltd Annual Report 2016 93
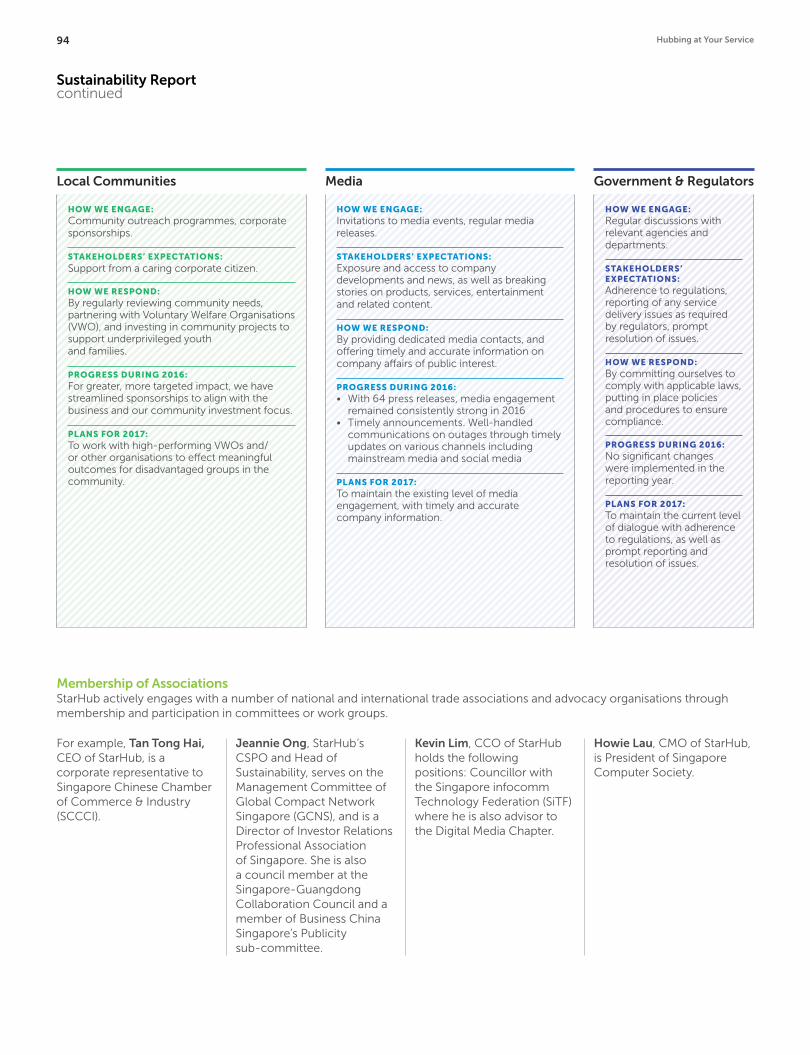
For example, Tan Tong Hai, CEO of StarHub, is a corporate representative to Singapore Chinese Chamber of Commerce & Industry (SCCCI).
Jeannie Ong, StarHub’s CSPO and Head of Sustainability, serves on the Management Committee of Global Compact Network Singapore (GCNS), and is a Director of Investor Relations Professional Association of Singapore. She is also a council member at the Singapore-Guangdong Collaboration Council and a member of Business China Singapore’s Publicity sub-committee.
Kevin Lim, CCO of StarHub holds the following positions: Councillor with the Singapore infocomm Technology Federation (SiTF) where he is also advisor to the Digital Media Chapter.
Howie Lau, CMO of StarHub, is President of Singapore Computer Society.
Membership of AssociationsStarHub actively engages with a number of national and international trade associations and advocacy organisations through membership and participation in committees or work groups.
Local Communities Government & RegulatorsMedia
HOW WE ENGAGE:Community outreach programmes, corporate sponsorships.
STAKEHOLDERS’ EXPECTATIONS:
Support from a caring corporate citizen.
HOW WE RESPOND:By regularly reviewing community needs, partnering with Voluntary Welfare Organisations (VWO), and investing in community projects to support underprivileged youth and families.
PROGRESS DURING 2016:For greater, more targeted impact, we have streamlined sponsorships to align with the business and our community investment focus.
PLANS FOR 2017:To work with high-performing VWOs and/or other organisations to effect meaningful outcomes for disadvantaged groups in the community.
HOW WE ENGAGE:Invitations to media events, regular media releases.
STAKEHOLDERS’ EXPECTATIONS:Exposure and access to company developments and news, as well as breaking stories on products, services, entertainment and related content.
HOW WE RESPOND:By providing dedicated media contacts, and offering timely and accurate information on company affairs of public interest.
PROGRESS DURING 2016:• With 64 press releases, media engagement
remained consistently strong in 2016• Timely announcements. Well-handled
communications on outages through timely updates on various channels including mainstream media and social media
PLANS FOR 2017:To maintain the existing level of media engagement, with timely and accurate company information.
HOW WE ENGAGE:Regular discussions with relevant agencies and departments.
STAKEHOLDERS’ EXPECTATIONS:Adherence to regulations, reporting of any service delivery issues as required by regulators, prompt resolution of issues.
HOW WE RESPOND:By committing ourselves to comply with applicable laws, putting in place policies and procedures to ensure compliance.
PROGRESS DURING 2016:No significant changes were implemented in the reporting year.
PLANS FOR 2017:To maintain the current levelof dialogue with adherence to regulations, as well as prompt reporting and resolution of issues.
Sustainability Report continued
94 Hubbing at Your Service
American Chamber of Commerce, Singapore
Asia Digital Marketing Association
Asia Pacific Network Information Centre
Association of Media Owners
Association of Small & Medium Enterprises (ASME), Singapore
British Chamber of Commerce, Singapore
Cable Television Laboratories (CableLabs)
CASBAA
Contact Centre Association of Singapore
Current Analysis
Games Exchange Alliances
Global Compact Network Singapore
GSMA Development Fund
GSMA Wireless Intelligence Subscription
Institute of Advertising, Singapore
Institute of Public Relations, Singapore
Investor Relations Professional Association, Singapore
Law Society of Singapore
Lawnet for Legal Research
Ovum Enterprise IT knowledge Centre
Pacific Telecommunications Council
Promax Asia
Routing Asset Database
Singapore Academy of Law
Singapore Advanced Research & Education Network
Singapore Association of the Institute of Chartered Secretaries & Administrators
Singapore Business Federation
Singapore Chinese Chamber of Commerce & Industry
Singapore Computer Society
Singapore Corporate Counsel Association
Singapore Hotel Association
Singapore Human Resource Institute
Singapore Indian Chamber of Commerce & Industry
Singapore infocomm Technology Federation
Singapore Institute of Management
Singapore International Chamber of Commerce
Singapore National Employers’ Federation
Singapore Press Club
Singapore Training and Development Association
Singapore Manufacturing Federation
Singapore Retailers Association
TM Forum
Wireless Broadband Alliance
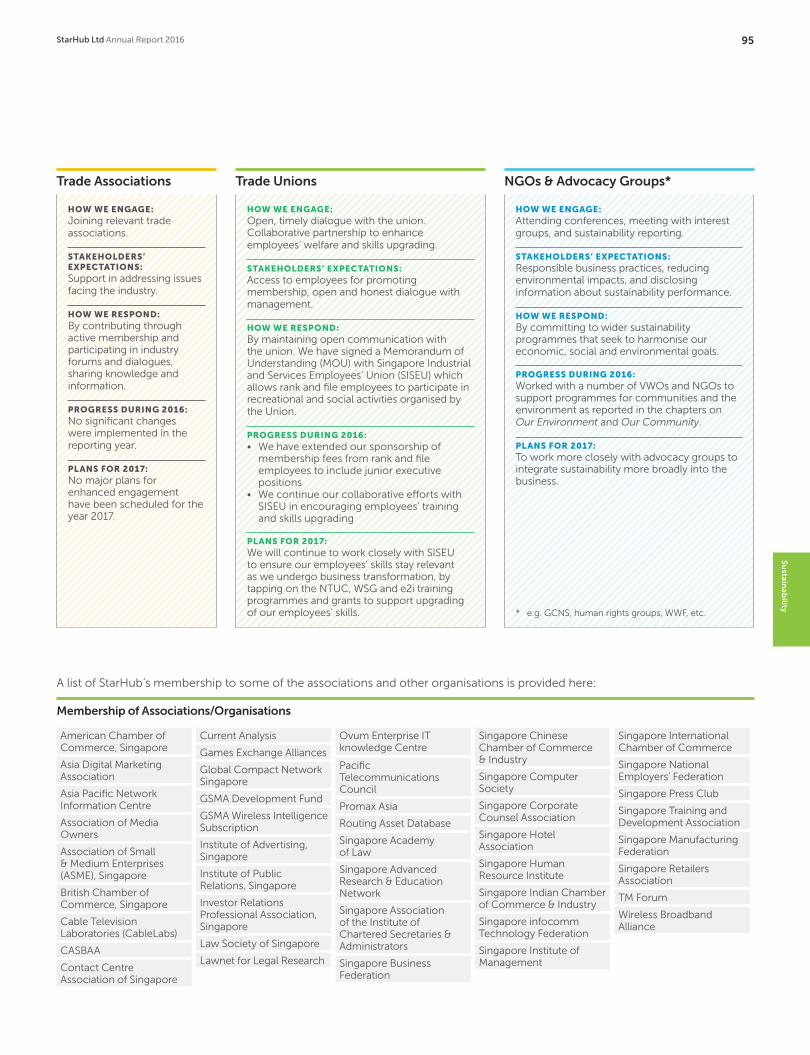
A list of StarHub’s membership to some of the associations and other organisations is provided here:
Membership of Associations/Organisations
Trade Associations Trade Unions NGOs & Advocacy Groups*
HOW WE ENGAGE:Joining relevant trade associations.
STAKEHOLDERS’ EXPECTATIONS:Support in addressing issues facing the industry.
HOW WE RESPOND:By contributing through active membership and participating in industry forums and dialogues, sharing knowledge and information.
PROGRESS DURING 2016:No significant changes were implemented in the reporting year.
PLANS FOR 2017:No major plans for enhanced engagement have been scheduled for the year 2017.
HOW WE ENGAGE:Open, timely dialogue with the union. Collaborative partnership to enhance employees’ welfare and skills upgrading.
STAKEHOLDERS’ EXPECTATIONS:Access to employees for promoting membership, open and honest dialogue with management.
HOW WE RESPOND:By maintaining open communication with the union. We have signed a Memorandum of Understanding (MOU) with Singapore Industrial and Services Employees’ Union (SISEU) which allows rank and file employees to participate in recreational and social activities organised by the Union.
PROGRESS DURING 2016:• We have extended our sponsorship of
membership fees from rank and file employees to include junior executive positions
• We continue our collaborative efforts with SISEU in encouraging employees’ training and skills upgrading
PLANS FOR 2017:We will continue to work closely with SISEU to ensure our employees’ skills stay relevant as we undergo business transformation, by tapping on the NTUC, WSG and e2i training programmes and grants to support upgrading of our employees’ skills.
HOW WE ENGAGE:Attending conferences, meeting with interest groups, and sustainability reporting.
STAKEHOLDERS’ EXPECTATIONS:Responsible business practices, reducing environmental impacts, and disclosing information about sustainability performance.
HOW WE RESPOND:By committing to wider sustainability programmes that seek to harmonise our economic, social and environmental goals.
PROGRESS DURING 2016:Worked with a number of VWOs and NGOs to support programmes for communities and the environment as reported in the chapters on Our Environment and Our Community.
PLANS FOR 2017:To work more closely with advocacy groups to integrate sustainability more broadly into the business.
* e.g. GCNS, human rights groups, WWF, etc.
Su
stainab
ility
StarHub Ltd Annual Report 2016 95

Our Materiality TopicsWe identify material topics for reporting based on the significance of our ESG and economic impacts and the degree of influence they have on stakeholder assessments and decisions. We review our material topics every year in the light of fresh stakeholder feedback, new trends in sustainability, challenges facing the telecom and media industries, experts’ views and our own business goals.
We are focused on those ESG and economic topics where we see the most potential for creating maximum value for shareholders and stakeholders. This involves managing ESG risks and opportunities across the value chain. The impacts that occur outside StarHub, such as in the value chain, are challenging to deal with as we may have little or no control on some of these. Our approach is to engage our value chain partners, wherever possible, to address the ESG impacts in their operations. For example, we engage with our key suppliers through an annual supplier sustainability assessment and share the results in this report (see Our Marketplace chapter).
Presented here is a summary of our material topics and their boundaries.
Environment • Energy• Emissions• Effluents and Waste
Important but not material topic:• Water
For more details, go to page 98
Social Marketplace
• Customer Satisfaction• Cyber Security• Customer Privacy• Procurement Practices
GRI Telecommunication Sector Indicators:• Reliable access to telecom services • Clarity of Charges and Tariffs• Customer Relations
GRI G4 Media Sector Disclosures:• Content Creation• Content Dissemination
Other Topics:• Cyber Security
Community
• Local Communities
GRI Telecommunication Sector Indicators:• Access to Telecom Products and
Services/Bridging Digital Divide• Access to Content
Workplace
• Employment• Diversity and Equal Opportunity• Training and Education• Employee Turnover• Occupational Health and Safety
Important but not material topic:• Non-discrimination• Freedom of Association• Child Labour• Forced or Compulsory Labour
For more details, go to page 104
For more details, go to page 108
For more details, go to page 114
Economic • Economic Performance• Indirect Economic Impacts
GRI Telecommunication Sector Indicators:• Infrastructure
For more details, go to page 118
Sustainability Report continued
96 Hubbing at Your Service
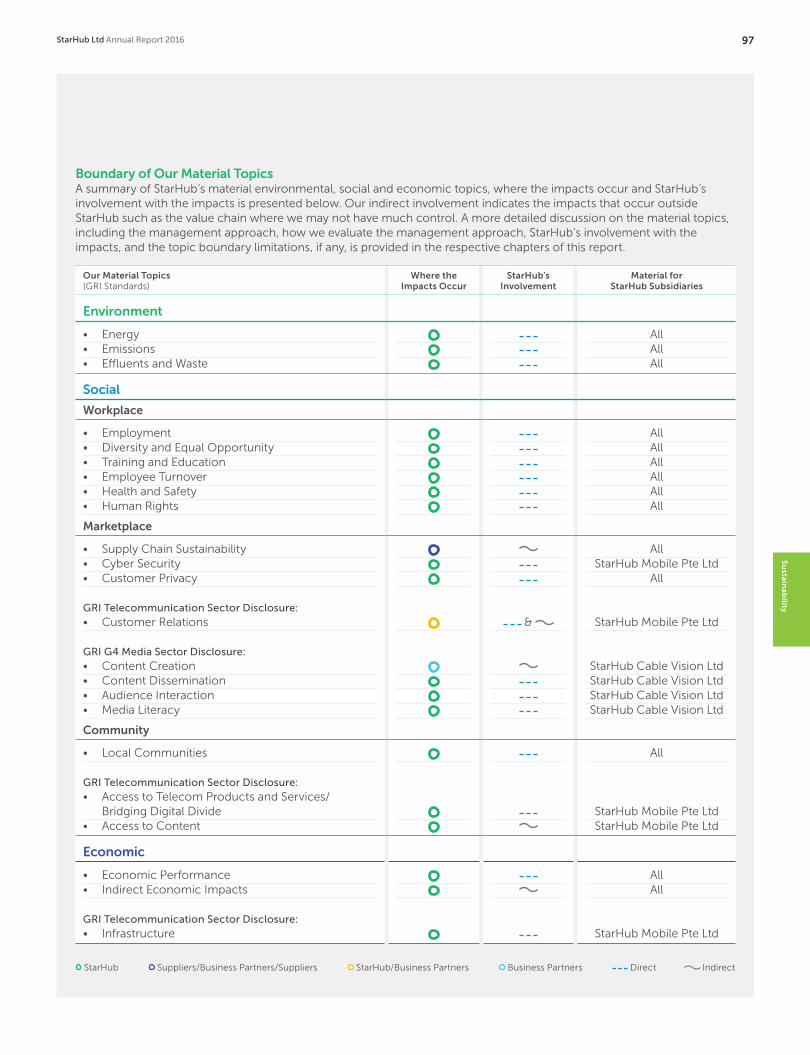
Boundary of Our Material Topics A summary of StarHub’s material environmental, social and economic topics, where the impacts occur and StarHub’s involvement with the impacts is presented below. Our indirect involvement indicates the impacts that occur outside StarHub such as the value chain where we may not have much control. A more detailed discussion on the material topics, including the management approach, how we evaluate the management approach, StarHub’s involvement with the impacts, and the topic boundary limitations, if any, is provided in the respective chapters of this report.
Our Material Topics(GRI Standards)
Where the Impacts Occur
StarHub’s Involvement
Material for StarHub Subsidiaries
Environment
• Energy • Emissions• Effluents and Waste
AllAllAll
Social
Workplace
• Employment • Diversity and Equal Opportunity• Training and Education• Employee Turnover• Health and Safety• Human Rights
AllAllAllAllAllAll
Marketplace
• Supply Chain Sustainability • Cyber Security• Customer Privacy
GRI Telecommunication Sector Disclosure:• Customer Relations
GRI G4 Media Sector Disclosure:• Content Creation• Content Dissemination• Audience Interaction • Media Literacy
&
AllStarHub Mobile Pte Ltd
All
StarHub Mobile Pte Ltd
StarHub Cable Vision LtdStarHub Cable Vision LtdStarHub Cable Vision LtdStarHub Cable Vision Ltd
Community
• Local Communities
GRI Telecommunication Sector Disclosure:• Access to Telecom Products and Services/
Bridging Digital Divide • Access to Content
All
StarHub Mobile Pte LtdStarHub Mobile Pte Ltd
Economic
• Economic Performance • Indirect Economic Impacts
GRI Telecommunication Sector Disclosure:• Infrastructure
AllAll
StarHub Mobile Pte Ltd
Suppliers/Business Partners/Suppliers StarHub/Business Partners Direct Indirect Business Partners StarHub
Su
stainab
ility
StarHub Ltd Annual Report 2016 97

OUR ENVIRONMENT
Performance Highlights
How We Create Value
1 Minimise energy intensity.
2 Reduce greenhouse gas emissions.
3 Conserve water.
4 Reduce and recycle waste.
5 Increase employee awareness about environmental issues.
6 Encourage customers to minimise environmental impact.
7 Comply with regulations.
Energy Intensity:
183 GJper $M revenue
Carbon Emissions Intensity:
22.7 tonnesCO2e per $M revenue
Water Use:
28,421m3
General Waste:
40 tonnes
Total e-waste recycled (including RENEW):
438 tonnes
Sustainability Report continuedOUR ENVIRONMENT
98 Hubbing at Your Service

We are focused on creating value by continuously minimising the environmental impacts of our business operations.
Our management approach is to minimise our environmental impacts even as we expand and upgrade our network infrastructure to continuously enhance customer experience. We support a precautionary approach to environmental challenges by addressing the material environmental risks and impacts in our operations.
Our environmental efforts are focused on reducing energy consumption, greenhouse gas emissions and waste management. We also try to conserve water which is a precious natural resource. Other than our operational efforts to minimise environmental impacts, we actively encourage our employees, customers and communities to participate in StarHub’s environmental programmes.
We regularly review and evaluate the effectiveness of our approach by various means including stakeholder feedback and our environmental performance.
StarHub Commitment We have refreshed the StarHub Green Policy, first launched in 2009, to address our material environmental impacts. The six commitments we have made through the Green Policy are:
1 We will adopt responsible and sustainable practices in our corporate activities to minimise the environmental impact of our operations. We will continually review our goals and commitment to protect the global environment as much as possible.
2 We will adhere to, as much as possible, environmental recommendations by the relevant authorities and also implement in-house targets to improve our environmental performance.
3 We will reduce our environmental loads by efficiently using resources, saving energy, reducing waste, encouraging material recycling and minimising emissions of greenhouse gases and ozone-depleting substances.
4 We will adopt environmentally friendly technologies as far as possible, when ordering and purchasing necessary resources.
5 We will implement education programmes to raise environmental awareness among our employees so that they recognise the essence of this Green Policy by actively addressing environmental concerns.
6 We will make social contributions in close partnership with local communities by disclosing environmental information and supporting environmental conservation initiatives.
This report presents several initiatives we have taken in line with our Green Policy.
Climate Change Singapore, where our operations are mainly concentrated, is not immune to climate change. According to studies undertaken by the National Climate Change Secretariat, the annual mean temperature has increased from 26.6°C to 27.7°C from 1972 to 2014. The mean sea level in the Straits of Singapore has also risen at the rate of 1.2mm to 1.7mm per year in the period 1975 to 2009. Recent years have also witnessed an increase in rainfall. The annual average rainfall has increased from 2,192mm in 1980 to 2,727mm in 2014.
Singapore has pledged to reduce national emission intensity by 36% from 2005 levels by 2030 and to stabilise the country’s emissions with the aim of peaking around 2030. We are committed to doing our part by striving to become more energy efficient and minimise our carbon footprint. We adopted energy efficient technologies when we recently upgraded our telecom infrastructure. As a result, our absolute GHG emissions have dropped 11% in 2016 compared with 2010 even as we expanded our infrastructure.
We believe the information and communications technology (ICT) industry has great potential especially in the area of developing green data centres through research and innovation. In our view, wireless and telecom technologies have an important role to play in the world’s transition to a lower carbon economy.
Su
stainab
ility
StarHub Ltd Annual Report 2016 99

Our PerformanceGreen BuildingWe reduce our environmental impact by operating from certified green buildings. Our head office StarHub Green is located in a Green Mark Gold certified building. The building, certified green by the Building and Construction Authority (BCA), saves energy and water and provides healthier indoor air for our employees and visitors.
We also joined hands with ST Telemedia to jointly develop STT MediaHub, a highly specialised telecommunications, media and data centre facility which was awarded the BCA-IDA Green Mark Platinum for New Data Centres.
EnergyOur management approach is to minimise the use of fossil fuel energy. Data centres, base stations, offices and transport operations account for most of our energy use. We are focused on adopting energy-efficient technologies and saving energy through employee awareness. We have improved energy efficiency in our data centres by improvements in cabling and air-conditioning equipment. This year’s electricity data includes consumption at STT MediaHub where we started moving some of the telco and media operations from July 2016.
Green NetworkWe have modernised our 2G and 3G networks which consume less power and added an energy-efficient 4G network resulting in a substantial reduction in energy consumption.
Solar EnergyWe operate two solar-powered mobile base transceiver stations (BTS) located at our headquarters, StarHub Green and on the roof of IKEA Alexandra. The two stations annually save approximately 8,000 kWh energy or about 3,599 kg of CO2. We have also invested in Singapore’s first solar-powered BTS-enabled vehicle used to boost signal strength.
GHG EmissionsOur management approach is to progressively reduce our organisational carbon footprint by improving energy efficiency and minimising energy consumption. StarHub’s greenhouse gas (GHG) emissions can be attributed to the use of electricity, diesel and petrol. Our emission intensity in 2016 was calculated to be 22.7 tCO2 per million $ in revenue, compared with 23.2 tCO2
in the preceding year. Emissions from electricity represented 99% of our total carbon. Our overall GHG emission was slightly lower in 2016, mainly attributable to less use of refrigerant gases included in the Kyoto Protocol.
Ozone Depleting Fugitive EmissionsOur ozone depleting fugitive emissions, attributed to the use of refrigerant R22 in air-conditioning equipment, amounted to 143 tCO2e in 2016 as against 786 tCO2e in the prior year.
Scope 3 EmissionsOur current reporting of Scope 3 emissions or other indirect emissions includes emissions from use of electricity by our exclusive retail partners. In 2016, the Scope 3 emissions were calculated to be 187 tCO2, compared to 217 tCO2 in the prior year.
Emission Sources FY 2016 FY 2015 FY 2014
Scope 1
Stationary Combustion 65 112 87
Mobile Combustion 487 568 600
Fugitive emissions (refrigerant gases) 9 1,252 494
Total Scope 1 emissions 561 1,932 1,181
Scope 2
Purchased electricity 53,957 54,774 53,444
Total Scope 2 emissions 53,957 54,774 53,444
Total CO2e emissions 54,518 56,706 54,625
Detailed Emissions Summary (CO2e tonnes)
We also joined hands with ST Telemedia to jointly develop STT MediaHub, a highly specialised tele-communications, media and data centre facility which was awarded the BCA-IDA Green Mark Platinum for New Data Centres.
Sustainability Report continuedOUR ENVIRONMENT
100 Hubbing at Your Service

WasteOur management approach is to reduce, reuse and recycle waste wherever possible through employee awareness. Waste from our operations includes paper, packaging waste and e-waste. We recycle our e-waste through licensed waste management contractors. We also help our customers recycle their used mobile phones and cable TV set top boxes and remote controls.
REcycling Nation’s Electronic Waste (RENEW)RENEW is an award-winning initiative aimed at encouraging the public to recycle their e-waste. RENEW, our collaboration with logistics provider DHL and waste recycler TES-AMM, collects e-waste from public through collection bins placed across the island.
People can drop their unwanted electronic items such as answering machines, cables, car stereos, computer mice, CDs/ DVDs, docking stations, CD/ DVD/ VCD players, electronic toys, hard drives, keyboards, laptops, lithium-ion (Li-ion) batteries, mobile phones, modems, MP3 players, printed circuit boards, printers, remote controls, routers, set-top boxes, telephones, VCRs and wires in the designated bins. DHL helps transport the e-waste safely to TES-AMM’s recycling facility.
There are now 325 bins across 274 locations. Close to 59 tonnes of e-waste collected from the public in 2016 was recycled, as against 31.7 tonnes in the preceding year.
RecyclingFigures for our paper and e-waste recycling programmes are presented in the chart.
WaterWe use water only for drinking, washing, and cooling equipment. Even though water is not considered a material impact of our operations, we make efforts to conserve water as Singapore lacks natural fresh water resources. Our office building, which is certified Green Mark Gold, is installed with water efficient fittings, fixtures and flushing system. We also regularly measure, monitor and report our water consumption.
We also replaced our paper bags with new reusable carrier bags. The bags are labelled with the Recycling Code 5 symbol, to help recyclers identify the specific type of recycling required.
StarHub’s Green Marketing Journey
Over the years, we have implemented several initiatives to reduce printed marketing material.
Invitations to our marketing events are mostly sent as e-invites. We have switched to sending e-cards during festive seasons from the conventional printed greeting cards. Electronic version of the latest issues of our newsletters to business customers are now available online on our website. Our Annual Reports are printed in limited number on FSC certified sustainably sourced paper.
Other initiatives have included:
2009
2012
2013
2014
Annual Reports and EGM Circulars available in digital format.
StarHub customers can opt to save paper by receiving electronic statements instead of printed bills with MyStarHub e-bill. Complementing MyStarHub e-bill is the My StarHub app, available on both the iOS and Android platforms. The app allows StarHub customers to view their account details, such as billing information, on their mobile devices at their convenience, encouraging them to go paperless. StarHub also removed Business Reply Envelopes from mailed bills in 2012, an effort which saves about 15 tonnes of paper each year.
A paperless bill payment process was introduced at our retail shops, printing out bills only for customers who request a hard copy for retention.
Introduced the Board Portal to replace all printed Board documents. The initiative saves an estimated 2,000 sheets of paper each year.
Su
stainab
ility
StarHub Ltd Annual Report 2016 101
Sustainability Report continuedOUR ENVIRONMENT
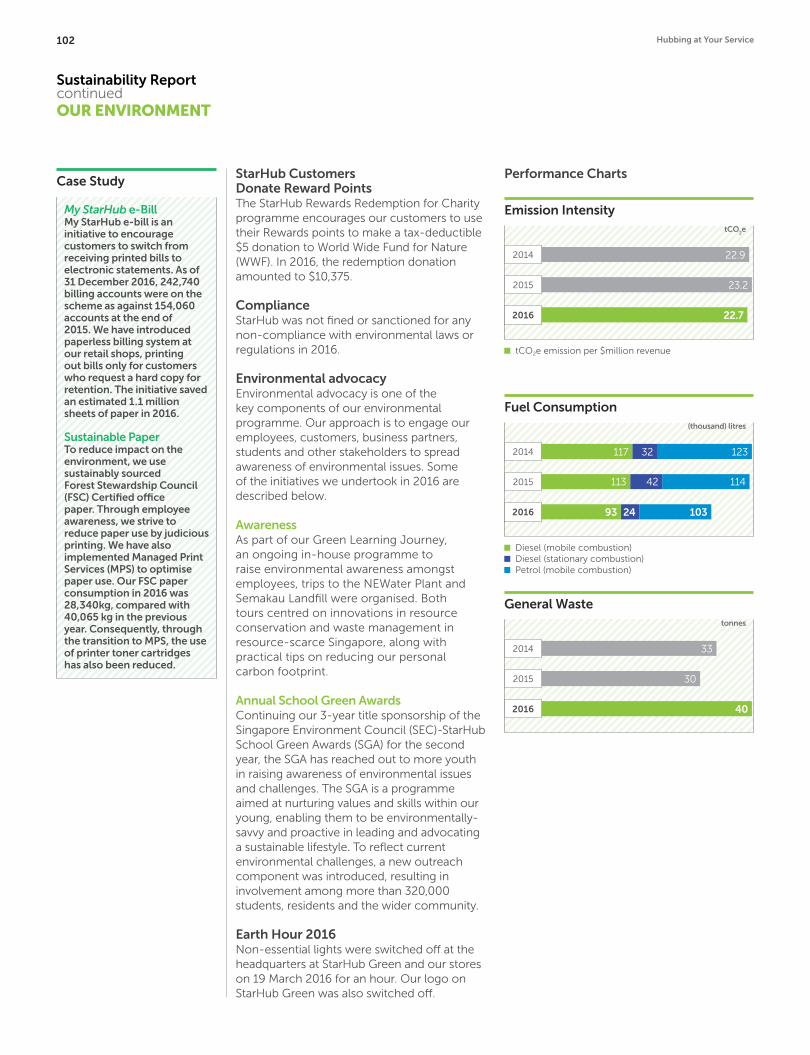
StarHub Customers Donate Reward PointsThe StarHub Rewards Redemption for Charity programme encourages our customers to use their Rewards points to make a tax-deductible $5 donation to World Wide Fund for Nature (WWF). In 2016, the redemption donation amounted to $10,375. ComplianceStarHub was not fined or sanctioned for any non-compliance with environmental laws or regulations in 2016.
Environmental advocacy Environmental advocacy is one of the key components of our environmental programme. Our approach is to engage our employees, customers, business partners, students and other stakeholders to spread awareness of environmental issues. Some of the initiatives we undertook in 2016 are described below.
AwarenessAs part of our Green Learning Journey, an ongoing in-house programme to raise environmental awareness amongst employees, trips to the NEWater Plant and Semakau Landfill were organised. Both tours centred on innovations in resource conservation and waste management in resource-scarce Singapore, along with practical tips on reducing our personal carbon footprint.
Annual School Green AwardsContinuing our 3-year title sponsorship of the Singapore Environment Council (SEC)-StarHub School Green Awards (SGA) for the second year, the SGA has reached out to more youth in raising awareness of environmental issues and challenges. The SGA is a programme aimed at nurturing values and skills within our young, enabling them to be environmentally-savvy and proactive in leading and advocating a sustainable lifestyle. To reflect current environmental challenges, a new outreach component was introduced, resulting in involvement among more than 320,000 students, residents and the wider community.
Earth Hour 2016Non-essential lights were switched off at the headquarters at StarHub Green and our stores on 19 March 2016 for an hour. Our logo on StarHub Green was also switched off.
Case Study
My StarHub e-BillMy StarHub e-bill is an initiative to encourage customers to switch from receiving printed bills to electronic statements. As of 31 December 2016, 242,740 billing accounts were on the scheme as against 154,060 accounts at the end of 2015. We have introduced paperless billing system at our retail shops, printing out bills only for customers who request a hard copy for retention. The initiative saved an estimated 1.1 million sheets of paper in 2016.
Sustainable PaperTo reduce impact on the environment, we use sustainably sourced Forest Stewardship Council (FSC) Certified office paper. Through employee awareness, we strive to reduce paper use by judicious printing. We have also implemented Managed Print Services (MPS) to optimise paper use. Our FSC paper consumption in 2016 was 28,340kg, compared with 40,065 kg in the previous year. Consequently, through the transition to MPS, the use of printer toner cartridges has also been reduced.
Performance Charts
Emission Intensity
2014
2015
2016
tCO2e
tCO2e emission per $million revenue
22.9
23.2
22.7
Fuel Consumption(thousand) litres
Diesel (mobile combustion) Diesel (stationary combustion) Petrol (mobile combustion)
12332117
11442113
1032493
2014
2015
2016
General Wastetonnes
33
30
40
2014
2015
2016
102 Hubbing at Your Service
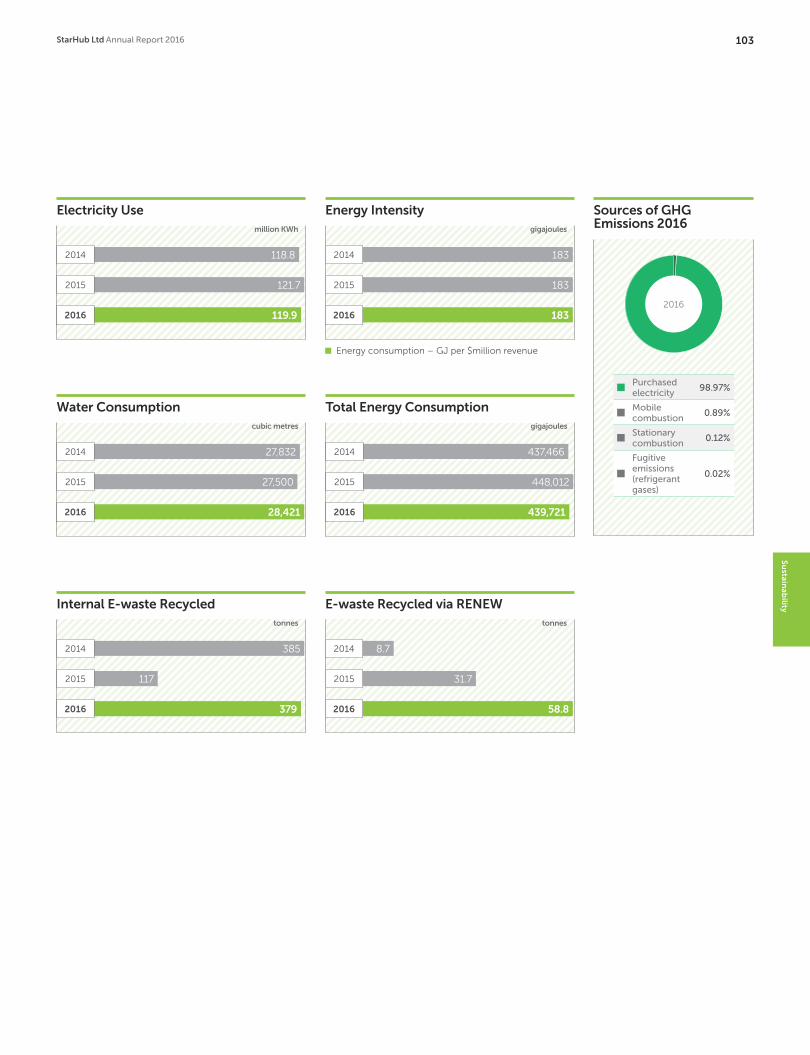
Sources of GHG Emissions 2016
2016
Purchased electricity
98.97%
Mobile combustion
0.89%
Stationary combustion
0.12%
Fugitive emissions (refrigerant gases)
0.02%
Energy Intensity
183
183
183
gigajoules
Energy consumption – GJ per $million revenue
2014
2015
2016
Electricity Usemillion KWh
118.8
121.7
119.9
2014
2015
2016
Total Energy Consumptiongigajoules
437,466
448,012
439,721
2014
2015
2016
Water Consumptioncubic metres
27,832
27,500
28,421
2014
2015
2016
Internal E-waste Recycledtonnes
385
117
379
2014
2015
2016
E-waste Recycled via RENEWtonnes
8.7
31.7
58.8
2014
2015
2016
Su
stainab
ility
StarHub Ltd Annual Report 2016 103
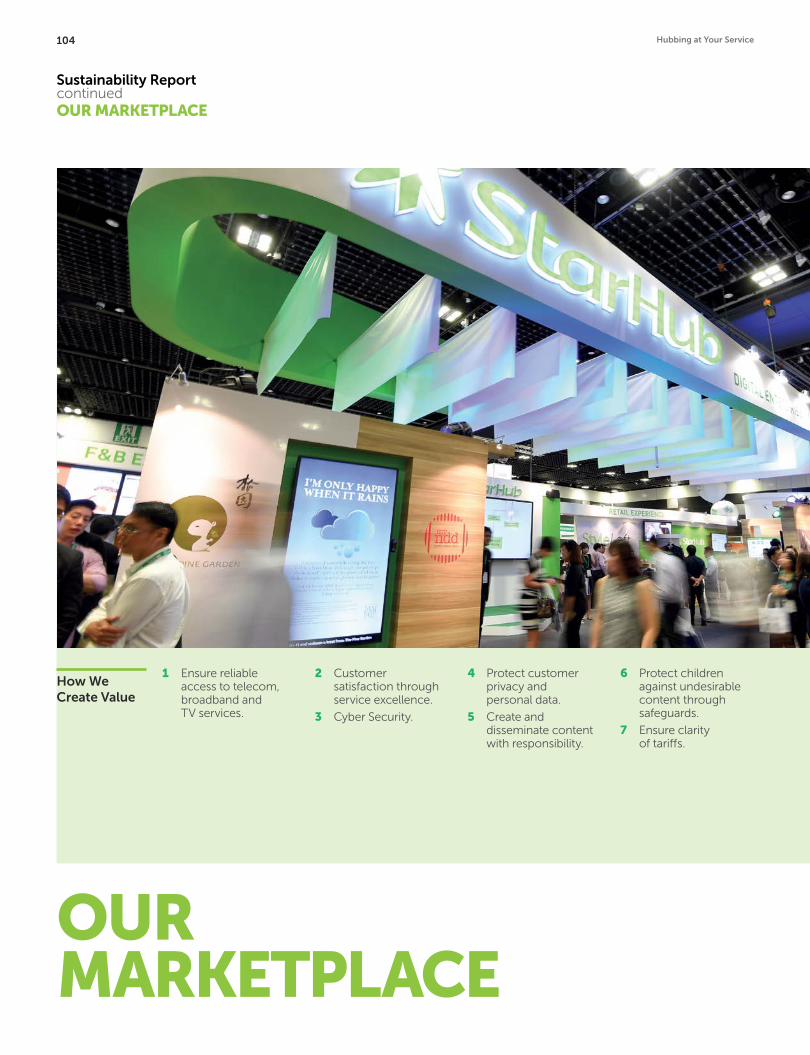
OUR MARKETPLACE
How We Create Value
1 Ensure reliable access to telecom, broadband and TV services.
2 Customer satisfaction through service excellence.
3 Cyber Security.
4 Protect customer privacy and personal data.
5 Create and disseminate content with responsibility.
6 Protect children against undesirable content through safeguards.
7 Ensure clarity of tariffs.
Sustainability Report continuedOUR MARKETPLACE
104 Hubbing at Your Service
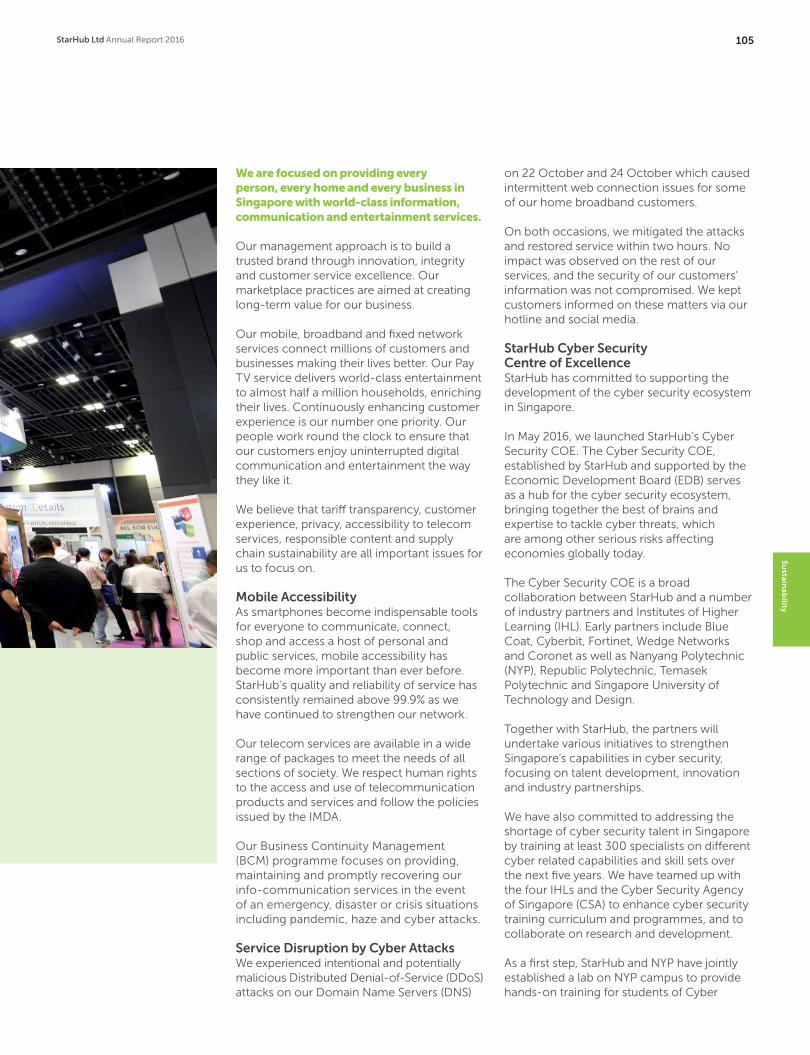
We are focused on providing every person, every home and every business in Singapore with world-class information, communication and entertainment services.
Our management approach is to build a trusted brand through innovation, integrity and customer service excellence. Our marketplace practices are aimed at creating long-term value for our business.
Our mobile, broadband and fixed network services connect millions of customers and businesses making their lives better. Our Pay TV service delivers world-class entertainment to almost half a million households, enriching their lives. Continuously enhancing customer experience is our number one priority. Our people work round the clock to ensure that our customers enjoy uninterrupted digital communication and entertainment the way they like it.
We believe that tariff transparency, customer experience, privacy, accessibility to telecom services, responsible content and supply chain sustainability are all important issues for us to focus on.
Mobile AccessibilityAs smartphones become indispensable tools for everyone to communicate, connect, shop and access a host of personal and public services, mobile accessibility has become more important than ever before. StarHub’s quality and reliability of service has consistently remained above 99.9% as we have continued to strengthen our network.
Our telecom services are available in a wide range of packages to meet the needs of all sections of society. We respect human rights to the access and use of telecommunication products and services and follow the policies issued by the IMDA.
Our Business Continuity Management (BCM) programme focuses on providing, maintaining and promptly recovering our info-communication services in the event of an emergency, disaster or crisis situations including pandemic, haze and cyber attacks.
Service Disruption by Cyber AttacksWe experienced intentional and potentially malicious Distributed Denial-of-Service (DDoS) attacks on our Domain Name Servers (DNS)
on 22 October and 24 October which caused intermittent web connection issues for some of our home broadband customers.
On both occasions, we mitigated the attacks and restored service within two hours. No impact was observed on the rest of our services, and the security of our customers’ information was not compromised. We kept customers informed on these matters via our hotline and social media.
StarHub Cyber Security Centre of ExcellenceStarHub has committed to supporting the development of the cyber security ecosystem in Singapore.
In May 2016, we launched StarHub’s Cyber Security COE. The Cyber Security COE, established by StarHub and supported by the Economic Development Board (EDB) serves as a hub for the cyber security ecosystem, bringing together the best of brains and expertise to tackle cyber threats, which are among other serious risks affecting economies globally today.
The Cyber Security COE is a broad collaboration between StarHub and a number of industry partners and Institutes of Higher Learning (IHL). Early partners include Blue Coat, Cyberbit, Fortinet, Wedge Networks and Coronet as well as Nanyang Polytechnic (NYP), Republic Polytechnic, Temasek Polytechnic and Singapore University of Technology and Design.
Together with StarHub, the partners will undertake various initiatives to strengthen Singapore’s capabilities in cyber security, focusing on talent development, innovation and industry partnerships.
We have also committed to addressing the shortage of cyber security talent in Singapore by training at least 300 specialists on different cyber related capabilities and skill sets over the next five years. We have teamed up with the four IHLs and the Cyber Security Agency of Singapore (CSA) to enhance cyber security training curriculum and programmes, and to collaborate on research and development.
As a first step, StarHub and NYP have jointly established a lab on NYP campus to provide hands-on training for students of Cyber
Su
stainab
ility
StarHub Ltd Annual Report 2016 105
Sustainability Report continued
Security & Forensics. These students will subsequently have the opportunity to learn directly from experienced cyber security professionals during their internship placements at StarHub or our industry partners.
The Cyber Security COE’s first commercial initiative is the first-of-its-kind Security Operations Centre at StarHub (named StarHub Security Operations Centre), whereby StarHub’s core infrastructure is integrated with round-the-clock proactive cyber threat detection capabilities.
Cyber-attacks come through wired and wireless networks. As a telco, StarHub’s core networks are thus a strategic location to monitor and detect potential malicious data traffic early and perform mitigation. In addition, cyber security solutions to protect industrial control systems and cloud-based cyber security solutions are being developed.
StarHub and the Cyber Security COE partners will jointly invest $200 million over the next five years to support a sustainable cyber security ecosystem.
Content ResponsibilityProtecting young users of our services from harmful content is an important issue for us. JuniorProtect Basic is a StarHub service that lets kids explore the Internet safely across devices, blocking out harmful websites and content on both mobile and PC. Targeted at StarHub’s pre-defined categories as Juniors (Age 7 to 12) and Teens (Age 13 to 16), the service uses default content filters as required by the IMDA. Parents, who have subscribed to the service for their child, can also set access rules across 15 categories considered undesirable for young minds via a web portal.
Content ValuesWe are committed to promoting safe and responsible use of our mobile services. In line with the Voluntary Code for Self-regulation of Mobile Content in Singapore, our policies prohibit content that is objectionable on the grounds of public interest, public morality, public
security, national harmony, or that is illegal under Singapore laws.
We offer services that help customers to make informed choices with respect to what kind of content their children can access. For example, our Parental Control facility offers Parental Lock and Purchase Lock features. Customers can use the Parental Lock feature to control what their children can watch. The Purchase Lock feature allows customers to prevent their children from making unauthorised channel subscription(s) or Video on Demand (VOD) purchase(s). Customers can use the Rating Level feature to block rated VOD content according to rating level set.
We continue to promote content in all national languages. We support art, culture and education by promoting TV programmes for schools, educational TV shows, news and information programmes; arts and cultural programmes; and drama and sports programmes.
We have partnered with the IMDA to produce local content for PSB. In 2016, StarHub committed to commissioning about 110 hours of original productions aimed at supporting PSB values, such as celebration of the Singapore’s culture and heritage, and promotion of the Singaporean identity, through innovative storytelling.
Tariff Transparency We are committed to transparent communication of our tariffs and charges through various marketing channels. Our price plans are prominently displayed at all retail outlets and are available on our website. Our customer service staff are provided training to clearly communicate the pricing structure and the contract terms to all customers at the time of signing contracts.
We measure and publish typical range of Internet speeds for our broadband plans on our website to maintain transparency. We have taken measures to protect our customers from ‘bill shock’. Customers can use My StarHub
app to manage their overseas data bills and cap roaming expenses.
Customer Satisfaction We gather feedback and insights from our customers through various channels. Insights gathered through the NPS, a customer loyalty metric, have helped us improve our customer service and systems in a targeted manner.
Since 2013, frontliners have been successfully cross-trained to handle both sales and post-sales transactions. This seamless integration, the visual revamp and enhanced customer flow within the StarHub retail stores has delighted customers. We will continue to introduce a number of enhancements to customer service.
Customers who are pressed for time can now make e-appointments prior to shop visits. In 2016, we also piloted a Click and Collect option for customers who wish to collect their devices from our shops instead of home deliveries. This ‘shop online-collect offline’ option has been well received. At the contact centre, we introduced guided workflows via an e-Butler tool to facilitate our staff’s interactions with customers over the phone. This tool also fetched relevant information from various sources to enable our staff to resolve customers’ concerns promptly during the call interaction. With our omni-channel focus, we are constantly refining the ‘how’ and ‘when’ of interacting with customers. Simple transactions can be done over a mobile application called My StarHub. The app has seen constant improvements over the years and its latest enhancement in late 2016 aims to make transactions as effortless as possible for our customers. They can pay bills, check data, book e-appointments, redeem rewards and activate roaming with just a few taps.
OUR MARKETPLACE
106 Hubbing at Your Service
Privacy and Data SecurityWe respect our customers’ privacy. Our approach is to adhere to the privacy and data protection laws of Singapore and other applicable regulations and standards. We regularly review our customer privacy and data protection processes to ensure compliance. We have implemented a strict personal data protection policy and have taken the necessary measures to protect our customers’ personal data. For example, we do not send promotional and marketing messages via phone calls, text messages and faxes to the customers who have opted out from receiving marketing messages through these channels. Customers can modify their consent through our StarHub web portal.
Our detailed Personal Data Protection Policy is available on the StarHub website.
Supply Chain SustainabilityOur management approach is to source responsibly and work with our suppliers to promote ethical conduct throughout the value chain. We choose vendors, suppliers and contractors fairly and require them to commit to our ethical code of conduct.
Our supply chain includes providers of products and services for our Mobile, Pay TV, Broadband and Enterprise Fixed business lines. This also covers network equipment, consumer handsets and customer premise equipment.
Our supplier relationships include dominant vendors who are among the largest corporations in the world. Several of them have publicly committed to sustainability. We recognise that our ability to influence them is somewhat limited. Our approach is to engage with them whenever possible and work together to support responsible business practices. We also engage a selected group of suppliers and business partners through a supplier sustainability survey questionnaire.
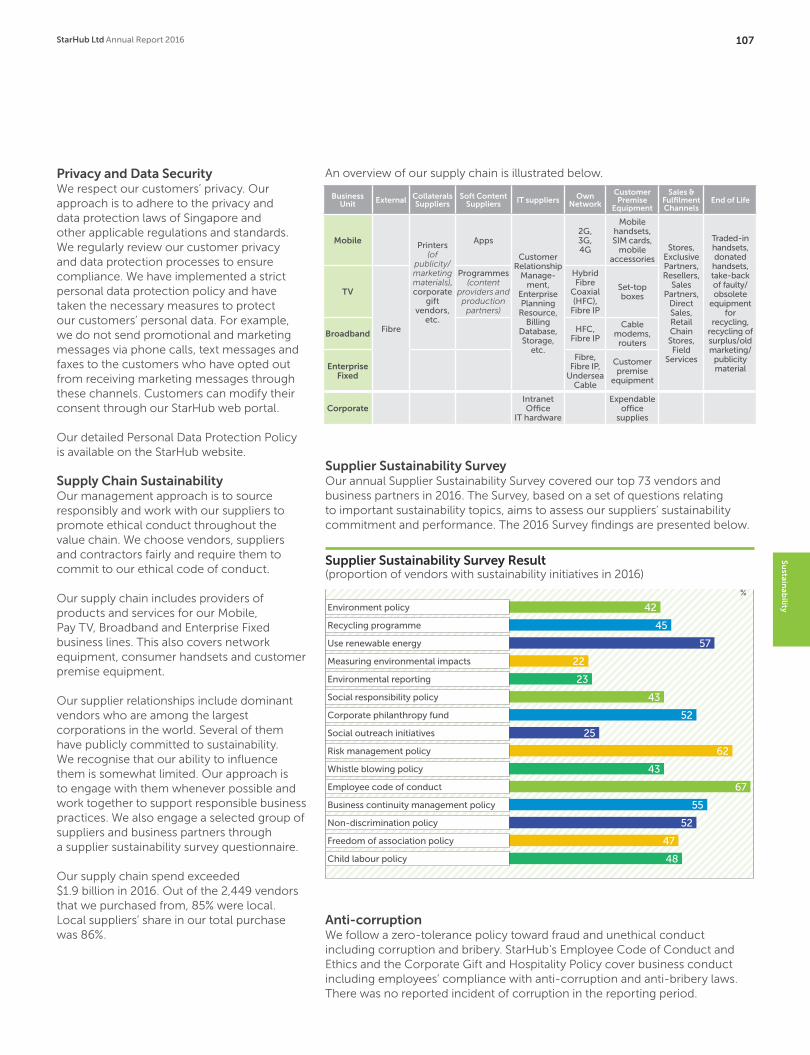
Our supply chain spend exceeded $1.9 billion in 2016. Out of the 2,449 vendors that we purchased from, 85% were local. Local suppliers’ share in our total purchase was 86%.
Anti-corruptionWe follow a zero-tolerance policy toward fraud and unethical conduct including corruption and bribery. StarHub’s Employee Code of Conduct and Ethics and the Corporate Gift and Hospitality Policy cover business conduct including employees’ compliance with anti-corruption and anti-bribery laws. There was no reported incident of corruption in the reporting period.
An overview of our supply chain is illustrated below.
Supplier Sustainability SurveyOur annual Supplier Sustainability Survey covered our top 73 vendors and business partners in 2016. The Survey, based on a set of questions relating to important sustainability topics, aims to assess our suppliers’ sustainability commitment and performance. The 2016 Survey findings are presented below.
Supplier Sustainability Survey Result(proportion of vendors with sustainability initiatives in 2016)
%
Use renewable energy
Social responsibility policy
Risk management policy
Business continuity management policy
Child labour policy
Recycling programme
Environmental reporting
Social outreach initiatives
Employee code of conduct
Freedom of association policy
Environment policy
Measuring environmental impacts
Corporate philanthropy fund
Whistle blowing policy
Non-discrimination policy
42
22
52
43
52
45
23
25
67
47
57
43
62
55
48
Business Unit External Collaterals
SuppliersSoft Content
Suppliers IT suppliers Own Network
Customer Premise
Equipment
Sales & Fulfilment Channels
End of Life
Mobile Printers (of
publicity/marketing materials), corporate
gift vendors,
etc.
Apps
Customer Relationship
Manage-ment,
Enterprise Planning Resource,
BillingDatabase, Storage,
etc.
2G,3G,4G
Mobile handsets,SIM cards,
mobile accessories
Stores, Exclusive Partners, Resellers,
Sales Partners,
Direct Sales, Retail Chain Stores,Field
Services
Traded-in handsets, donated handsets, take-back of faulty/obsolete
equipment for
recycling, recycling of surplus/old marketing/
publicity material
TV
Fibre
Programmes (content
providers and production partners)
Hybrid Fibre
Coaxial (HFC),
Fibre IP
Set-topboxes
Broadband HFC,Fibre IP
Cable modems, routers
Enterprise Fixed
Fibre, Fibre IP,
Undersea Cable
Customer premise
equipment
CorporateIntranet Office
IT hardware
Expendable office
supplies
Su
stainab
ility
StarHub Ltd Annual Report 2016 107
OURWORKPLACE
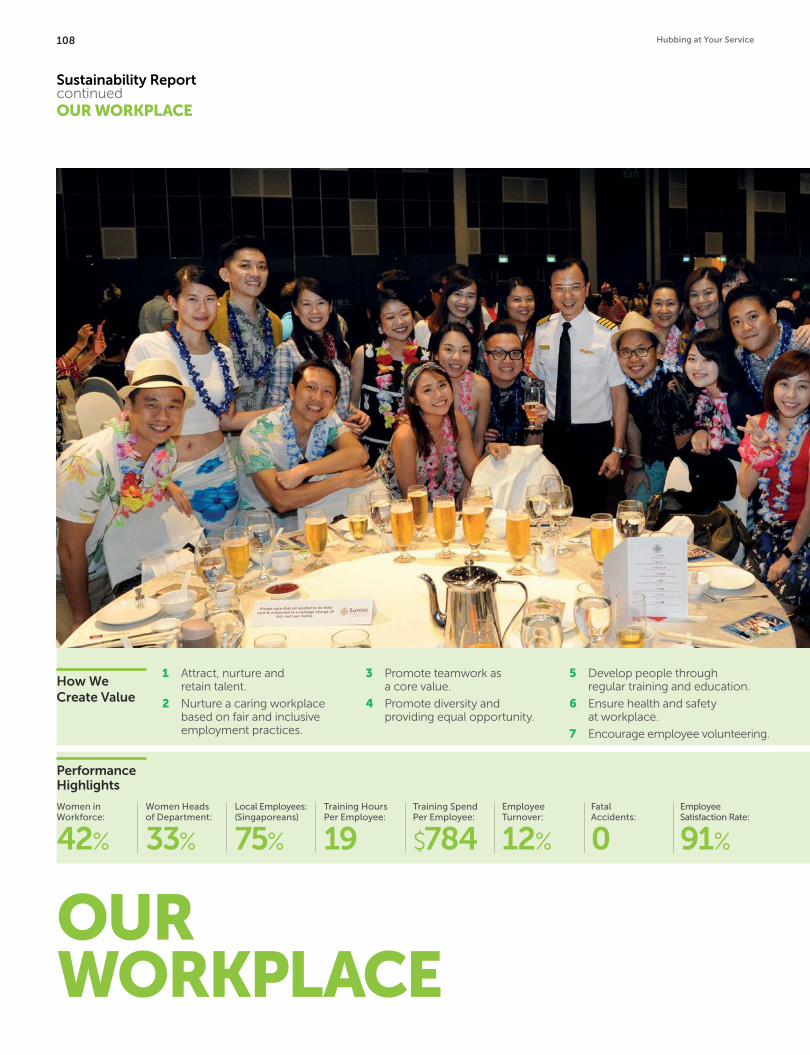
How We Create Value
Women in Workforce:
42%
Women Headsof Department:
33%
Local Employees: (Singaporeans)
75%
Training Hours Per Employee:
19Training Spend Per Employee:
$784Employee Turnover:
12%
FatalAccidents:
0Employee Satisfaction Rate:
91%
Performance Highlights
1 Attract, nurture and retain talent.
2 Nurture a caring workplace based on fair and inclusive employment practices.
3 Promote teamwork as a core value.
4 Promote diversity and providing equal opportunity.
5 Develop people through regular training and education.
6 Ensure health and safety at workplace.
7 Encourage employee volunteering.
OUR WORKPLACE
Sustainability Report continued
108 Hubbing at Your Service

We are focused on creating a high performing organisation based on respect, teamwork, inclusivity and excellence.
Our management approach is to continually invest in people so that they can deliver value to our customers and other stakeholders. Our human resource policies are aimed at developing a high-performing organisation by creating a fair, inclusive, engaging and fulfilling workplace. Our policies promote merit-based hiring and remuneration, teamwork, safe and healthy working conditions, diversity, reward and recognition for performance, people development, career growth, work-life balance, and employee volunteering.StarHub management regularly reviews HR policies and performance including hiring, diversity and equal opportunity, training, performance management and occupational health and safety.
We are proud to have achieved the People Developer (PD) certification in 2016, awarded by SPRING Singapore, in recognition of our efforts to develop our people to drive business excellence.
Our PeopleStarHub employed 2,965 people in 2016 with a median age of 37 years. Permanent employees, which include part-time employees, represented 90.6% of the total headcount. Employees with managerial or supervisory roles accounted for 16% of the workforce. The Customer Service Experience (30%), StarHub Integrated NW Engineering (23%), Enterprise Business Group (13%), and Information Services (11%) divisions accounted for the largest shares of the headcount.
Our PerformanceDiversity and equal opportunityOur mission is to nurture a diverse and inclusive workplace. Our policies promote diversity and meritocracy. We strive to offer equal opportunity in hiring, career advancement, promotions and remuneration strictly based on merit irrespective of gender, age, racial, ethnic or cultural background.
StarHub’s Board includes one female director who holds the position of an independent director. There are four women in the 11-member strong senior management team.
We are also committed to promoting an inclusive workplace and offering employment opportunities to persons with disabilities. We employed four persons with physical disabilities in 2016.
Equal Remuneration for Men and WomenOur management approach is to offer remuneration based on merit and experience without any gender discrimination.
Employee Profile
2016
Permanent employees
90.3%
Contract employees
9.4%
Part-time employees
0.3%
Ratio of base salary: Female to Male (2016)
Employee Category Female Male
Senior Manager & above 1.0 1.1
Middle Manager 1.0 1.1
Executive 1.0 1.0
Non-Executive 1.0 1.1
2016 2015 2014
Female 1 1 1
Male 1.1 1.1 1.1
Su
stainab
ility
StarHub Ltd Annual Report 2016 109

Diversity at StarHub New Hiring
Gender Diversity%
Male Female
4357
4357
4258
2014
2015
2016
Gender Profile by Employee Category%
Male Female
3763
3664
4456
8713
Snr. Managers & above
Executives
Middle Managers
Non-exec
Gender Diversity: StarHub Vs Infocomm%
StarHub National Infocomm Industry (source: MOM Year Book 2016)
61
58
42
Gender Diversity (Department/Division/Section Heads)
%
Male Female
3367
3367
3367
2014
2015
2016
Age Diversity by Gender%
Male Female
4555
4555
3862
3565
<30 years
41-50 years
30-40 years
> 50 years
Ethnic Diversity%
StarHub National Ethnic Composition
(source: Population trends 2016, Dept of Stat, Singapore)
75
9
3
75
137
6
12
Age Diversity
< 30 years 18%
30-40 years 47%
41-50 years 27%
Above 50 years 8%
Local Employees
Singapore citizens
75%
Singapore PR 12%
Foreigners 13%
2016
New Hiring by Gender
Male 62%
Female 38%
2016
New Hiring by Age Group
< 30 years 48%
30-50 years 50%
Above 50 years 2%
2016
OUR WORKPLACE
Sustainability Report continued
39
Male employees
Femaleemployees
Chinese
Malay
Indian
Others
2016
110 Hubbing at Your Service
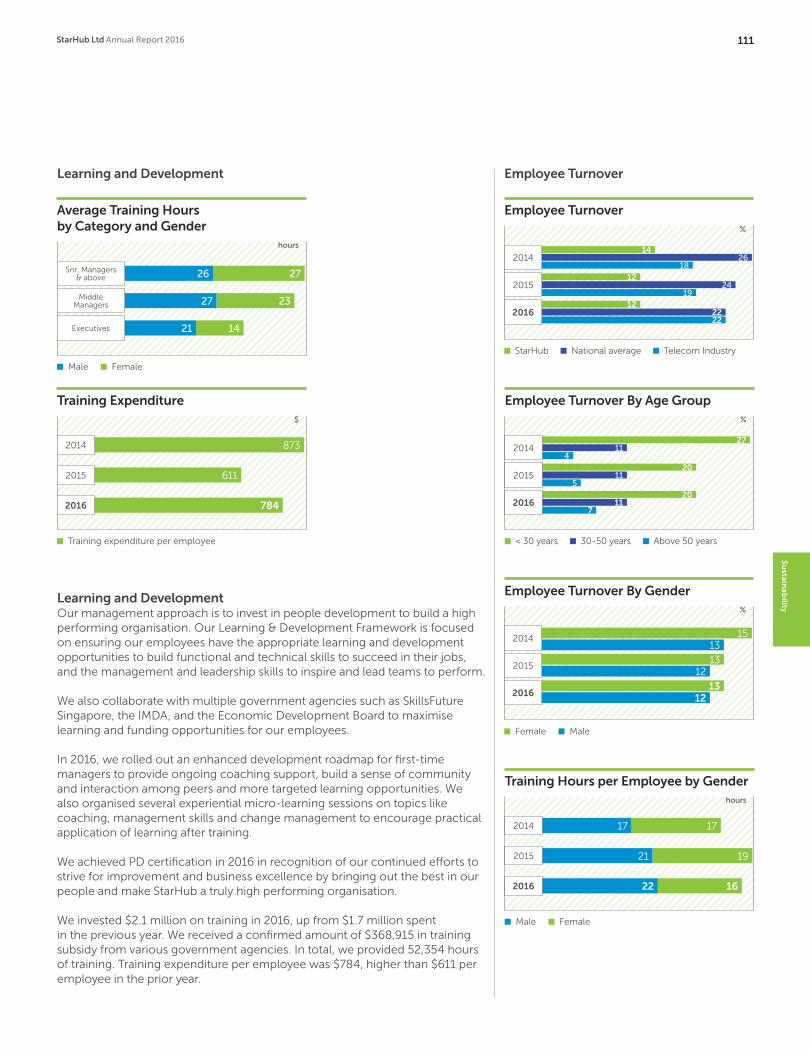
Average Training Hours by Category and Gender
hours
Male Female
2726
2327
1421
Snr. Managers & above
Middle Managers
Executives
Training Expenditure$
Training expenditure per employee
873
784
611
2014
2015
2016
Employee Turnover
Employee Turnover%
StarHub National average Telecom Industry
14
12
12
26
24
22
18
19
22
2014
2015
2016
Employee Turnover By Age Group%
< 30 years 30-50 years Above 50 years
27
20
20
11
11
11
4
5
7
2014
2015
2016
Employee Turnover By Gender%
Female Male
151313
12
1312
2014
2015
2016
Training Hours per Employee by Genderhours
Male Female
1717
1921
1622
2014
2015
2016
Learning and Development
Learning and DevelopmentOur management approach is to invest in people development to build a high performing organisation. Our Learning & Development Framework is focused on ensuring our employees have the appropriate learning and development opportunities to build functional and technical skills to succeed in their jobs, and the management and leadership skills to inspire and lead teams to perform.
We also collaborate with multiple government agencies such as SkillsFuture Singapore, the IMDA, and the Economic Development Board to maximise learning and funding opportunities for our employees.
In 2016, we rolled out an enhanced development roadmap for first-time managers to provide ongoing coaching support, build a sense of community and interaction among peers and more targeted learning opportunities. We also organised several experiential micro-learning sessions on topics like coaching, management skills and change management to encourage practical application of learning after training.
We achieved PD certification in 2016 in recognition of our continued efforts to strive for improvement and business excellence by bringing out the best in our people and make StarHub a truly high performing organisation.
We invested $2.1 million on training in 2016, up from $1.7 million spent in the previous year. We received a confirmed amount of $368,915 in training subsidy from various government agencies. In total, we provided 52,354 hours of training. Training expenditure per employee was $784, higher than $611 per employee in the prior year.
Su
stainab
ility
StarHub Ltd Annual Report 2016 111
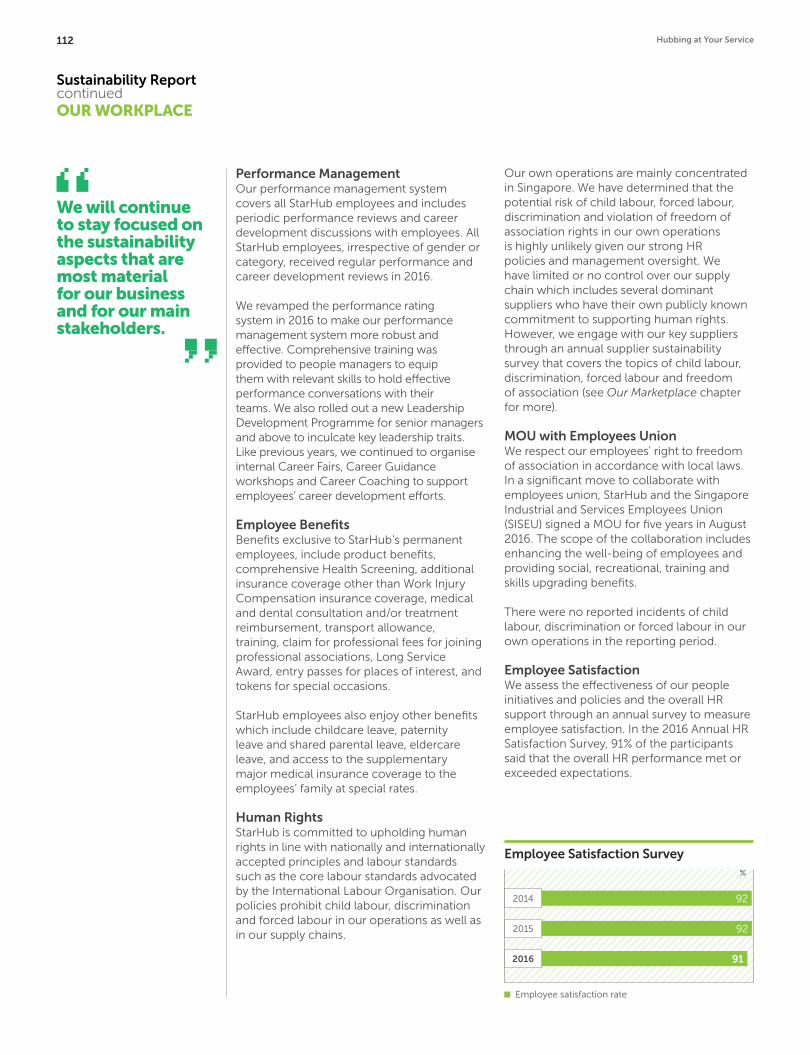
OUR WORKPLACE
Sustainability Report continued
Performance ManagementOur performance management system covers all StarHub employees and includes periodic performance reviews and career development discussions with employees. All StarHub employees, irrespective of gender or category, received regular performance and career development reviews in 2016.
We revamped the performance rating system in 2016 to make our performance management system more robust and effective. Comprehensive training was provided to people managers to equip them with relevant skills to hold effective performance conversations with their teams. We also rolled out a new Leadership Development Programme for senior managers and above to inculcate key leadership traits. Like previous years, we continued to organise internal Career Fairs, Career Guidance workshops and Career Coaching to support employees’ career development efforts.
Employee BenefitsBenefits exclusive to StarHub’s permanent employees, include product benefits, comprehensive Health Screening, additional insurance coverage other than Work Injury Compensation insurance coverage, medical and dental consultation and/or treatment reimbursement, transport allowance, training, claim for professional fees for joining professional associations, Long Service Award, entry passes for places of interest, and tokens for special occasions.
StarHub employees also enjoy other benefits which include childcare leave, paternity leave and shared parental leave, eldercare leave, and access to the supplementary major medical insurance coverage to the employees’ family at special rates. Human RightsStarHub is committed to upholding human rights in line with nationally and internationally accepted principles and labour standards such as the core labour standards advocated by the International Labour Organisation. Our policies prohibit child labour, discrimination and forced labour in our operations as well as in our supply chains.
Our own operations are mainly concentrated in Singapore. We have determined that the potential risk of child labour, forced labour, discrimination and violation of freedom of association rights in our own operations is highly unlikely given our strong HR policies and management oversight. We have limited or no control over our supply chain which includes several dominant suppliers who have their own publicly known commitment to supporting human rights. However, we engage with our key suppliers through an annual supplier sustainability survey that covers the topics of child labour, discrimination, forced labour and freedom of association (see Our Marketplace chapter for more).
MOU with Employees UnionWe respect our employees’ right to freedom of association in accordance with local laws. In a significant move to collaborate with employees union, StarHub and the Singapore Industrial and Services Employees Union (SISEU) signed a MOU for five years in August 2016. The scope of the collaboration includes enhancing the well-being of employees and providing social, recreational, training and skills upgrading benefits.
There were no reported incidents of child labour, discrimination or forced labour in our own operations in the reporting period.
Employee SatisfactionWe assess the effectiveness of our people initiatives and policies and the overall HR support through an annual survey to measure employee satisfaction. In the 2016 Annual HR Satisfaction Survey, 91% of the participants said that the overall HR performance met or exceeded expectations.
Employee Satisfaction Survey%
Employee satisfaction rate
92
92
91
2014
2015
2016
We will continue to stay focused on the sustainability aspects that are most material for our business and for our main stakeholders.
112 Hubbing at Your Service
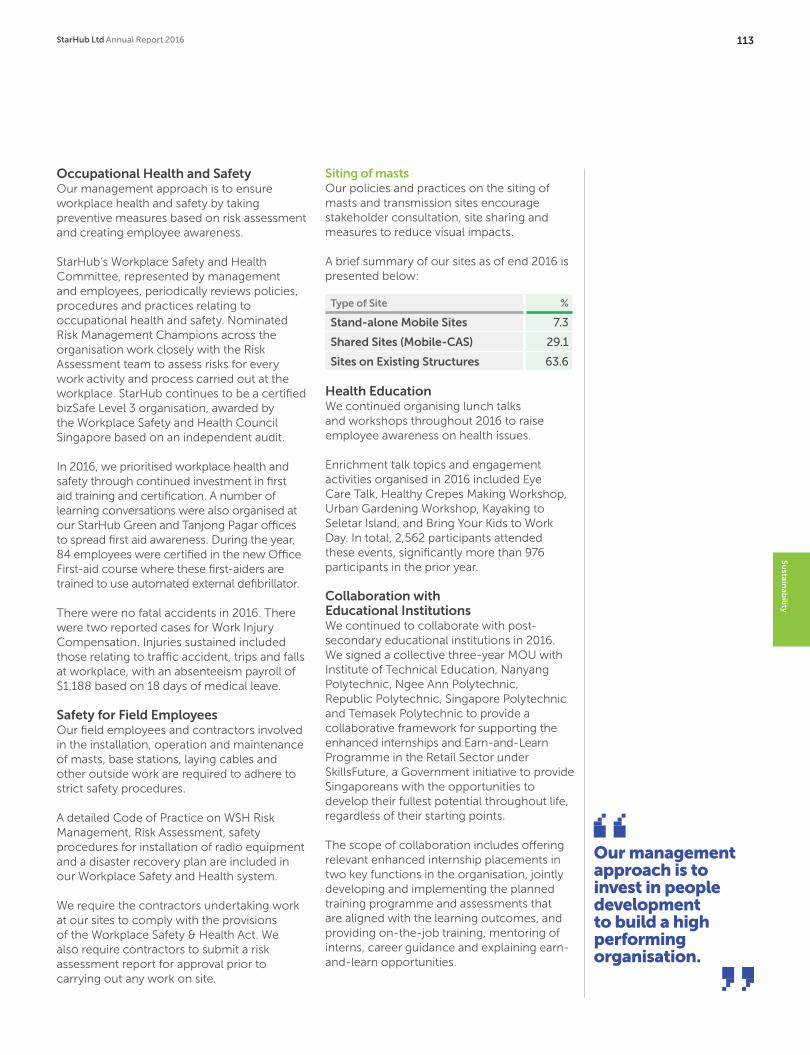
Occupational Health and SafetyOur management approach is to ensure workplace health and safety by taking preventive measures based on risk assessment and creating employee awareness.
StarHub’s Workplace Safety and Health Committee, represented by management and employees, periodically reviews policies, procedures and practices relating to occupational health and safety. Nominated Risk Management Champions across the organisation work closely with the Risk Assessment team to assess risks for every work activity and process carried out at the workplace. StarHub continues to be a certified bizSafe Level 3 organisation, awarded by the Workplace Safety and Health Council Singapore based on an independent audit.
In 2016, we prioritised workplace health and safety through continued investment in first aid training and certification. A number of learning conversations were also organised at our StarHub Green and Tanjong Pagar offices to spread first aid awareness. During the year, 84 employees were certified in the new Office First-aid course where these first-aiders are trained to use automated external defibrillator.
There were no fatal accidents in 2016. There were two reported cases for Work Injury Compensation. Injuries sustained included those relating to traffic accident, trips and falls at workplace, with an absenteeism payroll of $1,188 based on 18 days of medical leave.
Safety for Field EmployeesOur field employees and contractors involved in the installation, operation and maintenance of masts, base stations, laying cables and other outside work are required to adhere to strict safety procedures.
A detailed Code of Practice on WSH Risk Management, Risk Assessment, safety procedures for installation of radio equipment and a disaster recovery plan are included in our Workplace Safety and Health system.
We require the contractors undertaking work at our sites to comply with the provisions of the Workplace Safety & Health Act. We also require contractors to submit a risk assessment report for approval prior to carrying out any work on site.
Siting of mastsOur policies and practices on the siting of masts and transmission sites encourage stakeholder consultation, site sharing and measures to reduce visual impacts.
A brief summary of our sites as of end 2016 is presented below:
Type of Site %
Stand-alone Mobile Sites 7.3
Shared Sites (Mobile-CAS) 29.1
Sites on Existing Structures 63.6
Health EducationWe continued organising lunch talks and workshops throughout 2016 to raise employee awareness on health issues.
Enrichment talk topics and engagement activities organised in 2016 included Eye Care Talk, Healthy Crepes Making Workshop, Urban Gardening Workshop, Kayaking to Seletar Island, and Bring Your Kids to Work Day. In total, 2,562 participants attended these events, significantly more than 976 participants in the prior year.
Collaboration with Educational InstitutionsWe continued to collaborate with post-secondary educational institutions in 2016. We signed a collective three-year MOU with Institute of Technical Education, Nanyang Polytechnic, Ngee Ann Polytechnic, Republic Polytechnic, Singapore Polytechnic and Temasek Polytechnic to provide a collaborative framework for supporting the enhanced internships and Earn-and-Learn Programme in the Retail Sector under SkillsFuture, a Government initiative to provide Singaporeans with the opportunities to develop their fullest potential throughout life, regardless of their starting points.
The scope of collaboration includes offering relevant enhanced internship placements in two key functions in the organisation, jointly developing and implementing the planned training programme and assessments that are aligned with the learning outcomes, and providing on-the-job training, mentoring of interns, career guidance and explaining earn-and-learn opportunities.
Our management approach is to invest in people development to build a high performing organisation.
Su
stainab
ility
StarHub Ltd Annual Report 2016 113

OURCOMMUNITY
How We Create Value
1 Make positive contribution to local communities, focus on the underprivileged.
2 Bridge digital divide. 3 Encourage employee volunteering.
4 Encourage customers to participate in community initiatives.
Performance Highlights
Employee volunteering:
124 days
Beneficiaries:
More than 35,500disadvantaged youth and families
Community investment:
$844,769VWOs supported:
12
Sustainability Report continuedOUR COMMUNITY
114 Hubbing at Your Service

We are focused on building long-term relationships based on trust with the community by making a positive contribution.
Our management approach is to contribute toward building a strong and resilient community. We also actively involve our employees and customers in community programmes.
We reviewed our community investment programme in 2016 and identified two areas of priority: improving employability and life skills, and supporting connectivity needs for disadvantaged youth and families. In addition, we contributed to a number of other community causes. In total, our investment in community development programmes amounted to $844,769. We partnered with 12 VWOs in various initiatives, enhancing employability and critical life skills.
Community Chest AwardsStarHub’s fundraising efforts were recognised at the annual ComChest Awards in September 2016 with a Corporate Gold (for our donation of $213,850 for StarHub Open 2015) and a Special Events Silver (for StarHub Rewards Redemption Programme 2015). We also received a token of appreciation from President’s Challenge for our in-kind sponsorship of airtime worth $400,000.
Employee VolunteeringWe encourage our employees to participate in community and environmental initiatives through volunteering. We provide up to two working days of paid leave a year to our employees for volunteering. Several StarHub employees volunteer for a number of social and environmental causes each year. Our employees volunteered 124 man-days in 2016.
StarHub Community Investment 2016Together with employees, customers and business partners, we supported several community initiatives throughout the year. Our key community investment programmes in 2016 are described below.
624 children benefitted from the Nurture 2.0 programme, a volunteer programme that tutors underprivileged children in Central Singapore District in English and Mathematics with financial support from StarHub. Nurture 2.0, a weekly volunteer-driven programme for children aged seven to 12 run by the Central Singapore CDC, received $200,000 from the StarHub Sparks Fund, our corporate philanthropic vehicle. Working closely with the Central Singapore CDC, we have refined and introduced several non-academic modules such as creativity through IT, crafts and robotics to complement the academic curriculum. StarHub employees continued to volunteer at the Nurture 2.0 initiative in
Employee Volunteeringdays
214
144
124
2014
2015
2016
Community Investment$m
Amount disbursed from StarHub Sparks Fund
1.4
0.8
1.1
2014
2015
2016
Su
stainab
ility
StarHub Ltd Annual Report 2016 115
Sustainability Report continuedOUR COMMUNITY
2016. A group of 35 staff volunteers acted as mentors and took 202 Nurture beneficiaries for a day-long interactive learning experience to KidZania, an indoor theme park in Sentosa, where the children learnt about various vocations and basic financial literacy.
People with special needs and/or disabilities have been identified as one of the most vulnerable groups in Singapore. To support this group, StarHub donated $209,700 from the StarHub Sparks Fund through the annual StarHub Open, a golf event for corporate clients, joined by StarHub management with guest appearances by TVB artistes.
Funds went towards Metta School, MINDS Towner Garden School and Lighthouse School, to equip special needs students with the knowledge and skills necessary for independent functioning. This includes training of functional academic, independence, vocational and life skills to maximise their potential towards independent living and integration into the community.
Our two-year sponsorship of $300,000 of SPD’s Infocomm Accessibility Centre Certificate in Office Skills (ICOS) from 2015 to 2017, an office skills training programme that enables people with disabilities to find open, gainful employment in administrative positions has reaped positive outcomes. In 2016, over 70 persons were trained. Out of these, 19 found open employment.
We continued our support for the Children’s Cancer Foundation’s annual Hair for Hope event for the fifth consecutive year. To raise awareness of childhood cancer, StarHub pledged $1,000 for every person who shaved his/her head at the satellite event held at our main office in StarHub Green. A record 122 shavees including employees, partners and customers went bald in support of children with cancer, raising a total of $122,000 from the StarHub Sparks Fund.
Beneficiaries of StarHub’s Community Outreach Programmes in 2016$200,000 funding of Nurture 2.0.
$209,700 to three special needs schools: Metta School, MINDS Towner Garden School and Lighthouse School through the StarHub Open.
$122,000 for Hair for Hope in total donations to Children’s Cancer Foundation.
$50,000 to Entrepreneurs with Disability to support disadvantaged/deaf entrepreneurs in starting their own enterprises.
$150,000 for SPD’s ICOS, final tranche of a 2-year commitment from 2015.
$10,000 to Football with a Heart Fundraiser.
$47,860 for MINDS Towner Garden School, Care Corner Counselling Centre, and WWF through Rewards Redemption.
$16,420 donated to Daughters of Tomorrow, helping single or disadvantaged mothers get employability skills, in conjunction with the National Day campaign.
Media Spots for Social CampaignsOur in-kind donations in the form of TV commercial spots for social and environmental campaigns amounted to $1.44 million in 2016. The campaigns included WWF’s Earth Hour 2016, Children Cancer Foundation’s Hair for Hope 2016, Make a Wish Foundation’s Santa Run for Wishes 2016 and President’s Challenge.
We continued our support for the Children’s Cancer Foundation’s annual Hair for Hope event for the fifth consecutive year.
116 Hubbing at Your Service

StarHubbers bringing children from the Nurture programme to KidZania, to learn about various vocations.
StarHub CEO presenting a cheque to ComChest for funds raised through the StarHub Open.
Su
stainab
ility
StarHub Ltd Annual Report 2016 117

Sustainability Report continued
ECONOMIC PERFORMANCE
How We Create Value
1 Create sustainable economic value for shareholders as well as stakeholders.
2 Make a positive indirect impact on local economy and communities.
3 Support local suppliers.
4 Invest in infrastructure.
Performance Highlights
Net Profit:
$341mDirect Jobs:
2,965Local Suppliers:
2,090Local Suppliers’ Share in Total Supplier Payments:
86%
ECONOMIC PERFORMANCE
118 Hubbing at Your Service

We are focused on creating long-term value for shareholders and stakeholders by pursuing sustainable business growth strategies.
Our management approach is to create value for our shareholders and stakeholders by ensuring sustainable growth of our business. We are focused on adopting strategies that maximise shareholder returns while creating environmental, social and economic value for our stakeholders. We regularly review our management approach in view of the business goals, stakeholder expectations and the actual performance to evaluate effectiveness.
Our shareholders have enjoyed consistent and healthy dividends over the years.
Indirect Economic ImpactsOur management approach is to support projects, initiatives, services and infrastructure which allows us to pursue sustainable business growth and at the same time make a positive difference to the society where we operate.
StarHub plays a critical role in augmenting Singapore’s national infocomm infrastructure by regularly investing in the upgrade of our mobile, wireless communications and cable TV infrastructure. As we upgrade our networks, we strive to adopt energy-efficient technologies to reduce the impact on the environment and contribute to climate change mitigation efforts.
Our modern infocomm infrastructure and technologies enable people to connect and businesses to run their operations using our fast and reliable networks.
StarHub continues to create and support high quality direct jobs benefitting the local economy and the communities. Our significant purchase from local suppliers supports indirect jobs and helps in the development of local businesses.
Our other contributions to the local economy include tax payments, payment of wages, and community investments.
StarHub provided 2,965 direct jobs across the Group as of end-December 2016. Our operating expenditure, including employee costs, exceeded $2 billion in 2016. We paid $281 million in wages, adding further value to the local economy.
Supporting Local SuppliersWe indirectly contribute to the local economic development through our purchases. In 2016, our vendor payments exceeded $1.9 billion. In 2016, the share of local suppliers was 86% of the total purchases. Local suppliers constitute 85% of our vendor base.
Our significant purchase from local suppliers supports local jobs and businesses and creates tax opportunities for the government. Read more about our Supply Chain Sustainability in the chapter on Our Marketplace chapter.
Infrastructure DevelopmentWe regularly invest in upgrading the mobile, broadband and cable TV infrastructure. A major portion of our $367 million CAPEX was used for infrastructural investments and 4G spectrum licences in 2016.
Research and Development We regularly invest in research and development projects and forge cross-industry collaborations that promise new technological breakthroughs, reinvigorate our infrastructure, enhance productivity for customers and empower the community. These projects include enhancing mobile network evolution technologies and speed, strengthening complementary capabilities for data business services, the development of opportunities in the Internet of Things and cyber security. StarHub launched the Cyber Security COE in 2016 and together with the COE partners, will jointly invest S$200 million over the next five years to support a sustainable cyber security ecosystem. More information on the COE is available in the section under Our Marketplace.
Financial Assistance from the GovernmentWe received $368,915 in subsidy for employee training in 2016 under various schemes run by the IMDA, SkillsFuture Singapore, and Employment and Employability Institute (e2i).
Financial PerformanceA summarised version of our economic performance is presented below in line with the GRI Standards. The figures have been extracted from the Audited Annual Report approved by the Board of Directors for the respective financial years. To learn more about StarHub’s financial performance, please refer to the Group Financial Review and Financial Statements sections of this report.
Economic Performance Indicators FY 2016 FY 2015 FY 2014
Operating revenue 2,397 2,444 2,387
Net profit 341 372 371
Operating costs (including staff costs) 2,004 2,049 1,957
Staff costs 281 271 275
Dividends paid to shareholders 346 346 345
Summary of StarHub’s Economic Performance ($m)
Su
stainab
ility
StarHub Ltd Annual Report 2016 119

Sustainability Report continued
GRI Content Index‘In accordance’ – Core
GRI Standard DisclosurePage Number(s)
and/or URL(s)
GRI 101: Foundation 2016(GRI 101 does not include any standards)
GENERAL DISCLOSURES
GRI 102: General Disclosures 2016
Organisational Profile
102-1 Name of the organisation StarHub Ltd
102-2 Activities, brands, products, and services 3
102-3 Location of headquarters Singapore
102-4 Location of operations Mainly Singapore
102-5 Ownership and legal form 204-205
102-6 Markets served 3, 5
102-7 Scale of the organisation 3-5
102-8 Information on employees and other workers 108-112
102-9 Supply chain 107
102-10 Significant changes to the organisation and its supply chain None
102-11 Precautionary Principle or approach 96, 99
102-12 External initiatives 91
102-13 Membership of associations 95
Strategy
102-14 Statement from senior decision maker 15-17
102-15 Key impacts, risks, and opportunities 90-91
Ethics and Integrity
102-16 Values, principles, standards, and norms of behaviour 69-70, 89
Governance
102-18 Governance structure 54-78
Stakeholder Engagement
102-40 List of stakeholder groups 92-93
102-41 Collective bargaining agreements 112
102-42 Identifying and selecting stakeholders 92
102-43 Approach to stakeholder engagement 92-93
102-44 Key topics and concerns raised 92-93
Reporting Practice
102-45 Entities included in the consolidated financial statements 177
102-46 Defining report content and topic Boundaries 87, 97
102-47 List of material topics 96
102-48 Restatements of information 87
102-49 Changes in reporting 87
102-50 Reporting period 87
102-51 Date of most recent report 87
102-52 Reporting cycle 87
102-53 Contact point for questions regarding the report 88
102-54 Claims of reporting in accordance with the GRI Standards 87
102-55 GRI content index 120-123
102-56 External assurance 88
120 Hubbing at Your Service

GRI Standard DisclosurePage Number(s)
and/or URL(s)
MATERIAL TOPICS
Economic Performance
GRI 103:Management Approach 2016
103-1 Explanation of the material topic and its Boundaries 91, 97
103-2 The management approach and its components 118-119
103-3 Evaluation of the management approach 119
GRI 201: Economic Performance 2016
201-1 Direct economic value generated and distributed 119
201-4 Financial assistance received from government 119
Indirect Economic Impacts
GRI 103: Management Approach 2016
103-1 Explanation of the material topic and its Boundaries 97, 119
103-2 The management approach and its components 119
103-3 Evaluation of the management approach 119
GRI 203: Indirect Economic Impacts 2016
203-2 Significant indirect economic impacts 119
Procurement Practices
GRI 103: Management Approach 2016
103-1 Explanation of the material topic and its Boundaries 96, 97
103-2 The management approach and its components 91, 107, 119
103-3 Evaluation of the management approach 107, 119
GRI 204: Procurement Practices 2016
204-1 Proportion of spending on local suppliers 107, 119
Anti-corruption
GRI 103: Management Approach 2016
103-1 Explanation of the material topic and its Boundaries 107
103-2 The management approach and its components 107
103-3 Evaluation of the management approach 107
GRI 205: Anti-Corruption 2016
205-2 Communication and training about anti-corruption policies and procedures 107
205-3 Confirmed incidents of corruption and actions taken 107
Energy
GRI 103: Management Approach 2016
103-1 Explanation of the material topic and its Boundaries 90, 96-97
103-2 The management approach and its components 98-100
103-3 Evaluation of the management approach 98-100
GRI 302: Energy 2016
302-1 Energy consumption within the organisation 100, 102-103
302-2 Energy consumption outside of the organisation 100
302-3 Energy intensity 103
Emissions
GRI 103: Management Approach 2016
103-1 Explanation of the material topic and its Boundaries 90, 96-97
103-2 The management approach and its components 98-100
103-3 Evaluation of the management approach 98-100
GRI 305: Emissions 2016
305-1 Direct (Scope 1) GHG emissions 100
305-2 Energy indirect (Scope 2) GHG emissions 100
305-3 Other indirect (Scope 3) GHG emissions 100
305-4 GHG emissions intensity 102
305-6 Emissions of ozone-depleting substances (ODS) 100
Effluents and Waste
GRI 103: Management Approach 2016
103-1 Explanation of the material topic and its Boundaries 90, 96-97
103-2 The management approach and its components 101
103-3 Evaluation of the management approach 101
Su
stainab
ility
StarHub Ltd Annual Report 2016 121

GRI Standard DisclosurePage Number(s)
and/or URL(s)
GRI 306: Effluents and Waste 2016
306-2 Waste by type and disposal method 102-103
Environmental Compliance
GRI 103: Management Approach 2016
103-1 Explanation of the material topic and its Boundaries 99
103-2 The management approach and its components 99
103-3 Evaluation of the management approach 99
GRI 307:Environmental Compliance 2016
GRI 307-1 Non-compliance with environmental laws and regulations 102
Employment
GRI 103: Management Approach 2016
103-1 Explanation of the material topic and its Boundaries 90, 96-97
103-2 The management approach and its components 109
103-3 Evaluation of the management approach 109
GRI 401: Employment 2016
401-1 New employee hires and employee turnover 110-111
401-2 Benefits provided to full-time employees that are not provided to temporary or part-time employees
112
Occupational Health & Safety
GRI 103: Management Approach 2016
103-1 Explanation of the material topic and its Boundaries 96-97
103-2 The management approach and its components 113
103-3 Evaluation of the management approach 113
GRI 403: Occupational Health and Safety 2016
403-1 Workers representation in formal joint management–worker health and safety committees 113
403-2 Types of injury and rates of injury, occupational diseases, lost days, and absenteeism, and number of work-related fatalities
113
Training and Education
GRI 103: Management Approach 2016
103-1 Explanation of the material topic and its Boundaries 90, 96-97
103-2 The management approach and its components 111
103-3 Evaluation of the management approach 111
GRI 404: Training and Educations 2016
404-1 Average hours of training per year per employee 111
404-2 Programs for upgrading employee skills and transition assistance programs 111
404-3 Percentage of employees receiving regular performance and career development reviews 112
Diversity and Equal Opportunity
GRI 103: Management Approach 2016
103-1 Explanation of the material topic and its Boundaries 96-97, 109
103-2 The management approach and its components 109
103-3 Evaluation of the management approach 109
GRI 405:Diversity and EqualOpportunity 2016
405-1 Diversity of governance bodies and employees 110
405-2 Ratio of basic salary and remuneration of women to men 109
Non-discrimination
GRI 103: Management Approach 2016
103-1 Explanation of the material topic and its Boundaries 96-97, 112
103-2 The management approach and its components 112
103-3 Evaluation of the management approach 112
GRI 406:Non-discrimination 2016
406-1 Incidents of discrimination and corrective actions taken 107, 112
Freedom of Association and Collective Bargaining
GRI 103: Management Approach 2016
103-1 Explanation of the material topic and its Boundaries 96-97
103-2 The management approach and its components 95, 112
103-3 Evaluation of the management approach 112
GRI 407:Freedom ofAssociation andCollective Bargaining
407-1 Operations and suppliers in which the right to freedom of association and collective bargaining may be at risk
107, 112
Sustainability Report continued
122 Hubbing at Your Service
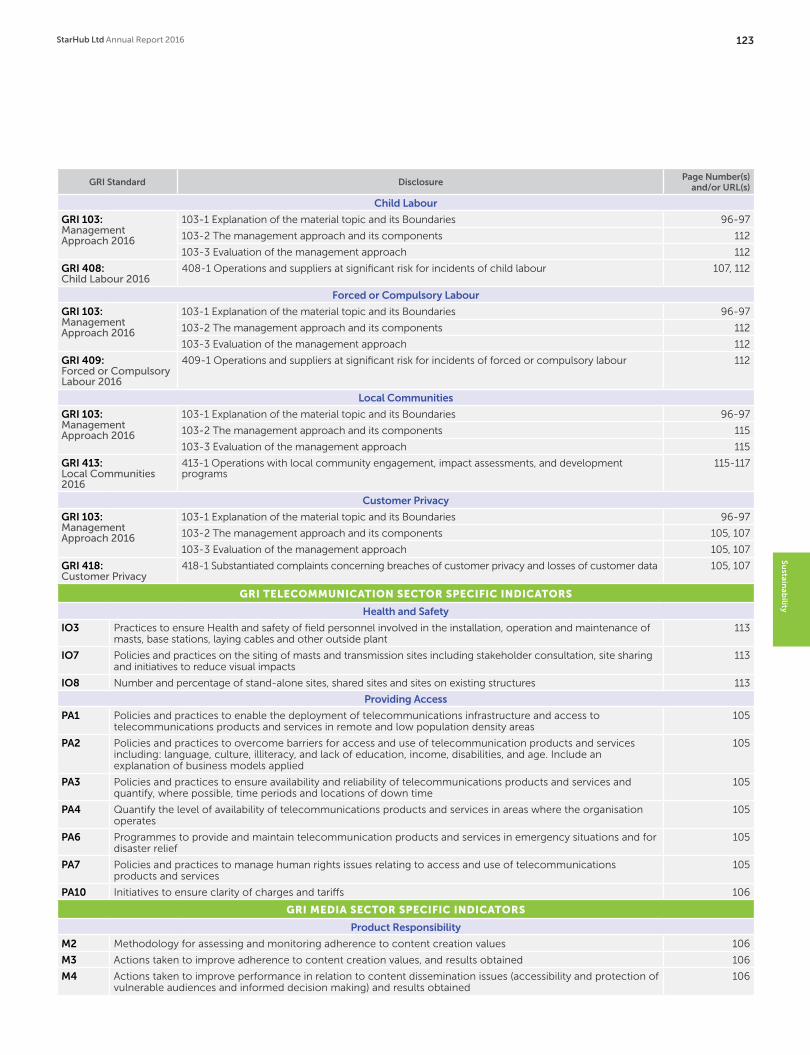
GRI Standard DisclosurePage Number(s)
and/or URL(s)
Child Labour
GRI 103: Management Approach 2016
103-1 Explanation of the material topic and its Boundaries 96-97
103-2 The management approach and its components 112
103-3 Evaluation of the management approach 112
GRI 408:Child Labour 2016
408-1 Operations and suppliers at significant risk for incidents of child labour 107, 112
Forced or Compulsory Labour
GRI 103: Management Approach 2016
103-1 Explanation of the material topic and its Boundaries 96-97
103-2 The management approach and its components 112
103-3 Evaluation of the management approach 112
GRI 409:Forced or Compulsory Labour 2016
409-1 Operations and suppliers at significant risk for incidents of forced or compulsory labour 112
Local Communities
GRI 103: Management Approach 2016
103-1 Explanation of the material topic and its Boundaries 96-97
103-2 The management approach and its components 115
103-3 Evaluation of the management approach 115
GRI 413: Local Communities 2016
413-1 Operations with local community engagement, impact assessments, and development programs
115-117
Customer Privacy
GRI 103: Management Approach 2016
103-1 Explanation of the material topic and its Boundaries 96-97
103-2 The management approach and its components 105, 107
103-3 Evaluation of the management approach 105, 107
GRI 418: Customer Privacy
418-1 Substantiated complaints concerning breaches of customer privacy and losses of customer data 105, 107
GRI TELECOMMUNICATION SECTOR SPECIFIC INDICATORS
Health and Safety
IO3 Practices to ensure Health and safety of field personnel involved in the installation, operation and maintenance of masts, base stations, laying cables and other outside plant
113
IO7 Policies and practices on the siting of masts and transmission sites including stakeholder consultation, site sharing and initiatives to reduce visual impacts
113
IO8 Number and percentage of stand-alone sites, shared sites and sites on existing structures 113
Providing Access
PA1 Policies and practices to enable the deployment of telecommunications infrastructure and access to telecommunications products and services in remote and low population density areas
105
PA2 Policies and practices to overcome barriers for access and use of telecommunication products and services including: language, culture, illiteracy, and lack of education, income, disabilities, and age. Include an explanation of business models applied
105
PA3 Policies and practices to ensure availability and reliability of telecommunications products and services and quantify, where possible, time periods and locations of down time
105
PA4 Quantify the level of availability of telecommunications products and services in areas where the organisation operates
105
PA6 Programmes to provide and maintain telecommunication products and services in emergency situations and for disaster relief
105
PA7 Policies and practices to manage human rights issues relating to access and use of telecommunications products and services
105
PA10 Initiatives to ensure clarity of charges and tariffs 106
GRI MEDIA SECTOR SPECIFIC INDICATORS
Product Responsibility
M2 Methodology for assessing and monitoring adherence to content creation values 106
M3 Actions taken to improve adherence to content creation values, and results obtained 106
M4 Actions taken to improve performance in relation to content dissemination issues (accessibility and protection of vulnerable audiences and informed decision making) and results obtained
106
Su
stainab
ility
StarHub Ltd Annual Report 2016 123

Group Financial Review
1.1 RevenueYear ended 31 December
2016 2016 2015 2015 Incr/(Decr)$m % $m % $m %
Mobile revenue 1,214.6 50.7 1,239.8 50.7 (25.2) (2.0)Pay TV revenue 377.8 15.8 391.0 16.0 (13.2) (3.4)Broadband revenue 216.8 9.0 200.3 8.2 16.5 8.2 Enterprise Fixed revenue 400.0 16.7 384.9 15.8 15.1 3.9 Total service revenue 2,209.2 92.2 2,216.0 90.7 (6.8) (0.3)Sales of equipment 187.5 7.8 228.3 9.3 (40.8) (17.9)Total 2,396.7 100.0 2,444.3 100.0 (47.6) (1.9)
The Group’s total revenue of $2,396.7 million was $47.6 million or 1.9% lower year-on-year (YoY), attributed to lower revenues from sales of equipment and services.
Compared to 2015, mobile service revenue was lower by 2.0% due to lower usage revenue from voice services, IDD and roaming services from both post-paid and pre-paid services, partly mitigated by higher subscription revenue from a larger customer base.
Pay TV service revenue was lower by 3.4% YoY, primarily due to a decrease in the customer base.
Broadband service revenue was higher by 8.2% when compared to 2015. The higher revenue was driven by an increase in the mix of customers taking fibre plans, resulting in higher average revenue per user (ARPU) of $37 in 2016, up from $34 in 2015.
YoY, enterprise fixed service revenue was higher by 3.9%, primarily due to growth in data & internet services.
Revenue from sales of equipment decreased 17.9% YoY primarily due to lower volume of handsets sold.
1.2 Operating Expenses Year ended 31 December
2016 2015 Incr/(Decr)
$m $m $m %
Cost of sales 974.6 1,053.1 (78.5) (7.5)Other operating expenses 1,029.2 995.5 33.7 3.4 Total 2,003.8 2,048.6 (44.8) (2.2)
Total operating expenses were 2.2% lower YoY at $2,003.8 million, attributed to lower cost of sales (primarily cost of equipment and traffic expenses), offset by higher other operating expenses.
As a percentage of revenue, total operating expenses were at 83.6% when compared to 83.8% in 2015.
A breakdown of total operating expenses is as follows:
(i) Cost of SalesYear ended 31 December
2016 2015 Incr/(Decr)$m $m $m %
Cost of equipment sold 447.8 487.1 (39.3) (8.1)Cost of services 409.5 415.8 (6.3) (1.5)Traffic expenses 117.3 150.2 (32.9) (21.9)Total 974.6 1,053.1 (78.5) (7.5)
Cost of equipment decreased 8.1% YoY with fewer handsets sold.
Cost of services in 2016 included some reversals of accruals not required. Excluding these reversals, cost of services were 1.1% higher YoY, mainly due to higher enterprise fixed costs, coupled with increase in installation costs driven by higher
take-up of fibre broadband plans. This was partly mitigated by lower TV programming and production costs.
Traffic expenses were lower by 21.9% YoY due to lower domestic and international traffic volume.
124 Hubbing at Your Service

Staff costsThe higher staff costs were due to annual increments and provision for restructuring costs, mitigated by reversal of staff costs accruals not required.
Operating leasesThe higher operating leases in 2015 were mainly due to the catch up of property tax on our network offices. Excluding this catch up in 2015 and reversal of accruals not required in 2016, operating leases were 1.2% higher YoY mainly due to commencement of new office’s rental.
Marketing and promotionsCompared to 2015, the lower marketing and promotions expenses in 2016 were primarily due to the lower acquisition and re-contract costs driven by lower sales volume and reclassification of certain expenses to cost of sales.
Allowance for doubtful receivablesThe higher allowance for doubtful receivables was due to an increase in provision rate with effect from 4Q2016 after the review of the outstanding accounts receivables profile.
Repair and maintenanceCompared to 2015, the higher repair and maintenance expenses in 2016 were mainly due to the provision for submarine cable repair costs for cable cuts in the first half of 2016 and higher maintenance costs driven by expanded network and systems infrastructure.
Other expensesYoY, the higher other expenses were due to higher licence fees ($11.7m), foreign exchange losses ($7.3m), professional and outsourcing fees ($5.0m) and lower gain on disposal of fixed assets ($3.2m).
Depreciation and amortisationThe lower depreciation and amortisation expenses were mainly due to property, plant and equipment and intangible assets fully depreciated and amortised respectively, offset by new additions of CAPEX.
(ii) Other Operating Expenses Year ended 31 December
2016 2015 Incr/(Decr)$m $m $m %
Staff costs 281.4 270.7 10.7 4.0 Operating leases 116.1 121.7 (5.6) (4.6)Marketing and promotions 133.7 144.6 (10.9) (7.5)Allowance for doubtful receivables 21.0 18.4 2.6 14.5 Repair and maintenance 96.9 86.0 10.9 12.6 Other expenses 115.1 82.7 32.4 39.0 Subtotal 764.2 724.1 40.1 5.5 Depreciation and amortisation (net of asset grants) 265.0 271.4 (6.4) (2.4)Total 1,029.2 995.5 33.7 3.4
The Group’s other operating expenses were higher by 3.4% when compared to 2015. As a percentage of revenue, other operating expenses were at 42.9%, up from 40.7% in 2015.
Analysis of major variances in other operating expenses is provided below:
Su
stainab
ility
StarHub Ltd Annual Report 2016 125
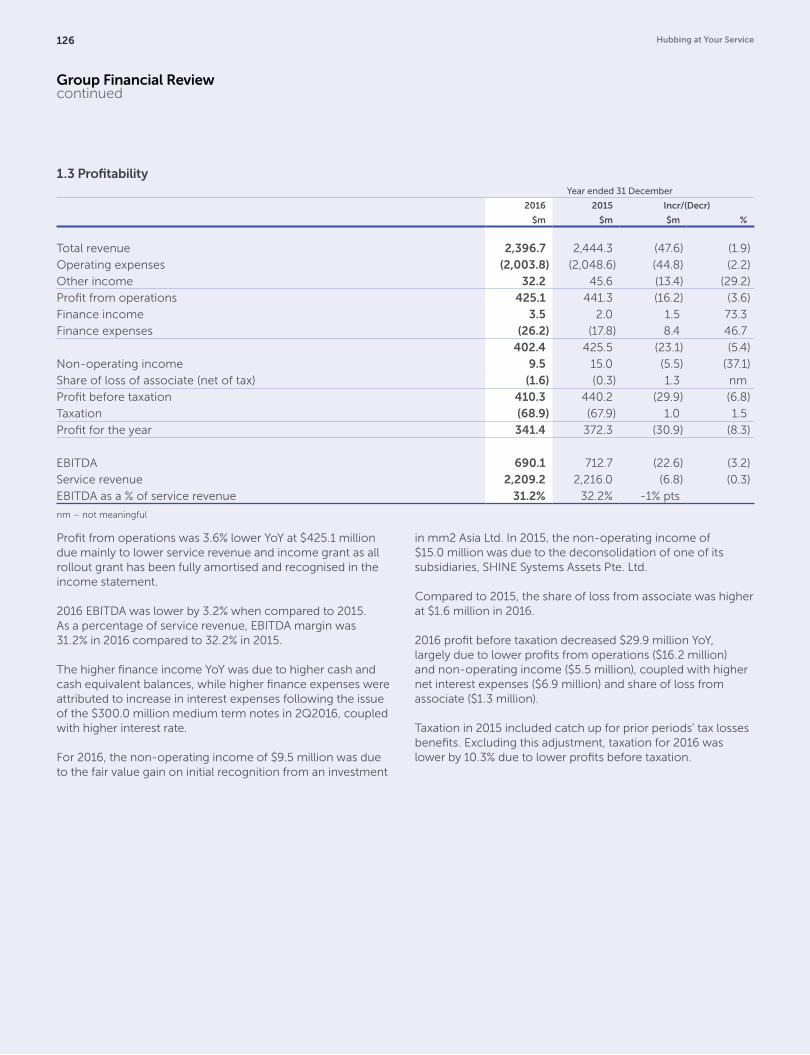
Group Financial Review continued
1.3 ProfitabilityYear ended 31 December
2016 2015 Incr/(Decr)
$m $m $m %
Total revenue 2,396.7 2,444.3 (47.6) (1.9)
Operating expenses (2,003.8) (2,048.6) (44.8) (2.2)
Other income 32.2 45.6 (13.4) (29.2)
Profit from operations 425.1 441.3 (16.2) (3.6)
Finance income 3.5 2.0 1.5 73.3
Finance expenses (26.2) (17.8) 8.4 46.7
402.4 425.5 (23.1) (5.4)
Non-operating income 9.5 15.0 (5.5) (37.1)
Share of loss of associate (net of tax) (1.6) (0.3) 1.3 nm
Profit before taxation 410.3 440.2 (29.9) (6.8)
Taxation (68.9) (67.9) 1.0 1.5
Profit for the year 341.4 372.3 (30.9) (8.3)
EBITDA 690.1 712.7 (22.6) (3.2)
Service revenue 2,209.2 2,216.0 (6.8) (0.3)
EBITDA as a % of service revenue 31.2% 32.2% -1% pts
nm – not meaningful
Profit from operations was 3.6% lower YoY at $425.1 million due mainly to lower service revenue and income grant as all rollout grant has been fully amortised and recognised in the income statement.
2016 EBITDA was lower by 3.2% when compared to 2015. As a percentage of service revenue, EBITDA margin was 31.2% in 2016 compared to 32.2% in 2015.
The higher finance income YoY was due to higher cash and cash equivalent balances, while higher finance expenses were attributed to increase in interest expenses following the issue of the $300.0 million medium term notes in 2Q2016, coupled with higher interest rate.
For 2016, the non-operating income of $9.5 million was due to the fair value gain on initial recognition from an investment
in mm2 Asia Ltd. In 2015, the non-operating income of $15.0 million was due to the deconsolidation of one of its subsidiaries, SHINE Systems Assets Pte. Ltd.
Compared to 2015, the share of loss from associate was higher at $1.6 million in 2016.
2016 profit before taxation decreased $29.9 million YoY, largely due to lower profits from operations ($16.2 million) and non-operating income ($5.5 million), coupled with higher net interest expenses ($6.9 million) and share of loss from associate ($1.3 million).
Taxation in 2015 included catch up for prior periods’ tax losses benefits. Excluding this adjustment, taxation for 2016 was lower by 10.3% due to lower profits before taxation.
126 Hubbing at Your Service

1.4 Liquidity and ResourcesYear ended 31 December
2016 2015
$m $m
Profit before taxation 410.3 440.2
Non-cash items & net finance expenses adjustments 257.8 233.7
Changes in operating assets and liabilities (63.7) (36.7)
Income tax paid (53.7) (92.7)
Net cash from operating activities 550.7 544.5
Net cash used in investing activities (389.3) (300.3)
Net cash used in financing activities (49.6) (335.3)
Net change in cash and cash equivalents 111.8 (91.1)
Exchange difference on cash and cash equivalents – 0.3
Cash and cash equivalents at beginning of the year 173.4 264.2
Cash and cash equivalents at end of the year 285.2 173.4
Free Cash Flow (1) 184.0 215.7 (1) Free Cash Flow refers to net cash from operating activities less purchase of property, plant and equipment and intangible assets in the cash flow statement.
YoY, the Group’s net cash from operating activities was $6.2 million higher due to lower tax paid offset by higher requirements from working capital and lower cash flows from operations.
The negative changes in working capital of $63.7 million was attributed to lower net balances due to related parties, higher trade receivables, other receivables, deposits and prepayments. This was mitigated by higher trade and other payables.
Net cash used in investing activities increased by $89.0 million YoY, due to higher CAPEX payments and loans disbursed to associate of $8.7 million in 2016 as compared to a repayment of loan from associate of $36.9 million in 2015. In addition, 2016 cash outflow also included the investment in mm2 Asia Ltd of $18.0 million compared to $12.0 million additional capital injected in associate in 2015.
The Group’s CAPEX payments in 2016 totalled $366.7 million. Excluding the $80 million spectrum paid in 3Q2016, the CAPEX payments in 2016 were 12.0% of total revenue.
Free cash flow was $31.7 million lower at $184.0 million as a result of higher CAPEX payments.
Net cash used in financing activities were lower at $49.6 million in 2016 as compared to $335.3 million in 2015. The lower cash outlay was due to the proceeds received from the issue of $300.0 million medium term notes offset by purchase of treasury shares in 2016.
The resulting net cash generated was a surplus of $111.8 million. As a result, cash and cash equivalents balance was higher at $285.2 million, up from $173.4 million in 2015.
Su
stainab
ility
StarHub Ltd Annual Report 2016 127

Compared to 2015, the Group’s non-current assets of $1,455.3 million as of 31 December 2016 were higher by $149.7 million. The increase was mainly due to higher net book values for fixed assets which included the addition of 4G spectrum rights in 3Q2016, and higher non-current balance due from related parties resulting from the loan disbursement to associate. In addition, the investment in mm2 Asia Ltd with a fair value of $40.0 million recorded as of 31 December 2016 also contributed to the higher non-current assets.
Total current assets of $741.0 million as of 31 December 2016 were $137.2 million higher YoY, primarily due to higher cash and cash equivalents which was up by $111.8 million when compared to 31 December 2015.
Total current liabilities as of 31 December 2016 were $172.4 million lower at $855.5 million when compared to a year ago. The decrease was due to the reclassification of bank borrowings from current liabilities to non-current liabilities as a result of extension of bank borrowings. Balance due to related parties was also lower by $55.4 million upon the finalisation of outstanding claims and timing in settlement of payables.
Against 31 December 2015, total non-current liabilities were $452.0 million higher at $1,145.9 million. The increase was largely due to the $300.0 million medium term notes issued in 2Q2016 and reclassification of bank borrowings from current liabilities.
The Group’s shareholders’ equity increased by $7.3 million to $194.9 million as of 31 December 2016. The increase was primarily due to higher share capital of $6.2 million and favourable changes in fair value of available-for-sale investments of $12.5 million, offset by the purchase of treasury shares of $12.3 million.
GearingThe Group’s unsecured borrowings of $987.5 million as of 31 December 2016 were $300.0 million higher when compared to a year ago. The increase was due to the $300.0 million 3.55% fixed rate 10-year medium term notes issued in June 2016, with maturity due in 2026.
Against 31 December 2015, net debt was $188.2 million higher at $702.3 million as of 31 December 2016, attributed to higher borrowings mitigated by an increase in ending cash balances. As a ratio of the full year EBITDA, the Group’s net debt was higher at 1.02 times as of 31 December 2016, up from 0.72 times as of 31 December 2015.
1.5 Financial PositionAs at 31 December
2016 2015
$m $m
Non-current assets 1,455.3 1,305.6
Current assets 741.0 603.8
Less: Current liabilities 855.5 1,027.9
Less: Non-current liabilities 1,145.9 693.9
Net assets 194.9 187.6
Shareholders' equity 194.9 187.6
Group Financial Review continued
128 Hubbing at Your Service