Sustainability Planning, Environmental Justice and Climate ...
24
Suburban Sustainability Suburban Sustainability Volume 2 Issue 2 Article 1 2014 Sustainability Planning, Environmental Justice and Climate Sustainability Planning, Environmental Justice and Climate Change: Applications of the Long Island MARKAL Model Change: Applications of the Long Island MARKAL Model David S. Friedman City University of New York Graduate Center, [email protected] Yehuda Klein Brooklyn College of the City University of New York and NOAA-CREST at CCNY, [email protected] Jose Pillich City University of New York Graduate Center and NOAA-CREST at CCNY, [email protected] Michael T. Sullivan City University of New York, Lehman College, [email protected] Follow this and additional works at: https://scholarcommons.usf.edu/subsust Part of the Geographic Information Sciences Commons, Human Geography Commons, Oil, Gas, and Energy Commons, Other Environmental Sciences Commons, and the Sustainability Commons Recommended Citation Recommended Citation Friedman, David S.; Klein, Yehuda; Pillich, Jose; and Sullivan, Michael T. (2014) "Sustainability Planning, Environmental Justice and Climate Change: Applications of the Long Island MARKAL Model," Suburban Sustainability: Vol. 2 : Iss. 2 , Article 1. https://www.doi.org/http://dx.doi.org/10.5038/2164-0866.2.2.1 Available at: https://scholarcommons.usf.edu/subsust/vol2/iss2/1 This Article is brought to you for free and open access by the Environmental Sustainability at Scholar Commons. It has been accepted for inclusion in Suburban Sustainability by an authorized editor of Scholar Commons. For more information, please contact [email protected].
Transcript of Sustainability Planning, Environmental Justice and Climate ...

Suburban Sustainability Suburban Sustainability
Volume 2 Issue 2 Article 1
2014
Sustainability Planning, Environmental Justice and Climate Sustainability Planning, Environmental Justice and Climate
Change: Applications of the Long Island MARKAL Model Change: Applications of the Long Island MARKAL Model
David S. Friedman City University of New York Graduate Center, [email protected]
Yehuda Klein Brooklyn College of the City University of New York and NOAA-CREST at CCNY, [email protected]
Jose Pillich City University of New York Graduate Center and NOAA-CREST at CCNY, [email protected]
Michael T. Sullivan City University of New York, Lehman College, [email protected]
Follow this and additional works at: https://scholarcommons.usf.edu/subsust
Part of the Geographic Information Sciences Commons, Human Geography Commons, Oil, Gas, and
Energy Commons, Other Environmental Sciences Commons, and the Sustainability Commons
Recommended Citation Recommended Citation Friedman, David S.; Klein, Yehuda; Pillich, Jose; and Sullivan, Michael T. (2014) "Sustainability Planning, Environmental Justice and Climate Change: Applications of the Long Island MARKAL Model," Suburban Sustainability: Vol. 2 : Iss. 2 , Article 1. https://www.doi.org/http://dx.doi.org/10.5038/2164-0866.2.2.1 Available at: https://scholarcommons.usf.edu/subsust/vol2/iss2/1
This Article is brought to you for free and open access by the Environmental Sustainability at Scholar Commons. It has been accepted for inclusion in Suburban Sustainability by an authorized editor of Scholar Commons. For more information, please contact [email protected].
I. INRODUCTION
A. SUSTAINABILITY PLANNING & ENVIRONMENTAL JUSTICE
The United Nations Brundtland Commission (1987), defined “sustainability” as “meeting the needs of the present without compromising the ability of future generations to meet their own needs.” Within the business sector, the concept of sustainability has been examined by many (Gladwin, et al, 1995; Jennings and Zandbergen, 1995; Sharma and Ruud, 2003; Schaefer, 2004), and is generally defined by the imperative that a company should take into account social, environmental, and financial performance (Spreckley, 1981). John Elkington (1998) used this concept to coin the phrase "triple bottom line," which is the foundation of the stakeholder theory1 and for shaping concepts such as the Global Reporting Initiative2 (GRI) and Dow Jones Sustainability Indexes. Similarly, the 2005 World Summit on Social Development (United Nations General Assembly, 2005) explained that the framework of all United Nations activities must include sustainable environmental components, and social equity, while meeting economic demands. In connecting the demands of economic growth with our environmental concerns, Daly (1990) characterizes environmental sustainability as consumption levels that are within “sustainable limits.” These limits require that our consumption of renewable resources should not exceed replacement rates; our use of non-renewable resources should not outpace the rate at which we can develop renewable substitutes; our discharge of pollutants should not exceed the rate at which the environment can safely absorb and decompose them. In the twenty-five years since the Brundtland Report, society has witnessed a number of sustainability initiatives, spanning institutions such as corporations, universities, and political entities at all levels, from nations and groups of nations to local municipalities. One active area of research has explored the numerous sustainability initiatives undertaken by U.S. cities (Portney, 2003; 2005). An example of a local urban sustainability plan is PlaNYC 2030, a New York City initiative aimed at creating a sustainable New York City. This initiative embraces twenty nine sustainability indicators to frame nine progressive themes that the city seeks to accomplish in the near future. It is an ongoing initiative and
1 The stakeholder theory explains that businesses should have a responsibility to all those that are influenced by the firms actions, and not shareholders. Elkington discusses the need for business entities to, among other things, long term reflection, transparency, responsibility, and diversity.
2 The GRI is the dominant corporate sustainability reporting (CSR) framework for reporting financial and nonfinancial information to stakeholders. The GRI has established and regularly updated criteria that must be included and discussed in sustainability reports (Ballou, 2006).
1
Friedman et al.: LI MARKAL: Sustainability, Environmental Justice, and Climate Change
Published by Scholar Commons, 2014

has achieved the cooperation of a number of local stakeholders, among them the major universities within New York City. Similar to PlaNYC is The Baltimore Sustainability Plan which incorporates seven themes (such as conservation, education and awareness, and pollution prevention) and 29 major goals. Some of these goals are clearly defined, such as a doubling of Baltimore's tree canopy by 2037 and a reduction of Baltimore's energy use by 15% by 2015. Common to these sustainability initiatives are the goals of economic growth, ecological protection, and social equity. Unfortunately, many of these plans set forth seemingly arbitrary goals, without first establishing clear criteria for determining the “best” choices from among available option. To a certain extent, economic growth in all the plans is the initiative that remains at the top of the entire framework. The primary reason is that the other initiatives are designed in a manner that does not need impede economic growth. Although urban areas have taken the lead in establishing sustainability goals, suburbs have pushed this concept as well. This is a crucial development; as of the 2000 census, U.S. suburban populations have exceeded urban and rural populations, and this trend is expected to continue. Suburban areas have increasingly felt the pressures of increased traffic, strained infrastructure, and loss of open space (Dunham-Jones, 2005), and have begun to establish sustainability plans in response to these pressures. Prior to the initiation of large scale sustainability plans on Long Island, programs were established to simply improve household efficiency, in some cases via door-to-door or large group informational sessions. One such effort was undertaken in Levittown, New York, America’s first suburb. In cooperation with Nassau County and private stakeholders, the Citizens Campaign for the Environment and Green Levittown were established. This initiative strived to improve the environment by improving efficiency and creating a more sustainable future. This initiative was hampered by the failure to establish measurable goals, and the lack of communication among stakeholder groups. As a result, the plan ceased operations within a year. Green Levittown may thus be seen as a failure. Sustainability programs at a regional scale have targeted residential energy use with the goals of mitigating energy expenditures and, as a result, air emissions. The objectives of the Long Island Green Homes Consortium, a cooperative effort started in 2008, were to raise homeowners’ awareness of energy use and costs. Toward that end, homeowners were encouraged to complete comprehensive home energy audits. The partnership between local municipalities, nonprofit organizations, energy providers and governmental agencies offers funding for free or reduced-cost home energy audits conducted by Building Performance Institute accredited contractors through NYSERDA's Home Performance with ENERGY STAR Program. Long Island Green Homes
2
Suburban Sustainability, Vol. 2 [2014], Iss. 2, Art. 1
https://scholarcommons.usf.edu/subsust/vol2/iss2/1DOI: http://dx.doi.org/10.5038/2164-0866.2.2.1

targets older, less efficient homes for retrofit. Energy efficiency upgrades, including lighting, furnaces, boilers, weather-stripping, duct/air sealing and insulation, are eligible for financing plans, as well as grants and rebates of up to $5,000 or 50% of the costs. Specific programs and costs vary by municipality. In the Town of Babylon, the town pays the cost of energy audits to contractors, and offers participants a 3% financing option on costs up to $12,000. Participants in Babylon experienced a reduction of $1,024 in energy costs annually. (Home Performance Resource Center, 2010) As of 2011, the Town signed up 600 homes, 1% of all single family homes, leading to a projected reduction of 2,777 metric tons of CO2
emissions annually. The program aimed to enroll 1,000 homes by 2012. Unfortunately, the program has not conducted a detailed self-study, and thus estimates of the reduction of emissions for Long Island Green Homes are not available. Nationally, existing technologies in energy efficient retrofitting can potentially lead to a reduction in 160 million metric tons of greenhouse gas emissions annually by 2020. (LeBaron and Rinaldi, 2010) Given Long Island’s large proportion of residential energy usage, programs like Long Island Green Homes have the potential to substantially limit the region’s energy demand and enable sustainability improvements. In 2009, New York State announced plans to reduce 2050 greenhouse gas emissions in the State to 80% below the levels emitted in 1990 and a benchmark reduction of 40% below 1990 levels in 2030. Executive Order 24, promulgated by Governor Patterson, created the Climate Action Council. That body was assigned responsibilities to assess how all economic sectors can reduce greenhouse gas emissions, adapt to climate change, and be responsible for meeting the goals set in the Executive Order. Industry portfolios in buildings and industry, transportation and land use, power supply and delivery, and agriculture, forestry and waste, were developed to target sector-specific policies. In power supply and delivery, the plan proposed to introduce zero to low carbon sources of power, while maintaining power grid reliability. Policies include introducing renewable energy standards, expanding the Regional Greenhouse Gas Initiative, GHG emission standards for new power plants, and encouraging the repowering of existing fossil fuel power plants, with a focus on vulnerable coastal zones (New York State Climate Action Plan Interim Report, 2009). A report from Brookhaven National Laboratory (Stokes and Looney, 2010) highlighted the need for New York’s climate plans to be an integrated approach with municipalities and take a bottom up approach. The NY Department of Conservation has started a Climate Smart Communities Pledge program. This program established ten elements including “setting goals, inventory emissions and move to action” and “plan for adaptation to unavoidable climate change.” One hundred and twenty two communities have taken the State’s pledge,
3
Friedman et al.: LI MARKAL: Sustainability, Environmental Justice, and Climate Change
Published by Scholar Commons, 2014
including Suffolk County and 10 of its towns and villages, and 5 towns and villages in Nassau County. Suffolk County’s Climate Smart Community Program includes reducing electricity usage 15% by projected levels in 2015 and identifying critical impact areas such as water supply and sewer infrastructure. The Climate Smart Communities program is handicapped by the failure to include either direct incentives for participating or penalties for failing to meet the program’s guidelines. More detailed goals and policies to attain those goals from both state and local governments would enable further progress to be made on adapting to climate change. By May of 2013, the Cleaner Greener Long Island Regional Sustainability Plan (CGLI) was established by the Cleaner Greener Consortium of Long Island and its partners which included over 800 Long Island leaders. The plan aims to reduce green house gas emissions (described in the plan as a "paramount goal"), improve economic development and housing, as well as deal with energy, transportation, land use, waste management, and water management issues. By using a greenhouse gas inventory established by NYIT (2010) the plan calls for expanded use of food waste biogas, introduction of "solar ready" construction codes, and measures to encourage the use of geothermal heat pumps. The "Energy" section of the plan does call for municipalities to carry out feasibility studies of renewables and promotion of efficiency. The plan however does not explain why each of these goals has been chosen nor do they determine whether these are optimal solutions for the problem of increasing green house gas emission. Another component of sustainability, beyond dealing with climate change, which must be taken into consideration, is environmental justice. The environmental justice movement is generally agreed to have been developed in the United States during the 1970s primarily as a result of racially divided siting of environmental risks, waste management being the major issue (Harvey, 1996; Dobson, 1998; Agyeman, 2002). The United Church of Christ's Commission for Racial Justice report in 1987 pushed environmental justice into the spotlight, with many other papers following it. Bowen (2002) reviewed 42 such environmental justice papers and noted many flaws in statistical analysis and overall methodology. Been (1994) posed an interesting question; what came first, the hazard or the population? But regardless of when these Locally Unwanted Land Uses (LULUs) were established, it is important that no one group feels a disproportionate burden. As Oran Young stated we must "ensure that the rich and powerful do not insulate themselves from environmental harm largely by displacing problems on to the poor and weak.” Environmental justice is not solely about distribution of environmental ills; it is also about participation in the environmental policy making process. This participation can promote policies and actions that link sustainability with
4
Suburban Sustainability, Vol. 2 [2014], Iss. 2, Art. 1
https://scholarcommons.usf.edu/subsust/vol2/iss2/1DOI: http://dx.doi.org/10.5038/2164-0866.2.2.1
environmental justice. Faber and McCarthy (2001) call for “sustainability and environmental protection,” as a means to ensure a more “socially and ecologically just society.” Further, environmental justice is ultimately about sustainability, as environmental justice leaders have fought hard against the label of NIMBYs (Not In My Backyard) and in turn proclaiming themselves NIABYs (Not In Anyone's Backyard) (Dowie, 1995). Of course, this approach can be carried to an extreme, precluding economic development itself: NIMTOO (Not In My Term Of Office); BANANA (Build Absolutely Nothing Anywhere Near Anyone); NOPE (Not On Planet Earth; and CAVEs (Citizens Against Virtually Everything) (Schively, 2007). It is clear that the definition(s) of sustainability, its goals, and the means to reach them are contested (Holling, 2000). Green-washing has been the word coined for describing this disingenuous process of call everything under the sun sustainable. In the words of Parris (2003), sustainability has “broad appeal and little specificity.” Baumgartner and Ebner (2010) noted, "...sustainability issues are pursued more coincidentally than with a clear strategy." And there lies the main problem of the sustainability movement, green-washing has become endemic problem and in many situation has led to very little environmental progress. Although few policy makers would balk at the notion of sustainability, we face ever-growing economic constraints and difficult choices (Hess and Winner, 2007). There is thus a clear need to establish clear, quantifiable sustainability goals and to identify policies and technologies that will enable us to reach these ends.
B. GLOBAL CLIMATE CHANGE AND GREENHOUSE GAS MITIGATION
POLICIES Human demand for energy is clearly and unequivocally intertwined with
many of our most pressing environmental threats. Among these threats, the risk of climate change is perhaps the one that looms largest in the eyes of many scientists and policy makers. Other environmental issues associated with our energy systems, including acid deposition and the dispersion of metals from mining and burning fossil fuels, have an impact at local or regional scales (Johansson and Lundqvist, 1999). Although, there are a number of sources of criteria air pollutants (lead, ozone, particulate matter, carbon monoxide, nitrogen oxides and sulfur dioxide) and greenhouse gases (carbon dioxide, methane, nitrous oxide and fluorinated gases), electric power plants are regarded as the largest single point source (Jeong, et al., 2008). Approximately two-thirds of U.S. fossil fuels (coal, petroleum and natural gas) are used by the U.S. electricity sector, and this share is growing over time (Nagurney, et al., 2006). Although the magnitude of the anthropogenic contribution to global warming is subject to
5
Friedman et al.: LI MARKAL: Sustainability, Environmental Justice, and Climate Change
Published by Scholar Commons, 2014
debate, the basic relationship between the combustion of fossil fuels, the atmospheric concentration of carbon dioxide, and mean global temperature is clear.
Although there are numerous greenhouse gases (GHGs), carbon dioxide is generally targeted because it is a major byproduct of fossil fuel combustion, from which the majority of our electricity generation is derived. In addition, the bulk of the other GHGs are related to the combustion of fossil fuels (Gielen and Kram, 2000). Further, it has been noted that CO2 emissions reductions simultaneously reduces other criteria pollutants such as, SO2, NOx, PM10 (Chen et. al., 2001). Since the non-CO2 emissions are falling below the IPCCs scenarios, the current focus of climate change policy is on carbon dioxide emissions (Hansen, et. al., 2008). Unfortunately, as other GHG rates fall, CO2 emissions are rising at a rate that many models predict can lead to a temperature increase equal in magnitude to the cooling experienced during the last Ice Age. This increase may be responsible for, among other things, coral bleaching, shut down of the ocean’s thermohaline circulation, and rise of sea level (Hoffert, 2002).
The United States Earth Summit (UN Framework Convention on Climate Change, 1992), called for a worldwide stabilization of greenhouse gases as to avoid, “dangerous anthropogenic interference with the climate system.” The 2007 report of the Intergovernmental Panel on Climate Change (IPCC) (Fourth Assessment Report: Climate Change, 2007) concluded: 1, warming of the climate is unequivocal; 2, warming observed since the mid-20th century is likely associated to anthropogenic activity; 3, the probability of this warming being a natural event alone is less than 5%; and 4, the past, current, and future anthropogenic CO2 emissions will continue to contribute to warming for more than a millennium. Some predict a rapid climate change impacting Earth systems within a century or less (Hansen, et. al., 2007) and there is growing realization that an Earth energy balance no longer exists and further warming lies ahead (Hansen, et al, 2005). The most recent (2013) IPCC Report concluded:
1. It is virtually certain that globally the troposphere has warmed since
the mid-20th century.
2. It is virtually certain that global mean sea level rise will continue
beyond 2100, with sea level rise due to thermal expansion to continue
for many centuries.
3. It is extremely likely that human influence has been the dominant
cause of the observed warming since the mid-20th century (Alexander, et al, 2013).
6
Suburban Sustainability, Vol. 2 [2014], Iss. 2, Art. 1
https://scholarcommons.usf.edu/subsust/vol2/iss2/1DOI: http://dx.doi.org/10.5038/2164-0866.2.2.1
In response to these potential issues, many politicians, scientists and industrial leaders, such as Exxon Mobil CEO Rex Tillersin3, have called for action. Regardless of what is decided, it is likely that the new legislation will be more stringent than predecessors such as the 1990 Clean Air Act, or international accords, such as Kyoto. A wide range of proposals to impose mandatory caps on U.S. greenhouse gas emissions have been introduced in the U.S. Congress (Paltsev et al., 2007). Although the prospects for action at the national level are uncertain, other programs have been introduced by state governments, acting individually and in concert with their neighbors4. Recently, the United Nations Climate Change Conference 2009 (COP15) has concluded with mixed outcomes. A Copenhagen Accord has been established which seeks to enact a Copenhagen Green Climate Fund. Among other policies the Accord seeks to cap temperature rise to 2°C and reduce CO2 emissions. II. ABOUT THE MARKAL MODEL
MARKAL is an integrated energy systems analysis methodology used to design optimal strategies for long-term energy security, climate change mitigation and environmental sustainability at local, regional and national scales by nearly 100 institutions in more than 55 countries. The methodology comprehensively evaluates costs and benefits of alternative technology and resource use options to aid effective decision making. It identifies interdependencies of various energy sub-systems (including energy supply, production, distribution and consumption technologies and alternatives and comprehensively analyzes the behavior of the entire energy system for long-term planning. MARKAL is a bottom up linear programming model that captures interactions and potential substitutions between energy forms and technologies, from conventional energy resources such as oil and natural gas to renewable energy sources such as wind and solar. Policy instruments, ranging from pollution taxes, emissions caps, and renewable energy portfolio standards, are incorporated within MARKAL as constraints; the model chooses the optimal (cost-minimizing) set of technologies subject to a specified set of constraints (Loulou, et al, 2004). MARKAL has found a range of technology and policy applications, including the determination of least-cost energy systems subject to energy and environmental policies such as: 1, restrictions on emissions; 2, required use of renewable energy resources; and 3, the introduction of energy regulations, taxes, and subsidies.
3 Rex Tillersin called on Congress to enact a “lucient” and efficient carbon tax. (Gold and Talley, 2009)
4 Examples of these regional actions include the Regional Greenhouse Gas Initiative (RGGI) and Western Regional Climate Action Initiative (WRCAI).
7
Friedman et al.: LI MARKAL: Sustainability, Environmental Justice, and Climate Change
Published by Scholar Commons, 2014
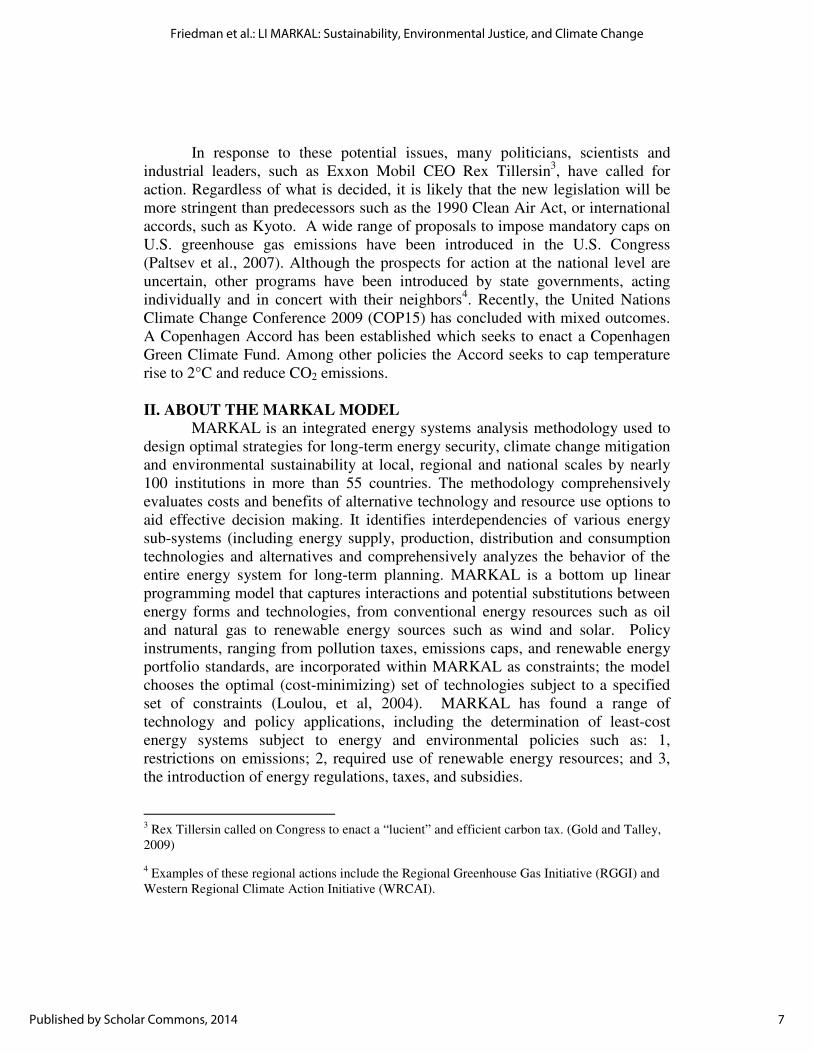
The economic and environmental impact of proposed energy technologand policy instruments will be estimated with respect to a baseline, “businessusual” scenario. This baseline represents the modeler's best projection of energy use and emissions over the planning horizon (generally short term, 5 years to long term, 50 years). The structure of this model is captured by the MARKAL Reference Energy System (Figure 1). The Reference Energy System (RES) requires input data from primary energy supply (e.g., natural gas), intermediate conversion and process (e.g., electricirefrigerator) that satisfy energy service demands (e.g., home appliances). Every component in the RES is characterized by three groups of data: technical (e.g., efficiency), economic (e.g., capital cost), and emission coefficient) (Friedman and Klein, 2010).
Figure 1: Long Island Reference Energy System III. APPLICATIONS OF THE MARKAL MODEL: SUSTAINABILITY
PLANNING, ENVIRONMENTAL JUSTICE, AND ADAPTATION TO
CLIMATE CHANGE
Once the base case has been established, scenarios called for in sustainability plans, investigations of environmental justice, and responses to climate change, can be run and analyzed. This section discusses applications of the MARKAL model to address these impo Carbon Tax or Cap and Trade policies:
Both carbon dioxide emissions taxes and caps have been proposed as methods for mitigating the effects of global climate change. A wide range of proposals to impose mandatory caps on U.S. green
The economic and environmental impact of proposed energy technologand policy instruments will be estimated with respect to a baseline, “businessusual” scenario. This baseline represents the modeler's best projection of energy use and emissions over the planning horizon (generally short term, 5 years to long
50 years). The structure of this model is captured by the MARKAL Reference Energy System (Figure 1). The Reference Energy System (RES) requires input data from primary energy supply (e.g., natural gas), intermediate conversion and process (e.g., electricity generation), to end-use technologies (e.g., refrigerator) that satisfy energy service demands (e.g., home appliances). Every component in the RES is characterized by three groups of data: technical (e.g., efficiency), economic (e.g., capital cost), and environmental (e.g., carbon emission coefficient) (Friedman and Klein, 2010).
Figure 1: Long Island Reference Energy System
III. APPLICATIONS OF THE MARKAL MODEL: SUSTAINABILITY
PLANNING, ENVIRONMENTAL JUSTICE, AND ADAPTATION TO
e base case has been established, scenarios called for in sustainability plans, investigations of environmental justice, and responses to climate change, can be run and analyzed. This section discusses applications of the MARKAL model to address these important policy issues.
Carbon Tax or Cap and Trade policies:
Both carbon dioxide emissions taxes and caps have been proposed as methods for mitigating the effects of global climate change. A wide range of proposals to impose mandatory caps on U.S. greenhouse gas emissions have been
The economic and environmental impact of proposed energy technologies and policy instruments will be estimated with respect to a baseline, “business-as-usual” scenario. This baseline represents the modeler's best projection of energy use and emissions over the planning horizon (generally short term, 5 years to long
50 years). The structure of this model is captured by the MARKAL Reference Energy System (Figure 1). The Reference Energy System (RES) requires input data from primary energy supply (e.g., natural gas), intermediate
use technologies (e.g., refrigerator) that satisfy energy service demands (e.g., home appliances). Every component in the RES is characterized by three groups of data: technical (e.g.,
environmental (e.g., carbon
III. APPLICATIONS OF THE MARKAL MODEL: SUSTAINABILITY
PLANNING, ENVIRONMENTAL JUSTICE, AND ADAPTATION TO
e base case has been established, scenarios called for in sustainability plans, investigations of environmental justice, and responses to climate change, can be run and analyzed. This section discusses applications of the MARKAL
Both carbon dioxide emissions taxes and caps have been proposed as methods for mitigating the effects of global climate change. A wide range of
house gas emissions have been
8
Suburban Sustainability, Vol. 2 [2014], Iss. 2, Art. 1
https://scholarcommons.usf.edu/subsust/vol2/iss2/1DOI: http://dx.doi.org/10.5038/2164-0866.2.2.1
introduced in the U.S. Congress (Paltsev et al., 2008). A carbon tax on carbon dioxide emissions could be somewhat simply implemented into MARKAL, as carbon content of fossil fuels used are easy to calculate and trace (Fullerton, 2001). The burden of such a tax would be distributed over all areas (residential, commercial, industrial, etc.) and will help environmental protection (Pehlivan and Demirbas, 2008). By raising the variable costs of producing electricity from fossil fuels an incentive will be established to shift towards cleaner technologies (Green, 2008).
On January 1, 1991, Sweden enacted a carbon tax, $100 per ton, on the use of fossil fuels. In this case the tax was neither broadly based nor equally distributed. For political reasons, industrial users paid between a quarter and half the rate while certain high-energy industries (mining, manufacturing and the pulp and paper industry) were exempted from these taxes. In 1997 the rate was raised to $150 per ton of CO2 released (Brannlund, 1999; Brannlund and Gren, 1999; Ekins, 1996). Although this type of treatment may not be politically acceptable in this country, it illustrates the flexibility of the carbon tax. The MARKAL model can accommodate these sector-specific tax policies. There have been numerous assessments of the impacts of carbon taxes at the national level. Jeong, et al (2008) investigated a carbon tax on Korea’s utilities comparing coal and LNG in the presence of a carbon tax. Masui, et al (2006) investigated a carbon tax in Japan, as a mechanism to achieve a 2% CO2 reduction of 1990 emissions, in order to comply with Kyoto targets. The MARKAL model can accommodate both emissions caps and taxes. We have characterized a carbon tax scenario using the Long Island MARKAL model. Results of this scenario can be used to determine carbon emissions and costs, and to assess the impact of 0and have been used to examine environmental justice issues. As seen by the Long Island MARKAL model, the presence of a carbon tax leads to the closing of a heavily polluted central power plant and calls for smaller cleaner distributed electricity generation, thus reducing the impacts on one group (Friedman, Klein, and Sun, 2012). Minimum Renewable Portfolio Standards:
Another possible policy scenario could be the implementation of minimum renewable energy sources, as per the NYS Renewable Energy Portfolio Standard (RPS). According to NYS Public Service commission mandate, enacted by Governor Paterson by 2015, 30% of all retail electricity must be from renewable sources (http://www.nyserda.org/rps/index.asp). This number was increased from a previous level of 25% by 2013. MARKAL allows for analyzing the impacts of minimum renewables by incorporating a constraint equal to the desired minimum renewable and defining each electricity generating technology as renewable or non renewable. The model is flexible in allowing the standard to
9
Friedman et al.: LI MARKAL: Sustainability, Environmental Justice, and Climate Change
Published by Scholar Commons, 2014
change over time, for example, 25% renewable by 2013 and 30% renewable by 2015. This is frequently done in MARKAL models, but has yet to be carried out in regards to a specific sustainability plan.
Efficiency Standards:
Goals for market penetration of new efficient goods, legal changes such as banning incandescent light bulbs, or mandating standard minimum efficiencies for various demand devices: MARKAL is a bottom up model and as such great detail can be included in the demand side of the problem. Demand devices or end use devices, such as specific types of lighting or air conditioning, can be specified by the model. Newer, more efficient devices may be included into the analysis with set market penetrations going forward in time. Further, the elimination of various types of technologies may be analyzed, such as phasing out incandescent light bulbs, as is being done in the European Union (European Commission on Energy) and in California (AB 1109, signed into law October 12, 2007). By establishing sustainability plans and analyzing the results with MARKAL, it is possible to determine the impacts on vulnerable populations, such as the elderly, infants and children, low-income and minority populations, and asthma and heart-disease patients. A reduction in peak electricity demand may reduce the need for heavily-polluting peaking plants, thus improving air quality in adjacent communities. Similarly, the displacement of current transportation technologies by cleaner ones (e.g., hybrid, diesel, clean diesel, natural gas, etc), one could improve ambient air quality in urban asthma hot spots. By improving sustainability, the economy, environment, and equity of a region improve (Campbell, 1996). Unfortunately, few cities or regions combine environmental justice with sustainability (Warner, 2002). MARKAL provides the analytical framework to characterize these technology and policy changes. IV. The Long Island MARKAL: Results and Future Work
The regional impacts of a national policy change, in the form of a carbon tax, have been examined by the Long Island MARKAL. Using the baseline LI MARKAL, two possible carbon tax scenarios were established and analyzed. The first scenario was a $10 per ton CO2 flat tax initiated in 2010. The second scenario was a tax that begins at $10 per ton in 2010, increasing $10 per ton over a period of 9 years, and then held constant at $100 per ton over the planning horizon. We find that a flat $10 tax reduces electricity sector costs by 3.1%, and CO2 emissions by 6.4%, relative to the base or business as usual scenario. These economic and environmental impacts have social and environmental justice implications as well. The reduced reliance on older, dirtier power plants means certain communities, and, in particular, vulnerable populations, will be less
10
Suburban Sustainability, Vol. 2 [2014], Iss. 2, Art. 1
https://scholarcommons.usf.edu/subsust/vol2/iss2/1DOI: http://dx.doi.org/10.5038/2164-0866.2.2.1
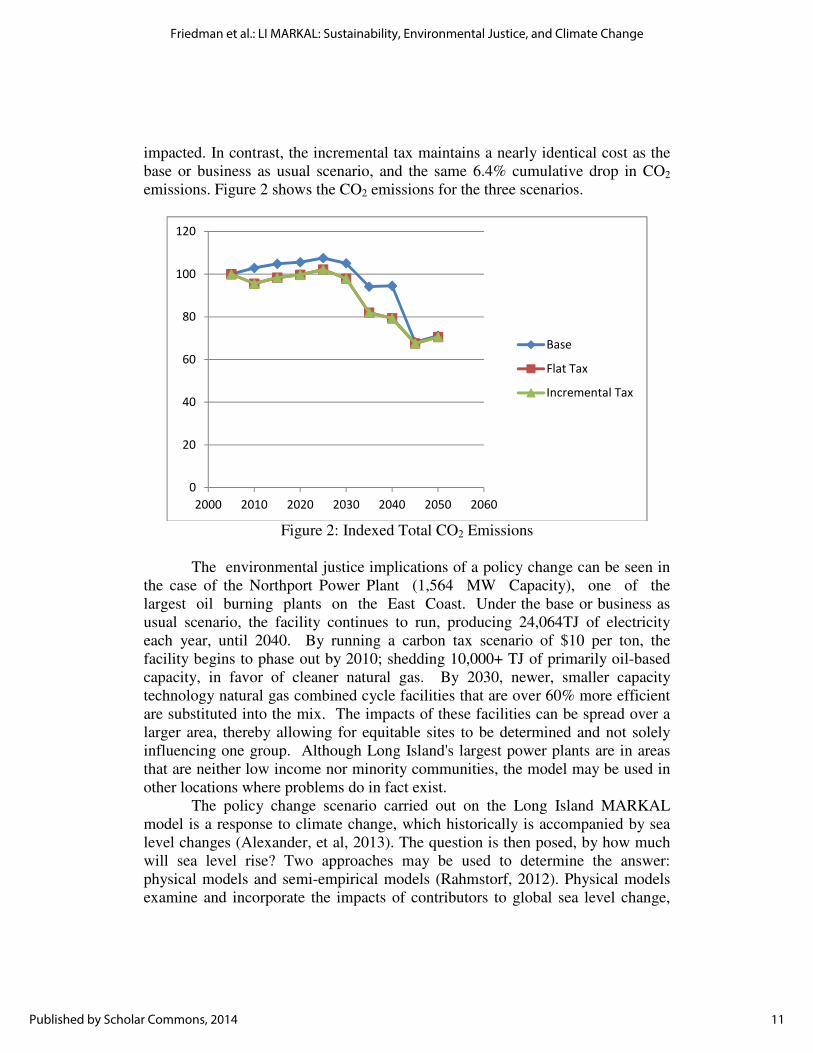
impacted. In contrast, the incremental tax maintains a nearly identical cost as the base or business as usual scenario, and the same 6.4% cumulative drop in CO2 emissions. Figure 2 shows the CO2 emissions for the three scenarios.
Figure 2: Indexed Total CO2 Emissions
The environmental justice implications of a policy change can be seen in
the case of the Northport Power Plant (1,564 MW Capacity), one of the largest oil burning plants on the East Coast. Under the base or business as usual scenario, the facility continues to run, producing 24,064TJ of electricity each year, until 2040. By running a carbon tax scenario of $10 per ton, the facility begins to phase out by 2010; shedding 10,000+ TJ of primarily oil-based capacity, in favor of cleaner natural gas. By 2030, newer, smaller capacity technology natural gas combined cycle facilities that are over 60% more efficient are substituted into the mix. The impacts of these facilities can be spread over a larger area, thereby allowing for equitable sites to be determined and not solely influencing one group. Although Long Island's largest power plants are in areas that are neither low income nor minority communities, the model may be used in other locations where problems do in fact exist.
The policy change scenario carried out on the Long Island MARKAL model is a response to climate change, which historically is accompanied by sea level changes (Alexander, et al, 2013). The question is then posed, by how much will sea level rise? Two approaches may be used to determine the answer: physical models and semi-empirical models (Rahmstorf, 2012). Physical models examine and incorporate the impacts of contributors to global sea level change,
0
20
40
60
80
100
120
2000 2010 2020 2030 2040 2050 2060
Base
Flat Tax
Incremental Tax
11
Friedman et al.: LI MARKAL: Sustainability, Environmental Justice, and Climate Change
Published by Scholar Commons, 2014

including: thermal expansion, addition of water mass, and changing depths of ocean basins. Unfortunately when modeled components are summed, the results fall short of recently observed sea level rise (Rahmstorf, et al, 2007). Semi-empirical models are used to predict future trends by linking observed sea level changes and observed global temperature changes. These models reproduce past sea level rise, but cannot definitively ensure what was observed in the past will hold true going forward (Rahmstorf, 2012). Locally, sea level change may deviate from global changes for many reasons, including: winds, gravitational pull, and vertical land movement (Rahmstorf, 2012). As temperatures rise there will lead to serious ramifications for low lying coastal communities (Nicholls and Cazenave, 2010). Citizens, governments, and policy makers need to understand the potential impacts that may result from climate change in order to protect their communities (Slangen, et al, 2012). Superstorm Sandy Impact on Long Island:
Low lying areas, such as the South Shore of Long Island, which was greatly impacted by Tropical Storm Irene in 2011 and Super Storm Sandy in 2012, pose interesting case studies for the benefits of improved planning. Had the region been better prepared, damage may have been mitigated and electricity restored more quickly. Sandy showed us that flooding of power plants may become the "new normal". It is likely that if global temperatures and sea level continue to rise, regions like this will suffer the same fate going forward. MARKAL may be used to study the impacts of loss of generation from power plants that will be impacted by sea level rise. On Long Island, they may include power plants like E.F. Barrett, a 362 MW natural gas/oil fired electricity generating facility (Kimble, 2009), which was greatly damaged by Sandy. Long Island’s Power Sector Vulnerability:
According to the report, “Synthesis of Climate Change Drives and Responses in Long Island Sound”, the Intergovernmental Panel on Climate Change(IPCC) predicts seal level rise will be up to 2 feet by 2100 and particular locations such New York will be more impacted than other locations. In particular, the south shore areas of Long Island will be more vulnerable to sea level rise because the land elevation in the south shore is lower. In Figure 3, the map depicts the locations of power plants throughout Long Island. The table provides place name locations and elevations. The power plants are typically clustered near the north or south shore of the island to take advantage of the water intakes from the ocean. Out of the many power stations on Long Island, five represent a substantial slice of the power generation for the
12
Suburban Sustainability, Vol. 2 [2014], Iss. 2, Art. 1
https://scholarcommons.usf.edu/subsust/vol2/iss2/1DOI: http://dx.doi.org/10.5038/2164-0866.2.2.1
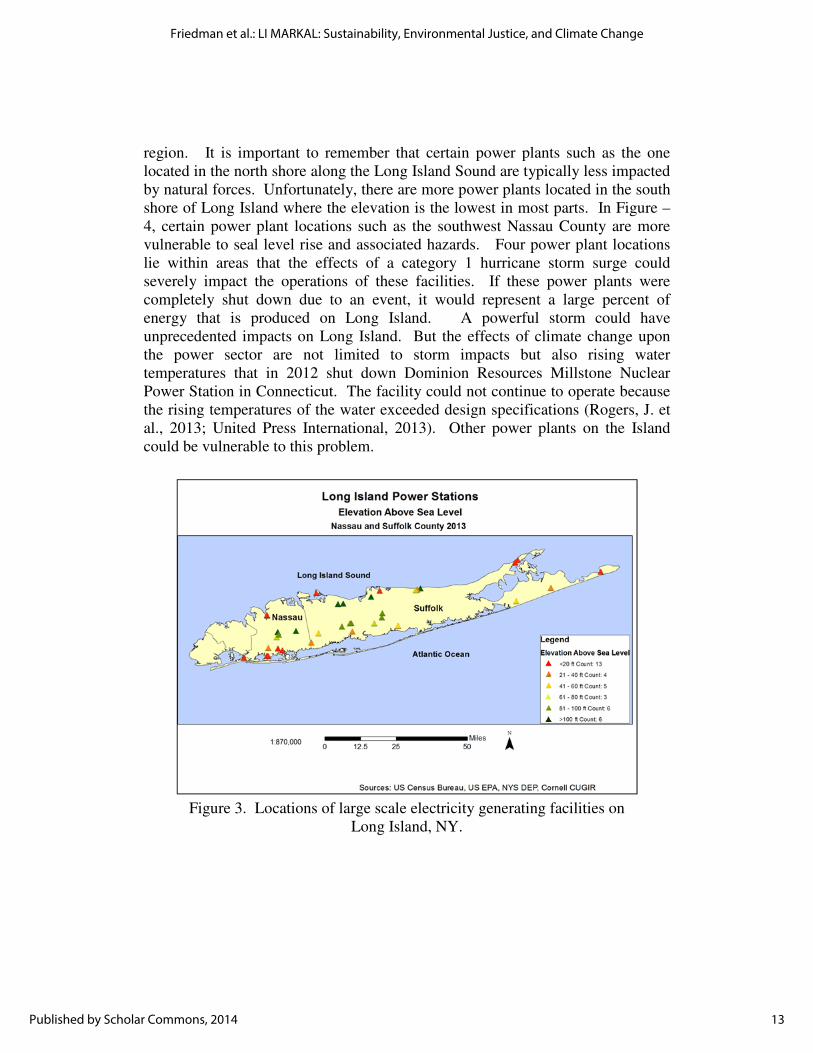
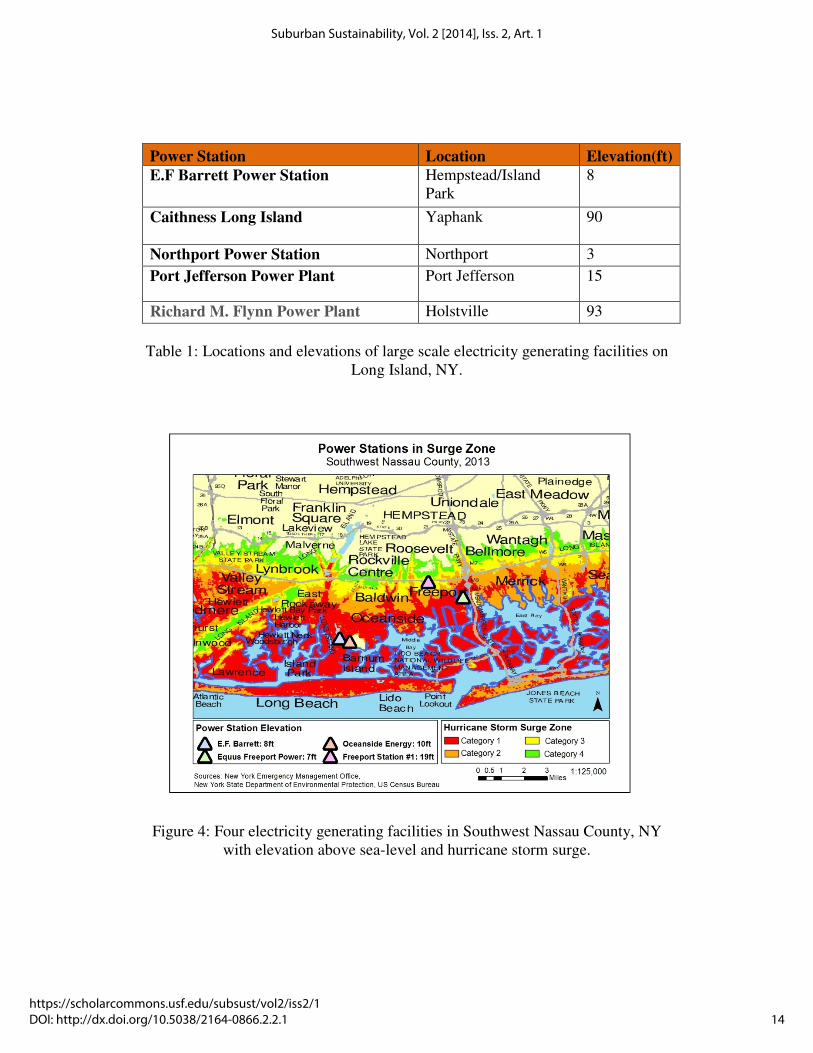
region. It is important to remember that certain power plants such as the one located in the north shore along the Long Island Sound are typically less impacted by natural forces. Unfortunately, there are more power plants located in the south shore of Long Island where the elevation is the lowest in most parts. In Figure – 4, certain power plant locations such as the southwest Nassau County are more vulnerable to seal level rise and associated hazards. Four power plant locations lie within areas that the effects of a category 1 hurricane storm surge could severely impact the operations of these facilities. If these power plants were completely shut down due to an event, it would represent a large percent of energy that is produced on Long Island. A powerful storm could have unprecedented impacts on Long Island. But the effects of climate change upon the power sector are not limited to storm impacts but also rising water temperatures that in 2012 shut down Dominion Resources Millstone Nuclear Power Station in Connecticut. The facility could not continue to operate because the rising temperatures of the water exceeded design specifications (Rogers, J. et al., 2013; United Press International, 2013). Other power plants on the Island could be vulnerable to this problem.
Figure 3. Locations of large scale electricity generating facilities on
Long Island, NY.
13
Friedman et al.: LI MARKAL: Sustainability, Environmental Justice, and Climate Change
Published by Scholar Commons, 2014
Power Station Location Elevation(ft)
E.F Barrett Power Station Hempstead/Island Park
8
Caithness Long Island Yaphank 90
Northport Power Station Northport 3
Port Jefferson Power Plant Port Jefferson 15
Richard M. Flynn Power Plant Holstville 93
Table 1: Locations and elevations of large scale electricity generating facilities on
Long Island, NY.
Figure 4: Four electricity generating facilities in Southwest Nassau County, NY with elevation above sea-level and hurricane storm surge.
14
Suburban Sustainability, Vol. 2 [2014], Iss. 2, Art. 1
https://scholarcommons.usf.edu/subsust/vol2/iss2/1DOI: http://dx.doi.org/10.5038/2164-0866.2.2.1

MARKAL is an instrumental tool that could be utilized to model the impacts of the closure of these power plants over a period of time if they are susceptible to storms. Presently, regional energy plans specific to Long Island do not take into account the effects of Climate Change upon the power sector. Therefore, it is important to understand the ramifications to the environment, economy and social impacts of the elimination of a power plant. Furthermore, new plans have to be drafted to increase the energy supply for the region. In this case scenario, the elimination of power plants would likely cause the price of electricity to rise compared to the current costs and emissions would likely rise, at least short term, as smaller less efficient plants quickly replace other facilities. Other power plant facilities would also likely have to increase their power production to satisfy future energy consumption. And from a social perspective, the closure of these power plants would reduce the exposure of emissions from this area but it would increase it in other locations.
Therefore, sustainability objectives are not limited to energy production but have far ranging impacts. The closure of these plants would change the energy production pattern for the area and could lead to the reduction of emissions for certain communities. From an environmental justice perspective, the elimination of these power plants that produce harmful emissions would be another reason that sustainability should take more into account climate change effects. From 2000 to 2002, new energy infrastructures that were installed were placed in low-income communities and minority communities (New York State Department of Environmental Conservation, 2009). The most vulnerable climate change infrastructure could be replaced with energy production that is cleaner and less vulnerable to storms.
V. Acknowledgement
Partial funding for this research was provided by NOAA-Crest at City College of New York.
15
Friedman et al.: LI MARKAL: Sustainability, Environmental Justice, and Climate Change
Published by Scholar Commons, 2014
VI. References
AECOM. Cleaner Greener Long Island Regional Sustainability Plan. May 2013. https://www.nyserda.ny.gov/-/media/Files/About/Statewide-Initiatives/CGC-Plans/Long-Island-CGC-Plan-Report.pdf
Agyeman, J. (2002). Constructing Environmental (in) Justice: Transatlantic Tales. Environmental Politics, Vol. 11 (3), 31-53. <http://www.tandfonline.com/doi/abs/10.1080/714000627#.UidUsca-k4k> Retrieved 2013-02-05. Alexander, et al. (2013). Working Group I Contribution to the IPCC Fifth Assessment Report on Climate Change 2013: The Physical Science Basis Report Summary for Policymakers. <http://www.climatechange2013.org/images/uploads/WGIAR5-SPM_Approved27Sep2013.pdf> Retrieved 2013-10-10.
Ballou, B., Heitger, D., and Landes, C. (2006) The Future of Corporate Sustainability Reporting. Journal of Accountancy. <http://www.journalofaccountancy.com/Issues/2006/Dec/TheFutureOfCorporateSustainabilityReporting> Retrieved on: 2013-02-28. Baltimore City Planning Commission (2009). The Baltimore Sustainability Plan. <http://www.baltimorecity.gov/Portals/0/agencies/planning/sustainability/public%20downloads/051509_BCS-001SustainabilityReport.pdf > Retrieved 2013-02-04. Baumgartner, R. J., and Ebner, D. (2010) Corporate Sustainability Strategies: Sustainability Profiles and Maturity Levels. Sustainable Development. Vol. 18. pp. 76-89.
Brannlund, R. (1999). The Swedish Green Tax Commission. Green Taxes: Economic Theory and Empirical Evidence from Scandinavia. New Horizons in
Environmental Economics, Edward Elgar Publishing Limited, pp. 23-32.
Brannlund, R. and Gren, I. (1999). Green Taxes in Sweden: A Partial Equilibrium Analysis of the Carbon Tax and the Tax on Nitrogen and Fertilizers. Green Taxes: Economic Theory and Empirical Evidence from Scandinavia. New Horizons in
Environmental Economics, Edward Elgar Publishing Limited, pp. 109-136.
Campbell, S. (1996). Green Cities, Growing Cities, Just Cities?: Urban Planning and the Contradictions of Sustainable Development. Journal of the American
16
Suburban Sustainability, Vol. 2 [2014], Iss. 2, Art. 1
https://scholarcommons.usf.edu/subsust/vol2/iss2/1DOI: http://dx.doi.org/10.5038/2164-0866.2.2.1
Planning Association, Vol. 62 (3), 296-312 < http://www-personal.umich.edu/~sdcamp/Ecoeco/Greencities.html> Retrieved on 2013-02-01.
Chen et. al. (2001). Assessing the potential for the stomatal characters of extant and fossil Ginkgo leaves to signal atmospheric CO2 change. American Journal of
Botany, Vol. 88 (7), 1309-1315 < http://www.amjbot.org/content/88/7/1309.full> Retrieved on 2013-02-01.
Dobson, A. (1998). Justice and the Environment: Conceptions of Environmental Sustainability and Dimensions of Social Justice. Oxford University Press. Oxford, UK.
Dovers, S. (1989). Sustainability: definitions, clarifications and contexts. Development, (2/3), 33-36.
Dowie, M. (1995). Losing Ground: American Environmentalism at the Close of the Twentieth Century. The MIT Press, Cambridge, MA, USA. Dunham-Jones, E. (2005). Suburban Retrofits, Demographics and Sustainability. Places: Forum of Design for the Public Realm, Vol. 17 (2), 8-19. <http://escholarship.org/uc/item/7758q0hf#page-1> Retrieved on 2013-02-01.
Elkington, J. (1998). Cannibals with forks: The triple bottom line of 21st century business. Gabriola Island, BC: New Society Publishers.
Ekins, P. (1996). Environmental Taxes & Charges : National Experiences & Plans. Report of the European Workshop held at the Foundation, Dublin, on 7-8 February 1996, Loughlinstown, Co., Dublin, Ireland. < http://www.eurofound.europa.eu/pubdocs/1997/01/en/1/wp9701en.pdf> Retrieved 2013-02-03.
Faber, N., Jorna, R., & Van Engelen, J. (2005). The Sustainability of "Sustainability"—A Study Into The Conceptual Foundations Of The Notion Of" Sustainability". Journal of Environmental Assessment Policy and Management, 7(01), 1-33. < http://www.sustainableorganizations.org/Sustainability-of-Sustainability.pdf> Retrieved 2013-02-05.
Friedman, D. and Klein, Y. (2010). Urban/Suburban Sustainability Planning: MARKAL as an Analytical Tool. Middle States Geographer, Vol. 43, 1-7. < http://www.msaag.org/wp-content/uploads/2013/04/1-MSG-2010-Friedman-Klein.pdf> Retrieved on 2013-02-01.
17
Friedman et al.: LI MARKAL: Sustainability, Environmental Justice, and Climate Change
Published by Scholar Commons, 2014

Friedman, D., Klein, Y., and Sun, G. (2012). Environmental and economic impacts of a carbon tax: An application of the Long Island MARKAL model. Middle States Geographer , Vol. 45, 18-26. < http://www.msaag.org/wp-content/uploads/2013/04/3-Friedman-et-al-MSG-442012F.pdf> Retrieved on 2013-02-01.
Fullerton, D. (2001). A Framework to Compare Environmental Policies. Southern
Economic Journal, Vol. 68 (2), 224-248. < http://www.nber.org/papers/w8420> Retrieved 2013-02-04.
Gielen, D. and Kram, T. (2000). The role of Kyoto mechanisms: results from MARKAL analysis. Paper prepared for “Climate negotiations and Emissions Trading. Economic insights from European models.” Brussels, 29-30 August 2000. < http://webu2.upmf-grenoble.fr/iepe/techmeet/TMtext/GIELENpap.PDF> Retrieved on 2013-02-04.
Gladwin, et al. (1995). Shifting Paradigms for Sustainable Development: Implications for Management Theory and Research. The Academy of
Management Review, Vol. 20 (4), 874-907. <https://sustainability.water.ca.gov/documents/18/3407876/shifting+paradigms+of+sustainable+development.pdf> Retrieved 2013-02-08. Glavič, P., & Lukman, R. (2007). Review of sustainability terms and their definitions. Journal of Cleaner Production, 15(18), 1875-1885. Green, R. (2008). Carbon Tax or Carbon Permits: The Impact on Generators’ Risks. The Energy Journal. Vol. 29 (3), 67-89. < ftp://ftp.bham.ac.uk/pub/RePEc/pdf/RGreen.pdf> Retrieved 2013-02-04. Hansen, J. et al. (2005). Earth’s energy imbalance: Confirmation and implications. Science. Vol. 308, 1431-1435. < http://www.sciencemag.org/content/308/5727/1431.short> Retrieved 2013-02-04. Hansen J. et al. (2007). Climate change and trace gases. Phil. Trans R. Soc. A, Vol. 365, 1925-1954. < http://rsta.royalsocietypublishing.org/content/365/1856/1925.short> Retrieved 2013-02-02. Hansen, J. et al. (2008). Target Atmospheric CO2: Where Should Humanity Aim? The Open Atmospheric Science Journal, Vol. 2, 217-231. < http://arxiv.org/ftp/arxiv/papers/0804/0804.1126.pdf> Retrieved 2013-02-01.
18
Suburban Sustainability, Vol. 2 [2014], Iss. 2, Art. 1
https://scholarcommons.usf.edu/subsust/vol2/iss2/1DOI: http://dx.doi.org/10.5038/2164-0866.2.2.1
Harvey, D. (1996). Justice, Nature and the Geography of Difference. Blackwell Publishers Inc. Malden, MA, USA and Oxford, UK.
Hess, D. and Winner, L. (2007). Enhancing Justice and Sustainability at the Local Level: Affordable Policies for Urban Governments. Local Environment, Vol. 12 (4) 379-395.< http://www.davidjhess.org/PolicyPaper.pdf> Retrieved 2013-02-04.
Hoffert, et al. 2002. Advanced Technology Paths to Global Stability: Energy for a Greenhouse Planet. Science. Vol. 298: 5595, 981-987. <http://www.atmos.washington.edu/2009Q1/111/Readings/Hoffert2002_world_energy_needs.pdf> Retrieved 2013-02-01. Holling, C. S. (2000). Theories for Sustainable Futures. Conservation Ecology Vol. 4(2): 7. <http://www.consecol.org/vol4/iss2/art7/> Retreived on 2013-02-01. Home Performance Resource Center. Best Practices for Energy Retrofit Program Design. Case Study: Long Island Green Homes. March 2010. http://www.hprcenter.org/sites/default/files/ec_pro/hprcenter/best_practices_case_study_long_island.pdf
IPCC, (2007). Summary for Policymakers. In: Climate Change 2007: The Physical Science Basis. Contribution of Working Group I to the Fourth Assessment Report of the Intergovernmental Panel on Climate Change. Cambridge University Press, Cambridge, United Kingdom and New York, NY, USA. < http://www.slvwd.com/agendas/Full/2007/06-07-07/Item%2010b.pdf> Retrieved on 2013-02-02.
Jeong et al. (2008). Economic comparison between coal-fired and liquefied natural gas combined cycle power plants considering carbon tax: Korean case: Korean case. Energy, Vol. 33 (8), 1320-1330. <http://www.sciencedirect.com/science/article/pii/S0360544208000650> Retrieved 2013-02-03. Jennings, P. and Zandbergen, P. (1995) Ecologically sustainable organizations: An institutional approach. Academy of Management Review, Vol. 20 (4), 1015-1052. <http://www.jstor.org/discover/10.2307/258964?uid=3739832&uid=2&uid=4&uid=3739256&sid=21102618840463> Retrieved 2013-02-05.
Johansson, J. and Lundqvist, U. (1999). Estimating Swedish biomass energy. Biomass and Bioenergy, Vol. 17 (2), 85-93.
19
Friedman et al.: LI MARKAL: Sustainability, Environmental Justice, and Climate Change
Published by Scholar Commons, 2014
<http://www.sciencedirect.com/science/article/pii/S0961953499000343> Retrieved 2013-02-04. Keyspan Energy Inc. Port Jefferson Power Station Wharf Facility. FindtheBest. Retrieved 9, 2014 http://seaport.findthebest.com/l/28109/Keyspan-Energy-Inc-Port-Jefferson-Power-Station-Wharf
Kimble, C. (2009, October). SPDES Fact Sheet Narrative: National Grid – E.F. Barrett Power Station. <http://www.dec.ny.gov/docs/permits_ej_operations_pdf/barrettfctsh.pdf> Retrieved 2013-02-05.
LeBaron, Robin & Rinaldi, Kara. 2010. National Home Performance Council. Residential Energy Efficiency Retrofit Programs in the U.S. http://www.nhpci.org/images/NHPC_WHRetrofitReport_201012.pdf
Long Island Carbon Footprint Project, 2005-2010 Comparison. February 2013, NYIT.
Long Island Green Homes. http://www.longislandgreenhomes.org/
Loulou et al. (2004) Documentation for the MARKAL Family of Models. IEA
Energy Technology Systems Analysis Programme. Paris. <http://www.eprc.re.kr/upload_dir/board/996338814c4ce3d49fd7c.pdf> Retrieved 2013-02-05. Nagurney et al. (2006). Optimal Endogenous Carbon Taxes for Electric Power Supply Chains with Power Plants. Mathematical and Computer Modeling, Vol. 44, 899-916. < http://supernet.isenberg.umass.edu/articles/nagurneyliuwoolley.pdf> Retrieved 2013-02-04. National Grid EF Barrett Power Station. November 8, 2013. Retrieved May 9, 2014 http://data.rtknet.org/tri/tri.php?reptype=f&database=tri&facility_name=&facility_id=11558FBRRTMCCAR&city=&state=&reporting_year=2005&first_year_range=&last_year_range=&detail=3&dbtype=C&sortp=D&datype=T&email=&esubj=
New York City Office of Long-Term Planning and Sustainability (OLTPS). PlaNYC: Sustainability Indicators.
20
Suburban Sustainability, Vol. 2 [2014], Iss. 2, Art. 1
https://scholarcommons.usf.edu/subsust/vol2/iss2/1DOI: http://dx.doi.org/10.5038/2164-0866.2.2.1
<http://www.nyc.gov/html/planyc2030/html/theplan/sustainability.shtml> Retrieved 2013-02-07.
New York Department of Environmental Conservation. Climate Smart Communities: Local Action to Combat Climate Change. http://www.dec.ny.gov/energy/50845.html
New York State Department of Environmental Conservation (NYSDEC) (2009). Environmental Justice Issue Brief: New York State Energy Plan 2009. <http://www.nysenergyplan.com/Prior-State-Energy-Plans/-/media/nysenergyplan/final/Environmental_Justice_IB.pdf> Retrieved 2013-03-01. New York State Department of Environmental Conservation. Executive Summary: New York State Climate Action Plan Interim Report. http://www.dec.ny.gov/docs/administration_pdf/irexecsumm.pdf
New York State Energy Research and Development Authority (NYSERDA). New York Renewable Portfolio Standard. < http://www.nyserda.org/rps/> Accessed 2013-02-03
Paltsev et al. (2007). Assessment of U.S. Cap-and-trade Proposals. MIT Joint Program on the Science and Policy of Global Change, Report 146, Cambridge, MA. National Bureau of Economic Research (NBER), Working Paper 13176, Cambridge, MA. < http://www.nber.org/papers/w13176> Retrieved 2013-02-03.
Paltsev, et al. (2008). Assessment of U.S. GHG Cap-and-Trade Proposals. Climate Policy, Vol. 8(4), 395-420. < http://web.mit.edu/globalchange/www/MITJPSPGC_Rpt146.pdf> Retrieved 2013-02-02.
Pehlivan, O. and Demirbas, A. (2007). Energy Economy, Energy Policy, and Energy/Carbon Taxes of Turkey. Energy Sources, Part B, Vol. 3 (1), 26-40. < http://www.tandfonline.com/doi/abs/10.1080/15567240600814862#.UidfCMa-k4k> Retrieved 2013-02-05.
Permit Review Report, Janury 1st 2012, Department of Environmental Conservation. Retrieved May 9, 2014. http://www.dec.ny.gov/dardata/boss/afs/permits/prr_147220442600007.pdf
Portney, K. E. (2003). Taking Sustainable Cities Seriously: Economic Development, the Environment, and Quality of Life in American Cities. The MIT Press, Cambridge, MA, USA.
21
Friedman et al.: LI MARKAL: Sustainability, Environmental Justice, and Climate Change
Published by Scholar Commons, 2014
Portney, K. E. (2005). Civic Engagement and Sustainability in the United States. Public Administration Review, Vol. 65 (5), 579-591. < http://ase.tufts.edu/polsci/faculty/portney/PARarticle.pdf> Retrieved 2013-02-04. Rahmstorf, S. (2007). A Semi-Empirical Approach to Projecting Future Sea-Level Rise. Science, Vol. 315, 368-370. < http://www.sciencemag.org/content/315/5810/368.short> Retrieved 2013-02-03. Rahmstorf, S. (2012). Modeling Sea Level Rise. Nature Education Knowledge, Vol. 3 (10):4. < http://www.nature.com/scitable/knowledge/library/modeling-sea-level-rise-25857988> Retrieved 2013-02-03.
Rogers, J. et al. (2013) Water-Smart Power: Strengthening the U.S. Electricity System in a Warming World. Energy and Water in a Warming World Initiative. Cambridge, MA: Union of Concerned Scientists. <http://www.ucsusa.org/assets/documents/clean_energy/Water-Smart-Power-Full-Report.pdf> Retrieved 2013-08-05.
Schaefer, A. (2004). Corporate Sustainability – integrating environmental and social concerns? Corporate Social Responsibility and Environmental
Management, Vol. 11 (4), 179-187. < http://onlinelibrary.wiley.com/doi/10.1002/csr.70/abstract> Retrieved 2013-02-04. Schively, C. (2007). Understanding the NIMBY and LULU phenomena: Reassessing our knowledge base and informing future research. Journal of
planning literature, 21(3), 255-266. < https://www2.hhh.umn.edu/publications/4387/document.pdf> Retrieved 2013-02-02. Sharma, S., & Ruud, A. 2003. On the Path to Sustainability: Integrating Social Dimensions into the Research and Practice of Environmental Management. Business Strategy and the Environment, Vol. 12(4), 205-214. < http://onlinelibrary.wiley.com/doi/10.1002/bse.366/abstract> Retrieved 2013-02-04. Slangen, A. et al (2012). Towards Regional Projections of Twenty-first Century Sea-level Change Based on IPCC SRES Scenarios. Climate Dynamics, Vol. 38 (5), 1191-1209. < http://link.springer.com/article/10.1007%2Fs00382-011-1057-6> Retrieved 2013-02-05.
22
Suburban Sustainability, Vol. 2 [2014], Iss. 2, Art. 1
https://scholarcommons.usf.edu/subsust/vol2/iss2/1DOI: http://dx.doi.org/10.5038/2164-0866.2.2.1

Spreckley, F. (1981). Social Audit - A Management Tool for Co-operative Working <http://www.locallivelihoods.com/cmsms/uploads/PDFs/Social%20Audit%20-%20A%20Management%20Tool.pdf> Retrieved 2013-03-03. Stokes, Gerry & Looney, Patrick. 2010. Envisioning a Low-Carbon 2050 for New York State. Brookhaven National Laboratory. http://www.dec.ny.gov/docs/administration_pdf/irappendixf.pdf Suffolk County Department of Parks, Recreation and Conservation. Climate Smart Community Program. http://ecode360.com/27250173 United Nations General Assembly (2005). 2005 World Summit Outcome, Resolution A/60/1, adopted by the General Assembly on 15 September 2005. <http://data.unaids.org/Topics/UniversalAccess/worldsummitoutcome_resolution_24oct2005_en.pdf> Retrieved on: 2013-03-01.
United Nations Framework Convention on Climate Change, Text of the convention, May 1992, Rio de Janiero, Brazil (UN Environment Program – World Meteorological Organization, Climate Change Secretariat, Geneva, 1992). < http://unfccc.int/resource/docs/convkp/conveng.pdf> Retrieved 2013-02-04. United Press International (2013). Water at risk of from power plants, climate change. < http://www.upi.com/Business_News/Energy-Resources/2013/07/19/Water-at-risk-from-power-plants-climate-change/UPI-66251374256314/> Retrieved 2013-08-01. U.S. Department of Energy. Database of Statewide Incentives for Renewables and Efficiency. Town of Babylon – Long Island Green Homes Program. http://www.dsireusa.org/incentives/incentive.cfm?Incentive_Code=NY65F
United States Environmental Protection Agency (EPA) (2009). Climate Ready Estuaries. Synthesis of Climate Change Drivers and Responses in the Long Island Sound. <http://longislandsoundstudy.net/wp-content/uploads/2011/03/LISS-Synthesis-of-CC-Impacts-Memo.pdf> Retrieved 2013-02-24.
Warner, K. (2002). Linking Local Sustainability Initiatives with Environmental Justice. Local Environment, Vol. 7 (1), 35-47. < http://www.tandfonline.com/doi/abs/10.1080/13549830220115402#.Uidq_Ma-k4k> Retrieved 2013-02-05.
23
Friedman et al.: LI MARKAL: Sustainability, Environmental Justice, and Climate Change
Published by Scholar Commons, 2014