Sustainability Metrics - University of Wisconsin–Whitewater · Needless to say, materials supply...
25
Tanya Franklin (B.B.A., University of Wisconsin-Whitewater; Management of Computer Systems) is currently a graduate student of Operations and Supply Chain Management. 761 Supply Chain Systems University of Wisconsin Whitewater Professor Sameer Prasad Fall 2008 Sustainability Metrics
Transcript of Sustainability Metrics - University of Wisconsin–Whitewater · Needless to say, materials supply...

Tanya Franklin (B.B.A., University of
Wisconsin-Whitewater; Management of
Computer Systems) is currently a
graduate student of Operations and
Supply Chain Management.
761 Supply Chain Systems
University of Wisconsin Whitewater
Professor Sameer Prasad
Fall 2008
Sustainability Metrics

1 | P a g e
Table of Contents Introduction .................................................................................................................................................. 2
Sustainability Metrics .................................................................................................................................... 3
Comprehensive List – ISM ......................................................................................................................... 3
Other Industry – Nike Metrics Example .................................................................................................... 5
Figure 1. Nike Sustainability Vision, Metrics, and Plan. ........................................................................ 6
UW-Oshkosh ............................................................................................................................................. 6
Complete the Carbon Inventory (CACP) for UWW CO2 Footprint ............................................................ 8
Figure 2. Campus Carbon Calculator Sample of an Input Sheet Section. (CACP) ............................... 10
The Next Steps ........................................................................................................................................ 10
Figure 3. Summary of Metrics Flow. ................................................................................................... 12
Conclusion ................................................................................................................................................... 12
Figure 4. Supply Chain Decision-Making Framework. (Chopra & Meindel) ........................................ 13
Supply chain review and consolidated metrics table. ............................................................................ 13
Table 1. Supply Chain Key Drivers and Related Metrics. Integrated (Chopra)& (ISM) ....................... 14
Beyond Metrics ....................................................................................................................................... 15
Other Helpful Resources ......................................................................................................................... 16
Bibliography ................................................................................................................................................ 17
Appendix 1. ISM’s Sustainability and Social Responsibility Metrics .......................................................... 18
Appendix 2. EPA Waste Reduction Steps. Waste Wise Page. (EPA) ......................................................... 24

2 | P a g e
Introduction Metrics are basically measures of performance used in the strategic decision making process.
The metrics data information is collected, manipulated, and presented in a diverse number of ways
according to an organization’s industry-specific needs. This section of this project will present current
sustainability metrics applied to the University of Wisconsin – Whitewater campus; the materials arena
specifically.
Aggregated data pertaining to purchase orders, inventory, and waste disposition for the campus
was a challenge to assemble. There is a centralized, university wide purchasing system and a
decentralized, college (business, education, etc.) purchasing system. Also, the state of durable goods
inventory (desks, computers, etc.) and their end-of-life disposition routes are unclearly defined at this
point. Additionally, the current waste management company collects and weighs waste materials and
reports an aggregate number on a quarterly basis. The numbers provided by the company will allow
calculation of an aggregated annual material waste CO2 carbon footprint number. However, there is not
enough information provided on a building, school, or semester basis.
Needless to say, materials supply chain management is a complex task with many variables to
include as well as performance metrics to capture. “A supply of consistent, accurate, and timely data
across all functional areas of an organization provides real-time information for the evaluation, control,
and improvement of processes, products, and services to meet both business objectives and rapidly
changing customer needs.” (Evans & Lindsay) Aligning the metrics and processes of functional areas of
the school will prove to be a daunting, but beneficial task. Presented in this section are the currently
known sustainability metrics from Clean Air Cool Planet (CACP), Institute for Supply Management (ISM),
and other leaders in their industry. An evaluation of these metrics will likely be necessary for their
appropriateness for UWW’s short and long term strategies. Care must be taken to ensure the accuracy
and unit definition of a metric in order to make it meaningful to the organization. Ultimately, metrics

3 | P a g e
are critical to performance measures. “If you don’t measure results, you can’t tell success from failure.
If you can’t see success, you can’t reward it – and if you can’t reward success, you are probably
rewarding failure. If you can’t recognize failure, you can’t correct it.” (Evans & Linday)
Sustainability Metrics
Comprehensive List – ISM
Considering the plethora of ‘green’ information in the media these days, it is difficult to discern
what is really beneficial when making personal and professional sustainability decisions. A company
may advertise a ‘green’ product with or without the metrics to quantify their claims. Many call these
actions ‘green-washing’. Advocacy groups and governmental agencies have published criteria they must
comply with in order to display a seal of compliance. A few examples are displayed below.
In an effort to help companies sift through the ‘green’ sustainability initiatives that can be
undertaken, the Institute for Supply Management (ISM) has published a comprehensive list of metrics
and performance criteria for sustainability and social responsibility initiatives. See Appendix 1. The
document lists the metrics for nine social responsibility categories:
• Community,
• Diversity and Inclusiveness – Supply Base ,
• Diversity and Inclusiveness – Workforce,
• Environment ,
• Ethics and Business Conduct,
• Financial Responsibility ,
• Human Rights,
• Health and Safety, and
• Sustainability. (ISM)

4 | P a g e
The metrics under Environment and Sustainability are most applicable for this project, and have
been incorporated into a supply chain driver table, Table 1 in this report. Below is a partial list in each
category to give you an idea what ‘green’ areas should have metrics collected and maintained. The
Environment category describes supply management actions and decisions that promote protection and
preservation of the environment where an organization operates. Some of the metrics and decision
criteria follow:
• Disposal and waste management policies and practices,
• Water conservation and consumption,
• Green House Gas (GHG) footprint (Aggregate CO2 number),
• Paper and paper product consumption ,
• Packaging reduction initiatives,
• Energy consumption (power, gas, electric),
• Buildings and construction (LEED Certification, Green Globes, Energy Star, etc.),
• Transportation and logistics management including routing and consolidation, fleet
management ,
• Travel policies and statistics (miles driven, miles flown, nights away from base, etc.),
• Education and communication initiatives, and
• Contact information for Chief Sustainability Officer publicly available. (ISM)
The Sustainability category refers to “the ability to meet current needs without hindering the
ability to meet the needs of future generations in terms of economic, environmental and social
challenges.” (ISM) Some of the metrics and decision criteria follow:
• Use of sustainability criteria in procurement decisions,
• Processes in place to embed sustainability and social responsibility into supplier
qualification and certification decisions,
• Processes in place to embed sustainability and social responsibility into product
design, redesign, and statements of work,
• Developing processes/knowledge to ensure understanding of sourcing and recycling
Decisions,
• Development of relationships with key suppliers to gain access to protected
information on chemical makeup of products being purchased,
• Working with risk management and/or internally to develop, quantify and base

5 | P a g e
decisions on financial and other risks related to nonconformance with or lack of
support of sustainability and social responsibility initiatives, and
• Maintain appropriate records to feed into corporate sustainability and social
responsibility reporting. (ISM)
The comprehensive list is a great reference when considering the next ‘green’ initiative an
organization’s upper management is going to select.
Other Industry – Nike Metrics Example
To illustrate what metrics are chosen, captured, and used, let us look at what other industries
are doing. Where materials are concerned, Nike’s selected sustainability criteria is the percent of
recycled content purchased and the percent of consumption reduction with an ultimate goal of 100% of
purchases. The metrics they use is the percent of each product’s recycled content along with a
communicated corporate directive to reduce consumption, measured with materials waste in pounds.
Therefore, they are capturing each product’s recycled content number as well as a materials waste
number in their information systems. See Figure 1 on the following page.

6 | P a g e
Figure 1. Nike Sustainability Vision, Metrics, and Plan.
(ISM Conference: NIKE Presentation).
UW-Oshkosh
Many universities have addressed sustainability topics and embarked on their selected initiative
implementations. The materials management specifics will be discussed in later sections of this project.
Looking close to home within the University of Wisconsin system, UW-Oshkosh is an excellent resource

7 | P a g e
and example of what campus sustainability initiatives can be addressed. This is what they have done so
far:
2002: UW Oshkosh becomes one of a handful of universities that officially endorses the
Earth Charter and its goals of ecological sustainability and social justice.
2003: UW Oshkosh becomes the first Wisconsin university to join the Environmental
Protection Agency’s Green Power Partnership by agreeing to purchase at least 3 percent
of its energy from renewable sources, making it the largest purchaser of green energy in
Wisconsin.
2007: Chancellor Richard Wells signs the American College and University Presidents
Climate Commitment.
2008 (Earth Day): Chancellor Wells unveils the comprehensive and ambitious UW
Oshkosh Campus Sustainability Plan. This plan will guide the University in extending
our leadership in conservation and sustainability in operations, education, research, and
community outreach.
2008 (Sept. 2): Chancellor Wells declares that UW Oshkosh is a Fair Trade University,
the first in the U.S. (UWO)
The Campus Sustainability Plan for the University of Wisconsin Oshkosh was published in February 2008
with the following vision statements and top priorities listed.
‘"Sustainability implies that the critical activities of a higher education institution are (at
a minimum) ecologically sound, socially just, and economically viable, and that they will
continue to be so for future generations. A truly sustainable college or university would
emphasize these concepts in its curriculum and research, preparing students to
contribute as working citizens to an environmentally sound and socially just society. The
institution would function as a sustainable community, embodying responsible
consumption of food and energy, treating its diverse members with respect, and
supporting these values in the surrounding community.”Association of University
Leaders for a Sustainable Future (www.ulsf.org)
“Education for sustainability is a lifelong learning process that leads to an informed and
involved citizenry having the creative problem-solving skills, scientific and social
literacy, and commitment to engage in responsible individual and cooperative actions.
These actions will help ensure an environmentally sound and economically prosperous
future.” The President’s Council on Sustainable Development (www.ffof.org/pcsd)’ (UWO)

8 | P a g e
Section G lists some of their top priorities and conclusions:
• ‘Create Organizational Infrastructure to Support Sustainability,
• Perform Energy Independence Study and Implement Recommendations,
• Encourage the Teaching of Sustainability,
• Initiate Residence Hall Programs on Sustainability,
• Revive the Campus Environmental Audit,
• Initiate Planning Procedures in Key Operational Areas,
- Transportation,
- Purchasing, and
- Recycling,
• Develop Websites,
• Develop Community Gardens and Composting Site,
• Implement Modifications to Dining Contract,
• Declare UW Oshkosh a Fair Trade University,
• Adopt LEED Standards for Construction and Renovation Projects, and
• Perform Assessments.’ (UWO)
The Campus Sustainability Plan is comprehensive and ambitious, and includes many
recommendations for initial consideration. While all of the recommendations would help make the
campus more sustainable, the list in section ‘G’ is considered critical. Considering that the UW-Oshkosh
campus is further along the sustainability path, it is reasonable to review their plan and
recommendations after the UWW baseline carbon footprint is calculated.
Complete the Carbon Inventory (CACP) for UWW CO2 Footprint
The Campus Carbon Calculator from the Clean Air Cool Planet (CACP) is free and available for
anyone to download. It includes modules for projection and for generating solutions to problems. It is
designed to help schools that have completed greenhouse gas inventories develop long term,
comprehensive climate action plans. The Campus Carbon Calculator facilitates analysis of carbon
reduction options, determines project payback times, net present value, cost per ton reduced, and
other relevant markers.
“The greenhouse gas emissions inventory is an accounting of the amounts and sources of
emissions of greenhouse gases attributable to the existence and operations of an institution. The

9 | P a g e
completion of such an inventory provides an essential foundation for focused, effective outreach on the
issue of climate change at a college or university, and the basis for institutional action to address it—in
other words; it is a crucial first step toward comprehensive campus climate action efforts.” (CACP)
An MS- Excel-based spreadsheet tool takes you through the steps, providing procedural
protocols and a framework for investigation. The major emission source categories are: on-campus
energy production, purchased electricity, transportation, waste, agriculture and refrigerants. Looking at
the emissions levels in each of these categories provides a good idea of the best opportunities for
emissions reduction. There are three elements to the greenhouse gas emission inventory process: data
collection, calculating greenhouse gas emissions, and analyzing and summarizing the results.
The resources required are pretty basic: a computer (with Microsoft Excel and Word), a phone
and a place to store notes and materials. The most critical resource necessary, is access to the relevant
information, likely to come from a variety of sources including the campus facilities department, fleet
managers, purchasing records and utility records. Data collection can be the most challenging phase of
the inventory process. It will require thorough detective work and collaboration with many people and
departments on campus. Keeping a journal, complete with a list of who was contacted, when they were
contacted, and what their response was, provides a resource to consult if questions arise about
emissions and data down the road. Be creative and be patient; the process may be imperfect but the
results will be worth it.
Once the data is collected, the calculator makes emissions calculations relatively easy. Enter the
data into the appropriate cells of the spreadsheet along with a few other parameters (such as the
regional electricity pool from which the institution purchases), the calculations are made. (All formulas,
conversion factors, emission factors, etc. are already built-in.) The beauty of this tool is that one does
not have to get into the fairly complex math and science involved in estimating greenhouse gas

10 | P a g e
emissions. Just enter the data required in the proper units on the two ‘Inputs' worksheets, and the
calculator will do the rest!
Figure 2. Campus Carbon Calculator Sample of an Input Sheet Section. (CACP)
Solid
Waste
Incinerated
Waste (not
used for
on-campus
power)
Landfilled Waste
Mass Burn
Refuse
Derived Fuel
(RDF)
No CH4 Recovery CH4 Recovery
and Flaring
CH4 Recovery and
Electric Generation
Short Tons Short Tons Short Tons Short Tons Short Tons
Analyzing and presenting the results of the inventory will allow UWW to move forward in the
larger process of campus emissions reduction and climate action. The calculator can automatically
create many graphs and other tables that will help all stakeholders understand the institutional
emissions profile. The analysis and summary of the inventory creates the platform for action necessary
to all future climate efforts. It also allows form widespread buy-in and momentum for continued action.
Continued action, as well as providing figures for portions of the calculator’s input spreadsheets
(commuter transportation and materials waste) is the focus of the following sections of this project.
Ultimately the UWW carbon footprint can be calculated in terms of total CO2 emissions.
The Next Steps
Once the initial carbon footprint for the campus is calculated, the next sustainability initiatives
can be undertaken. The EPA has provided ‘next step’ tools necessary for the continued sustainability
journey. Appendix 2 outlines the necessary steps for progress. Step seven is where the UWW must
track and measure progress. Consequently, this step is where understanding the campus’s supply chain

11 | P a g e
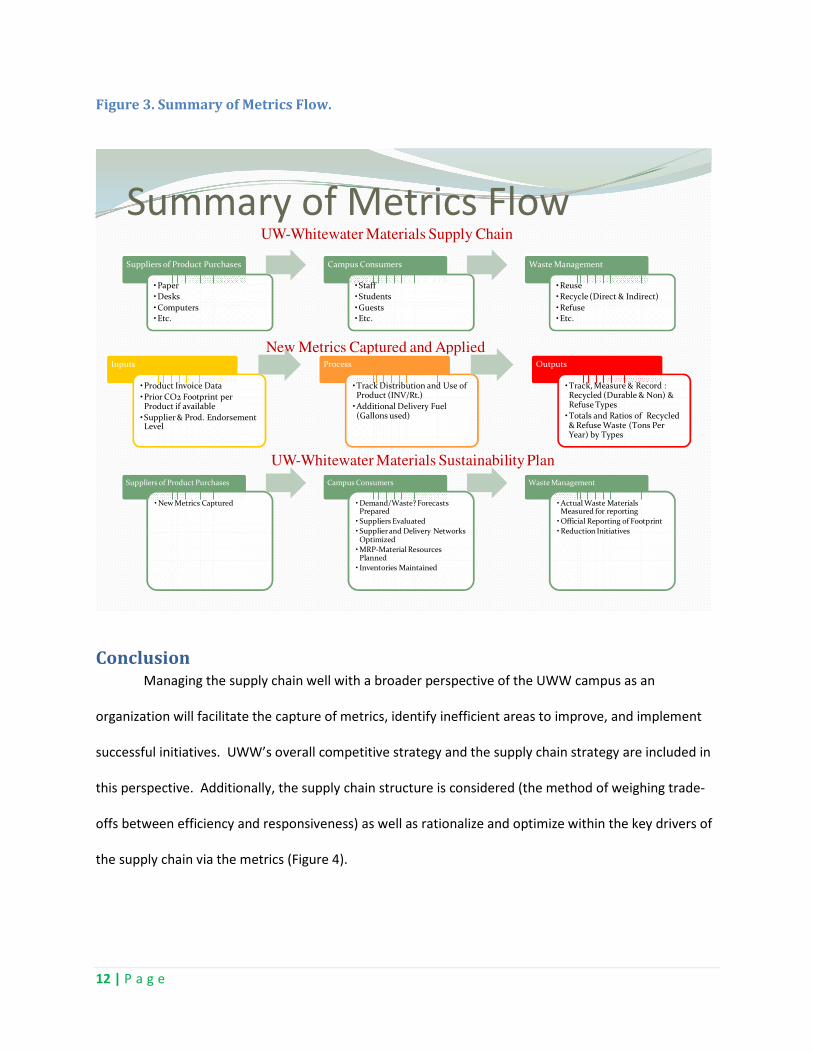
and the metrics to track is most critical for success. Figure 3 displays how the metrics flow through the
materials supply chain. On the second level, the tracking information is captured at the inputs stage:
product invoice data, prior CO2 footprint per product if available, and Supplier Selection criteria &
Product endorsement levels. At the process stage, additional product distribution and inventory
information is captured: delivery fuel consumption, updated inventory records, and the product’s
ultimate disposition route. The outputs stage records the final steps of a particular material: end-of-life
disposition – reused, recycled, returned, or land filled. The continued sustainability initiatives at the
third level will be supported and documented with the tracking data maintained on an ongoing basis
(metrics). Adjustments and additions to the metrics should be expected as the ‘green’ industry
advances and changes over time. Therefore, UWW must begin the sustainability journey while keeping
a watchful eye on the industry as a whole.
12 | P a g e
Figure 3. Summary of Metrics Flow.
Suppliers of Product Purchases
• Paper
• Desks
• Computers• Etc.
Campus Consumers
•Staff
•Students
•Guests•Etc.
Waste Management
•Reuse
•Recycle (Direct & Indirect)
•Refuse•Etc.
Summary of Metrics FlowUW-Whitewater Materials Supply Chain
New Metrics Captured and Applied
Suppliers of Product Purchases
• New Metrics Captured
Campus Consumers
• Demand/Waste? Forecasts Prepared
• Suppliers Evaluated
• Supplier and Delivery Networks Optimized
• MRP-Material Resources Planned
• Inventories Maintained
Waste Management
• Actual Waste Materials Measured for reporting
• Official Reporting of Footprint
• Reduction Initiatives
UW-Whitewater Materials Sustainability Plan
Inputs
•Product Invoice Data
•Prior CO2 Footprint per Product if available
•Supplier & Prod. Endorsement Level
Process
•Track Distribution and Use of Product (INV/Rt.)
•Additional Delivery Fuel (Gallons used)
Outputs
•Track, Measure & Record : Recycled (Durable & Non) & Refuse Types
•Totals and Ratios of Recycled & Refuse Waste (Tons Per Year) by Types
Conclusion Managing the supply chain well with a broader perspective of the UWW campus as an
organization will facilitate the capture of metrics, identify inefficient areas to improve, and implement
successful initiatives. UWW’s overall competitive strategy and the supply chain strategy are included in
this perspective. Additionally, the supply chain structure is considered (the method of weighing trade-
offs between efficiency and responsiveness) as well as rationalize and optimize within the key drivers of
the supply chain via the metrics (Figure 4).

13 | P a g e
Figure 4. Supply Chain Decision-Making Framework. (Chopra & Meindel)
Supply chain review and consolidated metrics table.
Supply chain drivers and some associated metrics are summarized in Table 1. Three drivers of a
supply chain are categorized as cross-functional and affect all six drivers. They are information,
sourcing, and pricing. The other three drivers are logistic (physical) drivers. They are facilities,
inventory, and transportation. The cells highlighted in green are the subject areas researched with
specific findings reported in separate sections of this project. The green typed cells under the metrics
headings are the green metrics suggested by ISM in Appendix 1. The table is intended to convey where
the metrics ‘fit’ with respect to the drivers in the supply chain and should be helpful when capturing
measures as well as rationalizing and optimizing processes for specific sustainability initiatives UWW
management choose to address.
Competitive Strategy
Supply Chain Strategy
Supply Chain Structure - Method of weighing trade-offs between efficiency and responsiveness
Rationalize and Optimize Drivers via Metrics

14 | P a g e
Table 1. Supply Chain Key Drivers and Related Metrics. Integrated (Chopra)& (ISM)
Drivers Cross- Functional���� Information metrics Sourcing metrics Pricing metrics
Drivers Push-Pull In-house or
Outsource
Pricing and
Economies of scale
Coordination and
Information
Sharing
Supplier
Selection
Everyday low
pricing vs. High-
Low pricing
Forecasting and
Aggregate Planning
Procurement Fixed price vs.
Menu pricing
Enabling Tech. Capture Sstn.
Metrics
Sustainability
Financing
Metrics:��� Forecast
horizon
Metrics:�� Days payable
outstanding
Metrics:��� Profit Margin
Update
frequency
Avg. Purchase
price
Days sales
outstanding
Forecast
error
Range of
purchase price
Incremental fixed
cost per order
Seasonal
factors
Avg. purchase
quantity
Incrmntl.var. cost
per unit
Variance
from plan
Fraction on-time
deliveries
Avg. sale price
Demand to
order
variability
Ratio
Supply Quality Avg. order size
Sstn.Web
Page
Supply Lead
Time
Range of sale price
Sstn.Std.Op.
Procedures
Product CO2 Periodic sales Range
Packaging,
Communicate
Message
Disposition Rte. Carbon Offsets
Logistic���� Facilities metrics Inventory metrics Transportation metrics
Drivers Role Cycle (MRP)
Inventory
Design of Network
(Materials)
Location Safety
Inventory
Choice of Mode
Capacity
(Materials)
Seasonal
Inventory
Level of
Product
Availability
Metrics:��� Capacity Metrics:�� Average
Inventory
Metrics:��� Avg. Cost
In/Outbound Utilization
Flow/Cycle
times
Product’s Length
of time in
inventory
In/Outbound
shipment size
Volume
Product
variety
Replenishment
batch size
Avg. cost per shpmnt.
In/ Outbound
Process/
Setup/ Idle
Times
Avg. Safety
inventory
Fraction transported
by mode
Service Level Seasonal
inventory
Capture Transp.CO2
from Purchases Waste Mngt.
Water Consv. Fill rate Conduct Regular
Commuter Survey Leed
Buildings
Product’s time
out of stock
Land Use Capture Other
Faculty Travel - CO2
Seminars, etc.
Noise
Energy Consv

15 | P a g e
Beyond Metrics
To assist the UWW facilities department report the baseline carbon inventory from CACP, a
small survey was conducted. Forecast commuter emissions numbers as well as the refuse and recycled
waste numbers have been estimated in those sections of this project. After the CO2 footprint is
calculated and reported, the following initiatives should be considered as sustainability next steps.
• Identify sustainability values (SV) that are important to UWW and then communicate those
values to suppliers, employees, and students,
• Put SV’s in the Supplier Selection Criteria and provide the means to evaluate prior CO2 and
other SV’s of a product being purchased,
• Record material disposal routes, especially for durables (reuse, recycle, return, or refuse),
• Capture additional transportation footprint for deliveries in gallons and types of fuel used,
• Identify and select carbon offset options, and
• Document and publicize sustainability accomplishments, goals, initiatives, and procedures on an
accessible web page.
Considering other University’s progress and sustainability plans while taking a longer-term perspective
on sustainability will be beneficial. This project used this rational and have provided research, links, and
suggestions that will continually improve sustainability for the UWW campus. The following sections
should be helpful to current and future initiatives.

16 | P a g e
Other Helpful Resources
As the UWW campus enters into more sustainability initiatives after the baseline carbon
footprint is calculated, the following list of other resources may be helpful as sustainability is
communicated publicly and improved internally:
• Green Office Guide: www.greenbiz.com/toolbox/reports_third.cfm/LinkAdvID=22121
• http://www.greenerchoices.org/eco-labels
• Responsible Purchasing Network –www.responsiblepurchasing.org
• http://www.energystar.gov/
• US Green Building Council –www.usgbc.org
• Center for a New American Dream –www.newdream.org/procure
• On specific chemicals and alternatives:
o Inform –www.informinc.org
o Green Seal –www.greenseal.org
o Scorecard –www.scorecard.org/chemical-profiles/index.tcl

17 | P a g e
Bibliography AASHE. (2008, 1 1). Association for the Advancement of Sustainability in Higher Education. Retrieved
November 10, 2008, from AASHE: http://www.aashe.org/
ACUPCC. (2008, 1 1). American College and University Presidents Climate Commitment. Retrieved
November 10, 2008, from ACUPCC website: http://www.presidentsclimatecommitment.org/
CACP. (2008, 1 1). Clean Air Cool Planet. Retrieved November 10, 2008, from CACP:
http://www.cleanair-coolplanet.org/toolkit/inv-calculator.php
Chopra, S., & Meindl, P. (2007). Supply Chain Management (Third ed.). Upper Saddle River, New Jersey:
Pearson Education, Inc.
EPA Wast Wise. (2008, 1 1). United States Environmenta Protection Agency. Retrieved November 28,
2008, from Waste Wise: http://www.epa.gov/epawaste/partnerships/wastewise/index.htm
EPA-Environmental Protection Agency. (2008, January 1). US Environmental Protection Agency.
Retrieved September 20, 2008, from Invironmentally Preferred Pruchasing Hands on Tools:
http://www.epa.gov/opptintr/epp/index.htm
Evans/Lindsay. (2008). The Management and Control of Quality. Mason, OH: Thomson Higher Education.
ISM - Institute for Supply Management. (2008, August 1). Ethics and Social Responsibility. Retrieved
September 8, 2008, from ISM: http://www.ism.ws/
ISM Conference. (November 4-7, 2008). Sustainability and Social Responsibility for Supply Professionals.
http://www.ism.ws/education/content.cfm?ItemNumber=18644&navItemNumber=5580. Adelphi, MD:
ISM.
Jones, G. R. (2007). Organizational Theory, Design, and Change (Fifth ed.). Upper Saddle River, New
Jersey: Pearson Education, Inc.
Morris University. (2005, January 1). Morris University. Retrieved October 10, 2008, from UMN:
www.morris.umn.edu/greencampuse
UMass Amherst. (2008, January 1). Greenhouse Gas Emissions. Retrieved November 25, 2008, from
UMassAmherst: http://www.umass.edu/epac/carbon.htm
UWO University of Wisconsin - Oshkosh. (2008, April 1). Sustainability. Retrieved September 3, 2008,
from University of Wisconsin-Oshkosh: http://www.uwosh.edu/sustainability

18 | P a g e
Appendix 1. ISM’s Sustainability and Social Responsibility Metrics
Sustainability and Social Responsibility Metrics and Performance Criteria for Sustainability and Social Responsibility Initiatives _ _
Introduction .............................................................................................................. 2
Metrics for individual sustainability and social responsibility principles:
1. Community ........................................................................................................... 2
2. Diversity and Inclusiveness – Supply Base .......................................................... 3
3. Diversity and Inclusiveness – Workforce .............................................................. 3
4. Environment ...................................................................................................... 3-4
5. Ethics and Business Conduct............................................................................... 4
6. Financial Responsibility ..................................................................................... 4-5
7. Human Rights....................................................................................................... 5
8. Health and Safety................................................................................................. 5
9. Sustainability ..................................................................................................... 5-6

19 | P a g e
2
Sustainability and Social Responsibility Metrics and Performance Criteria for Sustainability and Social Responsibility Initiatives Introduction The development and implementation of metrics and performance criteria is important to the success of sustainability and social responsibility programs. Integrating goals and objectives with relevant measurements will ensure the ability to track and report progress across initiatives. Often an annual sustainability and social responsibility report, sometimes called a citizenship report, is issued or results are included in the organization’s annual report. This document was developed to provide supply professionals and management with a broad based list of possible metrics. (Please see the ISM web site www.ism.ws/sr, then select “metrics and indices” to find a list of metrics and reporting tools). Supply professionals must consider impact, influence, and positioning when selecting and developing metrics to embed throughout the: (1) supply organization, (2) entity and (3) supply base. ISM and the ISM Committee on Sustainability and Social Responsibility welcome your comments and suggestions and can be reached at [email protected]. Note: Implemented metrics will usually be stated in absolute numbers, a percentage, by
employee, ratios, and in other ways that allow for more effective comparison and data
management.
1. Community Community initiatives provide resources to support the community in which the company or organization operates. a. Number and types of community programs in place, including philanthropy and foundation
resources/giving
b. Employees hours or person days for community initiatives
c. Employee volunteerism
i. Employee leave of absence as volunteer outside local community, e.g., voluntary service overseas
ii. Support provided for this effort by company, e.g., personal fixed cost such as mortgage repayments
d. Corporate funding of community-based initiatives
e. Philanthropy
f. In-kind contributions
g. Employee giving
h. Donation of products and services
20 | P a g e
3
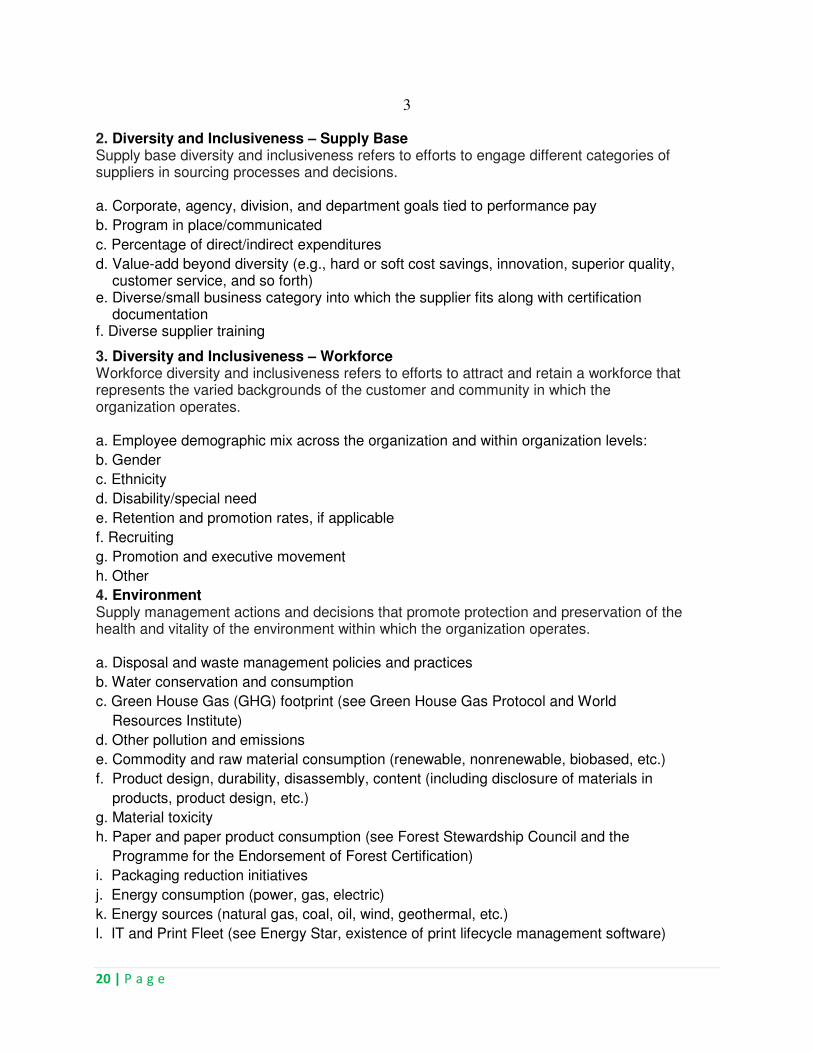
2. Diversity and Inclusiveness – Supply Base Supply base diversity and inclusiveness refers to efforts to engage different categories of suppliers in sourcing processes and decisions. a. Corporate, agency, division, and department goals tied to performance pay
b. Program in place/communicated
c. Percentage of direct/indirect expenditures
d. Value-add beyond diversity (e.g., hard or soft cost savings, innovation, superior quality, customer service, and so forth) e. Diverse/small business category into which the supplier fits along with certification documentation f. Diverse supplier training
3. Diversity and Inclusiveness – Workforce Workforce diversity and inclusiveness refers to efforts to attract and retain a workforce that represents the varied backgrounds of the customer and community in which the organization operates. a. Employee demographic mix across the organization and within organization levels:
b. Gender
c. Ethnicity
d. Disability/special need
e. Retention and promotion rates, if applicable
f. Recruiting
g. Promotion and executive movement
h. Other
4. Environment Supply management actions and decisions that promote protection and preservation of the health and vitality of the environment within which the organization operates. a. Disposal and waste management policies and practices
b. Water conservation and consumption
c. Green House Gas (GHG) footprint (see Green House Gas Protocol and World
Resources Institute)
d. Other pollution and emissions
e. Commodity and raw material consumption (renewable, nonrenewable, biobased, etc.)
f. Product design, durability, disassembly, content (including disclosure of materials in
products, product design, etc.)
g. Material toxicity
h. Paper and paper product consumption (see Forest Stewardship Council and the
Programme for the Endorsement of Forest Certification)
i. Packaging reduction initiatives
j. Energy consumption (power, gas, electric)
k. Energy sources (natural gas, coal, oil, wind, geothermal, etc.)
l. IT and Print Fleet (see Energy Star, existence of print lifecycle management software)

21 | P a g e
4 m. Buildings and construction (see LEED Certification, Green Globes, Energy Star, etc.)
n. Land use (e.g., sustainable agriculture, etc.)
o. Noise
p. Transportation and logistics management including routing and consolidation, fleet
management (see EPA SmartWay)
q. Travel policies and statistics (miles driven, miles flown, nights away from home base,
etc.)
r. Use of awards and certifications (see Performance Track, ISO 14000, SA8000, etc.)
(see International Organization for Standardization, Social Accountability International,
American Society for Quality, etc.)
s. Participation in Consortia (see GRI, GEMI, etc.)
t. Education and communication initiatives
u. Contact information for Chief Sustainability Officer publicly available
v. Other green and sustainable practices
5. Ethics and Business Conduct
Ethical behavior and business conduct is a critical element impacting personal, business
(public and private), supplier and governmental relationships and governance.
a. Employee and supplier training
b. Inquiries into business conduct (by employees, suppliers, others)
c. Allegations of impropriety
d. Audit and accounting concerns
e. Types and numbers of disciplinary actions taken (oral warning, written warning,
termination, resignation, counseled)
f. Use of ethics reporting channels (e.g., audits, hotlines, etc.)
g. Written code in place and communicated
h. Encourage discussion around the topics of influence
i. Ethics hotline
j. Executive ethics committee
k. Regular communication with suppliers
l. Actively explore topic during job interviews/hiring
m. Document sourcing decisions
n. Subscribe to the ISM Principles and Standards of Supply Management Conduct
o. Conduct built into supplier contracts and measured
6. Financial Responsibility
Financial responsibility refers to understanding and applying financial concepts to supply
management decisions to address allocation of funds, accurate reporting, and management
of risk.
a. Is supply strong/viable/sustainable source of supplies
b. Business Continuity Plan in place
c. UN Principles of Responsible Investment
d. Accounting principles and standards issued by governance and governmental entities

22 | P a g e
5 e. Published internal policies and guidelines
f. Responsible investing
g. Fiscal supplier health
7. Human Rights Human rights refer to the concept of human beings having universal natural rights, or status, regardless of legal jurisdiction or other localizing factors. a. Working hours
b. Compensation and wages (e.g., living wage concept)
c. Workplace environment and conditions
d. Benefits
e. Freedom of association practices
f. Training and development
g. Understanding and following local laws and regulations
h. Impacting indigenous peoples
i. Child labor policies
j. Signatory to Global Compact
8. Health and Safety Health and safety refers to the condition of being protected or free from the occurrence of risk of injury, danger, failure, error, accident, harm or loss. a. Accidents and injury rates
b. Illnesses
c. Heath care and insurance (costs, coverage)
d. Health and wellness initiatives and programs
e. Employee housing
f. Cafeterias
g. Written safety procedures, audits
h. Working conditions (heat, lighting)
i. Providing safety equipment (eye wear, ear plugs, gloves, hard hats)
j. Product safety
9. Sustainability Sustainability refers to the ability to meet current needs without hindering the ability to meet the needs of future generations in terms of economic, environmental and social challenges. a. Use of sustainability criteria in procurement decisions
b. Processes in place to embed sustainability and social responsibility into supplier
qualification and certification decisions
c. Processes in place to embed sustainability and social responsibility into product design,
redesign, and statements of work
d. Developing processes/knowledge to ensure understanding of sourcing, recycling, etc.
decisions

23 | P a g e
6 e. Development of relationships with key suppliers to gain access to protected information
on chemical makeup of products being purchased
f. Working with risk management and/or internally to develop, quantify and base decisions
on financial and other risks related to nonconformance with or lack of support of
sustainability and social responsibility initiatives
g. Maintain appropriate records to feed into corporate sustainability and social
responsibility reporting
Published by: Institute for Supply Management, Inc.™ Paul Novak, C.P.M., A.P.P., Chief Executive Officer © 2008 Institute for Supply Management™ P.O. Box 22160 Tempe,Arizona 85285-2160 USA www.ism.ws All Rights Reserved. Material may be copied and used with permission with credit given to ISM

24 | P a g e
Appendix 2. EPA Waste Reduction Steps. Waste Wise Page. (EPA)
See Attached.