Sustainability and Responsibility - 2014 Tim Hortons...
6
Sustainability and Responsibility 2013 Performance Report
Transcript of Sustainability and Responsibility - 2014 Tim Hortons...

Sustainability and Responsibility 2013 Performance Report
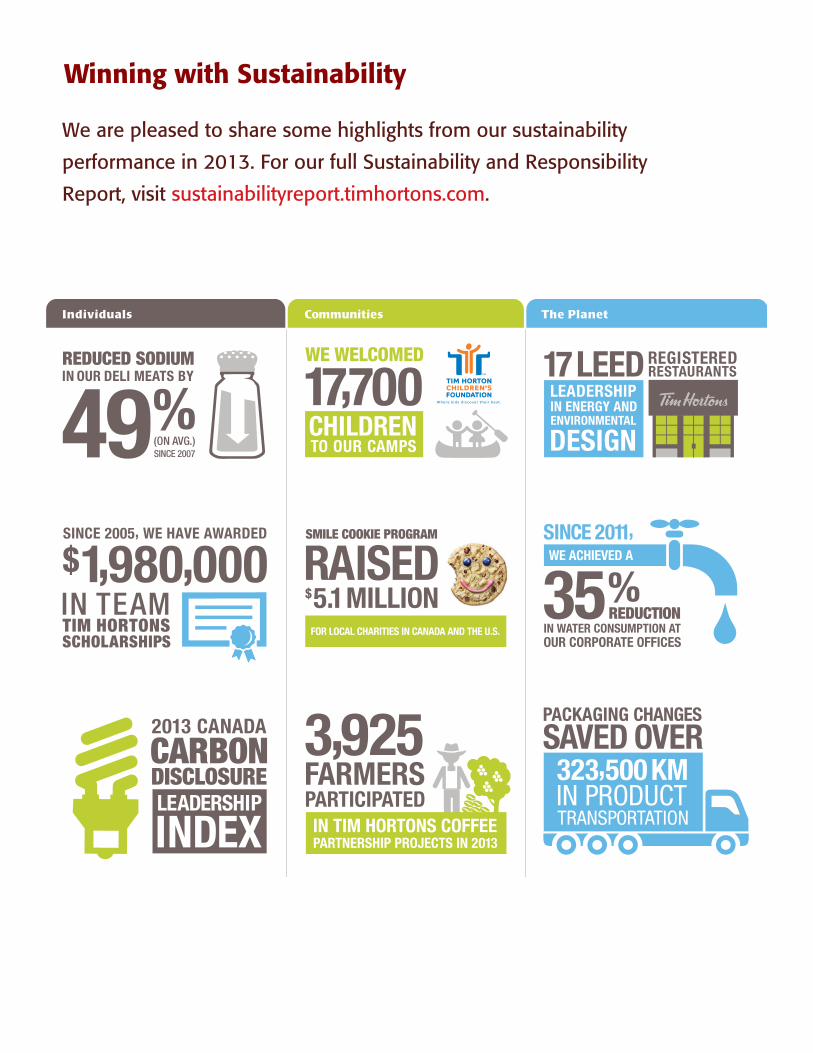
Winning with Sustainability
We are pleased to share some highlights from our sustainability
performance in 2013. For our full Sustainability and Responsibility
Report, visit sustainabilityreport.timhortons.com.

2013 Goal Status Performance Highlights
NutritionWe will continue to work to enhance the availability of healthier options across our product categories and to increase communication of the positive attributes and options within our menu.
• In 2013, we introduced gluten-free macaroons, turkey sausage breakfast sandwiches, and multigrain flatbread.
• To date, we have reduced sodium in our soups (31%), deli meats (49%), muffins (25%), classic hot beverages (15%), chili (10%), english muffins in the U.S. (40%), and cheese croissants (25%, including a 15% fat reduction).
• New communication included a “Lighter Options” section on our breakfast menu boards in the U.S. and a “Breakfast Value” promotion highlighting items under 300 calories in Canada.
Guest ServicesWe will work to maintain a 100% response rate on enquiries that are received by Corporate Guest Services where a response was requested by our guests.
• We achieved a response rate of 99.9% for 150,000 guest inquiries in 2013.
Food SafetyWe are aiming for 100% of our full-serve restaurants to receive at least two food safety audits every 12 months.
• 98.5% of our full-serve restaurants received at least two food safety audits in 2013. Remaining restaurants were audited in January 2014.
We will continue to aim for 100% of our corporate employees who directly influence restaurant operations to have up-to-date food safety certification, and we are aiming to launch an enhanced online training system that will allow a broader reach of participants in 2013.
• 99% of employees who directly influence restaurant operations have up-to-date food safety certification and we launched our online training system. Remaining employees are scheduled for re-certification in Q1 of 2014.
Standards of Business Practices (SOBP) All new corporate employees will be educated on our SOBP within their first year of employment and we will launch additional Ethics and Compliance e-learning modules in 2013.
• 100% of our employees were educated on our SOBP and additional Ethics and Compliance e-learning modules were developed and launched in 2013.
Training and DevelopmentCommitment: We will maintain our strong levels of employee engagement and commitment through feedback surveys, focus groups, and external benchmarking initiatives. We will again work to improve our “under one year” voluntary turnover rate by 10% in 2013.
• We conducted an employment experience study, an engagement survey and several focus groups, which identified opportunities to enhance our overall employee experience. Task forces have been developed to address improvement opportunities.
• We achieved a 15% improvement in our “under one year” voluntary turnover rate compared to 2012.
Calibration: We will complete annual talent reviews for manager level and above in 2013.
• Performance and talent reviews were completed to evaluate employee performance and potential across the organization.
Capability: 100% of our permanent corporate employees will have an Individual Development Plan.
• We were not able to measure our capability goal because we decided to defer implementation of our talent management system.
Performance: 100% of our permanent corporate employees will set annual goals aligned with business objectives and will have an annual performance review in 2013.
• We have completed 100% of our annual 2013 performance reviews and goal setting.
Restaurant OwnersWe aim to host our Restaurant Owner roundtables in 2013 and incorporate their feedback into our sustainability and responsibility strategy and initiatives.
• Close to 40 of our Restaurant Owners participated in roundtables that focused on education and sharing of best practices with respect to sustainability and restaurant operations. Recommendations will be considered for future sustainability strategy and programming.
InvestorsWe will continue to report using the GRI Guidelines, and respond to both the Carbon Disclosure Project (CDP) and the Dow Jones Sustainability Index (DJSI).
• We utilized the GRI Guidelines and received independent limited assurance from PricewaterhouseCoopers on select environmental indicators.
• We submitted responses to both the CDP and DJSI. We were named to the Canada 200 CDP Leadership Index for the second consecutive year.
PA
RT
NE
RS
EM
PL
OY
EE
SG
UE
ST
S
INDIvIDUALS
Tim Hortons encourages individuals to achieve their best. We manage the personal impact we have in all that we do.
GOAL MET
GOAL MET
GOAL MET
GOAL MET
GOAL MET
GOAL MET
GOAL MET
GOAL MET
GOAL MET
GOAL PARTIALLY
MET
GOAL MET
GOAL NOT MET
For further details on our 2013 goals and performance, please visit our online Sustainability and Responsibility Report: sustainabilityreport.timhortons.com.

2013 Goal Status Performance Highlights
Tim Horton Children’s FoundationWe will continue to work towards 17,000 economically disadvantaged children participating in Tim Horton Children’s Foundation camps and programs by the end of 2015.
• We hosted almost 17,700 economically disadvantaged children and youth at THCF camps.
• Construction for our new Youth Leadership Camp in Manitoba is proceeding.
We will continue to invest in youth by providing over 1,000 bursaries to graduates of our Youth Leadership Program for post-secondary education by the end of 2015.
• We have distributed 539 bursaries since January 2012, worth approximately $1.2 million for post-secondary education, to graduates of our Youth Leadership Program.
Together with our Restaurant Owners, Team Members and the community, we are aiming to raise over $11.5 million on Camp Day in 2013.
• We raised $11.8 million on Camp Day!
Community InitiativesTogether with our Restaurant Owners we are aiming to invest $100 million through our community initiatives in Canada by the end of 2018.
• We invested approximately $16 million through community initiatives in Canada in 2013. To date, we have invested $31.9 million towards our goal of $100 million by 2018.
Smile CookieTogether with our Restaurant Owners and guests, we are aiming to raise $4.6 million through our Smile Cookie Program in 2013 for local charities across Canada and in the U.S.
• Together with our Restaurant Owners and guests, we raised over $5.1 million for local charities across Canada and in the U.S.
Horizons Aboriginal Program Education: We are aiming for 30,000 new Restaurant Team Members to complete Aboriginal Awareness training in 2013.
• Over 36,750 new Restaurant Team Members completed our Aboriginal Awareness training in 2013.
Employment: We will expand the DevelopMENTOR Program beyond its pilot, and pursue Aboriginal recruitment strategies.
• Collaborating with Algonquin College, the DevelopMENTOR Program has been expanded beyond its pilot, and new participants are enrolled in the program.
• We have also worked with the Aboriginal Human Resources Council to pursue Aboriginal labour, education and recruitment strategies.
Empowering Youth: We are aiming for a total of 5,000 Aboriginal youth to attend Tim Horton Children’s Foundation camps for structured learning by the end of 2014.
• We have hosted 4,000 Aboriginal children and youth at our THCF camps since setting our goal in January 2012.
Economic Development: We are striving for 10 new Aboriginal-owned restaurants or kiosks to be opened on Aboriginal lands by the end of 2014.
• Since 2012, we have opened eight Aboriginal-owned restaurants or self-serve kiosks on Aboriginal lands.
We are aiming for 2,800 farmers to participate in our projects in 2013.
• We had 3,925 farmers participating in our projects in 2013.
We are aiming for 12,000 technical training demonstrations for farmers in 2013 and for 95% of farmers to have a farm management plan over the lifespan of each project.
• We completed 13,920 technical training demonstrations and 76% of our farmers had established farm management plans.
We are aiming to achieve a three-year average of 5,000 hectares of land under environmentally responsible management in 2013.
• Our three-year average of land under environmentally responsible management increased to 7,355 hectares in 2013.
We are aiming for 90% of water to be recycled and/or treated during coffee processing in 2013 and 100% of farmers not to be using banned pesticides.
• We achieved 76% of water recycled and/or treated during coffee processing in 2013 and 100% of project farmers did not use banned pesticides.
COMMUNITIES
Tim Hortons believes it has a positive role to play in enabling communities to thrive and grow.
CH
ILD
RE
NT
IM H
OR
TO
NS
CO
FF
EE
PA
RT
NE
RS
HIP
CO
MM
UN
ITY
SU
CC
ES
S
GOAL MET
GOAL PARTIALLY
MET
GOAL PARTIALLY
MET
GOAL MET
GOAL MET
GOAL MET
ON TRACK
ON TRACK
ON TRACK
ON TRACK
GOAL MET
GOAL MET
GOAL MET
For further details on our 2013 goals and performance, please visit our online Sustainability and Responsibility Report: sustainabilityreport.timhortons.com.

2013 Goal Status Performance Highlights
PackagingWe will implement our standardized process and tools to benchmark the environmental impacts of key packaging formats in order to allow for future goal setting in 2013.
• We completed our benchmarking exercise, assessing over 90% of our guest-facing packaging formats. The results generated short-term opportunities to explore and lessons learned to inform future goal setting.
Waste Diversion at RestaurantsTogether with our Restaurant Owners, we are striving to build on our current level of success and develop a comprehensive waste diversion strategy for our restaurant system.
• We worked on two studies to increase our understanding of the barriers to the acceptance of our hot beverage cup and other food service packaging in municipal recycling programs.
By 2016, we are focused on achieving wide-scale implementation of bottles, cans and cardboard recycling programs and increase the number of restaurants diverting paper packaging (including our hot beverage cups) and organic waste by 20%.
• We met with our Restaurant Owners across Canada as a first phase in developing a comprehensive waste diversion strategy.
Corporate OfficesWe will continue to focus on reducing the environmental impact of our corporate operations and work towards a 10% reduction in energy/water consumption and landfill waste at our corporate offices by the end of 2014.
• We have seen a 35% decrease in water usage and a 2% increase in energy consumption at corporate offices since 2011 (our baseline year).
• In 2013, we validated our 2012 waste baseline data and performed waste audits at our Oakville Corporate Offices.
Manufacturing and DistributionAt our manufacturing and distribution facilities, we are focused on a 10% increase in waste diversion by the end of 2014.
• In 2013, we continued to measure our waste diversion rates, and investigated opportunities for improved waste diversion and data collection.
Transportation EfficiencyWe will continue to reduce the environmental impact of our distribution fleet by working towards a 15% increase in fuel efficiency by the end of 2014.
• We have increased the fuel efficiency of our distribution fleet by 9.7% since 2010. All manual transmission trucks have now been replaced with more efficient automatic transmissions, and we continue to upgrade our fleet and trailers on an annual basis to further increase fuel efficiency.
We will focus on more efficient routing and trailer cube utilization to improve our average cases per kilometre.
• In 2013, we implemented a new system to centrally route and optimize our trailer cube utilization to improve our average cases per kilometre.
Green Building DesignWe will continue to explore LEED applications for our restaurants and are aiming to register a minimum of 30 new restaurants for LEED Certification by the end of 2016. We will continue to test innovative energy and water reduction initiatives for our restaurants.
• We registered three restaurants for LEED Certification in 2013, bringing our total to 17 registered restaurants.
Business Partner and Supplier Code of Conduct (BPSCC)We will continue to refine and implement our BPSCC and our independent verification program by the end of 2013.
• Over 99% of our in-scope vendors signed our BPSCC and we finalized our risk assessment and verification program with an independent auditing organization.
• Since 2011, Control Union Certifications has conducted eight independent verification audits at dry mills of our coffee suppliers in Colombia, Guatemala and Brazil.
Animal WelfareBy 2022, we will source pork from suppliers who have made a transition to alternative open housing. Further, we will work with the pork industry and governments to advance standardized approaches and codes resulting in more humane and sustainable open housing systems. At the same time, we will support efforts to improve traceability systems and verification.
• Engagement and collaboration with our supply chain and the pork industry continued in 2013.
• We hosted an industry-wide Animal Welfare Summit at the University of Guelph, communicating new research on animal welfare and alternative housing systems, consumer expectations and supply chain economics.
We will purchase at least 10% of our egg products, representing significantly more than 10 million eggs, from more humane, alternative hen housing systems by the end of 2013.
• We sourced 10% of our eggs for our egg products from producers utilizing alternative hen housing systems.
• Three new alternative hen housing barns came on-line for Tim Hortons supply in 2013 and we are aiming to achieve 12% sourcing by the end of 2014.
THE PLANET
Tim Hortons understands that changes in the environment need to be managed and embraces our responsibility to do our part.
GOAL MET
GOAL MET
GOAL MET
ON TRACK
ON TRACK
ON TRACK
ON TRACK
ON TRACK
ON TRACK
ON TRACK
EN
vIR
ON
ME
NT
AL
ST
EW
AR
DS
HIP
SU
PP
LY
CH
AIN
GOAL PARTIALLY
MET
Tim Hortons understands that changes in the environment need to be managed and embraces our responsibility to do our part.
For further details on our 2013 goals and performance, please visit our online Sustainability and Responsibility Report: sustainabilityreport.timhortons.com.

* In 2012, we expanded our reporting to include energy, water and GHG emissions data for U.S. standard restaurants
20131 20121 20111 Unit of measurement
TIM HORTONS INC. (CORPORATE OFFICES,
DISTRIBUTION CENTRES, MANUFACTURING FACILITIES
AND CORPORATE RESTAURANTS)2
Energy
Direct Energy Use3 143,209 136,693 120,197 mWhIndirect Energy Use4 33,651 35,835 29,127 mWhTotal Energy Use 176,860 172,528 149,325 mWhEnergy Intensity5 0.000054 0.000055 0.000052 mWh/$ Revenue
Water
Total Water Consumption6 107,339 108,803 90,213 1000 LWater Intensity5 0.000033 0.000035 0.000032 1000 L/$ Revenue
GHG Emissions (CO2e)7
Total CO2e Emissions8 47,398 46,873 41,617 tonnes
RESTAURANTS (CANADIAN AND U.S. STANDARD
RESTAURANTS)9*Energy
Direct Energy Use3 273,994 223,742 204,371 mWhIndirect Energy Use4 1,168,940 1,080,012 861,552 mWhTotal Energy Use 1,442,933 1,303,754 1,065,923 mWhEnergy Intensity10 0.000116 0.000121 0.000211 mWh/restaurant sales ($)
Water
Total Water Consumption6 5,972,480 6,263,817 5,702,908 1000 LWater Intensity10 0.001016 0.001184 0.001130 1000 L/restaurant sales ($)
GHG Emissions (CO2e)7
Total CO2e Emissions11 331,212 312,214 207,240 tonnes
GHG EMISSIONS (CO2e) BY SCOPE12,13
Total Gross Emissions Scope 1 (Direct) 34,056 32,859 28,491 tonnes Total Gross Emissions Scope 2 (Indirect) 5,532 6,874 4,958 tonnes Total Gross Emissions Scope 3 (Other Indirect) 341,205 321,672 217,927 tonnes Total Gross CO2e Emissions 380,793 361,405 251,376 tonnes Total Net CO2e Emissions14 380,787 361,397 251,343 tonnes
Environmental Performance Summary
2013 TIM HORTONS INC. GHG EMISSIONS (47,398 tonnes of CO2e)
Distribution fleet 46%
2013 TIM HORTONS GHG EMISSIONS (380,793 tonnes of CO2e)
88 11 1 46 14 13 2 3 4 8 10
Third-party distribution 14%
Manufacturing operations 13%
Distribution centres 8%
Corporate fleet 10%
Corporate travel 4% Corporate restaurants 3% Corporate offices 2%
88 11 146 14 13 2 3 4 8 10
Franchised
Restaurants (Standard)
88% Tim Hortons Inc. 11%
Tim Horton Children’s Foundation 1%}
Additional footnote information can be found in our online Sustainability and Responsibility Report at sustainabilityreport.timhortons.com/planet_performance_summary.html.
PricewaterhouseCoopers LLP has conducted an independent limited assurance engagement on selected environmental information in our 2013 Sustainability and Responsibility Report. For details, please download a copy of PricewaterhouseCoopers’ Independent Limited Assurance Report at sustainabilityreport.timhortons.com/pdf/2013PWC.pdf.
To learn more about our efforts to reduce our environmental impact, please visit sustainabilityreport.timhortons.com.