Surviving the Scorpion Stings, Toxic Venom Brings Painful Red Ink to USA Steelmakers ASD Spring...
58
Surviving the Scorpion Stings: Toxic Venom Brings Painful Red Ink to USA Steelmakers Presentation at the: Association of Steel Distributors Spring Convention Palm Springs, CA by: Becky E. Hites, President April 24, 2015
-
Upload
becky-e-hites -
Category
Documents
-
view
126 -
download
1
Transcript of Surviving the Scorpion Stings, Toxic Venom Brings Painful Red Ink to USA Steelmakers ASD Spring...

Surviving the Scorpion Stings: Toxic Venom Brings Painful Red Ink to USA
SteelmakersPresentation at the:
Association of Steel Distributors Spring ConventionPalm Springs, CA
by: Becky E. Hites, President
April 24, 2015

USA Steel Industry is Traversing Death Valley
• USA steel producers utilization rate dropped below 68% the first week of April, a level not seen since Nov 2010.
• Imports were 39-38% of apparent USA steel consumption in January/February.
• Flat rolled prices have dropped to $420 per ton, down 39% from the year ago peak of $686 per ton.
• First quarter earnings reports are coming in down but not “abysmal”.
2

Is that an Oasis on the Horizon, or is it a Mirage?
• Steel Market Update’s most recent mill lead times survey showed the “extremely short” category dropping to 32 from 48 shifting to “shorter than normal” at 56 from 48 and “normal” increasing to 8 from 4 and “slightly longer than normal” at 4 from 0.
• SMU’s service center inventory survey has 51% “reducing inventory”, down from 57% and the recent peak of 66%. The “building inventory” category is still a low 9%.
• Mill lead times are minimal BUT there are reports of at least one EAF flat rolled mill running full. Bookings are reportedly improving at other EAF flat mills.
3

Most Places I’ve Been in Recent Months Have Had Construction Cranes
4
ATLANTA WASHINGTON, DC MIAMINASHVILLE PITTSBURGH CONNECTICUT

Indicating Demand is Improving
5
MARYLAND MARYLAND VIRGINIA VIRGINIA CINCINNATI CINCINNATI

Lots of Activity in New York City
6
FLUSHING MEADOWS SOHO MIDTOWNSTATEN ISLAND TARRYTOWN GW BRIDGE

S-I’s Leading Economic Indicators have Pulled Back at 46% Positive for February, Down from 57% in December,
But Up from 43% in January
7
Jan Feb Mar Apr May Jun Jul Aug Sep Oct Nov Dec Jan Feb Mar AprArchitectural Billings IndexAuto Light Vehicle SalesAuto Light Vehicle Sales-TTMMAAuto ProductionAuto Production-TTMMAChicago Purchasing Managers IndexChicago Purchasing Managers Index-TTMMAConsumer Confidence, Conference Board IndexConsume Confidence-TTMMA, Conference Board IndexConsumer Sentiment, University of MichiganConsumer Sentiment-TTMMA, University of MichiganHousing StartsHousing Starts-TTMMAIndustrial Production, Manufacturing, Not-Seasonally AdjustedIndustrial Production, Seasonally Adjusted (INDPRO)Interest Rates, 10-Year TreasuriesMachine Tool OrdersMachine Tool Orders-TTMMAManufacuring SalesManufacuring Sales-TTMMANatural Gas Prices, Henry HubNew Orders Index, ISMNew Orders Index-TTMMA, ISMNew Orders, Durable Goods, Electrican & ApplianceNew Orders, Durable Goods, Electrican & Appliance-TTMMANon-Defence Capital Goods Orders, Excluding AircraftNon-Defence Capital Goods Orders, Excluding Aircraft-TTMMANon-Residential Construction (SAAR)Non-Residential Construction (SAAR)-TTMMAOil Prices, Brent Crude, EuropeOil Prices, West Texas Intermediate, OklahomaPersonal Consumption Expenditures Durable GoodsPersonal Consumption Expenditures Durable Goods-TTMMAUS Trade Weighted Dollar IndexUS Trade Weighted Dollar Index-TTMMA
Positive 13 22 24 22 21 29 22 21 24 20 19 20 15 16 11Neutral 1 1 0 2 0 0 1 1 0 0 1 0 2 0 0Negative 21 12 11 11 14 6 12 13 11 15 15 15 18 19 9
% Positive 37% 63% 69% 63% 60% 83% 63% 60% 69% 57% 54% 57% 43% 46% 55%
Code: red=down; green=up; grey=sideways; white=no new data yet
2014
Leading & Other Economic Indicators Heat Map-Month to Month Change
2015

NABE April 2015 Business Conditions Survey –Marked Deceleration
• "The April 2015 NABE Business Conditions Survey results indicate a marked deceleration in growth across the board in the first quarter," said Survey Chair Jim Diffley, senior director, IHS."However, the panel did not pull back on bullish expectations for the upcoming quarter."
• "Over the past three months, the prices of crude oil and the dollar have not had a material impact on the outlook for the majority of respondents' firms," said NABE President John Silvia, chief economist at Wells Fargo. "Due to unusually harsh weather and dock strikes on the West Coast, growth in the first quarter appears to be an outlier within the broader economic outlook."
8

So Demand is By No Means Secure, and the Environment Feels “Uncertain”
9

Inventories Are At Relatively Low Levels Historically 2008 Changed Industry Practices
10
5
7
9
11
13
15
17
Jan-
99
Jul-9
9
Jan-
00
Jul-0
0
Jan-
01
Jul-0
1
Jan-
02
Jul-0
2
Jan-
03
Jul-0
3
Jan-
04
Jul-0
4
Jan-
05
Jul-0
5
Jan-
06
Jul-0
6
Jan-
07
Jul-0
7
Jan-
08
Jul-0
8
Jan-
09
Jul-0
9
Jan-
10
Jul-1
0
Jan-
11
Jul-1
1
Jan-
12
Jul-1
2
Jan-
13
Jul-1
3
Jan-
14
Jul-1
4
Jan-
15
Mill
ion
Net
Ton
s
USA Steel Service Center Inventories
Source: Metal Service Center Institute
Trailing Twelve Month Moving Average

Flat Rolled Inventories Not “High”, But Not “Low”;Still an Overhang
11
2
3
4
5
6
7
8
9
10
11
Jan-
99
Jul-9
9
Jan-
00
Jul-0
0
Jan-
01
Jul-0
1
Jan-
02
Jul-0
2
Jan-
03
Jul-0
3
Jan-
04
Jul-0
4
Jan-
05
Jul-0
5
Jan-
06
Jul-0
6
Jan-
07
Jul-0
7
Jan-
08
Jul-0
8
Jan-
09
Jul-0
9
Jan-
10
Jul-1
0
Jan-
11
Jul-1
1
Jan-
12
Jul-1
2
Jan-
13
Jul-1
3
Jan-
14
Jul-1
4
Jan-
15
Mill
ion
Net
Ton
s
USA Steel Service Center Carbon Flat Rolled Inventories
Source: Metal Service Center Institute
Trailing Twelve Month Moving Average

Flat Rolled Taking Bigger Share of Service Center Shipments
12
Total CarbonSteel Flat Carbon Carbon Carbon
Products Rolled Plate Bars Structurals
2007 52,067 31,907 5,295 4,833 4,6062008 46,652 27,485 5,249 4,554 4,2612009 29,540 17,868 2,955 2,621 2,6372010 35,666 22,374 3,456 3,240 2,5582011 41,650 25,764 4,217 3,564 2,6542012 43,437 26,262 4,279 3,438 2,7452013 41,360 26,918 4,109 3,201 2,6382014 43,063 28,040 4,391 3,293 2,706
2007 61.3% 10.2% 9.3% 8.8%2008 58.9% 11.3% 9.8% 9.1%2009 60.5% 10.0% 8.9% 8.9%2010 62.7% 9.7% 9.1% 7.2%2011 61.9% 10.1% 8.6% 6.4%2012 60.5% 9.9% 7.9% 6.3%2013 65.1% 9.9% 7.7% 6.4%2014 65.1% 10.2% 7.6% 6.3%
Source: MSCI
Service Center Shipments
(% of total)
(thousand tons)

USA Mill Shipments to Service Centers Declining Through 2013
13
10
15
20
25
30
35
1974
1975
1976
1977
1978
1979
1980
1981
1982
1983
1984
1985
1986
1987
1988
1989
1990
1991
1992
1993
1994
1995
1996
1997
1998
1999
2000
2001
2002
2003
2004
2005
2006
2007
2008
2009
2010
2011
2012
2013
Mill
ion
Tons
USA Mill Shipments to Service Centers
Source: AISI

USA Shipments Through Service Centers StableBut Below Peak Levels
14
0
10
20
30
40
50
60
1981
1982
1983
1984
1985
1986
1987
1988
1989
1990
1991
1992
1993
1994
1995
1996
1997
1998
1999
2000
2001
2002
2003
2004
2005
2006
2007
2008
2009
2010
2011
2012
2013
2014
Mill
ion
Tons
USA Service Center Shipments
Source: MSCI
Service Centers, Construction & Automotive Account for almost 2/3rds of USA Steel Mill Shipments
15

Non-Residential Construction Has Been in a Solid Up-Trend; But the TTMMA Looking Vulnerable
16

Residential Construction Firmed Through 2014; But Flattish Recently, and Not Definitive
17

Automotive Production at Great Levels, But Again the TTMMA Looks a Bit Weak
18

Looking on the Supply Side, USA Steel Production is Well Below the Level Indicated by Demand
19

Imports Have “Taken” the Demand Recovery, and Were 39% of ASC in January
20

Imports Annualized on a Trailing Twelve Month Moving Average Basis Through March Were 46.5 Million Tons Compared to
Exports of 11.9 Million Tons
21

The Strong Dollar Has Reduced Non-USA Steel Producers Costs; Challenging USA Mills Global Market Competitiveness
22

Imports Are Likely to Continue at High Levels
• Strength of the dollar has lowered non-USA producers cost of production.
• Global overcapacity of perhaps 300-600 million tonnes in a 1.6 billion tonne market, or 30%.
• China claims they’ll have their overcapacity under control by 2017. Currently there’s a shake-up happening at the provincial government level under the anti-corruption campaign. Taking out everyone over 55 according to some economic sources.
• USA could have the leading GDP growth rate of the world according to some economists – a scary thought.
• Europe’s financial health remains in jeopardy.• USA trade discussions so far have been largely ineffective. Lots
of talk, and not so much action (drawing from Toby Keith – I hear there’s a big country music event happening here this weekend).
23

Exports Are Likely to Remain Under Pressure
• Strength of the dollar means non-USA producers are willing to sell for less, because their home currencies are worth “more” on a relative basis than a year or two earlier. (Side bar: For the past few years, the currency relationship has been in our favor and the Europeans have been “hurting” trying to compete.)
• Recent capacity additions in South Korea, Russia as well as China are looking for a home.
• China adding another 25 million tonnes of capacity this year. • China produces half of the world’s steel, but represents only 25% of
global trade.• Exports from China will likely be curbed in the long run. It’s not the
leadership’s goal to continue supporting growth of the industry. However, it’s unlikely they’ll ever become “insignificant” on the global market.
• In the GCC Region, it’s reported that the Saudi’s are offering HRB delivered to the plant for $420 per tonne in 3 days by truck.
24

Global Trade up 10%; Back at Recent 2007 Peak
25

Flat Products Still Dominate Global Trade
26
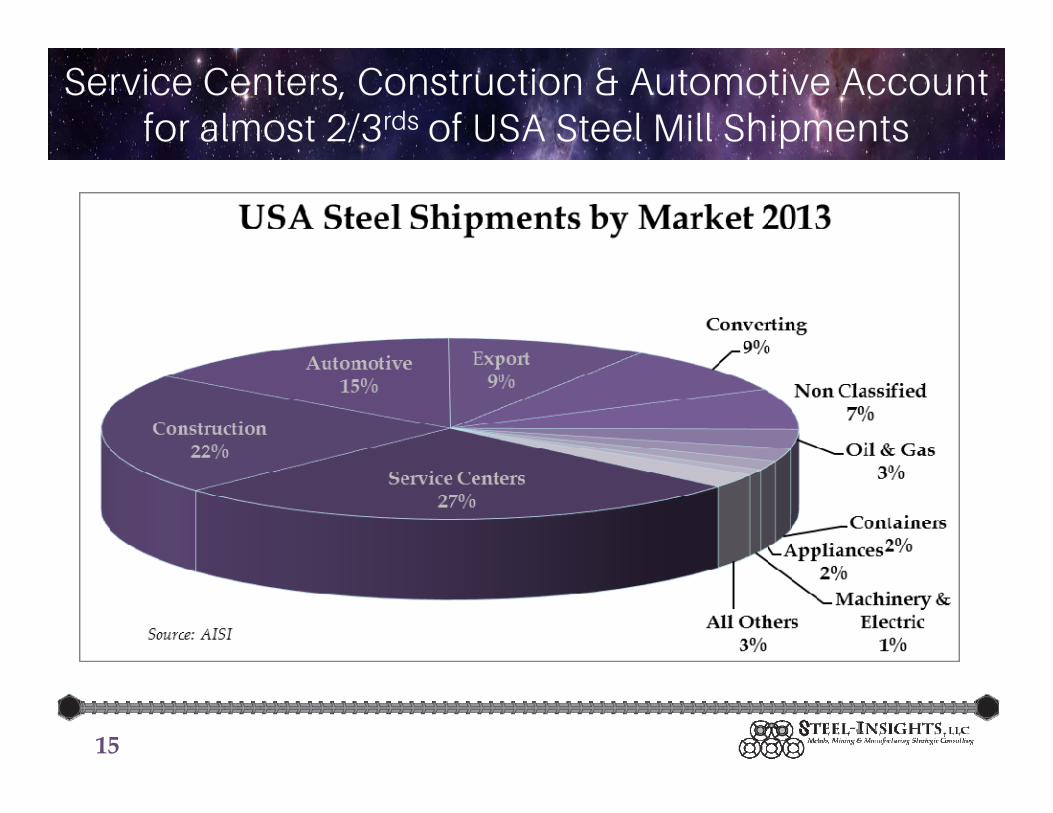
NAFTA Imports – China is 5th on the List(For the USA - UK 1.3; Germany 1.2; Netherlands 0.86; Italy 0.7)
EU by Product to the USA: HR Wide Strip 1.0, Seamless Tube 0.9, Semis 0.8)
27
Source: ISSB – used with permission

USA Apparent Steel Consumption on an Annualized TTMMA Basis Through February Was 131.4 Million Tons Compared to the 116.4
Million TPY Rate in February 2014
28
60
70
80
90
100
110
120
130
140
150
160
Jan-
84
Jan-
85
Jan-
86
Jan-
87
Jan-
88
Jan-
89
Jan-
90
Jan-
91
Jan-
92
Jan-
93
Jan-
94
Jan-
95
Jan-
96
Jan-
97
Jan-
98
Jan-
99
Jan-
00
Jan-
01
Jan-
02
Jan-
03
Jan-
04
Jan-
05
Jan-
06
Jan-
07
Jan-
08
Jan-
09
Jan-
10
Jan-
11
Jan-
12
Jan-
13
Jan-
14
Jan-
15
Thou
sand
Ton
s
USA Monthly Apparent Steel ConsumptionTwelve Month Moving Average
Source: AISI

Despite the OK TTMMA Trend, USA Monthly Apparent Steel Consumption Not Inspiring Confidence – Looks Vulnerable to a Technical Breakdown;
Maybe Already Has
29
4,000
5,000
6,000
7,000
8,000
9,000
10,000
11,000
12,000
13,000
14,000
Jan-
84
Jan-
85
Jan-
86
Jan-
87
Jan-
88
Jan-
89
Jan-
90
Jan-
91
Jan-
92
Jan-
93
Jan-
94
Jan-
95
Jan-
96
Jan-
97
Jan-
98
Jan-
99
Jan-
00
Jan-
01
Jan-
02
Jan-
03
Jan-
04
Jan-
05
Jan-
06
Jan-
07
Jan-
08
Jan-
09
Jan-
10
Jan-
11
Jan-
12
Jan-
13
Jan-
14
Jan-
15
Thou
sand
Ton
s
USA Monthly Apparent Steel Consumption
Source: AISI
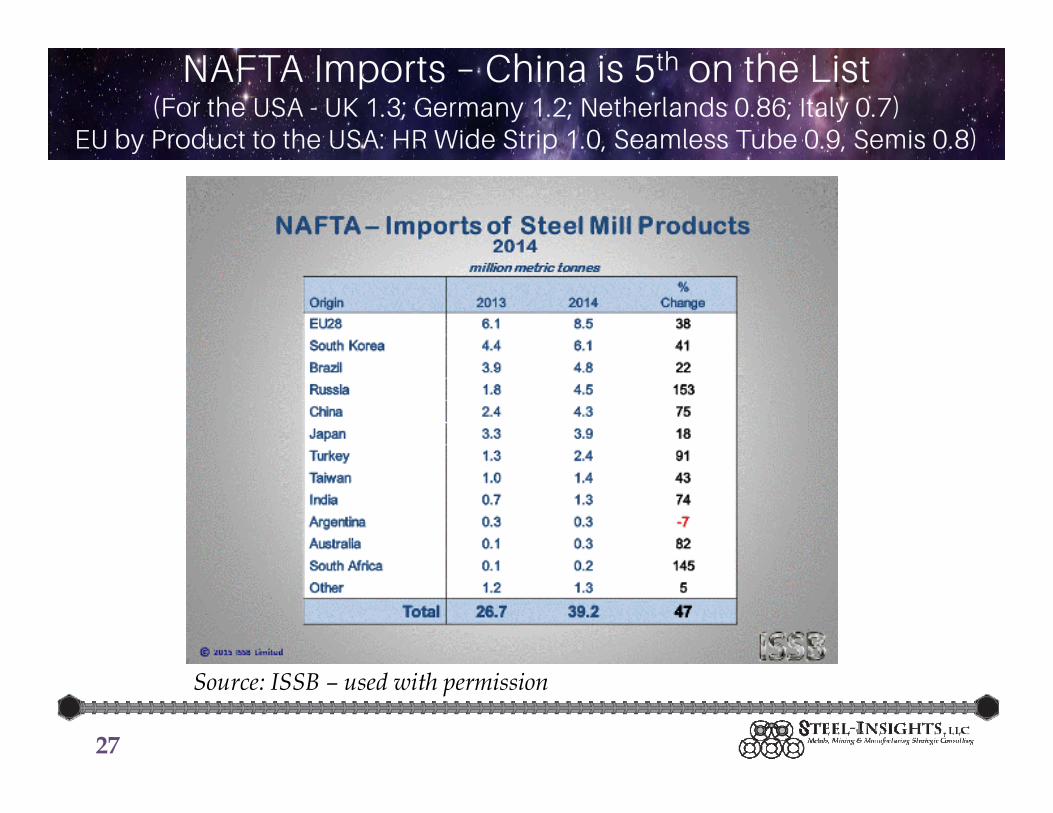
Spinning the Price Odds Wheel – While the Recovery is Vulnerable, Prices Have Probably Hit the Bottom
30

USA Shipments and Consumption Were Both Up in 2014. 2015 ASC Likely to Be Up, But Not Shipments
31
Less SemisShipments Imports Imports Exports ASC Y-t-Y Chg
2000 109.6 38.7 6.8 6.6 134.8 5.8%2001 98.6 30.2 5.5 6.1 117.0 -13.2%2002 99.0 32.7 8.2 6.0 117.4 0.4%2003 104.6 23.0 4.8 8.2 114.6 -2.4%2004 111.0 35.8 7.2 7.9 131.6 14.8%2005 103.2 32.1 6.9 9.5 118.9 -9.6%2006 108.6 45.3 9.3 9.7 134.9 13.4%2007 106.1 33.2 6.6 11.1 121.7 -9.8%2008 98.4 32.4 5.9 13.4 111.4 -8.4%2009 60.3 16.2 2.0 9.3 65.3 -41.4%2010 83.4 23.9 5.0 12.0 90.3 38.3%2011 91.9 28.5 6.6 13.5 100.3 11.1%2012 95.9 33.5 7.6 13.7 108.1 7.7%2013 95.4 32.2 7.3 12.7 107.6 -0.4%2014 98.2 44.3 9.6 12.0 120.9 12.4%2015e 95.9 48.1 10.4 10.8 122.8 1.5%
Source: AISI & Steel-Insights estimates
USA Steel Shipments, Imports, Exports & Consumption(million tons)

Domestic Shipments at 1.655 Million Tons Per Week, or a 77.5 Million Finished Ton Annualized Rate
32
800
1,000
1,200
1,400
1,600
1,800
2,000
2,200
2,400
2,600
2,800
1980
1981
1982
1983
1984
1985
1986
1987
1988
1989
1990
1991
1992
1993
1994
1995
1996
1997
1998
1999
2000
2001
2002
2003
2004
2005
2005
2006
2007
2009
2009
2010
2011
2012
2013
2014
Thou
sand
Ton
s
Weekly Estimated USA Crude Steel Production
Source: AISI

EAF-Based Steelmaking Dominates Now, But Hasn’t Taken More Share in the Last Few Years
33
15
25
35
45
55
65
75
Mill
ion
Net
Ton
s
USA BOF and EAF Annualized MonthlyCrude Steel Production
BOF
EAF
Source: AISI

EAF Steelmaking Represents 59-63% of the USA Market
34
35%
40%
45%
50%
55%
60%
65%
70%
Perc
ent o
f Tot
al
USA EAF Percent of Total Crude Steel Production
Source: AISI

USA Finished Product Shipments Increased 3%; Sheet Still Dominates at 54%
35

USA Steel Market 2014 Shipments Up in Sheet, Plate Bar & Semi-Finished.
36
0
20,000
40,000
60,000
80,000
100,000
120,000
2006
2007
2008
2009
2010
2011
2012
2013
2014
Thou
sand
Ton
s
USA Steel Shipments by Product Type
Sheet Plate Tin Semi-Finished Bar Shapes & Piling Pipe & Tube Wire Rail
Source: AISI

USA HRB/CRC Shipments Flat For Three Years
37
0
10,000
20,000
30,000
40,000
50,000
60,000
70,000
2006
2007
2008
2009
2010
2011
2012
2013
2014
Thou
sand
Ton
s
USA Sheet Shipments
Hot Rolled Sheet
Cold Rolled Sheet
Galvanized Hot Dip
Source: AISI
EG
Cold Rolled Sheet
Galvanized Hot Dip
Other Coated, Electrical Steel, Strip

USA Plate Market Up Modestly Last Two Years
38
0
2,000
4,000
6,000
8,000
10,000
12,000
2006
2007
2008
2009
2010
2011
2012
2013
2014
Thou
sand
Ton
s
USA Plate Shipments
Cut Lengths
Source: AISI
In Coils

USA Shapes & Piling Market Sideways
39
0
1,000
2,000
3,000
4,000
5,000
6,000
7,000
8,000
9,000
10,000
2006
2007
2008
2009
2010
2011
2012
2013
2014
Thou
sand
Ton
s
USA Structural Shapes (over 3") & Piling Shipments
Structural Shapes Over 3"
Source: AISI
Piling

USA Pipe & Tube Market Likely to Show a Reversal in 2015
40
0
1,000
2,000
3,000
4,000
5,000
6,000
2006
2007
2008
2009
2010
2011
2012
2013
2014
Thou
sand
Ton
s
USA Pipe & Tube Shipments
OCTG
Source: AISI
Mechanical Tubing
Standard Pipe
Line Pipe
Other Pipe & Tube

The World Changes; The Only Way to “Win” Is To Anticipate and Adapt – Critical Resources of the Past Can
Become Irrelevant to the Future
41
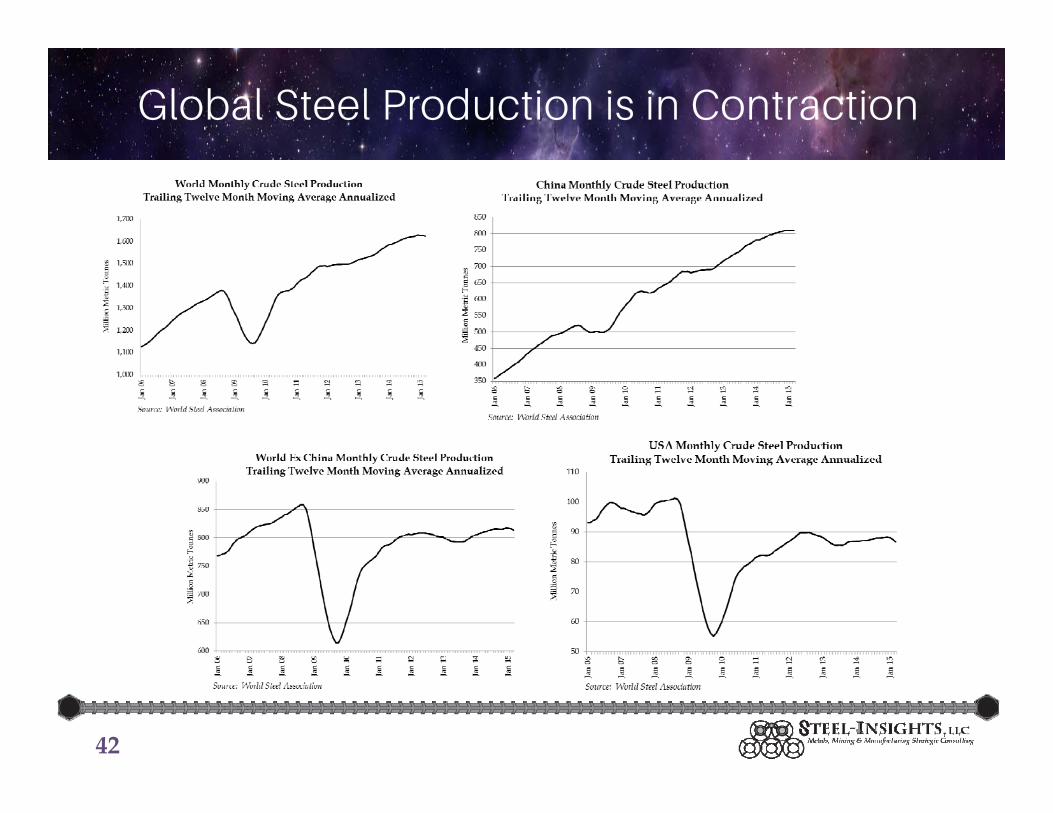
Global Steel Production is in Contraction
42

China’s 10-Day Annualized Run Rate – Has Been Sideways Before – Too Early To Tell If a Contraction There Yet – It’s
Expected Though
43

44
Global Crude Steel Production - China Up 54 Million Tonnes in 2013, and 8 Million Tonnes in 2014
2000 2005 2010 2011 2012 2013 2014e 2015e 2013-14 2014-15
China 128.5 355.8 638.7 702.0 724.7 815.0 822.7 814.0 0.9% -1.1%Japan 106.4 112.5 109.6 107.6 107.2 110.6 110.7 110.9 0.1% 0.2%India 26.9 45.8 69.0 73.5 77.6 81.2 83.2 84.9 2.5% 2.0%South Korea 43.1 47.8 58.9 68.5 69.1 66.0 71.0 72.5 7.6% 2.0%Other Asia 26.9 37.3 41.4 42.9 41.2 42.3 42.7 43.0 1.0% 0.8%EU-27 193.4 195.6 172.8 177.7 168.6 167.0 170.6 172.0 2.2% 0.8%Russia 59.1 66.1 66.9 68.9 70.4 69.4 70.7 72.8 1.8% 3.0%Ukraine 31.8 38.6 33.4 35.3 33.0 32.8 27.2 23.1 -17.2% -15.0%Other CIS 7.6 8.4 7.8 8.5 7.6 6.5 7.3 7.6 11.6% 4.4%Turkey 14.3 21.0 29.1 34.1 35.9 34.7 34.0 34.7 -1.8% 2.0%Other Europe 109.2 138.0 134.1 143.3 143.3 140.9 136.2 135.0 -3.3% -0.9%NAFTA 135.4 127.6 111.6 118.7 121.6 119.3 121.2 116.5 1.7% -3.9%USA 101.8 94.9 80.5 86.4 88.7 87.0 88.3 83.3 1.6% -5.7%South America 39.1 45.3 43.9 48.2 46.4 46.0 45.2 44.2 -1.8% -2.3%Middle East 10.8 15.3 20.0 23.0 24.7 25.9 28.1 28.4 8.4% 1.3%Africa 13.8 18.0 16.6 15.7 15.3 15.8 15.7 15.6 -0.7% -0.3%Oceania 7.8 8.6 8.1 7.2 5.8 4.6 4.6 4.5 -0.8% -2.5%
Total Global 849 1,156 1,433 1,537 1,553 1,641 1,659 1,649 1.1% -0.6%Developed World 544 574 528 547 541 538 539 534 0.2% -0.8%Developing World 305 582 905 990 1,012 1,103 1,120 1,115 1.5% -0.5%
Developed % of Total 64% 50% 37% 36% 35% 33% 32% 32%Developing % of Total 36% 50% 63% 64% 65% 67% 68% 68%
Source: World Steel Association, China Iron and Steel Association & Steel-Insights, LLC estimates
Crude Steel Production by Region(million tonnes)

Developing World is Growing While the Developed World is Contracting
45
EU 27 CISOther
Europe NAFTA ChinaOther
AsiaSouth
AmericaMiddle
East Africa Oceania Global
2001 -3.1% 1.1% 1.4% -11.4% 18.0% -0.6% -4.4% 8.4% 7.9% 0.0% 0.3%2002 0.4% 1.6% 3.9% 2.6% 20.2% 5.2% 9.3% 6.9% 6.0% 5.9% 6.2%2003 2.3% 5.2% 52.0% 2.6% 22.0% 4.0% 5.3% 7.6% 3.0% 1.3% 8.3%2004 5.1% 6.5% 9.7% 6.2% 22.7% 4.4% 6.6% 6.0% 2.6% -1.2% 9.3%2005 -3.3% -0.1% 3.3% -4.8% 30.4% 5.5% -1.2% 7.0% 7.4% 4.2% 8.0%2006 6.0% 5.9% 9.6% 3.3% 18.3% 4.4% -0.1% 0.8% 4.2% 0.5% 8.9%2007 1.4% 3.6% -15.9% 0.6% 16.3% 5.7% 6.6% 7.0% -0.1% 1.1% 7.1%2008 -5.5% -7.9% 3.6% -6.1% 4.6% 1.1% -1.8% 1.2% -9.1% -4.1% -0.4%2009 -29.8% -14.6% -8.3% -33.7% 12.6% -13.8% -20.3% 6.7% -9.3% -28.6% -7.9%2010 24.0% 10.8% 16.0% 35.1% 10.7% 19.1% 16.2% 12.6% 7.9% 35.5% 15.8%2011 2.8% 4.1% 16.1% 6.4% 9.9% 4.9% 9.7% 15.2% -5.6% -11.1% 7.3%2012 -5.1% -1.5% 1.9% 2.5% 3.2% 0.9% -3.7% 7.2% -2.3% -19.9% 1.1%2013 -1.0% -2.0% -3.1% -1.9% 12.5% 1.7% -0.8% 4.9% 2.8% -20.0% 5.7%2014 2.2% -3.4% -0.7% 1.7% 0.9% 2.5% -1.8% 8.4% -0.7% -0.8% 1.1%2015e 0.8% -1.6% 1.8% -3.9% -1.1% 1.2% -2.3% 1.3% -0.3% -2.5% -0.6%
Source: World Steel Association & Steel-Insights estimates
Crude Steel Production Year-Over-Year by Region(Percentage Change)

Colonial Model of Supply No Longer Holds True as Half of Global Crude Steel Production is in the Developing World Countries
46

China Net Exports at 79 Million Tonnes in 2014 –and a 109 Million Tonne Rate So Far For 2015
(10.3 million tonnes in Jan, 7.8 million tonnes in Feb)
47
2003 2004 2005 2006 2007 2008 2009 2010 2011 2012 2013 2014e 2015eChinaImports 43.2 33.2 27.3 19.1 17.2 15.6 22.4 17.2 16.3 14.2 14.8 14.4 Exports 8.2 20.1 27.4 51.7 66.4 56.3 24.0 41.6 47.9 54.8 61.5 93.8 108.5 Net Exports (35.0) (13.1) 0.1 32.6 49.2 40.7 1.6 24.5 31.6 40.6 46.8 79.4
Imports Long Products 2.8 2.8 2.3 2.0 1.6 1.5 1.7 2.0 1.8 1.5 1.7 3.2 Exports Long Products 3.1 5.7 7.7 15.1 23.6 18.5 5.5 9.2 11.6 17.6 23.5 36.2 Net Exports Long 0.4 2.8 5.5 13.1 21.9 17.0 3.8 7.2 9.8 16.0 21.8 33.1
Imports Flat Products 33.3 25.1 22.5 15.5 14.3 12.7 15.3 13.9 13.2 11.7 11.9 10.6 Exports Flat Products 1.8 5.8 8.5 20.4 28.3 28.8 11.8 24.8 26.6 27.0 27.6 36.6 Net Exports Flat (31.4) (19.3) (14.0) 4.8 14.0 16.1 (3.4) 10.9 13.4 15.3 15.8 26.0
Imports Tubulars 1.1 1.3 1.1 1.0 0.7 1.0 0.7 0.5 0.6 0.5 0.5 0.7 Exports Tubulars 1.4 2.1 3.5 6.5 7.3 7.2 6.3 7.3 9.4 9.9 10.1 13.9 Net Exports Tubulars 0.3 0.7 2.4 5.5 6.6 6.2 5.6 6.7 8.8 9.5 9.6 13.2
Note: 2015 estimated based on reported results through February.
Source: World Steel Association, World Steel Dynamics, SBB Platts, Bloomberg and Steel-Insights, LLC estimates
China Steel Net Exports(million tonnes)

China Exports by Product Category
48
Year 2011 2012 2013Export Change Y‐t‐Y % of
by volume % Chg Total
Flat Products 26.58 26.75 27.64 43.67 16.03 58.0% 46.6%Bar & Wire 6.69 11.49 17.11 30.86 13.75 80.4% 32.9%Pipe & Tube 9.23 9.63 9.57 10.06 0.49 5.1% 10.7%Sections 2.57 3.35 4.1 4.60 0.50 12.2% 4.9%Others 3.27 3.97 3.54 4.00 0.46 13.0% 4.3%Rail 0.64 0.54 0.38 0.59 0.21 55.3% 0.6%Total 48.98 55.73 62.34 93.78 31.44 50.4%
Source: WSD estimates
2014
China Steel Product Exports(million tonnes)

World Export Price Now at $399 Per Tonne; USA at $420 per Net Ton
49

USA Hot-Rolled Price Spread to the World Well Below the $100-150 Per Tonne That Normally Attracts Increased Imports
50

Integrated Metallic Cost Has Probably Bottomed(Iron Ore-$48 ; Coking Coal $92 FOB, Coke $215 Europe)
51
150
200
250
300
350
400
450
500
550
600
650
Jan-
09M
ar-0
9M
ay-0
9Ju
l-09
Sep-
09N
ov-0
9Ja
n-10
Mar
-10
May
-10
Jul-1
0Se
p-10
Nov
-10
Jan-
11M
ar-1
1M
ay-1
1Ju
l-11
Sep-
11N
ov-1
1Ja
n-12
Mar
-12
May
-12
Jul-1
2Se
p-12
Nov
-12
Jan-
13M
ar-1
3M
ay-1
3Ju
l-13
Sep-
13N
ov-1
3Ja
n-14
Mar
-14
May
-14
Jul-1
4Se
p-14
Nov
-14
Jan-
15M
ar-1
5
$ pe
r Met
ric T
onne
Cost of BF/BOF Metallics - Iron Ore x 1.55 + Coal x (1.5*0.6)
Source: Vale, The Steel Index and Steel Market Update

EAFs More Cost Competitive Than in 2014;Scrap Has Stabilized at $230-260 Per Ton
52
0.50
0.70
0.90
1.10
1.30
1.50
1.70
Jan-
09M
ar-0
9M
ay-0
9Ju
l-09
Sep-
09N
ov-0
9Ja
n-10
Mar
-10
May
-10
Jul-1
0Se
p-10
Nov
-10
Jan-
11M
ar-1
1M
ay-1
1Ju
l-11
Sep-
11N
ov-1
1Ja
n-12
Mar
-12
May
-12
Jul-1
2Se
p-12
Nov
-12
Jan-
13M
ar-1
3M
ay-1
3Ju
l-13
Sep-
13N
ov-1
3Ja
n-14
Mar
-14
May
-14
Jul-1
4Se
p-14
Nov
-14
Jan-
15M
ar-1
5
Rat
io
Ratio #1 Heavy Melt Scrap Cost to Cost of BF/BOF Metallics - Iron Ore x 1.55 + Coal x (1.5*.6)
Source: Steel-Insights estimates

Typical Down Cycle Closure Announcements
• Detroit blast furnace hot idled• There are a number of blast furnaces
down for maintenance right now• EAFs took early maintenance outages –
will likely pick up market share in the near term here
• Small privately held service center bankruptcies
53
Globally Steel Must Evolve and Respond, or Face Market Share Loss
Customers will continue to demand less price volatility, or a better option for dealing with the environment.
– Aluminum prices have been more volatile than steel prices over the cycle, but financial products are in place to provide a sense of predictability, and thus, security.
– The steel industry’s distrust of financial instruments mirrors the aluminum industry 20 years ago.
– The mills saying “trust us, we’ll take care of you” doesn’t cut it. Need a way to deal with the raw material price volatility.
54
It’s a New Day With Customers
• Need to not only:– 1) meet the need;– 2) make it easy; but also– 3) make it enjoyable.
• By the time someone reaches out to customer service, the relationship has already broken down.
• Cultural shift to more self service.• Requires more market transparency.Source: Mark Bula, Big River Steel & Outside In
55

Steel-Insights, LLC – “Seeing” What Others Don’t
56
In WWII, American submarine commanders endured despite being outclassed by superior equipment and outgunned (fully functioning torpedoes weren’t available to them for the first 21 months of the Pacific War). In the fog of war, as often is the case in business, decisions with long impacting outcomes have to be made without the luxury of complete or definitive information.
Steel-Insights was formed to assist executive management teams navigate the “noise of battle” by more effectively managing the abundant resources available today and
harnessing those resources to explore thought provoking and penetrating issues in order to magnify the pivotal decisions required for the long-term success of their companies in arguably tough industries that must survive challenging cycles, i.e. training and empowering submarine commanders.
www.steel-insights.com

This document and all content hereof are intended for informational purposes only and none of the information contained herein or opinions expressed herein should be viewed as an offer or solicitation to buy, sell or otherwise trade futures, options-on-futures, commodities, options, securities or any other investments mentioned herein. All opinions and information contained herein constitute the judgments of Steel-Insights, LLC or its affiliates (collectively “Steel-Insights”) as of the date of this document and are subject to change without notice. Steel-Insights and its directors, members, officers and employees may, directly or indirectly, effect or have effected a transaction for Steel-Insights’ own account in any investment referred to herein, either before or after the material is published, or may give advice to customers which may differ from or be inconsistent with the information and opinions contained herein or may from time to time hold long or short positions in, buy or sell (on a principal basis or otherwise), or act as market maker in, securities, derivatives, futures or other financial instruments or products related to matters discussed herein and may make trading decisions that are different from or contrary to any of those which may be discussed.. The information contained herein is based on data obtained from recognized statistical services and other sources believed to be reliable. However, such information has not necessarily been verified by Steel-Insights, and Steel-Insights does not make any representations as to its accuracy, currency, reliability, effectiveness or completeness. Steel-Insights may from time to time issue futures reports based on fundamentals, such as expected trends in supply and demand, as well as reports based on technical factors, such as price and volume movements. Since such reports rely upon different criteria, there may be instances when Steel-Insights’ conclusions in individual reports are not in concert. Additional information on futures and options-on-futures is available upon request. Trading in futures and options on futures is not appropriate for all persons, as the risk of loss is substantial. Therefore only risk capital should be used in futures trading. Information contained herein was prepared without regard to the specific investment objectives, financial situation or needs of any particular participant. Speak to your Financial Advisor to assess whether such trading is appropriate for you. Steel-Insights is not an adviser as to legal, taxation, accounting or regulatory matters in any jurisdiction, and is not providing any advice as to any such matter to the recipient. This material does not constitute a personal recommendation or take into account the particular investment objectives, financial situations, or needs of individual clients. The recipient of this material should take their own independent advice with respect to such matters. You should be aware of the risks of trading equities, fixed income, foreign exchange or derivative instruments or in non-liquid or emerging market investments. Derivatives generally involve leverage and are therefore more volatile than their underlying cash investments. Your capital may be at risk. Products and services mentioned herein may not have regard to your specific investment objectives, financial situation or particular needs. PAST PERFORMANCE IS NOT NECESSARILY INDICATIVE OF FUTURE RESULTS. THE RISK OF LOSS ASSOCIATED WITH FUTURES ANDOPTIONS TRADING CAN BE SUBSTANTIAL. All information contained herein is intended solely for your own personal, informational use, and you are not permitted to reproduce, retransmit, disseminate, sell, license, distribute, republish, broadcast, post, circulate or commercially exploit the information in any manner or media without the express written consent of Steel-Insights, or to use the information for any unlawful purpose. This document and all information herein is comprised of information, data and other material owned by either Steel-Insights or its data providers, which is protected under copyright, trademark and other intellectual property laws. Steel-Insights and its data providers, as applicable, own all rights, title and interest, including without limitation, all copyrights, in and to all content of this document. All trademarks, service marks, and logos used in the document are the trademarks, service marks, or logos of Steel-Insights or its data providers, as applicable. You may not use such names or logos without the prior written consent of the relevant owner thereof. Other than the right to access the document and view the information contained therein under the terms and conditions set forth herein, you acquire no ownership, title, right or interest of any kind in or to any of the content of this document. THIS PUBLICATION AND ALL CONTENT HEREOF ARE PROVIDED SOLELY ON AN AS IS BASIS, WITHOUT ANY REPRESENTATION OR WARRANTY OF ANY KIND, EXPRESS OR IMPLIED, AND STEEL-INSIGHTS HEREBY DISCLAIMS ALL SUCH REPRESENTATIONS AND WARRANTIES, INCLUDING WITHOUT LIMITATION THE IMPLIED WARRANTIES OF FITNESS FOR A PARTICULAR PURPOSE AND NON-INFRINGEMENT. ANY USE OF OR RELIANCE UPON THIS PUBLICATION, IN WHOLE OR IN PART, IS SOLELY AT THE USER’S OWN RISK. © Steel-Insights, LLC.
Disclaimer & Copyright

Conclusion & Questions
58