Surveys of a Finite Parts List - Gerstein Labbioinfo.mbb.yale.edu/lectures/t2000/talk.pdf1 (c) Mark...
60
1 (c) Mark Gerstein, 2000, Yale, bioinfo.mbb.yale.edu Analysis of Genomes & Transcriptomes in terms of the Occurrence of Parts and Features: Surveys of a Finite Parts List Mark Gerstein Molecular Biophysics & Biochemistry and Computer Science, Yale University H Hegyi, J Lin, B Stenger, P Harrison, N Echols, J Qian, A Drawid, D Greenbaum, R Jansen Transcriptome 2000, Paris 8 November 2000
Transcript of Surveys of a Finite Parts List - Gerstein Labbioinfo.mbb.yale.edu/lectures/t2000/talk.pdf1 (c) Mark...
1(c
) M
ark
Ger
stei
n, 2
000,
Yal
e, b
ioin
fo.m
bb
.yal
e.ed
u
Analysis of Genomes & Transcriptomes in terms of the
Occurrence of Parts and Features:
Surveys of a Finite Parts List Mark Gerstein
Molecular Biophysics & Biochemistry andComputer Science, Yale University
H Hegyi, J Lin, B Stenger, P Harrison, N Echols, J Qian, A Drawid, D Greenbaum, R Jansen
Transcriptome 2000, Paris8 November 2000

2(c
) M
ark
Ger
stei
n, 2
000,
Yal
e, b
ioin
fo.m
bb
.yal
e.ed
u
Genomes highlight
the Finiteness
of the “Parts” in Biology
Bacteria, 1.6 Mb,
~1600 genes [Science 269: 496]
Eukaryote, 13 Mb,
~6K genes [Nature 387: 1]
1995
1997
1998
Animal, ~100 Mb,
~20K genes [Science 282:
1945]
Human, ~3 Gb, ~100K
genes [???]
2000?
real thing, Apr ‘00‘98 spoof
3(c
) M
ark
Ger
stei
n, 2
000,
Yal
e, b
ioin
fo.m
bb
.yal
e.ed
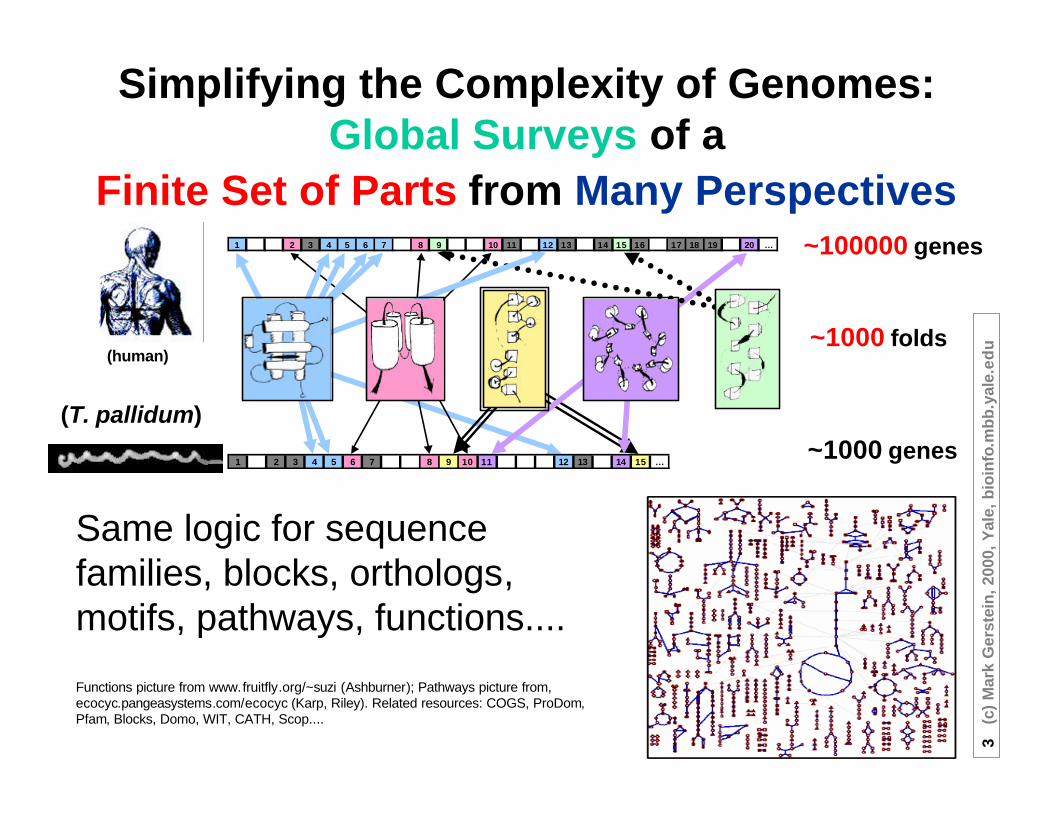
u~1000 folds
~100000 genes
~1000 genes1 2 3 4 5 6 7 8 9 10 11 12 13 14 15 …
1 2 3 4 5 6 7 8 9 10 11 12 13 14 15 16 17 18 19 20 …
(human)
(T. pallidum)
Simplifying the Complexity of Genomes:Global Surveys of a
Finite Set of Parts from Many Perspectives
Same logic for sequence families, blocks, orthologs, motifs, pathways, functions....
Functions picture from www.fruitfly.org/~suzi (Ashburner); Pathways picture from,ecocyc.pangeasystems.com/ecocyc (Karp, Riley). Related resources: COGS, ProDom, Pfam, Blocks, Domo, WIT, CATH, Scop....
4(c
) M
ark
Ger
stei
n, 2
000,
Yal
e, b
ioin
fo.m
bb
.yal
e.ed
u
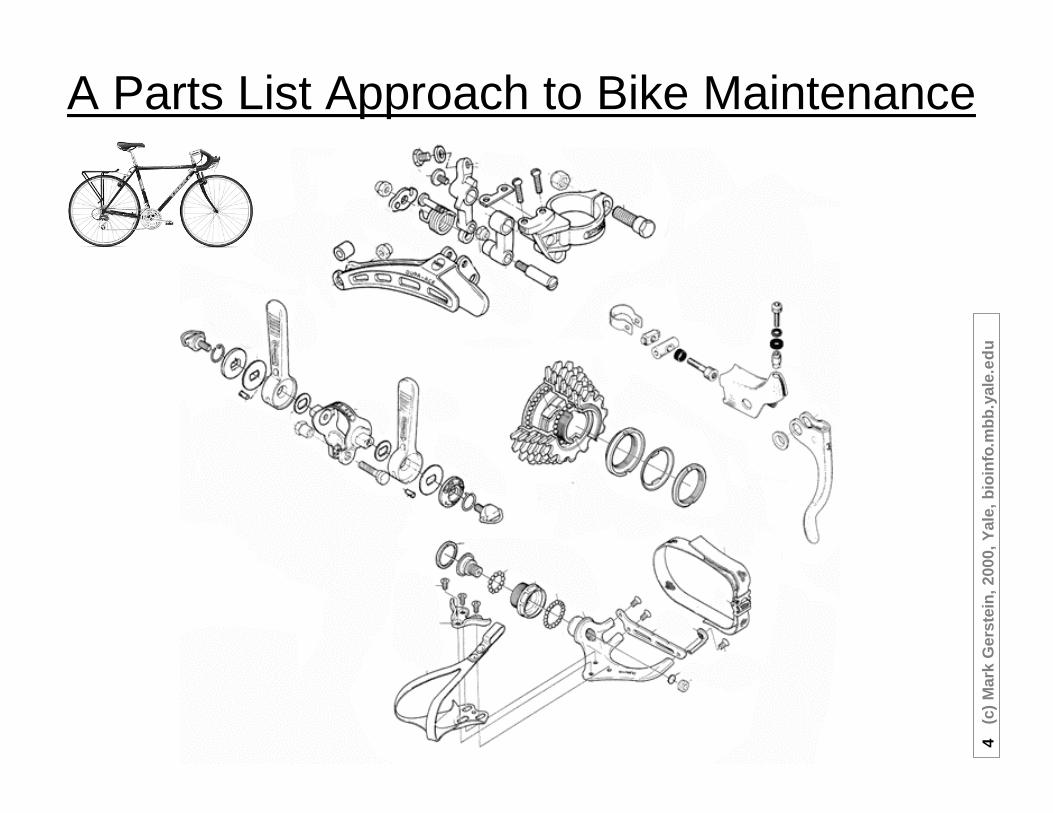
A Parts List Approach to Bike Maintenance
5(c
) M
ark
Ger
stei
n, 2
000,
Yal
e, b
ioin
fo.m
bb
.yal
e.ed
u
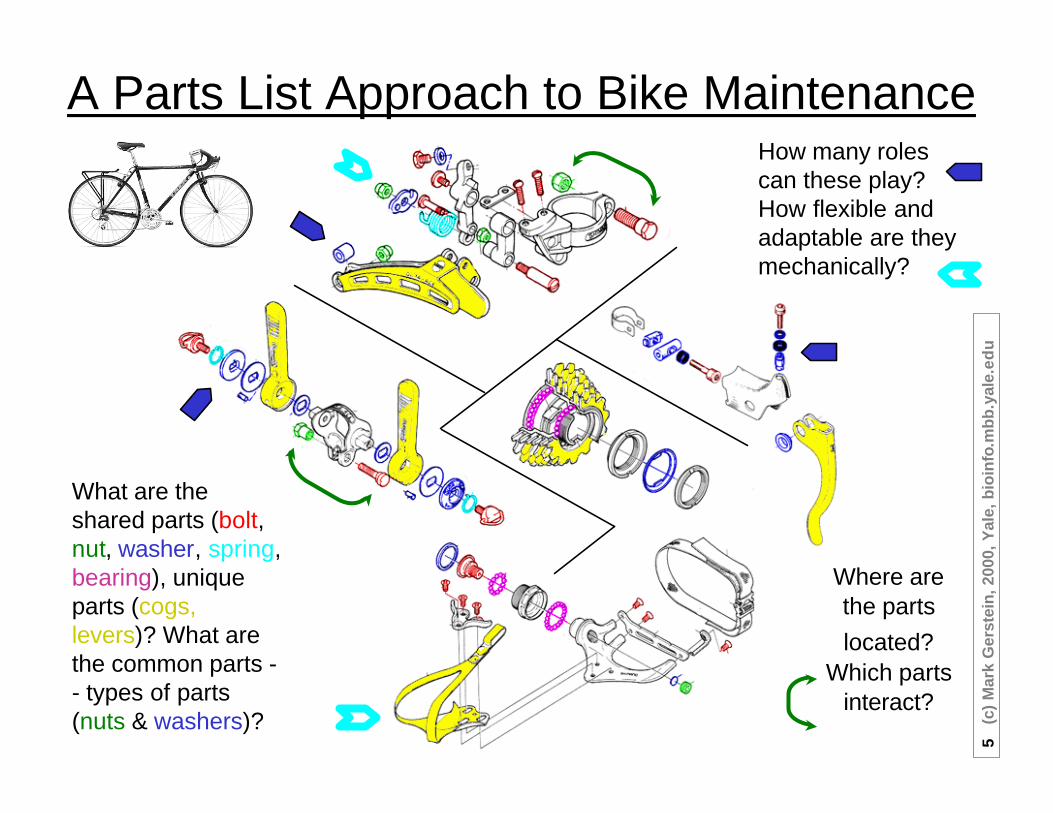
A Parts List Approach to Bike Maintenance
What are the shared parts (bolt, nut, washer, spring, bearing), unique parts (cogs, levers)? What are the common parts -- types of parts (nuts & washers)?
How many roles can these play? How flexible and adaptable are they mechanically?
Where are the parts located?
Which parts interact?

6(c
) M
ark
Ger
stei
n, 2
000,
Yal
e, b
ioin
fo.m
bb
.yal
e.ed
u
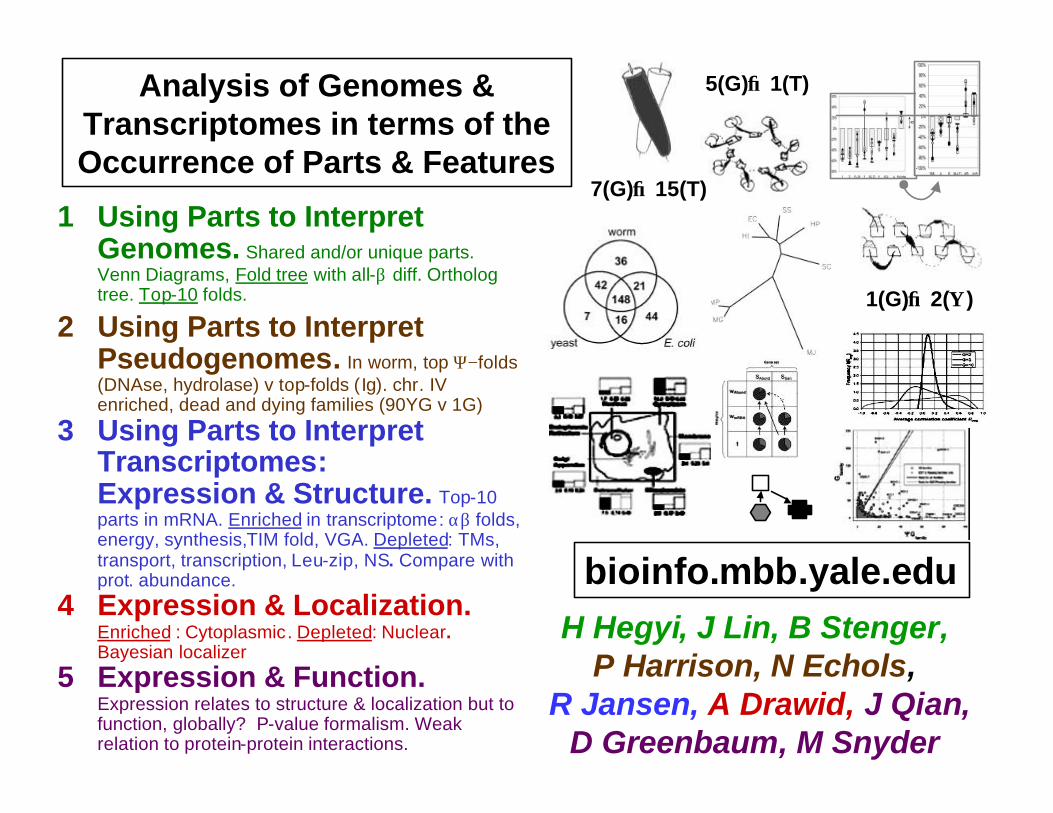
1 Using Parts to Interpret Genomes. Shared and/or unique parts. Venn Diagrams, Fold tree with all-β diff. Ortholog tree. Top-10 folds.
2 Using Parts to Interpret Pseudogenomes. In worm, top Ψ−folds (DNAse, hydrolase) v top-folds (Ig). chr. IV enriched, dead and dying families (90YG v 1G)
3 Using Parts to Interpret Transcriptomes: Expression & Structure. Top-10 parts in mRNA. Enriched in transcriptome: αβ folds, energy, synthesis,TIM fold, VGA. Depleted: TMs, transport, transcription, Leu-zip, NS. Compare with prot. abundance.
4 Expression & Localization.Enriched : Cytoplasmic. Depleted: Nuclear. Bayesian localizer
5 Expression & Function. Expression relates to structure & localization but to function, globally? P-value formalism. Weak relation to protein-protein interactions.
bioinfo.mbb.yale.eduH Hegyi, J Lin, B Stenger,
P Harrison, N Echols, R Jansen, A Drawid, J Qian,
D Greenbaum, M Snyder
Analysis of Genomes & Transcriptomes in terms of the Occurrence of Parts & Features
7(G)→15(T)
5(G)→1(T)
1(G)→2(Ψ)

7(c
) M
ark
Ger
stei
n, 2
000,
Yal
e, b
ioin
fo.m
bb
.yal
e.ed
u
IntegratedAnalysisSystem:
X-ref Parts withGenomesOne approach of many...Much previous work on Sequence & Structure ClusteringCATH, Blocks, FSSP, Interpro, eMotif, Prosite, CDD, Pfam, Prints, VAST, TOGA…Remington, Matthews ‘80; Taylor, Orengo ‘89, ‘94; Thornton,CATH; Artymiuk, Rice, Willett ‘89; Sali, Blundell, ‘90; Vriend, Sander ‘91; Russell, Barton ‘92; Holm, Sander ‘93+ (FSSP); Godzik, Skolnick ‘94; Gibrat, Bryant ‘96 (VAST); F Cohen, ‘96; Feng, Sippl‘96; G Cohen ‘97; Singh & Brutlag, ‘98
finding parts in genome
sequences
blast, ψ-blast,
fasta,TM, low-
complexity, &c
(Altschul, Pearson, Wooton)
part occurrence profiles
Folds: scop+automaticOrthologs: COGs“Families”: homebrew,
ProtoMap

8(c
) M
ark
Ger
stei
n, 2
000,
Yal
e, b
ioin
fo.m
bb
.yal
e.ed
u
Shared Folds of 339
worm
yeastE. coli
149
16
21 42
843
35
9(c
) M
ark
Ger
stei
n, 2
000,
Yal
e, b
ioin
fo.m
bb
.yal
e.ed
u
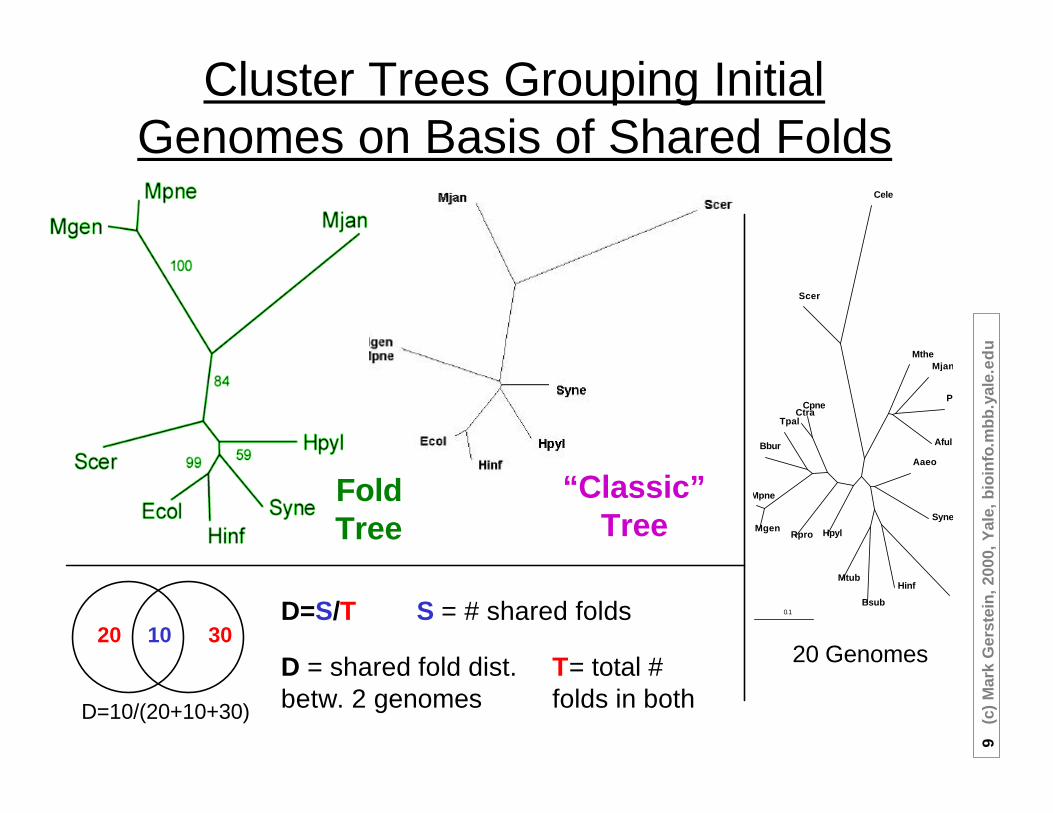
Cluster Trees Grouping Initial Genomes on Basis of Shared Folds
20 3010
D=10/(20+10+30)
“Classic” Tree
T= total # folds in both
D = shared fold dist.betw. 2 genomes
D=S/T S = # shared folds
20 Genomes
0.1
Aaeo
Syne
Hinf
Bsub
Mtub
HpylRproMgen
Mpne
Bbur
TpalCtra
Cpne
Scer
Cele
MtheMjan
Phor
Aful
Fold Tree
10(c
) M
ark
Ger
stei
n, 2
000,
Yal
e, b
ioin
fo.m
bb
.yal
e.ed
u
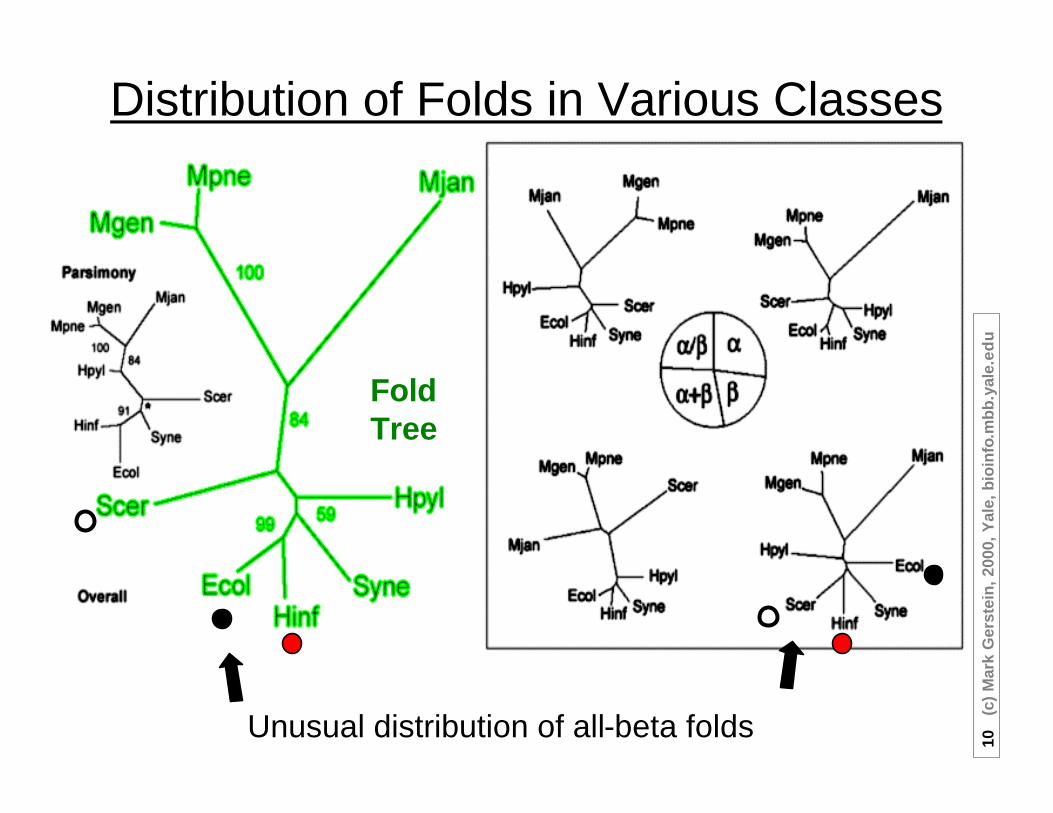
Distribution of Folds in Various Classes
Unusual distribution of all-beta folds
FoldTree
11(c
) M
ark
Ger
stei
n, 2
000,
Yal
e, b
ioin
fo.m
bb
.yal
e.ed
u
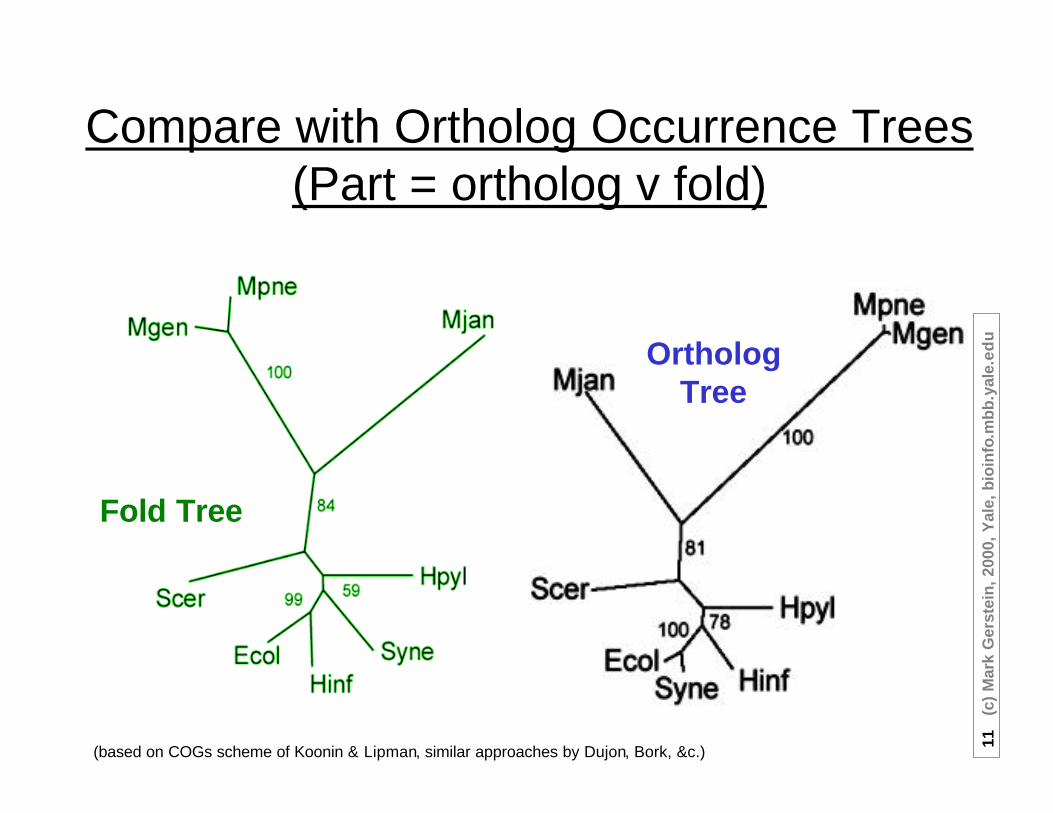
(based on COGs scheme of Koonin & Lipman, similar approaches by Dujon, Bork, &c.)
Compare with Ortholog Occurrence Trees(Part = ortholog v fold)
OrthologTree
Fold Tree
12(c
) M
ark
Ger
stei
n, 2
000,
Yal
e, b
ioin
fo.m
bb
.yal
e.ed
u
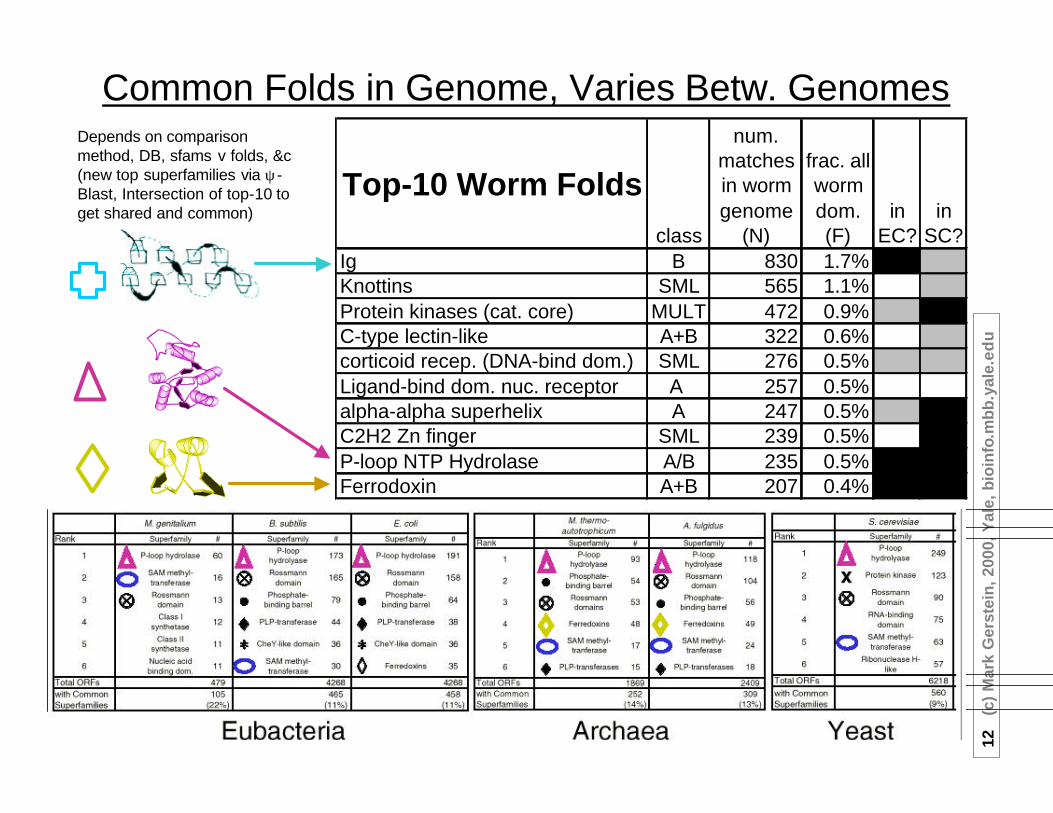
Common Folds in Genome, Varies Betw. Genomes
M. genitalium B. subtilis E. coli
Rank Superfamily # Superfamily # Superfamily #
1 ∆ P-loop hydrolase 60 ∆ P-loop hydrolyase 173 ∆ P-loop hydrolase 191
2 = SAM methyl-transferase 16 ⊗ Rossmann
domain 165 ⊗ Rossmann domain 158
3 ⊗ Rossmann domain 13 • Phosphate-
binding barrel 79 • Phosphate-binding barrel 64
4Class I
synthetase 12 ♦ PLP-transferase 44 ♦ PLP-transferase 38
5Class II
synthetase 11 ∗ CheY-like domain 36 ∗ CheY-like domain 36
6Nucleic acid binding dom. 11 = SAM methyl-
transferase 30 ◊ Ferredoxins 35
Total ORFs 479 4268 4268with Common Superfamilies
105 (22%)
465 (11%)
458 (11%)
M. thermo-autotrophicum
A. fulgidus
Rank Superfamily # Superfamily #
1 ∆ P-loop hydrolyase
93 ∆ P-loop hydrolyase
118
2 • Phosphate-binding barrel
54 ⊗ Rossmann domain
104
3 ⊗ Rossmann domains
53 • Phosphate-binding barrel
56
4 ◊ Ferredoxins 48 ◊ Ferredoxins 49
5 = SAM methyl-tranferase
17 = SAM methyl-tranferase
24
6 ♦ PLP-transferases 15 ♦ PLP-transferases 18
Total ORFs 1869 2409with Common Superfamilies
252 (14%)
309 (13%)
Rank Superfamily #
1 ∆ P-loop hydrolyase 249
2 x Protein kinase 123
3 ⊗ Rossmann domain 90
4RNA-binding
domain 75
5 = SAM methyl-transferase 63
6Ribonuclease H-
like 57
Total ORFs 6218with Common Superfamilies
560 (9%)
S. cerevisiae
Depends on comparison method, DB, sfams v folds, &c (new top superfamilies via ψ-Blast, Intersection of top-10 to get shared and common)
Top-10 Worm Foldsclass
num. matches in worm genome
(N)
frac. all worm dom. (F)
in EC?
in SC?
Ig B 830 1.7% 18 4Knottins SML 565 1.1% 0 3Protein kinases (cat. core) MULT 472 0.9% 1 142C-type lectin-like A+B 322 0.6% 0 1corticoid recep. (DNA-bind dom.) SML 276 0.5% 1 10Ligand-bind dom. nuc. receptor A 257 0.5% 0 0alpha-alpha superhelix A 247 0.5% 6 114C2H2 Zn finger SML 239 0.5% 0 78P-loop NTP Hydrolase A/B 235 0.5% 72 133Ferrodoxin A+B 207 0.4% 83 114
13(c
) M
ark
Ger
stei
n, 2
000,
Yal
e, b
ioin
fo.m
bb
.yal
e.ed
u
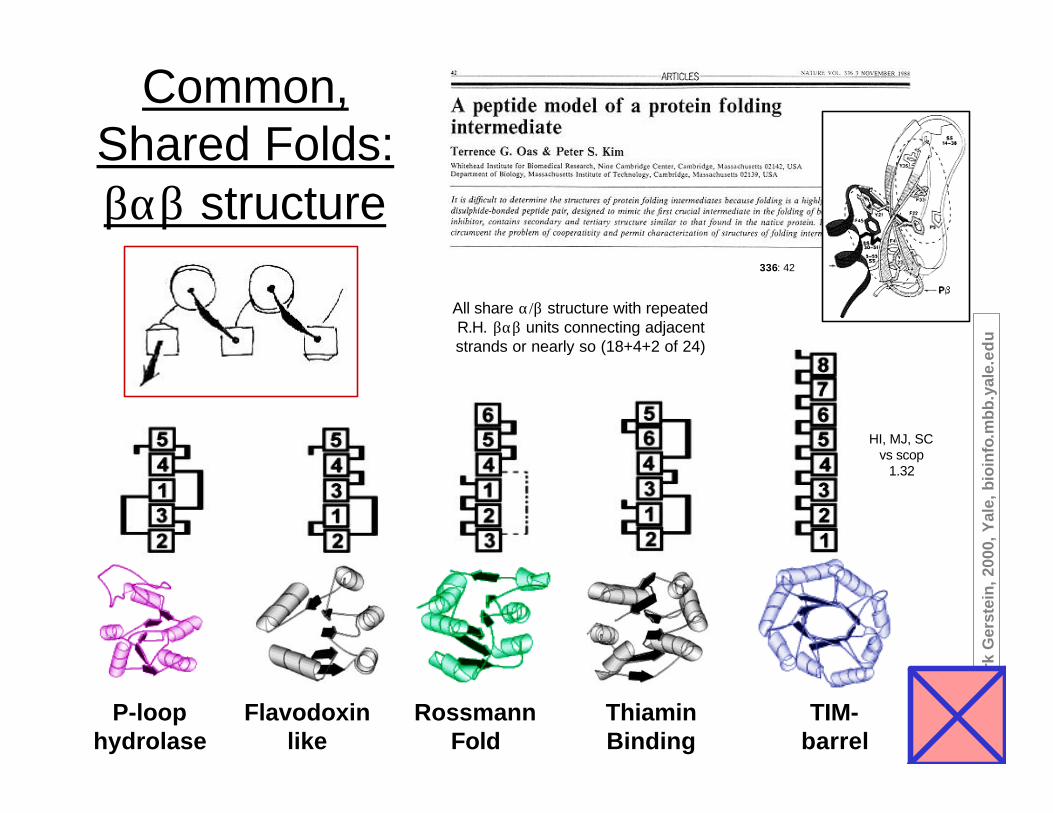
Common, Shared Folds: βαβ structure
HI, MJ, SC vs scop
1.32
336: 42
P-loop hydrolase
Flavodoxin like
RossmannFold
Thiamin Binding
TIM-barrel
All share α/β structure with repeated R.H. βαβ units connecting adjacent strands or nearly so (18+4+2 of 24)

14(c
) M
ark
Ger
stei
n, 2
000,
Yal
e, b
ioin
fo.m
bb
.yal
e.ed
u
1 Using Parts to Interpret Genomes. Shared and/or unique parts. Venn Diagrams, Fold tree with all-β diff. Ortholog tree. Top-10 folds.
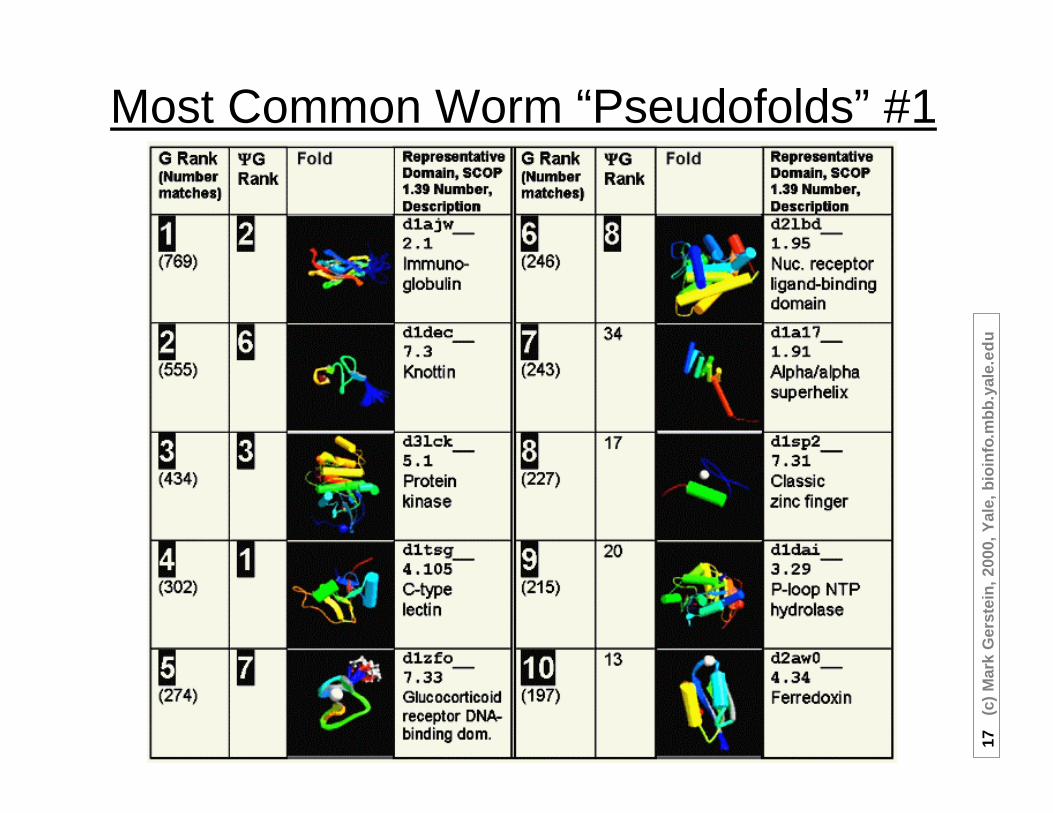
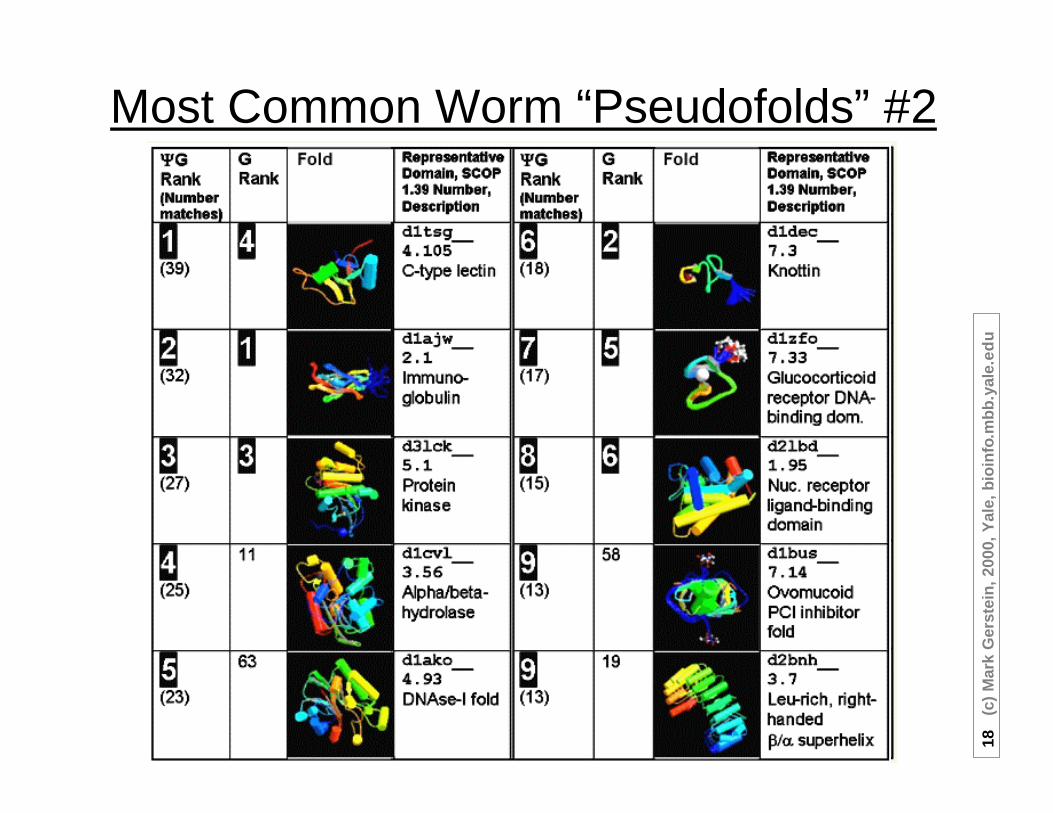
2 Using Parts to Interpret Pseudogenomes. In worm, top Ψ−folds (DNAse, hydrolase) v top-folds (Ig). chr. IV enriched, dead and dying families (90YG v 1G)
3 Using Parts to Interpret Transcriptomes: Expression & Structure. Top-10 parts in mRNA. Enriched in transcriptome: αβ folds, energy, synthesis,TIM fold, VGA. Depleted: TMs, transport, transcription, Leu-zip, NS. Compare with prot. abundance.
4 Expression & Localization.Enriched : Cytoplasmic. Depleted: Nuclear. Bayesian localizer
5 Expression & Function. Expression relates to structure & localization but to function, globally? P-value formalism. Weak relation to protein-protein interactions.
bioinfo.mbb.yale.eduH Hegyi, J Lin, B Stenger,
P Harrison, N Echols, R Jansen, A Drawid, J Qian,
D Greenbaum, M Snyder
Analysis of Genomes & Transcriptomes in terms of the Occurrence of Parts & Features
7(G)→15(T)
5(G)→1(T)
1(G)→2(Ψ)

15(c
) M
ark
Ger
stei
n, 2
000,
Yal
e, b
ioin
fo.m
bb
.yal
e.ed
u
Pseudogenomics: Surveying “Dead” Parts
Example of a potential ΨG with
frameshift in mid-domain
(Our def’n: ΨG = obvious homolog to known protein with frameshift or stop in mid-domain)

16(c
) M
ark
Ger
stei
n, 2
000,
Yal
e, b
ioin
fo.m
bb
.yal
e.ed
u
Folds in Pseudogenes
Example of a potential ΨG with frameshift in mid-domain
G=19K ΨG=4K (2K)GE=8K
ΨG identification pipelineto Summary of Pseudogenes
in worm
17(c
) M
ark
Ger
stei
n, 2
000,
Yal
e, b
ioin
fo.m
bb
.yal
e.ed
u
Most Common Worm “Pseudofolds” #1
18(c
) M
ark
Ger
stei
n, 2
000,
Yal
e, b
ioin
fo.m
bb
.yal
e.ed
u
Most Common Worm “Pseudofolds” #2
19(c
) M
ark
Ger
stei
n, 2
000,
Yal
e, b
ioin
fo.m
bb
.yal
e.ed
u
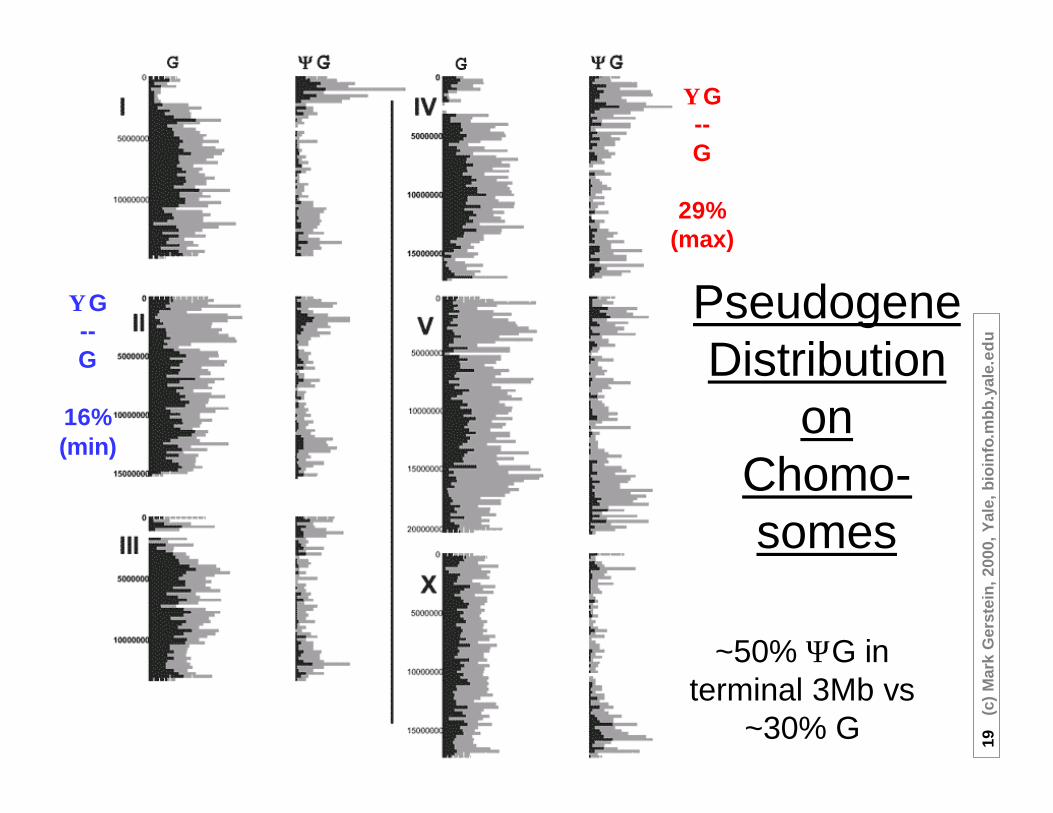
PseudogeneDistribution
on Chomo-somes
~50% ΨG in terminal 3Mb vs
~30% G
ΨG--G
16%(min)
ΨG--G
29%(max)
20(c
) M
ark
Ger
stei
n, 2
000,
Yal
e, b
ioin
fo.m
bb
.yal
e.ed
u
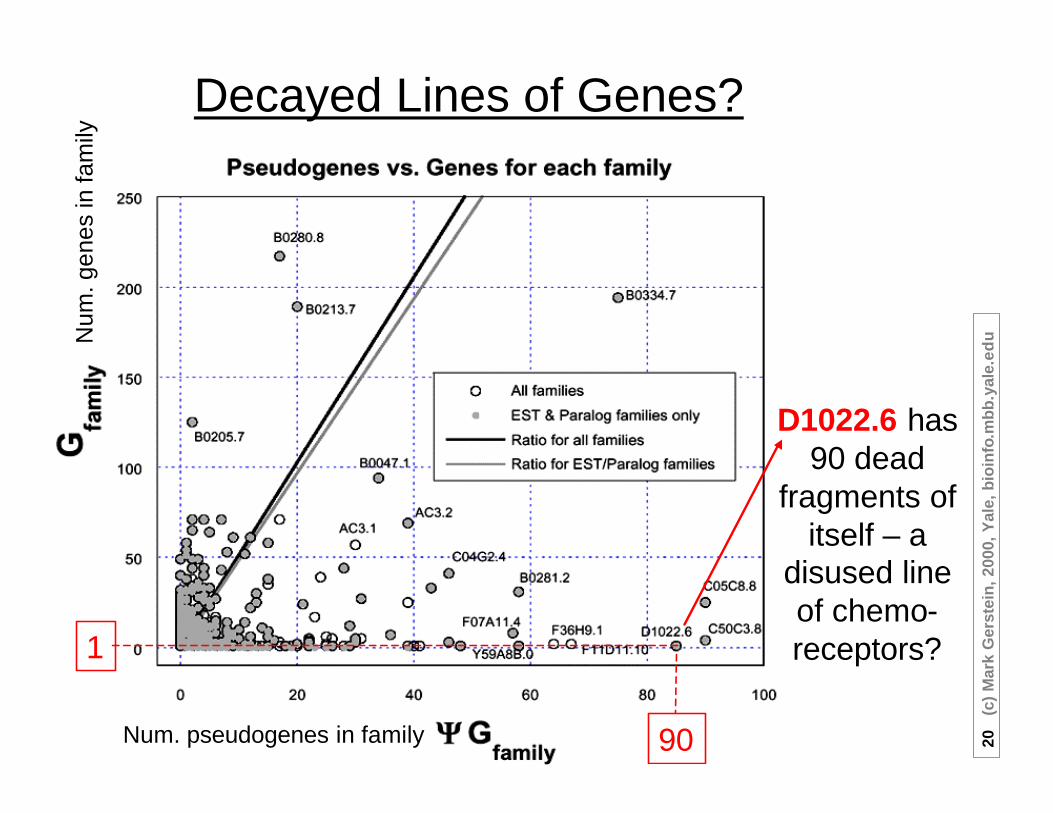
Decayed Lines of Genes?
D1022.6 has 90 dead
fragments of itself – a
disused line of chemo-receptors?1
90Num. pseudogenes in family
Num
. gen
es in
fam
ily
21(c
) M
ark
Ger
stei
n, 2
000,
Yal
e, b
ioin
fo.m
bb
.yal
e.ed
u
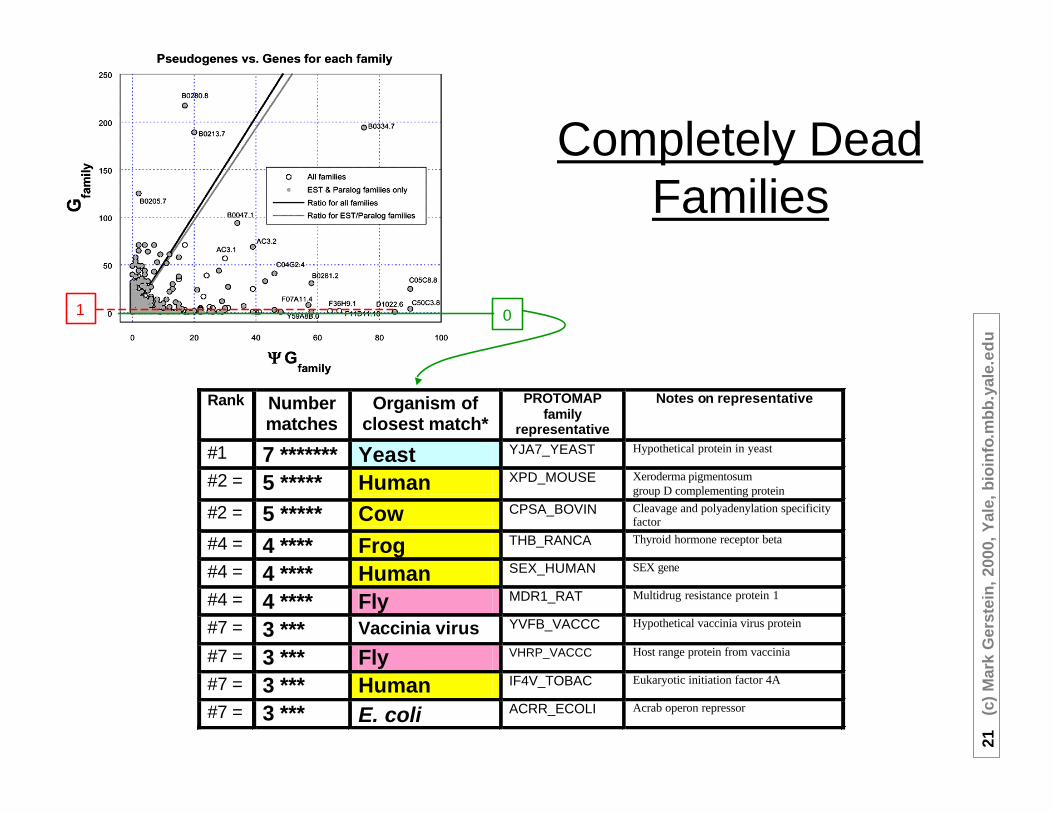
0
Completely Dead Families
1
Rank Number matches
Organism of closest match*
PROTOMAP family
representative
Notes on representative
#1 7 ******* Yeast YJA7_YEAST Hypothetical protein in yeast
#2 = 5 ***** Human XPD_MOUSE Xeroderma pigmentosum group D complementing protein
#2 = 5 ***** Cow CPSA_BOVIN Cleavage and polyadenylation specificity factor
#4 = 4 **** Frog THB_RANCA Thyroid hormone receptor beta
#4 = 4 **** Human SEX_HUMAN SEX gene
#4 = 4 **** Fly MDR1_RAT Multidrug resistance protein 1
#7 = 3 *** Vaccinia virus YVFB_VACCC Hypothetical vaccinia virus protein
#7 = 3 *** Fly VHRP_VACCC Host range protein from vaccinia
#7 = 3 *** Human IF4V_TOBAC Eukaryotic initiation factor 4A
#7 = 3 *** E. coli ACRR_ECOLI Acrab operon repressor

22(c
) M
ark
Ger
stei
n, 2
000,
Yal
e, b
ioin
fo.m
bb
.yal
e.ed
u
Amino Acid Composition of Pseudogenes is Midway between Proteins and Random
23(c
) M
ark
Ger
stei
n, 2
000,
Yal
e, b
ioin
fo.m
bb
.yal
e.ed
u
1 Using Parts to Interpret Genomes. Shared and/or unique parts. Venn Diagrams, Fold tree with all-β diff. Ortholog tree. Top-10 folds.
2 Using Parts to Interpret Pseudogenomes. In worm, top Ψ−folds (DNAse, hydrolase) v top-folds (Ig). chr. IV enriched, dead and dying families (90YG v 1G)
3 Using Parts to Interpret Transcriptomes: Expression & Structure. Top-10 parts in mRNA. Enriched in transcriptome: αβ folds, energy, synthesis,TIM fold, VGA. Depleted: TMs, transport, transcription, Leu-zip, NS. Compare with prot. abundance.
4 Expression & Localization.Enriched : Cytoplasmic. Depleted: Nuclear. Bayesian localizer
5 Expression & Function. Expression relates to structure & localization but to function, globally? P-value formalism. Weak relation to protein-protein interactions.
bioinfo.mbb.yale.eduH Hegyi, J Lin, B Stenger,
P Harrison, N Echols, R Jansen, A Drawid, J Qian,
D Greenbaum, M Snyder
Analysis of Genomes & Transcriptomes in terms of the Occurrence of Parts & Features
7(G)→15(T)
5(G)→1(T)
1(G)→2(Ψ)
24(c
) M
ark
Ger
stei
n, 2
000,
Yal
e, b
ioin
fo.m
bb
.yal
e.ed
u
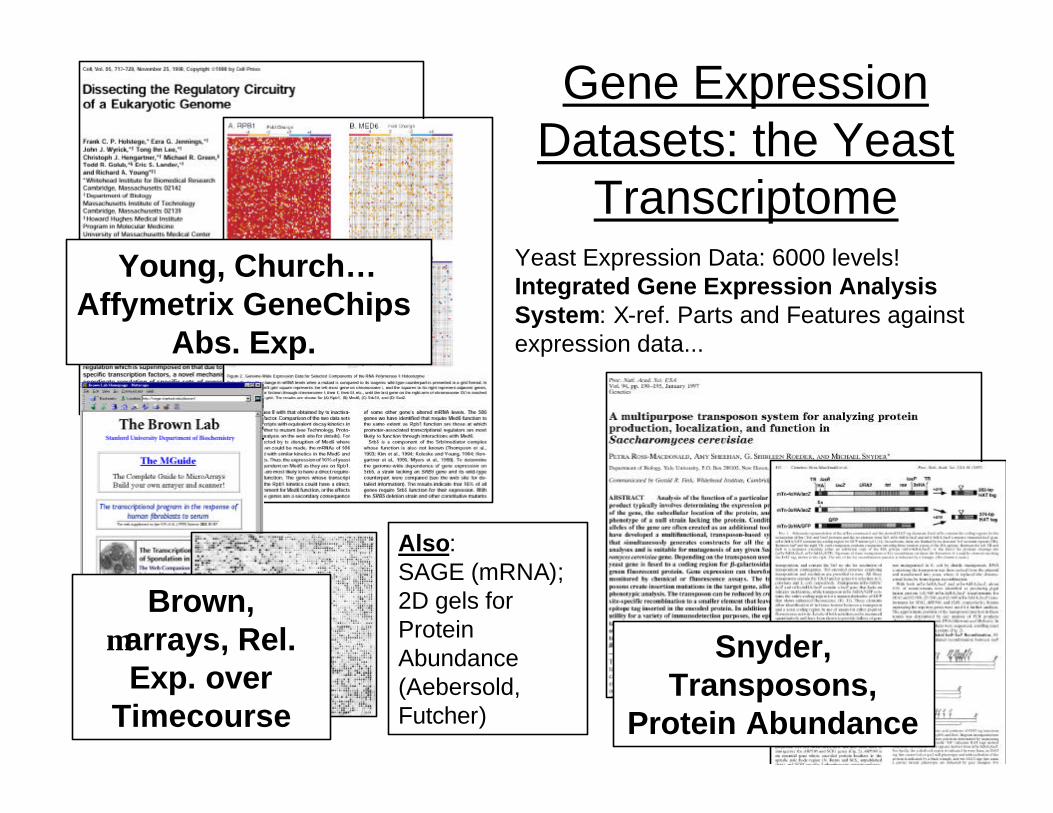
Gene Expression Datasets: the Yeast
TranscriptomeYeast Expression Data: 6000 levels! Integrated Gene Expression Analysis System: X-ref. Parts and Features against expression data...
Also: SAGE (mRNA); 2D gels for Protein Abundance (Aebersold, Futcher)
Young, Church…Affymetrix GeneChips
Abs. Exp.
Brown, µarrays, Rel.
Exp. over Timecourse
Snyder, Transposons,
Protein Abundance
25(c
) M
ark
Ger
stei
n, 2
000,
Yal
e, b
ioin
fo.m
bb
.yal
e.ed
u
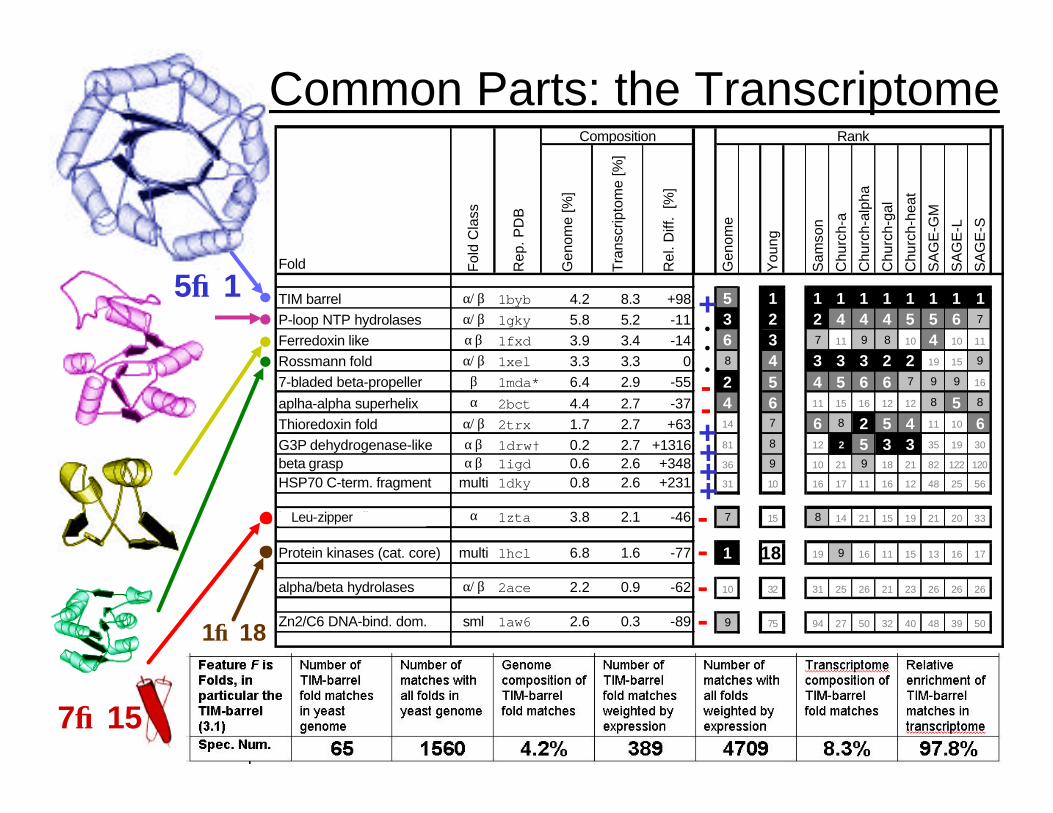
Fold Fol
d C
lass
Rep
. PD
B
Gen
ome
[%]
Tra
nscr
ipto
me
[%]
Rel
. Diff
. [%
]
Gen
ome
You
ng
Sam
son
Chu
rch-
a
Chu
rch-
alph
a
Chu
rch-
gal
Chu
rch-
heat
SA
GE
-GM
SA
GE
-L
SA
GE
-S
TIM barrel α/ β 1byb 4.2 8.3 +98 5 1 1 1 1 1 1 1 1 1P-loop NTP hydrolases α/ β 1gky 5.8 5.2 -11 3 2 2 4 4 4 5 5 6 7
Ferredoxin like α+β 1fxd 3.9 3.4 -14 6 3 7 11 9 8 10 4 10 11
Rossmann fold α/ β 1xel 3.3 3.3 0 8 4 3 3 3 2 2 19 15 9
7-bladed beta-propeller β 1mda* 6.4 2.9 -55 2 5 4 5 6 6 7 9 9 16
aplha-alpha superhelix α 2bct 4.4 2.7 -37 4 6 11 15 16 12 12 8 5 8
Thioredoxin fold α/ β 2trx 1.7 2.7 +63 14 7 6 8 2 5 4 11 10 6G3P dehydrogenase-like α+β 1drw† 0.2 2.7 +1316 81 8 12 2 5 3 3 35 19 30
beta grasp α+β 1igd 0.6 2.6 +348 36 9 10 21 9 18 21 82 122 120
HSP70 C-term. fragment multi 1dky 0.8 2.6 +231 31 10 16 17 11 16 12 48 25 56
long helices oligomers α 1zta 3.8 2.1 -46 7 15 8 14 21 15 19 21 20 33
Protein kinases (cat. core) multi 1hcl 6.8 1.6 -77 1 18 19 9 16 11 15 13 16 17
alpha/beta hydrolases α/ β 2ace 2.2 0.9 -62 10 32 31 25 26 21 23 26 26 26
Zn2/C6 DNA-bind. dom. sml 1aw6 2.6 0.3 -89 9 75 94 27 50 32 40 48 39 50
Composition Rank
----
--+
+
+++
•••
Common Parts: the Transcriptome
7→15
5→1
Leu-zipper
18
1→18
26(c
) M
ark
Ger
stei
n, 2
000,
Yal
e, b
ioin
fo.m
bb
.yal
e.ed
u
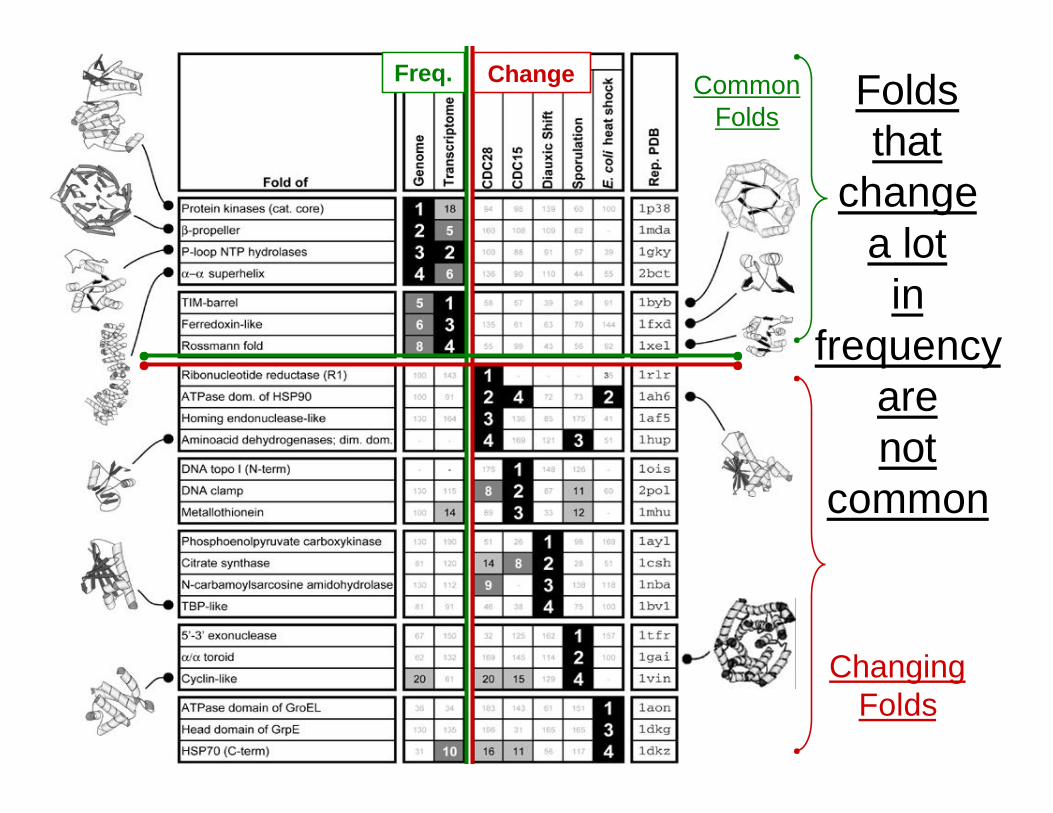
Freq. Change
Changing Folds
Common Folds
Foldsthat
changea lot
infrequency
arenot
common
27(c
) M
ark
Ger
stei
n, 2
000,
Yal
e, b
ioin
fo.m
bb
.yal
e.ed
u
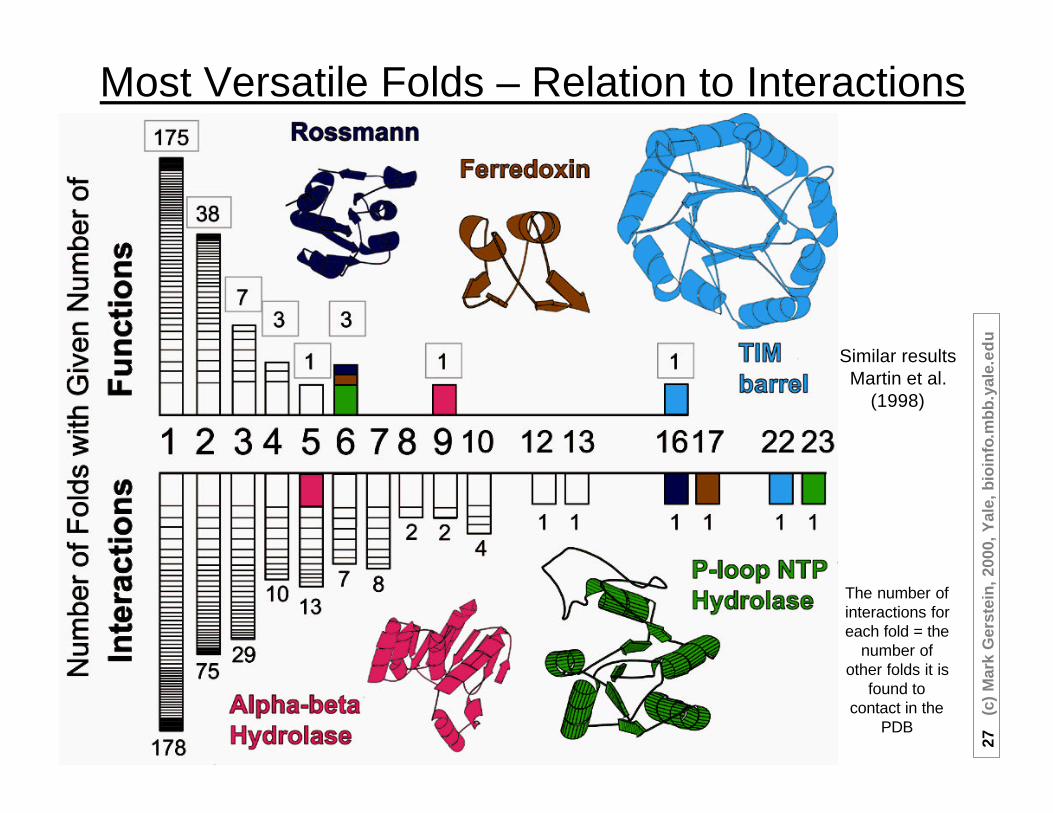
Most Versatile Folds – Relation to Interactions
The number of interactions for each fold = the
number of other folds it is
found to contact in the
PDB
Similar results Martin et al.
(1998)
28(c
) M
ark
Ger
stei
n, 2
000,
Yal
e, b
ioin
fo.m
bb
.yal
e.ed
u
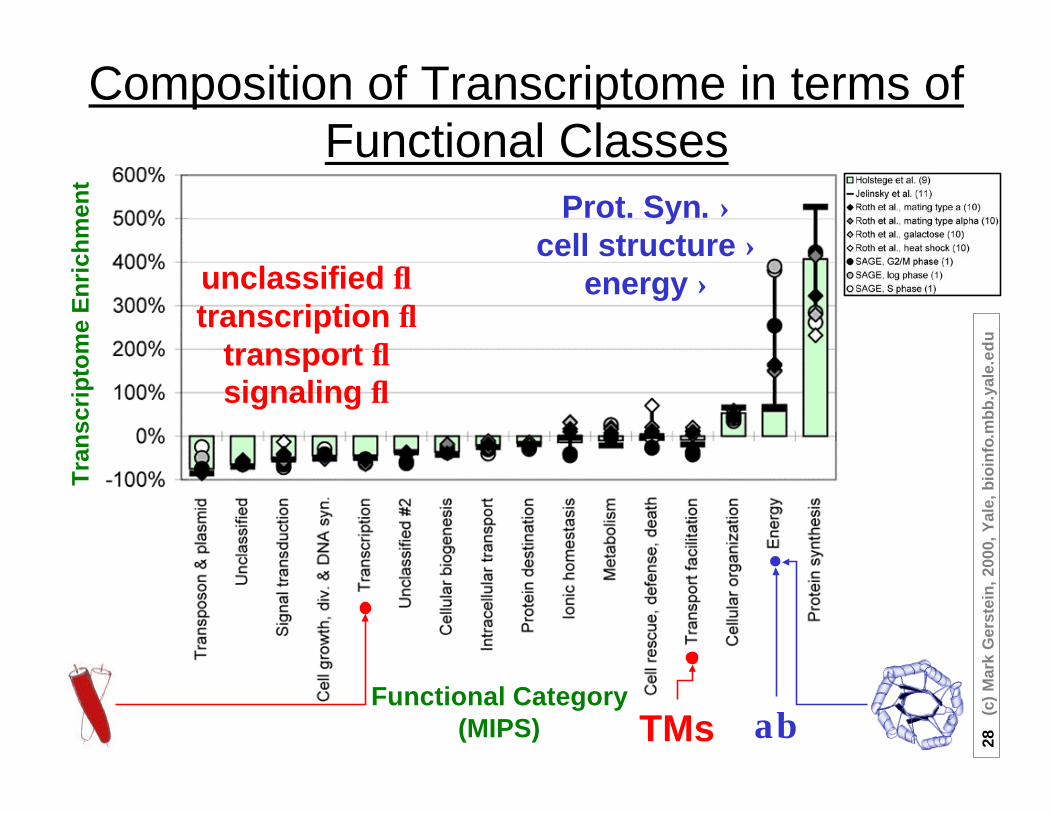
Composition of Transcriptome in terms of Functional Classes
Prot. Syn. ↑cell structure ↑
energy ↑unclassified ↓transcription ↓
transport ↓signaling ↓
Tra
nsc
rip
tom
e E
nri
chm
ent
Functional Category(MIPS) TMs αβ
29(c
) M
ark
Ger
stei
n, 2
000,
Yal
e, b
ioin
fo.m
bb
.yal
e.ed
u
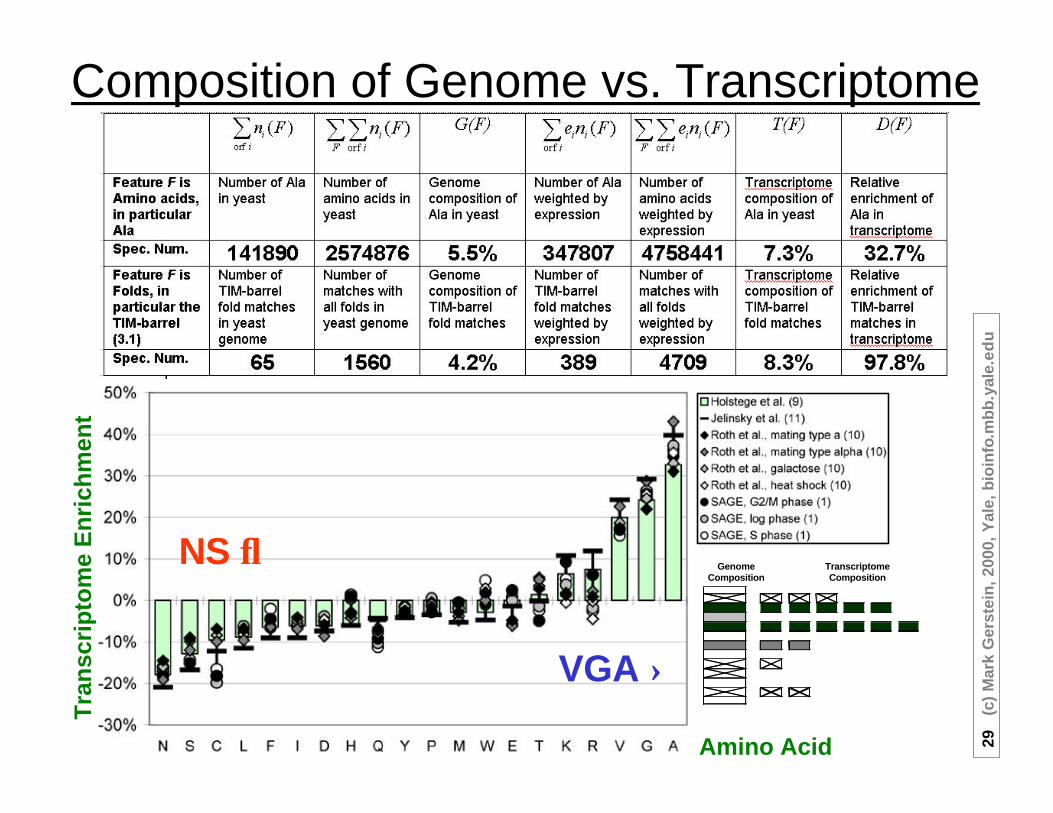
GenomeComposition
TranscriptomeComposition
Composition of Genome vs. TranscriptomeT
ran
scri
pto
me
En
rich
men
t
Amino Acid
NS ↓
VGA ↑

30(c
) M
ark
Ger
stei
n, 2
000,
Yal
e, b
ioin
fo.m
bb
.yal
e.ed
u
Relation between Length & Expression
10
100
1000
10000
1.0 10.0 100.0
Expression Level
Leng
th
Fit
Maximum Lengths
Max Expression (e.g. transcripts/cell) ~ (Length)-2/3
Shorter proteins can be more highly expressed
31(c
) M
ark
Ger
stei
n, 2
000,
Yal
e, b
ioin
fo.m
bb
.yal
e.ed
u
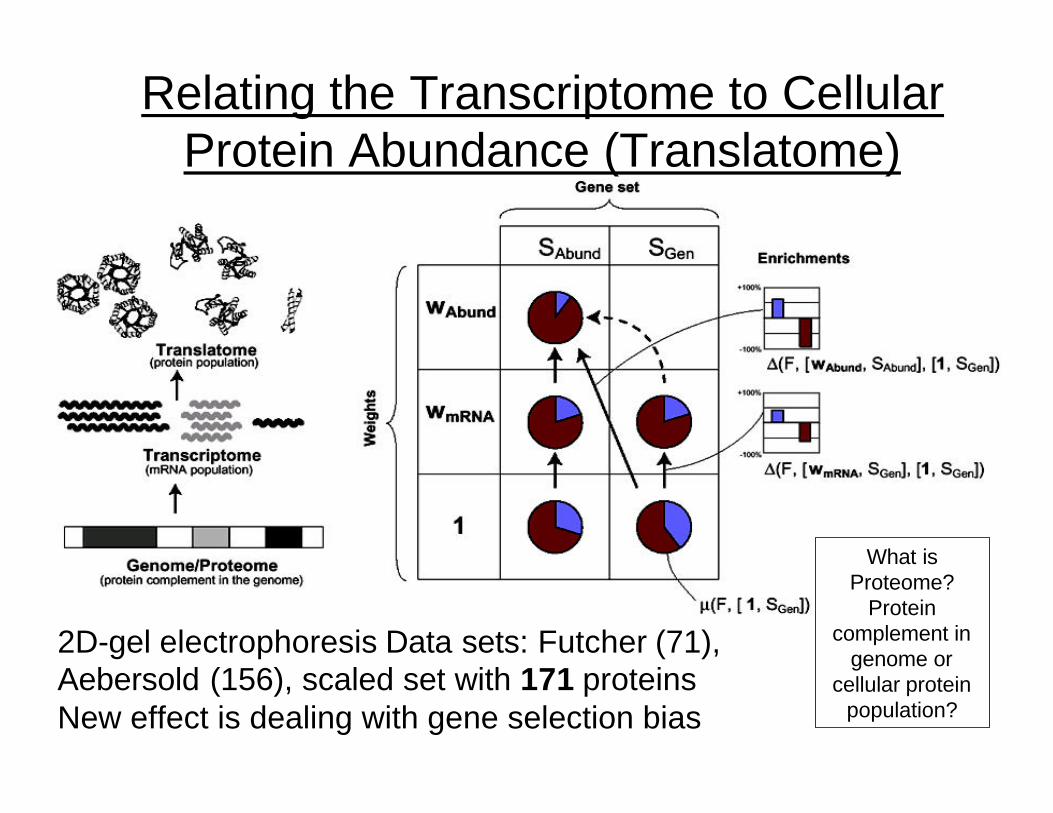
2D-gel electrophoresis Data sets: Futcher (71), Aebersold (156), scaled set with 171 proteinsNew effect is dealing with gene selection bias
Relating the Transcriptome to Cellular Protein Abundance (Translatome)
What isProteome?
Protein complement in
genome or cellular protein
population?

32(c
) M
ark
Ger
stei
n, 2
000,
Yal
e, b
ioin
fo.m
bb
.yal
e.ed
u
mRNA and protein abundance related, roughly
~150 protein abundance values from
merging results of 2D gel expts. of Aebersold &
Futcher
mRNA values for same 150 genes from merging and scaling 6 yeast expressions
33(c
) M
ark
Ger
stei
n, 2
000,
Yal
e, b
ioin
fo.m
bb
.yal
e.ed
u
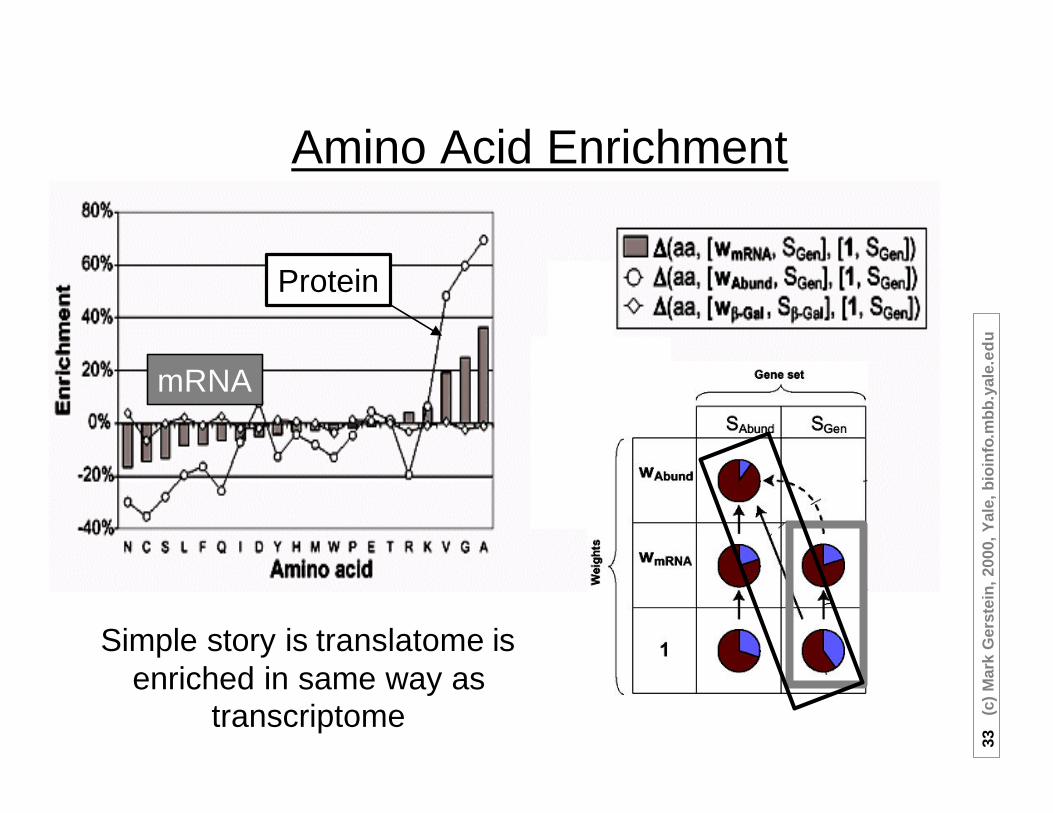
Amino Acid Enrichment
Protein
mRNA
Simple story is translatome is enriched in same way as
transcriptome
34(c
) M
ark
Ger
stei
n, 2
000,
Yal
e, b
ioin
fo.m
bb
.yal
e.ed
u
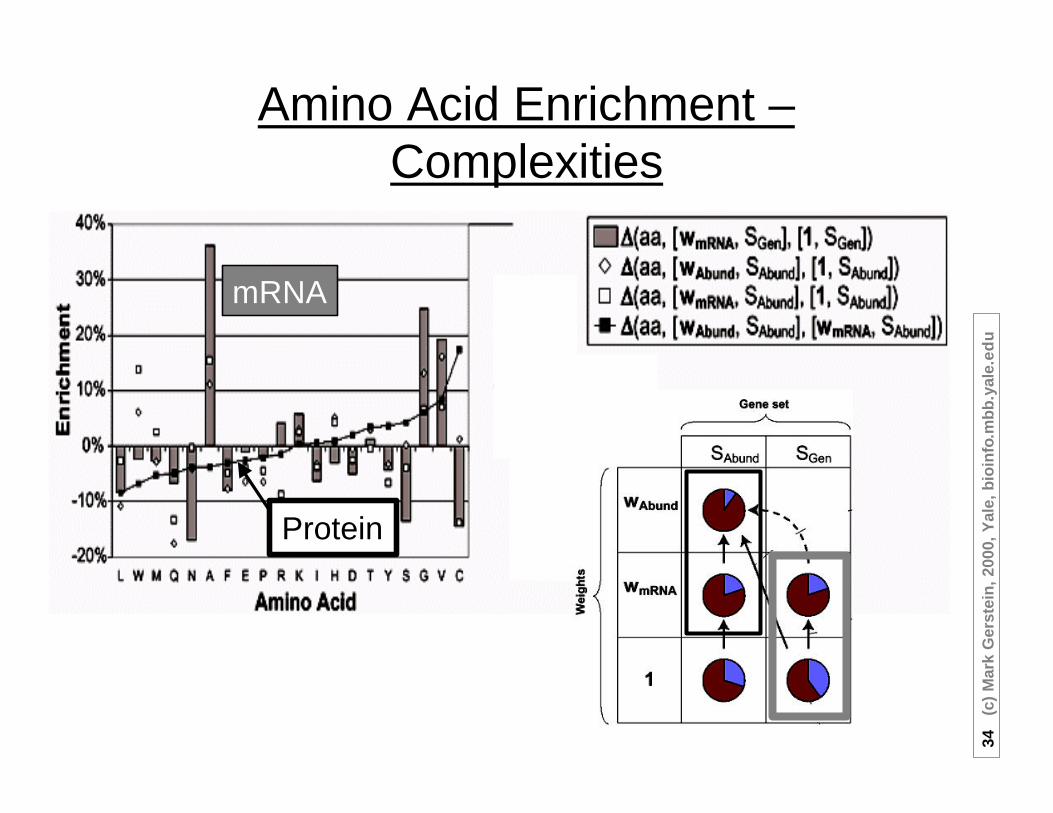
Amino Acid Enrichment –Complexities
Protein
mRNA

35(c
) M
ark
Ger
stei
n, 2
000,
Yal
e, b
ioin
fo.m
bb
.yal
e.ed
u
1 Using Parts to Interpret Genomes. Shared and/or unique parts. Venn Diagrams, Fold tree with all-β diff. Ortholog tree. Top-10 folds.
2 Using Parts to Interpret Pseudogenomes. In worm, top Ψ−folds (DNAse, hydrolase) v top-folds (Ig). chr. IV enriched, dead and dying families (90YG v 1G)
3 Using Parts to Interpret Transcriptomes: Expression & Structure. Top-10 parts in mRNA. Enriched in transcriptome: αβ folds, energy, synthesis,TIM fold, VGA. Depleted: TMs, transport, transcription, Leu-zip, NS. Compare with prot. abundance.
4 Expression & Localization.Enriched : Cytoplasmic. Depleted: Nuclear. Bayesian localizer
5 Expression & Function. Expression relates to structure & localization but to function, globally? P-value formalism. Weak relation to protein-protein interactions.
bioinfo.mbb.yale.eduH Hegyi, J Lin, B Stenger,
P Harrison, N Echols, R Jansen, A Drawid, J Qian,
D Greenbaum, M Snyder
Analysis of Genomes & Transcriptomes in terms of the Occurrence of Parts & Features
7(G)→15(T)
5(G)→1(T)
1(G)→2(Ψ)
36(c
) M
ark
Ger
stei
n, 2
000,
Yal
e, b
ioin
fo.m
bb
.yal
e.ed
u
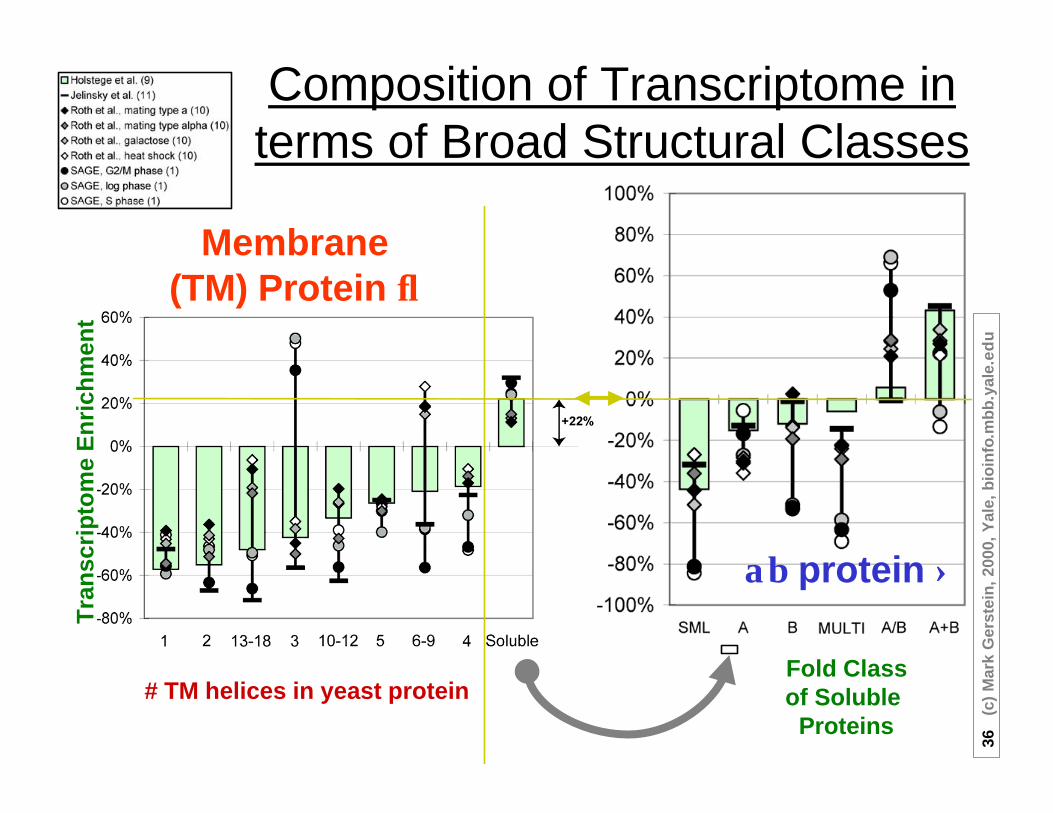
Composition of Transcriptome in terms of Broad Structural Classes
Tra
nsc
rip
tom
e E
nri
chm
ent
# TM helices in yeast proteinFold Classof Soluble
Proteins
Membrane (TM) Protein ↓
αβ protein ↑
37(c
) M
ark
Ger
stei
n, 2
000,
Yal
e, b
ioin
fo.m
bb
.yal
e.ed
u
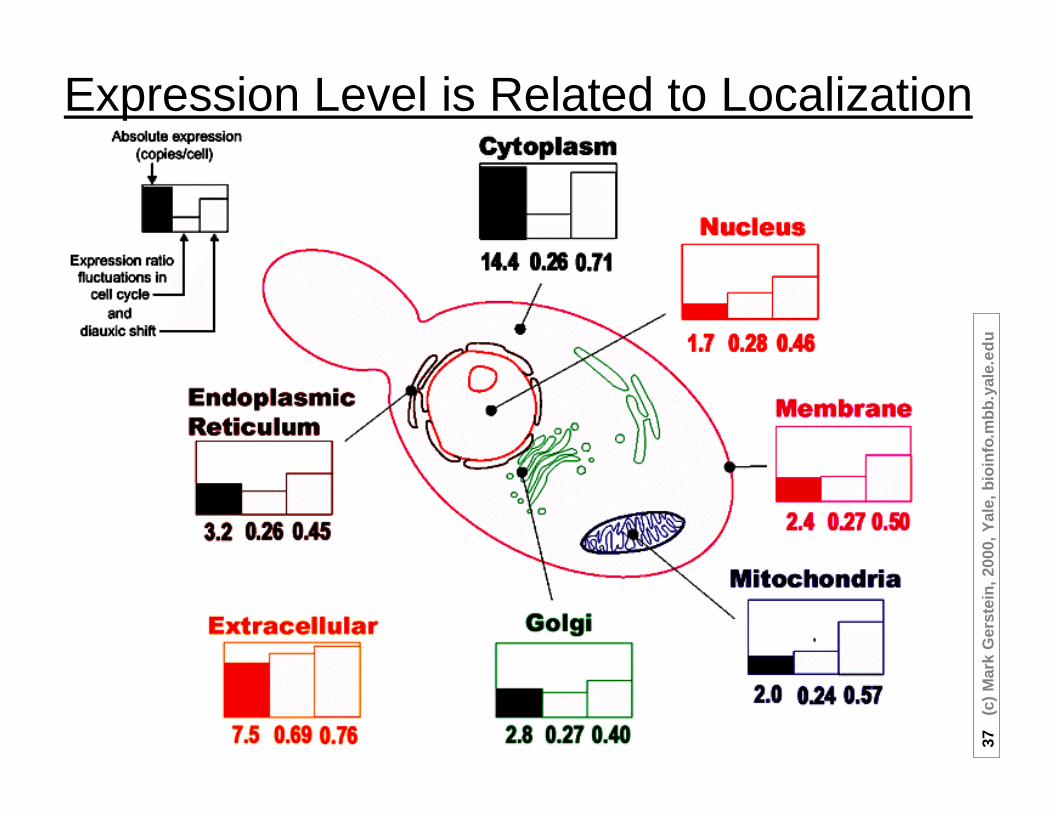
Expression Level is Related to Localization
38(c
) M
ark
Ger
stei
n, 2
000,
Yal
e, b
ioin
fo.m
bb
.yal
e.ed
u
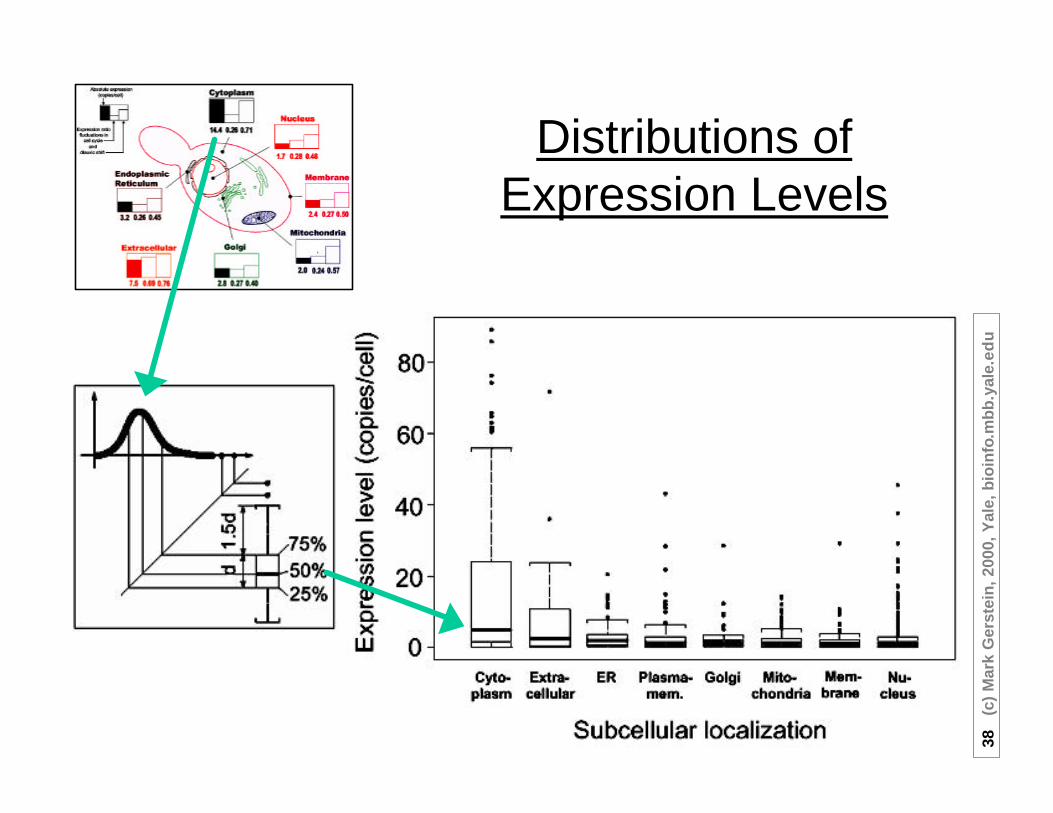
Distributions of Expression Levels
39(c
) M
ark
Ger
stei
n, 2
000,
Yal
e, b
ioin
fo.m
bb
.yal
e.ed
u
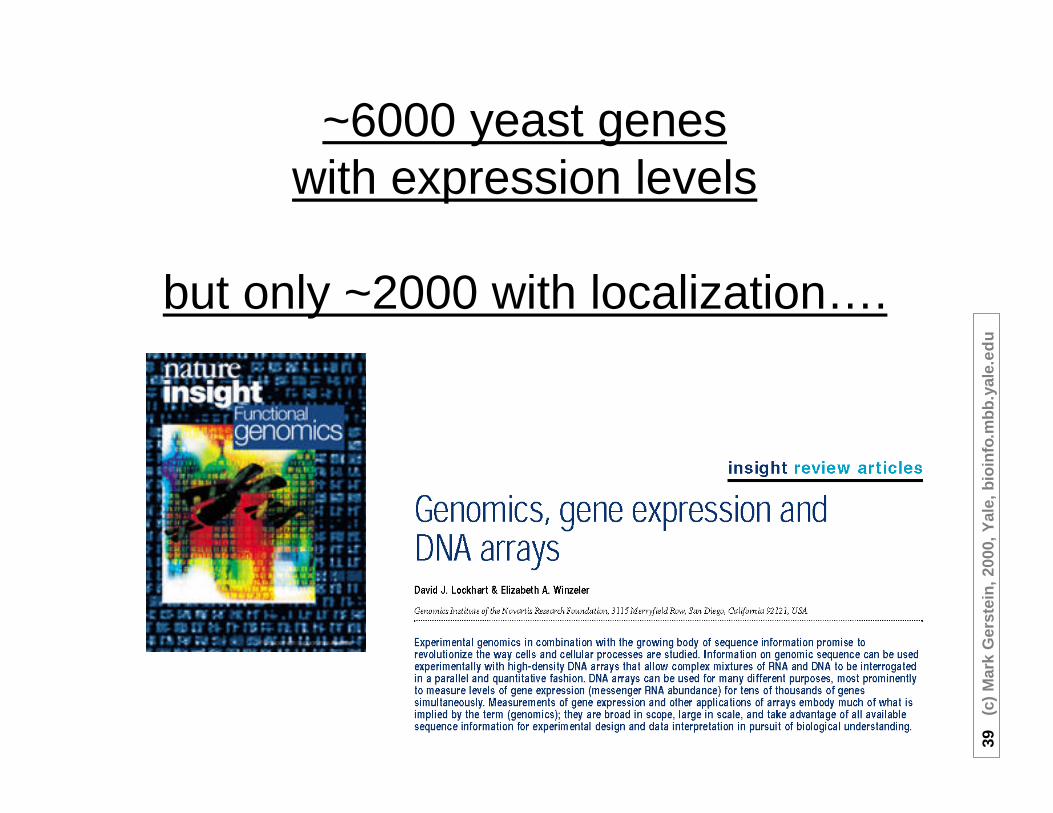
~6000 yeast geneswith expression levels
but only ~2000 with localization….
40(c
) M
ark
Ger
stei
n, 2
000,
Yal
e, b
ioin
fo.m
bb
.yal
e.ed
u
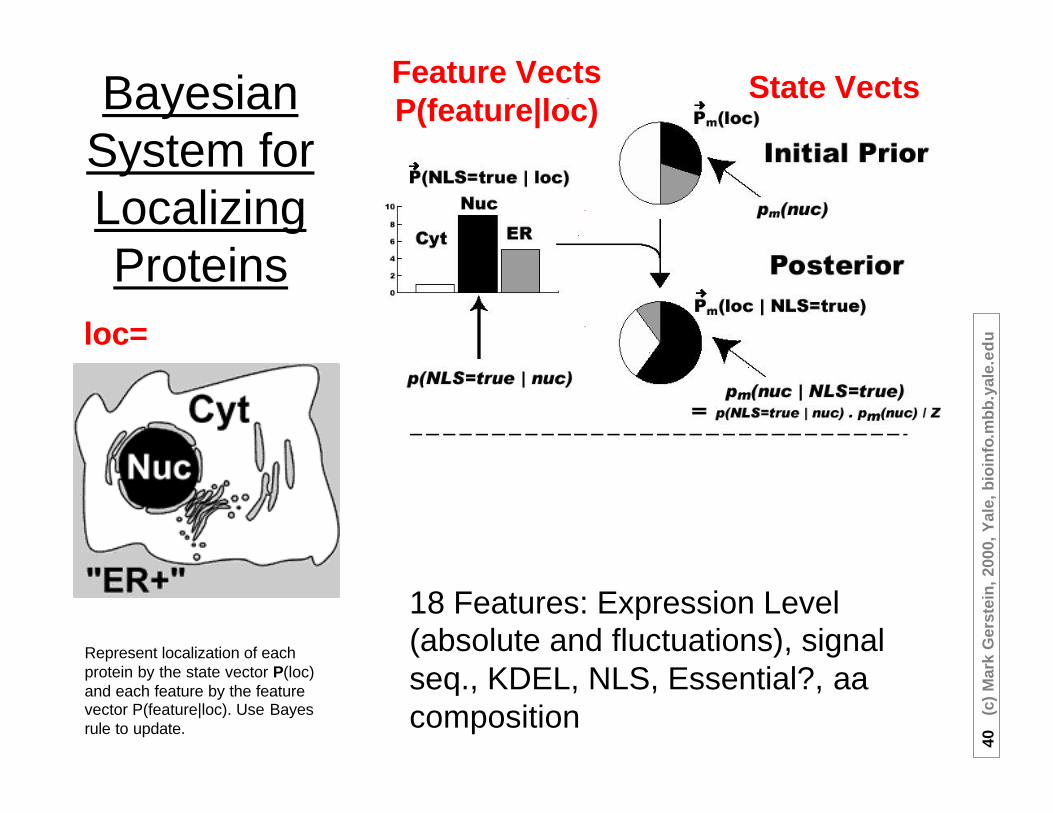
Bayesian System for Localizing Proteins
Feature VectsP(feature|loc)
State Vects
loc=
Represent localization of each protein by the state vector P(loc) and each feature by the feature vector P(feature|loc). Use Bayes rule to update.
18 Features: Expression Level (absolute and fluctuations), signal seq., KDEL, NLS, Essential?, aa composition
41(c
) M
ark
Ger
stei
n, 2
000,
Yal
e, b
ioin
fo.m
bb
.yal
e.ed
u
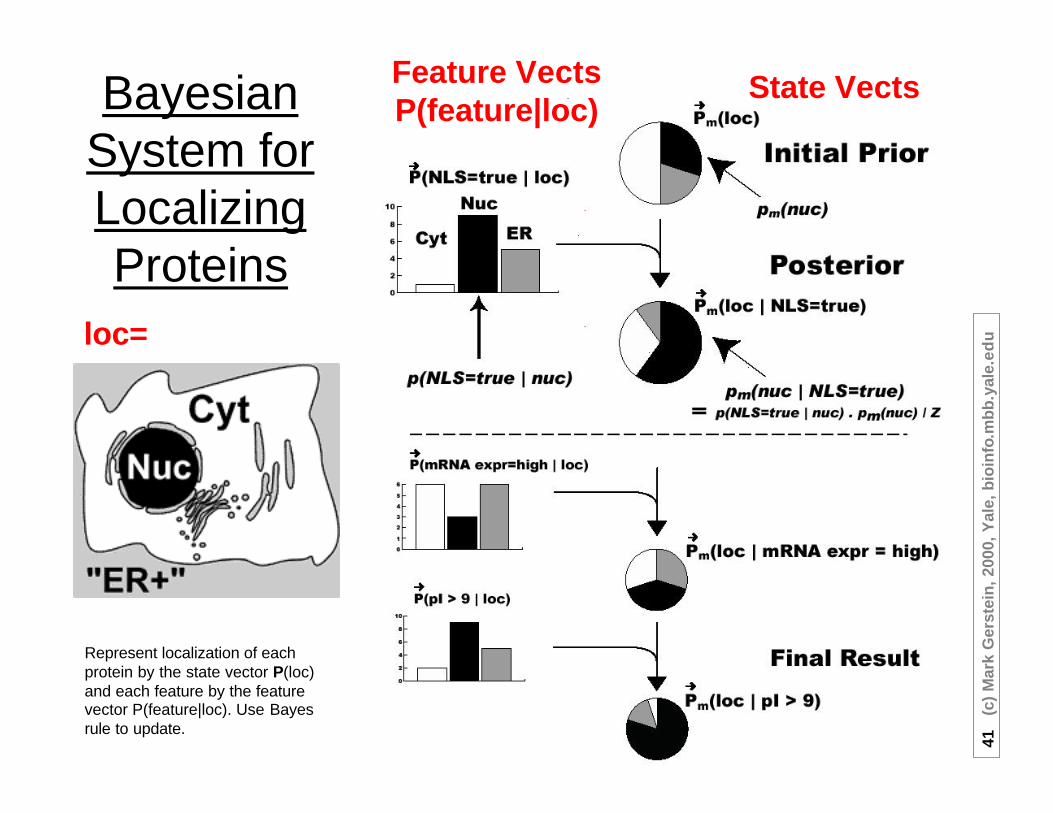
Bayesian System for Localizing Proteins
Feature VectsP(feature|loc)
State Vects
loc=
Represent localization of each protein by the state vector P(loc) and each feature by the feature vector P(feature|loc). Use Bayes rule to update.
42(c
) M
ark
Ger
stei
n, 2
000,
Yal
e, b
ioin
fo.m
bb
.yal
e.ed
u
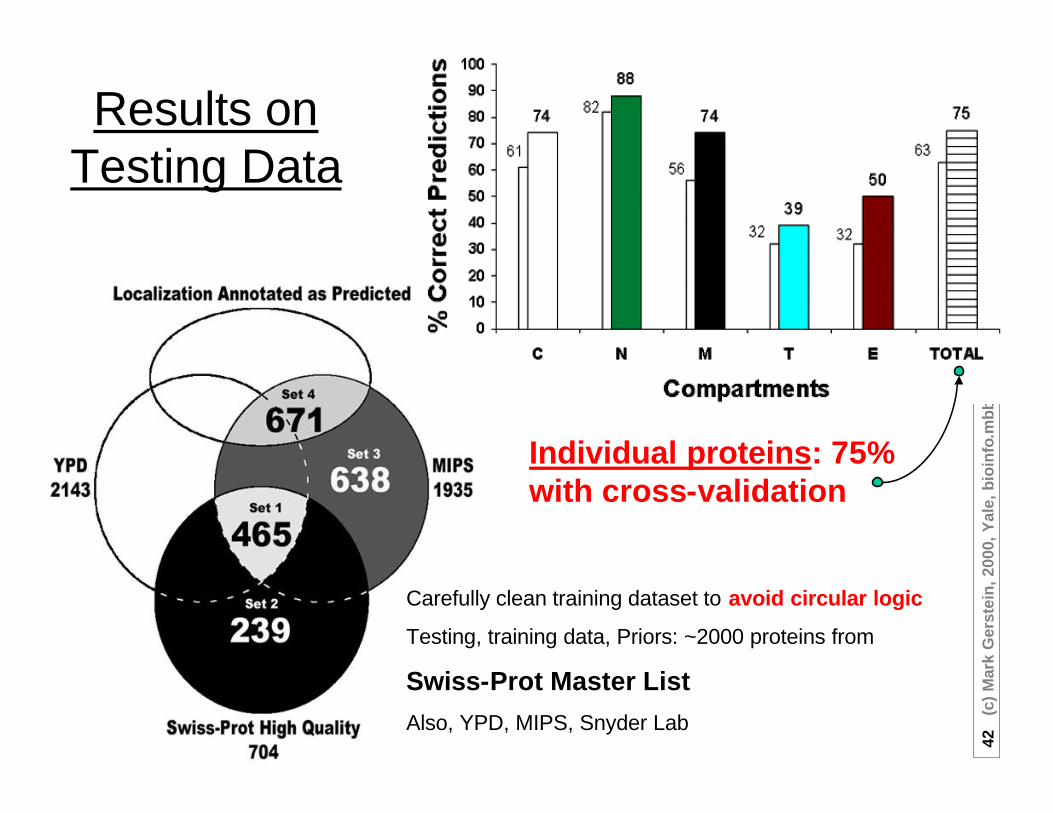
Results on Testing Data
Individual proteins: 75% with cross-validation
Carefully clean training dataset to avoid circular logic
Testing, training data, Priors: ~2000 proteins from
Swiss-Prot Master List
Also, YPD, MIPS, Snyder Lab
43(c
) M
ark
Ger
stei
n, 2
000,
Yal
e, b
ioin
fo.m
bb
.yal
e.ed
u
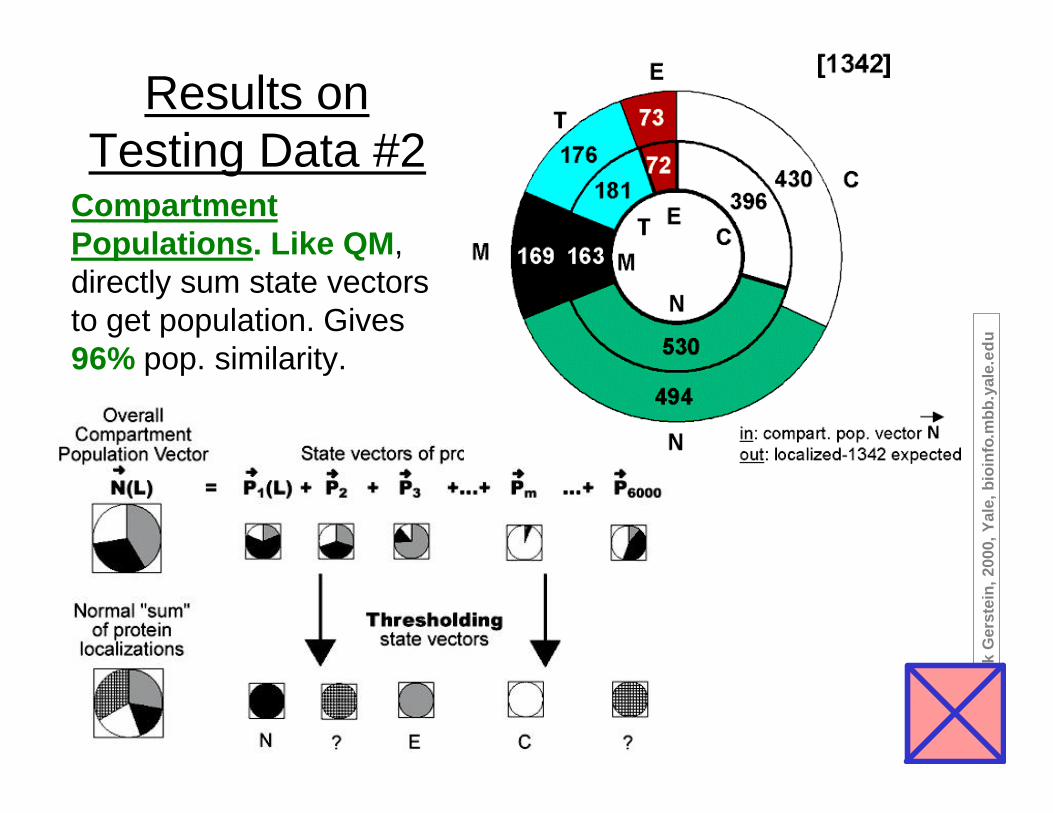
Results on Testing Data #2
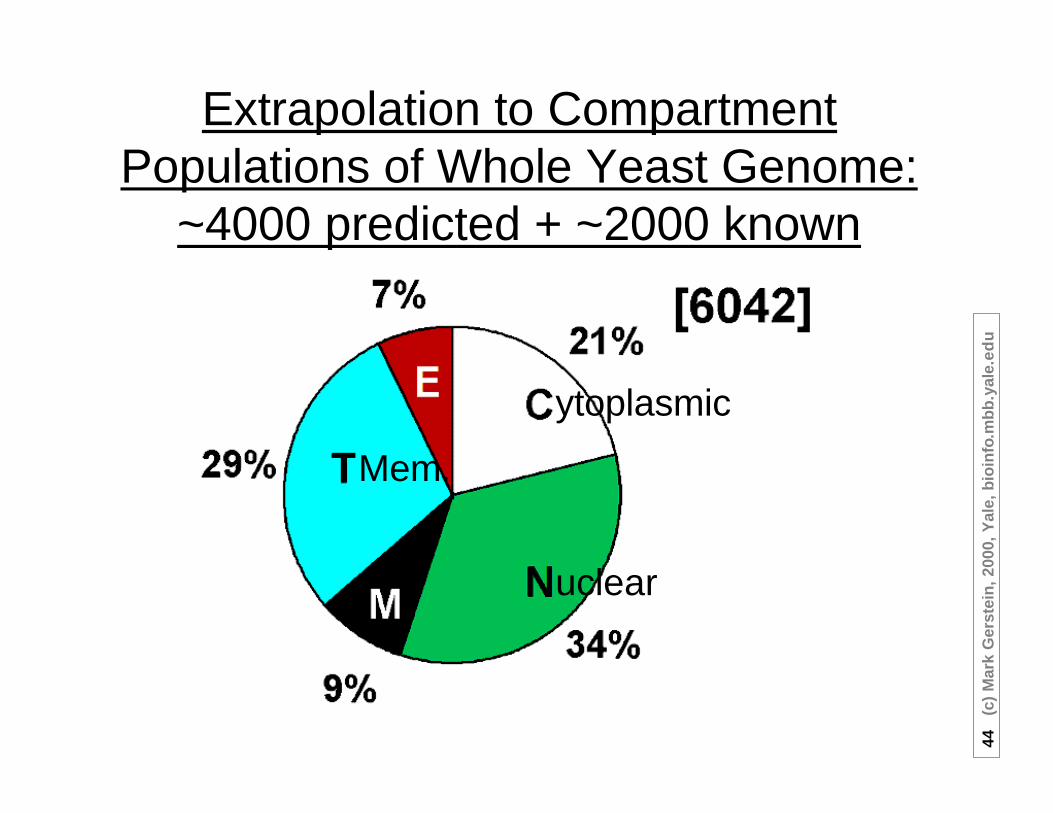
Compartment Populations. Like QM, directly sum state vectors to get population. Gives 96% pop. similarity.
44(c
) M
ark
Ger
stei
n, 2
000,
Yal
e, b
ioin
fo.m
bb
.yal
e.ed
u
Extrapolation to Compartment Populations of Whole Yeast Genome:
~4000 predicted + ~2000 known
uclear
ytoplasmic
Mem.

45(c
) M
ark
Ger
stei
n, 2
000,
Yal
e, b
ioin
fo.m
bb
.yal
e.ed
u
1 Using Parts to Interpret Genomes. Shared and/or unique parts. Venn Diagrams, Fold tree with all-β diff. Ortholog tree. Top-10 folds.
2 Using Parts to Interpret Pseudogenomes. In worm, top Ψ−folds (DNAse, hydrolase) v top-folds (Ig). chr. IV enriched, dead and dying families (90YG v 1G)
3 Using Parts to Interpret Transcriptomes: Expression & Structure. Top-10 parts in mRNA. Enriched in transcriptome: αβ folds, energy, synthesis,TIM fold, VGA. Depleted: TMs, transport, transcription, Leu-zip, NS. Compare with prot. abundance.
4 Expression & Localization.Enriched : Cytoplasmic. Depleted: Nuclear. Bayesian localizer
5 Expression & Function. Expression relates to structure & localization but to function, globally? P-value formalism. Weak relation to protein-protein interactions.
bioinfo.mbb.yale.eduH Hegyi, J Lin, B Stenger,
P Harrison, N Echols, R Jansen, A Drawid, J Qian,
D Greenbaum, M Snyder
Analysis of Genomes & Transcriptomes in terms of the Occurrence of Parts & Features
7(G)→15(T)
5(G)→1(T)
1(G)→2(Ψ)
46(c
) M
ark
Ger
stei
n, 2
000,
Yal
e, b
ioin
fo.m
bb
.yal
e.ed
u
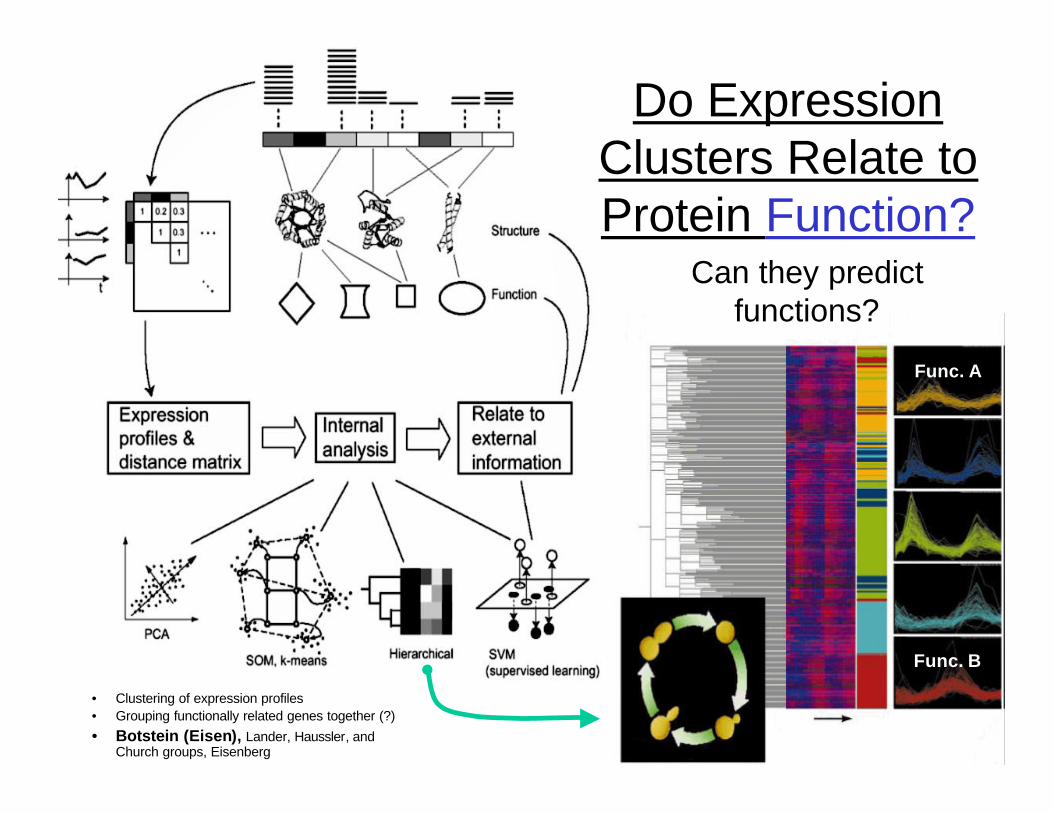
• Clustering of expression profiles• Grouping functionally related genes together (?)
• Botstein (Eisen), Lander, Haussler, and Church groups, Eisenberg
Do Expression Clusters Relate to Protein Function?
Func. A
Func. B
Can they predict functions?
47(c
) M
ark
Ger
stei
n, 2
000,
Yal
e, b
ioin
fo.m
bb
.yal
e.ed
u
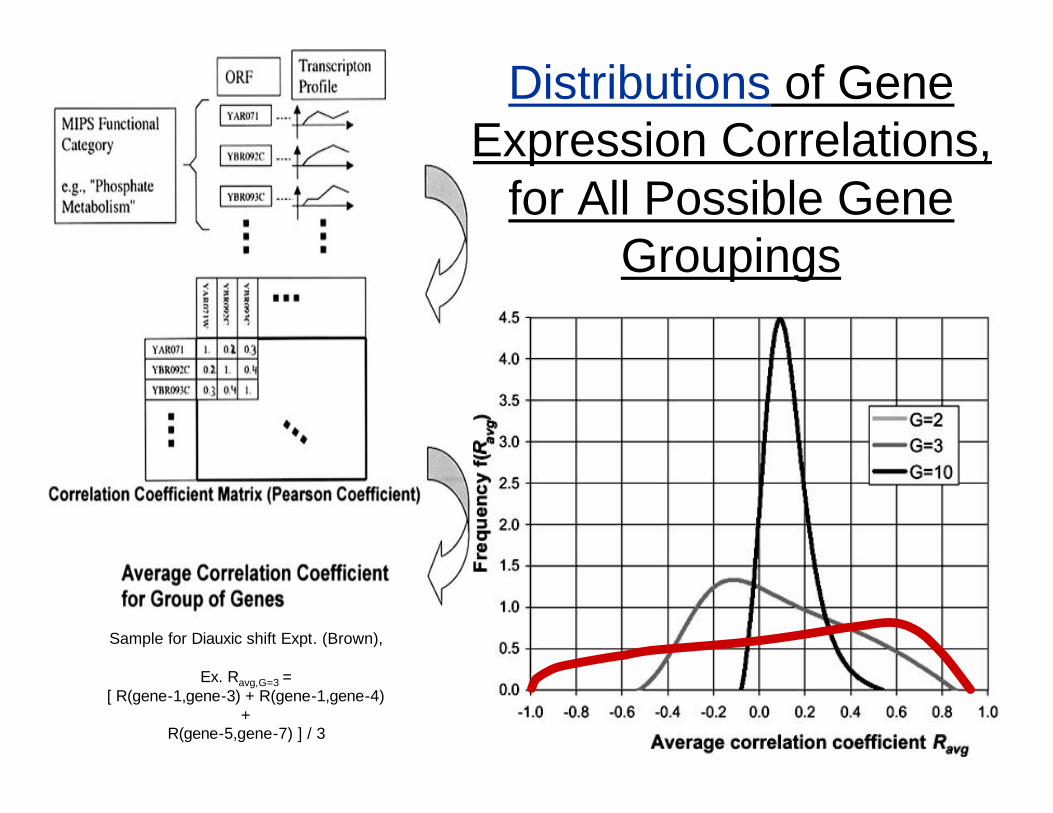
Distributions of Gene Expression Correlations,
for All Possible Gene Groupings
Sample for Diauxic shift Expt. (Brown),
Ex. Ravg,G=3 = [ R(gene-1,gene-3) + R(gene-1,gene-4)
+ R(gene-5,gene-7) ] / 3

48(c
) M
ark
Ger
stei
n, 2
000,
Yal
e, b
ioin
fo.m
bb
.yal
e.ed
u
Distributions of Gene Expression Correlations,
for All Possible Gene Groupings 2
Sample for Diauxic shift Expt. (Brown),
Ex. Ravg,G=3 = [ R(gene-1,gene-3) + R(gene-1,gene-4)
+ R(gene-5,gene-7) ] / 3
P-value for specific 10-gene func.
group
49(c
) M
ark
Ger
stei
n, 2
000,
Yal
e, b
ioin
fo.m
bb
.yal
e.ed
u
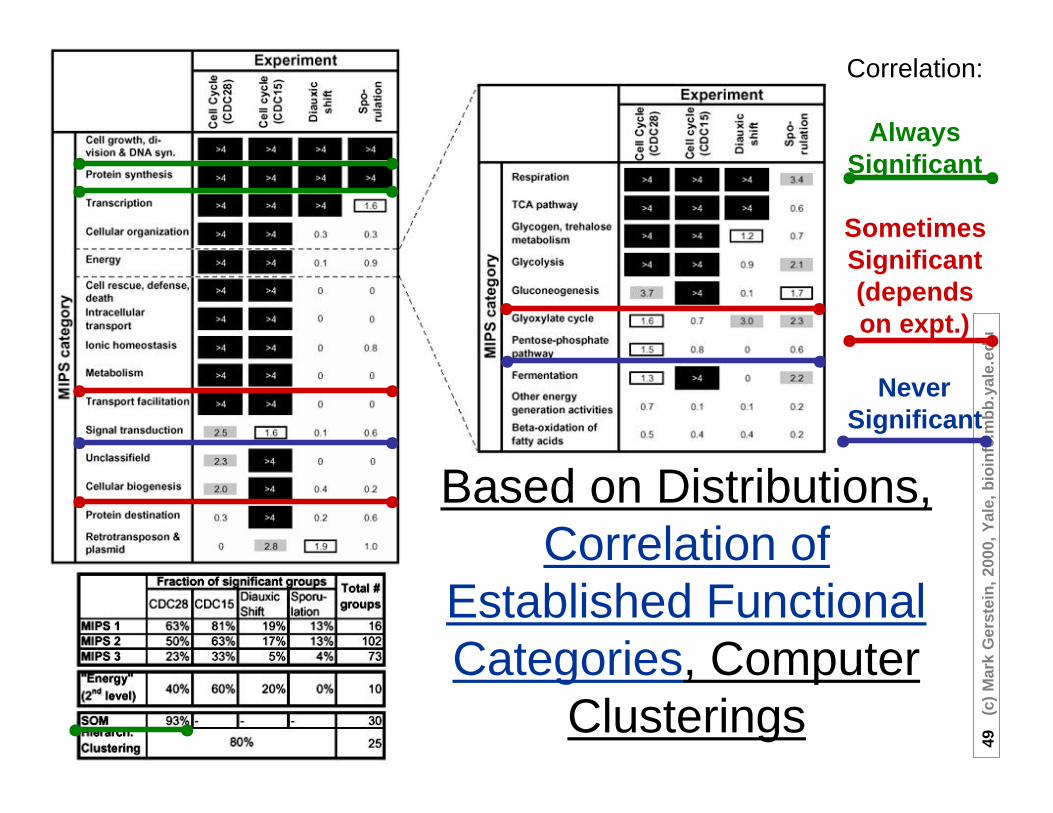
Correlation:
AlwaysSignificant
SometimesSignificant(dependson expt.)
NeverSignificant
Based on Distributions, Correlation of
Established Functional Categories, Computer
Clusterings

50(c
) M
ark
Ger
stei
n, 2
000,
Yal
e, b
ioin
fo.m
bb
.yal
e.ed
u
Protein-Protein Interactions &
ExpressionUse same formalism to assess how closely related expression
timecourses to sets of known p-p interactions
Sets of interactions
between selected expression timecourses in CDC28 expt. (Davis)
(all pairs)(control)
(from MIPS)
(strong interaction, clearly diff.)
(Uetz et al.)

51(c
) M
ark
Ger
stei
n, 2
000,
Yal
e, b
ioin
fo.m
bb
.yal
e.ed
u
Relation of P-P Interactions to Abs. Expression Level
Distribution of Normalized
Expression Levels
Sets of Interacting Proteins
for

52(c
) M
ark
Ger
stei
n, 2
000,
Yal
e, b
ioin
fo.m
bb
.yal
e.ed
u
Can we define FUNCTION well enough to relate to expression?
24(c
) Mar
k G
erst
ein
, 200
0, Y
ale,
bio
info
.mb
b.ya
le.e
du
Functional Classification
GenProtEC(E. coli, Riley)
MIPS/PEDANT(yeast, Mewes)
“Fly” (fly, Ashburner)now extended to GO (cross-org.)
ENZYME(SwissProt Bairoch/Apweiler,just enzymes, cross-org.)
Also:
Other SwissProt Annotation
WIT, KEGG (just pathways)
TIGR EGAD (human ESTs)
COGs(cross-org., just conserved, NCBIKoonin/Lipman)
Problems defining function:Multi-functionality: 2 functions/protein (also 2 proteins/function) Conflating of Roles: molecular action, cellular role, phenotypic
manifestation.Non-systematic Terminology:
‘suppressor-of-white-apricot’ & ‘darkener-of-apricot’
Fold, Localization, Interactions & Regulation are
attributes of proteins that are much more clearly
defined
vs.
53(c
) M
ark
Ger
stei
n, 2
000,
Yal
e, b
ioin
fo.m
bb
.yal
e.ed
u
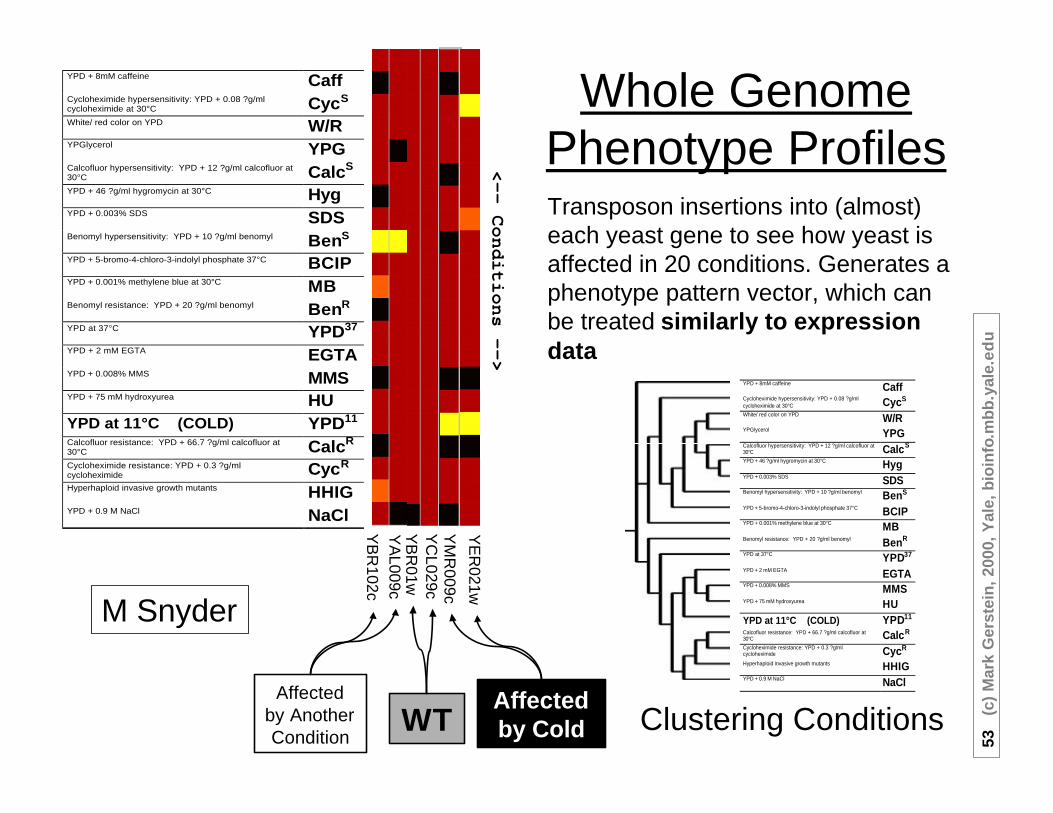
Whole Genome Phenotype Profiles
YPD + 8mM caffeine CaffCycloheximide hypersensitivity: YPD + 0.08 ?g/mlcycloheximide at 30°C CycS
White/ red color on YPD W/RYPGlycerol YPGCalcofluor hypersensitivity: YPD + 12 ?g/ml calcofluor at30°C CalcS
YPD + 46 ?g/ml hygromycin at 30°C HygYPD + 0.003% SDS SDSBenomyl hypersensitivity: YPD + 10 ?g/ml benomyl BenS
YPD + 5-bromo-4-chloro-3-indolyl phosphate 37°C BCIPYPD + 0.001% methylene blue at 30°C MBBenomyl resistance: YPD + 20 ?g/ml benomyl BenR
YPD at 37°C YPD37
YPD + 2 mM EGTA EGTAYPD + 0.008% MMS MMSYPD + 75 mM hydroxyurea HUYPD at 11°C (COLD) YPD11
Calcofluor resistance: YPD + 66.7 ?g/ml calcofluor at30°C CalcR
Cycloheximide resistance: YPD + 0.3 ?g/mlcycloheximide CycR
Hyperhaploid invasive growth mutants HHIGYPD + 0.9 M NaCl NaCl
YE
R021w
YA
L009c
YM
R009c
YC
L029cY
BR
01w
Affected by ColdWT
Affected by Another Condition
YB
R102c
Transposon insertions into (almost) each yeast gene to see how yeast is affected in 20 conditions. Generates a phenotype pattern vector, which can be treated similarly to expression data
YPD + 8mM caffeine CaffCycloheximide hypersensitivity: YPD + 0.08 ?g/mlcycloheximide at 30°C CycS
White/ red color on YPD W/RYPGlycerol YPGCalcofluor hypersensitivity: YPD + 12 ?g/ml calcofluor at30°C CalcS
YPD + 46 ?g/ml hygromycin at 30°C HygYPD + 0.003% SDS SDSBenomyl hypersensitivity: YPD + 10 ?g/ml benomyl BenS
YPD + 5-bromo-4-chloro-3-indolyl phosphate 37°C BCIPYPD + 0.001% methylene blue at 30°C MBBenomyl resistance: YPD + 20 ?g/ml benomyl BenR
YPD at 37°C YPD37
YPD + 2 mM EGTA EGTAYPD + 0.008% MMS MMSYPD + 75 mM hydroxyurea HUYPD at 11°C (COLD) YPD11
Calcofluor resistance: YPD + 66.7 ?g/ml calcofluor at30°C CalcR
Cycloheximide resistance: YPD + 0.3 ?g/mlcycloheximide CycR
Hyperhaploid invasive growth mutants HHIGYPD + 0.9 M NaCl NaCl
<--Conditions -->
Clustering Conditions
M Snyder
54(c
) M
ark
Ger
stei
n, 2
000,
Yal
e, b
ioin
fo.m
bb
.yal
e.ed
u
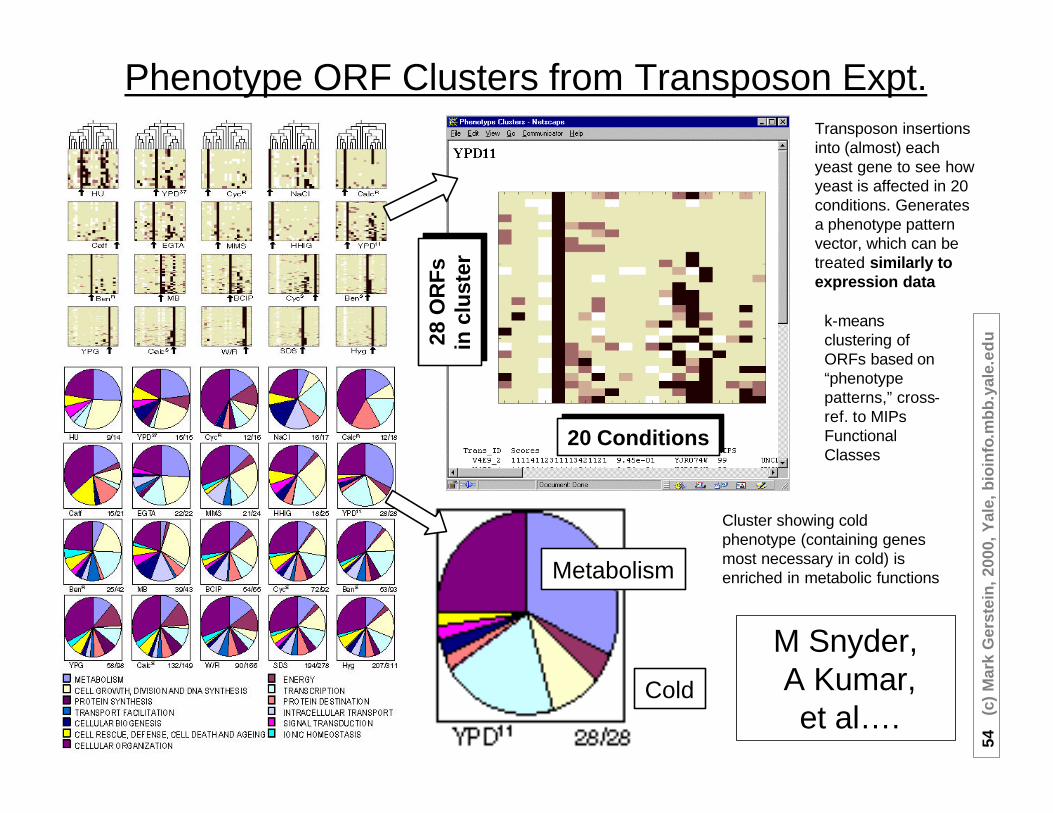
k-means clustering of ORFs based on “phenotype patterns,” cross-ref. to MIPs Functional Classes
20 Conditions20 Conditions
Metabolism
Cold
28 O
RFs
in
clu
ster
28 O
RFs
in
clu
ster
Phenotype ORF Clusters from Transposon Expt.
Cluster showing cold phenotype (containing genes most necessary in cold) is enriched in metabolic functions
Transposon insertions into (almost) each yeast gene to see how yeast is affected in 20 conditions. Generates a phenotype pattern vector, which can be treated similarly to expression data
M Snyder,A Kumar,et al….

55(c
) M
ark
Ger
stei
n, 2
000,
Yal
e, b
ioin
fo.m
bb
.yal
e.ed
u
1 Using Parts to Interpret Genomes. Shared and/or unique parts. Venn Diagrams, Fold tree with all-β diff. Ortholog tree. Top-10 folds.
2 Using Parts to Interpret Pseudogenomes. In worm, top Ψ−folds (DNAse, hydrolase) v top-folds (Ig). chr. IV enriched, dead and dying families (90YG v 1G)
3 Using Parts to Interpret Transcriptomes: Expression & Structure. Top-10 parts in mRNA. Enriched in transcriptome: αβ folds, energy, synthesis,TIM fold, VGA. Depleted: TMs, transport, transcription, Leu-zip, NS. Compare with prot. abundance.
4 Expression & Localization.Enriched : Cytoplasmic. Depleted: Nuclear. Bayesian localizer
5 Expression & Function. Expression relates to structure & localization but to function, globally? P-value formalism. Weak relation to protein-protein interactions.
bioinfo.mbb.yale.eduH Hegyi, J Lin, B Stenger,
P Harrison, N Echols, R Jansen, A Drawid, J Qian,
D Greenbaum, M Snyder
Analysis of Genomes & Transcriptomes in terms of the Occurrence of Parts & Features
7(G)→15(T)
5(G)→1(T)
1(G)→2(Ψ)
56(c
) M
ark
Ger
stei
n, 2
000,
Yal
e, b
ioin
fo.m
bb
.yal
e.ed
u
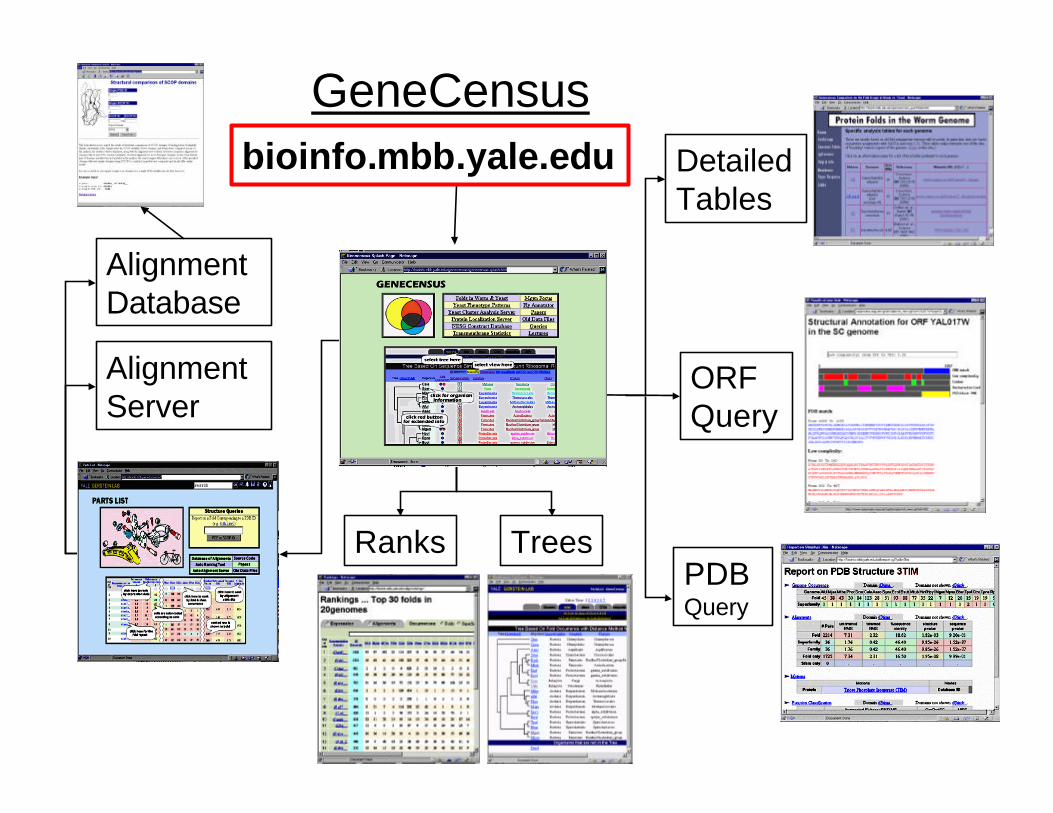
GeneCensus
ORF Query
Alignment Server
Alignment Database
PDB Query
Detailed Tables
bioinfo.mbb.yale.edu
Ranks Trees
57(c
) M
ark
Ger
stei
n, 2
000,
Yal
e, b
ioin
fo.m
bb
.yal
e.ed
u
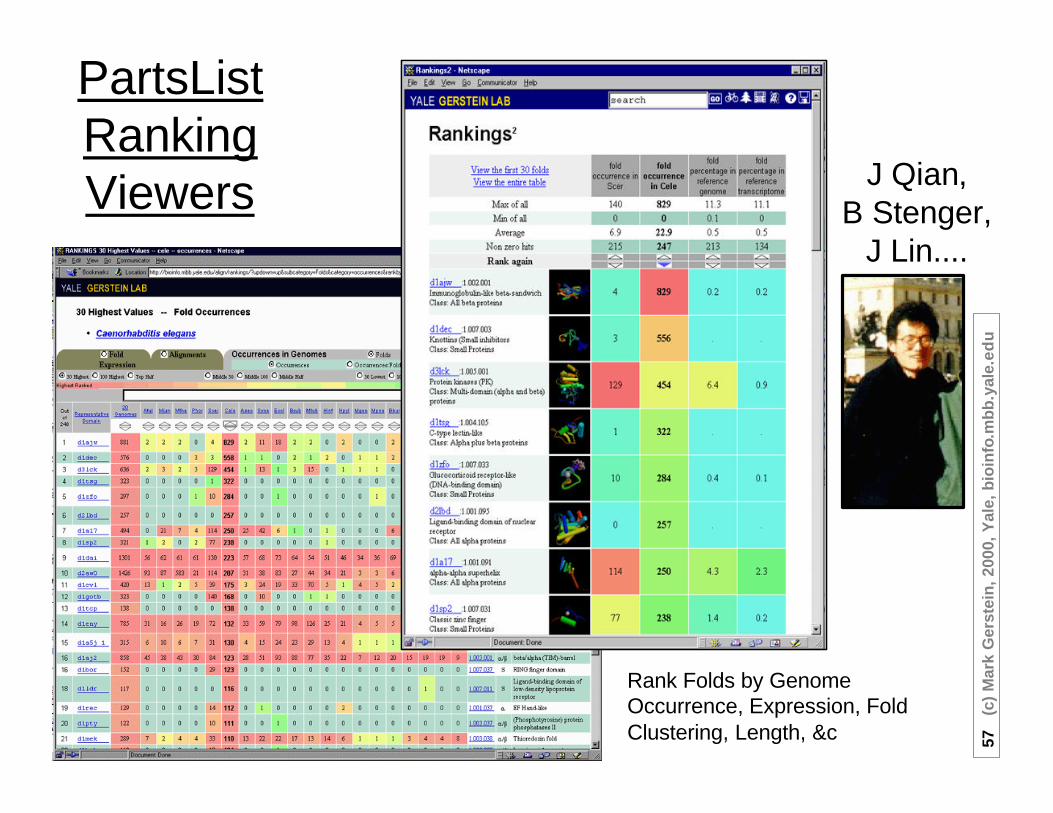
PartsListRanking Viewers
Rank Folds by Genome Occurrence, Expression, Fold Clustering, Length, &c
J Qian, B Stenger,
J Lin....

58(c
) M
ark
Ger
stei
n, 2
000,
Yal
e, b
ioin
fo.m
bb
.yal
e.ed
u
Surveying a Finite PartsList from Many Perspective
59(c
) M
ark
Ger
stei
n, 2
000,
Yal
e, b
ioin
fo.m
bb
.yal
e.ed
u
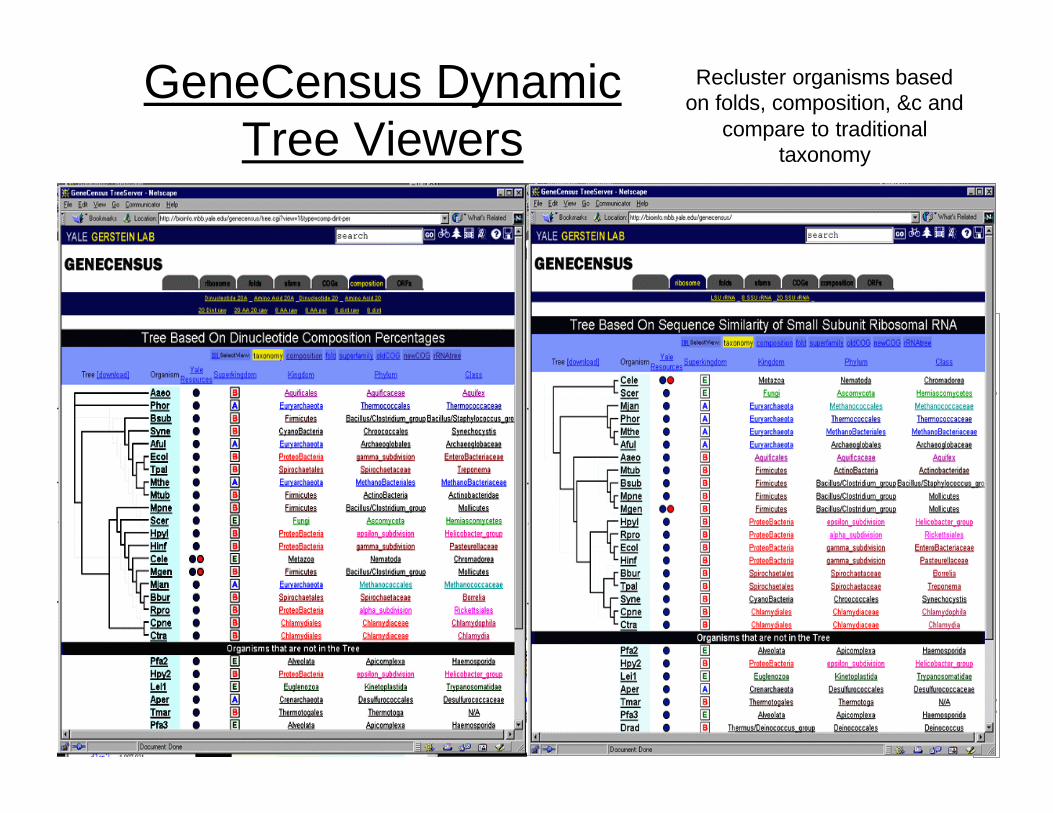
GeneCensus Dynamic Tree Viewers
Recluster organisms based on folds, composition, &c and
compare to traditional taxonomy

60(c
) M
ark
Ger
stei
n, 2
000,
Yal
e, b
ioin
fo.m
bb
.yal
e.ed
u
1 Using Parts to Interpret Genomes. Shared and/or unique parts. Venn Diagrams, Fold tree with all-β diff. Ortholog tree. Top-10 folds.
2 Using Parts to Interpret Pseudogenomes. In worm, top Ψ−folds (DNAse, hydrolase) v top-folds (Ig). chr. IV enriched, dead and dying families (90YG v 1G)
3 Using Parts to Interpret Transcriptomes: Expression & Structure. Top-10 parts in mRNA. Enriched in transcriptome: αβ folds, energy, synthesis,TIM fold, VGA. Depleted: TMs, transport, transcription, Leu-zip, NS. Compare with prot. abundance.
4 Expression & Localization.Enriched : Cytoplasmic. Depleted: Nuclear. Bayesian localizer
5 Expression & Function. Expression relates to structure & localization but to function, globally? P-value formalism. Weak relation to protein-protein interactions.
bioinfo.mbb.yale.eduH Hegyi, J Lin, B Stenger,
P Harrison, N Echols, R Jansen, A Drawid, J Qian,
D Greenbaum, M Snyder
Analysis of Genomes & Transcriptomes in terms of the Occurrence of Parts & Features
7(G)→15(T)
5(G)→1(T)
1(G)→2(Ψ)