Surveys and Questionnaires Government agencies, news organizations, and marketing companies often...
26
Surveys and Questionnaires
-
Upload
dulcie-garrett -
Category
Documents
-
view
216 -
download
0
Transcript of Surveys and Questionnaires Government agencies, news organizations, and marketing companies often...

Surveys and Questionnaires

Government agencies, news organizations, and marketing companies often conduct surveys.
The results can be factual or subjective.

Sampling Techniques

Governments, companies, and news agencies often want to know the public’s opinion on pertinent questions.
Elections offer an excellent example of sampling and bias.

Suppose you want to know who is going to win the next election?

Clearly it is not feasible to ask every person in the country directly.
You can probably get an idea of the results by asking only a certain number of people…
The question is, “how many?”

A marketing research firm (Ipsos-Reid or Ekos or Decima)
would be hired by a news agency (CBC) to poll the public…

A private company must be efficient to stay in business.

If a company asks too many people,
they are wasting time and money
If a company asks too few people,
the results will not be valid.
Determining the right number of respondents is a major challenge to these companies

Canada’s population is about 32.5 million
There are about 22.5 million registered voters
Approximately 60% of the registered voters actually vote
About 13.5 million people vote

Canada’s population is about 32.5 million
There are about 22.5 millions registered voters
Approximately 60% of the population actually votes
About 13.5 million people vote
SES polls tracks 1200 voters
0.0089% of the population !!!!!!

Population
• All individuals in the group being studied
Sample
• A subset of the population

To see some examples of samples taken from
populations, check out the website below
samples

There are a number of different ways populations can be sampled.
A representative sample needs to be typical of the entire population.
If it is not representative, it is biased and the survey results are
invalid.

Simple Random Sample
All selections must be independent of one another and equally likely
Use a random number generator, dice, or a hat draw to ensure the data is randomly sampled.
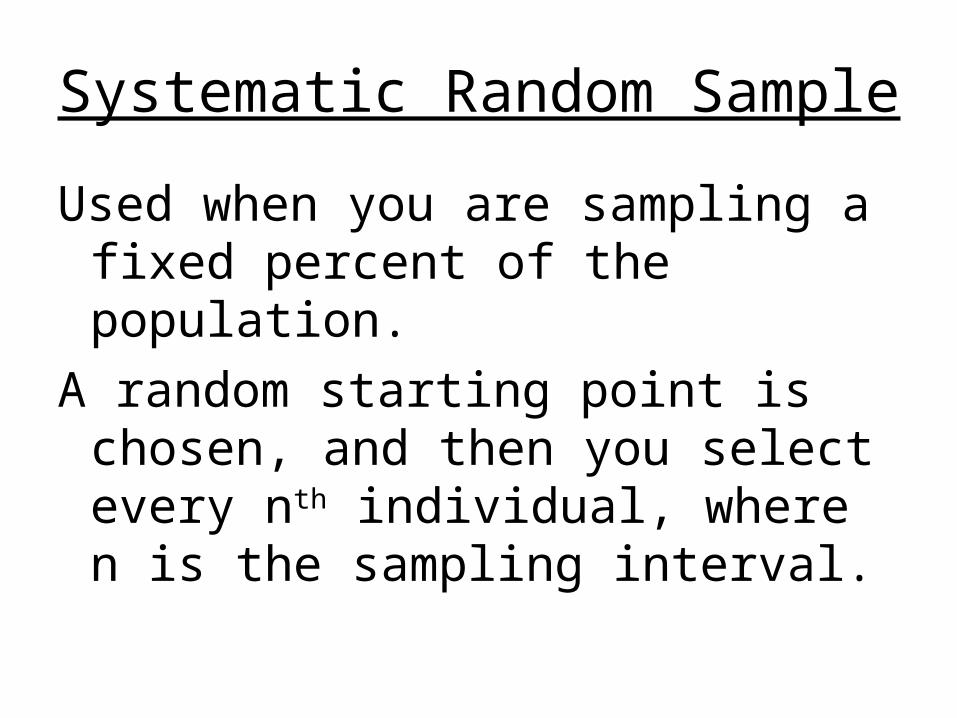
Systematic Random Sample
Used when you are sampling a fixed percent of the population.
A random starting point is chosen, and then you select every nth individual, where n is the sampling interval.

Randomly select the first person to measure (from 1 to 4), then measure every 4th person after them.

Stratified Random SamplingThe population is divided into
different groups called strata (ex. geographic areas, gender,age).
A simple random sample of the members in each stratum is taken.
The size of the sample is proportional to the stratum’s size. (a consistent percent)

Other sampling techniques
Make a note of the sampling techniques discussed in the glossary
Convenience Sampling:
Voluntary sampling

• Statistical bias is any factor that favours certain outcomes or responses and hence systematically skews the survey results.
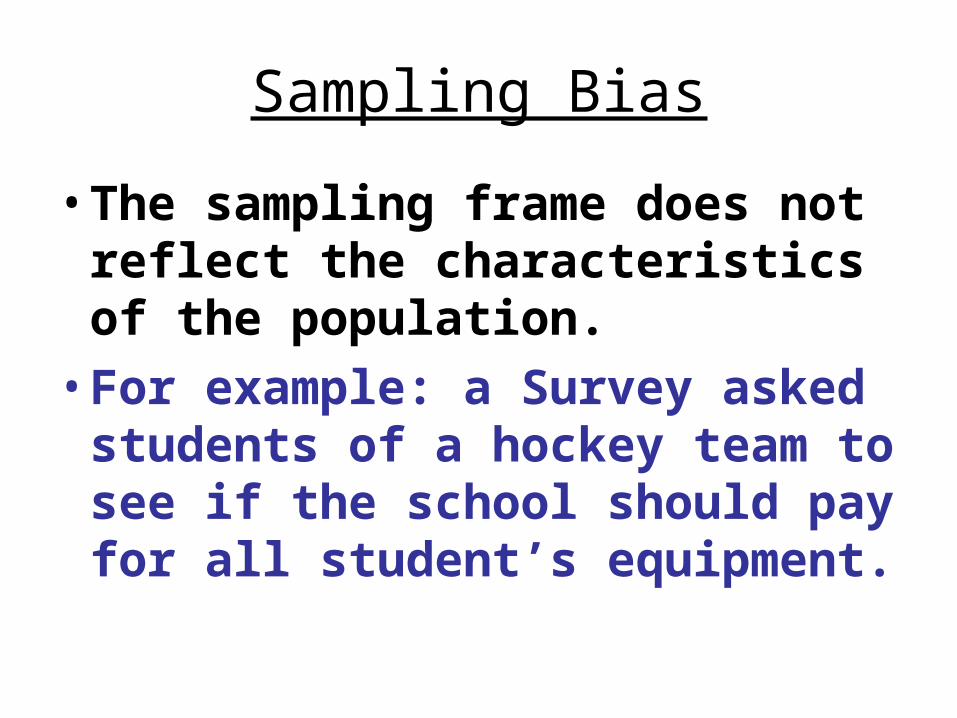
Sampling Bias
• The sampling frame does not reflect the characteristics of the population.
• For example: a Survey asked students of a hockey team to see if the school should pay for all student’s equipment.

Non-Response Bias
• Occurs when certain groups are under represented in the survey because they choose not to participate.
• A researcher asks every 5th student entering the cafeteria to fill out a survey. Less than half agree to fill out the questionnaire.

Response Bias• Occurs when participants in a survey
deliberately give false or misleading answers. The respondents might want to influence the results unduly, or they may be afraid or embarrassed to answer sensitive questions honestly.
• After a lesson, a teacher says “raise your hands if you do not understand”

Measurement Bias
• Occurs when the data collection method consistently either under or overestimates a characteristic of the population
• A police officer tries to survey traffic speeds by patrolling the highway and recording the speeds of cars around them.
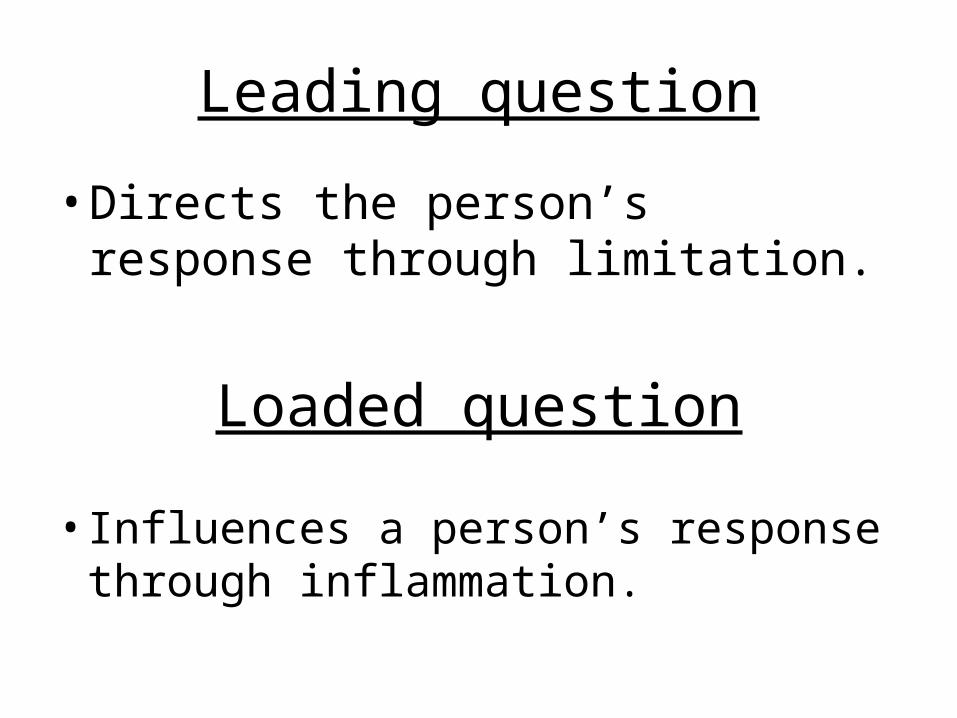
Leading question
• Directs the person’s response through limitation.
Loaded question
• Influences a person’s response through inflammation.

Be sure to read pg 211 ex1 – ex 3
Pg 214
1-12