Survey Procedures for Tourism Economic Impact … Survey Procedures for Tourism Economic Impact...
133
Guidelines: Survey Procedures for Tourism Economic Impact Assessments of Gated Events and Festivals Financed by: Alberta Tourism, Parks, Recreation and Culture Canadian Tourism Commission Federal-Provincial-Territorial Culture/Heritage and Tourism Initiative Government of the Northwest Territories – Department of Resources, Wildlife, & Economic Development Government of Yukon – Department of Tourism and Culture Nova Scotia Department of Tourism, Culture and Heritage Ontario Ministry of Tourism Tourism British Columbia Tourism Prince Edward Island Submitted by: Research Resolutions & Consulting Ltd. March 2007 (Revised) This work is protected by copyright. Any reproduction of this document is allowed, as long as it is in its integral form and acknowledges source. ISBN 978-1-4249-7634-8 PDF
Transcript of Survey Procedures for Tourism Economic Impact … Survey Procedures for Tourism Economic Impact...
Guidelines: Survey Procedures for Tourism Economic Impact Assessments of Gated Events and Festivals
Financed by: Alberta Tourism, Parks, Recreation and Culture
Canadian Tourism Commission Federal-Provincial-Territorial Culture/Heritage and Tourism Initiative
Government of the Northwest Territories – Department of Resources, Wildlife, & Economic Development Government of Yukon – Department of Tourism and Culture Nova Scotia Department of Tourism, Culture and Heritage
Ontario Ministry of Tourism Tourism British Columbia
Tourism Prince Edward Island
Submitted by:
Research Resolutions & Consulting Ltd.
March 2007
(Revised)
This work is protected by copyright.
Any reproduction of this document is allowed, as long as it is in its integral form and acknowledges source.
ISBN 978-1-4249-7634-8 PDF

Guidelines: Survey Procedures for Tourism Economic Impact Assessments of Gated Events and Festivals
2
Table of Contents
I. WHAT IS THIS GUIDEBOOK ALL ABOUT? .......................................................................................................7
A. Introduction .....................................................................................................................................................7 1. Background.......................................................................................................................................................7 2. Goals ................................................................................................................................................................7 3. Different information needs, event types, and measurement requirements......................................................8 4. Which set of guidelines is most appropriate to meet your information needs? ...............................................10 5. Partners ..........................................................................................................................................................10 6. Benefits to funding organizations ....................................................................................................................11 7. Benefits to event planners & organizers .........................................................................................................11
B. Basic questions you should ask .................................................................................................................12 1. What is “tourism economic impact”? ...............................................................................................................12 2. Why is incremental spending such an important concept? .............................................................................12 3. Tourism economic impact is different from how much money was spent by tourists ......................................13 4. Are there other ways to measure the success of an event? ...........................................................................13 5. Should every event measure its tourism economic impact? ...........................................................................13 6. Why would an event want to estimate its tourism economic impact? .............................................................14 7. Check with sponsors and partners before deciding what to measure!............................................................14 8. What steps does an event organizer have to take to estimate tourism economic impact? .............................14 9. Where can you learn more about tourism economic impact measurement? ..................................................14 10. Do you need to hire research experts?.......................................................................................................14 11. Where else can you obtain help? ...............................................................................................................15 12. What do you need to estimate your event’s tourism economic impact? .....................................................15
II. DESIGNING A TOURISM ECONOMIC IMPACT STUDY...................................................................................18
C. Important concepts.......................................................................................................................................18 1. Event type .......................................................................................................................................................18 2. How many locals and how many tourists came to the event?.........................................................................18 3. What is a tourist? ............................................................................................................................................19 4. Who is your tourist? ........................................................................................................................................19 5. Substitution effects..........................................................................................................................................20 6. The importance of your event in the tourist’s destination choice (“Casuals”) ..................................................20 7. “Time switchers”..............................................................................................................................................20
D. Four components to a tourism economic impact study ...........................................................................21 1. Counting & tallying attendees .........................................................................................................................21 2. Attendee survey ..............................................................................................................................................21 3. Analysis plan...................................................................................................................................................23 4. Documenting the study process......................................................................................................................24

Guidelines: Survey Procedures for Tourism Economic Impact Assessments of Gated Events and Festivals
3
E. Other types of studies ..................................................................................................................................26 1. On-site spending study ...................................................................................................................................26 2. Non-market value studies ...............................................................................................................................26 3. A decision tree ................................................................................................................................................27
III. THE ATTENDEE SURVEY PROCESS ..........................................................................................................28
A. An overview of the process .........................................................................................................................28 1. Essential measurement tasks .........................................................................................................................28 2. A picture of the process ..................................................................................................................................28
B. Counting & tallying attendees at a gated event: key concepts & issues................................................29 1. Elements required for attendee counts and on-site tally .................................................................................29 2. Important definitions for tallies and counts......................................................................................................29 3. Sampling: How the “part” can represent the “whole”......................................................................................29 4. A “stint” is the sampling unit for counts & tallies..............................................................................................30 5. Attendee counts ..............................................................................................................................................30 6. Attendee tallies (the tally interview).................................................................................................................30 7. Recruitment for the attendee survey ...............................................................................................................31 8. Different events require different approaches to stint samples .......................................................................31 9. Tools for “counting” attendees ........................................................................................................................32 10. How to estimate staff requirements for counting/ tallying ...........................................................................32 11. More information about tallying attendees..................................................................................................36 12. “Interviewer stints” ......................................................................................................................................38 13. Number of tally interviewer stints required to meet Attendee Survey completion targets ...........................38 14. Sampling tallied household parties for attendee surveys............................................................................39 15. What if your event does not attract enough tourists to achieve 200 attendee survey completions?...........40 16. Number of interviewers required.................................................................................................................41
C. Designing a sampling plan for counts and tallies .....................................................................................42 1. Estimating the number of interviewer stints you require for counts and tallies................................................42 2. All times and locations must have an opportunity to be in your stint sample ..................................................44
D. The stint sampling plan................................................................................................................................44 1. Three basic steps............................................................................................................................................44 2. Two types of random sampling plans..............................................................................................................44 3. A generic simple random sampling plan .........................................................................................................45 4. A generic stratified random sampling plan ......................................................................................................48
E. Counting attendees ......................................................................................................................................52 1. What does the “counter” do? ..........................................................................................................................53 2. Adjusting “counts” to “tally” data for excluded attendees ................................................................................53 3. What happens if you “miss” a stint? ................................................................................................................53
IV. WEIGHTING AND PROJECTION PLAN FOR COUNTS AND TALLIES ......................................................54

Guidelines: Survey Procedures for Tourism Economic Impact Assessments of Gated Events and Festivals
4
A. Some basic concepts for weighting and projection ..................................................................................54 1. What is a weighting and projection plan?........................................................................................................54 2. Why you have to weight & project counts and tallies ......................................................................................54 3. Other important definitions..............................................................................................................................54
B. A step-by-step description of the weighting and projection process......................................................55 1. The weighting and projection process for simple random samples.................................................................55 2. The weighting and projection process for stratified random samples .............................................................60 3. Estimating attendance by place of residence..................................................................................................62 4. What do you do with the ratios by place of residence?...................................................................................63 5. Step 6: special adjustment for multi-day events.............................................................................................63
V. THE TALLY INTERVIEW PROCESS .................................................................................................................65
A. The interviewers............................................................................................................................................65 1. A critical component of the research process .................................................................................................65 2. Selecting interviewers .....................................................................................................................................65 3. Training interviewers.......................................................................................................................................65 4. Supervision .....................................................................................................................................................66
B. Interviewing ...................................................................................................................................................67 1. Conducting the interview.................................................................................................................................67 2. Stopping an attendee to ask questions using a selection interval (every nth).................................................68 3. The tally unit is a household party...................................................................................................................69 4. The tally questionnaire....................................................................................................................................69 5. Required tally Information ...............................................................................................................................70
C. Recruitment for attendee survey .................................................................................................................74 1. Additional questions required in tally interview ...............................................................................................74 2. Incentives........................................................................................................................................................74 3. Recruitment for self-completion attendee survey at tally stage.......................................................................75
VI. COUNTING ATTENDEES ..............................................................................................................................78
A. Units for counters .........................................................................................................................................78
B. Stint-by-stint counts .....................................................................................................................................78
VII. ATTENDEE SURVEY ANALYSIS PLAN – NON-LOCALS ...........................................................................79
A. An overview...................................................................................................................................................79
B. Creating a “raw” data file .............................................................................................................................79 1. What is a “raw data file”? ................................................................................................................................79 2. Unique respondent ID # ..................................................................................................................................79 3. Usable questionnaires ....................................................................................................................................80

Guidelines: Survey Procedures for Tourism Economic Impact Assessments of Gated Events and Festivals
5
4. Calculating response rate ...............................................................................................................................80
C. Coding survey responses ............................................................................................................................80 1. Unique variable addresses in your data file ....................................................................................................80 2. Numeric fields .................................................................................................................................................81 3. Developing code lists for geographical units...................................................................................................81 4. Data entry & verification..................................................................................................................................82 5. Keep a copy of the raw data file......................................................................................................................82
D. Creating a “clean” data file ..........................................................................................................................82 1. Introduction .....................................................................................................................................................82 2. Internal consistency edits................................................................................................................................82 3. Check for reasonable values ..........................................................................................................................83 4. Replacing missing values and distributing “total” values to specific spending categories...............................83 5. Definitions: reported, allocated and attributed spending .................................................................................85
E. Assigning spending to geographic areas...................................................................................................85
F. Constructing “event accounts” (incremental spending) ..............................................................................85 1. Two event account columns ...........................................................................................................................86 2. Substitution effects..........................................................................................................................................86 3. Trip replacement .............................................................................................................................................86 4. Importance of event in destination choice.......................................................................................................87 5. If importance of event question is don’t know or blank ...................................................................................87
G. Weighting and projecting Attendee Survey data .......................................................................................88 1. Using tally weights ..........................................................................................................................................88
VIII. DOCUMENTING THE STUDY PROCESS .....................................................................................................91
H. Introduction ...................................................................................................................................................91 1. What is a Technical Appendix?.......................................................................................................................91 2. What does a Technical Appendix contain? .....................................................................................................91
I. Contents of a Technical Appendix...................................................................................................................92 1. Overview of study objectives and study sponsor(s) ........................................................................................92 2. Who conducted the study ...............................................................................................................................92 3. Study timing and survey dates........................................................................................................................92 4. Description of the data capture method(s) used .............................................................................................92 5. Description of the universe under study..........................................................................................................93 6. Definition of “Qualified Respondents” .............................................................................................................93 7. Sampling .........................................................................................................................................................93 8. Field procedures .............................................................................................................................................94 9. Response rate.................................................................................................................................................95 10. Calculations for weighting/projection ..........................................................................................................96 11. Data editing, cleaning and adjustment procedures.....................................................................................96 12. Field materials ............................................................................................................................................96

Guidelines: Survey Procedures for Tourism Economic Impact Assessments of Gated Events and Festivals
6
IX. GLOSSARY....................................................................................................................................................97
APPENDIX I: SUPPORTERS & PANEL OF EXPERT MEMBERS...........................................................................101
A. Supporters...................................................................................................................................................101
B. Panel of Experts..........................................................................................................................................101
APPENDIX II: MARGIN OF ERROR TABLE ...........................................................................................................102
APPENDIX III: ATTENDEE SURVEY: EDITING & SPENDING ALLOCATION ......................................................104
Special Edit Rules for Lodging ...............................................................................................................................104
APPENDIX IV: ASSIGNING SPENDING TO CATEGORIES...................................................................................105
A. Only “Total” provided.................................................................................................................................105 1. Checked some “Spent Any” boxes................................................................................................................105 2. Checked no “Spent Any” boxes ....................................................................................................................105
B. No Total Provided and Some Items Marked with “Don’t Know” Amount ..............................................105
C. Total Provided and Some Items Marked with “Don’t Know” Amount....................................................106
D. No Spending Information Provided...........................................................................................................106
E. Guidelines for Calculating Average Spending for Allocation/ Ascription .............................................106
F. Attendee Survey: Geographic Distribution Tables .....................................................................................108
G. Identifying and Assigning Incremental Spending to Event Account .....................................................109
APPENDIX V: ANNOTATED LITERATURE REVIEW FOR EVENTS & FESTIVALS.............................................110
H. Gated Events ...............................................................................................................................................110
I. Ungated Events ...............................................................................................................................................116
APPENDIX VI: SAMPLE TALLY QUESTION LIST AND TALLY FORM .................................................................119 Sample Tally Sheet................................................................................................................................................123
APPENDIX VII: SAMPLE ATTENDEE SURVEY QUESTIONNAIRES (NON-LOCAL & LOCAL VERSIONS)........124

Guidelines: Survey Procedures for Tourism Economic Impact Assessments of Gated Events and Festivals
7
I. WHAT IS THIS GUIDEBOOK ALL ABOUT?
A. Introduction
1. Background
Event and festival organizers are often called upon to make estimates of tourism-related economic impacts to justify their requests for support from private and public sector sponsors. Many of these events are comparatively small, operate on very low budgets and have neither the skilled staff to implement nor the funds to purchase high quality tourism economic impact studies. The result is a proliferation of tourism economic impact studies that generate estimates that are not credible. All too often, the estimates are inaccurate, at least in part because the manner in which information is collected and projected does not meet acceptable research standards.
2. Goals
These guidelines are designed to enable organizers of small and medium sized fairs, festivals and events across North America to produce more credible and consistent inputs for estimating their tourism economic impact1. A new level of consistency and professionalism will be brought to this important measurement task as event organizers adopt the guidelines as minimum standards.
Events that elect to measure other characteristics such as on-site spending and attendee satisfaction and profile information will also benefit from the application of the procedures and minimum standards described in these guidelines. A further goal of the project was to explore alternative ways to estimate the value of an event or festival. To this end, a discussion paper on approaches to estimating non-market values was prepared (available under separate cover). This document covers topics such as willingness to pay (WTP), and other forms of revealed or stated preference in the context of events and festivals.
1 These guidelines are designed to allow organizers of small and medium sized events and festivals to produce credible estimates of tourism economic impact with limited assistance from professional consultants. Consequently the guidelines include some “rules of thumb” and simplifications that would not be appropriate for studies of larger events and festivals. These guidelines are most appropriate for events and festivals with 50,000 or fewer “net” attendees. “Net” attendees are unique visitors to an event. Thus, if the same individual attends the event on three separate days, he or she is counted only once in the “net attendance” count. Similarly, the person who attends the event on only one day is counted once in the “net attendance” estimate.

Guidelines: Survey Procedures for Tourism Economic Impact Assessments of Gated Events and Festivals
8
3. Different information needs, event types, and measurement requirements
Event organizers and planners have different information needs and are responsible for different types of events. In turn, information needs and event types require different measurement plans and tools. To determine which of the following four sets of guidelines is most appropriate to meet your needs, use the definitions provided below and refer to the grid in Section 4.
1. Guidelines: Survey Procedures for Tourism Economic Impact Assessments of Gated Events and Festivals
2. Guidelines: Survey Procedures for Tourism Economic Impact Assessments of Ungated and Open Access Events and Festivals
3. Guidelines: Survey Procedures for Assessment of On-Site Spending at Gated Events and Festivals
4. Guidelines: Survey Procedures for Assessment of On-Site Spending at Ungated or Open Access Events and Festivals
The Guidelines are not appropriate for all types of events. Specifically, they are not suitable for sports tournaments (e.g., recreational hockey or softball tournaments) or competitions (e.g., dance competitions) in which most attendees are also participants in the event2 or for commercial trade shows nor do they provide tools to estimate the economic impact of on-site or future commercial sales that may be stimulated by an event.
In effect, the spending estimates and economic benefits discussed in these Guidelines are limited to those that are deemed “touristic”.
Note that the Guidelines focus on how to generate inputs for estimating tourism economic impact or on-site spending. They do not include economic impact models per se.
a) Gated versus ungated or open access events
A “gated” event is one that takes place in a confined area with “gates” or other “controlled” points of entry/exit. Estimating total attendance is comparatively straightforward at a gated event because event organizers can count tickets or entrants as they pass through controlled entry points. Many of the measurement processes are similar for generating a gated event’s tourism economic impact or on-site spending (see below).
An “ungated” or open access event is one that takes place in whole or in part in an open area where access is not controlled. From a measurement perspective, this type of event poses challenges because research tools are required to estimate total attendance without the benefit of “head counts” as attendees enter or exit the site. The challenges are similar for generating estimates of an ungated event’s tourism economic impact or on-site spending (see below).
2 For more information on methodologies for this type of event, see John L. Crompton’s Measuring the Economic Impact of Visitors to Sports Tournaments and Special Events, National Recreation and Park Association, 1999.

Guidelines: Survey Procedures for Tourism Economic Impact Assessments of Gated Events and Festivals
9
b) Tourism economic impact versus on-site spending
Tourism economic impact is the change in sales, income and jobs in businesses or agencies that receive tourists’ spending directly, indirectly or as a result of household expenditures, from the income earned directly or indirectly because tourists came to the community and spent money there.
The tourism economic impact of an event takes into account incremental spending by tourists who travel from outside the community and go to the event. Incremental spending is money that is spent at or because of the event that would not otherwise have been spent in the community.
It does not include spending associated with the event by people who live in the community (locals). A tourism economic impact assessment is most appropriate for small and medium sized events that attract at least ten percent of their total attendance from tourists – people who do not live in area in which the event takes place and is appropriate for gated and ungated events (see above)3.
On-site spending at an event by all attendees including community residents and tourists may be an appropriate information objective for events that do not attract a sizeable proportion of tourists and/or do not have the resources to undertake a tourism economic impact assessment or for other purposes. On-site spending is money spent at the event site itself and for tickets to attend the event. It also includes money spent on parking, refreshments, souvenirs and other retail purchases and additional admission fees (e.g., amusement fees for rides, movies, concerts, etc.) on the site.
An on-site spending estimate can be generated for gated or ungated events (see above).
3 Recall that a small or medium sized event is defined as one with 50,000 or fewer “net” attendees.

Guidelines: Survey Procedures for Tourism Economic Impact Assessments of Gated Events and Festivals
10
4. Which set of guidelines is most appropriate to meet your information needs?
Based on the type of event and type of spending of interest to your event, select the guidelines listed below. The highlighted quadrant is “this” document. Others are provided under separate cover.
Gated Event Ungated Event Tourism Economic Impact Estimate
Guidelines: Survey Procedures for Tourism Economic Impact Assessments of Gated Events and Festivals (this document)
Guidelines: Survey Procedures for Tourism Economic Impact Assessments of Ungated or Open Access Events and Festivals (under separate cover)
On-Site Spending Estimate
Guidelines: Survey Procedures for Assessment of On-Site Spending at Gated Events and Festivals (under separate cover)
Guidelines: Survey Procedures for Assessment of On-Site Spending at Ungated or Open Access Events and Festivals (under separate cover)
5. Partners
Financial support for this project from the following organizations is gratefully acknowledged.
Canada Alberta Tourism, Parks, Recreation and Culture
Canadian Tourism Commission
Federal-Provincial-Territorial Culture/Heritage and Tourism Initiative
Government of the Northwest Territories – Department of Resources, Wildlife, & Economic Development
Government of Yukon – Department of Tourism and Culture
Nova Scotia Department of Tourism, Culture and Heritage
Ontario Ministry of Tourism
Tourism British Columbia
Tourism Prince Edward Island
USA Texas A&M University

Guidelines: Survey Procedures for Tourism Economic Impact Assessments of Gated Events and Festivals
11
A panel of experts in Canada and the United States developed these guidelines. The panel includes academics, research practitioners and industry representatives. A complete list of supporters and panel of expert members is appended. [See Appendix I: Supporters & Panel of Expert Members.] Special thanks are due to Dr. James Petrick for his many contributions to this project and to James Storms and Hyong-Gon Kim, graduate students at Texas A&M University, who also contributed to the literature review and website development.
6. Benefits to funding organizations
By adopting these guidelines, event sponsors can achieve a common standard for decision-making. If every event produces estimates of tourism economic impact that meet the minimum standards set forth herein, a common and credible basis for comparisons should emerge. As well, over time, profiles of attendees of different types of events will be developed which may be useful as inputs for forecasting the potential tourism economic impact of events or festivals still in the planning stage.
7. Benefits to event planners & organizers
Event planners and organizers will have tools that enable them to (1) determine whether they are in a position to undertake a tourism economic impact assessment or to select other options to estimate their value and (2) to conduct the tasks required to feed economic impact models with the inputs required to produce consistent and credible estimates of the touristic value of their event.

Guidelines: Survey Procedures for Tourism Economic Impact Assessments of Gated Events and Festivals
12
B. Basic questions you should ask
1. What is “tourism economic impact”?
The tourism economic impact of an event is an estimate of the change in economic activity that results from tourists who come from outside the community to attend an event. If your local newspaper were reporting tourism economic impact, it would print something like the following:
ABC Festival brought _____ thousands of tourists to the city. These tourists, generated $_____ thousands in economic impact, _____ hundreds of jobs for the community, and added $_____ thousands to the local tax coffers.
The numbers used to fill in the blanks in this statement represent the results of a tourism economic impact estimation process based on tourists who attended ABC Festival. The tourism economic impact of an event takes into account incremental spending by tourists who travel from outside the community and go to the event. Incremental spending is money that is spent at or because of the event that would not otherwise have been spent in the community.
Tourism economic impact is the change in sales, income and jobs in businesses or agencies that receive tourists’ spending directly, indirectly or induced as a result of household expenditures, financed from the income earned directly or indirectly because tourists came to the community and spent money there.
2. Why is incremental spending such an important concept?
The purpose of a tourism economic impact estimate is to gauge the impact on an economy of a particular event or activity. If the same money that is spent at or as a result of an event would have been spent in the community on other activities, goods or services, the event is not deemed to be responsible for the spending. In other words, some of the spending that takes place at an event is not incremental – it would have happened anyway.
For example, while visiting your community, Dave and Diane decide to go to your event instead of going to a movie at the local theatre. Suppose that the ticket price for your event and the movie are the same. In this case, the purchase of tickets for your event would produce no incremental spending. Why? Because Dave and Diane would have spent the same amount of money in your community on a recreational activity (either your event or the movie) – whether your event took place or not4.
4 This assumes that the indirect and induced impacts are the same in each case. These guidelines are based on the assumption that any difference in the indirect or induced impacts is inconsequential.
Guidelines: Survey Procedures for Tourism Economic Impact Assessments of Gated Events and Festivals
13
3. Tourism economic impact is different from how much money was spent by tourists
The economic impact of tourists’ activities in a community is not the same as how much tourists spent in the area. In fact, since most communities import goods and services in order to meet tourists’ local demands, not all of the benefits from tourists’ spending in a community will be retained within that community. For this reason, in many communities, tourist spending can be higher than tourism economic impacts.
The economic impact of tourists’ activities in a community is also different from how much all attendees spent at the event. If you want to measure how much money residents of your community and tourists spent at your event, you should consider using an On-Site Spending Study (see Guidelines: Survey Procedures for Assessment of On-Site Spending at Gated Events and Festivals under separate cover).
4. Are there other ways to measure the success of an event?
Yes. There are many ways to evaluate the “success” of an event. A tourism economic impact estimate is only one. For example, an event organizer might wish to estimate total on-site spending by all attendees including community residents and tourists. One may also wish to estimate non-monetary impacts on the community such as the value of maintaining community pride, cultural traditions, and the like. While all of these approaches can be useful, the materials provided here are primarily related to methods to collect data needed to estimate the incremental economic impacts tourists at an event bring to a community, province/state or country.
5. Should every event measure its tourism economic impact?
No. Gathering appropriate information to produce credible estimates of an event’s tourism economic impact takes time and effort. Every event organizer should weigh the benefits and costs of undertaking the steps required before making a decision. If, for example, your event matches one of the following descriptions, it is probably not worthwhile to invest the necessary time and effort:
(1) if the event draws few, if any, people from outside the community (i.e., less than 10% of total attendees are tourists); or
(2) if most of the tourists who go to the event are in the community for a reason other than attending the event (the economic impact associated with the event is linked to how important it was in the decision to visit the community -- see Section II-A-6 for more details).

Guidelines: Survey Procedures for Tourism Economic Impact Assessments of Gated Events and Festivals
14
6. Why would an event want to estimate its tourism economic impact?
If you want to know how much new economic activity (Gross Domestic Product or GDP), how many new jobs and how many new tax dollars came into your community because tourists came to your event, you might want to estimate the event’s tourism economic impact. In other words, a tourism economic impact estimate quantifies the incremental impacts brought to a community because the event attracted these tourists.
Estimates of the contribution your event made to the overall economy of the community (GDP), how many jobs it created and how much it contributed to the tax coffers of the community (or other jurisdictions) because it took place and attracted tourists can be used for planning, to generate community support and for other purposes.
7. Check with sponsors and partners before deciding what to measure!
Some event sponsors are especially interested in the tourism impacts of events whereas others are interested in other measures, such as on-site spending. Make sure that the estimates you produce will meet the needs of potential event sponsors before you design and implement a measurement plan.
8. What steps does an event organizer have to take to estimate tourism economic impact?
See the description on pages 22 through 24 and Figures 1 (page 23) and 2 (page 25) for the various steps required to generate inputs for a tourism economic impact estimate.
9. Where can you learn more about tourism economic impact measurement?
There are many guidelines available to help organizations learn more about tourism economic impact measurement. Some provide less stringent measurement tools than the ones recommended here but are, nonetheless, useful sources of background information. Possible sites that may be of use include the National Recreation and Park Association (NRPA.org), Michigan State University (MSU.edu - see Daniel Stynes) , and economic development offices at the provincial, state or local level.
10. Do you need to hire research experts?
You may find that the technical aspects of sampling, weighting, data management and projection are too complex to take on without the help of research and tabulation experts. If this is the case, you might use these guidelines to develop a Terms of Reference to obtain proposals from local market and economic research suppliers and/or provide these guidelines to your supplier for implementation of the project.

Guidelines: Survey Procedures for Tourism Economic Impact Assessments of Gated Events and Festivals
15
11. Where else can you obtain help?
You can explore options for help in implementing the methods described in these guidelines from faculty members in tourism, economics or social science departments at a local college or university, your sponsors and/or partners (if any), and members of research professional organizations such as the Travel and Tourism Research Association (TTRA, www.ttra.com), Marketing Research and Intelligence Association (MRIA, www.mria-arim.ca) or Marketing Research Association (U.S.A.) (MRA,, www.mra-net.org). These organizations maintain lists of members who may be able to meet your needs.
12. What do you need to estimate your event’s tourism economic impact?
a) Money
The guidelines recommend the collection of information directly from event attendees, using surveys and surveys cost money. Even if you plan to train and use volunteers to collect the information, you may incur costs for some or all of the following: printing (forms/questionnaires), hand-held computer rental or purchase, long distance telephone charges for telephone call-backs, data processing, tabulation and/or analysis.
You may also require the services of professional research and tabulation experts for some of the more complex components of the survey tasks (e.g., sampling, weighting, data management and projection).
b) Human resources
Someone has to be “in charge” to make sure that all the elements required to conduct a successful survey at an event are in place. The process requires project management and the commitment of sufficient human resources to ensure a positive outcome.
The counting, tallying and telephone callback procedures recommended in these guidelines also require trained interviewers. These may be volunteers from the community who are trained to conduct the surveys or professionally trained interviewers supplied by survey research companies.
c) A tourism economic impact model
A tourism economic impact model is an econometric tool that utilizes the structure of a region’s economy, generally based on national statistical organizations’ data (such as input/output tables) and provides estimates of the impact tourists’ spending has on overall economic activity, jobs and taxes.
The guidelines provided here will help you produce appropriate inputs for tourism economic impact models but you need to ensure that a national, provincial/state or regional economic

Guidelines: Survey Procedures for Tourism Economic Impact Assessments of Gated Events and Festivals
16
development office or other organization has a model available for you to use. For example, you could contact any of the partners of this project for information on the availability of a model for your geographic area:
Canada Alberta Tourism, Parks, Recreation and Culture
Canadian Tourism Commission
Federal-Provincial-Territorial Culture/Heritage and Tourism Initiative
Government of the Northwest Territories – Department of Resources, Wildlife, & Economic Development
Government of Yukon – Department of Tourism and Culture
Nova Scotia Department of Tourism, Culture and Heritage
Ontario Ministry of Tourism
Tourism British Columbia
Tourism Prince Edward Island
USA Texas A&M University
d) A medium-term research plan (for repeat events)
To determine what you want to learn about your attendees and how often you can afford to conduct a survey, you may want to develop a medium-term (five-year) research plan. Depending on your budget and human resource limitations, you may decide to conduct a full-blown survey occasionally and more limited surveys in the intervening years.
e) The impact area
At what level of geography do you plan to estimate the tourism economic impact of your event (i.e., national, regional, or local)? You will ask different questions and include/exclude different spending, depending on the level of geography you select as the basis of your tourism economic impact estimates. Your impact area might be a county or similar administrative geographical area, a group of counties, a tourism region, a city, a province or state, etc. We recommend that you use geographic boundaries that correspond to standard economic and/or census areas because economic impact models are generally designed to reflect the economic structure of particular census areas.
When selecting the level of geography, make sure a tourism economic impact model is available at the same level. For example, if you plan to look at your event’s impact on the municipal economy, you will need a tourism economic impact model that reflects the structure of the municipal economy. If no such model exists, consult with your local economic development office or tourism authority to identify the implications of using a model reflecting a different level

Guidelines: Survey Procedures for Tourism Economic Impact Assessments of Gated Events and Festivals
17
of geography than the one you have selected.
f) Local partners
Perhaps your event can’t “go it alone”, but if you worked with other events in your area and/or the local destination marketing organization, you could build a partnership to spread the financial and human resource costs.
g) Enough tourists
If your event is unlikely to attract at least ten percent (10%) of its attendees from outside the local area, you should probably not undertake a tourism economic impact assessment. Unless your event is very large, such a small proportion of tourists (less than 10%) will likely have a minimal economic impact on your community. Furthermore, finding enough of these tourists to produce credible estimates from a survey would likely require more effort than many events can manage.
h) A reality check
Not every event will have budget, human resources, and/or access to a suitable tourism economic impact model. Be prepared to conclude that your event cannot support the effort required to generate inputs for assessing tourism economic impacts that meet minimum standards. If your event falls into this category, you may select other measures to describe the benefits your event brings to a community and to generate support for the event. For example, you might conduct an On-Site Spending Survey [see other Guidelines, under separate cover].

Guidelines: Survey Procedures for Tourism Economic Impact Assessments of Gated Events and Festivals
18
II. DESIGNING A TOURISM ECONOMIC IMPACT STUDY
C. Important concepts
1. Event type
If the event takes place in a confined area with “gates” or other “controlled” points of entry/exit, follow the guidelines for a Gated Event.
If the event takes place in whole or in part in an open area where access is not controlled, follow the guidelines for an Ungated or Open Access Event.
While many of the steps in the Guidelines are the same for Gated and Ungated events, there are some fundamental differences in sampling and projection procedures that must be taken into account, depending on the event type.
Sampling procedures refer to the methods you will use to identify the subset of attendees and/or tourists that will be interviewed at your event. Projection procedures refer to how you will use the information collected from the subset (sample) of attendees included in the research process to estimate the characteristics of all attendees and/or all tourists who came to your event.
2. How many locals and how many tourists came to the event?
You will need to know how many locals and how many tourists came to your event. Local residents may represent the majority of event attendees, but their spending should be excluded from tourism economic impact assessments.
An on-site tally is the recommended method of identifying how many attendees are tourists and how many are local residents. By intercepting a random sample of event attendees as they enter the site and asking them a few questions, you will be able to determine the proportion of tourists (in total and by various origin markets) and the proportion of local residents. The on-site tally process can also include additional questions that will aid in developing appropriate inputs for a tourism economic impact assessment.

Guidelines: Survey Procedures for Tourism Economic Impact Assessments of Gated Events and Festivals
19
3. What is a tourist?
The manner in which the World Tourism Organization’s guidelines for the tourism component of travel is operationalized for measurement purposes varies from country to country. Event organizers should check with the appropriate authorities to determine the operational definition in use in their particular jurisdiction. The operational approach adopted by Canada for identifying tourists is provided here.
An overnight domestic tourist is one who claims to have taken an out-of-town trip of at least one night away from home for any purpose apart from commuting to work or school, moving to a new residence, routine trips (shopping, medical, religious observance, pick-ups/deliveries, service/sales calls or other routine work-related trips). The trip must be completed within 365 days.*
A same-day domestic tourist is defined in a manner similar to the overnight tourist but the out-of-town trip must take the traveller at least 40 kilometres (25 miles) one-way from home and be completed within less than 24 hours.*
A same-day or overnight international tourist is one who crosses an international boundary (e.g., from Canada to the USA) on a trip for any purpose, excluding commuting to work or school, on military or diplomatic or as a member of a crew.** The trip must be completed within 365 days.
*Different distance criteria are used in different countries. **Some other minor exclusions apply.
4. Who is your tourist?
Identifying the Impact Area or setting geographical boundaries for who is or is not a tourist from a measurement perspective requires that you have a clear understanding of the geographical area in which you want to assess the incremental economic impacts generated by tourists.
For example, if you want to estimate the tourism impact on a particular community within the province or state, you would consider residents of the province/state who live outside the particular community in which the event is held to be tourists. Only residents of the particular community who attended the event would be “local”.
Within tourism economic models, special adjustments may be made to estimate indirect and induced spending by locals. As noted elsewhere in these guidelines, the focus here is on direct spending impacts.

Guidelines: Survey Procedures for Tourism Economic Impact Assessments of Gated Events and Festivals
20
5. Substitution effects
Would attendees have spent the “same” money elsewhere in the community if your event had not taken place? Remember, a tourism economic impact assessment measures the impact of incremental spending associated with an event. This is spending that would not have taken place if your event had not been held. For example, if Dave and Diane decided to go to the event instead of going to a movie at the theatre and the ticket prices for your event and the movie were the same, your event would have produced no incremental spending. Why not? Because Dave and Diane would have spent the same amount of money in your community on a recreational activity – whether your event took place or not (substitution effects) 5.
Whether the expenditure at the event by Dave and Diane just “substituted for” an equivalent expenditure they would have made elsewhere in the community is central to what tourism economic impact estimates are designed to provide: incremental impacts of an event on the economy. A survey is required to find out what Dave and Diane would have done if your event had not occurred.
6. The importance of your event in the tourist’s destination choice (“Casuals”)
Once you know how many tourists came to your event, you have to identify how important your event was in their decision to visit the destination (area of geography you selected – community, region, province/state, country) or whether your event caused them to extend their stay. If they would have come to your community whether or not your event took place, their spending is treated differently than if they came because your event was being held.
7. “Time switchers”
Did your tourist replace a future trip with one that coincides with your event? If a tourist was planning to come to your community at a later time but changed his or her travel plans because of your event, only a portion of the tourist’s spending in the community would be incremental because some portion of this tourist’s spending would have taken place in the community at a later date.
The time span used to estimate “replacement trips” varies from study to study. Some experts suggest using a three-month period whereas others rely on a twelve-month period. These guidelines adopt the three-month limit but event organizers will determine, in consultation with partners and funders, what time span for “time switchers” is most appropriate for their analysis purposes, event and community.
5 Recall we are assuming that any difference in the indirect or induced impacts are likely small and can be safely ignored.
Guidelines: Survey Procedures for Tourism Economic Impact Assessments of Gated Events and Festivals
21
D. Four components to a tourism economic impact study
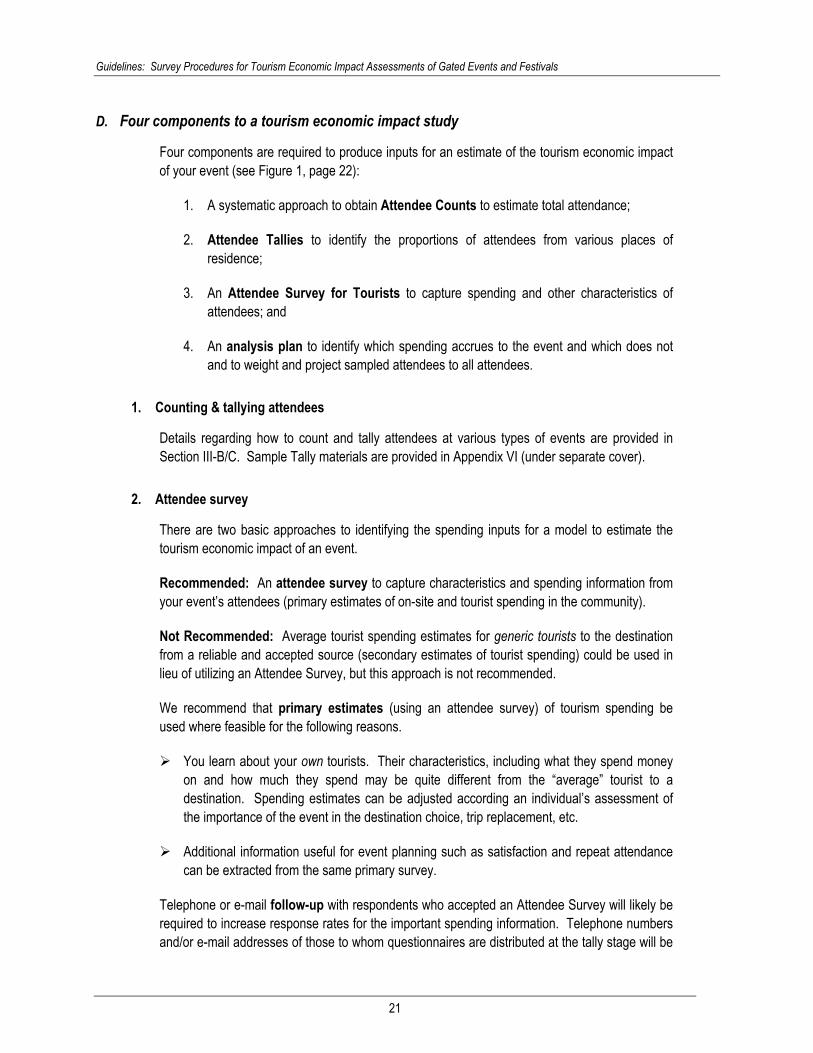
Four components are required to produce inputs for an estimate of the tourism economic impact of your event (see Figure 1, page 22):
1. A systematic approach to obtain Attendee Counts to estimate total attendance;
2. Attendee Tallies to identify the proportions of attendees from various places of residence;
3. An Attendee Survey for Tourists to capture spending and other characteristics of attendees; and
4. An analysis plan to identify which spending accrues to the event and which does not and to weight and project sampled attendees to all attendees.
1. Counting & tallying attendees
Details regarding how to count and tally attendees at various types of events are provided in Section III-B/C. Sample Tally materials are provided in Appendix VI (under separate cover).
2. Attendee survey
There are two basic approaches to identifying the spending inputs for a model to estimate the tourism economic impact of an event.
Recommended: An attendee survey to capture characteristics and spending information from your event’s attendees (primary estimates of on-site and tourist spending in the community).
Not Recommended: Average tourist spending estimates for generic tourists to the destination from a reliable and accepted source (secondary estimates of tourist spending) could be used in lieu of utilizing an Attendee Survey, but this approach is not recommended.
We recommend that primary estimates (using an attendee survey) of tourism spending be used where feasible for the following reasons.
You learn about your own tourists. Their characteristics, including what they spend money on and how much they spend may be quite different from the “average” tourist to a destination. Spending estimates can be adjusted according an individual’s assessment of the importance of the event in the destination choice, trip replacement, etc.
Additional information useful for event planning such as satisfaction and repeat attendance can be extracted from the same primary survey.
Telephone or e-mail follow-up with respondents who accepted an Attendee Survey will likely be required to increase response rates for the important spending information. Telephone numbers and/or e-mail addresses of those to whom questionnaires are distributed at the tally stage will be
Guidelines: Survey Procedures for Tourism Economic Impact Assessments of Gated Events and Festivals
22
collected. The follow-up contact could take the form of a simple reminder. If, however, the respondent no longer has a copy of the questionnaire, the follow-up process could involve administering the interview over the telephone or via a Web-based survey or mailing out another copy of the questionnaire.
Details about how to conduct an Attendee Survey are provided in Section III. Sample attendee questionnaires are provided in Appendix VII (under separate cover).
ATTENDEE COUNTS
Interviewers at Entry Gates to Count People
Entering (at pre-determined times)
Interviewers to Obtain Basic Characteristics of People Entering (at pre-
determined times)
Figure 1 PARALLEL SURVEY PROCESS COMPONENTS TO GENERATE INPUTS
FOR TOURISM ECONOMIC IMPACT ESTIMATES
Turnstile counts “Clickers”
Ticket stubs
Tally Questions & Map Tally Form
(Paper or hand held Computer)
Postage Paid Envelopes &
Drop off Boxes on Site For Returns
Follow-Up With Non-
Responders (telephone
and/or e-mail)
ATTENDEE SURVEY FOR TOURISTS
System To “Count” The Counts
Printed Self-completion Questionnaire & Map
ANALYSIS PLAN Weighting & Projection Plan To Estimate Total
Attendees by Place of Residence
Coding, Data Entry, Data “Cleaning” and Editing Capabilities
Weighting & Projection Plan To Generate Inputs for Tourism Economic Impact Model
(By Category)
Tourism Economic Impact Model
ATTENDEE TALLIES
System To Tabulate Tally Data
Systematic Sampling Plan Systematic Sampling Plan
ANALYSIS PLAN

Guidelines: Survey Procedures for Tourism Economic Impact Assessments of Gated Events and Festivals
23
3. Analysis plan
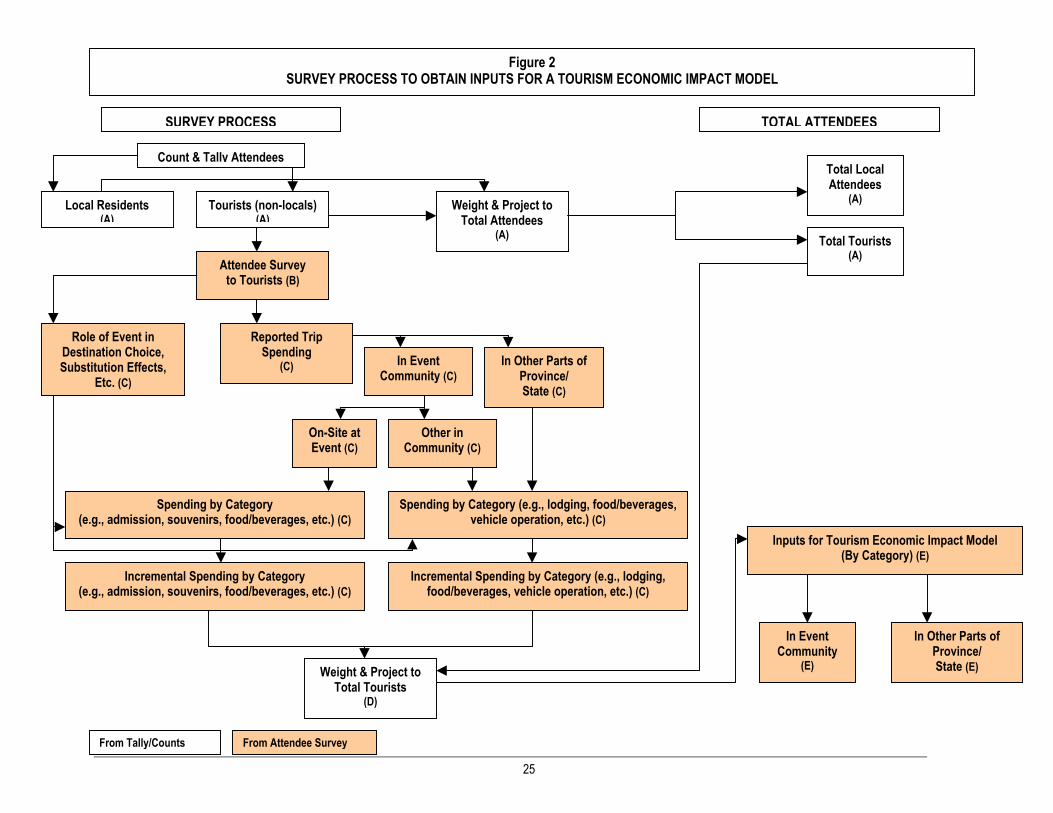
The analysis and tabulation plan provides guidance for determining how to adjust spending estimates to reflect the incremental spending generated by your event, and how to weight and project this estimate to all tourists who visited your event. Details about how to construct an Analysis Plan are provided in Section VII. A schematic diagram is provided in Figure 2 (page 25). The various steps in the analysis process shown in Figure 2 are described below (refer to letter labels, e.g., “A”, “B” for groups of tasks required in the analysis plan).
Estimates and tasks listed under “Count & Tally Attendees” form a critical part of your analysis plan (“A”). They permit you to identify the total number of attendees (“Total Attendees”) at your event and the number who are tourists versus local residents (using proportions from the Counts & Tallies).
Once you have used data from counts and tallies to estimate “total tourists”, you would focus on information you captured from the “Attendee Survey” (“B”). Two key elements from the attendee survey among tourists will enable you to identify the amounts of reported tourist spending that will accrue to your event:
1. Role of event in destination choice, substitution effects, etc. – this information is used to determine how much spending on-site and in other parts of the community is a result of your event (incremental) and how much would have been spent whether your event took place or not (“C”).
2. Where tourists report having spent money – this information permits you to assign spending to the appropriate level of geography (in the event community; elsewhere in the province or state, etc.) (“C”).
Using information that tourists provided in their completed Attendee Surveys (#1 and #2 above), you would isolate the incremental spending for each category of expense. These spending estimates are based on the sample of tourists who completed the Attendee Survey. They now must be projected to “Total Tourists”, using the estimate you obtained from the count and tally processes (“D”)
After you have weighted and projected tourist spending that took place because of your event (incremental) from surveys to all tourists, you are ready to input spending estimates, category-by-category, into the tourism economic impact model you are using (“E”).

Guidelines: Survey Procedures for Tourism Economic Impact Assessments of Gated Events and Festivals
24
4. Documenting the study process
The manner in which the study is conducted will influence the quality of its results. In order to help you and others who may be presented with your findings understand how robust and reliable the information is, documentation of what you did to generate the findings is required. This information is commonly compiled in a Technical Appendix, either as a chapter in your report or as a stand-alone document.
This technical documentation not only provides guidance for interpreting the study findings but also provides a handy reference tool for organizations that may wish to undertake the same type of study “next year” or in subsequent years. The Technical Appendix should provide sufficient information on how the study was conducted that the organization can follow it in the future, thereby, obtaining comparable year-to-year results.
Chapter VIII of these Guidelines provides information on this important documentation tool.
Guidelines: Survey Procedures for Tourism Economic Impact Assessments of Gated Events and Festivals
25
Figure 2 SURVEY PROCESS TO OBTAIN INPUTS FOR A TOURISM ECONOMIC IMPACT MODEL
Count & Tally Attendees
Local Residents (A)
Tourists (non-locals) (A)
Attendee Survey to Tourists (B)
SURVEY PROCESS
Role of Event in Destination Choice, Substitution Effects,
Etc. (C)
Reported Trip Spending
(C)
TOTAL ATTENDEES
Weight & Project to Total Attendees
(A)
Total Local Attendees
(A)
Total Tourists (A)
In Event Community (C)
On-Site at Event (C)
Other in Community (C)
In Other Parts of Province/ State (C)
Spending by Category (e.g., admission, souvenirs, food/beverages, etc.) (C)
Spending by Category (e.g., lodging, food/beverages,vehicle operation, etc.) (C)
Incremental Spending by Category (e.g., admission, souvenirs, food/beverages, etc.) (C)
Incremental Spending by Category (e.g., lodging, food/beverages, vehicle operation, etc.) (C)
Weight & Project to Total Tourists
(D)
Inputs for Tourism Economic Impact Model (By Category) (E)
In Event Community
(E)
In Other Parts of Province/ State (E)
From Tally/Counts From Attendee Survey

E. Other types of studies
1. On-site spending study
Instead of undertaking a study that will produce estimates of the tourism economic impact of your event, you can conduct an On-Site Spending Study. Such a study would provide information about the characteristics of your attendees and how much money they spent at your event.
This type of study is NOT suitable for generating estimates of the tourism economic impact of your event in a community, province or state because it includes spending by local residents and non-residents that may or may not be new spending in your community.
See Guidelines: Survey Procedures for Assessment of On-Site Spending at Gated Events and Festivals or Guidelines: Survey Procedures for Assessment of On-Site Spending at Ungated or Open Access Events and Festivals for a description of the steps involved in an on-site spending study.
2. Non-market value studies
An overview of methods to measure the non-market value of an event or festival is provided in a separate document: Review of Non-market Value Estimation for Festivals and Events. This document introduces approaches to estimating the social and community benefits that may be generated by an event or festival. As noted in the Review, event organizers are advised to seek professional guidance if they wish to implement this type of benefit analysis because of the relative complexity of the concepts and tasks involved.
Guidelines: Survey Procedures for Tourism Economic Impact Assessments of Gated Events and Festivals
27
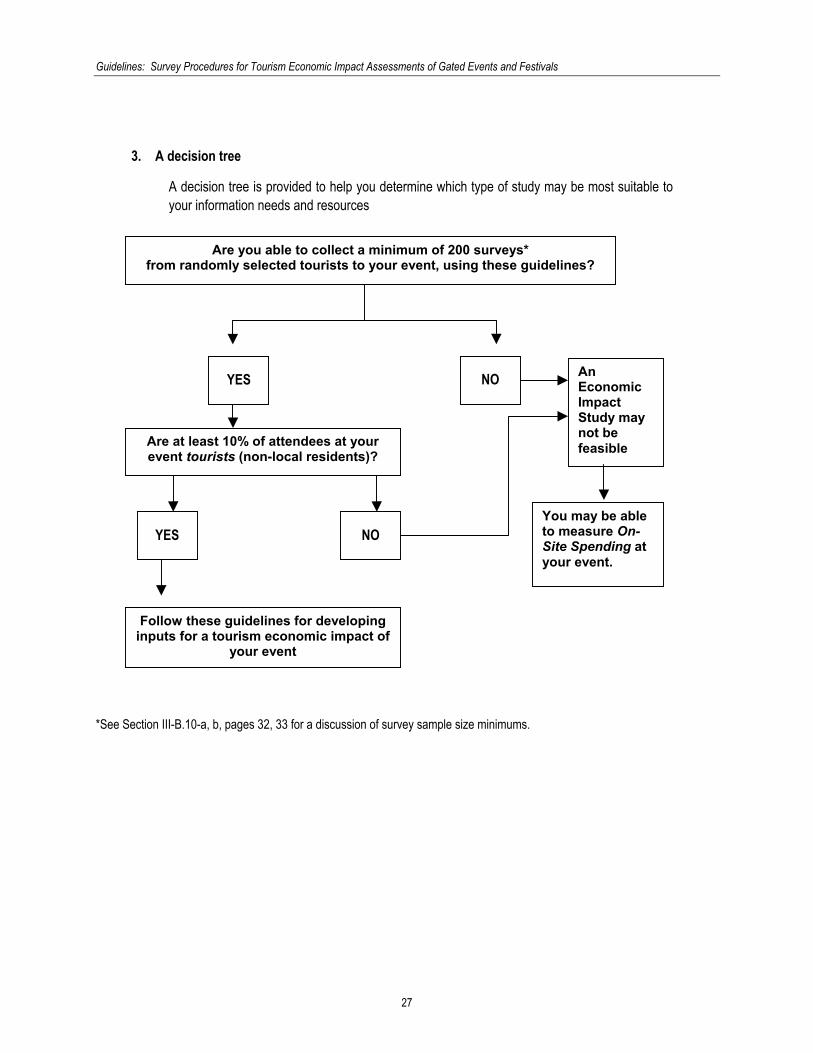
3. A decision tree
A decision tree is provided to help you determine which type of study may be most suitable to your information needs and resources
*See Section III-B.10-a, b, pages 32, 33 for a discussion of survey sample size minimums.
Are you able to collect a minimum of 200 surveys* from randomly selected tourists to your event, using these guidelines?
YES NO An Economic Impact Study may not be feasible Are at least 10% of attendees at your
event tourists (non-local residents)?
YES NO You may be able to measure On-Site Spending at your event.
Follow these guidelines for developing inputs for a tourism economic impact of
your event

Guidelines: Survey Procedures for Tourism Economic Impact Assessments of Gated Events and Festivals
28
III. THE ATTENDEE SURVEY PROCESS
A. An overview of the process
1. Essential measurement tasks
Even if you know how many attendees came to your event, you require a process to estimate with accuracy how many of these attendees are local residents and how many are tourists. You also need a way to determine how the “sample” of attendees from whom you collect detailed information can be used to represent all attendees at your event.
Consequently, you need to conduct an Attendee Count and a Tally that rely on accepted research practices. Without these components, you will not be able to estimate the economic impact of your event accurately.
You also need to conduct an Attendee Survey among a random sample of tourists and locals who attended the event. This survey will capture information on how much money was spent at the event, in your community, and/or in your province/state. Responses to the Attendee Survey will be weighted and projected to all people who attended the event by place of residence. Only incremental spending associated with the event as reported in the Attendee Survey will be used to estimate the economic impact of your event. Sample Attendee questionnaires are provided in Appendix VII (under separate cover).
Telephone or e-mail follow-up with respondents who accepted an Attendee Survey will likely be required to increase response rates for the important spending information. Telephone numbers of those to whom questionnaires are distributed at the tally stage will be collected. The follow-up contact could take the form of a simple reminder. If, however, the respondent no longer has a copy of the questionnaire, the follow-up process could involve administering the interview over the telephone or via a Web-based survey or mailing out another copy of the questionnaire.
2. A picture of the process
Refer to Figure 1, page 22.

Guidelines: Survey Procedures for Tourism Economic Impact Assessments of Gated Events and Festivals
29
B. Counting & tallying attendees at a gated event: key concepts & issues
1. Elements required for attendee counts and on-site tally
Sampling Plan & Tally Targets Weighting and Projection Plan Tally Questionnaire Instructions for Tally Interviewers
2. Important definitions for tallies and counts
Stint: Unique observation and/or measurement time period at a specific entry point to your event. The stint will form the basis for sampling attendees who come to your event (e.g., 9:00 am to 11:00 am). Stint Sample: A randomly selected set of stints during which you will count and/or tally attendees at your event. Interviewer Stint: A unique observation and/or measurement time period at a specific entry point to your event to which one interviewer is assigned to collect information (tally and/or count attendees at your event). Tally Interview: Short interview to obtain basic information about which attendees are locals, tourists, etc. Counts: All attendees entering during tally stint. You will project the people you tallied during the stint to the total count during the same stint. Stint Weight: Adjustment to sampled stints so that they represent all people who entered your event. Final Ticket Adjustment Weight: Adjustment to match the total number of ticketed attendees who came to the event to the number represented by your sample.
3. Sampling: How the “part” can represent the “whole”
The basic concept behind sampling is that a portion of your attendees can “represent” themselves and other people. Survey researchers rely on samples because they require less time and money than including everyone in the survey process. If everyone were included, you would be conducting a “census”.
The characteristics of the attendees you interview in a sample are projected to other people like themselves in the total population by calculating a factor (weight) that brings your sample up to the total attendee population. This projection process works as long as your sample is truly representative of the total attendee population for key characteristics.

Guidelines: Survey Procedures for Tourism Economic Impact Assessments of Gated Events and Festivals
30
Samples are efficient tools in the research process as long as you are careful about how you develop and implement the sampling plan. In order for the people you interview to represent other people that you do not interview, you must ensure that those you do interview are selected randomly and with a known probability of selection. [For more information, on sampling principles and concepts, see Trochim = http://www.socialresearchmethods.net/kb/sampling.htm]
4. A “stint” is the sampling unit for counts & tallies
To count and tally attendees as they enter your event, you need a sampling plan based on the particular characteristics of your site and event. The sampling unit for this part of the study is called a “stint”. Its purpose is to designate time periods for systematic observation and/or measurement. A stint corresponds to a pre-set time period (e.g., 9:00 am to 11:00 am) on a particular day of the event (e.g., Day 1) at a particular entry point (e.g., Gate 1) or other location on the site for data collection.
5. Attendee counts
Because different types of attendees may come to the event at different times of day, on different days of a multi-day event, and/or through different gates, you need a way of sorting out how many different types of attendees came when.
Even if you know how many people in total came to your event because you sold tickets, you will not be talking to all these attendees to find out their particular characteristics (origin, spending, etc.). For this reason, you need to “sample” the various times/gates and days a visitor could arrive and count the attendees who enter at these sampled times/gates and days.
You can assign a person to each “gate” or entrance on your site to “count” entrants, you can rely on turnstiles that have built-in counters, or drop a ticket into a box for every person who enters the event (even if you do not sell tickets to the event).
No matter which approach you take to counting people who enter your event, you need to make sure you can separate people who entered at different times/locations (stints) because you will need this information in order to adjust the people you tallied to the total entrants on a stint-by-stint basis.
6. Attendee tallies (the tally interview)
You probably can’t talk to all the people who come to your event about their place of residence, their household party size, and how much they spent at your event and in your community. At the same time, you need a way to estimate this type of information for all your attendees.
As with the attendee counts, you need to “sample” the various times/gates and days a visitor could arrive and conduct a brief Tally Interview with a sample of household parties who enter at these sampled times/gates and days. [A “household party” is the group of people who enter the

Guidelines: Survey Procedures for Tourism Economic Impact Assessments of Gated Events and Festivals
31
event at the same time and live in the same permanent residence.]
The tally will provide critical information on where your attendees live and provide a tool for excluding from your estimates groups you do not want in your analysis. These groups include merchants, media, staff, volunteers, participants, etc.
7. Recruitment for the attendee survey
We recommend that you “recruit” respondents for the Attendee Survey as part of the Tally Interview process. Because tourists are likely to be relatively scarce, particularly when compared to local residents, you might recruit every nth local resident to complete the survey (e.g., every 10th) but would ask every out-of-town attendee you tally to complete the survey.
You can conduct the Attendee Survey personally on-site, use a self-completion questionnaire for drop-off on site or to be mailed back, or call/e-mail the attendee at home once the trip is over (for tourists).
8. Different events require different approaches to stint samples
a) Event characteristics
The complexity and duration of your event, your resources, and what you are attempting to measure will influence the following:
how many interviewers you need; where they will be assigned to work; and the number of hours they must devote to counting, tallying and Attendee Survey
recruitment.
For example, different sampling plans will be required for different types of events: A single day event and everyone enters at the same time (e.g., a performance with a set
start time);
A multi-day event in which all attendees come for the full duration of the event, starting on Day 1; A multi-day event in which different attendees may arrive at any time over the course of the
event (Day 1, Day 2, etc.).
Different plans will also be required depending on how many points of entry the site has (gates) and whether you have reason to expect that different types of attendees will enter through different gates.
For example, if one gate is near a bus stop but far from the parking lot and another gate is near the parking lot but far from a bus stop, different types of attendees may enter at each gate. Those who rely on public transport may differ in a variety of ways from those who drive a private vehicle and you need to make sure you have included both groups in your counts and visitor tallies in their correct proportions.

Guidelines: Survey Procedures for Tourism Economic Impact Assessments of Gated Events and Festivals
32
b) What you are trying to measure
The numbers of tally/recruitment interviewers you require will also depend on what information you are attempting to measure. If you are interested in capturing information to allow you to generate inputs for a tourism economic impact model, you will likely need more interviewers than if you are interested only in the amount of money that was spent on-site by all attendees (locals and tourists).
Why? Because tourists are likely to represent a much smaller proportion of your total attendance and will, therefore, be harder to find, than locals. Tourists are the proverbial needles in the haystack. And you have to find a sizeable number of needles (tourists) for your economic impact estimates to be reliable.
9. Tools for “counting” attendees
If you have a tool for counting attendees, you would not need to have interviewers doing a physical count at assigned stints. Possible tools for counting include turnstiles through which every entrant must pass and that keep running totals that can be tracked on a stint-by-stint basis; or ticket stubs (counted for each time period/ location that corresponds to possible stints).
We recommend that you issue tickets (even if you don’t charge for them) so you can count ticket stubs for each stint or install turnstiles and keep stint-by-stint records of turnstile counts. By using one of these tools, you can obtain an accurate real time count of attendees during each stint. These counts can be compiled after the event is over. Using such tools will save on the number of interviewers/staff required to undertake the research plan.
10. How to estimate staff requirements for counting/ tallying
a) Recommended attendee survey sample sizes
You need to work backwards from the total number of completed Attendee Surveys you want to achieve to determine how many staff you will require for counting and tallying attendees.
Recommended sample sizes differ, depending on the level of analysis you want to conduct and the quality of the final estimates you are willing to accept. Of course, bigger is better when it comes to sample sizes, as long as you follow a sampling plan to ensure that your respondents are selected randomly and systematically to represent all the people in the group you have elected to study (your universe).
To generate inputs for a tourism economic impact assessment, we recommend that you obtain spending information from a minimum of 200 attendee parties in each of the attendee groups you plan to study. Of course, you can conduct more Attendee Surveys than 200. The more completions you achieve, the more reliable your final estimates will be.

Guidelines: Survey Procedures for Tourism Economic Impact Assessments of Gated Events and Festivals
33
At 200 completions, responses to a “yes/no” question could be considered accurate + 7%, 19 times out of 20.
What does 19 times out of 20 mean? Here is an example: Suppose you are trying to estimate the percentage of attendees that visited your community because of your event. You can’t ask all attendees so you will estimate the percentage by asking a random sample of attendees and use the percentage of your sample that said yes as your “best guess” of the true percentage. If you take a sample of 200 attendees there is a 95% probability (19 out of 20) that the percentage of your sample that said yes is within 7% of the true percentage of all attendees who visited your community because of your event. See Appendix II for a table that displays the margin of error for various response levels and sample sizes.
b) 200 completions are the recommended minimum for tourists
To produce inputs for an economic impact estimate, you should obtain at least 200 completed interviews with non-local attendees, or tourists. You can treat all non-local attendees as a “group”, conducting 200 interviews with them or you can divide your tourists into “segments” and attempt to reach the 200 minimum for each segment. A “segment” is a group of people who share one or more common characteristics. Examples of tourist “segments” include those who are out-of-town visitors but live in the same province or state as your event versus those who live outside your province or state.
c) Tourist segments
Tourist segments become important if you wish to report incremental spending and economic impact for groups of tourists such as those who live outside your province/state or country versus tourists (non-locals) who live outside the community but in your own province/state.
d) Target number of tally interviews to complete
Determining how many completed tally interviews you require will depend on how many completed Attendee Surveys you hope to obtain, assuming you will be recruiting household parties to complete the Attendee Survey as part of the tally process. Here are some key questions you need to ask to determine how many tally interviews you should attempt to complete.
What proportion of your total attendees is likely to live outside the local area? Unless you have conducted visitor studies at the same event in the past and have information on the proportion of attendees from different origins who come, you will have to “guestimate” the proportion you expect to be from outside the local area.
What if you expect few non-local attendees to attend your event? Each event will have to determine how much effort it wants to devote to obtaining results from tourists, recognizing that to estimate the economic impact of tourists, you require a minimum of 200 completed Attendee Surveys with tourists.
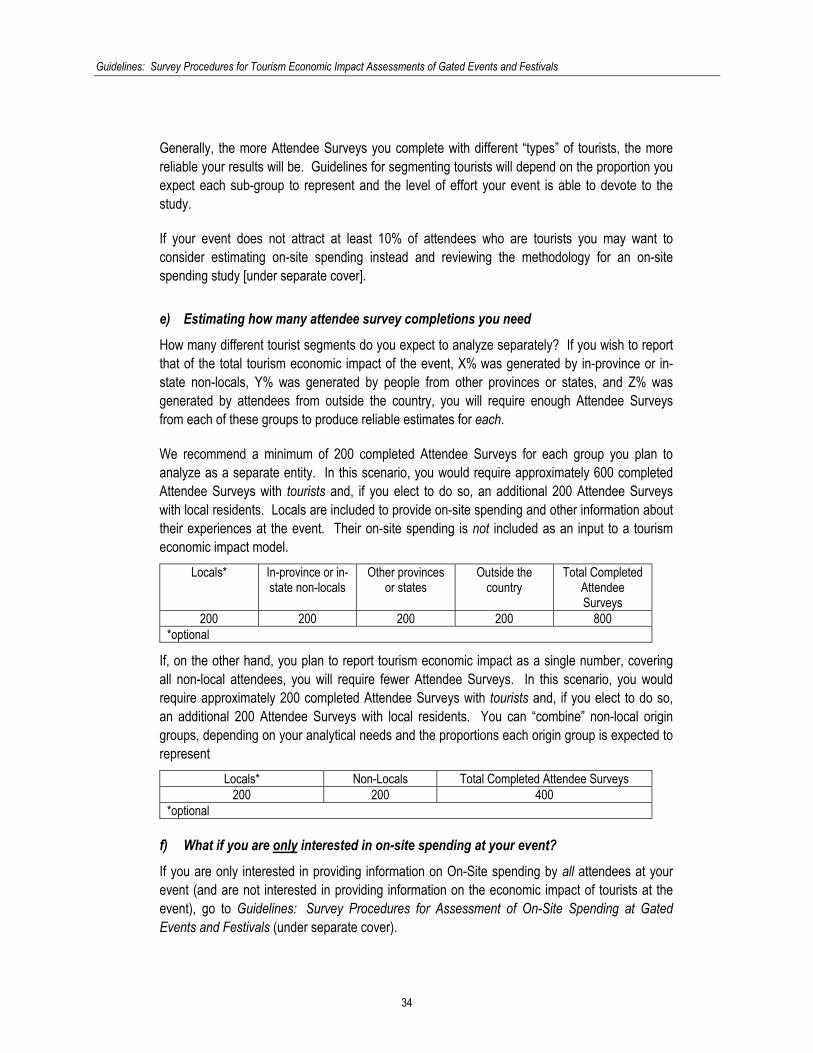
Guidelines: Survey Procedures for Tourism Economic Impact Assessments of Gated Events and Festivals
34
Generally, the more Attendee Surveys you complete with different “types” of tourists, the more reliable your results will be. Guidelines for segmenting tourists will depend on the proportion you expect each sub-group to represent and the level of effort your event is able to devote to the study.
If your event does not attract at least 10% of attendees who are tourists you may want to consider estimating on-site spending instead and reviewing the methodology for an on-site spending study [under separate cover].
e) Estimating how many attendee survey completions you need
How many different tourist segments do you expect to analyze separately? If you wish to report that of the total tourism economic impact of the event, X% was generated by in-province or in-state non-locals, Y% was generated by people from other provinces or states, and Z% was generated by attendees from outside the country, you will require enough Attendee Surveys from each of these groups to produce reliable estimates for each.
We recommend a minimum of 200 completed Attendee Surveys for each group you plan to analyze as a separate entity. In this scenario, you would require approximately 600 completed Attendee Surveys with tourists and, if you elect to do so, an additional 200 Attendee Surveys with local residents. Locals are included to provide on-site spending and other information about their experiences at the event. Their on-site spending is not included as an input to a tourism economic impact model.
Locals* In-province or in-
state non-locals Other provinces
or states Outside the
country Total Completed
Attendee Surveys
200 200 200 200 800 *optional
If, on the other hand, you plan to report tourism economic impact as a single number, covering all non-local attendees, you will require fewer Attendee Surveys. In this scenario, you would require approximately 200 completed Attendee Surveys with tourists and, if you elect to do so, an additional 200 Attendee Surveys with local residents. You can “combine” non-local origin groups, depending on your analytical needs and the proportions each origin group is expected to represent
Locals* Non-Locals Total Completed Attendee Surveys 200 200 400
*optional f) What if you are only interested in on-site spending at your event?
If you are only interested in providing information on On-Site spending by all attendees at your event (and are not interested in providing information on the economic impact of tourists at the event), go to Guidelines: Survey Procedures for Assessment of On-Site Spending at Gated Events and Festivals (under separate cover).

Guidelines: Survey Procedures for Tourism Economic Impact Assessments of Gated Events and Festivals
35
g) What if you do not know how many people will likely attend your event?
If you cannot guestimate total attendance at your event and/or what proportion of your attendees are likely to be tourists, how can you reach the recommended minimum number of completed Attendee Surveys?
Since the stint is the sampling unit, you would assign sufficient stints to tally and recruit attendees, assuming a constant flow of entrants through the gates. Depending on the draw of the event and its attractiveness to tourists, you may or may not meet the minimum completions recommended for analysis.
In effect, you will only know how many attendee segments you can analyze once the tally process has been completed. At that time, you will review the number of completions you obtained with various segments (locals, in-province/state non-locals, other domestic tourists and foreign tourists) and determine which segments meet the 200 minimum completions to support analysis.
h) There are no guarantees
There are no guarantees that you will achieve the minimum sample size of 200 completions with each group you wish to analyze separately. Instead, once you review the final number of completions you achieve, you may elect to combine some market segments in order to meet the 200 minimum for analysis purposes. You may find that your study did not produce sufficient information from tourists to conduct a tourism economic impact analysis at the recommended minimum.
Why might you experience a shortfall in the number of tourists in your study? Factors that might produce a shortfall include the following:
you might have over-estimated how many tourists would come to your event;
you may have assigned too few stints to capture enough tourists;
even if you have had previous experience to suggest that your event would attract sufficient tourists to meet your minimum objectives, a shift in gasoline prices, a terrorist alert, poor weather conditions or other factors could suddenly alter the number of people travelling at the time of your event.
You can use information from samples smaller than 200 but the level of precision of your estimate will decrease as your sample size decreases. And of course, the converse is also true: the more completions you obtain, the higher the level of precision your estimates will have. See Appendix II for a table that displays the margin of error for various response levels and sample sizes.
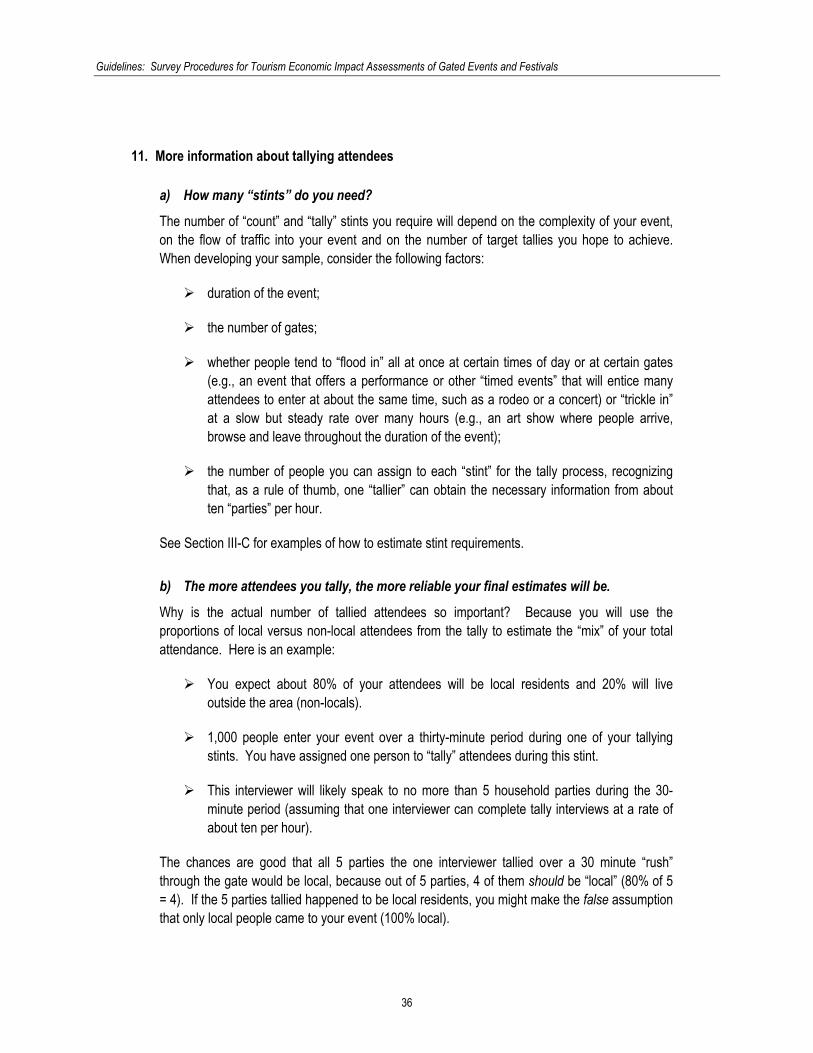
Guidelines: Survey Procedures for Tourism Economic Impact Assessments of Gated Events and Festivals
36
11. More information about tallying attendees
a) How many “stints” do you need?
The number of “count” and “tally” stints you require will depend on the complexity of your event, on the flow of traffic into your event and on the number of target tallies you hope to achieve. When developing your sample, consider the following factors:
duration of the event;
the number of gates;
whether people tend to “flood in” all at once at certain times of day or at certain gates (e.g., an event that offers a performance or other “timed events” that will entice many attendees to enter at about the same time, such as a rodeo or a concert) or “trickle in” at a slow but steady rate over many hours (e.g., an art show where people arrive, browse and leave throughout the duration of the event);
the number of people you can assign to each “stint” for the tally process, recognizing that, as a rule of thumb, one “tallier” can obtain the necessary information from about ten “parties” per hour.
See Section III-C for examples of how to estimate stint requirements.
b) The more attendees you tally, the more reliable your final estimates will be.
Why is the actual number of tallied attendees so important? Because you will use the proportions of local versus non-local attendees from the tally to estimate the “mix” of your total attendance. Here is an example:
You expect about 80% of your attendees will be local residents and 20% will live outside the area (non-locals).
1,000 people enter your event over a thirty-minute period during one of your tallying stints. You have assigned one person to “tally” attendees during this stint.
This interviewer will likely speak to no more than 5 household parties during the 30-minute period (assuming that one interviewer can complete tally interviews at a rate of about ten per hour).
The chances are good that all 5 parties the one interviewer tallied over a 30 minute “rush” through the gate would be local, because out of 5 parties, 4 of them should be “local” (80% of 5 = 4). If the 5 parties tallied happened to be local residents, you might make the false assumption that only local people came to your event (100% local).
Guidelines: Survey Procedures for Tourism Economic Impact Assessments of Gated Events and Festivals
37
What if you had interviewed 20 parties? Out of these 20 parties, assuming that 80% really are local, you should find 4 parties that are not local. And if you had a crew of ten talliers over the 30-minute rush, you would have tallied 50 parties, hopefully finding more of the 10 non-local parties.
Because the more attendees you tally, the better chance you have of finding “low incidence” groups such as non-local attendees, you need to assign interviewers to stints strategically to maximize the number of attendees you tally.
c) What is strategic staffing for tallies?
Strategic staffing takes into account expected flow, assigning more staff to high volume stints and less staff to low volume stints. Thus, you might assign three or four interviewers to a stint with expected high volumes but only one or two interviewers to a stint with expected low volumes. Strategic staffing for tallies can be used to increase the “yield” or number of completed tallies but it is not as systematic as using a stratified stint sampling plan.
Even though sampling, weighting and projection procedures are somewhat more complex for stratified random sampling, it is recommended over strategic staffing combined with a simple random sample approach (see Section III-C for more details about sampling methods).
d) A special note for tallying at a timed, ticketed event
If your event is one in which everyone arrives at the same time, you may need to augment your “stint” sample at entry points (gates) with additional tally stints on-site. If almost all of your attendees arrive at the same time, there may be no way to keep the crowds flowing through the gates AND conduct sufficient tally interviews to have viable estimates of different visitor types. Recommendations for handling this situation are provided in the Concentrated Entry Events section (Section IV-B-1-c).
e) You must be systematic in the tally process
As long as you have covered all the time periods and locations at which people can enter your event in a systematic and pre-set way, your “tallies” can be adjusted to represent all attendees. If the plan does not meet these criteria, the results of all your tallying effort will be for nought because you will be unable to project your sample to the total universe of attendees at your event.
f) Selected tally stints must be completed
There is no hard and fast rule about how many tallies are enough. Remember, the sampling unit is based on time and location (stints) rather than completed tallies. Guidelines for completed tally interviews are “targets” and not quotas.
Guidelines: Survey Procedures for Tourism Economic Impact Assessments of Gated Events and Festivals
38
Your tally staff must continue their random pattern of selection of household parties throughout the entire stint period and each selected stint must be completed (weather cancellations may be unavoidable. See Section III-D-2). If you “stop” the tallying process when you reach a “target”, the sample will no longer be valid. You must finish the tallying process for all selected stints.
12. “Interviewer stints”
An interviewer stint represents a fixed time period of work by one interviewer at a specific location. You can set stint duration to meet the expected entry patterns of your event, recognizing that an interviewer can work productively for no more than about a five to six hour period. Thus, your maximum interviewer stint duration should not exceed six hours.
The time span during which attendees are expected to enter the event will determine how many possible stints you will have in your sample frame. For example, if everyone “enters” over a four-hour period, you might have a single time block of four hours. If people might be expected to enter over the course of a ten-hour period (e.g., 10:00 am through 8:00 pm), you might have two time blocks of 5 hours each.
You can also set shorter stint durations than the maximum number of hours an interviewer can work productively. If, for example, you want to spread interviewers out over multiple locations, you might set a stint duration for three hours. A single interviewer could cover two stints (at two different locations) over a six-hour period. As a general rule, the shorter the stint duration, the more coverage you will obtain at different locations and the more flexibility you will have for taking into account high volume and low volume entry locations and time periods.
If all attendees are expected to enter within a very short period of time, entry gates will not be a realistic location for capturing sufficient tally information. In this case, additional tally time blocks and locations would be required on the site itself. Recommendations for handling this situation are provided in the Concentrated Entry Events section (Section IV-B-1-c).
13. Number of tally interviewer stints required to meet Attendee Survey completion targets
Remember, you have to work backwards to identify how many tally interviewer stints you will require to meet your Attendee Survey targets. In turn, the Attendee Survey targets will depend on how many non-local attendees you expect to attend your event and how many different sub-groups among non-locals you plan to analyze.
Once you have determined the smallest group you plan to examine in your analysis, use the expected incidence of this group (incidence = the proportion [%] a smaller sub-group represents of all attendees at your event) to calculate how many interviewer hours and interviewer stints you will need for the tally process. Why pick the smallest group? Because as you attempt to find people in the lowest incidence group, you will also find people who represent larger proportions of your attendees.
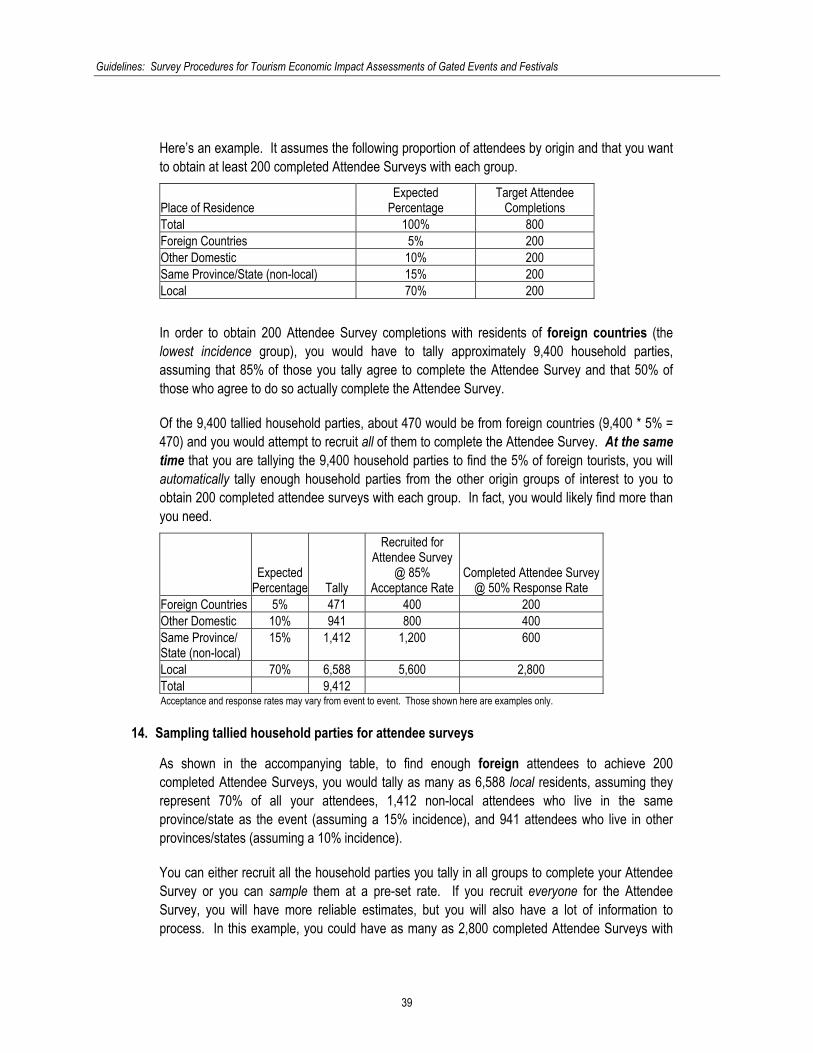
Guidelines: Survey Procedures for Tourism Economic Impact Assessments of Gated Events and Festivals
39
Here’s an example. It assumes the following proportion of attendees by origin and that you want to obtain at least 200 completed Attendee Surveys with each group.
Place of Residence Expected
Percentage Target Attendee
Completions Total 100% 800 Foreign Countries 5% 200 Other Domestic 10% 200 Same Province/State (non-local) 15% 200 Local 70% 200
In order to obtain 200 Attendee Survey completions with residents of foreign countries (the lowest incidence group), you would have to tally approximately 9,400 household parties, assuming that 85% of those you tally agree to complete the Attendee Survey and that 50% of those who agree to do so actually complete the Attendee Survey.
Of the 9,400 tallied household parties, about 470 would be from foreign countries (9,400 * 5% = 470) and you would attempt to recruit all of them to complete the Attendee Survey. At the same time that you are tallying the 9,400 household parties to find the 5% of foreign tourists, you will automatically tally enough household parties from the other origin groups of interest to you to obtain 200 completed attendee surveys with each group. In fact, you would likely find more than you need.
Expected
Percentage Tally
Recruited for Attendee Survey
@ 85% Acceptance Rate
Completed Attendee Survey @ 50% Response Rate
Foreign Countries 5% 471 400 200 Other Domestic 10% 941 800 400 Same Province/ State (non-local)
15% 1,412 1,200 600
Local 70% 6,588 5,600 2,800 Total 9,412 Acceptance and response rates may vary from event to event. Those shown here are examples only.
14. Sampling tallied household parties for attendee surveys
As shown in the accompanying table, to find enough foreign attendees to achieve 200 completed Attendee Surveys, you would tally as many as 6,588 local residents, assuming they represent 70% of all your attendees, 1,412 non-local attendees who live in the same province/state as the event (assuming a 15% incidence), and 941 attendees who live in other provinces/states (assuming a 10% incidence).
You can either recruit all the household parties you tally in all groups to complete your Attendee Survey or you can sample them at a pre-set rate. If you recruit everyone for the Attendee Survey, you will have more reliable estimates, but you will also have a lot of information to process. In this example, you could have as many as 2,800 completed Attendee Surveys with

Guidelines: Survey Procedures for Tourism Economic Impact Assessments of Gated Events and Festivals
40
locals -- more completed Attendee Surveys than you need for reliable spending estimates.
We recommend that you sample tallied attendees at the recruitment stage so that you have enough completed Attendee Surveys but do not get overwhelmed by the volume of surveys to process and analyze.
Expected Percentage Tally
Recruited for Attendee Survey @
85% Acceptance
Rate
Completed Attendee Survey @
50% Response
Rate
Sampling Rate forRecruitment for Attendee Survey to Achieve 200
Completions Per Segment
Total Completed Attendee Surveys
Foreign Countries 5% 471 400 200 All (100%) 200 Other Domestic 10% 941 800 400 Every 2nd 200 Same Province/State (non-local)
15% 1,412 1,200 600 Every 3rd 200
Local 70% 6,588 5,600 2,800 Every 14th 200 Total 9,412 Acceptance and response rates may vary from event to event. Those shown here are examples only.
15. What if your event does not attract enough tourists to achieve 200 attendee survey completions?
If your event attracts relatively few “tourists”, you can still estimate tourism economic impact so long as the rate at which you sample tourists is relatively high. If, for example, your event attracted 150 tourists and you obtained completed Attendee Surveys from at least half of them (75), your estimate of tourism spending associated with your event would be relatively stable based on the Law of Large Numbers in statistics. Averages and proportions vary less in large samples than in small samples of the same population (tourists). If, of course, there are many more than 150 tourists at your event, a sample of only 75 would not necessarily produce stable estimates. To achieve 75 completed attendee surveys from tourists at this hypothetical event, you would likely have to tally and recruit all of the 150 tourists who came (assuming that half of them would complete and return the questionnaire).6
If you have a small event and/or expect that low proportions of your attendees will be tourists (live outside the local area), you should consider whether undertaking an economic impact estimation process is appropriate (see Guidelines: Survey Procedures for Assessment of On-Site Spending at Gated Events and Festivals).
a) Number of tally interviewer stints required if you cannot estimate number of attendees or tourists
If you cannot estimate total attendance or how many tourists you expect in advance, you will have to assign enough interviewer tally stints to optimize the chances of obtaining sufficient completed Attendee Surveys with groups of interest to you.
6 Statistics, A New Approach, Wallis, A.W., Roberts, H.V., The Free Press, Glencoe, Illinois, 1956, p. 123.
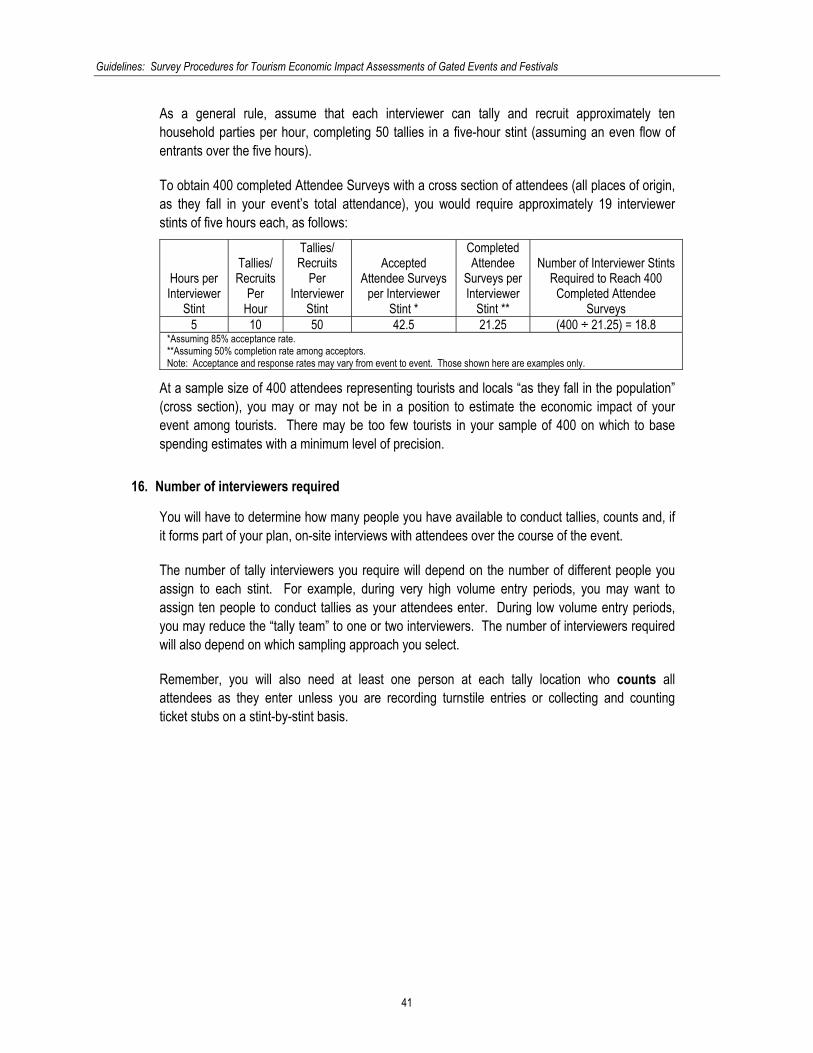
Guidelines: Survey Procedures for Tourism Economic Impact Assessments of Gated Events and Festivals
41
As a general rule, assume that each interviewer can tally and recruit approximately ten household parties per hour, completing 50 tallies in a five-hour stint (assuming an even flow of entrants over the five hours).
To obtain 400 completed Attendee Surveys with a cross section of attendees (all places of origin, as they fall in your event’s total attendance), you would require approximately 19 interviewer stints of five hours each, as follows:
Hours per Interviewer
Stint
Tallies/ Recruits
Per Hour
Tallies/ Recruits
Per Interviewer
Stint
Accepted Attendee Surveys
per Interviewer Stint *
Completed Attendee
Surveys per Interviewer
Stint **
Number of Interviewer Stints Required to Reach 400
Completed Attendee Surveys
5 10 50 42.5 21.25 (400 ÷ 21.25) = 18.8 *Assuming 85% acceptance rate. **Assuming 50% completion rate among acceptors. Note: Acceptance and response rates may vary from event to event. Those shown here are examples only.
At a sample size of 400 attendees representing tourists and locals “as they fall in the population” (cross section), you may or may not be in a position to estimate the economic impact of your event among tourists. There may be too few tourists in your sample of 400 on which to base spending estimates with a minimum level of precision.
16. Number of interviewers required
You will have to determine how many people you have available to conduct tallies, counts and, if it forms part of your plan, on-site interviews with attendees over the course of the event.
The number of tally interviewers you require will depend on the number of different people you assign to each stint. For example, during very high volume entry periods, you may want to assign ten people to conduct tallies as your attendees enter. During low volume entry periods, you may reduce the “tally team” to one or two interviewers. The number of interviewers required will also depend on which sampling approach you select.
Remember, you will also need at least one person at each tally location who counts all attendees as they enter unless you are recording turnstile entries or collecting and counting ticket stubs on a stint-by-stint basis.

Guidelines: Survey Procedures for Tourism Economic Impact Assessments of Gated Events and Festivals
42
C. Designing a sampling plan for counts and tallies
Because many events will not have the volunteers or funds to hire enough interviewers to cover all entry locations and entry times throughout the course of the event, these guidelines are based on using sampled stints for counting and tallying attendees. In this plan, you would randomly select stints for tallying attendees and counting entrants from a list of all possible stints.
This section is designed to provide you with the basic steps required to generate a sample for counting and tallying at your event. You would customize it to correspond to the particulars of your event.
1. Estimating the number of interviewer stints you require for counts and tallies
Before you can draw your sample of stints, you need to estimate how many interviewer hours you will require to achieve your target number of attendee survey completions.
For example, we have made the following assumptions about the characteristics of the event. 2 gates or tally zones 2 time blocks (10:00 am to 2:30 pm; 2:30 pm to 7:00 pm) 4 days duration
In this example, you would have 16 possible stints, calculated as follows:
[2 Zones * 2 Time Blocks/Day * 4 Days = 16]
The number of interviewer stints you would require will depend on how may completed attendee surveys you wish to achieve. To calculate the number of interviewer stints you require, you would:
1. Identify the attendee segments you plan to examine in your analysis (e.g., all attendees; out-of-province attendees, etc.) keeping in mind the recommendation for 200 completed attendee surveys for each segment you plan to analyze separately (see Chapter III, Section B-13/16);
2. Estimate, to the extent you can, the rate or incidence at which these segments are likely to occur in your attendee population (incidence is the proportion a segment represents of all attendees at your event);

Guidelines: Survey Procedures for Tourism Economic Impact Assessments of Gated Events and Festivals
43
3. Identify a realistic acceptance rate and response rate for the attendee survey (how many of the tallied households will accept the attendee survey and of these, how many will actually complete and return the survey form) 7;
4. Take into account that an interviewer can work effectively for no more than about five hours at a stretch.
The following table provides an example of how you would go about these calculations.
Target = 400 Completions with
All Attendees (Cross Section)
Target = 200 Completions with
Out-of-Province/State
Attendees (5% incidence)
Target = 200 Completions with
All Tourists (20% incidence)
Hours per Interviewer Stint 4.5 4.5 4.5 Tallies/ Recruits Per Hour 10 10 10 Tallies/ Recruits Per Interviewer Stint you would expect to find in each market segment 45.00 2.25 9.00 Number of Household Parties who Accept Attendee Survey per Interviewer Stint (assuming 85% acceptance rate) 38.25 1.91 7.65 Number of Completions you can expect per Interviewer Stint (assuming 50% completion rate among acceptors) 19.13 0.96 3.83 Number of Interviewer Stints Required to Reach Target 20.92 209.15 52.29 Minimum Number of Additional Interviewers to Count Attendees 2 per stint 2 per stint 2 per stint Acceptance and response rates may vary from event to event. Those shown here are examples only.
If you wanted to complete 400 Attendee Surveys with all attendees (cross-section – see Glossary), you would require about 21 interviewer stints. If, however, you wanted to complete 200 Attendee Surveys with Out of Province/State Tourists, you would require over 200 interviewer stints. If you wanted to complete 200 Attendee Surveys with All Tourists, you would require about 52 interviewer stints.
Many events will not have the resources to obtain enough completed Attendee Surveys with low incidence groups to support independent analysis of these groups. In these cases, the number of non-local groups can be reduced, thereby increasing the overall incidence (as in the example,
7 Acceptance and response rates used throughout these Guidelines are examples only. They will vary based on the particulars of an event and the type(s) of attendees it attracts. For example, teenagers may be less cooperative with a survey process than are older attendees. Event organizers will have to use their experience and judgement to estimate likely acceptance and response rates but should recognize that acceptance rates could be as low as 50% and completion rates could fall below the 50% estimate used in these Guidelines.

Guidelines: Survey Procedures for Tourism Economic Impact Assessments of Gated Events and Festivals
44
moving from out-of-province tourists at an expected rate of 5% to all tourists at an expected rate of 20%). Alternatively, an On-Site Spending Study could be considered.
In addition to the number of tally interviewers assigned to a stint, staff will be required to implement the appropriate counting process to estimate total attendance (these procedures and staff requirements differ from approach to approach).
2. All times and locations must have an opportunity to be in your stint sample
You can assign interviewers to various times and locations based on your expectations of traffic flow through your event but you must ensure that all possible time slots and locations over the duration of your event have an opportunity to be included in your stint sample.
To achieve this goal, you need to develop a stint sampling plan. The steps to create a stint sampling plan are described in the following section. In our example, we will assume that you will have teams of four interviewers for the tally process and wish to achieve a target of 400 completed attendee surveys with all attendees (see table/example in Section III-C-a).
In this scenario, you would require about five stints to achieve your target (21 interviewer stints divided by four interviewers on each team).
D. The stint sampling plan
1. Three basic steps
Once you have estimated how many stints you require to count and/or tally attendees, you will create a stint sampling plan and select the time periods and locations at which you will assign interviewers.
There are three basic steps to build a sampling frame and to select your count/tally stint sample:
1. List all possible time/location periods over the full duration of the event (all days);
2. Pick a random start point and select an interval (every nth where n = total possible stints ÷ number of stints you require to achieve the target number of counting locations or completed attendee surveys you hope to achieve, to the nearest whole number);
3. Starting at your random start point, count every nth (your interval). Keep counting until you have been through the entire list of possible stint times. The rows that correspond to every nth represent your stint sample for counting and/or tallying.
2. Two types of random sampling plans
You can elect to use a “Simple Random Sampling Plan” in which each location/time period is given an equal chance of being selected for your stint sample or you can use a “Stratified Random Sampling Plan” in which you adjust the rate at which you randomly select locations/time periods.
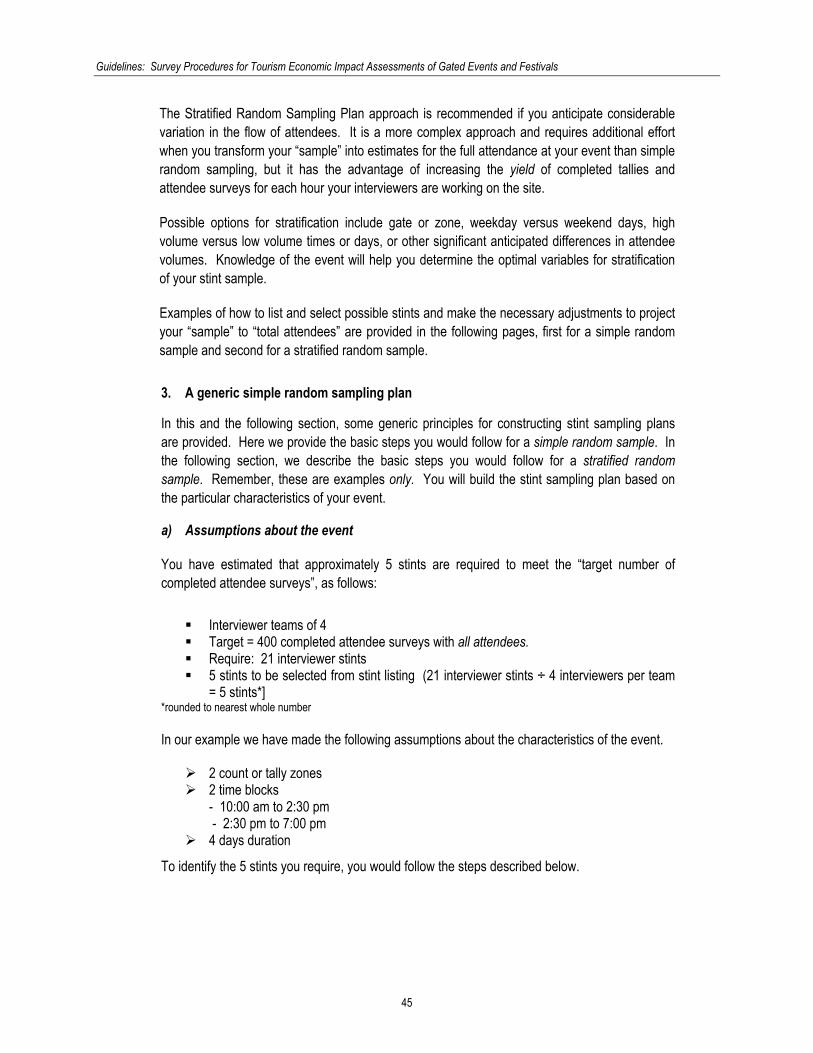
Guidelines: Survey Procedures for Tourism Economic Impact Assessments of Gated Events and Festivals
45
The Stratified Random Sampling Plan approach is recommended if you anticipate considerable variation in the flow of attendees. It is a more complex approach and requires additional effort when you transform your “sample” into estimates for the full attendance at your event than simple random sampling, but it has the advantage of increasing the yield of completed tallies and attendee surveys for each hour your interviewers are working on the site.
Possible options for stratification include gate or zone, weekday versus weekend days, high volume versus low volume times or days, or other significant anticipated differences in attendee volumes. Knowledge of the event will help you determine the optimal variables for stratification of your stint sample.
Examples of how to list and select possible stints and make the necessary adjustments to project your “sample” to “total attendees” are provided in the following pages, first for a simple random sample and second for a stratified random sample.
3. A generic simple random sampling plan
In this and the following section, some generic principles for constructing stint sampling plans are provided. Here we provide the basic steps you would follow for a simple random sample. In the following section, we describe the basic steps you would follow for a stratified random sample. Remember, these are examples only. You will build the stint sampling plan based on the particular characteristics of your event.
a) Assumptions about the event
You have estimated that approximately 5 stints are required to meet the “target number of completed attendee surveys”, as follows:
Interviewer teams of 4 Target = 400 completed attendee surveys with all attendees. Require: 21 interviewer stints 5 stints to be selected from stint listing (21 interviewer stints ÷ 4 interviewers per team
= 5 stints*] *rounded to nearest whole number
In our example we have made the following assumptions about the characteristics of the event.
2 count or tally zones 2 time blocks
- 10:00 am to 2:30 pm - 2:30 pm to 7:00 pm
4 days duration
To identify the 5 stints you require, you would follow the steps described below.

Guidelines: Survey Procedures for Tourism Economic Impact Assessments of Gated Events and Festivals
46
b) Step 1: list all possible stints In this example, the you would have 16 possible stints, calculated as follows:
[2 Zones * 2 Time Blocks per Day * 4 Days = 16]. You would list these stints, in sequence, as shown below.
Stint # Day of week Date Time Count/Tally Gate or Zone 1 Monday May 1 10:00 – 2:30 A 2 Monday May 1 2:30 – 7:00 A 3 Monday May 1 10:00 – 2:30 B 4 Monday May 1 2:30 – 7:00 B 5 Tuesday May 2 10:00 – 2:30 A 6 Tuesday May 2 2:30 – 7:00 A 7 Tuesday May 2 10:00 – 2:30 B 8 Tuesday May 2 2:30 – 7:00 B 9 Wednesday May 3 10:00 – 2:30 A 10 Wednesday May 3 2:30 – 7:00 A 11 Wednesday May 3 10:00 – 2:30 B 12 Wednesday May 3 2:30 – 7:00 B 13 Thursday May 4 10:00 – 2:30 A 14 Thursday May 4 2:30 – 7:00 A 15 Thursday May 4 10:00 – 2:30 B 16 Thursday May 4 2:30 – 7:00 B
c) Step 2: select random start point & interval
We have selected the 5th stint down as the random start point, but you can select any row in the list to begin the “counting process”. Our interval (n) in this example is 3, as described below: n = total possible stints (16) ÷ number of stints you require to achieve your target number of completed attendee surveys (5) = 3. 16 ÷ 5 = 3.2, rounded to the nearest whole number [3].

Guidelines: Survey Procedures for Tourism Economic Impact Assessments of Gated Events and Festivals
47
d) Step 3: select stints
You must go through the entire list, selecting stints until you arrive back at or near your Random Start Point.
Stint # Day of week Date Time
Count/Tally Gate or Zone Selected Stints
Count continued from endpoint
1 Monday May 1 10:00 – 2:30 A 1 2 Monday May 1 2:30 – 7:00 A 2 3 Monday May 1 10:00 – 2:30 B 3 Selected 4 Monday May 1 2:30 – 7:00 B 1 5 Tuesday* May 2 10:00 – 2:30 A 1 Random Start Point 6 Tuesday May 2 2:30 – 7:00 A 2 7 Tuesday May 2 10:00 – 2:30 B 3 Selected 8 Tuesday May 2 2:30 – 7:00 B 1 9 Wednesday May 3 10:00 – 2:30 A 2 10 Wednesday May 3 2:30 – 7:00 A 3 Selected 11 Wednesday May 3 10:00 – 2:30 B 1 12 Wednesday May 3 2:30 – 7:00 B 2 13 Thursday May 4 10:00 – 2:30 A 3 Selected 14 Thursday May 4 2:30 – 7:00 A 1 15 Thursday May 4 10:00 – 2:30 B 2 16 Thursday May 4 2:30 – 7:00 B 3 Selected *Random Start Point
e) Check your stint selections
Review the final stint distribution to ensure that you have included at least one stint that represents different days of the week, different gates or on-site locations and different times per day. Why? Because the people who are on-site at high and low volume periods and at different locations may be different from one another. To represent all types of attendees, you have to give everyone an opportunity to be included in your sample.
Be sure to retain at least some stints that represent “typical” and “not typical” times. For example, if your event includes major holiday periods such as the winter or spring school break, you should make sure to include at least some stints that correspond to these “atypical” periods. See Stratified Stint Selection Procedures (following section) for ways to increase yields for high volume periods.

Guidelines: Survey Procedures for Tourism Economic Impact Assessments of Gated Events and Festivals
48
Selected Stints
Stint # Day of week Date Time
Count/Tally Gate or Zone Selected Stints
3 Monday May 1 10:00 – 2:30 B Selected 7 Tuesday May 2 10:00 – 2:30 B Selected 10 Wednesday May 3 2:30 – 7:00 A Selected 13 Thursday May 4 10:00 – 2:30 A Selected 16 Thursday May 4 2:30 – 7:00 B Selected
f) Assigning interviewer stints for tallying
Now you know when (date, time) and where (gates or zones) you will be counting and/or tallying your attendees. The next task is to determine how many interviewer stints (number of interviewers per time block) to assign to each date/time/zone.
If you anticipate a relatively “even” flow of attendees throughout your event, you would assign equal numbers of interviewers to each time/location selection you have made. Many events, however, do not have an even flow. For example, some events have much higher attendance on weekends than on weekdays. Some have relatively low flows in the mornings but much heavier flows in the afternoon. And some events have special timed activities such as a special performance that will change the visitor flow. You need to consider the particular features of your event to decide how to maximize the number of tallies you complete while retaining the systematic nature of your sample.
In this example, we have assumed that you will assign four (4) interviewers to each “team” and therefore, to each “stint”. You can adjust this number to take into account uneven flows of attendees to increase yield or, preferably, you can use a stratified stint sampling approach to achieve this goal (see next section).
In addition to the number of tally interviewers assigned to a stint, additional staff will be required to implement the appropriate counting process to estimate total attendance (these procedures and staff requirements differ from approach to approach).
4. A generic stratified random sampling plan
a) About stratified random samples
A stratified random sampling plan will enable you to maximize the yield of counted and tallied attendees because you will sample high volume times and/or zones at a higher rate than you sample medium or low volume ones. You can set up as many different stratum as you want. The example provided in this section is based on two strata.
To construct a stratified sampling plan using two strata – a high and a low volume stratum – you would identify the times/locations that will be included in each. You would then follow the steps in the previous section for a “simple random sample” for all possible time periods/ locations within each of the stratum. In other words, you would repeat the steps described for a Simple Random Sample, first for all of your high volume time periods/locations and then for all the low

Guidelines: Survey Procedures for Tourism Economic Impact Assessments of Gated Events and Festivals
49
volume time periods/ locations.
b) Different sampling rates for different stratum
The sampling rate or the number of stints you select within each stratum may be different for a stratified sample. You might assign stints at a higher rate for high volume periods than for low ones. You MUST, however, include a random sample of stints from each stratum you create in your sampling plan. At the weighting and projection phase, each of the stints completed within a stratum will be adjusted to the total attendance for its stratum. Subsequently, projections for each stratum will be combined to reflect the relative weight of each stratum.
c) Assumptions about the event
In this example, we have made the following assumptions about the characteristics of the event. The event has:
2 count or tally zones 2 time blocks
- 10:00 am to 2:30 pm - 2:30 pm to 7:00 pm
7 days duration
You expect higher volumes of attendees on Friday and Saturday (high volume), and lower volumes of attendees on Sunday through Thursday (low volume). You have estimated that approximately 5 high volume stints and 5 low volume stints are required to meet the “target number of completed attendee surveys”.
d) Step 1: list all possible stints Total number of listed possible stints for counting and/or tallying would be 28 (as follows):
[2 Zones * 2 Time Blocks/Day * 7 Days = 28]
Of these 28 stints, 8 would be High Volume stints (e.g., Friday/Saturday) and 20 would be Low Volume stints (e.g., Sunday – Thursday).
You would list the 8 High Volume and the 20 Low Volume stints separately (see following charts).
e) Step 2: select random start point & interval
In this example, we have selected the 5th stint down as the random start point, but you can select any row in the list to begin the “counting process”.
The interval (n) for high volume stints in this example is 2, as described below:
n = total possible high volume stints (8) ÷ number of high volume stints you require to achieve your target number of completed attendee surveys (5) = 2.

Guidelines: Survey Procedures for Tourism Economic Impact Assessments of Gated Events and Festivals
50
8 ÷ 5 = 1.6, rounded to the nearest whole number [2].
The interval (n) for low volume stints in this example is 4, as described below:
n = total possible low volume stints (20) ÷ number of low volume stints you require to achieve your target number of completed attendee surveys (5) = 4.
20 ÷ 5 = 4
f) Listing stints for a stratified sampling plan
For each list, you would identify a random start point and a selection interval based on the target number of completed attendee survey questionnaires you set (See Section III-C for a discussion of how to set target completions).
For the High Volume list, your interval is every 2nd.
For the Low Volume list, your interval is every 4th.
See the examples below for how you would set up stint listings and selection procedures for a stratified sampling plan.
High Volume Stints = Friday/Saturday Random Start Point = 5 Interval for Selection = 2nd Day of week Date Time Count/Tally Gate or
Zone Count (continued from endpoint)
Friday May 6 10:00 – 2:30 A 2 Friday May 6 2:30 – 7:00 A 1 Friday May 6 10:00 – 2:30 B 2 Selected Friday* May 6 2:30 – 7:00 B 1*Random Start Saturday May 7 10:00 – 2:30 A 2 Selected Saturday May 7 2:30 – 7:00 A 1 Saturday May 7 10:00 – 2:30 B 2 Selected Saturday May 7 2:30 – 7:00 B 1
The selection process for high volume stints produced only four selected stints. One additional stint must be selected in this example to reach the target of five stints. To identify this additional stint, you would use the same list but pick a different start point and apply the same interval you used in the first round selection (in this example, the interval is 2). By doing this, you would eventually identify a stint that was not identified in your original selection.

Guidelines: Survey Procedures for Tourism Economic Impact Assessments of Gated Events and Festivals
51
To select the additional stint: select a different start point (see Friday, May 6, 10:00 - 2:30) and begin the counting process again, using the original interval (2). The first stint identified in this process is your “selected” fifth stint.
High Volume Stints = Friday/Saturday Random Start Point = 3 Interval for Selection = 2nd Day of week Date Time Count/Tally Gate or
Zone Count (continued from endpoint)
Friday May 6 10:00 – 2:30 A 1 Friday May 6 2:30 – 7:00 A 2 Friday May 6 10:00 – 2:30 B 1*New Random
Start Friday May 6 2:30 – 7:00 B 2 Selected (new) Saturday May 7 10:00 – 2:30 A 2 Selected Saturday May 7 2:30 – 7:00 A 2 Saturday May 7 10:00 – 2:30 B 1 Selected Saturday May 7 2:30 – 7:00 B 2
Friday, May 6 from 2:30 – 7:00 at Gate or Zone B is the additional stint to be added to your high volume stints. Thus, your final high volume stint sample would include the following:
High Volume Stints = Friday/Saturday Random Start Point = 4 Interval for Selection = 2nd Day of week Date Time Count/Tally Gate or
Zone Selected Stints
Friday May 6 10:00 – 2:30 A Selected Friday May 6 10:00 – 2:30 B Selected Friday May 6 2:30 – 7:00 B Selected Saturday May 7 10:00 – 2:30 A Selected Saturday May 7 10:00 – 2:30 B Selected
Repeat the process used for high volume stints when selecting low volume stints (see below). As noted above, the random start point in this example is the fifth listed stint and the interval is every 4th. Five low volume stints will be selected in this process.
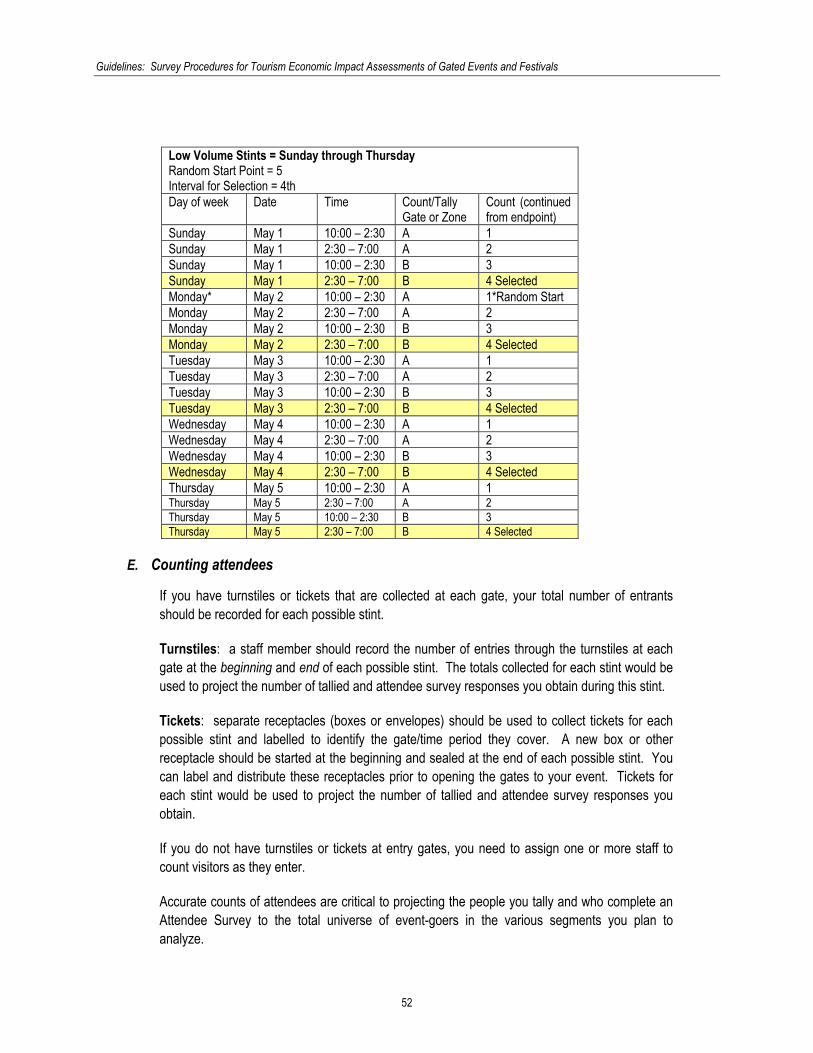
Guidelines: Survey Procedures for Tourism Economic Impact Assessments of Gated Events and Festivals
52
Low Volume Stints = Sunday through Thursday Random Start Point = 5 Interval for Selection = 4th Day of week Date Time Count/Tally
Gate or Zone Count (continued from endpoint)
Sunday May 1 10:00 – 2:30 A 1 Sunday May 1 2:30 – 7:00 A 2 Sunday May 1 10:00 – 2:30 B 3 Sunday May 1 2:30 – 7:00 B 4 Selected Monday* May 2 10:00 – 2:30 A 1*Random Start Monday May 2 2:30 – 7:00 A 2 Monday May 2 10:00 – 2:30 B 3 Monday May 2 2:30 – 7:00 B 4 Selected Tuesday May 3 10:00 – 2:30 A 1 Tuesday May 3 2:30 – 7:00 A 2 Tuesday May 3 10:00 – 2:30 B 3 Tuesday May 3 2:30 – 7:00 B 4 Selected Wednesday May 4 10:00 – 2:30 A 1 Wednesday May 4 2:30 – 7:00 A 2 Wednesday May 4 10:00 – 2:30 B 3 Wednesday May 4 2:30 – 7:00 B 4 Selected Thursday May 5 10:00 – 2:30 A 1 Thursday May 5 2:30 – 7:00 A 2 Thursday May 5 10:00 – 2:30 B 3 Thursday May 5 2:30 – 7:00 B 4 Selected
E. Counting attendees
If you have turnstiles or tickets that are collected at each gate, your total number of entrants should be recorded for each possible stint.
Turnstiles: a staff member should record the number of entries through the turnstiles at each gate at the beginning and end of each possible stint. The totals collected for each stint would be used to project the number of tallied and attendee survey responses you obtain during this stint.
Tickets: separate receptacles (boxes or envelopes) should be used to collect tickets for each possible stint and labelled to identify the gate/time period they cover. A new box or other receptacle should be started at the beginning and sealed at the end of each possible stint. You can label and distribute these receptacles prior to opening the gates to your event. Tickets for each stint would be used to project the number of tallied and attendee survey responses you obtain.
If you do not have turnstiles or tickets at entry gates, you need to assign one or more staff to count visitors as they enter.
Accurate counts of attendees are critical to projecting the people you tally and who complete an Attendee Survey to the total universe of event-goers in the various segments you plan to analyze.

Guidelines: Survey Procedures for Tourism Economic Impact Assessments of Gated Events and Festivals
53
1. What does the “counter” do?
You will require one or more people counting the number of attendees entering the event during your selected stints. If there are multiple turnstiles or entrances at a single “gate” or location, you will likely need more than one counter to keep up with traffic entering through the gate, depending on how thick the flow of attendees is.
The counter literally counts each individual as he/she enters, using a paper and pencil, hand held computer or “clicker”.
2. Adjusting “counts” to “tally” data for excluded attendees
Some of the people who enter your event during a stint may be counted by the counter, but will be staff members, merchants, participants or volunteers. Generally, these types of attendees are excluded from tourism economic impact assessments.
If any types of attendees are to be excluded from your final estimates, you will have to identify how many excluded attendees came to your event and remove them from your “counts”. For this reason, the Tally Questionnaire includes a question about which type of entrant each person is. You would use this information to make the appropriate adjustments when you weight and project your tally information (see Section IV).
3. What happens if you “miss” a stint?
If inclement weather or some other reason causes you to miss one of your sampled stints, you have several adjustment options.
You can “replace” the missed stint with one that is most similar to it (same gate, same time period but a different day assuming there is still time left in your event’s schedule).
If you cannot replace the missed stint because there is not enough time left in your event’s schedule, the stints you DID conduct will all have a higher stint weight than they would have had if you had conducted the “missed” stint.
Guidelines: Survey Procedures for Tourism Economic Impact Assessments of Gated Events and Festivals
54
IV. WEIGHTING AND PROJECTION PLAN FOR COUNTS AND TALLIES
A. Some basic concepts for weighting and projection
1. What is a weighting and projection plan?
A weighting and projection plan permits you to generalize from your sample to all attendees at your event. It is based on a sequence of arithmetical steps, using information you collected and compiled from attendee counts and attendee tallies conducted over the duration of the event.
2. Why you have to weight & project counts and tallies
Now that you have completed your tally and attendee counts, what do you know about your attendees?
You know numbers of people who entered your event at particular times/locations; and
You know the type of entrant (e.g., local, tourist, staff, merchant, etc.), party composition and place of residence of a portion of the people who entered your event at particular times/locations (the portion you “tallied”).
You need the same information you collected during counting and tallying for all the attendees who came to your event. How do you get this information for all attendees? You adjust your “sampled” counts and tallied stints to represent all of your attendees. To do this, you must develop and implement a weighting and projection plan.
3. Other important definitions
Following are several important definitions you will require for weighting and projection.
Record-by-record: a “record” is all the information collected from a single respondent. Thus, it would be a single “row” on the Tally Sheet or a completed Attendee Survey (questionnaire).
Household Travel Party: a household travel party, household party, or “party” is all the people travelling together and/or who came to the event together and who live in the same permanent residence. Because spending information is collected at the “household party” level but sampling and counting is done at the “person” level, for some parts of the weighting and projection process, it is necessary to convert between “people” and “parties”.
The reason spending information is collected at the “household party” level is that an individual respondent may not have personally spent money on a spending category (e.g. gasoline, vehicle repairs, vehicle rental, accommodation) but someone else in the household group travelling

Guidelines: Survey Procedures for Tourism Economic Impact Assessments of Gated Events and Festivals
55
together (“party”) would have spent money on behalf of this individual. By asking about all the money spent on various items by everyone in the household travel party, spending estimates are more accurate.
B. A step-by-step description of the weighting and projection process
Here are the steps in the process:
1. Convert tallied “party” to “people”, on a record-by-record basis;
2. Apply attendee counts to tally “person” information on a stint-by-stint basis*;
3. Remove excluded groups from adjusted stint counts (excluded groups would be pre-defined and identified on your Tally Questionnaire. Categories might include staff, merchants, volunteers, media, etc.);
4. Expand “stints” to total event;
5. Adjust for actual daily attendance;
6. FOR MULTI-DAY EVENTS: Adjust for unique attendees.
*See special note if you used on-site tally locations for a concentrated entry event (Section IV-B-1-c).
As noted in the Designing a Sampling Plan for Counts and Tallies section above, more complex weighting and projection procedures are required if you elect to use a stratified approach to sampling than if you use a simple random sampling plan. In the following sections, the weighting and projection procedures for each of these approaches are described, commencing with the simple random sample design.
1. The weighting and projection process for simple random samples
a) Step 1: Convert tallied “party” to “people”, on a record by record basis
A “household party” is the measurement unit for the tally whereas an individual is the measurement unit for attendee counts. Thus, you need to convert household parties to individuals represented by each party in order to match the tally and count information for each stint.
The first step is to obtain a count of all the people tallied during a specific stint. You do this by summing all the people represented by the household parties tallied in each stint. This should be done on a stint-by-stint basis, adding up all the people represented by each household party that was interviewed during the tally process.
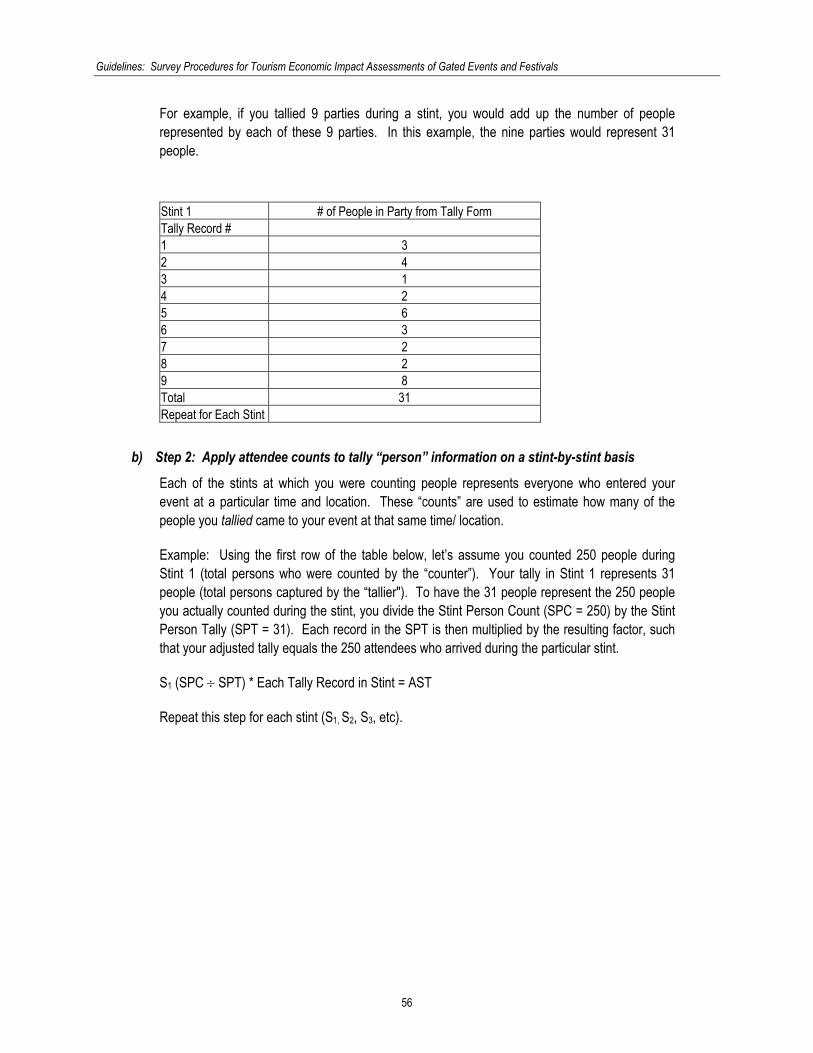
Guidelines: Survey Procedures for Tourism Economic Impact Assessments of Gated Events and Festivals
56
For example, if you tallied 9 parties during a stint, you would add up the number of people represented by each of these 9 parties. In this example, the nine parties would represent 31 people.
Stint 1 # of People in Party from Tally Form Tally Record # 1 3 2 4 3 1 4 2 5 6 6 3 7 2 8 2 9 8 Total 31 Repeat for Each Stint
b) Step 2: Apply attendee counts to tally “person” information on a stint-by-stint basis
Each of the stints at which you were counting people represents everyone who entered your event at a particular time and location. These “counts” are used to estimate how many of the people you tallied came to your event at that same time/ location.
Example: Using the first row of the table below, let’s assume you counted 250 people during Stint 1 (total persons who were counted by the “counter”). Your tally in Stint 1 represents 31 people (total persons captured by the “tallier"). To have the 31 people represent the 250 people you actually counted during the stint, you divide the Stint Person Count (SPC = 250) by the Stint Person Tally (SPT = 31). Each record in the SPT is then multiplied by the resulting factor, such that your adjusted tally equals the 250 attendees who arrived during the particular stint.
S1 (SPC ÷ SPT) * Each Tally Record in Stint = AST
Repeat this step for each stint (S1, S2, S3, etc).
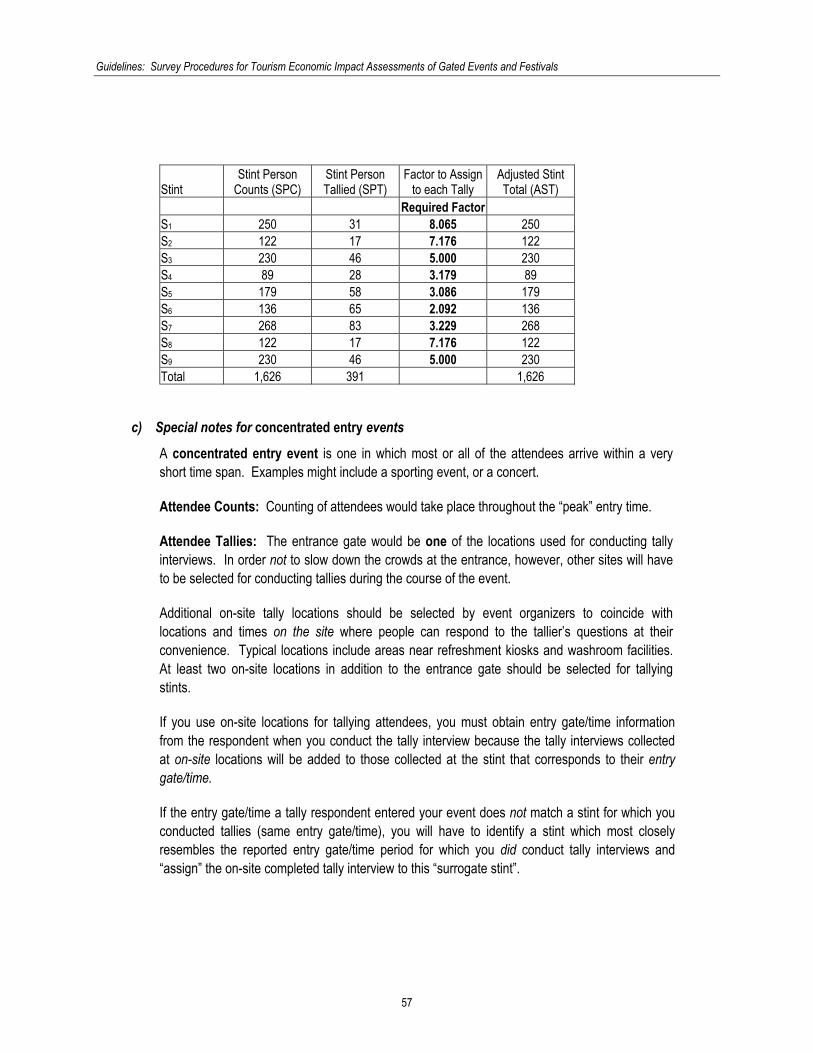
Guidelines: Survey Procedures for Tourism Economic Impact Assessments of Gated Events and Festivals
57
Stint Stint Person
Counts (SPC) Stint Person Tallied (SPT)
Factor to Assign to each Tally
Adjusted Stint Total (AST)
Required Factor S1 250 31 8.065 250 S2 122 17 7.176 122 S3 230 46 5.000 230 S4 89 28 3.179 89 S5 179 58 3.086 179 S6 136 65 2.092 136 S7 268 83 3.229 268 S8 122 17 7.176 122 S9 230 46 5.000 230 Total 1,626 391 1,626
c) Special notes for concentrated entry events
A concentrated entry event is one in which most or all of the attendees arrive within a very short time span. Examples might include a sporting event, or a concert.
Attendee Counts: Counting of attendees would take place throughout the “peak” entry time.
Attendee Tallies: The entrance gate would be one of the locations used for conducting tally interviews. In order not to slow down the crowds at the entrance, however, other sites will have to be selected for conducting tallies during the course of the event.
Additional on-site tally locations should be selected by event organizers to coincide with locations and times on the site where people can respond to the tallier’s questions at their convenience. Typical locations include areas near refreshment kiosks and washroom facilities. At least two on-site locations in addition to the entrance gate should be selected for tallying stints.
If you use on-site locations for tallying attendees, you must obtain entry gate/time information from the respondent when you conduct the tally interview because the tally interviews collected at on-site locations will be added to those collected at the stint that corresponds to their entry gate/time.
If the entry gate/time a tally respondent entered your event does not match a stint for which you conducted tallies (same entry gate/time), you will have to identify a stint which most closely resembles the reported entry gate/time period for which you did conduct tally interviews and “assign” the on-site completed tally interview to this “surrogate stint”.

Guidelines: Survey Procedures for Tourism Economic Impact Assessments of Gated Events and Festivals
58
d) Step 3: Excluding vendors, staff, etc. from adjusted stint counts
Some people who entered your event and were counted during a stint may be excluded attendees. Excluded groups might include merchants, paid or unpaid event staff including volunteers, representatives of the media, etc. If you are conducting a tourism economic impact assessment, these individuals must be removed from the tallies.
Generally the people who will be excluded from the final counts are local but may be people from outside your community (participants and/or merchants who come to sell food, amusement rides, and retail products at the event). Because the proportions of excluded attendees are likely to vary by place of residence, it is recommended that you adjust for exclusions separately for each major “place of residence” category. In some cases, you may not need to identify these excluded groups (volunteers, staff, vendors, etc.) in your tally and go through these special calculations to “take them out” of your estimates because you have other ways to estimate how many people the excluded groups represent.
For example, if all excluded categories of entrants go through their own special gate (one that is not open to the general public), you would exclude this gate from your sampling frame, exclude the question from the Tally Questionnaire and ignore the calculation described here. Event organizers may also know the number of people who would fall into “excluded groups” and would not, therefore, need to generate an estimate of these individuals.
e) Step 4: Expand “stints” to total event
Each one of your stints will have to be adjusted to stand for time periods and locations in which counting and tallying did not take place. Now that you know how many people each sampled stint should represent, you must adjust the sample to the full event.
You can adjust your stint counts to the total in different ways, depending on how you sampled and how much information you have available.
In the simplest case, you could use the ratio of the number of selected stints to total possible stints as the adjustment factor. In the Simple Random Stint Sampling Plan example, there were 84 possible stints and 33 were selected for counting and tallying. The stint adjustment would be:
Total stints (84) ÷ Sampled stints (33) = Stint Weight (2.545)
The stint weight should be multiplied by the Total Attendees for Projection Purposes to provide the total attendees represented by each tally stint. In the following example, all stints have equal weight.
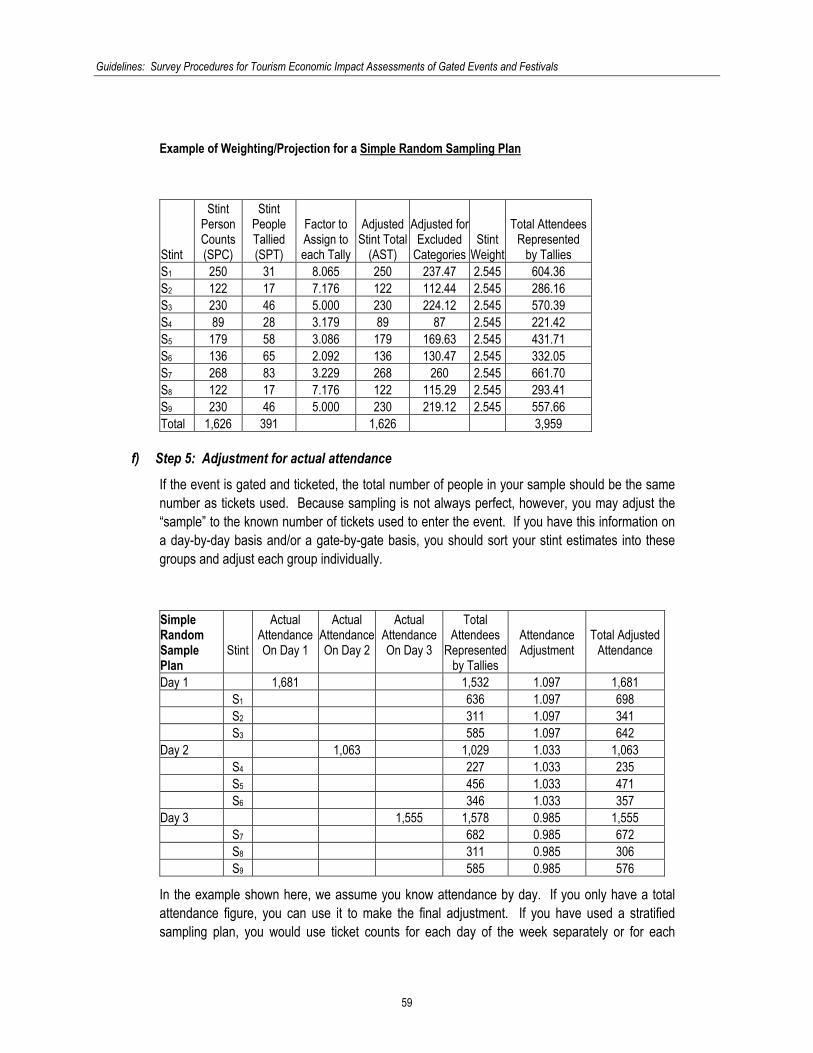
Guidelines: Survey Procedures for Tourism Economic Impact Assessments of Gated Events and Festivals
59
Example of Weighting/Projection for a Simple Random Sampling Plan
Stint
Stint Person Counts (SPC)
Stint People Tallied (SPT)
Factor to Assign to each Tally
Adjusted Stint Total
(AST)
Adjusted for
Excluded Categories
Stint Weight
Total Attendees
Represented by Tallies
S1 250 31 8.065 250 237.47 2.545 604.36 S2 122 17 7.176 122 112.44 2.545 286.16 S3 230 46 5.000 230 224.12 2.545 570.39 S4 89 28 3.179 89 87 2.545 221.42 S5 179 58 3.086 179 169.63 2.545 431.71 S6 136 65 2.092 136 130.47 2.545 332.05 S7 268 83 3.229 268 260 2.545 661.70 S8 122 17 7.176 122 115.29 2.545 293.41 S9 230 46 5.000 230 219.12 2.545 557.66 Total 1,626 391 1,626 3,959
f) Step 5: Adjustment for actual attendance
If the event is gated and ticketed, the total number of people in your sample should be the same number as tickets used. Because sampling is not always perfect, however, you may adjust the “sample” to the known number of tickets used to enter the event. If you have this information on a day-by-day basis and/or a gate-by-gate basis, you should sort your stint estimates into these groups and adjust each group individually.
Simple Random Sample Plan
Stint
Actual Attendance On Day 1
Actual AttendanceOn Day 2
Actual Attendance On Day 3
Total Attendees
Represented by Tallies
Attendance Adjustment
Total Adjusted
Attendance
Day 1 1,681 1,532 1.097 1,681 S1 636 1.097 698 S2 311 1.097 341 S3 585 1.097 642 Day 2 1,063 1,029 1.033 1,063 S4 227 1.033 235 S5 456 1.033 471 S6 346 1.033 357 Day 3 1,555 1,578 0.985 1,555 S7 682 0.985 672 S8 311 0.985 306 S9 585 0.985 576
In the example shown here, we assume you know attendance by day. If you only have a total attendance figure, you can use it to make the final adjustment. If you have used a stratified sampling plan, you would use ticket counts for each day of the week separately or for each
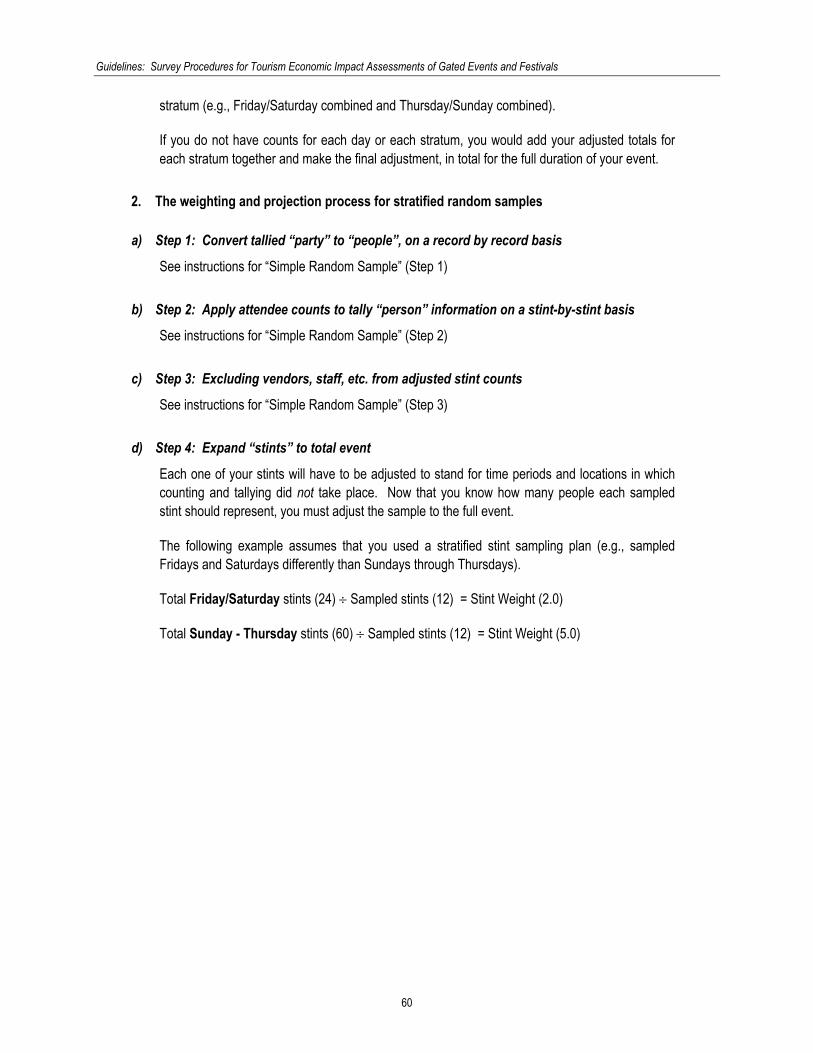
Guidelines: Survey Procedures for Tourism Economic Impact Assessments of Gated Events and Festivals
60
stratum (e.g., Friday/Saturday combined and Thursday/Sunday combined).
If you do not have counts for each day or each stratum, you would add your adjusted totals for each stratum together and make the final adjustment, in total for the full duration of your event.
2. The weighting and projection process for stratified random samples
a) Step 1: Convert tallied “party” to “people”, on a record by record basis
See instructions for “Simple Random Sample” (Step 1)
b) Step 2: Apply attendee counts to tally “person” information on a stint-by-stint basis
See instructions for “Simple Random Sample” (Step 2)
c) Step 3: Excluding vendors, staff, etc. from adjusted stint counts
See instructions for “Simple Random Sample” (Step 3)
d) Step 4: Expand “stints” to total event
Each one of your stints will have to be adjusted to stand for time periods and locations in which counting and tallying did not take place. Now that you know how many people each sampled stint should represent, you must adjust the sample to the full event.
The following example assumes that you used a stratified stint sampling plan (e.g., sampled Fridays and Saturdays differently than Sundays through Thursdays).
Total Friday/Saturday stints (24) ÷ Sampled stints (12) = Stint Weight (2.0)
Total Sunday - Thursday stints (60) ÷ Sampled stints (12) = Stint Weight (5.0)
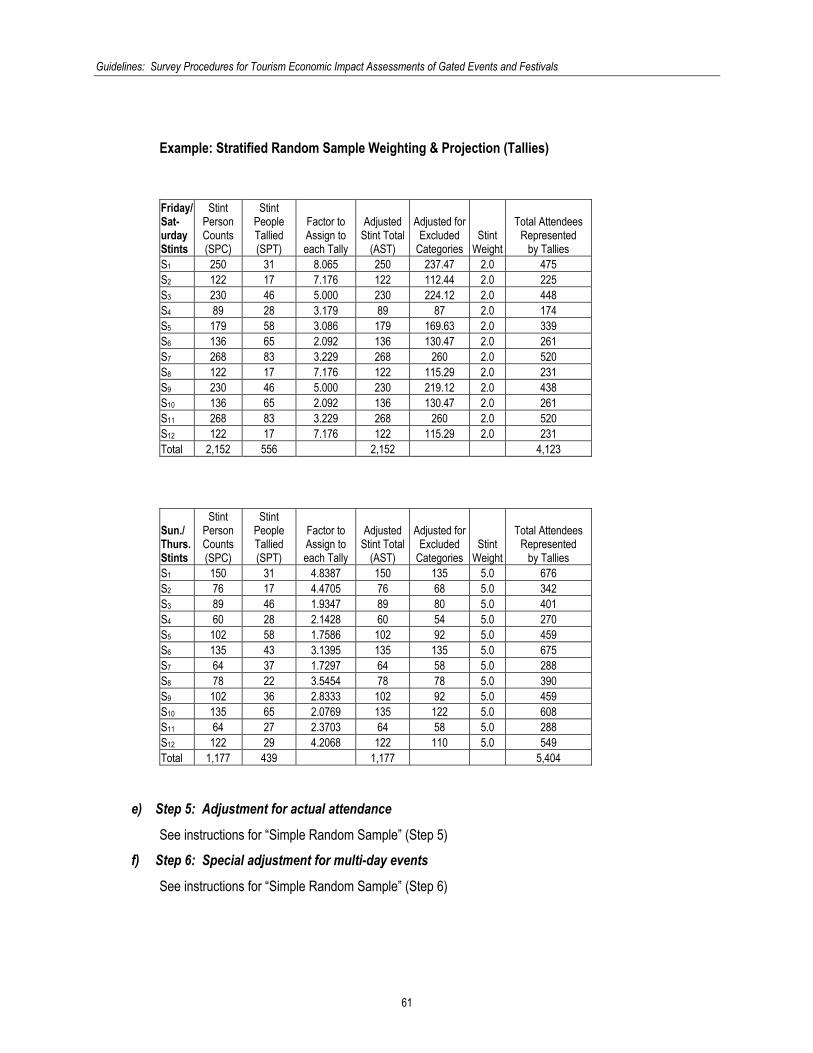
Guidelines: Survey Procedures for Tourism Economic Impact Assessments of Gated Events and Festivals
61
Example: Stratified Random Sample Weighting & Projection (Tallies)
Friday/ Sat-urday Stints
Stint Person Counts (SPC)
Stint People Tallied (SPT)
Factor to Assign to each Tally
Adjusted Stint Total
(AST)
Adjusted for
Excluded Categories
Stint Weight
Total Attendees
Represented by Tallies
S1 250 31 8.065 250 237.47 2.0 475 S2 122 17 7.176 122 112.44 2.0 225 S3 230 46 5.000 230 224.12 2.0 448 S4 89 28 3.179 89 87 2.0 174 S5 179 58 3.086 179 169.63 2.0 339 S6 136 65 2.092 136 130.47 2.0 261 S7 268 83 3.229 268 260 2.0 520 S8 122 17 7.176 122 115.29 2.0 231 S9 230 46 5.000 230 219.12 2.0 438 S10 136 65 2.092 136 130.47 2.0 261 S11 268 83 3.229 268 260 2.0 520 S12 122 17 7.176 122 115.29 2.0 231 Total 2,152 556 2,152 4,123
Sun./ Thurs. Stints
Stint Person Counts (SPC)
Stint People Tallied (SPT)
Factor to Assign to each Tally
Adjusted Stint Total
(AST)
Adjusted for
Excluded Categories
Stint Weight
Total Attendees
Represented by Tallies
S1 150 31 4.8387 150 135 5.0 676 S2 76 17 4.4705 76 68 5.0 342 S3 89 46 1.9347 89 80 5.0 401 S4 60 28 2.1428 60 54 5.0 270 S5 102 58 1.7586 102 92 5.0 459 S6 135 43 3.1395 135 135 5.0 675 S7 64 37 1.7297 64 58 5.0 288 S8 78 22 3.5454 78 78 5.0 390 S9 102 36 2.8333 102 92 5.0 459 S10 135 65 2.0769 135 122 5.0 608 S11 64 27 2.3703 64 58 5.0 288 S12 122 29 4.2068 122 110 5.0 549 Total 1,177 439 1,177 5,404
e) Step 5: Adjustment for actual attendance
See instructions for “Simple Random Sample” (Step 5) f) Step 6: Special adjustment for multi-day events
See instructions for “Simple Random Sample” (Step 6)

Guidelines: Survey Procedures for Tourism Economic Impact Assessments of Gated Events and Festivals
62
3. Estimating attendance by place of residence
Now that you know how many attendees each party in your tally represents, you are ready to estimate the proportion of attendees from various origin groups. This is a critical element in generating reliable inputs for economic impact estimation. In other words, these are the numbers you went to all the trouble to obtain by sampling, counting, tallying, weighting and projecting.
Once you have calculated the total attendees for each type of stint, you would determine how many of the projected and weighted tallied individuals are local residents, non-locals from other parts of the community’s province or state; from other provinces or states, and from foreign countries. Some of the people who enter your event during a stint may be counted by the counter, but will be staff members, merchants, participants or volunteers. In the exclusion weight, you will adjust your estimates to exclude these attendees.
These ratios are required in order to estimate how much spending at your event derives from the local community and how much is coming in from other places. As shown below for 2 sample stints, the number of attendees from each origin in each stint is multiplied by all the weights to arrive at the final ratios.
Once you have converted your stint parties to people, you would calculate the share each stint represents of total attendance for each origin group included in your tally sheet.
The Calculation:
People Tallied by Place of Origin * Stint Count Weight * Exclusion Weight * Stint Weight * Attendance Weight
Stint Tallied
Attendees Stint Count
Weight
Exclusion
Weight
Stint
Weight
Attendanc
e Weight
Weighted, Projected Attendees
S1 Total 31 8.065 .998 2.545 1.097258 697 S1 Local 20 8.065 .998 2.545 1.097258 450 S1 Non-local – Same
Province/State 9 8.065 0 2.545 1.097258
203 S1 Other Provinces/ States 1 8.065 0 2.545 1.097258 23 S1 Other Country 1 8.065 0 2.545 1.097258 23 S2 Total 17 7.176 .999 2.545 1.097258 340 S2 Local 10 7.176 .999 2.545 1.097258 200 S2 Non-local – Same
Province/State 3 7.176 0 2.545 1.097258
60 S2 Other Provinces/ States 2 7.176 0 2.545 1.097258 40 S2 Other Country 2 7.176 0 2.545 1.097258 40 Repeat for each stint

Guidelines: Survey Procedures for Tourism Economic Impact Assessments of Gated Events and Festivals
63
In this example, of the 1,037 weighted, projected attendees 63% were residents of the local community, 25% came from other parts of the province or state, 6% live in other provinces or states, and 6% live in foreign countries. When you go through these procedures, you would calculate the total visitation by origin for all stints.
Weighted, Projected Visitors, Stints 1, 2 by Place of Residence Place of Residence Stint 1 Stint 2 Total Percent Total (All) 697 + 340 = 1,037 100% Local 450 + 200 = 650 63% Non-local – Same Province/State 203 + 60 =263 25% Other Provinces/ States 23 + 40 = 63 6% Other Country 23 + 40 = 63 6%
4. What do you do with the ratios by place of residence?
You will apply the ratios by place of residence to the information you collect on spending and other characteristics of the trip that brought the person to the community and the event. In turn, these ratios will enable you to calculate total spending at the event and in the community and to determine how much of this spending is incremental because the event attracted tourists to the community [Note: an extra procedure is required to estimate unique attendees if yours is a multi-day event. See below for details].
5. Step 6: special adjustment for multi-day events
A person who comes to your multi-day event on only one day has a different opportunity to be counted and tallied than does someone who comes on more than one day. Let’s assume your event lasts for three days (Friday through Sunday). The household party that only comes on Friday has no chance of being counted and tallied on Saturday or Sunday but the household party who comes on Friday and Saturday could be counted and tallied on both days.
To estimate the number of unique household parties that attended your event over its full duration, you need to adjust for the number of different days the same household party might attend. It is for this reason that the Tally Questionnaire asks you to collect information on the number of different days the household party has or plans to come to your event.
You need an estimate of the number of different people who came to your event over its full course to estimate the amount of spending your event generated because in the Attendee Survey, respondents are asked to report their spending on-site and in your community for the full duration of their stay and all their visits to your event. Consequently, you must divide your
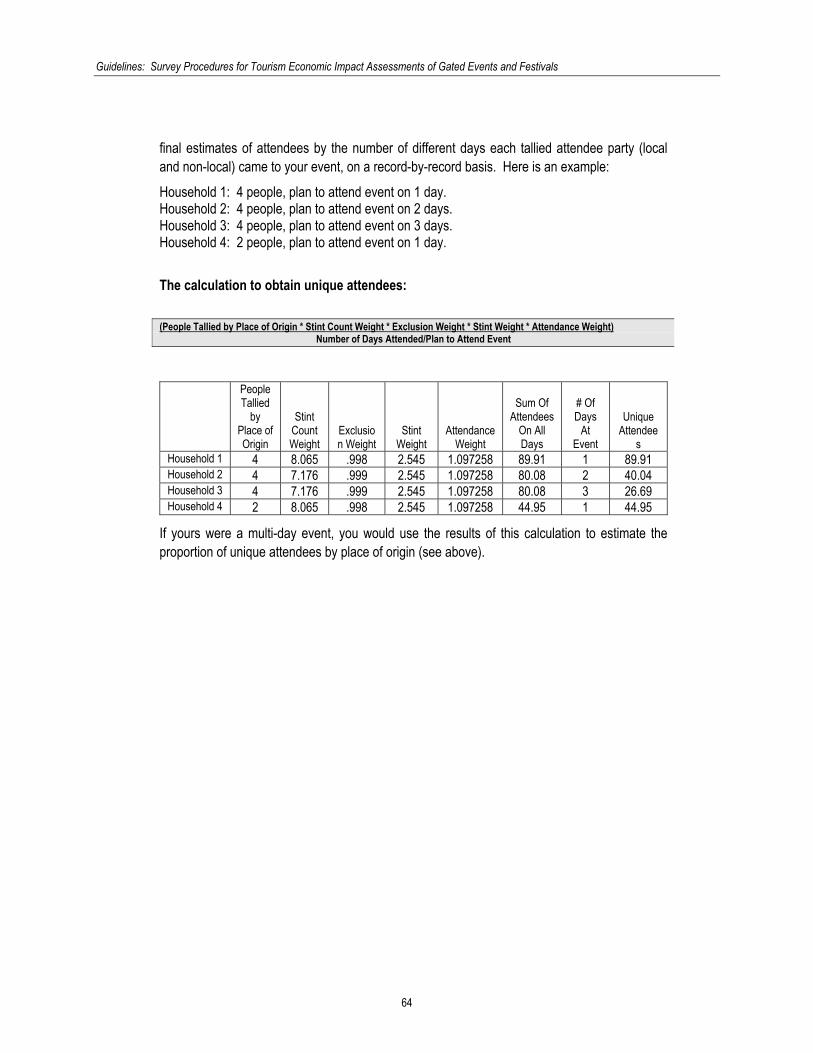
Guidelines: Survey Procedures for Tourism Economic Impact Assessments of Gated Events and Festivals
64
final estimates of attendees by the number of different days each tallied attendee party (local and non-local) came to your event, on a record-by-record basis. Here is an example: Household 1: 4 people, plan to attend event on 1 day. Household 2: 4 people, plan to attend event on 2 days. Household 3: 4 people, plan to attend event on 3 days. Household 4: 2 people, plan to attend event on 1 day.
The calculation to obtain unique attendees: (People Tallied by Place of Origin * Stint Count Weight * Exclusion Weight * Stint Weight * Attendance Weight)
Number of Days Attended/Plan to Attend Event
People Tallied
by Place of Origin
Stint Count Weight
Exclusion Weight
Stint Weight
Attendance Weight
Sum Of Attendees
On All Days
# Of Days
At Event
Unique Attendee
s Household 1 4 8.065 .998 2.545 1.097258 89.91 1 89.91 Household 2 4 7.176 .999 2.545 1.097258 80.08 2 40.04 Household 3 4 7.176 .999 2.545 1.097258 80.08 3 26.69 Household 4 2 8.065 .998 2.545 1.097258 44.95 1 44.95
If yours were a multi-day event, you would use the results of this calculation to estimate the proportion of unique attendees by place of origin (see above).

Guidelines: Survey Procedures for Tourism Economic Impact Assessments of Gated Events and Festivals
65
V. THE TALLY INTERVIEW PROCESS
A. The interviewers
1. A critical component of the research process
Interviewers are a critical component of the research process. They are the link between what you need to know from your attendees and what you find out about them (characteristics, spending, etc.). If interviewers do a good job, the quality of your information improves. If they do a poor job, the quality of your information deteriorates.
In the following sections, general principles for selection, training and supervision are provided but you are encouraged to find additional resources to ensure that your interviewers are in the best possible position to do a “good job”. For additional information on these topics, contact your local economic development office, local colleges or universities, and/or research professional organizations such as the Travel and Tourism Research Association (TTRA, www.ttra.com), Marketing Research and Intelligence Association (Canada) (MRIA, www.mria-arim.ca), or Marketing Research Association (U.S.A.) (MRA,, www.mra-net.org).
2. Selecting interviewers
Whether you use local volunteers who will conduct the surveys, hire students or other local people or use professionally trained interviewers, the people involved in the survey process at your event should have the following characteristics*: Good communication skills: enunciate well, use language appropriate for interviewing
visitors. Good interpersonal relations skills. Be socially mature. Be friendly and outgoing. Be good at keeping conversations on track. Be good independent workers with a strong work ethic. Be able and willing to work irregular hours (such as evenings or weekends). Be comfortable using computer programs for data entry and record keeping if this will be
part of their work. *List from A Guide To Designing and Conducting Visitor Surveys, Julie Leones, Arizona Cooperative Extension, College of Agriculture, The University of Arizona, September 1998
3. Training interviewers
a) Two basic types of training
Two basic types of interviewer training are required:
Type I: general understanding of the survey process, the objectives of the study, general deportment, the importance of administering the questionnaire exactly as it is written, and how to
Guidelines: Survey Procedures for Tourism Economic Impact Assessments of Gated Events and Festivals
66
handle “difficult respondents” and unforeseen circumstances. Type II: familiarity with the survey instruments, including practice interviews to ensure that interviewers are conversant with the language and flow of the questions, skip patterns, and response categories, respondent selection guidelines, etc.
b) A training plan
Interviewing is harder than you might think! While these guidelines provide some training tips, we strongly suggest that you develop and implement an interviewer training plan, particularly if you will be relying on interviewers who have limited or no prior experience. The following list* covers some Type I and Type II elements required of a training plan. Explain the objectives of the study and what the main questions are that you wish to answer. Go through the survey instrument thoroughly. Have the interviewer practice interviewing you and other interviewers before interviewing a
visitor. Train interviewers in the use of the data entry program you are using and have written
instructions on how to use the program (if appropriate). Show interviewers how to save data files and help them understand how and why to make
back up copies of data files. Teach interviewers about the different components of an interview. Explain to interviewers that how they ask questions will affect response. Train them in good interviewing technique (see next section). Show the interviewers what records they must keep and why these are important.
*List from A Guide To Designing and Conducting Visitor Surveys, Julie Leones, Arizona Cooperative Extension, College of Agriculture, The University of Arizona, September 1998
4. Supervision
An on-site supervisor must be available to interviewers at all times. More than one supervisor may be required on-site, depending on how large the site is and how many interviewer crews are working at any one time. A supervisor’s tasks would include the following*: Ensure that the required numbers of interviewers are at their designated locations at the
correct times. Circulate among survey locations. Collect and check their data files regularly. Monitor them at work periodically. Encourage them to find ways to do the survey more efficiently or effectively. Praise and reward them for good work. Warn them and then help them if they are having trouble doing the work involved. Give them some flexibility with regard to the days and hours that they work.
*List from A Guide To Designing and Conducting Visitor Surveys, Julie Leones, Arizona Cooperative Extension, College of Agriculture, The University of Arizona, September 1998

Guidelines: Survey Procedures for Tourism Economic Impact Assessments of Gated Events and Festivals
67
B. Interviewing
1. Conducting the interview
a) Identification and support materials
Interviewers require some form of “official identification” (i.e., photo-ID badge or letter from event organizers indicating that they are conducting an official survey with the sanction of the event). You might also consider some form of “uniform”. This can be a printed t-shirt, smock or cap with “Official Survey” or a similar identifying label so attendees can readily identify them.
Because interviewers will “look” official, attendees may approach them to obtain information about the event. Consequently, you should provide interviewers with a site map and general knowledge about the locations of key amenities (food services, washrooms, etc.). Event organizers should brief the interviewers and provide them with appropriate materials so they can answer basic questions.
Interviewers also require a way to contact a supervisor or event organizer (e.g., cell phone number) in case a respondent wants to call to verify that interviewers are bona fide, if they are experiencing difficulties with a respondent, or in the case of an emergency.
b) Some basic interviewing techniques
As noted above, the success of your study hinges on the interaction between the interviewer and the respondent. Consequently, we recommend that you invest in interviewer training by professionals. These professionals can amplify on the points raised below* and customize the training to match your survey materials (sampling plan, questionnaires, etc.).
1. An interview consists of three basic parts: an introduction, the interview proper and the end.
In the introduction, you need to introduce yourself, explain what the survey is about, who is sponsoring it and how long it takes to complete it. Then you need to ask the person if they would be willing to be interviewed.
In the interview proper, you need to carefully follow the questionnaire format provided.
The end of the interview involves thanking the respondent for their time and bidding them good-bye. If you have an incentive of some sort to give them, this is the time to present it. It is also a good time to provide any information that the respondent may want concerning area attractions, lodging, shopping or restaurants. Make sure that you have been provided with information about these amenities so that you can pass information on to respondents.
2. Try to keep the interview as conversational as possible, but do not modify the question wording. However, if it is clear that the person did not understand the question, rephrase the

Guidelines: Survey Procedures for Tourism Economic Impact Assessments of Gated Events and Festivals
68
question or ask it in a different way.
3. If you are not sure you have understood the response or the response is incomplete, try one of the following techniques:
rephrase what the person has said, say it to them, and ask them if you understood them correctly. For example, "I understood you to say that you are just passing through the area, is that correct?"
ask the person if they can rephrase their comment or explain further. For example, "Can you tell me a little more about why you are visiting our area?"
4. Use responses from earlier questions to check responses of later responses, especially in the expenditure section. For example, you are asking about other expenses and the person gives you a very low estimate. You might ask: "Does that include the admission fees to the attractions that you mentioned visiting earlier?"
5. Be careful how you ask follow up questions to make sure that they are not insinuating something or suggesting a certain response. Leading questions or a leading tone of voice can bias responses to a question. As much as possible, ask questions in a neutral way since there are no right or wrong answers to the questions.
6. You may need to develop methods for getting respondents back on track if they begin talking in detail after one particular question. For example, a respondent is going on in detail about how much they are enjoying their trip. The interviewer might affirm what they say and move on to the next question: "I am glad you are having a good time in our community, how many nights are you planning to stay?"
7. Interviewers need good listening skills. This includes paying careful attention to what people say, looking alert and interested in the interview, giving appropriate verbal and nonverbal cues that show that you are interested and paying attention. *From A Guide To Designing and Conducting Visitor Surveys, Julie Leones, Arizona Cooperative Extension, College of Agriculture, The University of Arizona, September 1998
2. Stopping an attendee to ask questions using a selection interval (every nth)
When approaching people as they enter the event, interviewers need to do so in a “random” manner. Randomness at the respondent selection stage is very important to ensure that the final sample you include in your study is representative of all types of attendees (those who look friendly and those who don’t look so friendly, those with and without young children, old and young, etc.). The easiest way to achieve randomness at the selection stage is to have the tally interviewer approach every nth (e.g., every 5th) person as he/she enters the event and attempt to obtain this person’s cooperation.
The number of people stopped should follow a fixed interval in order to randomize the sample of people who are included in the tally process. By instructing interviewers to select every nth person, you will insure all types of attendees are included in the tally – not just the ones that look

Guidelines: Survey Procedures for Tourism Economic Impact Assessments of Gated Events and Festivals
69
friendly or easy to approach.
If entry flows are very brisk at a gate, the interval could be every 3rd or every 5th person that enters. If, however, the entry flow is very slow, the tally interviewer could be instructed to approach “the next” individual who enters after the previous tally questionnaire is completed.
3. The tally unit is a household party
Even though the interviewer will approach a person, the unit for collecting tally information is the household party. Thus, once the interviewer has secured the attention of the person, he or she will ask that this person and others in the immediate group step out of the flow of traffic for the interview. The tally questionnaire will aid the interviewer in determining how many different people are in the respondent’s household party. Each tally interview should represent all people in the household party (people who live in the same permanent residence and came to the event together).
4. The tally questionnaire
a) General comments for recruiting Attendees for the Attendee Survey
In the tally interview, you will obtain the information you require to weight and project the information you collect from your Attendee Survey. We also recommend that you use the tally interview to recruit respondents for the Attendee Survey. Questions associated with the recruitment task included in the tally questionnaire will vary somewhat, depending on how you plan to undertake the Attendee Survey. Different approaches to identifying the sample for the Attendee Survey are listed below. Each will require customized questions or descriptions of procedures in the tally interview.
TAG If you plan to select and “tag” attendees when they enter the event so that you can conduct a face-to-face interview with the individual as he/she exits the event, your tally interview would include a question about permission to provide an identifying tag and instructions about interview locations on the site.
TELEPHONE CALL-BACK If you plan to obtain a telephone number and call the respondent back when he/she returns home to conduct the Attendee Survey by telephone, you would have statements that describe this procedure to potential respondents.
ON-SITE RANDOM SELECTION If you plan to approach attendees on a random basis on the site during the course of the event to conduct the Attendee Survey, you require a separate stint sampling plan for the Attendee Survey.
SELF-COMPLETION MAILBACK questionnaires can be distributed as attendees enter or exit the site or mailed to them at their place of residence. The system of “returns” can be drop-offs on site, by return mail or on a website. Follow-up with telephone calls or e-mails to non-responders is generally required to ensure sufficiently high response rates to the self-completion questionnaire.
Guidelines: Survey Procedures for Tourism Economic Impact Assessments of Gated Events and Festivals
70
WEB SURVEY A website on which the Attendee Survey has been mounted can be constructed. Respondents would be given the site’s unique web address and asked to complete the survey once they have access to a computer.
The basic elements of the Tally Questionnaire are the same, no matter which approach to the Attendee Survey you adopt.
b) Paper & pencil or computers
Tally Questionnaires can be “paper and pencil”, with interviewers recording the information on printed sheets for subsequent data entry and tabulation or they can be pre-programmed into hand-held or laptop computers. The availability of equipment, weather and site conditions will determine the most effective way to administer the Tally Questionnaire. Remember that if you use a “paper and pencil” approach, you will require the tools and expertise to input tally data into a software system that will permit the weighting and projection of this information.
c) Sample questionnaire and tally sheet
Sample on-site tally questionnaires and tally sheets are provided in Appendix VI (under separate cover).
5. Required tally Information
a) Stint identification
Every assigned stint in your study should have a unique number. This number should be recorded on each tally sheet and each set of materials provided for counting entrants.
b) Interviewer Identification
The interviewer’s name should be recorded on each tally sheet for quality control.
c) Refusals
You must be able to measure the response rate to the tally process. Thus, you must have a mechanism in the tally process to record the number of people who decline/refuse your efforts to interview them as they enter the site.
d) Map
Each tally interviewer should have a map that clearly identifies the area you consider to be local. Key landmarks within and outside the local borders might be marked on the map to help people
from outside the local area understand the local geography. A map with clear boundaries of the areas for which you plan to estimate economic impact is an essential component of the research process.

Guidelines: Survey Procedures for Tourism Economic Impact Assessments of Gated Events and Festivals
71
e) Greeting
To start the interview, the interviewer requires a script. The following sample would be customized to the particulars of your event.
Hi, my name is XXXX INTERVIEWER’S FIRST NAME. Welcome to NAME EVENT. Before you start your visit here today, I’d like to ask you just a few questions so we can learn more about who is coming to this event. (TO TAKE RESPONDENT OUT OF TRAFFIC FLOW: Could you and others who are here with you today just step aside for a couple of minutes?)
f) Previous tally
In order to ensure that the respondent has not been interviewed elsewhere on the site on the same day, you need to ask this type of question. If your event has only one point of entrance, you might consider excluding this question.
If a respondent has already been interviewed, the interviewer should thank the respondent and politely terminate the interview.
Have you already been stopped to answer questions about NAME EVENT today?
No [ ] Yes [ ] IF YES, THANK RESPONDENT & TERMINATE
g) A special note about “Previous Tally”
These guidelines provide an Attendee Survey design that captures all spending on the site and all spending for the stay in the community by attendees for all of their visits to the site and for the full duration of their stay. Attendees will be counted and tallied independently on each day they attend the event but would be asked to complete only ONE Attendee Survey, covering the full duration of their stay in the community. If local residents are included in the Attendee Survey, they too will be asked to complete only one Attendee Survey for all the days they visited the event’s site.
h) Gate & time of entry
This question is required only if you conduct tally interviews at on-site locations such as refreshment kiosks, washroom line-ups, bleachers, etc. The information is necessary to link the tallied party to entry counts for the event.
At which location and time did you first enter the site today?
Location (pre-list to correspond to entry gates) Time Period (pre-list to correspond to stint time periods)

Guidelines: Survey Procedures for Tourism Economic Impact Assessments of Gated Events and Festivals
72
i) Place of residence - local
It is critical that you are able to distinguish local residents and non-locals in the tally and Attendee Surveys. Thus, particular attention should be paid to collecting place of residence information completely and accurately. Is XXXX (NAME CITY/TOWN IN WHICH EVENT IS TAKING PLACE ) your permanent place of residence (SHOW MAP*)?
No [ ] (These people would be asked city/town, postal code and out-of-town trip questions.)
Yes [ ] (These are Locals and would NOT be asked city/town, postal code or out-of-town trip questions.)
*The map should display clear boundaries of what the event has defined to be the “local area”.
j) Place of residence - other
IF RESPONDENT LIVES OUTSIDE CITY/TOWN OF EVENT, ASK: In which city/town, province/ state/country is your permanent residence? IF CANADA OR USA, ASK: And what is your postal/zip code?
City/Town __________ Province/State __________ Country __________
IF CANADA/USA: Postal/Zip Code __________
k) Identifying tourists and overnight tourists
IF RESPONDENT LIVES OUTSIDE CITY/TOWN OF EVENT, ASK: Are you on an out-of-town trip from your permanent place of residence?
No [ ] Yes [ ]
IF YES, ASK: Have you or will you be spending at least one night away from home on this trip?
No [ ] Yes [ ]
l) Household party size
The unit of selection for the tally process is a “household party”. It is necessary to collect the number of people included in this household party and the class of ticket they purchased (in order to match the units of tickets sold).
A household party is a group of people who enter the site together and who live in the same household. As the spokesperson for this party (respondent), you will need to identify an individual who is best able to report on spending for all members of the party.
Some examples are provided on the following page.
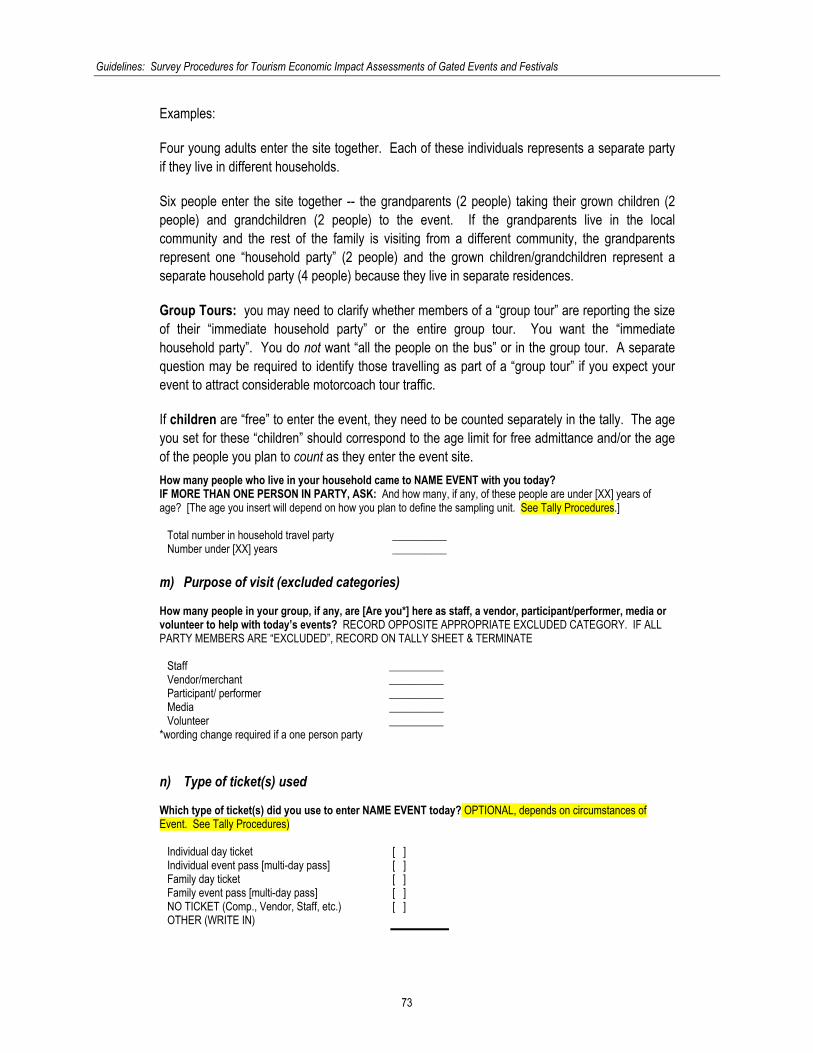
Guidelines: Survey Procedures for Tourism Economic Impact Assessments of Gated Events and Festivals
73
Examples:
Four young adults enter the site together. Each of these individuals represents a separate party if they live in different households.
Six people enter the site together -- the grandparents (2 people) taking their grown children (2 people) and grandchildren (2 people) to the event. If the grandparents live in the local community and the rest of the family is visiting from a different community, the grandparents represent one “household party” (2 people) and the grown children/grandchildren represent a separate household party (4 people) because they live in separate residences.
Group Tours: you may need to clarify whether members of a “group tour” are reporting the size of their “immediate household party” or the entire group tour. You want the “immediate household party”. You do not want “all the people on the bus” or in the group tour. A separate question may be required to identify those travelling as part of a “group tour” if you expect your event to attract considerable motorcoach tour traffic.
If children are “free” to enter the event, they need to be counted separately in the tally. The age you set for these “children” should correspond to the age limit for free admittance and/or the age of the people you plan to count as they enter the event site. How many people who live in your household came to NAME EVENT with you today? IF MORE THAN ONE PERSON IN PARTY, ASK: And how many, if any, of these people are under [XX] years of age? [The age you insert will depend on how you plan to define the sampling unit. See Tally Procedures.]
Total number in household travel party __________ Number under [XX] years __________
m) Purpose of visit (excluded categories)
How many people in your group, if any, are [Are you*] here as staff, a vendor, participant/performer, media or volunteer to help with today’s events? RECORD OPPOSITE APPROPRIATE EXCLUDED CATEGORY. IF ALL PARTY MEMBERS ARE “EXCLUDED”, RECORD ON TALLY SHEET & TERMINATE
Staff __________ Vendor/merchant __________ Participant/ performer __________ Media __________ Volunteer __________
*wording change required if a one person party
n) Type of ticket(s) used
Which type of ticket(s) did you use to enter NAME EVENT today? OPTIONAL, depends on circumstances of Event. See Tally Procedures)
Individual day ticket [ ] Individual event pass [multi-day pass] [ ] Family day ticket [ ] Family event pass [multi-day pass] [ ] NO TICKET (Comp., Vendor, Staff, etc.) [ ] OTHER (WRITE IN)
Guidelines: Survey Procedures for Tourism Economic Impact Assessments of Gated Events and Festivals
74
o) Number of days have/plan to attend event
IF MULTI-DAY EVENT: NAME EVENT lasts for X days. Over the full course of the event, on how many different days have you/do you plan to attend, counting today’s visit?
WRITE IN NUMBER OF DAYS
DON’T KNOW/CAN’T ESTIMATE [ ]
C. Recruitment for attendee survey
1. Additional questions required in tally interview
If you were planning to use the tally procedure to recruit participants for the Attendee Survey, you would add the appropriate “recruitment” questions at the end of the tally questionnaire.
We recommend that you distribute a self-completion questionnaire to attendees as they are tallied and collect the completed questionnaire as people exit the site for the last time or return via the mail (you need to provide postage paid envelopes for them, ensuring that the postage is appropriate to the country from which they may mail the completed questionnaire – e.g., Canada or USA postage).
This method is recommended because it is the most efficient way to obtain Attendee Surveys from “hard to find” attendees (e.g., tourists) and involves the least investment in interviewer time, training and supervision.
If you plan to collect completed Attendee Surveys as people exit your event, you will require collection receptacles and staff at exit points reminding attendees who might have been given surveys to complete and leave them at the site. Ideally, you would have tables and chairs in a protected area near points of exit so that exiting attendees can complete the questionnaire just before they leave. A “Complete your Survey Here” sign would also encourage attendees to stop and complete the questionnaire before they leave the site. A supply of pencils should also be available.
2. Incentives
To enhance your response rate, we recommend that you offer an incentive to people who complete and return the Attendee Survey. The incentive could take the form of a souvenir of the event itself, a small cash gift (e.g., $1.00), or a chance to win a prize in a “lucky draw”. Local merchants can often be called upon to provide souvenirs or prizes. To ensure responses that are not biased, avoid incentives that not all visitors would enjoy equally (i.e., golf clubs, tickets to an out of town event, etc.).
Guidelines: Survey Procedures for Tourism Economic Impact Assessments of Gated Events and Festivals
75
3. Recruitment for self-completion attendee survey at tally stage
We recommend that you have two versions of the Attendee Survey questionnaire: one for people who live in the local community and a different one for tourists.
If you have selected a distribution interval such that every 5th or every 10th local household party would be asked to complete the Attendee Survey, tally interviewers will have to keep track of the interval as they distribute questionnaires.
Because tourists are generally harder to find at an event than locals, you may wish to distribute an Attendee Questionnaire to all tourists.
Because we recommend that different Attendee Questionnaires be used for local and tourist household parties, interviewers will have to check the place of residence question in the tally interview to determine which script to use and which questionnaire version to distribute.
Each Attendee Questionnaire should be pre-numbered with a unique identification number (ID). This number would be recorded on the Tally Sheet as the questionnaire is distributed. The purpose of this unique ID number is to permit you to know who did and who did not return a completed questionnaire. Those who did not return a questionnaire would be re-contacted by telephone or email and encouraged to complete and return the survey.
Because different questionnaire versions are recommended for local and tourist parties, we suggest that you pre-number each version of Attendee Questionnaires using a different series (e.g., L-0023 for a “local” and T-0045 for a “tourist”).
a) Recruitment questions for locals at single day event
ASK EVERY nth LOCAL: In order for us to learn more about your reactions to NAME EVENT and your spending here, would the person most able to report on spending for all people in your household please complete this short survey just before you leave the site today? You can drop the completed questionnaire in one of the specially labelled boxes near the exits or return it to us by mail in the postage paid envelope we have provided. IF THERE IS AN INCENTIVE, CONSTRUCT THE APPROPRIATE STATEMENT: As a thank you for your cooperation, once we have your completed survey, we will provide you with/ you will have a chance to win [NAME PRIZE], etc.
Refuses to accept questionnaire [ ] Accepts questionnaire [ ] RECORD UNIQUE ID FROM
Q’AIRE ON TALLY SHEET IF ACCEPTS: Could I please have a local telephone number and the first name of the person who will complete this survey, just in case we have to follow-up on any of your answers? RECORD LOCAL PHONE NUMBER RECORD FIRST NAME OF RESPONDENT
Guidelines: Survey Procedures for Tourism Economic Impact Assessments of Gated Events and Festivals
76
b) Recruitment questions for non-locals at single day event
NON-LOCAL: In order for us to learn more about your reactions to NAME EVENT and spending on your trip, would the person most able to report on spending for all people in your household who are on the trip with you please complete this short survey just before you leave the site today? You can drop the completed questionnaire in one of the specially labelled boxes near the exits or return it to us by mail in the postage paid envelope we have provided. IF USING AN INCENTIVE, CONSTRUCT THE APPROPRIATE STATEMENT: As a thank you for your cooperation, once we have your completed survey, we will provide you with/ you will have a chance to win [NAME PRIZE], etc.
Refuses to accept questionnaire [ ] Accepts questionnaire [ ] RECORD UNIQUE ID FROM
Q’AIRE ON TALLY SHEET IF ACCEPTS: Could I please have a telephone number (including area code) where I can reach you at home and the first name of the person who will complete this survey, just in case we have to follow-up on any of your answers? RECORD PHONE NUMBER RECORD FIRST NAME OF RESPONDENT
c) Recruitment questions at multi-day event
IF MULTI-DAY EVENT: Have you or has anyone else in your household party received a questionnaire to complete, either today or on a previous day you came to the event?
No [ ] GO TO NEXT QUESTION Yes [ ] You need only complete one questionnaire for all your visits to this
event. Thank you for your cooperation and enjoy your stay here today.
Recruitment Questions for Non-Locals at multi-day event
In order for us to learn more about your reactions to NAME EVENT and spending on your trip, would the person most able to report on spending for all people in your household who are on the trip with you please complete this short survey just before you leave the site today? You can drop the completed questionnaire in one of the specially labelled boxes near the exits or return it to us by mail in the postage paid envelope we have provided. IF USING AN INCENTIVE, CONSTRUCT THE APPROPRIATE STATEMENT: As a thank you for your cooperation, once we have your completed survey, we will provide you with/ you will have a chance to win [NAME PRIZE], etc.
Refuses to accept questionnaire [ ] Accepts questionnaire [ ] RECORD UNIQUE ID FROM
Q’AIRE ON TALLY SHEET IF ACCEPTS: Could I please have a telephone number (including area code) where I can reach you at home and the first name of the person who will complete this survey, just in case we have to follow-up on any of your answers? RECORD PHONE NUMBER RECORD FIRST NAME OF RESPONDENT
Guidelines: Survey Procedures for Tourism Economic Impact Assessments of Gated Events and Festivals
77
Recruitment Questions for Locals at multi-day event
LOCAL: In order for us to learn more about your reactions to NAME EVENT and spending at this event, would the person most able to report on spending for all people in your household who came to this event with you please complete this short survey just before you leave the site today? You can drop the completed questionnaire in one of the specially labelled boxes near the exits or return it to us by mail in the postage paid envelope we have provided. IF USING AN INCENTIVE, CONSTRUCT THE APPROPRIATE STATEMENT: As a thank you for your cooperation, once we have your completed survey, we will provide you with/ you will have a chance to win [NAME PRIZE], etc.
Refuses to accept questionnaire [ ] Accepts questionnaire [ ] RECORD UNIQUE ID FROM
Q’AIRE ON TALLY SHEET IF ACCEPTS: Could I please have a telephone number (including area code) where I can reach you at home and the first name of the person who will complete this survey, just in case we have to follow-up on any of your answers? RECORD PHONE NUMBER RECORD FIRST NAME OF RESPONDENT

Guidelines: Survey Procedures for Tourism Economic Impact Assessments of Gated Events and Festivals
78
VI. COUNTING ATTENDEES
A. Units for counters
If you are using turnstiles, it is likely that all entrants to your site will pass through the turnstile. Thus, your counts would likely include adults and children. When reconciling tally information and entry counts, you will need to keep this fact in mind.
If you are collecting ticket stubs as a way of counting attendees, you need to determine if you are going to keep a stub for all entrants or for adults only. When reconciling tally information and entry counts, you will need to use the same unit you used for ticket stubs.
If you are assigning interviewers to count entrants during a sample of stints, you must provide them with clear direction about who to count – adults or all entrants, including children. You would use the same units for projecting your tally interview data to total attendance.
B. Stint-by-stint counts
Regardless of how you count entrants to the event, you must keep track of the counts by stint.
TURNSTILES If you are using turnstiles, you would obtain the count reading on the turnstile at the beginning and end of each stint. Ideally, you would collect this information for stints in which you are tallying and those in which you are not. This information would be used for weighting and projecting the tallied attendees to all people who entered the event during the Tally Stint and for identifying the total number of attendees who entered the event during “similar” stints.
TICKET STUBS If you were collecting tickets as the tool for counting attendees, you would require separate receptacles for tickets that correspond to each stint. The receptacles should be labelled with a unique stint ID. Once the event is over, you would count and record the number of tickets collected on a stint-by-stint basis. This information would be used for weighting and projecting the tallied attendees to all people who entered the event during the Tally Stint and for identifying the total number of attendees who entered the event during “similar” stints.
COUNTERS If you are relying on staff to count entrants during assigned (or all) stints, the staff must record entrants such that the total for each stint can be identified. You can design a simple form for recording this information on a stint-by-stint basis, using the unique stint ID.

Guidelines: Survey Procedures for Tourism Economic Impact Assessments of Gated Events and Festivals
79
VII. ATTENDEE SURVEY ANALYSIS PLAN – NON-LOCALS
A. An overview
Once your Attendee Surveys have been completed, they must be transformed into a data file for tabulation and analysis. The steps in converting questionnaires into spending information for input to a tourism economic impact model are complex. For this reason, we highly recommend that you engage the services of professional research and tabulation experts and provide them with these guidelines to complete this part of the process.
The tasks required to transform questionnaire responses into estimates to be used as inputs to a tourism economic impact model include:
1. Creating a “raw” data file (includes coding, keying, verification)
2. Creating a “clean” data file (includes editing, assignment of information for missing values and distribution of aggregated spending to categories)
3. Assigning reported, allocated or attributed spending to geographic areas
4. Constructing an “Event Account” (identification of spending in the community and larger area that is incremental)
5. Weighting and projecting survey responders to all non-local attendees.
These steps are described in greater detail in the sections that follow. Sample Attendee questionnaires are provided in Appendix VII (under separate cover).
B. Creating a “raw” data file
1. What is a “raw data file”?
A “raw data file” is an electronic version of the information provided by the respondent in a completed questionnaire before any editing or adjustments have been made.
2. Unique respondent ID #
When distributed, every questionnaire should have been given a unique identification number that is recorded on the Tally Sheet (for follow-up with non-responders). You can use this number as the “respondent ID” or you can assign a new number series to all returned questionnaires. Whichever number you decide to use, its data entry is very important for the tabulation and analysis process because the unique respondent ID provides you with a “mailing address” in your data file for each completed survey.

Guidelines: Survey Procedures for Tourism Economic Impact Assessments of Gated Events and Festivals
80
If you do not use the pre-assigned questionnaire number, you can assign consecutive numbers to each questionnaire or you can “group” them by stint, or by type of visitor (local, non-local; overnight or same-day, etc.). For example, you could use the 100 series for locals, the 400 series for non-locals who live in the same province/state as your event, and the 600 series for non-locals who live outside the province/state in which your event takes place. If you group respondent IDs in series, make sure each series will accommodate the number of completions you anticipate receiving for each group. In this example, you could have up to 400 completions with locals, 300 completions with non-locals who live in the same province/state and so on.
Local Non-local – same province/state
Non-local – other
100 . . . 399 400. . . 699 700. . .
3. Usable questionnaires
Not every questionnaire that is returned is “usable”. Some must be discarded from the analysis process because the respondent provided insufficient information for weighting and projection and/or frivolous responses. You should manually review each returned questionnaires to determine how many, if any, have too little information to be kept for analysis. These “unusable returns” should be retained for estimating your response rate (see below) but would not be included in your tabulations.
4. Calculating response rate
The response rate of your Attendee Survey is a measure of how representative your sample of attendees is of all attendees. Thus, at the distribution phase, you would keep track of how many people refused to accept the questionnaire when offered (from Tally Sheet) and, of those who did accept it, how many actually returned it. The final response rate is the total usable returns (“C” in the table below) you obtained divided by the total asked to complete the survey (C ÷ N in the table below).
Total Asked to Complete N (number) Percent Total Acceptors A A ÷ N Total Returners B B ÷ N Total Usable Returns C C ÷ N
For more information on calculating response rates, see Chapter VIII (Documenting the Study Process).
C. Coding survey responses
1. Unique variable addresses in your data file
Responses to each question or “variable” in the questionnaire must be entered into a computer system that will permit you to tabulate and manipulate the results Generally a system of

Guidelines: Survey Procedures for Tourism Economic Impact Assessments of Gated Events and Festivals
81
system that will permit you to tabulate and manipulate the results. Generally, a system of numeric codes is developed to assign a unique “address” to each response category for each question. For example, the Respondent ID might be in Field 001 and be four units long. Thus, a questionnaire with Respondent #0239 would be keyed in Field 001 as 0 2 3 9.
Another example: Attendee Survey question about main mode of transport. You might assign codes 1 through 6 for the listed response categories and a “9” for those who leave the question blank: MAIN TYPE OF TRANSPORTATION (Type used to travel greatest distance on trip)
Assigned Code
Auto/truck/motorhome p 1
Inter-city bus p 2
Train p 3
Airplane p 4
Boat/ship p 5
Other p 6
NOT STATED/BLANK 9
You would enter the appropriate code in the field you have assigned to the Main Mode variable.
You will require a separate field for each variable you plan to examine. This will include each spending category in the on-site and other spending lists in the Attendee Survey.
2. Numeric fields
For response categories such as number of nights and dollars (numeric fields), you would create fields that can accommodate the maximum number of units you expect to be reported. For example, if you expect the number of nights spent by tourists in your community to be no greater than 99, you could use a two-digit field. In this case, a record with three nights in your community would be entered as “03” and a record with 30 nights would be entered as “30”.
You will need to set aside some “codes” for missing information and for “Don’t Know” responses. This information should always be included in your data file. In this example, you might use “98” to represent missing information (an item left blank by the respondent) and “99” for “Don’t Know”.
When setting up numeric fields, be sure to identify the maximum value for the variable in your completed questionnaires so you leave yourself enough room to accommodate the largest value and have some codes available to assign to people who mark “don’t know” and those who provide “no response” to the variable.
3. Developing code lists for geographical units
For variables such as cities, provinces, states and countries, you will likely need to create a “code list” in which you assign numeric values (codes) to the information provided. As a general rule, it is advised that you rely on census geo-codes at the county (census division) and city levels for

Guidelines: Survey Procedures for Tourism Economic Impact Assessments of Gated Events and Festivals
82
the local community and its immediate environs because you will need to be able to sort your respondents into those that live in the local area and those who live outside this area. For locations outside your province or state, it is usually sufficient to code information only at the province, state or country level.
You can always group smaller geographic units together to build larger ones. Consequently, we recommend that you select the smallest possible unit for geo-coding for locations within your own province or state.
4. Data entry & verification
Once questionnaires have been coded, they must be “entered” or “keyed” into a computer system. Because you will be relying heavily on the dollar values reported by respondents and because it is easy to make errors in keying these numbers, we recommend that you “verify” data entry. Verification is the re-entry of the questionnaire data by a different data entry person and a comparison of the two “files”. Any discrepancies between the two files should be resolved by reviewing the actual questionnaire.
5. Keep a copy of the raw data file
Once every usable questionnaire has a unique, electronic “mailing address” and every variable in the questionnaire has a value (code), you have a “raw data file”. Keep a copy of your raw data file in a safe place. Make a copy of this “raw” file to use as your “working file”. In the “working file”, you will clean and edit the data.
D. Creating a “clean” data file
1. Introduction
There are many “editing” procedures required to get your raw data “in shape” to generate the spending estimates necessary to feed a tourism economic impact model. The editing tasks fall into several main categories:
1. Internal consistency 2. Check for reasonable values 3. Replacing missing values and/or distributing “total” values to specific spending
categories
To perform the edits, you need a raw data file that provides all responses for each completed questionnaire, including the unique ID, on a record-by-record basis.
All editing and adjustments to spending are to be completed on unweighted, unprojected data (before you have performed the weighting and adjustment tasks).
2. Internal consistency edits
You need to ensure that respondents answered questions in a consistent manner. For example, if they claim to have spent nights in a paid form of lodging (e.g., hotel), they should have entered

Guidelines: Survey Procedures for Tourism Economic Impact Assessments of Gated Events and Festivals
83
a dollar amount in the lodging category of the spending question. If they did not do this, you will
need to make an adjustment in the data. Similarly, if the total number of people in the household travel party is smaller than the number who are under 18 years of age, an adjustment is required If any adjustments are made (apart from keying errors), they should be recorded as part of the technical documentation for the project, including the original value provided by the respondent, the adjusted value and the unique respondent ID. Keeping a record of changes you make will help you and others understand how you arrived at the final estimates. [See Appendices III and IV for Editing Guidelines]
3. Check for reasonable values
Maximum reasonable values for each item of expenditure should be set. All records that exceed these “reasonable” values should be manually examined to ensure accuracy of data entry and reporting. If any adjustments are made (apart from keying errors), they should be recorded as part of the technical documentation for the project, including the original amount, the adjusted amount and the unique respondent ID.
The duration of the trip, number of nights in the community and other parts of the province or state and the number of days on which a respondent went to your event are included in the questionnaire for two reasons: (1) they provide useful information in their own right and (2) they are tools to help you determine if the values provided by a respondent for on-site and other spending are reasonable. When assessing completed responses for reasonable values, you should take responses to these questions into account.
4. Replacing missing values and distributing “total” values to specific spending categories
Spending estimates to be used as inputs for a tourism economic impact model must be divided into categories of expenditure because different types of spending have different impacts in an economy.
For example, a dollar spent in a grocery store on food has a different economic impact in a community than does a dollar spent in a restaurant on food. Similarly, dollars spent on lodging, various types of transportation, retail and other categories generate different impacts in an economy.
To prepare spending estimates for use in a tourism economic impact model, you need a set of rules to help you divide spending into each of the categories listed in the questionnaire for respondents who were unable or unwilling to divide their spending into the listed categories when they completed their questionnaire. The processes for distributing spending to various categories are referred to as allocation or attribution (see definitions in Section 5, below).
Developing and applying rules to handle each type of spending and each circumstance that can occur when people complete a questionnaire is complex. Why? Because the spending patterns of attendees will differ depending on the nature and duration of their trip, how much information

Guidelines: Survey Procedures for Tourism Economic Impact Assessments of Gated Events and Festivals
84
they provided in the questionnaire and whether they detailed their spending or provided you with “total only”. The patterns and amount of detail provided can vary from respondent to respondent. For more information on how to distribute spending to various categories, see Appendices III, IV.

Guidelines: Survey Procedures for Tourism Economic Impact Assessments of Gated Events and Festivals
85
5. Definitions: reported, allocated and attributed spending
Reported spending is information provided by the respondent and taken directly from the questionnaire “as is”. It includes the total amount spent in the province/state and the portion (%) of this spending, converted to dollars, that the respondent claims to have spent in the local community.
Allocated spending is the distribution you make to various spending categories and/or locations from the “total” dollar amount supplied by the respondent.
Attributed spending is your assignment of spending for various spending categories and to locations for respondents who did NOT provide an indication of how much they spent (i.e., categories and “total” are left blank by the respondent).
E. Assigning spending to geographic areas
Because the costs of a particular item such as accommodation could vary greatly depending on the location in which the expense was incurred (e.g., a hotel night in a major city might cost considerably more than a hotel night in small town), respondents are asked to aid in the assignment process by identifying the proportion of their total spending estimate for a particular category that was attributable to the local community. Not all respondents will provide the proportion (%) of total spending that took place in the local community. Consequently, you will need some assignment principles so that you can assign spending to different locations in a consistent manner. We recommend the following principles:
If the respondent provides guidance about the proportion of expenditures in a particular category that was spent in the local area versus the balance of the province/state, use the respondent’s distribution for each category, with three exceptions: vehicle operations, vehicle rental and domestic carrier fares (see Appendix IV, Section J, Geographic Distribution Tables).
If the respondent does not indicate the proportion of expenditures in the local community (or if dollars had to be allocated to specific expenditure items in cases of ascription or distribution of “total” spending), special rules are required (see Appendix IV, Section J, Geographic Distribution Tables). These rules help you to allocate expenditures to the local community and the balance of the province/state.
All on-site expenditures are assigned to the local community.
F. Constructing “event accounts” (incremental spending)
Once reported, allocated or attributed spending has been assigned to geographic areas, you are ready to isolate the portion of spending that is considered incremental tourism spending. This is the spending that occurred because your event took place. It is the spending you will feed into a tourism economic impact model.

Guidelines: Survey Procedures for Tourism Economic Impact Assessments of Gated Events and Festivals
86
Identifying incremental spending is done on a record-by-record basis, using responses to three questions in the Attendee Survey:
Similar recreational activities in the community (substitution effects);
Trip replacement; and
Importance of your event in destination choice.
1. Two event account columns
Some incremental spending accrues to the local community and other incremental spending accrues to the rest of the community’s province or state. We recommend that you create two “columns” in your Event Account so you can estimate the incremental spending at both the community and provincial or state levels. You can add additional “event accounts”, depending on the number of geographical impact areas you wish to assess. For example, you can add columns to the questionnaire and in the analysis such that you can estimate the tourism economic impact for the local community, county, and state.
2. Substitution effects
If a non-local visitor would have engaged in other similar recreational activities in lieu of going to your event, spending associated with the event is not incremental spending. In other words, it would have occurred irrespective of the event. In this case, the attendee’s spending “on site” would not be included in the “Event Account” (see question from Attendee Survey, below). SIMILAR RECREATIONAL ACTIVITIES IN COMMUNITY If you had not attended [NAME EVENT] on this trip, would you have gone to some other [SIMILAR TYPE OF EVENT] instead? Please refer to the map, if necessary.
IN [NAME COMMUNITY]
IN [OTHER PARTS OF PROV/STATE]
No p p Yes p p Don’t Know p p
3. Trip replacement
If the trip that included a visit to your event displaced a trip that would have taken place within the next three months, no spending is considered incremental because a “similar trip” was replaced by “this” trip (see question from Attendee Survey, below). The time period for a replacement trip or time switchers can vary. Some experts recommend a three-month period (used in these materials), whereas others use a twelve-month period. In designing your survey, you will determine the time span most appropriate for your event and community.
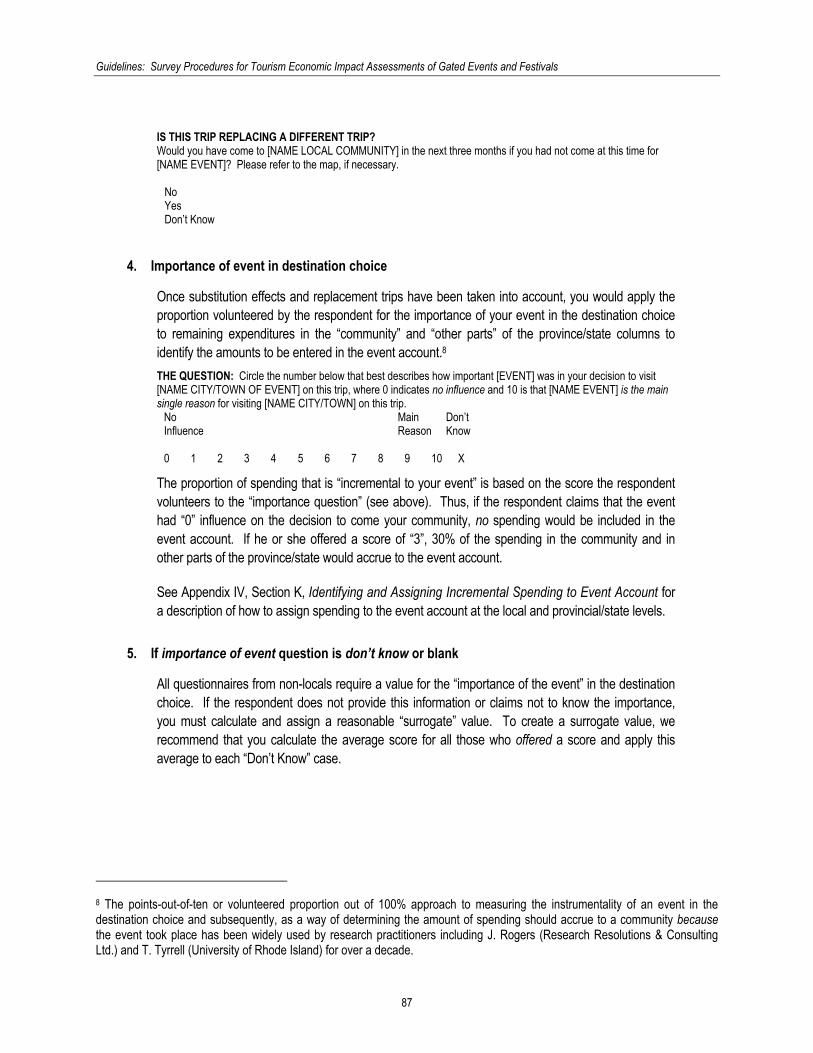
Guidelines: Survey Procedures for Tourism Economic Impact Assessments of Gated Events and Festivals
87
IS THIS TRIP REPLACING A DIFFERENT TRIP? Would you have come to [NAME LOCAL COMMUNITY] in the next three months if you had not come at this time for [NAME EVENT]? Please refer to the map, if necessary.
No p Yes p Don’t Know p
4. Importance of event in destination choice
Once substitution effects and replacement trips have been taken into account, you would apply the proportion volunteered by the respondent for the importance of your event in the destination choice to remaining expenditures in the “community” and “other parts” of the province/state columns to identify the amounts to be entered in the event account.8 THE QUESTION: Circle the number below that best describes how important [EVENT] was in your decision to visit [NAME CITY/TOWN OF EVENT] on this trip, where 0 indicates no influence and 10 is that [NAME EVENT] is the main single reason for visiting [NAME CITY/TOWN] on this trip.
No Influence
Main Reason
Don’t Know
0 1 2 3 4 5 6 7 8 9 10 X
The proportion of spending that is “incremental to your event” is based on the score the respondent volunteers to the “importance question” (see above). Thus, if the respondent claims that the event had “0” influence on the decision to come your community, no spending would be included in the event account. If he or she offered a score of “3”, 30% of the spending in the community and in other parts of the province/state would accrue to the event account.
See Appendix IV, Section K, Identifying and Assigning Incremental Spending to Event Account for a description of how to assign spending to the event account at the local and provincial/state levels.
5. If importance of event question is don’t know or blank
All questionnaires from non-locals require a value for the “importance of the event” in the destination choice. If the respondent does not provide this information or claims not to know the importance, you must calculate and assign a reasonable “surrogate” value. To create a surrogate value, we recommend that you calculate the average score for all those who offered a score and apply this average to each “Don’t Know” case.
8 The points-out-of-ten or volunteered proportion out of 100% approach to measuring the instrumentality of an event in the destination choice and subsequently, as a way of determining the amount of spending should accrue to a community because the event took place has been widely used by research practitioners including J. Rogers (Research Resolutions & Consulting Ltd.) and T. Tyrrell (University of Rhode Island) for over a decade.

Guidelines: Survey Procedures for Tourism Economic Impact Assessments of Gated Events and Festivals
88
G. Weighting and projecting Attendee Survey data
1. Using tally weights
From the Tally/Counting process, you have estimates of the total number of attendees by place of residence and by stint. Each of your completed Attendee Surveys is also linked to a stint because you put a stint ID on each questionnaire before you distributed it (see Tally Process). To estimate the total spending by non-local attendees and the portion of it that will be used in the estimate of economic impact, you would apply the final weights for each stint/place of residence group to those who completed the Attendee Survey.
If yours is a multi-day event, you must use the proportions you calculated in the tally process for unique local attendees (taking into account the number of different days they attended your event). Before you do this, you need to “convert” completed attendee survey units from “household parties” to people.
a) An example
Step 1: Convert completed attendee survey units from “household parties” to people on a record-by-record basis. Each completed questionnaire represents the total number of people on the trip.
Step 2: Use the weighted, projected estimates from the tally process for each place of residence group in each stint (see Section IV-B). In the example used in the tally process, Stints 1 and 2 produced the following distribution.
FROM TALLY PROCESS
Stint Tallied Attendees Weighted, Projected Unique*
Attendees S1 Local 20 450 S1 Non-local – Same
Province/State 9 203 S1 Other Provinces/ States 1 23 S1 Other Country 1 23 S2 Local 10 200 S2 Non-local – Same
Province/State 3 60 S2 Other Provinces/ States 2 40 S2 Other Country 2 40 *Adjusted for multiple day visits if multiple day event.
b) Attendee person weight
Each completed non-local Attendee Survey (questionnaire) for a particular place of residence and stint will be weighted and projected to the total number of unique attendees from the corresponding place of residence that entered your event during the particular stint.

Guidelines: Survey Procedures for Tourism Economic Impact Assessments of Gated Events and Festivals
89
Thus, if you estimated that 203 non-locals from the same province/state entered during Stint 1, each of the five (5) completed Attendee Questionnaires representing 12 people from this place of residence/stint group will have a weight of 16.92. In other words, each of these records will “stand for” 16.92 unique non-local attendees. This final attendee weight would be coded on the respondent’s record in your data file and would be used when you run tabulations for attendee characteristics excluding spending (see note below). *If your event lasted more than one day, you need to make a special adjustment in the weighting and projection to take this into account.
COMBINING TALLY & ATTENDEE INFORMATION
Stint
Weighted, Projected Unique
Attendees
Completed Attendee
Questionnaires
Household Members on
Trip
Attendee Person Weight
S1 Local 450 N/A N/A N/A S1 Non-local – Same
Province/State 203 5 12 16.92 S1 Other Provinces/ States 23 1 3 S1 Other Country 23 0 0 14.33* S2 Local 200 N/A N/A N/A S2 Non-local – Same
Province/State 60 2 4 15.00 S2 Other Provinces/ States 40 1 2 20.00 S2 Other Country 40 1 1 40.00 *Cells must be merged because “Other Country” has “0” value
c) Attendee household weight (for spending estimates)
Spending information is collected for all members of the household party on the trip. Consequently, when you are working with spending data, you must create and use an Attendee Household Weight. This weight is the Attendee Person Weight divided by the total number of household members on the trip. In our example, one of the 5 non-locals from the same province/state in Stint 1 has a household party size of 2 people. The Attendee Household Weight for this record would be 16.92 ÷ 2, or 8.46. In this case, every dollar spent in the community or in a larger geographic area for this household party would be multiplied by 8.46 to represent this and other similar attendee parties.
As shown below, the Attendee Household Weight must be calculated individually for each record, using the Attendee Person Weight and the number of household members reported on the trip (from the completed questionnaire). The sequence in which you perform these steps is very important.
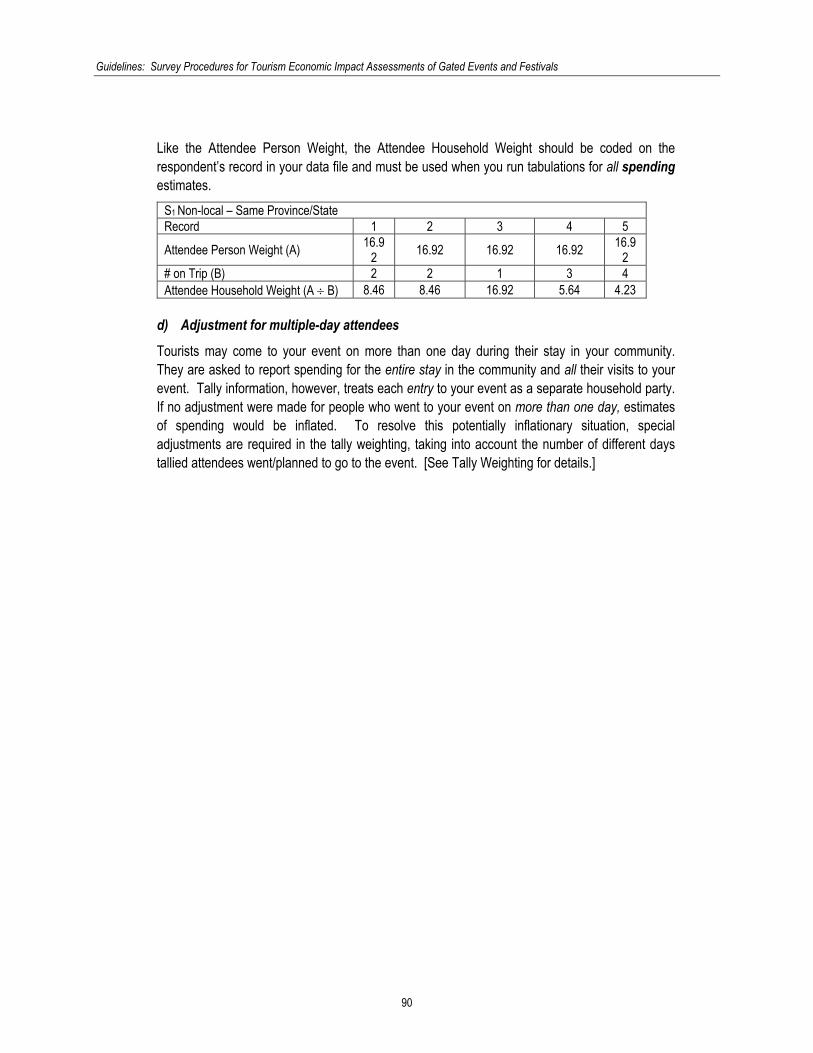
Guidelines: Survey Procedures for Tourism Economic Impact Assessments of Gated Events and Festivals
90
Like the Attendee Person Weight, the Attendee Household Weight should be coded on the respondent’s record in your data file and must be used when you run tabulations for all spending estimates.
S1 Non-local – Same Province/State Record 1 2 3 4 5
Attendee Person Weight (A) 16.92 16.92 16.92 16.92 16.9
2 # on Trip (B) 2 2 1 3 4 Attendee Household Weight (A ÷ B) 8.46 8.46 16.92 5.64 4.23
d) Adjustment for multiple-day attendees
Tourists may come to your event on more than one day during their stay in your community. They are asked to report spending for the entire stay in the community and all their visits to your event. Tally information, however, treats each entry to your event as a separate household party. If no adjustment were made for people who went to your event on more than one day, estimates of spending would be inflated. To resolve this potentially inflationary situation, special adjustments are required in the tally weighting, taking into account the number of different days tallied attendees went/planned to go to the event. [See Tally Weighting for details.]
Guidelines: Survey Procedures for Tourism Economic Impact Assessments of Gated Events and Festivals
91
VIII. DOCUMENTING THE STUDY PROCESS
H. Introduction
1. What is a Technical Appendix?
Once your study is over, you will have results based on the information you collected and analyzed. These results should be accompanied by a document that allows users to understand the robustness of your findings. Such information includes the procedures you used to sample, collect information (interviewing), weight and tabulate your results.
The rationale for a Technical Appendix, as this document is often called, is to provide enough detail about how the study was done that if someone else followed your procedures, they would get similar results.
This technical documentation not only provides guidance for interpreting the study findings but also provides a handy reference tool for organizations that may wish to undertake the same type of study “next year” or in subsequent years. The Technical Appendix should provide sufficient information on how the study was conducted that the organization can follow it in the future, thereby, obtaining comparable year-to-year results.
The Technical Appendix will be much easier to compile if you collect and retain calculations (spreadsheets) and survey materials as the study unfolds. In fact, much of what you will need for the Technical Appendix will be “in place” prior to starting the interviewing for the study. Keeping complete records of the steps you take in developing your study and recording the outcomes of activities as you go along will make the preparation of the Technical Appendix much easier!
2. What does a Technical Appendix contain?
The essential contents of a Technical Appendix are listed below. Details about each of these topics are provided in the following sections.
• Overview of study objectives and study sponsor(s) • Who conducted the study • Study timing and survey dates • Description of the data capture method(s) used • Description of the universe under study • Definition of “qualified respondents” • Sampling • Field procedures • Response rate • Calculations for weighting/projection • Data editing, cleaning and adjustment procedures • Field materials

Guidelines: Survey Procedures for Tourism Economic Impact Assessments of Gated Events and Festivals
92
I. Contents of a Technical Appendix
1. Overview of study objectives and study sponsor(s)
This introductory section describes the major information objectives of the study. Here is an example:
This study was initiated by [NAME OF SPONSOR(S)] in order to obtain inputs to estimate the tourism economic impact of NAME EVENT held between [INSERT START AND END DATE OR THE PORTION OF THE EVENT COVERED BY THE STUDY], to gain a better understanding of who comes to EVENT and to identify improvements that might be made to enhance the visitor experience. Specific objectives included estimating the incidence of tourists and non-tourists, demographic and behavioural characteristics of tourists and non-tourists, tourist spending at the event and in the community, ratings of the event on a number of attributes and generation of inputs for a tourism economic impact assessment.
2. Who conducted the study
If your organization undertook all aspects of the study, you should say so. If, however, other organizations were called upon to do significant tasks (e.g., sampling, interviewing, data editing and/or tabulations, etc.) they should be identified in the Technical Appendix.
If the project was largely contracted to a third party (e.g., university, survey research firm, etc.), you may want to provide this section of the Guidelines to the supplier and ask them to provide you with a Technical Appendix that covers the topics described here.
3. Study timing and survey dates
The study timing describes the period the findings represent. For example, if you collected information and weighted and projected to volume estimates for only some of the time period of the event or only for some portions of it, you would provide describe the start and end dates of the survey period and which portions of the event are included and excluded.
4. Description of the data capture method(s) used
This section describes the tools or methods you used to count visitors and collect information from them. Simple descriptions are all you need. For example, if interviewers were used to count entrants, you would say this and indicate what forms or technology they used to keep track of the counts, how many “stints” were assigned to counting, how many “counters” you used and where and when the counting was done. If turnstiles were used you would identify the number and location of turnstiles and how you gathered counts from them (e.g., daily, weekly, etc.). For collection, you would describe how information was gathered. Some examples: • All information was collected via an on-site intercept interview; or
Guidelines: Survey Procedures for Tourism Economic Impact Assessments of Gated Events and Festivals
93
• Limited information was collected via an on-site intercept interview and additional information was collected using a self-completion paper questionnaire; or
• As above, using a telephone follow-up interview, etc.
If multiple modes of data collection were used, the basic content of each questionnaire should be described. The actual questionnaires would be appended to the Technical Appendix and do not have to be repeated in their entirety in this section.
5. Description of the universe under study
This section will establish the boundaries of your study findings. The “universe” is the total number of people to which you have weighted and projected questionnaire responses. The information you provide to describe the “universe” would answer the following types of questions:
• Is the universe all people who came to the event or attraction or were some types of entrants excluded (e.g., staff, volunteers, media representatives, school groups, bus tours, guests at VIP functions)?
• What mechanisms did you use to exclude certain types of entrants from the tally or attendee survey process? These might include specific questions in the questionnaire or exclusion of some entrances (e.g., staff entrances) from the sample.
• What steps did you take to adjust visitor “counts” to remove certain types of entrants? • Were local residents and tourists included in your study? If so, how did you define a
“tourist”?
If the findings are weighted and projected to tourists or some other subgroup of the total visitor population, you need to provide the definition(s) you used to determine if a person qualified for the subgroup.
6. Definition of “Qualified Respondents”
The criteria used to determine which person would be providing information to you (the “qualified respondent”) should be documented in this section. If only certain types of people were asked to provide information, you need to describe the qualifications they had to meet. For example, did they have to be at least 18 years of age? Were there other requirements for determining which individual was asked to provide information? For example, did respondents have to be able to report on their own spending and the spending of others travelling with them?
7. Sampling
An overview of the various components of sampling should be provided. What type of sampling plan did you use? Was it a stratified stint sampling approach? How were the stints selected? How many were selected? If separate stint samples were developed for counting and interviewing, materials for each should be included.
This section should also provide information on the outcome of your sampling plan. Did all the stints take place as originally intended? Were there cancellations and/or replacements? Were any stints added? How many completions were obtained per stint?

Guidelines: Survey Procedures for Tourism Economic Impact Assessments of Gated Events and Festivals
94
Since you will have compiled much of this information in order to weight and project your interviews or counts to totals, you can either insert your worksheets and full sampling plan for counts and intercepts in the body of the Technical Appendix or summarize stint distribution and outcomes over time (day of week/time of day) and append the more detailed worksheets.
If you plan to provide a summary of the stint sample, including outcomes, you can use the same type of grid provided in these Guidelines for a stratified stint sample with 13 selected stints (see page 45). Using this grid as an example, you would add a column to the table to detail cancellations, replacements and/or additional stints. You would add another column in which you would record the number of completions achieved during each listed stint.
13 Selected High Volume Stints
NEW NEW
Selected Stints Month Date Time Count Cancellations/
Substitutions, Other Number of Completed
Interviews 1 June 2 1:30 – 4:30 208 2 June 14 1:30 – 4:30 16 3 June 23 10:00 – 1:30 32 4 July 2 10:00 – 1:30 48 5 July 12 10:00 – 1:30 64 6 July 21 10:00 – 1:30 80 7 July 30 10:00 – 1:30 96 8 August 8 1:30 – 4:30 112 9 August 17 1:30 – 4:30 128
10 August 26 1:30 – 4:30 144 11 Sept 5 1:30 – 4:30 160 12 Sept 14 1:30 – 4:30 176 13 Sept 23 1:30 – 4:30 192
This section should also cover the procedures used to select respondents for intercept interviews/other interviews. For example, was it every nth party or individual? If so, what interval was used?
8. Field procedures
This section would include brief descriptions of the following elements (as applicable):
• How many interviewers worked on each stage of the project (e.g., counting, tallying, interviewing)?
• How much prior interviewing experience did they have? • What training was provided to them? • What supervision procedures were developed for the project (monitoring “count” stints;
interview stints, etc.)? • How many field supervisors worked on the project? • Were interviewer instruction manuals prepared? If so, a copy should be appended to the
Technical Appendix.

Guidelines: Survey Procedures for Tourism Economic Impact Assessments of Gated Events and Festivals
95
9. Response rate
The response rate you achieve in your study is an indication of how representative the surveyed population is of the “universe under study”. This number helps you and those using your estimates to understand the robustness and reliability of your findings.
An example of how to calculate the response rate is provided below.
Row Number Percent Formula
1 Total number of entry parties approached during Tally process (A) ["A" = B + C]
2000 100%
2 Total number of entry parties that completed the Tally interview (sum of completed “rows” on Tally Sheets for all stints) (B)
1200 60% B ÷ A
3 Total number of entry parties that refused to cooperate with Tally (sum of refusals from the box on top of all Tally sheets [sum of “last number crossed out” on each completed Tally Sheet for all stints]) (C)
800 40% C ÷ A
4 Total in-scope entry parties for Attendee Survey (Total eligible to receive or asked to complete Attendee Survey. This number is the sum of rows with either a “refusal” or “accepts” mark at Q.8 on the Tally Sheet for all stints) (D) ["D" = E + F]
1,000 50% D ÷ A
5 Total number of entry parties that refused self-completion/ on-site interview (This number is the sum of rows with a “refusal” mark at Q.8 on the Tally Sheet) (E)
150 8% E ÷ A
6 Total number of entry parties that accepted self-completion/ completed on-site administered interview (This number is the sum of rows with an “accepts” mark at Q.8 on the Tally Sheet) (F)
850 43% F ÷ A
7 Returned self-completion survey/completed on-site administered interview (G)
430 22% G ÷ A
8 Unusable questionnaires (H) (Number of questionnaires that were not processed because they were incomplete, were returned too late, or for other reasons]
15 1% H ÷ A
9 Usable questionnaires for processing (I) [I = G - H) 415 21% I ÷ A 10 Completed Questionnaires Among All Entry Parties 22% Row 7 11 Usable Completed Questionnaires Among All Entry Parties 21% Row 9 12 Usable Completed Questionnaires Among All In-Scope Parties 42% I ÷ D
Notes for example
• Rows 1 – 3: You would sum refusals (the row of numbers at the top of the tally sheet that are “crossed out” as parties refuse the tally process) and sum completed rows from all tally sheets for all stints. The sum of these two (Rows 2 and 3) represents the number of “encounters” interviewers had with attendee parties. You would record this number in Row 1.
• Rows 4 – 6: You would use information recorded on the tally sheets for each entry party interviewed (in this example, the information is based on the response to Question 8 of the tally questionnaire).
• Rows 7 – 9: These are the number of completed Attendee Surveys that were returned.
Guidelines: Survey Procedures for Tourism Economic Impact Assessments of Gated Events and Festivals
96
10. Calculations for weighting/projection
A brief description of the steps you took to weight and project your survey findings to the universe under study should be presented in this section. It should also include the calculations you performed, as described in Chapters IV, V and VII of these Guidelines.
11. Data editing, cleaning and adjustment procedures
A brief description of the steps you took to clean and edit questionnaires and to create the event account (if applicable), as described in Chapter VII, Sections D, E, F of these Guidelines should be presented in this section.
12. Field materials
As appendices to your Technical Appendix, you should include copies of all survey materials:
• Written interviewer instructions • Written supervisor instructions • Tally Sheet /Tally questions • Self-completion/ other questionnaires

Guidelines: Survey Procedures for Tourism Economic Impact Assessments of Gated Events and Festivals
97
IX. GLOSSARY
Allocated spending Allocated spending is the distribution you make to various spending categories and/or locations from the “total” dollar amount supplied by the respondent.
Attributed spending
Attributed spending is your assignment of spending for various spending categories and to locations for respondents who did NOT provide an indication of how much was spent.
Concentrated entry event
An event in which most or all of the attendees arrive within a very short time span. Examples might include a concert or other performance or a sporting event.
Contiguous zones Count zones (on grid map) for an event in which all activities associated with the event take place in physically adjacent sites (contiguous).
Count zones Areas on a grid map of the event area that are used to sample and count/tally attendees.
Counts All attendees entering during tally stint. You will project the people you tallied during the stint to the total count during the same stint.
Cross section of attendees
All types of attendees in their correct proportions for the event as a whole (different demographic, origin, and behavioural groups, in the same proportions as they occur in the real population).
Event account The event account includes the portion of tourist spending that is considered incremental. This is the spending that occurred because an event took place. It is the spending that would be fed into a tourism economic impact model.
Final Ticket Adjustment Weight
Adjustment to match the total number of ticketed attendees who came to the event to the number represented by your sample.
Gated event An event that takes place in a confined area with “gates” or other “controlled” points of entry/exit.
Grid map A map that divides the event site(s) into identifiable areas for purposes of counting and tallying attendees.
Gross domestic product (GDP)
The value of goods and services produced by labour and capital located within a country (or region), regardless of nationality of labour or ownership, which is measured at market prices. Tourism GDP refers to the GDP generated in those businesses that directly produce or provide goods and services for travellers.
Household travel party/household party
All people travelling together and/or who came to the event together and who live in the same permanent residence.
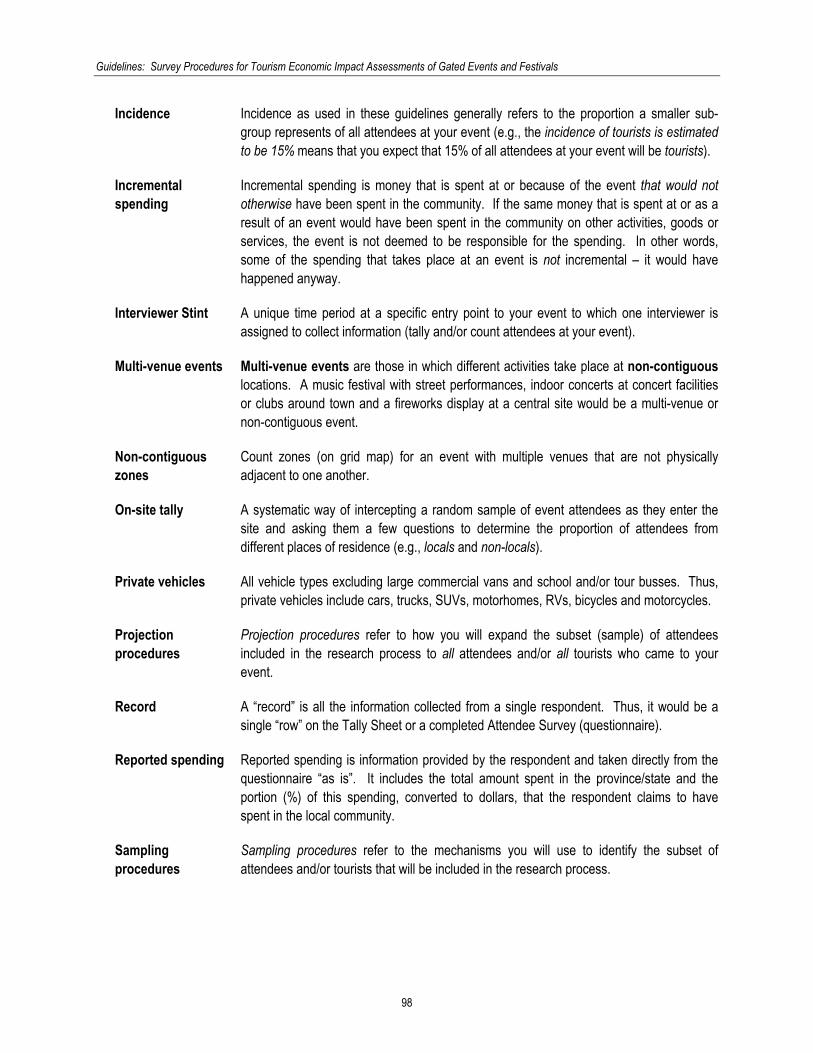
Guidelines: Survey Procedures for Tourism Economic Impact Assessments of Gated Events and Festivals
98
Incidence Incidence as used in these guidelines generally refers to the proportion a smaller sub-group represents of all attendees at your event (e.g., the incidence of tourists is estimated to be 15% means that you expect that 15% of all attendees at your event will be tourists).
Incremental spending
Incremental spending is money that is spent at or because of the event that would not otherwise have been spent in the community. If the same money that is spent at or as a result of an event would have been spent in the community on other activities, goods or services, the event is not deemed to be responsible for the spending. In other words, some of the spending that takes place at an event is not incremental – it would have happened anyway.
Interviewer Stint A unique time period at a specific entry point to your event to which one interviewer is assigned to collect information (tally and/or count attendees at your event).
Multi-venue events Multi-venue events are those in which different activities take place at non-contiguous locations. A music festival with street performances, indoor concerts at concert facilities or clubs around town and a fireworks display at a central site would be a multi-venue or non-contiguous event.
Non-contiguous zones
Count zones (on grid map) for an event with multiple venues that are not physically adjacent to one another.
On-site tally A systematic way of intercepting a random sample of event attendees as they enter the site and asking them a few questions to determine the proportion of attendees from different places of residence (e.g., locals and non-locals).
Private vehicles All vehicle types excluding large commercial vans and school and/or tour busses. Thus, private vehicles include cars, trucks, SUVs, motorhomes, RVs, bicycles and motorcycles.
Projection procedures
Projection procedures refer to how you will expand the subset (sample) of attendees included in the research process to all attendees and/or all tourists who came to your event.
Record A “record” is all the information collected from a single respondent. Thus, it would be a single “row” on the Tally Sheet or a completed Attendee Survey (questionnaire).
Reported spending Reported spending is information provided by the respondent and taken directly from the questionnaire “as is”. It includes the total amount spent in the province/state and the portion (%) of this spending, converted to dollars, that the respondent claims to have spent in the local community.
Sampling procedures
Sampling procedures refer to the mechanisms you will use to identify the subset of attendees and/or tourists that will be included in the research process.
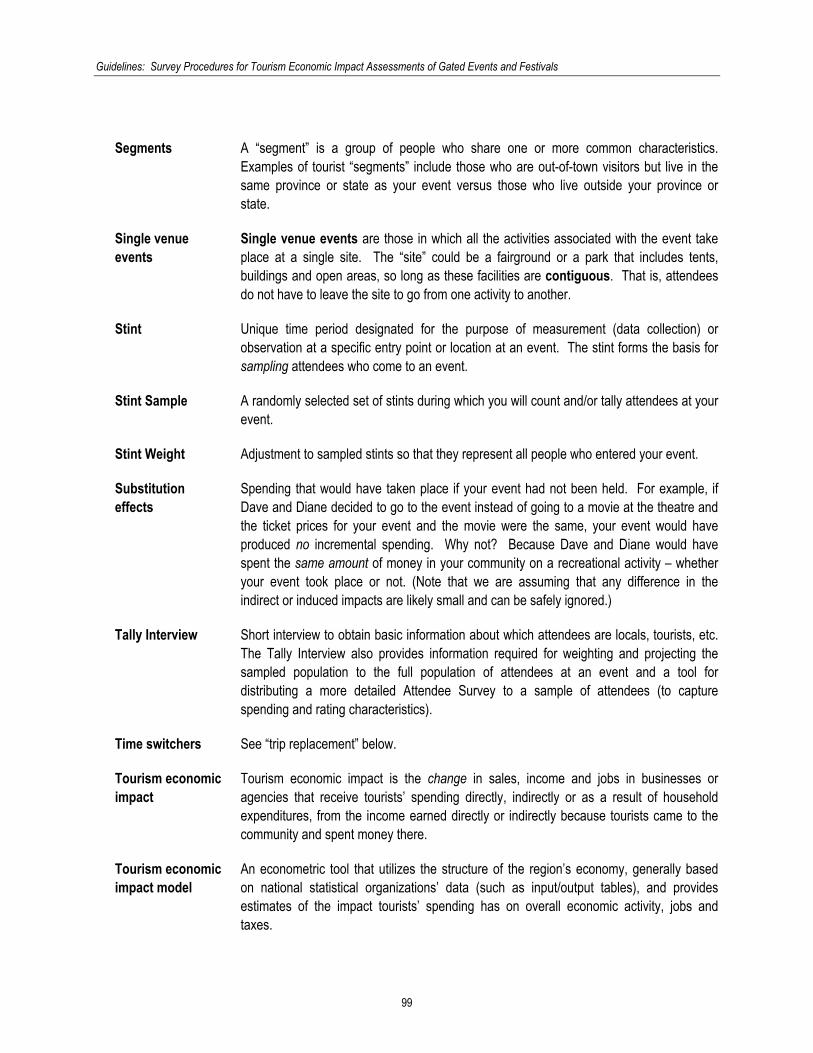
Guidelines: Survey Procedures for Tourism Economic Impact Assessments of Gated Events and Festivals
99
Segments A “segment” is a group of people who share one or more common characteristics. Examples of tourist “segments” include those who are out-of-town visitors but live in the same province or state as your event versus those who live outside your province or state.
Single venue events
Single venue events are those in which all the activities associated with the event take place at a single site. The “site” could be a fairground or a park that includes tents, buildings and open areas, so long as these facilities are contiguous. That is, attendees do not have to leave the site to go from one activity to another.
Stint Unique time period designated for the purpose of measurement (data collection) or observation at a specific entry point or location at an event. The stint forms the basis for sampling attendees who come to an event.
Stint Sample A randomly selected set of stints during which you will count and/or tally attendees at your event.
Stint Weight Adjustment to sampled stints so that they represent all people who entered your event.
Substitution effects
Spending that would have taken place if your event had not been held. For example, if Dave and Diane decided to go to the event instead of going to a movie at the theatre and the ticket prices for your event and the movie were the same, your event would have produced no incremental spending. Why not? Because Dave and Diane would have spent the same amount of money in your community on a recreational activity – whether your event took place or not. (Note that we are assuming that any difference in the indirect or induced impacts are likely small and can be safely ignored.)
Tally Interview Short interview to obtain basic information about which attendees are locals, tourists, etc. The Tally Interview also provides information required for weighting and projecting the sampled population to the full population of attendees at an event and a tool for distributing a more detailed Attendee Survey to a sample of attendees (to capture spending and rating characteristics).
Time switchers See “trip replacement” below.
Tourism economic impact
Tourism economic impact is the change in sales, income and jobs in businesses or agencies that receive tourists’ spending directly, indirectly or as a result of household expenditures, from the income earned directly or indirectly because tourists came to the community and spent money there.
Tourism economic impact model
An econometric tool that utilizes the structure of the region’s economy, generally based on national statistical organizations’ data (such as input/output tables), and provides estimates of the impact tourists’ spending has on overall economic activity, jobs and taxes.

Guidelines: Survey Procedures for Tourism Economic Impact Assessments of Gated Events and Festivals
100
Tourist The manner in which the World Tourism Organization’s guidelines for the tourism component of travel is operationalized for measurement purposes varies from country to country. Event organizers should check with the appropriate authorities to determine the operational definition in use in their particular jurisdiction. The operational approach adopted by Canada for identifying tourists is provided here.
An overnight domestic tourist is one who claims to have taken an out-of-town trip of at least one night away from home for any purpose apart from commuting to work or school, moving to a new residence, routine trips (shopping, medical, religious observance, pick-ups/deliveries, service/sales calls or other routine work-related trips). The trip must be completed within 365 days.*
A same-day domestic tourist is defined in a manner similar to the overnight tourist but the out-of-town trip must take the traveller at least 40 kilometres (25 miles) one-way from home and be completed within less than 24 hours (different jurisdictions use different distance criteria).
A same-day or overnight international tourist is one who crosses an international boundary (e.g., from Canada to the USA) on a trip for any purpose, excluding commuting to work or school, on military or diplomatic or as a member of a crew.* The trip must be completed within 365 days. *Some other minor exclusions apply.
Trip replacement or “time switchers”
If the trip that included a visit to your event displaced a trip that would have taken place in the future, no spending is considered incremental because a “similar trip” was replaced by “this” trip. The time period for a replacement trip can vary. Some experts recommend a three-month period (used in these materials), whereas others use a twelve-month period. In designing your survey, you will determine the time span most appropriate for your event and community.
Ungated or Partially Gated Event
An event that takes place in whole or in part in an open area where access is not controlled.
Vehicle Household Party
total number of reported or counted occupants per vehicle who live in the same household as the tally respondent.
Vehicle Occupants The total number of reported or counted occupants per vehicle (irrespective of whether they all live in the same household as the tally respondent).

Guidelines: Survey Procedures for Tourism Economic Impact Assessments of Gated Events and Festivals
101
APPENDIX I: SUPPORTERS & PANEL OF EXPERT MEMBERS
A. Supporters
Financial support for this project from the following organizations is gratefully acknowledged.
Canada Tourism British Columbia Canadian Tourism Commission Ontario Ministry of Tourism Nova Scotia Department of Tourism, Culture and Heritage Alberta Tourism, Parks, Recreation and Culture Federal-Provincial-Territorial Culture/Heritage and Tourism Initiative Tourism Prince Edward Island Government of Yukon – Department of Tourism and Culture Government of the Northwest Territories – Department of Resources,
Wildlife, & Economic Development USA Texas A&M University
B. Panel of Experts
Canada Bonnie Mactavish, Royal Agricultural Fair* Judy Rogers, Research Resolutions & Consulting Ltd. USA Texas A&M University Dr. John Crompton Dr. James F. McNamara Dr. Joseph O’Leary Dr. James Petrick Dr. Douglass Shaw *Canadian Association of Fairs and Exhibitions (C.A.F.E.) Representative
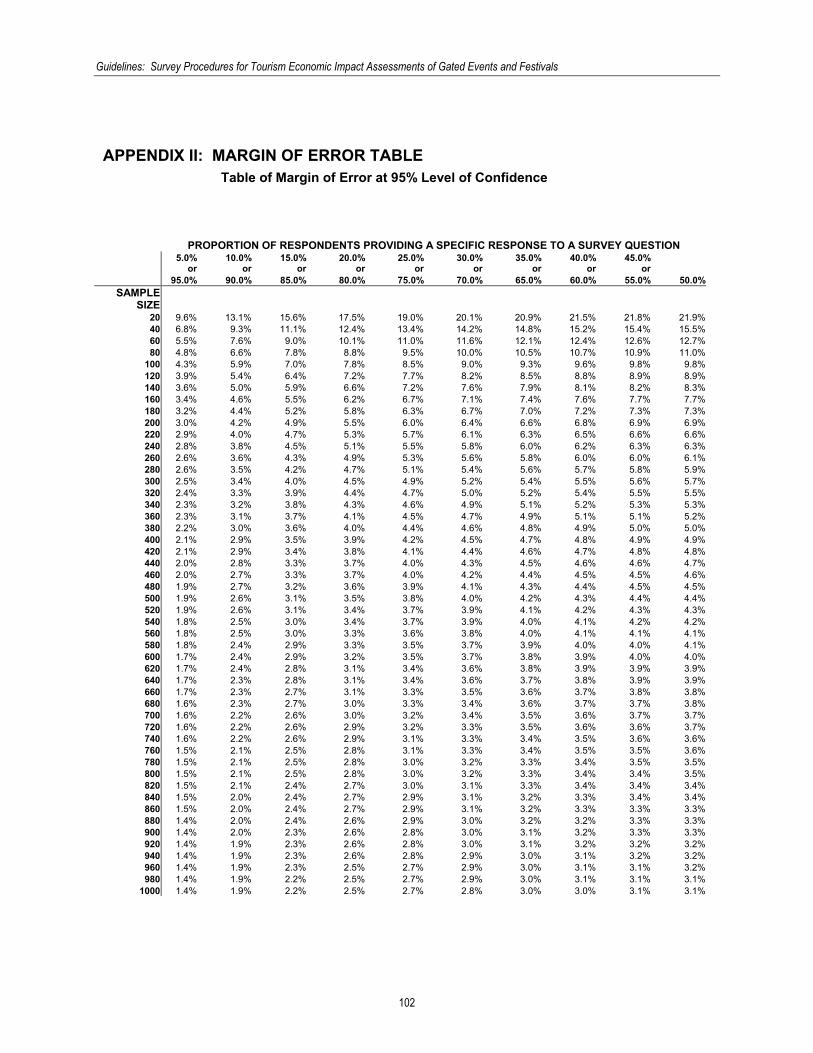
Guidelines: Survey Procedures for Tourism Economic Impact Assessments of Gated Events and Festivals
102
APPENDIX II: MARGIN OF ERROR TABLE
Table of Margin of Error at 95% Level of Confidence
PROPORTION OF RESPONDENTS PROVIDING A SPECIFIC RESPONSE TO A SURVEY QUESTION
5.0% or
10.0% or
15.0% or
20.0% or
25.0% or
30.0% or
35.0% or
40.0% or
45.0% or
95.0% 90.0% 85.0% 80.0% 75.0% 70.0% 65.0% 60.0% 55.0% 50.0%SAMPLE
SIZE 20 9.6% 13.1% 15.6% 17.5% 19.0% 20.1% 20.9% 21.5% 21.8% 21.9%40 6.8% 9.3% 11.1% 12.4% 13.4% 14.2% 14.8% 15.2% 15.4% 15.5%60 5.5% 7.6% 9.0% 10.1% 11.0% 11.6% 12.1% 12.4% 12.6% 12.7%80 4.8% 6.6% 7.8% 8.8% 9.5% 10.0% 10.5% 10.7% 10.9% 11.0%
100 4.3% 5.9% 7.0% 7.8% 8.5% 9.0% 9.3% 9.6% 9.8% 9.8%120 3.9% 5.4% 6.4% 7.2% 7.7% 8.2% 8.5% 8.8% 8.9% 8.9%140 3.6% 5.0% 5.9% 6.6% 7.2% 7.6% 7.9% 8.1% 8.2% 8.3%160 3.4% 4.6% 5.5% 6.2% 6.7% 7.1% 7.4% 7.6% 7.7% 7.7%180 3.2% 4.4% 5.2% 5.8% 6.3% 6.7% 7.0% 7.2% 7.3% 7.3%200 3.0% 4.2% 4.9% 5.5% 6.0% 6.4% 6.6% 6.8% 6.9% 6.9%220 2.9% 4.0% 4.7% 5.3% 5.7% 6.1% 6.3% 6.5% 6.6% 6.6%240 2.8% 3.8% 4.5% 5.1% 5.5% 5.8% 6.0% 6.2% 6.3% 6.3%260 2.6% 3.6% 4.3% 4.9% 5.3% 5.6% 5.8% 6.0% 6.0% 6.1%280 2.6% 3.5% 4.2% 4.7% 5.1% 5.4% 5.6% 5.7% 5.8% 5.9%300 2.5% 3.4% 4.0% 4.5% 4.9% 5.2% 5.4% 5.5% 5.6% 5.7%320 2.4% 3.3% 3.9% 4.4% 4.7% 5.0% 5.2% 5.4% 5.5% 5.5%340 2.3% 3.2% 3.8% 4.3% 4.6% 4.9% 5.1% 5.2% 5.3% 5.3%360 2.3% 3.1% 3.7% 4.1% 4.5% 4.7% 4.9% 5.1% 5.1% 5.2%380 2.2% 3.0% 3.6% 4.0% 4.4% 4.6% 4.8% 4.9% 5.0% 5.0%400 2.1% 2.9% 3.5% 3.9% 4.2% 4.5% 4.7% 4.8% 4.9% 4.9%420 2.1% 2.9% 3.4% 3.8% 4.1% 4.4% 4.6% 4.7% 4.8% 4.8%440 2.0% 2.8% 3.3% 3.7% 4.0% 4.3% 4.5% 4.6% 4.6% 4.7%460 2.0% 2.7% 3.3% 3.7% 4.0% 4.2% 4.4% 4.5% 4.5% 4.6%480 1.9% 2.7% 3.2% 3.6% 3.9% 4.1% 4.3% 4.4% 4.5% 4.5%500 1.9% 2.6% 3.1% 3.5% 3.8% 4.0% 4.2% 4.3% 4.4% 4.4%520 1.9% 2.6% 3.1% 3.4% 3.7% 3.9% 4.1% 4.2% 4.3% 4.3%540 1.8% 2.5% 3.0% 3.4% 3.7% 3.9% 4.0% 4.1% 4.2% 4.2%560 1.8% 2.5% 3.0% 3.3% 3.6% 3.8% 4.0% 4.1% 4.1% 4.1%580 1.8% 2.4% 2.9% 3.3% 3.5% 3.7% 3.9% 4.0% 4.0% 4.1%600 1.7% 2.4% 2.9% 3.2% 3.5% 3.7% 3.8% 3.9% 4.0% 4.0%620 1.7% 2.4% 2.8% 3.1% 3.4% 3.6% 3.8% 3.9% 3.9% 3.9%640 1.7% 2.3% 2.8% 3.1% 3.4% 3.6% 3.7% 3.8% 3.9% 3.9%660 1.7% 2.3% 2.7% 3.1% 3.3% 3.5% 3.6% 3.7% 3.8% 3.8%680 1.6% 2.3% 2.7% 3.0% 3.3% 3.4% 3.6% 3.7% 3.7% 3.8%700 1.6% 2.2% 2.6% 3.0% 3.2% 3.4% 3.5% 3.6% 3.7% 3.7%720 1.6% 2.2% 2.6% 2.9% 3.2% 3.3% 3.5% 3.6% 3.6% 3.7%740 1.6% 2.2% 2.6% 2.9% 3.1% 3.3% 3.4% 3.5% 3.6% 3.6%760 1.5% 2.1% 2.5% 2.8% 3.1% 3.3% 3.4% 3.5% 3.5% 3.6%780 1.5% 2.1% 2.5% 2.8% 3.0% 3.2% 3.3% 3.4% 3.5% 3.5%800 1.5% 2.1% 2.5% 2.8% 3.0% 3.2% 3.3% 3.4% 3.4% 3.5%820 1.5% 2.1% 2.4% 2.7% 3.0% 3.1% 3.3% 3.4% 3.4% 3.4%840 1.5% 2.0% 2.4% 2.7% 2.9% 3.1% 3.2% 3.3% 3.4% 3.4%860 1.5% 2.0% 2.4% 2.7% 2.9% 3.1% 3.2% 3.3% 3.3% 3.3%880 1.4% 2.0% 2.4% 2.6% 2.9% 3.0% 3.2% 3.2% 3.3% 3.3%900 1.4% 2.0% 2.3% 2.6% 2.8% 3.0% 3.1% 3.2% 3.3% 3.3%920 1.4% 1.9% 2.3% 2.6% 2.8% 3.0% 3.1% 3.2% 3.2% 3.2%940 1.4% 1.9% 2.3% 2.6% 2.8% 2.9% 3.0% 3.1% 3.2% 3.2%960 1.4% 1.9% 2.3% 2.5% 2.7% 2.9% 3.0% 3.1% 3.1% 3.2%980 1.4% 1.9% 2.2% 2.5% 2.7% 2.9% 3.0% 3.1% 3.1% 3.1%
1000 1.4% 1.9% 2.2% 2.5% 2.7% 2.8% 3.0% 3.0% 3.1% 3.1%

Guidelines: Survey Procedures for Tourism Economic Impact Assessments of Gated Events and Festivals
103
Here is an example. Assume 200 tourists completed the Attendee Survey. Your “sample size” is 200. In response to the question about their “Similar recreational activities in Community” 20% of them report that they would have gone to a different attraction or event on this trip (“Yes”). In the table provided here, you would read down the first column (SAMPLE SIZE) until you reach “200” and then read across this row until you find the proportion (or nearest proportion) that corresponds to the estimate in your study. In this case, you would be looking for a column labelled “20% ”. Read down this column until it intersects with your sample size. In this case, the number you would find is 5.5% (see example below).
This means that there is a 95% probability (19 times out of 20) that the percentage of your sample that said ”yes” is within 5.5% of the true percentage of all attendees who visited your community. You would report this in a manner such as the following: About twenty percent of tourists at NAME EVENT (+6%) would have gone to a different attraction or event in the community if they had not come to NAME EVENT on their trip.
Note: even though the table provides estimates with a decimal point, we have rounded the 5.5% up to 6% and advise that you always round the + percentage up to the nearest whole number in order to minimize impressions of false precision.
PROPORTION OF RESPONDENTS PROVIDING A SPECIFIC RESPONSE TO A SURVEY QUESTION
5.0% or
10.0% or
15.0% or
20.0% or
25.0% or
30.0% or
35.0% or
40.0% or
45.0% or
95.0% 90.0% 85.0% 80.0% 75.0% 70.0% 65.0% 60.0% 55.0% 50.0%SAMPLE
SIZE 20 9.6% 13.1% 15.6% 17.5% 19.0% 20.1% 20.9% 21.5% 21.8% 21.9%40 6.8% 9.3% 11.1% 12.4% 13.4% 14.2% 14.8% 15.2% 15.4% 15.5%60 5.5% 7.6% 9.0% 10.1% 11.0% 11.6% 12.1% 12.4% 12.6% 12.7%80 4.8% 6.6% 7.8% 8.8% 9.5% 10.0% 10.5% 10.7% 10.9% 11.0%
100 4.3% 5.9% 7.0% 7.8% 8.5% 9.0% 9.3% 9.6% 9.8% 9.8%120 3.9% 5.4% 6.4% 7.2% 7.7% 8.2% 8.5% 8.8% 8.9% 8.9%140 3.6% 5.0% 5.9% 6.6% 7.2% 7.6% 7.9% 8.1% 8.2% 8.3%160 3.4% 4.6% 5.5% 6.2% 6.7% 7.1% 7.4% 7.6% 7.7% 7.7%180 3.2% 4.4% 5.2% 5.8% 6.3% 6.7% 7.0% 7.2% 7.3% 7.3%200 3.0% 4.2% 4.9% 5.5% 6.0% 6.4% 6.6% 6.8% 6.9% 6.9%220 2.9% 4.0% 4.7% 5.3% 5.7% 6.1% 6.3% 6.5% 6.6% 6.6%240 2.8% 3.8% 4.5% 5.1% 5.5% 5.8% 6.0% 6.2% 6.3% 6.3%260 2.6% 3.6% 4.3% 4.9% 5.3% 5.6% 5.8% 6.0% 6.0% 6.1%280 2.6% 3.5% 4.2% 4.7% 5.1% 5.4% 5.6% 5.7% 5.8% 5.9%300 2.5% 3.4% 4.0% 4.5% 4.9% 5.2% 5.4% 5.5% 5.6% 5.7%320 2.4% 3.3% 3.9% 4.4% 4.7% 5.0% 5.2% 5.4% 5.5% 5.5%340 2.3% 3.2% 3.8% 4.3% 4.6% 4.9% 5.1% 5.2% 5.3% 5.3%360 2.3% 3.1% 3.7% 4.1% 4.5% 4.7% 4.9% 5.1% 5.1% 5.2%380 2.2% 3.0% 3.6% 4.0% 4.4% 4.6% 4.8% 4.9% 5.0% 5.0%400 2.1% 2.9% 3.5% 3.9% 4.2% 4.5% 4.7% 4.8% 4.9% 4.9%

Guidelines: Survey Procedures for Tourism Economic Impact Assessments of Gated Events and Festivals
104
APPENDIX III: ATTENDEE SURVEY: EDITING & SPENDING ALLOCATION
Special Edit Rules for Lodging
Total nights on the trip cannot be less than sum of total nights in each sub-location. If sum of nights in all lodging types/locations is greater than the total nights on the trip, adjust the nights on trip to equal the sum of nights reported in the lodging questions.
If lodging spending is provided in the Spending question AND . . .
. . . only unpaid lodging is used (e.g., private home or cottage), move lodging spending to “other” spending;
. . . Not Stated (NS) or Don’t Know (DK) to type of lodging, re-code type to “paid -- type unknown” lodging and retain spending reported in the Spending question;
. . . same-day trip (e.g., no nights), move lodging spending to “other” spending.
Guidelines: Survey Procedures for Tourism Economic Impact Assessments of Gated Events and Festivals
105
APPENDIX IV: ASSIGNING SPENDING TO CATEGORIES
These guidelines assume that on-site spending and “other spending” is calculated separately, as per the sample Attendee Survey Non-Local questionnaire included in these materials. The principles listed below would be applied separately for On-Site and Other Spending. (See Guidelines for Calculating Average Spending for Allocation/ Ascription for more details.)
A. Only “Total” provided
Distribution of “total only” spending will depend on whether the respondent did or did not identify whether money was spent on various items (checked at least one of the “spent any” boxes).
1. Checked some “Spent Any” boxes
Calculate average spending per category for records that supplied the full array of detailed spending. Use these averages to generate ratios for the “mix” of items on which the respondent claims to have spent money but did not provide an amount. The ratios will guide how you distribute the respondent’s “total spending” to each category on which the respondent claims to have spent money but did not provide an amount. To the extent that the data can support it, different sets of ratios would be calculated for major origin groups and separately for same-day and overnight travellers.
We recommend that averages be based on cells (segments) with at least fifty (50) records of respondents who do provide a complete spending profile.
2. Checked no “Spent Any” boxes
Calculate average spending per category for records that supplied the full array of detailed spending. Use these averages to generate ratios to assign the respondent’s “total spending” to each category. To the extent that the data can support it, different sets of ratios would be calculated for major origin groups and separately for same-day and overnight travellers.
B. No Total Provided and Some Items Marked with “Don’t Know” Amount
If respondent did not know (DK) how much was spent on a specific item, the average amount for an analogous visitor (same origin, same transport mode) on a per person per night basis would used to attribute dollars to the DK categories.
In the case of carrier fares, the average spending for commercial domestic air carrier and other air carrier would be calculated and assigned as per the appropriate origin group.
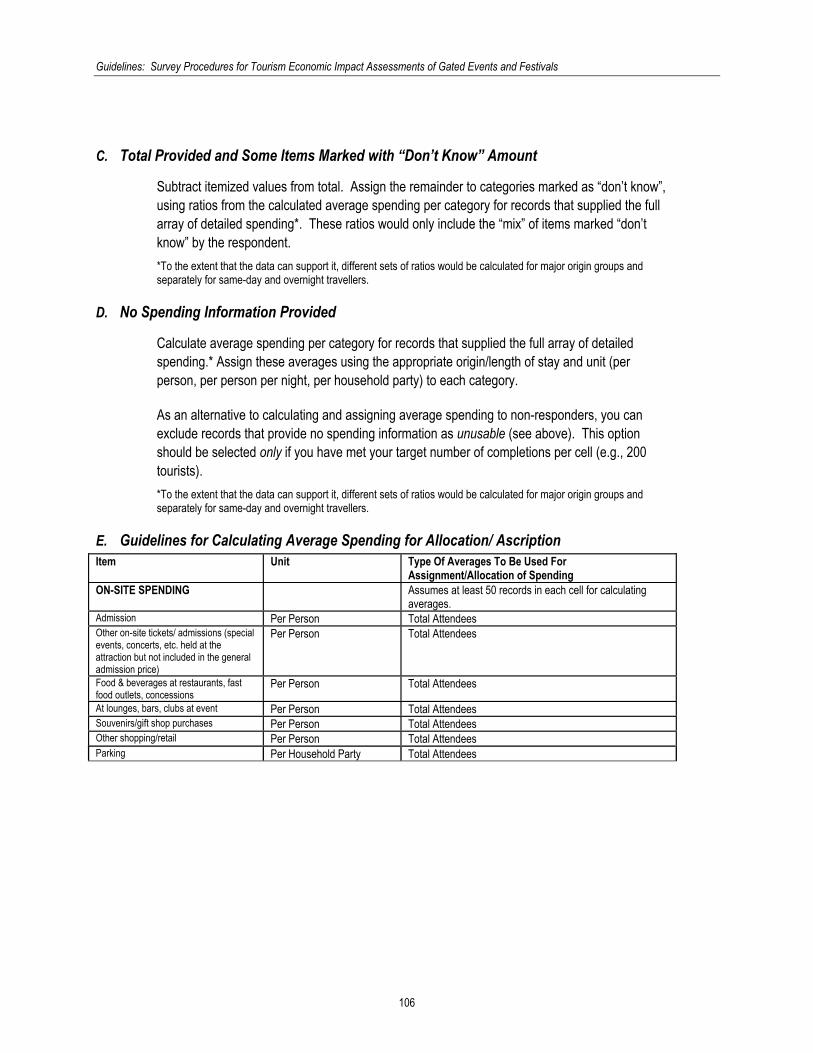
Guidelines: Survey Procedures for Tourism Economic Impact Assessments of Gated Events and Festivals
106
C. Total Provided and Some Items Marked with “Don’t Know” Amount
Subtract itemized values from total. Assign the remainder to categories marked as “don’t know”, using ratios from the calculated average spending per category for records that supplied the full array of detailed spending*. These ratios would only include the “mix” of items marked “don’t know” by the respondent. *To the extent that the data can support it, different sets of ratios would be calculated for major origin groups and separately for same-day and overnight travellers.
D. No Spending Information Provided
Calculate average spending per category for records that supplied the full array of detailed spending.* Assign these averages using the appropriate origin/length of stay and unit (per person, per person per night, per household party) to each category.
As an alternative to calculating and assigning average spending to non-responders, you can exclude records that provide no spending information as unusable (see above). This option should be selected only if you have met your target number of completions per cell (e.g., 200 tourists). *To the extent that the data can support it, different sets of ratios would be calculated for major origin groups and separately for same-day and overnight travellers.
E. Guidelines for Calculating Average Spending for Allocation/ Ascription Item Unit Type Of Averages To Be Used For
Assignment/Allocation of Spending ON-SITE SPENDING Assumes at least 50 records in each cell for calculating
averages. Admission Per Person Total Attendees Other on-site tickets/ admissions (special events, concerts, etc. held at the attraction but not included in the general admission price)
Per Person Total Attendees
Food & beverages at restaurants, fast food outlets, concessions
Per Person Total Attendees
At lounges, bars, clubs at event Per Person Total Attendees Souvenirs/gift shop purchases Per Person Total Attendees Other shopping/retail Per Person Total Attendees Parking Per Household Party Total Attendees

Guidelines: Survey Procedures for Tourism Economic Impact Assessments of Gated Events and Festivals
107
Item Unit Type Of Averages To Be Used For
Assignment/Allocation of Spending OTHER SPENDING Assumes at least 50 records in each cell for calculating
averages. If less than 50 records per cell, collapse origin cells.
Gasoline/repairs for vehicle Per Household Party Night* Total Domestic For Domestic Residents; Total Non-Domestic For All Other
Vehicle rental Per Household Party Night* Total Domestic For Domestic Residents; Total Non-Domestic For All Other
Parking Per Household Party Night* Total Domestic For Domestic Residents; Total Non-Domestic For All Other
Local taxis, local buses, subways Per Person Night* Total Domestic For Domestic Residents; Total Non-Domestic For All Other
Groceries/beverages (at grocery/liquor stores)
Per Person Night* Total Domestic For Domestic Residents; Total Non-Domestic For All Other
Food & beverages at restaurants Per Person Night* Total Domestic For Domestic Residents; Total Non-Domestic For All Other
At lounges, bars, clubs Per Person Night* Total Domestic For Domestic Residents; Total Non-Domestic For All Other
Clothing Per Person Night* Total Domestic For Domestic Residents; Total Non-Domestic For All Other
Other shopping Per Person Night* Total Domestic For Domestic Residents; Total Non-Domestic For All Other
Lodging Per Person Night Total Domestic For Domestic Residents; Total Non-Domestic For All Other
Any Other Expenses Per Person Night* Total Domestic For Domestic Residents; Total Non-Domestic For All Other
Domestic Carrier Within Province/Territory/State
Bus/Train Per Person Total Domestic For Domestic Residents; Total Non-Domestic For All Other
Air Carrier/Boat/Ship Per Person
Total Non-Local
Domestic Carrier To Province/Territory/State
Bus/Train Per Person Total Non-Local Air Carrier/Boat/Ship Per Person Total Non-Local *For local residents and non-locals with no nights in the province/territory/state, use “per person” in lieu of “per person per night”.
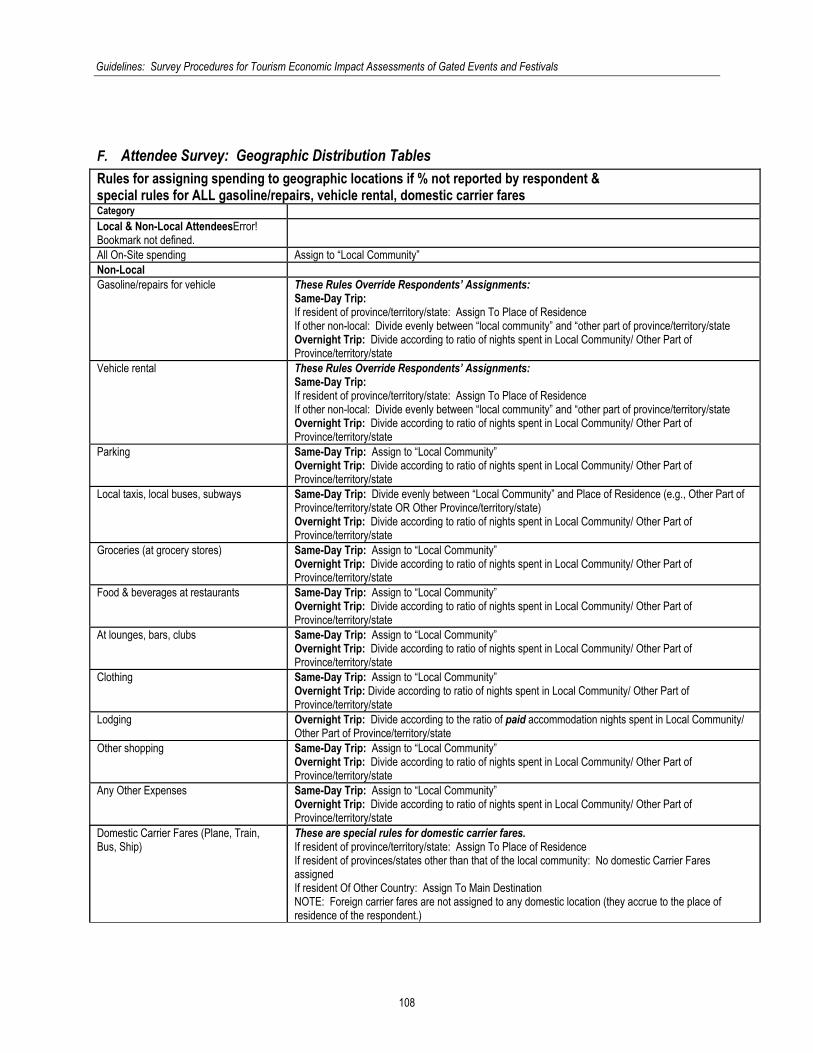
Guidelines: Survey Procedures for Tourism Economic Impact Assessments of Gated Events and Festivals
108
F. Attendee Survey: Geographic Distribution Tables Rules for assigning spending to geographic locations if % not reported by respondent & special rules for ALL gasoline/repairs, vehicle rental, domestic carrier fares Category Local & Non-Local AttendeesError! Bookmark not defined.
All On-Site spending Assign to “Local Community” Non-Local Gasoline/repairs for vehicle These Rules Override Respondents’ Assignments:
Same-Day Trip: If resident of province/territory/state: Assign To Place of Residence If other non-local: Divide evenly between “local community” and “other part of province/territory/state Overnight Trip: Divide according to ratio of nights spent in Local Community/ Other Part of Province/territory/state
Vehicle rental These Rules Override Respondents’ Assignments: Same-Day Trip: If resident of province/territory/state: Assign To Place of Residence If other non-local: Divide evenly between “local community” and “other part of province/territory/state Overnight Trip: Divide according to ratio of nights spent in Local Community/ Other Part of Province/territory/state
Parking Same-Day Trip: Assign to “Local Community” Overnight Trip: Divide according to ratio of nights spent in Local Community/ Other Part of Province/territory/state
Local taxis, local buses, subways Same-Day Trip: Divide evenly between “Local Community” and Place of Residence (e.g., Other Part of Province/territory/state OR Other Province/territory/state) Overnight Trip: Divide according to ratio of nights spent in Local Community/ Other Part of Province/territory/state
Groceries (at grocery stores) Same-Day Trip: Assign to “Local Community” Overnight Trip: Divide according to ratio of nights spent in Local Community/ Other Part of Province/territory/state
Food & beverages at restaurants Same-Day Trip: Assign to “Local Community” Overnight Trip: Divide according to ratio of nights spent in Local Community/ Other Part of Province/territory/state
At lounges, bars, clubs Same-Day Trip: Assign to “Local Community” Overnight Trip: Divide according to ratio of nights spent in Local Community/ Other Part of Province/territory/state
Clothing Same-Day Trip: Assign to “Local Community” Overnight Trip: Divide according to ratio of nights spent in Local Community/ Other Part of Province/territory/state
Lodging Overnight Trip: Divide according to the ratio of paid accommodation nights spent in Local Community/ Other Part of Province/territory/state
Other shopping Same-Day Trip: Assign to “Local Community” Overnight Trip: Divide according to ratio of nights spent in Local Community/ Other Part of Province/territory/state
Any Other Expenses Same-Day Trip: Assign to “Local Community” Overnight Trip: Divide according to ratio of nights spent in Local Community/ Other Part of Province/territory/state
Domestic Carrier Fares (Plane, Train, Bus, Ship)
These are special rules for domestic carrier fares. If resident of province/territory/state: Assign To Place of Residence If resident of provinces/states other than that of the local community: No domestic Carrier Fares assigned If resident Of Other Country: Assign To Main Destination NOTE: Foreign carrier fares are not assigned to any domestic location (they accrue to the place of residence of the respondent.)
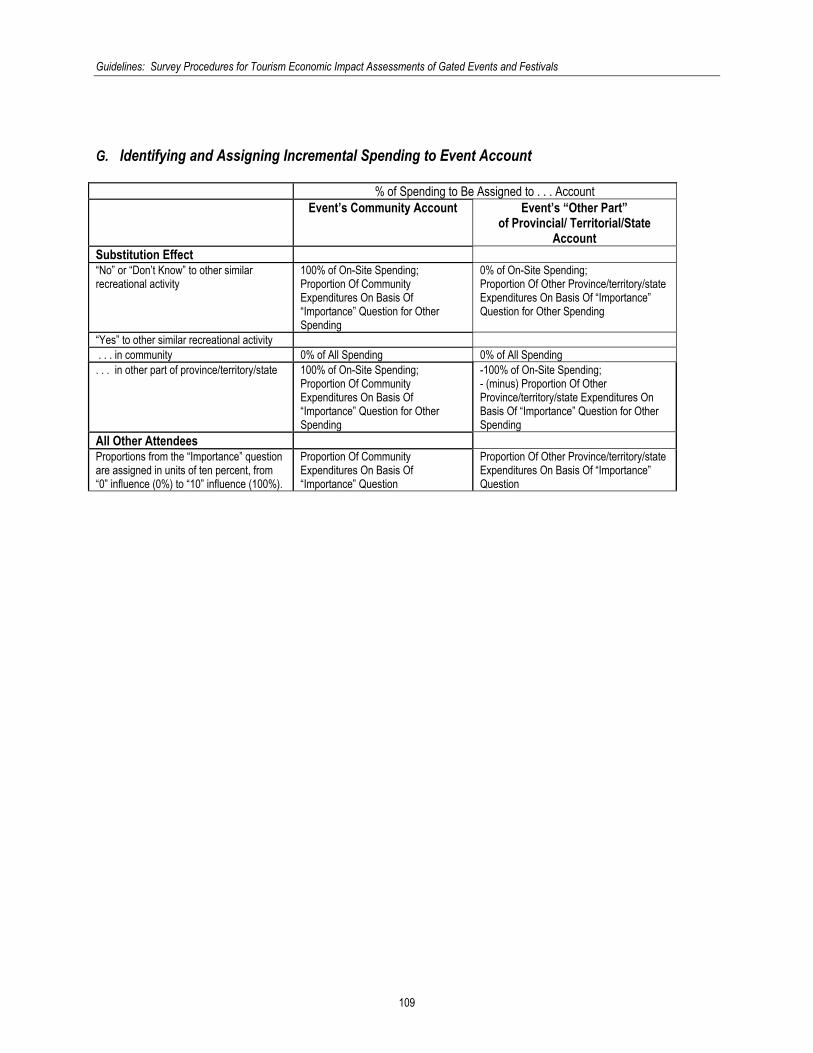
Guidelines: Survey Procedures for Tourism Economic Impact Assessments of Gated Events and Festivals
109
G. Identifying and Assigning Incremental Spending to Event Account % of Spending to Be Assigned to . . . Account Event’s Community Account Event’s “Other Part”
of Provincial/ Territorial/State Account
Substitution Effect “No” or “Don’t Know” to other similar recreational activity
100% of On-Site Spending; Proportion Of Community Expenditures On Basis Of “Importance” Question for Other Spending
0% of On-Site Spending; Proportion Of Other Province/territory/state Expenditures On Basis Of “Importance” Question for Other Spending
“Yes” to other similar recreational activity . . . in community 0% of All Spending 0% of All Spending . . . in other part of province/territory/state 100% of On-Site Spending;
Proportion Of Community Expenditures On Basis Of “Importance” Question for Other Spending
-100% of On-Site Spending; - (minus) Proportion Of Other Province/territory/state Expenditures On Basis Of “Importance” Question for Other Spending
All Other Attendees Proportions from the “Importance” question are assigned in units of ten percent, from “0” influence (0%) to “10” influence (100%).
Proportion Of Community Expenditures On Basis Of “Importance” Question
Proportion Of Other Province/territory/state Expenditures On Basis Of “Importance” Question
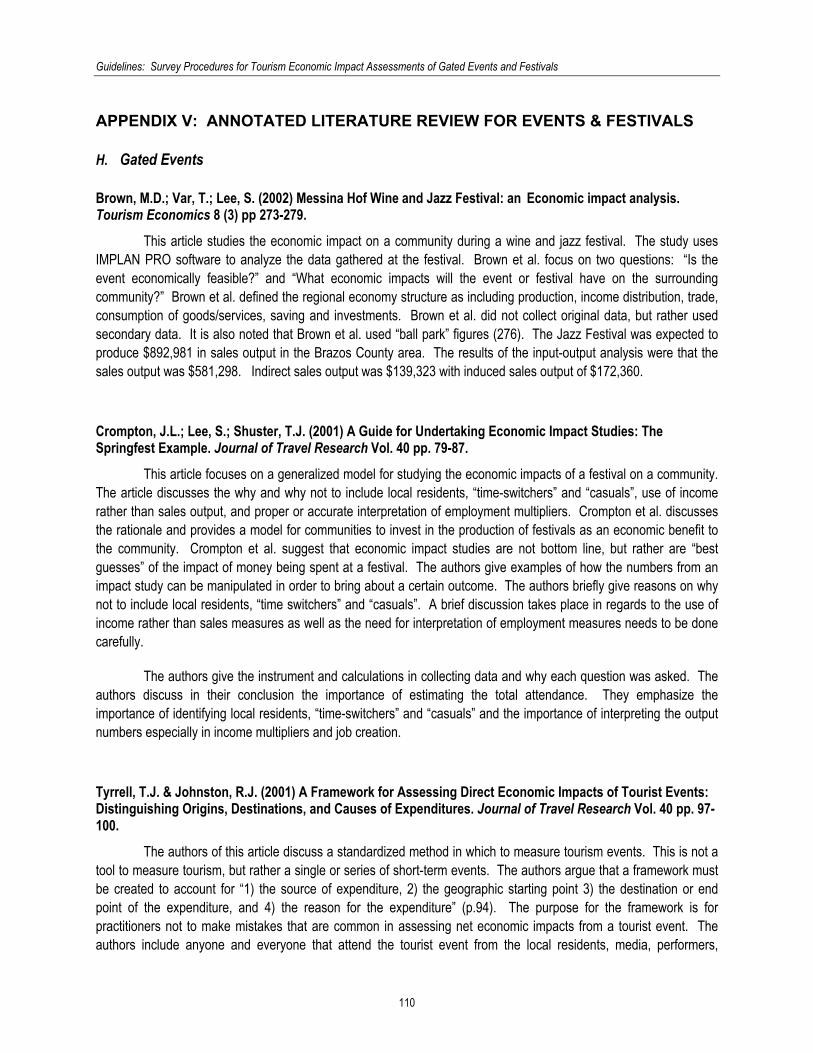
Guidelines: Survey Procedures for Tourism Economic Impact Assessments of Gated Events and Festivals
110
APPENDIX V: ANNOTATED LITERATURE REVIEW FOR EVENTS & FESTIVALS
H. Gated Events Brown, M.D.; Var, T.; Lee, S. (2002) Messina Hof Wine and Jazz Festival: an Economic impact analysis. Tourism Economics 8 (3) pp 273-279.
This article studies the economic impact on a community during a wine and jazz festival. The study uses IMPLAN PRO software to analyze the data gathered at the festival. Brown et al. focus on two questions: “Is the event economically feasible?” and “What economic impacts will the event or festival have on the surrounding community?” Brown et al. defined the regional economy structure as including production, income distribution, trade, consumption of goods/services, saving and investments. Brown et al. did not collect original data, but rather used secondary data. It is also noted that Brown et al. used “ball park” figures (276). The Jazz Festival was expected to produce $892,981 in sales output in the Brazos County area. The results of the input-output analysis were that the sales output was $581,298. Indirect sales output was $139,323 with induced sales output of $172,360.
Crompton, J.L.; Lee, S.; Shuster, T.J. (2001) A Guide for Undertaking Economic Impact Studies: The Springfest Example. Journal of Travel Research Vol. 40 pp. 79-87.
This article focuses on a generalized model for studying the economic impacts of a festival on a community. The article discusses the why and why not to include local residents, “time-switchers” and “casuals”, use of income rather than sales output, and proper or accurate interpretation of employment multipliers. Crompton et al. discusses the rationale and provides a model for communities to invest in the production of festivals as an economic benefit to the community. Crompton et al. suggest that economic impact studies are not bottom line, but rather are “best guesses” of the impact of money being spent at a festival. The authors give examples of how the numbers from an impact study can be manipulated in order to bring about a certain outcome. The authors briefly give reasons on why not to include local residents, “time switchers” and “casuals”. A brief discussion takes place in regards to the use of income rather than sales measures as well as the need for interpretation of employment measures needs to be done carefully.
The authors give the instrument and calculations in collecting data and why each question was asked. The authors discuss in their conclusion the importance of estimating the total attendance. They emphasize the importance of identifying local residents, “time-switchers” and “casuals” and the importance of interpreting the output numbers especially in income multipliers and job creation.
Tyrrell, T.J. & Johnston, R.J. (2001) A Framework for Assessing Direct Economic Impacts of Tourist Events: Distinguishing Origins, Destinations, and Causes of Expenditures. Journal of Travel Research Vol. 40 pp. 97-100.
The authors of this article discuss a standardized method in which to measure tourism events. This is not a tool to measure tourism, but rather a single or series of short-term events. The authors argue that a framework must be created to account for “1) the source of expenditure, 2) the geographic starting point 3) the destination or end point of the expenditure, and 4) the reason for the expenditure” (p.94). The purpose for the framework is for practitioners not to make mistakes that are common in assessing net economic impacts from a tourist event. The authors include anyone and everyone that attend the tourist event from the local residents, media, performers,
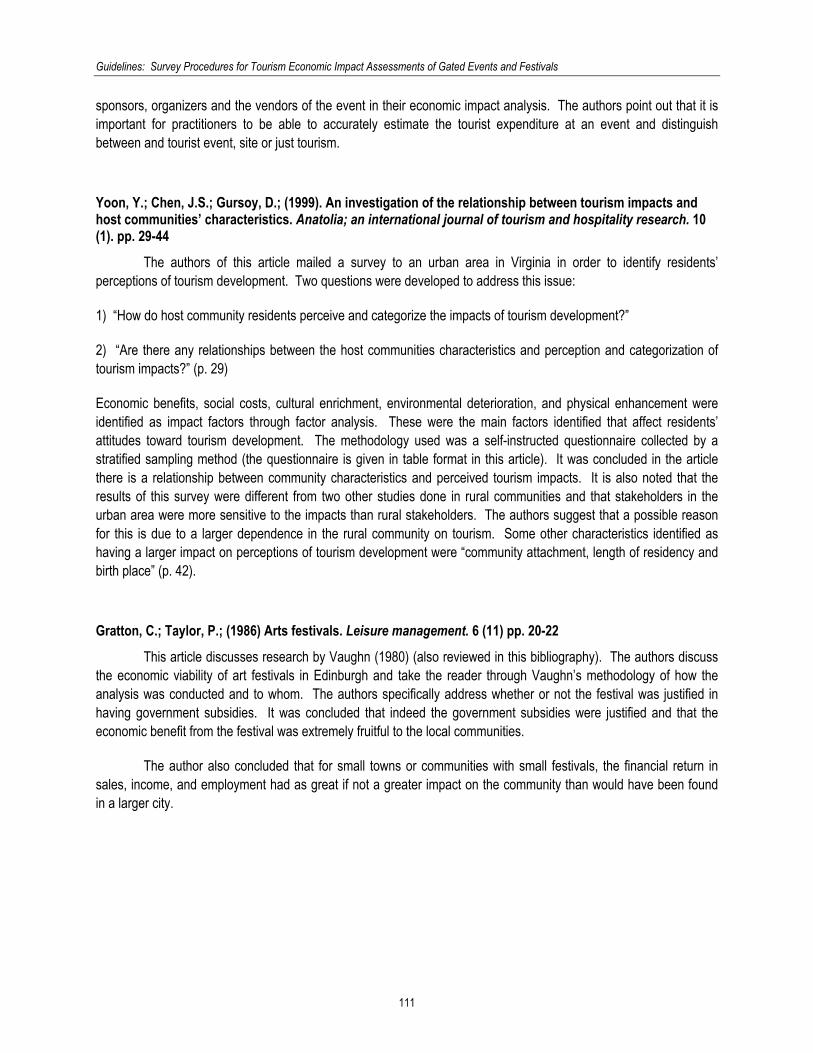
Guidelines: Survey Procedures for Tourism Economic Impact Assessments of Gated Events and Festivals
111
sponsors, organizers and the vendors of the event in their economic impact analysis. The authors point out that it is important for practitioners to be able to accurately estimate the tourist expenditure at an event and distinguish between and tourist event, site or just tourism.
Yoon, Y.; Chen, J.S.; Gursoy, D.; (1999). An investigation of the relationship between tourism impacts and host communities’ characteristics. Anatolia; an international journal of tourism and hospitality research. 10 (1). pp. 29-44
The authors of this article mailed a survey to an urban area in Virginia in order to identify residents’ perceptions of tourism development. Two questions were developed to address this issue:
1) “How do host community residents perceive and categorize the impacts of tourism development?”
2) “Are there any relationships between the host communities characteristics and perception and categorization of tourism impacts?” (p. 29)
Economic benefits, social costs, cultural enrichment, environmental deterioration, and physical enhancement were identified as impact factors through factor analysis. These were the main factors identified that affect residents’ attitudes toward tourism development. The methodology used was a self-instructed questionnaire collected by a stratified sampling method (the questionnaire is given in table format in this article). It was concluded in the article there is a relationship between community characteristics and perceived tourism impacts. It is also noted that the results of this survey were different from two other studies done in rural communities and that stakeholders in the urban area were more sensitive to the impacts than rural stakeholders. The authors suggest that a possible reason for this is due to a larger dependence in the rural community on tourism. Some other characteristics identified as having a larger impact on perceptions of tourism development were “community attachment, length of residency and birth place” (p. 42).
Gratton, C.; Taylor, P.; (1986) Arts festivals. Leisure management. 6 (11) pp. 20-22
This article discusses research by Vaughn (1980) (also reviewed in this bibliography). The authors discuss the economic viability of art festivals in Edinburgh and take the reader through Vaughn’s methodology of how the analysis was conducted and to whom. The authors specifically address whether or not the festival was justified in having government subsidies. It was concluded that indeed the government subsidies were justified and that the economic benefit from the festival was extremely fruitful to the local communities.
The author also concluded that for small towns or communities with small festivals, the financial return in sales, income, and employment had as great if not a greater impact on the community than would have been found in a larger city.

Guidelines: Survey Procedures for Tourism Economic Impact Assessments of Gated Events and Festivals
112
Vaughn, D.R. (1980) Does a festival pay? Economic policy for the arts. pp. 319-331.
This is the study discussed by Gratton and Taylor (1986) [see above]. Vaughn conducted interviews with 660 groups of visitors to the events of which 360 gave details regarding the groups’ expenditures. Vaughn gives details into the formulas for deriving multipliers.
He argues that success of a festival must be defined by the stakeholders and that economic gain is not necessarily the primary arbitrator for success, but rather there are social implications as well. Vaughn states that managers not only need to count how many visitors attend a festival, but what types as well; thus providing better or different accommodations for guests and visitors to the festivals. This analysis gives guidance on how tourism should be developed. Vaughn concluded that “festivals [are]…major economic assets which produce a measurable financial return” (p. 329). Auld, T.; McArthur, S. (2003). Does event-driven tourism provide economic benefits? A case study from the Manawatu region of New Zealand. Tourism economics; the business and finance of tourism and recreation. 9 (2) pp. 191- 201.
This article discusses whether or not events in the Manawatu region of New Zealand are economically beneficial. The authors used incremental analysis and estimated the “changes to costs and revenues arising from an event compared with the no-event situation” (pp193). The authors discuss opportunity costs and define two economic costs:
1) explicit costs, which involve monetary exchange when they are incurred (these are the ordinary payments identified by most people as costs, such as wages or payments for printed advertising) and
2) implicit or ‘invisible’ costs, which involve no monetary exchange when they are incurred (these include items such as foregone incomes or depreciation on assets).
The authors used a self-administered ‘tick the box’ survey as means for data collection. A problem arising from this is double-counting of expenditures as several events were being held at the same time. Flaws within their questionnaire were not taking day trippers into account and “failure to ask respondents the number of people accounted for in their expenditure estimates” (p 196). However, in conclusion the authors state that the events did generate economic benefits to the region, but discuss problems with time switchers, and locals.
Gratton, C; Taylor, P; (1986). Economic impact study. Hayfield International Jazz Festival. Leisure Management. 6 (10), pp. 19-21
This article gives a brief view of the economic impacts to a small village, Hayfield – outside of Manchester, from a jazz festival held annually. This article gives a chart of the total expenditures directly associated with the festival along with the total expenditures.
The authors then give a brief account of multipliers and discuss the information obtained from the festival. The authors point out that during the festival the local hotels, motels, and campsite were completely full, the authors recommend that a study be done of the locals in order to discover the negative affects such as dissatisfaction with the event and amount of visitors to the local area. The authors do, however, conclude that the overall economic impact to the area was an increase from previous years.

Guidelines: Survey Procedures for Tourism Economic Impact Assessments of Gated Events and Festivals
113
Mitchell, C.; Wall, G.; (1986). Impacts of cultural festivals on Ontario communities. Recreation Research Review. 13 (1). pp. 28-37.
The objective of this article was to offer evidence that festivals and events attract outside visitors, increases sales of local businesses and attract new enterprises to the community. The authors, through Dun and Bradstreet Analysis, identify nine business types or groups which are relevant to the Blyth festival in Ontario, Canada. These are the following: agriculture, communications, construction, finance, manufacturing, retail, service, transportation, and wholesaling (p. 30). The authors found that prior to the era of festivals, agriculture, construction, financial, and transportation increased while retail (-9), service (-4) and manufacturing functions (-3) all declined. However, wholesale, transportation, service and retail functions increased during the festival period (tables and charts are given – p. 31).
The authors distributed a survey to the local businesses in the area in August of 1985 in order to evaluate which businesses rely heavily on the festival. Through this survey which netted a 95% response rate from retail, accommodations, and dining establishments found that three businesses had been formed as a direct result from the festival. The authors concluded that while the economic impact to the rest of the community was minimal at best, the overall impact of the festival was positive.
Felsenstein, D.; Fleischer, A. (2003). Local Festivals and Tourism Promotion: The Role of Public Assistance and Visitor Expenditure. Journal of Travel Research. Vol. 41 pp. 385-392.
The authors of this study of two festivals in Northern Israel discuss the rationalization for public assistance for these festivals. The authors present a method in order to account for increases in local income. The authors argue that most economic impact studies of festivals do not go far enough in their evaluation process and do not show how the income of the festival is distributed to the locals that are not directly involved with the festival.
In the authors methodology they separate local expenditures from local residents and non-local residents. The authors give a formula for calculating the economic growth which is represented by an increase in private and public income as a result of the festival. How they derived this formula and methodology is discussed at length by the authors. The conclusions of this article show that there is a net growth in personal and local income, but it needs to be kept in proportion. This is done by “accurately representing their full effects, avoiding double-counting and the inclusion of expenditures that would have occurred in the absence of the festival” (391).
Kim, K.; Uysal, M. (2003 ) Perceived Socio-Economic Impacts of Festivals and Events Among Organizer. Journal of Hospitality & Leisure Marketing. 10 (3/4) pp. 159-171.
The authors of this article discuss and argue two areas of interest; “(1) to delineate the organizers perception of socio-economic impacts of the festival and event tourism, and (2) to compare these results with those of attendees from the literature” (p 159). The authors discuss at length that while economic impacts are relatively easy to study and understand and give direct input and results back to the community, impacts such as noise, pollution, and congestion and are not easily measured and can result in negative attitudes within the community towards a festival, event or tourism in general.
The authors discuss the methodology, the instrument, and results (with charts and graphs) used in collecting and analyzing data from event organizers in the Commonwealth of Virginia. The authors concluded from

Guidelines: Survey Procedures for Tourism Economic Impact Assessments of Gated Events and Festivals
114
the survey that organizers perceived four socio-economic impacts and discuss the results of the following: community cohesiveness; economic benefits; social costs; and social incentives. The survey concluded that negative impacts such as crime, congestion, social costs and pressure on local services increased substantially. Policy considerations are suggested by the authors in order to give a more positive view of the event to the local communities. Burgan, B; Mules, T.; (2001) Reconciling cost-benefit and economic impact assessment for event tourism. Tourism Economics: the business and finance of tourism and recreation. 7 (4) pp. 321-330.
The authors of this paper discuss the differences and benefits of economic impact analysis vs. cost-benefit analysis (CBA) approach to tourism events and festivals. The authors argue that there is “common ground” in regards to economic impact analysis and cost-benefit analysis. The authors discuss in detail the principles of CBA and the benefits the spending has on the community and region.
The paper concludes that economic impact analysis is an appropriate way to measure the costs/benefits of an event for a community. Bernthal, M.; Regan, T. (2004). The Economic Impact of a NASCAR Racetrack on a Rural Community and Region. Sport Marketing Quarterly. 13, pp. 26-34.
The authors study the economic impact of multiple events at a NASCAR Racetrack to the region. Methodology of the study and results from using the IMPLAN model are discussed and charted. The authors determined the “amount of dollars that circulates” in the region as a result of the raceway. The authors give characteristics of those sampled and included locals in their study. Using IMPLAN the authors were able to determine the economic impact of the events to the region as well as where the attendees spent their monies. The authors discovered that more money was spent outside the track than inside and concluded that economic impact studies are “extremely valuable” as a marketing tool for NASCAR. The study also concluded that the impact to the area in direct, indirect and induced impacts were remarkable.
Stynes, D. J., Sun, Y. (2004). Economic Impacts of National Heritage Area Visitor Spending: Summary Results from Seven National Heritage Area Visitor Surveys. East Lansing, Michigan; Department of Community, Agriculture, Recreation and Resource Studies, Michigan State University.
The authors of this report summarize survey results to seven National Heritage Areas. They specifically look at four types of visitors: local residents, day trips from outside the local area, overnight trip stays in the local hotels and motels and overnight trip stays with friends or relatives. The authors discuss the methods of collecting the surveys, response rates and non-response bias for the mail back survey, and the economic impact methods. The authors used the MGM2 (money generation model) model.
The authors discuss the survey results which include the following: trip characteristics and awareness, lodging segments, spending profiles, and economic impacts of National Heritage Areas.
Stynes, D. J., Propst, D.B., Chang, W., Sun, Y. (2000). Estimating national park visitor spending and economic impacts: The MGM2 model. East Lansing, Michigan; Department of Community, Agriculture, Recreation and Resource Studies, Michigan State University.

Guidelines: Survey Procedures for Tourism Economic Impact Assessments of Gated Events and Festivals
115
Chhabra, D.; Sills, E.; Cubbage, F. (2003). The Significance of festivals to Rural Economies: estimating the Economic Impacts of Scottish Highland games in North Carolina. Journal of Travel Research. 41 pp. 421-427.
The authors of this paper discuss the economic impact of two Scottish festivals in North Carolina and how the impact depends on different characteristics of the festival and local economy (other attractions). The method used was self-administered surveys at the site of the festival. Analysis of the data collected was done with IMPLAN. The authors noted that lodging had the greatest economic impact on the area for multi-day festivals, whereas beverages and food had the greatest impact on single day festivals.
The authors noted also discussed the reasons behind the different multipliers for the festivals. They argue that this is due in part to the magnitude of each festival and area of leakage.
Snowball, J.; Antrobus, G. Valuing the arts: Pitfalls in economic impact studies of arts festivals.
The authors of this article argue that in the case of arts festivals economic impact studies do not quantify or estimate the value of such festivals and that the willingness to pay should be added into the survey.
The authors study the ‘pitfalls’ of economic impact studies. Theses include the following: defining the area of study, including local spectators, including time switchers and casuals, determining the size of the multiplier, and employment multiplier. It is further argued by the authors that economic impact studies do not take into account opportunity costs.
The authors concluding remarks argue that the true value of an arts festival cannot be measured using economic impact studies; rather contingent valuation methods should be used in order to discover the value or worth of an arts festival. Dwyer, L.; Forsyth, P.; Spurr, R. (2005). Estimating the Impacts of Special Events on an Economy. Journal of Travel Research. 43 (4). pp. 351-359.
The authors of this article argue that the widely used Input-Output analysis in special events or festivals is rejected in other areas of economic impacts. The authors discuss and contrast comprehensive computable general equilibrium (CGE) as the alternative to the traditional I/P models. The authors argue that the CGE model gives a better description and broader base of the impact by increase tourism to an area.
The authors argue that the CGE model best illustrates the impact of an event on the economy as a whole and that this will allow the government agencies to do a better cost analysis and benefits of such events. Jackson, J.; Houghton, M.; Russell, R.; Triandos, P. (2005). Innovations in Measuring Economic Impacts of Regional Festivals: A Do It Yourself Kit. Journal of Travel Research. 43 pp. 360-367.
The authors of this article have developed a tool in which festival and event organizers can use a “do it yourself” kit to measure the economic impacts of a festival or event to the region. This kit is designed to be inexpensive, duplicated, and replicated. The article discusses the importance of festivals and the importance of evaluating the festival impacts. Discussion of how the team disseminated the kit to the region and managers is discussed.
Results of the case study showed that the response rate was close to 100% and was used by small and large events and festivals. Reception of the kit was good as several organizers requested to use again in the future.

Guidelines: Survey Procedures for Tourism Economic Impact Assessments of Gated Events and Festivals
116
The authors concluded that this kit would help to standardize the criteria for evaluating the economic impact or significance of an event. This would help organizers to better market their festival or event.
I. Ungated Events Brothers, G.L., & Brantley, V. (1993). Tag and Recapture: testing an attendance estimation technique for an open access special event. Festival Management & Event Tourism, Vol. 1, pp. 143-146.
The authors of this article discuss a standardized methodology of estimating number of visitors at open access festivals and events. They tested the “tag and recapture” method which is used in counting the population of wildlife. The authors discuss the methodology behind “tag and recapture” and give formulas to utilize.
The authors concluded that the “tag and recapture” method was fairly accurate in the estimation of the visitors to the event, but said that the number of visitor tagged should have been increased to further increase accuracy.
Caughley, G. (1974). Bias in aerial surveys. The Journal of Wildlife Management. Vol. 38, pp. 921-933.
The author argues that in large mammal aerial census there seems to be some bias. The accuracy deteriorates with larger transect width, speed and altitude. He discusses the weaknesses with aerial surveys and how to decrease bias. The author suggests techniques in which bias can be eliminated from the study. Caughley gives a method in which the bias can be measured and correct the estimates. The author concludes with a seven step process in which to decrease or account for bias in estimation.
Hofstee, P. (1984). Simple and cheap do-it-yourself technique. Cities. 1 (3) pp. 243-247.
This author discusses the economically viable method of small format aerial photography used to approximate maps of cities. The author states that it only requires a single engine airplane, pilot and photographer. This method is used when “no precision mapping is required”. The author discusses how the light aircraft do not need airports but can take off from pastures, roads, football fields, etc.
Myers, R.A., & Bowen, W.D. (1989). Estimating bias in aerial surveys of Harp Seal production. Journal of Wildlife Management. Vol. 53, pp. 361-372.
This article suggests ways in which to reduce bias in aerial surveys. However, this article primarily discusses the inability of aerial photography to locate all whelping grounds of the Harp Seal. The authors do provide equations in which to reduce bias in aerial photography.

Guidelines: Survey Procedures for Tourism Economic Impact Assessments of Gated Events and Festivals
117
Ralston, L.S. (1992). The Application of Systematic Survey Methods at Open Access Special Events and Festivals. Visions in Leisure and Business, 11(3), 18-24.
This article discusses and attempts to validate the use of self-administered surveys at an open access event. The author talks about previous literature in regards to this method. Un-gated and multi-entrance events and the method in which to distribute the survey materials are discussed.
Raybould, M., Mules, T., Fredline, E., & Tomljenovic, R. (2000). Counting the herd using aerial photography to estimate attendance at open events. Event Management. Vol. 6, pp. 25-32.
The authors discuss the need for researchers estimating attendance to open access daytime events in which economic impact studies are being conducted. The researchers discuss other methods such as tag and recapture, parade counts, entrance and exit counts, and finally aerial photography. The conclusion from these authors is that no one method is right for all applications. However, the authors suggest that for daytime, open air events aerial photography is the most cost effective method.
Sutherland, W.J. (1996). Mammals In W.J. Sutherland (Ed). Ecological census techniques: A handbook. pp. 260-278. Melbourne, Australia: Cambridge University Press.
The author of this chapter discusses the problems with counting mammals that are secretive or “out of view” of the counter. Methods are suggested along with advantages and disadvantages for counting large mammals in wildlife as well as bias. Strip and line transects, aerial strip and line transects are discussed in some detail and examples given. One method described in counting practices in the call method. This is where the vocalizations of mammals can be recorded and then counted. Advantages, disadvantages and bias are given for this method as well.
Other methods such as trapping and counting footprints and runways are discussed but the author suggests that counting footprints only gives the observer a sense of how dense the population is.
Trenkel, V.; Buckland, S.; McLean, C.; & Elston, D. (1997). Evaluation of Aerial Line Transect Methodology for Estimating Red Deer (Cervus elaphus) Abundance in Scotland. Journal of Environmental Management. 50, pp. 39- 50.
The authors of this article compare three studies performed in Scotland on Red Deer. The authors argue that aerial line transect surveys were adequate in estimating the number of deer in the population as well as stags, hinds and calves. The authors discuss the efficiency of the aerial line transect versus conventional ground based census. The authors find that the aerial line transect greatest us is when a large area is being censused and the population is large whereas, a ground census is better for small populations.

Guidelines: Survey Procedures for Tourism Economic Impact Assessments of Gated Events and Festivals
118
Tyrrell, T.J., Williams, P., & Johnston, R.J. (2003). How Many Visitors Were There? Presented to the 53rd AIEST Congress. Athens, Greece. September 10.
This article discusses ways in which to identify at a multi-event where ticketed patrons may come and go to several different venues. Survey data are discussed as to what should be collected and how. A visitor count model is diagrammed in order to estimate the number and types of visitors to a multi-venue event.
Vaughan, D.R., Farr, H. & Slee, R.W. (2000). Estimating and interpreting the local economic benefits of visitor spending: an explanation. Leisure Studies. Vol. 19, pp. 95-118.
This article discusses the use of economic impacts of visitor spending and addresses the issue of validity, relevance, and interpretation as well as data collection and analysis. The authors discuss the methodology of a three year study from Exmoor National Park. This paper discusses various ways to collect data through sampling and how to develop questionnaires. Discussed at length is direct, indirect and induced impacts and how to analyze these.
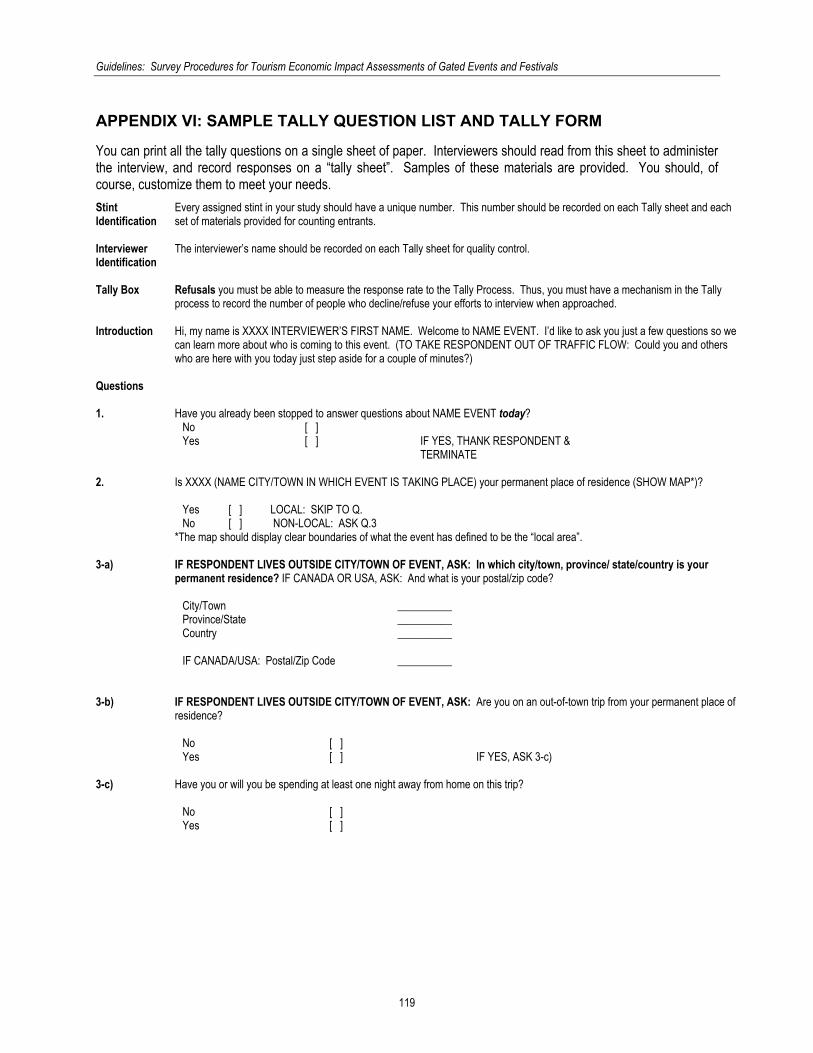
Guidelines: Survey Procedures for Tourism Economic Impact Assessments of Gated Events and Festivals
119
APPENDIX VI: SAMPLE TALLY QUESTION LIST AND TALLY FORM
You can print all the tally questions on a single sheet of paper. Interviewers should read from this sheet to administer the interview, and record responses on a “tally sheet”. Samples of these materials are provided. You should, of course, customize them to meet your needs. Stint Identification
Every assigned stint in your study should have a unique number. This number should be recorded on each Tally sheet and each set of materials provided for counting entrants.
Interviewer Identification
The interviewer’s name should be recorded on each Tally sheet for quality control.
Tally Box Refusals you must be able to measure the response rate to the Tally Process. Thus, you must have a mechanism in the Tally
process to record the number of people who decline/refuse your efforts to interview when approached. Introduction Hi, my name is XXXX INTERVIEWER’S FIRST NAME. Welcome to NAME EVENT. I’d like to ask you just a few questions so we
can learn more about who is coming to this event. (TO TAKE RESPONDENT OUT OF TRAFFIC FLOW: Could you and others who are here with you today just step aside for a couple of minutes?)
Questions
1. Have you already been stopped to answer questions about NAME EVENT today? No [ ] Yes [ ] IF YES, THANK RESPONDENT &
TERMINATE 2. Is XXXX (NAME CITY/TOWN IN WHICH EVENT IS TAKING PLACE) your permanent place of residence (SHOW MAP*)?
Yes [ ] LOCAL: SKIP TO Q. No [ ] NON-LOCAL: ASK Q.3
*The map should display clear boundaries of what the event has defined to be the “local area”. 3-a) IF RESPONDENT LIVES OUTSIDE CITY/TOWN OF EVENT, ASK: In which city/town, province/ state/country is your
permanent residence? IF CANADA OR USA, ASK: And what is your postal/zip code?
City/Town __________ Province/State __________ Country __________
IF CANADA/USA: Postal/Zip Code __________
3-b) IF RESPONDENT LIVES OUTSIDE CITY/TOWN OF EVENT, ASK: Are you on an out-of-town trip from your permanent place of
residence?
No [ ] Yes [ ] IF YES, ASK 3-c)
3-c) Have you or will you be spending at least one night away from home on this trip?
No [ ] Yes [ ]
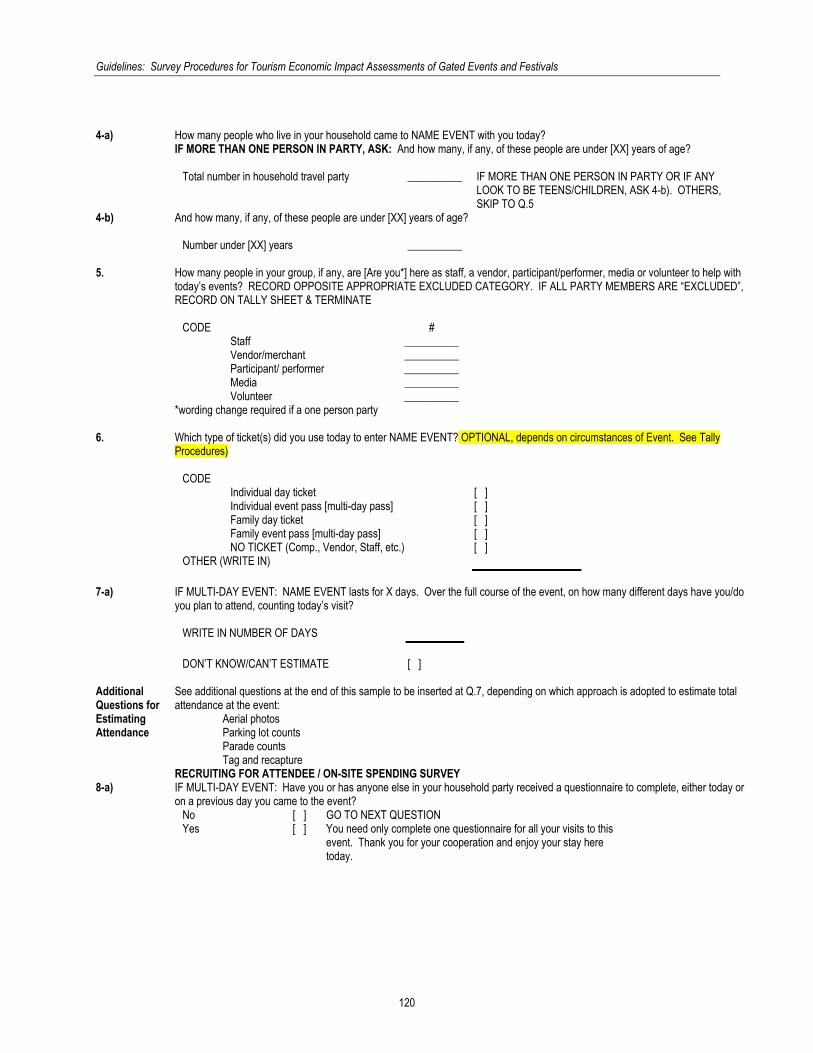
Guidelines: Survey Procedures for Tourism Economic Impact Assessments of Gated Events and Festivals
120
4-a) How many people who live in your household came to NAME EVENT with you today?
IF MORE THAN ONE PERSON IN PARTY, ASK: And how many, if any, of these people are under [XX] years of age?
Total number in household travel party __________ IF MORE THAN ONE PERSON IN PARTY OR IF ANY LOOK TO BE TEENS/CHILDREN, ASK 4-b). OTHERS, SKIP TO Q.5
4-b) And how many, if any, of these people are under [XX] years of age?
Number under [XX] years __________
5. How many people in your group, if any, are [Are you*] here as staff, a vendor, participant/performer, media or volunteer to help with today’s events? RECORD OPPOSITE APPROPRIATE EXCLUDED CATEGORY. IF ALL PARTY MEMBERS ARE “EXCLUDED”, RECORD ON TALLY SHEET & TERMINATE
CODE # Staff __________ Vendor/merchant __________ Participant/ performer __________ Media __________ Volunteer __________
*wording change required if a one person party
6. Which type of ticket(s) did you use today to enter NAME EVENT? OPTIONAL, depends on circumstances of Event. See Tally Procedures)
CODE Individual day ticket [ ] Individual event pass [multi-day pass] [ ] Family day ticket [ ] Family event pass [multi-day pass] [ ] NO TICKET (Comp., Vendor, Staff, etc.) [ ]
OTHER (WRITE IN)
7-a) IF MULTI-DAY EVENT: NAME EVENT lasts for X days. Over the full course of the event, on how many different days have you/do you plan to attend, counting today’s visit?
WRITE IN NUMBER OF DAYS
DON’T KNOW/CAN’T ESTIMATE [ ]
Additional Questions for Estimating Attendance
See additional questions at the end of this sample to be inserted at Q.7, depending on which approach is adopted to estimate total attendance at the event: Aerial photos Parking lot counts Parade counts Tag and recapture
RECRUITING FOR ATTENDEE / ON-SITE SPENDING SURVEY 8-a) IF MULTI-DAY EVENT: Have you or has anyone else in your household party received a questionnaire to complete, either today or
on a previous day you came to the event? No [ ] GO TO NEXT QUESTION Yes [ ] You need only complete one questionnaire for all your visits to this
event. Thank you for your cooperation and enjoy your stay here today.

Guidelines: Survey Procedures for Tourism Economic Impact Assessments of Gated Events and Festivals
121
8-b) Non-local
NON-LOCAL: In order for us to learn more about your reactions to NAME EVENT and spending on your trip, would the person most able to report on spending for all people in your household who are on the trip with you please complete this short survey just before you leave the site today? You can drop the completed questionnaire in one of the specially labelled boxes at [NAME LOCATION(S) OF DROP OFF BOXES] or return it to us by mail in the postage paid envelope we have provided. IF USING AN INCENTIVE, CONSTRUCT THE APPROPRIATE STATEMENT: As a thank you for your cooperation, once we have your completed survey, we will provide you with/ you will have a chance to win [NAME PRIZE], etc.
Refuses to accept questionnaire [ ] Accepts questionnaire [ ] RECORD UNIQUE ID FROM
Q’AIRE ON TALLY SHEET IF ACCEPTS: Could I please have a telephone number (including area code) where I can reach you at home and the first name of the person who will complete this survey, just in case we have to follow-up on any of your answers? RECORD PHONE NUMBER RECORD FIRST NAME OF RESPONDENT
8-b) Local LOCAL: In order for us to learn more about your reactions to NAME EVENT and spending at this event, would the person most
able to report on spending for all people in your household who came to this event with you please complete this short survey just before you leave the site today? You can drop the completed questionnaire in one of the specially labelled boxes at [NAME LOCATION(S) OF DROP OFF BOXES] or return it to us by mail in the postage paid envelope we have provided. IF USING AN INCENTIVE, CONSTRUCT THE APPROPRIATE STATEMENT: As a thank you for your cooperation, once we have your completed survey, we will provide you with/ you will have a chance to win [NAME PRIZE], etc.
Refuses to accept questionnaire [ ] Accepts questionnaire [ ] RECORD UNIQUE ID FROM
Q’AIRE ON TALLY SHEET IF ACCEPTS: Could I please have a telephone number (including area code) where I can reach you at home and the first name of the person who will complete this survey, just in case we have to follow-up on any of your answers? RECORD PHONE NUMBER RECORD FIRST NAME OF RESPONDENT
Thank respondent for his/her cooperation. INTERVIEWER NOTE: REMEMBER TO WRITE UNIQUE ID NUMBER FROM ATTENDEE SURVEY FORM ON YOUR TALLY SHEET BEFORE DISTRIBUTING THE ATTENDEE QUESTIONNAIRE.

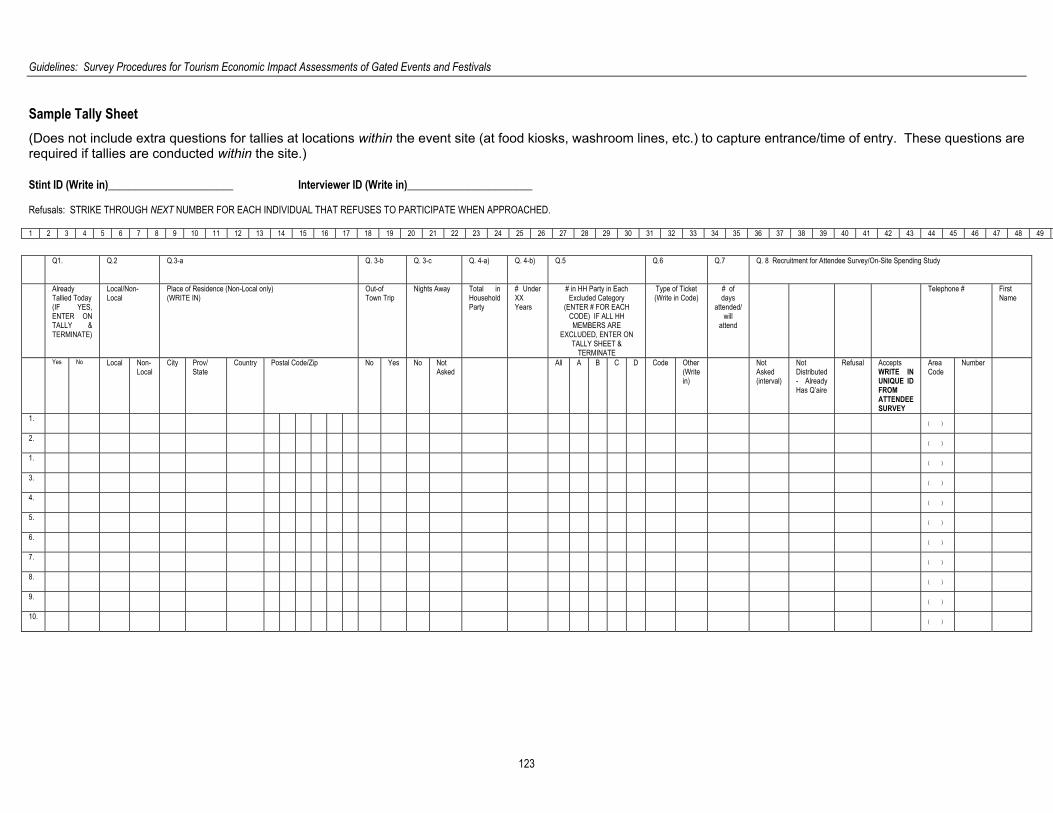
Guidelines: Survey Procedures for Tourism Economic Impact Assessments of Gated Events and Festivals
123
Sample Tally Sheet (Does not include extra questions for tallies at locations within the event site (at food kiosks, washroom lines, etc.) to capture entrance/time of entry. These questions are required if tallies are conducted within the site.) Stint ID (Write in)_______________________ Interviewer ID (Write in)_______________________ Refusals: STRIKE THROUGH NEXT NUMBER FOR EACH INDIVIDUAL THAT REFUSES TO PARTICIPATE WHEN APPROACHED. 1 2 3 4 5 6 7 8 9 10 11 12 13 14 15 16 17 18 19 20 21 22 23 24 25 26 27 28 29 30 31 32 33 34 35 36 37 38 39 40 41 42 43 44 45 46 47 48 49
Q1. Q.2 Q.3-a Q. 3-b Q. 3-c
Q. 4-a) Q. 4-b) Q.5 Q.6 Q.7 Q. 8 Recruitment for Attendee Survey/On-Site Spending Study
Already Tallied Today (IF YES, ENTER ON TALLY & TERMINATE)
Local/Non-Local
Place of Residence (Non-Local only) (WRITE IN)
Out-of Town Trip
Nights Away
Total in Household Party
# Under XX Years
# in HH Party in Each Excluded Category
(ENTER # FOR EACH CODE) IF ALL HH MEMBERS ARE
EXCLUDED, ENTER ON TALLY SHEET &
TERMINATE
Type of Ticket (Write in Code)
# of days
attended/ will
attend
Telephone # First Name
Yes No Local Non-Local
City Prov/ State
Country Postal Code/Zip No Yes No Not Asked
All A B C D Code Other (Write in)
Not Asked (interval)
Not Distributed - Already Has Q’aire
Refusal Accepts WRITE IN UNIQUE ID FROM ATTENDEE SURVEY
Area Code
Number
1. ( )
2. ( )
1. ( )
3. ( )
4. ( )
5. ( )
6. ( )
7. ( )
8. ( )
9. ( )
10. ( )

Guidelines: Survey Procedures for Tourism Economic Impact Assessments of Gated Events and Festivals
124
APPENDIX VII: SAMPLE ATTENDEE SURVEY QUESTIONNAIRES (NON-LOCAL & LOCAL VERSIONS)
NON-LOCAL VERSION
INSTRUCTIONS FOR COMPLETING THIS QUESTIONNAIRE
Who should complete this survey?
An adult on the trip that included a visit to NAME EVENT who is most able to report on spending and activities for all people in this household who went on the trip.
Why is the survey important? Information you provide will help NAME EVENT organizers plan for future events and demonstrate the benefits the event brings to the community and to people like yourself.
Is the information I provide kept confidential?
Yes. All information collected in the survey is used only for statistical analysis. Your responses are never associated with your name and all information you provide is confidential and anonymous. If you want to receive the NAME INCENTIVE be entered in the NAME CONTEST, include your name, address and telephone number in the space provided. This information will be detached from your survey responses and discarded once your gift has been sent/the winner has been notified.
Who can I call to verify the legitimacy of the survey?
Here is a number you can call if you have any questions or wish to verify the legitimacy of the survey (INSERT PHONE NUMBER)
What do I do with the completed survey?
There are “drop off” boxes at each gate or mail it back to us in the postage paid envelope we have provided. The cut-off date for processing returns is Day-Month-Year.
Freedom of Information To be inserted based on regulations in your jurisdiction.
What is the “local” area or “community”?
Please refer to the map included in this questionnaire to identify the boundaries of the “local community” when answering questions about where you spent nights and money.
What is “on-site” spending? By “on-site” (spending), we mean within the event’s immediate area. For example, if you parked at the event’s parking facility, you would write in your parking costs under “on-site spending”, but if you parked a few blocks away, you would enter your parking costs (along with any other parking you paid for on this trip) in “other spending”.
What if I have more than one copy of the questionnaire?
Complete only ONE questionnaire for the entire trip that included one or more visits to NAME EVENT.
What if my trip is not over yet? If your trip is not over, please provide your best estimate of how much money you will spend at NAME EVENT for all your visits to the event and on the entire trip.
Please provide your best estimate of spending for yourself and all other household members (people who live in the same permanent residence) who came on the trip with you.
PROVIDE MAP THAT CLEARLY DISPLAYS THE BOUNDARIES OF THE EVENT SITE’S COMMUNITY (“LOCAL”) AND THE BALANCE OF THE PROVINCE OR STATE FOR WHICH YOU PLAN TO ESTIMATE THE TOURISM ECONOMIC IMPACT.
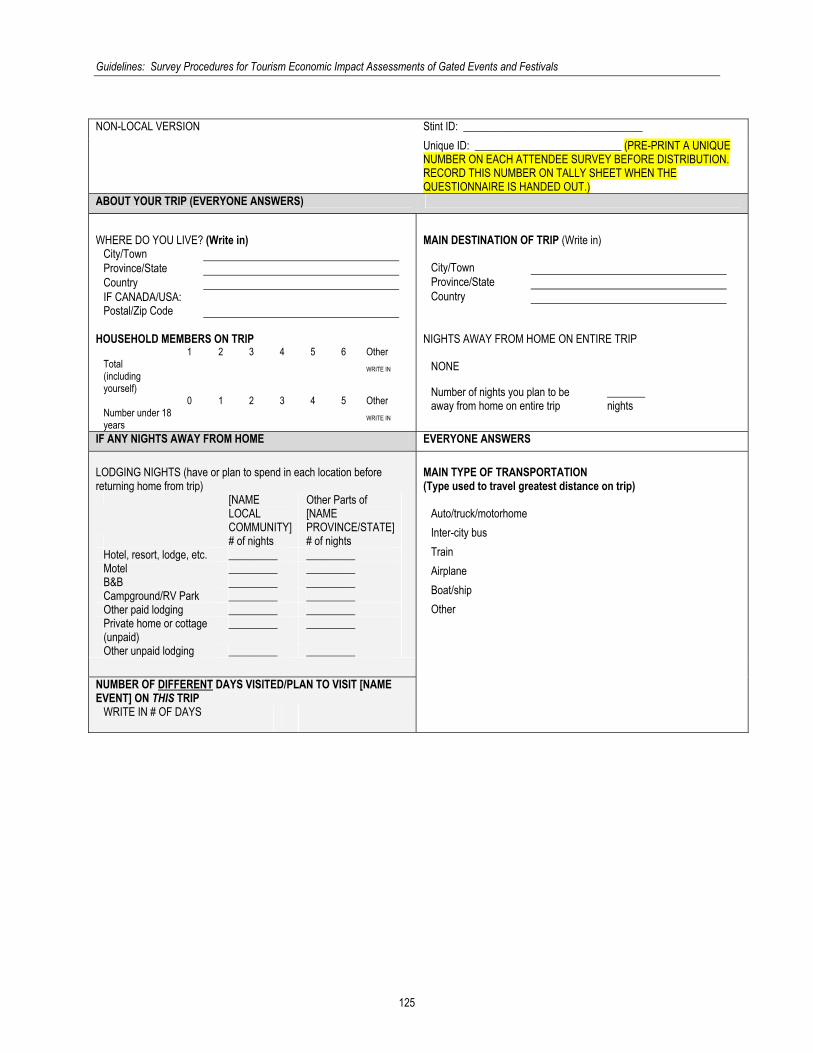
Guidelines: Survey Procedures for Tourism Economic Impact Assessments of Gated Events and Festivals
125
NON-LOCAL VERSION Stint ID: _________________________________ Unique ID: ___________________________ (PRE-PRINT A UNIQUE
NUMBER ON EACH ATTENDEE SURVEY BEFORE DISTRIBUTION. RECORD THIS NUMBER ON TALLY SHEET WHEN THE QUESTIONNAIRE IS HANDED OUT.)
ABOUT YOUR TRIP (EVERYONE ANSWERS) WHERE DO YOU LIVE? (Write in)
City/Town Province/State Country IF CANADA/USA: Postal/Zip Code
MAIN DESTINATION OF TRIP (Write in)
City/Town Province/State Country
HOUSEHOLD MEMBERS ON TRIP 1 2 3 4 5 6 Other Total (including yourself)
p p p p p p WRITE IN
0 1 2 3 4 5 Other Number under 18 years
p p p p p p WRITE IN
NIGHTS AWAY FROM HOME ON ENTIRE TRIP
NONE p
Number of nights you plan to be away from home on entire trip
_______ nights
IF ANY NIGHTS AWAY FROM HOME EVERYONE ANSWERS LODGING NIGHTS (have or plan to spend in each location before returning home from trip)
[NAME LOCAL COMMUNITY]
Other Parts of [NAME PROVINCE/STATE]
# of nights # of nights Hotel, resort, lodge, etc. _________ _________ Motel _________ _________ B&B _________ _________ Campground/RV Park _________ _________ Other paid lodging _________ _________ Private home or cottage (unpaid)
_________ _________
Other unpaid lodging _________ _________
MAIN TYPE OF TRANSPORTATION (Type used to travel greatest distance on trip)
Auto/truck/motorhome p
Inter-city bus p
Train p
Airplane p
Boat/ship p
Other p
NUMBER OF DIFFERENT DAYS VISITED/PLAN TO VISIT [NAME EVENT] ON THIS TRIP
WRITE IN # OF DAYS

Guidelines: Survey Procedures for Tourism Economic Impact Assessments of Gated Events and Festivals
126
EVERYONE ANSWERS EVERYONE ANSWERS HOUSEHOLD MEMBERS WHO WENT TO [EVENT]
1 2 3 4 5 6 Other Total (including yourself)
p p p p p p WRITE IN
0 1 2 3 4 5 Other Number under 18 years
p p p p p p WRITE IN
IMPORTANCE OF EVENT IN DESTINATION CHOICE Circle the number below that best describes how important [EVENT] was in your decision to visit [NAME CITY/TOWN OF EVENT] on this trip, where 0 indicates no influence and 10 is that [NAME EVENT] is the main single reason for visiting [NAME CITY/TOWN] on this trip.
No Influence
Main Reason
Don’t Know
0 1 2 3 4 5 6 7 8 9 10 X SIMILAR RECREATIONAL ACTIVITIES IN COMMUNITY If you had not attended [NAME EVENT] on this trip, would you have gone to some other [SIMILAR TYPE OF EVENT] instead? Please refer to the map, if necessary.
IN [NAME COMMUNITY]
IN [OTHER PARTS OF
PROV/STATE] No p p Yes p p Don’t Know p p
IS THIS TRIP REPLACING A DIFFERENT TRIP? Would you have come to [NAME LOCAL COMMUNITY] in the next three months if you had not come at this time for [NAME EVENT]? Please refer to the map, if necessary.
No p Yes p Don’t Know p
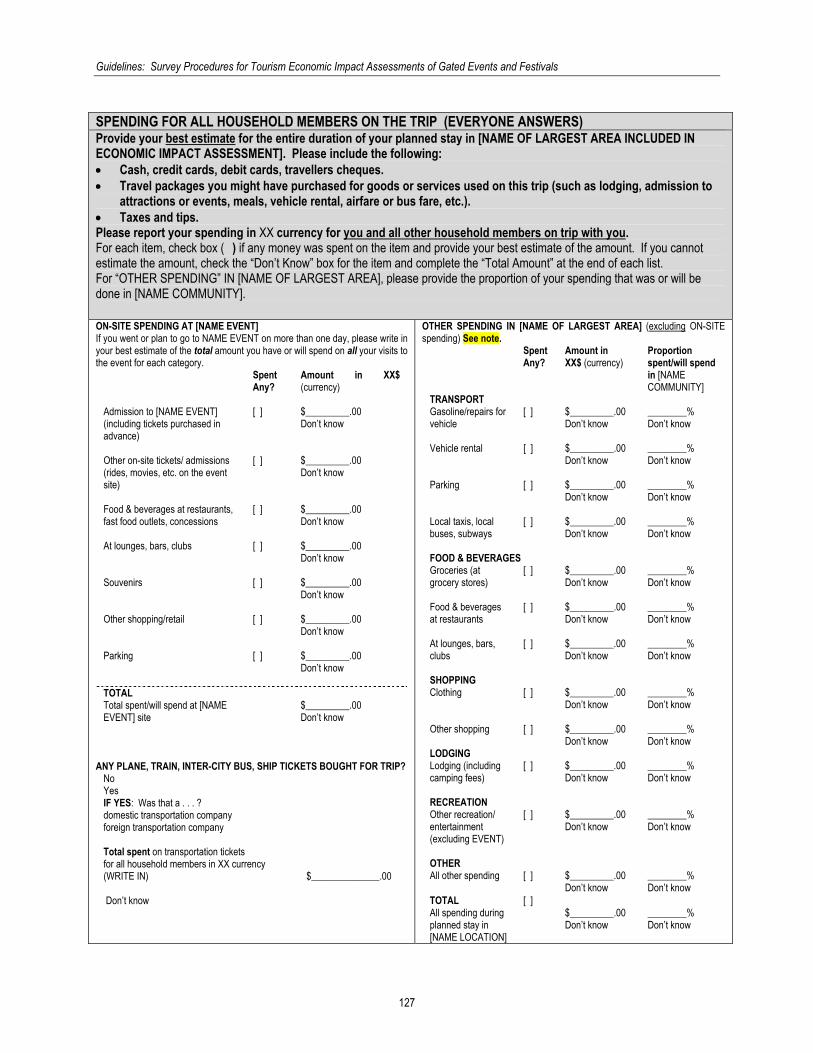
Guidelines: Survey Procedures for Tourism Economic Impact Assessments of Gated Events and Festivals
127
SPENDING FOR ALL HOUSEHOLD MEMBERS ON THE TRIP (EVERYONE ANSWERS) Provide your best estimate for the entire duration of your planned stay in [NAME OF LARGEST AREA INCLUDED IN ECONOMIC IMPACT ASSESSMENT]. Please include the following: • Cash, credit cards, debit cards, travellers cheques. • Travel packages you might have purchased for goods or services used on this trip (such as lodging, admission to
attractions or events, meals, vehicle rental, airfare or bus fare, etc.). • Taxes and tips. Please report your spending in XX currency for you and all other household members on trip with you. For each item, check box (p) if any money was spent on the item and provide your best estimate of the amount. If you cannot estimate the amount, check the “Don’t Know” box for the item and complete the “Total Amount” at the end of each list. For “OTHER SPENDING” IN [NAME OF LARGEST AREA], please provide the proportion of your spending that was or will be done in [NAME COMMUNITY]. ON-SITE SPENDING AT [NAME EVENT] If you went or plan to go to NAME EVENT on more than one day, please write in your best estimate of the total amount you have or will spend on all your visits to the event for each category.
Spent Any?
Amount in XX$ (currency)
Admission to [NAME EVENT] (including tickets purchased in advance)
[ ] $_________.00 Don’t know p
Other on-site tickets/ admissions (rides, movies, etc. on the event site)
[ ]p è $_________.00 Don’t know p
Food & beverages at restaurants, fast food outlets, concessions
[ ]p è $_________.00 Don’t know p
At lounges, bars, clubs [ ] $_________.00 Don’t know p
Souvenirs [ ]p è $_________.00 Don’t know p
Other shopping/retail
[ ] $_________.00 Don’t know p
Parking [ ]p è $_________.00 Don’t know p
TOTAL Total spent/will spend at [NAME EVENT] site
p è $_________.00 Don’t know p
ANY PLANE, TRAIN, INTER-CITY BUS, SHIP TICKETS BOUGHT FOR TRIP?
No p Yes p IF YES: Was that a . . . ? domestic transportation company p foreign transportation company p Total spent on transportation tickets for all household members in XX currency (WRITE IN)
$______________.00
Don’t know p
OTHER SPENDING IN [NAME OF LARGEST AREA] (excluding ON-SITE spending) See note.
Spent Any?
Amount in XX$ (currency)
Proportion spent/will spend in [NAME COMMUNITY]
TRANSPORT Gasoline/repairs for vehicle
[ ]p è $_________.00 Don’t know p
________% Don’t know p
Vehicle rental [ ] $_________.00 Don’t know p
________% Don’t know p
Parking [ ]p è $_________.00 Don’t know p
________% Don’t know p
Local taxis, local buses, subways
[ ] $_________.00 Don’t know p
________% Don’t know p
FOOD & BEVERAGES Groceries (at grocery stores)
[ ]p è $_________.00 Don’t know p
________% Don’t know p
Food & beverages at restaurants
[ ] $_________.00 Don’t know p
________% Don’t know p
At lounges, bars, clubs
[ ]p è $_________.00 Don’t know p
________% Don’t know p
SHOPPING Clothing [ ]p è $_________.00
Don’t know p ________% Don’t know p
Other shopping [ ] $_________.00 Don’t know p
________% Don’t know p
LODGING Lodging (including camping fees)
[ ]p è $_________.00 Don’t know p
________% Don’t know p
RECREATION Other recreation/ entertainment (excluding EVENT)
[ ]p è $_________.00 Don’t know p
________% Don’t know p
OTHER All other spending [ ]p è $_________.00
Don’t know p ________% Don’t know p
TOTAL [ ] All spending during planned stay in [NAME LOCATION]
p è $_________.00 Don’t know p
________% Don’t know p
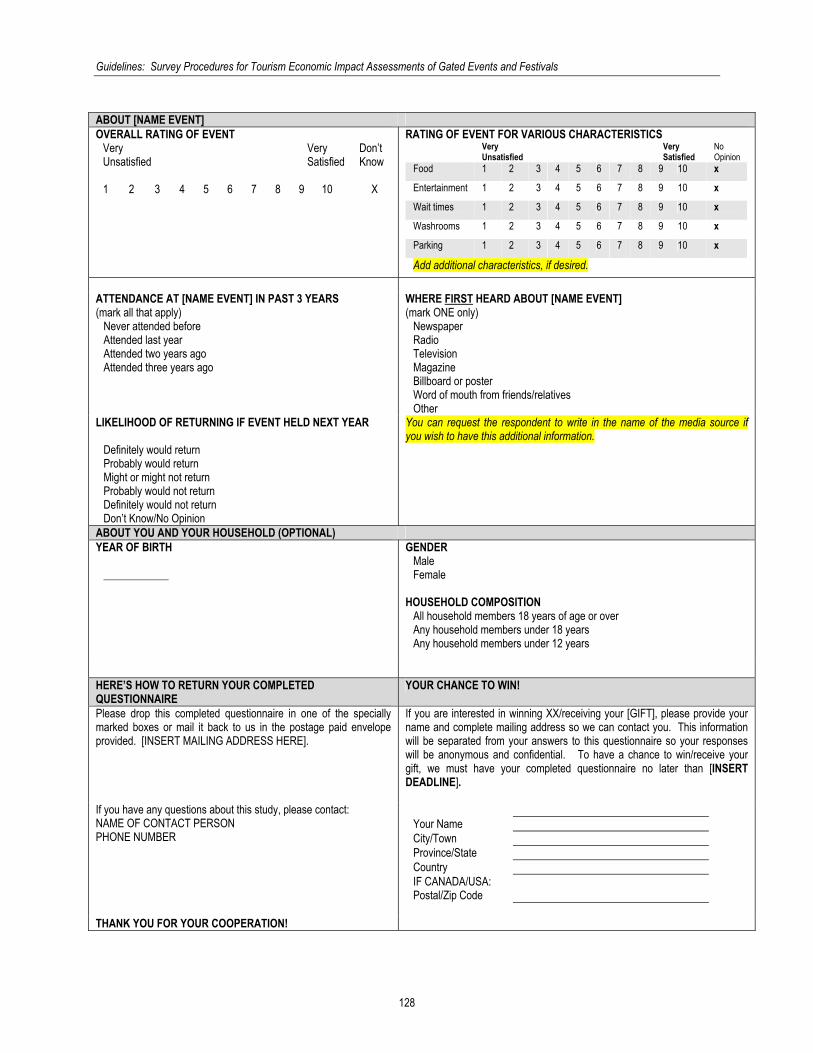
Guidelines: Survey Procedures for Tourism Economic Impact Assessments of Gated Events and Festivals
128
ABOUT [NAME EVENT] OVERALL RATING OF EVENT
Very Unsatisfied
Very Satisfied
Don’t Know
1 2 3 4 5 6 7 8 9 10 X
RATING OF EVENT FOR VARIOUS CHARACTERISTICS Very
Unsatisfied Very
Satisfied No Opinion
Food 1 2 3 4 5 6 7 8 9 10 x
Entertainment 1 2 3 4 5 6 7 8 9 10 x
Wait times 1 2 3 4 5 6 7 8 9 10 x
Washrooms 1 2 3 4 5 6 7 8 9 10 x
Parking 1 2 3 4 5 6 7 8 9 10 x
Add additional characteristics, if desired. ATTENDANCE AT [NAME EVENT] IN PAST 3 YEARS (mark all that apply)
Never attended before p Attended last year p Attended two years ago p Attended three years ago p
WHERE FIRST HEARD ABOUT [NAME EVENT] (mark ONE only)
Newspaper p Radio p Television p Magazine p Billboard or poster p Word of mouth from friends/relatives p Other p
LIKELIHOOD OF RETURNING IF EVENT HELD NEXT YEAR
Definitely would return p Probably would return p Might or might not return p Probably would not return p Definitely would not return p Don’t Know/No Opinion p
You can request the respondent to write in the name of the media source if you wish to have this additional information.
ABOUT YOU AND YOUR HOUSEHOLD (OPTIONAL) YEAR OF BIRTH
____________
GENDER Male p Female p
HOUSEHOLD COMPOSITION
All household members 18 years of age or over p Any household members under 18 years p Any household members under 12 years p
HERE’S HOW TO RETURN YOUR COMPLETED QUESTIONNAIRE
YOUR CHANCE TO WIN!
Please drop this completed questionnaire in one of the specially marked boxes or mail it back to us in the postage paid envelope provided. [INSERT MAILING ADDRESS HERE].
If you are interested in winning XX/receiving your [GIFT], please provide your name and complete mailing address so we can contact you. This information will be separated from your answers to this questionnaire so your responses will be anonymous and confidential. To have a chance to win/receive your gift, we must have your completed questionnaire no later than [INSERT DEADLINE].
If you have any questions about this study, please contact: NAME OF CONTACT PERSON PHONE NUMBER
Your Name City/Town Province/State Country IF CANADA/USA: Postal/Zip Code
THANK YOU FOR YOUR COOPERATION!

Guidelines: Survey Procedures for Tourism Economic Impact Assessments of Gated Events and Festivals
129
NOTE: This sample questionnaire is designed to produce tourism economic impact inputs at the local and provincial or state level. You can, however, add additional “event accounts”, depending on the number of geographical impact areas you wish to assess. For example, you can add columns to the questionnaire and in the analysis such that you can estimate the tourism economic impact for the local community, county, and state.
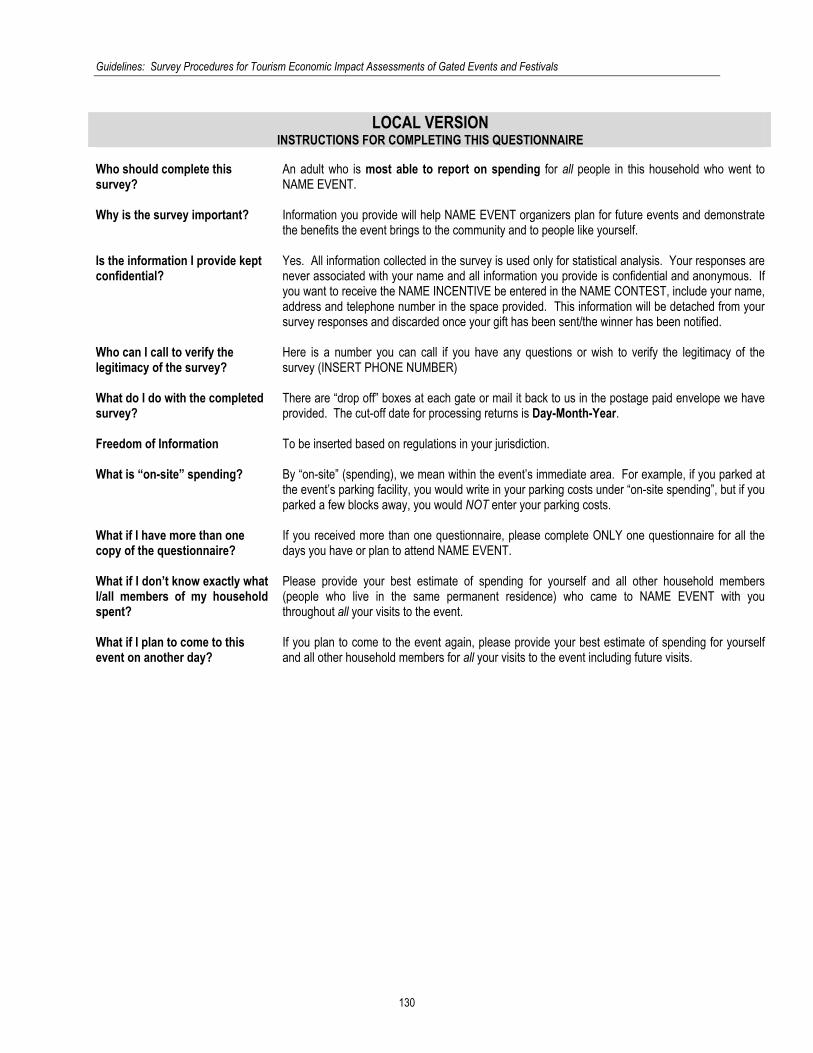
Guidelines: Survey Procedures for Tourism Economic Impact Assessments of Gated Events and Festivals
130
LOCAL VERSION
INSTRUCTIONS FOR COMPLETING THIS QUESTIONNAIRE Who should complete this survey?
An adult who is most able to report on spending for all people in this household who went to NAME EVENT.
Why is the survey important? Information you provide will help NAME EVENT organizers plan for future events and demonstrate
the benefits the event brings to the community and to people like yourself. Is the information I provide kept confidential?
Yes. All information collected in the survey is used only for statistical analysis. Your responses are never associated with your name and all information you provide is confidential and anonymous. If you want to receive the NAME INCENTIVE be entered in the NAME CONTEST, include your name, address and telephone number in the space provided. This information will be detached from your survey responses and discarded once your gift has been sent/the winner has been notified.
Who can I call to verify the legitimacy of the survey?
Here is a number you can call if you have any questions or wish to verify the legitimacy of the survey (INSERT PHONE NUMBER)
What do I do with the completed survey?
There are “drop off” boxes at each gate or mail it back to us in the postage paid envelope we have provided. The cut-off date for processing returns is Day-Month-Year.
Freedom of Information To be inserted based on regulations in your jurisdiction. What is “on-site” spending? By “on-site” (spending), we mean within the event’s immediate area. For example, if you parked at
the event’s parking facility, you would write in your parking costs under “on-site spending”, but if you parked a few blocks away, you would NOT enter your parking costs.
What if I have more than one copy of the questionnaire?
If you received more than one questionnaire, please complete ONLY one questionnaire for all the days you have or plan to attend NAME EVENT.
What if I don’t know exactly what I/all members of my household spent?
Please provide your best estimate of spending for yourself and all other household members (people who live in the same permanent residence) who came to NAME EVENT with you throughout all your visits to the event.
What if I plan to come to this event on another day?
If you plan to come to the event again, please provide your best estimate of spending for yourself and all other household members for all your visits to the event including future visits.

Guidelines: Survey Procedures for Tourism Economic Impact Assessments of Gated Events and Festivals
131
LOCAL VERSION Stint ID: _________________________________ Unique ID: ___________________________ (PRE-PRINT A UNIQUE
NUMBER ON EACH ATTENDEE SURVEY BEFORE DISTRIBUTION. RECORD THIS NUMBER ON TALLY SHEET WHEN THE QUESTIONNAIRE IS HANDED OUT.)
WHERE DO YOU LIVE? (Write in)
City/Town Province/State Country IF CANADA/USA: Postal/Zip Code
OVERALL RATING OF EVENT Very Unsatisfied
Very Satisfied
Don’t Know
1 2 3 4 5 6 7 8 9 10 X
ON-SITE SPENDING AT [NAME EVENT] TODAY RATING OF EVENT FOR VARIOUS CHARACTERISTICS Please report your spending in XX currency for you and all
other household members who came with you to the [EVENT].
If you went or plan to go to the event on more than one day, include spending for you and other members of your household for all your visits to the event. Please include your best estimate of what you will spend on future visits to this event.
By “on the event site” we mean within the boundaries of the event. If you parked or purchased food, beverages or souvenirs near but not on the site, you would NOT include this spending.
Provide your best estimate, including cash, credit cards, debit cards, travellers cheques. Include taxes and tips. Please report your spending in XX currency.
For each item, check box (p) if any money was spent on the item and provide your best estimate of the amount. If you cannot estimate the amount, check the “Don’t Know” box for the item and complete the “Total Amount” at the end of each list.
Very
Unsatisfied Very
Satisfied No Opinion
Food 1 2 3 4 5 6 7 8 9 10 x
Entertain-ment
1 2 3 4 5 6 7 8 9 10 x
Wait times 1 2 3 4 5 6 7 8 9 10 x
Washrooms 1 2 3 4 5 6 7 8 9 10 x
Parking 1 2 3 4 5 6 7 8 9 10 x
Add additional characteristics, if desired. ATTENDANCE AT [NAME EVENT] IN PAST 3 YEARS (mark all that apply)
Never attended before p Attended last year p Attended two years ago p Attended three years ago p
NUMBER OF DIFFERENT DAYS VISITED/PLAN TO VISIT [NAME EVENT]
WRITE IN # OF DAYS

Guidelines: Survey Procedures for Tourism Economic Impact Assessments of Gated Events and Festivals
132
If you went or plan to go to NAME EVENT on more than one day, please write in your best estimate of the total amount you have or will spend on all your visits to the event for each category.
Spent Any?
Amount in XX$ (currency)
Admission to [NAME EVENT] (including tickets purchased in advance)
[ ] $_________.00 Don’t know p
Other on-site tickets/ admissions (rides, movies, etc. on the event site)
[ ] $_________.00 Don’t know p
Food & beverages at restaurants, fast food outlets, concessions
[ ] $_________.00 Don’t know p
At lounges, bars, clubs [ ] $_________.00
Don’t know p
Souvenirs [ ] $_________.00 Don’t know p
Other shopping/retail
[ ] $_________.00 Don’t know p
Parking [ ] $_________.00
Don’t know p
TOTAL Total spent at [NAME EVENT] p è $_________.00
Don’t know p
LIKELIHOOD OF RETURNING IF EVENT HELD NEXT YEAR
Definitely would return p Probably would return p Might or might not return p Probably would not return p Definitely would not return p Don’t Know/No Opinion p
WHERE FIRST HEARD ABOUT [NAME EVENT] (mark ONE only)
Newspaper p Radio p Television p Magazine p Billboard or poster p Word of mouth from friends/relatives p Other p
You can request the respondent to write in the name of the media source if you wish to have this additional information.
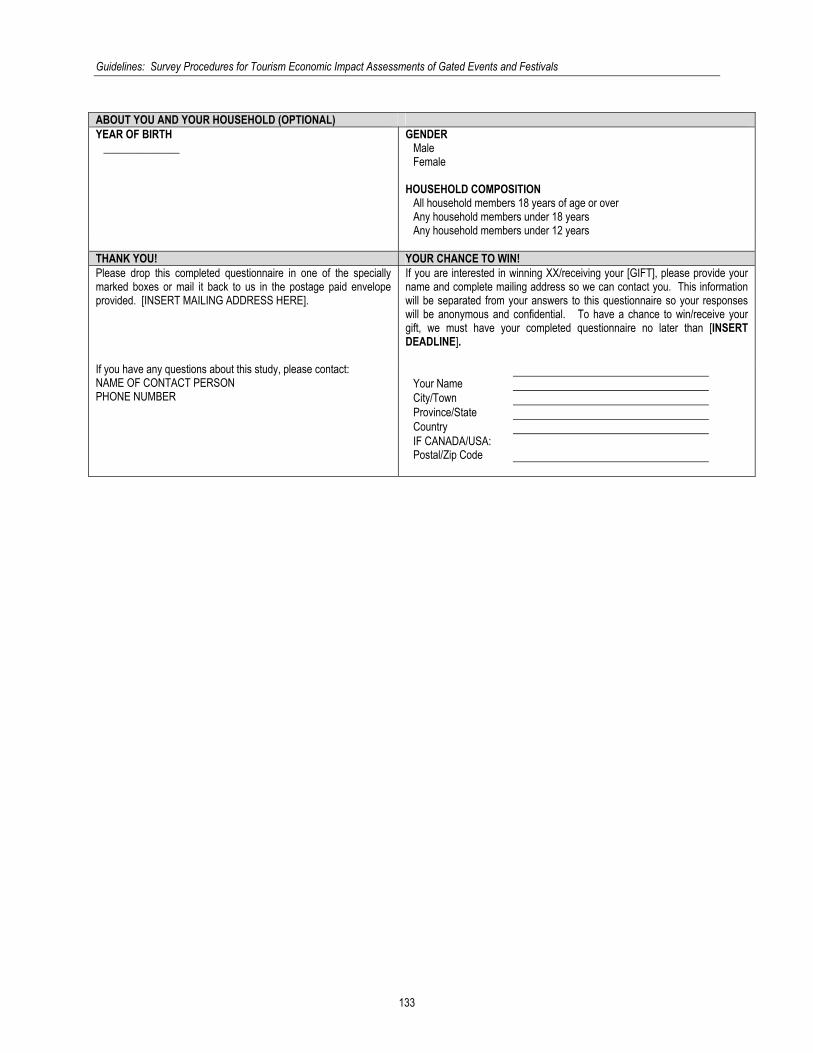
Guidelines: Survey Procedures for Tourism Economic Impact Assessments of Gated Events and Festivals
133
ABOUT YOU AND YOUR HOUSEHOLD (OPTIONAL) YEAR OF BIRTH
______________
GENDER Male p Female p
HOUSEHOLD COMPOSITION
All household members 18 years of age or over p Any household members under 18 years p Any household members under 12 years p
THANK YOU! YOUR CHANCE TO WIN! Please drop this completed questionnaire in one of the specially marked boxes or mail it back to us in the postage paid envelope provided. [INSERT MAILING ADDRESS HERE].
If you are interested in winning XX/receiving your [GIFT], please provide your name and complete mailing address so we can contact you. This information will be separated from your answers to this questionnaire so your responses will be anonymous and confidential. To have a chance to win/receive your gift, we must have your completed questionnaire no later than [INSERT DEADLINE].
If you have any questions about this study, please contact: NAME OF CONTACT PERSON PHONE NUMBER
Your Name City/Town Province/State Country IF CANADA/USA: Postal/Zip Code