Survey on Gender, Equity and Inclusion
62
NISTIR 8362 Survey on Gender, Equity and Inclusion Mary F. Theofanos Jasmine Evans Justyna P. Zwolak Sandra Spickard Prettyman This publication is available free of charge from: https://doi.org/10.6028/NIST.IR.8362
Transcript of Survey on Gender, Equity and Inclusion

NISTIR 8362
Survey on Gender, Equity and Inclusion
Mary F. Theofanos Jasmine Evans
Justyna P. Zwolak Sandra Spickard Prettyman
This publication is available free of charge from: https://doi.org/10.6028/NIST.IR.8362

NISTIR 8362
Survey on Gender, Equity and Inclusion
Mary F. Theofanos Office of Data and Informatics
Material Measurement Laboratory
Jasmine Evans Information Access Division
Information Technology Laboratory
Justyna P. Zwolak Applied and Computational Mathematics Division
Information Technology Laboratory
Sandra Spickard Prettyman Culture Catalyst, LLC
This publication is available free of charge from: https://doi.org/10.6028/NIST.IR.8362
March 2021
U.S. Department of Commerce Gina M. Raimondo, Secretary
National Institute of Standards and Technology
James K. Olthoff, Performing the Non-Exclusive Functions and Duties of the Under Secretary of Commerce for Standards and Technology & Director, National Institute of Standards and Technology
Certain commercial entities, equipment, or materials may be identified in this document in order to describe an experimental procedure or concept adequately.
Such identification is not intended to imply recommendation or endorsement by the National Institute of Standards and Technology, nor is it intended to imply that the entities, materials, or equipment are necessarily the best available for the purpose.
National Institute of Standards and Technology Interagency or Internal Report 8362 Natl. Inst. Stand. Technol. Interag. Intern. Rep. 8362, 62 pages (March 2021)
This publication is available free of charge from: https://doi.org/10.6028/NIST.IR.8362

i
Abstract
In the fall of 2019, the National Institute of Standards and Technology (NIST) funded three studies to better understand equity and inclusivity. The present study represents phase three of a sequential, exploratory mixed methods study designed to provide an in-depth look at the population of NIST federal employees to identify factors, attitudes, and processes that might result in gender-specific barriers at NIST. From phase 1 and the phase 2 in-depth interview qualitative results an on-line survey was designed to quantify the differences, if any, in the ways in which men and women experience work at NIST. The target population was all NIST federal employees, approximately 3,300. The sample size was 1,350, approximately 30 % of the sampling frame. The survey consisted of six sections and was disseminated by email to the sampling frame. Participation was completely voluntary. The survey was open for three weeks. 1,529 employees responded to the survey for an overall response rate of 33.2 % and 1,108 completed the survey (resulting in an overall completion rate of 72.5 %). Survey participants demographics were representative of the overall distribution of staff across Directorates, Operating Units, age, years of service, career paths, pay bands, and educational levels. The chi-square test for independence was used to test for statistically significant differences between the NIST population and the survey respondents as a whole, as well as between men and women. Statistically significant differences ( 𝑝𝑝 < 0.001) were found for men and women with respect to the organization’s commitment to diversity and inclusivity (men are more positive than women), on meritocracy (more women believe opportunities are based on who you know rather than most deserving employees), and gendered experiences of being interrupted in meeting, questioning competence, and not receiving credit for ideas. More women believe they have to work harder, wait longer for promotion and opportunities for leadership. More women reported considering leaving NIST than their male counterparts. Both women and men agree they have equal opportunity to be hired, their need for work life balance is supported, that teamwork is valued, and NIST believes it is more objective than subjective and that projects are not more important than staff. Overall, the survey results align with the qualitative results and provide quantitative data on the differences in which men and women experience the culture, diversity and inclusivity of NIST.
Key words
Diversity, Inclusivity, Gender, Survey
______________________________________________________________________________________________________ This publication is available free of charge from
: https://doi.org/10.6028/NIST.IR
.8362

ii
Table of Contents
1 Introduction ..................................................................................................................... 1 2 Methodology ..................................................................................................................... 1
3 Participant Demographics .............................................................................................. 5 4 Results ............................................................................................................................. 11
5 Discussion ....................................................................................................................... 36 6 Conclusion ...................................................................................................................... 37 Acknowledgments ................................................................................................................. 37 References .............................................................................................................................. 38 Appendix A: Email Template .............................................................................................. 39 Appendix B: Alignment of Survey to purpose and research questions ........................... 40 Appendix C: Survey .............................................................................................................. 45
______________________________________________________________________________________________________
This publication is available free of charge from: https://doi.org/10.6028/N
IST.IR.8362

iii
List of Tables
Table 1: List of Participant’s Highest Degree (Other) ............................................................ 10
Table 2. Percentage of Responses to Open-Ended Questions ................................................ 12
Table 3. Categories of Open-Ended Responses for Commitment to Inclusivity and Diversity................................................................................................................................................. 14
Table 4. Categories of Open-ended Responses for the Perceptions of Culture ...................... 17
Table 5. Categories of Open-ended Responses for Gendered Experiences ............................ 22
Table 6. Categories of Open-Ended Responses for Interactions ............................................ 28
Table 7. Categories of Open-Ended Responses for Beliefs about NIST ................................ 32
Table 8. Additional Reasons People are Respected ................................................................ 35
______________________________________________________________________________________________________ This publication is available free of charge from
: https://doi.org/10.6028/NIST.IR
.8362

iv
List of Figures
Figure 1. The Population Distribution ...................................................................................... 5
Figure 2. The Population Distribution by OU .......................................................................... 6
Figure 3. Age Distribution ........................................................................................................ 7
Figure 4. Distribution of Years of Service ................................................................................ 7
Figure 5. The Distribution of Career Path ................................................................................ 8
Figure 6. The Distribution of Pay Band .................................................................................... 8
Figure 7. The Distribution of Supervisory Status ..................................................................... 9
Figure 8. Gender Distribution Between Sites ........................................................................... 9
Figure 9. Distribution of the Highest Degree Earned ............................................................. 10
Figure 10. Distribution of Non-Federal Positions Held by Participants ................................. 11
Figure 11. Gender Differences in Perceptions of NIST’s Commitment to Diversity and Inclusivity ............................................................................................................................... 13
Figure 12. Gender Differences in Perceptions of NIST’s Culture (Part 1) ............................. 15
Figure 13. Gender Differences in Perceptions of NIST’s Culture (Part 2) ............................. 16
Figure 14. Gender Differences in Perception of Experiences at NIST (Part 1) ...................... 19
Figure 15. Gender Differences in Perception of Experiences at NIST (Part 2) ...................... 20
Figure 16. Experiences of Harassment ................................................................................... 21
Figure 17. Gender Differences in Reporting Harassment ....................................................... 21
Figure 18. Interactions at NIST (Part 1) ................................................................................. 23
Figure 19. Interactions at NIST (Part 2) ................................................................................. 24
Figure 20. Interactions at NIST: Connections ........................................................................ 26
Figure 21. Interactions at NIST: Mentoring ........................................................................... 27
Figure 22. NIST Culture: Objectivity and Career Advancement ........................................... 29
Figure 23. NIST Culture: Work/Life Balance ........................................................................ 30
Figure 24. NIST Culture: Perception of Patriarchal Culture .................................................. 31
______________________________________________________________________________________________________ This publication is available free of charge from
: https://doi.org/10.6028/NIST.IR
.8362
v
Figure 25. Satisfaction Working at NIST ............................................................................... 34
Figure 26. Respect and Recognition at NIST ......................................................................... 35
______________________________________________________________________________________________________ This publication is available free of charge from
: https://doi.org/10.6028/NIST.IR
.8362
1
1 Introduction
In order to better understand equity and inclusivity at the National Institute of Standards and Technology (NIST), three studies were started in 2019, each funded and overseen by the Office of the Associate Director for Laboratory Programs. While there are many populations at NIST that could benefit from a study examining diversity, inclusivity and equity, this project focused on gender, specifically women, and NIST’s core value of inclusivity. The purpose of this research effort is to explore the experiences of NIST federal employees to identify the ways in which differential opportunities and outcomes related to gender might exist. The goal is to provide the organization with data about how inequities manifest themselves to provide more equitable and inclusive experiences for all employees.
The study was designed in three phases. Phase 1 consisted of a quantitative examination of approximately 10 years of human resources (HR) data in order to compare women’s and men’s positions with respect to salaries, promotions, awards, and other demographics at NIST. Phase 1 is documented in [1]. Results of the analysis of the HR data informed the development of an interview protocol for Phase 2. This qualitative component consisted of in-depth interviews with 40 employees from a range of positions and career paths, documented in [2]. Results from both Phase 1 and Phase 2 informed the development of Phase 3, an organization-wide quantitative survey of federal employees. This report documents the Phase 3 survey on gender equity and inclusion. Given the year time frame and the three phases, it was necessary to limit the scope of the effort to one population and to federal employees to ensure a rigorous and obtainable research project. The approach may serve as a guide and provide a template to study other populations at NIST.
2 Methodology
This report is part of a sequential, exploratory mixed methods study. In these designs, an initial exploratory qualitative phase is often followed by a larger quantitative phase. The data detailed in the Phase 1 report and the Phase 2 report from the interviews provided input for Phase 3—the construction of an online quantitative survey that was sent to all federal employees at NIST. The goal was to provide broader representation of the NIST population in order to specifically address the following three quantitative research questions:
1. What are the differences, if any, in the ways in which men and women experience work at NIST?
2. What, if any, gender inequities exist at NIST? To what extent, if at all, do employees at NIST perceive that gender inequities exist?
3. In what ways, if at all, does NIST culture contribute to a lack of inclusivity?
Survey Population and Sampling Plan
In survey research, the target population represents the entire population of interest. The sampling frame is a subset of the target population who are contacted to participate in the survey. The sample is those individuals who ultimately participate in the survey (as not
______________________________________________________________________________________________________ This publication is available free of charge from
: https://doi.org/10.6028/NIST.IR
.8362

2
everyone who is contacted will actually choose to participate). The target population for this survey was NIST federal employees. Human resources data was obtained in January 2020 – at that time there were approximately 3,300 NIST federal employees in the database.
In this research, the sampling frame was the entire target population, all NIST federal employees identified in the HR database. At the time the survey was administered there was one employee under 18 who was not eligible to participate according to Research Protection Office guidelines. A power analysis was performed to determine the appropriate sample size. Given a sampling frame of approximately 3,300 employees, for a 95 % confidence level and a margin of error of 2 % the sample size is 1,350 responses (approximately 30 % of the sampling frame).
The survey would be disseminated through emails sent to the sampling frame through a NIST All-staff email list using GovDelivery. The All-staff email list includes all federal employees at NIST.
Demographics Questionnaire Development
A primary goal in the design of the demographics questionnaire and the survey was to minimize the potential for identification of any participant. This led to the decision that all of the questions in the survey and the demographics would be voluntary—no questions required a response in order to continue or finish the survey.
Yet demographics are a crucial component in understanding gender diversity and inclusivity. Factors including age, degree, career path, pay band, operating unit (OU), length of government service, and supervisory status significantly influence experiences in the NIST workplace as observed in the in-depth interviews. Balancing demographic response options and the potential for identification became a guiding principle and certain questions were adjusted to assure anonymity. For example, to minimize the potential for identification Senior Executive Staff (SES), Fellows, and Senior Technical or Professional staff (STs) (a relatively small group at NIST) staff, the questions about job series and pay band requested that these employees select the band and series they occupied prior to their appointment. In addition, response variables for location were limited to Gaithersburg and Boulder and OU but not division or group. Questions about degrees did not include disciplines. Likewise, supervisory positions such as group leader, division chief or OU director were not included.
The most important demographic for a survey on gender inclusivity is gender. Since the analysis of the survey responses was dependent on this response, the decision was made to place the gender question at the beginning of the survey. The response variables were limited to male/female and other based on Office of Management and Budget (OMB) guidelines. The remainder of the demographic questions were placed at the end of the survey. Since participation in the survey was voluntary and none of the questions on the survey, including demographic questions, was required, participants could choose to quit the survey at any point. The motivation for such arrangement of the demographic questions was to have as many participants as possible complete at least the gender question and the survey sections necessary for the primary analyses. Appendix A has the complete demographics questionnaire.
______________________________________________________________________________________________________ This publication is available free of charge from
: https://doi.org/10.6028/NIST.IR
.8362

3
Survey Development
The in-depth interviews identified three interconnected themes in the data: 1) a culture at NIST that creates a “chilly climate” for women; 2) gendered experiences that contribute to and are outcomes of that chilly climate; and 3) gendered outcomes that influence women’s experiences in the organization. The research questions and the findings from the in-depth interviews provided a focus and foundation for the development of the survey. The themes illustrated in the model were captured in the following five categories: beliefs about NIST, perceptions about NIST’s culture, gendered experiences at NIST, interactions at NIST, and NIST’s commitment to inclusivity and diversity.
These categories, in turn, guided the development of the objectives of the survey. The following survey objectives are enumerated in the alignment matrix with the corresponding category and survey items (Appendix B):
1. Assess employees’ perceptions of NIST’s culture 2. Assess employees’ perception of NIST ‘s Commitment to Diversity & Inclusivity 3. Assess employees’ experiences at NIST with respect to gender 4. Assess employees’ perspective of their work interactions 5. Assess employees’ beliefs about roles with respect to gender 6. Assess employees’ values 7. Test for gender, age, career path, and campus differences
A list of potential survey items was generated targeting each objective. All of the items were closed response. Recognizing that it is not possible to capture all possible response items in a survey, seven open-ended text boxes were included one at the end of each of the survey objectives. This allowed respondents an opportunity to provide additional comments related to a survey objective.
A team goal for the design of the survey was to keep the survey relatively short to encourage participation and completion of the full survey. A goal of approximately 20 minutes to complete was set. With this goal in mind, the full list of potential survey items was iteratively refined and reduced to accommodate the 20-minute timeframe while addressing the research questions and objectives. The final alignment matrix (Appendix B) illustrates the relationship of the survey objectives to the survey categories and the response items.
To ascertain the content and construct validity of the survey instruments, three types of reviews were conducted iteratively. Content experts at NIST in inclusivity and diversity including representatives from Human Resources, the Civil Rights and Diversity Office, Omsbud Program and a representative from Laboratory Programs actively working in diversity and inclusivity were asked to evaluate the alignment matrix and provide feedback. Specifically, they were asked to comment on the alignment of the categories with the scope of the survey goals, the alignment of the items with the survey category, and if there were missing items. Survey experts from academia, also reviewed the survey for alignment with the research questions and survey objectives and item clarity for the intended audience. The survey experts
______________________________________________________________________________________________________ This publication is available free of charge from
: https://doi.org/10.6028/NIST.IR
.8362

4
also provided feedback on the appropriate format for what the item is assessing, and alignment of response options Finally, we piloted the survey with recently retired or separated NIST employees to obtain timing data. In addition to taking the survey we asked these participants to go back through the survey and provide feedback on how they interpreted the questions and how they chose their answers and to report any additional concerns or problems with the questions.
Data from all three of these review types provided feedback that guided further improvements of the survey. These included things such as: changing response options in some questions to more accurately capture the type of information sought; changing the ordering of questions in some instances; or changing language in some questions to more neutral language.
Generally, changes were made based on all recommendations from these reviews with only one exception. In particular, the survey expert and the pilot testers expressed a concern that the response options with a Likert scale did not include a mid-point or neutral option. The decision to not include the neutral response was guided by previous studies showing that survey participants’ interpretations of the midpoint vary widely, from “I’m neutral on this”, “yes, I guess so”, “I don’t know”, “it’s neither fair nor unfair”, to “I don’t want to answer” or “I’m not sure what ‘fair’ means”, and any number of ideas that don’t necessarily indicate a true neutral opinion [3]. Given the lack of consistent interpretation of a neutral option, a four-level even-point Likert scale was used in the response scales.
Once all sections were complete, the online survey instrument was tested with the most popular browsers used at NIST. Several rounds of these reviews took place, with corrections made to the online tool as necessary and the protocol was approved by the NIST Institutional Review Board (MR-2020-0217).
Survey Dissemination
Invitation emails were sent from the NIST Director’s Office to the sampling frame through a NIST All-staff email list using GovDelivery. The email included a message from the Director on the role of diversity and inclusivity at NIST, a link to the information sheet, and a link to the survey. A second email was sent from all of the Operating Unit (OU) Directors to all of the federal employees in their OU in week two of the survey. A final reminder was sent through GovDelivery using the NIST All-staff email list the third and final week of the survey.
Data analysis methodology
Initial descriptive statistics were generated for each question to provide a snapshot of the responses. Tests for significance followed to examine whether or not responses between men and women differed significantly or not. The chi-square test for independence was used to test for statistically significant differences between the NIST population and the survey respondents as a whole, as well as between men and women. Since the NIST database did not include a non-binary gender option and the number of respondents who selected the “other” option was low (𝑁𝑁 = 13), all tests aimed at comparing gender-based differences include only men and women (the other gender is always provided for reference). When one or more of the cell counts in a contingency table was less than five, the Fisher’s exact test was used instead of the chi-squared test.
______________________________________________________________________________________________________ This publication is available free of charge from
: https://doi.org/10.6028/NIST.IR
.8362
5
To compensate for the inconsistent response rate between genders we use a post-stratification weighting to minimize discrepancies between population and the sample when analyzing the non-demographic questions [4]. In the Participants Demographics section, the non-weighted data is presented. All visualizations and discussion in the Results section use data with the weight correction implemented.
To account for the false discovery rate, the Benjamini-Hochberg procedure was implemented when appropriate and 𝑝𝑝𝑐𝑐𝑐𝑐𝑐𝑐𝑐𝑐 was reported. We consider results with 𝑝𝑝 < 0.001 as significant.
3 Participant Demographics
Of the 3,334 NIST federal employees included in the Human Resources database, 1,529 respondents entered the survey (resulting in an overall response rate of 45.8 %) and 1,108 respondents completed the survey (resulting in an overall completion rate of 33.2 % of NIST federal employees and a survey completion rate of 72.5 %). Since the participants were not required to answer any of the questions, a survey was considered completed whenever the participant selected the “Submit” button, regardless of how many questions were answered. The overall median completion time was 17:55 min., and the average completion time was 41:08 min. (note that participants could exit and come back to the survey at any point in time).
After a preliminary analysis of the completed survey, 15 responses were excluded from the analysis due to either missing gender information (9 respondents) or significant fraction of unanswered questions (6 respondents). The demographics presented throughout this section represent the data from the remaining 1,093 participants. However, since all survey questions were optional, the number of participant responses 𝑁𝑁 varied between questions. The 𝑁𝑁 value for each response is given with the associated figure.
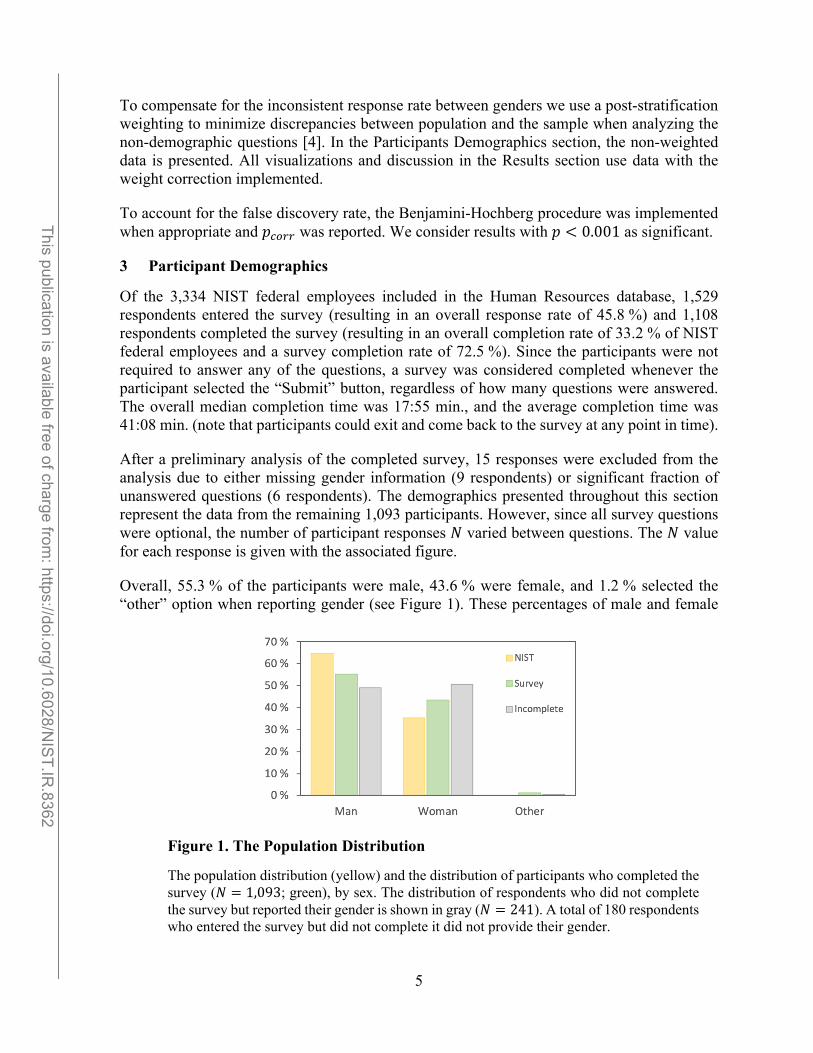
Overall, 55.3 % of the participants were male, 43.6 % were female, and 1.2 % selected the “other” option when reporting gender (see Figure 1). These percentages of male and female
Figure 1. The Population Distribution
The population distribution (yellow) and the distribution of participants who completed the survey (𝑁𝑁 = 1,093; green), by sex. The distribution of respondents who did not complete the survey but reported their gender is shown in gray (𝑁𝑁 = 241). A total of 180 respondents who entered the survey but did not complete it did not provide their gender.
______________________________________________________________________________________________________ This publication is available free of charge from
: https://doi.org/10.6028/NIST.IR
.8362

6
employees are statistically significantly different than the entire NIST federal employee population (𝜒𝜒2(1) = 35.7, 𝑝𝑝 < 0.001). To correct for this discrepancy, the non-demographic responses were weighted by a factor of 0.8 for women and 1.16 for men in the “Total” plots.
The distribution of survey respondents across all Directorates is as follows:
• 67.5 % from Laboratory Programs (LP),
• 2.8 % from Innovation and Industry Services (IIS),
• 20.5 % from Management Resources (MR), and
• 2.7 % from the Director’s Office (DO). A post-hoc chi-squared test reveals that the participation between the Directorates is consistent with the NIST population for DO and IIS but not for MR (𝜒𝜒2(1) = 20.5, 𝑝𝑝 < 0.001) and LP (𝜒𝜒2(1) = 15.9, 𝑝𝑝 < 0.001). The OU information was missing in 6.4 % of the responses.
At an individual OU level, the top respondents were from the Physical Measurement Laboratory (PML) (21.3 %), the Material Measurement Laboratory (MML) (18.3 %), and the Information Technology Laboratory (ITL) (12.9 %), which reflects the NIST general population of Laboratory Programs as the most populated Directorate. Figure 2 shows a comparison of the population distribution for NIST and the survey respondents.
The majority of participants were between 50 and 59 years of age (29.5 %), followed by 40-49 years (24.8 %), and 30-39 years (20.9 %) (see Figure 3). About six percent of participants were 29 or younger and about 2 percent were 70 or older. As can be seen in Figure 3, the gender composition of the respondents shifts from fairly equal numbers of men and woman in
Figure 2. The Population Distribution by OU
The population distribution (yellow) and the distribution of participants who completed the survey (𝑁𝑁 = 1,023; green), by OU.
______________________________________________________________________________________________________ This publication is available free of charge from
: https://doi.org/10.6028/NIST.IR
.8362

7
the younger age groups (between 18 and 50) towards a male-dominated composition among respondents 60 and older. This gender shift is consistent with the NIST population [1].
Figure 3. Age Distribution
The overall age distribution among respondents (𝑁𝑁 = 1,052).
Similarly, most participants had between 1 and 14 years of service at NIST, with the largest group of participants, 21.2 %, having 1-4 years of service (see Figure 4).
Figure 4. Distribution of Years of Service
The overall distribution of the total years of service at NIST (𝑁𝑁 = 1,046).
Participants also identified their current career path and pay band level. Pay band level only applied to those in the career paths of ZA, ZP, ZS and ZT. The large majority, 68.1 % of the participants, are in the Scientific and Engineering Staff at NIST, while 31.9 % of responders make up the remaining career paths at NIST (see Figure 5). Note that individuals in Senior Executive Service (SES), Scientific or Professional (ST), or Senior Level (SL) were asked to identify the career path immediately preceding their appointment.
______________________________________________________________________________________________________ This publication is available free of charge from
: https://doi.org/10.6028/NIST.IR
.8362

8
Figure 5. The Distribution of Career Path
The overall distribution of the career path at NIST (𝑁𝑁 = 1,063).
Participants in the career paths of ZA, ZP, ZS, and ZT were also asked their current pay band at NIST. The majority of responders are in pay band 4 at 42.3 %, followed by a close percentage in pay band 3 at 26.1 % and pay band 5 at 25.2 %, respectively (see Figure 6). When examined by gender, the composition shifts from about 2/3 of women at pay band 1 to about 1/4 women at pay band 5.
Figure 6. The Distribution of Pay Band
The overall distribution of the current pay band at NIST among survey respondents in Career Paths ZA, ZP, ZS, ZT (𝑁𝑁 = 988).
______________________________________________________________________________________________________ This publication is available free of charge from
: https://doi.org/10.6028/NIST.IR
.8362
9
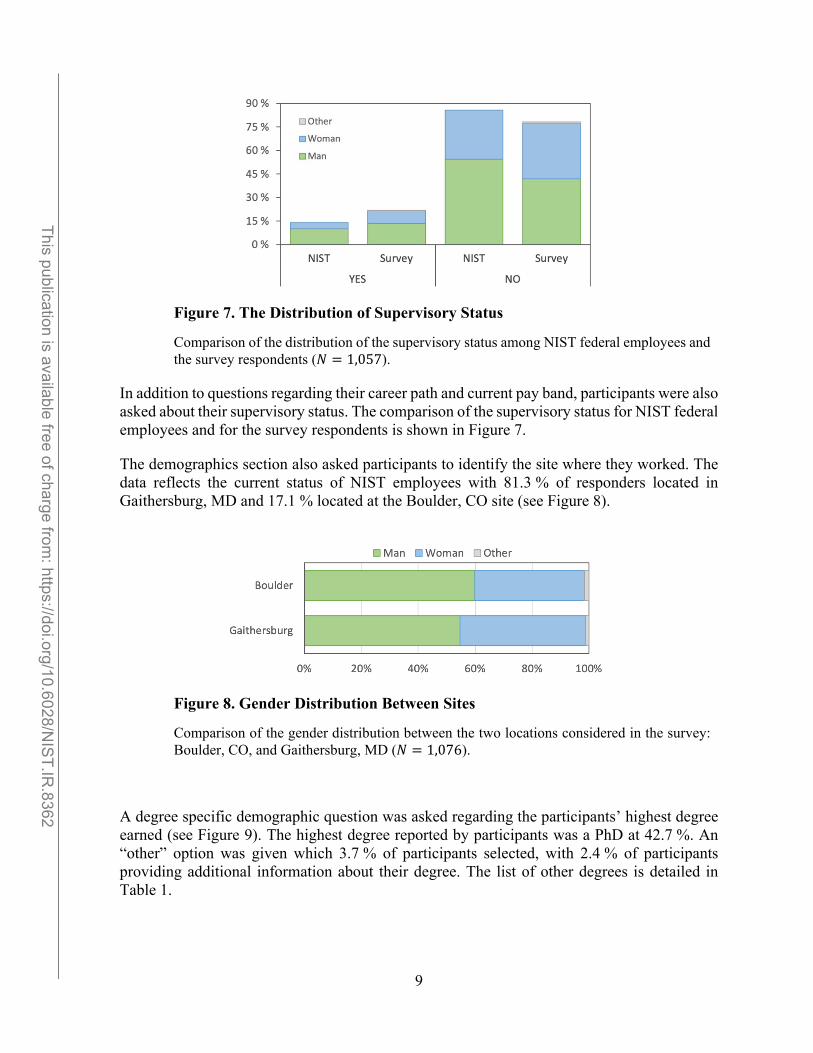
Figure 7. The Distribution of Supervisory Status
Comparison of the distribution of the supervisory status among NIST federal employees and the survey respondents (𝑁𝑁 = 1,057).
In addition to questions regarding their career path and current pay band, participants were also asked about their supervisory status. The comparison of the supervisory status for NIST federal employees and for the survey respondents is shown in Figure 7.
The demographics section also asked participants to identify the site where they worked. The data reflects the current status of NIST employees with 81.3 % of responders located in Gaithersburg, MD and 17.1 % located at the Boulder, CO site (see Figure 8).
Figure 8. Gender Distribution Between Sites
Comparison of the gender distribution between the two locations considered in the survey: Boulder, CO, and Gaithersburg, MD (𝑁𝑁 = 1,076).
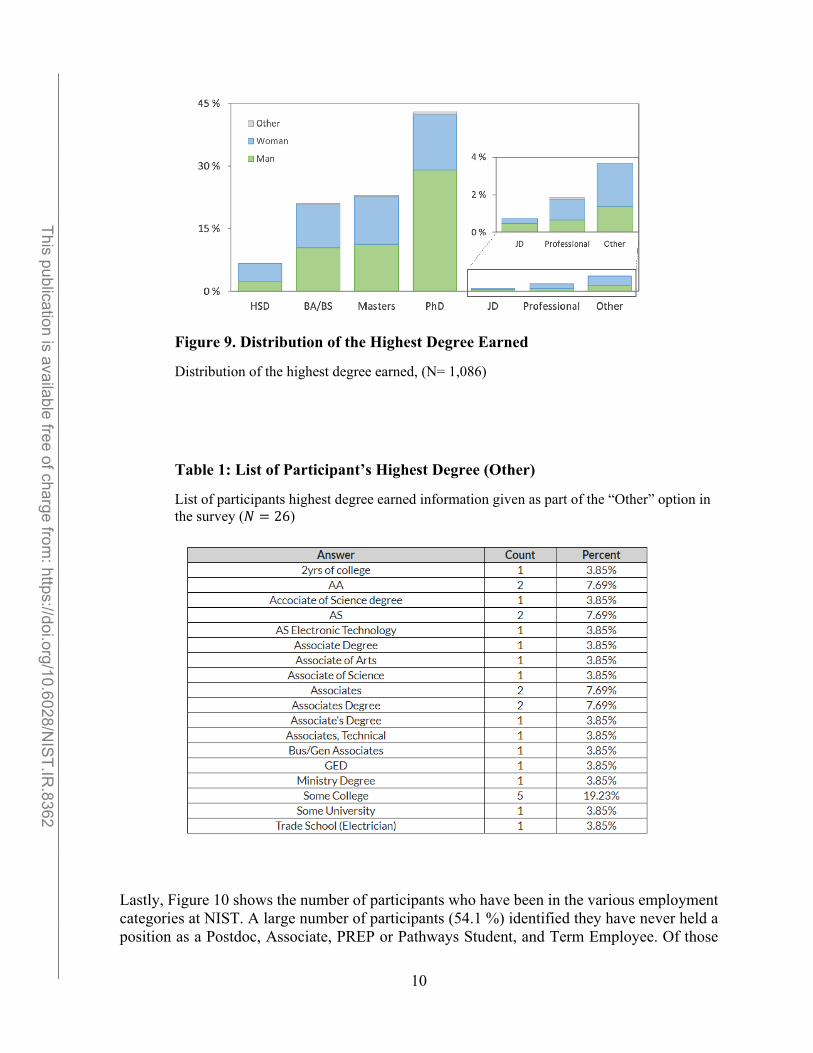
A degree specific demographic question was asked regarding the participants’ highest degree earned (see Figure 9). The highest degree reported by participants was a PhD at 42.7 %. An “other” option was given which 3.7 % of participants selected, with 2.4 % of participants providing additional information about their degree. The list of other degrees is detailed in Table 1.
______________________________________________________________________________________________________ This publication is available free of charge from
: https://doi.org/10.6028/NIST.IR
.8362
10
Figure 9. Distribution of the Highest Degree Earned
Distribution of the highest degree earned, (N= 1,086)
Table 1: List of Participant’s Highest Degree (Other)
List of participants highest degree earned information given as part of the “Other” option in the survey (𝑁𝑁 = 26)
Lastly, Figure 10 shows the number of participants who have been in the various employment categories at NIST. A large number of participants (54.1 %) identified they have never held a position as a Postdoc, Associate, PREP or Pathways Student, and Term Employee. Of those
______________________________________________________________________________________________________ This publication is available free of charge from
: https://doi.org/10.6028/NIST.IR
.8362

11
who had been in positions prior to becoming a NIST federal employee, 23.0 % were a term employee followed by the next largest group of 22.4 % in a Postdoc position.
Figure 10. Distribution of Non-Federal Positions Held by Participants
Distribution of the non-federal positions held by participants before becoming NIST federal employee (𝑁𝑁 = 1,042). The insert shows the gender distribution by position.
A follow-up question identified how many years a participant spent in each position, if applicable. The largest number of years spent in a position was identified as 10+ years. A non-federal tenure of 10 or more years was reported by 3.9 % of participants. The tenure for students and postdocs varied from one to eight years for pathway students, seven years for postdocs, and six years for PREP students, with a median tenure of about 2 years.
4 Results
In this section we present the results of the analyses performed. As previously discussed, participation in the survey was voluntary and no question on the survey required a response. Therefore, participants could choose to skip any of the questions and continue to the next question, or they could exit the survey at any time. While 1,093 participants completed the survey, the number of participants who responded to a particular question varied. The figures and tables throughout this section include the appropriate total number of responses, 𝑁𝑁.
In addition to the closed-ended questions, respondents had the opportunity to provide open-ended responses at the end of each section of the survey. As presented in Table 2, many of the 1,093 survey respondents who completed the survey took the time to answer at least one of the open-ended questions, often writing extensive answers. There were 2,120 different responses to the eight open ended questions. This extracted data represents 99,689 words, with an average of 47 words per response. Clearly, participants provided a lot of input.
______________________________________________________________________________________________________ This publication is available free of charge from
: https://doi.org/10.6028/NIST.IR
.8362

12
Table 2. Percentage of Responses to Open-Ended Questions
Percentage of participants with responses to open-ended survey questions (𝑁𝑁 = 1,909)
Do you have any additional comments about: (%) NIST efforts related to inclusivity and diversity to include? 31.8 NIST Culture that you would like to include? 24.6 your experiences at NIST based on gender that you would like to include? 24.5 the work environment at NIST that you would like to include? 17.7 the way men and women are treated at NIST, that you would like to include? 21.0
If you have considered leaving NIST, why? 8.5 Do you have other things that give you satisfaction from working at NIST? 21.4 Are there other reasons people are respected more at NIST? 25.2
An initial review of the open-ended responses generated a set of broad categories to identify similar responses. In the results section, after presenting the results for the closed-ended questions of each section of the survey, a summary of responses for each open-ended question is provided in a table identifying the categories and an exemplar verbatim quote. At the end of each quoted response is a notation that represents a particular survey response. The notation is composed of two parts: the first represents the gender (female (F), male (M) or other (O)) of the respondent, the second is the record ID number from the survey. For example, (F:1234) represents the survey response for record ID #1234, a female participant. Since the surveys were completed anonymously, it is not possible to associate a participant ID to a specific individual.
NIST’s Commitment to Diversity & Inclusivity
In this section of the survey, a total of four questions were used to evaluate how participants perceive NIST’s commitment to diversity and inclusivity in terms of (1) Senior Leadership (assessing how well Senior Leadership is committed to increasing inclusivity and diversity) and (2) each employee’s particular OU.
For each question within this section, respondents choose their answer from a four-level even-point Likert scale, with responses ranging from “Strongly Disagree” to “Strongly Agree”.
Figure 11 presents the summary of the results for the questions pertaining to NIST commitment to diversity and inclusivity. While the majority of the respondents agreed with each of these statements (by selecting either “agree” or “strongly agree), there is a statistically significant difference between men and women’s responses, with significantly more men agreeing with each statement (the results of the chi-squared test for questions in order as listed in Figure 11: 𝜒𝜒2(1) = 22.1, 𝑝𝑝𝑐𝑐𝑐𝑐𝑐𝑐𝑐𝑐 < 0.001; 𝜒𝜒2(1) = 18.5, 𝑝𝑝𝑐𝑐𝑐𝑐𝑐𝑐𝑐𝑐 < 0.001; 𝜒𝜒2(1) = 15.2, 𝑝𝑝𝑐𝑐𝑐𝑐𝑐𝑐𝑐𝑐 < 0.001;
______________________________________________________________________________________________________ This publication is available free of charge from
: https://doi.org/10.6028/NIST.IR
.8362

13
𝜒𝜒2(1) = 21.2, 𝑝𝑝𝑐𝑐𝑐𝑐𝑐𝑐𝑐𝑐 < 0.001). Among the respondents in other gender, the responses were even less positive than among women.
Figure 11. Gender Differences in Perceptions of NIST’s Commitment to Diversity and Inclusivity
Graph shows the distribution of responses by gender where responses range from “Strongly Disagree” (left-most/dark gray) to “Strongly Agree” (right-most/dark purple). The number of respondents for each question is shown in parenthesis
Overall, these results show that at NIST, men have a more positive perception about Senior Leadership and their OU’s commitment to diversity and inclusivity than women do. However, when comparing all answers to the question about Senior Leadership’s commitment to increasing diversity (“total” in second panel in Figure 11) and about one’s OU taking action to increase diversity (“total” in third panel in Figure 11), we found that respondents are not as convinced that their OU is doing enough to promote diversity in the workplace, regardless of gender (𝜒𝜒2(1) = 65.0, 𝑝𝑝𝑐𝑐𝑐𝑐𝑐𝑐𝑐𝑐 < 0.001). The same holds for inclusivity: when comparing “total” in first and last panel in Figure 11, we find that while the vast majority of respondents believes in Senior Leadership’s commitment to inclusivity, significantly less respondents believe their OU is “doing enough” to promote it (𝜒𝜒2(1) = 62.5, 𝑝𝑝𝑐𝑐𝑐𝑐𝑐𝑐𝑐𝑐 < 0.001).
A final open-ended text box was used in the section to capture any additional comments about NIST efforts related to inclusivity and diversity. Exemplars from the open-ended data relevant to the NIST’s Commitment to Inclusivity and Diversity section of the survey are presented in
______________________________________________________________________________________________________ This publication is available free of charge from
: https://doi.org/10.6028/NIST.IR
.8362
14
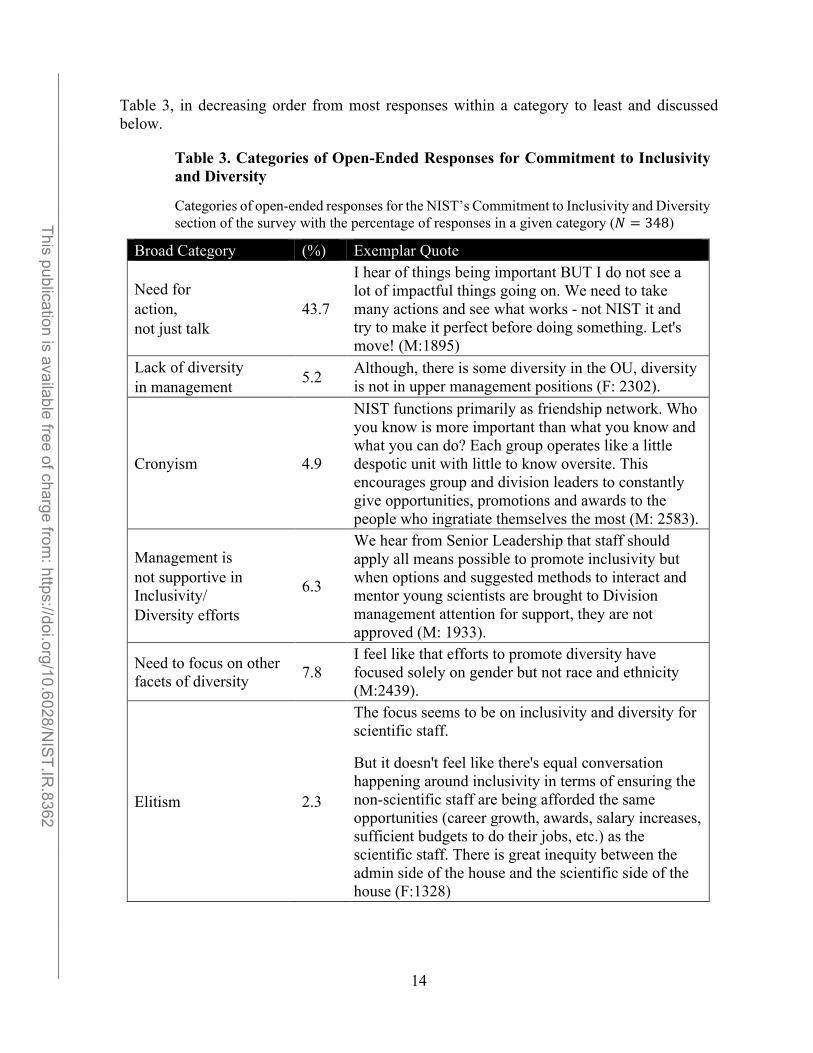
Table 3, in decreasing order from most responses within a category to least and discussed below.
Table 3. Categories of Open-Ended Responses for Commitment to Inclusivity and Diversity
Categories of open-ended responses for the NIST’s Commitment to Inclusivity and Diversity section of the survey with the percentage of responses in a given category (𝑁𝑁 = 348)
Broad Category (%) Exemplar Quote
Need for action, not just talk
43.7
I hear of things being important BUT I do not see a lot of impactful things going on. We need to take many actions and see what works - not NIST it and try to make it perfect before doing something. Let's move! (M:1895)
Lack of diversity in management 5.2 Although, there is some diversity in the OU, diversity
is not in upper management positions (F: 2302).
Cronyism 4.9
NIST functions primarily as friendship network. Who you know is more important than what you know and what you can do? Each group operates like a little despotic unit with little to know oversite. This encourages group and division leaders to constantly give opportunities, promotions and awards to the people who ingratiate themselves the most (M: 2583).
Management is not supportive in Inclusivity/ Diversity efforts
6.3
We hear from Senior Leadership that staff should apply all means possible to promote inclusivity but when options and suggested methods to interact and mentor young scientists are brought to Division management attention for support, they are not approved (M: 1933).
Need to focus on other facets of diversity 7.8
I feel like that efforts to promote diversity have focused solely on gender but not race and ethnicity (M:2439).
Elitism 2.3
The focus seems to be on inclusivity and diversity for scientific staff. But it doesn't feel like there's equal conversation happening around inclusivity in terms of ensuring the non-scientific staff are being afforded the same opportunities (career growth, awards, salary increases, sufficient budgets to do their jobs, etc.) as the scientific staff. There is great inequity between the admin side of the house and the scientific side of the house (F:1328)
______________________________________________________________________________________________________ This publication is available free of charge from
: https://doi.org/10.6028/NIST.IR
.8362

15
A large percentage of respondents noted that NIST does a great job of mentioning the importance of diversity and inclusivity however there has yet to be any action, any real steps taken. Another heavily mentioned category is the desire for NIST to focus on other facets of diversity such as race and ethnicity and not just gender.
Perceptions of NIST Culture
This section presents the part of the survey that addresses the theme of meritocracy, elitism, and the gender culture at NIST. It includes 8 questions where respondents could choose their answer from a four-level even-point Likert scale, with responses ranging from “Strongly Disagree” to “Strongly Agree”.
Figure 12. Gender Differences in Perceptions of NIST’s Culture (Part 1)
Graph shows the distribution of responses by gender where responses range from “Strongly Disagree” (left-most/dark gray) to “Strongly Agree” (right-most/dark purple). The number of respondents for each question is shown in parenthesis.
Figure 12 above presents an analysis of the results for the questions pertaining to the Perceptions of NIST Culture. The first two questions of this section address the theme of meritocracy. The largest gender related difference was observed when participants were asked whether they believe the best opportunities go to the most deserving employees (𝜒𝜒2(1) =35.0, 𝑝𝑝𝑐𝑐𝑐𝑐𝑐𝑐𝑐𝑐 < 0.001). In particular, about 18 % more men than women (about 29 % more than other genders) agree with this statement. The difference between women and men’s perception was also striking for the question “Opportunities are given based on who you know”, which showed that 74.3 % of women agree with this statement, compared to 58 % of men (𝜒𝜒2(1) =29.8, 𝑝𝑝𝑐𝑐𝑐𝑐𝑐𝑐𝑐𝑐 < 0.001). Other genders’ responses align with men’s responses.
The third question addresses the theme of elitism. Here, differences were fairly comparable between genders (𝜒𝜒2(1) = 5.8, 𝑝𝑝𝑐𝑐𝑐𝑐𝑐𝑐𝑐𝑐 = 0.03), indicating that regardless of gender,
______________________________________________________________________________________________________ This publication is available free of charge from
: https://doi.org/10.6028/NIST.IR
.8362
16
respondents believe that staff who have been at NIST for a long time are listened to more (see last panel in Figure 12).
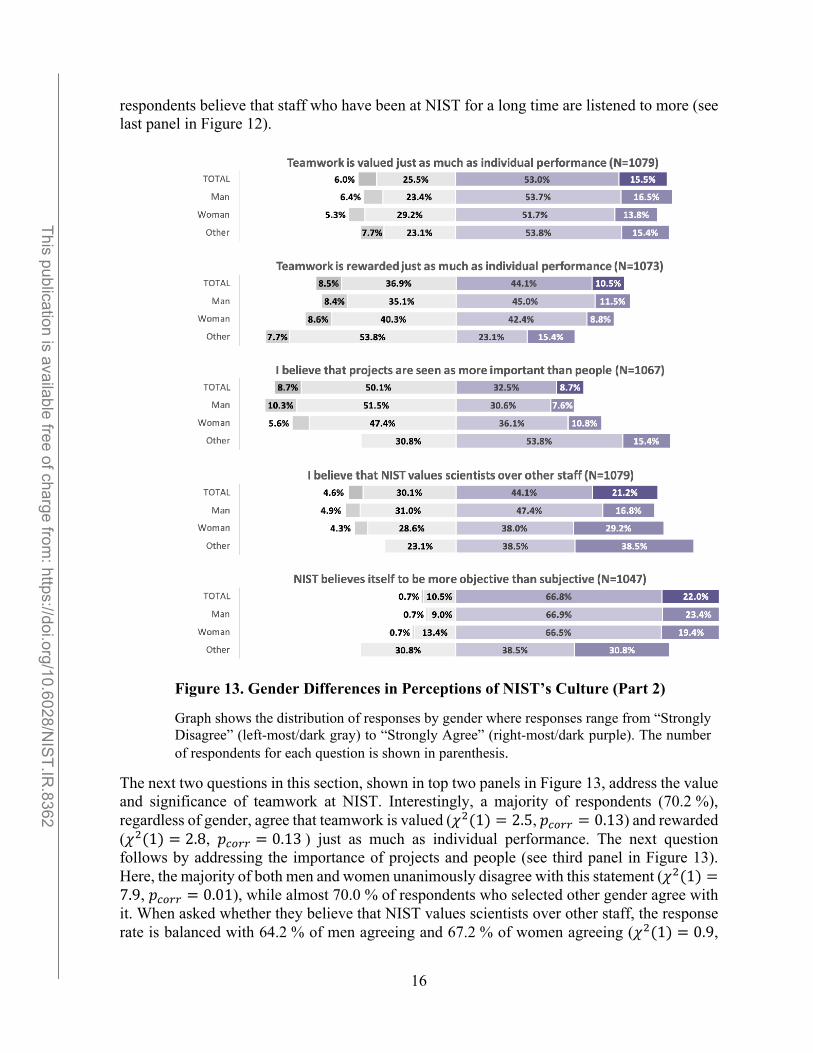
Figure 13. Gender Differences in Perceptions of NIST’s Culture (Part 2)
Graph shows the distribution of responses by gender where responses range from “Strongly Disagree” (left-most/dark gray) to “Strongly Agree” (right-most/dark purple). The number of respondents for each question is shown in parenthesis.
The next two questions in this section, shown in top two panels in Figure 13, address the value and significance of teamwork at NIST. Interestingly, a majority of respondents (70.2 %), regardless of gender, agree that teamwork is valued (𝜒𝜒2(1) = 2.5, 𝑝𝑝𝑐𝑐𝑐𝑐𝑐𝑐𝑐𝑐 = 0.13) and rewarded (𝜒𝜒2(1) = 2.8, 𝑝𝑝𝑐𝑐𝑐𝑐𝑐𝑐𝑐𝑐 = 0.13 ) just as much as individual performance. The next question follows by addressing the importance of projects and people (see third panel in Figure 13). Here, the majority of both men and women unanimously disagree with this statement (𝜒𝜒2(1) =7.9, 𝑝𝑝𝑐𝑐𝑐𝑐𝑐𝑐𝑐𝑐 = 0.01), while almost 70.0 % of respondents who selected other gender agree with it. When asked whether they believe that NIST values scientists over other staff, the response rate is balanced with 64.2 % of men agreeing and 67.2 % of women agreeing (𝜒𝜒2(1) = 0.9,
______________________________________________________________________________________________________ This publication is available free of charge from
: https://doi.org/10.6028/NIST.IR
.8362

17
𝑝𝑝𝑐𝑐𝑐𝑐𝑐𝑐𝑐𝑐 = 0.34) (see fourth panel in Figure 13). The responses of other gender mainly agree with the question as well at 77 %. Lastly, the agreement rate on whether NIST believes itself to be more objective than subjective is at least 85 % for men and women (𝜒𝜒2(1) = 4.5, 𝑝𝑝𝑐𝑐𝑐𝑐𝑐𝑐𝑐𝑐 =0.06). Other gender responses agree with this statement as well at 69.3 %.
A final open-ended text box was used in the section to capture any additional comments about NIST culture. Exemplars from the open-ended data are presented in Table 4, in decreasing order from most responses within a category to least and discussed in detail below.
According to the survey results, both men and women mostly agreed that NIST believes itself to be more objective than subjective, 90.3 % of men and 85.9 % of women. However, one open-ended question response category stood out above the others, while NIST believes itself to be objective many argued that in reality NIST is actually very subjective in many ways even providing examples. The next most addressed response category centered around elitism. Respondents expressed concern that scientists are valued over other staff and those who have been here for a significant amount of time are listened to more than others, regardless of any other factor.
Table 4. Categories of Open-ended Responses for the Perceptions of Culture
Categories of open-ended responses for the Perceptions of NIST Culture section of the survey with the percentage of responses in a given category (𝑁𝑁 = 269)
Broad Category (%) Exemplar Quote
NIST is a subjective organization
24.9
Everything about NIST is subjective. From performance plans to promotions, it is all subject to one person's opinion. As a result, many minorities and women have had their careers stifled by their management team. Opportunities such as details or other professional development seem to go to those that are in the "in crowd" (F:1647).
Elitism 17.1
Although we are the backbone of this organization, Admin staff is not valued as much. Our pay is not comparable to other agencies on the GS scale. w=When raises and bonuses are doled out, we are given the scraps in favor of scientists, even if our performance was stellar, Likewise, I've seen scientists get top ratings for the maximum bonus, even with a dereliction of duty. I have been told about how respected they are in their field, allowing the negative behavior to go unchecked, rewarding it even (F:2148).
Teamwork 11.2
Our "demonstration project" performance plans are aimed at individual performance and do little to encourage team effort. The system is old and out of date. it needs to be overhauled (M:2037).
Path to 6.0 NIST knows how to do science. NIST does not know how to lead and manage and support science. While there is training, it is not effective training. Managers and leaders are selected based
______________________________________________________________________________________________________ This publication is available free of charge from
: https://doi.org/10.6028/NIST.IR
.8362

18
management needs to be evaluated/ readjusted
on scientific skills, not management and leadership skills. NIST does not effectively develop these scientists into effective leaders. NIST then loses a good scientist and gains a poor manager. They are different skill sets (M:1226).
Male dominated organization
6.0
There is a perception that NIST is an "old boys club" and it is difficult for women to be taken seriously or to be seen credibly at higher levels (especially if you do not have a PhD). Fair or not, I have heard this throughout my career at NIST (F:1523).
NIST does not have gender related issues
4.1 NIST is an amazing place that promotes fairness, inclusivity, and diversity (M:1542).
Longevity at NIST receives more respect than anything else
1.5
People who have been at NIST for a long time and are established in their science are treated as immune to the need to also have people skills and be respectful. I want to be clear: almost all of the people at NIST that I have worked with have been fantastic, kind, respectful individuals in team settings. But there are a limited few (one primary offender, one secondary offender, in my limited experience) who have repeatedly treated their colleagues with disrespect and the behavior has not been directly addressed, remedied, or openly condemned by leadership despite it being brought forward many times (F:1872).
Gendered Experiences at NIST
This section presents a part of the survey that includes questions evaluating whether men and women perceive their experiences at NIST differently. In this section, 11 questions were asked specifically in relation to gender. For each question within this section, respondents choose from the following response options:
• No, has not happened • Yes, has happened at least once • Yes, has happened more than once.
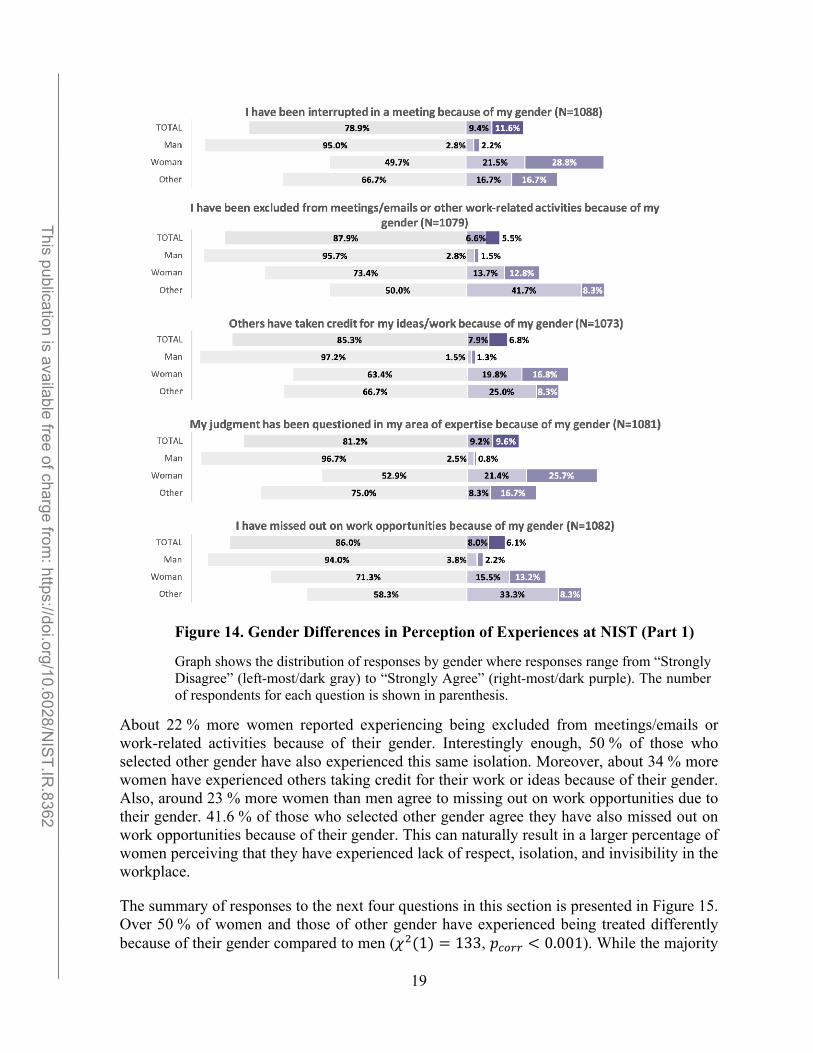
Figure 14 below presents an analysis of the responses to the first five questions in this section of the survey. Unlike in all previous sections of the survey, there is a striking difference in the response pattern between genders. The first five questions ask about being interrupted (top panel) (𝜒𝜒2(1) = 288, 𝑝𝑝𝑐𝑐𝑐𝑐𝑐𝑐𝑐𝑐 < 0.001), excluded from meetings or correspondence (second panel) (𝜒𝜒2(1) = 106, 𝑝𝑝𝑐𝑐𝑐𝑐𝑐𝑐𝑐𝑐 < 0.001), being excluded from credit for ideas or work (third panel) (𝜒𝜒2(1) = 203, 𝑝𝑝𝑐𝑐𝑐𝑐𝑐𝑐𝑐𝑐 < 0.001), questioning judgement in an area of one’s expertise (fourth panel) (𝜒𝜒2(1) = 286, 𝑝𝑝𝑐𝑐𝑐𝑐𝑐𝑐𝑐𝑐 < 0.001), and missing out on opportunities (fifth panel) (𝜒𝜒2(1) = 100, 𝑝𝑝𝑐𝑐𝑐𝑐𝑐𝑐𝑐𝑐 < 0.001) because of gender. All were found to be statistically significant. While no more than 6 % of men responded affirmatively to these questions, nearly 30 % of women reported having such experiences, with about 50 % of women reporting being interrupted (also reported by 5 % of men) or having their competence questioned (reported by 3.3 % of men).
______________________________________________________________________________________________________ This publication is available free of charge from
: https://doi.org/10.6028/NIST.IR
.8362
19
About 22 % more women reported experiencing being excluded from meetings/emails or work-related activities because of their gender. Interestingly enough, 50 % of those who selected other gender have also experienced this same isolation. Moreover, about 34 % more women have experienced others taking credit for their work or ideas because of their gender. Also, around 23 % more women than men agree to missing out on work opportunities due to their gender. 41.6 % of those who selected other gender agree they have also missed out on work opportunities because of their gender. This can naturally result in a larger percentage of women perceiving that they have experienced lack of respect, isolation, and invisibility in the workplace.
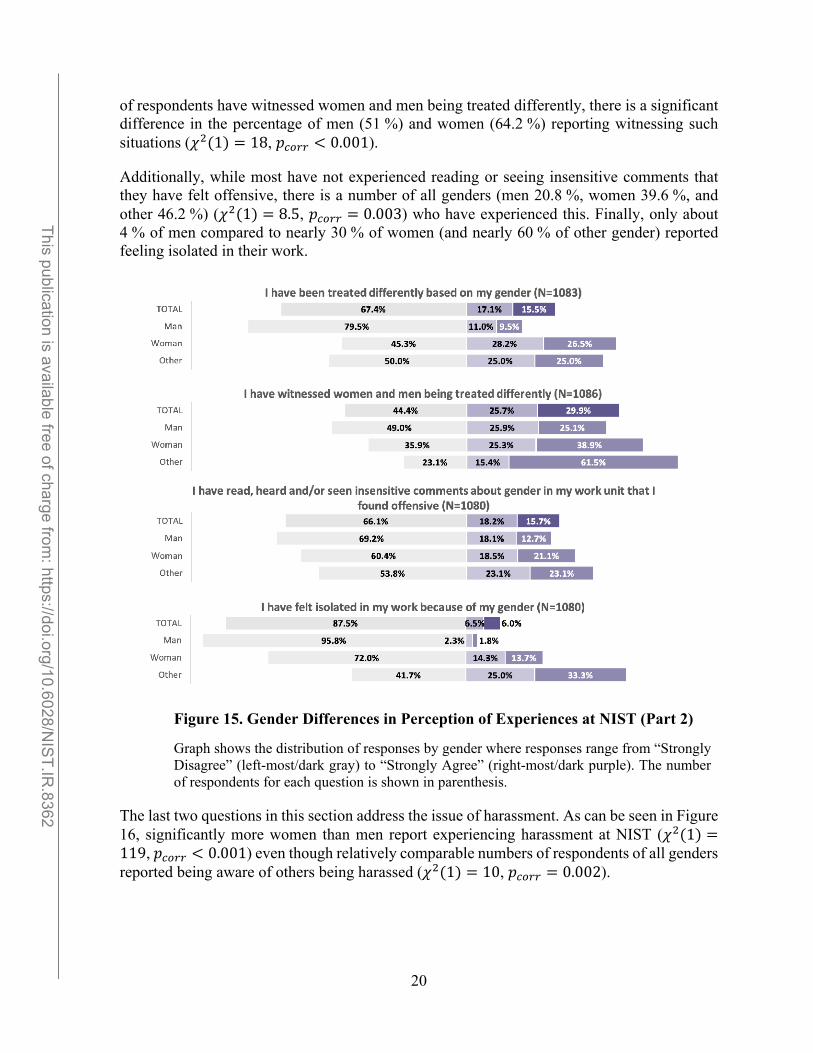
The summary of responses to the next four questions in this section is presented in Figure 15. Over 50 % of women and those of other gender have experienced being treated differently because of their gender compared to men (𝜒𝜒2(1) = 133, 𝑝𝑝𝑐𝑐𝑐𝑐𝑐𝑐𝑐𝑐 < 0.001). While the majority
Figure 14. Gender Differences in Perception of Experiences at NIST (Part 1)
Graph shows the distribution of responses by gender where responses range from “Strongly Disagree” (left-most/dark gray) to “Strongly Agree” (right-most/dark purple). The number of respondents for each question is shown in parenthesis.
______________________________________________________________________________________________________ This publication is available free of charge from
: https://doi.org/10.6028/NIST.IR
.8362
20
of respondents have witnessed women and men being treated differently, there is a significant difference in the percentage of men (51 %) and women (64.2 %) reporting witnessing such situations (𝜒𝜒2(1) = 18, 𝑝𝑝𝑐𝑐𝑐𝑐𝑐𝑐𝑐𝑐 < 0.001).
Additionally, while most have not experienced reading or seeing insensitive comments that they have felt offensive, there is a number of all genders (men 20.8 %, women 39.6 %, and other 46.2 %) (𝜒𝜒2(1) = 8.5, 𝑝𝑝𝑐𝑐𝑐𝑐𝑐𝑐𝑐𝑐 = 0.003) who have experienced this. Finally, only about 4 % of men compared to nearly 30 % of women (and nearly 60 % of other gender) reported feeling isolated in their work.
The last two questions in this section address the issue of harassment. As can be seen in Figure 16, significantly more women than men report experiencing harassment at NIST (𝜒𝜒2(1) =119, 𝑝𝑝𝑐𝑐𝑐𝑐𝑐𝑐𝑐𝑐 < 0.001) even though relatively comparable numbers of respondents of all genders reported being aware of others being harassed (𝜒𝜒2(1) = 10, 𝑝𝑝𝑐𝑐𝑐𝑐𝑐𝑐𝑐𝑐 = 0.002).
Figure 15. Gender Differences in Perception of Experiences at NIST (Part 2)
Graph shows the distribution of responses by gender where responses range from “Strongly Disagree” (left-most/dark gray) to “Strongly Agree” (right-most/dark purple). The number of respondents for each question is shown in parenthesis.
______________________________________________________________________________________________________ This publication is available free of charge from
: https://doi.org/10.6028/NIST.IR
.8362

21
Figure 16. Experiences of Harassment
Gender differences in experiencing or being aware of others who have experienced harassment at NIST. The number of respondents for each question is shown in parenthesis.
A follow up question to those who selected “Yes” to the question about experiencing harassment was asked to identify if the harassment was reported and, if reported, whether the issue was resolved to their satisfaction (Figure 17). Of the 26.1 % of women who have experienced harassment at least once, about 25 % reported the issue.
Figure 17. Gender Differences in Reporting Harassment
Gender differences in reporting harassment at NIST. The number of respondents for each question is shown in parenthesis.
Of those who did report the harassment, about 30 % of women said that the issue was resolved to their satisfaction. About 20 % of women who did report the harassment mentioned they do not know the resolution of the report. Of the 3.2 % of men who have experienced harassment because of their gender, about 15 % reported the harassment, and, unfortunately 100 % of those that reported said the issue was not resolved to their satisfaction. Finally, none of the other gender employees has reported the harassment.
A final open-ended text box was used in the section to capture any additional comments about NIST culture. Exemplars from the open-ended data are presented in Table 5, in decreasing
______________________________________________________________________________________________________ This publication is available free of charge from
: https://doi.org/10.6028/NIST.IR
.8362
22
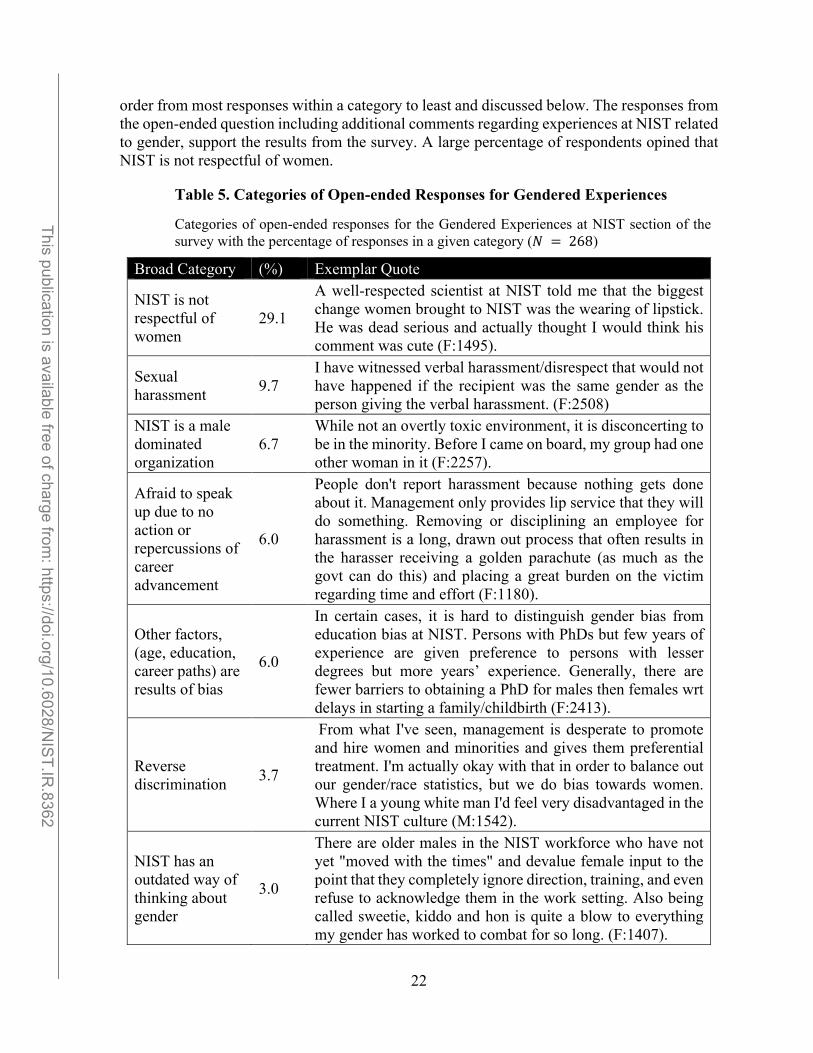
order from most responses within a category to least and discussed below. The responses from the open-ended question including additional comments regarding experiences at NIST related to gender, support the results from the survey. A large percentage of respondents opined that NIST is not respectful of women.
Table 5. Categories of Open-ended Responses for Gendered Experiences
Categories of open-ended responses for the Gendered Experiences at NIST section of the survey with the percentage of responses in a given category (𝑁𝑁 = 268)
Broad Category (%) Exemplar Quote
NIST is not respectful of women
29.1
A well-respected scientist at NIST told me that the biggest change women brought to NIST was the wearing of lipstick. He was dead serious and actually thought I would think his comment was cute (F:1495).
Sexual harassment 9.7
I have witnessed verbal harassment/disrespect that would not have happened if the recipient was the same gender as the person giving the verbal harassment. (F:2508)
NIST is a male dominated organization
6.7 While not an overtly toxic environment, it is disconcerting to be in the minority. Before I came on board, my group had one other woman in it (F:2257).
Afraid to speak up due to no action or repercussions of career advancement
6.0
People don't report harassment because nothing gets done about it. Management only provides lip service that they will do something. Removing or disciplining an employee for harassment is a long, drawn out process that often results in the harasser receiving a golden parachute (as much as the govt can do this) and placing a great burden on the victim regarding time and effort (F:1180).
Other factors, (age, education, career paths) are results of bias
6.0
In certain cases, it is hard to distinguish gender bias from education bias at NIST. Persons with PhDs but few years of experience are given preference to persons with lesser degrees but more years’ experience. Generally, there are fewer barriers to obtaining a PhD for males then females wrt delays in starting a family/childbirth (F:2413).
Reverse discrimination 3.7
From what I've seen, management is desperate to promote and hire women and minorities and gives them preferential treatment. I'm actually okay with that in order to balance out our gender/race statistics, but we do bias towards women. Where I a young white man I'd feel very disadvantaged in the current NIST culture (M:1542).
NIST has an outdated way of thinking about gender
3.0
There are older males in the NIST workforce who have not yet "moved with the times" and devalue female input to the point that they completely ignore direction, training, and even refuse to acknowledge them in the work setting. Also being called sweetie, kiddo and hon is quite a blow to everything my gender has worked to combat for so long. (F:1407).
______________________________________________________________________________________________________ This publication is available free of charge from
: https://doi.org/10.6028/NIST.IR
.8362

23
Interactions at NIST
This section presents a part of the survey that focuses on the broadly defined interactions at NIST. It comprises of three parts which were also presented to respondents as three separate subsections on the survey. The first subsection includes nine questions related to meritocracy, objectivity, and the patriarchy of science, to the gendered aspect of interactions, to the nature of the respondent’s work (i.e., teamwork vs Principal Investigator (PI) model) and their own perception of their overall “fitting in” at NIST, and questions about interest in taking on a leadership position at NIST.
For each question within this section, respondents answered using a four-level even-point Likert scale, with responses ranging from “Strongly Disagree” to “Strongly Agree”. Figure 18 and Figure 19 present the responses to this part of questions pertaining to interactions at NIST.
Figure 18. Interactions at NIST (Part 1)
The top bar of each graph shows the cumulative distribution of responses while the three lower bars show the distribution of responses by gender. The scale ranges from “Strongly disagree” (dark gray) to “Strongly Agree” (dark purple). The number of respondents for each question is shown in parentheses.
The first two questions in this part address meritocracy and objectivity at NIST. As shown in the top panel in Figure 18, significantly more women believe they have to work harder than their colleagues to be recognized and accepted because of their gender (49.1 % women vs.
______________________________________________________________________________________________________ This publication is available free of charge from
: https://doi.org/10.6028/NIST.IR
.8362

24
6.9 % men, see the top panel) (𝜒𝜒2(1) = 244, 𝑝𝑝𝑐𝑐𝑐𝑐𝑐𝑐𝑐𝑐 < 0.001). Significantly more women also believe they had to wait longer for promotion because of their gender (27.0 % women vs. 5.9 % men, see the second panel) (𝜒𝜒2(1) = 88, 𝑝𝑝𝑐𝑐𝑐𝑐𝑐𝑐𝑐𝑐 < 0.001). The beliefs of other gender respondents lie in between women and men, with 27.3 % reporting they have to work harder because of their gender and 16.6 % reporting they were not considered for promotion because of their gender.
Figure 19. Interactions at NIST (Part 2)
The top bar of each graph shows the cumulative distribution of responses while the three lower bars show the distribution of responses by gender. The scale ranges from “Strongly disagree” (dark gray) to “Strongly Agree” (dark purple). The number of respondents for each question is shown in parentheses.
The next question is related to the gendered aspect of interactions, and in particular the respondents’ beliefs about the relation between visual appearance and competence. The responses to this question are fairly balanced and comparable between the two dominant genders, with 48.9 % men and 56.4 % women agreeing that the way they dress influences how their competence is being judged (see third panel in Figure 18) (𝜒𝜒2(1) = 5.6, 𝑝𝑝𝑐𝑐𝑐𝑐𝑐𝑐𝑐𝑐 = 0.03).
______________________________________________________________________________________________________ This publication is available free of charge from
: https://doi.org/10.6028/NIST.IR
.8362

25
Among the respondents with other gender, 75 % agree with this statement. Interestingly, majority of respondents (87.8 %), regardless of gender, agree that people they work with listen to their ideas when making decision (see bottom panel in Figure 18) (𝜒𝜒2(1) = 2.6, 𝑝𝑝𝑐𝑐𝑐𝑐𝑐𝑐𝑐𝑐 =0.14).
The next two questions in this section, shown in Figure 19 are related to the nature of the respondents work and their perception of their “fitting in” with their teammates. Over a third of respondents report working mostly alone (35.3 % men, 34.0 % women, 58.4 % other gender) (𝜒𝜒2(1) = 0.1, 𝑝𝑝𝑐𝑐𝑐𝑐𝑐𝑐𝑐𝑐 = 0.70). At the same time, over 82.0 % of respondents, regardless of gender, report feeling that they “fit in” with colleagues they work with (𝜒𝜒2(1) = 1.9, 𝑝𝑝𝑐𝑐𝑐𝑐𝑐𝑐𝑐𝑐 = 0.19).
The last three questions in this part pertain to respondents’ interest in taking on a leadership position at NIST and to their perceptions of gendered opportunities for such positions. While over 55.0 % of respondents, regardless of gender, expressed interest in taking on a leadership position at NIST (𝜒𝜒2(1) = 4.0, 𝑝𝑝𝑐𝑐𝑐𝑐𝑐𝑐𝑐𝑐 = 0.07), there are significant differences in the perception of opportunities for such position between genders. In particular, while 70.7 % of men believe that the opportunities are equal, regardless of gender (see fourth panel in Figure 19), only 47.5 % of women (46.2 % of respondent with other gender) agreed with the statement (𝜒𝜒2(1) = 58, 𝑝𝑝𝑐𝑐𝑐𝑐𝑐𝑐𝑐𝑐 < 0.001). Similarly, while 88.6 % of men believe they would be accepted and respected as leaders at NIST, only 67.9 % of woman (61.5 % other gender) agreed with this statement (see bottom panel in Figure 19) (𝜒𝜒2(1) = 68, 𝑝𝑝𝑐𝑐𝑐𝑐𝑐𝑐𝑐𝑐 < 0.001).
The theme of the second subsection of the survey related to interactions at NIST focused on connections at NIST. Here, the aim is to capture whether there are differences between the frequency and level of influence of interactions between the genders. For each of the four questions within this section, respondents answered using five-level frequency scale, choosing one of the following options (listed from least to most frequent):
• Never • Rarely (once a year) • Occasionally (at least once a quarter) • Sometimes (at least once a month) • Frequently (at least once a week)
Figure 20 summarizes the results for this part. As expected, the frequency of reported interactions decreases as the status of the subject of these interactions increases. Over 90.0 % of respondents report having conversations with colleagues at least once a month, with the number slightly higher for men (93.2 %) than women (87.0 %) and other gender (84.6 %). At least once a month interactions with First Line Supervisors are reported by over 88.0 % of respondents, with a slightly higher fraction for other gender (92.3 %). At least once a month interactions with Second Line Supervisors are reported by about 44.0 % of respondents, though here the fraction for other gender is lower than of men and women (30.8 % vs. 45.1 % and 43.5 %, respectively). Finally, the majority of respondents (over 80.0 %) report rather infrequent (i.e., less than once a month) interactions with their OU Director. We find no statistically significant differences between genders for any of these questions (𝜒𝜒2(1) = 10.9,
______________________________________________________________________________________________________ This publication is available free of charge from
: https://doi.org/10.6028/NIST.IR
.8362

26
𝑝𝑝𝑐𝑐𝑐𝑐𝑐𝑐𝑐𝑐 = 0.004 for the first questions; 𝜒𝜒2(1) = 0.5, 𝑝𝑝𝑐𝑐𝑐𝑐𝑐𝑐𝑐𝑐 = 0.64 for the second one; 𝜒𝜒2(1) =0.2, 𝑝𝑝𝑐𝑐𝑐𝑐𝑐𝑐𝑐𝑐 = 0.64 for the third one; 𝜒𝜒2(1) = 2.6, 𝑝𝑝𝑐𝑐𝑐𝑐𝑐𝑐𝑐𝑐 = 0.22 for the fourth one).
Figure 20. Interactions at NIST: Connections
The top bar of each graph shows the cumulative distribution of responses while the three lower bars show the distribution of responses by gender. The scale ranges from “Strongly disagree” (dark gray) to “Strongly Agree” (dark purple). The number of respondents for each question is shown in parentheses.
The last subsection of the survey focuses on mentor-mentee interaction. Here, the respondents were asked whether they either had a mentor (formal or informal) or were a mentor (formal or informal) to others. The third question in this section asks whether the respondents ever considered leaving NIST for reasons related to diversity. Figure 21 shows the responses to all three questions. For questions related to mentoring experience there are follow up questions (shown only to those who reported having such experience).
As can be seen in the top panel of Figure 21, about 73.0 % of men and women report having mentors who helped them be successful at NIST (𝜒𝜒2(1) = 0.6, 𝑝𝑝𝑐𝑐𝑐𝑐𝑐𝑐𝑐𝑐 = 0.55), with about 19.0 % of both genders reporting having formal mentors (second panel) (𝜒𝜒2(1) = 0.3, 𝑝𝑝𝑐𝑐𝑐𝑐𝑐𝑐𝑐𝑐 =0.56). The numbers are somewhat lower for the other gender, with 46.2 % of respondents reporting having mentors, and 15.4 % of those as formal mentoring opportunities.
______________________________________________________________________________________________________ This publication is available free of charge from
: https://doi.org/10.6028/NIST.IR
.8362

27
Figure 21. Interactions at NIST: Mentoring
The top bar of each graph shows the cumulative distribution of responses while the three lower bars show the distribution of responses by gender. The number of respondents for each question is shown in parentheses.
The opposite trend is observed for those serving as a mentor, with about 57.0 % of men and women reporting being a mentor to others at NIST (𝜒𝜒2(1) = 1.7, 𝑝𝑝𝑐𝑐𝑐𝑐𝑐𝑐𝑐𝑐 = 0.32) compared to 69.2 % for the other gender (see middle panel in Figure 21). Of these, formal mentoring is reported by 13.6 % men, 9.7 % women, and 15.4 % other gender (fourth panel) (𝜒𝜒2(1) = 3.2, 𝑝𝑝𝑐𝑐𝑐𝑐𝑐𝑐𝑐𝑐 = 0.19). No statistically significant differences between genders were found for the mentoring questions.
The largest discrepancy between genders is observed for the last question in this subsection, asking about leaving NIST. While only 11.3 % of men report such consideration, the numbers are significantly higher for women (28.8 %; 𝜒𝜒2(1) = 28.9, 𝑝𝑝𝑐𝑐𝑐𝑐𝑐𝑐𝑐𝑐 < 0.001), and higher yet for other gender (44.4 %). For the last questions, respondents who reported considering leaving NIST were given an opportunity to share their thoughts and concerns about the work environment at NIST in an open-ended format. The comments provided are summarized in Table 6. The reasons for leaving NIST range from lack of opportunity for advancement, to lack of life-work balance, to discrimination and lack of respect.
______________________________________________________________________________________________________ This publication is available free of charge from
: https://doi.org/10.6028/NIST.IR
.8362

28
Table 6. Categories of Open-Ended Responses for Interactions
Categories of open-ended responses for the Interactions at NIST section of the survey with the percentage of responses in a given category (𝑁𝑁 = 93)
Broad Category (%) Exemplar Quote
Lack of opportunity for advancement
30.1
Lack of opportunity to work in an area over a time period where excellence can be demonstrated through peer reviewed journals (the only way that excellence is recognized at NIST). Complex team assignments performed for the benefit of NIST and the American people are not well recognized (M:2445).
Lack of diversity 30.1
There is little-to-no diversity among leadership, and NIST does little to support its minority staff at any level of their career. Women in leadership are unicorns at NIST (F:2020).
Lack of respect for women
19.4
Comments mentioned in earlier response about workplace respect. Male colleague was consistently rude, demeaning, and horrible to work with for months. Supervisor didn't stand up for me, I had to put myself out there and stand up for myself. Risky business as a lower-on-the-totem-pole female (F:1872).
Harassment 7.5
I have been at NIST for several decades. I have experienced sexual harassment and discrimination based on both my education level and gender. I have also had some horrific group leaders. Bad first line managers can really make or break a workplace and for me were more a reason to consider leaving than any other (F:1767).
Nepotism 5.4
The line of managers usually come from close pedigree. Staff who know the managers well are given more recognition and more resources. The division, in turn, is controlled by a small fraction of people. Lots of capable scientists and engineers were driven away by them. Hiring is limited to inferiors who listen to the people who already gained power, as these people can easily be controlled. I'm very sad to see the organization coming down this way. The most depressing is that the status quo won't end any time soon (M:1944).
Lack of work/life balance
4.3
Work/life balance issues. My job is demanding with requirements for afterhours work. It is hard to raise a family and work > 40 hours at odd times. The expectations of management and colleagues during that time did not take these issues into consideration during my child-rearing years though things have improved (M:1780).
______________________________________________________________________________________________________ This publication is available free of charge from
: https://doi.org/10.6028/NIST.IR
.8362

29
Beliefs about NIST
This section presents results that relate to the culture of NIST, with the focus on objectivity and career advancement, work/life balance, and the perception of the overall patriarchal culture of NIST. It includes 13 questions with four-level even-point Likert scale, with responses ranging from “Strongly Disagree” to “Strongly Agree”. Figure 22, Figure 23, and Figure 24 present the summary of the results for this part of the survey.
The first five questions focus on objectivity and beliefs about objectivity and career advancement. As we can see in the top two panels, while over 75.0 % of respondents agree that men and women have equal opportunity to be hired (𝜒𝜒2(1) = 5.0, 𝑝𝑝𝑐𝑐𝑐𝑐𝑐𝑐𝑐𝑐 = 0.03), there is a significant difference in beliefs about equal opportunities for advancement and promotion.
Figure 22. NIST Culture: Objectivity and Career Advancement
The top bar of each graph shows the cumulative distribution of responses while the three lower bars show the distribution of responses by gender. The scale ranges from “Strongly disagree” (dark gray) to “Strongly Agree” (dark purple). The number of respondents for each question is shown in parentheses.
______________________________________________________________________________________________________ This publication is available free of charge from
: https://doi.org/10.6028/NIST.IR
.8362

30
In particular, about 20.0 % more men than women or other gender believe that the opportunities for advancement are equal (second panel in Figure 22) (𝜒𝜒2(1) = 52.1, 𝑝𝑝𝑐𝑐𝑐𝑐𝑐𝑐𝑐𝑐 <0.001) and that promotion is applied fairly regardless of gender (bottom panel in Figure 22) (𝜒𝜒2(1) = 38.4, 𝑝𝑝𝑐𝑐𝑐𝑐𝑐𝑐𝑐𝑐 < 0.001). Moreover, about 27.0 % more men than women believe that neither time spent in a pay band (third panel in Figure 22) (𝜒𝜒2(1) = 74.5, 𝑝𝑝𝑐𝑐𝑐𝑐𝑐𝑐𝑐𝑐 < 0.001) nor the compensation one receives (fourth panel in Figure 22) (𝜒𝜒2(1) = 79.7, 𝑝𝑝𝑐𝑐𝑐𝑐𝑐𝑐𝑐𝑐 < 0.001) depend on gender. The responses of other gender tend to lie in between men and women, with the exception of the question about opportunities to be hired (with the number at 53.8 % being much lower than for either men or women) and the question about time spent in a pay band (with the number at 66.7 % being close to the agreement rate of men).
Figure 23. NIST Culture: Work/Life Balance
The top bar of each graph shows the cumulative distribution of responses while the three lower bars show the distribution of responses by gender. The scale ranges from “Strongly disagree” (dark gray) to “Strongly Agree” (dark purple). The number of respondents for each question is shown in parentheses.
______________________________________________________________________________________________________ This publication is available free of charge from
: https://doi.org/10.6028/NIST.IR
.8362
31
The next five questions in this section are related to beliefs about the work/life balance. As can be seen in the top panel in Figure 23, over 91.0 % of men and women believe their need to balance work and other life obligations is supported at NIST (𝜒𝜒2(1) = 0.6, 𝑝𝑝𝑐𝑐𝑐𝑐𝑐𝑐𝑐𝑐 = 0.44). However, nearly 40.0 % of women (and over 36.0 % other gender) believe that women with young and school-aged children are considered to be less committed to their career than women without children, which is significantly more than men (15.9 %; 𝜒𝜒2(1) = 71.9, 𝑝𝑝𝑐𝑐𝑐𝑐𝑐𝑐𝑐𝑐 <0.001), see second panel in Figure 23. The opinions are much more aligned for an analogous question about commitment to career for men with and without children (𝜒𝜒2(1) = 4.9, 𝑝𝑝𝑐𝑐𝑐𝑐𝑐𝑐𝑐𝑐 =0.03), with only 13.7 % of men and 9.1 % of women agreeing that men with children are considered to be less committed (the agreement rate for other gender is a little over 27.0 %; see third panel in Figure 23).
About 25.0% of men and women believe that using the available workplace flexibilities can negatively impact one’s career (𝜒𝜒2(1) = 6.1, 𝑝𝑝𝑐𝑐𝑐𝑐𝑐𝑐𝑐𝑐 = 0.02) and about 40.0 % believe that at NIST, working long hours is an important sign of commitment (𝜒𝜒2(1) = 0.7, 𝑝𝑝𝑐𝑐𝑐𝑐𝑐𝑐𝑐𝑐 = 0.43) (last two panels in Figure 23). The numbers are somewhat higher for the other gender, with over 36.0 % agreeing that using available flexibilities can negatively affect one’s career and with over 58.0 % agreeing that, at NIST, working long hours indicates commitment.
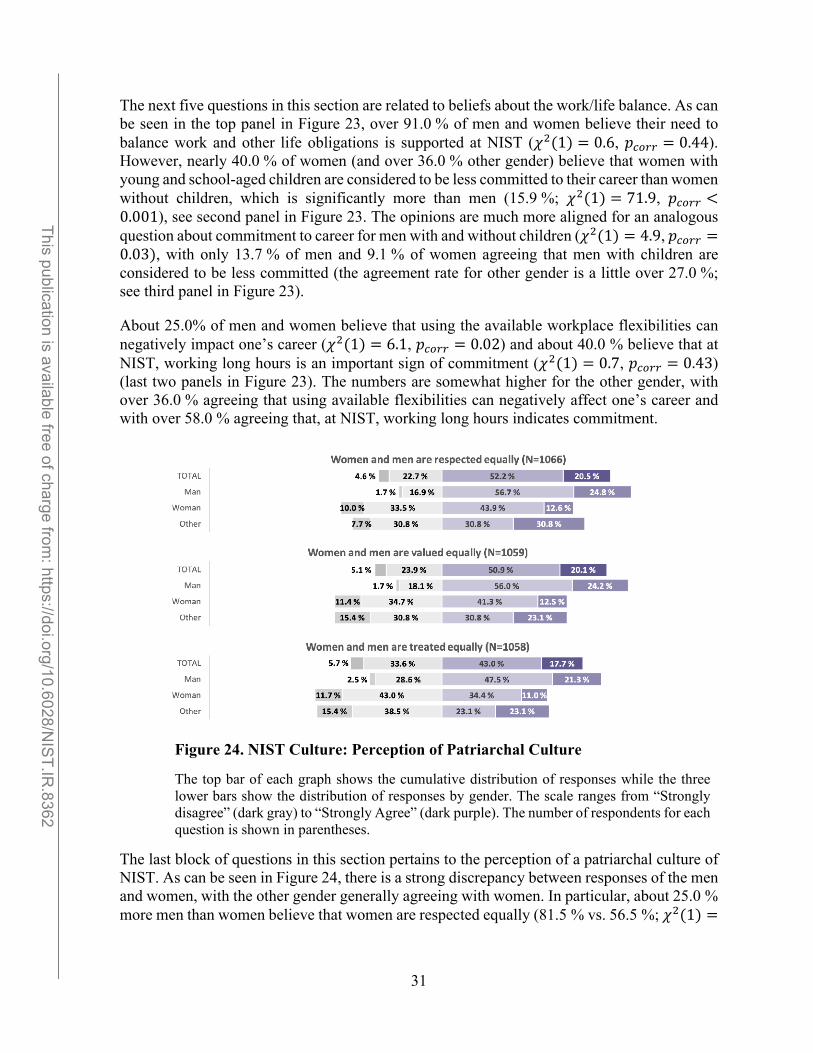
Figure 24. NIST Culture: Perception of Patriarchal Culture
The top bar of each graph shows the cumulative distribution of responses while the three lower bars show the distribution of responses by gender. The scale ranges from “Strongly disagree” (dark gray) to “Strongly Agree” (dark purple). The number of respondents for each question is shown in parentheses.
The last block of questions in this section pertains to the perception of a patriarchal culture of NIST. As can be seen in Figure 24, there is a strong discrepancy between responses of the men and women, with the other gender generally agreeing with women. In particular, about 25.0 % more men than women believe that women are respected equally (81.5 % vs. 56.5 %; 𝜒𝜒2(1) =
______________________________________________________________________________________________________ This publication is available free of charge from
: https://doi.org/10.6028/NIST.IR
.8362

32
76.3, 𝑝𝑝𝑐𝑐𝑐𝑐𝑐𝑐𝑐𝑐 < 0.001), valued equally (80.2 % vs. 53.8 %; 𝜒𝜒2(1) = 81.9, 𝑝𝑝𝑐𝑐𝑐𝑐𝑐𝑐𝑐𝑐 < 0.001), and treated equally (68.9 % vs. 45.4 %; 𝜒𝜒2(1) = 57.5, 𝑝𝑝𝑐𝑐𝑐𝑐𝑐𝑐𝑐𝑐 < 0.001).
As in previous sections, for the last questions respondents were given an opportunity to share their thoughts and concerns related to their beliefs about NIST. Comments provided in response are summarized in Table 7.
Table 7. Categories of Open-Ended Responses for Beliefs about NIST
Categories of open-ended responses for the Beliefs about NIST section of the survey with the percentage of responses in a given category (𝑁𝑁 = 229)
Broad Category (%) Exemplar Quote
Treated differently based on gender
15.7
If a highly experienced male researcher has disparaging remarks about a lesser-established female researcher, it will be let go; again, I see this as valuing the scientific contributions of the male over the respect of the female. This happened in my division two years ago, resulting in an older, more experienced male assuming group leadership from a younger, less experienced female. A subsequent EEO complaint to DOC resulted in reparation for the female. But the damage was already done, and continues to occur, to her work environment and career (M:1768).
Poor workplace flexibilities
12.7
There are programs like telework etc. which are great, but they are not allowed in many OUs and In OUs that allow the use when you use them you are disrespected. When you use the flexibilities, you are left out (F: 2640).
Reverse discrimination 10.0
"Value" implies someone is worth more than another based on gender; I see diversity & inclusion as valuing the minorities more than those in the majority, for the simple fact that by hiring more minorities NIST can boast about better numbers in terms of diversity. If this is to be truly a merit-based system, then everyone should be valued equally, and the jobs and promotions should go to those who competitively earn them based on experience, achievement and potential. An employee's skills and abilities should be valued higher than one's skin color or gender (M:2225).
Pay and hiring process too opaque/ subjective
5.7 Decisions about promotions are never transparent, so it's hard to assess their fairness (M:1813).
Boys Club 5.7 Women are often not in the 'good old boys clubs' that exist in ITL (F:1214).
______________________________________________________________________________________________________ This publication is available free of charge from
: https://doi.org/10.6028/NIST.IR
.8362

33
Inequality in promotions/ leadership
4.8
On men/women having equal opportunities for advancement - again, managers tend to promote people that resonates with them. In a lot of cases, the people who are promoted are people just like them, i.e., male, white. So, no, I do not believe that women and men have the same likelihood of being promoted. On promotion, I think men tend to self-advocate more than women do, so I think men get promoted faster (squeaky wheel theory), but I don't have the data (F:1702).
Longer hours = more committed to organization
3.5
regarding question 10. Working long hours is an important sign of commitment., Although I do not believe this, I do think it is the culture of NIST. It is reflected in the way people talk about how hard they are working to their colleagues and supervisors (M:1625).
General Thoughts
The last section of the survey, presented here, includes two questions that focus on the overall sense of satisfaction from working at NIST and on a broadly defined perception of respect and recognition at NIST. For both questions respondents were asked to rank up to three top choices, choosing from the following options when answering the question about satisfaction:
• Making a difference in world • Contributing to science • Having stability in my work life • Having a high-quality work environment • Having access to cutting edge technology • Having strong relationships with coworkers • Helping NIST to excel and grow • Doing interesting, challenging work that gives me a sense of accomplishment • Being respected and valued at work • Receiving appropriate compensation for the work I do • Having a good work/life balance • I don’t get any satisfaction from working at NIST
and choosing from the following options when answering the question about perception of respect at NIST:
• For being a scientist • For being a man • For having been at NIST a long time • For the kind of degree a person has
______________________________________________________________________________________________________ This publication is available free of charge from
: https://doi.org/10.6028/NIST.IR
.8362

34
• For getting things done using administrative expertise • For the job description a person has • For the number of awards a person has • For the way a person dresses
In both cases, the respondents were given the opportunity to add comments in the form of an open-ended follow-up question.
As illustrated in Figure 25, when asked about what gives the respondents the sense of satisfaction, the top choice for all genders is “doing interesting, challenging work that gives me a sense of accomplishment”. “Having a good work/life balance” is the second top choice for men and women, while for the other gender the second top choice is “contributing to science” (which is also the third top choice for men, closely tied with the “making a difference in world” option). “Making a difference in the world” is also the third top choice for the other gender. Importantly, for women the third top choice is “being respected and valued at work”.
Figure 25. Satisfaction Working at NIST
For each question, the responses are divided by gender (M denoted male, F – female, and O – other gender). The intensity of color represents the rank order, with the darkest color corresponding to rank 1.
The distribution of responses to the questions about respect and recognition at NIST is presented in Figure 26. Here, respondents of all genders agree on the top two choices, identifying “being a scientist” as the top reason for respect, followed by “having been at NIST a long time”. Men and other gender agreed on their third top choice as “the number of awards a person has”, while women identified “the kind of degree a person has” as the third top reason for respect.
______________________________________________________________________________________________________ This publication is available free of charge from
: https://doi.org/10.6028/NIST.IR
.8362

35
Figure 26. Respect and Recognition at NIST
For each question, the responses are divided by gender (M denoted male, F – female, and O – other gender). The intensity of color represents the rank order, with the darkest color corresponding to rank 1.
There were opened-ended text boxes for each of these questions asking if there is any other factor that gives you satisfaction from working at NIST and if there are additional reasons why people are respected at NIST. For the first question most of the comments elaborated on the choice provided in the survey. For the second question on providing additional reasons people are respected, Table 8 shows some of the categories of responses. The most frequently mentioned category was “people are respected more for being an overall great employee” and for the quality of research, competence, ability to get things done, and the leadership they display.
Table 8. Additional Reasons People are Respected
Categories of open-ended responses for additional reasons that people are respected, (𝑵𝑵 = 𝟐𝟐𝟐𝟐𝟐𝟐)
Broad Category (%) Being an overall great employee 29.1
Character/How you treat others 11.3
Amount of publishing 8.4
Nepotism 8.0
Collaborations 7.3
Bringing in funding 2.2
______________________________________________________________________________________________________ This publication is available free of charge from
: https://doi.org/10.6028/NIST.IR
.8362
36
5 Discussion
Phase 3 of this sequential, exploratory mixed methods study was designed to assess the perception of gender equity at NIST as it relates to diversity and inclusivity. It provides significant evidence that men and women have different views and understanding of how gender affects the culture, beliefs, and even interactions at NIST. This survey confirms, clarifies and/or expands on the gender related issues identified in Phase 2 of the study, the interviews.
We evaluated perceptions of gender inequity as it relates to diversity and inclusivity in a sample of 1,093 completed survey respondents. This survey sample has representation from all of the organizational units at NIST. Most importantly, the survey participants reflect each of the largest population career paths represented at NIST.
The analysis found many questions where women and men experience NIST in the same way. For example for the following survey items, there were no significant differences between women and men, both agree that:
• teamwork is valued and rewarded • staff who have been at NIST for a long time are listened to more • NIST values scientists over other staff • NIST believes it is more objective than subjective • the way one dresses influences how one’s competence is being judged • the people one works with listen to one’s ideas when making decisions • staff work primarily alone • staff “fit in” with colleagues they work with • men and women have equal opportunity to be hired • the need to balance work and other life obligations is supported • doing interesting, challenging work gives a sense of accomplishment that provides the
most satisfaction.
Both women and men also disagree with the statement that:
• projects are more important than people.
But the analysis of the survey data also shows that there is a significant difference between how men, women, and others perceive certain aspects of NIST’s culture. For example, men have a more positive perception about Senior Leadership and OU commitment to diversity and inclusivity than women. More men believe that the best opportunities go to the most deserving employees while more women believe that opportunities are based on who you know. The responses to gendered experiences showed the most striking differences, more women responded that they have been interrupted in meetings, excluded from meetings, denied credit for ideas or work, had their judgement questioned, missed out on opportunities and experienced harassment. More women believe they must work harder to be recognized and accepted, to be promoted and provided opportunities for advancement. More women believe that the culture
______________________________________________________________________________________________________ This publication is available free of charge from
: https://doi.org/10.6028/NIST.IR
.8362

37
of NIST is patriarchal and that women with young or school-aged children are considered less committed to their careers than their male counterparts. Finally, the number of women who have considered leaving NIST for reasons related to diversity and inclusivity is significantly higher than men.
6 Conclusion
To summarize, the survey results presented are consistent with the phase 1 analysis of the human resources data [1] and confirm the phase 2 in-depth qualitative analysis [2]. Referring back to the research questions, the survey results indicate that women and men do experience work at NIST differently. Employees do perceive that gender inequities exist for women and others and that some elements of NIST’s culture contribute to the lack of inclusivity.
This report presents an initial analysis of the data. This report examines only the NIST level statistics for the survey questions by gender. There are many additional analyses that could be examined including analyzing the data by Directorate, by OU, by length of service, or by age of respondents. In addition, the analysis did not include inferential statistics. Examining the data by these additional dimensions will provide a deeper understanding of research questions and the culture of NIST.
An additional report is planned that will integrate the findings from all three phases to provide a holistic view of the findings focusing on how the data converge and/or diverge.
Acknowledgments
We would like to acknowledge and thank those who have made this study possible. First, we would like to acknowledge the Associate Director of Laboratory Programs, Dr. James Olthoff, for the funding support and opportunity to perform this research. Additionally, we would like to thank all the federal employees who graciously gave their time and input for this project.
______________________________________________________________________________________________________
This publication is available free of charge from: https://doi.org/10.6028/N
IST.IR.8362

38
References
1. Evans, J., Koepke, A., Lund, S.P., Theofanos, M.F. , NIST Workforce Demographics Analysis. Draft 2020, National Institute of Standards and Technology.
2. Theofanos, M., Prettyman, S., Evans,J., Furman, S. , Voices of NIST: A Study of Gender and Inclusivity, Findings from In-depth Interviews. Draft. October, 2020, National Institute of Standards and Technology.
3. Nadler, J.T., R. Weston, and E.C. Voyles, Stuck in the middle: the use and interpretation of mid-points in items on questionnaires. The Journal of general psychology, 2015. 142(2): p. 71-89.
4. Kulas, J.T., et al., Post‐stratification weighting in organizational surveys: a cross‐disciplinary tutorial. Human Resource Management, 2018. 57(2): p. 419-436.
______________________________________________________________________________________________________ This publication is available free of charge from
: https://doi.org/10.6028/NIST.IR
.8362
39
Appendix A: Email Template
Initial Email Invitation Template
To line: <individualized>
Subject line: Please Respond: New Survey on Gender, Equity, and Inclusivity at NIST
Dear Colleagues,
As we emphasize often, one of our core values at NIST is inclusivity. This value is also our aspiration for ensuring a welcoming culture where each of us can thrive. The NIST leadership team and I are fully committed to advancing equity, diversity and inclusivity for all at NIST. As part of that effort, we announced three gender equity projects last fall, and these have been progressing well.
We are now launching a survey of all NIST federal employees and we need your input. Your voice is important as we seek to move NIST forward in our quest to enhance the NIST culture of inclusivity, with equity!
Please click the link below and provide your answers by Friday, September 4th. Survey responses are anonymous, and it should take less than 20 minutes to complete. Consider this time well invested in a better future for NISTers.
LINK to survey: https://NISTusability.checkbox.com/Gender-and-Diversity
We hope the survey will help us identify barriers and positive influences that affect women’s opportunities at NIST. By participating you will be helping us better understand how women and men describe their work experiences, including the culture and work environment at NIST in order to inform appropriate action.
A fact sheet describing the survey is available on the NIST internal website.
Please join us on this journey to continue improving the equity, diversity and inclusivity of the NIST workforce.
Warm regards,
Walt Copan NIST Director
______________________________________________________________________________________________________ This publication is available free of charge from
: https://doi.org/10.6028/NIST.IR
.8362

40
Appendix B: Alignment of Survey to purpose and research questions
• Purpose
Explore the experiences of NIST FED employees, at all levels, to identify the ways in which differential opportunities might exist, in this case related to gender. The goal is to provide the organization with data about how women and men experience work at NIST, including the ways in which inequities manifest themselves related to gender. The ultimate goal is to make the organization more equitable and inclusive so NIST can be a better science institution.
• Specific objectives
1. Assess NIST Fed employee beliefs, perceptions, and experiences related to gender equity and inclusion
2. Identify the ways in which NIST culture (including organizational practices and policies as well as broader cultural values and beliefs) contributes to gender inequities and a lack of inclusion, if at all.
• Research Questions
Overarching question(s) (Integration Question)
1. What are the barriers and facilitators, if any, that impact women’s opportunities at NIST? 2. In what way does the quantitative and qualitative data converge?
Qualitative Question(s)
1. How do men and women describe their work experiences, their work environment, and their work opportunities at NIST?
2. In what ways are the work experiences, work environment, and work opportunities similar and/or different for women and men?
3. What practices/systems contribute to limiting or facilitating career opportunities for women and men at NIST
Quantitative Question(s)
1. What are the differences, if any, in the ways in which men and women experience work at NIST?
2. What, if any, gender inequities exist at NIST? 3. To what extent do employees at NIST perceive that gender inequities exist? 4. In what ways, if at all, does NIST culture contribute to a lack of inclusivity?
______________________________________________________________________________________________________ This publication is available free of charge from
: https://doi.org/10.6028/NIST.IR
.8362

41
Quantitative Research Questions Survey Categories
What are the differences, if any, in the ways in which men and women experience work at NIST
● Gendered Experiences at NIST ● Interactions at NIST
What, if any, gender inequities exist at NIST? To what extent do employees at NIST perceive that gender inequities exist
● Beliefs about NIST
In what ways, if at all, does NIST culture contribute to a lack of inclusivity?
● Perceptions of NIST’s Culture ● NIST Commitment to Diversity &
Inclusivity
• Survey Alignment Matrix
Objective Category Category Definition
Items
Assess employees perceptions of NIST’s culture Culture
Extent to which employees agree with perceptions of NIST’s culture from in-depth interviews
Section 1: Perceptions of NIST culture 1. At NIST, opportunities are given based on who you know. 2. At NIST, the best opportunities go to the most deserving employees 3. Staff who have been at NIST for a long time are listened to more than staff who have been
at NIST for a shorter period of time. 4. At NIST, teamwork is valued just as much as individual performance. 5. At NIST, teamwork is rewarded just as much as individual performance 6. At NIST, projects are seen as more important than people. 7. NIST values scientists over other staff. 8. NIST as a scientific organization, believes itself to be more objective than subjective.
Assess employees perception of NIST ‘s Commitment to Diversity & Inclusivity
Culture
Extent to which employees agree with perceptions of NIST’s commitment to diversity and inclusivity to in-depth interviews
1. Senior Leadership, including the Director and three Associate Directors, is committed to inclusivity
______________________________________________________________________________________________________ This publication is available free of charge from
: https://doi.org/10.6028/NIST.IR
.8362
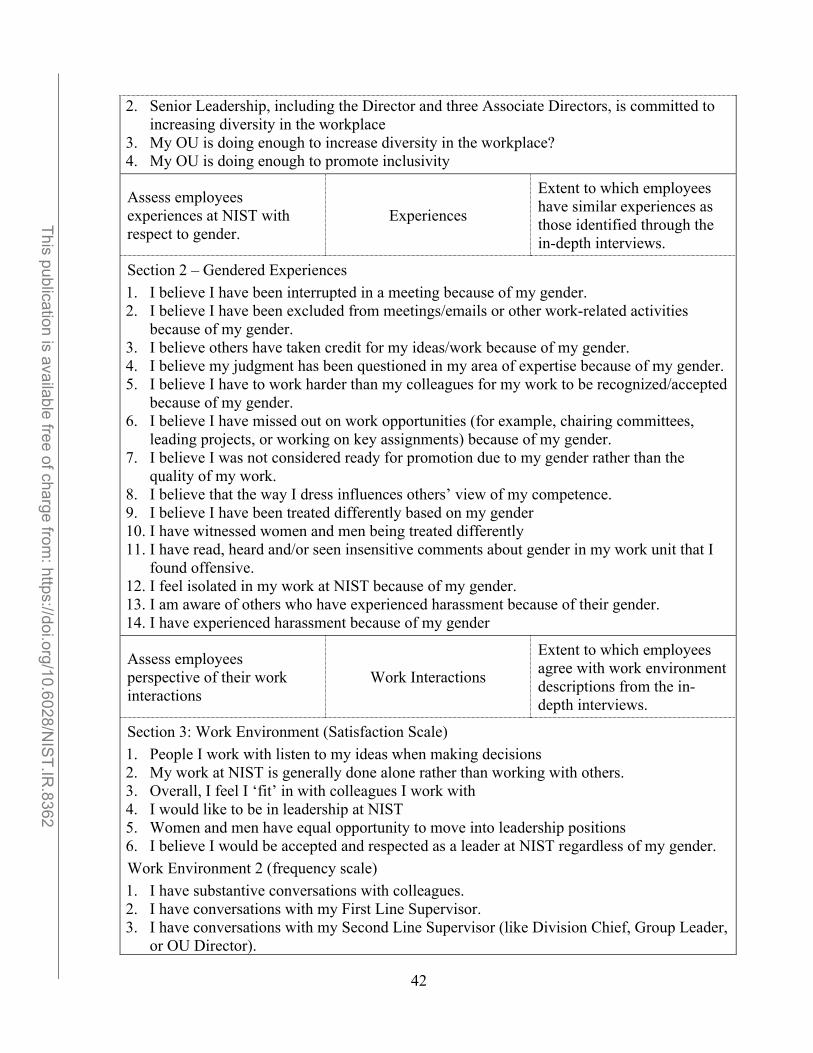
42
2. Senior Leadership, including the Director and three Associate Directors, is committed to increasing diversity in the workplace
3. My OU is doing enough to increase diversity in the workplace? 4. My OU is doing enough to promote inclusivity
Assess employees experiences at NIST with respect to gender.
Experiences
Extent to which employees have similar experiences as those identified through the in-depth interviews.
Section 2 – Gendered Experiences 1. I believe I have been interrupted in a meeting because of my gender. 2. I believe I have been excluded from meetings/emails or other work-related activities
because of my gender. 3. I believe others have taken credit for my ideas/work because of my gender. 4. I believe my judgment has been questioned in my area of expertise because of my gender. 5. I believe I have to work harder than my colleagues for my work to be recognized/accepted
because of my gender. 6. I believe I have missed out on work opportunities (for example, chairing committees,
leading projects, or working on key assignments) because of my gender. 7. I believe I was not considered ready for promotion due to my gender rather than the
quality of my work. 8. I believe that the way I dress influences others’ view of my competence. 9. I believe I have been treated differently based on my gender 10. I have witnessed women and men being treated differently 11. I have read, heard and/or seen insensitive comments about gender in my work unit that I
found offensive. 12. I feel isolated in my work at NIST because of my gender. 13. I am aware of others who have experienced harassment because of their gender. 14. I have experienced harassment because of my gender
Assess employees perspective of their work interactions
Work Interactions
Extent to which employees agree with work environment descriptions from the in- depth interviews.
Section 3: Work Environment (Satisfaction Scale) 1. People I work with listen to my ideas when making decisions 2. My work at NIST is generally done alone rather than working with others. 3. Overall, I feel I ‘fit’ in with colleagues I work with 4. I would like to be in leadership at NIST 5. Women and men have equal opportunity to move into leadership positions 6. I believe I would be accepted and respected as a leader at NIST regardless of my gender. Work Environment 2 (frequency scale) 1. I have substantive conversations with colleagues. 2. I have conversations with my First Line Supervisor. 3. I have conversations with my Second Line Supervisor (like Division Chief, Group Leader,
or OU Director).
______________________________________________________________________________________________________ This publication is available free of charge from
: https://doi.org/10.6028/NIST.IR
.8362

43
4. I have conversations with my OU Director. Work Environment 3 (Yes/No) Consider the following statements. 1. I have had formal/informal mentors who have helped me be successful at NIST. 2. I have been a formal/informal mentor to others at NIST. 3. Have you ever considered leaving NIST for reasons related to diversity?
Assess employees’ beliefs about roles with respect to gender
Beliefs Extent to which employees agree with beliefs expressed in in-depth interviews
Section 4: Beliefs 1. Women and men have equal opportunity to be hired 2. Women and men have equal opportunity for advancement 3. Women and men spend equal time in a pay band before promotion 4. Compensation is fair for women and men 5. The promotion process is applied fairly and objectively 6. My need to balance work and other life obligations is supported 7. Women who have young or school-aged children are considered to be less committed to
their careers than colleagues who are not mothers. 8. Men who have young or school-aged children are considered to be less committed to their
careers than colleagues who are not fathers. 9. Using available workplace flexibilities, such as alternative work schedules, telework, can
result in negative consequences for one’s career 10. Working long hours is an important sign of commitment 11. Women and men are respected equally. 12. Women and men are valued equally 13. Women and men are treated equally
Assess employees’ values Values Extent to which employees agree with values expressed in in-depth interviews
Section 5: Values 1. The greatest satisfaction I get from working at NIST is:
o Making a difference in world o Contributing to science o Having stability in my work life o Having a high quality work environment o Having access to cutting edge technology o Having strong relationships with coworkers o Helping NIST to excel and grow o Doing interesting, challenging work that gives me a sense of accomplishment o Being respected and valued at work o Receiving appropriate compensation for the work I do o Having a good work/life balance
______________________________________________________________________________________________________ This publication is available free of charge from
: https://doi.org/10.6028/NIST.IR
.8362

44
o I don’t get any pleasure from working at NIST 2. At NIST, people are respected more for the following:
o For being a scientist o For being a man o For having been at NIST a long time o For the kind of degree a person has o For getting things done using administrative expertise o For the job description a person has o For the number of awards a person has o For the way a person dresses o For the way a person speaks
Test for gender, age, career path, and campus differences Demographics Identification of gender, age,
career path, campus
1. I identify as: Female, Male, Other 2. My age is: (Drop down box in 10 year increments), 3. My highest Degree earned is: (list) 4. I am affiliated with the NIST site in Boulder or Gaithersburg 5. My Operating Unit (OU) at NIST is: (Drop down list of 19 OUs) 6. My Career Path at NIST is: (If SES, ST, SL, or Fellow, choose one preceding your
appointment) 7. I am a Supervisor? 8. I have worked at NIST (total number of years in any position): (Drop down box in 5 year
intervals,) 9. I have been in one of the following positions at NIST (choose all that apply): Postdoc ☐ Associate ☐ PREP student ☐ Pathways student ☐ Term employee
______________________________________________________________________________________________________ This publication is available free of charge from
: https://doi.org/10.6028/NIST.IR
.8362

45
Appendix C: Survey
Welcome to the Survey on Gender, Equity, and Inclusion of Federal Employees at NIST
This is your opportunity to share your perceptions, beliefs and experiences of the culture and work environment at NIST with regard to gender equity and inclusion.
This research survey takes approximately 20 minutes.
We appreciate your time and input!
You must be 18 to participate. Your Participation is Confidential and Voluntary. By continuing you are consenting to participate in this research. You may decline to answer any question. Click here for additional information. (X)
Click NEXT to take the survey!
Demographic Question
1. I identify as a:
Man Woman Other
If Other is selected, then ask the following question:
o If you choose, please share with us how you self-identify ____________
NIST Commitment to Diversity & Inclusivity: How much do you agree or disagree with the following statements.
1. Senior Leadership, including the Director and three Associate Directors, is committed to inclusivity. Strongly Disagree Disagree Agree Strongly Agree
2. Senior Leadership, including the Director and three Associate Directors, is committed to increasing diversity in the workplace. Strongly Disagree Disagree Agree Strongly Agree
3. My OU is doing enough to increase diversity in the workplace. Strongly Disagree Disagree Agree Strongly Agree
______________________________________________________________________________________________________ This publication is available free of charge from
: https://doi.org/10.6028/NIST.IR
.8362

46
4. My OU is doing enough to promote inclusivity. Strongly Disagree Disagree Agree Strongly Agree Text Box: Do you have any additional comments about NIST efforts related to inclusivity and diversity to include?
Perceptions of NIST Culture: How much do you agree or disagree with the following statements.
1. At NIST, I believe the best opportunities go to the most deserving employees. Strongly Disagree Disagree Agree Strongly Agree
2. At NIST, I believe opportunities are given based on who you know. Strongly Disagree Disagree Agree Strongly Agree
3. At NIST, I believe that staff who have been at NIST for a long time are listened to more than staff who have been at NIST for a shorter period of time. Strongly Disagree Disagree Agree Strongly Agree
4. At NIST, I believe that teamwork is valued just as much as individual performance. Strongly Disagree Disagree Agree Strongly Agree
5. AT NIST, I believe that teamwork is rewarded just as much as individual performance. Strongly Disagree Disagree Agree Strongly Agree
6. At NIST, I believe that projects are seen as more important than people. Strongly Disagree Disagree Agree Strongly Agree
7. I believe that NIST values scientists over other staff. Strongly Disagree Disagree Agree Strongly Agree
8. I believe that NIST as a scientific organization, believes itself to be more objective than subjective. Strongly Disagree Disagree Agree Strongly Agree
______________________________________________________________________________________________________ This publication is available free of charge from
: https://doi.org/10.6028/NIST.IR
.8362

47
Text Box: Do you have any additional comments about NIST Culture that you would like to include?
Gendered Experiences at NIST: Consider the following statements specifically in relationship to gender. Do you believe you have experienced any of the following while working at NIST?
1. I believe I have been interrupted in a meeting because of my gender. YES, has happened more than once Yes, has happened at least once NO, has not happened
2. I believe I have been excluded from meetings/emails or other work-related activities because of my gender. YES, has happened more than once Yes, has happened at least once NO, has not happened
3. I believe others have taken credit for my ideas/work because of my gender. YES, has happened more than once Yes, has happened at least once NO, has not happened
4. I believe my judgment has been questioned in my area of expertise because of my gender. YES, has happened more than once Yes, has happened at least once NO, has not happened
5. I believe I have missed out on work opportunities (for example, chairing committees, leading projects, or working on key assignments) because of my gender. YES, has happened more than once Yes, has happened at least once NO, has not happened
6. I believe I have been treated differently based on my gender. YES, has happened more than once Yes, has happened at least once NO, has not happened
7. have witnessed women and men being treated differently. YES, has happened more than once Yes, has happened at least once NO, has not happened
______________________________________________________________________________________________________ This publication is available free of charge from
: https://doi.org/10.6028/NIST.IR
.8362

48
8. I have read, heard and/or seen insensitive comments about gender in my work unit that I found offensive. YES, has happened more than once Yes, has happened at least once NO, has not happened
9. I have felt isolated in my work because of my gender. YES, has happened more than once Yes, has happened at least once NO, has not happened
10. I have experienced harassment because of my gender (for example: inappropriate touching, comments about the way you dress, comments about body parts, etc.). YES, has happened more than once Yes, has happened at least once NO, has not happened If YES to Q10 above, then ask the following question: 10A. If yes, I reported the harassment. YES NO If YES to Q10A above, then ask the following question: 10B. Was the issue resolved to your satisfaction? YES NO I DON’T KNOW
11. I am aware of others who have experienced harassment because of their gender (for example: inappropriate touching, comments about the way you dress, comments about body parts, etc.). YES NO Text Box: Do you have any additional comments about your experiences at NIST based on gender that you would like to include?
Interactions at NIST I: To what extent do you agree or disagree with the following statements.
1. I believe I have to work harder than my colleagues for my work to be recognized/accepted because of my gender. Strongly Disagree Disagree Agree Strongly Agree
______________________________________________________________________________________________________ This publication is available free of charge from
: https://doi.org/10.6028/NIST.IR
.8362
49
2. I believe I was not considered ready for promotion due to my gender rather than the quality of my work. Strongly Disagree Disagree Agree Strongly Agree
3. I believe that the way I dress influences others’ view of my competence. Strongly Disagree Disagree Agree Strongly Agree
4. People I work with listen to my ideas when making decisions. Strongly Disagree Disagree Agree Strongly Agree
5. My work at NIST is generally done alone rather than working with others. Strongly Disagree Disagree Agree Strongly Agree
6. Overall, I feel I ‘fit’ in with colleagues I work with. Strongly Disagree Disagree Agree Strongly Agree
7. I would like to be in leadership at NIST. Strongly Disagree Disagree Agree Strongly Agree
8. Women and men have equal opportunity to move into leadership positions. Strongly Disagree Disagree Agree Strongly Agree
9. I believe I would be accepted and respected as a leader at NIST regardless of my gender. Strongly Disagree Disagree Agree Strongly Agree
Interactions at NIST II: Think about how often you have the following interactions.
1. I have substantive conversations with colleagues.
Never Rarely (once a year) Occasionally (at least once a quarter) Sometimes (at least once a month) Frequently (at least once a week)
2. I have conversations with my First Line Supervisor. Never Rarely (once a year) Occasionally (at least once a quarter)
______________________________________________________________________________________________________ This publication is available free of charge from
: https://doi.org/10.6028/NIST.IR
.8362

50
Sometimes (at least once a month) Frequently (at least once a week)
3. I have conversations with my Second Line Supervisor (like Division Chief or OU Director). Never Rarely (once a year) Occasionally (at least once a quarter) Sometimes (at least once a month) Frequently (at least once a week)
4. I have conversations with my OU Director. Never Rarely (once a year) Occasionally (at least once a quarter) Sometimes (at least once a month) Frequently (at least once a week)
Interactions at NIST III: Consider the following statements.
1. I have had formal/informal mentors who have helped me be successful at NIST. YES NO If YES to Q1, then ask the following question: 1A. Was this through a formal mentoring opportunity at NIST? YES NO
2. I have been a formal/informal mentor to others at NIST. YES NO If YES to Q2, then ask the following question: 2A. Was this through a formal mentoring opportunity at NIST?? YES NO
3. Have you ever considered leaving NIST for reasons related to diversity? YES NO If YES to Q3, then ask the following question: Text Box: If you have considered leaving NIST, Why?
______________________________________________________________________________________________________ This publication is available free of charge from
: https://doi.org/10.6028/NIST.IR
.8362

51
Text Box: Do you have any additional comments about the Work Environment at NIST that you would like to include?
Beliefs about NIST: To what extent do you agree or disagree with the following statements.
At NIST:
1. Women and men have equal opportunity to be hired. Strongly Disagree Disagree Agree Strongly Agree
2. Women and men have equal opportunity for advancement. Strongly Disagree Disagree Agree Strongly Agree
3. Women and men spend equal time in a pay band before promotion. Strongly Disagree Disagree Agree Strongly Agree
3. Compensation is fair for women and men. Strongly Disagree Disagree Agree Strongly Agree
4. The promotion process is applied fairly and objectively. Strongly Disagree Disagree Agree Strongly Agree
5. My need to balance work and other life obligations is supported. Strongly Disagree Disagree Agree Strongly Agree
6. Women who have young or school-aged children are considered to be less committed to their careers than colleagues who are not mothers. Strongly Disagree Disagree Agree Strongly Agree
7. Men who have young or school-aged children are considered to be less committed to their careers than colleagues who are not fathers. Strongly Disagree Disagree Agree Strongly Agree
8. Using available workplace flexibilities, such as alternative work schedules, telework, can result in negative consequences for one’s career. Strongly Disagree Disagree Agree Strongly Agree
______________________________________________________________________________________________________ This publication is available free of charge from
: https://doi.org/10.6028/NIST.IR
.8362

52
9. Working long hours is an important sign of commitment.
Strongly Disagree Disagree Agree Strongly Agree
10. Women and men are respected equally. Strongly Disagree Disagree Agree Strongly Agree
11. Women and men are valued equally. Strongly Disagree Disagree Agree Strongly Agree
12. Women and men are treated equally. Strongly Disagree Disagree Agree Strongly Agree Text Box: Do you have any additional comments about the way men and women are treated at NIST, that you would like to include?
General Thoughts: For the next question, IDENTIFY AND RANK UP TO YOUR TOP THREE CHOICES in order of importance for you. Drag items from the left-hand box into the right-hand box to order them.
1. The greatest satisfaction I get from working at NIST is: o Making a difference in world o Contributing to science o Having stability in my work life o Having a high-quality work environment o Having access to cutting edge technology o Having strong relationships with coworkers o Helping NIST to excel and grow o Doing interesting, challenging work that gives me a sense of accomplishment o Being respected and valued at work o Receiving appropriate compensation for the work I do o Having a good work/life balance o I don’t get any satisfaction from working at NIST
Text Box: Do you have other things that give you satisfaction from working at NIST? Please list below.
______________________________________________________________________________________________________ This publication is available free of charge from
: https://doi.org/10.6028/NIST.IR
.8362

53
For the next question, IDENTIFY AND RANK UP TO YOUR TOP THREE CHOICES in order of importance for you. Drag items from the left-hand box into the right-hand box to order them.
2. At NIST, people are respected more for the following: o For being a scientist o For being a man o For having been at NIST a long time o For the kind of degree a person has o For getting things done using administrative expertise o For the job description a person has o For the number of awards a person has o For the way a person dresses o For the way a person speaks
Text Box: Are there other reasons people are respected more at NIST? Please list below.
Demographics (8 questions + 4 sub-questions): All demographic data will be aggregated to prevent identification of respondents.
1. My age is: (Drop down box in 10 year increments, start with Under 18, then go to 18—19, then 20—29, then replicate up to 60—69, then 70+)
2. My highest Degree earned is:
High School Degree BA/BS Masters PhD JD Professional Other
If Other is selected, then ask the following question: 2A. If you choose, please list your highest degree ____________
3. I am affiliated with the NIST site in:
Boulder Gaithersburg 4. My Operating Unit (OU) at NIST is: (Drop down list of 19 OUs)
5. My Career Path at NIST is: (If SES, ST, SL, or Fellow, choose the career path
immediately preceding your appointment) ZA ZP ZS ZT Wage Grade General Schedule Only ask the following 2 questions IF response to #6 is ZA, ZP, ZS, or ZT
______________________________________________________________________________________________________ This publication is available free of charge from
: https://doi.org/10.6028/NIST.IR
.8362

54
5A. My current Pay Band at NIST is: (If SES, ST, SL, or Fellow, choose the pay band immediately preceding your appointment) 1 2 3 4 5 5B. My current position at NIST only goes as high as Pay Band: (If SES, ST, SL, or Fellow, choose Pay Band 5) 1 2 3 4 5
6. I am a Supervisor? YES NO
7. I have worked at NIST (total number of years in any position): (Drop down box in 5 year intervals, going from 1—4 to 5—9; up to 40+)
8. I have been in one of the following positions at NIST (choose all that apply): Postdoc Associate PREP student Pathways student Term employee Not Applicable Only ask the following question IF any of the responses to Q8 are checked: 8A. If yes, how long did you spend in the positions you identified above? (Drop down box in one year increments, beginning with 1 and going to 10+) Postdoc Associate PREP student Pathways student Term employee Not Applicable
Thank You Page
Thank you for your participation in the Survey on Gender, Equity, and Inclusion of Federal Employees at NIST.
If you have any questions, concerns or complaints about this study, or experience an unanticipated problem or research-related injury email Mary Theofanos at [email protected].
If you have questions about your rights as a participant in this study, or have complaints, concerns or issues you want to discuss with someone outside the research team, call the Research Protections Office (RPO) at [email protected]
______________________________________________________________________________________________________ This publication is available free of charge from
: https://doi.org/10.6028/NIST.IR
.8362