SURVEY OF THE PREVALENCE OF...
89
SURVEY OF THE PREVALENCE OF PERFLUOROOCTANE SULPHONATE (PFOS), PERFLUOROOCTANOIC ACID (PFOA) AND RELATED COMPOUNDS IN DRINKING WATER AND THEIR SOURCES WRc Ref: DEFRA 7585 FEBRUARY 2008
-
Upload
truongnguyet -
Category
Documents
-
view
220 -
download
0
Transcript of SURVEY OF THE PREVALENCE OF...

SURVEY OF THE PREVALENCE OF PERFLUOROOCTANE SULPHONATE (PFOS), PERFLUOROOCTANOIC ACID (PFOA) AND RELATED COMPOUNDS IN DRINKING WATER AND THEIR SOURCES
WRc Ref: DEFRA 7585 FEBRUARY 2008

SURVEY OF THE PREVALENCE OF PERFLUOROOCTANE SULPHONATE (PFOS), PERFLUOROOCTANOIC ACID (PFOA) AND RELATED COMPOUNDS IN DRINKING WATER AND THEIR SOURCES
Report No.: DEFRA 7585
Date: February 2008
Authors: Clare Atkinson, Simon Blake, Tom Hall, Rakesh Kanda(1), Paul Rumsby
Contract Manager: Clare Atkinson
Contract No.: 14612-0
RESTRICTION: This report has the following limited distribution: DWI
(1) STL Reading
Any enquiries relating to this report should be referred to the authors at the following address:
WRc Swindon, Frankland Road, Blagrove, Swindon, Wiltshire, SN5 8YF. Telephone: + 44 (0) 1793 865000 Fax: + 44 (0) 1793 865001 Website: www.wrcplc.co.uk

The contents of this document are subject to copyright and all rights are reserved. No part of this document may be reproduced, stored in a retrieval system or transmitted, in any form or by any means electronic, mechanical, photocopying, recording or otherwise, without the prior written consent of the copyright owner.
This document has been produced by WRc plc.

CONTENTS
SUMMARY 1
1. INTRODUCTION 3
1.1 Objectives 3 1.2 Background 3
2. REVIEW OF CURRENTLY AVAILABLE MONITORING DATA FOR PFOS AND PFOA IN THE UK 5
2.1 Summary 5 2.2 Introduction 6 2.3 Data Collection Approach 9 2.4 Consolidated Available Data 10 2.5 General Discussion 19 2.6 Conclusions and Recommendations 21 2.7 References 22
3. DETERMINATIONS OF PERFLUOROOCTANE SULPHONATE (PFOS) AND RELATED COMPOUNDS IN WATER USING SOLID PHASE EXTRACTION AND LIQUID CHROMATOGRAPHY TANDEM MASS SPECTROMETRY (LCMS/MS) 25
3.1 Introduction 25 3.2 Performance Characteristics of the Method 25 3.3 Principle 26 3.4 Reagents 26 3.5 Standard solutions 28 3.6 Apparatus 29 3.7 Sampling and sample pretreatment 30 3.8 Analytical Procedure 31 3.9 Calculations 33 3.10 Quality Control 33 3.11 Safety 33 3.12 References 34
4. PERFORMANCE OF ANALYTICAL METHOD 35
4.1 Aquacheck Laboratory Comparison 35 4.2 General Laboratory Comparison 36
5. SELECTION OF SURVEY SITES 39
6. MONITORING 41
6.1 Sampling 41 6.2 Results 42 6.3 Discussion 50

7. RECENT ENGLISH AND WELSH MONITORING DATA SINCE LITERATURE REVIEW 53
7.1 Water Company Monitoring Data 53 7.2 Environment Agency 55
8. CONCLUSIONS 57
8.1 Method 57 8.2 Monitoring Survey 57 8.3 Other Recent Monitoring 58
9. RECOMMENDATIONS 59
REFERENCES 61
LIST OF TABLES Table 2.1 Drinking Water Inspectorate (DWI) Guidance levels for PFOS and
PFOA 8 Table 2.2 Elevated PFOS monitoring results obtained from Water Treatment
Works within the WU2 region 13 Table 4.1 Results of the Aquacheck Laboratory comparison 35 Table 4.2 Data from the Aquacheck Laboratory comparison specific for the
Severn Trent Laboratory 36 Table 4.3 Results of the General Laboratory Comparison 37 Table 6.1 PFOS and PFOA results of sampling in 2007 at the five control sites
for all four sampling sessions. 43 Table 6.2 PFOS results (in µg/l) of sampling in 2007 at the perceived higher-
risk sites for all four sampling sessions. 44 Table 6.3 PFOA results (in µg/l) of sampling in 2007 at the perceived higher-
risk sites for all four sampling sessions. 47 LIST OF FIGURES
Figure 2.1 Keywords used to search for publicly-available data 9 Figure 5.1 The geographical distribution of the 20 sampling sites chosen. 40 Figure 6.1 Graphs showing the variation of PFOS concentrations over the
sampling period at the four sites where it was detected. Where samples have been detected at <0.011 µg/l, concentrations have been taken as 0.011 µg/l as the worst case scenario. GW: groundwater, SW: surface water, GAC: Granular Activated Carbon. Note: 0.3 µg/l has been used as the maximum of the scale as it is the DWI Tier 1 trigger value for PFOS. 51
Figure 7.1 Data from a water company showing concentrations of perfluorinated compounds in a groundwater source before GAC and concentrations in final drinking water after GAC treatment 54
DEFRA
WRc Ref: DEFRA 7585/14612-0 February 2008
1
SUMMARY
I OBJECTIVES
The general objectives of this project were (a) to review and assess any monitoring data currently undertaken regarding PFOS, PFOA and related compounds in drinking water and its sources in England and Wales, (b) to develop an accurate and scientifically sound analytical method for the analysis of these compounds, (c) to devise and perform a one-year monitoring study of these compounds at 20 sites across England and Wales, and (d) to identify future research needs.
II REASONS
Perfluorinated chemicals such as PFOS (perfluorooctane sulphonate) and PFOA (perfluorooctanoic acid) have been used in a number of different types of products, including performance chemicals such as: photographic film; surfactant in fire fighting foams; surfactant for alkaline cleaners; emulsifiers in floor polish; mist suppressant for metal plating baths; surfactant for etching acids for circuit boards; pesticides; active ingredient for ant bait traps; and dirt repellent treatments for textiles (e.g. carpets, home furnishing and leather) and paper (e.g. food containers and masking papers). PFOS has been shown to be toxic, persistent and bioaccumulative in the environment. Although already a focus for restriction within the European Union, its profile as a potential micropollutant in water was raised following the Buncefield Oil Depot fire in December 2005 when fire-fighting foam containing PFOS was used.
III CONCLUSIONS
• The review of monitoring data in the UK indicated that no monitoring data were available for PFOA and PFOSA (perfluorooctanesulphonic acid), and only minimal information was available for PFOS, which indicates that it is not generally considered a likely contaminant of UK raw water sources, unless a specific incident has occurred. Little information was available on the treatment options for PFOS removal from raw drinking water sources, and anomalies in the various analytical methods used have been noted.
• The survey of levels of PFOS and PFOA indicated that PFOS does not appear to be a widespread background contaminant of raw and treated drinking water in England. When detected, PFOS concentrations were below the current DWI drinking water guidance levels for England and Wales. Where PFOS was detected at very low concentrations, the water source was considered at higher risk due to a specific incident, or the presence of a local source of contamination (e.g. an airfield).
• Conclusions regarding PFOA are not so clear. However, it does not appear to be a background contaminant of raw and treated drinking water in England.
• Where PFOS and PFOA were detected, source water originated primarily from unconfined aquifers as might be expected if resulting from point source contamination events.
• From the limited data, no apparent trends in PFOS or PFOA concentrations in drinking water exist in relation to the type of treatment, the type of perceived risk in the area, the method of chlorination, or the season.
DEFRA
WRc Ref: DEFRA 7585/14612-0 February 2008
2
• Where PFOS and PFOA were detected, the water treatment processes involved did not show any obvious signs of being able to remove PFOS or PFOA. However, it is acknowledged that the Granular Activated Carbon (GAC) present at two of the affected sites is relatively old, and separate studies have suggested that new (or recently regenerated GAC) may be effective in the removal of perfluorochemicals.
• There is no correlation between the presence of PFOS and PFOA in raw or treated drinking water.
IV RECOMMENDATIONS
• To further review the monitoring of PFOS, PFOA and PFOSA being undertaken by the Water Companies and other National Bodies.
• To maintain transparent communication and sharing of information between all interested parties to further the knowledge base on perfluorochemicals.
• To further investigate the removal of PFOS and other perfluorinated compounds during water treatment processes.
• To monitor the use, toxicology and occurrence of other perfluorinated compounds, which may become compounds of concern in the future.

DEFRA
WRc Ref: DEFRA 7585/14612-0 February 2008
3
1. INTRODUCTION
1.1 Objectives
The general objectives of this project were (a) to review and assess any monitoring data currently available regarding PFOS, PFOA and related compounds in drinking water and its sources in England and Wales, (b) to develop an accurate and scientifically sound analytical method for the analysis of these compounds in raw and treated waters, (c) to devise and perform a one-year monitoring study of these compounds at 20 sites across England and Wales, and (d) to identify future research needs. The project was carried out in three phases; firstly the review and assessment of the literature, secondly, to develop a robust method, and thirdly, a survey of PFOS, PFOA and related compounds in drinking water and source water.
Since reliable analytical methods could only be developed for PFOS and PFOA, only these determinands were monitored in this study. A lack of appropriate standards for other perfluorinated compounds meant that a complete validation for additional compounds was not possible within the confines of this project.
1.2 Background
Perfluorinated chemicals such as PFOS (perfluorooctane sulphonate) and PFOA (perfluorooctanoic acid) have been used in a number of different types of products, including performance chemicals such as: photographic film; surfactant in fire fighting foams; surfactant for alkaline cleaners; emulsifiers in floor polish; mist suppressant for metal plating baths; surfactant for etching acids for circuit boards; pesticides; active ingredient for ant bait traps; and dirt repellent treatments for textiles (e.g. carpets, home furnishing and leather) and paper (e.g. food containers and masking papers). PFOS has been shown to be toxic, persistent and bioaccumulative in the environment. Although already a focus for restriction within the European Union, its profile as a potential micropollutant in water was raised following the Buncefield Oil Depot fire in December 2005 when fire-fighting foam containing PFOS was used.
From the literature review, it is clear that only limited monitoring for PFOS and PFOA has been performed in England and Wales and there were doubts over the analytical procedures used. Therefore, the need for a geographically-spaced initial scoping study to assess both raw and final drinking water using an accurate and robust analytical method was required. This report includes the afore-mentioned literature review, the approved method that was developed, and then details the monitoring study undertaken. The report concludes with a brief discussion of further research needs.

DEFRA
WRc Ref: DEFRA 7585/14612-0 February 2008
4
DEFRA
WRc Ref: DEFRA 7585/14612-0 February 2008
5
2. REVIEW OF CURRENTLY AVAILABLE MONITORING DATA FOR PFOS AND PFOA IN THE UK
An initial review was produced by Clare Atkinson, Tom Hall, Rakesh Kanda (STL) and Paul Rumsby in July 2007, prior to the commencement of sampling. Subsequent monitoring of raw and final drinking water in England and Wales is summarised in Section 7. The findings of this review have been included in the broader conclusion of the overall work.
2.1 Summary
I Benefits
An accurate understanding of our knowledge of current concentrations of PFOS, PFOA and related compounds in the UK will be achieved from a comprehensive review of the monitoring of PFOS in the UK. This will lead to more targeted future sampling of raw and drinking waters.
II Objectives
To produce a thorough review of current existing monitoring data of PFOS, PFOA and related compounds in the UK and to assess the analytical methods used to obtain the results.
III Reasons
Perfluorinated chemicals such as PFOS (perfluorooctane sulphonate) and PFOA (perfluorooctanoic acid) have been used in a number of different types of products, including performance chemicals such as: photographic film; surfactant in fire fighting foams; surfactant for alkaline cleaners; emulsifiers in floor polish; mist suppressant for metal plating baths; surfactant for etching acids for circuit boards; pesticides; active ingredient for ant bait traps; and dirt repellent treatments for textiles (e.g. carpets, home furnishing and leather) and paper (e.g. food containers and masking papers). PFOS has been shown to be toxic, persistent and bioaccumulative in the environment. Although already a focus for restriction within the European Union, its profile as a potential micropollutant in water was raised following the Buncefield Oil Depot fire when fire-fighting foam containing PFOS was used.
IV Conclusions
• No consistent data were available on PFOA, PFOSA or other related compounds in drinking water and so the review concentrates on data for PFOS.
• From the small dataset of monitoring of water sources from non-contaminated sites, there is no evidence of background levels of PFOS in UK raw water sources. However, it should be noted that this conclusion has been made on very limited data, rather than a comprehensive wide-ranging monitoring programme.
• There has been no systematic monitoring of UK industrial sites or sites of historical commercial activity, which may have included the use of PFOS; for example, PFOS or fire-fighting foam production, chromium plating, carpet manufacture/handling including areas where incidents (e.g. fires) may have occurred.
DEFRA
WRc Ref: DEFRA 7585/14612-0 February 2008
6
• Where incidents have occurred (Buncefield and Jersey) there has been contamination of environmental waters with PFOS. Information from Jersey indicates that this may reach drinking water if boreholes used for drinking water supplies are contaminated. In the case of Jersey this contamination has continued at elevated levels for at least 7 years, confirming the environmental persistence of PFOS.
• There is little information at present on the effect that drinking water treatment regimes may have on the passage of PFOS into drinking water.
• Several studies have revealed evidence of anomalies in the levels of PFOS detected. Although a number of different methods have been used for analysis and there is a lack of validation (usually owing to the need for analysis at short notice), there are no clear reasons for such anomalies.
V Recommendations
• The need for more intensive monitoring to include sites where there is evidence for the historic use of PFOS and PFOA and where further possible incidents have taken place.
• The need for a co-ordinated monitoring programme necessitates good communications between all parties involved.
• Monitoring of PFOS and PFOA in raw and drinking water where different water treatments are in use to investigate their effect on PFOS concentration.
• Development and validation of PFOS and PFOA sampling methodology as well as the analysis to reduce the risk of possible anomalous results in monitoring.
2.2 Introduction
Perfluorooctane sulphonate (PFOS), perfluorooctanoic acid (PFOA) and related compounds are members of the large family of perfluoroalkylated substances (PFAS). The term PFOS-related substance is used in this document to represent any substance containing the PFOS structure (C8F17SO2) with the potential to degrade to PFOS in the environment. PFOS has been identified as being persistent, bioaccumulative and toxic. In 2000, the 3M Group, the manufacturers of PFOS and PFOA, agreed to cease production of these compounds. In a review for the Environment Agency in 2005 by WRc’s National Centre for Environmental Toxicology (NCET), groundwaters were identified globally that contained PFOS.
In October 2005, the Department for Environment, Food and Rural Affairs (Defra) announced its intention to move forward with national action to restrict the use and marketing of PFOS and substances that degrade to it. The European Union have subsequently published plans to restrict the marketing and use of PFOS (see below). The UK Committee on Toxicity of Chemicals in Food, Consumer Products and the Environment (COT) in 2005, after consideration of the mammalian toxicity of ingested PFOS, decided on a No Observed Adverse Effect Level (NOAEL) of 0.1 mg/kg body weight/day to derive a provisional Tolerable Daily Intake (TDI) value of 1 µg/kg body weight/day. This in turn has led to consideration of what level of PFOS in drinking water is unlikely to be harmful to human health.
On receipt of an initial toxicological assessment of PFOS by the Health Protection Agency (HPA) early in 2006, the value of 3 µg/l (microgrammes per litre) was provided by the Drinking
DEFRA
WRc Ref: DEFRA 7585/14612-0 February 2008
7
Water Inspectorate to water companies as reflecting the best available evidence on which a water company could base its judgement of wholesomeness.
In early 2007 the HPA provided further advice on both PFOS and PFOA. This revised advice included consideration of the Committee on Toxicity of Chemicals in Food, Consumer Products and the Environment (COT) statement on provisional Total Daily Intake (TDI) for PFOS and PFOA, and the Food Standards Agency’s work on UK dietary intakes of fluorinated chemicals. Due to the complexity of the issue and uncertainties involved, the Inspectorate also sought further advice from an independent toxicological consultant.
Following consideration of the updated advice, the Inspectorate has issued further guidance to all water undertakers in England and Wales in line with normal procedures via information letter 05/2007.
A summary of the guidance levels is given in Table 2.1 below.
The European Union plan to introduce an imminent, although not total, ban on PFOS (EU, 2006). Uses at concentrations >0.005%, in semi-finished products at levels >0.1% and in textiles and coated materials at 1 µg/m2 will be banned. The exemptions are reported to include its use in anti-reflective coatings for photolithography and hydraulic fluids, however, safer alternatives are to be introduced as and when they become available. Member States are required to implement the ban from mid-2008. However, any PFOS containing fire-fighting foams in existence at this time will still be permitted for use until the end of June 2011.
Following the explosion and fire at the Buncefield oil depot in December 2005, there was large-scale use of fire-fighting foams and it was found that some of these foams contained PFOS, although the exact extent of the use of PFOS is unclear. This use has further highlighted the potential hazard of PFOS compounds to drinking water sources. There is also a concern that the replacement of PFOS compounds, with those based on PFOA or perfluorinated compounds that may break down to PFOA, may also increase the potential exposure to PFOA.
At the present time, neither PFOS nor PFOA are regulated by means of a standard, nor are there specific parameters for the purpose of routine monitoring of drinking water under the Water Supply (Water Quality) Regulations 2000 (2001 in Wales). However, the presence (if any) of PFOS, PFOA and related substances in drinking water is regulated in England and Wales through the catch-all requirement for drinking water to be wholesome, meaning that it may not contain any substance at a level which would constitute a potential danger to human health.
As such, water companies are required to monitor for the presence of such compounds where there is considered to be a risk of them impacting on treated water quality. Thus the extent of data available on PFOS, PFOA and associated compounds in drinking water and its sources is limited to specific incidents where these compounds have been detected in raw waters and further investigations have been carried out to ensure no impact on treated drinking water. This research is intended to establish the extent and quality of the existing data and to identify the prevalence of these compounds in drinking water and sources such that the need for more extensive monitoring and/or guidance levels for the protection of drinking can be determined.

DEFRA
WRc Ref: DEFRA 7585/14612-0 February 2008
8
Table 2.1 Drinking Water Inspectorate (DWI) Guidance levels for PFOS and PFOA
Item Regulatory requirement Guidance value(concentration)
Minimum action to be taken
Perfluorooctane sulphonate (PFOS)
Tier 1 Regulation 10
(Sampling: further provisions)
> 0.3 µg/l • consult with local health professionals;
• monitor levels in drinking water.
Tier 2 Regulation 4(2)
(Wholesomeness)
> 1.0 µg/l As tier 1 plus:
• put in place measures to reduce concentrations to below 1.0µg/l as soon as is practicable.
Tier 3* Water Undertakers Information Direction 2004
(Notification of events)
> 9.0 µg/l As tier 2 plus:
• ensure consultation with local health professionals takes place as soon as possible;
• take action to reduce exposure from drinking water within 7 days.
*Note - notification to the Inspectorate under the Information Direction may also be triggered at lower levels due to Tier 1 or Tier 2 activities
Perfluorooctanoic acid (PFOA)
Tier 1 Regulation 10
(Sampling: further provisions)
> 0.3 µg/l • consult with local health professionals;
• monitor levels in drinking water.
Tier 2 Regulation 4(2)
(Wholesomeness)
> 10.0 µg/l As tier 1 plus:
• put in place measures to reduce concentrations to below 10.0µg/l as soon as is practicable.
Tier 3* Water Undertakers Information Direction 2004
(Notification of events)
> 90.0 µg/l As tier 2 plus:
• ensure consultation with local health professionals takes place as soon as possible;
• take action to reduce exposure from drinking water within 7 days.
*Note - notification to the Inspectorate under the Information Direction may also be triggered at lower levels due to Tier 1 or Tier 2 activities

DEFRA
WRc Ref: DEFRA 7585/14612-0 February 2008
9
2.3 Data Collection Approach
The possible presence of PFOS and related compounds in drinking water and its sources is due to the large historical use of PFOS in many different industries, ranging from chromium plating to carpet manufacture. The Buncefield oil depot fire in 2005 at which PFOS containing fire-fighting foams were used, heightened the interest in these compounds. Therefore, initial searches were performed using the standard publicly-available search engines to gain an overview of current data. However, the search was intensified and became more detailed by contacting all UK water companies to establish whether they had monitoring data available. In addition, owing to the potential threat of PFOS to the environment, it was known that the Environment Agency had undertaken some monitoring; therefore they were also contacted. To gain an understanding of the analysis methods used, the laboratories that conducted the analysis were also contacted requesting details of their methods 1.
2.3.1 Publicly-Available Sources
Searches were performed in the following websites: PubMed; Science Direct; Environment Agency; and Google, using the keywords listed in Figure 2.1.
PFOS UK Concentration Fire-fighting
PFOA Data Monitoring data Borehole
PFOSA Water Groundwater Airfield
Figure 2.1 Keywords used to search for publicly-available data
2.3.2 Water Companies
Contact was made with UK and Channel Islands water companies to request monitoring data for PFOS and related compounds, as well as details of the analytical method employed. Monitoring data was available from 4 out of 29 organisations approached.
2.3.3 Environment Agency
Data from the ongoing monitoring related to the Surface Water Abstraction Directive (SWAD) have been obtained from the Environment Agency (EA) together with details of the methodology used both in this programme and in their monitoring at Buncefield.
1 Laboratory and site names are held in confidence.

DEFRA
WRc Ref: DEFRA 7585/14612-0 February 2008
10
2.3.4 Drinking Water Inspectorate
Monitoring data on the Buncefield area were also available from a one-off sampling activity undertaken by the Drinking Water Inspectorate in response to the fire at the Buncefield oil storage depot. This was obtained together with details of the analytical method.
2.4 Consolidated Available Data
Six sets of PFOS data and details of analytical methods were identified from 4 water undertakers, the Environment Agency and the Drinking Water Inspectorate). No consistent data were available on PFOA, PFOSA or other related compounds in drinking water and so the review concentrates on data for PFOS.
2.4.1 Publicly Available Data
From the publicly available data search, no drinking water concentrations (raw or finished waters from drinking water treatment plants) of PFOS, PFOA or other related compounds were identified from the UK.
Limited data were obtained from the brief surface water (rivers, canals) and groundwater (from on-site boreholes) monitoring made available to the public on the Environment Agency’s (EA) website. It is important to highlight that this monitoring occurred in surface and ground waters only, not drinking water, nor sources used for drinking water. These data were a direct result of the Buncefield explosion that occurred on 11/12/05. In February of 2006, the website stated that the EA were testing at four locations in the River Ver (EA, 2006a) and in May over 400 river water, groundwater and soil samples had been taken (EA, 2006b). Also in May, six of the nine groundwater samples taken the week beginning the 8th May were below the limit of detection (LOD) of 0.10 µg PFOS/l, one sample was 0.13 µg/l, one sample was 0.20 µg/l, one of 4.58 µg/l and one of 5.90 µg/l, which when duplicated decreased to 0.20 µg/l (EA, 2006c), and results from the weeks beginning 15th and 22nd May did not exceed 3 µg/l (EA, 2006d). Also in May, a new River Ver monitoring site was added to their fortnightly surface water sampling suite and sampling also occurred in the River Gade, Bulbourne and the Grand Union Canal (samples all below 3 µg/l) (EA, 2006d). In June, surface water levels, although below 3 µg/l, were occasionally above 1 µg/l and the monitoring was extended to the west of the Buncefield site with groundwater weekly monitoring of the site continuing (EA, 2006e). At the end of June, PFOS continued to be detected in groundwater from the site; however, their analysis from the River Colne did not detect any PFOS that originated from the firewater leak that occurred on 23/06/06 (EA, 2006f). In August, it was reported that groundwater samples from within the oil depot site itself were still above 3 µg/l (EA, 2006g).
2.4.2 Water Undertaker 1 (WU1)
Data Available
Fifteen sites in the supply area of Water Undertaker 1 have been monitored for PFOS. These are raw water sites for water treatment works and include rivers, reservoirs and bankside storage tanks. PFOS was not detected at any site.
DEFRA
WRc Ref: DEFRA 7585/14612-0 February 2008
11
In December, 2006, raw and final water samples were taken from a water treatment works (WTWs) and final water samples from the reservoir (which is a supply point for the downstream distribution system) and were monitored for PFOS and related compounds. These sites were located near an air force base. The company had been informed of activities in the previous October, which may have impacted on groundwater in the area. The level of PFOS measured in raw water on 01/12/06 was 4 µg/l decreasing to 2.4 µg/l by 12/12/06. The final drinking water levels measured from 06-12/12/06 at the WTWs had one value at 0.12 µg/l, with the remainder <0.1 µg/l. All measurements at the same reservoir (representing drinking water as supplied to consumers) were <0.1 µg/l.
A number of other PFOS-related compounds were detected in raw water, namely: perfluorobutane sulphonate (PFBS); perfluorohexane sulphonate (PFHS); perfluorohexanoic acid (PFCA6); perfluorooctanoic acid (PFCA8); and 6.2 fluorotelomer sulphonate (6.2FTS). The 6-carbon compounds, PFHS and PFCA6, were detected in the final water, but were reduced by 85 and 55%, respectively, compared with the raw water. The other compounds were not detected. Advice was given at this time by the National Centre for Environmental Toxicology (NCET) at WRc on the significance to human health of these levels of fluorinated compounds. Although little information was available on compounds other than PFOS and PFOA, toxicity of C8 compounds could conservatively be regarded as similar to PFOS, while C4 and C6 compounds appear to be less potent. Therefore, taking the value for PFOS of 3 µg/l as a conservative guideline, the much lower levels of the other fluorinated compounds were unlikely to be of concern to human health.
Analysis Method
The analysis used to obtain the results provided by WU1 was performed by Laboratory A. The method was compiled in a relatively short time period, owing to concern following previous high profile incidents, e.g. Buncefield, and emphasis was given to PFOS and PFOA, not PFOSA. The method consisted of direct aqueous injection of the samples with liquid chromatography-liquid chromatography (LC-LC) separation and electrospray ionisation – time of flight mass spectrometry, which used accurate mass as the criteria of acceptance (mass accuracy was to four decimal places). Due to the urgent requirement for the analysis, no validation of the method was conducted, but Analytical Quality Controls (AQCs) were run with every batch of samples, which included PFOS and PFOA. Despite the lack of validation, the working range is reported to be 0-50 µg/l, precision approximately 10% and from repeat injections of 25 µg/l samples, a Limit of Detection (LOD) of <0.1 µg/l could be achieved. The origins of the samples and sampling conditions are unknown. Spiked recovery was 85-100% from limited borehole water work, but this is considered to vary in different matrices. Mass-labelled standards were not used.
Conclusion
The first tranche of sampling conducted at various water treatment works in WU1’s supply area indicates that PFOS is not present as a background contaminant; levels were all below the limit of detection of 0.1 µg/l. However, sampling at a further water treatment plant near an air force base, detected levels of PFOS in raw water of 4 µg/l decreasing to 2.4 µg/l after 12 days. PFOS was only detectable once (0.12 µg/l) in the final water of the WTWs suggesting that the treatment (granular activated carbon, GAC) had removed the PFOS from the raw water, and was not detected at any time in water supplied to consumers. Monitoring is continuing to gain further information.

DEFRA
WRc Ref: DEFRA 7585/14612-0 February 2008
12
Although some AQC data are available and the method uses single stage mass spectroscopy (MS), MSMS was not used, which is a limiting concept, despite the high resolution that was achieved. The method had also not been validated at the time. The purpose of the analysis at the time was to inform the company’s response to an operational incident. Due to limited data, it is prudent to make a full technical assessment of this method and its potential applicability to wider surveys of drinking water. Although the data produced from this method may have proved appropriate for response to an operational incident (where timeliness of analytical results is an issue), a more robust analytical procedure would be more appropriate for long term surveys of prevalence. Thus the interpolation of data from this method in wider prevalence surveys should be treated within this context.
2.4.3 Water Undertaker 2 (WU2)
Data Available
Since the fire at the Buncefield Oil Depot in December, 2005, WU2 has conducted regular sampling from raw water intakes on the River Thames, with two sites being the first two downstream abstraction points from the confluence of the River Colne with the River Thames and a further intake chosen as an upstream control point. In addition to the raw water monitoring, a small number of treated water samples were also collected for reassurance purposes.
Prior to April 2006, Laboratory B analysed samples for a range of surfactants including PFOS, perfluorobutyl sulphonate (PFBS), perfluoropentyl sulphonate (PFPS), perfluorohexyl sulphonate (PFHS), perfluoroheptyl sulphonate (PFHpS), perfluorohexanoic acid (PFHxA), perfluoroundecanoic acid, 6:2 FtS 1-hydroxyethane-2-perfluorohexane and fluoroalkylthioamido sulphonate. All samples returned results of less than the LOD of 1 µg/l. After April 2006, analysis was carried out by Laboratory C and was restricted to a single parameter (PFOS) (as this was the parameter considered of most concern). The change in laboratories reduced the LOD for PFOS from 1 µg/l to 0.1 µg/l.
Following the introduction of the lower analytical LOD, PFOS was detected at very low levels from all of the intakes monitored (all <1 µg/l). As a result, the monitoring programme was extended during June 2006 to include weekly sampling of treated water at downstream water treatment works. Weekly sampling was considered appropriate as all treatment works are fed from bankside storage reservoirs with retention times of >30 days. Consequently a significant buffering capacity would be present to reduce the impact of transient peak concentrations.
During June 2006, there was an accidental release of stored contaminated surface water (held from the clean-up of the Buncefield site) from a sewage treatment works (STW) into the River Colne. Although it was calculated that concentrations of PFOS were unlikely to exceed 0.1 µg/l at the nearest water treatment works (WTW) intake, daily samples were taken from this intake and from all the relevant WTWs downstream. Samples were also taken from other raw water reservoirs fed from the relevant intake. Daily sampling was conducted for a period of 6 or 7 days, before reverting to weekly sampling.
In the period between January and April 2006, results showed no detectable levels of surfactants including PFOS in the River Thames at the downstream abstraction points or from sampling at WTWs (LOD <1 µg/l).

DEFRA
WRc Ref: DEFRA 7585/14612-0 February 2008
13
Between April and June 2006, the majority of further raw water samples returned results below the LOD, however, PFOS was intermittently detected at levels below 1 µg/l. It should be noted that the highest concentration of PFOS detected before June 2006 was from the abstraction point above the confluence with the River Colne and should therefore not have been influenced by the release from the STW. At the time, the positive result was attributed to background levels of PFOS in the aquatic environment arising from a variety of uses and discharges in the upstream catchment.
Frequent sampling of treated water commenced during June 2006 and an elevated PFOS concentration recorded in a single sample from a downstream WTW (3.56 µg/l, 01/06/06). However, assessment of this result, in conjunction with further raw and treated water sampling data, suggests this is an isolated anomalous result, possibly related to analytical problems. Repeat sampling did not detect PFOS, further supporting a possible problem with the original analysis.
Analytical results received from the River Thames at the first abstraction point would appear to confirm the time of travel modelling, however, concentrations of PFOS at this point were higher than expected for two days (0.9 µg/l on 21/06/06 and 0.8 µg/l on 22/06/06). All subsequent results were below the limit of detection (<0.1 µg/l). It should be noted, however, that elevated PFOS concentrations were not observed at the second monitored intake (although monitoring was only conducted on a weekly basis) nor within the raw water reservoir, which feeds raw water to the water treatment works.
During the period of the accidental discharge, PFOS was detected at elevated levels on three occasions from treatment works downstream of the Colne system. However repeated sampling and analysis failed to repeat these elevated results and investigations at the time concluded that they were likely to have been the result of analytical problems and not representative of the drinking water supplied to consumers. Both of these water treatment works receive water from reservoir storage with a nominal residence time in excess of 30 days. Examining data from the STW, from the first intake site, it’s receiving reservoir and also taking into account dilution and residence time within the reservoir indicates such results are considered to be highly anomalous with no other supporting evidence. Indeed the concentrations far exceed those measured in the raw water supplying the water treatment works (i.e. prior to any treatment) It is also interesting to note that the two highest results obtained (28.6 µg/l and 8.4 µg/l) were from samples taken on the same day and within the same analytical batch, also indicating possible analytical error(s).
Table 2.2 Elevated PFOS monitoring results obtained from Water Treatment Works within the WU2 region
Sample 1 Sample 2 Site (WTWs) Date PFOS (µg/l) Date PFOS (µg/l)
1 22/6/06 0.12 13/7/2006 0.13 2 27/6/06 8.4* 10/7/06 0.12 3 27/6/06 28.6* 13/7/2006 2.53
Shading indicates the higher values.
*Investigation by WU2 concluded that the result is indicative of analytical error(s) and not representative of water supplied to consumers.

DEFRA
WRc Ref: DEFRA 7585/14612-0 February 2008
14
Analysis Method
Analysis of samples taken by WU2 were initially analysed by Laboratory B and then by Laboratory C after April 2006. Only the former laboratory method is detailed in this section; for details of the second method see Section 3.6.2. Laboratory B used two methods (both UKAS accredited): one based on a solid phase extraction procedure based on the method of Laboratory C (see Section 3.6.2); and the other was developed in-house. The first method from Laboratory B consists of PFOS extraction from aqueous samples using C18 SPE cartridges. The analyte is eluted from the cartridge with methanol and made up to a known volume in methanol. The extract is then analysed by liquid chromatography mass spectroscopy (LCMS) against appropriate calibration standards. The method provides % relative standard deviation (%RSD) of 17% in permeate spiked at 1 µg/l. An LOD based on the standard deviation of 12 blanks was calculated to be 0.06 µg/l.
Samples analysed using the in-house method were analysed by diluting the aqueous samples as necessary and analysing PFOS directly by LCMS against appropriate calibration standards. The performance data suggests that an LOD of 0.1 µg/l could be achieved.
Laboratory B follows Quality Assurance/Control procedures for the analysis of samples. An AQC standard at 1 µg/l (prepared from an independent source of PFOS) is analysed with each batch to confirm the viability of the calibration standards. AQC results are plotted on a Schewart chart with warning and action limits based on the AQC data obtained whilst the performance data were being generated. A blank sample and two extracted spiked solutions (at concentrations of 1 µg/l and 10 µg/l PFOS, respectively) are analysed with each batch.
Conclusion
In general PFOS was not detected in drinking water at the LOD achieved by the two laboratories (1 or 0.1 µg/l). However, low levels (just above the LOD) were measured on three occasions and on three further occasions significant levels were reported (8.4, 28.6 and 2.53 µg/l). These sample results were far in excess of those found in the raw water (0.9 µg/l) supplying the WTW. The two highest results obtained (28.6 and 8.4 µg/l) were from samples taken on the same day. It seems possible that these results were due to some analytical error, although the nature of this is unclear from the methodology. Investigations by WU2 also indicated that these results were likely to have been the result of analytical problems and not representative of the water supplied to consumers at the time.
The other notable results came following the accidental release of low-level contaminated surface water from the STW some way upstream. At the calculated time of arrival deduced from time of travel modelling, the levels of PFOS were 0.8 and 0.9 µg/l in raw (river) water for two days. This level was above that expected from the dilution calculations. No elevated PFOS concentrations were detected at other abstraction points.
The analytical method from Laboratory B has been validated and UKAS accredited. However, it is not known as to whether any labelled internal standards were used and only single stage MS was used. Additionally, validation has only been performed in two matrices and care should be taken if this method is used to analyse samples that have not been validated, e.g. chlorinated waters.
For the conclusion of the method from Laboratory C, please refer to Section 3.6.3.

DEFRA
WRc Ref: DEFRA 7585/14612-0 February 2008
15
2.4.4 Water Undertaker 3 (WU3)
Data Available
Data was provided by WU3 of monitoring in their area following the Buncefield incident including monitoring conducted by the Environment Agency. Much of these data are summarised in Section 3.1.
Analysis Method
The data were obtained using the method from Laboratory C, therefore, see Section 3.6.2 for more information.
Conclusion
It is known that the use of PFOS-containing fire-fighting foam on the fire at Buncefield Oil Depot led to contamination of the local aquifer and surface water. Boreholes (except one deep borehole) around the Buncefield site remained contaminated after sampling in June, 2006. In general, the surface water sources (the local rivers) remained uncontaminated, with levels below 1 µg/l, with a few values above this, which remain unexplained. However, there were a number of groundwater sites around Buncefield and St Albans, which have shown raised levels of PFOS (up to 5.91 µg/l) in the groundwater starting in April and continuing to June, 2006, which also remain unexplained. PFOS was not detected in samples of drinking water.
Analysis was undertaken by Laboratory C, please see Section 3.6.3 for more information.
2.4.5 Jersey Water
Data Available
Data were provided by Jersey Water, in conjunction with Jersey Airport. Monitoring of water sources in Jersey has been extensive owing to severe contamination of the groundwaters of certain areas of the island. Since before 1991, a north-western area of Jersey airfield (the fire training ground) has been used by fire fighters as a training and exercise area. Whilst initially only using water as an extinguisher, in late 1991 the use of fire fighting foams was introduced and regularly employed. The extent of contamination was not identified until 1993, when foaming water emerging from an excavated drain north-west of the training ground was noted.
As a result, an Officer Group was formed in 1994 to keep abreast of the situations and ensure relevant bodies were adequately informed (HAC, 2004). This group initiated a quarterly monitoring regime, which was still in place when information was obtained in 2006. Ground-, surface and drinking water were intensively monitored from 1993 onward in the area around the airport, which lies in the western area of the island and in certain strategic areas such as Water Treatment Works (WTWs) and storage tanks in the east. The monitoring from 1993-1999 was conducted by the PFOS manufacturer, 3M and the results are not available. The extensive volume of data from 1999 onward has been divided into ground-, surface and drinking water data for the purpose of this review.

DEFRA
WRc Ref: DEFRA 7585/14612-0 February 2008
16
A 2004 report by the Harbours and Airport Committee of the States of Jersey concluded that the majority of the foam that had become dissolved into ground and rainwaters had emerged to the west into the St. Ouen’s aquifer and under the seawall onto the beach of St Ouen’s Bay (HAC, 2004).
Although data for a significant number of sites were provided, only results from the limited number of sites that have been continuously monitored over a number of years, have been analysed to assess trends in the levels of PFOS with time. However, full statistical analysis to study PFOS decay rates proved impossible for a number of reasons: the levels of PFOS between 1993 (the approximate time the use of PFOS ceased) and 1999 are unknown; and the wide variation in results suggests that local unknown factors (e.g. rainfall, continuing mobility in soil and water) might be playing a role. Any suggestions on the behaviour in different water types are just observational.
Drinking Water
It is understood that the drinking water sampled from properties was supplied from local boreholes rather than the mains water supply. Ten water supplies from domestic residences, cafes and golf courses have been sampled on or near La Grande Route des Meilles, the road running along St Ouen’s Bay just west of the airport. Where PFOS was detected during the first sampling in 1999, the site has continued to be monitored until the present time. These sites have continued to show significant PFOS concentrations with little evidence of a decrease with time. One property had consistently raised levels with a high of 9.5 µg/l and a low of 2.7 µg/l. Other properties have levels up to 4.9 µg/l. Most of the properties have levels below 1 µg/l.
The other area where major monitoring has taken place is along La Rue du Val de la Mare du Sud, which is just north-west of the airport, where 13 sites have been sampled for some time. Again one property gave consistently high results during monitoring from 1999 to the present time (2006). Although these levels have varied considerably, there is little evidence that they have decreased over time. PFOS in this property had a highest concentration of 98.0 µg/l and levels are mainly over 20 µg/l. When measured in 2006, the drinking water of this property still had a concentration of 31.0 µg/l. While two other properties had peak PFOS levels of 2.0 and 3.0 µg/l, most were below 1.0 µg/l. This suggests that the water source of this single property is from an individual groundwater source such as a borehole.
Other sites were monitored in areas very close to the airport. At sites immediately south and just north of the airport, no PFOS was detected nor was it detected at the desalination plant south-west of the airport. This suggests that the contamination spread west and north-west of the airport in a very confined area. PFOS was not detected in areas in the east of the island suggesting that there was no background PFOS other than that due to the contamination by fire-fighting foams.
It is understood that bottled water is supplied to those properties where the drinking water remains contaminated with PFOS, while others have been connected to the unaffected mains supply rather than being supplied by local boreholes.
Of the 8 sites analysed, only one showed evidence for a reduction in PFOS concentration, while one site showed signs of increasing PFOS concentration.

DEFRA
WRc Ref: DEFRA 7585/14612-0 February 2008
17
Surface Water
Over 40 sites have been monitored at some stage during the programme. The surface water contamination is in similar areas to those where drinking water contamination has been detected, i.e. near La Grande Route des Meilles and La Rue du Val de la Mare du Sud. A number of sites have more low level contamination below 1 µg/l, but with peaks of PFOS concentration up to 12 µg/l. However, two sites have high level PFOS contamination and have been monitored over a period of time. A ditch in the area had an initial PFOS concentration of 170 µg/l in 2000, although this had subsequently decreased to 20 µg/l by 2002 and a pond had an initial PFOS level in 1999 of 93 µg/l, which had declined to 7.7 µg/l by 2004.
Of the 9 sites with continual monitoring data analysed, four showed some evidence of reduction in PFOS levels with time.
Groundwater
Groundwater contamination is evident in a few borehole sites in similar areas to the drinking water contamination, i.e. near La Grande Route des Meilles and La Rue du Val de la Mare du Sud, where levels of 96 µg/l have been detected in a field borehole. Monitoring of this site from 1999-2006 has seen a large variation in the levels of PFOS, but no real decrease with time.
Of the 19 sites with sufficient monitoring data (mainly boreholes), eight showed some evidence of a reduction in PFOS levels over time, while one showed some increase in PFOS levels.
Analysis Method
The analysis used to produce the data provided by Jersey Water/Airport was performed by Laboratory D. Only brief information is available due to confidentiality reasons identified by the laboratory. Samples were prepared by freeze-drying the samples and analysing them using electrospray ionisation – LCMS. PFOS was analysed alongside, perfluorohexanesulphonate, perfluorobutanesulphonate and tridecylfluorooctylsulphonate. Semi-quantitative estimates of PFBS, PFPS, PFHS, PFHpS TDFOS, TDFOXAS and TDFOPAS were provided on the basis of electrospray mass spectroscopy (ESMS) response factors. No details of validation or quality assurance/control procedures were provided.
Conclusion
Foams containing PFOS were used in fire-fighting practices on the north-west corner of Jersey Airport for a number of years from 1991 onwards. It is unclear when this practice was stopped, but probably soon after detection of the contamination of local water sources in 1993. Monitoring carried out from 1999 onward showed a specific defined area of contamination spreading out west and north-west from the fire-fighting practice site leading to the appearance of PFOS in ground-, surface and drinking water (sourced from local boreholes) in that area. There is some evidence that in some contaminated surface and groundwater sites (approximately 40%), the concentration of PFOS has declined over a period of years. However, there is little evidence of this occurring in drinking water supplied from local boreholes. Contamination of specific groundwater and drinking water sites has continued at high levels for at least 7 years highlighting the persistence of PFOS in the environment.

DEFRA
WRc Ref: DEFRA 7585/14612-0 February 2008
18
Although the method uses single stage MS, MSMS was not used. Details of any validation of the method are not available and it is not known whether labelled internal standards were used. Analytical methodologies were generally improving over this time period. However, due to limited data, it is prudent to make a full technical assessment of this method and its potential applicability to wider surveys of drinking water. Although the data produced from this method may have proved appropriate for response to a localised incident, a more robust analytical procedure would be more appropriate for long term surveys of prevalence and thus the interpolation of data from this method in wider prevalence surveys should be treated within this context.
2.4.6 Environment Agency
Data Available
The data provided by the Environment Agency (EA) represents the PFOS data (up to 18/10/06) for sites sampled under the Surface Water Abstraction Directive (SWAD) sites being monitored as part of the investigation into background levels. At the time of preparing this review, it is planned that this investigation will run until March 2007. SWAD sites are river, reservoir or spring sampling points adjacent to those used by water companies for potable water abstraction. The results so far from 16 sites in the South and Midlands indicate that PFOS levels are all below 0.1 µg/l, the limit of detection.
Analysis Method
Laboratory C determines perfluorocarboxylates including PFOS using C18 SPE cartridges. Extracts are eluted from the solid phase columns using methanol. The organic extracts are analysed by High Performance Liquid Chromatography Mass Spectrometry (HPLC-MS). The following analytes were determined: PFC5; PFC6; PFC7; PFC8; PFC9; PFC10; PFC11; PFC12; PFC14; and PFOS. Samples are extracted using C18 phase Solid Phase Extraction columns.
As part of its QA/QC procedures, a blank, three standards and two AQCs are made up in the range 0-5 µg/l in Milli-Q water. The blank, standards, QCs and samples are made up in 100 ml of sample. The AQC values are set at the mid-point of the working range, 2.5 µg/l. The extracts, blanks, calibrants and QCs are analysed using a C18 HPLC column interfaced with a LC-MS set in Electrospray mode. This method has a range of 0-5.0 µg/l and limit of detection 0.1 µg/l per oligomer. No other method performance details were provided or information on how the limit of detection was calculated.
Conclusion
The results of the sampling performed by the EA as part of their SWAD monitoring indicate that PFOS is not a concern for background contamination of surface waters; no concentrations above the limit of detection (0.1 µg/l) were identified. However, this monitoring programme is at an early stage and does not constitute a representative sample of UK sites. For the EA sampling data relating to the Buncefield incident please refer to Section 3.4 (the WU3 data).

DEFRA
WRc Ref: DEFRA 7585/14612-0 February 2008
19
Although the method uses single stage MS, MSMS was not used. The method has also not been validated and it is not known whether labelled internal standards were used. Due to limited information, it is considered that the data produced from this method may not necessarily be appropriate for interpolation in a wider survey of prevalence.
2.4.7 Drinking Water Inspectorate (DWI)
Data Available
The data provided by DWI are from a limited survey carried out by DWI following considerable local concern over drinking water quality after the Buncefield oil depot fire, and are raw and final water samples taken from water treatment plants in the area around Buncefield. The results indicated that there was no contamination of this water supply.
Analysis Method
Some of the analysis done by DWI was performed by Laboratory D, so please refer to Section 3.5.2 for more details of the method used. The remainder of the analysis was carried out by Laboratory E. Only brief details are available: samples were concentrated using solid phase extraction and analysed by liquid chromatography with mass spectrometric detection (LC-MSMS). Details of any method validation are unknown, although development time was short as it was necessary to provide an appropriate incident response method following the Buncefield incident.
Conclusion
These limited results of raw and final waters from water treatment plants in the Buncefield area indicate no PFOS contamination of the drinking water.
Although the method uses the more recent approach of MSMS, details of any validation of the method are not available and it is not known whether labelled internal standards were used. Due to limited information, it is considered that data produced using this method may not necessarily be appropriate for interpolation in a wider survey of prevalence.
2.5 General Discussion
2.5.1 Available Data
From the small dataset supplied by WU1 and the Environment Agency of monitoring of water sources from non-contaminated sites, there is no evidence of background levels of PFOS in UK raw or drinking water at present. However, there has been no systematic monitoring as yet, of UK industrial sites in general or sites specifically of commercial activity, which may have been associated with the production of PFOS or PFOS-containing foams or other products in the past. Such past or current use might include, for example, chromium plating, non-stick coating manufacture and carpet manufacture or handling. It is clear from the monitoring in Jersey that PFOS contamination is persistent. It would also be important to include areas where incidents (e.g. fires) may have occurred in these industries in the past.

DEFRA
WRc Ref: DEFRA 7585/14612-0 February 2008
20
Where major incidents have occurred using fire-fighting foams containing PFOS (Buncefield and Jersey), this has led directly to the contamination of groundwater (in the case of Buncefield) and heavy contamination of water sources (in Jersey) with PFOS.
Information from Jersey indicates that PFOS may reach drinking water if private boreholes with little or no treatment are contaminated. This is clearly a risk both to the environment through the persistence and bioaccumulation characteristics of PFOS and to human health and the wildlife through its toxicity (although this is not clearly understood yet). This contamination may continue in ground- and drinking water sources at high levels for, at least, 7 years, confirming the persistence of PFOS. Although the data were insufficient for statistical analysis, there is evidence that there is some decline in PFOS levels over time in some surface and groundwater sites (approximately 40%), but little evidence for a decrease in PFOS levels in drinking water supplied from boreholes in the contaminated area.
There is little information at present on the effect that drinking water treatment regimes may have on the passage of PFOS into drinking water. However, sampling by WU1 at a water treatment plant near an airbase (described in Section 3.2) detected levels of PFOS in raw water of 4 µg/l decreasing to 2.4 µg/l after 12 days. PFOS was only detectable once at a low level (0.12 µg/l) in the final water suggesting that the treatment (including GAC and disinfection) had removed PFOS from the raw water. Monitoring is continuing at this site to gain further information.
In the summer of 2006, 12 perfluorinated surfactants were sampled for in various surface and drinking water samples in Germany (Skutlarek, 2006). Surface water samples included the rivers Rhine, Ruhr, Moehne and some of their tributaries, whilst drinking water samples were from public buildings in the Rhine-Ruhr area. The sum of the seven compounds most frequently detected in the Rhine river and its tributaries was <0.1 µg/l. The highest concentrations of these compounds detected were in the Ruhr River (tributary of the Rhine) at 0.094 µg/l, with PFOA being the major component. Samples from the rivers Ruhr and Moehne (a tributary of the Ruhr) showed high (0.446 and 4.385 µg/l, respectively) concentrations in their upper reaches. The maximum drinking water concentration was 0.598 µg/l, with PFOA being the most prevalent compound. Drinking water samples were comparable to those in surface water, thus the authors concluded that these compounds are not being significantly removed by water treatment. The source of the contamination in this particular case is believed to result from the spreading of contaminated fertiliser to the agricultural land in the area. The authors also stated that, although activated carbon filters may be thought by some to remove these contaminants, they are unlikely to be very effective due to the occurrence of breakthrough. Additionally it was stated that treatment plants that use carbon filters might act as point sources for carboxylic acids (such as PFOA), due to microbial degradation of other perfluorinated compounds. The WU1 data also suggested that individual perfluorinated compounds may differ in their removal by GAC, which may have affected the German removal where the predominant compound was PFOA and total levels of a number of perfluorinated compounds were measured. In the German incident, it is also possible that the GAC had become saturated due to the length of time the pollution was on-going. Therefore direct comparison of these results with the preliminary ones obtained by WU1 may not be appropriate.
Further monitoring and experimental studies are required to judge the extent that PFOS and its related compounds may be removed by various water treatments.
Several studies have revealed evidence of anomalies in the levels of PFOS detected. Although a number of different methods have been used for analysis and their lack of
DEFRA
WRc Ref: DEFRA 7585/14612-0 February 2008
21
validation (usually owing to the need for analysis at short notice), there are no clear reasons from the analysis for such anomalies. However, owing to the inherent chemical characteristics of PFOS, such as its surfactant properties, there may be significant problems in the collection of samples, which may need to be addressed in future standard protocols.
2.5.2 Analytical Methods
A number of analytical methods are used for the analysis of PFOS in UK laboratories, all using single stage LCMS or LC-TOF-MS.
With the exception of the Laboratory B methods there is limited information provided to make a technical assessment of the methods used or their applicability to drinking water. It is therefore difficult to compare the methods used by the different laboratories. For example, none of the methods state if any mass labelled internal standards were used and there is limited performance data provided. However, all laboratories (excluding Laboratory D) quote a limit of detection for PFOS in aqueous samples of between 0.06-0.1 µg/l.
2.6 Conclusions and Recommendations
2.6.1 Conclusions
• From the small dataset of monitoring of water sources from non-contaminated sites, there is no evidence of background levels of PFOS in UK raw water sources. However, this conclusion has been made on very limited monitoring data, rather than a comprehensive wide-ranging monitoring programme.
• There has been no systematic monitoring of UK industrial sites or sites of historical commercial activity, which may have included the use of PFOS; for example, PFOS or fire-fighting foam production, chromium plating, carpet manufacture/handling including areas where incidents (e.g. fires) may have occurred.
• Where incidents have occurred (Buncefield and Jersey), this has led to the contamination of environmental waters with PFOS. Information from Jersey indicates that PFOS may reach drinking water where private water supply boreholes are contaminated and no suitable treatment process is in place. This contamination may continue at high levels for, at least, 7 years, confirming the persistence of PFOS.
• There is little information at present on the effect that drinking water treatment processes may have on the passage of PFOS into drinking water, although preliminary UK data suggest that GAC may be effective.
• Several studies have revealed evidence of anomalies in the levels of PFOS detected. Although a number of different methods have been used for analysis and there is a lack of validation (usually owing to the need for analysis at short notice), there are no clear reasons for such anomalies.

DEFRA
WRc Ref: DEFRA 7585/14612-0 February 2008
22
2.6.2 Recommendations
• A need for more intensive monitoring to include sites where there is evidence for the historic use of PFOS and where further possible incidents have taken place as well as sites, which could be considered of low risk.
• Good communications with other interested parties to ensure that monitoring is conducted in a co-ordinated way to consider both the potential sites of environmental impact and downstream drinking water abstraction sites.
• Monitoring of PFOS in raw and drinking water where different water treatments are in use to investigate their effect on PFOS.
• Development and validation of PFOS sampling methodology as well as the analysis is required to reduce the risk of possible anomalous results in monitoring.
• Interlaboratory comparisons of the analytical methods to ensure consistency of monitoring results.
2.7 References
Environment Agency (2006a). UK Environment Agency Website. News: Buncefield update – 20 February 2006. Available at http://www.environment-agency.gov.uk/.
Environment Agency (2006b). UK Environment Agency Website. News: Buncefield update – 9 May 2006. Available at http://www.environment-agency.gov.uk/.
Environment Agency (2006c). UK Environment Agency Website. News: Water Monitoring Results Update – Buncefield. 12 May 2006. Available at http://www.environment-agency.gov.uk/.
Environment Agency (2006d). UK Environment Agency Website. News: Buncefield update – 24 May 2006. Available at http://www.environment-agency.gov.uk/.
Environment Agency (2006e). UK Environment Agency Website. News: Buncefield update – 7 June 2006. Available at http://www.environment-agency.gov.uk/.
Environment Agency (2006f). UK Environment Agency Website. News: Buncefield update – 30 June 2006. Available at http://www.environment-agency.gov.uk/.
Environment Agency (2006g). UK Environment Agency Website. News: Buncefield update – 23 August 2006. Available at http://www.environment-agency.gov.uk/.
European Union (2006) Official Journal of the European Union. Directive 2006/122/EC of the European Parliament and of the Council of 12 December, 2006
Google (2006). Google. Available at http://www.google.co.uk/
HAC (2004). Harbours and Airport Committee. States of Jersey. Jersey Airport: Fireground remediation – deed of settlement. Available from www.statesassembly.gov.je.

DEFRA
WRc Ref: DEFRA 7585/14612-0 February 2008
23
PubMed (2006). NCBI. National Library of Medicine and the National Institutes of Health. Available at http://www.ncbi.nlm.nih.gov/entrez/query.fcgi.
Science Direct (2006). Science Direct. Available at http://www.sciencedirect.com/.
Skutlarek, D., Exner, M. and Farber, H. (2006) Perfluorinated surfactants in surface and drinking waters. Environ. Sci. Pollut. Res. Int. 13, 299-307.

DEFRA
WRc Ref: DEFRA 7585/14612-0 February 2008
24

DEFRA
WRc Ref: DEFRA 7585/14612-0 February 2008
25
3. DETERMINATIONS OF PERFLUOROOCTANE SULPHONATE (PFOS) AND RELATED COMPOUNDS IN WATER USING SOLID PHASE EXTRACTION AND LIQUID CHROMATOGRAPHY TANDEM MASS SPECTROMETRY (LCMS/MS)
This Method Development Report was written by Rakesh Kanda (STL) in September 2007.
3.1 Introduction
This method describes a procedure for the determination of perfluorooctane sulphonate (PFOS) and perfluorooctanoic acid (PFOA) in raw and potable waters using solid phase extraction and liquid chromatography with tandem mass spectrometry (LCMS/MS) for detection and quantification.
3.2 Performance Characteristics of the Method
3.2.1 Substances Determined
Perfluorooctane sulphonate (PFOS) and perfluorooctanoic acid (PFOA).
3.2.2 Type of Sample
Raw and potable waters.
3.2.3 Basis of Method
The aqueous sample is spiked with labelled internal standards and extracted using solid phase extraction cartridges. The extract is analysed using LCMS/MS operated in negative ion electrospray (ESI) mode.
3.2.4 Range of Application
Typically 0-2000 ng/l for surface and potable waters.
3.2.5 Calibration Curve
PFOS and PFOA calibrations are linear over the range of application of the method (correlation coefficient r² >0.995) (Appendix E).

DEFRA
WRc Ref: DEFRA 7585/14612-0 February 2008
26
3.2.6 Interferences
Any substance, which is co-extracted under the conditions used, is not removed by the clean-up methods used, which exhibits similar chromatographic behaviour to any of the compounds being determined and which has the same mass spectral transitions will interfere.
3.2.7 Standard deviation
See Appendix C.
3.2.8 Limit of detection
PFOS 8.1 ng/l and PFOA 23.9 ng/l in potable waters.
PFOS 10.4 ng/l and PFOA 23.7 ng/l in raw waters.
3.2.9 Sensitivity
This is instrument dependent.
3.2.10 Bias
See Appendix C.
3.2.11 Sample Stability
PFOS and PFOA are stable in water stored in plastic high density polyethylene (HDPE) bottles for 7 days at 10°C.
See Appendix D.
3.3 Principle
Samples are collected in plastic HDPE bottles. The aqueous sample is spiked with labelled internal standards and extracted using Oasis HLB solid phase extraction cartridges. The extracts are analysed using LCMS/MS operated in negative ion electrospray mode. The method is based upon those developed by Yamashita et al. (2004) and Taniyasu et al. (2005).
3.4 Reagents
All reagents must be of sufficient purity that they do not give rise to significant interfering peaks in the analysis. Purity must be checked for each batch of materials by the running of procedural blanks with each batch of samples analysed. Solvents suitable for high performance liquid chromatography or pesticide analysis use and analytical grade materials are normally suitable unless otherwise stated and details of preparation are given where appropriate.

DEFRA
WRc Ref: DEFRA 7585/14612-0 February 2008
27
To avoid excessive evaporation of solvent, standard solutions should be stored in a refrigerator. However, prior to use, all solutions and solvents should be allowed to reach ambient room temperature before volumetric measurements are made.
3.4.1 Media
Deionised Water (conductivity <1 µS/cm at 20°C) or comparable pure grade reagent.
3.4.2 Acetonitrile
Rathburns HPLC grade S.
3.4.3 Methanol
Rathburns HPLC grade.
3.4.4 Internal standard stock solutions
The following pre-prepared stock solutions were obtained from the supplier:
13C4-PFOA 50 µg/ml in methanol (Wellington Laboratories Inc.).
13C4-PFOS 50 µg/ml in methanol (Wellington Laboratories Inc.).
3.4.5 Standard stock solutions
The following pre-prepared stock solutions were obtained from the supplier:
PFOA Chiron 100 µg/ml in acetonitrile (Chiron AS, Norway) - Part No. 2042.8.
PFOS 100 µg/ml Methanol 1.0 ml (Greyhound Chromatography & Applied Chemicals) - Part No. PFOS-S.
3.4.6 Nitrogen
N2, purity ≥99.996% volume fraction, for concentration by evaporation.
3.4.7 Sodium thiosulphate pentahydrate
Na2S2O3·5H2O.

DEFRA
WRc Ref: DEFRA 7585/14612-0 February 2008
28
3.5 Standard solutions
3.5.1 Internal Standard Spiking Solution, 1 µg/ml (13C4-PFO-Sp-Mx)
Add 200 µl of each stock solution (50 µg/ml) into a 10 ml volumetric flask containing methanol, and then make up to the mark.
This solution is stable for 1 year if stored in a freezer at -18°C.
3.5.2 PFO Standard Intermediate Solutions, 20 µg/ml
Dissolve 1.0 ml of each commercial stock solution (100 µg/ml) into 5 ml volumetric flasks containing methanol, then make up to the mark. The solution codes are given below.
Compound Code
PFOS PFOS-INT-Mx
PFOA PFOA-INT-Mx
These solutions are stable for one year when stored in a freezer.
3.5.3 PFO Spiking Solution, 1 µg/ml (PFO-WS-Mx)
Add 500 µl of each intermediate solution (20 µg/ml) to a 10 ml volumetric flask containing methanol, then make up to the mark.
This solution is stable for 1 year if stored in the freezer.
3.5.4 Calibration standards
Calibration standard solutions should be prepared. Each calibration solution should contain PFOS, PFOA and the labelled internal standards.
The following table shows the volumes of intermediate PFO standard intermediate solutions (5.2) and PFO standard mixed spiking solution (5.3) required to prepare 25 ml quantities of calibration standard solutions each containing 100 µl of the labelled internal standard stock solutions (50 µg/ml).

DEFRA
WRc Ref: DEFRA 7585/14612-0 February 2008
29
Description Volume of Mixed Spiking - Solution 5.3
(µl)
Volume of Intermediate - Solutions 5.2
(µl)
Volume of Internal standards - Section
4.4 (µl)
Cal-2000 10 n/a 0.0004 Cal-1000 25 n/a 0.001 Cal-500 50 n/a 0.002 Cal-100 250 n/a 0.01 Cal-50 500 n/a 0.0025 Cal-10 n/a 125 0.125 Cal-5 n/a 250 0.25 Cal-2 n/a 500 0.4 Cal-0 n/a n/a 0
Calibration standards should be prepared as follows:
Description* Concentration of Determinands(µg/ml)
Concentration of internal standards
(µg/ml) Cal-2000 0.4 0.2 Cal-1000 0.25 0.2 Cal-500 0.125 0.2 Cal-100 0.025 0.2 Cal-50 0.01 0.2 Cal-10 0.002 0.2 Cal-5 0.001 0.2 Cal-2 0.0004 0.2 Cal-0 0 0.2
* Calibration standard equivalent concentration (ng/l) of 100 ml sample concentrated to 500 µl.
3.6 Apparatus
3.6.1 Bottles
Wide neck flat bottomed, heavy duty high density polyethylene bottles, 125 ml, with screw caps.
3.6.2 Cartridges
Solid phase extraction cartridges –Waters Oasis HLB (3 ml 60 mg). Cat No.: WAT094226.

DEFRA
WRc Ref: DEFRA 7585/14612-0 February 2008
30
3.6.3 Solid Phase Extraction Apparatus
Vacuum manifold to which several solid phase extraction cartridges can be attached. The flow rate through each individual cartridge is controlled by adjusting the vacuum applied to each one.
3.6.4 General
Pasteur pipette.
Volumetric flasks (range between 5 ml and 10 ml).
Range of glass syringes (between 10 µl and 1 ml).
Vials, glass 1.5 ml appropriate to the autosampler.
3.6.5 Extract Concentration Equipment
Test Tubes (10 ml).
TurboVap concentrator with thermostatically controlled water bath.
Nitrogen blow-down apparatus.
3.6.6 LCMS/MS
LCMS equipment consisting of a binary or quaternary pump and a tandem mass spectrometer should be used. The following equipment has been used in the performance testing of this method:
Liquid Chromatograph (LC):
LC: Agilent 1100 system with autosampler, binary pump, degasser and column heater.
Column: Phenomenex Gemini 5u C18 110A 150 x 4.60 mm (P/N 00F-4235-E0)
Mass Spectrometer (MS): API5000 with an Electrospray ionisation (ESI) source.
3.7 Sampling and sample pretreatment
Samples should be collected in 250 ml HDPE plastic bottles. Fluoropolymeric plastics including Teflon, PTFE (polytetrafluoroethene) and rubber materials should be avoided during sampling, sample storage or extraction.
Samples are collected in the 250 ml container without adding any preservatives except for chlorinated samples, which should be dechlorinated by adding approximately 4 ml/l sodium thiosulphate (3% solution). Samples should be extracted as soon as possible after sampling. If

DEFRA
WRc Ref: DEFRA 7585/14612-0 February 2008
31
storage is unavoidable, samples should be kept in a refrigerator at below 10°C for up to 7 days. Once extraction has taken place, the resulting extracts can be stored for at least 4 weeks in a spark-proof refrigerator prior to analysis.
3.8 Analytical Procedure
3.8.1 Extraction Procedure
Sample pre-treatment
Samples should not be filtered prior to extraction.
To 100 ml of sample, add 100 µl of the internal standard spiking solution (1 µg/ml).
Sample extraction
An Oasis HLB SPE cartridge is conditioned by adding methanol (5 ml) followed by deionised water (5 ml).
Ensure that the cartridge does not dry out during this process or prior to passage of a sample through the cartridge.
Attach the sample lines, apply vacuum and extract the sample at a flow rate of less than 10 ml per minute. After extraction, remove the lines and add deionised water to the reservoir (5 ml).
Dry the cartridge under vacuum for 2 minutes.
Add 5 ml of 40% methanol in water to the dried cartridge and allow to drain to waste.
Dry the cartridge thoroughly using nitrogen and a vacuum source for 30 minutes.
A collection vessel is place inside the extraction manifold prior to sample elution. The target analytes are eluted, by gravity, with 2 ml of methanol.
Extract concentration
The collection vessel is removed and the contents concentrated to a final volume of 1 ml using a TurboVap concentrator at 50°C and then to 500 µl using a nitrogen-blow down apparatus into an autosampler vial.
Blank and AQC recovery
A sample blank (reverse osmosis water) and an AQC recovery sample prepared by spiking 100 ml reverse osmosis water with 100 µl of the 1 µg/ml spiking solution (Section 3.5.3) should be treated exactly as a sample and taken through the complete analytical procedure described in Section 3.8.1.
DEFRA
WRc Ref: DEFRA 7585/14612-0 February 2008
32
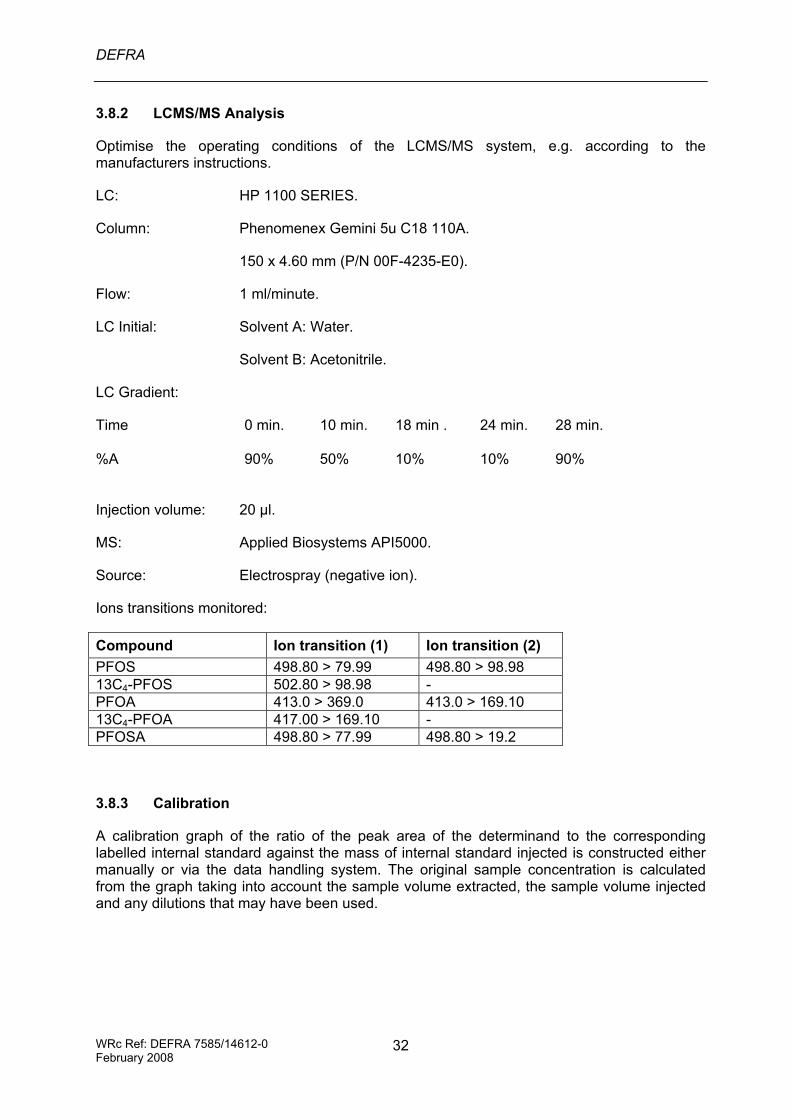
3.8.2 LCMS/MS Analysis
Optimise the operating conditions of the LCMS/MS system, e.g. according to the manufacturers instructions.
LC: HP 1100 SERIES.
Column: Phenomenex Gemini 5u C18 110A.
150 x 4.60 mm (P/N 00F-4235-E0).
Flow: 1 ml/minute.
LC Initial: Solvent A: Water.
Solvent B: Acetonitrile.
LC Gradient:
Time 0 min. 10 min. 18 min . 24 min. 28 min.
%A 90% 50% 10% 10% 90%
Injection volume: 20 µl.
MS: Applied Biosystems API5000.
Source: Electrospray (negative ion).
Ions transitions monitored:
Compound Ion transition (1) Ion transition (2) PFOS 498.80 > 79.99 498.80 > 98.98 13C4-PFOS 502.80 > 98.98 - PFOA 413.0 > 369.0 413.0 > 169.10 13C4-PFOA 417.00 > 169.10 - PFOSA 498.80 > 77.99 498.80 > 19.2
3.8.3 Calibration
A calibration graph of the ratio of the peak area of the determinand to the corresponding labelled internal standard against the mass of internal standard injected is constructed either manually or via the data handling system. The original sample concentration is calculated from the graph taking into account the sample volume extracted, the sample volume injected and any dilutions that may have been used.

DEFRA
WRc Ref: DEFRA 7585/14612-0 February 2008
33
3.8.4 Identification
Identify the sample component by matching both retention times and relative intensities of the ion transitions of the sample components and reference substances.
The target compound is present (is identified) in the sample if the relative or the absolute sample component retention time measured in the selected ion current chromatogram matches the relative or absolute retention time of the authentic compound within ± 0.2% (or a maximum of ± 6 s.) in the chromatogram of the latest calibration standard, measured under identical conditions.
3.9 Calculations
Using the mass spectrometer software, the area of each specific peak can be measured. For each determinand the response ratio is then calculated.
Pk Area (D) [Response] = ------------------- Pk Area (I.S.) where: Pk Area (D) peak area of the determinand. Pk Area (I.S.) peak area of the 13C4-labelled corresponding internal standard. Using the data system attached to the analytical instrument (or manually) plot the response ratio against the concentration for the standards. From the plotted calibration curve, calculate the slope and intercept using linear regression.
By determining the response ratio in the unknown samples, AQC blanks and controls, described above, this can then be applied to the following equation and the concentration of each determinand calculated.
Concentration = [Response - Intercept ] / [Slope]
3.10 Quality Control
The quality of the analysis is assured through reproducible calibration and testing of the extraction, clean-up and LCMS/MS systems. A series of quality control samples (including blanks and control standards) should be analysed with each batch of samples and monitored through control charting and other quality review procedures.
3.11 Safety
Hazard assessments should be carried out for all of the chemicals and procedures used and should be consulted prior to carrying out any work with the chemicals involved.
Appropriate precautions should be taken when handling the pure compounds and standard solutions of these compounds.
Several of the reagents used are potentially hazardous. Methanol and acetonitrile are toxic and flammable.
DEFRA
WRc Ref: DEFRA 7585/14612-0 February 2008
34
3.12 References
1. N. Yamashita et al., Analysis of perfluorinated acids at pert-per-quadrillion levels in seawater using liquid chromatography-tandem mass spectrometry, Environ. Sci. Technol., 2004, 38, 5522-5528
2. S. Taniyasu et al., Analysis of fluorotelomer alcohols, fluorotelomer acids, and short-and long-chain perfluorinated acids in water and biota, Journal of Chromatography A., 2005, 1093, 89-97

DEFRA
WRc Ref: DEFRA 7585/14612-0 February 2008
35
4. PERFORMANCE OF ANALYTICAL METHOD
In light of the differences in the analytical methods used for PFOS and PFOA detection that have become apparent during this project, it was deemed beneficial to benchmark the method used in the current study. Therefore, the method used was involved in both an official Aquacheck Laboratory comparison and a more informal General Laboratory Comparison.
4.1 Aquacheck Laboratory Comparison
Aquacheck is the service provided by LGC (formerly the Laboratory of the Government Chemist). It provides assessment of laboratory performance and provides benchmarking services for the analysis of clean waters, waste waters, sludges, sediments and soils. This comparison was undertaken in September-October 2007 (Aquacheck, 2007a). Eleven different laboratories took part and samples were spiked with PFOS and PFOA at concentrations of 4.70 and 7.86 µg/l, respectively. The results are detailed in Table 4.1.
Table 4.1 Results of the Aquacheck Laboratory comparison
PFOS
Laboratory Flagged Z-Score Result (µg/l)
Difference (µg/l)
% Difference
A 1.17 5.25 0.55 11.70 B 0.26 4.82 0.12 2.55 C 0.68 5.02 0.32 6.81 D ✯ ✯ 7.02 8.00 3.30 70.21 E -0.57 4.43 -0.27 -5.74 F 1.49 5.40 0.70 14.89 G 0.43 4.90 0.20 4.26 H ✯ ✯ 11.17 9.95 5.25 111.70 I 1.13 5.23 0.53 11.28 J 1.09 5.21 0.51 10.85 K -1.06 4.20 -0.50 -10.64
PFOA
Laboratory Flagged Z-Score Result (µg/l)
Difference (µg/l)
% Difference
A ✯ ✯ 3.70 10.77 2.91 37.02 B ✯ 2.42 9.76 1.90 24.17 C 0.50 8.25 0.39 4.96 D ✯ -2.37 6.00 -1.86 -23.66 E ✯ ✯ 3.66 10.74 2.88 36.64 F 0.05 7.90 0.04 0.51 G -0.08 7.80 -0.06 -0.76 H ✯ ✯ 16.46 20.80 12.94 164.63 I 1.70 9.20 1.34 17.05 J 0.59 8.32 0.46 5.85 K -0.59 7.40 -0.46 -5.85
Where Laboratory I is STL Ltd., i.e. the method used in this project.

DEFRA
WRc Ref: DEFRA 7585/14612-0 February 2008
36
Table 4.2 Data from the Aquacheck Laboratory comparison specific for the Severn Trent Laboratory
Difference Determinand Result (µg/l)
Bias (%)
RSD (%)
Median of all labs. (µg/l)
Assigned value (µg/l) Actual (µg/l) %
Z-Score
PFOS 5.23 10.85 9.78 5.21 4.70 0.53 11.28 1.13 PFOA 9.20 5.85 17.35 8.32 7.86 1.34 17.05 1.70
The results of the Aquacheck Laboratory comparison illustrate that acceptable Z-scores2 and %RSD for both PFOS and PFOS are achieved from the method used in this project (STL Ltd., Laboratory I). Moreover, it is not one of the five laboratories that were flagged (or double flagged) (marked on Table 4.1). Aquacheck issues a single flag when the Z-score >2.00 or <-2.00 and a double flag when the Z-score >3.01 or <-3.01 to draw attention to unsatisfactory or questionable results.
4.2 General Laboratory Comparison
The General Laboratory Comparison was instigated by various water companies and national organisations (who are also conducting monitoring and research into PFOS and PFOA concentrations in the UK) to benchmark and validate the analytical methods used. This involved a raw water sample (duplicated), as well as ‘control’ samples from final, treated water from another (WTWs), and control samples individually spiked with 0.28 µg/l of either PFOS or PFOA. The comparison was performed in September-October 2007. The results are presented in Table 4.3.
2 The Aquacheck Z-score is a performance score which compares the difference between each participants result and the assigned value in terms of the acceptable spread of results or error target thresholds (Aquacheck, 2007b).

DEFRA
WRc Ref: DEFRA 7585/14612-0 February 2008
37
Table 4.3 Results of the General Laboratory Comparison
Sample A PFOS (µg/l) PFOA (µg/l) Laboratory A 3.03 0.449 Laboratory B 1.25 0.1 Laboratory C 1.13 0.376 Laboratory D 1.77 0.37 Laboratory E 3.24 0.33
Sample B PFOS (µg/l) PFOA (µg/l)
Laboratory A 0.019 <0.024 Laboratory B Too small No peak Laboratory C <0.01 <0.01 Laboratory D 0.013 <0.013 Laboratory E <0.05 <0.05
Sample C PFOS (µg/l) PFOA (µg/l)
Laboratory A 0.392 0.278 Laboratory B 0.12 0.07 Laboratory C 0.17 0.286 Laboratory D 0.204 0.256 Laboratory E 0.3 0.27
Sample D PFOS (µg/l) PFOA (µg/l)
Laboratory A 3.81 0.485 Laboratory B 0.949 0.084 Laboratory C 1.08 0.376 Laboratory D 2.256 0.429 Laboratory E 3.32 0.32
Where: Samples A and D are raw water from the same water treatment works (WTWs). Sample B is control final, treated drinking water from a second WTWs.
Sample C is control and either spiked with 0.28 µg/l PFOS or 0.28 µg/l PFOA. Laboratory A is STL Ltd., i.e. the method used in this project.
During this informal trial, the results from the method used in this project (STL Ltd., Laboratory A) were satisfactory and provide further confidence in the method, even though the samples were not analysed until two weeks after sampling and the tested stability for PFOS and PFOA was only 7 days.

DEFRA
WRc Ref: DEFRA 7585/14612-0 February 2008
38

DEFRA
WRc Ref: DEFRA 7585/14612-0 February 2008
39
5. SELECTION OF SURVEY SITES
It was agreed with Defra/DWI that 20 sites would be sampled, which would include 5 control sites and 15 perceived higher-risk sites from England and Wales. These sites would include lowland and upland surface waters and groundwater sources, cover a range of different water treatment works, and be representative of the geographical area. The control sites were chosen from rural areas, with no perceived higher-risk factors nearby.
WRc compiled a list of industrial sites (including various uses, distributors and producers of perfluorinated compounds) in consultation with the Environment Agency. Civilian and military airfields were also identified. All water companies were asked to nominate any sites that could be deemed as potentially higher-risk according to the risk factors noted above. Specific risk factors noted included: airfields; semi-conductor industries; carpet or textile manufacturers; and chrome (VI) plating industries. Regarding water sources, unconfined, shallow or adit sources were deemed to be at high risk following historical use of the compounds.
The literature review (Section 2) identified that limited monitoring had been performed in England and Wales. That undertaken mainly related to the Buncefield Oil Depot explosion that occurred in December 2005, although one water undertaker and the Environment Agency (EA) had also undertaken some wider sampling. Following completion of the literature review, it was identified that Severn Trent planned to carry out a monitoring strategy of their own in 2007, which would cover all of their surface water sites and the majority of their groundwater sites. The only exemptions to this strategy were 14 deep, confined groundwaters, which were considered to be of no risk of PFOS contamination (see Section 7).
The sites chosen in this study were selected such that they did not duplicate any of the areas already sampled, or planned to be sampled, for PFOS and PFOA. The exception to this was one site near to Buncefield, which was included as a site in the vicinity of known contamination.
The geographical distribution of the sites chosen is shown in Figure 5.1.

DEFRA
WRc Ref: DEFRA 7585/14612-0 February 2008
40
Figure 5.1 The geographical distribution of the 20 sampling sites chosen.
DEFRA
WRc Ref: DEFRA 7585/14612-0 February 2008
41
6. MONITORING
6.1 Sampling
Prior to the start of sampling, it was determined that the addition of thiosulphate to final drinking water samples, required to remove any chlorine present, had no effect on the analysis for PFOS and PFOA.
Samples were taken from prescribed sample points (usually taps); the sample being poured directly into the sample bottle. All samples were kept in the dark in cool-boxes containing frozen ice-packs at between approximately 4°C to 8°C during transit, and either taken directly to the analysing laboratory, or kept overnight in a cold-room at approximately 4°C until submission to the analysing laboratory within approximately 48 hours of sampling.
6.1.1 Sampling Survey 1
The first sampling survey was carried out during the period 20/02/07 to 16/03/07. Raw and final waters were sampled from 19 of the 20 sites. Site number 13 was not sampled as it was not in operation at the time. In each of the 19 sites sampled, at least one sample was also taken within the treatment process, unless chlorination was the only treatment, in which case only raw and final samples were taken. Various duplicate samples were also taken.
6.1.2 Sampling Survey 2
The second sampling survey was carried out during the period 24/04/07 to 03/05/07. Raw and final waters were sampled from 19 of the 20 sites. Site number 17 was not sampled as it was no in operation at the time. The choice of samples taken was the same as is session 1, and again various duplicates were taken. Field blanks with distilled water from sites 1, 6, 8, 9 and 16 were also taken and analysed for both PFOS and PFOA.
Field blanks were prepared using analytical grade laboratory water poured directly into 125 ml HDPE plastic bottles of the same type as those used for the analytical samples. At each site, a field blank was taken to one of the positions from which samples taken at the site were being transferred to the sample bottles. At each position, the analytical samples were taken from prescribed sample points (usually taps); the sample being poured directly into the sample bottle. To mimic this procedure, a field blank was manually transferred to a clean 125 ml HDPE plastic bottle taken at random from the same batch of bottles used for the samples. This field blank sample was then labelled and stored alongside the samples during transit and subsequent delivery to the analytical laboratory performing the analysis. Field blanks were included to determine whether the sampling procedure used introduced any PFOS or PFOA contamination into the process.
6.1.3 Sampling Survey 3
The third sampling survey was carried out during the period 07/07/07 to 23/08/07. Raw and final waters were sampled from 18 of the 20 sites. Site 17 was not sampled as it remained out of operation, and site 18 was not sampled for various logistical reasons. Again, the choice of
DEFRA
WRc Ref: DEFRA 7585/14612-0 February 2008
42
samples taken was the same as that for the first two sessions, and duplicates were also taken.
6.1.4 Sampling Survey 4
The fourth and final sampling survey was carried out during the period 20/11/07 to 18/12/07. Raw and final waters were sampled from 19 of the 20 sites. Site 17 was not sampled as it remained out of operation. Research and work from Water Company monitoring programmes being undertaken at the time of this sampling round suggested that new Granular Activated Carbon (GAC) is capable of removing PFOS. Therefore this round of sampling was used to focus on the treatment method of each site, specifically GAC. As such, the following sites were focussed on:
● site 9 (PFOS detected in sessions 1, 2 and 3), ● site 10 (PFOA detected in session 2), ● site 15 (PFOS detected in sessions 1, 2 and 3), and, ● site 16 (PFOS detected in sessions 1, 2 and 3, and PFOA detected in session 2).
However, the GAC at site 9 had not been in operation during sessions 1, 2 and 3, and site 10 does not use GAC in its treatment process. Therefore, the effects of the GAC could only be examined in detail at sites 15 and 16. For each of these sites, samples were taken from the GAC feed water, from a range of GAC beds and also from the post-GAC water. Details of the GAC ages and blending proportions of the different waters were also obtained, see Appendix A. Only raw and final drinking waters of the other sites were taken, as well as various duplicates and field blanks from each site.
6.2 Results
Results of the effects of thiosulphate (i.e. de-ionised water as a control and de-ionised water and thiosulphate) were all below the LODs for both PFOS and PFOA (<0.011 and <0.024 µg/l, respectively). The results of all the field blanks were also below the LODs for both PFOS and PFOA.
The results from the control sites for all four sampling sessions are detailed in Table 6.1, and those from the perceived higher-risk sites in Table 6.2 and Table 6.3.

DEFRA
WRc Ref: DEFRA 7585/14612-0 February 2008
43
Table 6.1 PFOS and PFOA results of sampling in 2007 at the five control sites for all four sampling sessions.
PFOS Results (µg/l) PFOA Results (µg/l)
Site No.
Source Water Type Treatment Sampled
where
Session 1 (20/02 - 16/03)
Session 2 (24/04 - 03/05)
Session 3 (03/07 - 23/08)
Session 4 (20/11 - 18/12)
Session 1 (20/02 - 16/03)
Session 2 (24/04 - 03/05)
Session 3 (03/07 - 07/08)
Session 4 (20/11 - 18/12)
Raw <0.011 <0.011 <0.011 <0.011 0.076 <0.024 <0.024 <0.024 Before last chlorination <0.011 <0.011 <0.011 - 0.078 <0.024 <0.024 - 1 Lowland SW
Slow sand filtration, chlorination using
chlorine gas. After Cl contact tanks <0.011 <0.011 <0.011 <0.011 0.124 <0.024 <0.024 <0.024
Raw <0.011 <0.011 <0.011 <0.011 <0.024 <0.024 <0.024 <0.024 2 Groundwater (UC) Marginal chlorination by
gas. After Cl contact tanks <0.011 <0.011 <0.011 <0.011 <0.024 <0.024 <0.024 <0.024
Raw (reservoir 1) <0.011 <0.011 <0.011 <0.011 <0.024 <0.024 <0.024 <0.024
Raw (reservoir 2) <0.011 <0.011 <0.011 <0.011 <0.024 <0.024 <0.024 <0.024
Before final chlorination <0.011 <0.011 <0.011 - 0.113 <0.024 <0.024 -
After Cl contact tanks - <0.011 <0.011 <0.011 - <0.024 <0.024 <0.024
3 Upland SW Rapid gravity filters, chlorination by gas.
After Cl contact tanks <0.011 <0.011 - - 0.123 <0.024 - -
Raw 1 <0.011 <0.011 <0.011 <0.011 0.370 <0.024 0.026 <0.024
Raw 2 <0.011 <0.011 <0.011 <0.011 0.168 <0.024 <0.024 <0.024
After sand filtration <0.011 <0.011 <0.011 - 0.161 <0.024 <0.024 -
4 Lowland SW
Primary filters, GAC, slow sand filtration,
aeration to increase DO following degradation in
slow-sand stage. Chlorination using
chlorine gas followed by ammonium sulphate addition to produce
chloramine.
After Cl contact tanks <0.011 <0.011 <0.011 <0.011 0.240 <0.024 <0.024 <0.024
Raw <0.011 <0.011 <0.011 <0.011 0.230 <0.024 <0.024 <0.024 Raw - <0.011 <0.011 - - <0.024 <0.024 -
Before last chlorination <0.011 <0.011 <0.011 - 0.227 <0.024 <0.024 - 5 Groundwater (C)
Iron/manganese removal treatment. Chlorination using
chlorine gas. After Cl contact tanks <0.011 <0.011 <0.011 <0.011 0.135 <0.024 <0.024 <0.024
Where, Cl: chlorine, groundwater (C): confined groundwater, groundwater (UC): unconfined groundwater, SW: surface water, GAC: granular activated carbon, and DO: dissolved oxygen. The highlighted samples indicate where PFOS or PFOA were detected.

DEFRA
WRc Ref: DEFRA 7585/14612-0 February 2008
44
Table 6.2 PFOS results (in µg/l) of sampling in 2007 at the perceived higher-risk sites for all four sampling sessions.
Site No. Source Water type Treatment Risk type Sampled where
Session 1 (20/02 - 16/03)
Session 2 (24/04 - 03/05)
Session 3 (03/07 - 23/08)
Session 4 (20/11 - 18/12)
Raw <0.011 <0.011 <0.011 <0.011 Raw - - <0.011 -
Air-stripped <0.011 <0.011 <0.011 - 6 Groundwater (C)
Air stripping to remove volatile organics and
chlorination using chlorine gas.
Industrial, electroplating
After Cl contact tanks <0.011 <0.011 <0.011 <0.011 Raw <0.011 <0.011 <0.011 <0.011 Raw - - <0.011 - 7 Groundwater (C) Chlorination using chlorine
gas. Airfield After Cl contact tanks <0.011 <0.011 <0.011 <0.011
Raw 0.016 0.020 <0.011 0.013
Before last chlorination 0.016 0.023 <0.011 - 8 Groundwater (UC)
Ultrafiltration membranes and chlorination using
chlorine gas.
Airfield and industrial
After Cl contact tanks 0.016 0.019 <0.011 0.014
Raw 0.152 0.124 0.205 0.135 Raw 0.162 - 0.183 - Raw 0.154 - 0.208 - 9 Groundwater (UC)
None on site: water pumped by raw water pumping main to another treatment works,
which has GAC (not in operation), super
chlorination using gas and dechlorination.
Airfield
Final - - - 0.130
Borehole 2 <0.011 <0.011 <0.011 <0.011 Borehole 4 <0.011 <0.011 <0.011 <0.011
Chlorine residual point - <0.011 - - Final point A - <0.011 <0.011 -
10 Groundwater (UC) Chlorination using sodium hypochlorite.
Nearby fire in carpet
warehouse
Final point B <0.011 <0.011 <0.011 <0.011 Raw <0.011 <0.011 <0.011 <0.011
Before GAC <0.011 <0.011 - - After GAC <0.011 <0.011 <0.011 -
11 Surface water GAC, super chlorination by gas and dechlorination.
Sewage discharge and
airfield After Cl contact tanks <0.011 <0.011 <0.011 <0.011
Raw <0.011 <0.011 <0.011 <0.011 12 Groundwater (C) Super chlorination by gas
and dechlorination.
Local tip with presence of
flame retardants After Cl contact tanks <0.011 <0.011 <0.011 <0.011

DEFRA
WRc Ref: DEFRA 7585/14612-0 February 2008
45
Site No. Source Water type Treatment Risk type Sampled where
Session 1 (20/02 - 16/03)
Session 2 (24/04 - 03/05)
Session 3 (03/07 - 23/08)
Session 4 (20/11 - 18/12)
Raw outside feed <0.011 <0.011 <0.011
Raw inside <0.011 <0.011 <0.011
Raw inside <0.011 - -
13 Groundwater (UC) Ion exchange, nitrate
removal, chlorination by gas and phosphate dosing.
Airfield
Final
Off line
<0.011 <0.011 <0.011
Raw (plant not running)
<0.011 <0.011 <0.011 <0.011 14 Groundwater (UC) Chlorination using chlorine
gas. Airfield Raw (plant not running)
- <0.011 - -
Borehole 3 0.059 0.076 0.052 Off line
Borehole 4 0.029 0.028 0.018 Off line
Borehole 5 0.038 0.029 0.030 Off line
GAC feed water - - - 0.046
GAC 1 - - - 0.042
GAC 2 - - - 0.043
GAC 3 - - - 0.044
GAC 4 - - - 0.048
GAC 5 - - - 0.046 GAC 6 - - - 0.044 GAC 7 - - - 0.046 GAC 8 - - - 0.044 GAC 9 - - - 0.038
GAC 10 - - - 0.038 GAC 11 - - - 0.039 GAC 12 - - - 0.037
Post GAC (all) 0.042 0.047 0.035 -
15 Groundwater (UC)
GAC and chlorination by on-site electrolytic
generation using food grade salt stored in HDPE. 12
GAC beds.
Large use of PFOS-
containing fire fighting foam (Buncefield)
After chlorine contact 0.045 0.040 0.032 0.034
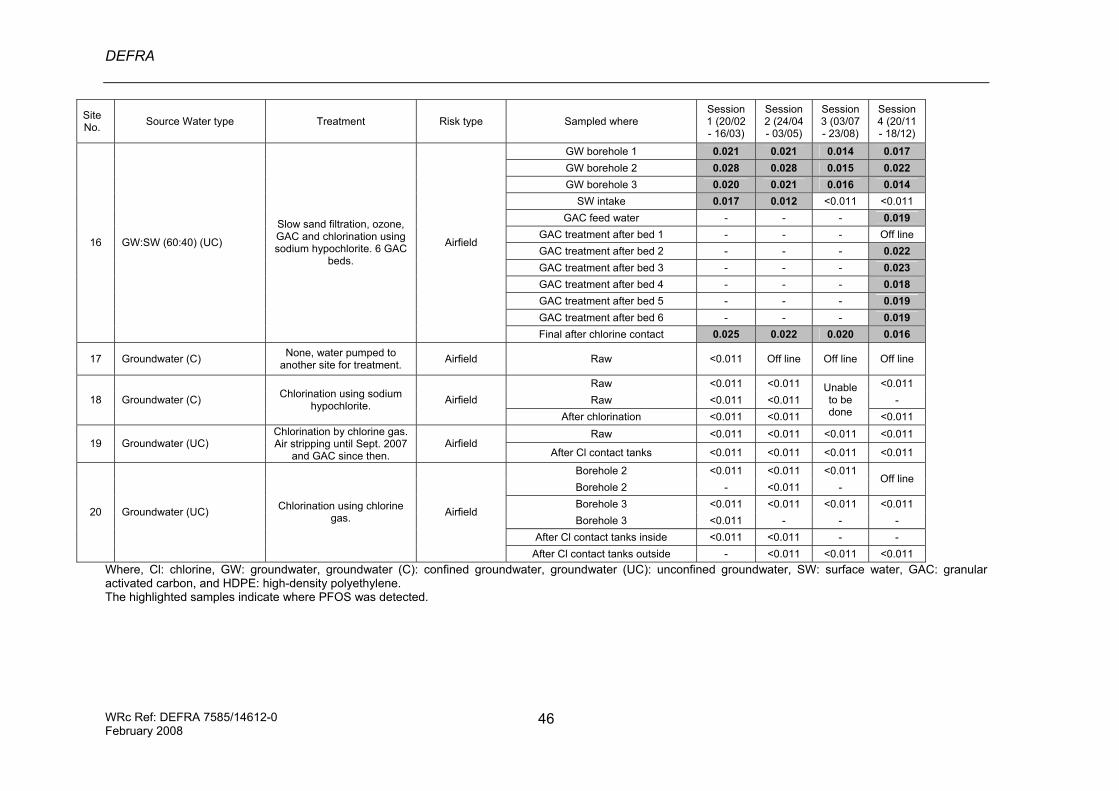
DEFRA
WRc Ref: DEFRA 7585/14612-0 February 2008
46
Site No. Source Water type Treatment Risk type Sampled where
Session 1 (20/02 - 16/03)
Session 2 (24/04 - 03/05)
Session 3 (03/07 - 23/08)
Session 4 (20/11 - 18/12)
GW borehole 1 0.021 0.021 0.014 0.017 GW borehole 2 0.028 0.028 0.015 0.022 GW borehole 3 0.020 0.021 0.016 0.014
SW intake 0.017 0.012 <0.011 <0.011 GAC feed water - - - 0.019
GAC treatment after bed 1 - - - Off line GAC treatment after bed 2 - - - 0.022 GAC treatment after bed 3 - - - 0.023 GAC treatment after bed 4 - - - 0.018 GAC treatment after bed 5 - - - 0.019 GAC treatment after bed 6 - - - 0.019
16 GW:SW (60:40) (UC)
Slow sand filtration, ozone, GAC and chlorination using sodium hypochlorite. 6 GAC
beds.
Airfield
Final after chlorine contact 0.025 0.022 0.020 0.016
17 Groundwater (C) None, water pumped to another site for treatment. Airfield Raw <0.011 Off line Off line Off line
Raw <0.011 <0.011 <0.011 Raw <0.011 <0.011 - 18 Groundwater (C) Chlorination using sodium
hypochlorite. Airfield After chlorination <0.011 <0.011
Unable to be done <0.011
Raw <0.011 <0.011 <0.011 <0.011 19 Groundwater (UC)
Chlorination by chlorine gas. Air stripping until Sept. 2007
and GAC since then. Airfield
After Cl contact tanks <0.011 <0.011 <0.011 <0.011
Borehole 2 <0.011 <0.011 <0.011 Borehole 2 - <0.011 -
Off line
Borehole 3 <0.011 <0.011 <0.011 <0.011 Borehole 3 <0.011 - - -
After Cl contact tanks inside <0.011 <0.011 - -
20 Groundwater (UC) Chlorination using chlorine gas. Airfield
After Cl contact tanks outside - <0.011 <0.011 <0.011 Where, Cl: chlorine, GW: groundwater, groundwater (C): confined groundwater, groundwater (UC): unconfined groundwater, SW: surface water, GAC: granular activated carbon, and HDPE: high-density polyethylene. The highlighted samples indicate where PFOS was detected.

DEFRA
WRc Ref: DEFRA 7585/14612-0 February 2008
47
Table 6.3 PFOA results (in µg/l) of sampling in 2007 at the perceived higher-risk sites for all four sampling sessions.
Site No. Source Water type Treatment Risk type Sampled where
Session 1 (20/02 - 16/03)
Session 2 (24/04 - 03/05)
Session 3 (03/07 - 23/08)
Session 4 (20/11 - 18/12)
Raw 0.182 <0.024 <0.024 <0.024 Raw - - <0.024 -
Air-stripped 0.222 <0.024 <0.024 - 6 Groundwater (C)
Air stripping to remove volatile organics and
chlorination using chlorine gas.
Industrial, electroplating
After Cl contact tanks 0.263 <0.024 <0.024 <0.024
Raw 0.155 <0.024 <0.024 <0.024
Raw - - <0.024 - 7 Groundwater (C) Chlorination using chlorine
gas. Airfield
After Cl contact tanks 0.183 <0.024 <0.024 <0.024
Raw 0.025 <0.024 <0.024 <0.024 Before last chlorination 0.052 <0.024 <0.024 - 8
Groundwater (UC)
Ultrafiltration membranes and chlorination using
chlorine gas.
Airfield and industrial
After Cl contact tanks 0.066 <0.024 <0.024 <0.024 Raw 0.042 <0.024 <0.024 <0.024 Raw 0.028 - <0.024 - Raw 0.045 - <0.024 - 9 Groundwater (UC)
None on site: water pumped by raw water pumping main to another treatment works,
which has GAC (not in operation), super
chlorination using gas and dechlorination.
Airfield
Final - - - <0.024
Borehole 2 0.040 0.031 <0.024 <0.024 Borehole 4 0.068 0.051 <0.024 <0.024
Chlorine residual point - 0.025 - - Final point A - 0.058 <0.024 -
10 Groundwater (UC) Chlorination using sodium hypochlorite.
Nearby fire in carpet
warehouse
Final point B <0.024 0.042 <0.024 <0.024 Raw 0.027 <0.024 <0.024 <0.024
Before GAC <0.024 <0.024 - - After GAC <0.024 <0.024 <0.024 -
11 Surface Water GAC, super chlorination by gas and dechlorination.
Sewage discharge and
airfield After Cl contact tanks <0.024 <0.024 <0.024 <0.024
Raw 0.037 <0.024 <0.024 <0.024 12 Groundwater (C) Super chlorination by gas
and dechlorination.
Local tip with presence of
flame retardants After Cl contact tanks <0.024 <0.024 <0.024 <0.024

DEFRA
WRc Ref: DEFRA 7585/14612-0 February 2008
48
Site No. Source Water type Treatment Risk type Sampled where
Session 1 (20/02 - 16/03)
Session 2 (24/04 - 03/05)
Session 3 (03/07 - 23/08)
Session 4 (20/11 - 18/12)
Raw outside feed <0.024 <0.024 <0.024
Raw inside 0.055 <0.024 <0.024
Raw inside 0.049 - -
13 Groundwater (UC) Ion exchange, nitrate
removal, chlorination by gas and phosphate dosing.
Airfield
Final
Off line
0.059 <0.024 <0.024
Raw (plant not running) 0.091 <0.024 <0.024 <0.024
14 Groundwater (UC) Chlorination using chlorine gas. Airfield Raw (plant not running)
- <0.024 - -
Borehole 3 0.046 <0.024 <0.024 Off line
Borehole 4 0.045 <0.024 <0.024 Off line
Borehole 5 0.041 <0.024 <0.024 Off line
GAC feed water - - - <0.024
GAC 1 - - - <0.024
GAC 2 - - - <0.024
GAC 3 - - - <0.024
GAC 4 - - - <0.024
GAC 5 - - - <0.024 GAC 6 - - - <0.024 GAC 7 - - - <0.024 GAC 8 - - - <0.024 GAC 9 - - - <0.024
GAC 10 - - - <0.024 GAC 11 - - - <0.024 GAC 12 - - - <0.024
Post GAC (all) 0.027 <0.024 <0.024 -
15 Groundwater (UC)
GAC and chlorination by on site electrolytic generation
using food grade salt stored in HDPE. 12 GAC beds.
Large use of PFOS-
containing fire fighting foam (Buncefield)
After chlorine contact 0.066 <0.024 <0.024 0.053

DEFRA
WRc Ref: DEFRA 7585/14612-0 February 2008
49
Site No. Source Water type Treatment Risk type Sampled where
Session 1 (20/02 - 16/03)
Session 2 (24/04 - 03/05)
Session 3 (03/07 - 23/08)
Session 4 (20/11 - 18/12)
GW borehole 1 0.048 <0.024 <0.024 <0.024 GW borehole 2 0.066 0.031 <0.024 <0.024 GW borehole 3 0.031 0.029 <0.024 <0.024
SW intake 0.066 0.039 <0.024 <0.024 GAC feed water - - - <0.024
GAC treatment after bed 1 - - - Off line GAC treatment after bed 2 - - - <0.024 GAC treatment after bed 3 - - - <0.024 GAC treatment after bed 4 - - - <0.024 GAC treatment after bed 5 - - - <0.024 GAC treatment after bed 6 - - - <0.024
16 GW:SW (60:40) (UC)
Slow sand filtration, ozone, GAC and chlorination using sodium hypochlorite. 6 GAC
beds.
Airfield
Final after chlorine contact 0.071 <0.024 <0.024 <0.024
17 Groundwater (C) None, water pumped to another site for treatment. Airfield Raw <0.024 Off line Off line Off line
Raw 0.105 <0.024 <0.024 Raw 0.118 <0.024 - 18 Groundwater (C) Chlorination using sodium
hypochlorite. Airfield After chlorination 0.125 <0.024
Unable to be done <0.024
Raw <0.024 <0.024 <0.024 <0.024 19 Groundwater (UC)
Chlorination by chlorine gas. Air stripping until Sept. 2007
and GAC since then. Airfield
After Cl contact tanks <0.024 0.025 <0.024 <0.024
Borehole 2 0.202 <0.024 <0.024 Borehole 2 - <0.024 -
Off line
Borehole 3 0.150 <0.024 <0.024 <0.024 Borehole 3 0.132 - - -
After Cl contact tanks inside *** 0.137 <0.024 - -
20 Groundwater (UC) Chlorination using chlorine gas. Airfield
After Cl contact tanks outside *** - <0.024 <0.024 <0.024 Where, Cl: chlorine, GW: groundwater, groundwater (C): confined groundwater, groundwater (UC): unconfined groundwater, SW: surface water, GAC: granular activated carbon, and HDPE: high-density polyethylene. The highlighted samples indicate where PFOA was detected.

DEFRA
WRc Ref: DEFRA 7585/14612-0 February 2008
50
6.3 Discussion
6.3.1 Effects of Thiosulphate & the Field Blanks
The addition of thiosulphate to remove any chlorine present in the water had no effect on the analysis for either PFOS or PFOA. It can also be seen that all the field blanks had non-detectable concentrations of PFOS and PFOA (below the Limit of Detections, LODs), indicating no observable faults in the sampling methodology or the analysis.
6.3.2 PFOS
PFOS was not detected at any of the five control low-risk sites.
Of the 15 perceived higher-risk sites sampled, PFOS was detected at low concentrations at 3 sites in all sessions and at 1 site in 3 out of 4 sessions. Concentrations were comparable in each session and showed no obvious increase or decrease over time (0.016-0.162 µg/l in session 1, 0.012-0.124 µg/l in session 2, 0.014-0.208 µg/l in session 3 and 0.013-0.135 µg/l in session 4). All levels detected were below the current DWI English and Welsh drinking water guidance levels (see Table 2.1).
PFOS was detected in all four sampling sessions at sites 9, 15 and 16 and in sessions 1, 2 and 4 at site 8 (Table 6.2). In every session, site 9 contained the greatest levels of PFOS, at concentrations approximately 5-fold higher than those at the other sites. The source water at site 8 is an unconfined groundwater, which is near the high risk factor of an airport, which is known to undertake fire fighting training (although whether this involves PFOS-containing fire-fighting foam is unknown). Site 9 is also an unconfined groundwater, which is near to an airfield, however, it is not known as to whether any training and subsequent use of PFOS-containing fire fighting foam occurs here. Site 15 is close to the Buncefield site, where unknown quantities of PFOS-containing fire-fighting foams were used following a large oil fire in December 2005. The water source is an unconfined groundwater, but the treatment does include granular activated carbon (GAC), which has been shown in other research to potentially remove PFOS. However, the GAC beds have not been regenerated for some years. Site 16 is near a big international airport, and uses both surface and ground water at a ratio of 40:60, where the groundwater is again unconfined. GAC is also used in the treatment at this site.
At the sites where PFOS was detected, there were no appreciable decreases following treatment, including GAC at two of the sites. However, as stated above, all GAC beds were relatively old. There were no apparent effects linked with the method of chlorination used. Although all the detects were in unconfined aquifers, PFOS was not detected at the other perceived higher-risk unconfined aquifer sites. No seasonal variations are apparent (Figure 6.1).
Good correlation between the duplicate samples was achieved, providing confidence in the reproducibility of the method.

DEFRA
WRc Ref: DEFRA 7585/14612-0 February 2008
51
0.00
0.05
0.10
0.15
0.20
0.25
0.30
Raw Before lastchlorination
Afterchlorination
contact tanks
Site 8
PFO
S (µ
g/l)
Session 1 (20/02/07 -16/03/07)
Session 2 (24/04/07 -03/05/07)
Session 3 (03/07/07 -23/08/07)
Session 4 (20/11/07 -18/12/07)
0.00
0.05
0.10
0.15
0.20
0.25
0.30
Raw Raw Raw
Site 9
PFO
S (µ
g/l)
Session 1 (20/02/07 -16/03/07)
Session 2 (24/04/07 -03/05/07)
Session 3 (03/07/07 -23/08/07)
Session 4 (20/11/07 -18/12/07)
0.00
0.05
0.10
0.15
0.20
0.25
0.30
Borehole3
Borehole4
Borehole5
Post GAC Afterchlorinecontact
Site 15
PFO
S (µ
g/l)
Session 1 (20/02/07 -16/03/07)
Session 2 (24/04/07 -03/05/07)
Session 3 (03/07/07 -23/08/07)
Session 4 (20/11/07 -18/12/07)
0.00
0.05
0.10
0.15
0.20
0.25
0.30
GWborehole
1
GWborehole
2
GWborehole
3
SWintake
Finalafter
chlorinecontact
Site 16
PFO
S (µ
g/l)
Session 1 (20/02/07 -16/03/07)
Session 2 (24/04/07 -03/05/07)
Session 3 (03/07/07 -23/08/07)
Session 4 (20/11/07 -18/12/07)
Figure 6.1 Graphs showing the variation of PFOS concentrations over the sampling period at the four sites where it was detected. Where samples have been detected at <0.011 µg/l, concentrations have been taken as 0.011 µg/l as the worst case scenario. GW: groundwater, SW: surface water, GAC: Granular Activated Carbon. Note: 0.3 µg/l has been used as the maximum of the scale as it is the DWI Tier 1 trigger value for PFOS.

DEFRA
WRc Ref: DEFRA 7585/14612-0 February 2008
52
6.3.3 PFOA
PFOA was detected at concentrations of 0.025-0.370 µg/l in all but three of the 19 sites that were sampled in session 1 (including 4 of the 5 control sites) (Table 6.3). In session 2, PFOA was detected at concentrations of 0.025-0.059 µg/l in just four of the 14 perceived higher-risk sites that were sampled, and not at any of the 5 control sites. In session 3, PFOA was only detected in one sample from the control number 4 site at 0.026 µg/l. Finally, in session 4, PFOA was not detected at any of the control sites and was only detected in one sample from one perceived higher-risk site at 0.053 µg/l (site 15). All measured levels (except one sample from session 1 at 0.370 µg/l in the control number 4 site) are below the current DWI English and Welsh drinking water guidance levels. This result would trigger Tier 1 minimum action if the guidance had been in place when this result was obtained (Table 2.1).
It may be that the presence of PFOA in water is transient and detectable in some seasons, but not others, or there may be some local use leading to contamination at that time. However, it appears that the occurrence of positive levels in the first sampling session with less in subsequent sessions suggests some anomalies in the analysis of samples, although this is hard to identify from the validation process.
In session 2, PFOA was detected at site 10, an unconfined aquifer near a carpet factory, and site 13, also an unconfined aquifer, with an airport that is known to have operated fire training procedures. It was also detected at sites 16 and 19. Site 16 is a site influenced by a large international airport and is a combined surface and groundwater source where the groundwater originates from an unconfined aquifer, while site 19 is an unconfined groundwater that is at risk from a nearby airport. In session 3, PFOA was detected at one control site (number 4), which extracts water from a lowland surface water. The site where PFOA was detected in session 4 was site 15, close to the Buncefield site, where unknown quantities of PFOS-containing fire-fighting foams were used following a large oil fire in December 2005, and is an unconfined groundwater. Although PFOA was not detected at three of the sites where PFOS had been detected (sites 8, 9 and 15), it was detected at site 16. PFOA is not known to be present in fire-fighting foams.
No trends are evident relating to the type of perceived higher-risk, or the type of source water, treatment or chlorination method. Nor is it clear that concentrations decrease following treatment, or as time progresses.
Good correlation between the duplicate samples was achieved, providing confidence in the reproducibility of the method.

DEFRA
WRc Ref: DEFRA 7585/14612-0 February 2008
53
7. RECENT ENGLISH AND WELSH MONITORING DATA SINCE LITERATURE REVIEW
7.1 Water Company Monitoring Data
In December 2006, samples were taken by the Environment Agency from the drainage system at an airbase following a fire-fighting practice that had taken place two months previously. Whilst it is not known if any link exists between the airbase itself and the source aquifer, the drainage system contained run-off water, including fire-fighting foam, and this water was found to contain PFOS.
Immediately adjacent to the airbase is a water treatment works operated by a water company. Groundwater is abstracted from a shallow chalk aquifer via a single borehole at the site. The borehole is hydraulically downstream of the airbase, and water is treated by forced draft aeration, followed by GAC adsorption, orthophosphoric acid dosing and disinfection. The GAC used at the site is Chemviron F400 grade, and the site is designed to give an empty bed contact time (EBCT) of 30 minutes. The final water is blended with a number of other local-derived groundwater sources within the supply system before being supplied to the public. No perfluorinated chemicals were detected in final drinking water after blending.
Regular monitoring of the raw, GAC-treated and final water at the site has been ongoing since December 2006 (see Figure 7.1). The regeneration frequency of the five GAC adsorbers at the site was reviewed and was increased in response to the detection of perfluorinated compounds in the raw water. Breakthrough was found to occur at between approximately 6 to 8 months depending on the substance. PFCA6 breaks through first at approximately 6 months from regeneration, followed by PFOA at about 8 months. The treated water data in Figure 7.1 are for the mixed water from the five GAC beds.
The results show good removal of perfluorinated compounds through GAC treatment, indicating that this is an effective control measure. All final water samples taken from the site have contained <0.2 µg/l PFOS and <0.25 µg/l PFOA. The data being generated from the intense monitoring at the site will inform the regeneration frequency moving forward for the GAC and consideration as to whether any additional control measures are required.
Samples from this site have also been sent to a Canadian laboratory to assess the effects of treatment with UV and peroxide. However, neither appeared to have any impact on PFOS or PFOA levels, in contrast to some literature reports.
The water company involved has carried out sample surveys across all of its raw surface water and groundwater sources. All samples have been below the limits of detection, with the exception of two groundwater sources. One of these is hydraulically downstream of a commercial airport (6-2 PTOH has regularly been detected there and PFCA6 has occasionally been detected there at unspecified levels), and the other is close to a fire station in an urban location (PFOS, PFOA and PFCA6 have occasionally been detected at unspecified levels).
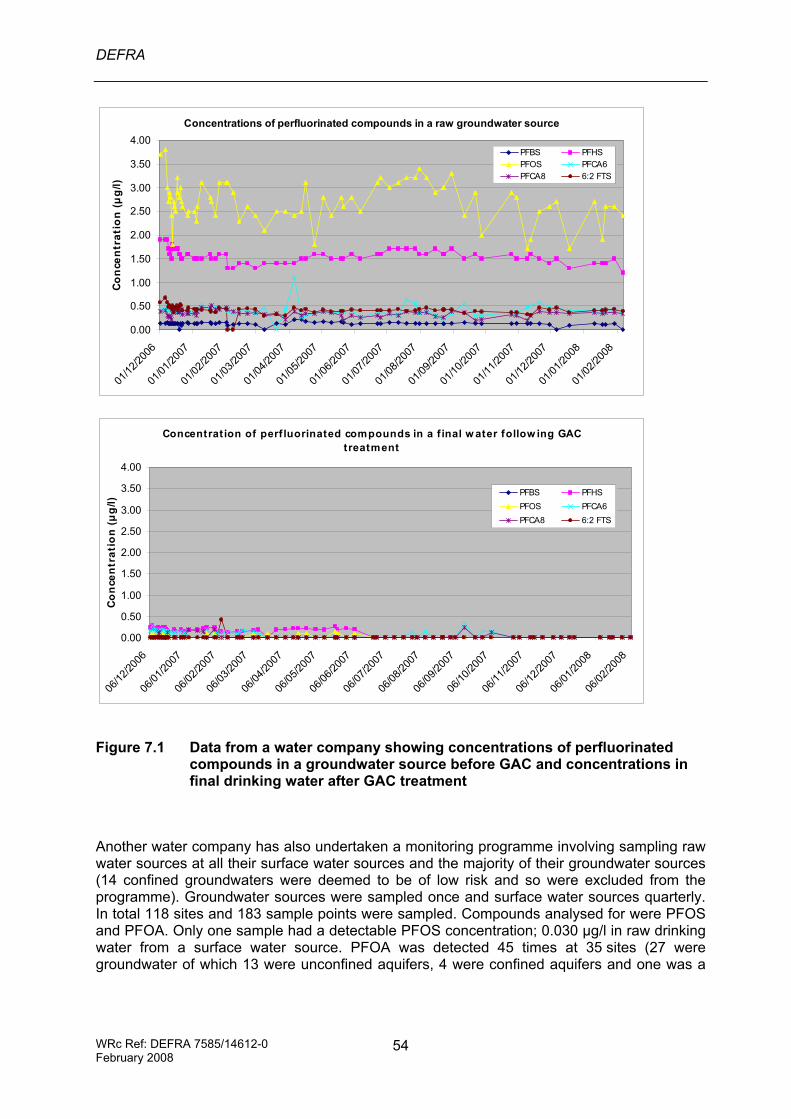
DEFRA
WRc Ref: DEFRA 7585/14612-0 February 2008
54
Concentrations of perfluorinated compounds in a raw groundwater source
0.00
0.50
1.00
1.50
2.00
2.50
3.00
3.50
4.00
01/12
/2006
01/01
/2007
01/02
/2007
01/03
/2007
01/04
/2007
01/05
/2007
01/06
/2007
01/07
/2007
01/08
/2007
01/09
/2007
01/10
/2007
01/11
/2007
01/12
/2007
01/01
/2008
01/02
/2008
Conc
entr
atio
n (µ
g/l)
PFBS PFHSPFOS PFCA6PFCA8 6:2 FTS
Concentrat ion of perf luorinated compounds in a f inal w ater follow ing GAC treatment
0.00
0.50
1.00
1.50
2.00
2.50
3.00
3.50
4.00
06/12
/2006
06/01
/2007
06/02
/2007
06/03
/2007
06/04
/2007
06/05
/2007
06/06
/2007
06/07
/2007
06/08
/2007
06/09
/2007
06/10
/2007
06/11
/2007
06/12
/2007
06/01
/2008
06/02
/2008
Con
cent
rati
on
(µg/
l)
PFBS PFHSPFOS PFCA6PFCA8 6:2 FTS
Figure 7.1 Data from a water company showing concentrations of perfluorinated compounds in a groundwater source before GAC and concentrations in final drinking water after GAC treatment
Another water company has also undertaken a monitoring programme involving sampling raw water sources at all their surface water sources and the majority of their groundwater sources (14 confined groundwaters were deemed to be of low risk and so were excluded from the programme). Groundwater sources were sampled once and surface water sources quarterly. In total 118 sites and 183 sample points were sampled. Compounds analysed for were PFOS and PFOA. Only one sample had a detectable PFOS concentration; 0.030 µg/l in raw drinking water from a surface water source. PFOA was detected 45 times at 35 sites (27 were groundwater of which 13 were unconfined aquifers, 4 were confined aquifers and one was a
DEFRA
WRc Ref: DEFRA 7585/14612-0 February 2008
55
mixture of an unconfined and a confined aquifer (it is not known whether the remaining 9 groundwater sites are confined or unconfined), and 8 were surface water), with a maximum concentration of 0.089 µg/l, a minimum of 0.025 µg/l and an average of 0.048 µg/l.
Ongoing sampling of the River Thames has shown low level concentrations of PFOS in the raw water samples, however, PFOS has not been detected in any of the treated (drinking) water samples. A general monitoring programme is not being undertaken as there are some concerns over the analytical method and the risk is considered to be low.
A further company is monitoring at one of their sites to determine the effectiveness of GAC. The site is currently off-line (i.e. not producing drinking water) due to concerns over risks to the quality of the source water. The effectiveness of GAC is also being investigated at one further site, including the possibility of using a different type of carbon in the filter.
7.2 Environment Agency
During 2006-2007, the EA monitored the levels of PFOS and other perfluorinated chemicals at selected sites form their surface and groundwater network. All samples were from untreated waters and effluents (EA, 2007).
Perfluorinated chemicals were detected at 26% (57/219) of the groundwater sites, with approximately 14% detecting PFOS. At the few sites where they were well above the level of detection (0.1 µg/l, including PFOS above 3.0 µg/l), repeat sampling did not duplicate the results.
Sampling of untreated surface water near drinking water abstraction points, indicated that the presence of perfluorinated chemicals at very low concentrations was widespread at these sites (52%, 22/42), but in only 18% of the samples taken (31/172). At the one site with high PFOS levels (>3 µg/l), subsequent sampling showed a low concentration (0.5 µg/l), with a further nine samples taken from the site containing no detectable PFOS.
In targeted monitoring of rivers and effluents, perfluorinated chemicals were detected in 67% of sites (26/39), and in 32% of samples with one sample being above the long term Predicted No Effect Concentration (PNEC) for aquatic life of 25 µg/l. Overall PFOS was detected in fewer than 8% of samples. There was also some indication of anomalous results with high levels being detected at a few sites, but subsequent sampling showing undetectable levels.
A report entitled ‘Incidence and attenuation of perfluorinated surfactants in groundwater’ is being produced by the EA, of which the draft is due to be released in the spring of 2008. It is also understood that the Environment Agency intend carrying out further monitoring in 2008. The sampling strategy for 2008 will analyse for a wider range of substances including PFBS. Some of the surface water sampling has also been continued from that done during 2006-7.

DEFRA
WRc Ref: DEFRA 7585/14612-0 February 2008
56

DEFRA
WRc Ref: DEFRA 7585/14612-0 February 2008
57
8. CONCLUSIONS
8.1 Method
The method used for the analysis proved to be robust; not only had it gone through the method validation phase of its development, but also various duplicates taken showed similar concentrations for both PFOS and PFOA. The method also performed well in both the Aquacheck Laboratory comparison and the more informal General Laboratory Comparison. The sampling technique was deemed appropriate due to all field blanks taken being below the LODs for both PFOS and PFOA. The LODs for PFOS (0.011 µg/l) and PFOA (0.024 µg/l) meant that these compounds could be detected at lower levels than previously reported. However, the possibility of anomalies in the detection of PFOA in the early monitoring session cannot be ruled out. Such anomalies have been observed in other studies.
8.2 Monitoring Survey
PFOS
From the data available, it appears that PFOS is not a widespread background contaminant of raw and treated drinking water in England even at very low concentrations, unless the area has been affected by a specific incident (e.g. the release of fire fighting foams containing PFOS) or is influenced by local conditions, such as airfields. The four sites where PFOS was detected all use groundwater that originates from unconfined aquifers. However, concentrations in the waters at these sites are still very low and below the current DWI English and Welsh drinking water guidance levels. From the limited data, no apparent trends exist in relation to the type of treatment, the type of perceived higher-risk or the method of chlorination. Additionally, the treatments involved did not show any obvious signs of being able to remove PFOS. However, the GAC present at two of the affected sites have not been regenerated for several years. There was also no significant seasonal effect; concentrations from the four sites where PFOS was detected show a consistent pattern throughout the four sampling rounds.
PFOA
Although the PFOS data are consistent, the same is not true of PFOA. Each of the sampling sessions provided a different pattern of detection. The first showed low concentrations of PFOA at nearly every site; in the second session, PFOA was detected at low concentrations at only four perceived higher-risk sites; PFOA was detected in only one sample from 1 control site in the third session; and in the last session, PFOA was only detected in one sample from one perceived higher-risk site. It could be that there is some very low level PFOA contamination, which may be seasonally affected. However, the fact that more positive results are seen in the early sampling may indicate that the results are anomalous, although how this occurred is unclear as the method was fully validated and field blanks negative. However, PFOA does not appear to be a consistent background contaminant of raw and treated drinking waters in England, and no apparent trends exist in relation to the type of treatment, the type of perceived risk, or the method of chlorination. Treatment did not seem to show any effect on the removal of PFOA. If session 1 results are anomalous, all other sites where PFOA were

DEFRA
WRc Ref: DEFRA 7585/14612-0 February 2008
58
detected sourced groundwater from unconfined aquifers (except one, which is a lowland surface water).
There appeared to be no direct relationship between PFOS and PFOA concentrations indicating that the presence of PFOS in raw or treated drinking water sources does not mean that PFOA is also present (and vice-versa).
Attempts have been made to ascertain whether the airfields located near to the sites used in this study undergo fire-fighting training, and if they do, whether PFOS-containing have or are being used. However, no contact was achieved, and so for the majority of these sites, this is unknown.
8.3 Other Recent Monitoring
It is clear that increased monitoring from water companies and the Environment Agency has occurred since this research was initiated and will be continued into 2008. As more monitoring results become available, results should ideally be considered in conjunction with the results presented here to provide further evidence for the prelevance (or otherwise) of PFOS. Continued monitoring should also provide greater clarity on the situation for PFOA. Data on the water treatment of the waters involved will provide further information in the removal of these compounds, specifically the proficiency of GAC. Regarding monitoring of other perfluorinated compounds, some water companies are considering these, but the knowledge of need for monitoring is restricted by the limited amount of information indicating the toxicological profile of these substances.

DEFRA
WRc Ref: DEFRA 7585/14612-0 February 2008
59
9. RECOMMENDATIONS
Following completion of this project, the following recommendations are proposed:
• To review the ongoing monitoring of PFOS, PFOA and PFOSA being undertaken by the Water Companies and other National Bodies.
It is apparent that several Water Companies, as well as the Environment Agency in England and Wales, are undertaking continual monitoring of PFOS, PFOA and related compounds. To ensure the proposed DWI guidance levels are relevant to the current situation it would be of benefit to maintain an awareness of this monitoring and the possible presence of these compounds in UK waters.
• To ensure transparent communication between all interested parties is maintained.
In light of the widespread ongoing monitoring by a number of organisations mentioned above, it is necessary to ensure all parties uphold good communication links not only to ensure that duplication of efforts is avoided, but again, to ensure that all involved are aware of the current situation and that any potential issues are foreseen ahead of time and can be dealt with in an appropriate manner. It is recommended that the continuation of the existing arrangements to share information between the Drinking Water Inspectorate, the Environment Agency and representatives of the water industry are continued.
• To monitor the use, toxicology and occurrence of other perfluorinated compounds, which may become compounds of concern in the future.
As the use of PFOS is declining, the use of PFOA and other perfluorinated compounds is increasing. As these newer compounds become increasingly used, it may become appropriate to monitor toxicological information as it becomes available to avoid risks to human health in the future. It may also be appropriate to consider the initiation of monitoring surveys for these newer compounds in raw and treated drinking waters in the UK.
• To further investigate the removal of PFOS and other perfluorinated compounds.
While it appears that PFOS is not present as a general contaminant in the environment, its persistent and increasing replacement by other perfluorinated compounds indicates that it is essential that technologies are in place for adequate removal to be achieved for the production of final drinking water. This would ensure the DWI guidance levels are adhered to, and the wholesomeness of treated drinking water and the protection of human health.

DEFRA
WRc Ref: DEFRA 7585/14612-0 February 2008
60

DEFRA
WRc Ref: DEFRA 7585/14612-0 February 2008
61
REFERENCES
Aquacheck (2007a). Aquacheck Special Distribution Report. SD56 – PFOS and PFOA. Samples distributed September 2007.
Aquacheck (2007b). Aquacheck Proficiency Scheme. Scheme Description 2007-8. Issue 1.
EA (2007). Investigation of PFOS and other perfluorochemicals in groundwater and surface water in England and Wales. Environment Agency, September, 2007, Bristol.

DEFRA
WRc Ref: DEFRA 7585/14612-0 February 2008
62

DEFRA
WRc Ref: DEFRA 7585/14612-0 February 2008
63
APPENDIX A SITE PROFILES
Site 1 Site Type: Control. Water Type: Lowland surface water. Treatment: Slow sand filtration, chlorination using chlorine gas. Any work at plant (i.e. any changes to design/operation): No. Water Information: Impounding reservoir water (considered good quality). Site 2 Site Type: Control. Water Type: Groundwater. Treatment: Chlorination by gas (marginal). Any work at plant (i.e. any changes to design/operation): No Water Information: It is in the same geological strata as site 19, but it is a few valleys away, so it is not influenced by surface contamination in the same way as site 19 is. Crypto risk assessment - low risk; Lithology 1 - middle / lower chalk, Lithology 2 - upper greensand; unconfined aquifer. Site 3 Site Type: Control. Water Type: Upland surface water. Treatment: Rapid gravity filters, chlorination by gas. Any work at plant (i.e. any changes to design/operation): A second stage of filtration was recently added in the form of four manganese contactors (filters) and ancillary plant. By constructing a new manganese removal stage downstream of the rapid gravity filters (RGFs) and enhancing manganese removal, it has been possible to change the coagulant from aluminium sulphate to ferric sulphate and thereby enhance solids and colour removal by the clarifiers and the RGF’s. The RGF’s will then be dedicated to residual solids and iron removal and the new manganese contactors will be pre-dosed with chlorine and pH adjusted to a point where manganese will be precipitated and removed by the contactors. Water Information: Water is derived from two upland impounding reservoirs. Site 4 Site Type: Control. Water Type: Lowland surface water. Treatment: Primary filters, GAC, slow sand filtration, aeration to increase dissolved oxygen (DO) following degradation in slow sand stage, chlorination using chlorine gas, followed by ammonium sulphate addition to produce chloramine. GAC Details: Blending of the pre GAC water: it is supplied by two reservoirs, which are currently operating at an 80:20 ratio (ideally would be 50:50, but vary due to algal concentrations). Number of adsorbers: 4 (note that these are used as roughing filters upstream of the slow sand filters at the site. Regeneration regime (staggered/done all at the same time): each filter is regenerated annually, and the programme is staggered throughout
DEFRA
WRc Ref: DEFRA 7585/14612-0 February 2008
64
the year. Ages of beds: dates that each was last regenerated are Filter 1 – 08.12.06, Filter 2 – 08.09.06, Filter 3 – 23.01.06 & 23.02.07, Filter 4 – 04.04.06 & 12.06.07. Any work at plant (i.e. any changes to design/operation): No. Water Information: It is classed as low risk, with nothing significant in catchment. Both the reservoirs that supply it are naturally filled from streams. Site 5 Site Type: Control. Water Type: Groundwater. Treatment: Iron/manganese removal, chlorination using chlorine gas. Any work at plant (i.e. any changes to design/operation): No. Water Information: It is classed as low risk, greensand (aquifer type) groundwater. It is on the Confined Lower Greensand aquifer, and is classified as low risk for crypto/bacti (AW scoring classification – crypto risk assessment is low risk). Site 6 Site Type: High risk. Risk: Industrial & electroplating processes. Water Type: Groundwater. Treatment: Air stripping to remove volatile organics from the raw water (has industrial solvent contamination), chlorination using chlorine gas. Any work at plant (i.e. any changes to design/operation): An ion exchange nitrate removal plant is being installed. This is due to enter supply late in 2008. Water Information: Two set of boreholes supply this site. The first set is on the semi-confined chalk aquifer, and are classified as medium risk for crypto/bacti (AW scoring classification – crypto risk assessment is low risk). The second set of boreholes is on the confined chalk aquifer, and are classified as low risk for crypto/bacti (AW scoring classification – crypto risk assessment is low risk). Site 7 Site Type: High risk. Risk: Airfield. Airfield Activity: Nothing specific is known, but it is assumed that training tests as part of their emergency planning work must be carried out. Water Type: Groundwater. Treatment: Chlorination using chlorine gas, but water is high in nitrate so it is blended with other sources at another reservoir. Any work at plant (i.e. any changes to design/operation): No. Water Information: Two sets of boreholes supply this site. The first set are on the semi-confined chalk aquifer and are classified as medium risk for crypto/bacti (AW scoring classification – crypto risk assessment is low risk). The second set of boreholes are on the unconfined chalk aquifer and are also classified as medium risk for crypto/bacti (AW scoring classification – crypto risk assessment is low risk).

DEFRA
WRc Ref: DEFRA 7585/14612-0 February 2008
65
Site 8 Site Type: High risk. Risk: Industrial and an international airfield. Airfield Activity: The airport is a large regional airport, they do fire training and have used foams, but not sure of sort. Water Type: Groundwater. Treatment: Ultra filtration membranes and chlorination using chlorine gas. Any work at plant (i.e. any changes to design/operation): No. Water Information: The source is deemed to be high risk for contamination by Cryptosporidium and other parameters arising from diffuse pollution, and is unconfined. Site 9 Site Type: High risk. Risk: On an airfield. Airfield Activity: Unknown. Water Type: Groundwater. Treatment: None at this site; water is pumped to another site for treatment, which has GAC (due to atrazine removal, which is evidence of the airfield affecting the source). This other site has GAC, super chlorination (high dose for a short contact time) using chlorine gas and dechlorination. GAC Details: GAC is not currently in use as the contaminant is <MAC. The blending of pre-GAC water is 100% from the initial site, there are 4 adsorbers at the other site, and the regeneration regime is 50:50. The GAC has not been in operation at any of the sampling periods. Any work at plant (i.e. any changes to design/operation): No. Water Information: Water from this site is the source water; there is no production at the other site, only treatment. It is an unconfined chalk aquifer, so not considered to be high crypto risk. GAC at the other site was originally installed for tetrachloroethylene removal (but more recently they had had problems with atrazine) from the nearby airfield. Site 10 Site Type: High risk. Risk: Nearby fire in carpet warehouse, site is behind car park of warehouse. Did the carpet factory use perfluorinated products: Carpet warehouse fire – PFOS expected to have been used on at least some of the carpets. Water Type: Groundwater. Treatment: Chlorination using sodium hypochlorite. Any work at plant (i.e. any changes to design/operation): No. Water Information: There are four chalk boreholes on the site. No crypto risk, aquifer is unconfined chalk, but overlain with ‘puggy’ chalk.
DEFRA
WRc Ref: DEFRA 7585/14612-0 February 2008
66
Site 11 Site Type: High risk. Risk: Airport nearby and strongly influenced by large sewage effluent discharge from treatment works, which is just upstream of the abstraction point. Airfield Activity: Unknown. Water Type: Surface water. Treatment: Rake screens, drum screen, bankside storage for 4-5 days*, pH correction for PAC dosing, initial chlorination, clarification*, filtration through the GAC* and final chlorination*. (Samples taken from *). Chlorination (with gas) by super and dechlorination. GAC Details: Blending of the pre GAC water: N/A. Number of adsorbers: 6 (converted RGFs). Regeneration regime (staggered/done all at the same time): 2 changed every 3 years – i.e. each changed every 3 years. Ages of beds during the periods over which the PFOS/PFOA samples were taken: The 2 that get regenerated are done around October each year so 2 beds will be about 6 months old, 2 will be about 18 months and 2 about 30 months old. Any work at plant (i.e. any changes to design/operation): Installation of a membrane filter that went into supply on May 28th 2007. Water Information: It is a chalk spring derived river, which is flashy when heavy rain affects it. It is approximately 3 km downstream of a sewage works from which it gets the majority of its organic content. Site 12 Site Type: High risk. Risk: Influenced by local tip, found flame retardants in water (TCEP and TCPP). Water Type: Groundwater. Treatment: Chlorination (with gas) by super and dechlorination. Any work at plant (i.e. any changes to design/operation): No. Water Information: It is in a chalk aquifer that is not a crypto risk and occasionally it will breach the nitrate limit approximately 1 month after the peak ground water level in the spring. Other parameters are what you might expect from a chalky supply. It is confined. Site 13 Site Type: High risk. Risk: Airport. Airfield Activity: In the past (might still be used now) there was a training centre at the base for fire fighting operations and would possibly have had PFOS foams in use. Water Type: Groundwater. Treatment: Nitrate removal (ion exchange), chlorination by gas and phosphate dosing. Any work at plant (i.e. any changes to design/operation): No Water Information: A groundwater source with an extensive adit that runs beneath the airport runway. It was a military airport with some commercial use. There may have been a training centre at the base for fire fighting operations, which would possibly have had PFOS foams in use in the past, it is unknown if this is still in operation. It is known that operations on site do affect the water quality, as an incident of diuron was found at the source, which was traced back to spraying operations at the airport. The aquifer is chalk and unconfined. The area is a nitrate vulnerable zone with intensive arable farming (cereals, brassicas and potatoes mostly).

DEFRA
WRc Ref: DEFRA 7585/14612-0 February 2008
67
Site 14 Site Type: High risk. Risk: Airfield nearby. Airfield Activity: In June 2007, fire fighting foam was released into the nearby river, so the current foam used is one that does not contain PFOS. But foam is stored on site, so historical foams could have contained PFOS. Water Type: Groundwater. Treatment: Chlorination using chlorine gas. Any work at plant (i.e. any changes to design/operation): Unlikely. Water Information: A shallow spring source within the Great Oolite Jurassic limestone typical of the area. The spring is heavily fractured and considered a high crypto risk. The airfield is underplayed by Oxford clay so movement of water from this area to the spring is thought unlikely. Site 15 Site Type: High risk. Risk: Large use of PFOS-containing fire-fighting foams at large oil fire at Buncefield in December 2005. Water Type: Groundwater. Treatment: GAC and chlorination – on site electrolyte generation using food grade salt stored in HDPE. GAC Details: Blending of the pre-GAC water is from up to 4 borehole sources prior to entry into the two banks of GAC contactors. Flow is up to 21 Mld. There are twelve 18 m³ pressurised contactors, divided into two banks of 6. Regeneration regime: contactors were installed for pesticide removal. Operational experience is that the contactors are mature and act as biological reactors, effectively destroying the uron pesticides within the beds. As such there has as yet been no need to change or regenerate the carbon. If replacement is considered then this will have to be done in a staggered way as they cannot be taken out of service for any length of time. The beds have not been regenerated for some years. Any work at plant (i.e. any changes to design/operation): No significant work other than changes to the contact tank covers. Water Information: The water is abstracted from an unconfined chalk aquifer overlaid with river gravel deposits. Boreholes are cased to the chalk and do not abstract from the gravels. Site 16 Site Type: High risk. Risk: Airport. Airfield Activity: Unknown, although it would be surprising if there wasn’t any training undertaken somewhere on site. Water Type: Surface water and groundwater. Blending ratio: This varies, generally there is more GW than SW, typically GW:SW = 30:20. Treatment: Slow sand filtration, ozone, GAC and chlorination using sodium hypochlorite. GAC Details: Blending of pre-GAC water: This varies, generally there is more GW than Surface. Typically GW:SW = 30:20. There are 6 adsorbers. The GAC adsorbers are for pesticide control, Very careful monitoring has shown that the pesticide levels in the water to the GAC are now low (well below 0.1 µg/l) and therefore no regeneration has been undertaken for several years.

DEFRA
WRc Ref: DEFRA 7585/14612-0 February 2008
68
Any work at plant (i.e. any changes to design/operation): New boreholes were under construction in March 2007. Water Information: The surface water is stored typically for two weeks (always over 7 days) so therefore the water treatment works is classified as “not at risk” in relation to crypto from this source. The GW aquifer is an unconfined gravel one. Site 17 Site Type: High risk. Risk: Adjacent (0.5 km) to an airfield, and around 7 km east of another airport fire training facility. Airfield Activity: Unknown. Water Type: Groundwater. Treatment: This borehole feeds into another WTW, which has coagulation, DAF (dissolved air flotation) and 2 stages of filtration, plus disinfection. Any work at plant (i.e. any changes to design/operation): None. Water Information: The geology of the area comprises approximately 8-10 metres of Boulder Clay overlying Triassic Sandstone (Wilmslow Sandstone and Chester Pebble Beds). The Wilmslow Sandstone is a weakly-cemented fine-grained sandstone. There are two main geological faults that cross the area The first trends north-south and is located 100 metres west of the site. The second is 1200 metres west of the site Both of these probably have negligible effect on groundwater flow because of the continuity of sandstone across the faults. The site is deemed not to be at risk from crypto and for all practical purposes it is confined. Site 18 Site Type: High risk. Risk: About 1 km north of an airfield, which is now closed. Airfield Activity: The airfield opened in 1939 and it is likely that fire training was carried out, but no details are known. Water Type: Groundwater. Treatment: Chlorination using sodium hypochlorite. Any work at plant (i.e. any changes to design/operation): None. Water Information: The site consists of five boreholes, three of which are linked by an adit. Two of the BHs are in production. The geology of the site comprises approximately 18 metres of Glacial Drift (clay, clay and sandstone) overlying the Wilmslow Sandstone - part of the Sherwood Sandstone aquifer. Daily output is approximately 8 ML/d. Forest Farm is deemed not to be at risk from crypto and it is confined. Site 19 Site Type: High risk. Risk: Airfield. Airfield Activity: Unknown. Water Type: Groundwater. Treatment: Air stripping (soon to be replaced by GAC). Up to September there was aeration in place to remove carbon tetrachloride. This now replaced with GAC. Chlorination is by gas. GAC Details: No GAC at present.

DEFRA
WRc Ref: DEFRA 7585/14612-0 February 2008
69
Any work at plant (i.e. any changes to design/operation): GAC installation was September 2007. Water Information: It is in the same geological strata as site 2, but a few valleys away, and is influenced by surface contamination. It is unconfined. Site 20 Site Type: High risk. Risk: Airfield. Airfield Activity: Training for fire fighting, etc. is likely, although no details are known. Water Type: Groundwater. Treatment: Chlorination using chlorine gas, mono sodium phosphate addition, mixing, final chlorination. Any work at plant (i.e. any changes to design/operation): No. Water Information: Airfield is close to groundwater source protection zone. Aquifer is unconfined Sherwood sandstone. The water table at the airport is approximately 5 m below ground level.

DEFRA
WRc Ref: DEFRA 7585/14612-0 February 2008
70

DEFRA
WRc Ref: DEFRA 7585/14612-0 February 2008
71
APPENDIX B CHROMATOGRAM OF A STANDARD SOLUTION IN METHANOL (MULTIPLE REACTION MONITORING MODE)
TIC of -MRM (3 pairs): Exp 1, from Sample 1 (cal 1) of R0881.wiff (Turbo Spray) Max. 9.6e6 cps.
1 2 3 4 5 6 7 8 9 10 11 12 13 14 15Time, min
0.0
2.0e6
4.0e6
6.0e6
8.0e6
9.6e6 6.94
6.78
6.61
Perfluorooctanesulphonate (PFOS)
TIC of -MRM (3 pairs): Exp 2, from Sample 1 (cal 1) of R0881.wiff (Turbo Spray) Max. 1.4e7 cps.
1 2 3 4 5 6 7 8 9 10 11 12 13 14 15Time, min
0.0
5.0e6
1.0e7
1.4e7 5.82
1.59
Perfluorooctanoic acid (PFOA)
TIC of -MRM (3 pairs): Exp 3, from Sample 1 (cal 1) of R0881.wiff (Turbo Spray) Max. 5.5e6 cps.
1 2 3 4 5 6 7 8 9 10 11 12 13 14 15Time, min
0.0
1.0e6
2.0e6
3.0e6
4.0e6
5.0e66.94
6.78 9.91
9.69
Perfluorooctanesulphonamide (PFOSA)

DEFRA
WRc Ref: DEFRA 7585/14612-0 February 2008
72

DEFRA
WRc Ref: DEFRA 7585/14612-0 February 2008
73
APPENDIX C ANALYTICAL PERFORMANCE TESTING
Perfluorinated compounds (PFC) validation using API5000 LCMSMS.
Annex B1: PFC in Drinking Water and River Water (Blank/Unspiked)
PFC in Drinking Water PFC in River Water
Concentration
(ng/l) Concentration (ng/l)
Sample Name PFOS PFOA Sample Name PFOS PFOA
Drinking Water unspiked River Water unspiked
Batch 1 DWA 0.59 0.89 Batch 1 RWA 4.65 1.64
Batch 1 DWB 0.21 4.36 Batch 1 RWB 3.94 5.50
Batch 2 DWA 0.41 0.67 Batch 2 RWA 4.27 4.07
Batch 2 DWB 0.43 0.88 Batch 2 RWB 4.24 4.03
Batch 3 DWA 0.18 6.44 Batch 3 RWA 4.22 2.82
Batch 3 DWB 0.00 4.66 Batch 3 RWB 4.45 3.82
Batch 4 DWA 0.17 2.90 Batch 4 RWA 4.62 2.65
Batch 4 DWB 0.51 1.05 Batch 4 RWB 4.91 5.85
Batch 5 DWA 0.03 3.16 Batch 5 RWA 4.44 2.44
Batch 5 DWB 0.02 3.00 Batch 5 RWB 4.11 3.96
Batch 6 DWA 0.52 0.67 Batch 6 RWA 5.16 4.21
Batch 6 DWB 0.16 3.04 Batch 6 RWB 4.25 5.17
Average 0.27 2.64 Average 4.44 3.85
Total Standard Deviation
0.21 1.87 Total Standard Deviation
0.35 1.28

DEFRA
WRc Ref: DEFRA 7585/14612-0 February 2008
74
APPENDIX C2 PFC IN DRINKING WATER AND RIVER WATER (LOW LEVEL)
PFC in Drinking Water PFC in River Water
Concentration
(ng/l) Concentration
(ng/l)
Sample Name PFOS PFOA Sample Name PFOS PFOA
Drinking Water + 20 ng/l spike River Water + 20 ng/l spike
Batch 1 DWLSA 25.2 26.6 Batch 1 RWLSA 28.4 32.9
Batch 1 DWLSB 24.2 25.7 Batch 1 RWLSB 25.2 20.9
Batch 2 DWLSA 20.6 24.8 Batch 2 RWLSA 29.9 24.8
Batch 2 DWLSB 21.6 33.0 Batch 2 RWLSB 30.7 29.2
Batch 3 DWLSA 23.4 34.9 Batch 3 RWLSA 25.5 37.8
Batch 3 DWLSB 25.1 27.4 Batch 3 RWLSB 29.3 32.7
Batch 4 DWLSA 21.1 32.4 Batch 4 RWLSA 27.0 33.0
Batch 4 DWLSB 22.7 31.8 Batch 4 RWLSB 28.1 27.2
Batch 5 DWLSA 23.3 24.7 Batch 5 RWLSA 26.3 29.3
Batch 5 DWLSB 26.6 35.2 Batch 5 RWLSB 26.3 27.1
Batch 6 DWLSA 21.8 30.5 Batch 6 RWLSA 27.4 32.5
Batch 6 DWLSB 25.3 25.2 Batch 6 RWLSB 32.2 26.9
Average 23.4 29.3 Average 28.0 29.5
Total Standard Deviation 1.91 4.04 Total Standard Deviation 2.17 4.53
%RSD 8.2% 13.8% %RSD 7.7% 15.3%
% Recovery 115.7% 133.5% % Recovery 117.9% 128.4%
LOD 8.1 23.9 LOD 10.4 23.7

DEFRA
WRc Ref: DEFRA 7585/14612-0 February 2008
75
APPENDIX C3 PFC IN DRINKING WATER AND RIVER WATER (HIGH LEVEL)
PFC in Drinking Water PFC in River Water
Concentration
(ng/l) Concentration
(ng/l)
Sample Name PFOS PFOA Sample Name PFOS PFOA
Drinking Water + 1000 ng/l spike River Water + 1000 ng/l spike
Batch 1 DWHSA 976 988 Batch 1 RWHSA 934 1060
Batch 1 DWHSB 921 1128 Batch 1 RWHSB 962 1120
Batch 2 DWHSA 903 1107 Batch 2 RWHSA 878 1116
Batch 2 DWHSB 872 1147 Batch 2 RWHSB 934 1046
Batch 3 DWHSA 981 1094 Batch 3 RWHSA 938 1089
Batch 3 DWHSB 951 1104 Batch 3 RWHSB 922 1029
Batch 4 DWHSA 895 1040 Batch 4 RWHSA 826 1074
Batch 4 DWHSB 812 1130 Batch 4 RWHSB 805 1134
Batch 5 DWHSA 960 1050 Batch 5 RWHSA 950 1150
Batch 5 DWHSB 958 1210 Batch 5 RWHSB 1011 1180
Batch 6 DWHSA 877 1160 Batch 6 RWHSA 953 1140
Batch 6 DWHSB 938 1140 Batch 6 RWHSB 905 1110
Average 920 1108 Average 918 1104
Total Standard Deviation 50.3 59.6 Total Standard Deviation 58.0 45.3
%RSD 5.5% 5.4% %RSD 6.3% 4.1%
% Recovery 92.0% 110.6% % Recovery 91.8% 110.4%

DEFRA
WRc Ref: DEFRA 7585/14612-0 February 2008
76
APPENDIX C4 PERFORMANCE TEST DATA : PFOS USING TAP WATER SPIKES (20 ng/l)
Batch Concentration Batch Mean
Result Estimate of within-batch
SD
Estimate of within-batch
variance
1 25.200 24.7 0.70711 0.50000
24.200
2 20.600 21.1 0.70711 0.50000
21.600
3 23.400 24.25 1.20208 1.44500
25.100
4 21.100 21.9 1.13137 1.28000
22.700
5 23.300 24.95 2.33345 5.44500
26.600
6 21.800 23.55 2.47487 6.12500
25.300
Mean 23.4083
M1 8.5859
M0 2.5492
F Value Observed 3.3681
Sw 1.5966
Sb 1.7374
St 3.1401
Rel SD(St) 0.1341
Limit of Detection 8.1

DEFRA
WRc Ref: DEFRA 7585/14612-0 February 2008
77
APPENDIX C5 PERFORMANCE TEST DATA : PFOA USING TAP WATER SPIKES (20 ng/l)
Batch Concentration Batch Mean Result
Estimate of within-batch
SD
Estimate of within-batch
variance
1 26.600 26.15 0.63640 0.40500
25.700
2 24.800 28.9 5.79828 33.62000
33.000
3 34.900 31.15 5.30330 28.12500
27.400
4 32.400 32.1 0.42426 0.18000
31.800
5 24.700 29.95 7.42462 55.12500
35.200
6 30.500 27.85 3.74767 14.04500
25.200
Mean 29.3500
M1 94.7778
M0 21.9167
F Value Observed 4.3245
Sw 4.6815
Sb 6.0358
St 10.2828
Rel SD(St) 0.3504
Limit of Detection 23.9
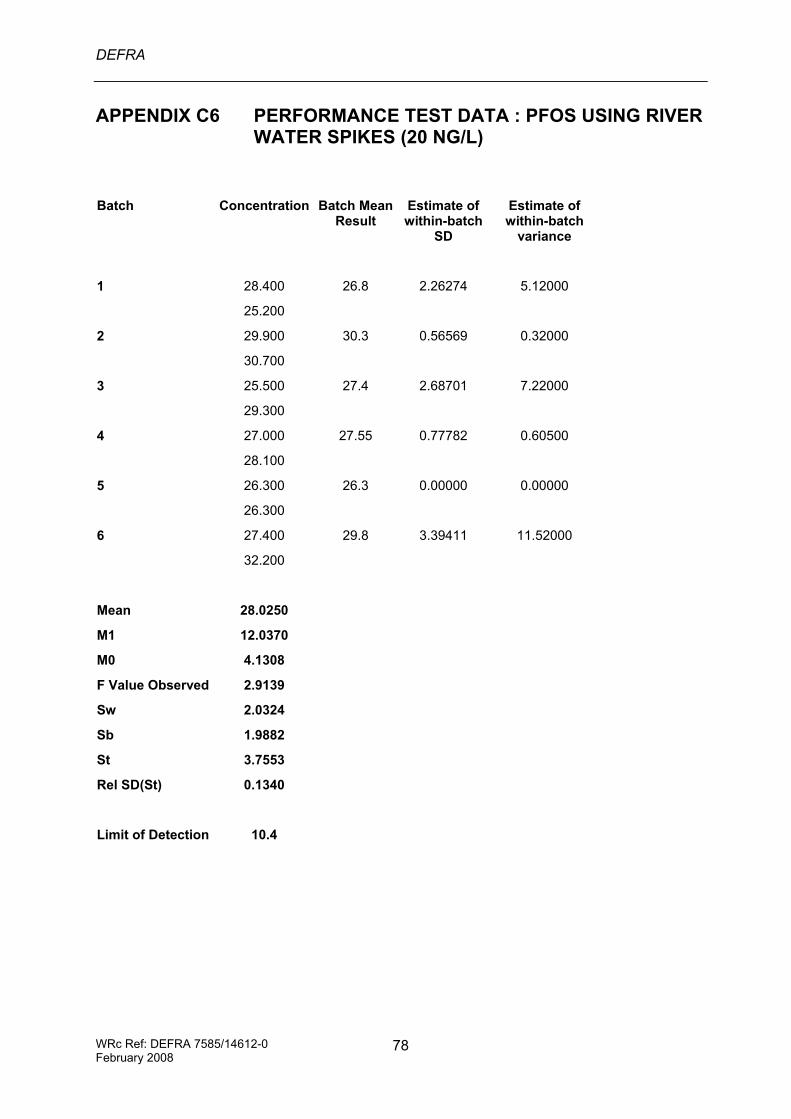
DEFRA
WRc Ref: DEFRA 7585/14612-0 February 2008
78
APPENDIX C6 PERFORMANCE TEST DATA : PFOS USING RIVER WATER SPIKES (20 NG/L)
Batch Concentration Batch Mean Result
Estimate of within-batch
SD
Estimate of within-batch
variance
1 28.400 26.8 2.26274 5.12000
25.200
2 29.900 30.3 0.56569 0.32000
30.700
3 25.500 27.4 2.68701 7.22000
29.300
4 27.000 27.55 0.77782 0.60500
28.100
5 26.300 26.3 0.00000 0.00000
26.300
6 27.400 29.8 3.39411 11.52000
32.200
Mean 28.0250
M1 12.0370
M0 4.1308
F Value Observed 2.9139
Sw 2.0324
Sb 1.9882
St 3.7553
Rel SD(St) 0.1340
Limit of Detection 10.4

DEFRA
WRc Ref: DEFRA 7585/14612-0 February 2008
79
APPENDIX C7 PERFORMANCE TEST DATA : PFOA USING RIVER WATER SPIKES (20 ng/l)
Batch Concentration Batch Mean Result
Estimate of within-batch
SD
Estimate of within-batch
variance
1 32.900 26.9 8.48528 72.00000
20.900
2 24.800 27 3.11127 9.68000
29.200
3 37.800 35.25 3.60624 13.00500
32.700
4 33.000 30.1 4.10122 16.82000
27.200
5 29.300 28.2 1.55563 2.42000
27.100
6 32.500 29.7 3.95980 15.68000
26.900
Mean 29.5250
M1 108.6170
M0 21.6008
F Value Observed 5.0284
Sw 4.6477
Sb 6.5961
St 10.9278
Rel SD(St) 0.3701
Limit of Detection 23.7

DEFRA
WRc Ref: DEFRA 7585/14612-0 February 2008
80
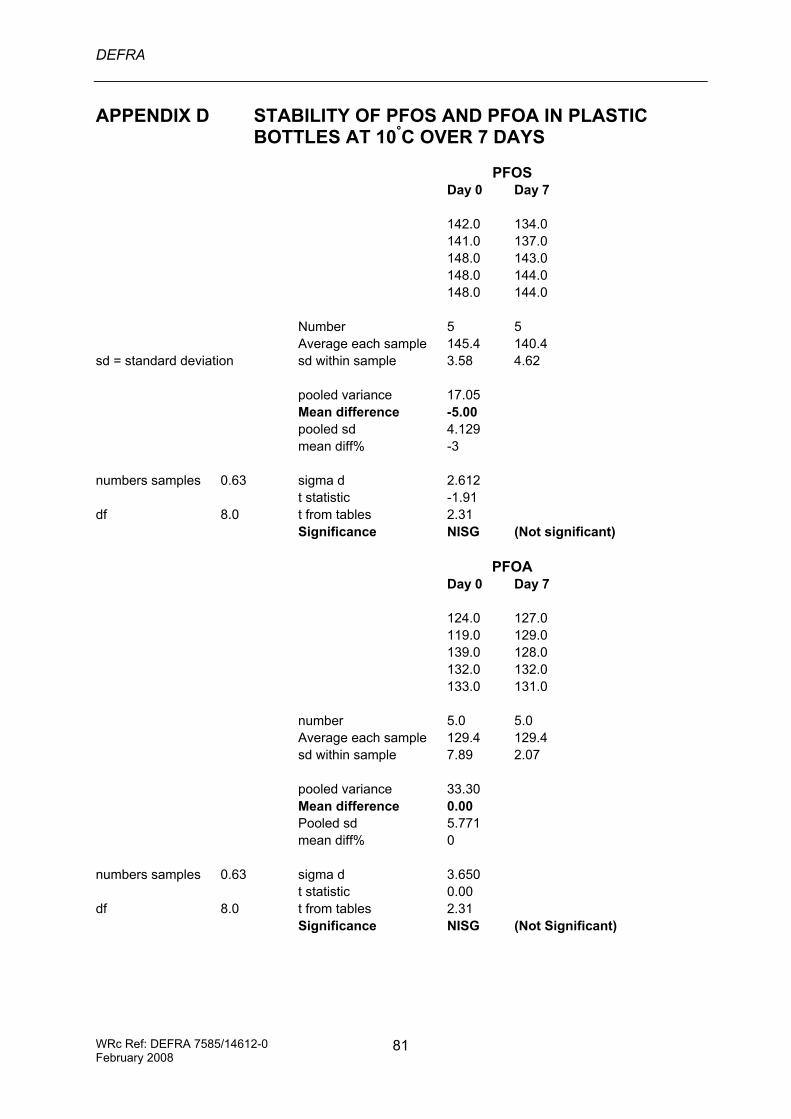
DEFRA
WRc Ref: DEFRA 7585/14612-0 February 2008
81
APPENDIX D STABILITY OF PFOS AND PFOA IN PLASTIC BOTTLES AT 10°C OVER 7 DAYS
PFOS Day 0 Day 7
142.0 134.0 141.0 137.0 148.0 143.0 148.0 144.0 148.0 144.0 Number 5 5 Average each sample 145.4 140.4 sd = standard deviation sd within sample 3.58 4.62 pooled variance 17.05 Mean difference -5.00 pooled sd 4.129 mean diff% -3 numbers samples 0.63 sigma d 2.612 t statistic -1.91 df 8.0 t from tables 2.31 Significance NISG (Not significant) PFOA Day 0 Day 7 124.0 127.0 119.0 129.0 139.0 128.0 132.0 132.0 133.0 131.0 number 5.0 5.0 Average each sample 129.4 129.4 sd within sample 7.89 2.07 pooled variance 33.30 Mean difference 0.00 Pooled sd 5.771 mean diff% 0 numbers samples 0.63 sigma d 3.650 t statistic 0.00 df 8.0 t from tables 2.31 Significance NISG (Not Significant)

DEFRA
WRc Ref: DEFRA 7585/14612-0 February 2008
82

DEFRA
WRc Ref: DEFRA 7585/14612-0 February 2008
83
APPENDIX E EXAMPLE CALIBRATION GRAPH: PFOS
PFOS Batch 22.rdb (PFOS Q2): "Linear" Regression ("No" weighting): y = 0.000785 x + -0.00233 (r = 1.0000)
0 100 200 300 400 500 600 700 800 900 1000 1100 1200 1300 1400 1500 1600 1700 1800 1900 2000Analyte Conc. / IS Conc.
0.0
0.1
0.2
0.3
0.4
0.5
0.6
0.7
0.8
0.9
1.0
1.1
1.2
1.3
1.4
1.5
1.6
Anal
yte
Are
a / I
S A
rea