European Quality in Social Services. Training Consultancy Certification.

Survey of the European Management Consultancy Market
2007/2008


Europe is faced with many challenges: the conver-sion from a mass production based economy to a knowledge based economy, the emergence of large, competing, economic centres, institutional and cultural difficulties in the construction of the EU, etc.
At the same time Europe is rapidly developing: economic integration and further expansion to Central and Eastern European counties, the Euro-peanisation, even globalization, of local compa-nies, development of the e-internal market, inno-vation clusters, etc.
Within this context Management Consultancy plays an essential role in the transformation of companies and economies. Management Con-sulting contributes actively on a daily basis to the construction of Europe with the assistance and advice it provides client companies engaged in transnational activities: development of interna-tional strategies, cross-border mergers and acqui-sitions, transfer of decision centres, international projects, cost reductions, systems integrations, outsourcing, offshoring and global sourcing, etc.
At the same time the profession needs to trans-form itself and adapt its service provision to these developments. Many Management Consulting companies are still too local to provide the serv-ices required. Consultancy companies need to ‘think big’, for their clients and for themselves. Smaller companies need to seek partners to sur-vive.
FEACO offers a unique framework for exchange and benchmarking for European consultancies, not just for the large, but particularly for small and medium-sized companies which find it in-creasingly difficult to adapt to and keep up with the market. FEACO allows to benchmark with oth-er markets and companies, to network with com-panies, to meet with consultants from all over Europe, and to learn about practices and develop-ments in European MC markets. Modern commu-nication tools cannot replace the benefits of per-sonal and direct exchange that an international organization like FEACO offers.
Our sector is in the prime of youth, but at the same time, recent history has shown, it is very fragile as it is easily affected by economic changes. Our sec-tor continues to have low recognition in certain client sectors and with policy makers. We need a common label, a common image, transparency in our services, promotion of our services, of our ex-
periences, best practices and success stories and the value added that Management Consultancies bring. Without national associations and a Euro-pean Federation, the European MC sector has no face and no voice and no input into European pol-icy making; what is more, it does not even exist.
I invite you all to contribute to the development of a successful and exciting European Manage-ment sector and to join FEACO and its national as-sociations. Our annual FEACO European Confer-ence in Dubrovnik, Croatia on 23/24 October and the FEACO European Management Consulting Summit in Paris, France on 16 December will pro-vide excellent opportunities for networking and exchange between European Management Con-sultancies of all sizes.
The Report on the European Management Con-sulting Market is a unique tool for the whole of the profession in Europe. It is difficult to obtain and provide a reliable and consistent picture of the vast and complex Management Consulting market. Our ambition is immense, our means very limited. This Report exists thanks to the commit-ment and contributions of the national Manage-ment Consultancies associations. In addition to a fixed information base, a number of innovations are made each year in order to lift a tip of the veil on another aspect of the multifaceted European Consulting Market.
In this 2007-2008 report, FEACO introduces three innovations:
A detailed comparative analysis of the main �
countries by sectors and service lines,
information on the average daily fee rates ap- �
plied in countries that were able to provide this information,
a description of the breakdown of turnover �
over the large and the smaller local market players.
I extend my gratitude to all who have contributed to this Report and I wish you pleasant reading.
Jean-Luc PlacetFEACO Chairman
Introduction by the FEACO Chairman

Report Contents
Introduction by the FEACO Chairman � � � � � � 3
Executive Summary � � � � � � � � � � � � � � � � � � � � � � � 5
Key Figures 2005 - 2008 � � � � � � � � � � � � � � � � � � � � � 5
Scope of the Market and Methodology � � � � 6
Europe – Market Size, Forecast & Analysis � 7
History and Projections � � � � � � � � � � � � � � � � � � � � � 7
Size of the European MC-Market, 1998-2008 � 7
Evolution in % of the MC Market turnover, �
1998-2008 - Base 100 in 1996 � � � � � � � � � � � � � � � 7
MC Market as a % of GDP, 1998-2008 � � � � � � � � 8
Average Growth Rate by Size of Consultancy �
Company, 2003-2007 � � � � � � � � � � � � � � � � � � � � � � 8
Size of European MC Market (total turnover) �
by Country-Region, 2007 � � � � � � � � � � � � � � � � � � 9
Breakdown of the European Consulting �
Market (Business & IT Consulting) by main Countries, 2006-2007 � � � � � � � � � � � � � � � � � � � � � � 9
Analysis by Service Line � � � � � � � � � � � � � � � � � � � 10
Breakdown of Turnover by Service Line, �
2007 � � � � � � � � � � � � � � � � � � � � � � � � � � � � � � � � � � � � 11
B � reakdown of Business Consulting Turnover, 2007 � � � � � � � � � � � � � � � � � � � � � � � � � � � � � � � � � � � � 11
Breakdown of Consulting Turnover, 2007 � � � 12
Breakdown of Turnover from other Services, �
2007 � � � � � � � � � � � � � � � � � � � � � � � � � � � � � � � � � � � � 12
Analysis by Client Sector � � � � � � � � � � � � � � � � � � � 12
Composition of MC Market by Client Sector, �
2007 � � � � � � � � � � � � � � � � � � � � � � � � � � � � � � � � � � � � 12
Selected European MC Markets � � � � � � � � � � � 13
Analysis by Country � � � � � � � � � � � � � � � � � � � � � � � 13
Growth Rates – Breakdown by Country/ �
Region, 2007 & 2008 � � � � � � � � � � � � � � � � � � � � � � 13
Management Consulting as a Percentage �
of GDP, 2007 � � � � � � � � � � � � � � � � � � � � � � � � � � � � � 13
MC Turnover and GD � P in selected European Markets, 2007 � � � � � � � � � � � � � � � � � � � � � � � � � � � 14
Breakdown between Management �
Consultants and Support Staff, 2007 � � � � � � � 14
Key Figures of selected European �
MC markets � � � � � � � � � � � � � � � � � � � � � � � � � � � � � 15
Analysis by daily rates � � � � � � � � � � � � � � � � � � � � � 16
Average Daily Fee Rates of selected �
European MC Markets � � � � � � � � � � � � � � � � � � � � 16
Export of MC Services by selected Countries, �
2007 � � � � � � � � � � � � � � � � � � � � � � � � � � � � � � � � � � � � 16
Analysis by Service Line � � � � � � � � � � � � � � � � � � � 17
MC Market Composition by Service Line �
(% of turnover) � � � � � � � � � � � � � � � � � � � � � � � � � � 17
MC Market Composition by Service Line �
(million €) � � � � � � � � � � � � � � � � � � � � � � � � � � � � � � � 17
Breakdown of MC in selected Key Countries �
(million €) � � � � � � � � � � � � � � � � � � � � � � � � � � � � � � � 18
Breakdown of Business Consulting in �
selected Key Countries (million €) � � � � � � � � � 18
Analysis by Client Sector � � � � � � � � � � � � � � � � � � � 19
MC Market Composition by Client Sector �
(% of turnover) � � � � � � � � � � � � � � � � � � � � � � � � � � 19
MC Market Composition by Client Sector �
(million €) � � � � � � � � � � � � � � � � � � � � � � � � � � � � � � � 19
Key Market Composition by Client Sector � � � 20
Main trends in Management Consulting in 2007/2008 � � � � � � � � � � � � � � � � � � � � � � � � � � � � � � � � 21
Bulgaria � � � � � � � � � � � � � � � � � � � � � � � � � � � � � � � � � 21
Czech Republic � � � � � � � � � � � � � � � � � � � � � � � � � � � 22
Denmark � � � � � � � � � � � � � � � � � � � � � � � � � � � � � � � � � 23
France � � � � � � � � � � � � � � � � � � � � � � � � � � � � � � � � � � � 23
Germany � � � � � � � � � � � � � � � � � � � � � � � � � � � � � � � � � 25
Greece � � � � � � � � � � � � � � � � � � � � � � � � � � � � � � � � � � � 25
Poland � � � � � � � � � � � � � � � � � � � � � � � � � � � � � � � � � � � 26
Portugal � � � � � � � � � � � � � � � � � � � � � � � � � � � � � � � � � 26
Romania � � � � � � � � � � � � � � � � � � � � � � � � � � � � � � � � � 27
Slovenia � � � � � � � � � � � � � � � � � � � � � � � � � � � � � � � � � 28
Spain � � � � � � � � � � � � � � � � � � � � � � � � � � � � � � � � � � � � 29
Switzerland � � � � � � � � � � � � � � � � � � � � � � � � � � � � � � 30
United Kingdom � � � � � � � � � � � � � � � � � � � � � � � � � � 30
About FEACO � � � � � � � � � � � � � � � � � � � � � � � � � � � � � 32
Member Associations � � � � � � � � � � � � � � � � � � � � � 34
Appendix 1 –definitions– � � � � � � � � � � � � � � � � � 35

5
Executive Summary
Total sales of the European MC industry in 2007 amount to € 81 billion, this represents a 9.5 % growth rate on 2006. This is a weighted growth rate based on the growth rate of the countries covered by the report for which growth rates are known, weighted by their market share.
During the 2005-2007 period, the market size in-creased by 21 % and the number of employees by 26.7 %, from 460,000 persons to 583,000 (total staff).
Figures related to employment should be consid-ered cautiously. In general the growth results from the development of the MC market but it can also originate from the enlargement of the scope of the survey in some countries. For instance, this year France made an effort to include more small mar-ket players in its analysis, which affected the mar-ket size. Usually, in mature markets, changes in staff are rather modest: Germany (+7 %), Switzer-land (+10 %) and the United Kingdom (+13 %).
Since 2005, the FEACO survey uses the same meth-odology which divides Management Consulting into four segments:
Consulting (consisting of Business Consulting �
and IT Consulting),Development and Systems Integration �
(excluding software development),Outsourcing of value added services, �
Other services �
In 2007 the share of the market of each of these service lines remains the same as in previous years: Consulting (Business and IT Consulting) accounts for 57 % of the total turnover, Outsourcing for 20 %, Development and Systems Integration for 20 % and Other Services for 3 %.
The Consulting segment (consisting of Business and IT Consulting), is worth € 46.1 million. The two largest markets in Europe are Germany (47 % of the European market) and the United Kingdom (31 %), followed at a distance by France (14 %), Spain (5 %) and Denmark (3 %).
The analysis by client sectors also shows the same distribution by sector since 2005. Demand from three sectors is significantly larger than from other sectors: Industry (32 % of the total turnover), Bank-ing and Insurance services (23 %) and Public sector (14 %).
2007 was an excellent year for the MC sector. The forecast for 2008 remains relatively optimistic but, at the end the first semester, perspectives remain unclear. Most European economies anticipate a slowdown towards the year end, as experience has shown that the general economic trend tends to rather rapidly affect the Consulting market. Nev-ertheless, all European associations still forecast a positive growth in 2008 within a range of +5 % (Portugal) to +40 % (Romania). The expected aver-age growth comes out at +9 %. However, the UK, the second largest market in Europe, anticipates only +5 % growth.
Tab 1: Key Figures 2005 - 2008
2005 2006 2007 2008 (est.)
Market size 66.8 bn € 74 bn € 81 bn € 88 bn €
Growth rate 14 % 10.7 % 9.5 % 9 %
Total Staff 460,000 450,000 583,000
Breakdown of Key services lines
Business Consulting 42.0 % 39.1 % 42.0 %
Outsourcing 21.0 % 19.0 % 20.0 %
Dvt & Integration 19.0 % 19.0 % 20.0 %
IT Consulting 12.0 % 17.0 % 15.0 %
Other services 6.0 % 5.9 % 3.0 %
Total turnover in billion €
Business & IT Consulting in
billion €
Total turnover in billion €
Business & IT Consulting in
billion €
Total turnover in billion €
Business & IT Consulting in
billion €
Germany 19.7 13.1 21.6 14.7 24.1 16.4
UK 18.0 9.2 18.3 11.1 19.0 11.1
Spain 6.9 1.6 7.6 1.6 8.5 1.7
France 5.9 3.3 6.9 3.8 7.8 4.9
6
Scope of the Market and Methodology
The objective of FEACO is to present objectively and as accurately as possible a picture of the ac-tivity in Europe in our sector, aiming for the maxi-mum level of reliability in the aggregation of the figures which represent the different elements of the services which companies in the market offer.
The results are reflected by the aggregated data presented in this report which are a result of the effort of all the companies, large and small, which participated in it and continue to contribute to building a prosperous, competitive and exciting European management consultancy market.
FEACO member companies provide a broad spec-trum of management consulting services. De-pending on the market these may be at different levels of maturity. The array of services manage-ment consultancies offer is very dynamic; it is con-tinuously evolving and changing. Defining the framework of activity of our sector is therefore not an easy task, the more because it concerns a basket of services which in certain cases are very different.
From that perspective and with the objective of improving our report, FEACO proposed in 2005 a new definition of the scope of services offered by management consultancies in Europe and a new way of segmenting these services.
This exercise resulted in the following division of the main services:
Consulting, which we divide into Business Con- �
sulting and IT Consulting,Development and Systems Integration (ex- �
cluding software development), Outsourcing of value added services, �
Other services. �
These segments are described in detail in the sub-section “Analysis by Service Line”.
This new framework implied a change in meth-odology for the collection and aggregation of the quantitative and qualitative data, which are con-tributed by the companies.
The methodology consists basically in the collec-tion by our member associations of the data on the sector via the aggregation of the figures from the individual consulting companies. In 2007, FEACO decided to distinguish between associa-tions with an in depth knowledge of their domes-tic market – for instance, because they publish their own often very detailed annual market re-
port- and associations from countries whose mar-kets are less known.
As a result, quantitative data were collected on two levels:
Key countries were asked to provide:Volume of turnover for the year 2007 �
Data on staffing �
Business volume per service area �
Business volume per major client sector �
Daily fee rates for 2007 �
General forecasts for 2008 �
Non key countries were asked to provide:Volume of turnover for the year 2007 �
Data on staffing �
General forecasts for 2008 �
In parallel, qualitative data were solicited in a sep-arate questionnaire on companies’ views on the development and the future of the sector in se-lected areas of activity, the results of which are summarised in the chapter on trends in the sec-tor.
It should be noted that the management consult-ing sector is a dynamic sector. Every year new con-sulting companies appear, others merge give rise to spin-offs or reorganize themselves. Because the data are provided on a voluntary basis, the sample of companies surveyed in each Europe-an country varies. The latest edition of the survey allows to redefine retroactively some of the data obtained in previous years. If this is the case, we decide to retain the most reliable data, accepting the discrepancies in comparison of one edition to another. Thus, some data estimates for 2007 con-tained in this report are provisional and will be confirmed in the next report, after further inves-tigation, collection and analysis over the course of 2008. In the same manner, the 2006-2007 data are verified and confirmed by this 2007-2008 report.

7
Europe – Market Size, Forecast & Analysis
History and Projections
In 2007, after two years of double-digit growth, the MC industry’s total sales presents, in comparison to 2006, a weighted growth rate of 9.5 % and reaches €81 billion.
For 2008, European MC companies are forecasting a growth rate of 9 %. Since this is the result of only 13 countries’ estimations for 2008, this forecast should be considered cautiously. What is more, growth esti-mations vary widely from 4.9 % in Portugal and 24 % in Denmark to 40 % in Romania.
Fig. 1a: Size of the European MC-Market, 1998-2008
Fig. 1b: Evolution in % of the MC Market turnover, 1998-2008 - Base 100 in 1996
According to figure 1b below, based on the 100 in-dex of 1996, the total turnover of the MC market has multiplied by 5.3 since 1996.
149
217
256286 280 286 292
389
446
489
532
24.7
36.0
42.547.5 46.5 47.5 48.5
64.5
74.0
81.0
88.0
15.0 15.918.0
11.5
– 2.0
3.5 3.7
14.010.7 9.5 9.0
600
500
400
300
200
100
0
Year
1998 1999 2000 2001 2002 2003 2004 2005 2006 2007 2008 (est)
MC
Mar
ket (
1996
= b
ase
100)
© FEACO 2008
90
80
70
60
50
40
30
20
10
0
Year
* In 2005, the growth rate of 14 % was partially attributable to the redefinition of MC services introduced by the FEACO.
Volume of the market (billion €) Growth rate (%)
1998 1999 2000 2001 2002 2003 2004 2005 2006 2007 2008 (est)
Billi
on €
/ G
row
th ra
te (%
)
© FEACO 2008

8
Europe – Market Size, Forecast & Analysis
The consulting intensity, measured as the contri-bution by the sector to the European GDP, has in-creased from 0.63 % in 2006 to 0.64 % in 2007. In
2007, this index increased by 0.4 points since 1998 and by 0.08 points since 2003, the end of the gen-eral economic crisis (Source: Eurostat, 2007).
Fig. 2: MC Market as a % of GDP,
1998-2008
It appears that the growth rate varies also by size of consulting company. In 2007 the medium sized MC-companies reported the highest growth rate (20 %), while small companies achieved 10 % and the large sized MC-companies 5 %. The large sized MC-companies, depending on which national market, generally account for between 30 % and
75 % of the total turnover on the national markets. However, these results are based on reports from only four countries (France, Germany, Greece and the United Kingdom), so statistically they cannot be considered representative for the whole of the European market.
Fig. 3: Average Growth Rate by
Size of Consultancy Company, 2003-2007
0.36
0.630.61
0.24
0.53
0.580.55 0.56 0.55
0.640.68
5 %
20 %
10 %9 %
17 %
15 %
10 %
4 %
8 %
4 % 4 %
2 %3 %
4 %5 %
Large sized MC-firms (TOP 20 MC-firms)
Medium sized MC-firms (≥ € 500,000 turnover)
Small sized MC-firms (< € 500,000 turnover)
0.7
0.6
0.5
0.4
0.3
0.2
0.1
0
Year
1998 1999 2000 2001 2002 2003 2004 2005 2006 2007 2008 (est)
% G
DP
© FEACO 2008
25
20
15
10
5
0
Year
2003 2004 2005 2006 2007
Perc
enta
ge
© FEACO 2008
Europe – Market Size, Forecast & Analysis
9
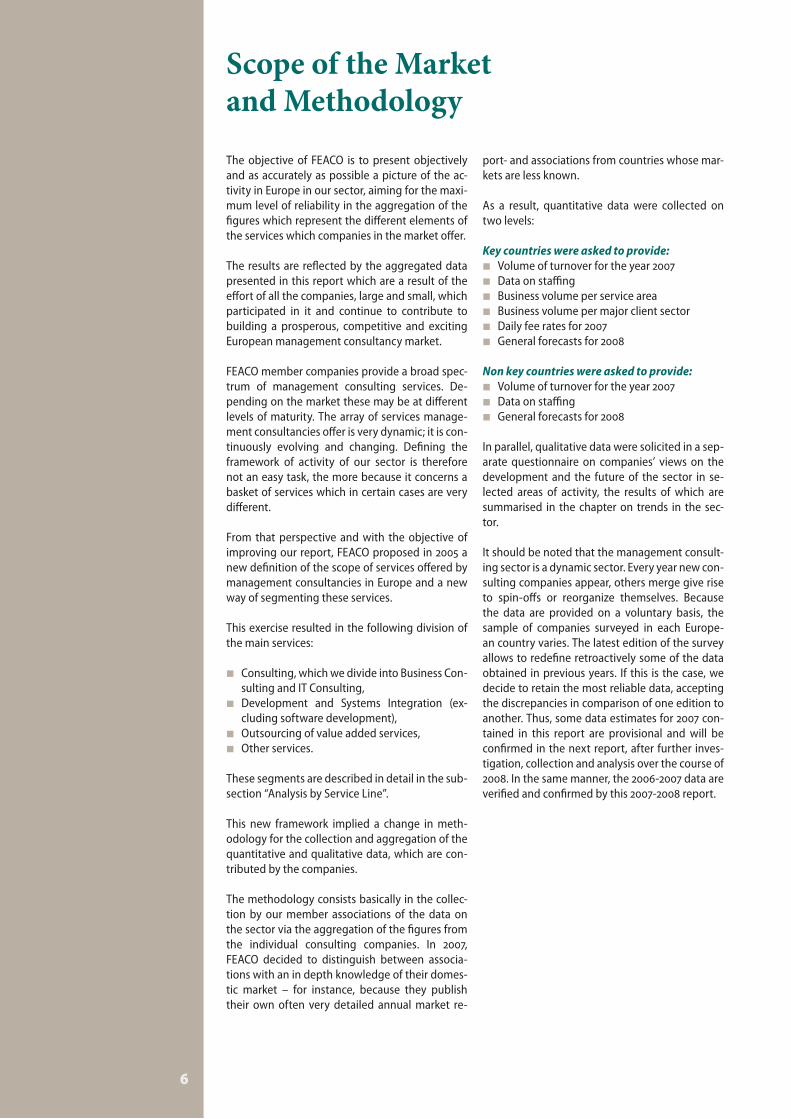
Fig. 4a: Size of European MC Market (total turnover) by Country-Region, 2007
Fig. 4b: Breakdown of the European Consulting Market (Business & IT Consulting) by main Countries, 2006-2007
Considering the total turnover of consulting companies, the two largest national markets are Germany and the United Kingdom with a total
turnover of € 24.1 billion and € 19 billion respec-tively, followed by Spain (€ 8.5 billion) and France (€ 7.8 billion).
When considering only the Consulting segment (Business and IT Consulting), we observe that Ger-many, with a turnover of €16.4 billion, consoli-dates in 2007 its domination of almost half of the
market (47%). The other important players are the United Kingdom (€11 billion), France (€4.9 billion), Spain (€1.7 billion) and Denmark (€1.1 billion).
%
30.0 Germany
24.0 United KingdomSpain 11.0
France 10.0
Nordic Region 9.0
Netherlands 4.0
Austria
4.0
Italy
3.0
Greece 0.3 %
Switzerland 1.0 %
Portugal 1.0 %
Belgium 1.0 %
Central & Eastern Europe 2.0 %
4 % 3 %5 % 5 %
12 % 14 %
34 % 31 %
45 % 47 %
Germany United Kingdom France Spain Denmark
© FEACO 2008
Year2006 2007
© FEACO 2008

10
Europe – Market Size, Forecast & Analysis
Analysis by Service Line
According to the new segmentation introduced by Feaco in 2005, the MC market is divided into four segments: Consulting, Development and In-tegration, Outsourcing and Other services. The Consulting segment is subsequently divided into two sub-segments: Business Consulting (BC) and Information Technology Consulting (ITC).
1. Consulting. These services help private and public organisations to analyse and redefine their strategies, to improve the efficiency of their busi-ness operations and to optimize their technical and human resources.
1a. Business Consulting (BC), which includes:
Strategy Consulting (SC), which targets the im- �
provement of the long-term, strategic health of a company: strategic planning develop-ment; mergers & acquisitions; sales; marketing; corporate communication; financial advisory; HR strategy;
Organisation/Operations Management (OM), �
which aims at the integration of business so-lutions through Business Process Re-engineer-ing (BPR); customer/supplier relations man-agement (CRM); turnaround/cost reduction and purchasing & supply management as well as advise on outsourcing;
Project Management (PM); The application of �
knowledge, skills, tools and techniques to a broad range of activities in order to meet the requirements of a particular project;
Change Management (CM), this consists of �
services which, on top of any other type of consulting service, help an organisation deal with the effects that change has on the human element of the organisation;
Human Resources Consulting (HR): Consulting �
services which target the improvement of the ‘people’ element of an organisation through performance measurement and management, reorganisation of benefits, compensations and retirement schemes, HR strategy and market-ing, the development of talent strategies and executive coaching.
1b. Information Technology Consulting (ITC) helps organisations to evaluate their IT strategies with the objective of aligning technology with the business process. These services include stra-tegic planning and conceptions, operations and implementations.
2. Development and Integration which con cerns:
the � development of applications (excluding software):
the creation of new functionalities through, �
often tailored, process developments. Usu-ally these developments integrate or unite internal or external business processes and can involve a conversion of applications so that they can be used for different plat-forms or conceptions,
the design of services which integrate ap- �
plications which were created in different existing IT applications or infrastructures (systems integration -development)
the � deployment and integration of ap pli-cations:
the implementation of new applications �
or infrastructures, which may concern the installation of hardware and/or software, their configuration or adaptation and the testing of their interoperability; and of serv-ices which integrate applications which were created in different existing IT appli-cations or infrastructures and the manage-ment thereof (Systems integration)
3. Outsourcing, which consists of three types of activities:
IT management services; among these are serv- �
ices for the operation of infrastructures (opera-tion of systems, administration and security, follow up of cost-effectiveness, configuration management, management of technology, etc.) applications management, and help desk man-agement.
Applied Management Services (AMS); this con- �
cerns the outsourcing of the development and implementation of support services for hard-ware, applications, CRM and infrastructures (tools for the development of applications and middle-ware, as well as software for information man-agement, storage or systems and networks).
Business Process Outsourcing (BPO). This serv- �
ice supposes the externalisation of a complete business process.
4. Other services, which consist of a variety of services provided by many MC companies of-ten complementary to Consulting, Development and Integration and Outsourcing services, such as: Training, Engineering consulting, Studies, Out-placement, Executive selection and recruitment and Audit and Accounting.

Europe – Market Size, Forecast & Analysis
11
An analysis by service line of the total MC turno-ver shows that Consulting services represent 57 % of the total turnover (of which 42 % is BC and 15 % ITC), Outsourcing services account for 20 %, De-
velopment and Systems Integration for 20 % and Other services 3 %. Since 2005, the annual increase of 1 % in Consulting services is the only significant change in the breakdown of MC services.
Compared to 2005, the breakdown of Business Consulting revenue shows that the market share of Organisation/Operations Management has dou-
bled to the detriment of HR Consulting (– 9 pts), Change Management (– 9 pts) and Project Ma-nagement (– 4 pts).
Fig. 5a: Breakdown of Turnover by Service Line, 2007
Fig. 5b: Breakdown of Business Consulting Turnover, 2007
%42.0 Business Consulting
20.0
Development & Integration
Outsourcing 20.0
IT Consulting 15.0
Other services
3.0
20 % 15 % 11 %
13 %
5 %4 %
16 %
13 %
12 %
21 %
36 %43 %
30 % 31 % 30 %
Strategy Organisation/Operations Management Project Management Change Management HR Consulting
© FEACO 2008
Year
2005 2006 2007
© FEACO 2008
12
Europe – Market Size, Forecast & Analysis
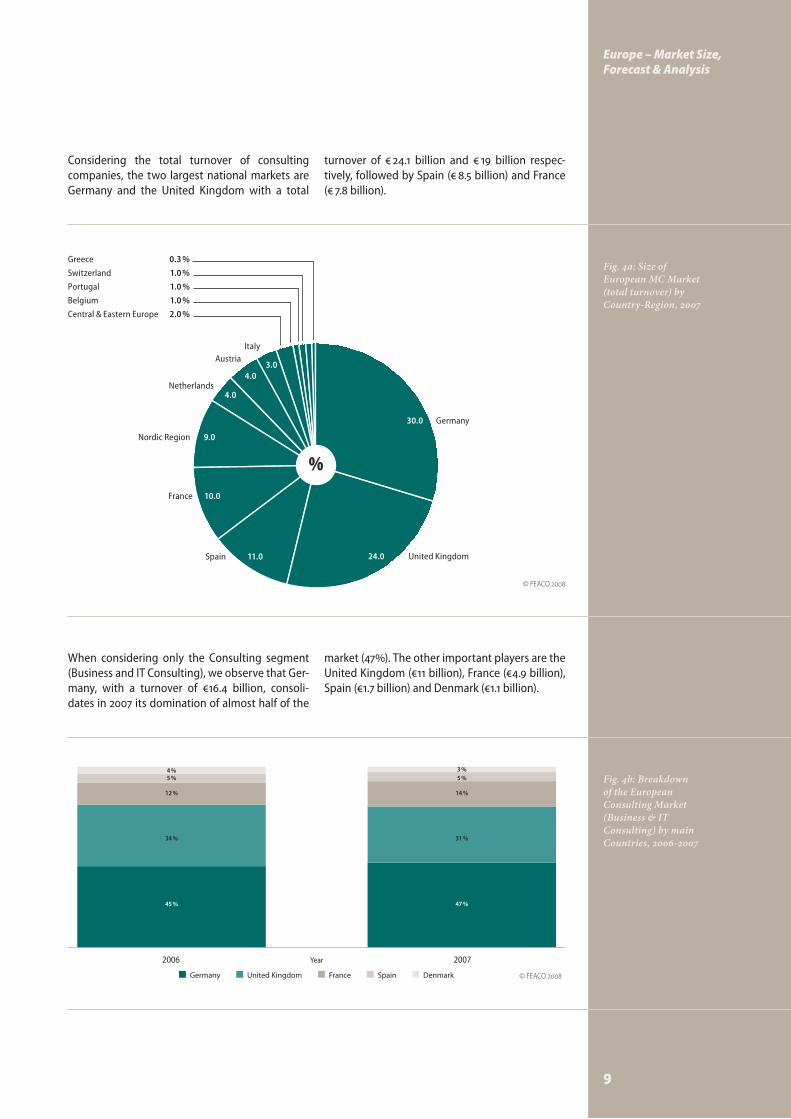
Compared with 2006, the breakdown of Consult-ing shows a reduction of IT Consulting (– 4 pts). Regarding other services provided by MC compa-
nies, Audit and Accounting and Engineering Con-sulting were introduced in 2007 which completely reshuffled the breakdown of this revenue.
Fig. 5c (left): Breakdown
of Consulting Turnover, 2007
Fig. 5d (right): Breakdown of
Turnover from other Services, 2007
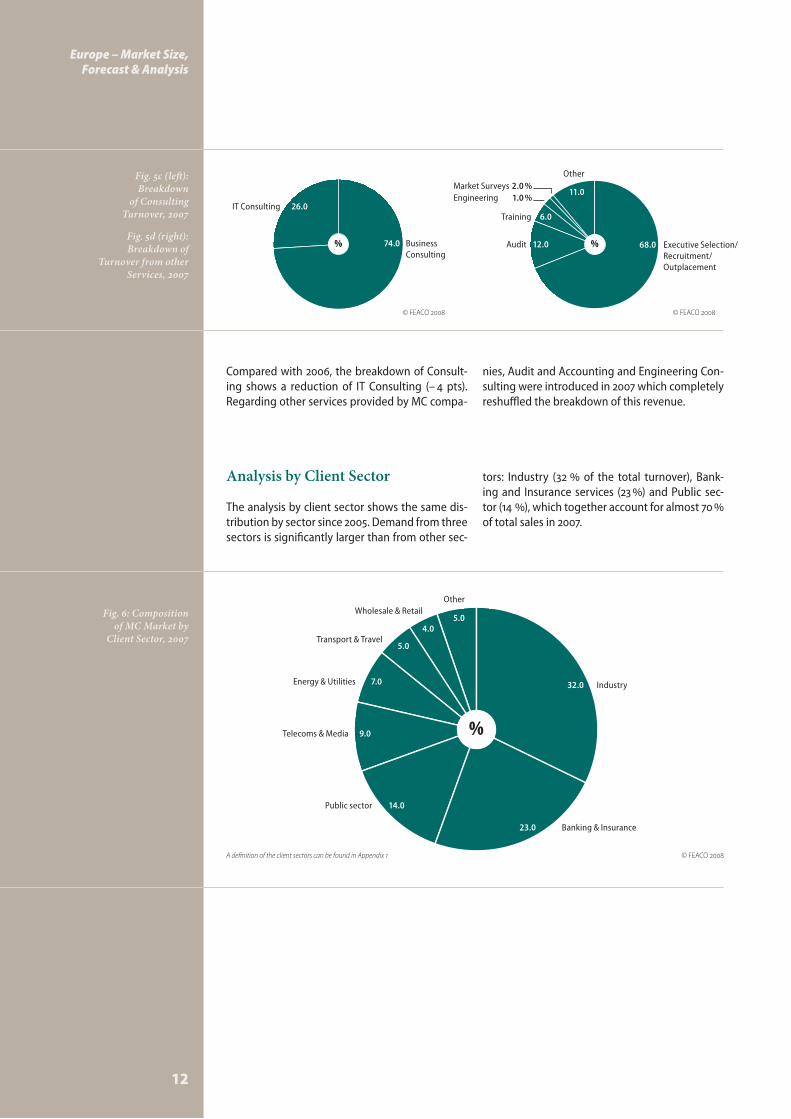
Analysis by Client Sector
The analysis by client sector shows the same dis-tribution by sector since 2005. Demand from three sectors is significantly larger than from other sec-
tors: Industry (32 % of the total turnover), Bank-ing and Insurance services (23 %) and Public sec-tor (14 %), which together account for almost 70 % of total sales in 2007.
Fig. 6: Composition of MC Market by
Client Sector, 2007
% %
%
74.0 Business Consulting
IT Consulting 26.0
68.0 Executive Selection/ Recruitment/ Outplacement
Audit 12.0
Training 6.0
Other
11.0Market Surveys 2.0 %Engineering 1.0 %
32.0 Industry
23.0 Banking & Insurance
Transport & Travel 5.0
Public sector 14.0
Other
5.0
Telecoms & Media 9.0
Energy & Utilities 7.0
Wholesale & Retail
4.0
© FEACO 2008 © FEACO 2008
© FEACO 2008A definition of the client sectors can be found in Appendix 1
Selected European MC Markets
13
Selected European MC Markets
Analysis by Country
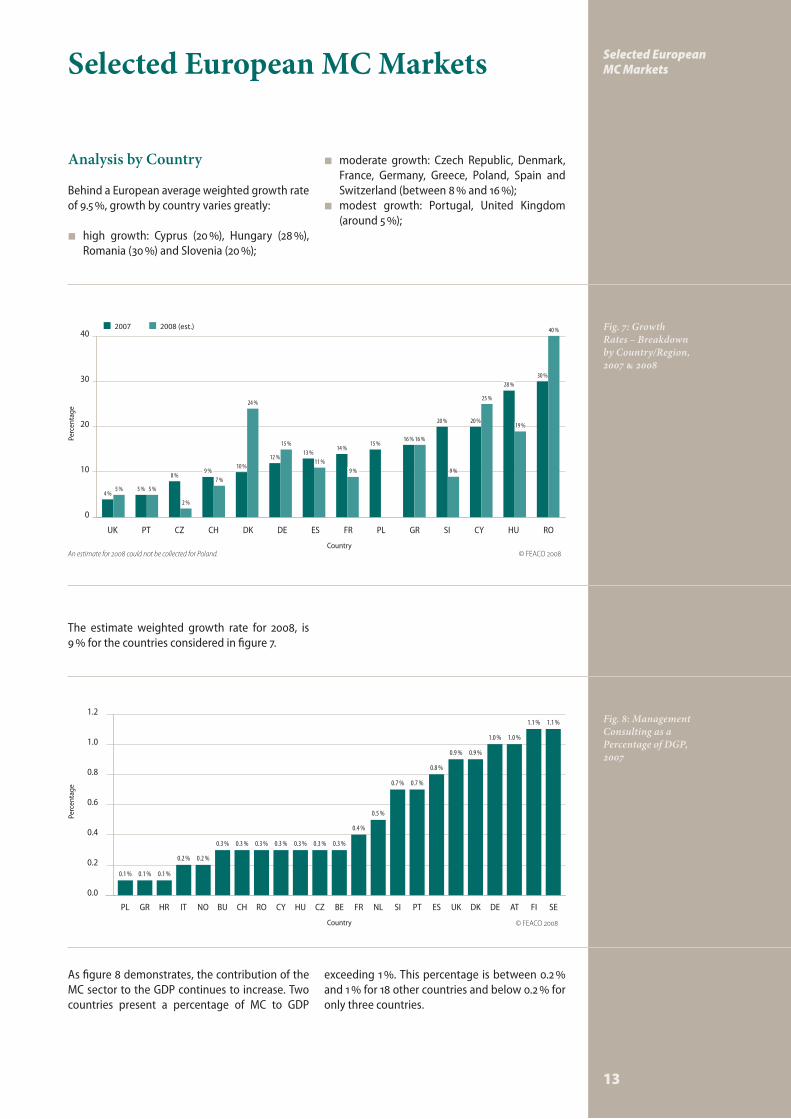
Behind a European average weighted growth rate of 9.5 %, growth by country varies greatly:
high growth: Cyprus (20 %), Hungary (28 %), �
Romania (30 %) and Slovenia (20 %);
moderate growth: Czech Republic, Denmark, �
France, Germany, Greece, Poland, Spain and Switzerland (between 8 % and 16 %);modest growth: Portugal, United Kingdom �
(around 5 %);
Fig. 7: Growth Rates – Breakdown by Country/Region, 2007 & 2008
Fig. 8: Management Consulting as a Percentage of DGP, 2007
The estimate weighted growth rate for 2008, is 9 % for the countries considered in figure 7.
As figure 8 demonstrates, the contribution of the MC sector to the GDP continues to increase. Two countries present a percentage of MC to GDP
exceeding 1 %. This percentage is between 0.2 % and 1 % for 18 other countries and below 0.2 % for only three countries.
2007 2008 (est�)
8 %
2 %
30 %
40 %
9 %7 %
10 %
24 %
12 %
15 %13 %
11 %
14 %
9 %
15 %16 % 16 %
20 %
25 %
20 %
9 %
28 %
19 %
5 % 5 %4 %
5 %
0.1 %
1.1 %
0.1 % 0.1 %
0.2 % 0.2 %
0.3 %0.3 % 0.3 % 0.3 % 0.3 % 0.3 % 0.3 %
0.4 %
0.5 %
0.7 % 0.7 %
0.8 %
1.1 %
1.0 %1.0 %
0.9 %0.9 %
An estimate for 2008 could not be collected for Poland.
40
30
20
10
0
Country
UK PT CZ CH DK DE ES FR PL GR SI CY HU RO
Perc
enta
ge
© FEACO 2008
1.2
1.0
0.8
0.6
0.4
0.2
0.0
Country
PL GR HR IT NO BU CH RO CY HU CZ BE FR NL SI PT ES UK DK DE AT FI SE
Perc
enta
ge
© FEACO 2008
14
Selected European MC Markets
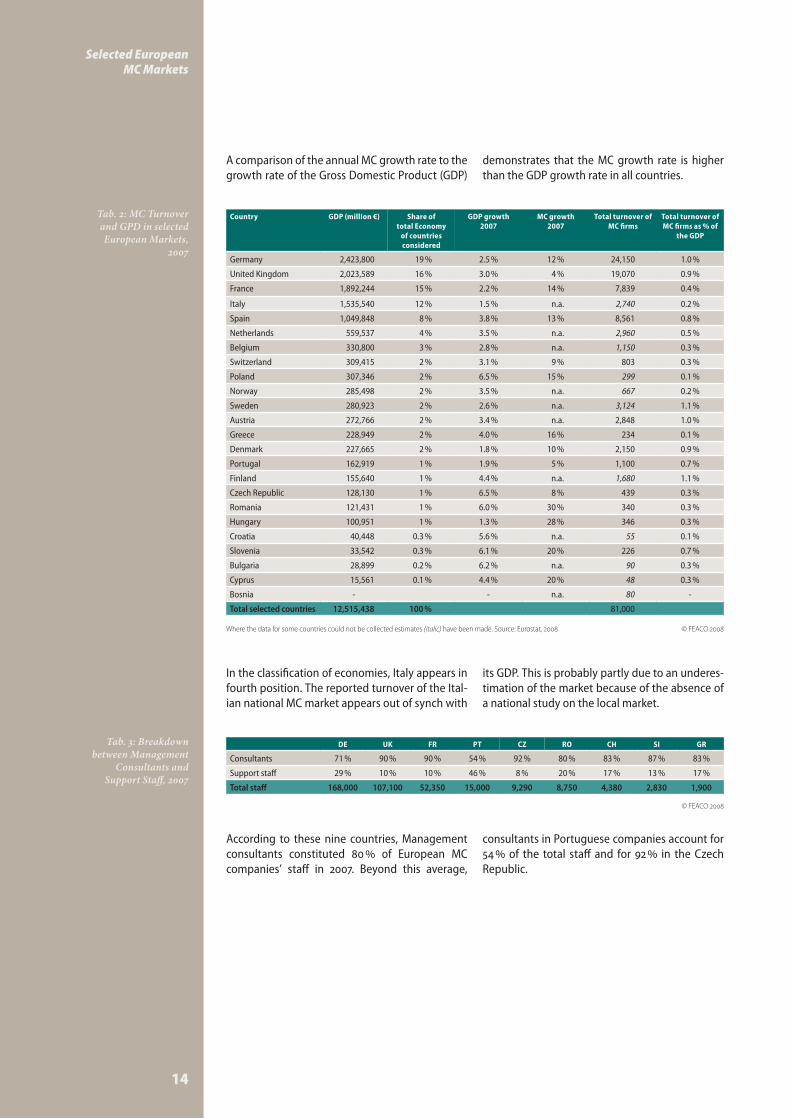
A comparison of the annual MC growth rate to the growth rate of the Gross Domestic Product (GDP)
demonstrates that the MC growth rate is higher than the GDP growth rate in all countries.
Country GDP (million €) Share of total Economy
of countries considered
GDP growth 2007
MC growth 2007
Total turnover of MC firms
Total turnover of MC firms as % of
the GDP
Germany 2,423,800 19 % 2.5 % 12 % 24,150 1.0 %
United Kingdom 2,023,589 16 % 3.0 % 4 % 19,070 0.9 %
France 1,892,244 15 % 2.2 % 14 % 7,839 0.4 %
Italy 1,535,540 12 % 1.5 % n.a. 2,740 0.2 %
Spain 1,049,848 8 % 3.8 % 13 % 8,561 0.8 %
Netherlands 559,537 4 % 3.5 % n.a. 2,960 0.5 %
Belgium 330,800 3 % 2.8 % n.a. 1,150 0.3 %
Switzerland 309,415 2 % 3.1 % 9 % 803 0.3 %
Poland 307,346 2 % 6.5 % 15 % 299 0.1 %
Norway 285,498 2 % 3.5 % n.a. 667 0.2 %
Sweden 280,923 2 % 2.6 % n.a. 3,124 1.1 %
Austria 272,766 2 % 3.4 % n.a. 2,848 1.0 %
Greece 228,949 2 % 4.0 % 16 % 234 0.1 %
Denmark 227,665 2 % 1.8 % 10 % 2,150 0.9 %
Portugal 162,919 1 % 1.9 % 5 % 1,100 0.7 %
Finland 155,640 1 % 4.4 % n.a. 1,680 1.1 %
Czech Republic 128,130 1 % 6.5 % 8 % 439 0.3 %
Romania 121,431 1 % 6.0 % 30 % 340 0.3 %
Hungary 100,951 1 % 1.3 % 28 % 346 0.3 %
Croatia 40,448 0.3 % 5.6 % n.a. 55 0.1 %
Slovenia 33,542 0.3 % 6.1 % 20 % 226 0.7 %
Bulgaria 28,899 0.2 % 6.2 % n.a. 90 0.3 %
Cyprus 15,561 0.1 % 4.4 % 20 % 48 0.3 %
Bosnia - - n.a. 80 -
Total selected countries 12,515,438 100 % 81,000
DE UK FR PT CZ RO CH SI GR
Consultants 71 % 90 % 90 % 54 % 92 % 80 % 83 % 87 % 83 %
Support staff 29 % 10 % 10 % 46 % 8 % 20 % 17 % 13 % 17 %
Total staff 168,000 107,100 52,350 15,000 9,290 8,750 4,380 2,830 1,900
Tab. 2: MC Turnover and GPD in selected European Markets,
2007
Tab. 3: Breakdown between Management
Consultants and Support Staff, 2007
Where the data for some countries could not be collected estimates (italic) have been made. Source: Eurostat, 2008 © FEACO 2008
In the classification of economies, Italy appears in fourth position. The reported turnover of the Ital-ian national MC market appears out of synch with
its GDP. This is probably partly due to an underes-timation of the market because of the absence of a national study on the local market.
According to these nine countries, Management consultants constituted 80 % of European MC companies’ staff in 2007. Beyond this average,
consultants in Portuguese companies account for 54 % of the total staff and for 92 % in the Czech Republic.
© FEACO 2008
Selected European MC Markets
15
Country Total 2007 turno-ver of MC-firms
(million €)
Share of MC market in Europe
in 2007
Total 2006 turn-over of MC-firms
(million €)
Share of MC market in Europe
in 2006
Total staff Turnover per employee (€)
Germany 24,150 30.0 % 21,601 28.76 % 168,000 143,750
United Kingdom 19,070 23.7 % 18,302 27.04 % 107,100 178,060
Spain 8,561 10.6 % 7,569 10.03 % 80,000 107,013
France 7,840 9.7 % 6,895 8.69 % 52,350 149,761
Sweden 3,124 3.9 % 2,900 3.72 % 18,000 173,536
Netherlands 2,960 3.7 % 2,900 3.71 % 22,000 134,545
Austria 2,848 3.5 % 2,800 3.58 % 21,500 132,479
Italy 2,740 3.4 % 2,600 3.31 % 20,000 137,000
Denmark 2,150 2.7 % 1,947 2.64 % 14,150 151,908
Finland 1,680 2.1 % 1,650 2.00 % 10,000 168,033
Belgium 1,150 1.4 % 1,150 1.39 % 8,700 132,216
Portugal 1,100 1.4 % 1,050 1.39 % 15,150 72,634
Switzerland 803 1.0 % 737 0.99 % 4,380 183,333
Norway 667 0.8 % 609 0.81 % 4,200 158,848
Czech Republic 439 0.5 % 407 0.54 % 9,290 47,201
Hungary 346 0.0 % 270 0.01 % 4,800 72,083
Romania 340 0.4 % 262 0.34 % 8,750 38,857
Poland 299 0.4 % 260 0.34 % 6,000 49,833
Slovenia 226 0.3 % 189 0.19 % 2,830 79,859
Greece 234 0.3 % 202 0.27 % 1,967 118,963
Cyprus 48 0.1 % 40 0.05 % 800 60,000
Bulgaria 90 0.1 % 70 0.08 % 1,500 60,000
Bosnia 80 0.1 % 60 0.07 % 1,000 79,775
Croatia 55 0.1 % 40 0.04 % 600 91,667
Total 81,000 100.0 % 74,000 100.00 % 583,067 138,921
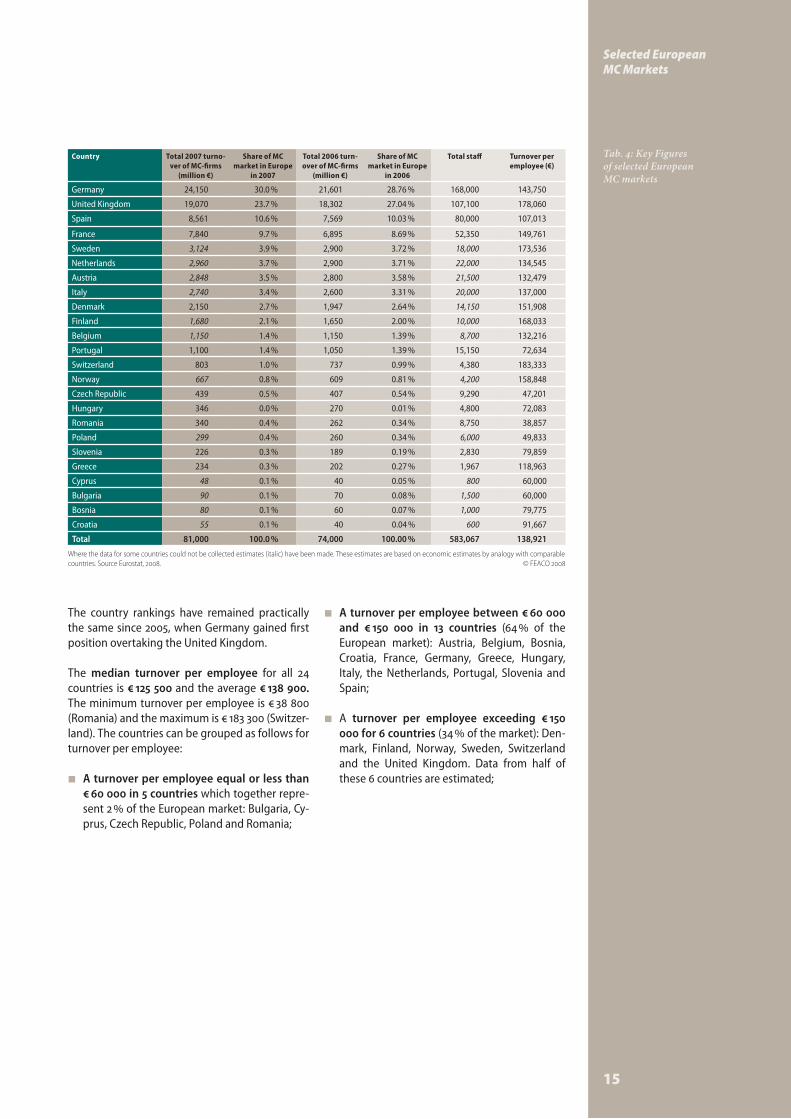
Tab. 4: Key Figures of selected European MC markets
Where the data for some countries could not be collected estimates (italic) have been made. These estimates are based on economic estimates by analogy with comparable countries. Source Eurostat, 2008. © FEACO 2008
The country rankings have remained practically the same since 2005, when Germany gained first position overtaking the United Kingdom.
The median turnover per employee for all 24 countries is € 125 500 and the average € 138 900. The minimum turnover per employee is € 38 800 (Romania) and the maximum is € 183 300 (Switzer-land). The countries can be grouped as follows for turnover per employee:
A turnover per employee equal or less than �
€ 60 000 in 5 countries which together repre-sent 2 % of the European market: Bulgaria, Cy-prus, Czech Republic, Poland and Romania;
A turnover per employee between € 60 000 �
and € 150 000 in 13 countries (64 % of the European market): Austria, Belgium, Bosnia, Croatia, France, Germany, Greece, Hungary, Italy, the Netherlands, Portugal, Slovenia and Spain;
A � turnover per employee exceeding € 150 000 for 6 countries (34 % of the market): Den-mark, Finland, Norway, Sweden, Switzerland and the United Kingdom. Data from half of these 6 countries are estimated;
16
Selected European MC Markets
Analysis by daily ratesManagement Consulting
France 1,526 €
Germany 1,550 €
United Kingdom * 1,732 €* These figures came from Management Consulting Information Service.
Conversion rate as of June 2008 © FEACO 2008
It proved difficult to obtain information on daily fee rates. Only four countries (France, Germany, Greece, and United Kingdom) were able to pro-vide information on average daily fee rates on their markets, among which France, Germany and the UK appeared fairly comparable, which may give an idea of the average daily fee rates for the MC Consulting market in Western Europe. Greece reported an average daily fee rate of € 400.
These rates should be considered cautiously, as the average daily fee rate is merely an indicator
and not representative of actual fees invoiced by consultants, which tend to vary according to sec-tors, service lines and profiles. UK consultants ap-pear to receive the highest daily fee rates for MC Consulting, with large differences between the various key service areas, ranging between € 315 and € 5,000 per man day. Also, the UK average dai-ly fee rate expressed in euro should be considered in relation to the GBP/EUR exchange rate which dropped by 15 % within one year. In France, the average daily fee rates for MC Consulting range between € 900 and € 1,700 per day depending on the sector. In Germany, where the daily fee rates for MC Consulting were analysed by profile, they range between € 800 for junior consultants and € 5,000 for Senior Partners of large international companies.
Tab. 5: Average Daily Fee Rates of selected European
MC Markets
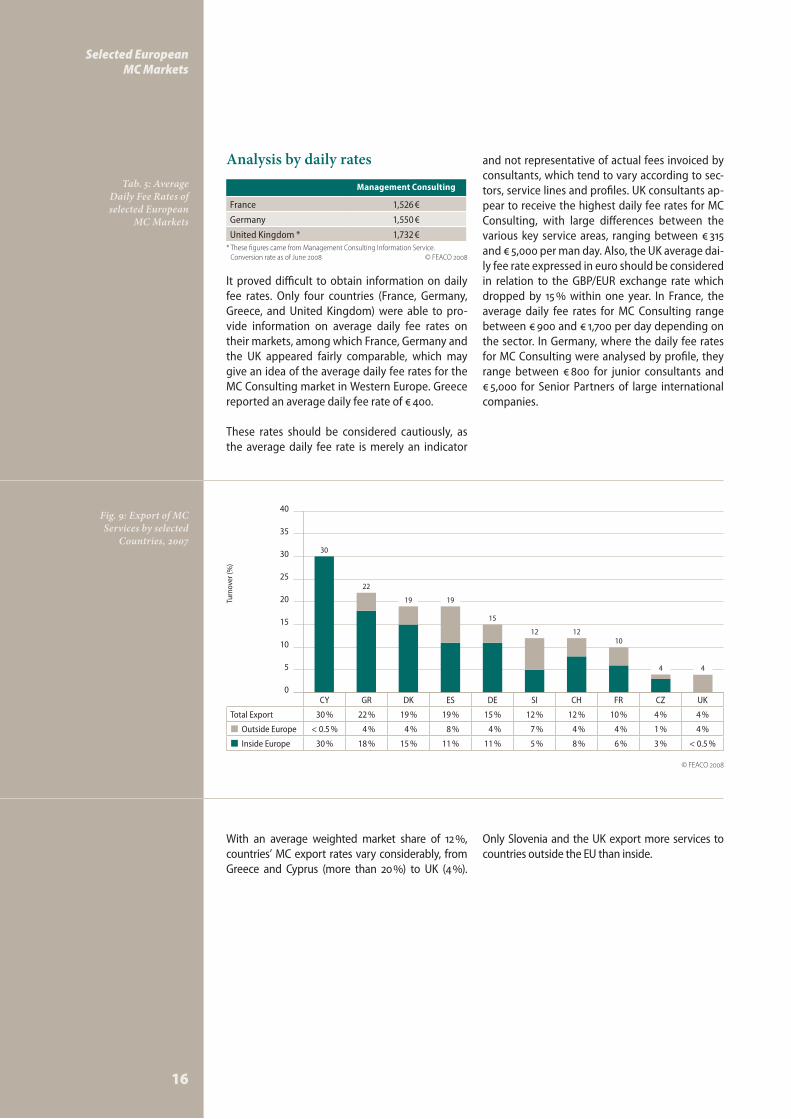
Fig. 9: Export of MC Services by selected
Countries, 2007
CY GR DK ES DE SI CH FR CZ UK
Total Export 30 % 22 % 19 % 19 % 15 % 12 % 12 % 10 % 4 % 4 %
Outside Europe � < 0.5 % 4 % 4 % 8 % 4 % 7 % 4 % 4 % 1 % 4 %
Inside Europe � 30 % 18 % 15 % 11 % 11 % 5 % 8 % 6 % 3 % < 0.5 %
With an average weighted market share of 12 %, countries’ MC export rates vary considerably, from Greece and Cyprus (more than 20 %) to UK (4 %).
Only Slovenia and the UK export more services to countries outside the EU than inside.
30
4
22
19
15
1210
4
12
19
40
35
30
25
20
15
10
5
0
Turn
over
(%)
© FEACO 2008

Selected European MC Markets
17
CH DE DK ES FR GR HU SI UK
Total turnover (million €) 803 24,150 2,150 8,561 7,839 234 346 226 19,070
Major service lines ( %)
Business Consulting (BC) 30 %
54 % 54 %
8 % 52 % 65 % 49 % 61 % 40 %
IT Consulting 14 % 12 % 11 % 8 % 37 % 17 % 18 %
Development & Integration 70 % 20 % 14 % 44 % 16 % 7 % 14 % 8 % 8 %
Outsourcing - 7 % 13 % 36 % 14 % 5 % - 1 % 34 %
Other services - 5 % 19 % - 7 % 15 % - 14 % -
Total 100 % 100 % 100 % 100 % 100 % 100 % 100 % 100 % 100 %
BC Details
Strategy - 17 % - 4 % 10 % 18 % 24 % 26 % 13 %
Organisation/ Operations Management
- 30 % - 3 % 20 % 18 % 9 % 22 % 8 %
Project Management - - - - 13 % 26 % 11 % 4 % 13 %
Change Management - - - 1 % 6 % 3 % 5 % 4 % 3 %
HR Consulting - 7 % - - 3 % 2 % - 6 % 4 %
Total - 54 % 0 % 8 % 52 % 65 % 49 % 61 % 40 %
CH DE DK ES FR GR HU SI UK
Total turnover (million €) 803 24,150 2,150 8,561 7,839 234 346 226 19,070
Major service lines ( %)
Business Consulting (BC)241
12,9691,156
685 4,044 152 170 137 7,571
IT Consulting 3,478 1,027 889 19 128 37 3,509
Development & Integration 562 4,806 301 3,767 1,254 16 48 18 1,602
Outsourcing - 1,594 277 3,082 1,098 12 - 2 6,389
Other services - 1,304 415 - 557 35 - 32 -
Total 803 24,150 2,150 8,561 7,840 234 346 226 19,070
BC Details
Strategy - 3,985 - 342 784 42 83 59 2,422
Organisation/ Operations Management
- 7,245 - 257 1,531 41 31 49 1,487
Project Management - - - - 1,037 60 38 8 2,422
Change Management - - - 86 445 6 17 9 534
HR Consulting - 1,739 - - 247 4 - 12 706
Total - 12,969 - 685 4,044 152 170 137 7,571
Tab. 6: MC Market Composition by Service Line (% of turnover)
Tab. 7: MC Market Composition by Service Line (million €)
Analysis by Service Line
Consulting accounts for on average 57 % of the European consulting companies’ turnover. Three types of countries can be distinguished:
for half of the countries considered, the mar- �
ket share of Consulting activities represents more than 60 % of the total MC Market: Hun-gary (86 %), Slovenia (78 %), Greece (73 %), Ger-many (68 %) and France (63 %). In these coun-tries, Organisation/Operations Management and Project Management are the major activi-ties (accounting for at least a quarter of the to-tal turnover), except for Hungary and Slovenia where Strategy dominates (24 % resp. 26 %);
the countries where Consulting represents be- �
tween 50 % and 60 %: UK (58 %) and Denmark (54 %). For the UK, Outsourcing (34 %) comes just after Business Consulting (40 %). IT Con-sulting (54 %) is the greater activity for Den-mark.
the countries where Consulting represents a �
market share of less than 50 %: Spain (20 %) and Switzerland (30 %). With respectively 44 % and 70 %, Development and Integration are the principal activity in both countries.
© FEACO 2008
© FEACO 2008

18
Selected European MC Markets
Considering the turnover in volume, the four key countries show that:
regarding total � Business Consulting turnover only, France comes in third position after Ger-many and the UK, while Spain comes in third place when regarding the total turnover; for IT Consulting, the UK dominates the market, very closely followed by Germany, respectively € 3,509 bn and € 3,478 bn ;the � Outsourcing market is by far the largest in the UK (53 %) ;the � Development & Integration market is re-alised by Germany and Spain (75 %).
Considering the turnover in volume, Business Consulting stands for different activities accord-ing to the characteristics of the key countries:
Organisation/Operations Management � is the heart of Business Consulting in Germany (56 % of domestic Business Consulting turnover) and in France (38 %) ;for the UK, � Strategy and Project Manage-ment account for 64 % of the Business Con-sulting activities.
Fig. 10: Breakdown of MC in selected Key Countries (million €)
Fig. 11: Breakdown of Business Consulting
in selected Key Countries (million €)
Germany United Kingdom Spain France
Total 24,150 19,070 8,561 7,839
Business Consulting � 12,969 7,571 685 4,043
IT Consulting � 3,478 3,509 1,027 889
Development & Integration � 4,806 1,602 3,767 1,254
Outsourcing � 1,594 6,389 3,082 1,097
Other services � 1,304 n.a. n.a. 557
Germany United Kingdom Spain France
Total 12,969 7,571 685 4,043
HR Consulting � 1,739 706 n.a. 247
Change Management � incl. in OM 534 86 444
Project Management � incl. in OM 2,422 n.a. 1,037
Organisation/Operations Management � 7,245 1,487 257 1,531
Strategy � 3,985 2,422 342 784
24,150
12,969
19,070
7,571
7,839
4,043
8,561
685
25,000
20,000
15,000
10,000
5,000
0
15,000
10,000
5,000
0
Turn
over
(mill
ion
€)Tu
rnov
er (m
illio
n €)
© F
EACO
200
8©
FEA
CO 2
008
Selected European MC Markets
19
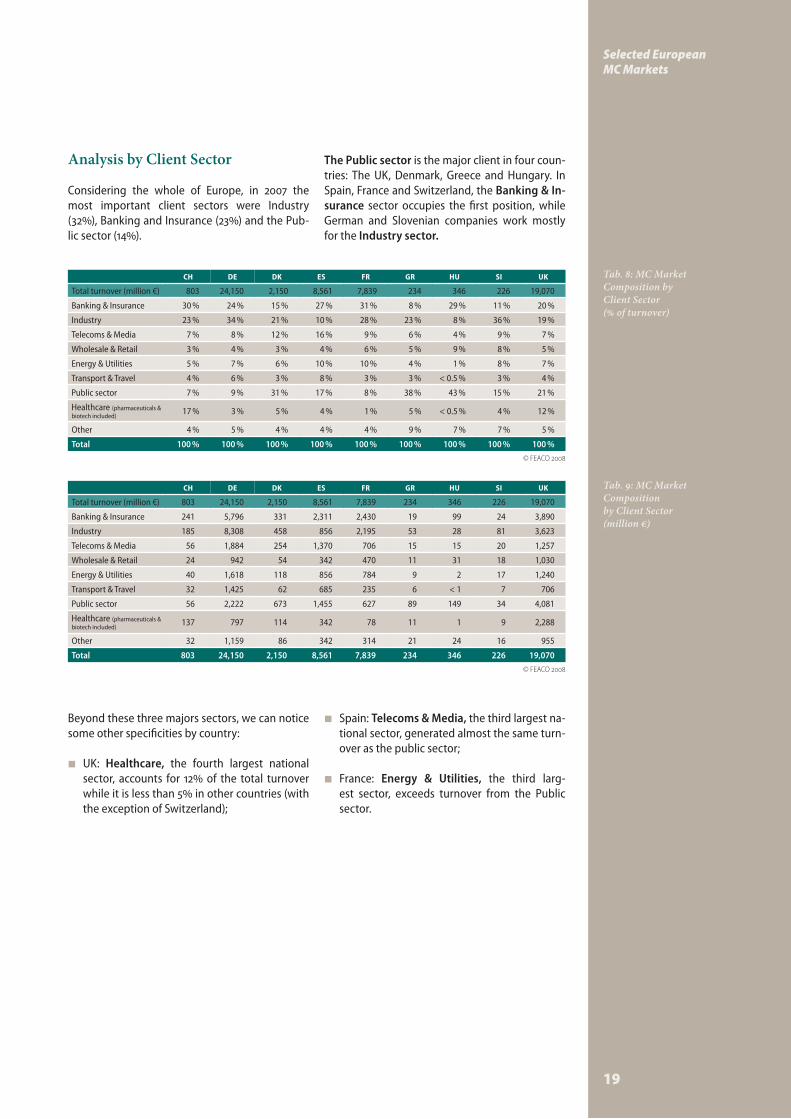
Analysis by Client Sector
Considering the whole of Europe, in 2007 the most important client sectors were Industry (32%), Banking and Insurance (23%) and the Pub-lic sector (14%).
The Public sector is the major client in four coun-tries: The UK, Denmark, Greece and Hungary. In Spain, France and Switzerland, the Banking & In-surance sector occupies the first position, while German and Slovenian companies work mostly for the Industry sector.
CH DE DK ES FR GR HU SI UK
Total turnover (million €) 803 24,150 2,150 8,561 7,839 234 346 226 19,070
Banking & Insurance 30 % 24 % 15 % 27 % 31 % 8 % 29 % 11 % 20 %
Industry 23 % 34 % 21 % 10 % 28 % 23 % 8 % 36 % 19 %
Telecoms & Media 7 % 8 % 12 % 16 % 9 % 6 % 4 % 9 % 7 %
Wholesale & Retail 3 % 4 % 3 % 4 % 6 % 5 % 9 % 8 % 5 %
Energy & Utilities 5 % 7 % 6 % 10 % 10 % 4 % 1 % 8 % 7 %
Transport & Travel 4 % 6 % 3 % 8 % 3 % 3 % < 0.5 % 3 % 4 %
Public sector 7 % 9 % 31 % 17 % 8 % 38 % 43 % 15 % 21 %
Healthcare (pharmaceuticals & biotech included)
17 % 3 % 5 % 4 % 1 % 5 % < 0.5 % 4 % 12 %
Other 4 % 5 % 4 % 4 % 4 % 9 % 7 % 7 % 5 %
Total 100 % 100 % 100 % 100 % 100 % 100 % 100 % 100 % 100 %
CH DE DK ES FR GR HU SI UK
Total turnover (million €) 803 24,150 2,150 8,561 7,839 234 346 226 19,070
Banking & Insurance 241 5,796 331 2,311 2,430 19 99 24 3,890
Industry 185 8,308 458 856 2,195 53 28 81 3,623
Telecoms & Media 56 1,884 254 1,370 706 15 15 20 1,257
Wholesale & Retail 24 942 54 342 470 11 31 18 1,030
Energy & Utilities 40 1,618 118 856 784 9 2 17 1,240
Transport & Travel 32 1,425 62 685 235 6 < 1 7 706
Public sector 56 2,222 673 1,455 627 89 149 34 4,081
Healthcare (pharmaceuticals & biotech included)
137 797 114 342 78 11 1 9 2,288
Other 32 1,159 86 342 314 21 24 16 955
Total 803 24,150 2,150 8,561 7,839 234 346 226 19,070
Tab. 8: MC Market Composition by Client Sector (% of turnover)
Tab. 9: MC Market Composition by Client Sector (million €)
Beyond these three majors sectors, we can notice some other specificities by country:
UK: � Healthcare, the fourth largest national sector, accounts for 12% of the total turnover while it is less than 5% in other countries (with the exception of Switzerland);
Spain: � Telecoms & Media, the third largest na-tional sector, generated almost the same turn-over as the public sector;
France: � Energy & Utilities, the third larg-est sector, exceeds turnover from the Public sector.
© FEACO 2008
© FEACO 2008
20
Selected European MC Markets
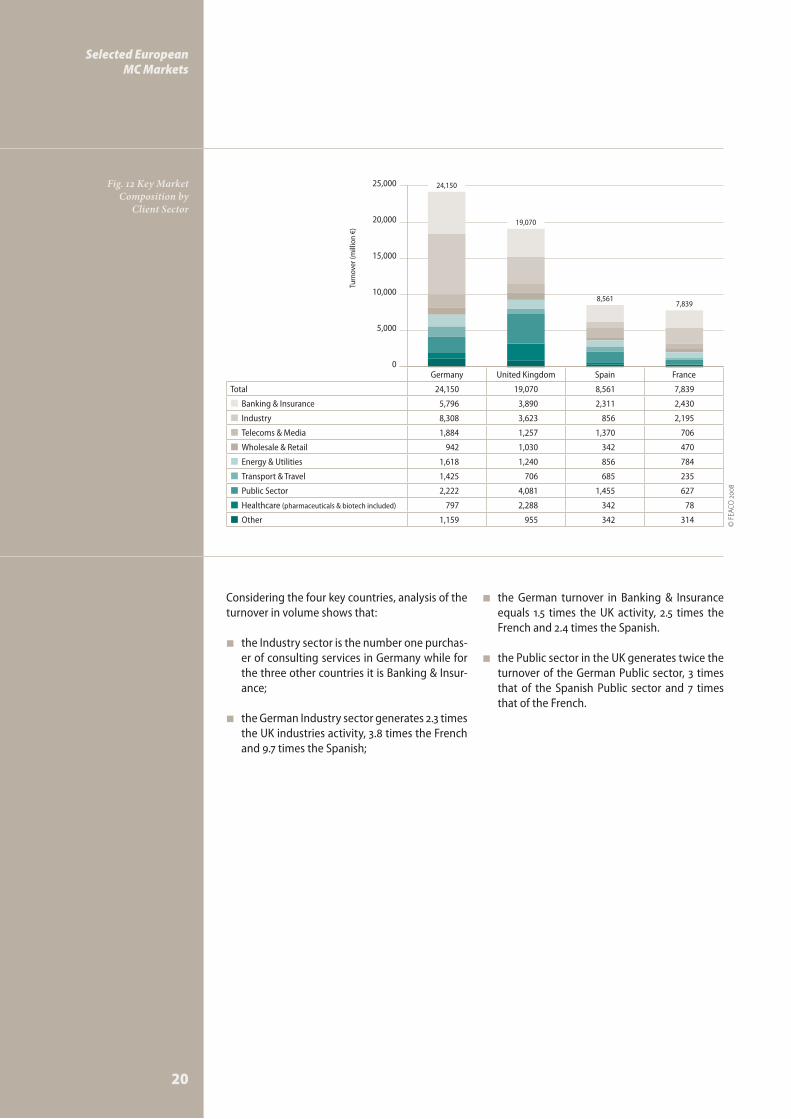
Fig. 12 Key Market Composition by
Client Sector
Germany United Kingdom Spain France
Total 24,150 19,070 8,561 7,839
Banking & Insurance � 5,796 3,890 2,311 2,430
Industry � 8,308 3,623 856 2,195
Telecoms & Media � 1,884 1,257 1,370 706
Wholesale & Retail � 942 1,030 342 470
Energy & Utilities � 1,618 1,240 856 784
Transport & Travel � 1,425 706 685 235
Public Sector � 2,222 4,081 1,455 627
Healthcare � (pharmaceuticals & biotech included) 797 2,288 342 78
Other � 1,159 955 342 314
Considering the four key countries, analysis of the turnover in volume shows that:
the Industry sector is the number one purchas- �
er of consulting services in Germany while for the three other countries it is Banking & Insur-ance;
the German Industry sector generates 2.3 times �
the UK industries activity, 3.8 times the French and 9.7 times the Spanish;
the German turnover in Banking & Insurance �
equals 1.5 times the UK activity, 2.5 times the French and 2.4 times the Spanish.
the Public sector in the UK generates twice the �
turnover of the German Public sector, 3 times that of the Spanish Public sector and 7 times that of the French.
24,150
19,070
7,8398,561
25,000
20,000
15,000
10,000
5,000
0
Turn
over
(mill
ion
€)
© F
EACO
200
8
21
Bulgaria
The Bulgarian market has started to show a clear-er segmentation and positioning of the consulting companies. Demand is increasing, partly because of the entry into the market of foreign companies who are used to hiring consultants. It continues to be the case that only a limited number of Bulgarian com-panies can afford to pay for quality services. The di-versity of consulting services on offer is increasing, as well as the nationalities of the consulting com-panies acting in Bulgaria causing more competition among the consulting companies. New market en-trants keep appearing. More and more firms, even small ones deliver consulting services across borders either personally on assignment basis, or through local partners.
One of the main market drivers continues to be the stable economic situation and the entry of Bulgaria into the EU, which brought considerable foreign in-vestment. EU membership also led to an increase in demand from the Public sector for the “EU adapta-tion”.
Given the substantial increase in funding from the EU Structural & Cohesion Funds (compared to the pre-accession funding), the start of the European Structural Funds programme is also likely to cause a dramatic increase in demand from Public sector cli-ents in 2008. All ministries and the Sofia Municipality are creating databases of consulting firms for the fu-ture beneficiaries of the programmes.
Since the development of projects under the oper-ational programmes differs significantly from the projects under PHARE and ISPA (except for compe-tition and administrative capacity), companies need to re-direct part of their services to the develop-ment of projects funded by the EU Structural and Cohesion Funds.
Management Consultancy services for the Private sector, especially investment services, have steadily increased – at least by 50 %, as a result of the start of the operational programmes and the programme for rural development. This demand is likely to gen-erate new types of consulting services.
Financial stability and business growth allow more companies to invest in consultancy. The many merg-ers and acquisitions demonstrate that the Bulgarian economy is not escaping from internationalisation
and globalisation. The inflow of know-how and business practices has an educational effect on the market. There is an increas-ing need for more knowledge and skills to meet the needs of companies. Investment in IT (hardware & software) and other new technologies, calls for experienced con-sultants to assist with the process of tech-nological restructuring.
Many new companies, new Bulgarian play-ers and foreign companies, are appearing on the market. The increasing competition among the consultants is creating confu-sion among the (potential) clients as there are huge variations in price and quality.
The PHARE and ISPA tenders require a minimum turnover of € 1.5 million from consulting companies. This is a huge constraint for the development of Bul-garian companies for whom this is unachievable. Many public tenders are also out of reach for Bulgar-ian consulting companies because of the excessive references that authorities require.
In addition to the inevitable problems related to the lack of experience with the management of these funds (which can also be seen as an opportunity for Management Consultancy) and the continuing problems with the capacity of the beneficiaries to administer the grants, Management Consultancy for Public sector clients is also confronted with the risk of cancellation of the funds by the European Com-mission because of, for instance, the lack of ade-quate control systems or the lack of absorption due to slow and bureaucratic procedures, as well as the relatively low ‘administrative capacity’ of the public institutions involved.
The average fee rates are slowly going up because of the increased confidence of Bulgarian consultants in competing with the international consultants.
The major challenge for the MC industry in Bulgar-ia is the difficulty of recruiting or retaining qualified staff. There is a growing need for qualified person-nel and, in view of this, a high demand for vocational training services. Since there are only few organisa-tions that provide such services, employers them-selves are searching for ways to increase the compe-tence and skills of their employees.
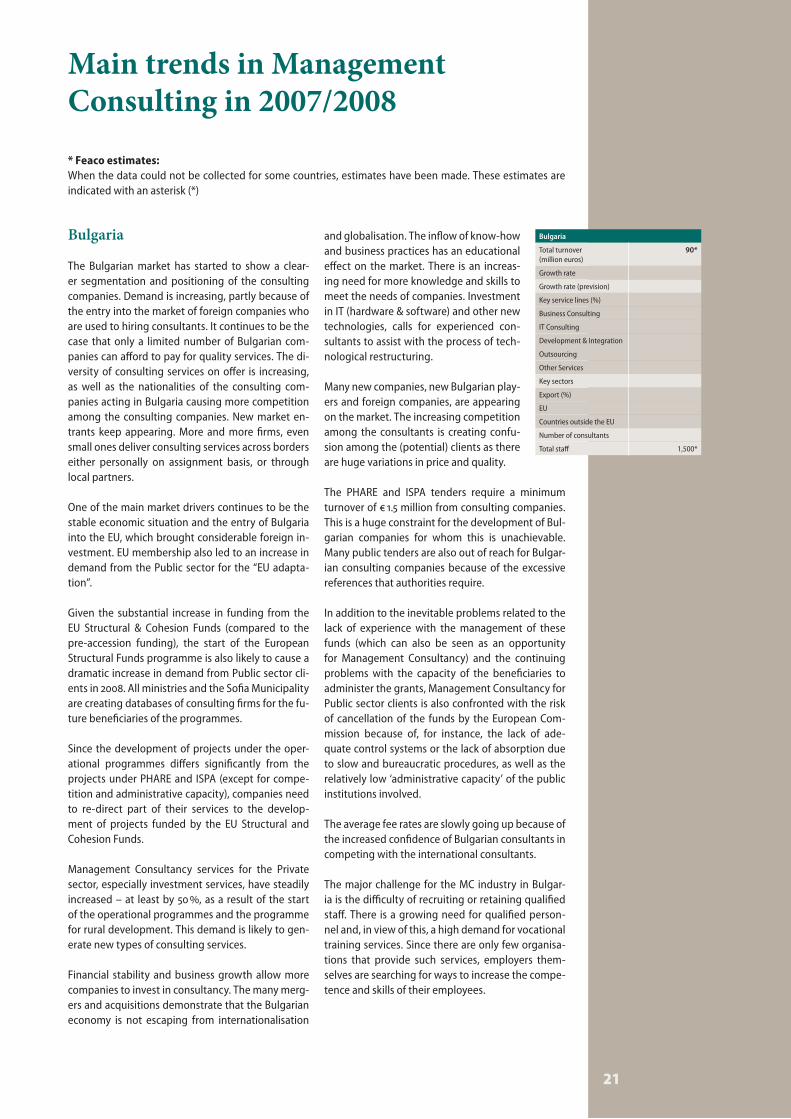
Bulgaria
Total turnover (million euros)
90*
Growth rate
Growth rate (prevision)
Key service lines (%)
Business Consulting
IT Consulting
Development & Integration
Outsourcing
Other Services
Key sectors
Export (%)
EU
Countries outside the EU
Number of consultants
Total staff 1,500*
Main trends in Management Consulting in 2007/2008
* Feaco estimates: When the data could not be collected for some countries, estimates have been made. These estimates are indicated with an asterisk (*)

22
Main trends in Management Consulting
in 2007/2008
Client behaviour towards consultants still varies widely. One of the reasons for the continuing reti-cence of clients could be the lack of knowledge on how to deal with consultants and how MC services can benefit clients. The current “retro-active” and reticent behaviour of clients hampers the develop-ment of the market. More work is needed to pro-mote the sector in general and to teach clients how to work with consultants.
Nevertheless, some progress can be observed as more clients become aware of the benefits of shar-ing their short to long term development plans with consultants and appear to be interested in develop-ing long term relationships. There are indications that -compared to previous years - some clients are better able to assess the quality of the services. Cli-ents therefore become more demanding (in a posi-tive manner) about deliverables and the relationship with the consultants. More foreign consultancies and the increase in demand for quality consultancy serv-ices makes it possible to have project fees which are well above the level of 2-3 years ago, but also leads to more Bulgarian companies and more competition.
Cross-border activities of the Bulgarian companies remain limited to their closest neighbours in the Bal-kan countries (predominantly Serbia, FYROM, Bosnia and Herzegovina, Montenegro and Croatia), as well as some ex-Soviet republics. This is primarily due to the already existing relations between these coun-tries, secondly, to the similar macro-economic de-velopment of those countries which creates possibil-ities for exporting know-how to those neighbouring countries and thirdly, to the common language.
Some Bulgarian companies though have expecta-tions to expand to the West-European market. Oth-ers (members of international networks) aim at con-tinuing growth in the Near East and Asia.
The demand for consulting services is very varied: production management and modernization, solv-ing social and urban problems of the communities, infrastructure projects for regional development and protection of the environment etc. This will re-quire more effective control of the competency of the consultancy providers.
Czech Republic
The Czech economy continued to grow steadily, in line with the general Europe-an economic development. The perspec-tive for 2008 is continued growth, which is also one of the main drivers of the de-velopment of the MC market as well as the globalisation of the economy.
Together with the large companies more medium size companies started or contin-ued demanding MC services. More local companies prepared for mergers and ac-quisitions than previously.
The Czech MC sector consists broadly of 2 parts:
1. International companies, working for foreign inves-tors or multinational companies, large Czech compa-nies and government authorities and Czech owned companies, some of which rank among the largest market players and whose position is comparable to that of some international players. These companies, approximately 30 in number, ac-count for more than 50 % of the market turnover. All the big international players are present on the Czech market.
2. Hundreds of small consultancy companies - an esti-mated 1500 - and companies that have a consultancy division as a part of a wider range of activities. These companies account for the rest of the market turnover.
The main clients come from the industry sector, fol-lowed by the Banking sector and the Public sector/
government. The major issues are: restructuring, in-crease of efficiency and competitiveness.
The average fee rate shows very little improvement, and when converted into euro it shows that the im-provement is more due to the appreciation of the Czech crown than to an actual increase.
The major present and/or future challenges and op-portunities for the MC industry are the continued re-structuring due to globalisation (cost reductions, in-ternal processes optimization), strategy adjustments due to increasing global competition and support of more international trade involvement and activities.
The client – consultant relationship is steadily im-proving. More and more medium-sized or even smaller companies are requesting consulting serv-ices. The major partner for a consultant remains top management.
Cost reduction, globalisation (new markets & com-petition), implementation of new IT and communi-cation systems are expected to become the 3 main priorities of clients in the next years.
Local companies (Czech owned) are expanding abroad, especially to the neighbouring countries (Slovakia, Poland) and further into east and south-east Europe (Russia, Bulgaria, Romania). Some even expanded to the Far East (particularly China). In gen-eral, they are successful, they tend to follow their Czech clients who are considering expanding or have obtained assignments from local companies.
Czech Republic
Total turnover (million euros)
439
Growth rate 7.7 %
Growth rate (prevision) 2.2 %
Key service lines (%)
Business Consulting
IT Consulting
Development & Integration
Outsourcing
Other Services
Key sectors
Export (%)
EU
Countries outside the EU
Number of consultants 8,530
Total staff 9,290

Main trends in Management Consulting in 2007/2008
Denmark
For more detailed information on the Danish MC market see the Dansk Management Raad (DMR) report on www.dmr.nu, or email to: [email protected]
Denmark
Total turnover (million euros)
2,150
Growth rate 10.4 %
Growth rate (prevision) 23.6 %
Key service lines (%)
Business Consulting 54.0 %
IT Consulting
Development & Integration 14.0 %
Outsourcing 13.0 %
Other Services 19.0 %
Key sectors Public Sector (31 %)Industry (21 %)
Export (%) 19.0 %
EU 14.6 %
Countries outside the EU 4.4 %
Number of consultants n.a.
Total staff 14,150*
23
France
2007 was a good year for most French consulting firms across all areas. Small firms are more vulnera-ble to market changes, but even most of these re-ported good growth as well. Of the three recent years of growth, 2007 was the best year so far. Over-all growth was 13.7 % in 2007, bringing the total mar-ket turnover to an estimated € 7.8 billion.
For 2008, widespread media coverage of the sub-prime and wider credit crisis led many consulting firms to expect demand for consulting to fall. But the overwhelming majority of firms have not yet seen any sign of an economic downturn. This puts planners and forecasters in a difficult position: most of them expect growth in demand for consulting to slow down towards the year end, but there are no signs of any slowdown yet and no idea of what is in store: a temporary downturn or a full-fledged crisis.
Globalisation, although not a new issue, particular-ly to the bigger firms accustomed to working with large, global clients, continues to be a main driver. What is striking however is the extent to which even quite small-scale firms now need to be prepared to work in other countries as their clients, too, become more international. For many firms – big and small – being international is viewed as a critical com-ponent for future growth. Being purely a domestic player also limits the kinds of clients you can work with. This issue is also driving a restructuring of the consulting industry itself.
For all the effort and money invested by consulting companies in sales and marketing, most clients still complain that they find it hard to tell them apart and get clarity about the fields in which a firm special-ises. This is not a new criticism; however, the pros-pect of an economic downturn puts the issue into an even sharper relief.
If anything, the market appears to be mov-ing in favour of the specialists. The irony is that specialisation is coming at a time when the boundary between consulting disciplines is being eroded, “Strategy firms are doing more operational work, oper-ational consulting and accounting firms are looking to do more strategy work and IT firms are talking about large-scale busi-ness transformations.” Therefore, clients are keen to segment the industry in order to understand the underlying differences between firms, something that is likely to make it harder for firms to move into new markets.
Continued growth inevitably means in-creasingly intense competition to attract and retain the best people, which, subsequently, inevitably creates salary inflation. People are attracted to the industry for different reasons: there is much more emphasis on corporate social responsibility and the ability of a company to accommodate work-life bal-ance issues.
Over time, the “war for talent” will be one of the fac-tors driving consolidation in the consulting industry. At the same time, there is an awareness of the risks of recruiting too quickly. “Consulting is a less attrac-tive industry today than it was in 2000 because peo-ple still remember that it recruited too quickly and then subsequently had to lay people off in 2001-04 because of overcapacity”.
Twenty consulting companies (9 % of the total mar-ket) operating in the French market reported a turn-over of over € 56 million in 2007. These companies, whose turnover varied between € 56 million and € 151 million, showed a record growth rate of 27 % in 2007, i.e. twice as much as the average growth rate. Together they account for 70 % of the total market turnover. This performance is mainly due to two fac-
France
Total turnover (million euros)
7,839
Growth rate 13.7 %
Growth rate (prevision) 9.0 %
Key service lines (%)
Business Consulting 52.0 %
IT Consulting 11.0 %
Development & Integration 16.0 %
Outsourcing 14.0 %
Other Services 7.0 %
Key sectors Banking & Insurance (31 %)
Industry (28 %)
Export (%) 10.0 %
EU 6.0 %
Countries outside the EU 4.0 %
Number of consultants 47,115
Total staff 52,350

24
Main trends in Management Consulting
in 2007/2008
tors: concentration of the number of players as a re-sult of mergers and acquisitions, and the resurgence of consulting activities within audit firms.
At the other end of the spectrum, consulting firms with a turnover of less than € 14 million repre-sent 78 % of the number of firms and 16 % of mar-ket share. These smaller firms can be considered as specialists, but the advantages of this may not out-weigh these three major drawbacks:
Lack of staff: In an already tough recruitment �
market, smaller firms have found it hard to com-pete with the higher salaries larger firms can af-ford to offer.
Changes in procurement: The centralisation of �
procurement and introduction of preferred sup-plier lists almost always favours larger, better known firms.
Globalisation: The more clients acquire interna- �
tional operations, the more they expect the con-sulting firms they work with to be able to work in different parts of the world, a situation that inevi-tably favours the large, global consulting firms.
The only demand to grow faster than the overall average in 2007 was that of the Industry sector. De-mand by this sector grew at roughly twice the aver-age rate and now accounts for 28 % of total demand. By contrast demand by the Financial Services sector, which grew considerably in the two previous years, remained in line with the average in 2007 and de-mand by the Public sector and Energy sector shrank.
2007 was a good year for manufacturing consultants because of a combination of restructuring, global sourcing and intense pressure on costs. Some of that restructuring has been prompted by globalisation, and, as a result, Supply Chain and Sourcing consult-ing are booming in this sector. Some of the increase however is the result of private equity activity and that, too, is driving up demand for consultants.
Nevertheless, Financial Services still account for 31 % of the total market. More than 60 % of the work is generated by banks; 32 % comes from Insurance companies. Widespread media coverage of the sub-prime and wider credit crisis led many consulting firms to expect demand for consulting from the fi-nancial sector to fall. One specific reason for con-tinued growth is that, although the overall level of regulatory-driven activity is now falling, operational risks issues have triggered an increase in risk-relat-ed work. A continuous source of demand forms the large-scale operational and IT improvement work that financial institutions competing in global mar-kets have to undertake.
In 2007 the telecoms sector grew by 7 % on 2006. Demand for consulting continues to be driven by a combination of global competition, cost and other operational pressures and technology change. How-ever, intense competition between consulting firms makes this a particularly tough market.
Demand for consulting among energy companies fell by 12.5 % in 2007. This is surprising because in other countries, the high price of oil has meant that oil companies have money to invest and spending on consulting has been especially buoyant. How-ever, analysed over a longer period, demand in this sector is still significantly higher than it was just a few years ago. The fall in demand in 2007 may there-fore simply be a sign that clients, having spent heav-ily in previous years, are drawing breath.
Demand from the Public sector is down by around 9 % on 2006. Some of the big initiatives commis-sioned in 2006 have now come to an end and the Public sector is trying to save money across the board. “The state is out of money, but the Pub-lic sector will remain a significant market for con-sultants because there is a big need to modernize.” This means that, irrespective of the fall in demand in 2007, underlying demand is still roughly twice what it was at the turn of the century. However, the mar-ket is likely to change, as public spending cuts have a greater impact. Firms do not expect a sudden fall in expenditure on consultants, but a shift towards a smaller number of bigger projects.
Average daily fee rates have risen in the last year by between 2 and 6 %. The 14 % overall growth in 2007 can be attributed to price increase (4 %) and volume (10 %).
Procurement has become more powerful, and the more international a company is, the more powerful its procurement department. It cuts the cost of sales because being on a preferred supplier list means getting invited to tender for more projects but, at the same time, it keeps prices low even when de-mand is high, because consultants are working to a pre-defined set of fee rates. Rates for Strategy Con-sulting appear to have held up well. The more spe-cialised a firm’s skills, the less it is subject to price pressure. In the Public sector in particular, managers do not hesitate to pay higher rates for higher qual-ity.
For more detailed information on the French MC market see the Syntec Management report: Etude Annuelle 2007/2008 sur le Marché du Conseil en Management en France; www.syntec-management.com, or email to: [email protected]
Main trends in Management Consulting in 2007/2008
25
Germany
In 2007 the turnover increased by 11.8 % to € 16.4 bil-lion (2006: € 14.7 billion). In spite of the worldwide conjuncture risks the prognosis for the consultancy sector in Germany for 2008 is very optimistic. Almost 80 % of the Consulting firms have positive expec-tations. Many plan to recruit more staff, even many small and medium-sized firms. Companies have the intention to increase the share of female consultants from 18 % in 2007 to 25 % in 2010.
Clients expect demonstrated value added. For 2008 the sector expects impulses from the Chemical and Pharmaceutical sector, the Machinery sector and the Utilities sector. By the selection of consultants four criteria are important: Expertise in implementation, a high impact on client success, knowledge and un-derstanding of client’s requirements and solutions.
The changes in turnover in 2007 differed consider-ably between the various market segments. The firms in the sector of € 5 - € 45 million turnover re-ported an average increase of 14 % (2006: 10.1 %) in comparison to the previous year. More than half re-ported an increase of over 15 % (2006: 35 %). Compa-nies with a turnover of over € 45 million reported an 11 % increase (2006: 8.5 %). Also 50 % of the compa-nies in the category € 500 000 – € 1 million report-
ed more than 15 % growth. However, there were not only winners this year; quite a few smaller firms again reported a de-crease in turnover: about 20 % of the com-panies with a turnover of less than € 250 000 (2006: 19 %).
The largest service sector remains Oper-ations Management which accounts for 30 % of the market. Development and In-tegration for 20 %, Strategy Consulting for 17 % and IT Consulting for 14 %. HR Con-sulting and Outsourcing both for about 7 %.
There were no significant changes in the client sectors. The highest demand still comes from the Automotive industry, Machinery and other Manufacturing sectors, accounting for one third of total demand. The Financial sector ac-counts for one quarter of total demand.
For more detailed information on the German MC market see the Bundesverband Deutscher Unterneh-mensberater (BDU) report: Facts & Figures zum Be-ratermarkt 2007/2008; http://www.bdu.de/Manage-mentberatung.html,or email to: [email protected]
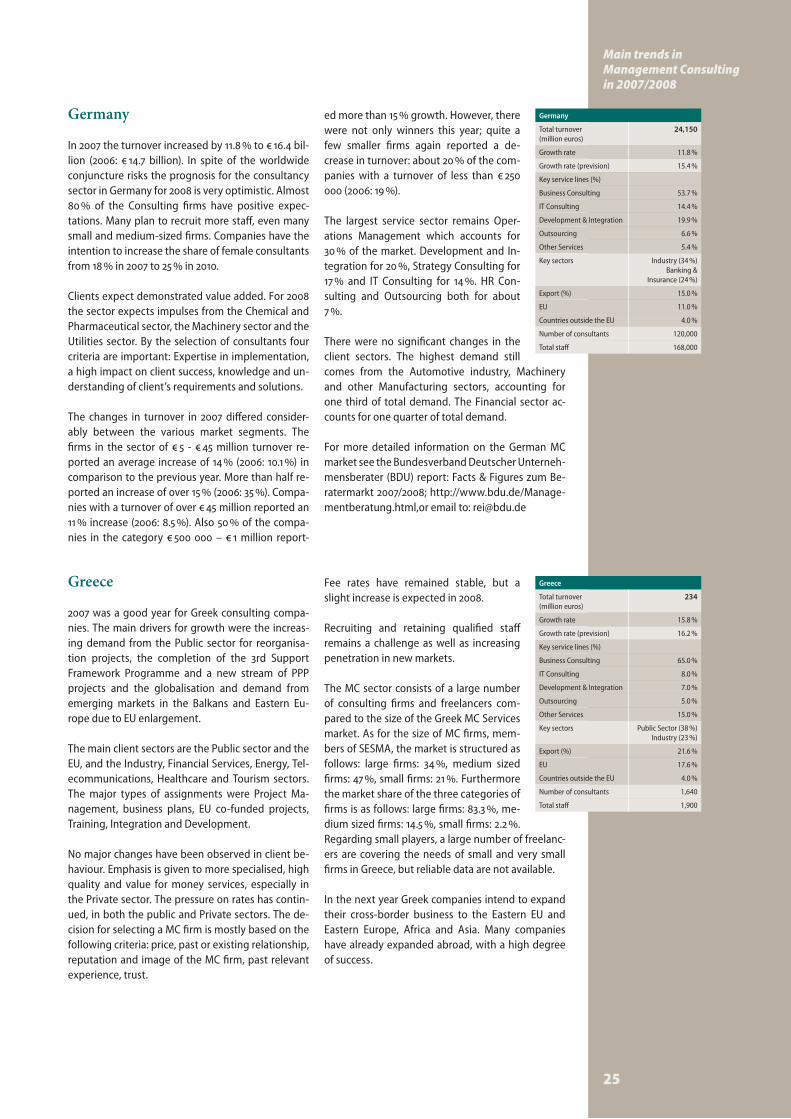
Germany
Total turnover (million euros)
24,150
Growth rate 11.8 %
Growth rate (prevision) 15.4 %
Key service lines (%)
Business Consulting 53.7 %
IT Consulting 14.4 %
Development & Integration 19.9 %
Outsourcing 6.6 %
Other Services 5.4 %
Key sectors Industry (34 %) Banking &
Insurance (24 %)
Export (%) 15.0 %
EU 11.0 %
Countries outside the EU 4.0 %
Number of consultants 120,000
Total staff 168,000
Greece
2007 was a good year for Greek consulting compa-nies. The main drivers for growth were the increas-ing demand from the Public sector for reorganisa-tion projects, the completion of the 3rd Support Framework Programme and a new stream of PPP projects and the globalisation and demand from emerging markets in the Balkans and Eastern Eu-rope due to EU enlargement.
The main client sectors are the Public sector and the EU, and the Industry, Financial Services, Energy, Tel-ecommunications, Healthcare and Tourism sectors. The major types of assignments were Project Ma-nagement, business plans, EU co-funded projects, Training, Integration and Development.
No major changes have been observed in client be-haviour. Emphasis is given to more specialised, high quality and value for money services, especially in the Private sector. The pressure on rates has contin-ued, in both the public and Private sectors. The de-cision for selecting a MC firm is mostly based on the following criteria: price, past or existing relationship, reputation and image of the MC firm, past relevant experience, trust.
Fee rates have remained stable, but a slight increase is expected in 2008.
Recruiting and retaining qualified staff remains a challenge as well as increasing penetration in new markets.
The MC sector consists of a large number of consulting firms and freelancers com-pared to the size of the Greek MC Services market. As for the size of MC firms, mem-bers of SESMA, the market is structured as follows: large firms: 34 %, medium sized firms: 47 %, small firms: 21 %. Furthermore the market share of the three categories of firms is as follows: large firms: 83.3 %, me-dium sized firms: 14.5 %, small firms: 2.2 %. Regarding small players, a large number of freelanc-ers are covering the needs of small and very small firms in Greece, but reliable data are not available.
In the next year Greek companies intend to expand their cross-border business to the Eastern EU and Eastern Europe, Africa and Asia. Many companies have already expanded abroad, with a high degree of success.
Greece
Total turnover (million euros)
234
Growth rate 15.8 %
Growth rate (prevision) 16.2 %
Key service lines (%)
Business Consulting 65.0 %
IT Consulting 8.0 %
Development & Integration 7.0 %
Outsourcing 5.0 %
Other Services 15.0 %
Key sectors Public Sector (38 %)Industry (23 %)
Export (%) 21.6 %
EU 17.6 %
Countries outside the EU 4.0 %
Number of consultants 1,640
Total staff 1,900

26
Main trends in Management Consulting
in 2007/2008
Poland
The economic situation in Poland in 2007 was good; there was a 6,5 % GDP growth rate and significant business activity. There were many projects especially investment and restructuring projects, which account-ed for a large part for the 15 % increase in turnover compared to 2006. The same economic growth is expected for 2008, but already stagnation in EU projects can be observed, as projects from the previous EU financing period 2004-2006 are still be-ing finalised and the start of the 2007-2013 period has been delayed.
The most important positive influences on the de-velopment of the MC market are the economic growth in the country, but also the European Struc-tural Funds, which caused an increase of demand from consulting services in the public as well as in the private sector.
Despite the economic growth, there are some fac-tors that cause destabilization on the market, such as political changes and a lack of decision taking by the public sector (especially as regards public health and energy).
The Polish MC market continues to develop progres-sively, new small local firms continue to appear, but the market is dominated by the so-called “Big Four” consulting companies.
Clients come mostly from the Financial sector (banks, insurance companies, foundations), the En-ergy sector and Telecommunications sector. The Public sector is also an important client.
Fee rates for consulting services remained mostly stable for all types of consulting services.
The market is very competitive; supply is higher than demand. Clients’ choice is increasing. The qual-ity of the Consulting services and the level of inno-vation are crucial criteria for selecting a Consulting company. Globalisation, new IT and Telecommuni-cation systems, privatisation and many other fac-tors caused not only an increase in demand for con-sultancy services but also influenced the nature and quality of this demand. Clients expect creativity and innovation, and often also immediate results. Con-sulting companies are thus faced with higher client expectations and increasing competition, especially among small local firms.
Clients have become more experienced in business and are more aware of the situation on the national market. The client - consultant relationships are tak-ing the form of a cooperation/partnership. Clients themselves take a more creative and active attitude and are more demanding about results. It is more and more common to build project teams composed of both client and consultant representatives. Types and length of assignments vary, depending on the subject of the project.
The following objectives will become/remain the main priorities of clients in the next years:
a) Supply optimization, b) Globalization (new markets & competition), c) Innovation, d) Increased risk, e) Implementation of new IT and Communication
systems
Local companies appear to have little intention to expand their business cross-border. Those who tried to do so in previous years, for example in Eastern Eu-rope, did not succeed.
Poland
Total turnover (million euros)
299*
Growth rate 15.0 %
Growth rate (prevision)
Key service lines (%)
Business Consulting
IT Consulting
Development & Integration
Outsourcing
Other Services
Key sectors
Export (%)
EU
Countries outside the EU
Number of consultants
Total staff 6,000*
Portugal
In 2007 there was a moderate recovery of the economic activity in Portugal, with a GDP growth of around 1.9 %, according to the Bank of Portugal (in 2005 and 2006 the GDP growth was 0.5 % and 1.2 %, re-spectively). This evolution of the Portu-guese economy was mostly due to an in-crease in productivity, reflecting higher capacity utilisation, and also to higher ex-ports, domestic demand and private in-vestment. Exports were the most dynamic component of demand, with an estimated growth of around 7 %.
For 2008 the Portuguese financial authorities expect a continuation of the economic recovery, but with a
GDP growth of only around 2 %. This projection re-flects higher than usual uncertainty and downward risks, related to the international economic and fi-nancial situation.
In the last few years the corporate sector has been undergoing a restructuring process, aimed at re-ducing costs and increasing the added value of products. As a result, exports are becoming more capital and technology-intensive and less labour-intensive.
Companies need to be more competitive in order to survive and to do so many hire consultants to get ad-vice. The slight increase in investment (around 2.6 %, according to the Bank of Portugal) has also been a driver for growth in the consultancy market.
Portugal
Total turnover (million euros)
1,100
Growth rate 4.8 %
Growth rate (prevision) 4.9 %
Key service lines (%)
Business Consulting
IT Consulting
Development & Integration
Outsourcing
Other Services
Key sectors
Export (%)
EU
Countries outside the EU
Number of consultants 8,200
Total staff 15,150

Main trends in Management Consulting in 2007/2008
27
Uncertainty in the economic outlook is probably the main constraint to growth. The recovery of the Portuguese economy has been steady in the last 2 years, but the recent evolution of the international situation has had an impact in the confidence level of businessmen.
The Portuguese Management Consultancy market is dominated by multinational companies with long experience and strong ties with national corporate groups and with branches of multinational compa-nies. There are also independent small and medium size companies, highly specialised in some areas of activity, focused on the client and with a good cost/benefit ratio. Some of these companies have signifi-cant international experience, particularly in African Portuguese speaking countries.
The major national corporate groups and the multi-national companies are the main clients of the sec-tor. However, some small and medium sized compa-nies regularly hire management consultants. These are mostly companies that have a long-term vision of their business and want to expand it.
The main client sectors are consumer goods and Public administration. The major issues manage-ment consultants address are: competitive gains; cost reduction and innovation. These are the main benefits clients want to achieve when hiring a con-sultant.
Due to the slow or moderate economic recovery of the last 3 years, the average fee rates remained al-most unchanged. This has led to a decrease in profit margins for the companies. For 2008 no significant change is expected.
With the full implementation of the National Stra-tegic Reference Framework (known as “QREN” in Portugal), which will last until 2013, investment lev-els, both public and private, will increase in the next years. The funds will help entrepreneurs and exist-ing companies achieve competitive gains through
product innovation, better qualifications and sus-tainable development. This constitutes an opportu-nity for management consultants to intervene in the restructuring of the economy.
Large public works (new Lisbon Airport, high speed railway network, new bridges, roads and dams) are also expected to have a positive impact on Manage-ment Consultancy growth.
When clients hire a consultant, they want solutions to their problems with fast and clear results. There-fore they have become more selective, choosing consultants that have proven to be competent and results oriented in the past. In addition to this, in the last years inefficient consultancies have had to close their doors. So the market is now more competitive and clients are more demanding.
Growth, cost reduction and Client Relationship Man-agement will become/remain the 3 main priorities of clients in the next years.
The Portuguese Management Consultancy com-panies that have international activity are main-ly focused on the Portuguese speaking countries, particularly the African ones. After several years of conflicts, these countries are now more stable and are developing their economies.
In 2007 Angola had a GDP growth of 24 % and Por-tuguese exports to this market increased by 19 %. Companies from several sectors want to take advan-tage of the Angolan economic recovery, which is due to continue, and many have already set up branches in the country.
Management consultancies are also interested in other markets, like Eastern Europe and North Afri-ca, and they are trying to take advantage of the op-portunities offered by EU framework contracts and by other multilateral agencies (ADB, AFDB, WB and IADB).
Romania
In recent years Romania has become a hotspot for western European investments; Petrol, Automotive, Utilities and Banking are some of the economic sec-tors which underwent important transformations as a result of the entrance of large multinational play-ers on the respective markets. New markets and economic sectors are emerging, therefore offering significant growth potential for the Romanian mar-ket, which will definitely have a positive effect on the MC market.
The main market drivers were the same as last year’s: economy stability and growth, foreign investments
and the inflow of EU money. The con-straints also remained the same: bureauc-racy and the low acceptance of MC services by both the Public and the Private sector.
The Romanian MC sector is not dominated by a few players, although the “Big Four” ac-count together for approximately 30 % of the market turnover. Probably another 30 % is imported from abroad, and the rest is billed by local players. The local players market (around 800 companies) is atomised; a con-solidation is expected over the next years. From the local players only around 5 compa-nies have turnovers of over € 3 million.
Romania
Total turnover (million euros)
340
Growth rate 30.0 %
Growth rate (prevision) 40.0 %
Key service lines (%)
Business Consulting
IT Consulting
Development & Integration
Outsourcing
Other Services
Key sectors
Export (%)
EU
Countries outside the EU
Number of consultants 7,000
Total staff 8,750
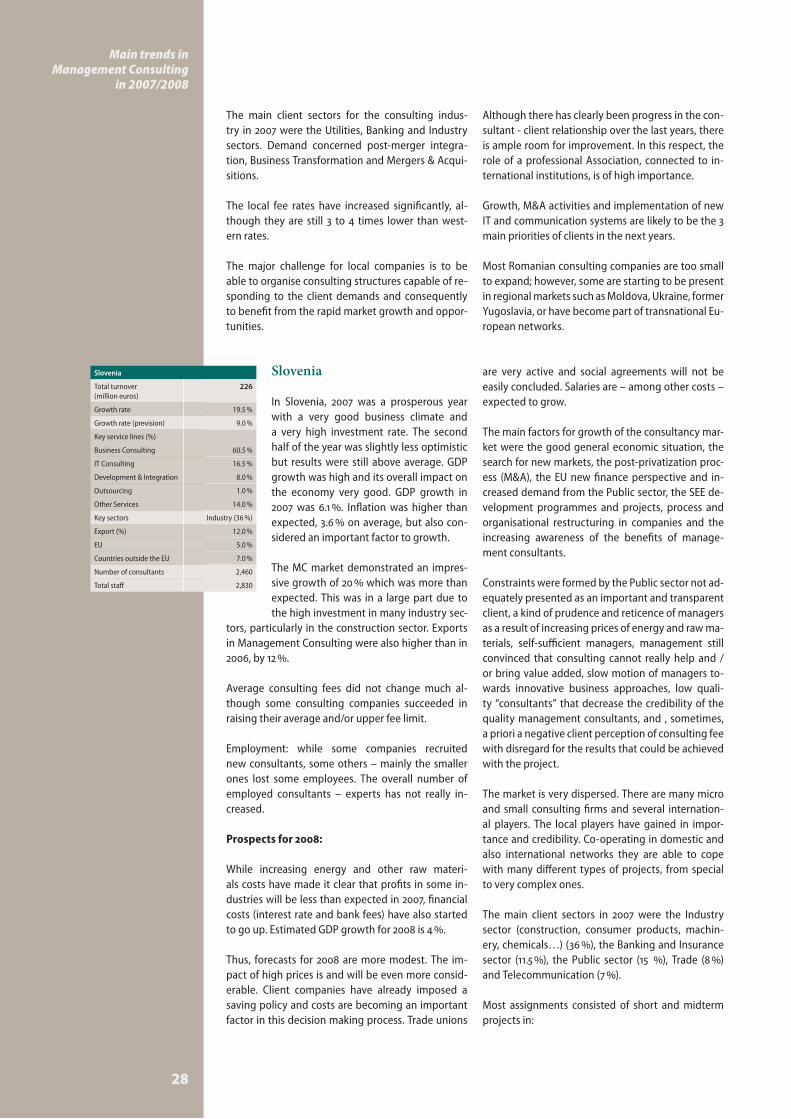
28
Main trends in Management Consulting
in 2007/2008
The main client sectors for the consulting indus-try in 2007 were the Utilities, Banking and Industry sectors. Demand concerned post-merger integra-tion, Business Transformation and Mergers & Acqui-sitions.
The local fee rates have increased significantly, al-though they are still 3 to 4 times lower than west-ern rates.
The major challenge for local companies is to be able to organise consulting structures capable of re-sponding to the client demands and consequently to benefit from the rapid market growth and oppor-tunities.
Although there has clearly been progress in the con-sultant - client relationship over the last years, there is ample room for improvement. In this respect, the role of a professional Association, connected to in-ternational institutions, is of high importance.
Growth, M&A activities and implementation of new IT and communication systems are likely to be the 3 main priorities of clients in the next years.
Most Romanian consulting companies are too small to expand; however, some are starting to be present in regional markets such as Moldova, Ukraine, former Yugoslavia, or have become part of transnational Eu-ropean networks.
Slovenia
In Slovenia, 2007 was a prosperous year with a very good business climate and a very high investment rate. The second half of the year was slightly less optimistic but results were still above average. GDP growth was high and its overall impact on the economy very good. GDP growth in 2007 was 6.1 %. Inflation was higher than expected, 3.6 % on average, but also con-sidered an important factor to growth.
The MC market demonstrated an impres-sive growth of 20 % which was more than expected. This was in a large part due to the high investment in many industry sec-
tors, particularly in the construction sector. Exports in Management Consulting were also higher than in 2006, by 12 %.
Average consulting fees did not change much al-though some consulting companies succeeded in raising their average and/or upper fee limit.
Employment: while some companies recruited new consultants, some others – mainly the smaller ones lost some employees. The overall number of employed consultants – experts has not really in-creased.
Prospects for 2008:
While increasing energy and other raw materi-als costs have made it clear that profits in some in-dustries will be less than expected in 2007, financial costs (interest rate and bank fees) have also started to go up. Estimated GDP growth for 2008 is 4 %.
Thus, forecasts for 2008 are more modest. The im-pact of high prices is and will be even more consid-erable. Client companies have already imposed a saving policy and costs are becoming an important factor in this decision making process. Trade unions
are very active and social agreements will not be easily concluded. Salaries are – among other costs – expected to grow.
The main factors for growth of the consultancy mar-ket were the good general economic situation, the search for new markets, the post-privatization proc-ess (M&A), the EU new finance perspective and in-creased demand from the Public sector, the SEE de-velopment programmes and projects, process and organisational restructuring in companies and the increasing awareness of the benefits of manage-ment consultants.
Constraints were formed by the Public sector not ad-equately presented as an important and transparent client, a kind of prudence and reticence of managers as a result of increasing prices of energy and raw ma-terials, self-sufficient managers, management still convinced that consulting cannot really help and /or bring value added, slow motion of managers to-wards innovative business approaches, low quali-ty “consultants” that decrease the credibility of the quality management consultants, and , sometimes, a priori a negative client perception of consulting fee with disregard for the results that could be achieved with the project.
The market is very dispersed. There are many micro and small consulting firms and several internation-al players. The local players have gained in impor-tance and credibility. Co-operating in domestic and also international networks they are able to cope with many different types of projects, from special to very complex ones.
The main client sectors in 2007 were the Industry sector (construction, consumer products, machin-ery, chemicals…) (36 %), the Banking and Insurance sector (11.5 %), the Public sector (15 %), Trade (8 %) and Telecommunication (7 %).
Most assignments consisted of short and midterm projects in:
Slovenia
Total turnover (million euros)
226
Growth rate 19.5 %
Growth rate (prevision) 9.0 %
Key service lines (%)
Business Consulting 60.5 %
IT Consulting 16.5 %
Development & Integration 8.0 %
Outsourcing 1.0 %
Other Services 14.0 %
Key sectors Industry (36 %)
Export (%) 12.0 %
EU 5.0 %
Countries outside the EU 7.0 %
Number of consultants 2,460
Total staff 2,830

Main trends in Management Consulting in 2007/2008
29
strategic development �
ownership restructuring �
growth management �
consulting for competing in public tenders �
HRM in all segments (increased demand for train- �
ing)
The major present and/or future challenges and op-portunities for the MC industry in Slovenia are CRM for building long term relationships, efficient tactics for competing with un-loyal competitors, building of networks with other consultants and other busi-ness service providers, raising competitiveness, and starting or increasing the export of consulting serv-ices.
As regards client - consultant relationship, there is constant pressure on fees as many clients (poten-tial clients) still consider consulting mainly as a cost. However, there are also clients whose choice does not only depend on price.
Clients are more oriented towards short-term projects with a possibility for extension. Client loyal-
ty exists, but is also relative to many factors (change of top managers and/or owners etc…). Competition is strong. A successful project does not necessarily mean a future loyalty.
On the other hand, long term contracts appear af-ter a few years of serious and successful work with clients
Growth, globalisation (new markets & competition), cost reduction and Client Relationship Management will be the 3 main priorities of clients in the next years.
More than before consulting companies intend to expand their cross-border business. Mostly to East-ern Europe, than Eastern and Western EU. Most of those who started exporting services in the past years succeeded. Major obstacles to cross-border expansion are the difference in business culture, building an image and trustful relationship and lack of capital.
Spain
In Spain, 2007 was a robust year for the MC Consult-ing market with an overall growth of 13.1 % and a to-tal turnover of € 8,561 billion, mainly driven by ma-jor IT services. If budgets declined for maintenance, they increased for new projects related to new busi-nesses or to the improvement of internal processes.
The main drivers for growth were related to cost cut-ting which created great opportunities for IT Out-sourcing, Application Management Services and Busi-ness Consulting (process reengineering and change management projects). However, some clients had to delay their projects until the first quarter of 2009. Oth-er constraints were due to the lack of resources – re-cruitment from both universities and business schools was not always sufficient to keep pace with turnover and to meet expanding market demand.
The MC Consulting market in Spain has two basic components; Strategy Consulting and Management Consulting or Business Consulting. The first segment is dominated by the large international strategy con-sulting firms. The second, Management Consulting, is controlled by large MC/IT Services companies. There are about six global or big local players which ac-count for 80 %-85 % of the market turnover. The rest belongs to a second tier, which work closely with re-gional governments and/or are positioned in “niches”. These smaller players are often well positioned, based on a time-to-market approach and competitive fees.
Industry and Financial Services are the main client sectors with a 27 % market share each, followed by
the Public Sector (17 % market share) and the Telecom industry (15 % market share). In 2007, major issues in these sectors were cost reduction, infrastructure consolida-tion, application management, SOA, busi-ness process re-engineering, efficiency and customer relation management.
Because of fierce competition in the MC market as well as cost reduction pressures, average fee rates remained unchanged. This implies for services providers that they have to constantly renew their own practices, processes and tools in order to improve productivity and reduce internal operational costs.
MC consulting and IT services companies are facing four major challenges for the future:
to accompany clients overseas, mainly financial �
services and utilities companies in their interna-tional expansion, to address the specific business needs of small �
and medium-sized enterprises, to help the public sector in improving its proc- �
esses, efficiency and capabilities, to remain sufficiently “glamorous” in order to �
keep attracting students on the job market.
Four objectives (cost reduction, client relationship management, IT consolidation, processes optimiza-tion) should become/remain the main priorities of clients in the next years.
Spain
Total turnover (million euros)
8,561
Growth rate 13.1 %
Growth rate (prevision) 11.0 %
Key service lines (%)
Business Consulting 8.0 %
IT Consulting 12.0 %
Development & Integration 44.0 %
Outsourcing 36.0 %
Other Services n.a.
Key sectors Banking & Insurance (27 %)
Export (%) 19.0 %
EU 11.0 %
Countries outside the EU 8.0 %
Number of consultants n.a.
Total staff 80,000

30
Main trends in Management Consulting
in 2007/2008
For more detailed information on the Spanish MC market, see the AEC report: La Consultoría en Es-
paña – el sector en cifras; www.consultoras.org, or email to: [email protected]
Switzerland
Switzerland has still a healthy, growing MC market.
The main drivers for growth of the consul-tancy market were the same as last year’s: Growth of the leading industries, globali-sation, M&A activities.
The structure of the MC sector did not change, the top 20 companies account for over 75 % of the Consulting market. Large firms continue to gain ground, at the cost of the small, and particularly the medium sized firms.There were more strategy assignments.
Also the average fee rates remained largely the same over the past few years and are expected to remain the same in 2008.
The major challenge is finding good and experi-enced people.
Purchasing departments are for IT not for strategy as this is the wrong approach for good management consulting relations.
The following objectives will be the 3 main priori-ties of clients in the next years: Growth, Cost reduc-tion and Globalisation (i.e. new markets and compe-tition).
Switzerland
Total turnover (million euros)
803
Growth rate 9.0 %
Growth rate (prevision) 7.0 %
Key service lines (%)
Business Consulting
IT Consulting 70.0 %
Development & Integration 30.0 %
Outsourcing n.a.
Other Services n.a.
Key sectors Banking & Insurance (30 %)
Industry (23 %)
Export (%) 12.0 %
EU 8.0 %
Countries outside the EU 4.0 %
Number of consultants 3,650
Total staff 4,380
United Kingdom(This text relates to Management Consultancy Associations (MCA) member firms only.)
Almost all the Private sector markets for consulting began the year in a buoy-ant mood. Indeed, last year’s MCA report gave little indication that there was any cause for concern and its half-year re-port suggested the industry was growing at the rate of 20 %. However, the dramat-ic change in the stock markets after the summer, caused by the sub-prime mort-gage crisis and subsequent credit squeeze, threw a pall over the rest of the year. That growth of the year as a whole was 10 % suggests that the market was relatively flat in the second half of the year. Confi-dence – or the lack of it – may have been more a driver here than economic neces-sity, with organisations cutting back be-cause of what they think is happening in
the US rather than what is actually happening. Per-haps because people are worrying more about the prospect of a downturn than its actuality, the effect has been patchy with some firms reporting quite a slow-down while others remain comparatively un-scathed.
However, the current consensus is that the first quar-ter of 2008 has not been as bad as anticipated with clients commissioning projects that had been de-layed and that the prospects for the year as a whole are for growth between 5 and 10 %.
Growth continues to be strong in Financial Services (20 %), but some banking saw the rate of growth fall from 40 % to 5 %, indicating the impact of the cred-it squeeze. Despite this, demand for IT and people-
related (HR and Change Management) consulting remained strong in this sector. By contrast, the rate of growth in financial management fell sharply, sug-gesting that many organisations in this sector are now suffering from regulatory “fatigue”: they want to invest in IT and employee engagement and are frustrated that much of their attention and resourc-es has been focused on regulatory compliance.
Outside Financial Services, growth was particular strong in the High-Tech and Telecommunications sector, largely driven by strategic issues and tech-nology convergence.
In terms of service lines, IT Consulting grew strongly overall, as did HR and Change Management Consult-ing. Most firms have been more cautious about re-cruitment in the last six months and, although the competition for the best people continues to be in-tense, only a small minority of firms say that lack of resources is limiting their growth at the moment.
The UK consulting industry continues to be polarised between a small number of very big firms and a large number of much smaller ones. MCA statistics show that the average fee income of the top ten firms rose by 14 % whereas that of other firms fell by 2 %. 2007 also saw considerable consolidation among mid-tier players, with several firms being bought by overseas firms or outsourcing / IT services companies.
Little is known about how fee rates have evolved over the past years. However, the average annual revenue per consultant has gone up by 2 %, while the number of consultants has stayed roughly in line with demand, suggesting that prices have risen very slightly (around the level of inflation).
United Kingdom
Total turnover (million euros)
19,070
Growth rate 4.2 %
Growth rate (prevision) 5.0 %
Key service lines (%)
Business Consulting 40.0 %
IT Consulting 18.0 %
Development & Integration 8.0 %
Outsourcing 34.0 %
Other Services n.a.
Key sectors Public Sector (21 %)Banking &
Insurance (20 %)
Export (%) 3.9 %
EU 0.2 %
Countries outside the EU 3.7 %
Number of consultants 97,370
Total staff 107,100
The data include not only MCA members but are an estimation of the whole of the UK market

Main trends in Management Consulting in 2007/2008
31
The major present and future challenges are: recruit-ing the right calibre of people, ability to deal with global marketplace, maintaining fee rates and mar-gins and the general economic uncertainty.
Budgets are tighter, as a result of the uncertain eco-nomic climate, and more projects are being broken down into smaller phases; procurement people con-tinue to play a very prominent role with many large-scale organisations setting up preferred supplier lists.
Cost reduction, supply optimization and implemen-tation of new IT and communication systems will
become the 3 main priorities of clients in the next years.
We have seen a lot of expansion in the level of over-seas work done by MCA member firms, especially in Eastern Europe, Russia and the Middle East, and we expect this to continue in the coming year. The main obstacle is the need (among smaller firms) to estab-lish a base in unfamiliar territory.
For more detailed information on the UK market see the MCA Industry Report 2008; http://www.mca.org.uk/MCA/Publications/IndustryReport.aspx or email to: [email protected]
32
FEACO, the European Federation of Management Consultancies Associations, a not for profit organ-isation, was established in 1960. The Federation now counts 20 national member associations:
• sixteen from the European Union: Austria, Bel-gium, Bulgaria, Cyprus, the Czech Republic, Den-mark, Finland, France, Germany, Greece, Hunga-ry, Italy, Poland, Portugal, Romania, Slovenia and Spain;
one from EFTA: Switzerland; �
two associate members: Bosnia & Herzegovina �
and Croatia;one affiliate member: Hong Kong. �
FEACO is a European organisation. Its general purpose is to assist in the promotion and devel-opment of the profession of Management Con-sultancy in Europe by providing support to its constituent National Association membership in those areas where a collective voice is stronger than the sum of its individual members.
Main objectives of FEACO are
The development of the Management Consul- �
tancy market, raising its image and profile at European and international level, by the pro-motion of common professional ethics, quality and best practice.
The promotion of the interests of Manage- �
ment Consultancy with the different European and International organisations, by maintain-ing a close relationship with the European In-stitutions and other pan-European and inter-national organisations in order to ensure an awareness of and defend professional inter-ests (this does not include lobbying for sales opportunities).
The development of a dynamic forum for net- �
working and service provision, by encouraging networking by members and between mem-bers‘ members, through the sponsorship and organisation of conferences, meetings and the establishment of mutual interest working groups, and through close cooperation with other consultancy organisations.
Some recent and upcoming activities:
The Europe Committee
The FEACO Europe Committee frequently meets with civil servants and policy makers in the Euro-pean Institutions and the OECD on the subject of the role of consultants in the provision of exter-nal assistance by the EU. In 2007/2008 the EC met with representatives from the national Perma-nent Representations, the European Parliament, the Commission, the EU Court of Auditors and the OECD.
The Europe Committee published a series of posi-tion papers on:
Global Prices for EU Projects, �
the Budget Support system for Development �
Aid,an efficient system for Appeal (for companies �
which consider that the EU procurement rules have not been applied correctly by the author-ities).
In the pipeline is a position paper on Framework Projects.
For more information and Europe Committee membership see: http://www.feaco.org
The Pendo Group
The Pendo group launched its ‘Report on Manag-ing Change in Europe’; The report is currently be-ing promoted through de-centralised launches in selected member states: Czech Republic, France, Poland and Spain. Within the frame work of man-aging change the Pendo group has published two Position Papers on
Global Workforce Mobility and on �
Business Transformation �
The Pendo group is currently developing activi-ties in the areas of Innovation, Skilled Workforce, Public Sector Reform and E-Internal Market.
For the Managing Chang in Europe Report and more information on the Pendo Group consult: http://www.thependogroup.eu/
About FEACO, The European Federation of Management Consultancies Associations

About FEACO
33
2008 Events
In the second half of 2008 FEACO will organize three conferences:
On 23/24 October the Annual European Man- �
agement Consulting Conference will take place in Dubrovnik, Croatia. For more information and to register consult: http://www. feaco2008.com.hr/
On 30 October an EU seminar on The Role, �
Quality and Financial Management of Devel-opment Assistance will take place in Brussels, Belgium. For more information and to regis-ter please consult the FEACO website: http://www.feaco.org
On 16 December the European Management �
Consulting Summit will take place in Paris, France. International Consulting Companies and International Client Companies will en-gage in round table discussions. For more in-formation and to register consult the FEACO website: http://www.feaco.org
We look forward to meeting you at our events!
Contact: Else Groen (Secretary General) [email protected]

Fédération Européenne des Associations de Conseils en Organisation European Federation of Management Consultancies Associations
FEACO Member Associations
AUSTRIA UBITProfessional Association of Management Consultancy and Information Technology; Fachverband Unternehmensberatung und Informationstechnologie Wiedner Hauptstrasse 63A - 1045 Vienna Phone: ++43 05 90 900 3760 Fax: ++43 05 90 900 3178Email: [email protected]: www.ubit.at
BELGIUM ASCOBELAssociation Belge des Conseils en Gestion et Organisation60 rue de TongresB -1040 BrusselsPhone: ++32 2 215 2996Fax: ++32 2 215 2996Email: [email protected]: www.ascobel.be
BOSNIA- LESPNET HERZEGOVINA (Associate member)
LespnetBranilaca Grada 47/3BIH -71000 SarajevoPhone: ++387 33 222854 Fax: ++387 33 442567Email: [email protected]; [email protected] Website: www.lespnet.ba
BULGARIA BAMCOBulgarian Association of Management Consulting Organizations1 Macedonia Square, 17th floor, office 7BG - Sofia 1000Phone: ++359 2 4010 506 Fax: ++359 2 4010 506Email: [email protected]: www.bamco.bg
CROATIA UPS-AMC(Associate member)UPS-AMC (Association of Management Consultancies)Jurja Haukila 4HR -10000 ZagrebPhone: ++385 1 4555 024Fax: ++385 1 4555 025Email: [email protected]: www.ups-amc.org
CYPRUS CYBCA Cyprus Association of Business Consultants30, Grivias Dhigenis AvenueP.O. Box 21657CY-1511 NicosiaPhone: ++357 2 665 102 Fax: ++357 2 669 459Email: [email protected]
CZECH REPUBLIC APPAssociation for Consulting to BusinessVeletřzni 21 CZ -170 00 Praha 7Phone: ++42 220 879043 Fax: ++42 220 879043Email: [email protected]: www.asocpor.cz
DENMARK DMRDansk Management RaadH. C. Andersens Boulevard 18 DK -1787 Copenhagen VPhone: ++45 70 203375 Fax: ++45 70 203376Email: [email protected] Website: www.dmr.nu
FINLAND LJKLiikkeenjohdon Konsultit LJKPostal address:PO Box 122 FI-33201 TampereVisiting address :c/o Yrityspalvelu Camena Pretax-YhtiötFinlaysoninkuia 9FI - 33201 TamperePhone: ++ 358 50 411 5458 Email: [email protected]: www.ljk.fi
FRANCE SYNTEC Conseil en managementChambre Syndicale des Sociétés de Conseil3 Rue Léon BonnatF - 75016 ParisPhone: ++33 1 44 30 49 20 Fax: ++33 1 40 50 73 57Website: www.syntec-management.com
GERMANY BDUBundesverband DeutscherUnternehmensberater BDU e.V.Zitelmannstrasse 22D - 53113 BonnPhone: ++49 228 91 61-0 Fax: ++49 228 91 61-26Email: [email protected]: www.bdu.de
GREECE SESMA100 Vasilis Sofias AvenueMavili Square GR – 115 21 AthensPhone: ++30 210 647 0660 Fax: ++30 210 647 0661Email: [email protected]: www.sesma.gr
HUNGARY VTMSZAssociation of Management Consultants of HungarySzt. István Körút11H - 1055 BudapestPhone: ++36 1 374 3344 / 36 20 922 4241Fax: ++36 1 269 1920 / 36 1 465 2078Email: [email protected]: www.vtmsz.hu
POLAND SDGStowarzyszenie Doradcow Gospodarczych w PolsceUl. Emilii PlaterPL- 00-113 WarsawPhone: ++48 509 382 481 Fax: ++48 22 520 6201Email: [email protected]: www.sdg.com.pl
PORTUGAL APPCAssociação Portuguesa de Projectistas e ConsultoresAvenida Antonio Augusto Aguiar 126 - 7°P – 1050-020 Lisbon Phone: ++351 21 358 0785 / 6 Fax: ++351 21 315 0413Email: [email protected]: www.appconsultores.org.pt
ROMANIA AMCORAsociatia Consultantilor in Management din RomaniaStr. Ion Brezoianu, nr 47-49, Scara B, ap. 166RO -70174 BucharestPhone: ++40 21 311 5175 Fax: ++40 21 311 5175Email: [email protected]: www.amcor.ro
SLOVENIA AMCOSAssociation of Management Consulting of SloveniaDimiceva 13SI -1504 Ljubljana Phone: ++386 1 589 8252 Fax: ++386 1 589 8200Email: [email protected]: www.gzs.si/zmcs
SPAIN AECAsociación Española de Empresas de ConsultoríaC/ Monte Esquinza 34 2° BES - 28010 MadridPhone: ++34 91 308 0161 / 91 391 3673Fax: ++ 34 91 391 3593Email: [email protected]: www.consultoras.com
SWITZERLAND ASCOAssociation of Management Consultants SwitzerlandWeinbergstrasse 31CH - 8006 Zürich Phone: ++41 43 343 9480Fax: ++41 43 343 9481Email: [email protected]: www.asco.ch
HONG KONG MCAHK (Affiliate member)Hong Kong Management Consultancies Association,14th Floor, Room 1403B9 Queen´s Road Central Hong KongPhone: ++852 2856 3487Fax: ++852 2565 6628Email: [email protected] Website: www.mca.org.hk
Appendix 1 –definitions–
1. European MC Market: EU 27 (excl. Ireland, Estonia, Latvia, Lithuania, Lux-embourg, Malta, Slovakia), Norway, Switzerland and Bosnia & Herzegovina.
2. Nordic region: Denmark, Norway, Sweden and Finland
3. Eastern Europe: Slovenia, Bulgaria, Romania, Hungary, Czech Republic, Slovakia, Poland, Estonia, Latvia and Lithuania.
4. Segmentation and Definitions of Key Client Industry Sectors
Industry Sector:Aerospace and Defense: includes commercial and defense aerospace, airlines and airports and space (civilian) and related manufacturing and as-sociated research
Automotive Products: automotive (motorized road transport vehicles) manufacturers, suppliers, systems integrators and distributors
Consumer Products: food and tobacco prod-ucts, textile & apparel, beauty & toiletries, metal (except machinery & automotive products and equipment) wood & furniture, paper and printed products
High Tech Products: all cutting edge technolo-gy: including cutting edge technology used in ci-vilian and defense related aerospace.
MachineryChemicalsIT hardware, software & computer servicesOther industries
Banking and Insurance Sector:All Banking and Financial services: including commercial banks, investment managers, mutu-al funds companies, brokerage firms, investment banks, private banking and trust companies, sav-ing banks, credit unions, mortgage banking com-panies, international banks and finance compa-nies
Insurance: insurance carriers, agents, brokers and services
Healthcare, pharmaceutical and biotechHealthcare: providers (hospitals and physicians), payers (insurance companies and HMOs) and dis-tributors (of medical equipment and supplies)
Pharmaceuticals and biotech: pharmaceuticals manufacturers and biotech companies, including biofuels
Wholesale& Retail Sector:Wholesale & Retail: all distribution incl. luxury retailers, specialty retailers, mass merchandisers, discount retailers, grocery chains, convenience stores, drug chains, car dealers, restaurants, home improvement chains, catalogue retailers and e-tailers of durable and non-durable goods such as building materials, hardware, general merchan-dise, food, automotive dealers, apparel and acces-sories, furniture, food & drink etc …
Transport & Travel Sector:Transport/travel includes all transport by air, road or water of goods or passengers: private transportation organisations (travel and urban transport), carriers and shippers as well as logis-tics services companies
Telecoms and Media Sector:Communication/Media/Entertainment: pub-lishers, entertainment companies, record labels; all communications not being telecommunica-tions
Telecommunications
Energy & Utilities Sector:Energy: petrol and gas extraction, coal, mining, clean energies (solar, wind) excluding biofuels (=biotech); chemicals & petrochemicals
Utilities: production and distribution of electrici-ty, gas and water (incl. irrigation systems and sew-age treatment)
Public Sector: services provided to all levels of the public sector: local, regional, national and EU.
Other Sectors: Not for Profit Private SectorBusiness servicesAll other sectors (not industry sectors)
35

3/4/5 Avenue des Arts B-1210 Brussels (Belgium)
Telephone: 32-2-250-06 50 Facsimile: 32-2-250-06 51
E-mail: [email protected] Internet: www.feaco.org
Contents: Céline Barbe, Michel Noiry Layout: giersberg MEDIA, Bonn
FEACO has used its best effort in collecting the information published in The Survey of the European Management Consultancy Market 2007/2008. FEACO does not assume, and hereby disclaims any liability for any loss or damage caused by errors or omissions in their surveys, whether such errors result from negligence, accident or other causes.
Notice: No part of this publication may be reproduced, stored in a retrieval system or transmitted by any means, electronically or mechanically, without the prior written permis-sion of FEACO.
Price € 100 (VAT Excl.)
Survey of the European Management Consultancy Market
2007/2008