Survey of Offshore Wind Farm Project in EU and Their ... · Survey of Offshore Wind Farm Project in...
31
Survey of Offshore Wind Farm Project in EU and Their Connecting Grid Systems July 2012 Brieuc Hamon Research Associate, Global Energy Network Institute (GENI) [email protected] Under the supervision of and edited by Peter Meisen President, Global Energy Network Institute (GENI) www.geni.org [email protected] (619) 595-0139
Transcript of Survey of Offshore Wind Farm Project in EU and Their ... · Survey of Offshore Wind Farm Project in...

Survey of Offshore Wind Farm Project in EU and Their
Connecting Grid Systems
July 2012
Brieuc Hamon
Research Associate, Global Energy Network Institute (GENI)
Under the supervision of and edited by
Peter Meisen
President, Global Energy Network Institute (GENI)
www.geni.org
[email protected] (619) 595-0139

2
Table of Contents
Abstract ..................................................................................................................................... 4
1 Current State of renewal Energy in EU .............................................................................. 5
1.1 Distribution of Wind Farms in EU ............................................................................... 5
1.2 Electric Power Consumption vs. Renewable Energy Production ................................ 7
2 The Supergrid Project ........................................................................................................ 10
2.1 Project Background .................................................................................................... 10
2.1.1 The Concept ......................................................................................................... 11
2.1.2 Policy Context ..................................................................................................... 11
2.2 Development Scenarios .............................................................................................. 13
2.3 Today’s Situation ....................................................................................................... 15
3 The Submarine Power Cables ............................................................................................ 17
3.1 How Does it Work? ................................................................................................... 17
3.1.1 Cables .................................................................................................................. 20
3.1.1.1 HVAC Cables ....................................................................................... 20
3.1.1.2 HVDC Cables ....................................................................................... 21
3.1.2 Supernodes .......................................................................................................... 22
3.2 How to Install Them .................................................................................................. 24
3.2.1 Cable Route Survey ............................................................................................. 24
3.2.2 Cables Laying ...................................................................................................... 25
3.3 Supergrid Technologies Schedule ............................................................................. 26
4 The Financial Aspect ........................................................................................................... 27
4.1 HVAC and HVDC0 Cost ........................................................................................... 27
4.2 Supergrid Cost ............................................................................................................ 28
Conclusion ............................................................................................................................... 30
Bibliography ........................................................................................................................... 31

3
Table of Figures
1 Cumulative and Annual Offshore Wind Installations (MW) ................................................. 5
2 Distribution of the Offshore Wind in EU ............................................................................... 6
3 Distribution of Wind Farms by Country – 2011 .................................................................... 6
4 Distribution of Turbines by Country – 2011 ........................................................................... 6
5 Distribution of Capacity Installed by Country – End 2011 .................................................... 7
6 Energy Mix of Electricity Production in Europe – 2008 ........................................................ 8
7 Share of Renewable Energies in Gross Final Consumption of Electricity – 2009.................. 9
8 Schematic Representation of the Supergrid Project ............................................................. 11
9 Supergrid Phase 1 .................................................................................................................. 13
10 Supergrid Phase 2 ............................................................................................................... 14
11 Supergrid Phase 3 ................................................................................................................ 14
12 Consumption Share of Each Grid (TWh/y) ......................................................................... 15
13 Comparative Table of HVAC and HVDC Cables ............................................................. 17
14 Typical Application of AC and DC Submarine Cables ..................................................... 18
15 Multi-terminal HVDC Systems .......................................................................................... 19
16 Modern Submarine Power Cable (AC) .............................................................................. 20
17 Modern Submarine Power Cable (DC) ............................................................................. 21
18 Supernode Scheme ............................................................................................................. 22
19 Boat Using a Seabed Mapping System .............................................................................. 24
20 Cable Laying Vessels ......................................................................................................... 25
21 Cable Laying Robots .......................................................................................................... 25
22 Schedule of the Next Technologies .................................................................................... 26
23 Typical Investment Costs for an Overhead Line Transmission with AC and HVDC ....... 27
24 Share of Investment by Sector ............................................................................................ 29

4
Abstract
Today the world is facing significant growth in energy demand. An increase of 50% in
global energy demand is expected by 2030. The increase in energy prices (the price per barrel
of oil hovers around $ 110), the depletion of fossil energy (more than 60 oil producing
countries have already passed their peak production) also affect energy demand. In addition,
strong regulations on emissions of greenhouse gases are being introduced, forcing states to
change their energy policies and to switch to alternative energy.
The European Union (EU) has adopted the objectives of 3x20 Plan, which force its
Member States to develop renewable energy sources (RES) and to give the objectives a more
important place in their overall energy policies1. However, the potential production sites of
production of electricity from renewable sources are often located far from consumption
centers. Indeed, the EU has many energy resources (wind, solar, hydro) that are not-uniformly
distributed among the Member States. The best areas for the production of electricity from
renewable sources are often located in places where the electrical network density is low.
Moreover, to achieve 20% energy from renewable sources in total energy consumption of
each country, the climate-energy objective of the 3x20 plan allows member countries to rely,
in part, on electricity produced outside the European borders.
1 European Union 3x20 Objectives, www.3x20.org
5
1. The Current State of Renewable Energy in EU
1.1 Distribution of the Wind Farms in EU
Europe is based on an electric economy. Indeed, electricity is becoming the dominant
energy that will lead us toward a low carbon future. By 2050, most of our vehicles
could function thanks to electricity, with the exception of some heavy commercial vehicles.
Europe is engaged in a transition to sustainability. Member States of the EU have
committed to reduce their Kyoto Greenhouse Gas emissions by at least 20% below 1990
levels by 2020. To reach this point, Europe started to establish wind farms in offshore areas
highly windy.
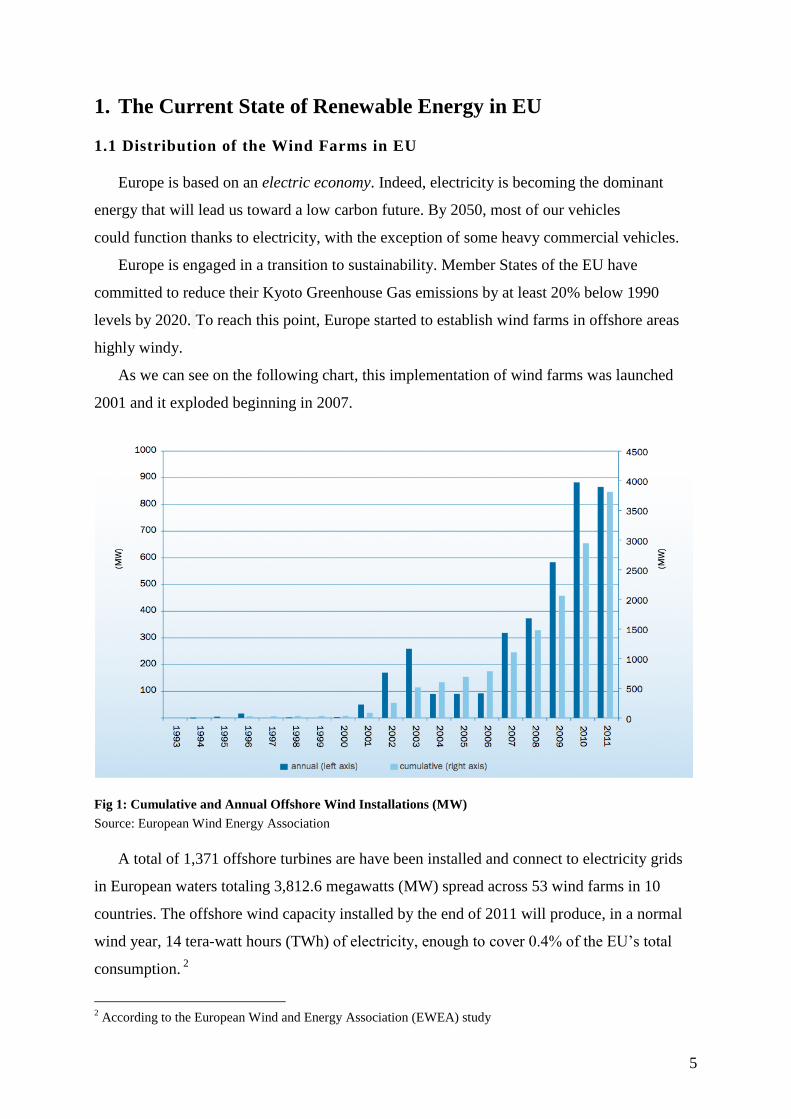
As we can see on the following chart, this implementation of wind farms was launched
2001 and it exploded beginning in 2007.
Fig 1: Cumulative and Annual Offshore Wind Installations (MW)
Source: European Wind Energy Association
A total of 1,371 offshore turbines are have been installed and connect to electricity grids
in European waters totaling 3,812.6 megawatts (MW) spread across 53 wind farms in 10
countries. The offshore wind capacity installed by the end of 2011 will produce, in a normal
wind year, 14 tera-watt hours (TWh) of electricity, enough to cover 0.4% of the EU’s total
consumption. 2
2 According to the European Wind and Energy Association (EWEA) study
6
In 2010, Thanet, a 300 MW project in the United Kingdom (UK), was the largest offshore
wind farm completed and fully grid connected in the world. In 2011, over 380 MW were
installed at Greater Gabbard, also in the UK. Once completed, Greater Gabbard’s total
capacity will be 504 MW. However, construction has also started on the first phase of the
London Array project. Once completed, it will be 630 MW per year.
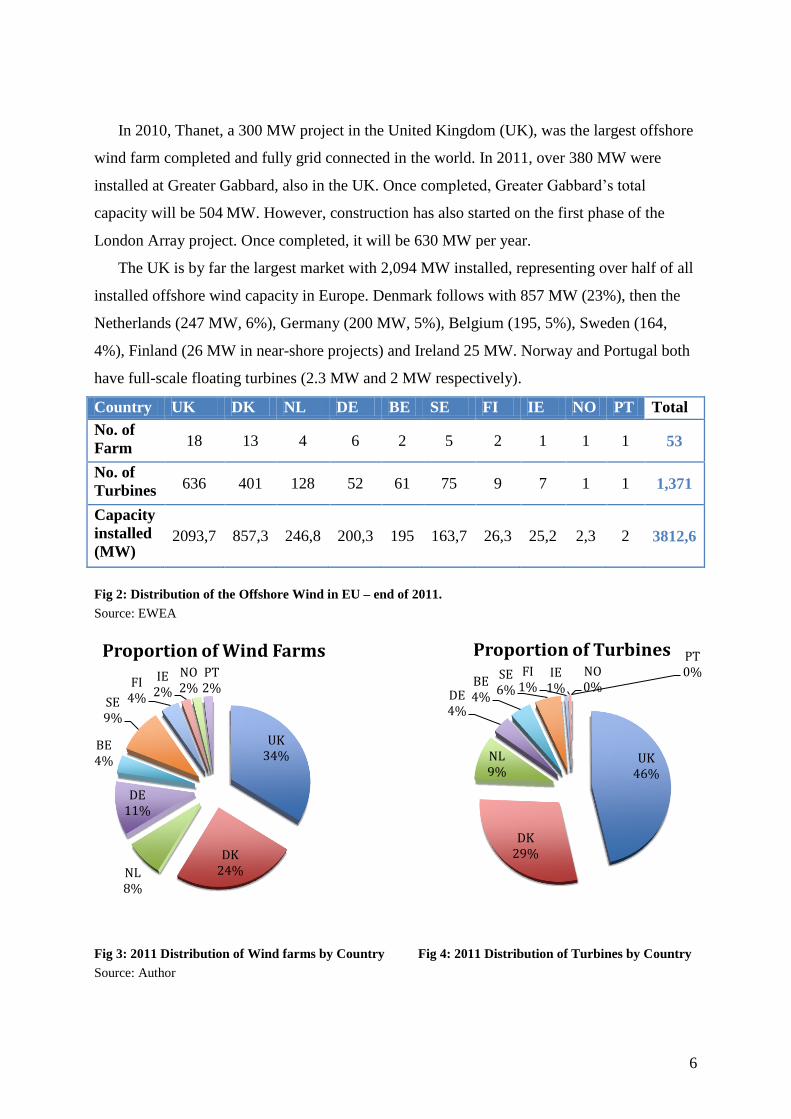
The UK is by far the largest market with 2,094 MW installed, representing over half of all
installed offshore wind capacity in Europe. Denmark follows with 857 MW (23%), then the
Netherlands (247 MW, 6%), Germany (200 MW, 5%), Belgium (195, 5%), Sweden (164,
4%), Finland (26 MW in near-shore projects) and Ireland 25 MW. Norway and Portugal both
have full-scale floating turbines (2.3 MW and 2 MW respectively).
Country UK DK NL DE BE SE FI IE NO PT Total
No. of
Farm 18 13 4 6 2 5 2 1 1 1 53
No. of
Turbines 636 401 128 52 61 75 9 7 1 1 1,371
Capacity
installed
(MW) 2093,7 857,3 246,8 200,3 195 163,7 26,3 25,2 2,3 2 3812,6
Fig 2: Distribution of the Offshore Wind in EU – end of 2011.
Source: EWEA
Fig 3: 2011 Distribution of Wind farms by Country Fig 4: 2011 Distribution of Turbines by Country
Source: Author
UK 46%
DK 29%
NL 9%
DE 4%
BE 4%
SE 6%
FI 1%
IE 1%
NO 0%
PT 0%
Proportion of Turbines
UK 34%
DK 24% NL
8%
DE 11%
BE 4%
SE 9%
FI 4%
IE 2%
NO 2%
PT 2%
Proportion of Wind Farms

7
Fig 5: Distribution of Capacity Installed by Country – end 2011
Source: Author
1.2 Electric Power Consumption vs. Renewable Energy Production
An energy mix that varies according to the country provides electricity generation in EU.
We can distinguish the low-carbon generation sources (hydro, renewable, nuclear) from the
high-carbon generation sources (coal, oil or natural gas). The following chart shows the share
of each source in power generation.
UK 55%
DK 23%
NL 6%
DE 5%
BE 5%
SE 4%
FI 1%
IE 1%
NO 0% PT
0%
Capacity Installed

8
Fig 6: Energy Mix of Electricity Production in Europe – 2008
Source: Eurostat 2008
As shown in this graph, countries like Denmark and Portugal, possess the largest share of
renewable energies in electricity production, nevertheless they have a low proportion of low-
carbon generation sources. This shows the importance of harmonizing energy production
among countries of Europe.
Now, we can look at the share of renewables energies in gross final consumption of
electricity. According to figures collected by the statistical agency Eurostat, here is the
histogram showing this distribution.
RE hydrolic other termaloilgascoalnuclear
9
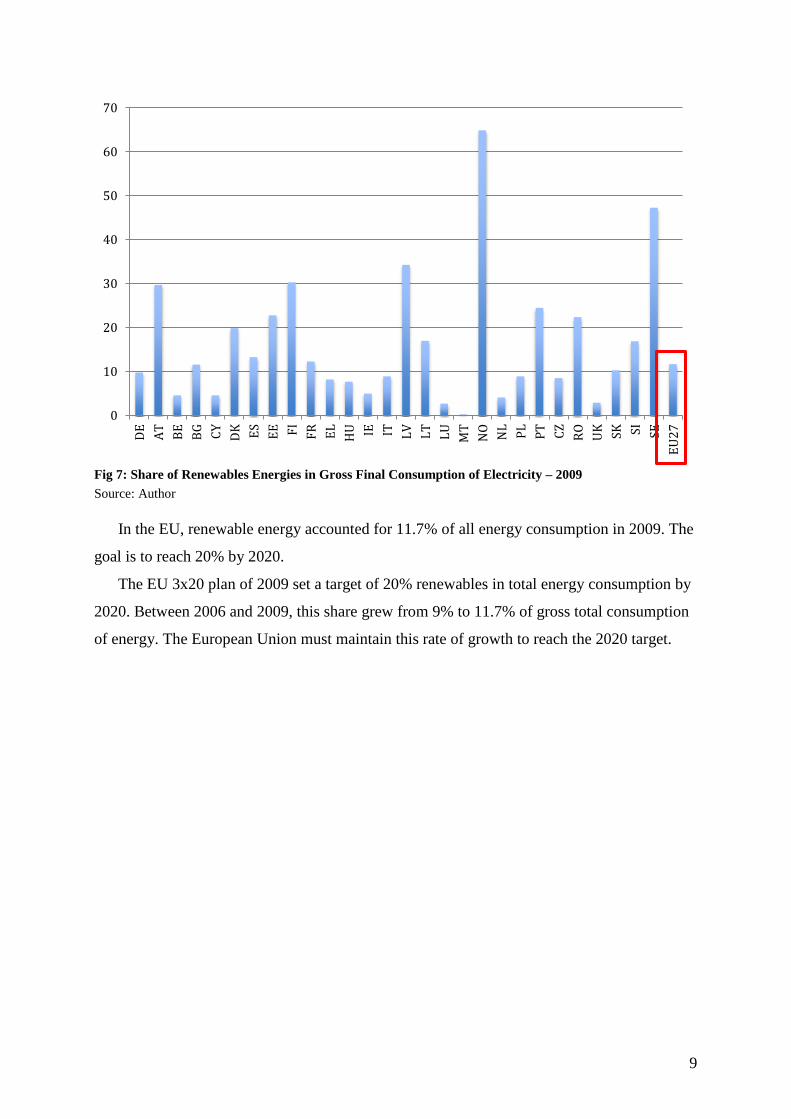
Fig 7: Share of Renewables Energies in Gross Final Consumption of Electricity – 2009
Source: Author
In the EU, renewable energy accounted for 11.7% of all energy consumption in 2009. The
goal is to reach 20% by 2020.
The EU 3x20 plan of 2009 set a target of 20% renewables in total energy consumption by
2020. Between 2006 and 2009, this share grew from 9% to 11.7% of gross total consumption
of energy. The European Union must maintain this rate of growth to reach the 2020 target.
0
10
20
30
40
50
60
70
DE
AT
BE
BG
CY
DK
ES
EE
FI
FR
EL
HU
IE
IT
LV
LT
LU
MT
NO
NL
PL
PT
CZ
RO
UK
SK
SI
SE
EU
27

10
2. The Supergrid Project
2.1 Project Background
2.1.1 The Concept
The concept of supergrid was initiated 10 years ago and it is defined by the Friends of the
Supergrid (FOSG) as "a pan-European transmission network facilitating the integration of
large-scale renewable energy and the balancing and transportation of electricity, with the aim
of improving the European market"3.
The Supergrid is not just an extension of the existing or planned point-to-point
network among EU countries. Even the combination of these schemes will not provide the
network with what is needed to route the marine renewable energy generated in the northern
seas to load centers in central Europe. The supergrid is a totally
different concept. Unlike point-to-point energy transmission, the supergrid involves the
creation of supernodes to collect, integrate and deliver renewable energy to the best
markets available. The supergrid is a trading tool that will improve the safety of the electrical
supply for all EU countries.
There may be many forms of the supergrid. The offshore supergrid is based on the seas
around north western Europe. There will be others, such as super-solar in the Mediterranean
region. These schemes are ultimately connected to provide power throughout the EU.
3 Friends of Supergrid report, www.friendsofthesupergrid.eu

11
Fig 8: Schematic Representation of the Supergrid Project.
Source: FOSG
2.1.2 Policy Context
Europe must meet the environmental objectives accepted at the Kyoto
agreement, that’s why the EU needs an energy policy oriented in an economical
manner. The first task is to agree on economic policy that will transform the environmental
objectives in a workable energy policy.
Then it will be necessary to develop an energy policy that limits, and preferably
eliminates, the risks to the security of supply. It is important to note that two of the
three founding treaties of the EU – the European Coal and Steel Community and (European
Atomic energy Community (Euratom) dealt with energy. Jean Monnet, one of the founding
fathers of the European Union, was himself concerned about the geopolitical consequences
of unacceptable dependency of Europe on imported energy. It is even more important to note
that Europe's dependence on imported energy has increased from 47.8% in 2002 to 56.2% in
2008 and is expected to reach 70% by 2020.4
At that moment, Europe is going to experience an "energy crisis". On the one hand, oil
production has reached its peak. Even the most optimistic forecasts of the International
Energy Agency agreed on this point. On the other hand, the Chinese and Indian demand for
oil and gas will have increased six to eight times their current levels.
4 European Environment Agency, Net Energy Import Dependency, 2011

12
In this case it is inevitable that, with the depletion of stocks and intense global
competition for resources between the United States, China and India, the EU will
be marginalized unless the Member States act together in the global energy market. The costs
of uncoordinated approach among European states, in these circumstances will be really
harmful, both in economic and societal terms.
There are reasons to believe that Member States will establish a common
policy on primary energy sources. The scale of ambition would not be greater than one to
create a common currency with a common monetary policy and a supranational central bank.
It is inevitable that an internal market should complement a common external energy
policy in electricity and by common standards in energy efficiency, as well as common
measures to develop bio-fuels so as to bring transport into connection with power generation
and building standards.
The European Union will either have a holistic energy policy a quarter of a century
from now or it will slide into inevitable and irreversible decline. The history of the Union
gives hope that the path chosen will be that of common action based on the pooling of
sovereignty in accordance with the EU treaties.
It is with that expectation that the concept of a European Offshore Supergrid is offered
for consideration by policy-makers throughout the EU.
13
2.2 Development Scenarios
The association Friends of the Supergrids offers a possible structure for the development
of a Super grid in the northern seas in three stages. It is conceivable that the development
scenarios of Super grids in the world could be modelled on this pattern.
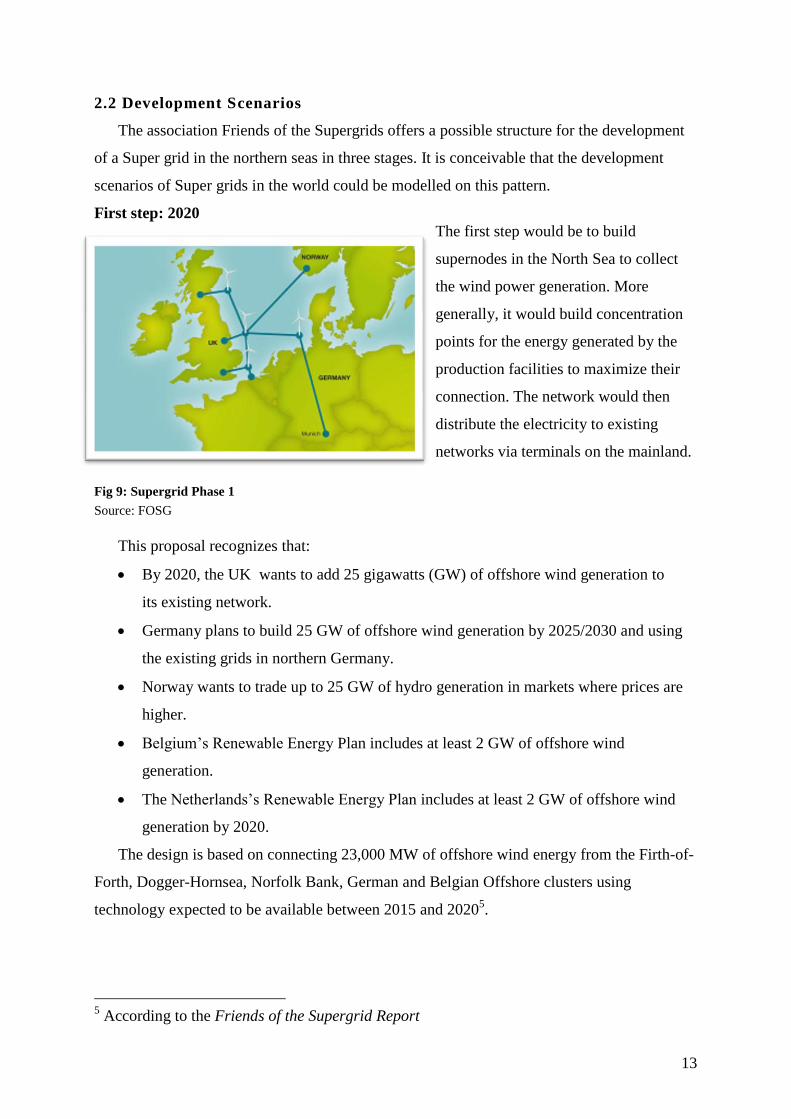
First step: 2020
The first step would be to build
supernodes in the North Sea to collect
the wind power generation. More
generally, it would build concentration
points for the energy generated by the
production facilities to maximize their
connection. The network would then
distribute the electricity to existing
networks via terminals on the mainland.
Fig 9: Supergrid Phase 1
Source: FOSG
This proposal recognizes that:
By 2020, the UK wants to add 25 gigawatts (GW) of offshore wind generation to
its existing network.
Germany plans to build 25 GW of offshore wind generation by 2025/2030 and using
the existing grids in northern Germany.
Norway wants to trade up to 25 GW of hydro generation in markets where prices are
higher.
Belgium’s Renewable Energy Plan includes at least 2 GW of offshore wind
generation.
The Netherlands’s Renewable Energy Plan includes at least 2 GW of offshore wind
generation by 2020.
The design is based on connecting 23,000 MW of offshore wind energy from the Firth-of-
Forth, Dogger-Hornsea, Norfolk Bank, German and Belgian Offshore clusters using
technology expected to be available between 2015 and 20205.
5 According to the Friends of the Supergrid Report
14
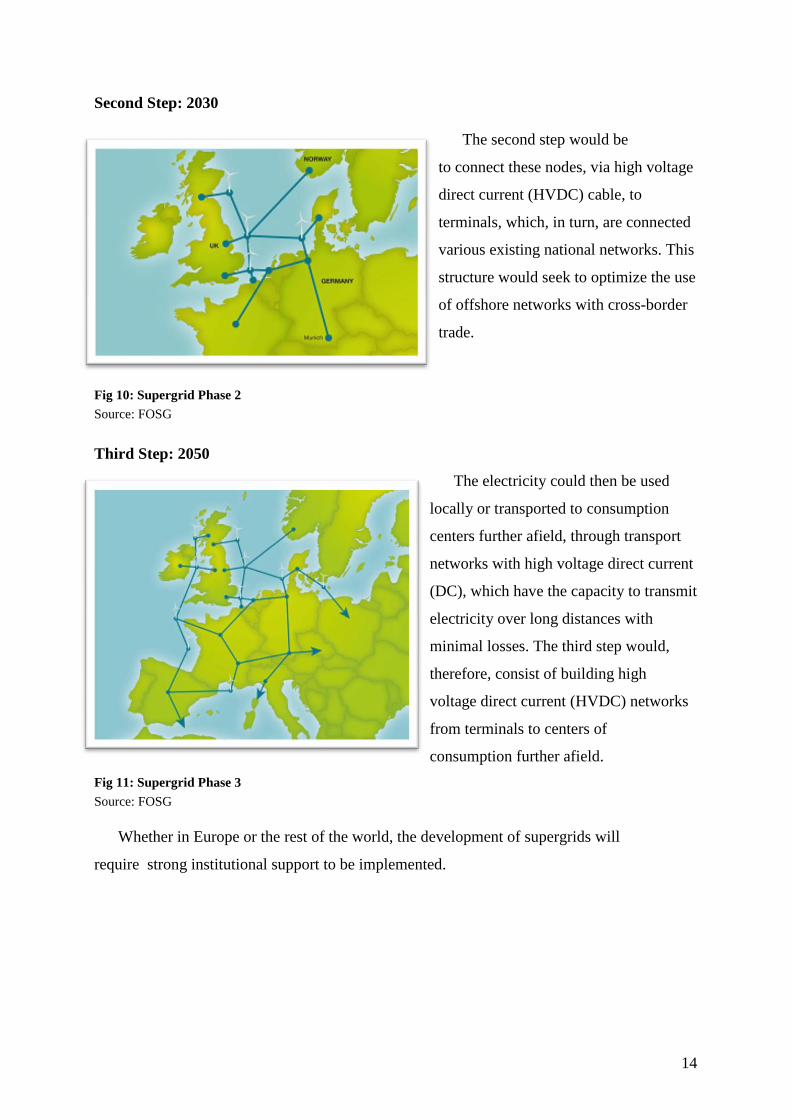
Second Step: 2030
The second step would be
to connect these nodes, via high voltage
direct current (HVDC) cable, to
terminals, which, in turn, are connected
various existing national networks. This
structure would seek to optimize the use
of offshore networks with cross-border
trade.
Fig 10: Supergrid Phase 2
Source: FOSG
Third Step: 2050
The electricity could then be used
locally or transported to consumption
centers further afield, through transport
networks with high voltage direct current
(DC), which have the capacity to transmit
electricity over long distances with
minimal losses. The third step would,
therefore, consist of building high
voltage direct current (HVDC) networks
from terminals to centers of
consumption further afield.
Fig 11: Supergrid Phase 3
Source: FOSG
Whether in Europe or the rest of the world, the development of supergrids will
require strong institutional support to be implemented.
15
2.3 Today’s Situation
The North Seas Countries Offshore Grid Initiative (NSCOGI) constitutes the first stage of
the European supergrid project. This is collaboration between the Member States of the
European Union and Norway to create an integrated offshore grid for conveying the energy
produced by wind farms and other renewable sources of electricity across the Northern seas
of Europe (North Sea, Baltic Sea, English Channel, Celtic Sea and Irish Sea) and thus
exploits the great offshore potential. The declaration of intent from participating countries in
the initiative (Germany, UK, France, Denmark, Sweden, Netherlands, Belgium, Ireland
and Luxembourg) was signed on December 7, 2009 at the European Union Council on
Energy. The initiative was subsequently joined by Norway in February 2010. The European
Commission, Agency for Cooperation of Energy Regulators (ACER), European Network for
Transmission System Operators – Electricity (ENTSO-E) and the relevant Member State
regulators participate in the work, including the design, regulation and procedures for
authorization of a marine system.
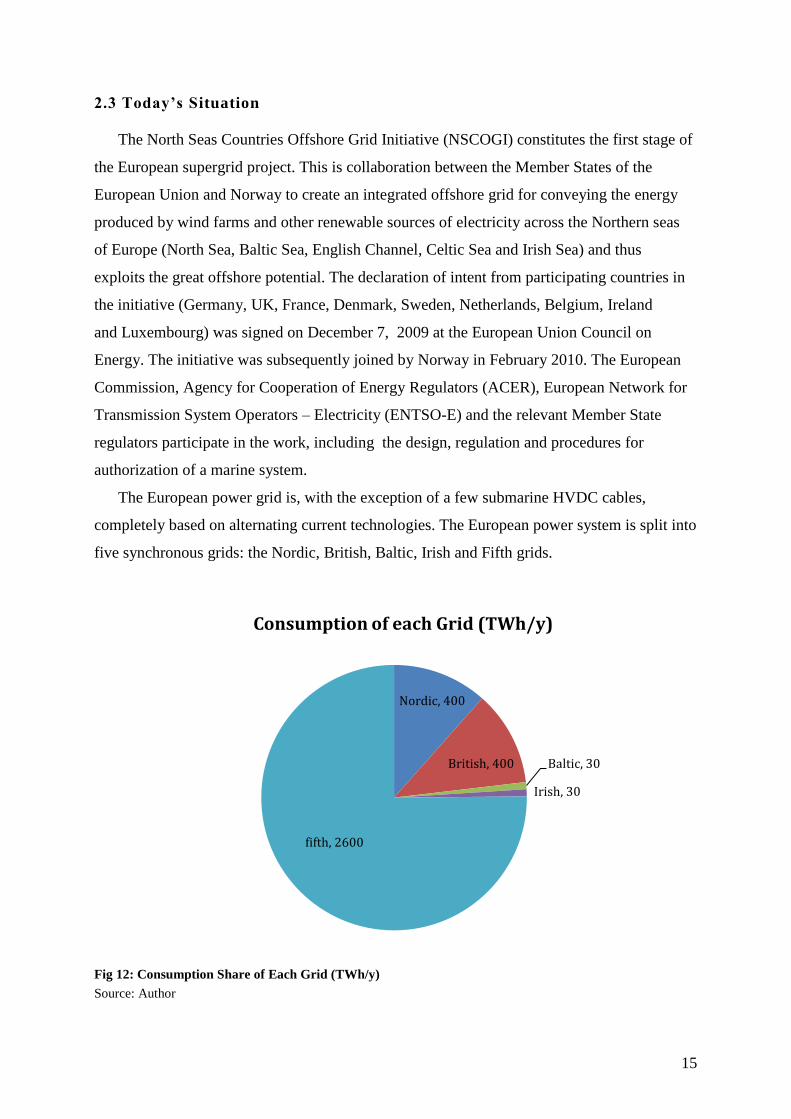
The European power grid is, with the exception of a few submarine HVDC cables,
completely based on alternating current technologies. The European power system is split into
five synchronous grids: the Nordic, British, Baltic, Irish and Fifth grids.
Fig 12: Consumption Share of Each Grid (TWh/y)
Source: Author
Nordic, 400
British, 400 Baltic, 30
Irish, 30
fifth, 2600
Consumption of each Grid (TWh/y)

16
All these blocks are interconnected with HVDC back-to-back facilities or HVDC
subsea cables. Currently, there are no significant HVDC connections to land in Europe,
except some limited back-to-back connections to asynchronous areas, mainly to the Russian
grid.

17
3. The Submarine Power Cables
Creation of a supergrid requires the establishment of an electric cables network over very
long distances. The supergrids will allow, without significant loss of energy, the transport of
electricity from one end to another of Europe. Currently, the DC technology stands out
as being best suited to transport off-shore and on-shore electricity over long distances in
excess of 500 kilometres (km.)
In this section we will explain how these cables work and how to install them.
3.1 How Does It Work?
3.1.1 Cables
Today we have two basic types of cable:
High Voltage, Alternating Current (HVAC )
High Voltage, Direct Current (HVDC)
These two types of cables have different properties; therefore, we use them in different
conditions. The following table (Fig 13) summarized those properties.
Properties HVAC HVDC
Transmission distance < 80 km > 80 km
N° of conductors 3 conductors
1 primary conductor
+
1 way back conductor
Current
Alternative Direct
Power losses due to skin
effect +++ None
Fig 13: Comparative Table of HVAC and HVDC Cables
Alternating current (AC) is the main driving force in the industries and residential areas;
but, for the long transmission line (more than 400 miles) AC transmission is more expensive
than that of direct current (DC). Technically, AC transmission line control is more
complicated because of the frequency. Because DC transmission does not have these
limitations, transmission line construction has focused on HVDC lines over the last 40 years.
HVDC technology makes possible the transferring bulk power over long distances.
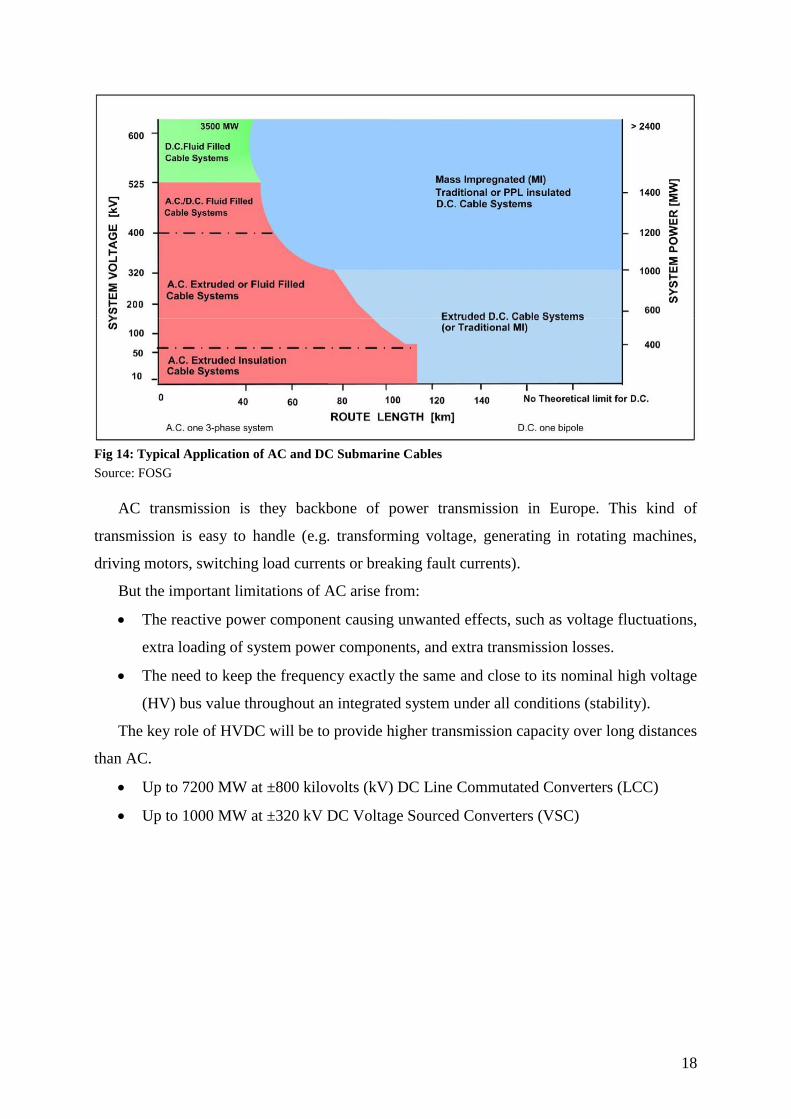
Figure 14 shows the respective applications of AC and DC cables:
18
Fig 14: Typical Application of AC and DC Submarine Cables
Source: FOSG
AC transmission is they backbone of power transmission in Europe. This kind of
transmission is easy to handle (e.g. transforming voltage, generating in rotating machines,
driving motors, switching load currents or breaking fault currents).
But the important limitations of AC arise from:
The reactive power component causing unwanted effects, such as voltage fluctuations,
extra loading of system power components, and extra transmission losses.
The need to keep the frequency exactly the same and close to its nominal high voltage
(HV) bus value throughout an integrated system under all conditions (stability).
The key role of HVDC will be to provide higher transmission capacity over long distances
than AC.
Up to 7200 MW at ±800 kilovolts (kV) DC Line Commutated Converters (LCC)
Up to 1000 MW at ±320 kV DC Voltage Sourced Converters (VSC)
19
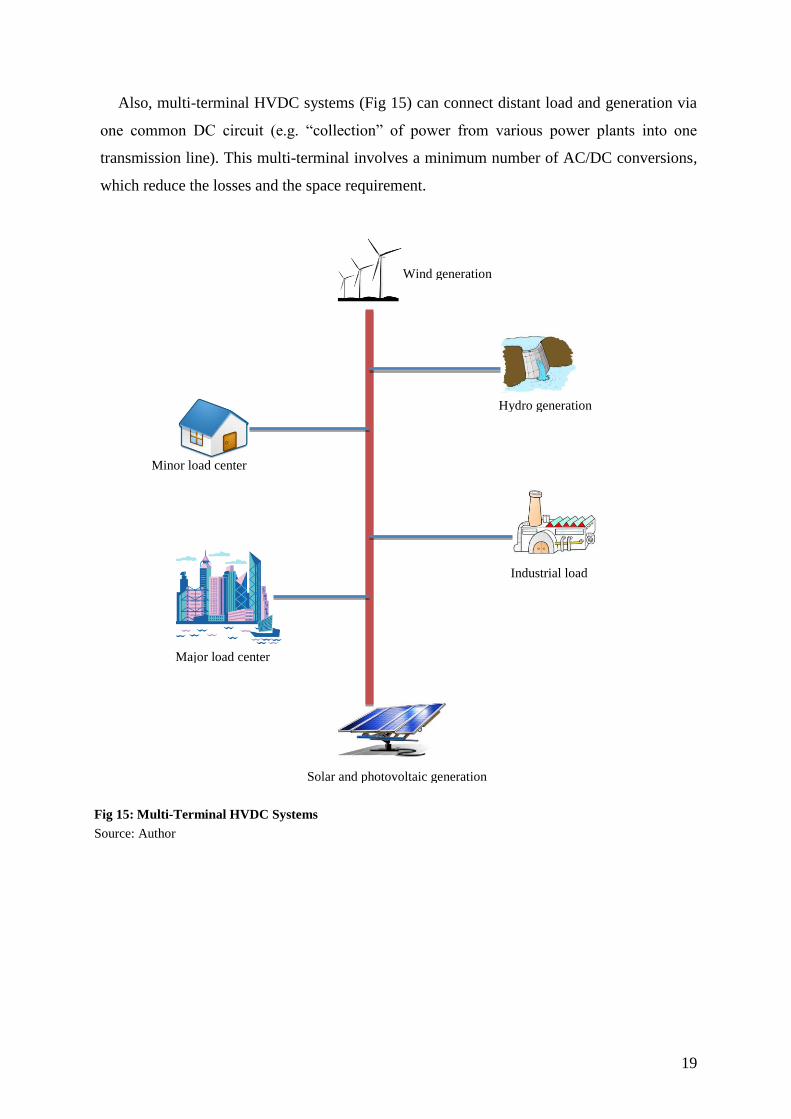
Also, multi-terminal HVDC systems (Fig 15) can connect distant load and generation via
one common DC circuit (e.g. “collection” of power from various power plants into one
transmission line). This multi-terminal involves a minimum number of AC/DC conversions,
which reduce the losses and the space requirement.
Fig 15: Multi-Terminal HVDC Systems
Source: Author
Wind generation
Industrial load
Hydro generation
Minor load center
Major load center
Solar and photovoltaic generation

20
3.1.1.1 HVAC cables
Figure 16 shows a typical modern AC submarine power cable. Construction varies
with manufacturer and seabed conditions; for example, more armor will be added to lines to
be installed in areas with strong waves and currents.
Fig 16: Modern Submarine Power Cable (AC)
Source: Nexans
An undersea cable designed to carry AC power consists of an inner electrical conductor
surrounded by layers of insulating material within conductive and non-conductive sheathing.
Typically, three cables are bundled together to carry three-phase currents.
1. Conductor – usually copper
2. Conductor screening – usually extruded
3. Insulation – XLPE or EPR
4. Insulation screening – semi conductive
5. Screen
6. Laminated sheath – aluminum tape and polyethylene
7. Optical fibers – optionally used for telecommunications
8. Fillers – as needed
9. Binder tapes
10. Armour Bedding – polypropylene strings
11. Armour – galvanized round steel wires
12. Serving – bituminous compound, hessian tape with polypropylene
colored stripe
21
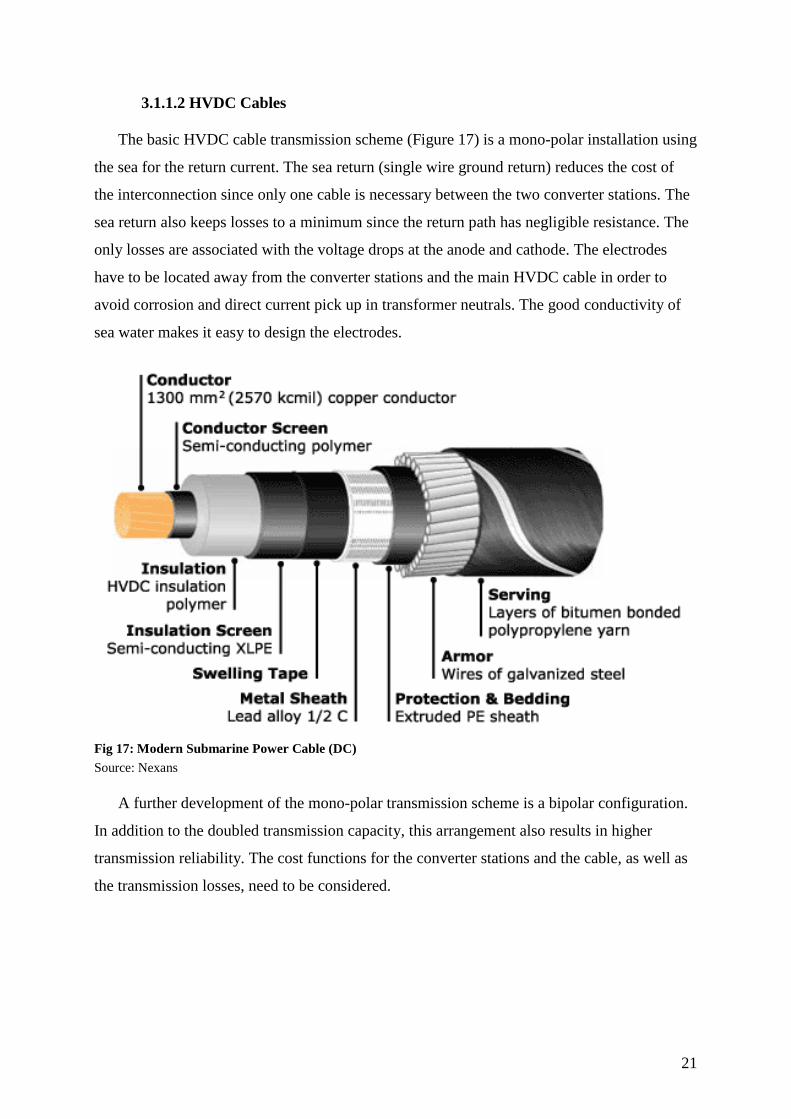
3.1.1.2 HVDC Cables
The basic HVDC cable transmission scheme (Figure 17) is a mono-polar installation using
the sea for the return current. The sea return (single wire ground return) reduces the cost of
the interconnection since only one cable is necessary between the two converter stations. The
sea return also keeps losses to a minimum since the return path has negligible resistance. The
only losses are associated with the voltage drops at the anode and cathode. The electrodes
have to be located away from the converter stations and the main HVDC cable in order to
avoid corrosion and direct current pick up in transformer neutrals. The good conductivity of
sea water makes it easy to design the electrodes.
Fig 17: Modern Submarine Power Cable (DC)
Source: Nexans
A further development of the mono-polar transmission scheme is a bipolar configuration.
In addition to the doubled transmission capacity, this arrangement also results in higher
transmission reliability. The cost functions for the converter stations and the cable, as well as
the transmission losses, need to be considered.

22
3.1.2 Supernodes
One other important technical aspect is the creation of supenodes that will interconnect
and separate multi-terminal systems and point-to-point systems. A supernode interconnects a
number of DC links together with wind parks via a small-islanded AC network (Node).
Fig 18: Supernode Scheme
Source: Mainstream Renewable Power
This concept is largely based on technology existing today and there of today there is
much experience with DC links interconnecting two AC systems. Most of the existing DC
links are equipped with Line Commutated Converters (LCC) based on thyristor
semiconductor technology. However, there are a number of HVDC links operating or under
construction, which are based on voltage sourced converter technology (VSC). The
development needed to build Supernodes is mainly in the field of control and protection for
the islanded AC network, which includes frequency control as well as fault detection and fault
clearing strategies.

23
The preferred DC transmission technology for building Supernodes is VSC. This is
because a VSC transmission system can generate and maintain the AC voltage at the node
with respect to amplitude and frequency, a feature also referred to as black start capability. As
long as there are VSC systems providing sufficient short circuit power available at the AC
node, LCC based HVDC transmission can also be connected. The concept of VSC
transmission controlling islanded AC networks will be demonstrated by the first HVDC
connected wind parks in the North Sea, which are currently under construction.

24
3.2 How to Install Them
3.2.1 Cable route survey
Before installing cable, we have to be careful of where we’re going to lay them. That is
why it is very important to make a cable route survey. Indeed, cable routes are selected to
minimize the environmental impact and maximize cable protection. To do that, we use high
technology boats (Fig 19) with seabed mapping systems that accurately chart depth,
topography, slope angles and seabed type.
Fig 19: Boat Using a Seabed Mapping System
Source: NIWA
The seabed mapping systems consist in a multi-beam echo sounders that emit a fan of
sound, beams to the seafloor to scan a wide swath of the seabed in great detail. The principle
of the multi-beam transceiver is to send out a beam of sound waves that is reflected off the
seafloor, back to a receiver on the ship.

25
3.2.2 Cables Laying
Specials equipment is needed to lay cables into deep water. These vessels (Fig 20) are
capable of sailing in deep water and carrying kilometers of cables.
Fig 20: Cable Laying Vessels
Source: ABB Engineering
Also needed, special
robots (Fig 20) are used
to dig trenches to lay
cables and bury in the
seabed to avoid
interfering with fishing.
Fig 21: Cable Laying Robot
Source: QUORA
26
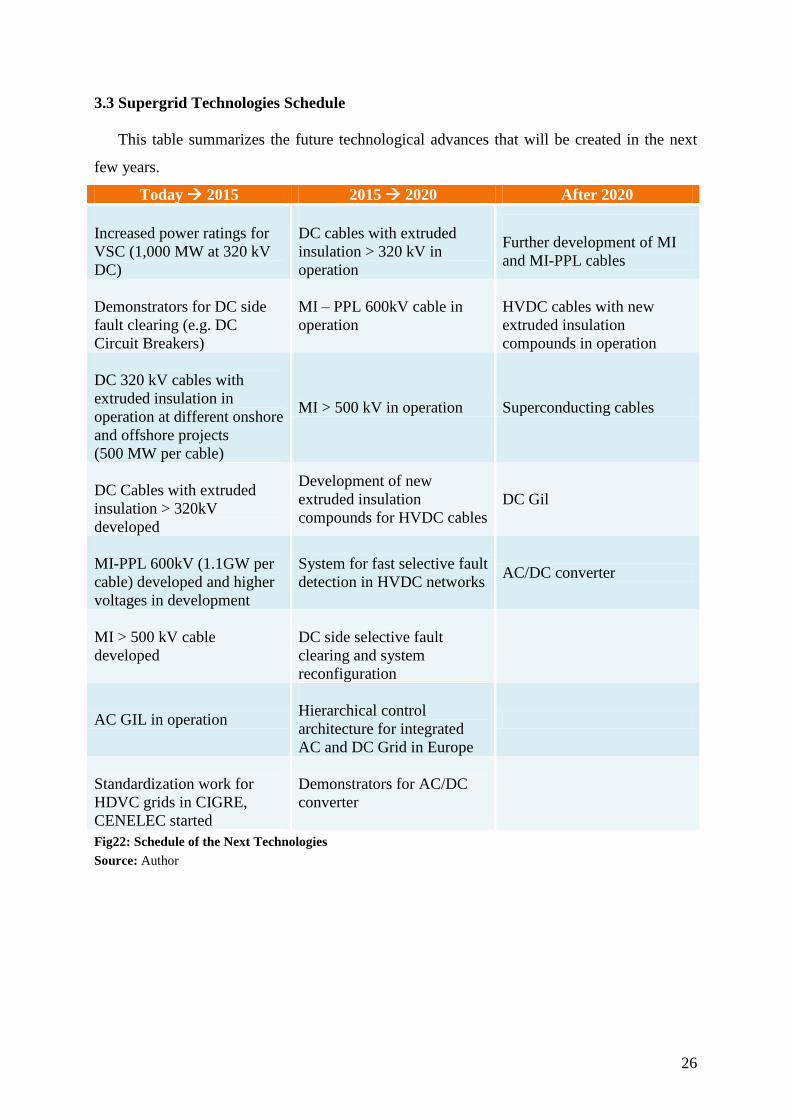
3.3 Supergrid Technologies Schedule
This table summarizes the future technological advances that will be created in the next
few years.
Today 2015 2015 2020 After 2020
Increased power ratings for
VSC (1,000 MW at 320 kV
DC)
DC cables with extruded
insulation > 320 kV in
operation
Further development of MI
and MI-PPL cables
Demonstrators for DC side
fault clearing (e.g. DC
Circuit Breakers)
MI – PPL 600kV cable in
operation
HVDC cables with new
extruded insulation
compounds in operation
DC 320 kV cables with
extruded insulation in
operation at different onshore
and offshore projects
(500 MW per cable)
MI > 500 kV in operation Superconducting cables
DC Cables with extruded
insulation > 320kV
developed
Development of new
extruded insulation
compounds for HVDC cables
DC Gil
MI-PPL 600kV (1.1GW per
cable) developed and higher
voltages in development
System for fast selective fault
detection in HVDC networks AC/DC converter
MI > 500 kV cable
developed
DC side selective fault
clearing and system
reconfiguration
AC GIL in operation
Hierarchical control
architecture for integrated
AC and DC Grid in Europe
Standardization work for
HDVC grids in CIGRE,
CENELEC started
Demonstrators for AC/DC
converter
Fig22: Schedule of the Next Technologies
Source: Author

27
4. The Financial Aspect
4.1 HVAC and HVDC Cost
HVAC transmission line costs more than a DC line for the same transmission capacity. In
addition, in the HVDC case, it is necessary to have terminal stations that convert the AC to
DC and vice versa which is more expensive. But passed a certain distance, the so-called
"break-even distance", the HVDC will always be cheaper.
Fig 23: Typical Investment Costs for an Overhead Line Transmission with AC and HVDC.
Source: ABB Engineering
This point called "break-even-distance" is higher for overhead cables than for submarine
cables. The distance depends on several factors (both for the underwater and overhead cables)
and an analysis must be made for each individual case. That’s why the break-even-distance
must not only be considered in the choice between AC and DC, since several other factors,
such as controllability, are important.
28
4.2 Supergrid Cost
At European level, ENTSO-E is in charge of the network planning of electricity
transmission through the development of the European Ten Year Plan network development.
However, managers of the networks have not yet conducted a comprehensive assessment of
the infrastructure related to supergrids and their cost. The 2050 Roadmap study conducted by
the European Climate Foundation (ECF) is a first approach and provides a first measurement
of the volume of interconnections that it would be necessary to develop in response to the
scenarios of "decarbonization" of the electricity sector by 2050.
Studies have been undertaken on the development of offshore networks in the North Sea.
These have helped to highlight the costs of about 75 – 90 billion euros for development of
offshore networks in the North Sea to allow the reception of about 80 GW of offshore wind
by 2030. This cost does not include enhancements that could be made necessary for terrestrial
networks. Moreover, the level of these costs is highly dependent on available technologies,
their level of standardization, and according the ECF, network structures that can be achieved.
For example, for offshore networks, implementation of mesh networks in DC would optimize
costs (optimization of marine energy connections) and the electrical system (development of
interconnection capacity).
According to Eddie O'Connor, CEO and founder of Mainstream Renewable Power, the
backbone of the creation of Supergrid is based on a fleet of ships capable of staying at sea in
all weathers, 24 hours a day and 365 days a year, to build non-stop wind farms. The cost of
each vessel is $250 million. O'Connor asked the EU to finance 80% of the assessed amount to
nearly € 6 billion, while the European Investment Bank would cover the rest.
The Directorate-General for Energy of the European Commission estimated 1,000 billion
euros cumulative investment needs for 2020, including 600 billion euros divided into three
sectors (Fig 24).

29
Fig 24: Share of Investment by Sector
Source: Author
Transmission 50% distribution
40%
storage 10%

30
Conclusion
In Europe, the development of supergrids meet several needs, such as the environmental
goals set by the package "climate-energy" to improve security of supply and energy
independence of Europe. This will strengthen interconnections and sharing among all
European countries for electricity produced by plants and will optimize the efficiency of the
electricity market by facilitating electricity trade between countries.
However, the reasons for the development of supergrids in other continents and other
countries are not the same. Thus, in Asia, including China, the supergrids are being developed
to transport electricity from large production facilities in the west to load centers mostly
located in the east.
The supergrids fail to cater to the same objectives by region and the terms of their
implementation will vary in different countries. In Europe, these networks may have parts in
DC and offshore elements while in Asia or America, these networks, also called electricity
highways, are ultra-high voltage networks, which can reach up one million volts. The only
element common to these definitions is the transmission of electricity over long distances.
The concept of supergrids therefore covers multiple realities in different geographical
areas and the objectives pursued and it raises many issues, including governance projects,
estimation of development costs and duration of implementation of projects that need to be
addressed if the projects are to be fully operational.
Some come to speak of a Super Smart Grid", a network that would combine the
technologies of Smart grids with the assets posed by electricity highways to make an
expanded intelligent network. The Super Smart Grid then would connect Europe to North
Africa and the Middle East.

31
Bibliography
1. ABB, “HVDC Cable Transmissions”, www.abb.com.
2. Airtricity, “European offshore supergrid proposal”.
3. Bpp.tech, “Subsea umbilicals and power cables”, Darren Patel, 2008.
4. Friends of the Supergrid, “Position paper on the EC communication for a European
infrastructure package”, www.friendsofthesupergrid.eu .
5. Friends of the Supergrid, “The roadmap to the Supergrid Technologies”, 2011,
www.friendsofthesupergrid.eu.
6. International cable protection committee Ltd, “about submarine power cable”, 2006-
2011, www.iscpc.org/publications/about_subpower_cables_2011.pdf
7. JRC, “Renewable Energy Snapshot 2001”, 2007.
8. KPMG, “Offshore wind farms in Europe”, 2007.
9. PRWeb, “Wind energy today: submarine cable O&M: cost critical strategies for
offshore wind” July 2012,
http://www.prweb.com/releases/2011/11/prweb8992345.htm
10. Quora, “How are major undersea cables laid in the ocean?” 2011,
www.quora.com/how-are-major-undersea-cables-laid-in-the-ocean.
11. Smart Grids – CRE, “Dossier, les super grids”, 2012, www.smartgrids-cre.fr.
12. The European wind and energy association, “The European offshore wind industry
key 2011 trends and statistics”, January 2012.
13. The UK parliament, “A European Supergrid”, 2010, www.publications.parliament.uk
14. The European wind and energy association, “Wind energy and the grid”
http://www.ewea.org/index.php?id=196.
15. U.S Department of the interior, “Effect of EMFs from undersea power cables on
elasmobranchs and other marine species”, September 2011.