Survey of Availability of Heat Pumps in the Food and ... · Survey of Availability of Heat Pumps in...
61
Survey of Availability of Heat Pumps in the Food and Beverage Fields March 2010 Heat Pump & Thermal Storage Technology Center of Japan
Transcript of Survey of Availability of Heat Pumps in the Food and ... · Survey of Availability of Heat Pumps in...
Survey of Availability of Heat Pumps in the Food
and Beverage Fields
March 2010
Heat Pump & Thermal Storage Technology Center of Japan

Survey of availability of heat pumps in the food and beverage fields
Contents
1. Introduction ................................................................................................................. 1
1.1 Background and significance of survey ....................................................................................... 1
1.2 General overview of the survey ................................................................................................... 2
2. Estimation of energy consumption structure (energy consumption by country, by
industrial category(sub classification), and by energy type) in the food and beverage
fields of countries surveyed ........................................................................................ 5
2.1 Estimation method ....................................................................................................................... 5
2.2 Estimation results....................................................................................................................... 10
3. CO2 reduction effect by applying heat pumps .......................................................... 12
3.1 Estimation method ..................................................................................................................... 12 3.1.1 Estimation of fuel consumption replaced by heat pumps ........................................................... 12 3.1.2 Estimation of CO2 reduction effect by applying heat pumps ..................................................... 17
3.2 Estimation results....................................................................................................................... 19
4. Conclusion ................................................................................................................ 21
4.1 Importance of replacing boilers with industrial heat pumps ...................................................... 21
4.2 Heat pump introduction effect in the food and beverage fields ................................................. 21
5. References ............................................................................................................... 23
5.1 Consumption by industrial category (middle classification) and energy type in the food and
beverage fields in countries surveyed ....................................................................................... 23
5.2 Estimation results of energy consumption by industrial category (sub classification) and energy
type in countries surveyed ........................................................................................................ 24
5.3 Energy consumption and CO2 emission related data in countries surveyed ............................. 30
5.4 Correlation between energy consumption and energy purchases .............................................. 31
5.5 Source of data ............................................................................................................................ 32 5.5.1 Data related to energy consumption structure analysis .............................................................. 32
5.5.2 Data related to the CO2 reduction effect analysis ...................................................................... 35
5.6 Topics on heat pump technology ............................................................................................... 39 5.6.1 Technological development of industrial heat pump .................................................................. 39 5.6.2 Status of application of heat pumps for industrial use ................................................................ 42
5.7 Example of actual measured radiation loss entailed by steam transfer ...................................... 50
5.8 Heat recovery technologies in food and beverage fields ........................................................... 51
5.9 Estimation results of primary energy consumption reduction ................................................... 52 5.9.1 Estimation method ...................................................................................................................... 52 5.9.2 Estimation results ....................................................................................................................... 54 5.9.3 Source of Data ............................................................................................................................ 55
5.10 Variation analyses for the composition ratio of applications at a use temperature below 100℃
to consumption for steam boilers .............................................................................................. 56 5.10.1 Estimation method .................................................................................................................... 56 5.10.2 Estimation results ..................................................................................................................... 56

1. Introduction 1.1 Background and significance of survey
Heat pumps have become increasingly important in the world as a technology to contribute to
CO2 reduction. Heat pumps have been widely used in office air-conditioning and are expected to
spread to other industrial fields from now on.
Recently, heat pumps have made great technological progress such as improved efficiency,
increase in capacity, output at higher temperatures, etc. The possibility of replacing boilers, which
are a conventional heat source, with heat pumps has increased in the industrial field. The Heat Pump
& Thermal Storage Technology Center of Japan estimated that a reduction of approximately 33
million tons of CO2 emissions can be achieved across the whole of Japan by expanding the use of
heat pumps in the industrial field.
In business categories such as food and beverage manufacturing factories, the operating
temperature level is relatively low. The introduction of heat pumps into this field is considered to be
easy because the temperature required in process is below 100℃ in many cases.
In this survey, CO2 reduction potential in 11 countries by applying heat pumps in the food and
beverage fields was estimated for the purpose of determining the CO2 reduction effect obtained by
introducing heat pumps.
- 1 -
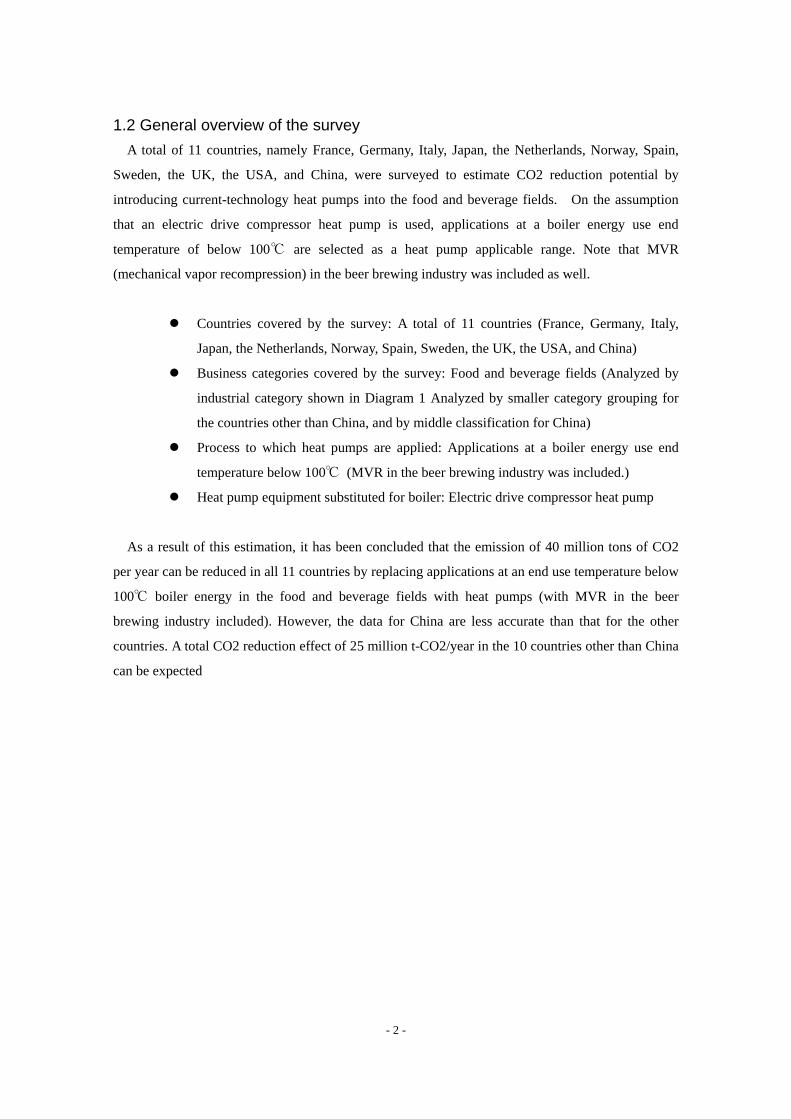
1.2 General overview of the survey A total of 11 countries, namely France, Germany, Italy, Japan, the Netherlands, Norway, Spain,
Sweden, the UK, the USA, and China, were surveyed to estimate CO2 reduction potential by
introducing current-technology heat pumps into the food and beverage fields. On the assumption
that an electric drive compressor heat pump is used, applications at a boiler energy use end
temperature of below 100℃ are selected as a heat pump applicable range. Note that MVR
(mechanical vapor recompression) in the beer brewing industry was included as well.
Countries covered by the survey: A total of 11 countries (France, Germany, Italy,
Japan, the Netherlands, Norway, Spain, Sweden, the UK, the USA, and China)
Business categories covered by the survey: Food and beverage fields (Analyzed by
industrial category shown in Diagram 1 Analyzed by smaller category grouping for
the countries other than China, and by middle classification for China)
Process to which heat pumps are applied: Applications at a boiler energy use end
temperature below 100℃ (MVR in the beer brewing industry was included.)
Heat pump equipment substituted for boiler: Electric drive compressor heat pump
As a result of this estimation, it has been concluded that the emission of 40 million tons of CO2
per year can be reduced in all 11 countries by replacing applications at an end use temperature below
100℃ boiler energy in the food and beverage fields with heat pumps (with MVR in the beer
brewing industry included). However, the data for China are less accurate than that for the other
countries. A total CO2 reduction effect of 25 million t-CO2/year in the 10 countries other than China
can be expected
- 2 -
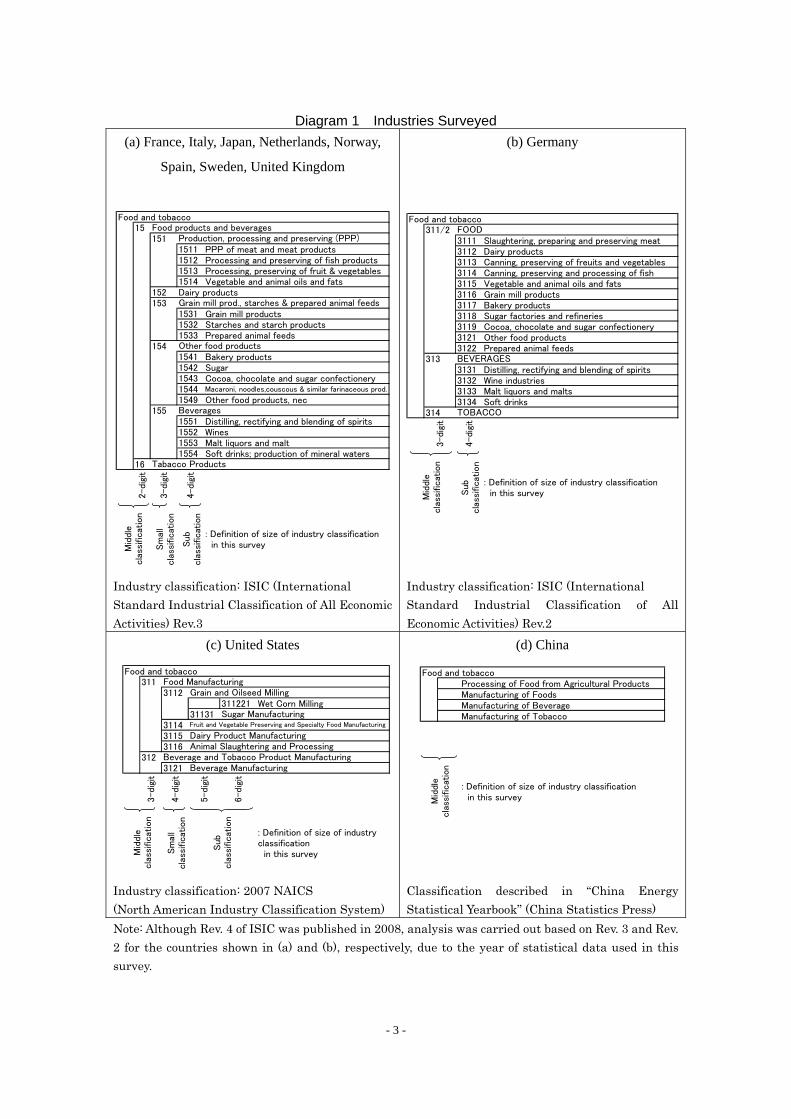
Diagram 1 Industries Surveyed (a) France, Italy, Japan, Netherlands, Norway,
Spain, Sweden, United Kingdom
Food and tobacco15
1511511 PPP of meat and meat products1512 Processing and preserving of fish products1513 Processing, preserving of fruit & vegetables1514 Vegetable and animal oils and fats
152 Dairy products153
1531 Grain mill products1532 Starches and starch products1533 Prepared animal feeds
1541541 Bakery products1542 Sugar1543 Cocoa, chocolate and sugar confectionery1544 Macaroni, noodles,couscous & similar farinaceous prod.
1549 Other food products, nec155
1551 Distilling, rectifying and blending of spirits1552 Wines1553 Malt liquors and malt1554 Soft drinks; production of mineral waters
16
2-dig
it
3-dig
it
4-dig
it
Sm
all
cla
ssific
atio
n
Sub
cla
ssific
atio
n
: Definition of size of industry classification in this surveyM
iddle
clas
sifica
tion
Tabacco Products
Beverages
Food products and beveragesProduction, processing and preserving (PPP)
Grain mill prod., starches & prepared animal feeds
Other food products
Industry classification: ISIC (International Standard Industrial Classification of All Economic Activities) Rev.3
(b) Germany
Food and tobacco311/2
3111 Slaughtering, preparing and preserving meat3112 Dairy products 3113 Canning, preserving of freuits and vegetables3114 Canning, preserving and processing of fish3115 Vegetable and animal oils and fats3116 Grain mill products3117 Bakery products3118 Sugar factories and refineries3119 Cocoa, chocolate and sugar confectionery3121 Other food products3122 Prepared animal feeds
3133131 Distilling, rectifying and blending of spirits3132 Wine industries3133 Malt liquors and malts3134 Soft drinks
314
3-di
git
4-di
git
Sub
clas
sifica
tion
: Definition of size of industry classification in this surveyM
iddl
ecla
ssific
atio
n
FOOD
BEVERAGES
TOBACCO
Industry classification: ISIC (International Standard Industrial Classification of All Economic Activities) Rev.2
(c) United States
Food and tobacco311
3112311221 Wet Corn Milling
31131311431153116
3123121
3-di
git
4-di
git
5-di
git
6-di
git
Sm
all
cla
ssific
atio
n
: Definition of size of industryclassification in this surveyM
iddle
clas
sificat
ion
Sub
clas
sificat
ion
Sugar Manufacturing
Dairy Product ManufacturingAnimal Slaughtering and Processing
Grain and Oilseed MillingFood Manufacturing
Beverage ManufacturingBeverage and Tobacco Product Manufacturing
Fruit and Vegetable Preserving and Specialty Food Manufacturing
Industry classification: 2007 NAICS (North American Industry Classification System)
(d) China
Food and tobaccoProcessing of Food from Agricultural ProductsManufacturing of FoodsManufacturing of BeverageManufacturing of Tobacco
: Definition of size of industry classification in this surveyM
iddl
ecla
ssific
atio
n
Classification described in “China Energy Statistical Yearbook” (China Statistics Press)
Note: Although Rev. 4 of ISIC was published in 2008, analysis was carried out based on Rev. 3 and Rev. 2 for the countries shown in (a) and (b), respectively, due to the year of statistical data used in this survey.
- 3 -
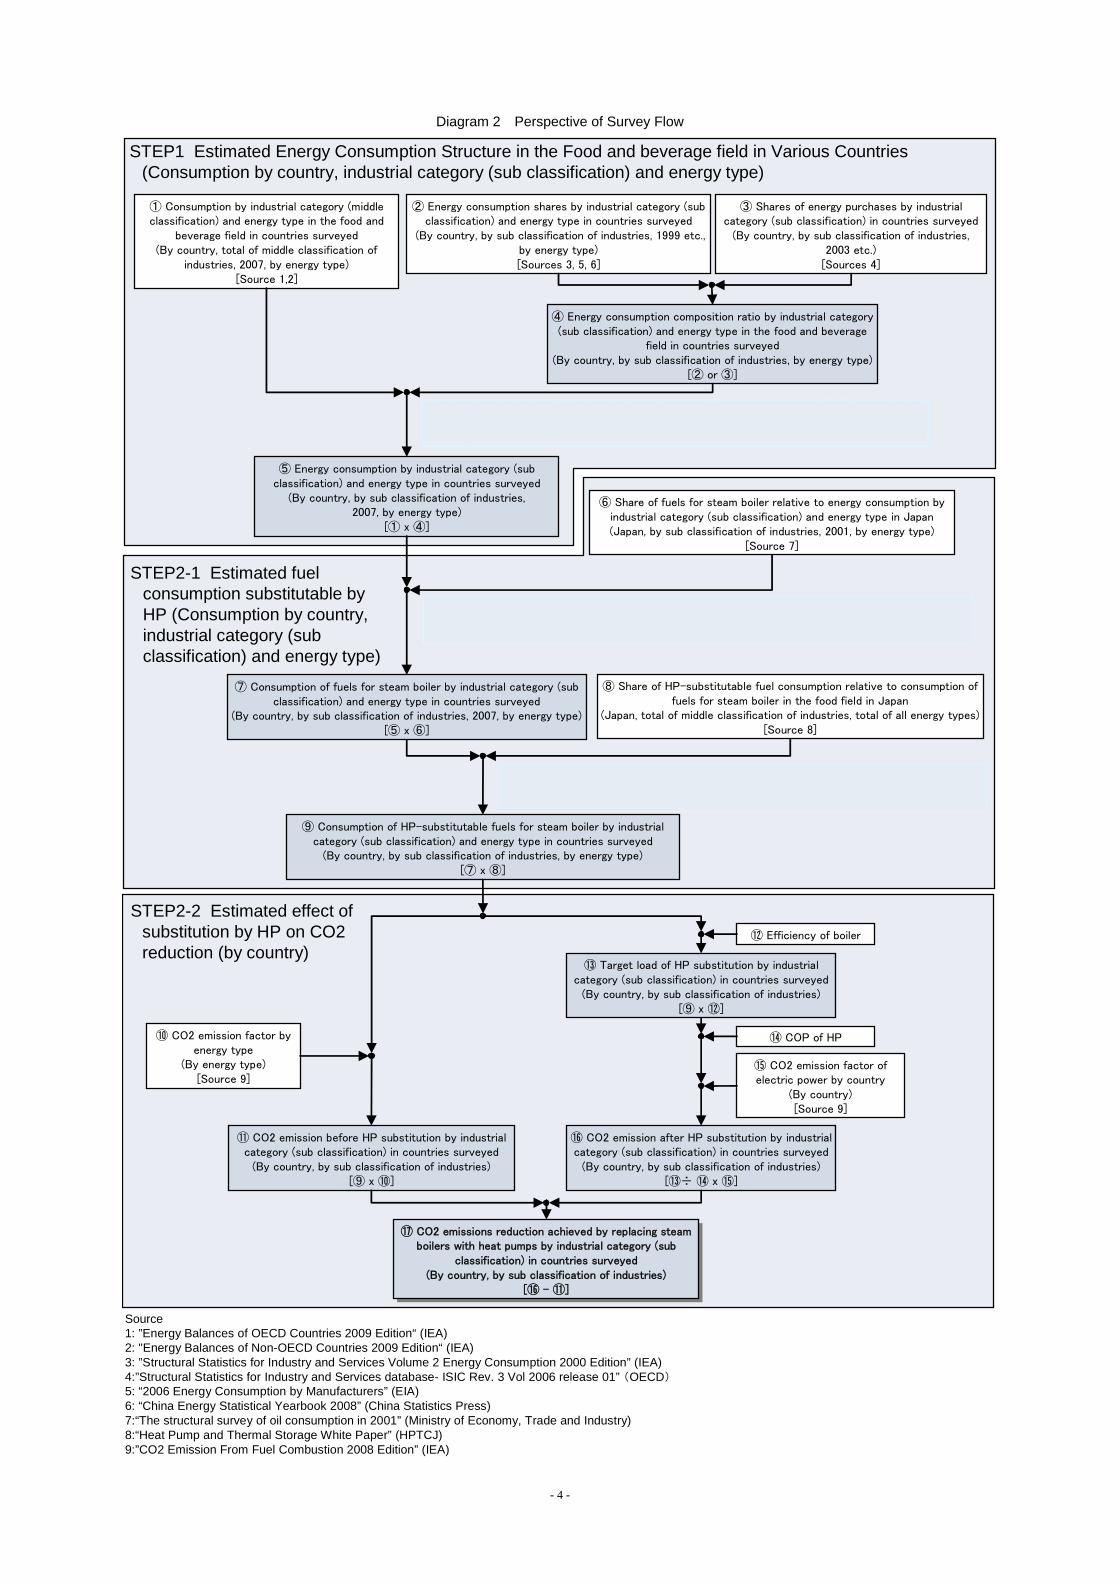
Diagram 2 Perspective of Survey Flow
① Consumption by industrial category (middle classification) and energy type in the food and
beverage field in countries surveyed(By country, total of middle classification of
industries, 2007, by energy type)[Source 1,2]
⑤ Energy consumption by industrial category (sub classification) and energy type in countries surveyed
(By country, by sub classification of industries,2007, by energy type)
[① x ④]
④ Energy consumption composition ratio by industrial category (sub classification) and energy type in the food and beverage
field in countries surveyed(By country, by sub classification of industries, by energy type)
[② or ③]
② Energy consumption shares by industrial category (subclassification) and energy type in countries surveyed
(By country, by sub classification of industries, 1999 etc., by energy type)[Sources 3, 5, 6]
⑥ Share of fuels for steam boiler relative to energy consumption by industrial category (sub classification) and energy type in Japan(Japan, by sub classification of industries, 2001, by energy type)
[Source 7]
* “Share of fuels for steam boiler relative to energy consumption in 2001 in Japan” is assumed as equal to “Share of fuels for steam boiler relative to energy consumption in 2007 in countries surveyed”.
*”Energy consumption composition ratio by industrial category (sub classification) and energy type in 2007” is assumed as equal to “Energy consumption composition ratio by industrial category (sub classification) and energy type in year used for ④”.
⑦ Consumption of fuels for steam boiler by industrial category (sub classification) and energy type in countries surveyed
(By country, by sub classification of industries, 2007, by energy type)[⑤ x ⑥]
⑧ Share of HP-substitutable fuel consumption relative to consumption of fuels for steam boiler in the food field in Japan
(Japan, total of middle classification of industries, total of all energy types)[Source 8]
* “Share of HP-substitutable fuel consumption in the food field (middle classification) in Japan” is assumed to be equal to “Share of HP-substitutable fuel consumption by industrial category (sub classification) and energy type in countries surveyed”
⑨ Consumption of HP-substitutable fuels for steam boiler by industrial category (sub classification) and energy type in countries surveyed
(By country, by sub classification of industries, by energy type)[⑦ x ⑧]
⑫ Efficiency of boiler
⑯ CO2 emission after HP substitution by industrial category (sub classification) in countries surveyed
(By country, by sub classification of industries)[⑬÷ ⑭ x ⑮]
⑭ COP of HP
⑮ CO2 emission factor of electric power by country
(By country)[Source 9]
⑪ CO2 emission before HP substitution by industrial category (sub classification) in countries surveyed
(By country, by sub classification of industries)[⑨ x ⑩]
⑩ CO2 emission factor by energy type
(By energy type)[Source 9]
⑰ CO2 emissions reduction achieved by replacing steam boilers with heat pumps by industrial category (sub
classification) in countries surveyed (By country, by sub classification of industries)
[⑯ ‒ ⑪]
⑰ CO2 emissions reduction achieved by replacing steam boilers with heat pumps by industrial category (sub
classification) in countries surveyed (By country, by sub classification of industries)
[⑯ ‒ ⑪]
STEP1 Estimated Energy Consumption Structure in the Food and beverage field in Various Countries (Consumption by country, industrial category (sub classification) and energy type)
STEP2-2 Estimated effect of substitution by HP on CO2 reduction (by country)
③ Shares of energy purchases by industrial category (sub classification) in countries surveyed
(By country, by sub classification of industries,2003 etc.)
[Sources 4]
STEP2-1 Estimated fuel consumption substitutable by HP (Consumption by country, industrial category (sub classification) and energy type)
⑬ Target load of HP substitution by industrial category (sub classification) in countries surveyed
(By country, by sub classification of industries)[⑨ x ⑫]
Source1: ”Energy Balances of OECD Countries 2009 Edition“ (IEA)2: "Energy Balances of Non-OECD Countries 2009 Edition“ (IEA) 3: ”Structural Statistics for Industry and Services Volume 2 Energy Consumption 2000 Edition” (IEA)4:”Structural Statistics for Industry and Services database- ISIC Rev. 3 Vol 2006 release 01” (OECD)5: “2006 Energy Consumption by Manufacturers” (EIA)6: “China Energy Statistical Yearbook 2008” (China Statistics Press)7:“The structural survey of oil consumption in 2001” (Ministry of Economy, Trade and Industry) 8:“Heat Pump and Thermal Storage White Paper” (HPTCJ)9:”CO2 Emission From Fuel Combustion 2008 Edition” (IEA)
- 4 -

2. Estimation of energy consumption structure (energy consumption by country, by industrial category(sub classification), and by energy type) in the food and beverage fields of countries surveyed
To estimate CO2 reduction potential by applying heat pumps, it is necessary to understand the
energy consumption structure (energy consumption by country, by industrial category, and by energy
type) in the food and beverage fields of each country covered by the survey. To estimate CO2
emissions before replacement, it is particularly necessary to determine energy consumption by
energy type because the CO2 emission factor differs from type to type. In addition, it is desirable to
understand the energy consumption structure by industrial category because the share of fuels for
steam boiler relative to energy consumption that is to be replaced differs depending on each
industrial category,
Therefore, in this survey, we determined the energy consumption structure by country, industrial
category (sub classification), and energy type in the food and beverage fields of each country. Note
that the middle classification was used for China because of limited statistical data. In this survey,
we mixed and matched many different statistical materials to estimate the energy consumption
structure for China because documents on relevant data were not available.
2.1 Estimation method The “Energy Balances of OECD Countries 2009 Edition” (IEA) and “Energy Balances of
Non-OECD Countries 2009 Edition” (IEA) provide statistical data on the energy consumption
structure of each country (see p.32 of the reference material). In the statistical data, the energy
consumption structure of each country in 2007, the most recent year, can be compared at a glance,
but the breakdown by industrial category in the food and beverage fields cannot be known because
the classification level of industrial category is not detailed enough.
Meanwhile, although two or more sets of statistics on the breakdown by industrial category in the
food and beverage fields of each country are available, the most recent statistics on the countries
covered by this survey are not available. For example, although the “Structural Statistics for Industry
and Services Volume 2 Energy Consumption 2000 Edition” (IEA) (see p.33 of the reference
material) indicates the breakdown of the energy consumption structure by industrial category in the
food and beverage fields of each country, this document has some tasks to address; for instance, the
listed data are old, only limited countries are listed, classification level of industrial category differs
from country to country, etc. Also, the “Structural Statistics for Industry and Services database- ISIC
Rev. 3 Vol 2006 release 01” (IEA) (see p.34 of the reference material) shows the breakdown of
energy purchases1 by industrial category in the food and beverage fields of each country, but no data
1 There is a positive correlation between energy purchases and energy consumption. (See p.31 of the reference material)
- 5 -
on energy consumption are listed.
In this survey, we estimated the consumption of each country by industrial category (sub category)
and energy type in 2007 in the following manner. Used statistical data are listed in Diagram 6.
1) The energy consumption structure of each country in the most recent year can be compared at a
glance in the “Energy Balances of OECD Countries 2009 Edition” (IEA) and “Energy Balances
of Non-OECD Countries 2009 Edition” (IEA). First of all, we used these two reports to
calculate “① Consumption by industrial category (middle classification) and energy type in the
food and beverage fields in countries surveyed” (2007 data).
2) Next, we used various statistical data to set energy consumption ratio by industrial category
(sub classification) composing the food and beverage fields and to estimate “⑤ Energy
consumption by industrial category (sub classification) and energy type in countries surveyed”.
3) The method by which the energy consumption shares by industrial category (subcategory) were
set differs from country to country. For the countries listed in the “Structural Statistics for
Industry and Services Volume 2 Energy Consumption 2000 Edition” (IEA), i.e. France,
Germany, Japan, Norway, Sweden, and the UK, we set “② Energy consumption shares by
industrial category (sub classification) and energy type in countries surveyed” based on this
document (data up to 1999).
4) Method 3) could not be employed for other countries. Among other countries, for the countries
listed in the “Structural Statistics for Industry and Services database- ISIC Rev. 3 Vol 2006
release 01” (OECD), that is, Italy, the Netherlands, and Spain, we set the energy consumption
ratio by industrial category (sub classification) and energy type2 based on “③ Shares of energy
purchases by industrial category (sub classification) in countries surveyed” (2003 data).
5) Neither Methods 3) nor 4) could be employed for the remaining countries, the USA and China.
We set “② Energy consumption shares by industrial category (sub classification) and energy
type in countries surveyed” by examining the statistical data by country. Note that since such a
subcategorized estimation for China was difficult owing to limited statistical materials, we had
to estimate the energy consumption by industrial category (middle classification) and energy
type as a last resort.
2 For France, we set the share in small classification (three-digit classification in ISIC) based on energy
consumption and the share in sub classification (four-digit classification in ISIC) based on energy purchases.
- 6 -
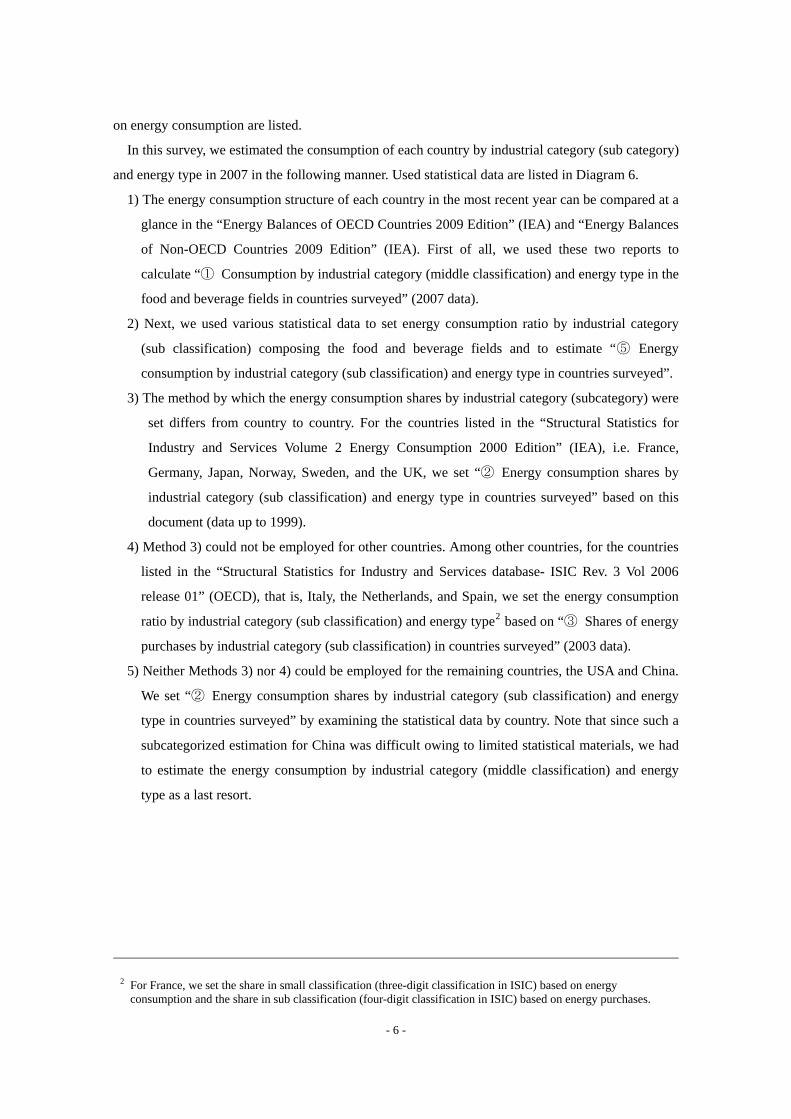
Diagram 3 Estimated Flow of Energy Consumption by Country, Industrial category (Sub Classification) and Energy type (Image):
Germany, Japan, Norway, Sweden, U.K., U.S. and China ChinaChina
U.S.U.S.U.K.U.K.
SwedenSweden
NorwayNorwayGermanyGermany
②Energy consumption shares by industrial category (sub classification) andenergy type in countries surveyed (1998)
Source: ”Structural Statistics for Industry and Services Volume 2 Energy Consumption 2000 Edition”(IEA) (See p.33 of the reference material)
①Consumption by industrial category (middle classification) and energy type in the food andbeverage field in countries surveyed (2007)
Source: “Energy Balances of OECD Countries 2009 Edition” (IEA) (See p.32 of the reference material)
Japan/
Food and Tobacco
(Middle classification)
⑤Energy consumption by industrial category (sub classification) and energy type in countries surveyed (2007)
Japan
Petro. products
GasCoal &
peat
(Mto
e)
Combust. Renew. & waste
Electr. Heat
Japan/
Food and Tobacco
(subclassification)
100%
・・・
・・・
・・・
・・・・・
・・・・
Electr.GasSolid LPG, Distiloil,
RFO
Biomass Steam
Japan/
Food and Tobacco
(subclassification)
Petro. products
GasCoal &
peat
(Mto
e)
Combust. Renew. & waste
Electr. Heat
1511
151215131514
152
(Mto
e) 1511:Production of meat and meat products
152:Dairy products
1512:Processing and preserving of fish products
1513:Processing, preserving of fruit & vegetables
1514:Vegetable and animal oils and fats
・・・
・・・・・
・
・・・
・・・
・・・ ・・・
1511:Production of meat and meat products
1512:Processing and preserving of fish products
1514:Vegetable and animal oils and fats
152:Dairy products
1513:Processing, preserving of fruit & vegetables
・・・
Note: For China, due to limitation of statistical data, energy consumption by industrial category (middle classification) and energy type was finally estimated.
- 7 -
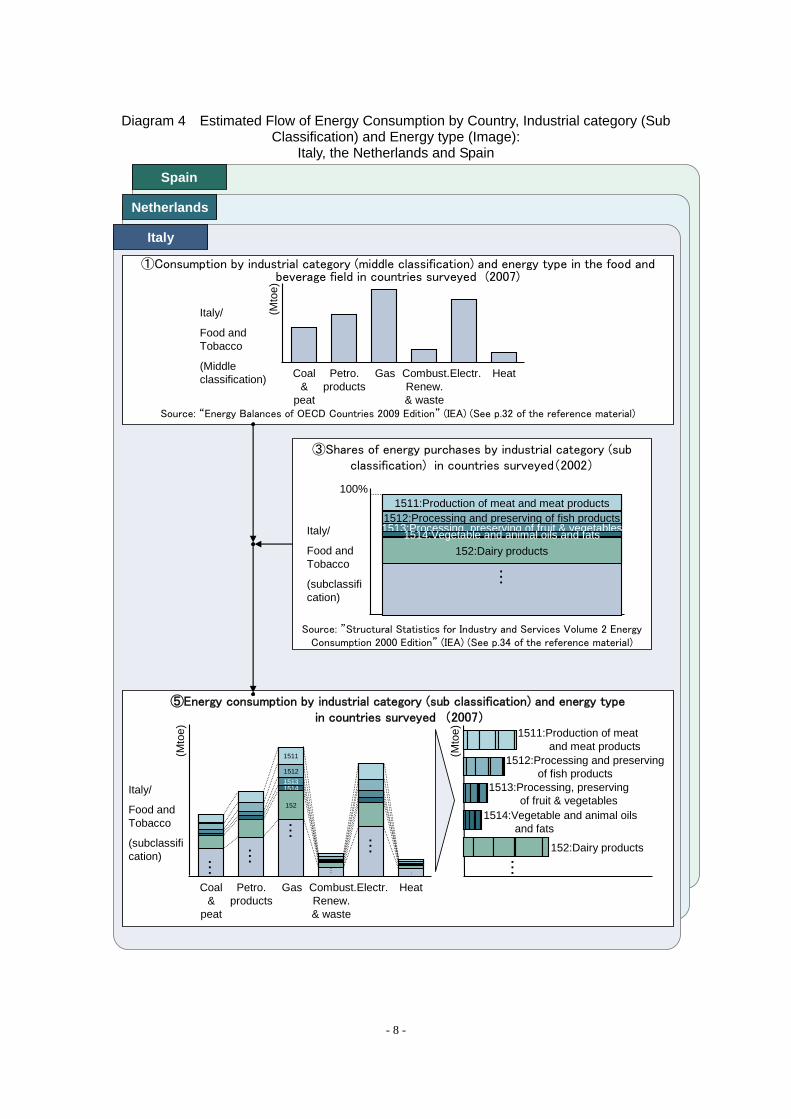
Diagram 4 Estimated Flow of Energy Consumption by Country, Industrial category (Sub Classification) and Energy type (Image):
Italy, the Netherlands and Spain
Spain
Netherlands
①Consumption by industrial category (middle classification) and energy type in the food andbeverage field in countries surveyed (2007)
Source: “Energy Balances of OECD Countries 2009 Edition” (IEA) (See p.32 of the reference material)
Italy/
Food and Tobacco
(Middle classification)
⑤Energy consumption by industrial category (sub classification) and energy typein countries surveyed (2007)
Italy
Petro. products
GasCoal &
peat
(Mto
e)
Combust. Renew. & waste
Electr. Heat
③Shares of energy purchases by industrial category (sub classification) in countries surveyed(2002)
Source: ”Structural Statistics for Industry and Services Volume 2 Energy Consumption 2000 Edition” (IEA) (See p.34 of the reference material)
Italy/
Food and Tobacco
(subclassification)
100%
Italy/
Food and Tobacco
(subclassification)
Petro. products
GasCoal &
peat
(Mto
e)
Combust. Renew. & waste
Electr. Heat
1511
151215131514
152
(Mto
e) 1511:Production of meat and meat products
152:Dairy products
1512:Processing and preserving of fish products
1513:Processing, preserving of fruit & vegetables
1514:Vegetable and animal oils and fats
・・・
・・・
・・・
・・・ ・・
・・・・ ・・・
1511:Production of meat and meat products1512:Processing and preserving of fish products1513:Processing, preserving of fruit & vegetables
152:Dairy products
・・・
1514:Vegetable and animal oils and fats
- 8 -
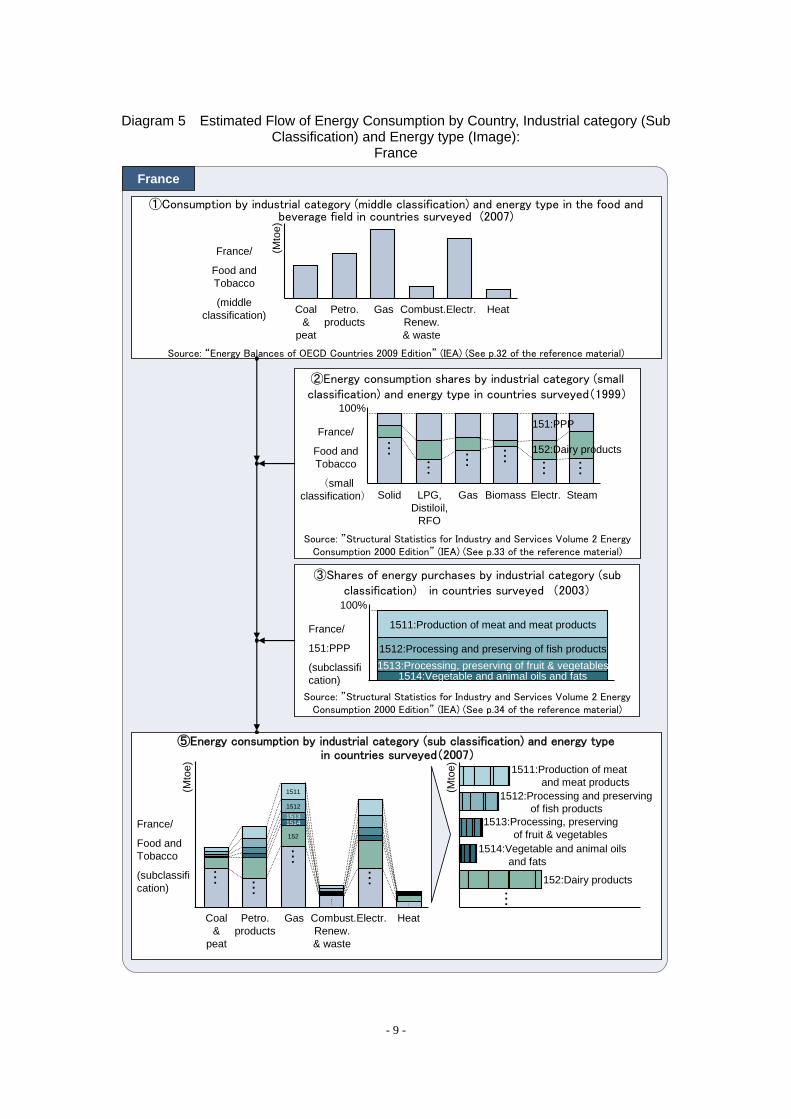
Diagram 5 Estimated Flow of Energy Consumption by Country, Industrial category (Sub Classification) and Energy type (Image):
France
②Energy consumption shares by industrial category (small classification) and energy type in countries surveyed(1999)
Source: ”Structural Statistics for Industry and Services Volume 2 Energy Consumption 2000 Edition” (IEA) (See p.33 of the reference material)
①Consumption by industrial category (middle classification) and energy type in the food andbeverage field in countries surveyed (2007)
Source: “Energy Balances of OECD Countries 2009 Edition” (IEA) (See p.32 of the reference material)
France/
Food and Tobacco
(middle classification)
⑤Energy consumption by industrial category (sub classification) and energy typein countries surveyed(2007)
France
Petro. products
GasCoal &
peat
(Mto
e)
Combust. Renew. & waste
Electr. Heat
France/
Food and Tobacco
(small classification)
100%151:PPP
152:Dairy products・・・
・・・
・・・
・・・・・
・・・・
③Shares of energy purchases by industrial category (sub classification) in countries surveyed (2003)
Source: ”Structural Statistics for Industry and Services Volume 2 Energy Consumption 2000 Edition” (IEA) (See p.34 of the reference material)
France/
151:PPP
(subclassification)
1511:Production of meat and meat products
1512:Processing and preserving of fish products
100%
Electr.GasSolid LPG, Distiloil,
RFO
Biomass Steam
France/
Food and Tobacco
(subclassification)
Petro. products
GasCoal &
peat
(Mto
e)
Combust. Renew. & waste
Electr. Heat
1513:Processing, preserving of fruit & vegetables1514:Vegetable and animal oils and fats
1511
151215131514
152
(Mto
e) 1511:Production of meat and meat products
152:Dairy products
1512:Processing and preserving of fish products
1513:Processing, preserving of fruit & vegetables
1514:Vegetable and animal oils and fats
・・・
・・・・・
・
・・・
・・・
・・・ ・・・
- 9 -
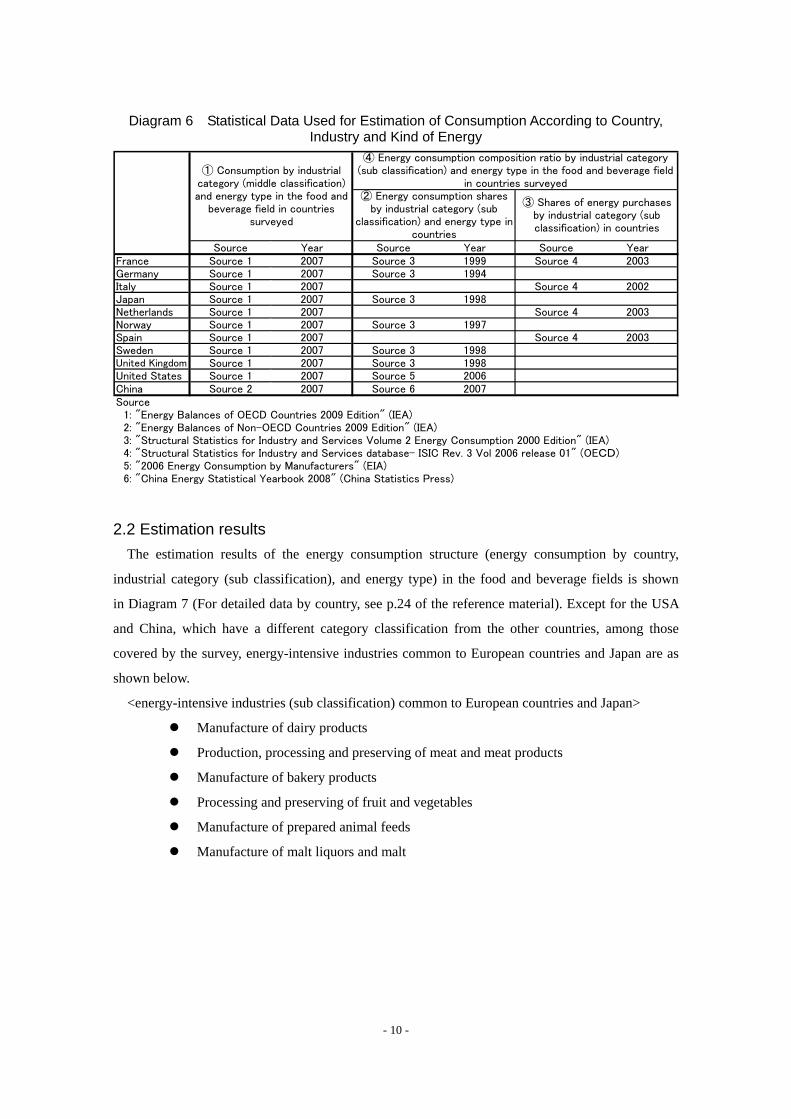
Diagram 6 Statistical Data Used for Estimation of Consumption According to Country, Industry and Kind of Energy
Source Year Source Year Source YearFrance Source 1 2007 Source 3 1999 Source 4 2003Germany Source 1 2007 Source 3 1994Italy Source 1 2007 Source 4 2002Japan Source 1 2007 Source 3 1998Netherlands Source 1 2007 Source 4 2003Norway Source 1 2007 Source 3 1997Spain Source 1 2007 Source 4 2003Sweden Source 1 2007 Source 3 1998United Kingdom Source 1 2007 Source 3 1998United States Source 1 2007 Source 5 2006China Source 2 2007 Source 6 2007Source 1: "Energy Balances of OECD Countries 2009 Edition" (IEA) 2: "Energy Balances of Non-OECD Countries 2009 Edition" (IEA) 3: "Structural Statistics for Industry and Services Volume 2 Energy Consumption 2000 Edition" (IEA) 4: "Structural Statistics for Industry and Services database- ISIC Rev. 3 Vol 2006 release 01" (OECD) 5: "2006 Energy Consumption by Manufacturers" (EIA) 6: "China Energy Statistical Yearbook 2008" (China Statistics Press)
① Consumption by industrialcategory (middle classification)and energy type in the food and
beverage field in countriessurveyed
④ Energy consumption composition ratio by industrial category(sub classification) and energy type in the food and beverage field
in countries surveyed② Energy consumption shares
by industrial category (subclassification) and energy type in
countries
③ Shares of energy purchasesby industrial category (subclassification) in countries
2.2 Estimation results The estimation results of the energy consumption structure (energy consumption by country,
industrial category (sub classification), and energy type) in the food and beverage fields is shown
in Diagram 7 (For detailed data by country, see p.24 of the reference material). Except for the USA
and China, which have a different category classification from the other countries, among those
covered by the survey, energy-intensive industries common to European countries and Japan are as
shown below.
<energy-intensive industries (sub classification) common to European countries and Japan>
Manufacture of dairy products
Production, processing and preserving of meat and meat products
Manufacture of bakery products
Processing and preserving of fruit and vegetables
Manufacture of prepared animal feeds
Manufacture of malt liquors and malt
- 10 -
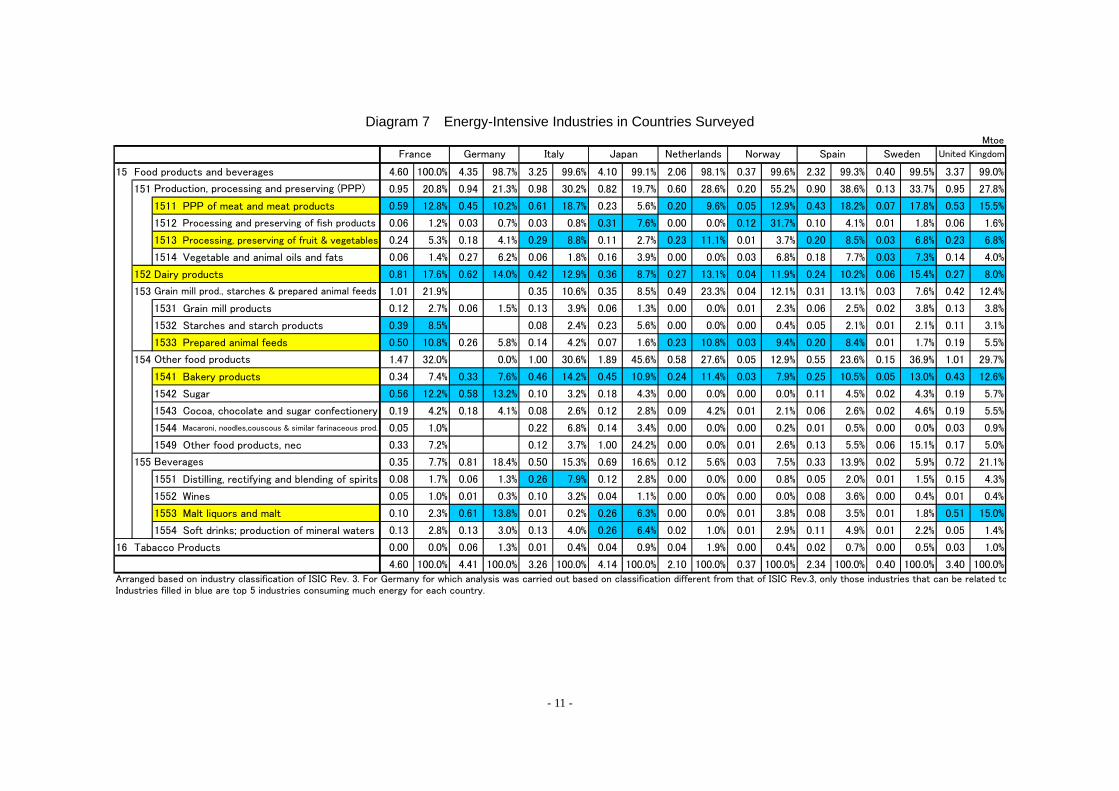
Diagram 7 Energy-Intensive Industries in Countries Surveyed Mtoe
15 Food products and beverages 4.60 100.0% 4.35 98.7% 3.25 99.6% 4.10 99.1% 2.06 98.1% 0.37 99.6% 2.32 99.3% 0.40 99.5% 3.37 99.0%
151 0.95 20.8% 0.94 21.3% 0.98 30.2% 0.82 19.7% 0.60 28.6% 0.20 55.2% 0.90 38.6% 0.13 33.7% 0.95 27.8%
1511 PPP of meat and meat products 0.59 12.8% 0.45 10.2% 0.61 18.7% 0.23 5.6% 0.20 9.6% 0.05 12.9% 0.43 18.2% 0.07 17.8% 0.53 15.5%
1512 Processing and preserving of fish products 0.06 1.2% 0.03 0.7% 0.03 0.8% 0.31 7.6% 0.00 0.0% 0.12 31.7% 0.10 4.1% 0.01 1.8% 0.06 1.6%
1513 Processing, preserving of fruit & vegetables 0.24 5.3% 0.18 4.1% 0.29 8.8% 0.11 2.7% 0.23 11.1% 0.01 3.7% 0.20 8.5% 0.03 6.8% 0.23 6.8%
1514 Vegetable and animal oils and fats 0.06 1.4% 0.27 6.2% 0.06 1.8% 0.16 3.9% 0.00 0.0% 0.03 6.8% 0.18 7.7% 0.03 7.3% 0.14 4.0%
152 Dairy products 0.81 17.6% 0.62 14.0% 0.42 12.9% 0.36 8.7% 0.27 13.1% 0.04 11.9% 0.24 10.2% 0.06 15.4% 0.27 8.0%
153 1.01 21.9% 0.35 10.6% 0.35 8.5% 0.49 23.3% 0.04 12.1% 0.31 13.1% 0.03 7.6% 0.42 12.4%
1531 Grain mill products 0.12 2.7% 0.06 1.5% 0.13 3.9% 0.06 1.3% 0.00 0.0% 0.01 2.3% 0.06 2.5% 0.02 3.8% 0.13 3.8%
1532 Starches and starch products 0.39 8.5% 0.08 2.4% 0.23 5.6% 0.00 0.0% 0.00 0.4% 0.05 2.1% 0.01 2.1% 0.11 3.1%
1533 Prepared animal feeds 0.50 10.8% 0.26 5.8% 0.14 4.2% 0.07 1.6% 0.23 10.8% 0.03 9.4% 0.20 8.4% 0.01 1.7% 0.19 5.5%
154 1.47 32.0% 0.0% 1.00 30.6% 1.89 45.6% 0.58 27.6% 0.05 12.9% 0.55 23.6% 0.15 36.9% 1.01 29.7%
1541 Bakery products 0.34 7.4% 0.33 7.6% 0.46 14.2% 0.45 10.9% 0.24 11.4% 0.03 7.9% 0.25 10.5% 0.05 13.0% 0.43 12.6%
1542 Sugar 0.56 12.2% 0.58 13.2% 0.10 3.2% 0.18 4.3% 0.00 0.0% 0.00 0.0% 0.11 4.5% 0.02 4.3% 0.19 5.7%
1543 Cocoa, chocolate and sugar confectionery 0.19 4.2% 0.18 4.1% 0.08 2.6% 0.12 2.8% 0.09 4.2% 0.01 2.1% 0.06 2.6% 0.02 4.6% 0.19 5.5%
1544 Macaroni, noodles,couscous & similar farinaceous prod. 0.05 1.0% 0.22 6.8% 0.14 3.4% 0.00 0.0% 0.00 0.2% 0.01 0.5% 0.00 0.0% 0.03 0.9%
1549 Other food products, nec 0.33 7.2% 0.12 3.7% 1.00 24.2% 0.00 0.0% 0.01 2.6% 0.13 5.5% 0.06 15.1% 0.17 5.0%
155 0.35 7.7% 0.81 18.4% 0.50 15.3% 0.69 16.6% 0.12 5.6% 0.03 7.5% 0.33 13.9% 0.02 5.9% 0.72 21.1%
1551 Distilling, rectifying and blending of spirits 0.08 1.7% 0.06 1.3% 0.26 7.9% 0.12 2.8% 0.00 0.0% 0.00 0.8% 0.05 2.0% 0.01 1.5% 0.15 4.3%
1552 Wines 0.05 1.0% 0.01 0.3% 0.10 3.2% 0.04 1.1% 0.00 0.0% 0.00 0.0% 0.08 3.6% 0.00 0.4% 0.01 0.4%
1553 Malt liquors and malt 0.10 2.3% 0.61 13.8% 0.01 0.2% 0.26 6.3% 0.00 0.0% 0.01 3.8% 0.08 3.5% 0.01 1.8% 0.51 15.0%
1554 Soft drinks; production of mineral waters 0.13 2.8% 0.13 3.0% 0.13 4.0% 0.26 6.4% 0.02 1.0% 0.01 2.9% 0.11 4.9% 0.01 2.2% 0.05 1.4%
16 Tabacco Products 0.00 0.0% 0.06 1.3% 0.01 0.4% 0.04 0.9% 0.04 1.9% 0.00 0.4% 0.02 0.7% 0.00 0.5% 0.03 1.0%
4.60 100.0% 4.41 100.0% 3.26 100.0% 4.14 100.0% 2.10 100.0% 0.37 100.0% 2.34 100.0% 0.40 100.0% 3.40 100.0%
Arranged based on industry classification of ISIC Rev. 3. For Germany for which analysis was carried out based on classification different from that of ISIC Rev.3, only those industries that can be related toIndustries filled in blue are top 5 industries consuming much energy for each country.
Other food products
Beverages
United KingdomSweden
Production, processing and preserving (PPP)
France Germany Italy Japan Netherlands Norway Spain
Grain mill prod., starches & prepared animal feeds
- 11 -
3. CO2 reduction effect by applying heat pumps 3.1 Estimation method 3.1.1 Estimation of fuel consumption replaced by heat pumps
We set applications at an end use temperature below 100℃ boiler energy (including MVR) as a
heat pump applicable range to estimate the CO2 reduction effect by applying current-technology
heat pumps to the food and beverage fields of major countries according to the following procedure.
1)We obtained the “⑦ Consumption of fuels for steam boiler by industrial category (sub
classification) and fuel type in countries surveyed” from the “⑤ Energy consumption by
industrial category (sub classification) and energy type in countries surveyed” obtained in the
previous Chapter 2 and from the “⑥Share of fuels for steam boiler relative to energy consumption
by industrial category (sub classification) and energy type in Japan.”
2)We estimated “⑨ Consumption of HP-substitutable fuels for steam boilers by industrial category
(sub classification) and energy type in countries surveyed” from the “⑦ Consumption of fuels for
steam boiler by industrial category (sub classification) and energy type in countries surveyed” and
based on the assumption that “⑧ Share of HP-substitutable fuel consumption relative to
consumption of fuels for steam boilers in the food field in Japan” is 60%.
3)Next, we set the coefficient of performance (COP) of the heat pump, boiler efficiency, and CO2
emission factor in power generation of each country. We estimated CO2 emissions when the
calorific value equivalent to the amount of CO2 emitted from the fuel consumption for steam
boilers obtained in step 2) was replaced with that of electric drive compressor heat pumps. We
obtained “⑰ CO2 emissions reduction achieved by replacing steam boilers with heat pumps by
industrial category (sub classification) in countries surveyed” from the difference between them.
It is required to set “the composition ratio of consumption for steam boilers to energy
consumption” and “the composition ratio of applications at an end use temperature below 100℃
consumption for steam boilers” to estimate fuel consumption for boilers at an end use temperature
below 100℃ where heat pumps are applied. Ideally speaking, these composition ratios should be
measured and collected through a fact-finding survey of many factories in each country. In this
survey, however, we set the ratios by applying to each country existing survey results in Japan.
- 12 -

Diagram 8 Estimated Flow of Effect of Heat Pump Application on CO2 Reduction
⑨Consumption of HP-substitutable fuels for steam boiler by industrial category (sub classification) and energy type in countries
surveyed
⑤Energy consumption by industrial category (sub classification) and energy type in countries surveyed ⑥Share of fuels for steam boiler
relative to energy consumption by industrial category (sub classification)
and energy type in Japan
Source:“The structural survey of oil consumption in 2001” (Ministry of Economy, Trade and Industry, Japan) (See p.35)
⑦Consumption of fuels for steam boiler by industrial category (sub classification) and energy type in countries surveyed
⑧Share of HP-substitutable fuel consumption relative to consumption of fuels for steam boiler in the food
field in Japan
60%
Source:“Heat Pump and Thermal Storage White Paper” (HPTCJ)
⑩CO2 emission factor by energy type
Source: “CO2 Emissions From Fuel Combustion 2008 Edition” (IEA) (See p.36)
⑯CO2 emission after HP substitution by industrial category (sub classification) in countries surveyed
⑮CO2 emission factor of electric power by country
Country A: xkg-CO2/kWhSource: “CO2 Emissions From Fuel Combustion 2008 Edition” (IEA) (See p.37)
⑪CO2 emission before HP substitution by industrial category (sub classification) in countries surbeyed
surveyed
⑫Efficiency of boiler85%
⑬Target load of HP substitution by industrial category (sub classification) in countries surveyed
⑰ CO2 emissions reduction achieved by replacing steam boilers withheat pumps by industrial category (sub classification) in countries
surveyed
⑰ CO2 emissions reduction achieved by replacing steam boilers withheat pumps by industrial category (sub classification) in countries
surveyed
STEP2-1 Estimated fuel consumption substitutable by HP (Consumption by country, industrial category (sub classification) and energy type)
STEP2-2 Estimated effect of substitution by HP on CO2 reduction (by country)
Country A/Industry B(sub classification)
Coal & peat
Renew. & waste
Gas Electr.
Heat
Coal & peat GasPetro.
products
Japan/
Industry B
(sub classification)
Coal & peat
GasPetro. products
Before HP substitution
CO2 reduction
Coal & peat GasPetro.
products
(t-CO2/TJ)
Petro. products 100%
Coal & peat
GasPetro. products
Coal & peat
GasPetro. products
Country A/Industry B(sub classification)
Country A/Industry B(sub classification)
Country A/Industry B(sub classification)
Country A/Industry B(sub classification)
Country A/Industry B(sub classification)
After HP substitution
⑭COP of HP4.0
- 13 -
(1) Energy consumption structure of the boiler in Japan
We set the “Share of fuels for steam boiler relative to energy consumption by industrial category
(sub classification) and energy type” based on the “The structural survey of oil consumption in
2001” a Japanese statistical document compiled through Fiscal 2001 (p.35 of the reference material).
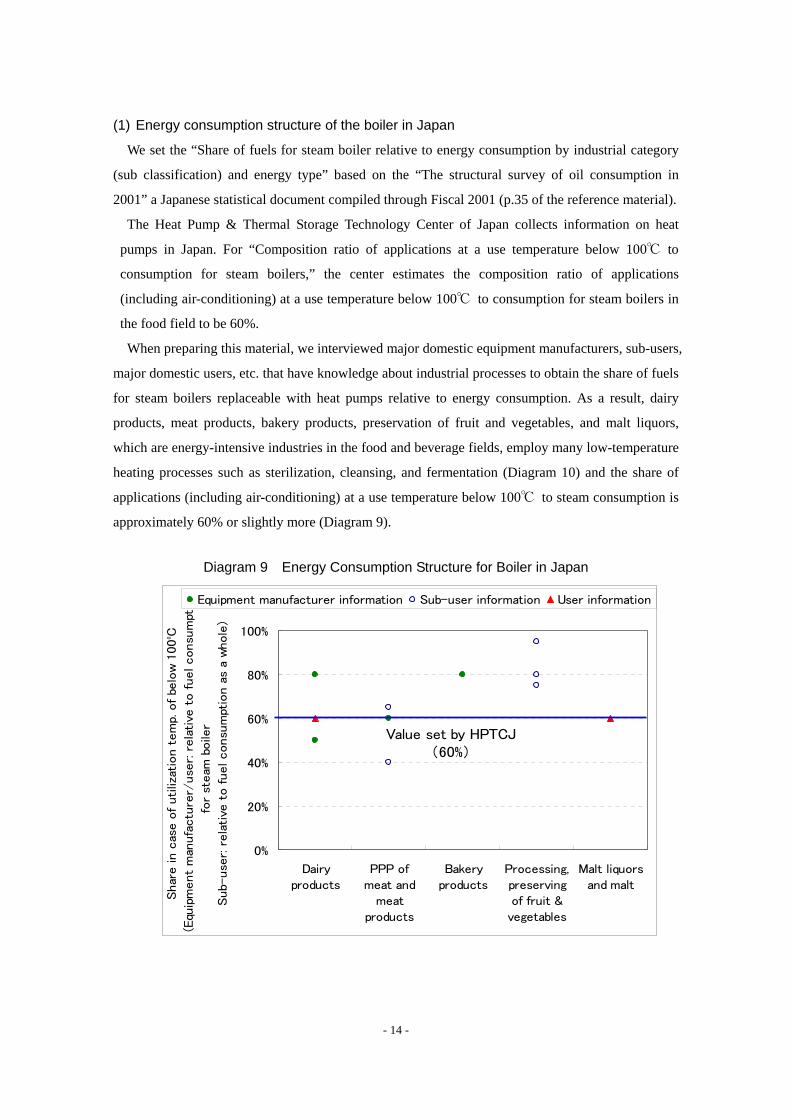
The Heat Pump & Thermal Storage Technology Center of Japan collects information on heat
pumps in Japan. For “Composition ratio of applications at a use temperature below 100℃ to
consumption for steam boilers,” the center estimates the composition ratio of applications
(including air-conditioning) at a use temperature below 100℃ to consumption for steam boilers in
the food field to be 60%.
When preparing this material, we interviewed major domestic equipment manufacturers, sub-users,
major domestic users, etc. that have knowledge about industrial processes to obtain the share of fuels
for steam boilers replaceable with heat pumps relative to energy consumption. As a result, dairy
products, meat products, bakery products, preservation of fruit and vegetables, and malt liquors,
which are energy-intensive industries in the food and beverage fields, employ many low-temperature
heating processes such as sterilization, cleansing, and fermentation (Diagram 10) and the share of
applications (including air-conditioning) at a use temperature below 100℃ to steam consumption is
approximately 60% or slightly more (Diagram 9).
Diagram 9 Energy Consumption Structure for Boiler in Japan
0%
20%
40%
60%
80%
100%
Dairyproducts
PPP ofmeat and
meatproducts
Bakeryproducts
Processing,preservingof fruit &vegetables
Malt liquorsand malt
Shar
e in c
ase o
f utiliz
atio
n t
em
p. o
f be
low 1
00ºC
(Equ
ipm
ent
man
ufa
ctu
rer/
use
r: r
ela
tive
to fuel consu
mp t
for
steam
boile
r
Sub-
use
r: r
ela
tive
to fuel consu
mpt
ion a
s a
whole
)
Equipment manufacturer information Sub-user information User information
Value set by HPTCJ(60%)
- 14 -

Diagram 10 Typical Production Process of Main Products Note: The colored are steps for which heat pump is applicable (utilization temp.: warming process using a temperature of below 100°C).
※Pasteurization temperature varies depending upon the products.
Dairy products/Milk
Dairy products/Cheese
Livestock food products/Ham and sausages
Thawing of
raw materials SeasoningShaping
Salting (tumbling)
Filling Heating
(smoking)
25℃
Steaming
80℃~
Cooling
Shipping Shaping film and Packaging
40~80℃ or over250℃
During operation
60~70℃
Washing
Raw
milk
Raw milk
storage Cooling
Pasteuri
zation
Homoge
nization
Cooling Filling Storage Shipping
Clarific
ation
Low temperature:About 65℃
High temperature::About 75℃
Ultra-high temperature:120~150℃
Washing
During operation After
operation(From
evening to night)
70~80℃
Raw
milk
Raw milk
storage Cooling
Separation ProcessingStorage and
maturing Shipping
Mixing
70℃~80℃
After operation
(From evening to
night)
70~80℃
Washing
Sterilization
During operation
After operation
(From evening to
night)
- 15 -

Bread
Processed products of fruits and vegetables/Canned mandarin orange
Beer
Source: Manufacturer information, prepared from “Zukai Shokuhin Kako Purosesu (Illustrated Food Processing)” (Kogyo Chosakai Publishing)
Dividing Acid
treatmentPealing Washing
Filling
85~90℃
Injecting syrup
80~85℃
Pasteurization Cooling Shipping
Seaming
During operation
Alkaline
treatment
Washing
50~60℃
Mixing MixingFermentation Division Fermentation
Molding
About 30℃
Final
fermentation
35~40℃ 200℃~
During operationAfter
operation(From
evening to night)
About 30℃
Baking Packaging Shipping
50~60℃Freezing Baking
Washing
Packaging Shipping
After operation
(From evening to
night)
Barley
milling Filtration
Saccharifi
cation
Fermentation
Whirlpool
50℃
Storage Filtration Bottling Shipping
60℃
Boiling
80~100℃ 100℃
50~60℃
Washing
After operation
(From evening to
night)
During operation
- 16 -
(2) Applying the composition ratio of Japan to each country
According to major domestic equipment manufacturers and sub-users that have knowledge about
industrial processes, many manufacturing facilities used in Japanese food and beverage fields have
been imported from Europe.
Also, according to French domestic estimates, an absolute quantity of heat demand below 100℃
in the French domestic food and beverage fields is approximately 12 TWh/year, which is close to the
estimation result (11.3TWh/year3) of heat demand obtained in this survey.
Based on the above, in this survey we decided to apply the setting values for Japan to each
country for the “composition ratio of consumption for steam boilers to energy consumption” and
“composition ratio of applications at a use temperature below 100℃ to consumption for steam
boilers.”
3.1.2 Estimation of CO2 reduction effect by applying heat pumps
(1) Estimation of CO2 emissions in the present situation
We estimated “⑪ CO2 emissions before HP substitution by industrial category (sub
classification) in countries surveyed” by multiplying “⑨ Consumption of HP-substitutable fuels
for steam boiler (at a end use temperature below 100℃) by industrial category (sub classification)
and energy type in countries surveyed” by “⑩ CO2 emission factor by energy type”. We applied
the same CO2 emission factor uniformly to every country and set coal & peat at 94.6 t-CO2/TJ
(other bituminous coal), petroleum products at 73.3 t-CO2/TJ (other oil4), and gas at 56.1
t-CO2/TJ (natural gas (dry)).
3 Load for steam boilers below 100℃ in the food and beverage fields in France, calculated by the estimation
method “⑬ Target load of HP substitution by industrial category (sub classification) in countries surveyed” 4 The CO2 emission factor of petroleum products differs from product to product. In this survey, we set “Other oil”
as a typical value because it is an intermediate level in various products and has the same factor as crude oil.
- 17 -

Diagram 11 Factor of CO2 Emission from Fuel
56.1
73.366.7
73.3100.8
73.380.7
73.361.663.1
77.474.173.3
71.971.5
69.3
106.0106.7
101.296.1
94.694.6
98.3
0 20 40 60 80 100 120
Natural gas (dry)
Other oilRefinery gas
Refinery feedstocksPetroleum coke
LubricantsBitumenNaphthaEthane
LPGResidual fuel oil
Gas/diesel oilShale oil
Other keroseneJet kerosene
Gasoline
PeatOil shale
LigniteSub-bituminous coal
Other bituminous coalCoking coalAnthracite
[t-CO2/TJ] Source: “CO2 Emission From Fuel Combustion 2008 Edition” (IEA)
(2) Estimation of CO2 emissions after the application of heat pumps
First of all, we calculated power consumption by country and category after the application of
heat pumps by multiplying “⑫ Efficiency of boiler” (which was set at 85% uniformly for every
country) by “⑨ Consumption of HP-substitutable fuels for steam boiler by industrial category
(sub classification) and energy type in countries surveyed” and then dividing the obtained value
by “⑭ COP of heat pump” (which was set at 4.0 uniformly for every country).
Next, we calculated “⑯ CO2 emission after HP substitution by industrial category (sub
classification) in countries surveyed” by multiplying the power consumption by “⑮ CO2
emission factor of electric power by country”.
Diagram 12 CO2 emissions per kWh from electricity and heat generation
(Average 2004-2006)
0.79
0.57
0.49
0.05
0.38
0.01
0.41
0.42
0.41
0.42
0.09
0.0 0.2 0.4 0.6 0.8 1.0
China
United States
United Kingdom
Sweden
Spain
Norway
Netherlands
Japan
Italy
Germany
France
[kg-CO2/kWh]
Source: “CO2 Emission From Fuel Combustion 2008 Edition” (IEA)
- 18 -
(3) Estimation of CO2 reduction effect by applying heat pumps
We calculated “⑰ CO2 emissions reduction achieved by replacing steam boilers with heat
pumps by industrial category (sub classification) in countries” by comparing CO2 emissions
before and after the application of heat pumps. Note that we analyzed China with rougher
category classification (middle classification) than the other countries owing to limited statistical
materials.
3.2 Estimation results A total CO2 reduction effect of 40 million t-CO2/year for all of the 11 countries covered by the
survey can be expected by substituting heat pumps for steam boilers among applications at a use end
temperature below 100℃ in the food and beverage fields. In particular, a significant CO2 reduction
can be expected in China (15 million t-CO2/year) and the USA (14 million t-CO2).
It is instructive to look at the rate of CO2 reduction achieved by replacing applications at a end
use temperature below 100℃ with heat pumps in the food and beverage fields relative to CO2
emissions in all industries. The combined CO2 reduction for the 11 countries accounts for 1.3% of
CO2 emissions in the industrial field (3,140 million t-CO2/year5). Particularly in France, the rate of
reduction reaches 4.2%.
The data for China have a lower accuracy than that for other countries. A total CO2 reduction of
25 million t-CO2/year in the 10 countries other than China can be expected.
The impact of replacing applications at a use end temperature below 100℃ with heat pumps in
the food and beverage fields on CO2 emissions reduction in all industries accounts for 1.8% of CO2
emissions (1,380 million t-CO2/year) in all industries in the 10 countries excluding China.
5 Source: “CO2 Emission From Fuel Combustion 2008 Edition” (IEA)
- 19 -
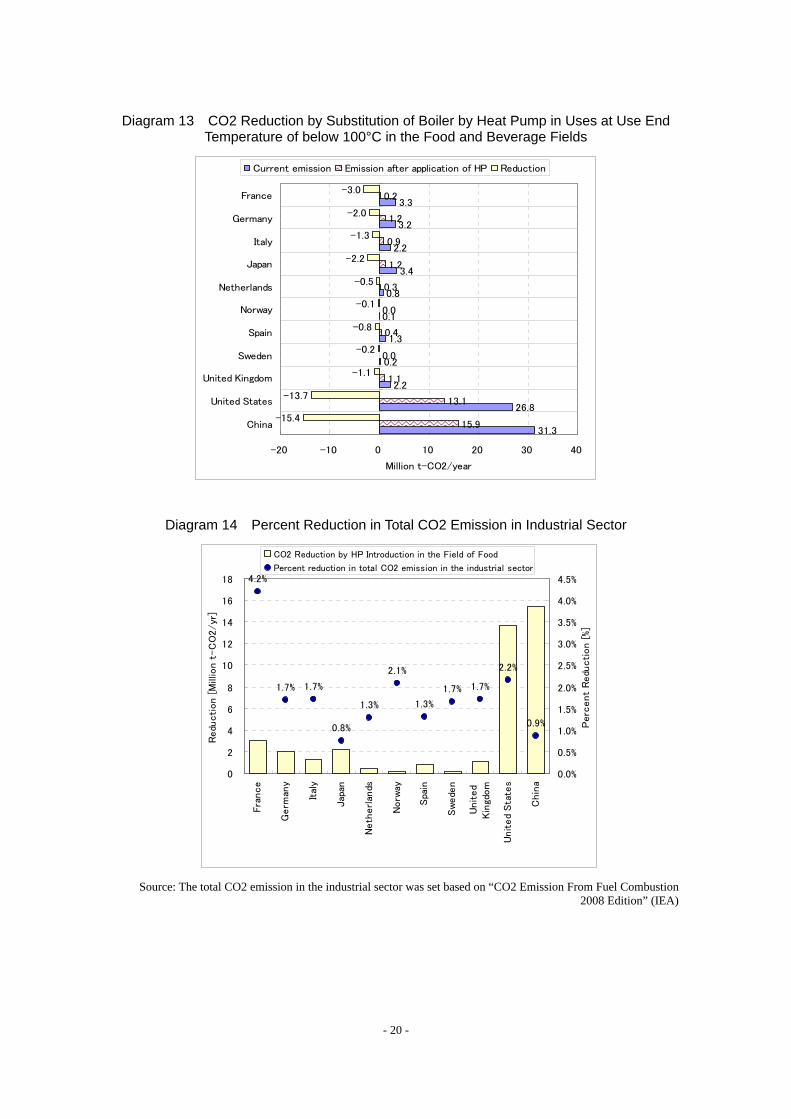
Diagram 13 CO2 Reduction by Substitution of Boiler by Heat Pump in Uses at Use End Temperature of below 100°C in the Food and Beverage Fields
31.3
26.8
2.2
0.2
1.3
0.1
0.8
3.4
2.2
3.2
3.3
15.9
13.1
1.1
0.0
0.4
0.0
0.3
1.2
0.9
1.2
0.2
-15.4
-13.7
-1.1
-0.2
-0.8
-0.1
-0.5
-2.2
-1.3
-2.0
-3.0
-20 -10 0 10 20 30 40
China
United States
United Kingdom
Sweden
Spain
Norway
Netherlands
Japan
Italy
Germany
France
Million t-CO2/year
Current emission Emission after application of HP Reduction
Diagram 14 Percent Reduction in Total CO2 Emission in Industrial Sector
4.2%
1.7% 1.7%
0.8%
1.3%
2.1%
1.3%
1.7% 1.7%
2.2%
0.9%
0
2
4
6
8
10
12
14
16
18
Fra
nce
Germ
any
Ital
y
Jap
an
Neth
erl
ands
Norw
ay
Spa
in
Sw
ede
n
Unit
ed
Kin
gdom
Unit
ed
Sta
tes
Chin
a
Redu
cti
on [
Mill
ion t
-C
O2/yr
]
0.0%
0.5%
1.0%
1.5%
2.0%
2.5%
3.0%
3.5%
4.0%
4.5%P
erc
ent
Redu
cti
on [
%]
CO2 Reduction by HP Introduction in the Field of Food
Percent reduction in total CO2 emission in the industrial sector
Source: The total CO2 emission in the industrial sector was set based on “CO2 Emission From Fuel Combustion
2008 Edition” (IEA)
- 20 -

4. Conclusion 4.1 Importance of replacing boilers with industrial heat pumps
Advances in heat pump technology have increased the possibility of a new heat supply system in
factories. There are problems in using boilers as a heat source in factories as shown below.
1) Pollutants such as CO2, SOx, and NOx are emitted because fossil fuels are generally used.
2) COP on a primary energy basis is less than 1.
3) When a steam pipe in a factory is long, steam transfer will entail a great heat loss.
Heat pumps can solve problems with boilers. When electric power is used as the driving energy,
emissions of substances detrimental to the environment enumerated in Item 1) above can be
significantly reduced. For Item 2), it is certain that a recent increase in the COP of the heat pump has
already achieved energy saving at the present stage on a primary energy basis in comparison with
boilers. The COP is likely to further improve hereafter. For 3), although the length of steam pipes
may differ depending on the characteristics of the factory, a heat pump can be installed near the
place where heat is required, resulting in a decrease in heat transfer loss (see p.50 of the reference
material).
4.2 Heat pump introduction effect in the food and beverage fields In the food and beverage fields among diverse manufacturing industries, the operating
temperature level is relatively low. As this sector is one of the categories where heat pumps can be
introduced easily, we analyzed the introduction effect in this survey. In the food and beverage fields,
heat pumps can be applied to many of the manufacturing processes of typical products (meat
products, bread, dairy products, beer, etc.). A substantial CO2 reduction effect can be expected from
the replacement of boilers.
In this survey, first of all, we analyzed energy consumption by industrial category in the food and
beverage fields of each country. Secondly, among energy consumption by industrial category, we
analyzed consumption in steam boilers. Thirdly, we analyzed consumption of a process at an
operating temperature below 100℃ on the steam demand side. Finally, we analyzed CO2 reduction
potential achieved by converting the supply source of this energy from boilers to heat pumps.
The analysis revealed that a total CO2 reduction of 40 million t-CO2/year can be expected for the
11 countries considered. This amount is equal to 1.3% of CO2 emissions (3,140 million t-CO2/year)
in the industry of all 11 countries.
Also, in the 10 countries except China, a CO2 reduction of 25 million t-CO2/year can be expected.
This amount accounts for 1.8% of CO2 emissions (1,380 million t-CO2/year) in the industry of these
10 countries.
The industrial heat pump is an important technology that contributes to the prevention of global
- 21 -

warming through CO2 emissions reduction and technological development in each country may
likely make heat pumps more efficient and able to operate at higher temperatures, further expanding
its areas of applicability.
- 22 -
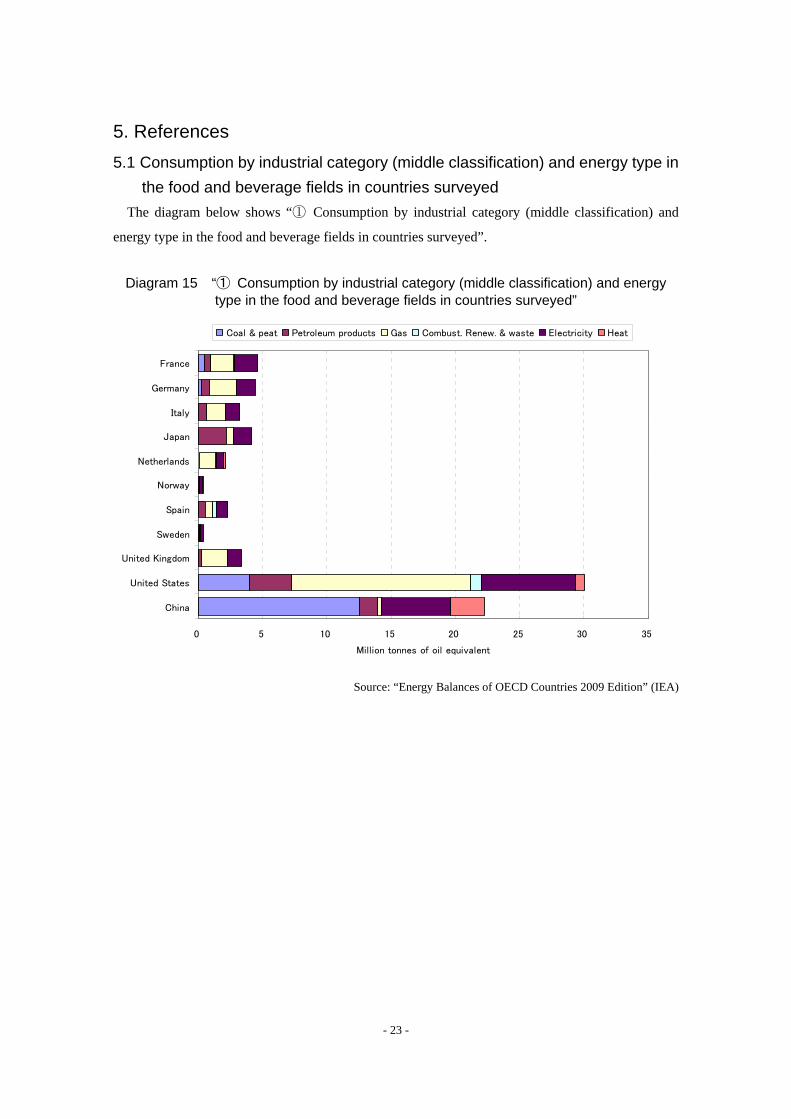
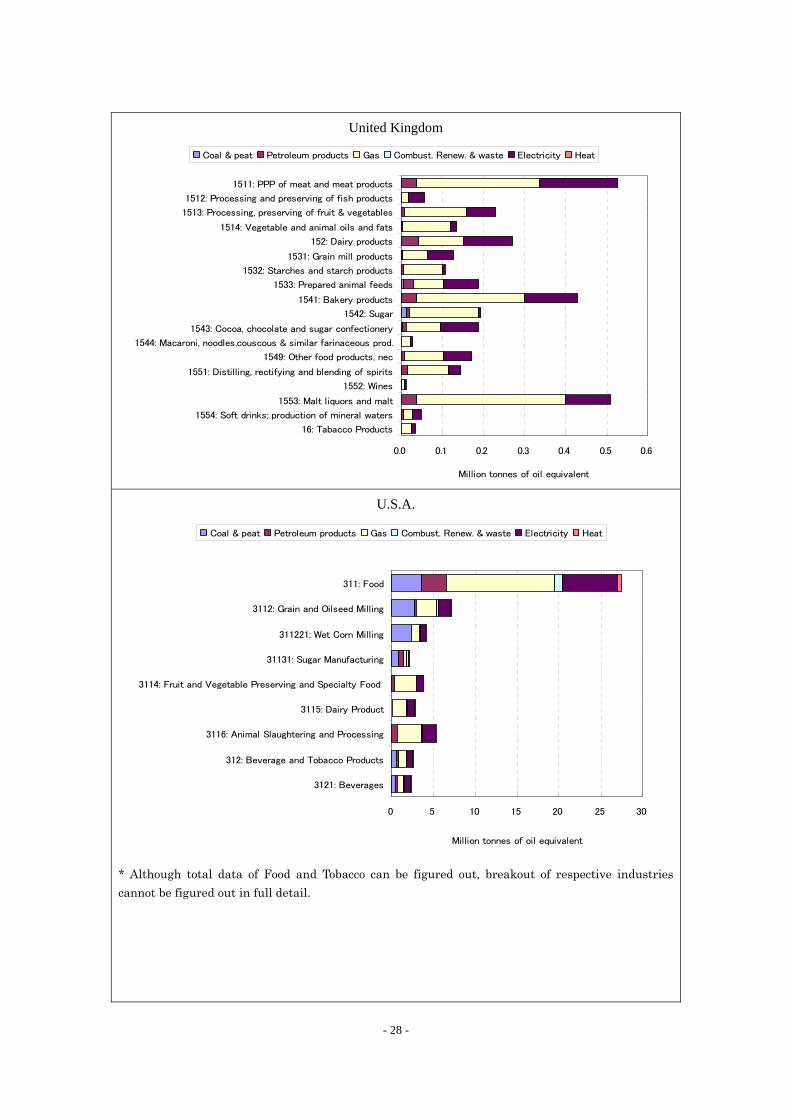
5. References 5.1 Consumption by industrial category (middle classification) and energy type in
the food and beverage fields in countries surveyed The diagram below shows “① Consumption by industrial category (middle classification) and
energy type in the food and beverage fields in countries surveyed”.
Diagram 15 “① Consumption by industrial category (middle classification) and energy
type in the food and beverage fields in countries surveyed”
0 5 10 15 20 25 30 35
China
United States
United Kingdom
Sweden
Spain
Norway
Netherlands
Japan
Italy
Germany
France
Million tonnes of oil equivalent
Coal & peat Petroleum products Gas Combust. Renew. & waste Electricity Heat
Source: “Energy Balances of OECD Countries 2009 Edition” (IEA)
- 23 -
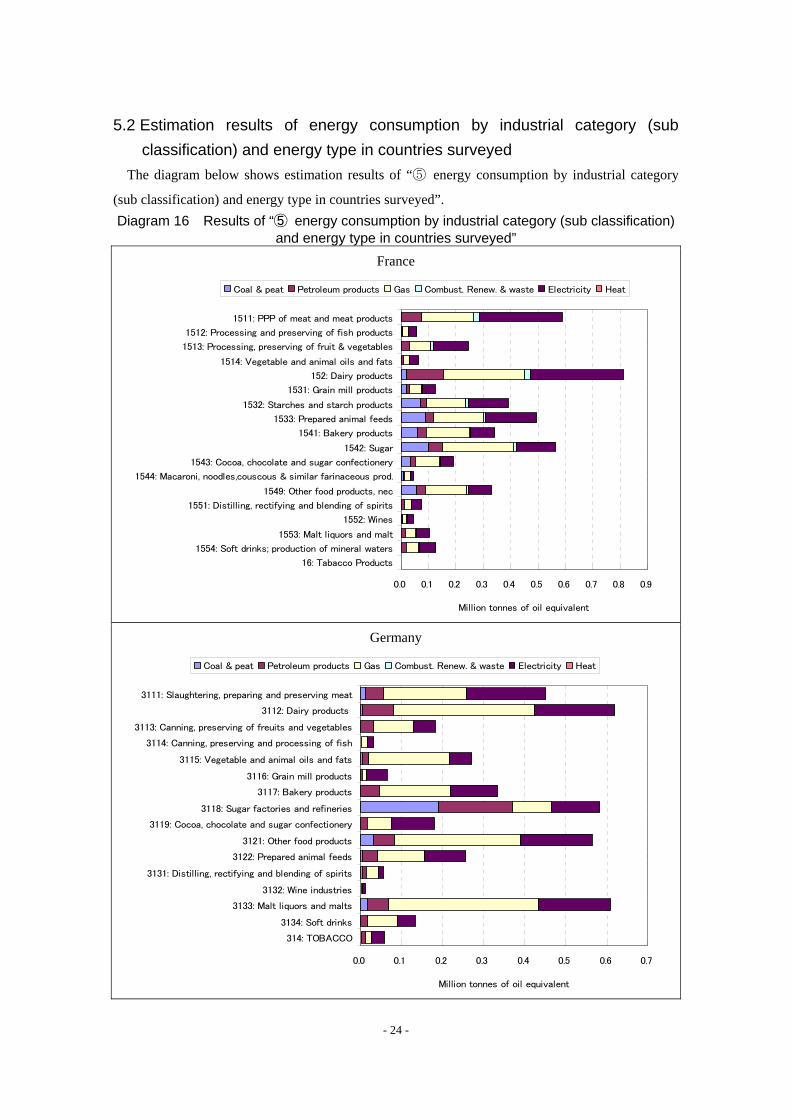
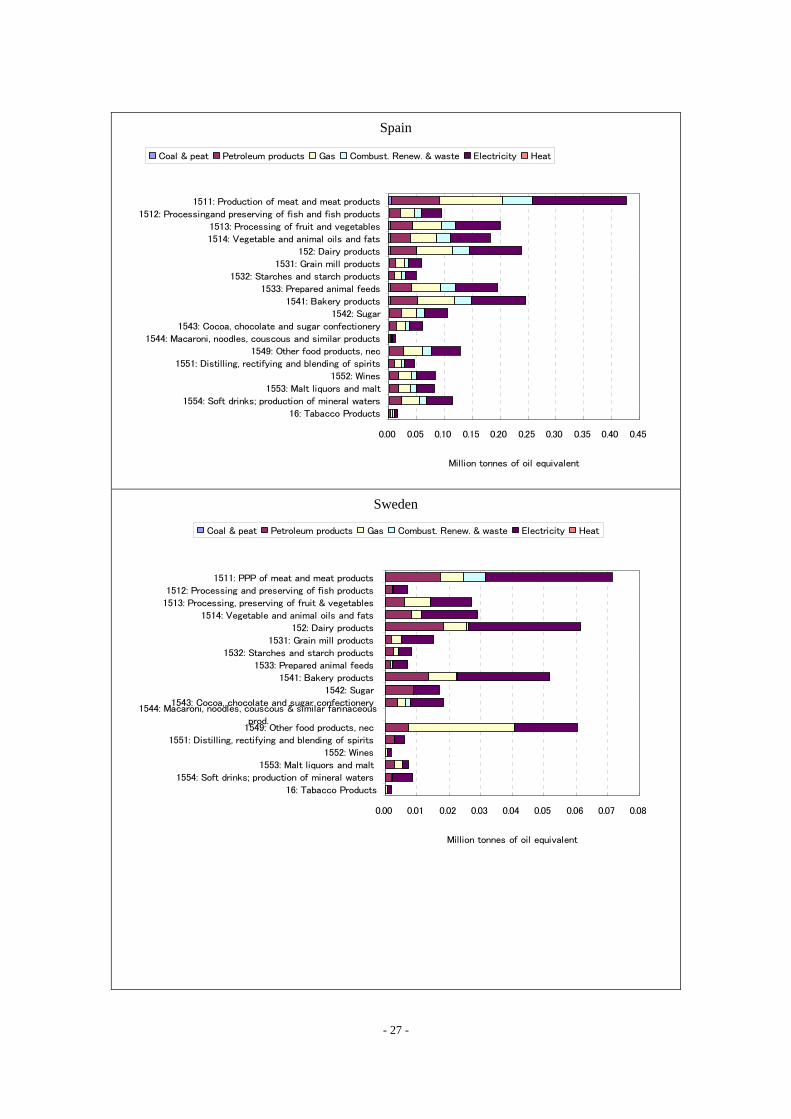
5.2 Estimation results of energy consumption by industrial category (sub classification) and energy type in countries surveyed
The diagram below shows estimation results of “⑤ energy consumption by industrial category
(sub classification) and energy type in countries surveyed”. Diagram 16 Results of “⑤ energy consumption by industrial category (sub classification)
and energy type in countries surveyed” France
0.0 0.1 0.2 0.3 0.4 0.5 0.6 0.7 0.8 0.9
16: Tabacco Products
1554: Soft drinks; production of mineral waters
1553: Malt liquors and malt
1552: Wines
1551: Distilling, rectifying and blending of spirits
1549: Other food products, nec
1544: Macaroni, noodles,couscous & similar farinaceous prod.
1543: Cocoa, chocolate and sugar confectionery
1542: Sugar
1541: Bakery products
1533: Prepared animal feeds
1532: Starches and starch products
1531: Grain mill products
152: Dairy products
1514: Vegetable and animal oils and fats
1513: Processing, preserving of fruit & vegetables
1512: Processing and preserving of fish products
1511: PPP of meat and meat products
Million tonnes of oil equivalent
Coal & peat Petroleum products Gas Combust. Renew. & waste Electricity Heat
Germany
0.0 0.1 0.2 0.3 0.4 0.5 0.6 0.7
314: TOBACCO
3134: Soft drinks
3133: Malt liquors and malts
3132: Wine industries
3131: Distilling, rectifying and blending of spirits
3122: Prepared animal feeds
3121: Other food products
3119: Cocoa, chocolate and sugar confectionery
3118: Sugar factories and refineries
3117: Bakery products
3116: Grain mill products
3115: Vegetable and animal oils and fats
3114: Canning, preserving and processing of fish
3113: Canning, preserving of freuits and vegetables
3112: Dairy products
3111: Slaughtering, preparing and preserving meat
Million tonnes of oil equivalent
Coal & peat Petroleum products Gas Combust. Renew. & waste Electricity Heat
- 24 -

Italy
0.0 0.1 0.2 0.3 0.4 0.5 0.6 0.7
16: Tabacco Products
1554: Soft drinks; production of mineral waters
1553: Malt liquors and malt
1552: Wines
1551: Distilling, rectifying and blending of spirits
1549: Other food products, nec
1544: Macaroni, noodles, couscous and similar products
1543: Cocoa, chocolate and sugar confectionery
1542: Sugar
1541: Bakery products
1533: Prepared animal feeds
1532: Starches and starch products
1531: Grain mill products
152: Dairy products
1514: Vegetable and animal oils and fats
1513: Processing of fruit and vegetables
1512: Processingand preserving of fish and fish products
1511: Production of meat and meat products
Million tonnes of oil equivalent
Coal & peat Petroleum products Gas Combust. Renew. & waste Electricity Heat
Japan
0.0 0.2 0.4 0.6 0.8 1.0 1.2
16: Tabacco Products
1554: Soft drinks; production of mineral waters
1553: Malt liquors and malt
1552: Wines
1551: Distilling, rectifying and blending of spirits
1549: Other food products, nec
1544: Macaroni, noodles,couscous & similar farinaceous prod.
1543: Cocoa, chocolate and sugar confectionery
1542: Sugar
1541: Bakery products
1533: Prepared animal feeds
1532: Starches and starch products
1531: Grain mill products
152: Dairy products
1514: Vegetable and animal oils and fats
1513: Processing, preserving of fruit & vegetables
1512: Processing and preserving of fish products
Million tonnes of oil equivalent
Coal & peat Petroleum products Gas Combust. Renew. & waste Electricity Heat
- 25 -

Netherlands
0.00 0.05 0.10 0.15 0.20 0.25 0.30
16: Tabacco Products
1554: Soft drinks; production of mineral waters
1553: Malt liquors and malt
1552: Wines
1551: Distilling, rectifying and blending of spirits
1549: Other food products, nec
1544: Macaroni, noodles, couscous and similar products
1543: Cocoa, chocolate and sugar confectionery
1542: Sugar
1541: Bakery products
1533: Prepared animal feeds
1532: Starches and starch products
1531: Grain mill products
152: Dairy products
1514: Vegetable and animal oils and fats
1513: Processing of fruit and vegetables
1512: Processingand preserving of fish and fish products
1511: Production of meat and meat products
Million tonnes of oil equivalent
Coal & peat Petroleum products Gas Combust. Renew. & waste Electricity Heat
Norway
0.00 0.02 0.04 0.06 0.08 0.10 0.12 0.14
16: Tabacco Products
1554: Soft drinks; production of mineral waters
1553: Malt liquors and malt
1552: Wines
1551: Distilling, rectifying and blending of spirits
1549: Other food products, nec
1544: Macaroni, noodles,couscous & similar farinaceous
prod.
1543: Cocoa, chocolate and sugar confectionery
1542: Sugar
1541: Bakery products
1533: Prepared animal feeds
1532: Starches and starch products
1531: Grain mill products
152: Dairy products
1514: Vegetable and animal oils and fats
1513: Processing, preserving of fruit & vegetables
1512: Processing and preserving of fish products
1511: PPP of meat and meat products
Million tonnes of oil equivalent
Coal & peat Petroleum products Gas Combust. Renew. & waste Electricity Heat
- 26 -
Spain
0.00 0.05 0.10 0.15 0.20 0.25 0.30 0.35 0.40 0.45
16: Tabacco Products
1554: Soft drinks; production of mineral waters
1553: Malt liquors and malt
1552: Wines
1551: Distilling, rectifying and blending of spirits
1549: Other food products, nec
1544: Macaroni, noodles, couscous and similar products
1543: Cocoa, chocolate and sugar confectionery
1542: Sugar
1541: Bakery products
1533: Prepared animal feeds
1532: Starches and starch products
1531: Grain mill products
152: Dairy products
1514: Vegetable and animal oils and fats
1513: Processing of fruit and vegetables
1512: Processingand preserving of fish and fish products
1511: Production of meat and meat products
Million tonnes of oil equivalent
Coal & peat Petroleum products Gas Combust. Renew. & waste Electricity Heat
Sweden
0.00 0.01 0.02 0.03 0.04 0.05 0.06 0.07 0.08
16: Tabacco Products
1554: Soft drinks; production of mineral waters
1553: Malt liquors and malt
1552: Wines
1551: Distilling, rectifying and blending of spirits
1549: Other food products, nec
1544: Macaroni, noodles, couscous & similar farinaceous
prod.
1543: Cocoa, chocolate and sugar confectionery
1542: Sugar
1541: Bakery products
1533: Prepared animal feeds
1532: Starches and starch products
1531: Grain mill products
152: Dairy products
1514: Vegetable and animal oils and fats
1513: Processing, preserving of fruit & vegetables
1512: Processing and preserving of fish products
1511: PPP of meat and meat products
Million tonnes of oil equivalent
Coal & peat Petroleum products Gas Combust. Renew. & waste Electricity Heat
- 27 -
United Kingdom
0.0 0.1 0.2 0.3 0.4 0.5 0.6
16: Tabacco Products
1554: Soft drinks; production of mineral waters
1553: Malt liquors and malt
1552: Wines
1551: Distilling, rectifying and blending of spirits
1549: Other food products, nec
1544: Macaroni, noodles,couscous & similar farinaceous prod.
1543: Cocoa, chocolate and sugar confectionery
1542: Sugar
1541: Bakery products
1533: Prepared animal feeds
1532: Starches and starch products
1531: Grain mill products
152: Dairy products
1514: Vegetable and animal oils and fats
1513: Processing, preserving of fruit & vegetables
1512: Processing and preserving of fish products
1511: PPP of meat and meat products
Million tonnes of oil equivalent
Coal & peat Petroleum products Gas Combust. Renew. & waste Electricity Heat
U.S.A.
0 5 10 15 20 25 30
3121: Beverages
312: Beverage and Tobacco Products
3116: Animal Slaughtering and Processing
3115: Dairy Product
3114: Fruit and Vegetable Preserving and Specialty Food
31131: Sugar Manufacturing
311221: Wet Corn Milling
3112: Grain and Oilseed Milling
311: Food
Million tonnes of oil equivalent
Coal & peat Petroleum products Gas Combust. Renew. & waste Electricity Heat
* Although total data of Food and Tobacco can be figured out, breakout of respective industries cannot be figured out in full detail.
- 28 -

China
0 2 4 6 8 10 1
Manufacturing of Tobacco
Manufacturing of Beverage
Manufacturing of Foods
Processing of Food from
Agricultural Products
Million tonnes of oil equivalent
2
Coal & peat Petroleum products Gas Combust. Renew. & waste Electricity Heat
* Size of industry classification is rough compared with other countries.
- 29 -
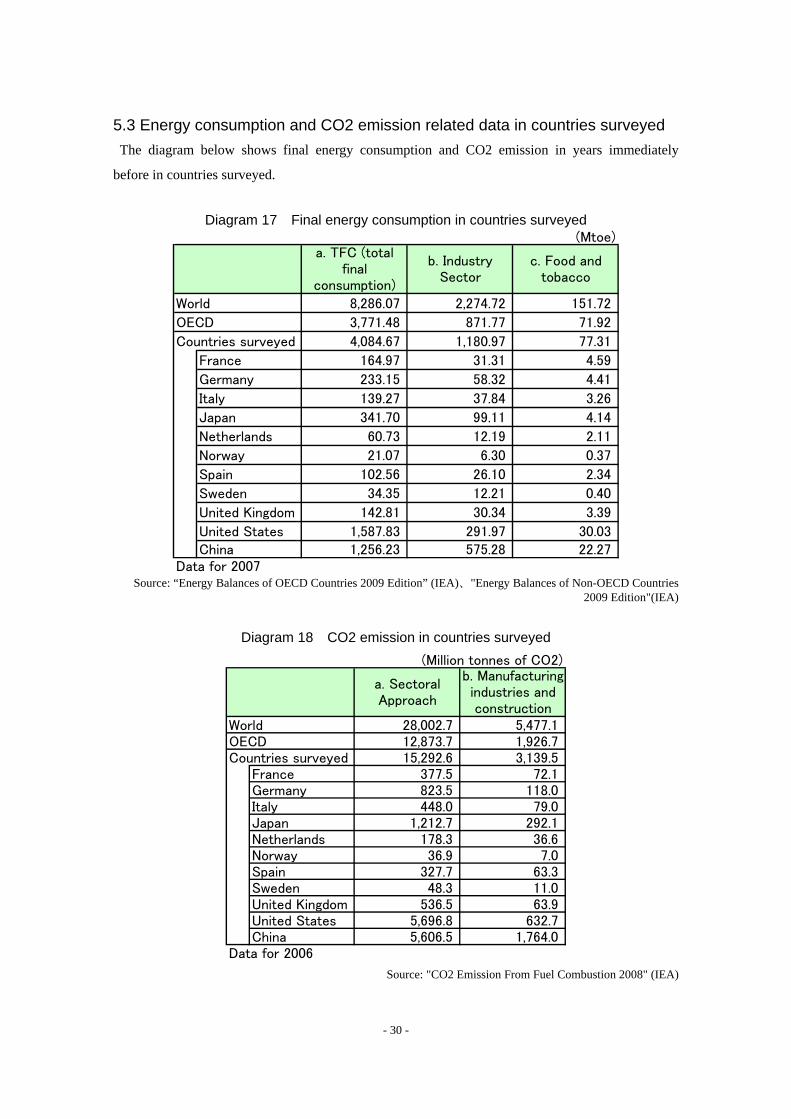
5.3 Energy consumption and CO2 emission related data in countries surveyed The diagram below shows final energy consumption and CO2 emission in years immediately
before in countries surveyed.
Diagram 17 Final energy consumption in countries surveyed
(Mtoe)
World 8,286.07 2,274.72 151.72
OECD 3,771.48 871.77 71.92
Countries surveyed 4,084.67 1,180.97 77.31
France 164.97 31.31 4.59
Germany 233.15 58.32 4.41
Italy 139.27 37.84 3.26
Japan 341.70 99.11 4.14
Netherlands 60.73 12.19 2.11
Norway 21.07 6.30 0.37
Spain 102.56 26.10 2.34
Sweden 34.35 12.21 0.40
United Kingdom 142.81 30.34 3.39
United States 1,587.83 291.97 30.03China 1,256.23 575.28 22.27
Data for 2007
a. TFC (totalfinal
consumption)
b. IndustrySector
c. Food andtobacco
Source: “Energy Balances of OECD Countries 2009 Edition” (IEA)、"Energy Balances of Non-OECD Countries
Diagram 18 CO2 emission in countries surveyed
2009 Edition"(IEA)
(Million tonnes of CO2)
World 28,002.7 5,477.1OECD 12,873.7 1,926.7Countries surveyed 15,292.6 3,139.5
France 377.5 72.1Germany 823.5 118.0Italy 448.0 79.0Japan 1,212.7 292.1Netherlands 178.3 36.6Norway 36.9 7.0Spain 327.7 63.3Sweden 48.3 11.0United Kingdom 536.5 63.9United States 5,696.8 632.7China 5,606.5 1,764.0
Data for 2006
b. Manufacturingindustries andconstruction
a. SectoralApproach
Source: "CO2 Emission From Fuel Combustion 2008" (IEA)
- 30 -
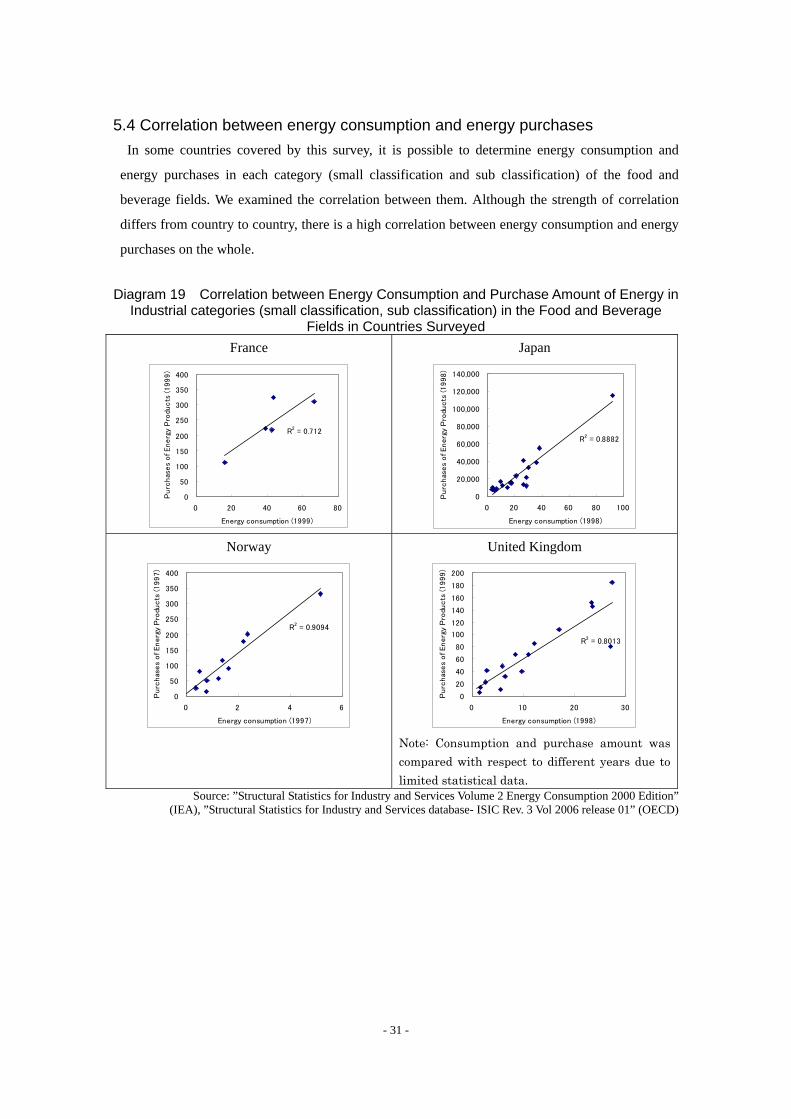
5.4 Correlation between energy consuption and
the food and
bev
D n between Energy Consumption and Purchase Amount of Energy in
Industrial categories (small classification, sub classification) in the Food and Beverage
mption and energy purchases In some countries covered by this survey, it is possible to determine energy consum
energy purchases in each category (small classification and sub classification) of
erage fields. We examined the correlation between them. Although the strength of correlation
differs from country to country, there is a high correlation between energy consumption and energy
purchases on the whole.
iagram 19 Correlatio
Fields in Countries Surveyed France Japan
R2 = 0.8882
0
20,000
40,000
60,000
80,000
100,000
120,000
R2 = 0.712
0
50
100
150
200
250
300
350
400
0 20 40 60 80
Energy consumption (1999)
Purc
has
es
of Energ
y P
rodu
cts
(1999) 140,000)
0 20 40 60 80 100
Energy consumption (1998)
Purc
has
es
of Energ
y P
rodu
cts
(1998
Norway United Kingdom
R2 = 0.8013
0
20
40
60
80
100
120
140
160
180
200
0 10 20
Energy consumption (1998)
Purc
has
es
of Energ
y P
rodu
cts
(1999)
R2 = 0.9094
0
50
100
150
200
250
300
350
400
0 2 4
Energy consumption (1997)
Purc
has
es
of Energ
y P
rodu
cts
(1997)
6
30
Note: Consumption and purchase amount was compared with respect to different years due to limited statistical data.
Source: ”Structural Statistics for Industry (IEA), ”Structural Statistics for Industry and Se
and Services Volume 2 Energy Consumption 2000 Edition”rvices database- ISIC Rev. 3 Vol 2006 release 01” (OECD)
- 31 -
5.5 Source of data Statistical data used in the survey are shown below.
5.5.1 Data related to energy consumption structure analysis
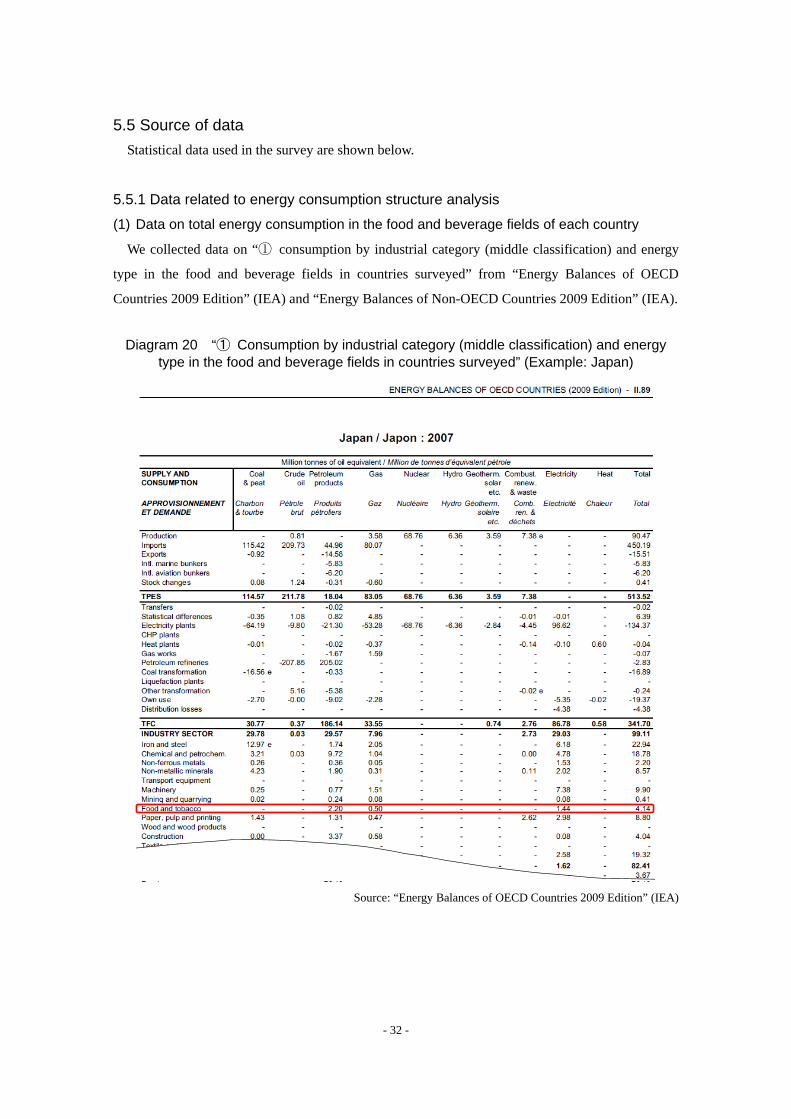
(1) Data on total energy consumption in the food and beverage fields of each country
We collected data on “① consumption by industrial category (middle classification) and energy
type in the food and beverage fields in countries surveyed” from “Energy Balances of OECD
Countries 2009 Edition” (IEA) and “Energy Balances of Non-OECD Countries 2009 Edition” (IEA).
Diagram 20 “① Consumption by industrial category (middle classification) and energy
type in the food and beverage fields in countries surveyed” (Example: Japan)
Source: “Energy Balances of OECD Countries 2009 Edition” (IEA)
- 32 -

(2) Data on energy consumption composition ratio by industrial category (sub classification)
in the food and beverage fields
Data on “④ Energy consumption composition ratio by industrial category (sub classification) and
energy type in the food and beverage fields in countries surveyed” used in this survey differs from
country to country. We calculated “② Energy consumption shares by industrial category (sub
classification) and energy type in countries surveyed” and “③ Shares of energy purchases by
industrial category (sub classification) in countries surveyed” from “Structural Statistics for Industry
and Services Volume 2 Energy Consumption 2000 Edition” (IEA), “Structural Statistics for Industry
and Services database- ISIC Rev. 3 Vol 2006 release 01” (OECD), “2006 Energy Consumption by
Manufacturers” (EIA), and “China Energy Statistical Yearbook 2008” (China Statistics Press).
Diagram 21 “② Energy consumption shares by industrial category (sub classification) and
energy type in countries surveyed” (Example: Japan)
Source: “Structural Statistics for Industry and Services Volume 2 Energy Consumption 2000 Edition” (IEA)
- 33 -
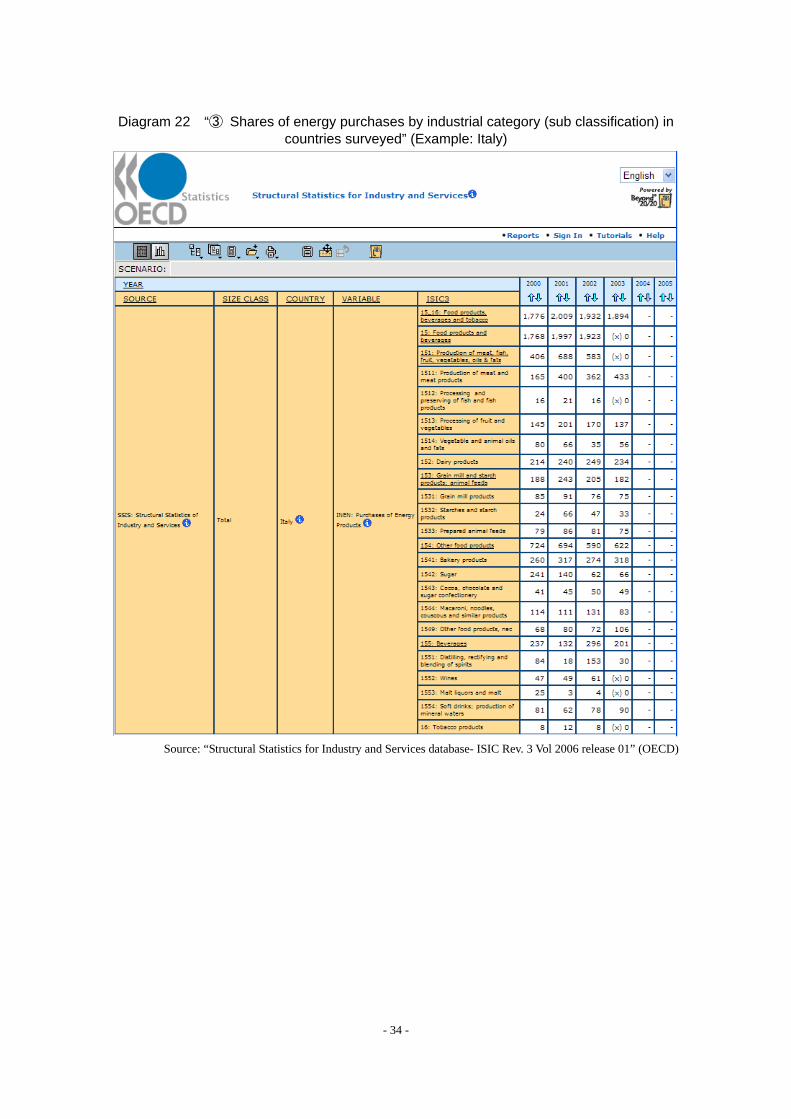
Diagram 22 “③ Shares of energy purchases by industrial category (sub classification) in countries surveyed” (Example: Italy)
Source: “Structural Statistics for Industry and Services database- ISIC Rev. 3 Vol 2006 release 01” (OECD)
- 34 -
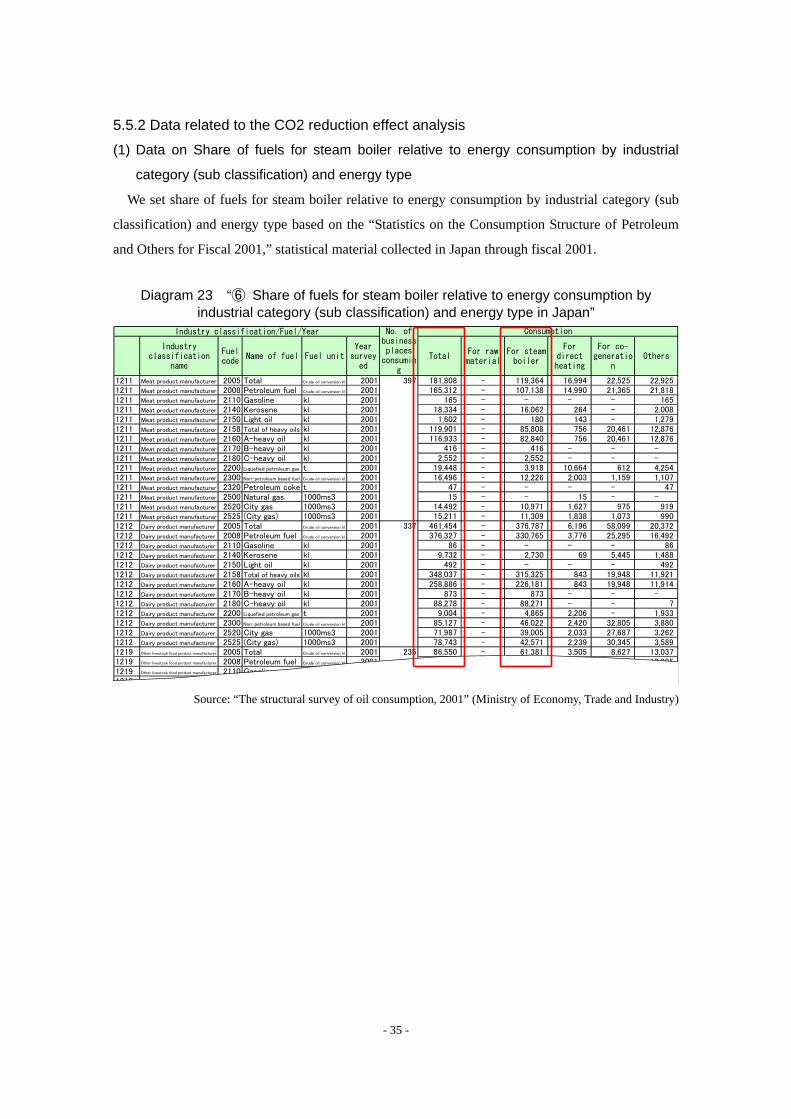
5.5.2 Data related to the CO2 reduction effect analysis
(1) Data on Share of fuels for steam boiler relative to energy consumption by industrial
category (sub classification) and energy type
We set share of fuels for steam boiler relative to energy consumption by industrial category (sub
classification) and energy type based on the “Statistics on the Consumption Structure of Petroleum
and Others for Fiscal 2001,” statistical material collected in Japan through fiscal 2001.
Diagram 23 “⑥ Share of fuels for steam boiler relative to energy consumption by
industrial category (sub classification) and energy type in Japan”
Industryclassification
name
Fuelcode
Name of fuel Fuel unitYear
surveyed
TotalFor rawmaterial
For steamboiler
Fordirectheating
For co-generatio
nOthers
1211 Meat product manufacturer 2005 Total Crude oil conversion kl 2001 397 181,808 - 119,364 16,994 22,525 22,9251211 Meat product manufacturer 2008 Petroleum fuel Crude oil conversion kl 2001 165,312 - 107,138 14,990 21,365 21,8181211 Meat product manufacturer 2110 Gasoline kl 2001 165 - - - - 1651211 Meat product manufacturer 2140 Kerosene kl 2001 18,334 - 16,062 264 - 2,0081211 Meat product manufacturer 2150 Light oil kl 2001 1,602 - 180 143 - 1,2791211 Meat product manufacturer 2158 Total of heavy oils kl 2001 119,901 - 85,808 756 20,461 12,8761211 Meat product manufacturer 2160 A-heavy oil kl 2001 116,933 - 82,840 756 20,461 12,8761211 Meat product manufacturer 2170 B-heavy oil kl 2001 416 - 416 - - -1211 Meat product manufacturer 2180 C-heavy oil kl 2001 2,552 - 2,552 - - -1211 Meat product manufacturer 2200 Liquefied petroleum gas t 2001 19,448 - 3,918 10,664 612 4,2541211 Meat product manufacturer 2300 Non-petroleum based fuel Crude oil conversion kl 2001 16,496 - 12,226 2,003 1,159 1,1071211 Meat product manufacturer 2320 Petroleum coke t 2001 47 - - - - 471211 Meat product manufacturer 2500 Natural gas 1000ms3 2001 15 - - 15 - -1211 Meat product manufacturer 2520 City gas 1000ms3 2001 14,492 - 10,971 1,627 975 9191211 Meat product manufacturer 2525 (City gas) 1000ms3 2001 15,211 - 11,309 1,838 1,073 9901212 Dairy product manufacturer 2005 Total Crude oil conversion kl 2001 337 461,454 - 376,787 6,196 58,099 20,3721212 Dairy product manufacturer 2008 Petroleum fuel Crude oil conversion kl 2001 376,327 - 330,765 3,776 25,295 16,4921212 Dairy product manufacturer 2110 Gasoline kl 2001 86 - - - - 861212 Dairy product manufacturer 2140 Kerosene kl 2001 9,732 - 2,730 69 5,445 1,4881212 Dairy product manufacturer 2150 Light oil kl 2001 492 - - - - 4921212 Dairy product manufacturer 2158 Total of heavy oils kl 2001 348,037 - 315,325 843 19,948 11,9211212 Dairy product manufacturer 2160 A-heavy oil kl 2001 258,886 - 226,181 843 19,948 11,9141212 Dairy product manufacturer 2170 B-heavy oil kl 2001 873 - 873 - - -1212 Dairy product manufacturer 2180 C-heavy oil kl 2001 88,278 - 88,271 - - 71212 Dairy product manufacturer 2200 Liquefied petroleum gas t 2001 9,004 - 4,865 2,206 - 1,9331212 Dairy product manufacturer 2300 Non-petroleum based fuel Crude oil conversion kl 2001 85,127 - 46,022 2,420 32,805 3,8801212 Dairy product manufacturer 2520 City gas 1000ms3 2001 71,987 - 39,005 2,033 27,687 3,2621212 Dairy product manufacturer 2525 (City gas) 1000ms3 2001 78,743 - 42,571 2,239 30,345 3,5891219 Other livestock food product manufacturer 2005 Total Crude oil conversion kl 2001 235 86,550 - 61,381 3,505 8,627 13,0371219 Other livestock food product manufacturer 2008 Petroleum fuel Crude oil conversion kl 2001 85,724 - 60,973 3,129 8,627 12,9951219 Other livestock food product manufacturer 2110 Gasoline kl 2001 90 - - - - 901219 Other livestock food product manufacturer 2140 Kerosene kl 2001 4,193 - 2,559 397 - 1,237
Industry classification/Fuel/Year No. ofbusinessplaces
consuming
Consumption
Source: “The structural survey of oil consumption, 2001” (Ministry of Economy, Trade and Industry)
- 35 -

(2) CO2 emission factor
1) CO2 emission factor for fuel combustion by energy type (fuel type)
We set “⑩CO2 emission factor by energy type“ (fuel type) uniformly, based on typical values in
“CO2 Emissions From Fuel Combustion 2008 Edition” (IEA).
Diagram 24 “⑩CO2 emission factor by energy type“ (fuel type)
Source: ”CO2 Emission From Fuel Combustion 2008 Edition” (IEA)
- 36 -

2) CO2 emission factor of electricity generation
We set “⑮ CO2 emission factor of electric power by country” by country based on “CO2
Emission From Fuel Combustion 2008 Edition” (IEA).
Diagram 25 “⑮ CO2 emission factor of electric power by country”
Source: “CO2 Emission From Fuel Combustion 2008 Edition” (IEA)
- 37 -

(3) CO2 emissions from all industrial sectors
We set CO2 emissions from all industrial sectors by country based on “CO2 Emission From Fuel
Combustion 2008 Edition” (IEA).
Diagram 26 CO2 Emission for All Industrial Sectors (Example: Japan)
Source: “CO2 Emission From Fuel Combustion 2008 Edition” (IEA)
- 38 -

5.6 Topics on heat pump technology 5.6.1 Technological development of industrial heat pump
With an increase in heating capacity and supply temperature of the heat pump, the range where the
boiler can be replaced with the heat pump in industrial process is expanding. In Japan, heat pump hot
water heater that supply 90℃ hot water (80kW-class heating capacity) is marketed, and heat pump
hot air heater that supply 120℃ hot air (100kW-class heating capacity) started marketing in Fall
2009.
Diagram 27 70°C Warm Water Heat Pump
Performance
(Note)
Capacity Heating 357kW/Cooling 243kW
Total COP 5.4
Consumed power 112kW
Range of taking off temperature Warm water 55~70℃、
Chilled water7~30℃
Note 2: Values under the conditions of inlet/outlet water temperature of warm water and chilled water of 55/65°C and 17/7°C, respectively
Source: Data from a power company
Diagram 28 80°C Warm Water Heat Pump
Warm water of 35 to 50°C coming from exhaust heat is used as the
heat source, and, as standard specification, warm water of 75°C is
heated to 80°C
Source: Website of a manufacturer
- 39 -

Diagram 29 90°C Warm Water Heat Pump
50Hz 60Hz
Refrigerant R-744 (CO2)
Performance
Heating Capacity*
(kW) 68.9 (67.9) 80.0 (77.6)
Power
Consumption*
(kW)
16.8 (20.1) 20.5 (24.1)
COP 4.1 3.9
Condition
Ambient temperature DB16℃,
WB12℃, Feed water
temperature17℃, Supplied water
temperature 65℃(90℃)
Supplied water flow* (L/h) 1259 ( 829) 1461 ( 947)
Power 3φAC200V 50/60Hz
Operating
range
Feed water
temperature (℃) 5~65
Feed water flow
(L/min) 0~30
Supplied water
temperature (℃) 65~90
Ambient
temperature (℃) -10~43
*※Values in parenthesis are under the conditions of ”Ambient temperature DB16℃, WB12℃, Feed water temperature17℃, Supplied water temperature 90℃”
Source: Catalogue of a manufacturer
- 40 -

Diagram 30 Heat Pump Generating Hot Air of 120°C
Source: Catalogue of a manufacturer
- 41 -
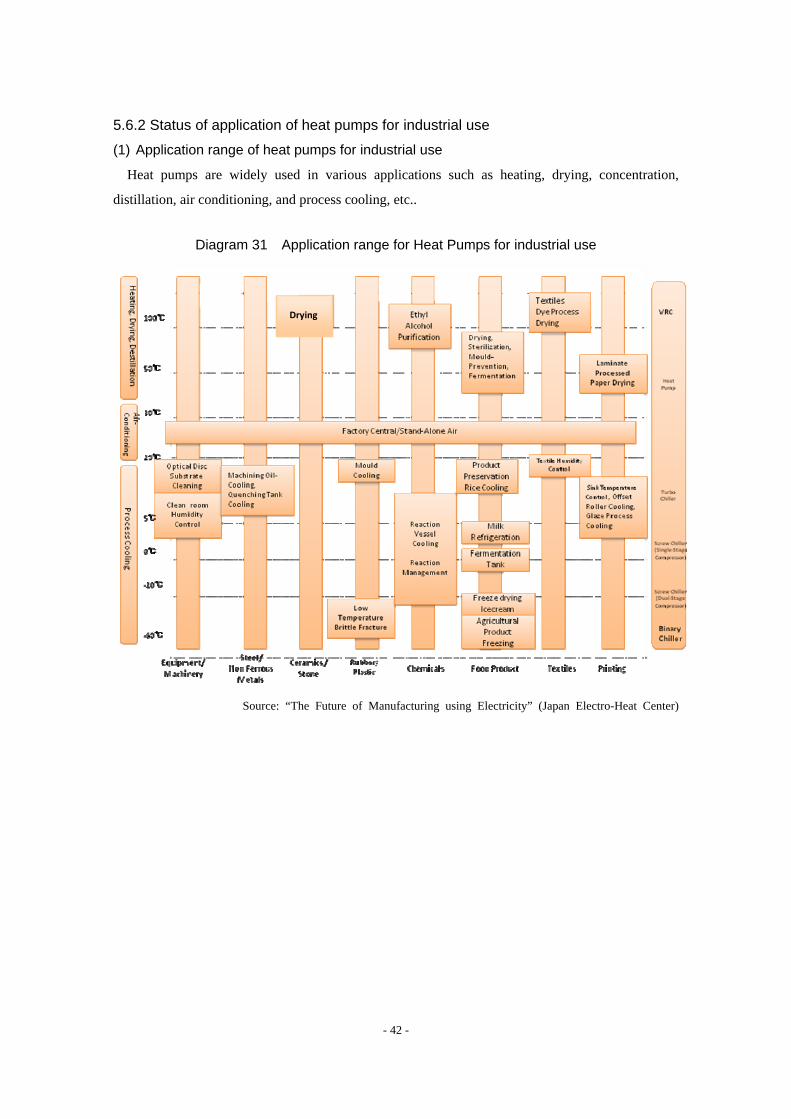
5.6.2 Status of application of heat pumps for industrial use
(1) Application range of heat pumps for industrial use
Heat pumps are widely used in various applications such as heating, drying, concentration,
distillation, air conditioning, and process cooling, etc..
Diagram 31 Application range for Heat Pumps for industrial use
Drying
Source: “The Future of Manufacturing using Electricity” (Japan Electro-Heat Center)
- 42 -
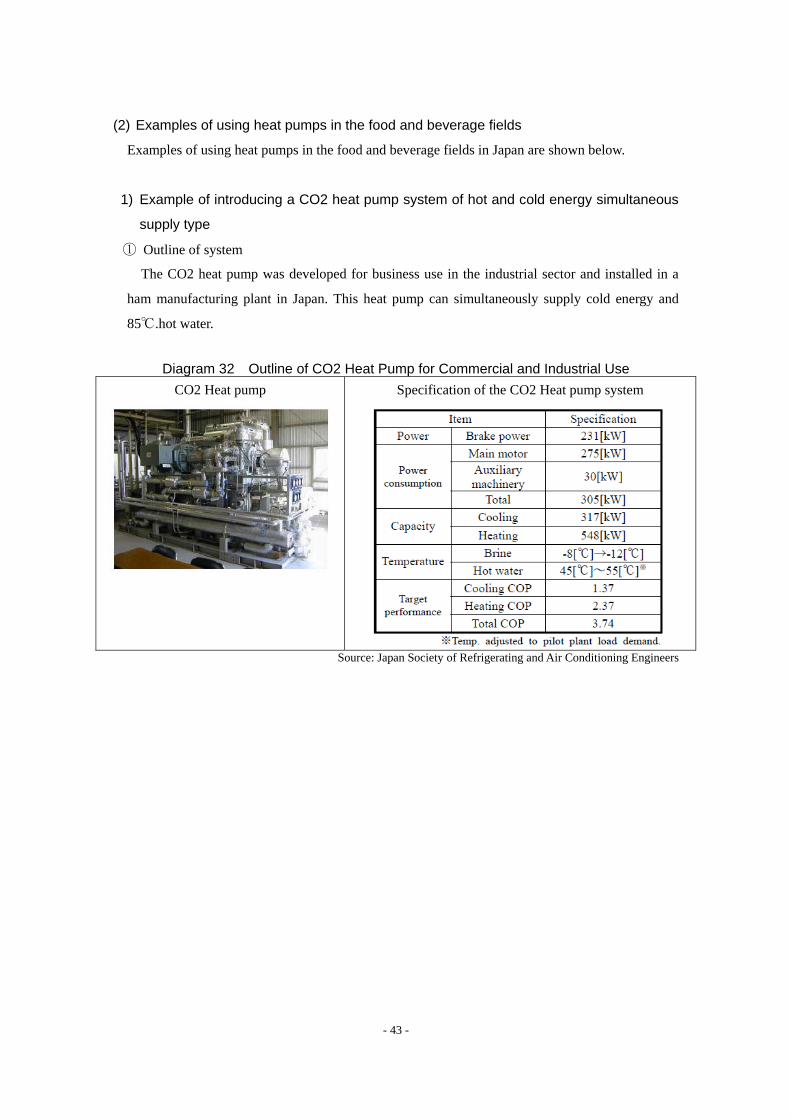
(2) Examples of using heat pumps in the food and beverage fields
Examples of using heat pumps in the food and beverage fields in Japan are shown below.
1) Example of introducing a CO2 heat pump system of hot and cold energy simultaneous
supply type
① Outline of system
The CO2 heat pump was developed for business use in the industrial sector and installed in a
ham manufacturing plant in Japan. This heat pump can simultaneously supply cold energy and
85℃.hot water.
Diagram 32 Outline of CO2 Heat Pump for Commercial and Industrial Use
CO2 Heat pump
Specification of the CO2 Heat pump system
Source: Japan Society of Refrigerating and Air Conditioning Engineers
- 43 -
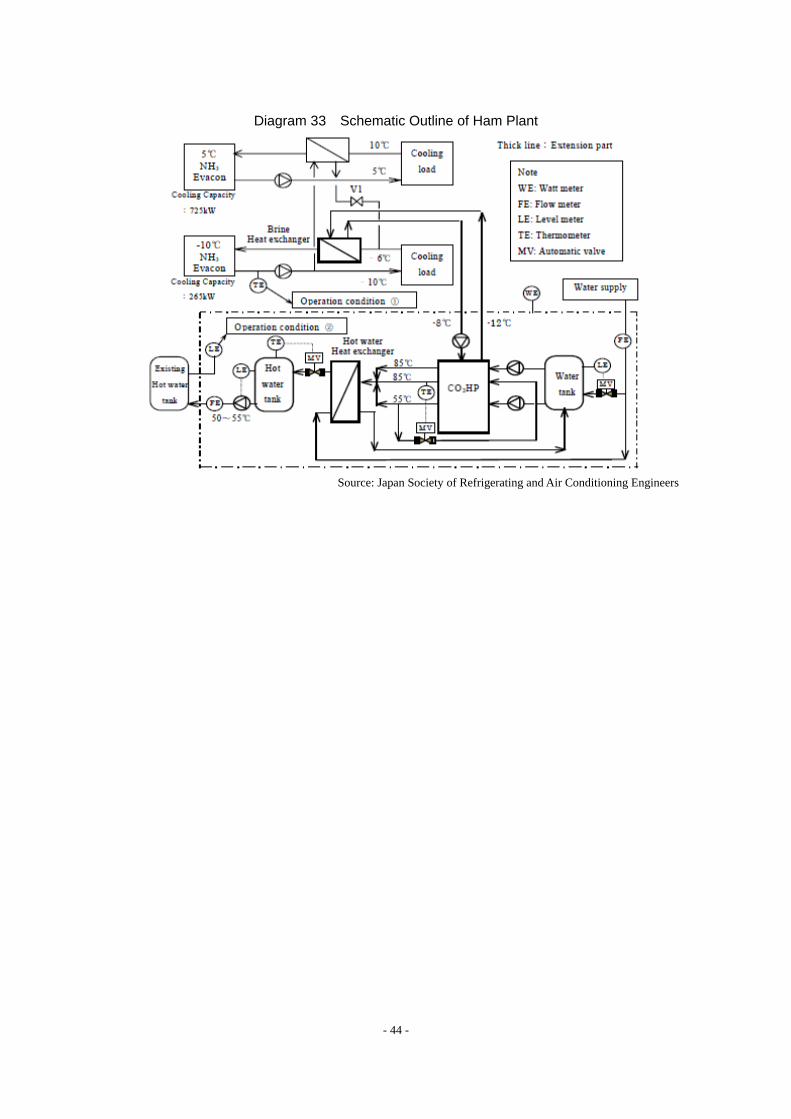
Diagram 33 Schematic Outline of Ham Plant
Source: Japan Society of Refrigerating and Air Conditioning Engineers
- 44 -
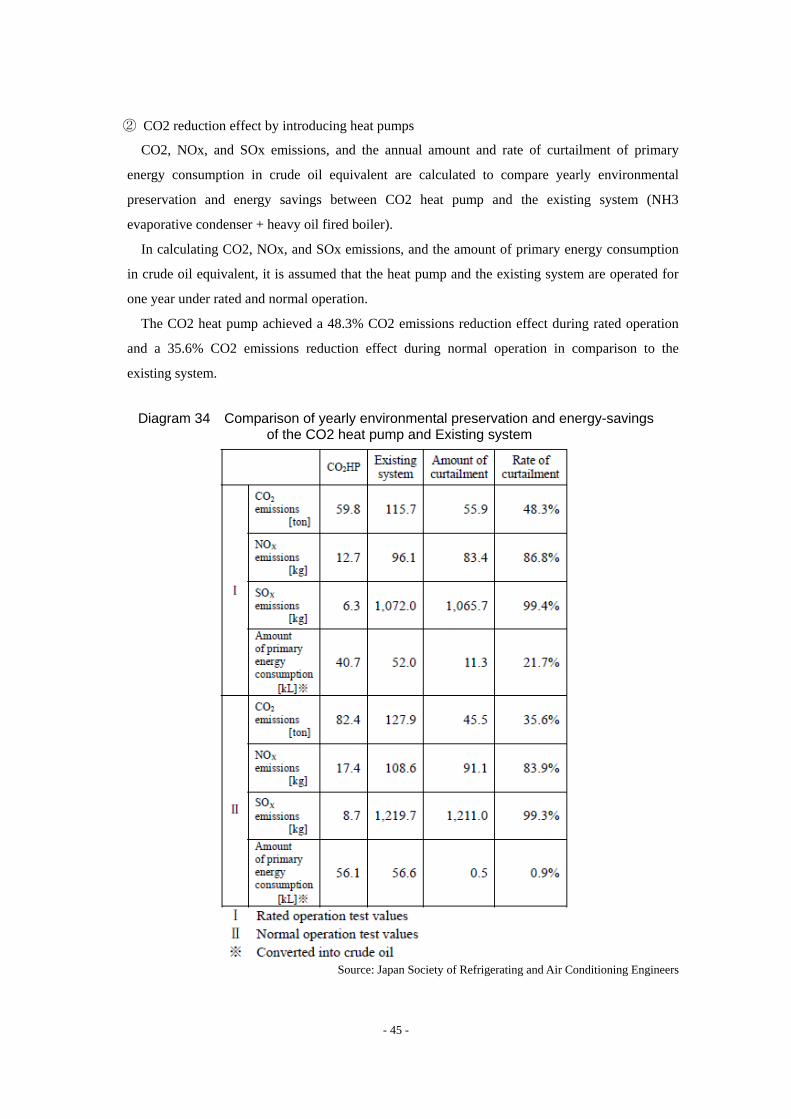
② CO2 reduction effect by introducing heat pumps
CO2, NOx, and SOx emissions, and the annual amount and rate of curtailment of primary
energy consumption in crude oil equivalent are calculated to compare yearly environmental
preservation and energy savings between CO2 heat pump and the existing system (NH3
evaporative condenser + heavy oil fired boiler).
In calculating CO2, NOx, and SOx emissions, and the amount of primary energy consumption
in crude oil equivalent, it is assumed that the heat pump and the existing system are operated for
one year under rated and normal operation.
The CO2 heat pump achieved a 48.3% CO2 emissions reduction effect during rated operation
and a 35.6% CO2 emissions reduction effect during normal operation in comparison to the
existing system.
Diagram 34 Comparison of yearly environmental preservation and energy-savings
of the CO2 heat pump and Existing system
Source: Japan Society of Refrigerating and Air Conditioning Engineers
- 45 -
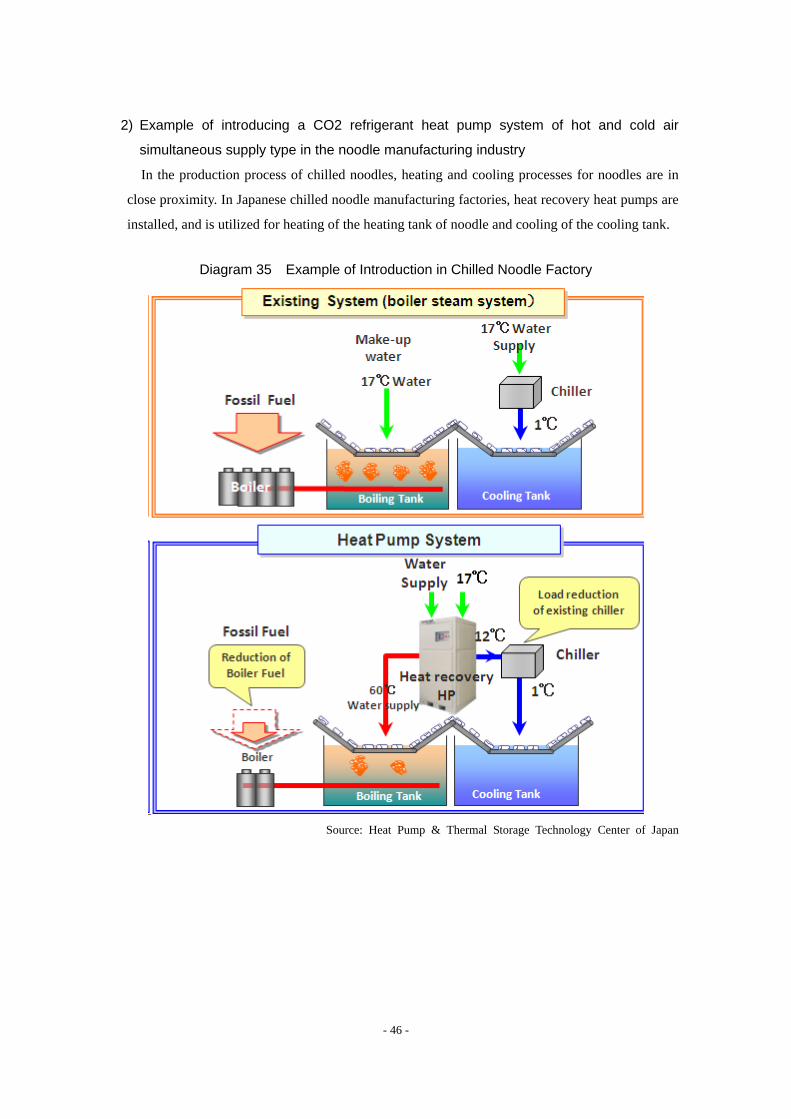
2) Example of introducing a CO2 refrigerant heat pump system of hot and cold air
simultaneous supply type in the noodle manufacturing industry
In the production process of chilled noodles, heating and cooling processes for noodles are in
close proximity. In Japanese chilled noodle manufacturing factories, heat recovery heat pumps are
installed, and is utilized for heating of the heating tank of noodle and cooling of the cooling tank.
Diagram 35 Example of Introduction in Chilled Noodle Factory
Source: Heat Pump & Thermal Storage Technology Center of Japan
- 46 -
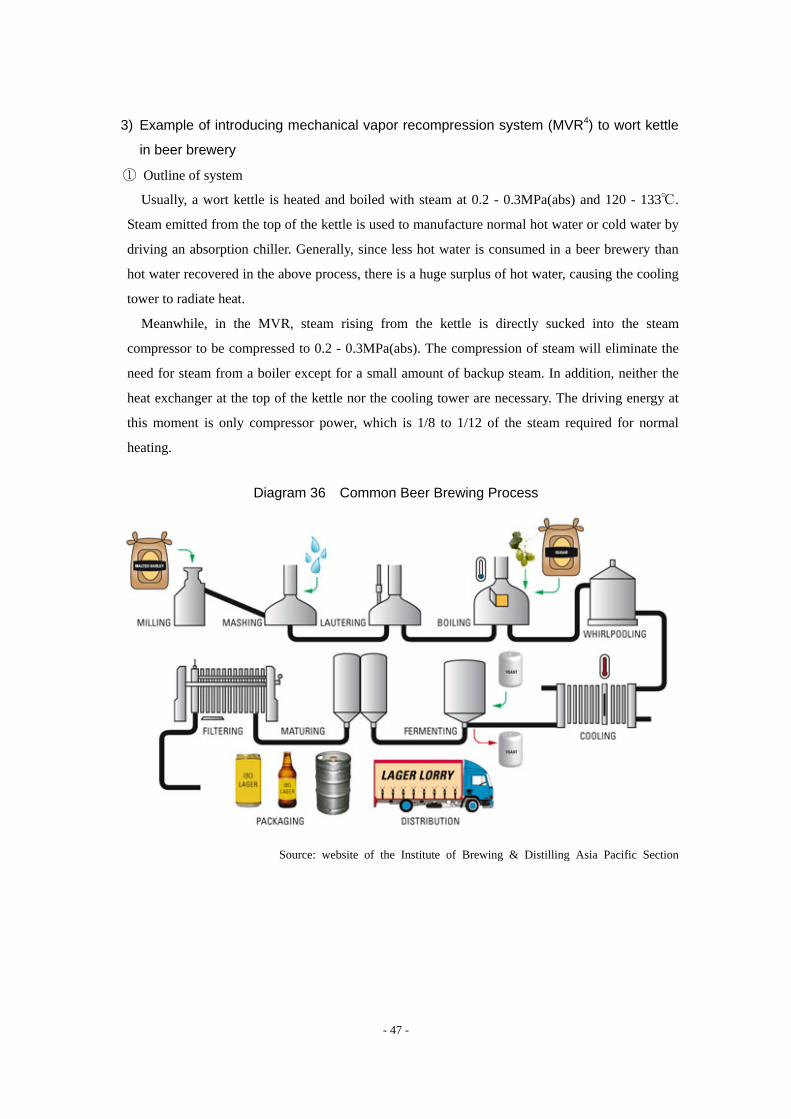
3) Example of introducing mechanical vapor recompression system (MVR4) to wort kettle
in beer brewery
① Outline of system
Usually, a wort kettle is heated and boiled with steam at 0.2 - 0.3MPa(abs) and 120 - 133℃.
Steam emitted from the top of the kettle is used to manufacture normal hot water or cold water by
driving an absorption chiller. Generally, since less hot water is consumed in a beer brewery than
hot water recovered in the above process, there is a huge surplus of hot water, causing the cooling
tower to radiate heat.
Meanwhile, in the MVR, steam rising from the kettle is directly sucked into the steam
compressor to be compressed to 0.2 - 0.3MPa(abs). The compression of steam will eliminate the
need for steam from a boiler except for a small amount of backup steam. In addition, neither the
heat exchanger at the top of the kettle nor the cooling tower are necessary. The driving energy at
this moment is only compressor power, which is 1/8 to 1/12 of the steam required for normal
heating.
Diagram 36 Common Beer Brewing Process
Source: website of the Institute of Brewing & Distilling Asia Pacific Section
- 47 -
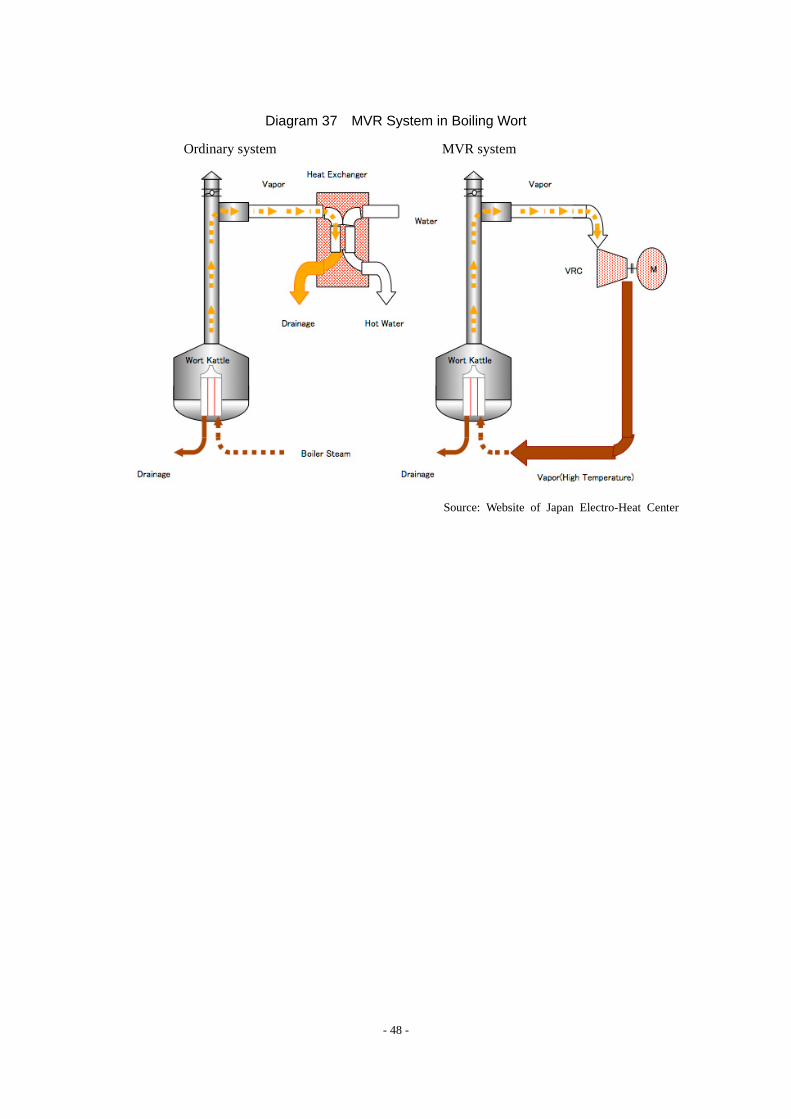
Diagram 37 MVR System in Boiling Wort
Ordinary system MVR system
Source: Website of Japan Electro-Heat Center
- 48 -
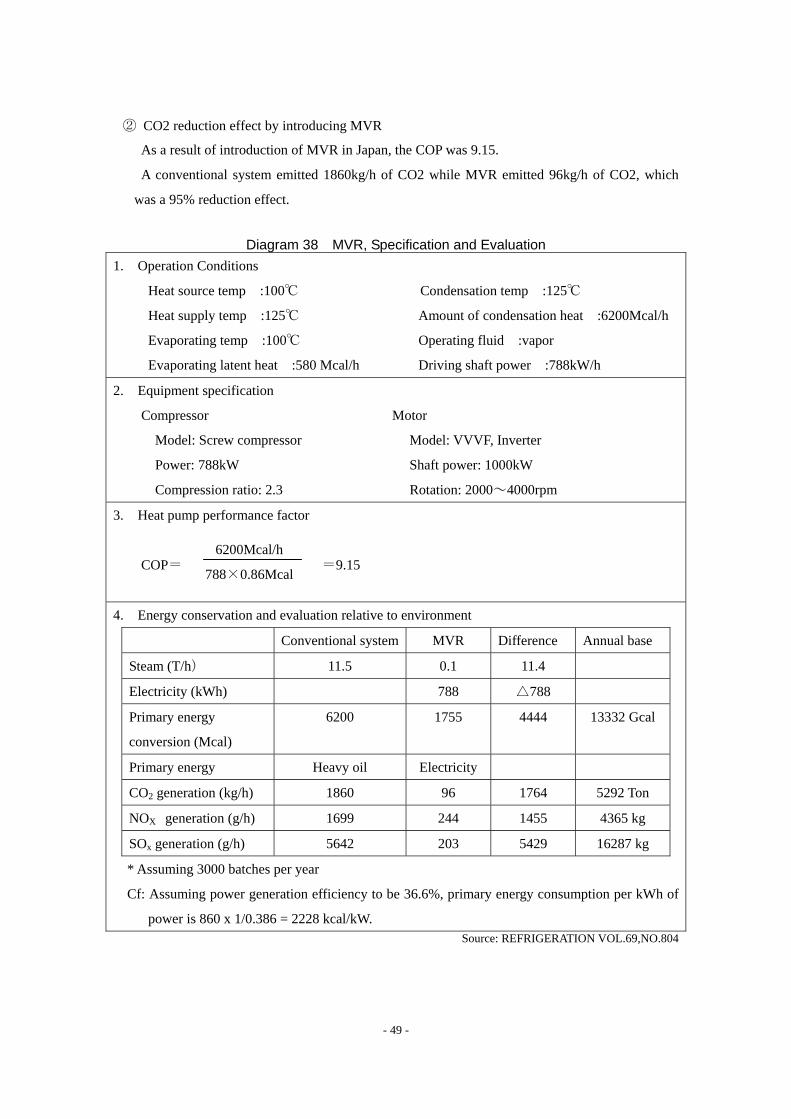
② CO2 reduction effect by introducing MVR
As a result of introduction of MVR in Japan, the COP was 9.15.
A conventional system emitted 1860kg/h of CO2 while MVR emitted 96kg/h of CO2, which
was a 95% reduction effect.
Diagram 38 MVR, Specification and Evaluation
1. Operation Conditions
Heat source temp :100℃ Condensation temp :125℃
Heat supply temp :125℃ Amount of condensation heat :6200Mcal/h
Evaporating temp :100℃ Operating fluid :vapor
Evaporating latent heat :580 Mcal/h Driving shaft power :788kW/h
2. Equipment specification
Compressor Motor
Model: Screw compressor Model: VVVF, Inverter
Power: 788kW Shaft power: 1000kW
Compression ratio: 2.3 Rotation: 2000~4000rpm
3. Heat pump performance factor
COP= =9.15
4. Energy conservation and evaluation relative to environment
Conventional system MVR Difference Annual base
Steam (T/h) 11.5 0.1 11.4
Electricity (kWh) 788 △788
Primary energy
conversion (Mcal)
6200 1755 4444 13332 Gcal
Primary energy Heavy oil Electricity
CO2 generation (kg/h) 1860 96 1764 5292 Ton
NOX generation (g/h) 1699 244 1455 4365 kg
SOx generation (g/h) 5642 203 5429 16287 kg
* Assuming 3000 batches per year
Cf: Assuming power generation efficiency to be 36.6%, primary energy consumption per kWh of
power is 860 x 1/0.386 = 2228 kcal/kW.
6200Mcal/h
788×0.86Mcal
Source: REFRIGERATION VOL.69,NO.804
- 49 -

5.7 Example of actual measured radiation loss entailed by steam transfer Sufficient data on heat efficiency on the actual demand side, i.e. total heat efficiency as a system
from boiler feed water to the heat demand end, has not been obtained. With an increasing awareness
of energy saving, a detailed survey has been conducted only recently. As an example, the
measurement result of steam boiler heat balance in an automobile plant is shown below.
Diagram 39 Example of Actual Use of Energy in Steam System
Source: Prepared from the Website of The Energy Conservation Center of Japan,
“Cases of Energy Conservation in Plants and Buildings”
Effectively used energy relative to fuel-input energy in the process of feeding water to a boiler to
draining in this plant was estimated to be 26.6%. About three quarters of the input energy was
released to the surroundings without being effectively used.
As far as we can tell from the result, the steam central-type steam process may entail a
considerable heat loss.
Meanwhile, for the heat supply system by heat pump, equipment can be installed close to the heat
demand point in the process and heat loss that may be generated in great quantities in the steam
process can be reduced. Furthermore, heat can be recycled by effectively using low-temperature
waste heat so that a high system efficiency can be achieved. Therefore, the replacement of
conventional boilers with heat pumps will be extremely important to improve the efficiency of the
entire process in industrial sector.
- 50 -

5.8 Heat recovery technologies in food and beverage fields
Heat recovery is a very valid approach to reducing energy use and CO2 emissions and is an
attractive technology that should become widespread. However, waste heat recovery in industries,
such as food and beverage production, is currently limited. This is due in part to relatively low
manufacturing temperatures, especially compared to those used in the steel and ceramic industries.
In addition, waste heat exists in decentralized locations throughout a factory and time constraints
further limit adoption, though the brewing process is an exception.
Therefore, we have calculated potential CO2 reductions through the utilization of heat pumps in
the food and beverage fields focusing on the region of operating temperature below 100 degrees C as
a heat pump applicable range.
Heat pump technologies has made great strides recently and in particular, it has become possible
to utilize low temperature waste heat from manufacturing process, etc. by applying heat pumps.
- 51 -

5.9 Estimation results of primary energy consumption reduction
5.9.1 Estimation method
(1) Estimation of primary energy consumption in the present situation
We set “⑨ Consumption of HP-substitutable fuels for steam boiler (at a end use temperature
below 100℃) by industrial category (sub classification) and energy type in countries surveyed” as
the primary energy consumption in the present situation. Energy types estimated are coal, petroleum
products and gas, and losses in energy conversion section are excluded.
(2) Estimation of primary energy consumption after the application of Heat Pumps
At first, we calculated power consumption by country and category after the application of heat
pumps by multiplying “⑫ Efficiency of boiler” (which was set at 85% uniformly for every country)
by “⑨ Consumption of HP-substitutable fuels for steam boiler by industrial category (sub
classification) and energy type in countries surveyed” and then dividing the obtained value by “⑭
COP of heat pump” (which was set at 4.0 uniformly for every country).
Next, we calculated “Primary energy consumption after HP substitution by industrial category
(sub classification) in countries surveyed” by dividing the power consumption by “Power generation
efficiency in countries surveyed”.
- 52 -

Diagram 40 Power generation efficiency for countries surveyed
37.9%
38.3%
41.3%
49.7%
44.7%
99.1%
45.7%
41.8%
44.1%
38.8%
36.0%
0% 20% 40% 60% 80% 100%
China
United States
United Kingdom
Sweden
Spain
Norway
Netherlands
Japan
Italy
Germany
France
* We calculated it by dividing electricity generated at the power plants described in the document by input energy (including non-fossil fuels such as nuclear energy).
* In the document, input energy for non-fossil fuels is set as follows. Nuclear energy; Input energy = Electricity generated / 33% Geothermal energy; Input energy = Electricity generated / 10% Hydro, solar, wind, tide/wave; Input energy = Electricity generated。
Source: “Energy Balances of OECD Countries 2009 Edition” (IEA), "Energy Balances of Non-OECD Countries 2009 Edition"(IEA)
Diagram 41 Input energy composition in power generation sector
0% 20% 40% 60% 80% 100%
China
United States
United Kingdom
Sweden
Spain
Norway
Netherlands
Japan
Italy
Germany
France
Primary energy for electricity
Coal & peat
Crude oil
Petroleum products
Gas
Nuclear
Hydro
Geotherm. Solar etc.
Combust. Renew. & waste
Heat
Source: “Energy Balances of OECD Countries 2009 Edition” (IEA),"Energy Balances of Non-OECD Countries 2009 Edition"(IEA)
- 53 -

5.9.2 Estimation results
A total primary energy reduction effect of 11million toe/year for all of the 11 countries covered by
the survey can be expected by substituting heat pumps for steam boilers among applications at a use
end temperature below 100℃ in the food and beverage fields. In particular, a significant primary
energy reduction can be expected in the USA (4.2 million toe/year) and China (3.6 million toe/year).
The data for China have a lower accuracy than that for other countries. A total primary energy
reduction of 7.1 million toe/year in the 10 countries other than China can be expected.
Diagram 42 Primary Energy Reduction by Substitution of Boiler by Heat Pump
in Uses at Use End Temperature of below 100°C in the Food and Beverage Fields
8.11
9.37
0.87
0.07
0.46
0.05
0.34
1.16
0.85
1.18
1.14
4.54
5.20
0.45
0.03
0.22
0.01
0.16
0.59
0.41
0.64
0.67
-3.57
-4.17
-0.42
-0.04
-0.24
-0.04
-0.18
-0.57
-0.44
-0.53
-0.47
-6 -4 -2 0 2 4 6 8 10 12
China
United States
United Kingdom
Sweden
Spain
Norway
Netherlands
Japan
Italy
Germany
France
Mtoe/year
Current consumption consumption after application of HP Reduction
- 54 -

5.9.3 Source of Data
We set “Power generation efficiency in countries surveyed” based on the “Energy Balances of
OECD Countries 2009 Edition(IEA)” for each country. Specifically, we calculated it by dividing
electricity generated at the power plants described in the document by input energy (including
non-fossil fuels such as nuclear energy).
Diagram 43 Energy Balance(Japan)
Source: “Energy Balances of OECD Countries 2009 Edition
- 55 -
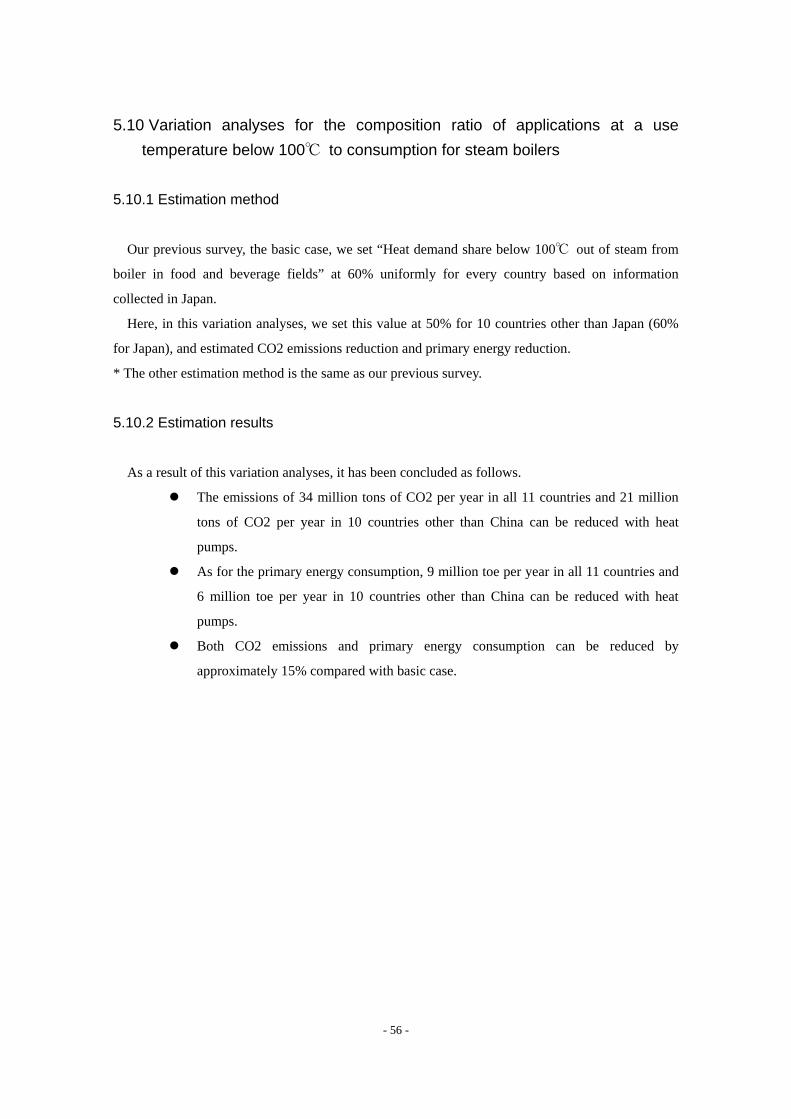
5.10 Variation analyses for the composition ratio of applications at a use temperature below 100℃ to consumption for steam boilers
5.10.1 Estimation method
Our previous survey, the basic case, we set “Heat demand share below 100℃ out of steam from
boiler in food and beverage fields” at 60% uniformly for every country based on information
collected in Japan.
Here, in this variation analyses, we set this value at 50% for 10 countries other than Japan (60%
for Japan), and estimated CO2 emissions reduction and primary energy reduction.
* The other estimation method is the same as our previous survey.
5.10.2 Estimation results
As a result of this variation analyses, it has been concluded as follows.
The emissions of 34 million tons of CO2 per year in all 11 countries and 21 million
tons of CO2 per year in 10 countries other than China can be reduced with heat
pumps.
As for the primary energy consumption, 9 million toe per year in all 11 countries and
6 million toe per year in 10 countries other than China can be reduced with heat
pumps.
Both CO2 emissions and primary energy consumption can be reduced by
approximately 15% compared with basic case.
- 56 -

Diagram 44 Estimation results of CO2 emissions and primary energy consumption in variation analyses
Million t-CO2/year
Current emissions Emissions afterapplication of HP
Reduction
France 2.7 0.2 -2.5
Germany 2.7 1.0 -1.7
Italy 1.8 0.7 -1.1
Japan 3.4 1.2 -2.2
Netherlands 0.7 0.3 -0.4
Norway 0.1 0.0 -0.1
Spain 1.1 0.4 -0.7
Sweden 0.2 0.0 -0.2
United Kingdom 1.8 0.9 -0.9
United States 22.3 10.9 -11.4
China 26.1 13.3 -12.8
Total 62.9 28.9 -34.1
(10 countries other than China) 36.9 15.6 -21.2
Mtoe/year
Current consumption Consumptuion afterapplication of HP
Reduction
France 0.9 0.6 -0.4
Germany 1.0 0.5 -0.4
Italy 0.7 0.3 -0.4
Japan 1.2 0.6 -0.6
Netherlands 0.3 0.1 -0.2
Norway 0.0 0.0 0.0
Spain 0.4 0.2 -0.2
Sweden 0.1 0.0 0.0
United Kingdom 0.7 0.4 -0.4
United States 7.8 4.3 -3.5
China 6.8 3.8 -3.0
Total 19.8 10.9 -9.0
(10 countries other than China) 13.1 7.1 -6.0
Heat demand share below 100 degrees Celsius out of steam from boileris set at 50% for 10 countries (60% for Japan)
Heat demand share below 100 degrees Celsius out of steam from boileris set at 50% for 10 countries (60% for Japan)
- 57 -