Incremental Sampling Methodology (ISM) for Metals: Number ...

2
J00326 Community Satisfaction Survey 2015 – Mount Alexander Shire Council
Background and objectives Survey methodology and sampling Further information Key findings & recommendations Summary of findings Detailed findings
• Key core measure: Overall performance• Key core measure: Customer service• Key core measure: Council direction indicators• Individual service areas• Detailed demographics
Appendix A: Detailed survey tabulations Appendix B: Further project information

3
J00326 Community Satisfaction Survey 2015 – Mount Alexander Shire Council
Welcome to the report of results and recommendations for the 2015 State-wide Local Government Community Satisfaction Survey for Mount Alexander Shire Council.
Each year Local Government Victoria (LGV) coordinates and auspices this State-wide Local Government Community Satisfaction Survey throughout Victorian local government areas. This coordinated approach allows for far more cost effective surveying than would be possible if councils commissioned surveys individually.
Participation in the State-wide Local Government Community Satisfaction Survey is optional and participating councils have a range of choices as to the content of the questionnaire and the sample size to be surveyed, depending on their individual strategic, financial and other considerations.
The main objectives of the survey are to assess the performance of Mount Alexander Shire Council across a range of measures and to seek insight into ways to provide improved or more effective service delivery. The survey also provides councils with a means to fulfil some of their statutory reporting requirements as well as acting as a feedback mechanism to LGV.

4
J00326 Community Satisfaction Survey 2015 – Mount Alexander Shire Council
This survey was conducted by Computer Assisted Telephone Interviewing (CATI) as a representative random probability survey of residents aged 18+ years in Mount Alexander Shire Council.
Survey sample matched to the demographic profile of Mount Alexander Shire Council as determined by the most recent ABS population estimates was purchased from an accredited supplier of publicly available phone records, including up to 10% mobile phone numbers to cater to the diversity of residents within Mount Alexander Shire Council, particularly younger people.
A total of n=400 completed interviews were achieved in Mount Alexander Shire Council. Survey fieldwork was conducted in the period of 1st February – 30th March, 2015.
The 2015 results are compared with previous years, as detailed below: • 2014, n=400 completed interviews, conducted in the period of 31st January – 11th March.• 2013, n=400 completed interviews, conducted in the period of 1st February – 24th March.• 2012, n=400 completed interviews, conducted in the period of 18th May – 30th June.
Minimum quotas of gender within age groups were applied during the fieldwork phase. Post-survey weighting was then conducted to ensure accurate representation of the age and gender profile of the Mount Alexander Shire Council area.
Any variation of +/-1% between individual results and net scores in this report or the detailed survey tabulations is due to rounding. In reporting, ‘—’ denotes not mentioned and ‘0%’ denotes mentioned by less than 1% of respondents. ‘Net’ scores refer to two or more response categories being combined into one category for simplicity of reporting.
5
J00326 Community Satisfaction Survey 2015 – Mount Alexander Shire Council
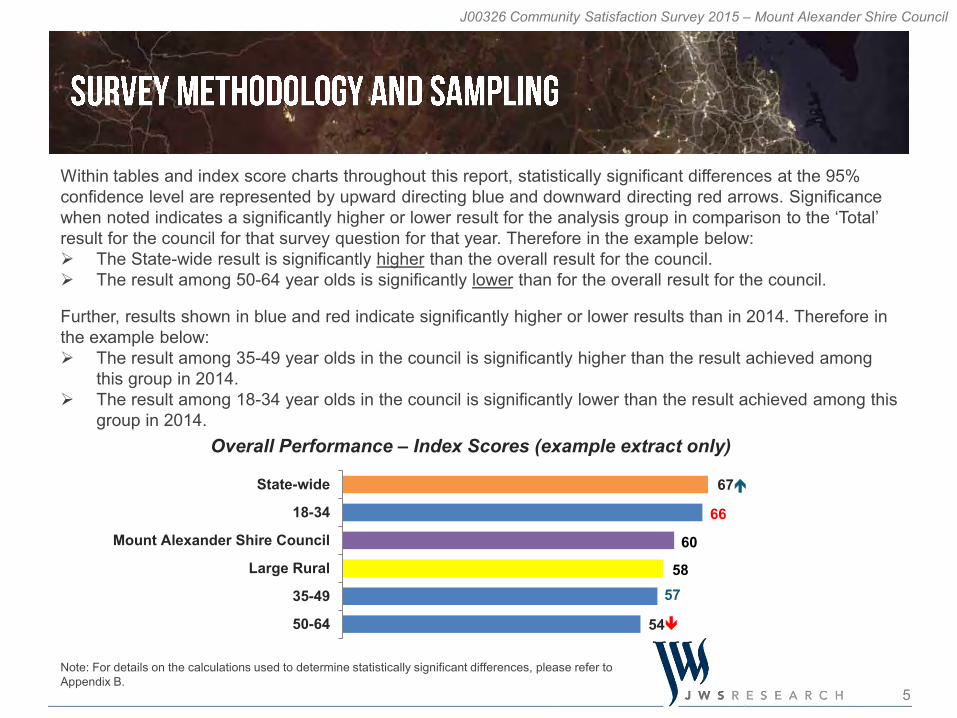
Within tables and index score charts throughout this report, statistically significant differences at the 95% confidence level are represented by upward directing blue and downward directing red arrows. Significance when noted indicates a significantly higher or lower result for the analysis group in comparison to the ‘Total’ result for the council for that survey question for that year. Therefore in the example below: The State-wide result is significantly higher than the overall result for the council. The result among 50-64 year olds is significantly lower than for the overall result for the council.
Further, results shown in blue and red indicate significantly higher or lower results than in 2014. Therefore in the example below: The result among 35-49 year olds in the council is significantly higher than the result achieved among
this group in 2014. The result among 18-34 year olds in the council is significantly lower than the result achieved among this
group in 2014.
54
5758
60
67
66
50-64
35-49
Large Rural
Mount Alexander Shire Council
18-34
State-wide
Overall Performance – Index Scores (example extract only)
Note: For details on the calculations used to determine statistically significant differences, please refer to Appendix B.

6
J00326 Community Satisfaction Survey 2015 – Mount Alexander Shire Council
Further InformationFurther information about the report and explanations about the State-wide Local Government Community Satisfaction Survey can be found in Appendix B, including: Background and objectives Margins of error Analysis and reporting Glossary of terms
ContactsFor further queries about the conduct and reporting of the 2015 State-wide Local Government Community Satisfaction Survey, please contact JWS Research on (03) 8685 8555.

8
J00326 Community Satisfaction Survey 2015 – Mount Alexander Shire Council
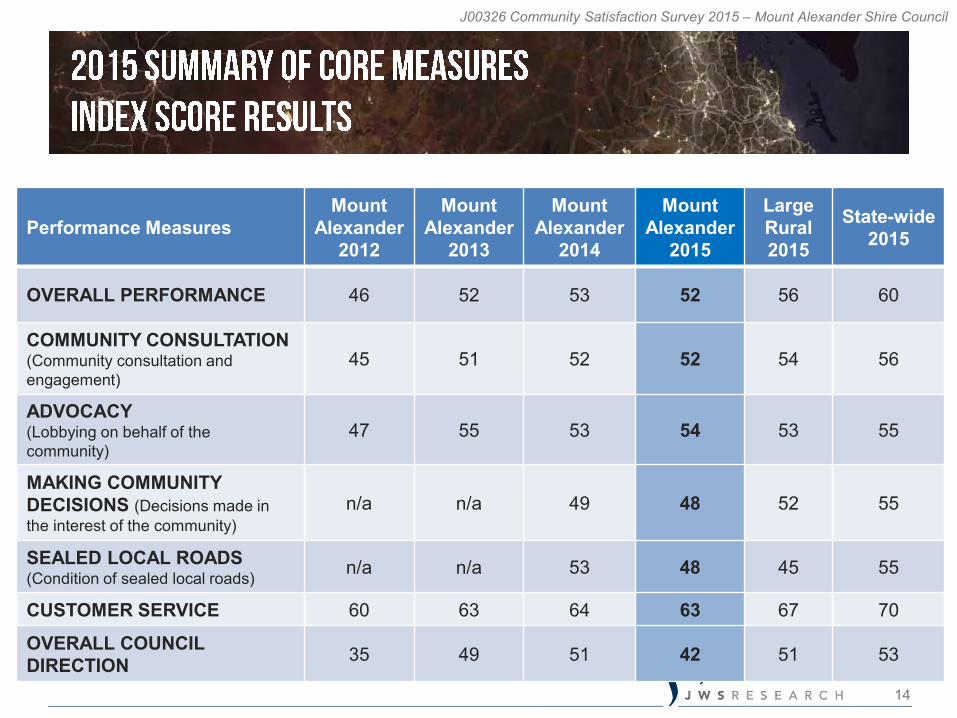
Mount Alexander Shire Council’s performance over the last 12 months has remained generally stable. The stability in Mount Alexander’s overall performance score is mirrored throughout most core measures. The two exceptions to this are ‘overall Council direction’ and the ‘condition of sealed local roads’, where Council performance has significantly declined compared with 2014.
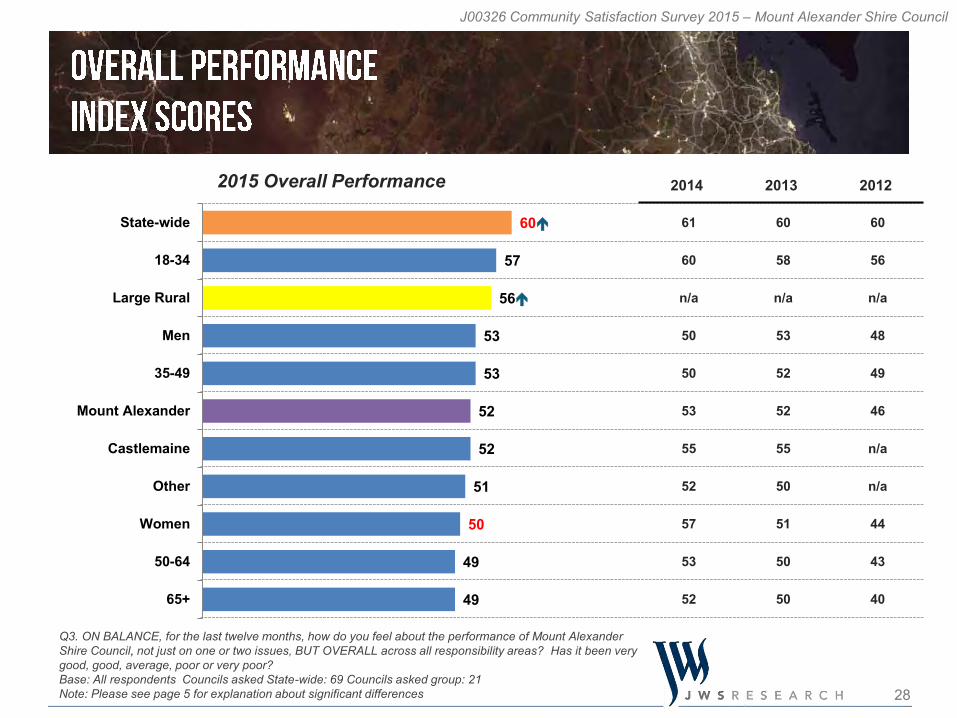
Mount Alexander Shire Council should note that in general, residents aged over 50tend to rate Council performance significantly worse than other demographic groups. Conversely, residents aged 18-34 year old tend to be much more positive about Council’s performance.
The overall performance index of 52 is within one point of the 2014 result however it is significantly lower than the Large Rural group average (56) and also the State-wide average (60). While there has been no significant change at the overall resident level, women have been
far more critical of Council’s overall performance as reflected in an average performance rating which is seven points lower than 2014.
9
J00326 Community Satisfaction Survey 2015 – Mount Alexander Shire Council
Council’s performance index on overall council direction sits at 42 which is s significant decline of nine points compared with 2014. This result puts Mount Alexander Shire Council significantly below both the State-wide and the Large Rural council group averages for this measure. Much of this decline is being driven by more critical assessments of council direction among
most resident cohorts with the exception of men and those aged 35-49 whose views are generally consistent with 2014.
It is difficult to isolate exactly what issues or concerns are underlying the significant decline in the assessment of Council direction, as the only individual service area to show a significant decrease in performance rating is the condition of local sealed roads, where the performance rating is five points lower than 2014 (index score of 48).
On the issue of sealed local roads, the significant decline in performance is driven in large part by a more critical assessment of Council performance from women this year, as well as 35-49 year olds, and non-Castlemaine..

10
J00326 Community Satisfaction Survey 2015 – Mount Alexander Shire Council
Council performance on the issues of community consultation (index score of 52), advocacy (index score of 54) and also making decisions in the interest of the community (index score of 48) are all consistent with Council’s 2014 results. Performance on all three issues is on par with the Large Rural group averages.
Customer service is the best performing of the seven core issues. The performance index of 63 is within one point of the 2014 result but significantly lower than the Large Rural and State-wide averages.
In the absence of clear guidance about what is causing Council’s overall direction score to decrease, we would recommend increasing attention and communication around those individual services where Council rates lower than the Large Rural average score, including on: Informing the community The condition of local streets and footpaths Enforcement of local laws Elderly support services Recreational facilities Waste management Making decisions in the interest of the community
11
J00326 Community Satisfaction Survey 2015 – Mount Alexander Shire Council
Council should also look to address and communicate its efforts in service areas where the importance of a service to residents exceeds their rating of Council’s performance by 10 points or more, particularly those exceeding 15 points: Making decisions in the interest of the community, performance – importance = -34 Condition of local streets and footpaths, -32 Consultation and engagement, -27 Informing the community, -23 Waste management, -21 Elderly support services, -20 Lobbying on behalf of the community, -16
An approach we recommend is to further mine the survey data to better understand the profile of these over and under-performing demographic groups. This can be achieved via additional consultation and data interrogation, or self-mining the SPSS data provided or via the dashboard portal available to the council.
A complimentary personal briefing by senior JWS Research representatives is also available to assist in providing both explanation and interpretation of the results. Please contact JWS Research on 03 8685 8555.

12
J00326 Community Satisfaction Survey 2015 – Mount Alexander Shire Council
• NoneHigher results in 2015
• Overall council direction• Condition of sealed roadsLower results in 2015
• 18-34 year oldsMost favourably disposed towards Council
• 50-64 year olds• 65+ year olds
Least favourably disposed towards
Council

14
J00326 Community Satisfaction Survey 2015 – Mount Alexander Shire Council
Performance Measures Mount
Alexander2012
Mount Alexander
2013
Mount Alexander
2014
Mount Alexander
2015
Large Rural2015
State-wide2015
OVERALL PERFORMANCE 46 52 53 52 56 60
COMMUNITY CONSULTATION(Community consultation and engagement)
45 51 52 52 54 56
ADVOCACY(Lobbying on behalf of the community)
47 55 53 54 53 55
MAKING COMMUNITYDECISIONS (Decisions made in the interest of the community)
n/a n/a 49 48 52 55
SEALED LOCAL ROADS (Condition of sealed local roads) n/a n/a 53 48 45 55
CUSTOMER SERVICE 60 63 64 63 67 70
OVERALL COUNCIL DIRECTION 35 49 51 42 51 53

15
J00326 Community Satisfaction Survey 2015 – Mount Alexander Shire Council
Performance Measures Mount
Alexander 2015
vs Mount Alexander
2014
vsLarge Rural2015
vs State-wide2015
Highest score
Lowest score
OVERALL PERFORMANCE 52 1 points lower
4 points lower
8 points lower
18-34 year olds
50-64 year olds
COMMUNITY CONSULTATION(Community consultation and engagement)
52 Equal 2 points lower
4 points lower
35-49 year olds
50-64 year olds
ADVOCACY(Lobbying on behalf of the community)
54 1 points higher
1 points higher
1 points lower
18-34 year olds
50-64 year olds
MAKING COMMUNITYDECISIONS (Decisions made in the interest of the community)
48 1 points lower
4 points lower
7 points lower
18-34 year olds
50-64 year olds
SEALED LOCAL ROADS (Condition of sealed local roads) 48 5 points
lower3 points higher
7 points lower
Castlemaine Other
CUSTOMER SERVICE 63 1 points lower
4 points lower
7 points lower Women Men
OVERALL COUNCIL DIRECTION 42 9 points
lower9 points
lower11 points
lower18-34
year olds50-64
year olds

16
J00326 Community Satisfaction Survey 2015 – Mount Alexander Shire Council
8
9
6
5
5
22
28
26
23
23
28
33
35
31
27
32
31
23
16
20
14
22
20
10
11
8
5
9
14
9
2
6
23
3
Overall Performance
Community Consultation
Advocacy
Making CommunityDecisions
Sealed Local Roads
Customer Service
% Very good Good Average Poor Very poor Can't say
Key Measures Summary Results
13 53 28 7Overall Council Direction
% Improved Stayed the same Deteriorated Can't say

17
J00326 Community Satisfaction Survey 2015 – Mount Alexander Shire Council
Sign
ifica
ntly
hig
her t
han
Stat
e-w
ide
aver
age
Significantly lower than State-w
ide average
-Community & cultural
-Consultation & engagement -Informing the community -Local streets & footpaths-Enforcement of local laws-Elderly support services -Recreational facilities -Appearance of public areas-Waste management -Making community decisions-Sealed local roads

18
J00326 Community Satisfaction Survey 2015 – Mount Alexander Shire Council
Sign
ifica
ntly
hig
her t
han
grou
p av
erag
e Significantly lower than group
average
-Community & cultural-Sealed local roads
-Informing the community -Local streets & footpaths-Enforcement of local laws-Elderly support services -Recreational facilities -Waste management -Making community decisions

19
J00326 Community Satisfaction Survey 2015 – Mount Alexander Shire Council
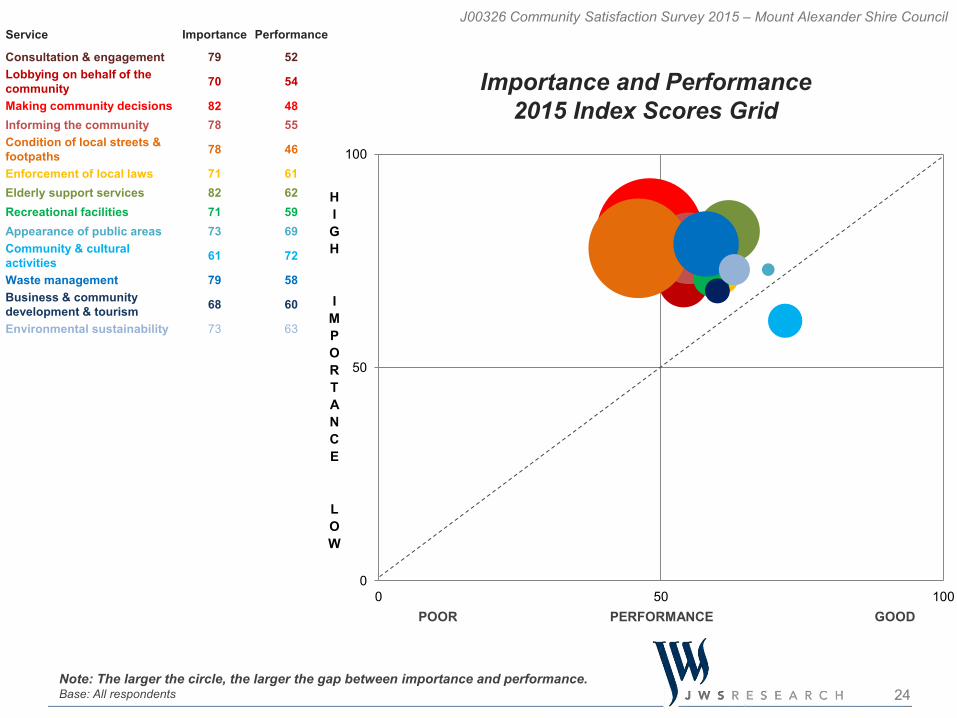
Service areas where importance exceeds performance by 10 points or more, suggesting further investigation is necessary:
Service Importance Performance Net differentialMaking decisions in the interest of the community
82 48 -34
Condition of local streets & footpaths 78 46 -32
Consultation & engagement 79 52 -27
Informing the community 78 55 -23
Waste management 79 58 -21
Elderly support services 82 62 -20
Lobbying on behalf of the community 70 54 -16
Recreational facilities 71 59 -12
Enforcement of local laws 71 61 -10
Environmental sustainability 73 63 -10

20
J00326 Community Satisfaction Survey 2015 – Mount Alexander Shire Council
Base: All respondents Councils asked State-wide: 55Note: Please see page 5 for explanation of significant differences
n/a
82
80
80
78
78
74
n/a
n/a
73
70
n/a
n/a
80
n/a
79
79
80
77
73
n/a
n/a
n/a
70
n/a
n/a
n/a
n/a
n/a
n/a
n/a
n/a
n/a
n/a
n/a
n/a
n/a
n/a
n/a
2014 2013 20122015 Priority Area Importance
82
82
79
79
78
78
73
73
71
71
70
68
61
Elderly support services
Community decisions
Consultation & engagement
Waste management
Informing the community
Local streets & footpaths
Appearance of public areas
Environmental sustainability
Enforcement of local laws
Recreational facilities
Lobbying
Bus/community dev./tourism
Community & cultural
21
J00326 Community Satisfaction Survey 2015 – Mount Alexander Shire Council
n/a
n/a
n/a
n/a
n/a
n/a
60
n/a
n/a
53
52
49
53
n/a
n/a
n/a
n/a
n/a
n/a
n/a
n/a
n/a
n/a
55
51
n/a
n/a
n/a
n/a
n/a
n/a
n/a
n/a
n/a
n/a
n/a
n/a
47
45
n/a
n/a
n/a
2014 2013 2012
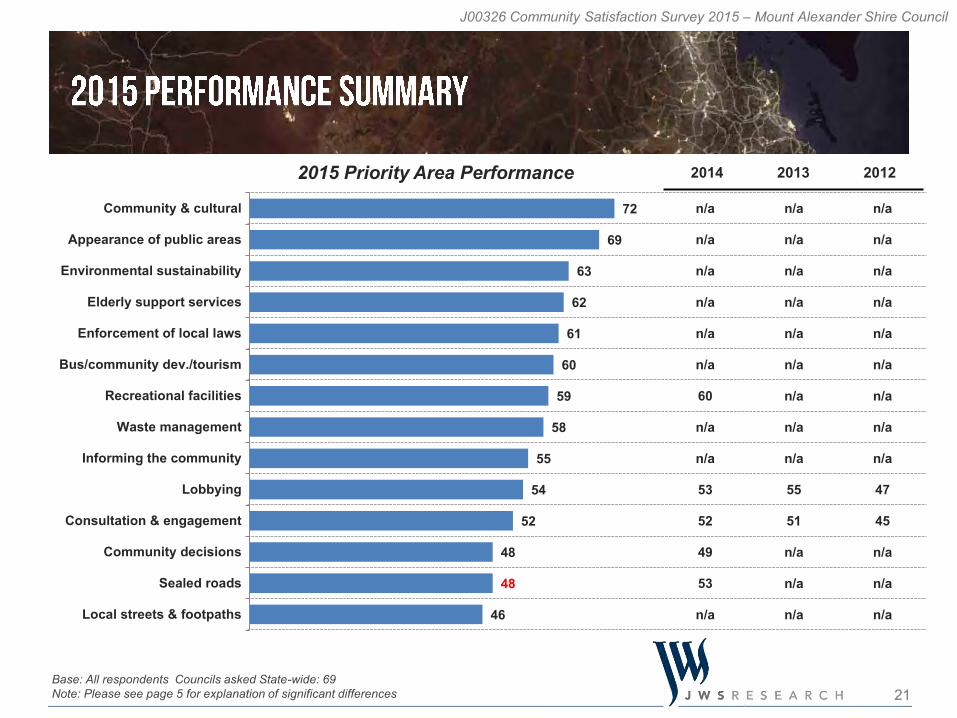
72
69
63
62
61
60
59
58
55
54
52
48
48
46
Community & cultural
Appearance of public areas
Environmental sustainability
Elderly support services
Enforcement of local laws
Bus/community dev./tourism
Recreational facilities
Waste management
Informing the community
Lobbying
Consultation & engagement
Community decisions
Sealed roads
Local streets & footpaths
Base: All respondents Councils asked State-wide: 69Note: Please see page 5 for explanation of significant differences
2015 Priority Area Performance

22
J00326 Community Satisfaction Survey 2015 – Mount Alexander Shire Council
Top Three Most Important Service Areas(Highest to lowest, i.e. 1. = most important)
Mount Alexander Shire Council
1. Community decisions
2. Elderly support services
3. Waste management
Metropolitan
1. Waste management
2. Community decisions
3. Elderly support services
Interface
1. Emergency & disaster mngt
2. Waste management
3. Local streets & footpaths
Regional Centres
1. Emergency & disaster mngt
2. Elderly support services
3. Waste management
Large Rural
1. Community decisions
2. Unsealed roads3. Emergency &
disaster mngt
Small Rural
1. Emergency & disaster mngt
2. Community decisions
3. Elderly support services
Bottom Three Most Important Service Areas (Lowest to highest, i.e. 1. = least important)
Mount Alexander Shire Council
1. Community & cultural
2. Bus/community dev./tourism
3. Lobbying
Metropolitan
1. Bus/community dev./tourism
2. Community & cultural
3. Slashing & weed control
Interface
1. Tourism development
2. Community & cultural
3. Bus/community dev./tourism
Regional Centres
1. Community & cultural
2. Tourism development
3. Art centres & libraries
Large Rural
1. Community & cultural
2. Art centres & libraries
3. Parking facilities
Small Rural
1. Traffic management
2. Art centres & libraries
3. Community & cultural

23
J00326 Community Satisfaction Survey 2015 – Mount Alexander Shire Council
Top Three Most Performance Service Areas(Highest to lowest, i.e. 1. = highest performance)
Bottom Three Most Performance Service Areas (Lowest to highest, i.e. 1. = lowest performance)
Mount Alexander Shire Council
1. Community & cultural
2. Appearance of public areas
3. Environmental sustainability
Metropolitan
1. Waste management
2. Art centres & libraries
3. Recreational facilities
Interface
1. Waste management
2. Art centres & libraries
3. Emergency & disaster mngt
Regional Centres
1. Art centres & libraries
2. Appearance of public areas
3. Waste management
Large Rural
1. Art centres & libraries
2. Emergency & disaster mngt
3. Appearance of public areas
Small Rural
1. Appearance of public areas
2. Elderly support services
3. Waste management
Mount Alexander Shire Council
1. Local streets & footpaths
2. Sealed roads 3. Community
decisions
Metropolitan
1. Planning permits
2. Population growth
3. Town planning policy
Interface
1. Unsealed roads2. Planning
permits 3. Slashing &
weed control
Regional Centres
1. Unsealed roads2. Community
decisions3. Parking facilities
Large Rural
1. Unsealed roads2. Sealed roads 3. Population
growth
Small Rural
1. Unsealed roads2. Slashing &
weed control 3. Sealed roads
24
J00326 Community Satisfaction Survey 2015 – Mount Alexander Shire Council
Importance and Performance2015 Index Scores Grid
Note: The larger the circle, the larger the gap between importance and performance.Base: All respondents
Service Importance Performance
Consultation & engagement 79 52Lobbying on behalf of thecommunity 70 54
Making community decisions 82 48Informing the community 78 55Condition of local streets & footpaths 78 46
Enforcement of local laws 71 61Elderly support services 82 62Recreational facilities 71 59Appearance of public areas 73 69Community & cultural activities 61 72
Waste management 79 58Business & community development & tourism 68 60
Environmental sustainability 73 63
0
50
100
0 50 100
HIGH
IMPORTANCE
LOW
POOR PERFORMANCE GOOD

25
J00326 Community Satisfaction Survey 2015 – Mount Alexander Shire Council
Importance and Performance2015 Index Scores Grid
(Magnified view)
Note: The larger the circle, the larger the gap between importance and performance.Base: All respondents
40
90
40 90
HIGH
IMPORTANCE
LOW
POOR PERFORMANCE GOOD
Service Importance Performance
Consultation & engagement 79 52Lobbying on behalf of thecommunity 70 54
Making community decisions 82 48Informing the community 78 55Condition of local streets & footpaths 78 46
Enforcement of local laws 71 61Elderly support services 82 62Recreational facilities 71 59Appearance of public areas 73 69Community & cultural activities 61 72
Waste management 79 58Business & community development & tourism 68 60
Environmental sustainability 73 63


28
J00326 Community Satisfaction Survey 2015 – Mount Alexander Shire Council
2015 Overall Performance
Q3. ON BALANCE, for the last twelve months, how do you feel about the performance of Mount Alexander Shire Council, not just on one or two issues, BUT OVERALL across all responsibility areas? Has it been very good, good, average, poor or very poor? Base: All respondents Councils asked State-wide: 69 Councils asked group: 21Note: Please see page 5 for explanation about significant differences
61
60
n/a
50
50
53
55
52
57
53
52
60
58
n/a
53
52
52
55
50
51
50
50
60
56
n/a
48
49
46
n/a
n/a
44
43
40
2014 2013 2012
60
57
56
53
53
52
52
51
50
49
49
State-wide
18-34
Large Rural
Men
35-49
Mount Alexander
Castlemaine
Other
Women
50-64
65+

29
J00326 Community Satisfaction Survey 2015 – Mount Alexander Shire Council
Q3. ON BALANCE, for the last twelve months, how do you feel about the performance of Mount Alexander Shire Council, not just on one or two issues, BUT OVERALL across all responsibility areas? Has it been very good, good, average, poor or very poor? Base: All respondents Councils asked State-wide: 69 Councils asked group: 21
8
7
6
5
10
8
11
6
9
8
7
9
8
9
28
33
30
23
39
34
25
31
31
25
41
32
21
23
35
36
38
37
35
40
37
33
34
36
28
31
42
35
16
13
15
23
10
12
12
18
16
16
7
13
18
20
11
11
9
12
4
6
13
10
10
13
10
12
10
12
2
1
1
2
1
1
2
2
1
3
7
2
1
1
2015 Mount Alexander
2014 Mount Alexander
2013 Mount Alexander
2012 Mount Alexander
State-wide
Large Rural
Castlemaine
Other
Men
Women
18-34
35-49
50-64
65+
% Very Good Good Average Poor Very Poor Can't say
2015 Overall Performance


31
J00326 Community Satisfaction Survey 2015 – Mount Alexander Shire Council
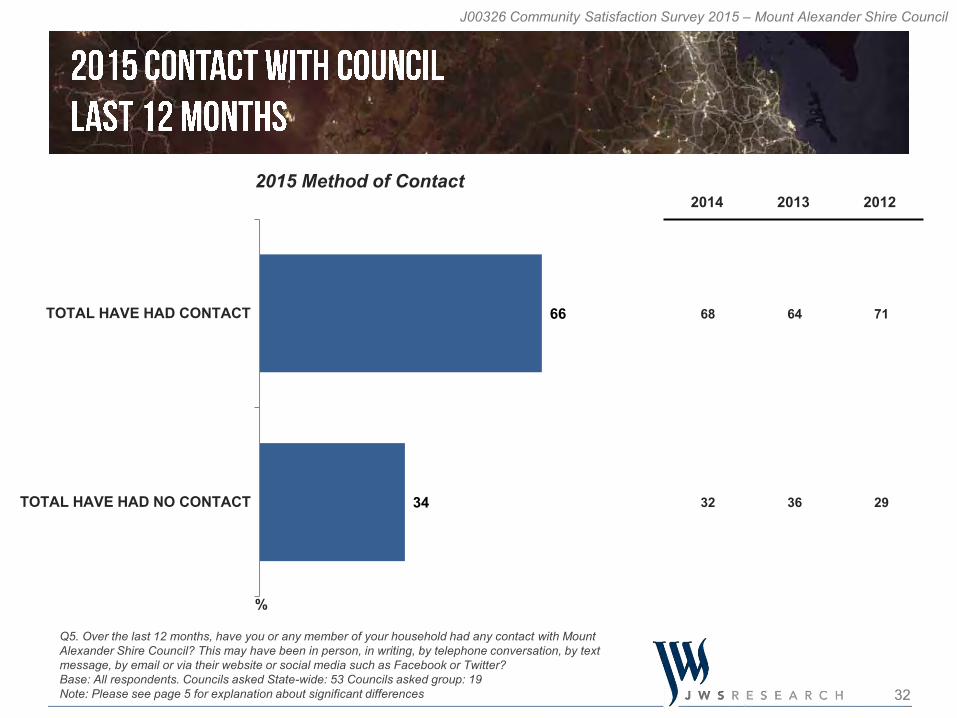
• 66%, down 2 points on 2014 Overall contact with
Mount Alexander Shire Council
• Aged 35-49 yearsMost contact with Mount Alexander Shire Council
• Aged 18-34 yearsLeast contact with Mount Alexander Shire Council
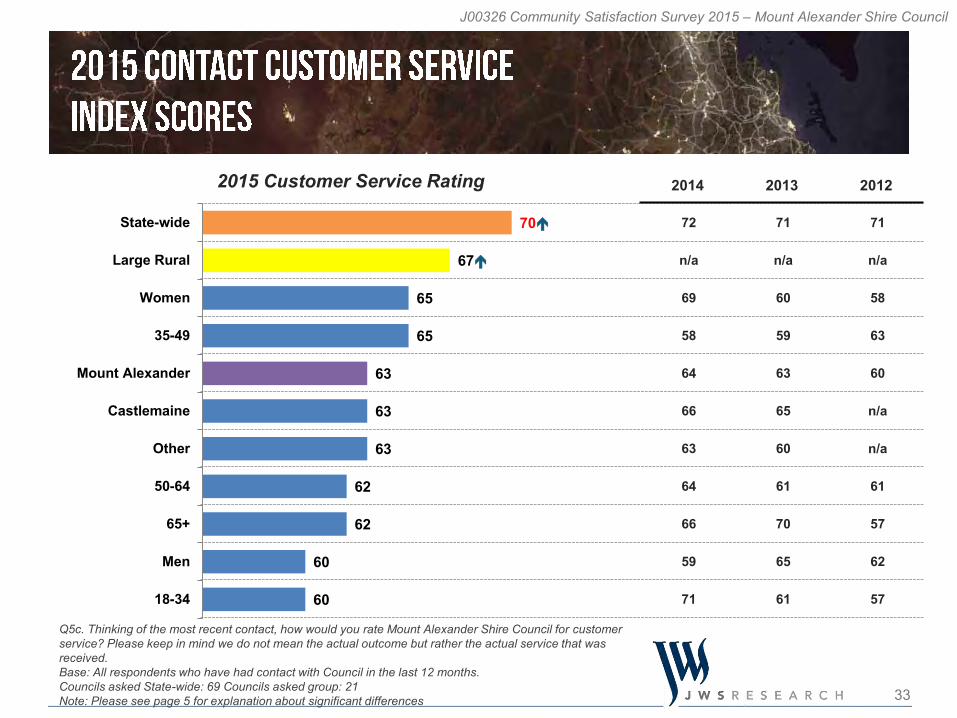
• Index score of 63, down 1 point on 2014 Customer Service rating
• Women• 35-49 year olds
Most satisfied with Customer Service
• Men• 18-34 year olds
Least satisfied with Customer Service
32
J00326 Community Satisfaction Survey 2015 – Mount Alexander Shire Council
68
32
64
36
71
29
66
34
TOTAL HAVE HAD CONTACT
TOTAL HAVE HAD NO CONTACT
2014 2013 2012
Q5. Over the last 12 months, have you or any member of your household had any contact with Mount Alexander Shire Council? This may have been in person, in writing, by telephone conversation, by text message, by email or via their website or social media such as Facebook or Twitter?Base: All respondents. Councils asked State-wide: 53 Councils asked group: 19Note: Please see page 5 for explanation about significant differences
2015 Method of Contact
%
33
J00326 Community Satisfaction Survey 2015 – Mount Alexander Shire Council
72
n/a
69
58
64
66
63
64
66
59
71
71
n/a
60
59
63
65
60
61
70
65
61
71
n/a
58
63
60
n/a
n/a
61
57
62
57
70
67
65
65
63
63
63
62
62
60
60
State-wide
Large Rural
Women
35-49
Mount Alexander
Castlemaine
Other
50-64
65+
Men
18-34
Q5c. Thinking of the most recent contact, how would you rate Mount Alexander Shire Council for customer service? Please keep in mind we do not mean the actual outcome but rather the actual service that was received. Base: All respondents who have had contact with Council in the last 12 months. Councils asked State-wide: 69 Councils asked group: 21Note: Please see page 5 for explanation about significant differences
2015 Customer Service Rating 2014 2013 2012

34
J00326 Community Satisfaction Survey 2015 – Mount Alexander Shire Council
22
30
29
19
31
27
23
20
20
24
22
17
24
24
33
31
27
36
37
37
36
31
30
37
22
45
31
31
23
15
19
23
17
18
17
28
26
21
28
23
23
22
10
14
13
11
8
9
9
11
10
10
14
8
10
11
9
10
11
11
6
7
12
6
10
8
7
6
11
10
3
1
1
2
1
2
3
4
1
7
2
1
3
2015 Mount Alexander
2014 Mount Alexander
2013 Mount Alexander
2012 Mount Alexander
State-wide
Large Rural
Castlemaine
Other
Men
Women
18-34
35-49
50-64
65+
% Very good Good Average Poor Very poor Can't sayQ5c. Thinking of the most recent contact, how would you rate Mount Alexander Shire Council for customer service? Please keep in mind we do not mean the actual outcome but rather the actual service that was received. Base: All respondents who have had contact with Council in the last 12 months. Councils asked State-wide: 69 Councils asked group: 21
2015 Customer Service Rating

36
J00326 Community Satisfaction Survey 2015 – Mount Alexander Shire Council
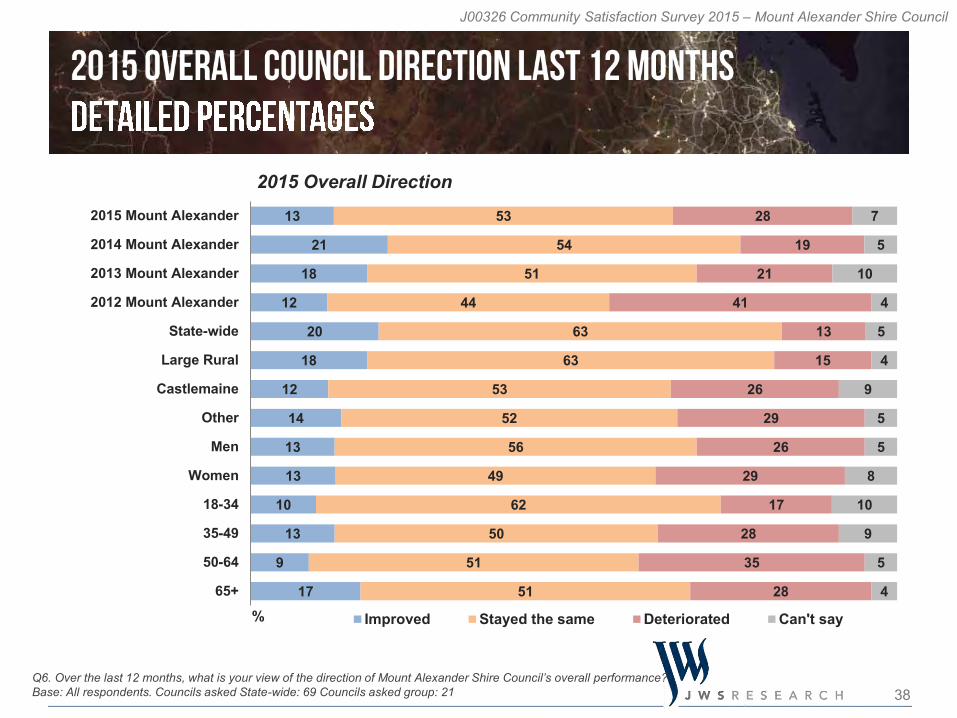
• 53% stayed about the same, down 1 point on 2014• 13% improved, down 8 points on 2014• 28% deteriorated, up 9 points on 2014
Council Direction over last 12 months
• Aged 18-34 years• Aged 65+ years
Most satisfied with Council Direction
• Aged 50-64 yearsLeast satisfied with Council Direction

37
J00326 Community Satisfaction Survey 2015 – Mount Alexander Shire Council
53
n/a
49
54
46
51
53
50
48
56
52
53
n/a
47
55
51
49
49
48
42
46
49
52
n/a
42
31
39
35
n/a
n/a
37
31
33
53
51
46
44
43
42
42
42
42
41
36
State-wide
Large Rural
18-34
65+
Men
Mount Alexander
Castlemaine
Other
35-49
Women
50-64
Q6. Over the last 12 months, what is your view of the direction of Mount Alexander Shire Council’s overall performance? Base: All respondents. Councils asked State-wide: 69 Councils asked group: 21Note: Please see page 5 for explanation about significant differences
2015 Overall Direction 2014 2013 2012
38
J00326 Community Satisfaction Survey 2015 – Mount Alexander Shire Council
13
21
18
12
20
18
12
14
13
13
10
13
9
17
53
54
51
44
63
63
53
52
56
49
62
50
51
51
28
19
21
41
13
15
26
29
26
29
17
28
35
28
7
5
10
4
5
4
9
5
5
8
10
9
5
4
2015 Mount Alexander
2014 Mount Alexander
2013 Mount Alexander
2012 Mount Alexander
State-wide
Large Rural
Castlemaine
Other
Men
Women
18-34
35-49
50-64
65+
% Improved Stayed the same Deteriorated Can't say
Q6. Over the last 12 months, what is your view of the direction of Mount Alexander Shire Council’s overall performance? Base: All respondents. Councils asked State-wide: 69 Councils asked group: 21
2015 Overall Direction

40
J00326 Community Satisfaction Survey 2015 – Mount Alexander Shire Council
83
81
80
81
79
76
79
78
n/a
80
74
82
82
79
79
79
76
81
76
n/a
75
73
n/a
n/a
n/a
n/a
n/a
n/a
n/a
n/a
n/a
n/a
73
83
82
79
79
79
79
78
76
75
75
74
50-64
Women
Mount Alexander
Castlemaine
Other
65+
35-49
Men
Large Rural
18-34
State-wide
Q1. Firstly, how important should ‘Community Consultation and Engagement’ be as a responsibility for Council?Base: All respondents. Councils asked State-wide: 28 Councils asked group: 8 Note: Please see slide 5 for explanation about significant differences
2014 2013 20122015 Consultation Importance
41
J00326 Community Satisfaction Survey 2015 – Mount Alexander Shire Council
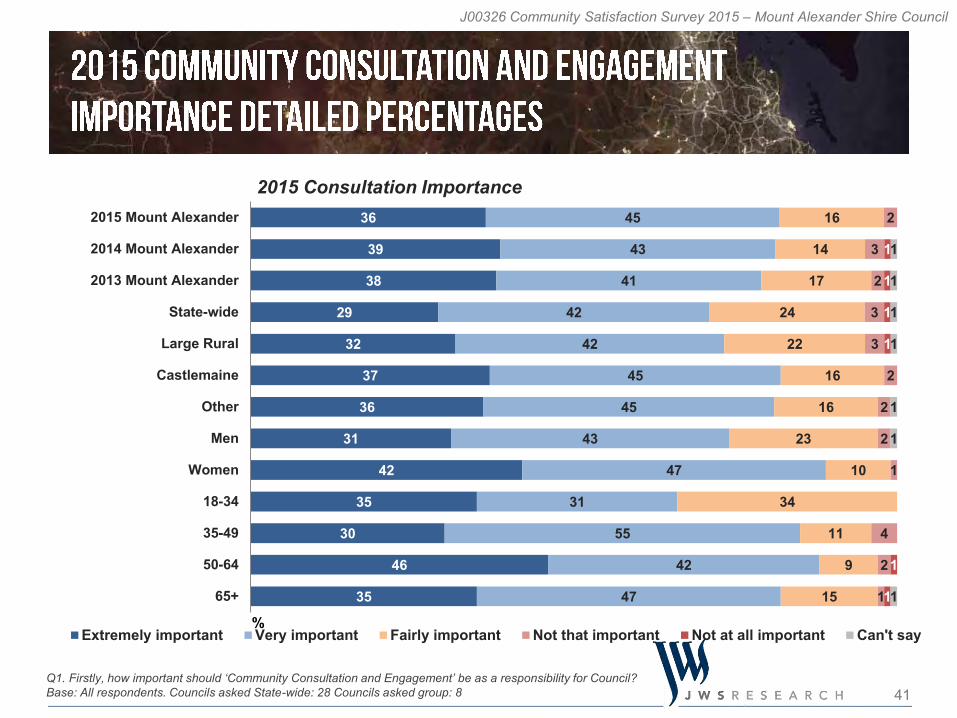
36
39
38
29
32
37
36
31
42
35
30
46
35
45
43
41
42
42
45
45
43
47
31
55
42
47
16
14
17
24
22
16
16
23
10
34
11
9
15
2
3
2
3
3
2
2
2
1
4
2
1
1
1
1
1
1
1
1
1
1
1
1
1
1
2015 Mount Alexander
2014 Mount Alexander
2013 Mount Alexander
State-wide
Large Rural
Castlemaine
Other
Men
Women
18-34
35-49
50-64
65+
%Extremely important Very important Fairly important Not that important Not at all important Can't say
Q1. Firstly, how important should ‘Community Consultation and Engagement’ be as a responsibility for Council?Base: All respondents. Councils asked State-wide: 28 Councils asked group: 8
2015 Consultation Importance

42
J00326 Community Satisfaction Survey 2015 – Mount Alexander Shire Council
50
57
59
n/a
56
51
52
54
52
48
51
53
57
57
n/a
53
51
51
51
50
49
46
52
57
53
n/a
45
n/a
45
n/a
37
45
41
57
56
55
54
54
53
52
52
52
51
47
35-49
State-wide
18-34
Large Rural
Women
Other
Mount Alexander
Castlemaine
65+
Men
50-64
Q2. How has Council performed on ‘Community Consultation and Engagement’ over the last 12 months?Base: All respondents. Councils asked State-wide: 69 Councils asked group: 21 Note: Please see slide 5 for explanation about significant differences
2015 Consultation Performance 2014 2013 2012
43
J00326 Community Satisfaction Survey 2015 – Mount Alexander Shire Council
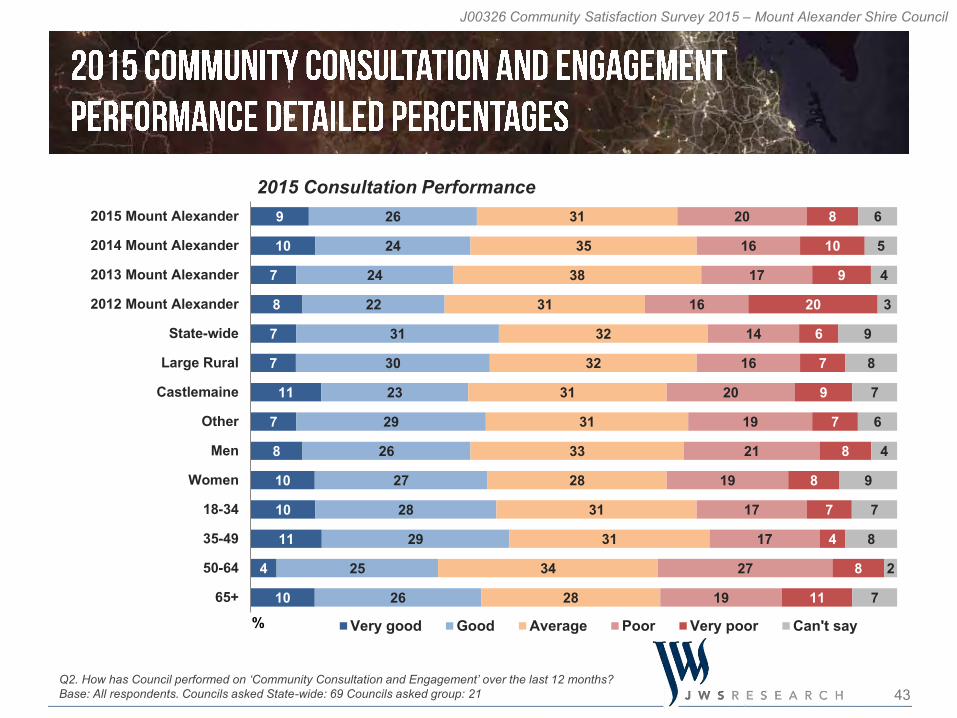
9
10
7
8
7
7
11
7
8
10
10
11
4
10
26
24
24
22
31
30
23
29
26
27
28
29
25
26
31
35
38
31
32
32
31
31
33
28
31
31
34
28
20
16
17
16
14
16
20
19
21
19
17
17
27
19
8
10
9
20
6
7
9
7
8
8
7
4
8
11
6
5
4
3
9
8
7
6
4
9
7
8
2
7
2015 Mount Alexander
2014 Mount Alexander
2013 Mount Alexander
2012 Mount Alexander
State-wide
Large Rural
Castlemaine
Other
Men
Women
18-34
35-49
50-64
65+
% Very good Good Average Poor Very poor Can't say
Q2. How has Council performed on ‘Community Consultation and Engagement’ over the last 12 months?Base: All respondents. Councils asked State-wide: 69 Councils asked group: 21
2015 Consultation Performance

44
J00326 Community Satisfaction Survey 2015 – Mount Alexander Shire Council
76
70
70
n/a
69
71
71
70
67
71
64
74
68
70
n/a
71
69
72
70
68
72
66
n/a
n/a
n/a
n/a
n/a
n/a
n/a
70
n/a
n/a
n/a
73
72
70
70
70
70
70
69
69
69
68
Women
65+
Mount Alexander
Large Rural
Castlemaine
Other
50-64
State-wide
18-34
35-49
Men
Q1. Firstly, how important should ‘Lobbying on Behalf of the Community’ be as a responsibility for Council?Base: All respondents. Councils asked State-wide: 28 Councils asked group: 7 Note: Please see slide 5 for explanation about significant differences
2014 2013 20122015 Lobbying Importance

45
J00326 Community Satisfaction Survey 2015 – Mount Alexander Shire Council
25
23
23
23
24
24
26
21
30
28
23
27
25
38
44
41
39
39
40
36
40
35
31
39
37
41
28
22
25
28
27
26
29
27
28
31
27
25
28
6
6
6
6
6
7
5
9
3
10
8
6
2
2
3
2
2
2
1
2
2
2
1
3
2
2
2
3
2
2
2
2
2
2
2
2
3
2015 Mount Alexander
2014 Mount Alexander
2013 Mount Alexander
State-wide
Large Rural
Castlemaine
Other
Men
Women
18-34
35-49
50-64
65+
%Extremely important Very important Fairly important Not that important Not at all important Can't say
Q1. Firstly, how important should ‘Lobbying on Behalf of the Community’ be as a responsibility for Council?Base: All respondents. Councils asked State-wide: 28 Councils asked group: 7
2015 Lobbying Importance

46
J00326 Community Satisfaction Survey 2015 – Mount Alexander Shire Council
56
56
53
55
50
52
n/a
51
55
51
52
58
55
55
59
54
54
n/a
52
57
57
53
59
55
47
n/a
49
40
n/a
n/a
46
52
42
57
55
54
54
54
54
53
53
53
53
52
18-34
State-wide
Mount Alexander
Castlemaine
Men
65+
Large Rural
Other
Women
35-49
50-64
Q2. How has Council performed on ‘Lobbying on Behalf of the Community’ over the last 12 months?Base: All respondents. Councils asked State-wide: 69 Councils asked group: 21 Note: Please see slide 5 for explanation about significant differences
2015 Lobbying Performance 2014 2013 2012

47
J00326 Community Satisfaction Survey 2015 – Mount Alexander Shire Council
6
7
14
6
6
5
8
5
9
4
3
3
7
10
23
23
23
26
26
24
21
25
22
25
35
23
17
22
27
34
29
29
32
34
29
26
27
27
21
29
32
26
14
14
13
17
12
14
14
15
15
14
7
14
18
15
5
7
10
15
4
5
6
5
6
5
7
3
4
7
23
15
11
6
20
18
23
23
21
25
28
28
21
19
2015 Mount Alexander
2014 Mount Alexander
2013 Mount Alexander
2012 Mount Alexander
State-wide
Large Rural
Castlemaine
Other
Men
Women
18-34
35-49
50-64
65+
% Very good Good Average Poor Very poor Can't say
Q2. How has Council performed on ‘Lobbying on Behalf of the Community’ over the last 12 months?Base: All respondents. Councils asked State-wide: 69 Councils asked group: 21
2015 Lobbying Performance

48
J00326 Community Satisfaction Survey 2015 – Mount Alexander Shire Council
82
87
80
83
85
82
85
82
77
79
n/a
n/a
n/a
n/a
n/a
n/a
n/a
n/a
n/a
n/a
n/a
n/a
n/a
n/a
n/a
n/a
n/a
n/a
n/a
n/a
n/a
n/a
n/a
84
84
83
83
83
82
82
81
81
80
80
Castlemaine
18-34
Men
35-49
50-64
Mount Alexander
Women
Other
65+
State-wide
Large Rural
Q1. Firstly, how important should ‘Decisions made in the interest of the community’ be as a responsibility for Council?Base: All respondents. Councils asked State-wide: 15 Councils asked group: 3 Note: Please see slide 5 for explanation about significant differences
2014 2013 20122015 Community Decisions Importance

49
J00326 Community Satisfaction Survey 2015 – Mount Alexander Shire Council
45
45
38
40
46
44
47
42
48
49
46
39
41
42
42
40
44
40
38
45
38
37
43
45
10
8
15
16
9
12
11
10
14
11
7
11
1
2
2
1
1
1
1
1
1
2
1
1
1
1
2
1
1
1
3
2
2
2
1
1
2
2
1
1
1
4
2015 Mount Alexander
2014 Mount Alexander
State-wide
Large Rural
Castlemaine
Other
Men
Women
18-34
35-49
50-64
65+
%Extremely important Very important Fairly important Not that important Not at all important Can't say
Q1. Firstly, how important should ‘Decisions made in the interest of the community’ be as a responsibility for Council?Base: All respondents. Councils asked State-wide: 15 Councils asked group: 3
2015 Community Decisions Importance

50
J00326 Community Satisfaction Survey 2015 – Mount Alexander Shire Council
57
n/a
51
49
51
45
49
53
48
51
47
n/a
n/a
n/a
n/a
n/a
n/a
n/a
n/a
n/a
n/a
n/a
n/a
n/a
n/a
n/a
n/a
n/a
n/a
n/a
n/a
n/a
n/a
55
52
52
52
50
49
48
48
47
47
44
State-wide
Large Rural
18-34
35-49
Castlemaine
Men
Mount Alexander
Women
Other
65+
50-64
Q2. How has Council performed on ‘Decisions made in the interest of the community’ over the last 12 months?Base: All respondents. Councils asked State-wide: 69 Councils asked group: 21 Note: Please see slide 5 for explanation about significant differences
2015 Community Decisions Performance 2014 2013 2012

51
J00326 Community Satisfaction Survey 2015 – Mount Alexander Shire Council
5
6
7
5
6
4
7
3
7
5
3
5
23
28
31
27
24
23
21
26
31
22
20
23
32
32
33
35
31
33
33
32
24
35
37
32
22
16
14
16
19
24
21
23
17
19
28
22
9
13
6
8
9
8
10
7
10
3
11
10
9
5
9
8
11
7
9
9
10
17
2
8
2015 Mount Alexander
2014 Mount Alexander
State-wide
Large Rural
Castlemaine
Other
Men
Women
18-34
35-49
50-64
65+
% Very good Good Average Poor Very poor Can't say
Q2. How has Council performed on ‘Decisions made in the interest of the community’ over the last 12 months?Base: All respondents. Councils asked State-wide: 69 Councils asked group: 21
2015 Community Decisions Performance

52
J00326 Community Satisfaction Survey 2015 – Mount Alexander Shire Council
55
56
56
49
53
56
50
50
n/a
56
50
n/a
n/a
n/a
n/a
n/a
n/a
n/a
n/a
n/a
n/a
n/a
n/a
n/a
n/a
n/a
n/a
n/a
n/a
n/a
n/a
n/a
n/a
55
53
53
50
48
47
47
46
45
45
44
State-wide
Castlemaine
18-34
Men
Mount Alexander
35-49
65+
50-64
Large Rural
Women
Other
Q2. How has Council performed on ‘The condition of sealed local roads in your area’ over the last 12 months?Base: All respondents. Councils asked State-wide: 69 Councils asked group: 21 Note: Please see slide 5 for explanation about significant differences
2015 Sealed Local Roads Performance 2014 2013 2012

53
J00326 Community Satisfaction Survey 2015 – Mount Alexander Shire Council
5
9
11
6
8
4
6
5
7
3
4
7
28
29
33
24
33
25
31
26
35
35
26
22
31
36
29
30
31
31
32
30
31
25
34
33
20
15
16
24
16
24
19
22
17
19
22
22
14
10
10
16
11
16
12
16
10
17
14
14
1
1
1
1
1
1
1
1
1
1
2
2015 Mount Alexander
2014 Mount Alexander
State-wide
Large Rural
Castlemaine
Other
Men
Women
18-34
35-49
50-64
65+
% Very good Good Average Poor Very poor Can't say
Q2. How has Council performed on ‘The condition of sealed local roads in your area’ over the last 12 months?Base: All respondents. Councils asked State-wide: 69 Councils asked group: 21
2015 Sealed Local Roads Performance

54
J00326 Community Satisfaction Survey 2015 – Mount Alexander Shire Council
83
79
81
75
78
78
n/a
79
75
78
74
85
79
81
78
80
79
n/a
82
75
80
75
n/a
n/a
n/a
n/a
n/a
n/a
n/a
n/a
75
n/a
n/a
81
80
79
79
78
77
76
76
75
75
74
Women
Other
50-64
65+
Mount Alexander
18-34
Large Rural
35-49
State-wide
Castlemaine
Men
Q1. Firstly, how important should ‘Informing the Community’ be as a responsibility for Council?Base: All respondents. Councils asked State-wide: 25 Councils asked group: 7 Note: Please see slide 5 for explanation about significant differences
2014 2013 20122015 Informing Community Importance

55
J00326 Community Satisfaction Survey 2015 – Mount Alexander Shire Council
35
37
41
30
32
31
39
29
41
41
33
37
33
44
42
39
44
45
44
45
45
44
35
42
45
51
17
18
15
22
19
21
14
21
13
17
24
16
14
1
2
2
3
3
2
1
2
1
3
1
2
2
1
1
1
1
1
2
3
3
2
2
1
1
2015 Mount Alexander
2014 Mount Alexander
2013 Mount Alexander
State-wide
Large Rural
Castlemaine
Other
Men
Women
18-34
35-49
50-64
65+
%Extremely important Very important Fairly important Not that important Not at all important Can't say
Q1. Firstly, how important should ‘Informing the Community’ be as a responsibility for Council?Base: All respondents. Councils asked State-wide: 25 Councils asked group: 7
2015 Informing Community Importance

56
J00326 Community Satisfaction Survey 2015 – Mount Alexander Shire Council
62
n/a
n/a
n/a
n/a
n/a
n/a
n/a
n/a
n/a
n/a
61
n/a
n/a
n/a
n/a
n/a
n/a
n/a
n/a
n/a
n/a
60
n/a
n/a
n/a
n/a
n/a
n/a
n/a
n/a
n/a
n/a
61
61
59
58
56
55
55
55
55
54
53
State-wide
18-34
Large Rural
Castlemaine
Men
Mount Alexander
Women
35-49
50-64
Other
65+
Q2. How has Council performed on ‘Informing the Community’ over the last 12 months?Base: All respondents. Councils asked State-wide: 35 Councils asked group: 9 Note: Please see slide 5 for explanation about significant differences
2015 Informing Community Performance 2014 2013 2012

57
J00326 Community Satisfaction Survey 2015 – Mount Alexander Shire Council
10
12
10
12
8
11
8
7
9
10
12
31
38
37
30
32
32
30
52
31
26
24
33
31
32
37
30
31
34
24
34
38
33
20
12
14
16
22
18
21
14
22
18
22
5
4
5
4
5
6
4
3
3
5
7
2
2
3
1
3
2
2
1
3
3
2015 Mount Alexander
State-wide
Large Rural
Castlemaine
Other
Men
Women
18-34
35-49
50-64
65+
% Very good Good Average Poor Very poor Can't say
Q2. How has Council performed on ‘Informing the Community’ over the last 12 months?Base: All respondents. Councils asked State-wide: 35 Councils asked group: 9
2015 Informing Community Performance

58
J00326 Community Satisfaction Survey 2015 – Mount Alexander Shire Council
81
82
78
78
78
79
77
n/a
78
75
75
78
80
78
77
76
75
78
n/a
78
75
74
n/a
n/a
n/a
n/a
n/a
n/a
77
n/a
n/a
n/a
n/a
80
79
79
78
78
78
77
77
77
75
75
Women
18-34
50-64
Mount Alexander
Other
65+
State-wide
Large Rural
Castlemaine
Men
35-49
Q1. Firstly, how important should ‘The condition of local streets and footpaths in your area’ be as a responsibility for Council?Base: All respondents. Councils asked State-wide: 29 Councils asked group: 9 Note: Please see slide 5 for explanation about significant differences
2014 2013 20122015 Streets and Footpaths Importance
59
J00326 Community Satisfaction Survey 2015 – Mount Alexander Shire Council
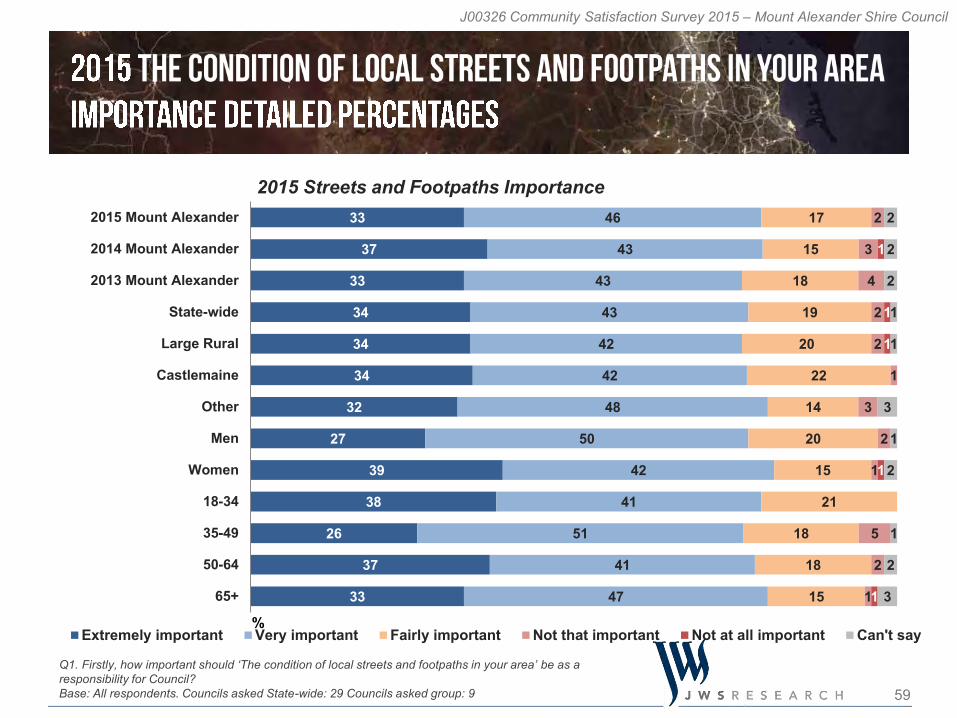
33
37
33
34
34
34
32
27
39
38
26
37
33
46
43
43
43
42
42
48
50
42
41
51
41
47
17
15
18
19
20
22
14
20
15
21
18
18
15
2
3
4
2
2
1
3
2
1
5
2
1
1
1
1
1
1
2
2
2
1
1
3
1
2
1
2
3
2015 Mount Alexander
2014 Mount Alexander
2013 Mount Alexander
State-wide
Large Rural
Castlemaine
Other
Men
Women
18-34
35-49
50-64
65+
%Extremely important Very important Fairly important Not that important Not at all important Can't say
Q1. Firstly, how important should ‘The condition of local streets and footpaths in your area’ be as a responsibility for Council?Base: All respondents. Councils asked State-wide: 29 Councils asked group: 9
2015 Streets and Footpaths Importance

60
J00326 Community Satisfaction Survey 2015 – Mount Alexander Shire Council
58
n/a
n/a
n/a
n/a
n/a
n/a
n/a
n/a
n/a
n/a
58
n/a
n/a
n/a
n/a
n/a
n/a
n/a
n/a
n/a
n/a
57
n/a
n/a
n/a
n/a
n/a
n/a
n/a
n/a
n/a
n/a
58
58
54
50
49
48
46
44
43
42
40
State-wide
18-34
Large Rural
35-49
Men
Castlemaine
Mount Alexander
Other
Women
50-64
65+
Q2. How has Council performed on ‘The condition of local streets and footpaths in your area’ over the last 12 months?Base: All respondents. Councils asked State-wide: 40 Councils asked group: 15 Note: Please see slide 5 for explanation about significant differences
2015 Streets and Footpaths Performance 2014 2013 2012

61
J00326 Community Satisfaction Survey 2015 – Mount Alexander Shire Council
7
13
11
9
5
7
6
14
6
2
7
23
34
31
24
23
27
19
35
27
22
16
28
28
28
30
26
28
27
21
30
30
28
24
15
18
18
28
21
27
24
24
25
24
14
7
9
17
12
12
16
3
8
17
22
4
3
4
1
7
3
5
3
6
4
3
2015 Mount Alexander
State-wide
Large Rural
Castlemaine
Other
Men
Women
18-34
35-49
50-64
65+
% Very good Good Average Poor Very poor Can't say
Q2. How has Council performed on ‘The condition of local streets and footpaths in your area’ over the last 12 months?Base: All respondents. Councils asked State-wide: 40 Councils asked group: 15
2015 Streets and Footpaths Performance

62
J00326 Community Satisfaction Survey 2015 – Mount Alexander Shire Council
n/a
n/a
n/a
n/a
70
n/a
n/a
n/a
n/a
n/a
n/a
n/a
n/a
n/a
n/a
71
n/a
n/a
n/a
n/a
n/a
n/a
n/a
n/a
n/a
n/a
70
n/a
n/a
n/a
n/a
n/a
n/a
74
73
72
71
71
71
70
70
69
68
67
Women
18-34
65+
Mount Alexander
State-wide
Other
Large Rural
Castlemaine
35-49
50-64
Men
Q1. Firstly, how important should ‘Enforcement of local laws’ be as a responsibility for Council?Base: All respondents. Councils asked State-wide: 25 Councils asked group: 7 Note: Please see slide 5 for explanation about significant differences
2014 2013 20122015 Law Enforcement Importance
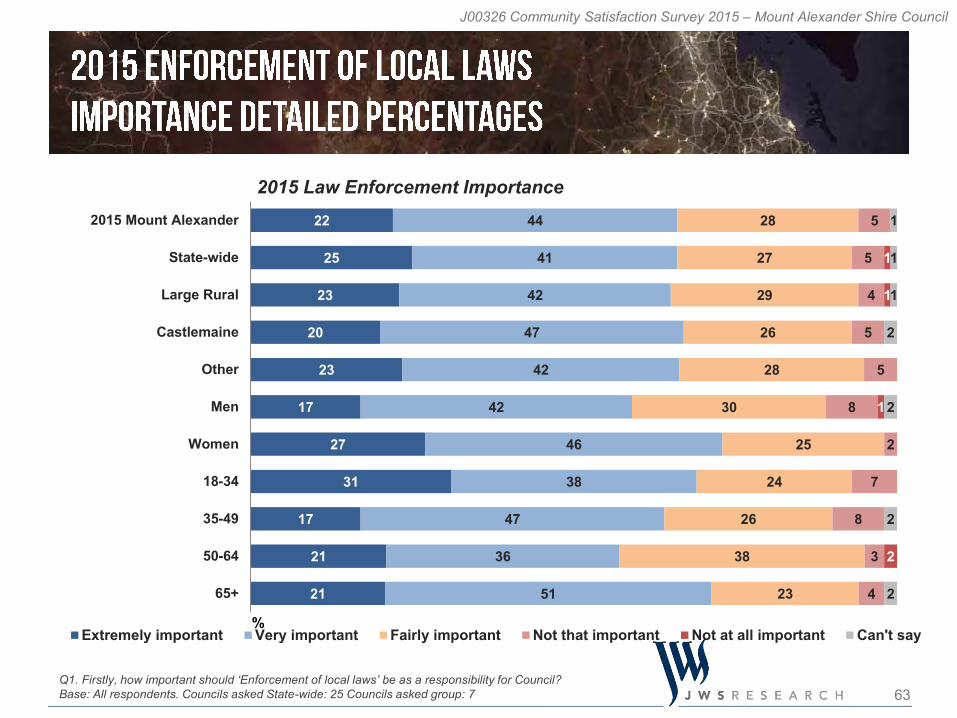
63
J00326 Community Satisfaction Survey 2015 – Mount Alexander Shire Council
22
25
23
20
23
17
27
31
17
21
21
44
41
42
47
42
42
46
38
47
36
51
28
27
29
26
28
30
25
24
26
38
23
5
5
4
5
5
8
2
7
8
3
4
1
1
1
2
1
1
1
2
2
2
2
2015 Mount Alexander
State-wide
Large Rural
Castlemaine
Other
Men
Women
18-34
35-49
50-64
65+
%Extremely important Very important Fairly important Not that important Not at all important Can't say
Q1. Firstly, how important should ‘Enforcement of local laws’ be as a responsibility for Council?Base: All respondents. Councils asked State-wide: 25 Councils asked group: 7
2015 Law Enforcement Importance

64
J00326 Community Satisfaction Survey 2015 – Mount Alexander Shire Council
n/a
66
n/a
n/a
n/a
n/a
n/a
n/a
n/a
n/a
n/a
n/a
65
n/a
n/a
n/a
n/a
n/a
n/a
n/a
n/a
n/a
n/a
65
n/a
n/a
n/a
n/a
n/a
n/a
n/a
n/a
n/a
67
66
65
64
62
62
61
61
60
59
58
18-34
State-wide
Large Rural
Women
Other
50-64
Mount Alexander
35-49
Castlemaine
Men
65+
Q2. How has Council performed on ‘Enforcement of local laws’ over the last 12 months?Base: All respondents. Councils asked State-wide: 36 Councils asked group: 12 Note: Please see slide 5 for explanation about significant differences
2015 Law Enforcement Performance 2014 2013 2012

65
J00326 Community Satisfaction Survey 2015 – Mount Alexander Shire Council
10
13
12
9
11
9
11
14
7
8
12
32
40
40
32
33
29
36
42
31
36
27
28
26
27
29
27
28
28
24
28
26
31
9
6
7
11
7
10
9
3
10
9
11
3
3
3
3
3
5
1
3
3
5
17
12
11
16
18
19
16
14
24
19
14
2015 Mount Alexander
State-wide
Large Rural
Castlemaine
Other
Men
Women
18-34
35-49
50-64
65+
% Very good Good Average Poor Very poor Can't say
Q2. How has Council performed on ‘Enforcement of local laws’ over the last 12 months?Base: All respondents. Councils asked State-wide: 36 Councils asked group: 12
2015 Law Enforcement Performance
66
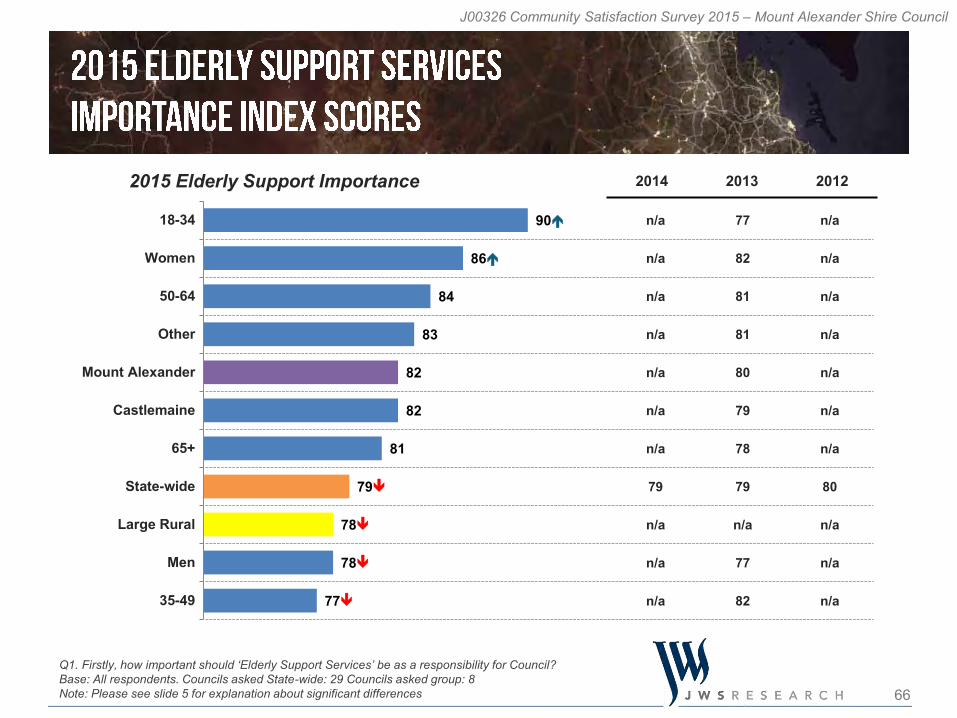
J00326 Community Satisfaction Survey 2015 – Mount Alexander Shire Council
n/a
n/a
n/a
n/a
n/a
n/a
n/a
79
n/a
n/a
n/a
77
82
81
81
80
79
78
79
n/a
77
82
n/a
n/a
n/a
n/a
n/a
n/a
n/a
80
n/a
n/a
n/a
90
86
84
83
82
82
81
79
78
78
77
18-34
Women
50-64
Other
Mount Alexander
Castlemaine
65+
State-wide
Large Rural
Men
35-49
Q1. Firstly, how important should ‘Elderly Support Services’ be as a responsibility for Council?Base: All respondents. Councils asked State-wide: 29 Councils asked group: 8 Note: Please see slide 5 for explanation about significant differences
2014 2013 20122015 Elderly Support Importance

67
J00326 Community Satisfaction Survey 2015 – Mount Alexander Shire Council
40
37
36
35
38
42
30
51
59
27
45
38
48
46
44
46
51
46
54
43
41
54
46
50
9
12
16
16
10
8
12
5
15
7
10
1
3
2
2
1
2
2
1
1
1
1
1
2
1
1
1
2
2
1
3
2
1
2015 Mount Alexander
2013 Mount Alexander
State-wide
Large Rural
Castlemaine
Other
Men
Women
18-34
35-49
50-64
65+
%Extremely important Very important Fairly important Not that important Not at all important Can't say
Q1. Firstly, how important should ‘Elderly Support Services’ be as a responsibility for Council?Base: All respondents. Councils asked State-wide: 29 Councils asked group: 8
2015 Elderly Support Importance

68
J00326 Community Satisfaction Survey 2015 – Mount Alexander Shire Council
70
n/a
n/a
n/a
n/a
n/a
n/a
n/a
n/a
n/a
n/a
69
n/a
n/a
n/a
n/a
n/a
n/a
n/a
n/a
n/a
n/a
69
n/a
n/a
n/a
n/a
n/a
n/a
n/a
n/a
n/a
n/a
69
69
68
64
62
62
62
61
59
58
58
State-wide
Large Rural
65+
Castlemaine
Mount Alexander
Men
Women
Other
50-64
18-34
35-49
Q2. How has Council performed on ‘Elderly Support Services’ over the last 12 months?Base: All respondents. Councils asked State-wide: 40 Councils asked group: 13 Note: Please see slide 5 for explanation about significant differences
2015 Elderly Support Performance 2014 2013 2012
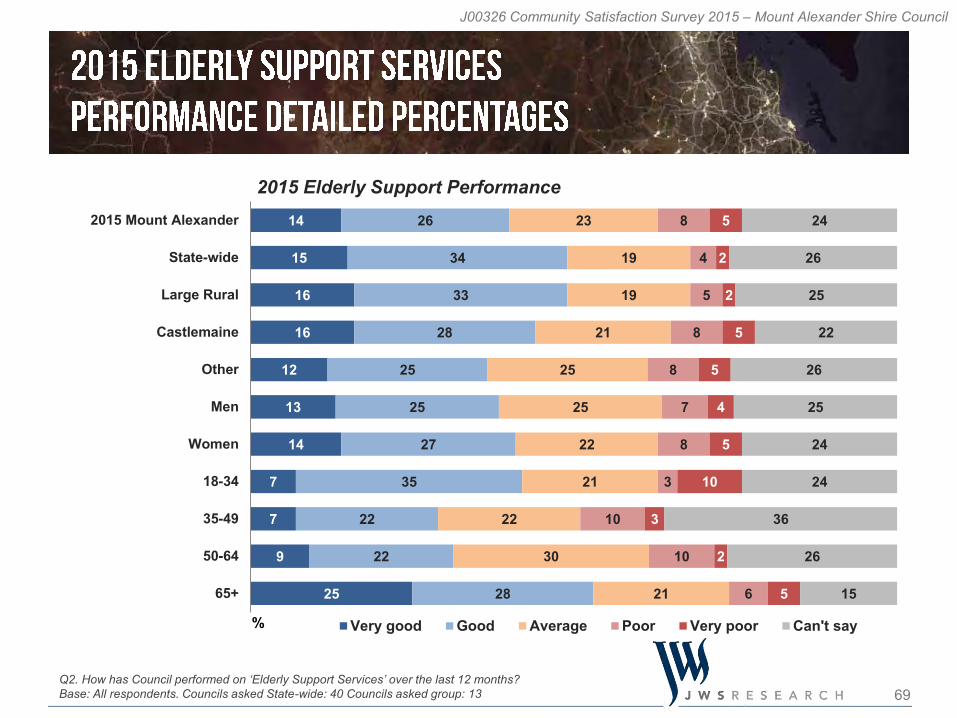
69
J00326 Community Satisfaction Survey 2015 – Mount Alexander Shire Council
14
15
16
16
12
13
14
7
7
9
25
26
34
33
28
25
25
27
35
22
22
28
23
19
19
21
25
25
22
21
22
30
21
8
4
5
8
8
7
8
3
10
10
6
5
2
2
5
5
4
5
10
3
2
5
24
26
25
22
26
25
24
24
36
26
15
2015 Mount Alexander
State-wide
Large Rural
Castlemaine
Other
Men
Women
18-34
35-49
50-64
65+
% Very good Good Average Poor Very poor Can't say
Q2. How has Council performed on ‘Elderly Support Services’ over the last 12 months?Base: All respondents. Councils asked State-wide: 40 Councils asked group: 13
2015 Elderly Support Performance

70
J00326 Community Satisfaction Survey 2015 – Mount Alexander Shire Council
76
76
73
74
72
n/a
73
74
73
70
70
n/a
n/a
n/a
n/a
72
n/a
n/a
n/a
n/a
n/a
n/a
n/a
n/a
n/a
n/a
72
n/a
n/a
n/a
n/a
n/a
n/a
75
74
73
73
72
72
71
71
70
68
67
Women
18-34
Castlemaine
50-64
State-wide
Large Rural
Mount Alexander
35-49
Other
65+
Men
Q1. Firstly, how important should ‘Recreational Facilities’ be as a responsibility for Council?Base: All respondents. Councils asked State-wide: 33 Councils asked group: 10 Note: Please see slide 5 for explanation about significant differences
2014 2013 20122015 Recreational Facilities Importance

71
J00326 Community Satisfaction Survey 2015 – Mount Alexander Shire Council
20
26
23
22
20
19
13
27
31
18
23
12
49
44
46
48
54
45
51
47
38
57
43
52
27
24
26
25
22
31
30
25
28
17
31
31
4
4
3
4
3
4
6
1
3
8
1
3
1
1
1
1
1
1
1
1
1
1
2015 Mount Alexander
2014 Mount Alexander
State-wide
Large Rural
Castlemaine
Other
Men
Women
18-34
35-49
50-64
65+
%Extremely important Very important Fairly important Not that important Not at all important Can't say
Q1. Firstly, how important should ‘Recreational Facilities’ be as a responsibility for Council?Base: All respondents. Councils asked State-wide: 33 Councils asked group: 10
2015 Recreational Facilities Importance
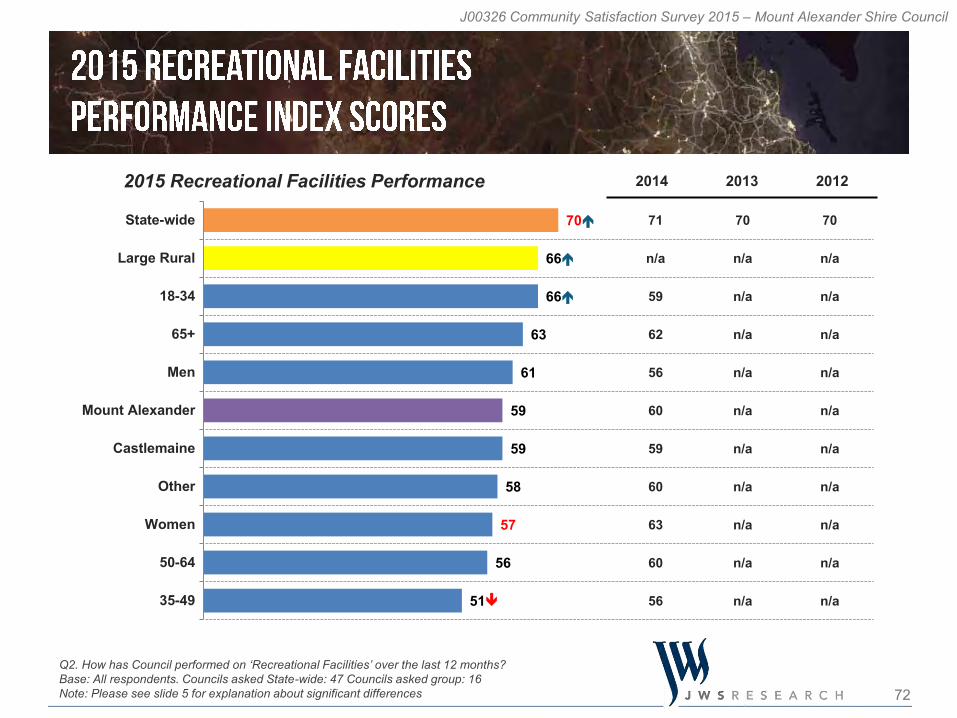
72
J00326 Community Satisfaction Survey 2015 – Mount Alexander Shire Council
71
n/a
59
62
56
60
59
60
63
60
56
70
n/a
n/a
n/a
n/a
n/a
n/a
n/a
n/a
n/a
n/a
70
n/a
n/a
n/a
n/a
n/a
n/a
n/a
n/a
n/a
n/a
70
66
66
63
61
59
59
58
57
56
51
State-wide
Large Rural
18-34
65+
Men
Mount Alexander
Castlemaine
Other
Women
50-64
35-49
Q2. How has Council performed on ‘Recreational Facilities’ over the last 12 months?Base: All respondents. Councils asked State-wide: 47 Councils asked group: 16 Note: Please see slide 5 for explanation about significant differences
2015 Recreational Facilities Performance 2014 2013 2012

73
J00326 Community Satisfaction Survey 2015 – Mount Alexander Shire Council
12
14
22
18
12
13
12
12
21
4
11
15
32
32
43
41
33
32
36
29
31
34
30
33
32
33
23
25
36
29
34
31
31
29
33
35
13
9
6
8
10
16
11
16
7
20
17
9
5
7
2
3
5
5
4
6
3
9
6
2
5
6
3
3
3
6
3
7
7
4
3
6
2015 Mount Alexander
2014 Mount Alexander
State-wide
Large Rural
Castlemaine
Other
Men
Women
18-34
35-49
50-64
65+
% Very good Good Average Poor Very poor Can't say
Q2. How has Council performed on ‘Recreational Facilities’ over the last 12 months?Base: All respondents. Councils asked State-wide: 47 Councils asked group: 16
2015 Recreational Facilities Performance

74
J00326 Community Satisfaction Survey 2015 – Mount Alexander Shire Council
74
76
74
74
73
n/a
75
74
72
70
81
73
75
74
73
74
n/a
71
74
71
72
71
n/a
n/a
n/a
n/a
73
n/a
n/a
n/a
n/a
n/a
n/a
77
75
74
73
73
73
73
73
72
72
70
50-64
Women
Castlemaine
Mount Alexander
State-wide
Large Rural
Other
65+
Men
35-49
18-34
Q1. Firstly, how important should ‘The appearance of public areas’ be as a responsibility for Council?Base: All respondents. Councils asked State-wide: 30 Councils asked group: 8 Note: Please see slide 5 for explanation about significant differences
2014 2013 20122015 Public Areas Importance
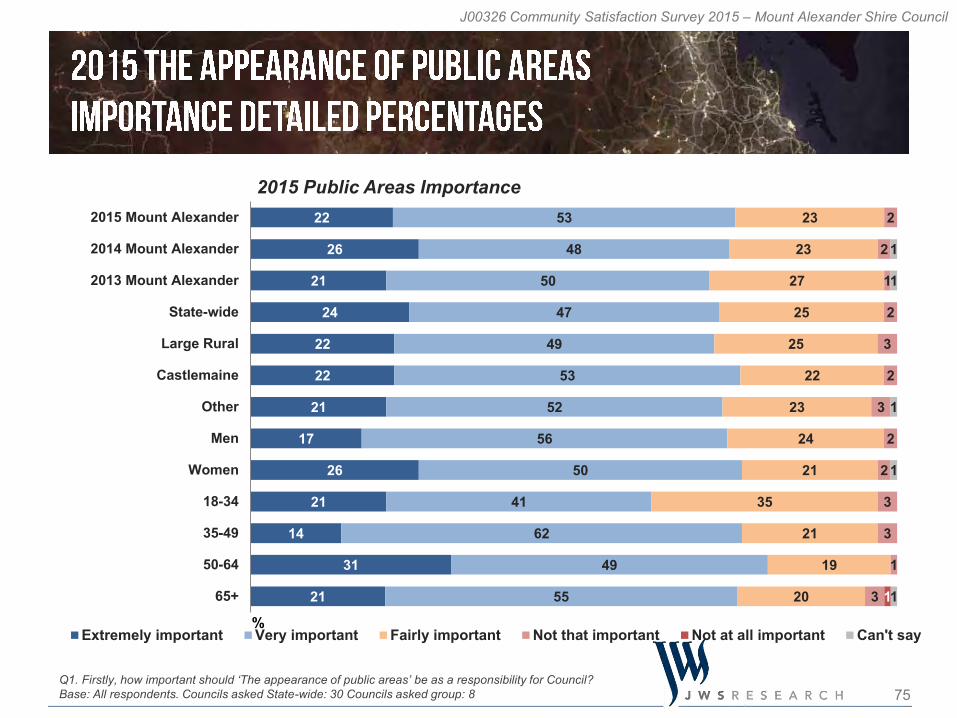
75
J00326 Community Satisfaction Survey 2015 – Mount Alexander Shire Council
22
26
21
24
22
22
21
17
26
21
14
31
21
53
48
50
47
49
53
52
56
50
41
62
49
55
23
23
27
25
25
22
23
24
21
35
21
19
20
2
2
1
2
3
2
3
2
2
3
3
1
3 1
1
1
1
1
1
2015 Mount Alexander
2014 Mount Alexander
2013 Mount Alexander
State-wide
Large Rural
Castlemaine
Other
Men
Women
18-34
35-49
50-64
65+
%Extremely important Very important Fairly important Not that important Not at all important Can't say
Q1. Firstly, how important should ‘The appearance of public areas’ be as a responsibility for Council?Base: All respondents. Councils asked State-wide: 30 Councils asked group: 8
2015 Public Areas Importance

76
J00326 Community Satisfaction Survey 2015 – Mount Alexander Shire Council
n/a
72
n/a
n/a
n/a
n/a
n/a
n/a
n/a
n/a
n/a
n/a
71
n/a
n/a
n/a
n/a
n/a
n/a
n/a
n/a
n/a
n/a
71
n/a
n/a
n/a
n/a
n/a
n/a
n/a
n/a
n/a
76
72
70
70
70
69
69
69
69
67
67
18-34
State-wide
Other
Men
35-49
Mount Alexander
Large Rural
Castlemaine
Women
50-64
65+
Q2. How has Council performed on ‘The appearance of public areas’ over the last 12 months?Base: All respondents. Councils asked State-wide: 42 Councils asked group: 12 Note: Please see slide 5 for explanation about significant differences
2015 Public Areas Performance 2014 2013 2012

77
J00326 Community Satisfaction Survey 2015 – Mount Alexander Shire Council
21
24
21
22
20
21
20
31
19
17
20
46
47
46
44
48
45
47
52
49
44
43
25
20
23
24
25
26
23
10
26
32
26
5
5
6
5
5
4
6
3
5
4
7
3
2
3
4
2
2
4
3
1
3
4
1
1
1
2015 Mount Alexander
State-wide
Large Rural
Castlemaine
Other
Men
Women
18-34
35-49
50-64
65+
% Very good Good Average Poor Very poor Can't say
Q2. How has Council performed on ‘The appearance of public areas’ over the last 12 months?Base: All respondents. Councils asked State-wide: 42 Councils asked group: 12
2015 Public Areas Performance

78
J00326 Community Satisfaction Survey 2015 – Mount Alexander Shire Council
n/a
n/a
62
n/a
n/a
n/a
n/a
n/a
n/a
n/a
n/a
n/a
n/a
62
n/a
n/a
n/a
n/a
n/a
n/a
n/a
n/a
n/a
n/a
62
n/a
n/a
n/a
n/a
n/a
n/a
n/a
n/a
64
63
62
61
61
61
61
61
61
58
57
Women
50-64
State-wide
Mount Alexander
Large Rural
Castlemaine
Other
35-49
65+
18-34
Men
Q1. Firstly, how important should ‘Community and Cultural Activities’ be as a responsibility for Council?Base: All respondents. Councils asked State-wide: 22 Councils asked group: 6 Note: Please see slide 5 for explanation about significant differences
2014 2013 20122015 Community Activities Importance

79
J00326 Community Satisfaction Survey 2015 – Mount Alexander Shire Council
10
11
10
8
10
8
11
10
9
11
9
41
37
38
42
40
38
43
31
39
42
46
36
40
39
39
35
36
37
41
43
36
29
8
10
10
5
9
11
5
7
5
8
10
5
2
2
5
5
7
2
7
5
3
6
1
1
2
3
1
2015 Mount Alexander
State-wide
Large Rural
Castlemaine
Other
Men
Women
18-34
35-49
50-64
65+
%Extremely important Very important Fairly important Not that important Not at all important Can't say
Q1. Firstly, how important should ‘Community and Cultural Activities’ be as a responsibility for Council?Base: All respondents. Councils asked State-wide: 22 Councils asked group: 6
2015 Community Activities Importance

80
J00326 Community Satisfaction Survey 2015 – Mount Alexander Shire Council
n/a
n/a
n/a
n/a
n/a
n/a
n/a
n/a
n/a
70
n/a
n/a
n/a
n/a
n/a
n/a
n/a
n/a
n/a
n/a
69
n/a
n/a
n/a
n/a
n/a
n/a
n/a
n/a
n/a
n/a
68
n/a
75
74
72
72
72
72
71
70
70
69
69
18-34
Women
Mount Alexander
Castlemaine
35-49
50-64
Other
Men
65+
State-wide
Large Rural
Q2. How has Council performed on ‘Community and Cultural Activities’ over the last 12 months?Base: All respondents. Councils asked State-wide: 28 Councils asked group: 9 Note: Please see slide 5 for explanation about significant differences
2015 Community Activities Performance 2014 2013 2012

81
J00326 Community Satisfaction Survey 2015 – Mount Alexander Shire Council
24
18
16
26
23
21
27
35
19
25
21
43
43
46
40
46
43
43
35
49
44
43
22
25
24
24
21
24
20
21
23
20
24
5
5
5
5
5
5
5
7
3
4
6
2
1
2
1
2
2
1
3
2
5
7
6
5
4
4
5
3
7
3
5
2015 Mount Alexander
State-wide
Large Rural
Castlemaine
Other
Men
Women
18-34
35-49
50-64
65+
% Very good Good Average Poor Very poor Can't say
Q2. How has Council performed on ‘Community and Cultural Activities’ over the last 12 months?Base: All respondents. Councils asked State-wide: 28 Councils asked group: 9
2015 Community Activities Performance

82
J00326 Community Satisfaction Survey 2015 – Mount Alexander Shire Council
83
79
80
82
80
79
78
n/a
81
83
77
80
78
78
81
79
79
76
n/a
79
74
80
n/a
n/a
n/a
n/a
n/a
78
n/a
n/a
n/a
n/a
n/a
83
81
81
80
79
79
79
78
78
76
76
50-64
Castlemaine
65+
Women
Mount Alexander
State-wide
Men
Large Rural
Other
18-34
35-49
Q1. Firstly, how important should ‘Waste Management’ be as a responsibility for Council?Base: All respondents. Councils asked State-wide: 33 Councils asked group: 9 Note: Please see slide 5 for explanation about significant differences
2014 2013 20122015 Waste Management Importance

83
J00326 Community Satisfaction Survey 2015 – Mount Alexander Shire Council
34
39
34
35
33
38
32
32
36
31
28
42
35
49
45
47
46
47
49
49
51
47
41
51
47
53
15
11
15
16
17
13
17
16
15
27
20
8
11
1
3
2
1
1
1
1
1
1
1
1
1
1
2
1
1
1
1
1
2015 Mount Alexander
2014 Mount Alexander
2013 Mount Alexander
State-wide
Large Rural
Castlemaine
Other
Men
Women
18-34
35-49
50-64
65+
%Extremely important Very important Fairly important Not that important Not at all important Can't say
Q1. Firstly, how important should ‘Waste Management’ be as a responsibility for Council?Base: All respondents. Councils asked State-wide: 33 Councils asked group: 9
2015 Waste Management Importance

84
J00326 Community Satisfaction Survey 2015 – Mount Alexander Shire Council
73
n/a
n/a
n/a
n/a
n/a
n/a
n/a
n/a
n/a
n/a
71
n/a
n/a
n/a
n/a
n/a
n/a
n/a
n/a
n/a
n/a
72
n/a
n/a
n/a
n/a
n/a
n/a
n/a
n/a
n/a
n/a
72
71
68
60
59
59
58
58
58
54
53
State-wide
18-34
Large Rural
Castlemaine
Men
65+
Mount Alexander
Other
Women
35-49
50-64
Q2. How has Council performed on ‘Waste Management’ over the last 12 months?Base: All respondents. Councils asked State-wide: 45 Councils asked group: 14 Note: Please see slide 5 for explanation about significant differences
2015 Waste Management Performance 2014 2013 2012

85
J00326 Community Satisfaction Survey 2015 – Mount Alexander Shire Council
15
25
21
17
13
18
12
27
8
10
17
35
47
44
34
36
33
38
52
29
30
34
23
17
19
23
23
22
24
3
35
28
22
14
6
8
11
16
14
14
3
19
15
15
9
3
5
10
8
10
8
10
6
12
9
3
2
3
4
3
2
4
3
3
5
2
2015 Mount Alexander
State-wide
Large Rural
Castlemaine
Other
Men
Women
18-34
35-49
50-64
65+
% Very good Good Average Poor Very poor Can't say
Q2. How has Council performed on ‘Waste Management’ over the last 12 months?Base: All respondents. Councils asked State-wide: 45 Councils asked group: 14
2015 Waste Management Performance

86
J00326 Community Satisfaction Survey 2015 – Mount Alexander Shire Council
n/a
n/a
n/a
n/a
n/a
n/a
n/a
67
n/a
n/a
n/a
n/a
n/a
n/a
n/a
n/a
n/a
n/a
67
n/a
n/a
n/a
n/a
n/a
n/a
n/a
n/a
n/a
n/a
66
n/a
n/a
n/a
72
70
69
69
68
68
68
67
67
67
66
50-64
Large Rural
Castlemaine
Women
Mount Alexander
Other
35-49
State-wide
Men
65+
18-34
Q1. Firstly, how important should ‘Business and community development and tourism’ be as a responsibility for Council?Base: All respondents. Councils asked State-wide: 23 Councils asked group: 6 Note: Please see slide 5 for explanation about significant differences
2014 2013 20122015 Business/Development/Tourism Importance
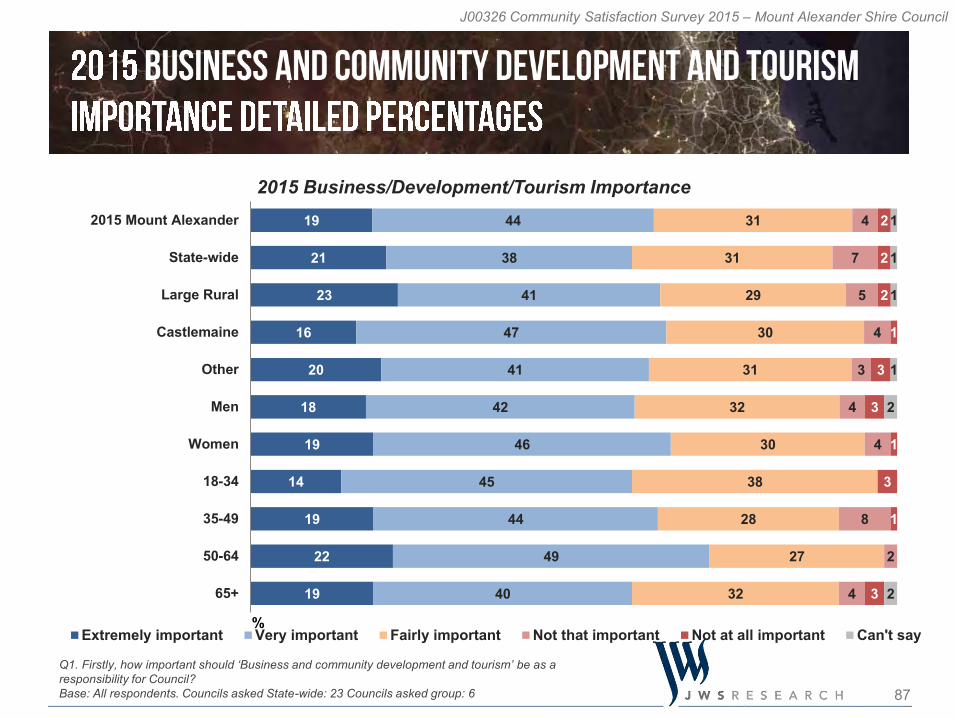
87
J00326 Community Satisfaction Survey 2015 – Mount Alexander Shire Council
19
21
23
16
20
18
19
14
19
22
19
44
38
41
47
41
42
46
45
44
49
40
31
31
29
30
31
32
30
38
28
27
32
4
7
5
4
3
4
4
8
2
4
2
2
2
1
3
3
1
3
1
3
1
1
1
1
2
2
2015 Mount Alexander
State-wide
Large Rural
Castlemaine
Other
Men
Women
18-34
35-49
50-64
65+
%Extremely important Very important Fairly important Not that important Not at all important Can't say
Q1. Firstly, how important should ‘Business and community development and tourism’ be as a responsibility for Council?Base: All respondents. Councils asked State-wide: 23 Councils asked group: 6
2015 Business/Development/Tourism Importance

88
J00326 Community Satisfaction Survey 2015 – Mount Alexander Shire Council
n/a
62
n/a
n/a
n/a
n/a
n/a
n/a
n/a
n/a
n/a
n/a
62
n/a
n/a
n/a
n/a
n/a
n/a
n/a
n/a
n/a
n/a
62
n/a
n/a
n/a
n/a
n/a
n/a
n/a
n/a
n/a
69
61
61
60
60
60
60
59
59
57
56
18-34
State-wide
Castlemaine
Mount Alexander
Men
Women
65+
Large Rural
Other
50-64
35-49
Q2. How has Council performed on ‘Business and community development and tourism’ over the last 12 months?Base: All respondents. Councils asked State-wide: 30 Councils asked group: 10 Note: Please see slide 5 for explanation about significant differences
2015 Business/Development/Tourism Performance 2014 2013 2012

89
J00326 Community Satisfaction Survey 2015 – Mount Alexander Shire Council
10
11
11
14
7
12
8
10
6
9
14
33
34
34
33
34
31
36
55
26
31
28
32
31
30
27
36
34
31
14
41
34
34
9
10
12
8
9
10
8
3
9
13
9
5
3
5
6
3
4
5
3
4
6
5
11
12
8
11
11
9
13
14
14
7
9
2015 Mount Alexander
State-wide
Large Rural
Castlemaine
Other
Men
Women
18-34
35-49
50-64
65+
% Very good Good Average Poor Very poor Can't say
Q2. How has Council performed on ‘Business and community development and tourism’ over the last 12 months?Base: All respondents. Councils asked State-wide: 30 Councils asked group: 10
2015 Business/Development/Tourism Performance
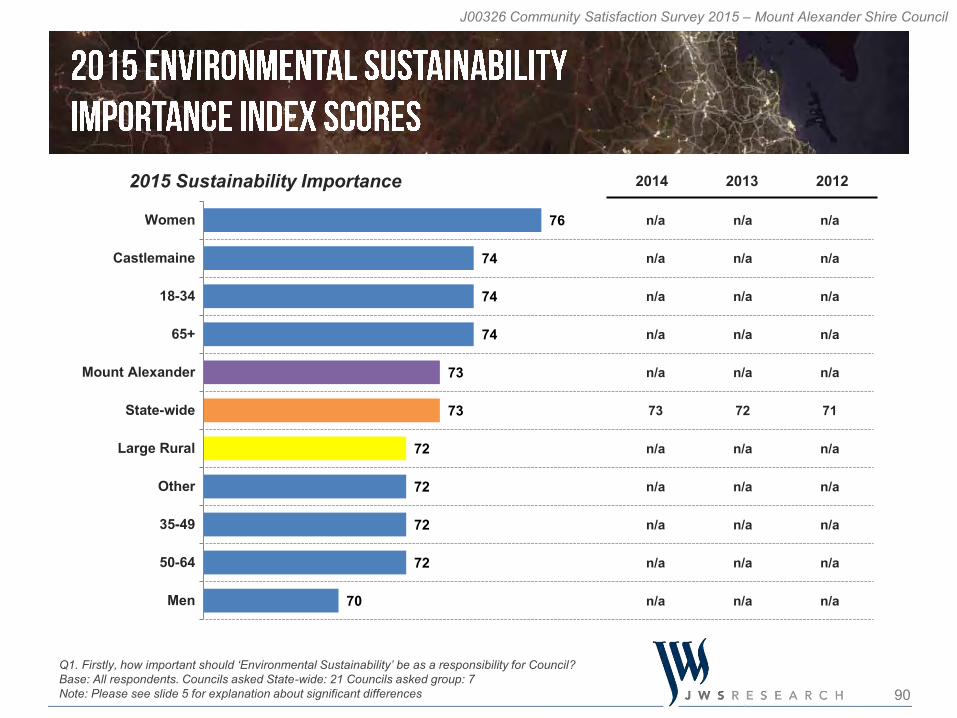
90
J00326 Community Satisfaction Survey 2015 – Mount Alexander Shire Council
n/a
n/a
n/a
n/a
n/a
73
n/a
n/a
n/a
n/a
n/a
n/a
n/a
n/a
n/a
n/a
72
n/a
n/a
n/a
n/a
n/a
n/a
n/a
n/a
n/a
n/a
71
n/a
n/a
n/a
n/a
n/a
76
74
74
74
73
73
72
72
72
72
70
Women
Castlemaine
18-34
65+
Mount Alexander
State-wide
Large Rural
Other
35-49
50-64
Men
Q1. Firstly, how important should ‘Environmental Sustainability’ be as a responsibility for Council?Base: All respondents. Councils asked State-wide: 21 Councils asked group: 7 Note: Please see slide 5 for explanation about significant differences
2014 2013 20122015 Sustainability Importance

91
J00326 Community Satisfaction Survey 2015 – Mount Alexander Shire Council
32
29
27
33
31
27
36
38
26
29
34
38
41
40
37
39
39
38
31
45
41
36
22
23
26
23
20
24
19
24
20
22
21
6
5
5
4
7
7
5
3
9
7
5
2
1
2
2
2
2
1
3
2
3
1
1
1
1
2015 Mount Alexander
State-wide
Large Rural
Castlemaine
Other
Men
Women
18-34
35-49
50-64
65+
%Extremely important Very important Fairly important Not that important Not at all important Can't say
Q1. Firstly, how important should ‘Environmental Sustainability’ be as a responsibility for Council?Base: All respondents. Councils asked State-wide: 21 Councils asked group: 7
2015 Sustainability Importance
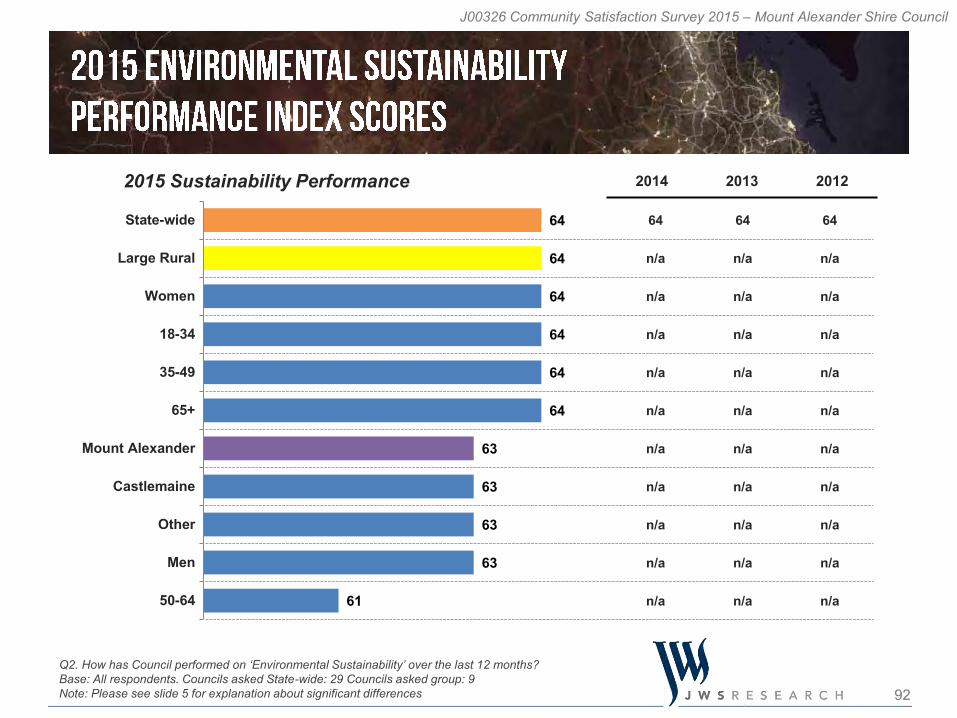
92
J00326 Community Satisfaction Survey 2015 – Mount Alexander Shire Council
64
n/a
n/a
n/a
n/a
n/a
n/a
n/a
n/a
n/a
n/a
64
n/a
n/a
n/a
n/a
n/a
n/a
n/a
n/a
n/a
n/a
64
n/a
n/a
n/a
n/a
n/a
n/a
n/a
n/a
n/a
n/a
64
64
64
64
64
64
63
63
63
63
61
State-wide
Large Rural
Women
18-34
35-49
65+
Mount Alexander
Castlemaine
Other
Men
50-64
Q2. How has Council performed on ‘Environmental Sustainability’ over the last 12 months?Base: All respondents. Councils asked State-wide: 29 Councils asked group: 9 Note: Please see slide 5 for explanation about significant differences
2015 Sustainability Performance 2014 2013 2012
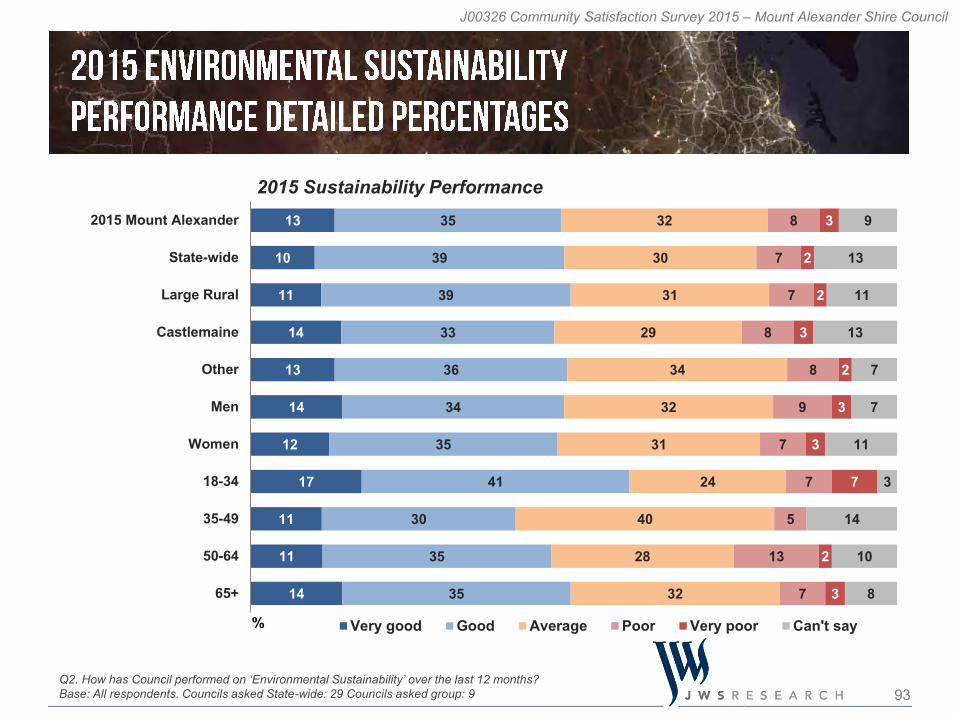
93
J00326 Community Satisfaction Survey 2015 – Mount Alexander Shire Council
13
10
11
14
13
14
12
17
11
11
14
35
39
39
33
36
34
35
41
30
35
35
32
30
31
29
34
32
31
24
40
28
32
8
7
7
8
8
9
7
7
5
13
7
3
2
2
3
2
3
3
7
2
3
9
13
11
13
7
7
11
3
14
10
8
2015 Mount Alexander
State-wide
Large Rural
Castlemaine
Other
Men
Women
18-34
35-49
50-64
65+
% Very good Good Average Poor Very poor Can't say
Q2. How has Council performed on ‘Environmental Sustainability’ over the last 12 months?Base: All respondents. Councils asked State-wide: 29 Councils asked group: 9
2015 Sustainability Performance


95
J00326 Community Satisfaction Survey 2015 – Mount Alexander Shire Council
50%50%MenWomen
7%10%
24%
24%
34%18-2425-3435-4950-6465+
Please note that for the reason of simplifying reporting, interlocking age and gender reporting has not been included in this report. Interlocking age and gender analysis is still available in the dashboard and data tables provided alongside this report.
S3. [Record gender] / S4. To which of the following age groups do you belong?Base: All respondents. Councils asked State-wide: 69 Councils asked group: 21
Gender Age
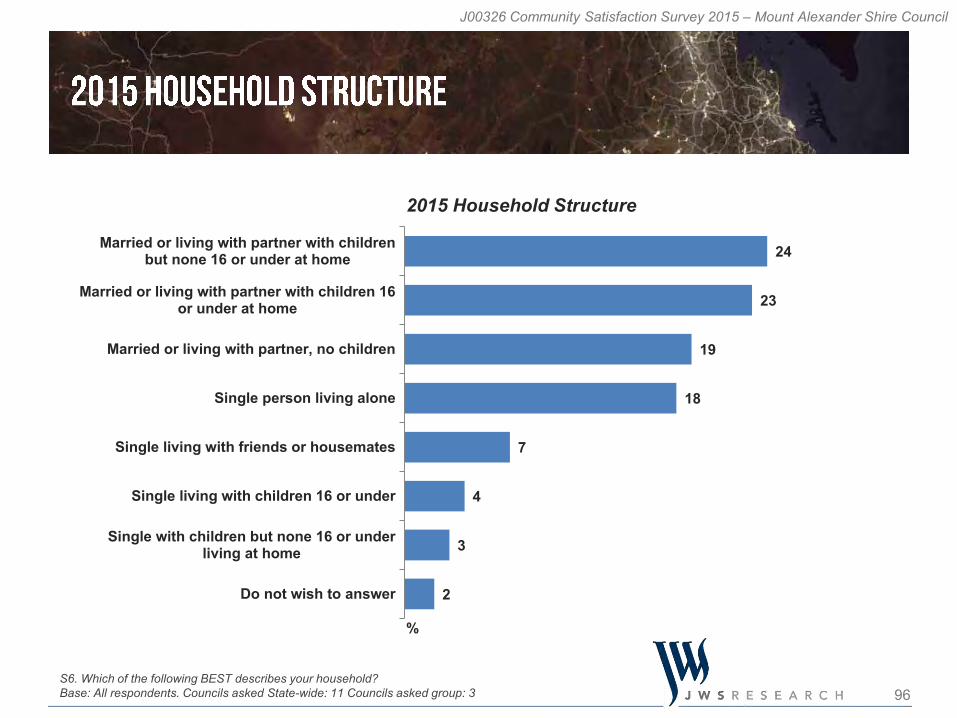
96
J00326 Community Satisfaction Survey 2015 – Mount Alexander Shire Council
S6. Which of the following BEST describes your household? Base: All respondents. Councils asked State-wide: 11 Councils asked group: 3
24
23
19
18
7
4
3
2
Married or living with partner with childrenbut none 16 or under at home
Married or living with partner with children 16or under at home
Married or living with partner, no children
Single person living alone
Single living with friends or housemates
Single living with children 16 or under
Single with children but none 16 or underliving at home
Do not wish to answer
2015 Household Structure
%

97
J00326 Community Satisfaction Survey 2015 – Mount Alexander Shire Council
10
11
14
13
10
10
10
8
12
21
11
6
6
14
14
13
14
14
16
13
14
15
7
26
11
12
75
75
73
73
76
74
77
79
72
72
62
83
81
2015 Mount Alexander
2014 Mount Alexander
2013 Mount Alexander
State-wide
Large Rural
Castlemaine
Other
Men
Women
18-34
35-49
50-64
65+
% 0-5 years 5-10 years 10+ years Can't say
S5. How long have you lived in this area?/How long have you owned a property in this area?Base: All respondents. Councils asked State-wide: 18 Councils asked group: 4
2015 Years Lived in Area


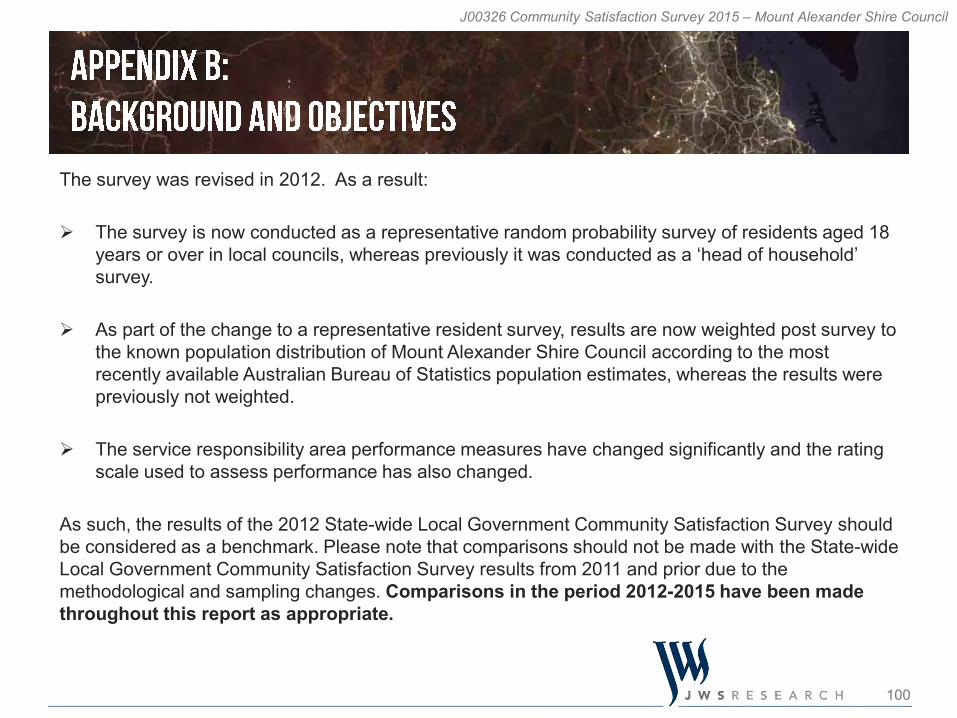
100
J00326 Community Satisfaction Survey 2015 – Mount Alexander Shire Council
The survey was revised in 2012. As a result:
The survey is now conducted as a representative random probability survey of residents aged 18 years or over in local councils, whereas previously it was conducted as a ‘head of household’ survey.
As part of the change to a representative resident survey, results are now weighted post survey to the known population distribution of Mount Alexander Shire Council according to the most recently available Australian Bureau of Statistics population estimates, whereas the results were previously not weighted.
The service responsibility area performance measures have changed significantly and the rating scale used to assess performance has also changed.
As such, the results of the 2012 State-wide Local Government Community Satisfaction Survey should be considered as a benchmark. Please note that comparisons should not be made with the State-wide Local Government Community Satisfaction Survey results from 2011 and prior due to the methodological and sampling changes. Comparisons in the period 2012-2015 have been made throughout this report as appropriate.

101
J00326 Community Satisfaction Survey 2015 – Mount Alexander Shire Council
Demographic Actual survey sample size
Weighted base
Maximum margin of error at 95% confidence
intervalMount Alexander Shire Council 400 400 +/-4.8
Men 186 199 +/-7.2Women 214 201 +/-6.7Castlemaine 177 173 +/-7.3Other 223 227 +/-6.518-34 years 29 71 +/-18.535-49 years 69 95 +/-11.950-64 years 125 96 +/-8.865+ years 177 137 +/-7.3
The sample size for the 2015 State-wide Local Government Community Satisfaction Survey for Mount Alexander Shire Council was n=400. Unless otherwise noted, this is the total sample base for all reported charts and tables.
The maximum margin of error on a sample of approximately n=400 interviews is +/-4.8% at the 95% confidence level for results around 50%. Margins of error will be larger for any sub-samples. As an example, a result of 50% can be read confidently as falling midway in the range 45.2% - 54.8%.
Maximum margins of error are listed in the table below, based on a population of 15,000 people aged 18 years or over for Mount Alexander Shire Council, according to ABS estimates.
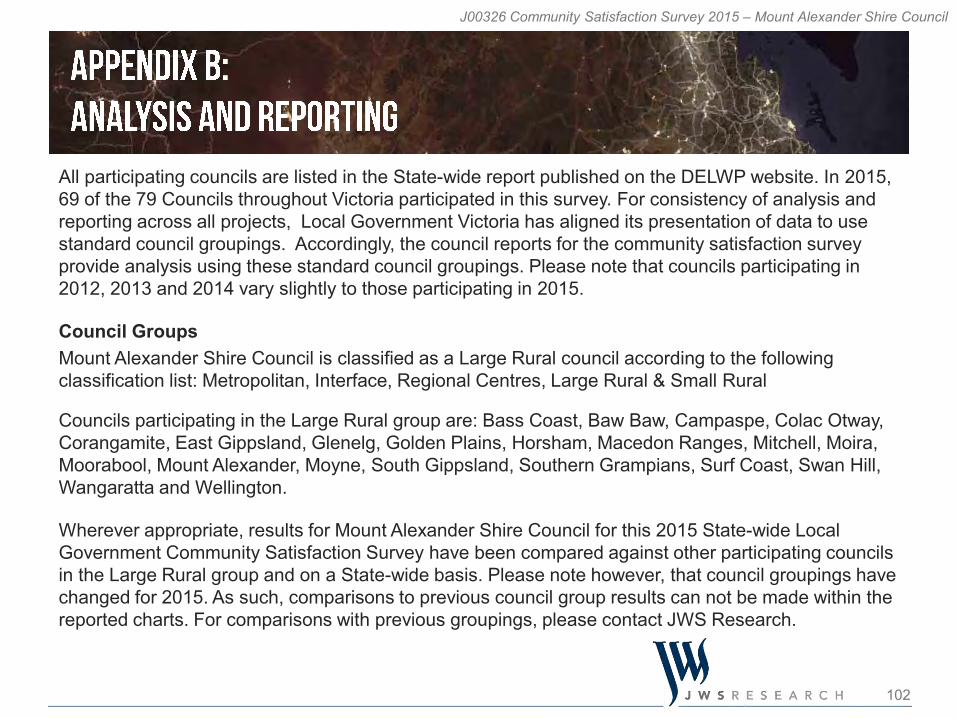
102
J00326 Community Satisfaction Survey 2015 – Mount Alexander Shire Council
All participating councils are listed in the State-wide report published on the DELWP website. In 2015, 69 of the 79 Councils throughout Victoria participated in this survey. For consistency of analysis and reporting across all projects, Local Government Victoria has aligned its presentation of data to use standard council groupings. Accordingly, the council reports for the community satisfaction survey provide analysis using these standard council groupings. Please note that councils participating in 2012, 2013 and 2014 vary slightly to those participating in 2015.
Council GroupsMount Alexander Shire Council is classified as a Large Rural council according to the following classification list: Metropolitan, Interface, Regional Centres, Large Rural & Small Rural
Councils participating in the Large Rural group are: Bass Coast, Baw Baw, Campaspe, Colac Otway, Corangamite, East Gippsland, Glenelg, Golden Plains, Horsham, Macedon Ranges, Mitchell, Moira, Moorabool, Mount Alexander, Moyne, South Gippsland, Southern Grampians, Surf Coast, Swan Hill, Wangaratta and Wellington.
Wherever appropriate, results for Mount Alexander Shire Council for this 2015 State-wide Local Government Community Satisfaction Survey have been compared against other participating councils in the Large Rural group and on a State-wide basis. Please note however, that council groupings have changed for 2015. As such, comparisons to previous council group results can not be made within the reported charts. For comparisons with previous groupings, please contact JWS Research.

103
J00326 Community Satisfaction Survey 2015 – Mount Alexander Shire Council
Index ScoresMany questions ask respondents to rate council performance on a five-point scale, for example, from ‘very good’ to ‘very poor’, with ‘can’t say’ also a possible response category. To facilitate ease of reporting and comparison of results over time, starting from the 2012 benchmark survey and measured against the State-wide result and the council group, an ‘Index Score’ has been calculated for such measures.
The Index Score is calculated and represented as a score out of 100 (on a 0 to 100 scale), with ‘can’t say’ responses excluded from the analysis. The ‘% RESULT’ for each scale category is multiplied by the ‘INDEX FACTOR’. This produces an ‘INDEX VALUE’ for each category, which are then summed to produce the ‘INDEX SCORE’, equating to ‘60’ in the following example.
SCALE CATEGORIES % RESULT INDEX FACTOR INDEX VALUE
Very good 9% 100 9Good 40% 75 30Average 37% 50 19Poor 9% 25 2Very poor 4% 0 0Can’t say 1% -- INDEX SCORE 60

104
J00326 Community Satisfaction Survey 2015 – Mount Alexander Shire Council
Similarly, an Index Score has been calculated for the Core question ‘Performance direction in the last 12 months’, based on the following scale for each performance measure category, with ‘Can’t say’ responses excluded from the calculation.
SCALE CATEGORIES % RESULT INDEX FACTOR INDEX VALUE
Improved 36% 100 36Stayed the same 40% 50 20Deteriorated 23% 0 0Can’t say 1% -- INDEX SCORE 56

105
J00326 Community Satisfaction Survey 2015 – Mount Alexander Shire Council
The test applied to the Indexes was an Independent Mean Test, as follows:
Z Score = ($1 - $2) / Sqrt (($3*2 / $5) + ($4*2 / $6))
Where:$1 = Index Score 1$2 = Index Score 2$3 = unweighted sample count 1$4 = unweighted sample count 1$5 = standard deviation 1$6 = standard deviation 2
All figures can be sourced from the detailed cross tabulations.
The test was applied at the 95% confidence interval, so if the Z Score was greater than +/- 1.954 the scores are significantly different.

106
J00326 Community Satisfaction Survey 2015 – Mount Alexander Shire Council
Core, Optional and Tailored QuestionsOver and above necessary geographic and demographic questions required to ensure sample representativeness, a base set of questions for the 2015 State-wide Local Government Community Satisfaction Survey was designated as ‘Core’ and therefore compulsory inclusions for all participating Councils.
These core questions comprised: Overall performance last 12 months (Overall performance) Lobbying on behalf of community (Advocacy) Community consultation and engagement (Consultation) Decisions made in the interest of the community (Making community decisions) Condition of sealed local roads (Sealed local roads) Contact in last 12 months (Contact) Rating of contact (Customer service) Overall council direction last 12 months (Council direction)
Reporting of results for these core questions can always be compared against other participating councils in the council group and against all participating councils State-wide. Alternatively, some questions in the 2015 State-wide Local Government Community Satisfaction Survey were optional. Councils also had the ability to ask tailored questions specific only to their council.

107
J00326 Community Satisfaction Survey 2015 – Mount Alexander Shire Council
ReportingEvery council that participated in the 2015 State-wide Local Government Community Satisfaction Survey receives a customised report. In addition, the state government is supplied with a State-wide summary report of the aggregate results of ‘Core’ and ‘Optional’ questions asked across all council areas surveyed.
Tailored questions commissioned by individual councils are reported only to the commissioning council and not otherwise shared unless by express written approval of the commissioning council.
The Overall State-wide Local Government Community Satisfaction Report is available at www.localgovernment.vic.gov.au.

108
J00326 Community Satisfaction Survey 2015 – Mount Alexander Shire Council
Core questions: Compulsory inclusion questions for all councils participating in the CSS.CSS: 2015 Victorian Local Government Community Satisfaction Survey.Council group: One of five classified groups, comprising: metropolitan, interface, regional centres, large rural and small rural.Council group average: The average result for all participating councils in the council group.Highest / lowest: The result described is the highest or lowest result across a particular demographic sub-group e.g. men, for the specific question being reported. Reference to the result for a demographic sub-group being the highest or lowest does not imply that it is significantly higher or lower, unless this is specifically mentioned.Index score: A score calculated and represented as a score out of 100 (on a 0 to 100 scale). This score is sometimes reported as a figure in brackets next to the category being described, e.g. men 50+ (60).Optional questions: Questions which councils had an option to include or not.Percentages: Also referred to as ‘detailed results’, meaning the proportion of responses, expressed as a percentage.Sample: The number of completed interviews, e.g. for a council or within a demographic sub-group.Significantly higher / lower: The result described is significantly higher or lower than the comparison result based on a statistical significance test at the 95% confidence limit. If the result referenced is statistically higher or lower then thiswill be specifically mentioned, however not all significantly higher or lower results are referenced in summary reporting.State-wide average: The average result for all participating councils in the State.Tailored questions: Individual questions tailored by and only reported to the commissioning council.Weighting: Weighting factors are applied to the sample for each council based on available age and gender proportions from ABS census information to ensure reported results are proportionate to the actual population of the council, rather than the achieved survey sample.