
Survey & Inventory Protocols for Big Game in Montana
31
STATE OF MONTANA Survey & Inventory Protocols for Big Game in Montana Mule Deer BY: Jay Newell 8/1/2013 Abstract In 82 of 162 HDs, there was some type of mule deer survey scheduled to be was conducted in 2010-11. The most common survey methods were the trend area and trend/census area counts with 63 and 14 of 82 HDs having these types of surveys, respectively. In the trend and trend/census survey areas biologists attempt to enumerate and classify into age/sex classes all the deer observed in a specific area. The assumption is made that the area surveyed is representative of the entire HD or multiple HDs, and that changes observed in the population within the trend area reflects what is happening to mule deer populations outside of that area. In most cases these surveys are conducted just after the hunting season to collect information on the number of bucks per 100 does and the numbers of fawns per 100 does and again in the spring for a total count of deer and to determine the numbers of fawns per 100 adults. There are currently 4 HDs where census area surveys are flown of which only two are flown on a regular basis. Census areas, like trend areas, can have both a post-season and a spring recruitment survey; however census areas were designed to have 3 replicate complete coverage surveys flown in the spring. Two other survey types exist: a sub-unit design where relatively small, fixed subunits are flown on an annual basis mainly for ratio information, and there are two energy development study areas in the southeastern part of the state designed to gather information on mule deer in areas where a large amount of oil and gas development is, or will be taking place. S&I data are primarily used for season setting, however biologists described many other uses for S&I data including; 1) informing sportsmen, FWP personnel, landowners and others in the general public about population trends, 2) descriptions of populations in land access and easement proposals, 3) in comments on proposed state and federal land exchange projects, 4) in comments on subdivisions, 5) for newspaper articles, 6) in comments on state land uses such as grazing changes or timber harvests, timber sales on forest service lands and 7) to inform comments on oil and gas leases and oil and gas drilling. Biologists also stressed the importance of having long-term trend data available for informed comment on unforeseen developments into the future.
Transcript of Survey & Inventory Protocols for Big Game in Montana
STATE OF MONTANA
Survey & Inventory Protocols for Big Game in Montana
Mule Deer
BY: Jay Newell
8/1/2013
Abstract
In 82 of 162 HDs, there was some type of mule deer survey scheduled to be was conducted in 2010-11. The most common survey methods were the trend area and trend/census area counts with 63 and 14 of 82 HDs having these types of surveys, respectively. In the trend and trend/census survey areas biologists attempt to enumerate and classify into age/sex classes all the deer observed in a specific area. The assumption is made that the area surveyed is representative of the entire HD or multiple HDs, and that changes observed in the population within the trend area reflects what is happening to mule deer populations outside of that area. In most cases these surveys are conducted just after the hunting season to collect information on the number of bucks per 100 does and the numbers of fawns per 100 does and again in the spring for a total count of deer and to determine the numbers of fawns per 100 adults. There are currently 4 HDs where census area surveys are flown of which only two are flown on a regular basis. Census areas, like trend areas, can have both a post-season and a spring recruitment survey; however census areas were designed to have 3 replicate complete coverage surveys flown in the spring. Two other survey types exist: a sub-unit design where relatively small, fixed subunits are flown on an annual basis mainly for ratio information, and there are two energy development study areas in the southeastern part of the state designed to gather information on mule deer in areas where a large amount of oil and gas development is, or will be taking place. S&I data are primarily used for season setting, however biologists described many other uses for S&I data including; 1) informing sportsmen, FWP personnel, landowners and others in the general public about population trends, 2) descriptions of populations in land access and easement proposals, 3) in comments on proposed state and federal land exchange projects, 4) in comments on subdivisions, 5) for newspaper articles, 6) in comments on state land uses such as grazing changes or timber harvests, timber sales on forest service lands and 7) to inform comments on oil and gas leases and oil and gas drilling. Biologists also stressed the importance of having long-term trend data available for informed comment on unforeseen developments into the future.
2
List of Figures Page
Figure 1. The five mule deer population management units in the state. .................................................... 5 Figure 2. Mule deer survey types, 2010-11. ................................................................................................ 6 Figure 3. Timing of mule deer surveys, 2011 deer HD boundaries. ............................................................ 7 Figure 4. Aircraft used to complete mule deer surveys. .............................................................................. 8 Figure 5. Location of trend, census and energy survey areas, deer and elk HDs, 2011. ............................ 9 Figure 6. Location of check stations and mule deer survey areas R-1, 2011 hunting season. ................. 13 Figure 7. Location of check stations and survey areas R-2, 2011. ............................................................ 14 Figure 8. Location of check stations and trend areas in R-3, 2011 hunting season. ............................... 16 Figure 9. Location of permanent check stations and mule deer survey areas R-4, 2011 hunting season.
.................................................................................................................................................................... 20 Figure 10. Location of check stations and mule deer survey areas R-5, 2011 hunting season. ............... 22 Figure 11. Location of check station and survey areas R-6, 2011 hunting season. .................................. 24 Figure 12. Location of check stations and survey areas R-7, 2011 hunting season. ................................ 26 List of Tables Page
Table 1. Number of HDs, deer hunters, and mule deer harvested by FWP Administrative Region, 2010. . 4 Table 2. Number of survey areas by Region at present, 2011, and when the AHM document was written
in 2001........................................................................................................................................................... 9 Table 3. Check station data collected, relative to deer1. ............................................................................ 11 Table 4. Region 1 mule deer surveys and season types by HD, 2011. ..................................................... 13 Table 5. Data collection and storage of historic flight data (prior to 2011) by Region 1 biologists. ........... 14 Table 6. Region 2 mule deer surveys and season types by HD, 2011. ..................................................... 15 Table 7. Data collection and storage of historic flight data (prior to 2011) by R-2 biologists. .................... 16 Table 8. Region 3 mule deer surveys and season types by HD, 2011. ..................................................... 17 Table 9. Data collection and storage of historic flight data (prior to 2011) by Region 3 biologists. ........... 19 Table 10. Region 4 mule deer surveys and season types by HD, 2011. ................................................... 20 Table 11. Data collection and storage of historic flight data (prior to 2011) by R-4 biologists. .................. 21 Table 12. Region 5 mule deer surveys and season types by HD, 2011. ................................................... 23 Table 13. Data collection and storage of historic flight data (prior to 2011) by Region 5 biologists. ......... 23 Table 14. Region 6 mule deer surveys and season types by HD, 2011. ................................................... 24 Table 15. Data collection and storage of historic flight data (prior to 2011) by Region 6 biologists. ......... 25 Table 16. Region 7 mule deer surveys and season types by HD, 2011. ................................................... 26 Table 17. Data collection and storage of historic flight data (prior to 2011). ............................................. 27 Table 18. Typical data analyzed to inform mule deer hunting season change justifications for the 2012
season. ........................................................................................................................................................ 28

3
INTRODUCTION Montana Fish, Wildlife and Parks (FWP) has the authority and responsibility to manage wildlife in the state of Montana. There are over 500 species of mammals, birds, reptiles and amphibians and FWP regulates harvest of 55 of those species that are valued for their meat, fur or as “trophies” (Montana Fish, Wildlife and Parks, 2006). In addition, FWP has the responsibility to manage other nongame wildlife for human enjoyment, scientific purposes and to ensure their survival into perpetuity. FWP personnel survey and inventory (S&I) many species of wildlife, and the data collected provide the scientific basis for management of those species and their habitat. Data collected are used to inform decisions by the Legislature, FWP Commission, other organizations with wildlife interests and governmental agencies. S&I allows FWP to monitor trends in wildlife populations in order to inform management decisions that affect 1) population abundance, 2) wildlife conflicts, 3) hunting and harvest opportunity, 4) habitat management and land use decisions and 5) other recreational opportunities for diverse user groups. S&I is an important part of FWP’s mission which states that FWP, through its employees and citizen commission, provides for stewardship of the fish, wildlife, parks and recreational resources of Montana while contributing to the quality of life for present and future generations. FWP has worked towards becoming more consistent with S&I protocols and has produced several documents that address protocols for individual species. The Montana Bighorn Sheep Conservation Strategy (Montana Fish, Wildlife and Parks, 2010); Management Plan and Conservation Strategies for Sage Grouse in Montana (Montana Sage Grouse Work Group, 2005); Montana Final Elk Management Plan (Montana Fish, Wildlife and Parks, 2005) and Adaptive Harvest Management (Montana Fish, Wildlife and Parks, 2001) address S&I protocols for bighorn sheep, sage-grouse, elk and deer, respectively. In order to further improve our S&I protocols the 2004 Montana Legislature approved a new S&I specialist position for FWP which was not filled until December of 2010. The primary focus of this new position was to be on decision/operations analysis, wildlife monitoring protocols, and evaluation of data at local, regional, and statewide scales. In addition, the position was created to review existing survey protocols and provide recommendations that may modify those protocols to better meet program needs. As a first step, this position was directed to catalog and summarize the current S&I programs for pronghorn antelope (antelope), elk and deer across the 7 FWP Regions of Montana. This effort was to focus on documenting the differences and similarities of protocols used in those surveys, and articulating how S&I data fit into wildlife management and conservation actions. Besides cataloging S&I protocols, this analysis may be used by FWP to increase efficiency and distribution of S&I dollars. Since FWP is not centralized in its organizational structure, protocols for surveys have evolved over time and in some cases differ by Region or even within a Region by hunting district (HD). In most cases, exceptions to general S&I protocols were born out of necessity, such as requests for additional information from sportsmen or FWP commissioners; a need for data for a specific research project, research question or environmental impact statement; and/or a change in budgets or manpower availability. Often the changes in protocols involved how male animals were classified or where surveys were conducted. In many cases, once the change in protocol was made, over time, the “new protocol” became the “standard” for that area. On occasion, the reason(s) that changes were made to a “standard” protocol were lost or forgotten, however because long-term datasets collected in a specific format existed, new biologists often carried on the revised tradition of data collection. FWP’s S&I program addresses a broad and complex array of subjects that vary from surveys that collect data on a statewide basis to surveys that are done on a local level by biologists in a specific area for a specific reason. Some very important aspects of the S&I program that will not be discussed in detail in this document are hunter harvest surveys and hunter preference surveys, which are conducted in a centralized fashion from the FWP headquarters office. FWP’s vegetation monitoring program for conservation easements and lands owned by the Department will not be discussed. Non-game monitoring by our native species biologists and wolf monitoring protocols will not be discussed. In addition, this document will not discuss in detail S&I efforts for game species other than antelope, deer and elk.
4
INFORMATION COLLECTION AND ASSEMBLY METHODS To collect the necessary information on S&I protocols, interviews were conducted with most of the wildlife biologists responsible for game species management across the state. Each biologist was asked a series of questions about their S&I protocols. Biologists were asked to describe which species they surveyed, time-period for the survey, where the survey area was located, type of vehicle utilized, periodicity of the survey, and how the survey was done including time of day and flight patterns. Biologists were asked to classify their surveys to a specific type such as trend area counts, complete coverage surveys, or production counts which will all be discussed in more detail later in this document. Biologists were also asked to describe the classification data they collected, how the data were stored, and for what purposes the data were used. The primary emphasis of this undertaking was to gather information about FWP S&I protocols for deer, elk and antelope, although additional information on surveys of other species, including bighorn sheep, black bears, moose, mountain goats, furbearers, migratory game birds such as waterfowl, sandhill cranes and mourning doves, and upland game birds including sage-grouse, pheasants, and sharp-tailed grouse was gathered and may be summarized at a later date. Biologists were also asked whether or not they conducted hunter check stations, to describe what information was gathered at those check stations and how those data are stored. I also reviewed existing papers, conservation strategies, and management plans addressing S&I protocols in Montana, including but not limited to elk, mule deer, sage grouse and bighorn sheep. In addition, each biologist was provided with a list of 20 questions that asked their opinions on the effectiveness of current survey protocols, needs they might have to improve S&I protocols and data analysis, opinions on which surveys might be eliminated, which species needed more S&I dollars for monitoring, and training needs for biologists and pilots. The following report on mule deer is one of five separate reports covering survey and inventory protocols for 1) antelope, 2) elk, 3) mule deer 4) white-tailed deer and 5) a summary of the answers to the 20 questions biologists were asked. MULE DEER Mule Deer Survey Methods Mule deer surveys are conducted in all 7 Regions in Montana. The number of surveys conducted varies by Region. In 2010 a majority of the mule deer harvest in Montana occurred in R-4 and R-7, while R-3 and R-4 had the greatest number of deer hunters (Table 1). Table 1. Number of HDs, deer hunters, and mule deer harvested by FWP Administrative Region, 2010. Region Number HDs Number of Deer Hunters 20101 Number Mule Deer Killed, 2010
1 19 24,185 1,379 2 28 20,420 2,349 3 45 30,676 5,909 4 36 29,618 8,906 5 12 18,599 6,724 6 16 18,193 7,729 7 6 22,638 10,928
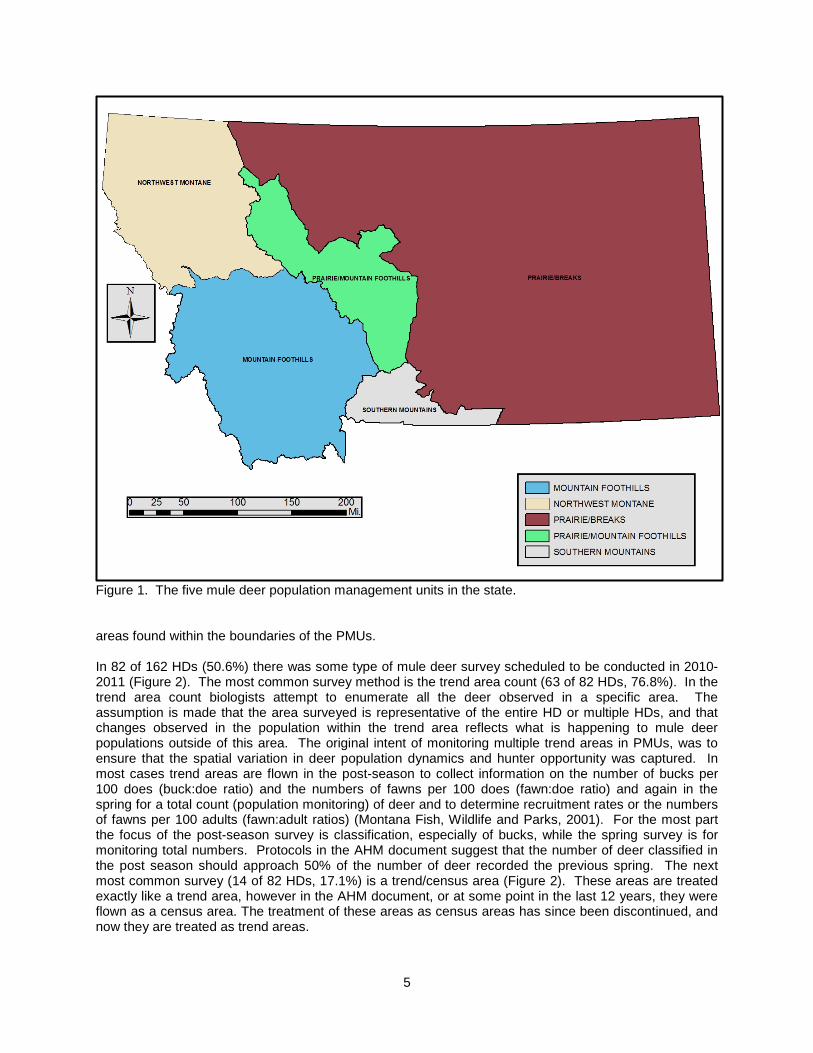
Total 162 152,139 43,924 1Includes both mule and white-tailed deer hunters. Our current deer S&I protocols originate from and are well described in the Adaptive Harvest Management document (Montana Fish, Wildlife and Parks, 2001). References to that document will be made throughout this chapter on mule deer protocols. At the time the AHM document was written the state was divided into 5 broad mule deer population management units (PMUs); the Northwest Montane, Mountain Foothills, Prairie/Mountain Foothills, Southern Mountains and Prairie/Breaks PMUs (Figure 1). These PMUs were differentiated based upon similar mule deer population dynamics and habitat characteristics. The AHM document identified S&I protocols that would be common in trend and census
5
Figure 1. The five mule deer population management units in the state. areas found within the boundaries of the PMUs. In 82 of 162 HDs (50.6%) there was some type of mule deer survey scheduled to be conducted in 2010-2011 (Figure 2). The most common survey method is the trend area count (63 of 82 HDs, 76.8%). In the trend area count biologists attempt to enumerate all the deer observed in a specific area. The assumption is made that the area surveyed is representative of the entire HD or multiple HDs, and that changes observed in the population within the trend area reflects what is happening to mule deer populations outside of this area. The original intent of monitoring multiple trend areas in PMUs, was to ensure that the spatial variation in deer population dynamics and hunter opportunity was captured. In most cases trend areas are flown in the post-season to collect information on the number of bucks per 100 does (buck:doe ratio) and the numbers of fawns per 100 does (fawn:doe ratio) and again in the spring for a total count (population monitoring) of deer and to determine recruitment rates or the numbers of fawns per 100 adults (fawn:adult ratios) (Montana Fish, Wildlife and Parks, 2001). For the most part the focus of the post-season survey is classification, especially of bucks, while the spring survey is for monitoring total numbers. Protocols in the AHM document suggest that the number of deer classified in the post season should approach 50% of the number of deer recorded the previous spring. The next most common survey (14 of 82 HDs, 17.1%) is a trend/census area (Figure 2). These areas are treated exactly like a trend area, however in the AHM document, or at some point in the last 12 years, they were flown as a census area. The treatment of these areas as census areas has since been discontinued, and now they are treated as trend areas.
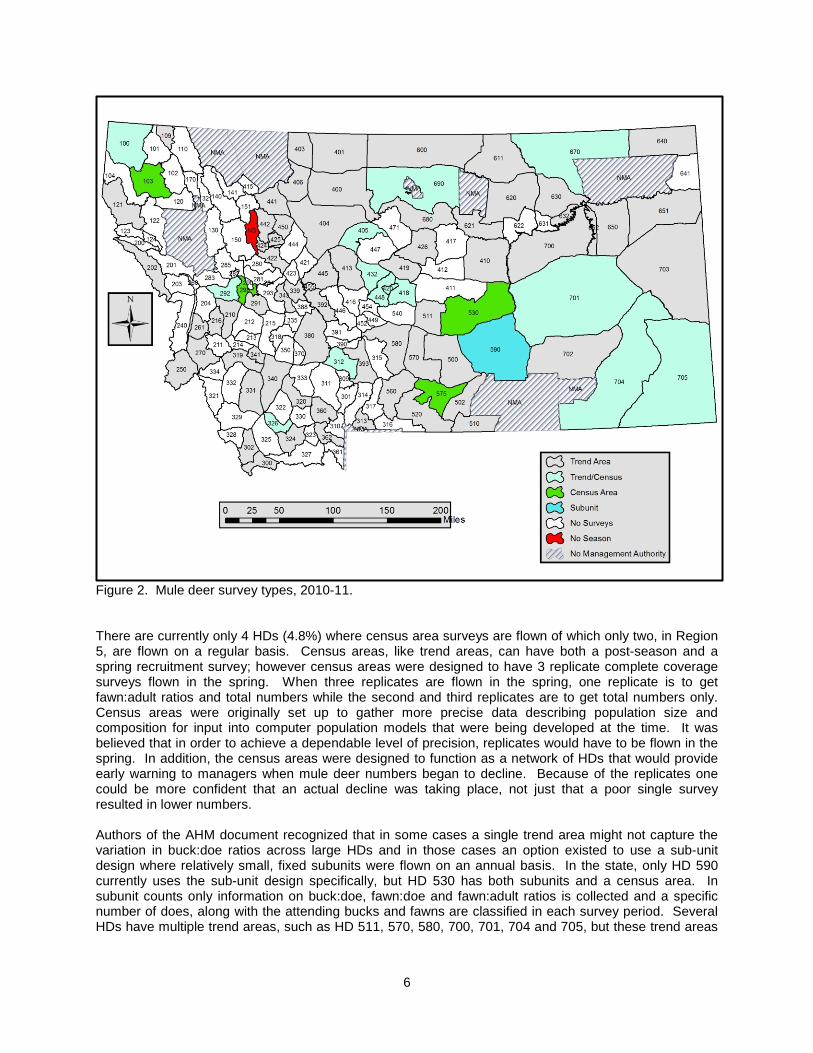
6
Figure 2. Mule deer survey types, 2010-11. There are currently only 4 HDs (4.8%) where census area surveys are flown of which only two, in Region 5, are flown on a regular basis. Census areas, like trend areas, can have both a post-season and a spring recruitment survey; however census areas were designed to have 3 replicate complete coverage surveys flown in the spring. When three replicates are flown in the spring, one replicate is to get fawn:adult ratios and total numbers while the second and third replicates are to get total numbers only. Census areas were originally set up to gather more precise data describing population size and composition for input into computer population models that were being developed at the time. It was believed that in order to achieve a dependable level of precision, replicates would have to be flown in the spring. In addition, the census areas were designed to function as a network of HDs that would provide early warning to managers when mule deer numbers began to decline. Because of the replicates one could be more confident that an actual decline was taking place, not just that a poor single survey resulted in lower numbers. Authors of the AHM document recognized that in some cases a single trend area might not capture the variation in buck:doe ratios across large HDs and in those cases an option existed to use a sub-unit design where relatively small, fixed subunits were flown on an annual basis. In the state, only HD 590 currently uses the sub-unit design specifically, but HD 530 has both subunits and a census area. In subunit counts only information on buck:doe, fawn:doe and fawn:adult ratios is collected and a specific number of does, along with the attending bucks and fawns are classified in each survey period. Several HDs have multiple trend areas, such as HD 511, 570, 580, 700, 701, 704 and 705, but these trend areas
7
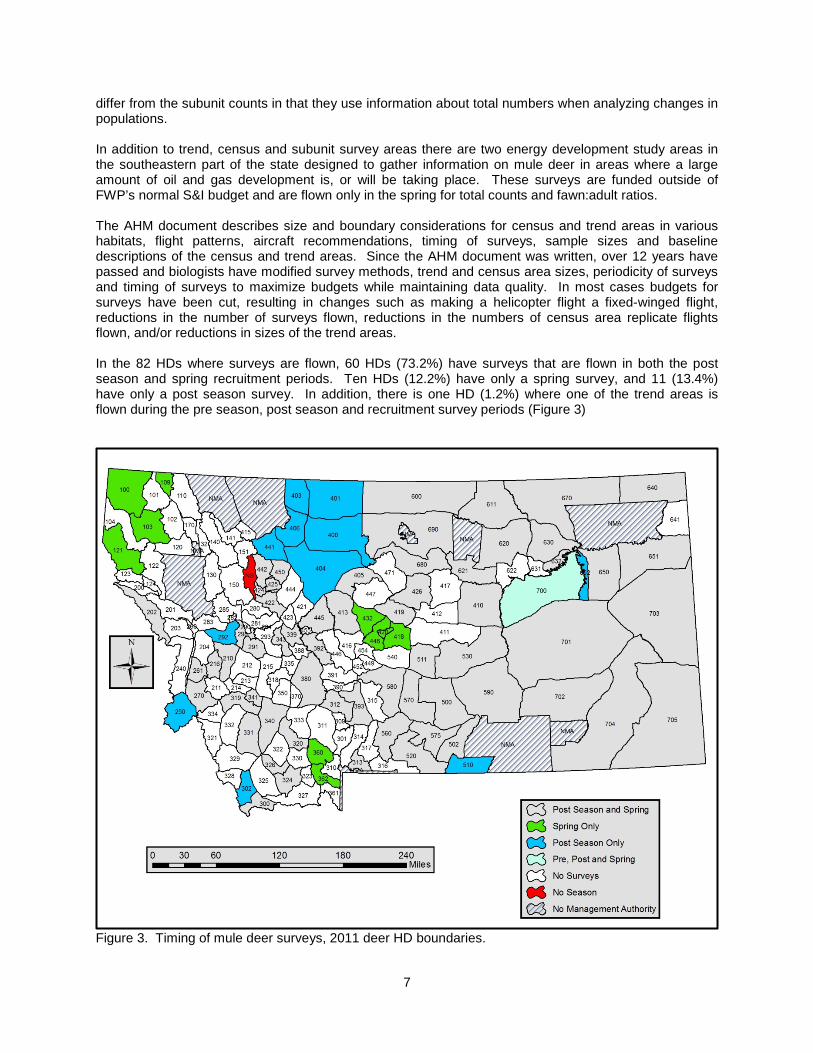
differ from the subunit counts in that they use information about total numbers when analyzing changes in populations. In addition to trend, census and subunit survey areas there are two energy development study areas in the southeastern part of the state designed to gather information on mule deer in areas where a large amount of oil and gas development is, or will be taking place. These surveys are funded outside of FWP’s normal S&I budget and are flown only in the spring for total counts and fawn:adult ratios. The AHM document describes size and boundary considerations for census and trend areas in various habitats, flight patterns, aircraft recommendations, timing of surveys, sample sizes and baseline descriptions of the census and trend areas. Since the AHM document was written, over 12 years have passed and biologists have modified survey methods, trend and census area sizes, periodicity of surveys and timing of surveys to maximize budgets while maintaining data quality. In most cases budgets for surveys have been cut, resulting in changes such as making a helicopter flight a fixed-winged flight, reductions in the number of surveys flown, reductions in the numbers of census area replicate flights flown, and/or reductions in sizes of the trend areas. In the 82 HDs where surveys are flown, 60 HDs (73.2%) have surveys that are flown in both the post season and spring recruitment periods. Ten HDs (12.2%) have only a spring survey, and 11 (13.4%) have only a post season survey. In addition, there is one HD (1.2%) where one of the trend areas is flown during the pre season, post season and recruitment survey periods (Figure 3)
Figure 3. Timing of mule deer surveys, 2011 deer HD boundaries.
8
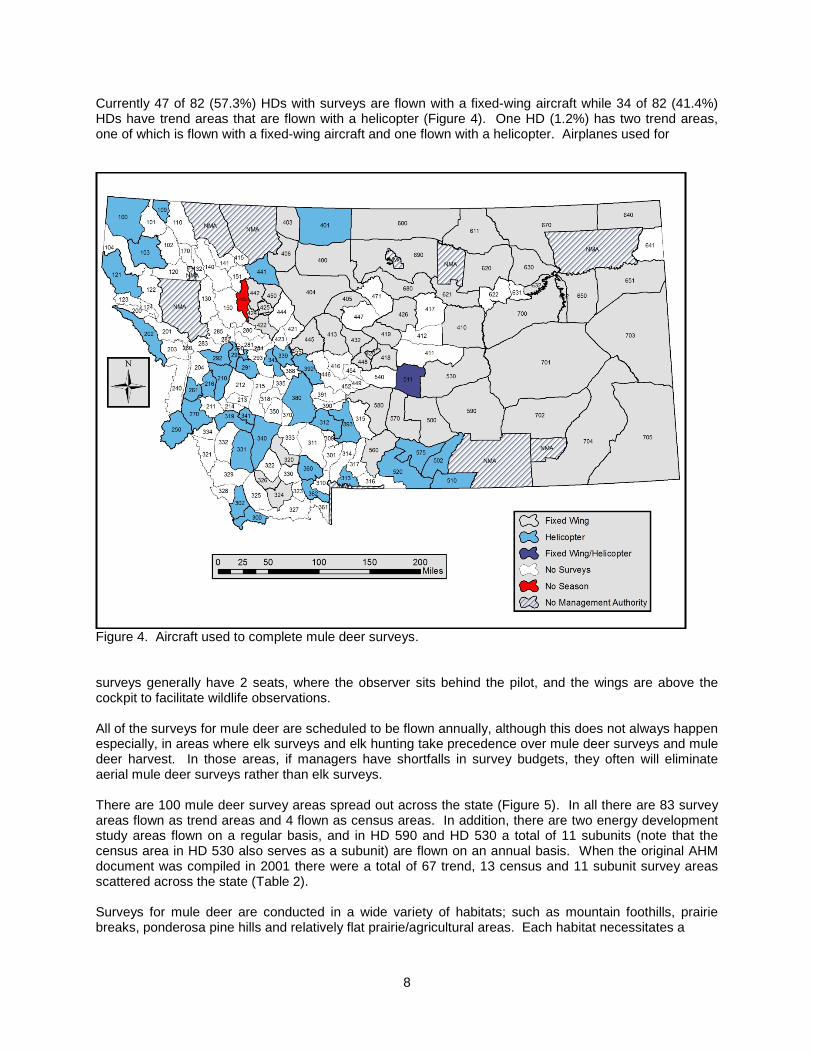
Currently 47 of 82 (57.3%) HDs with surveys are flown with a fixed-wing aircraft while 34 of 82 (41.4%) HDs have trend areas that are flown with a helicopter (Figure 4). One HD (1.2%) has two trend areas, one of which is flown with a fixed-wing aircraft and one flown with a helicopter. Airplanes used for
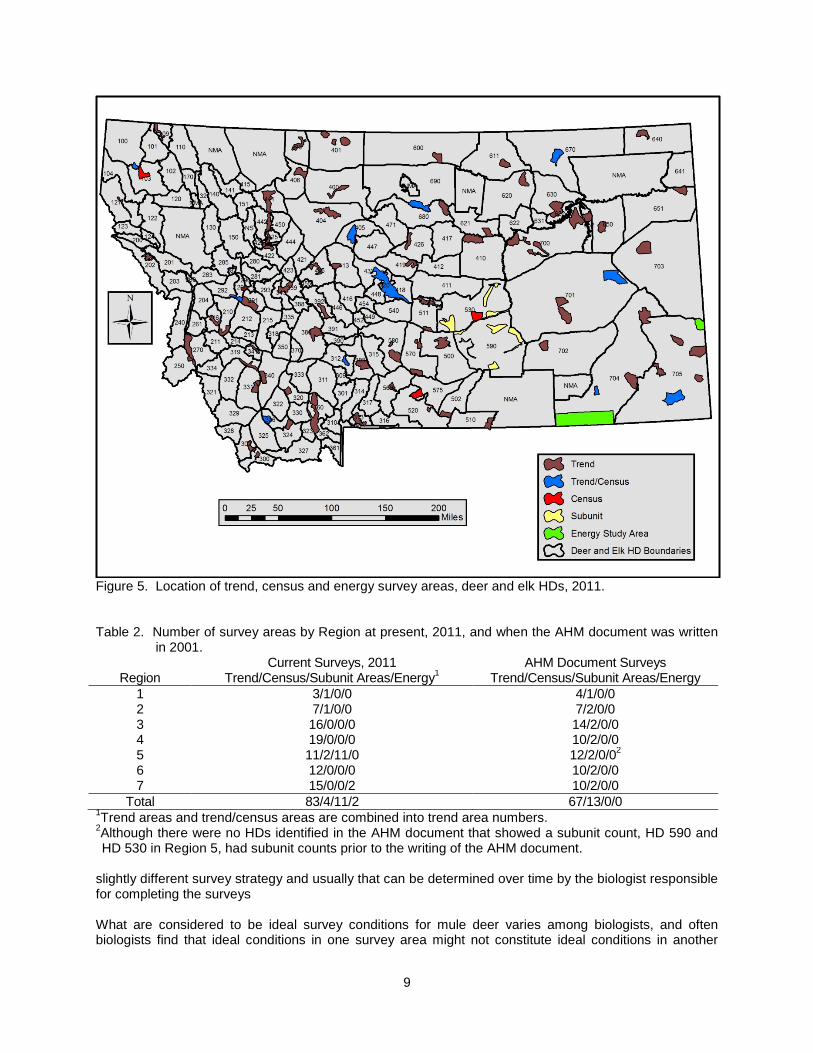
Figure 4. Aircraft used to complete mule deer surveys. surveys generally have 2 seats, where the observer sits behind the pilot, and the wings are above the cockpit to facilitate wildlife observations. All of the surveys for mule deer are scheduled to be flown annually, although this does not always happen especially, in areas where elk surveys and elk hunting take precedence over mule deer surveys and mule deer harvest. In those areas, if managers have shortfalls in survey budgets, they often will eliminate aerial mule deer surveys rather than elk surveys. There are 100 mule deer survey areas spread out across the state (Figure 5). In all there are 83 survey areas flown as trend areas and 4 flown as census areas. In addition, there are two energy development study areas flown on a regular basis, and in HD 590 and HD 530 a total of 11 subunits (note that the census area in HD 530 also serves as a subunit) are flown on an annual basis. When the original AHM document was compiled in 2001 there were a total of 67 trend, 13 census and 11 subunit survey areas scattered across the state (Table 2). Surveys for mule deer are conducted in a wide variety of habitats; such as mountain foothills, prairie breaks, ponderosa pine hills and relatively flat prairie/agricultural areas. Each habitat necessitates a
9
Figure 5. Location of trend, census and energy survey areas, deer and elk HDs, 2011. Table 2. Number of survey areas by Region at present, 2011, and when the AHM document was written
in 2001. Current Surveys, 2011 AHM Document Surveys
Region Trend/Census/Subunit Areas/Energy1 Trend/Census/Subunit Areas/Energy 1 3/1/0/0 4/1/0/0 2 7/1/0/0 7/2/0/0 3 16/0/0/0 14/2/0/0 4 19/0/0/0 10/2/0/0 5 11/2/11/0 12/2/0/02
6 12/0/0/0 10/2/0/0 7 15/0/0/2 10/2/0/0
Total 83/4/11/2 67/13/0/0 1Trend areas and trend/census areas are combined into trend area numbers. 2Although there were no HDs identified in the AHM document that showed a subunit count, HD 590 and HD 530 in Region 5, had subunit counts prior to the writing of the AHM document.
slightly different survey strategy and usually that can be determined over time by the biologist responsible for completing the surveys What are considered to be ideal survey conditions for mule deer varies among biologists, and often biologists find that ideal conditions in one survey area might not constitute ideal conditions in another
10
area. Most biologists, over time, have developed a systematic order to flying their surveys. One biologist in central Montana reported that in his area there were a few deer surveys that could be flown in the morning hours, ½ hour after sunrise for 2 to 3 hours and still provide counts representative of the population. In other areas the only way to get a good quality count was to fly 2-3 hours before sundown until sundown for this biologist. The biologist further reported that survey areas with large amounts of sagebrush have to be flown on days with clear skies, while in areas where deer often feed in agricultural fields one can get good counts regardless of cloud cover. In areas where deer feed in agricultural fields, good counts can rarely be obtained following significant snow events whereas in those areas with primarily native vegetation, especially sagebrush, good counts are often made after snow events. In the spring green-up period, flights can be made in agricultural areas on cloudy days. In all habitats and in all seasons, patchy snow conditions seem to provide for the worst survey conditions. Most biologists fly for just a few hours in the morning or the evening, however, under some conditions, especially if the aircraft is a helicopter, biologists are able to fly for more hours throughout the day. As with other big game species, calm conditions, with winds less than 15 mph are usually the best for getting reliable survey results. In the AHM document the recommendation was made to fly deer surveys using a helicopter in all mountain environments, though both fixed wing and helicopter surveys are currently conducted in mountain environments.
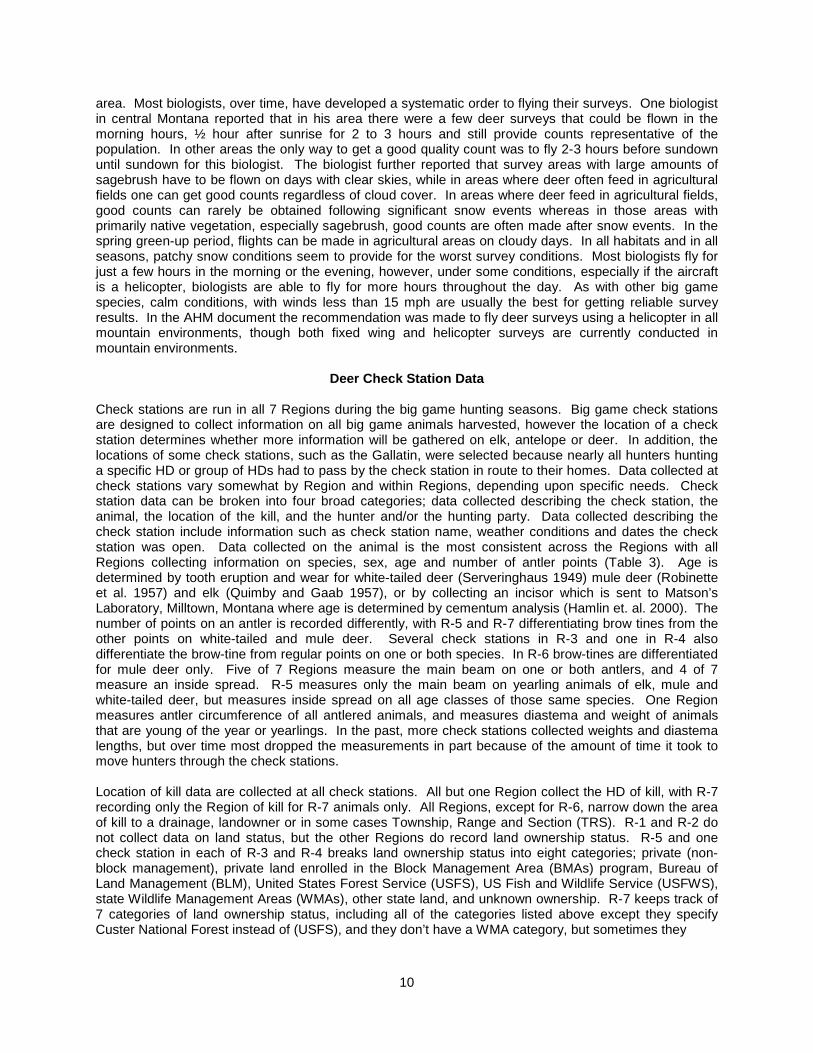
Deer Check Station Data Check stations are run in all 7 Regions during the big game hunting seasons. Big game check stations are designed to collect information on all big game animals harvested, however the location of a check station determines whether more information will be gathered on elk, antelope or deer. In addition, the locations of some check stations, such as the Gallatin, were selected because nearly all hunters hunting a specific HD or group of HDs had to pass by the check station in route to their homes. Data collected at check stations vary somewhat by Region and within Regions, depending upon specific needs. Check station data can be broken into four broad categories; data collected describing the check station, the animal, the location of the kill, and the hunter and/or the hunting party. Data collected describing the check station include information such as check station name, weather conditions and dates the check station was open. Data collected on the animal is the most consistent across the Regions with all Regions collecting information on species, sex, age and number of antler points (Table 3). Age is determined by tooth eruption and wear for white-tailed deer (Serveringhaus 1949) mule deer (Robinette et al. 1957) and elk (Quimby and Gaab 1957), or by collecting an incisor which is sent to Matson’s Laboratory, Milltown, Montana where age is determined by cementum analysis (Hamlin et. al. 2000). The number of points on an antler is recorded differently, with R-5 and R-7 differentiating brow tines from the other points on white-tailed and mule deer. Several check stations in R-3 and one in R-4 also differentiate the brow-tine from regular points on one or both species. In R-6 brow-tines are differentiated for mule deer only. Five of 7 Regions measure the main beam on one or both antlers, and 4 of 7 measure an inside spread. R-5 measures only the main beam on yearling animals of elk, mule and white-tailed deer, but measures inside spread on all age classes of those same species. One Region measures antler circumference of all antlered animals, and measures diastema and weight of animals that are young of the year or yearlings. In the past, more check stations collected weights and diastema lengths, but over time most dropped the measurements in part because of the amount of time it took to move hunters through the check stations. Location of kill data are collected at all check stations. All but one Region collect the HD of kill, with R-7 recording only the Region of kill for R-7 animals only. All Regions, except for R-6, narrow down the area of kill to a drainage, landowner or in some cases Township, Range and Section (TRS). R-1 and R-2 do not collect data on land status, but the other Regions do record land ownership status. R-5 and one check station in each of R-3 and R-4 breaks land ownership status into eight categories; private (non-block management), private land enrolled in the Block Management Area (BMAs) program, Bureau of Land Management (BLM), United States Forest Service (USFS), US Fish and Wildlife Service (USFWS), state Wildlife Management Areas (WMAs), other state land, and unknown ownership. R-7 keeps track of 7 categories of land ownership status, including all of the categories listed above except they specify Custer National Forest instead of (USFS), and they don’t have a WMA category, but sometimes they
11
Table 3. Check station data collected, relative to deer1. Parameter R-1 R-2 R-3 R- 4 R- 5 R-6 R-7 Check Station Description Check Station Name X X X X X X X Date of Check Station X X X X X X X Animal Description Species X X X X X X X Sex X X X X X X X Age X X X X X X X Number of Antler Points X X X X X X X Differentiate Brow-tines X2 X2 X X3 X Length of Main Beam 1 or 2 Sides X X2 X2 X X Inside Spread X2 X2 X X Horn Circumference X2 Diastema X2 Weight X4 X2 Location of Kill Hunting District X X X X X X Landowner/Location/Drainage/ TRS X X X X X X Land Status5 X2 X2 X X X Hunter & Hunting Party Number in Party X X X X X X X Vehicle License/Origin of Hunter X X X2 X X X Number in Party Successful X X X X X LPT X X2 X X6 X Hunter Name X X X X ALS Number X X X X Group Number X X X ORV X X X Date of Kill X X X Days Hunted X X2 Horse Trailer X X Resident/Nonresident/Youth X Fee Charged X Packer X2 Comments X X X X X X X 1 Some questions on the check station forms were relevant to only antelope and are discussed in the
chapter on Antelope. 2 Varies by check station within the Region. 3 Differentiates brow-tines on mule deer only. 4 Up until recently some biologists in R-1 took weights of fawns and yearlings at check stations 5 Varies by Region, see text. 6 R-6 keeps track of whether the license was valid for either-sex or for antlerless. The other Regions
collect an actual LPT number off the license used to harvest an animal. designate land as only public or private. R-6 keeps track of only the kills on BMAs, and the remaining Regions and check stations differentiate land status only as public or private. The greatest variations in data collected are associated with describing the hunter and hunting party. All Regions collect information on the number of hunters in a party while 6 of 7 Regions collect information on the origin of the hunter or hunting party. Five of 7 Regions keep track of the number in the party that are successful and information about the license or permit type (LPT) that was placed on the animal following the kill. Three of 7 Regions assign each hunting party a group number, record a date of kill, and whether the hunting party had an off-road vehicle (ORV). Two of seven Regions keep track of the
12
number of days hunted. R-2 and R-3 record whether or not the party had a horse trailer. The other parameters found in Table 3 are collected either by only one Region or in some cases one check station. In addition to the previously described data collected, check stations have been used as a place to collect samples to be tested for Chronic Wasting Disease, to gather other biological samples, to interview hunters about specific issues, and by game wardens to check for regulation compliance. Most Regions have an electronic database or databases that hold the check station data. Most Regions keep track of unsuccessful hunters at the check stations; however data associated with unsuccessful hunters are not always entered into the electronic check station databases.
Deer Classification During deer surveys biologists categorize deer into sex and age classes. Classification categories that are common across Regional and HD boundaries are for does, fawns, adults, unclassified antlerless deer (does and fawns), and unclassified deer-all (bucks, does and fawns). When it comes to buck classification there is a wide variety of classes used. Yearling bucks are usually synonymous with spikes and small two points with a small body size; however there are biologists that classify yearling bucks into two categories, spikes and ≥2x2 yearlings. Adult bucks are bucks older than 2.5 and are bucks that usually have more than two points on each antler and a larger body size than yearling bucks. Some biologists classify adult bucks into antler classes such as 2x2, 3x3 and ≥4x4 while other biologists classify adult bucks into age classes from yearling up to ≥3.5 years old. The definitions for age classes are somewhat subjective and are based on antler and body size. In general 2.5 year old bucks have smaller antlers in mass and/or number of points while bucks ≥3.5 years old generally have larger antlers and body size, usually with 4 or more points on each antler. In addition, some biologists keep track of large “trophy” or “mature” bucks which are described as bucks with ≥4 points on each side, and of large body size.
Region-specific survey methods summaries Region 1 R-1 has 19 deer HDs. In part, because of the limited visibility there are only 4 mule deer survey areas and 4 aerial surveys conducted in Region 1. These surveys are conducted in HDs 100, 103, 109 and 121 (Figure 6, Table 4). Biologists in the Region obtain useful information on spring fawn:adult ratios in their aerial surveys, along with harvest trends in order to set seasons, and complete coverage surveys in R-1 may or may not yield valid estimates of population trends. Most R-1 surveys are scheduled to be completed on an annual basis in the spring, but poor weather conditions, budget shortfalls and a continual shortage of qualified pilots often interfere with scheduled flights. Three of the 4 survey areas are trend areas and one is flown as a census area (rarely) when budgets allow. All 4 survey areas are located in HDs where hunters could shoot an antlered buck with a general A-license in 2011. Survey areas in the Region cover approximately 149 square miles (sq. mi.) of habitat and range in size from 22 to 61 sq. mi. (Figure 6). Biologists in R-1 classify mule deer as either adults or fawns in the spring of the year. Waypoint locations for each group of deer are recorded, although one biologist does not mark individuals or very small groups of mule deer, and track logs showing the survey flight pattern are collected and stored. Prior to 2011 two biologists downloaded waypoint and track log data from their GPS units through MapSource and the other 2 biologists used DNRGarmin. Historic classification and waypoint data are combined into data tables which are stored in Excel or shapefiles on 2 of the 4 biologists’ computers (Table 5). Because it is so difficult to survey animals in R-1 biologists rely heavily on harvest information to monitor big game populations. R-1 has 6 check stations scattered across the Region which are all open both weekend days throughout the deer and elk hunting season, resulting in 72 check-station days (Figure 6).

13
Figure 6. Location of check stations and mule deer survey areas R-1, 2011 hunting season. Table 4. Region 1 mule deer surveys and season types by HD, 2011.
HD
Aerial Survey Type
Periodicity
Classification Data Collected
General License Rifle-2011
100 Trend Area Annual-Spring Fawns & Adults Buck Only 101 None None None Buck Only 102 None None None Buck Only 103 Census Area Annual-Spring Fawns & Adults Buck Only 104 None None None Buck Only 109 Trend Area Annual-Spring Fawns & Adults Buck Only 110 None None None Buck Only 120 None None None Buck Only 121 Trend Area Annual-Spring Fawns & Adults Buck Only
122 None None None Buck Only 123 None None None Buck Only 124 None None None Buck Only 130 None None None Buck Only 132 None None None Buck Only 140 None None None Buck Only 141 None None None Buck Only 150 None None None Buck Only 151 None None None Buck Only 170 None None None Buck Only
14
Table 5. Data collection and storage of historic flight data (prior to 2011) by Region 1 biologists.
Biologist Upload Wpts &
Track Logs
Classification Data Collected Program Used to Combine
Classification & Location Data Chilton-Radandt DNR Garmin Spring-Fawns & Adults Excel
Sterling Map Source Spring-Fawns & Adults No Thier Map Source Spring-Fawns & Adults No Vore DNR Garmin Spring-Fawns & Adults Shape Files for ArcMap
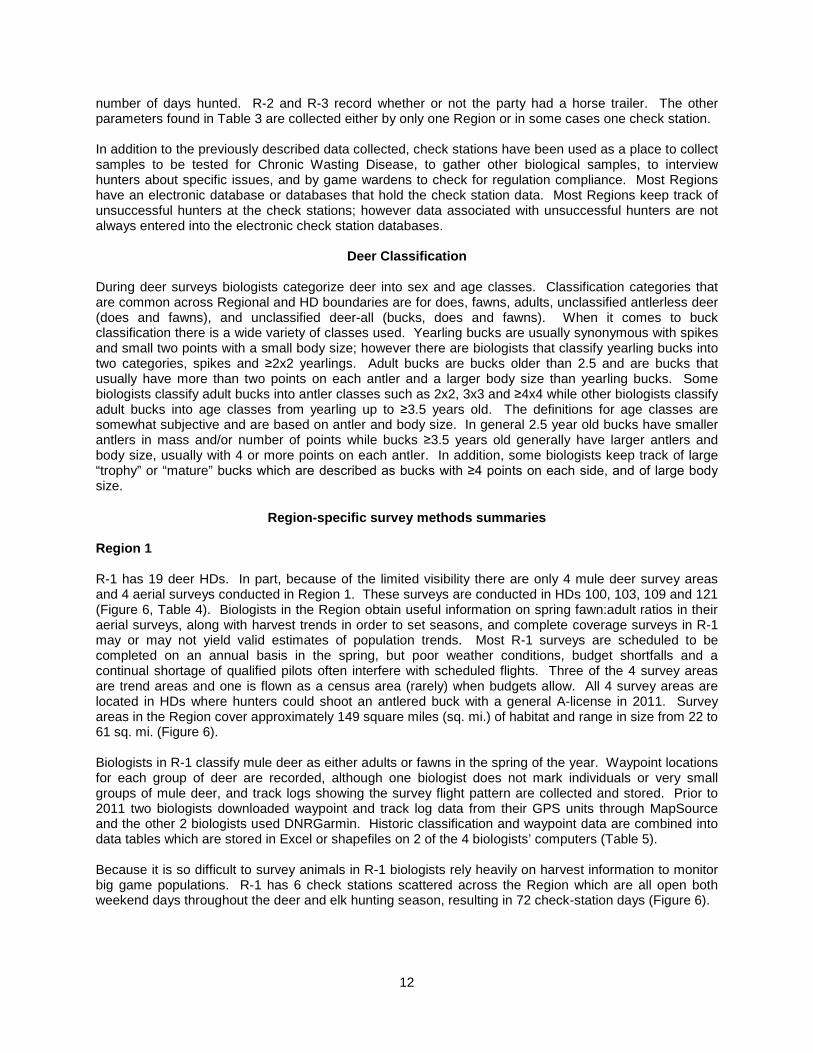
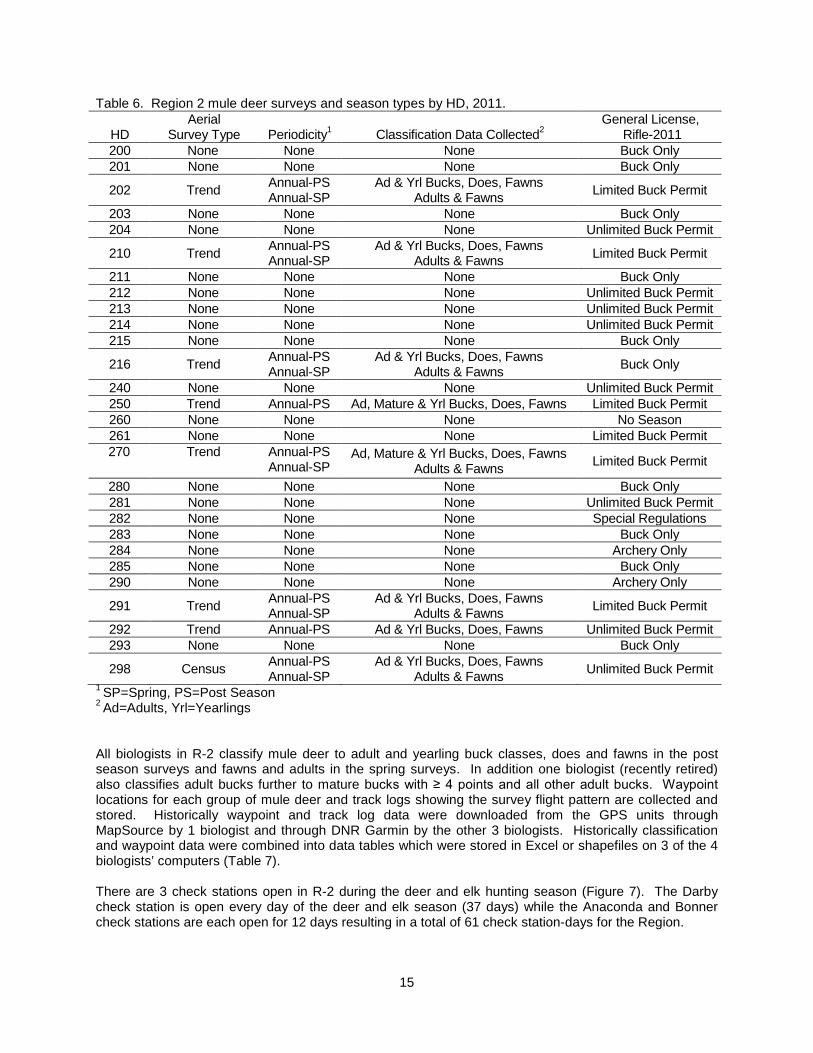
Region 2 R-2 has 28 deer HDs. There are 4 biologists with responsibilities for flying 1 or more mule deer surveys in 8 survey areas (Figure 7). Biologists in the Region have 14 aerial surveys to complete on mule deer, 8 in the post season period and 6 in the spring. All 8 survey areas are flown as survey trend areas, except one census area in HD 298 that on occasion is still flown as a census area (Table 6). Many mule deer trend areas in Region 2 have not been flown since 2008 or 2009, however in the winter/spring of 2011-2012 mule deer surveys were conducted in HD 202, 250 and 270. Survey areas in the Region cover a total of approximately 345 sq. mi. of habitat and range in size from 18 to 96 sq. mi. Four of the survey areas are located in HDs with limited permits, 3 in HDs with unlimited permits and one is located in a HD where a hunter can kill a buck on a general license.
Figure 7. Location of check stations and survey areas R-2, 2011.
15
Table 6. Region 2 mule deer surveys and season types by HD, 2011.
HD Aerial
Survey Type
Periodicity1
Classification Data Collected2 General License,
Rifle-2011
200 None None None Buck Only 201 None None None Buck Only
202 Trend Annual-PS Annual-SP
Ad & Yrl Bucks, Does, Fawns Adults & Fawns Limited Buck Permit
203 None None None Buck Only 204 None None None Unlimited Buck Permit
210 Trend Annual-PS Annual-SP
Ad & Yrl Bucks, Does, Fawns Adults & Fawns Limited Buck Permit
211 None None None Buck Only 212 None None None Unlimited Buck Permit 213 None None None Unlimited Buck Permit 214 None None None Unlimited Buck Permit 215 None None None Buck Only
216 Trend Annual-PS Annual-SP
Ad & Yrl Bucks, Does, Fawns Adults & Fawns Buck Only
240 None None None Unlimited Buck Permit 250 Trend Annual-PS Ad, Mature & Yrl Bucks, Does, Fawns Limited Buck Permit 260 None None None No Season 261 None None None Limited Buck Permit 270 Trend Annual-PS
Annual-SP Ad, Mature & Yrl Bucks, Does, Fawns
Adults & Fawns Limited Buck Permit
280 None None None Buck Only 281 None None None Unlimited Buck Permit 282 None None None Special Regulations 283 None None None Buck Only 284 None None None Archery Only 285 None None None Buck Only 290 None None None Archery Only
291 Trend Annual-PS Annual-SP
Ad & Yrl Bucks, Does, Fawns Adults & Fawns Limited Buck Permit
292 Trend Annual-PS Ad & Yrl Bucks, Does, Fawns Unlimited Buck Permit 293 None None None Buck Only
298 Census Annual-PS Annual-SP
Ad & Yrl Bucks, Does, Fawns Adults & Fawns Unlimited Buck Permit
1 SP=Spring, PS=Post Season 2 Ad=Adults, Yrl=Yearlings All biologists in R-2 classify mule deer to adult and yearling buck classes, does and fawns in the post season surveys and fawns and adults in the spring surveys. In addition one biologist (recently retired) also classifies adult bucks further to mature bucks with ≥ 4 points and all other adult bucks. Waypoint locations for each group of mule deer and track logs showing the survey flight pattern are collected and stored. Historically waypoint and track log data were downloaded from the GPS units through MapSource by 1 biologist and through DNR Garmin by the other 3 biologists. Historically classification and waypoint data were combined into data tables which were stored in Excel or shapefiles on 3 of the 4 biologists’ computers (Table 7). There are 3 check stations open in R-2 during the deer and elk hunting season (Figure 7). The Darby check station is open every day of the deer and elk season (37 days) while the Anaconda and Bonner check stations are each open for 12 days resulting in a total of 61 check station-days for the Region.
16
Table 7. Data collection and storage of historic flight data (prior to 2011) by R-2 biologists.
Biologist Upload Wpts & Track Logs
Classification Data Collected1
Program Used to Combine Classification & Location Data
Edwards DNR Garmin Post-Ad & Yrl Bucks, Does, Fawns Spring-Fawn & Adults ArcMap
Jourdonnais
DNR Garmin
Post-Ad, Yrl & Mature Bucks, Does, Fawns Fawn & Adults-Spring None
Kolbe DNR Garmin Post-Ad & Yrl Bucks, Does, Fawns Spring-Fawn & Adults Excel & ArcMap
Vinkey MapSource2 Post-Ad & Yrl Bucks, Does, Fawns Spring-Fawn & Adults Excel
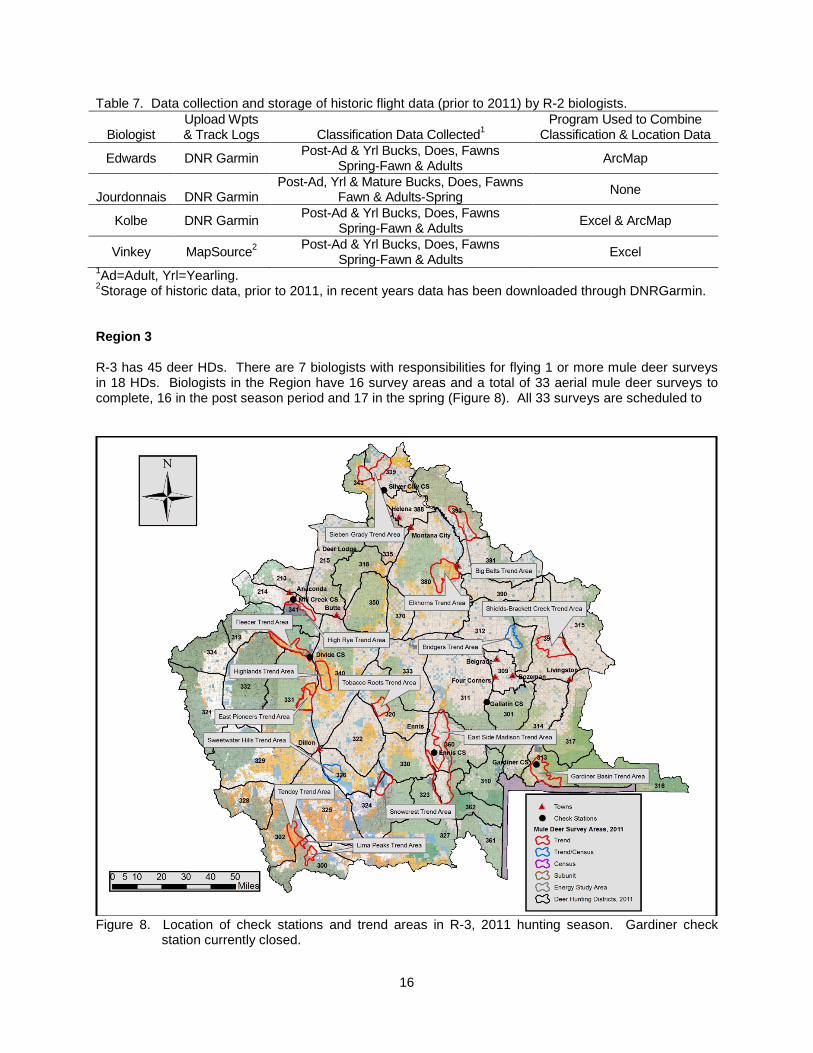
1Ad=Adult, Yrl=Yearling. 2Storage of historic data, prior to 2011, in recent years data has been downloaded through DNRGarmin. Region 3 R-3 has 45 deer HDs. There are 7 biologists with responsibilities for flying 1 or more mule deer surveys in 18 HDs. Biologists in the Region have 16 survey areas and a total of 33 aerial mule deer surveys to complete, 16 in the post season period and 17 in the spring (Figure 8). All 33 surveys are scheduled to
Figure 8. Location of check stations and trend areas in R-3, 2011 hunting season. Gardiner check
station currently closed.
17
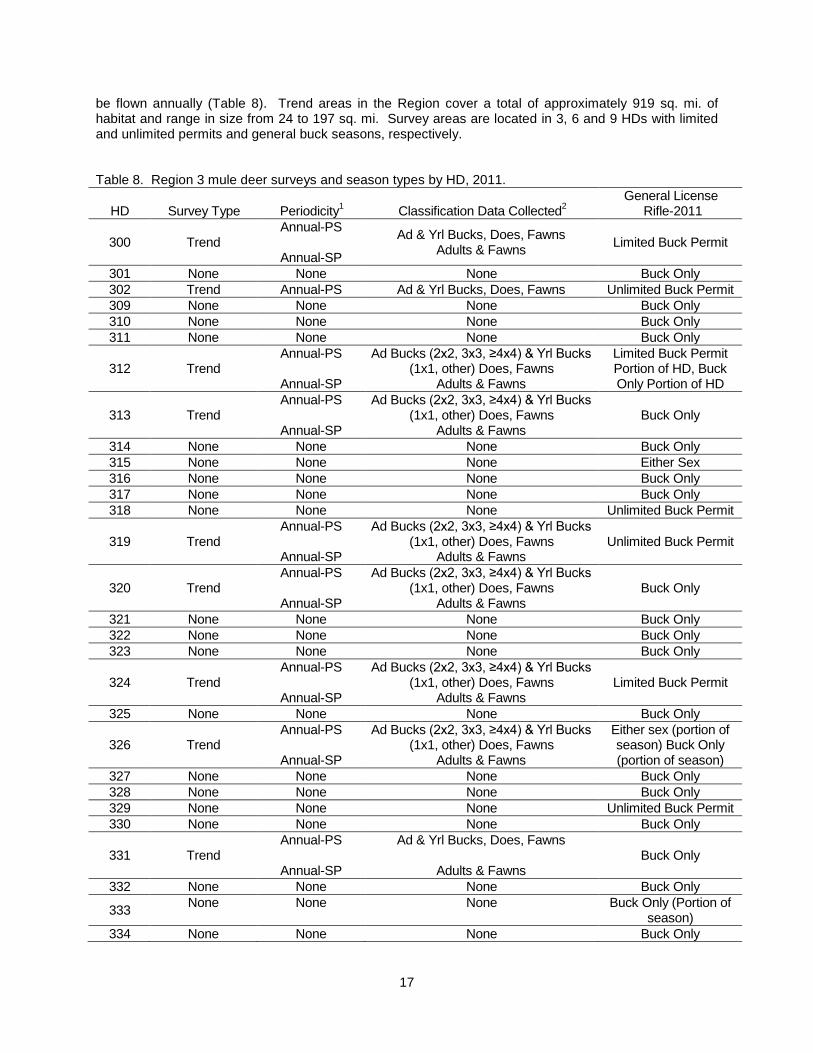
be flown annually (Table 8). Trend areas in the Region cover a total of approximately 919 sq. mi. of habitat and range in size from 24 to 197 sq. mi. Survey areas are located in 3, 6 and 9 HDs with limited and unlimited permits and general buck seasons, respectively. Table 8. Region 3 mule deer surveys and season types by HD, 2011.
HD
Survey Type
Periodicity1
Classification Data Collected2
General License Rifle-2011
300 Trend Annual-PS
Annual-SP
Ad & Yrl Bucks, Does, Fawns Adults & Fawns Limited Buck Permit
301 None None None Buck Only 302 Trend Annual-PS Ad & Yrl Bucks, Does, Fawns Unlimited Buck Permit 309 None None None Buck Only 310 None None None Buck Only 311 None None None Buck Only
312
Trend Annual-PS
Annual-SP
Ad Bucks (2x2, 3x3, ≥4x4) & Yrl Bucks (1x1, other) Does, Fawns
Adults & Fawns
Limited Buck Permit Portion of HD, Buck Only Portion of HD
313 Trend Annual-PS
Annual-SP
Ad Bucks (2x2, 3x3, ≥4x4) & Yrl Bucks (1x1, other) Does, Fawns
Adults & Fawns Buck Only
314 None None None Buck Only 315 None None None Either Sex 316 None None None Buck Only 317 None None None Buck Only 318 None None None Unlimited Buck Permit
319 Trend Annual-PS
Annual-SP
Ad Bucks (2x2, 3x3, ≥4x4) & Yrl Bucks (1x1, other) Does, Fawns
Adults & Fawns Unlimited Buck Permit
320 Trend Annual-PS
Annual-SP
Ad Bucks (2x2, 3x3, ≥4x4) & Yrl Bucks (1x1, other) Does, Fawns
Adults & Fawns Buck Only
321 None None None Buck Only 322 None None None Buck Only 323 None None None Buck Only
324 Trend Annual-PS
Annual-SP
Ad Bucks (2x2, 3x3, ≥4x4) & Yrl Bucks (1x1, other) Does, Fawns
Adults & Fawns Limited Buck Permit
325 None None None Buck Only
326 Trend Annual-PS
Annual-SP
Ad Bucks (2x2, 3x3, ≥4x4) & Yrl Bucks (1x1, other) Does, Fawns
Adults & Fawns
Either sex (portion of season) Buck Only (portion of season)
327 None None None Buck Only 328 None None None Buck Only 329 None None None Unlimited Buck Permit 330 None None None Buck Only
331 Trend Annual-PS
Annual-SP
Ad & Yrl Bucks, Does, Fawns
Adults & Fawns Buck Only
332 None None None Buck Only
333 None None None Buck Only (Portion of season)
334 None None None Buck Only

18
Table 8. (cont.) 335 None None None Unlimited Buck Permit
339
Trend Annual-PS
Annual-SP
Ad & Yrl Bucks, Does, Fawns
Adults & Fawns
Unlimited Buck Permit
HD
Survey Type
Periodicity1
Classification Data Collected2
General License Rifle-2011
340 Trend Annual-PS
Annual-SP
Ad Bucks (2x2, 3x3, ≥4x4) & Yrl Bucks (1x1, other) Does, Fawns
Adults & Fawns Buck Only
341 Trend Annual-PS
Annual-SP
Ad Bucks (2x2, 3x3, ≥4x4) & Yrl Bucks (1x1, other) Does, Fawns
Adults & Fawns Buck Only
343
Trend Annual-PS
Annual-SP
Ad & Yrl Bucks, Does, Fawns
Adults & Fawns
Unlimited Buck Permit
350 None None None Buck Only 360 Trend Annual-SP Adults & Fawns Buck Only 361 None None None Buck Only 362 Trend Annual-SP Adults & Fawns Buck Only 370 None None None Buck Only
380
Trend
Annual-PS
Annual-SP
Ad Bucks (2x2, 3x3, ≥4x4) & Yrl Bucks (1x1, other) Does, Fawns
Adults & Fawns Unlimited Buck Permit
388 None None None Either sex 390 None None None Buck Only 391 None None None Unlimited Buck Permit
392 Trend Annual-PS
Annual-SP
Ad Bucks (2x2, 3x3, ≥4x4) & Yrl Bucks (1x1, other) Does, Fawns
Adults & Fawns Unlimited Buck Permit
393 Trend Annual-PS
Annual-SP
Ad Bucks (2x2, 3x3, ≥4x4) & Yrl Bucks (1x1, other) Does, Fawns
Adults & Fawns Buck Only
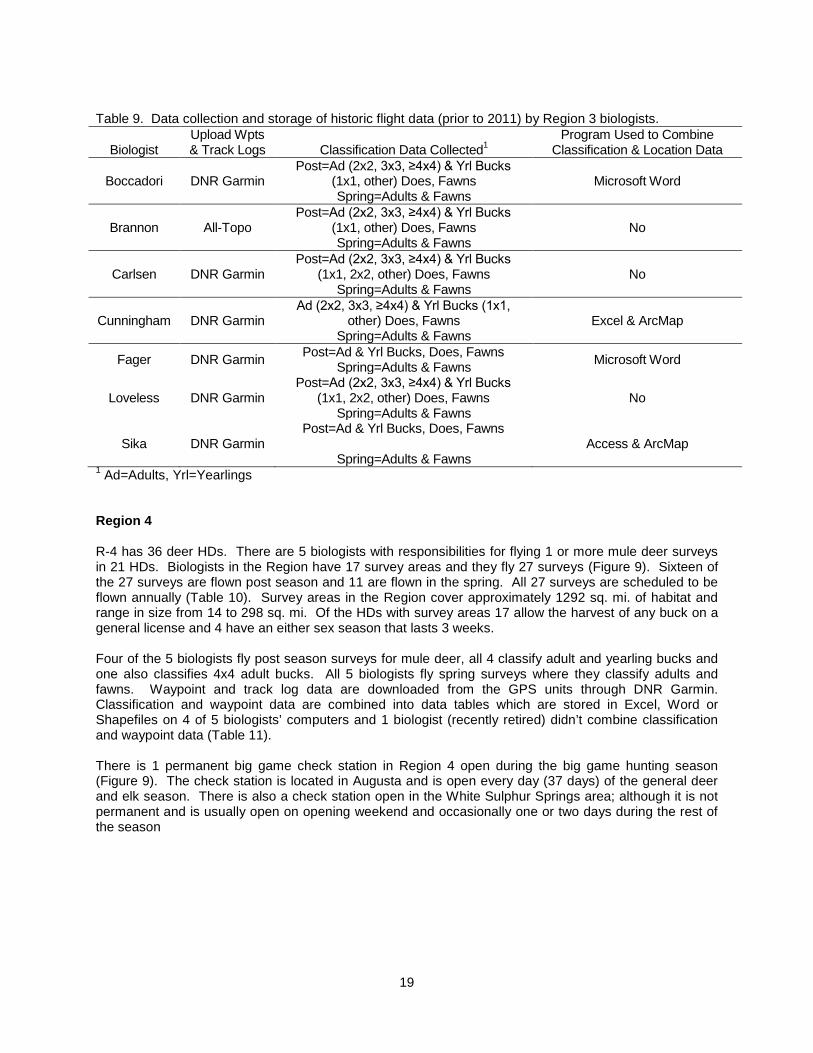
1 SP=Spring, PS=Post Season 2 Ad=Adults, Yrl=Yearlings Six of 7 biologists fly post season surveys, and 4 of those classify bucks by antler type; 2x2, 3x3, and 4x4, adults; along with 1x1 and 2x2 or other yearlings. Two biologists classify bucks to adult and yearling only. Historically, waypoint locations for each group of deer and track logs showing the survey flight pattern were collected and stored by all 7 biologists. Prior to 2011, waypoint and track log data were downloaded from GPS units through the program All-Topo by 1 biologist (recently retired) and through DNR Garmin by the other 6 biologists. Classification and waypoint data are combined into data tables which are stored in Excel, Access or shapefiles on 2 of 7 biologists’ computers, combined and stored in Microsoft Word on 2 biologists’ computers and 3 biologists do not combine classification and waypoint data (Table 9). There are 5 check stations open in R-3 during the deer and elk hunting season (Figure 8). All 5 check stations are open each weekend day of the season (12 days) for a total of 60 check station-days. The Gardiner check station has not been open since the late-season elk hunt in HD 313 was eliminated in 2010. In addition, the Ruby and Blacktail check stations were permanently closed in 2011.
19
Table 9. Data collection and storage of historic flight data (prior to 2011) by Region 3 biologists.
Biologist
Upload Wpts & Track Logs
Classification Data Collected1
Program Used to Combine Classification & Location Data
Boccadori DNR Garmin Post=Ad (2x2, 3x3, ≥4x4) & Yrl Bucks
(1x1, other) Does, Fawns Spring=Adults & Fawns
Microsoft Word
Brannon All-Topo Post=Ad (2x2, 3x3, ≥4x4) & Yrl Bucks
(1x1, other) Does, Fawns Spring=Adults & Fawns
No
Carlsen DNR Garmin Post=Ad (2x2, 3x3, ≥4x4) & Yrl Bucks
(1x1, 2x2, other) Does, Fawns Spring=Adults & Fawns
No
Cunningham DNR Garmin Ad (2x2, 3x3, ≥4x4) & Yrl Bucks (1x1,
other) Does, Fawns Spring=Adults & Fawns
Excel & ArcMap
Fager DNR Garmin Post=Ad & Yrl Bucks, Does, Fawns Spring=Adults & Fawns Microsoft Word
Loveless DNR Garmin Post=Ad (2x2, 3x3, ≥4x4) & Yrl Bucks
(1x1, 2x2, other) Does, Fawns Spring=Adults & Fawns
No
Sika DNR Garmin Post=Ad & Yrl Bucks, Does, Fawns
Spring=Adults & Fawns
Access & ArcMap
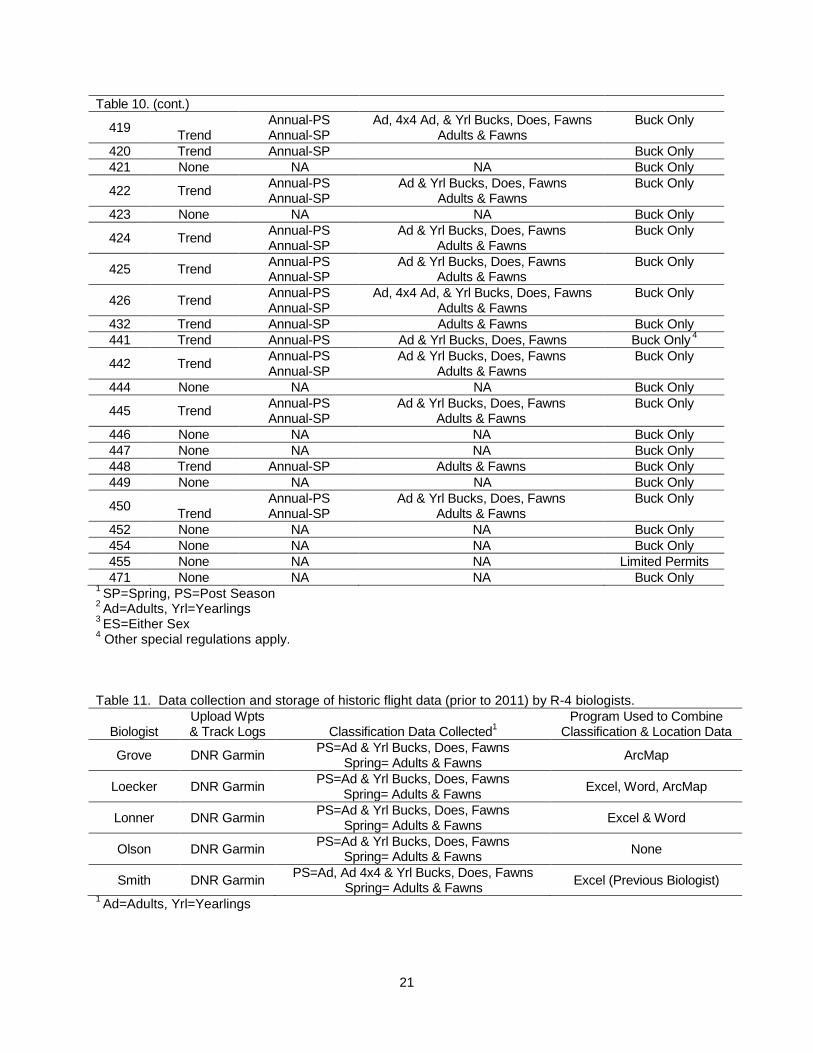
1 Ad=Adults, Yrl=Yearlings Region 4 R-4 has 36 deer HDs. There are 5 biologists with responsibilities for flying 1 or more mule deer surveys in 21 HDs. Biologists in the Region have 17 survey areas and they fly 27 surveys (Figure 9). Sixteen of the 27 surveys are flown post season and 11 are flown in the spring. All 27 surveys are scheduled to be flown annually (Table 10). Survey areas in the Region cover approximately 1292 sq. mi. of habitat and range in size from 14 to 298 sq. mi. Of the HDs with survey areas 17 allow the harvest of any buck on a general license and 4 have an either sex season that lasts 3 weeks. Four of the 5 biologists fly post season surveys for mule deer, all 4 classify adult and yearling bucks and one also classifies 4x4 adult bucks. All 5 biologists fly spring surveys where they classify adults and fawns. Waypoint and track log data are downloaded from the GPS units through DNR Garmin. Classification and waypoint data are combined into data tables which are stored in Excel, Word or Shapefiles on 4 of 5 biologists’ computers and 1 biologist (recently retired) didn’t combine classification and waypoint data (Table 11). There is 1 permanent big game check station in Region 4 open during the big game hunting season (Figure 9). The check station is located in Augusta and is open every day (37 days) of the general deer and elk season. There is also a check station open in the White Sulphur Springs area; although it is not permanent and is usually open on opening weekend and occasionally one or two days during the rest of the season

20
Figure 9. Location of permanent check stations and mule deer survey areas R-4, 2011 hunting season. Table 10. Region 4 mule deer surveys and season types by HD, 2011.
HD
Aerial Survey Type
Periodicity1
Classification Data Collected2
General License, Rifle-20113
400 Trend Annual-PS Ad & Yrl Bucks, Does, Fawns ES-3 Week
401 Trend Annual-PS Ad & Yrl Bucks, Does, Fawns ES-3 Week 403 Trend Annual-PS Ad & Yrl Bucks, Does, Fawns ES-3 Week 404 Trend Annual-PS Ad & Yrl Bucks, Does, Fawns Either Sex
405 Trend
Annual-PS Annual-SP
Ad & Yrl Bucks, Does, Fawns Adults & Fawns Buck Only
406 Trend Annual-PS Ad & Yrl Bucks, Does, Fawns ES-3 Week
410 Trend
Annual-PS Annual-SP
Ad, 4x4 Ad, & Yrl Bucks, Does, Fawns Adults & Fawns Buck Only
411 None NA NA Buck Only 412 None NA NA Buck Only
413 Trend Annual-PS Annual-SP
Ad & Yrl Bucks, Does, Fawns Adults & Fawns
Buck Only
415 None NA NA Buck Only 416 None NA NA Buck Only 417 None NA NA Buck Only 418 Trend Annual-SP Adults & Fawns Buck Only
21
Table 10. (cont.)
419 Trend
Annual-PS Annual-SP
Ad, 4x4 Ad, & Yrl Bucks, Does, Fawns Adults & Fawns
Buck Only
420 Trend Annual-SP Buck Only 421 None NA NA Buck Only
422 Trend Annual-PS Annual-SP
Ad & Yrl Bucks, Does, Fawns Adults & Fawns
Buck Only
423 None NA NA Buck Only
424 Trend Annual-PS Annual-SP
Ad & Yrl Bucks, Does, Fawns Adults & Fawns
Buck Only
425 Trend Annual-PS Annual-SP
Ad & Yrl Bucks, Does, Fawns Adults & Fawns
Buck Only
426 Trend Annual-PS Annual-SP
Ad, 4x4 Ad, & Yrl Bucks, Does, Fawns Adults & Fawns
Buck Only
432 Trend Annual-SP Adults & Fawns Buck Only 441 Trend Annual-PS Ad & Yrl Bucks, Does, Fawns Buck Only 4
442 Trend Annual-PS Annual-SP
Ad & Yrl Bucks, Does, Fawns Adults & Fawns
Buck Only
444 None NA NA Buck Only
445 Trend Annual-PS Annual-SP
Ad & Yrl Bucks, Does, Fawns Adults & Fawns
Buck Only
446 None NA NA Buck Only 447 None NA NA Buck Only 448 Trend Annual-SP Adults & Fawns Buck Only 449 None NA NA Buck Only
450 Trend
Annual-PS Annual-SP
Ad & Yrl Bucks, Does, Fawns Adults & Fawns
Buck Only
452 None NA NA Buck Only 454 None NA NA Buck Only 455 None NA NA Limited Permits
471 None NA NA Buck Only
1 SP=Spring, PS=Post Season 2 Ad=Adults, Yrl=Yearlings 3 ES=Either Sex 4 Other special regulations apply. Table 11. Data collection and storage of historic flight data (prior to 2011) by R-4 biologists.
Biologist
Upload Wpts & Track Logs
Classification Data Collected1
Program Used to Combine Classification & Location Data
Grove DNR Garmin PS=Ad & Yrl Bucks, Does, Fawns Spring= Adults & Fawns ArcMap
Loecker DNR Garmin PS=Ad & Yrl Bucks, Does, Fawns Spring= Adults & Fawns Excel, Word, ArcMap
Lonner DNR Garmin PS=Ad & Yrl Bucks, Does, Fawns Spring= Adults & Fawns Excel & Word
Olson DNR Garmin PS=Ad & Yrl Bucks, Does, Fawns Spring= Adults & Fawns None
Smith DNR Garmin PS=Ad, Ad 4x4 & Yrl Bucks, Does, Fawns Spring= Adults & Fawns Excel (Previous Biologist)
1 Ad=Adults, Yrl=Yearlings

22
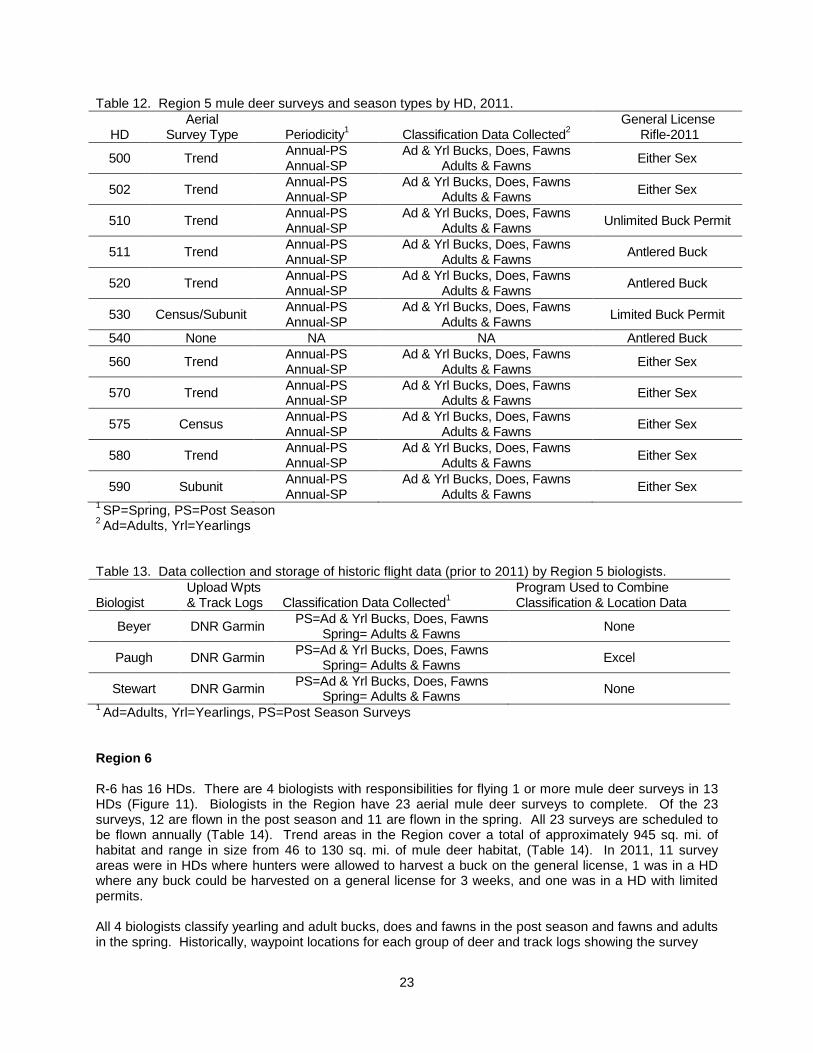
Region 5 R-5 has 12 deer HDs. There are 3 biologists with responsibilities for flying 1 or more mule deer surveys in 11 of the 12 HDs. Biologists in the Region have 12 trend areas, 2 census areas, 11 subunits and they fly 28 surveys each year (Figure 10). Fourteen of the 28 surveys are flown post season and 14 are flown in the spring. All 28 surveys are scheduled to be flown annually (Table 12). Trend and censes areas (subunits not included) in the Region cover a total of approximately 703 sq. mi. of habitat and range in size from 10 to 100 sq. mi. Surveys are flown in 1 HD with limited permits, 1 HD with unlimited permits and in 9 HDs that allow the harvest of any buck on a general license
Figure 10. Location of check stations and mule deer survey areas R-5, 2011 hunting season. All 3 biologists classify yearling and adult bucks, does and fawns in the post season and fawns and adults in the spring. Waypoint locations for each group of deer and track logs showing the survey flight pattern are collected and stored by all 3 biologists. Historically, waypoint and track log data were downloaded from the GPS units through DNR Garmin. Prior to 2011, classification and waypoint data were combined into data tables which were stored in Excel on 1 of 3 biologists’ computers (Table 13). There are 4 permanent big game check stations open in R-5 during the deer and elk hunting season (Figure 10). The Big Timber, Columbus, Laurel and Lavina check stations are open 8, 12, 6 and 8 days, respectively for a total of 34 check station-days during the deer and elk hunting season.
23
Table 12. Region 5 mule deer surveys and season types by HD, 2011.
HD Aerial
Survey Type
Periodicity1
Classification Data Collected2 General License
Rifle-2011
500 Trend Annual-PS Annual-SP
Ad & Yrl Bucks, Does, Fawns Adults & Fawns Either Sex
502 Trend Annual-PS Annual-SP
Ad & Yrl Bucks, Does, Fawns Adults & Fawns Either Sex
510 Trend Annual-PS Annual-SP
Ad & Yrl Bucks, Does, Fawns Adults & Fawns Unlimited Buck Permit
511 Trend Annual-PS Annual-SP
Ad & Yrl Bucks, Does, Fawns Adults & Fawns Antlered Buck
520 Trend Annual-PS Annual-SP
Ad & Yrl Bucks, Does, Fawns Adults & Fawns Antlered Buck
530 Census/Subunit Annual-PS Annual-SP
Ad & Yrl Bucks, Does, Fawns Adults & Fawns Limited Buck Permit
540 None NA NA Antlered Buck
560 Trend Annual-PS Annual-SP
Ad & Yrl Bucks, Does, Fawns Adults & Fawns Either Sex
570 Trend Annual-PS Annual-SP
Ad & Yrl Bucks, Does, Fawns Adults & Fawns Either Sex
575 Census Annual-PS Annual-SP
Ad & Yrl Bucks, Does, Fawns Adults & Fawns Either Sex
580 Trend Annual-PS Annual-SP
Ad & Yrl Bucks, Does, Fawns Adults & Fawns Either Sex
590 Subunit Annual-PS Annual-SP
Ad & Yrl Bucks, Does, Fawns Adults & Fawns Either Sex
1 SP=Spring, PS=Post Season 2 Ad=Adults, Yrl=Yearlings Table 13. Data collection and storage of historic flight data (prior to 2011) by Region 5 biologists. Biologist
Upload Wpts & Track Logs
Classification Data Collected1
Program Used to Combine Classification & Location Data
Beyer DNR Garmin PS=Ad & Yrl Bucks, Does, Fawns Spring= Adults & Fawns None
Paugh DNR Garmin PS=Ad & Yrl Bucks, Does, Fawns Spring= Adults & Fawns Excel
Stewart DNR Garmin PS=Ad & Yrl Bucks, Does, Fawns Spring= Adults & Fawns None
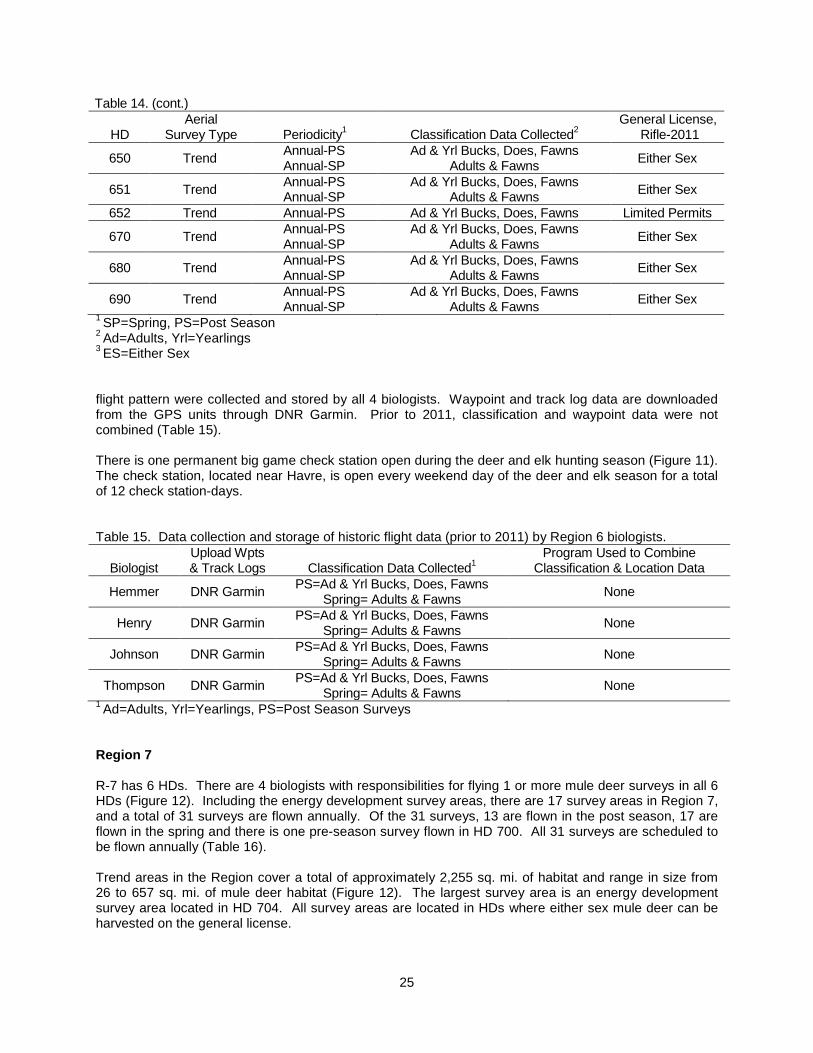
1 Ad=Adults, Yrl=Yearlings, PS=Post Season Surveys Region 6 R-6 has 16 HDs. There are 4 biologists with responsibilities for flying 1 or more mule deer surveys in 13 HDs (Figure 11). Biologists in the Region have 23 aerial mule deer surveys to complete. Of the 23 surveys, 12 are flown in the post season and 11 are flown in the spring. All 23 surveys are scheduled to be flown annually (Table 14). Trend areas in the Region cover a total of approximately 945 sq. mi. of habitat and range in size from 46 to 130 sq. mi. of mule deer habitat, (Table 14). In 2011, 11 survey areas were in HDs where hunters were allowed to harvest a buck on the general license, 1 was in a HD where any buck could be harvested on a general license for 3 weeks, and one was in a HD with limited permits. All 4 biologists classify yearling and adult bucks, does and fawns in the post season and fawns and adults in the spring. Historically, waypoint locations for each group of deer and track logs showing the survey

24
Figure 11. Location of check station and survey areas R-6, 2011 hunting season. Table 14. Region 6 mule deer surveys and season types by HD, 2011.
HD
Aerial Survey Type
Periodicity1
Classification Data Collected2
General License, Rifle-2011
600 Trend Annual-PS Annual-SP
Ad & Yrl Bucks, Does, Fawns Adults & Fawns Either Sex
611 Trend Annual-PS Annual-SP
Ad & Yrl Bucks, Does, Fawns Adults & Fawns Either Sex
620 Trend Annual-PS Annual-SP
Ad & Yrl Bucks, Does, Fawns Adults & Fawns Either Sex
621 Trend Annual-PS Annual-SP
Ad & Yrl Bucks, Does, Fawns Adults & Fawns Either Sex
622 None NA NA Either Sex
630 Trend Annual-PS Annual-SP
Ad & Yrl Bucks, Does, Fawns Adults & Fawns Either Sex
631 None NA NA Either Sex
632 Trend Annual-PS Annual-SP
Ad & Yrl Bucks, Does, Fawns Adults & Fawns Either Sex
640 Trend Annual-PS Annual-SP
Ad & Yrl Bucks, Does, Fawns Adults & Fawns ES 3 Weeks3
641 None NA NA Either Sex
25
Table 14. (cont.)
HD Aerial
Survey Type
Periodicity1
Classification Data Collected2 General License,
Rifle-2011
650 Trend Annual-PS Annual-SP
Ad & Yrl Bucks, Does, Fawns Adults & Fawns Either Sex
651 Trend Annual-PS Annual-SP
Ad & Yrl Bucks, Does, Fawns Adults & Fawns Either Sex
652 Trend Annual-PS Ad & Yrl Bucks, Does, Fawns Limited Permits
670 Trend Annual-PS Annual-SP
Ad & Yrl Bucks, Does, Fawns Adults & Fawns Either Sex
680 Trend Annual-PS Annual-SP
Ad & Yrl Bucks, Does, Fawns Adults & Fawns Either Sex
690 Trend Annual-PS Annual-SP
Ad & Yrl Bucks, Does, Fawns Adults & Fawns Either Sex
1 SP=Spring, PS=Post Season 2 Ad=Adults, Yrl=Yearlings 3 ES=Either Sex flight pattern were collected and stored by all 4 biologists. Waypoint and track log data are downloaded from the GPS units through DNR Garmin. Prior to 2011, classification and waypoint data were not combined (Table 15). There is one permanent big game check station open during the deer and elk hunting season (Figure 11). The check station, located near Havre, is open every weekend day of the deer and elk season for a total of 12 check station-days. Table 15. Data collection and storage of historic flight data (prior to 2011) by Region 6 biologists.
Biologist
Upload Wpts & Track Logs
Classification Data Collected1
Program Used to Combine Classification & Location Data
Hemmer DNR Garmin PS=Ad & Yrl Bucks, Does, Fawns Spring= Adults & Fawns None
Henry DNR Garmin PS=Ad & Yrl Bucks, Does, Fawns Spring= Adults & Fawns None
Johnson DNR Garmin PS=Ad & Yrl Bucks, Does, Fawns Spring= Adults & Fawns None
Thompson DNR Garmin PS=Ad & Yrl Bucks, Does, Fawns Spring= Adults & Fawns None
1 Ad=Adults, Yrl=Yearlings, PS=Post Season Surveys Region 7 R-7 has 6 HDs. There are 4 biologists with responsibilities for flying 1 or more mule deer surveys in all 6 HDs (Figure 12). Including the energy development survey areas, there are 17 survey areas in Region 7, and a total of 31 surveys are flown annually. Of the 31 surveys, 13 are flown in the post season, 17 are flown in the spring and there is one pre-season survey flown in HD 700. All 31 surveys are scheduled to be flown annually (Table 16). Trend areas in the Region cover a total of approximately 2,255 sq. mi. of habitat and range in size from 26 to 657 sq. mi. of mule deer habitat (Figure 12). The largest survey area is an energy development survey area located in HD 704. All survey areas are located in HDs where either sex mule deer can be harvested on the general license.
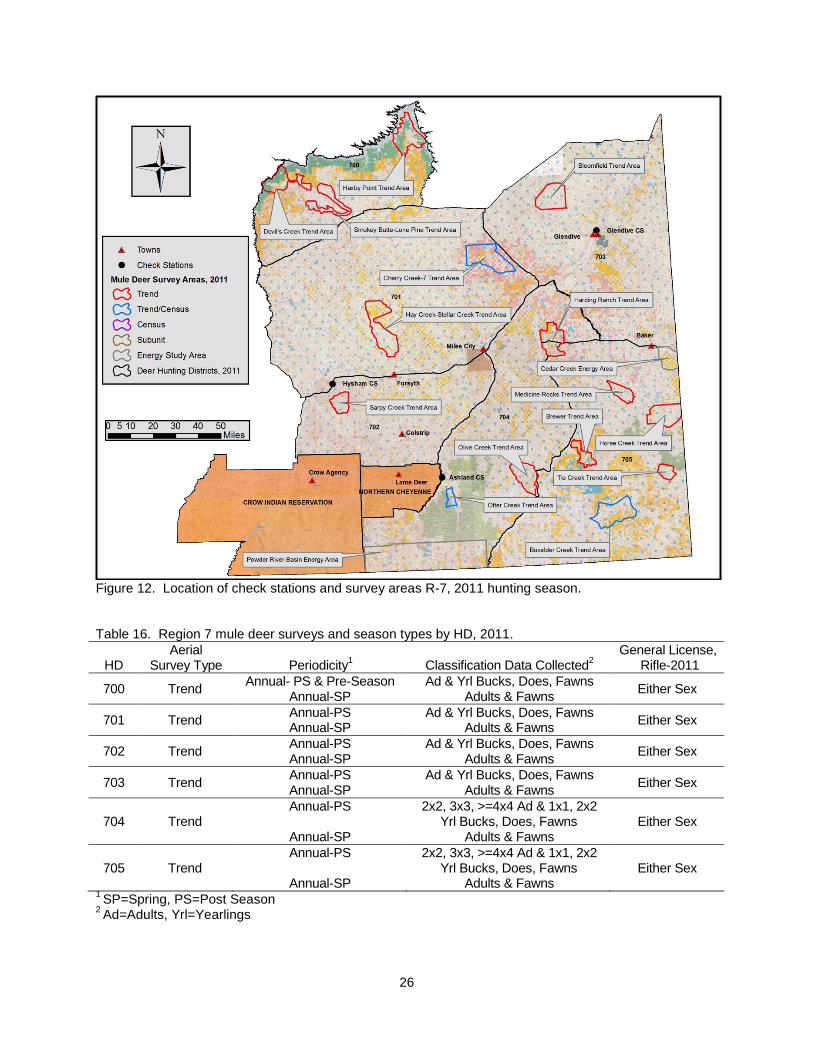
26
Figure 12. Location of check stations and survey areas R-7, 2011 hunting season. Table 16. Region 7 mule deer surveys and season types by HD, 2011.
HD
Aerial Survey Type
Periodicity1
Classification Data Collected2
General License, Rifle-2011
700 Trend Annual- PS & Pre-Season Annual-SP
Ad & Yrl Bucks, Does, Fawns Adults & Fawns Either Sex
701 Trend Annual-PS Annual-SP
Ad & Yrl Bucks, Does, Fawns Adults & Fawns Either Sex
702 Trend Annual-PS Annual-SP
Ad & Yrl Bucks, Does, Fawns Adults & Fawns Either Sex
703 Trend Annual-PS Annual-SP
Ad & Yrl Bucks, Does, Fawns Adults & Fawns Either Sex
704 Trend Annual-PS
Annual-SP
2x2, 3x3, >=4x4 Ad & 1x1, 2x2 Yrl Bucks, Does, Fawns
Adults & Fawns Either Sex
705 Trend Annual-PS
Annual-SP
2x2, 3x3, >=4x4 Ad & 1x1, 2x2 Yrl Bucks, Does, Fawns
Adults & Fawns Either Sex
1 SP=Spring, PS=Post Season 2 Ad=Adults, Yrl=Yearlings

27
All 4 biologists classify adult and yearling bucks, does and fawns in the post-season survey period and adults and fawns in the spring (Table 17). In addition, one biologist breaks out spike and 2x2 yearling bucks, and 2X2, 3X3, and >=4x4 adult bucks. Historic waypoint locations for each group of mule deer and track logs showing the survey flight pattern were collected and stored by 3 of 4 biologists. The waypoint and track log data were downloaded from the GPS units through DNR Garmin. Historically classification and waypoint data were not combined into data tables (Table 17). There are 3 permanent big game check stations open in R-7 located near Hysham, Glendive and Ashland during the deer and elk hunting season (Figure 12). These check stations are open a total of 18 days during the deer and elk season, 2 days at Ashland, 4 days at Glendive and 12 days at Hysham . Table 17. Data collection and storage of historic flight data (prior to 2011).
Biologist
Upload Wpts & Track Logs
Classification Data Collected1
Program Used to Combine Classification & Location Data
Burt NA PS=Ad & Yrl Bucks, Does, Fawns Spring= Adults & Fawns None
Denson NA PS=Ad & Yrl Bucks, Does, Fawns Spring= Adults & Fawns None
Hildebrand DNR Garmin PS=Ad & Yrl Bucks, Does, Fawns Spring= Adults & Fawns None
Waltee DNR Garmin PS=2x2, 3x3, >=4x4 Ad & 1x1, 2x2
Yrl Bucks, Does, Fawns Spring= Adults & Fawns
None
1 PS=Post Season, Ad=Adults, Yrl=Yearlings Uses of Deer S&I Data The primary use for deer survey and check station data is to provide information for managers to make annual and biennial recommendations for season setting. Season setting for deer is done on a biennial basis. Every other year, adjustments can be made to the structure of the season. For example whether or not general license holders can harvest any buck, either-sex, or antlerless deer and to deer/elk HD boundaries. Every year adjustments, other than for emergencies, can be made to the permit and b-license numbers. As with season setting for other big game animals, biologists use a combination of flight survey data, check station data, harvest survey estimates and discussions with landowners, sportsmen and game wardens to support their season recommendations for Commission decisions. In some cases, not all of these sets of data are available for the decision making process. In the best-case season setting situation, biologists would have an estimate of how many animals were going to be available to harvest at the time the rifle season (when a majority of the animals will be harvested); 6-7 months after most surveys are completed. Biologists would also know how many licenses issued would result in 1 mule deer being harvested, the success rates of hunters, and the number of landowners that were going to allow access to the animals and/or the numbers of deer on public lands. In addition, they would be able to accurately predict survival rates through the rest of the winter, spring and summer, emigration and immigration rates, and the number of fawns produced in the spring after surveys are completed. Biologists rarely encounter the best-case scenario for season setting, and the S&I program has evolved over time to gather information that gives a sufficient look at the parameters most needed to set seasons within a limited budget, under existing manpower limitations and in a timely fashion. Season setting is difficult, and biologists and game managers are charged with using their observations to predict the future for large complex systems that are under a continual state of change. In addition, season setting for mule deer may be more difficult than for antelope and elk because FWP survey methods do not generate very good population estimates for deer, deer inhabit less open areas than antelope, and deer are usually found in smaller groups in the winter than elk. These factors make it difficult to do complete coverage surveys of entire HDs or populations of mule deer. Biologists have pointed out the difficulty in estimating actual populations of big game animals (MDFWP, 2005), and for mule deer they have settled on surveying trend areas to index the relative change in

28
population numbers over long time periods. Biologists know that complete coverage surveys usually undercount the actual numbers of animals. However, by conducting surveys under similar weather conditions, at specific times of the year, and with trained biologists and pilots, biologists try to eliminate as much sampling variability as possible so that trend counts are well correlated to actual numbers. Even though care is taken to reduce sampling variability, sometimes survey conditions necessitate cautious treatment of particular counts. When considering season changes biologists look for trends in various population parameters that point in the same direction. Interpretation of data collected is not always straightforward, and in some cases trends that should logically be headed in the same direction are not. Mule deer season setting justifications contain a variety of information, somewhat dependent upon what data are collected in the given year and the proposed change. In addition, some data collected on an annual basis may not be applicable to the proposed season change and therefore would not be included in the justification. Indicators of mule deer population status and corresponding regulation categories are described in the AHM document. All PMUs have liberal, standard and conservative season types and the indicators of mule deer population status are used to help determine which season type is recommended. In addition, some special management HDs have population objectives that are different than in the rest of the PMU. Those population indicators that keep the season type in a standard season type are treated like objectives (Table 18). Consider 5 individual HDs and one group of 3 HDs where changes to mule deer hunting seasons for the 2012 hunting season were proposed (Table 18). In all cases the manager that submitted the recommended change looked at more than 1 trend when justifying the change in the season. However, Table 18. Typical data analyzed to inform mule deer hunting season change justifications for the 2012
season. Standard season type is treated as the objective. Hunting Districts
210 281,283, 285 329 500 575 640
Parameter Special Mgt
District Northwest Montane
Mountain Foothills
Prairie/Breaks
Prairie/Breaks
Prairie/Breaks
Population Obj.1
NC3 ±25% of LTA1 ±25% of LTA +20% to -30% of LTA
+20% to -30% of LTA
+20% to -30% of LTA
Pop Obs. NC3 NC3 NC3 31% below LTA 37% below LTA 73% above LTA Buck Harvest Obj.1 Not an Obj. ±25% of LTA ±25% of LTA ±25% of LTA ±25% of LTA ±25% of LTA Buck Harvest Obs. Not an Obj. Below NU 29% below LTA 27% below LTA NU Spring Fawns:100
Adults Obj. 1 Not an Obj. >30:100 >30:00 30-60:100 30-60:100 30-60:100
Spring Fawns:100 Adults Obs.1
Not an Obj. NU3 33:100 30:100 16:100 68:100
Buck:doe ratio Obj. 1 ≥40:100 ≥10:100 ≥10:100 Not an Obj. Not an Obj. Not an Obj. Buck:doe ratio Obs. 19:100 NU NU NU NU NU Yrl:buck:doe ratio
Obj.1 Not an Obj. ±25% of LTA ±25% of LTA Not an Obj. Not an Obj. Not an Obj.
Obs. Yrl buck:doe ratio Obs.1
NU3 NC3 NC3 NU3 NU3 NC3
Harvest of ≥4pts Obj.1
30% ≥4 Pts2 ≥25% ≥25% Not an Obj. Not an Obj. Not an Obj.
Harvest of ≥4 pts Obs.1
39.7% NU3 NU3 NU3 NU3 NU3
Harvest Age Obj.1 ≥30% ≥4 years old
Not an Obj. Not an Obj. Not an Obj. Not an Obj. Not an Obj.
Age Obs.1 See Antler Pts
NC3 NC3 NU3 NU3 NU3
Season Change Proposed
Reduce Permits for Bucks from 100 to 50
Decrease B-licenses from
25 to 0
Increase the number of b-licenses from
0 to 25
Change from ES to antlered
buck
Change from ES to Antlered
Buck
Change from 3-week ES to 5
week ES
1Obs=Observed, Obj.=Objective for standard season type, LTA=Long-term average, Pts=Points 2Used antler points to approximate 4 year old bucks. 3NU=Not used in justification but available, NC=Not collected.
29
depending upon the proposal, biologists chose to present data most applicable to the particular change. Not all HDs have trend or census areas and in those HDs the manager generally looks at buck harvest to estimate trends in the populations. In 3 of the 6 proposals managers looked at populations on the trend areas relative to the long-term average (LTA). In HD 500 and 575, the trend area counts indicated populations were 31% and 37% below the LTA, respectively. In those same HDs a second population indicator, buck harvest, showed that harvests were 29% and 27% below the LTA, respectively. In addition, fawn:adult ratios were low in both of these HDs. With these three trends all pointing in the same direction and falling at or outside the range adopted for a standard season in a prairie/breaks habitat type it was fairly easy to recommend that the HDs be put into a restrictive season type (antlered buck). In HD 640, surveys on the trend area indicated that the population trend was 73% above the LTA and that the fawn:adult ratio was very high, 68:100. These two factors along with the fact that game damage complaints had increased in this HD led the manager to recommend that the HD be put in the liberal season type, which is either sex on the general license along with issuing antlerless licenses. HD 210 is a special management district. Objectives in special management districts are different than in HDs where hunters can usually kill a buck or either sex animal with a general license. In HD 210 there are objectives for post-season buck:doe ratios (40:100) and number of bucks ≥4 years old in the harvest. In this case the sample size of bucks checked at the check station from HD 210 is quite small so the biologist uses the harvest of 4 points as an indicator of age (e.g. a 4 by 4 is considered to be equivalent to a buck ≥4 years old) The post-season buck:doe ratio was well below objective and although the number of bucks 4 years old or older was estimated to be within objective (39.7%) the numbers of mature bucks harvested has dropped 50% in recent years, from a high of 50 in 2006 to 25 in 2010. The final change we looked at was for 3 HDs in Region 2 that decreased the number of b-licenses from 25 to 0. Although exact numbers were not presented in the justification buck harvest in all 3 HDs was lower than 25% below the LTA and near historic lows indicating that these HDs should be in the restrictive season type. When reading through season justifications it appears that biologists tend to rely more heavily on trend counts or complete coverage surveys for antelope and elk season justifications than they do for mule deer justifications. This is related to the fact that mule deer are often more ubiquitously distributed, inhabit timbered habitats, and are often found in smaller groups, making it more difficult to survey these animals. Biologists tend to rely more on harvest information when setting seasons for mule deer than with some other big game species. It is also apparent that spring fawn:adult ratios are very important to informing hunting season decisions. In 4 of the 6 justifications managers discuss the observed fawn:adult ratio (Table 18) and in the other two justifications qualitative reference was made to this parameter. Fawn:adult ratios are so important because the numbers of fawns in the population speaks not only to the productivity in a given year but to the productivity of the habitat, winter severity and possibly the effects of predation where the population resides. In addition, fawn:adult ratios collected in the spring can help predict how many mule deer might be recruited into the following year’s population. Buck:doe ratios or the raw number of bucks are routinely used to inform hunting season decisions. Biologists use buck:doe ratios to monitor trends in buck numbers which is of interest to that portion of the hunting public that wants to kill a buck and to those hunters that specifically hunt trophy mule deer. In the Northwest Montane PMU, the Mountain Foothills PMU, and the special management HDs there are objectives/triggers for mule deer bucks. In the Northwest Montane and Mountain Foothills, the triggers will move the season type on bucks to a restrictive season (unlimited buck permits) if buck numbers drop below the defined thresholds. Finally, changes in seasons are also affected by what has happened in years prior to the current season change. In Region 2 long-term trends in mule deer numbers have been down and in Region 5 short-term trends also indicate a downward slide in numbers. In HD 329, even though the current trends in the population suggested staying in a very restrictive package the biologist for that area stated “The 2008 decline in mule deer numbers was a recurring cycle. The die-off event likely marked the passing of strong age cohorts that were born following the last major population decline in 1997. This proposal is an attempt to time the cycle and be prepared as mule deer populations recover from
30
their recent lows.” The expectation of the biologist responsible for management in HD 329 was that mule deer numbers were likely to start increasing. Check stations are also a part of the S&I program, and data are collected at check stations on an annual basis. Check station data, when sample sizes are large enough, are used to verify the accuracy of the hunter harvest survey data and to provide real-time information about harvest during the hunting season (harvest estimates are not released until several months after the rifle season closes). In addition, check stations give biologists an opportunity to interview many hunters in the field and to get their observations of population trends of mule deer. In the 6 season justifications reviewed here (Table 18), none used check station information although in some cases it was available for use. Most biologists discussed how important hunter contacts were and how check stations gave them an opportunity to talk to a large number of hunters that hunt in a wide variety of habitats. Hunters helped to confirm or dispel observations made in the previous year from the air. Check station data also provides an alternative index to recruitment (if samples are large enough), as the data provide an index to the proportion of female yearlings in the female harvest, a general age structure of the population, and an index to hunter success. In addition, check stations are sometimes used to gather biological information that includes parameters on health. Check stations have been used as a place to survey hunters about their preferences for hunting, and other wildlife observations (e.g., wolf or moose observations). In recent years check stations in the western part of state have become a place for hunters to vent their frustrations about wolves in areas that they hunt. Many hunters are now blaming wolves for their lack of success, and many believe that they are the cause for perceived or real population declines in mule deer and elk. Check station data also inform biologists on where animals are being harvested and hunter access problems; many check stations gather data on private versus public land use and/or how many hunters are hunting on BMAs. Besides using survey and check station data, managers rely on statewide harvest survey data collected through telephone surveys to help set seasons on an annual basis. Harvest estimates are used by biologists to help confirm trends that they are observing in the field and buck harvest is often used as an index to population trends. Success rates are an important factor in season setting as they may indicate an increasing or decreasing availability of mule deer or change in the numbers of mule deer in the population. In some cases, success rates might indicate environmental conditions that increased or decreased harvest. Information about numbers and classes of animals harvested gives biologists additional data to estimate how many harvested animals are likely to result for each license issued, or other similar metrics of the effects of seasons implemented in previous years, which helps to inform recommendations for season changes. Finally, season setting also has to take into consideration hunter access to the animals, hunter preferences and land-owner tolerance of both hunters and animals. Data on land-owner tolerance of both hunters and deer may be the most difficult data to gather and often there is no systematic method to collection and use of those data. Mule deer can cause crop and fence damage, especially in irrigated croplands. In many cases the assumption is made that data collected, such as hunter success rates, are surrogates for things such as land-owner tolerance of hunters or availability of mule deer to hunters. In some cases parameters like this can mean or be interpreted as one issue in one area and something different in another. Interpretation of these data can be difficult and is open to more criticism than other data collected. Most biologists believed that the second most important use of the S&I data, beyond season-setting, was for informing sportsmen, FWP personnel, landowners and others in the general public about deer population trends. The public has an expectation that our management of wildlife populations is based on scientific knowledge of wildlife populations. In the areas of the state where wolf populations have become well established, declines in mule deer populations or fawn:adult ratios are being used to justify more liberal wolf, lion, and black bear seasons in some areas. There were many other diverse uses for the survey data collected including descriptions of mule deer numbers and trends in land purchase proposals, in comments on proposed state and federal land exchange projects, in comments on subdivisions, for
31
newspaper articles, in comments on state land uses such as grazing changes or timber harvests, timber sales on forest service lands and to inform comments on oil and gas leases and oil and gas drilling. Data collected in MFWP surveys are used to speak towards potential effects of timber harvest, open road densities, and recreation effects on mule deer harvest. In some cases funding for our survey flights comes from sources such as the oil and gas industry and may be used to describe potential impacts or to inform mitigation. Finally, biologists stressed the importance of having long-term trend data available for informed comment on unforeseen developments into the future.
LITERATURE CITED
Hamlin, K. L., David F. Pac, Carolyn A. Sime, Richard M. DeSimone and Gary L. Dusek. 2000. Evaluating the Accuracy of Ages Obtained by Two Methods for Montana Ungulates. Journal of Wildlife Management 64(2): 441-449. Montana Department of Fish, Wildlife and Parks. 2001. Adaptive harvest management. Montana Department of Fish, Wildlife and Parks, Helena, MT, 59620 USA. Montana Department of Fish, Wildlife and Parks. 2005. Montana final elk management plan, January 2005. Montana Department of Fish, Wildlife and Parks, Helena, MT, 59620 USA. Montana Working Group. 2005. Management plan and conservation strategies for sage grouse in Montana-final. Montana Department of Fish, Wildlife and Parks, Helena, MT, 59620 USA. Montana Department of Fish, Wildlife and Parks. 2006. Montana Fish, Wildlife and Parks wildlife division survey and inventory evaluation, May 2006. Montana Department of Fish, Wildlife and Parks, Helena, MT, 59620 USA. Montana Department of Fish, Wildlife and Parks. 2010. Montana bighorn sheep conservation strategy. Montana Department of Fish, Wildlife and Parks, Helena, MT, 59620 USA. Quimby, D. C., and J. E. Gaab. 1957. Mandibular dentition as an age indicator in Rocky Mountain elk. Journal of Wildlife Management 21:435–451. Robinette, W. L., D. A. Jones, G. Rogers, and J.S. Gashwiler. 1957. Notes on tooth development and wear for Rocky Mountain mule deer. Journal of Wildlife Management 21:134–153. Severinghaus, C. W. 1949. Tooth development and wear as criteria of age in white-tailed deer. Journal of Wildlife Management 13:195–215.


![[PVG] Hannah Montana - Hannah Montana 3](https://static.fdocuments.net/doc/165x107/56d6bf381a28ab30169562c0/pvg-hannah-montana-hannah-montana-3.jpg)


