SURPRISE! MOST BLOCKBUSTER JURY AWARDS ARE IGNORED …leeds-faculty.colorado.edu/palmerm/Blockbuster...
23
SURPRISE! MOST BLOCKBUSTER JURY AWARDS ARE IGNORED BY THE STOCK MARKET γ Michael Palmer* University of Colorado Thomas B. Sanders** University of Miami ABSTRACT Utilizing a master list produced by Viscusi (2004) of what he called "blockbuster" jury awards -- those amounting to $100 million or more, -- we selected 17 cases where the defendant had traded shares (we excluded the tobacco cases) to see the stock market reaction to these announced awards. Utilizing event study technologies similar to those used by Prince and Rubin (2002), and looking at both case filing and award date data, we generally found trivial stock market effects for 11 of the 17 companies, despite the size of the awards. In those cases where there was a stock market response, it occurred with firms whose total award to market capitalization ratio was in excess of 9%. Apparently the awards, which on their face value seem large, are not always that important when one considers the much larger market capitalization and the fact that these very large, prominent defendant firms are under almost constant litigation, with the blockbuster being only one of many cases facing the firm. JEL Classification: G14, K13. Keywords: Event study, blockbuster, product liability litigation, punitive damages, compensatory damages, reputational loss, dummy variable method, market adjustment method. γ We are grateful to Ben Bleustein, Pat Pardo, Pam Lucken, and Bill Landsea for research assistance. We are especially grateful for comments from the anonymous reviewer. *University of Colorado, Leeds School of Business, Boulder, CO 80309. Phone: 303 492 4241. Email: [email protected] . **Corresponding author: University of Miami, Finance Department, 514 Jenkins, Coral Gables, FL 33124. Phone: 904 993 9031. Fax: 305 284 4300. Email: [email protected]
Transcript of SURPRISE! MOST BLOCKBUSTER JURY AWARDS ARE IGNORED …leeds-faculty.colorado.edu/palmerm/Blockbuster...

SURPRISE! MOST BLOCKBUSTER JURY AWARDS ARE IGNORED B Y THE STOCK MARKET γ Michael Palmer* University of Colorado Thomas B. Sanders** University of Miami
ABSTRACT Utilizing a master list produced by Viscusi (2004) of what he called "blockbuster" jury awards -- those amounting to $100 million or more, -- we selected 17 cases where the defendant had traded shares (we excluded the tobacco cases) to see the stock market reaction to these announced awards. Utilizing event study technologies similar to those used by Prince and Rubin (2002), and looking at both case filing and award date data, we generally found trivial stock market effects for 11 of the 17 companies, despite the size of the awards. In those cases where there was a stock market response, it occurred with firms whose total award to market capitalization ratio was in excess of 9%. Apparently the awards, which on their face value seem large, are not always that important when one considers the much larger market capitalization and the fact that these very large, prominent defendant firms are under almost constant litigation, with the blockbuster being only one of many cases facing the firm. JEL Classification: G14, K13. Keywords: Event study, blockbuster, product liability litigation, punitive damages, compensatory damages, reputational loss, dummy variable method, market adjustment method. γ We are grateful to Ben Bleustein, Pat Pardo, Pam Lucken, and Bill Landsea for research assistance. We are especially grateful for comments from the anonymous reviewer.
*University of Colorado, Leeds School of Business, Boulder, CO 80309. Phone: 303 492 4241. Email: [email protected]. **Corresponding author: University of Miami, Finance Department, 514 Jenkins, Coral Gables, FL 33124. Phone: 904 993 9031. Fax: 305 284 4300. Email: [email protected]
palmerm
Typewritten Text
palmerm
Typewritten Text
palmerm
Typewritten Text
palmerm
Typewritten Text
Journal of Law and Economics, Vol. 6, Issue 2, 2010, pp. 145-166
palmerm
Typewritten Text
palmerm
Typewritten Text
palmerm
Typewritten Text
palmerm
Typewritten Text

SURPRISE! MOST BLOCKBUSTER JURY AWARDS ARE IGNORED B Y THE STOCK MARKET 1. INTRODUCTION There is an emerging literature on the stock market effects of compensatory and punitive damages awards, usually involving product liability litigation. Such literature typically utilizes the various forms of event study technology. The view is that the stock market should digest the full economic effect of such awards as a reduction in the defendant firm’s market valuation. And, if markets are truly efficient, this effect should be instantaneous to the announcement news. Viscusi (2004) was the first to study what he called “blockbuster” awards involving amounts in excess of $100 million. Viscusi listed 64 such awards occurring over what he described as the emerging blockbuster period, that of 1999-2003. One of his main purposes was to provide an original inventory of such blockbuster awards about which he provided a useful discussion of some of the cases in relation to the landmark Campbell v State Farm decision by the Supreme Court, which suggested proper ratios of compensatory to punitive damages. Viscusi, however, did not study the full stock market effects of these large cases. We provide the first comprehensive stock market study of that portion of Viscusi’s 64 firms that are publicly traded to see the effects of the large blockbuster awards using the Prince and Rubin (2002) methodologies. It would seem logical that the extreme size of blockbuster awards would elicit sufficient media attention such that the stock market would give full effect in adjusted market valuations of these very large defendant companies. Our findings show that the stock market largely ignores those cases where the ratio of the blockbuster award to market capitalization is small (less than 9%), and only responds when the award comprises a larger portion of market capitalization. Moreover, of the inventory of defendant firms suffering very large awards, only 6 of 17 suffered a robust response in the stock market. These results suggest that because these defendants are very large firms that are under constant litigation, with the blockbuster being just one of many cases, the stock market might just be “used” to litigation, being more interested in the prospect of major changes in overall economic business strategy than in any one individual law suit. The results may also suggest the market is simply in a holding pattern waiting the outcome of the appeals process, which they undoubtedly suspect will result in substantially discounted settlements. 2. REVIEW OF LITERATURE Event studies have been used to measure stock market reaction to jury awards. It is generally considered [Garber and Adams (1998)] that stock market returns are superior to accounting returns because stock prices should, according to the efficient market hypothesis, reflect current and future damage awards. According to the efficient market notion, the stock market will react at the time of the award only if the amount catches the market by surprise1. 1 See McWilliams and Siegel (1997), MacKinlay (1997), Karafaith (1988), Coutts, Mills, and Roberts (1995).

Stock prices can also reflect firm reputation loss as well as actual damages. For example, if the market value of the firm drops more than the announced damages, this would suggest that the stock market is anticipating a loss in status, or reputation, for the firm among its consumers. Various papers have employed event study technologies to the stock market effects of litigation awards. Prince and Rubin (2002) studied 62 pharmaceuticals and 42 auto company events over the period 1985-1995. Prince and Rubin utilized the traditional market model with added dummy variables which took a value of 1.0 when the data was on in the event window and 0 otherwise. They utilized an event window of -1 day and +1 day, and -5 and +5 days, before and after the event date as a means of capturing the actual news leakage date. They ran the equation 150 days before and 50 days after the event date. The dummy variable method used by Prince and Rubin has the advantage of using one equation over several event windows. Prince and Rubin also utilized a market adjustment model which generated abnormal returns by subtracting a market index return from the individual stock return. There was no adjustment for the systematic risk of the individual security. Finally, they utilized a nonparametric sign test to test for significant abnormal returns in case assumptions for the parametric tests were violated. Their study found some significant abnormal returns. Govindaraj, Lee and Tinkelman (2007) re-examined much of the Prince and Rubin data and added Japanese firms, utilizing similar methodologies. In addition, they examined a new sample of 144 initial filings and 465 other litigation events for six auto firms over the period 1985-2000. They found that when the Ford Explorer roller award of August 2000 was excluded from the Prince and Rubin data, the results turned largely insignificant. In their expanded data base, they found that events involving what they called “normal” (unlike the Ford Explorer case) litigation produced no abnormal returns because they were already covered by liability reserves for contingent liabilities as required by FASB 175. Only in a few cases involving abnormally large awards did they find significant results. This finding is in accord with Viscusi (2004) who suggested that only the largest blockbuster awards get media attention and therefore are likely to have a stock market reaction. Our study is the first to systematically investigate the share price reaction of very large-firm defendants absorbing awards of blockbuster magnitude to see whether awards need to be large enough to cause significant stock market attention. 3. METHODOLOGY 3.1 Dummy Variable Method. We employ two of the methodologies used by Prince and Rubin. The first, the dummy variable method, estimates the following equation for 100 days before the event date to 50 days after.
where rit = daily return for firm i at time t; MKT is the daily return on the S&P 500 Index for time t; Dit is 1 for days inside the event period and zero otherwise; e is the disturbance term for security i at time t, assumed to be distributed N(0,σ2).

The coefficient bi measures the systematic risk of security ri. The parameter of interest is the coefficient ci , measures the average return for the security in the event period. In order to abstract from any possible outside influences on the stock price not strictly due to the award event, and following Prince and Rubin, we initially go no further than 5 days after the event. In case there is some premature leakage to the press before an award announcement, we also go 5 days before the event. Thus, our initial event period is t - 5 to t + 5. Since an event period preceding the actual announcement date can potentially dilute the statistical effects of the event on the stock price, we also ran the dummy equation for the period 0 to +5 days, and also for the period 0 to 25 days. We are interested in the t significance of the dummy Dit . The t statistic is simply reported out in the regression output. We would expect the coefficient on the dummy to be negative and significant during the event period if the award did have a stock market effect. 3.2 Market Adjustment Method. The market adjustment model was used by Prince and Rubin, Barber and Darrough (1996), and Jarrell and Peltzman (1985). The market adjustment model produces an abnormal return for each day in the event window, whereas the dummy variable method provides an average daily return for the event window. The prediction error, PE, is estimated as where rit and MKTt are as previously discussed. The t statistic of PEit at each day t for each firm i is determined by dividing each respective PEit by the standard deviation of all of the PEs in the estimation period minus 6 days to minus 100 days. Thus, there is a t statistic for each day in the event period. We report CPEs not PEs. The CPEs under the market adjustment model involve summing the individual PEs in the event period as
where L is the length of the event window, in this case either 10 days or 5 days or 25 days. The t statistic for CPE is determined by summing all of the individual daily t statistics in the event period and dividing by the square root of the number of days in the event period. 3.3 Portfolios We also perform t significance tests for portfolios of firms. That is, firms with an award/capital ratio equal to or above 9% are in portfolio 1 and firms with a lower ratio are in portfolio 22.
2 We chose 9% as a break point after viewing the plot in Figure 1 where it is evident that most of the 17 firms award-to-market-cap ratios below 9%.

For portfolios, we report out the cumulative average prediction error, CAPE. The CAPE is the average CPE of the individual firms in the portfolio. The t significance of CAPE for portfolio 1 and portfolio 2 is measured by adding the t statistics of individual firms and dividing the sum by the square root of the number of securities in the portfolio. 4. SOURCES OF DATA Our study utilizes the following data sources. (1) Blockbuster cases were identified from Viscusi's 2004 study which listed 64 firms with awards of over $100 million. (2) Award dates were collected from online sources and phone calls to relevant courts. (3) Filing dates were collected from online sources and the help of two law school librarians. (4) Stock prices and the S&P index were collected through Wharton Research Data Sources (CRSP files). We used stock prices adjusted for splits and dividends. 5. EVENT DATES Prince and Rubin examined both filing dates and award dates as triggers to news of a law suit. To examine only award dates as event dates lets aside the possibility that the litigation filing date, reported in the news, shows forth the prospect of a large award, thus eliciting an appropriate response in the stock market of the defendant firm's shares well before the case is settled. Thus, it would theoretically be possible to miss the stock market effect if one only used award dates as event dates. Prince and Rubin reported a stock market effect if either there was a market response at or near the filing date or at the award date. Thus, to include both dates would seem to satisfy criticism that the research really missed the real event date. This is the approach we took in this paper. Thus we ran the dummy variable and market adjustment tests for both the filing date and award date as anchors for an event period. These results are reported out in Tables 3-6. Our results show that in only two instances, Whittington v US Steel and O'Keefe v Loewen, did including the filing date make any difference. The stock price of US steel did produce a stock market effect at or near the filing date, whereas there was no response when the award was reported out. So, had we ignored the filing date, we would have erroneously reported that there was no response by shares of US steel to the law suit. In the case of O'Keefe v Loewen, we had stock market effects at both the filing date and award dates. Apparently the case filing date surprised the stock market, but in this instance the award also surprised the market. Apparently the actual award was much larger than the market had expected. On the other hand, in the case of Whittington v US Steel, the actual award was anticipated by the markets, and there was no stock market effect to the award announcement. In every other instance we studied, apparently the filing date was just one of many law suits and news items reported in the financial news about the subject defendant firm, and the stock market was used to the reporting of the many law suits faced by these large multinational firms. However, the robust response at award date (in those instances where the award comprised a significant portion of the market cap of the firm) suggests that the

size of the blockbuster award was a surprise to the market, even though the market was undoubtedly aware of the pending lawsuit. We must mention the great difficulty in gathering filing dates for legal research. It is much more difficult to get specific information about filing dates if the case was decided in state court instead of federal court, where data bases are available. Generally it can be said that financial reporters probably do not write much about the initial filing on any single lawsuit of these large firms, but do write about final awards. Thus, in the articles that we examined, there was a surprising lack of mention of the initial filing date. Yet through the dedicated efforts over many months of two law school librarians, we were able to compile filing dates for 13 of our 17 firms. Yet it is our feeling that legal research involving stock prices must attempt to amalgamate filing dates as well as award dates in order to defend against the claim that the inquiry missed the real event date (a problem with all event studies). 6. RESULTS 6.1. Event Period Results Of the 64 firms developed as an initial inventory by Viscusi, we selected those that were publicly traded. From this subtotal, we eliminated the tobacco law suits as involving situations too complicated, perhaps having many event dates. This left us with 17 firms subjected to event study methodology, shown in Table 1. (As we mentioned earlier, we could not find filing dates for the missing firms.) Table 1: Litigants as Listed by Viscusi (2004) That Have Traded Shares, Excluding Tobacco CompaniesLitigants Award Date Fil ing Date Case Number CRSP Permno
Pennzoil v Texaco 11/19/1985 2/8/1984 No. 84-05905 12052
Bartlett v Mitchell Energy 2/20/1996 NA No. 2-96-227-CV 76644
O'Keefe v Loewen 11/2/1995 4/24/1991 No. 91-67-423 46850
Whitt ington v US Steel 3/28/2003 8/16/2002 No. 02-L113 40483
Beckman Coulter v Flextronics 9/24/2003 6/28/2001 No. 01CC08396 11850
Patricia Anderson v GM 7/9/1999 NA No. BC116-926 11260
Exxon Valdez 3/24/1989 see below No. A89-0095-CV (HRH) 12079
Forti v General Dynamics 7/26/1996 6/10/1994 Nos. KC 016 871; KC 017 393; CRA no 7357 87031
City of Hope v Genentech 6/24/2002 NA No. BC215512 78729
Houchens v Rockwell International 5/31/1996 8/12/1993 no. 1993-CL-000158 wihite v rockwell 14736
Meyer Proctor v Davis and UpJohn 10/18/1991 2/14/1984 No. 84L3213 18948
Jimenez v Chrysler 10/8/1997 4/30/1996 No. 2:96-1269-11 80329
Theresa Goodrich v Aetna US Healthcare 1/20/1999 3/18/1996 No. RCV020499 25785
Six Flags Over Georgia v T ime Warner 12/21/1998 3/19/1997 No. 97-A-1939-1 25785
Romo v Ford 7/12/1999 6/24/1994 No. 82318 12079
Moseley v GM 2/4/1993 NA No. 90-V-6276 55191
Robinson v Ford 7/17/1998 NA No. 96-200 26681
Notes: Filing dates for the following firms were unavailable such that we could not run our tests based on filing date as the event date for these firms. For Bartlett v Mitchell Energy we have no exact filing date but know it occurred in 1987. For Anderson v GM we have only the accident date of 12/24/93; no filing date. Exxon Valdez spill date is 3/24/89; law suit filing date is 3/30/89; first jury verdict for $287 million occurred on 8/11/84; final jury award 9/16/94. City of Hope v Genentech, the defendant went public six months after filing date 1/13/99. For Romo v Ford, accident date near Los Angeles was 6/20/93; filing date 6/24/94. For Moseley v GM we have only the accident date in Georgia of 10/21/89.

We are interested in studying the effect of the law suit on the defendant firm. Table 2 shows the awards relative to the total market capitalization of the defendant firm on the award date. Table 2: Blockbuster Combined Award vs Market Capitalization of Defendant Firm on the Award Date
Shares Share Market Cap Combined Award Litigants (award date) Mil Price $ Mil $ Award Mil $ %Pennzoil v Texaco (11/19/85) 238.14 36.25 8,632.39 10,530.00 121.98Bartlett v Mitchell Energy (2/20/96) 23.22 18.25 420.83 205.00 48.71O'Keefe v Loewen (11/2/95) 48.07 32.00 1,538.24 500.00 32.51Whittington v US Steel (3/28/03) 102.61 10.10 1,036.41 250.00 24.12Beckman Coulter v Flextronics (9/24/03) 522.70 15.00 7,840.46 934.00 11.91Patricia Anderson v GM (7/9/99) 648.39 66.13 42,874.79 4,883.00 11.39Exxon (9/16/94)* 1,241.77 60.25 74,816.64 5,287.00 7.07Forti v General Dynamics (7/26/96) 63.18 62.38 3,940.85 107.50 2.73City of hope v Genentech (6/24/02) 525.58 34.84 18,311.07 500.00 2.73Houchens v Rockwell International (5/31/96) 217.25 58.38 12,681.79 218.00 1.72Meyer Proctor v Davis and UpJohn (10/18/91) 176.65 43.88 7,750.43 127.60 1.65Jimenez v Chrysler (10/8/97) 674.47 34.00 22,932.01 262.00 1.14Theresa Goodrich v Aetna US Healthcare (1/20/99)142.95 85.50 12,221.88 120.50 0.99Six Flags Over Georgia v Time Warner (12/21/98)1,112.85 58.25 64,823.40 454.00 0.70Romo v Ford (7/12/99) 1,140.92 53.75 61,324.50 293.00 0.48Moseley v GM (2/4/93) 705.21 37.75 26,621.49 105.00 0.40Robinson v Ford (7/17/98) 1,142.14 58.88 67,243.32 145.00 0.22*Exxon Valdez award date of 9/16/94 produced no stock market effect; all of the effect occurred at theactual spill date. Therefore, we have conducted the analysis for the spill date. Figure 1 plots the ratio of the total combined compensatory-punitive damages award to market capitalization of defendant firm on the award date. Except for a few instances, these large awards were generally small relative to the defendant firm market capitalization, being mostly less than 9%.
Tables 3, 4, 5, and 6 report the statistical tests on the dummy variable and market adjustment methods for the three event periods using filing date and award date
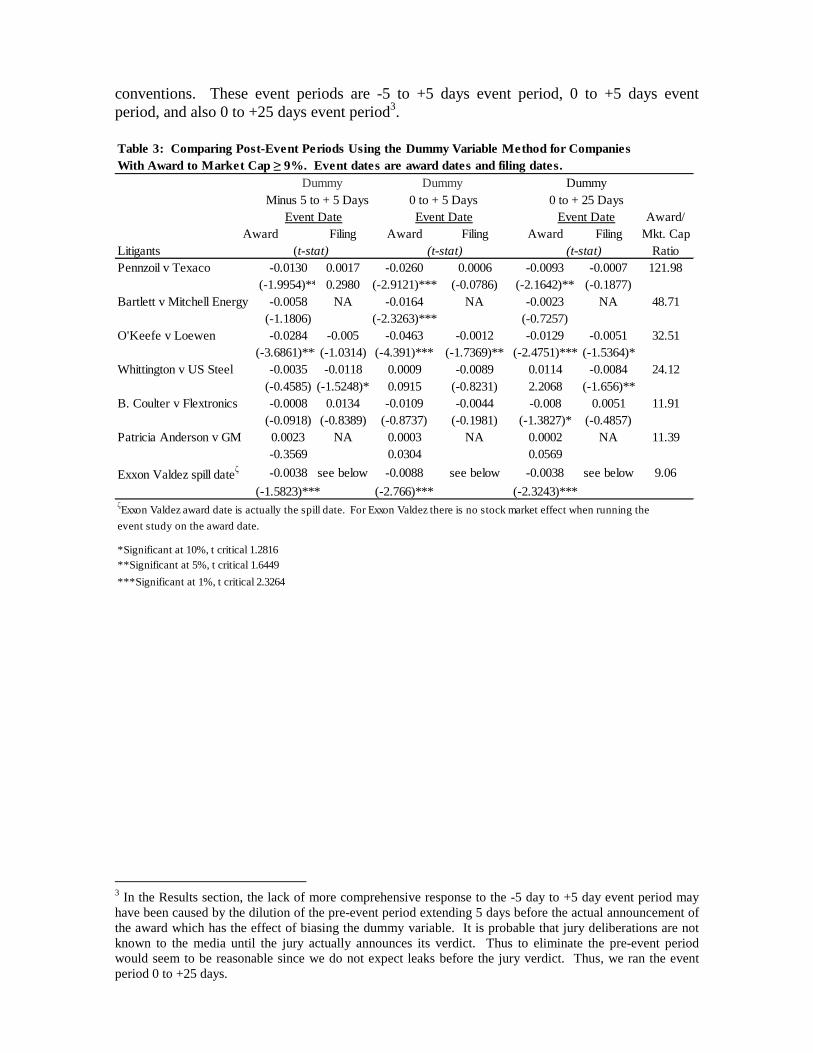
conventions. These event periods are -5 to +5 days event period, 0 to +5 days event period, and also 0 to +25 days event period3. Table 3: Comparing Post-Event Periods Using the Dummy Variable Method for Companies With Award to Market Cap ≥ 9%. Event dates are award dates and filing dates.
Dummy Dummy Dummy Minus 5 to + 5 Days 0 to + 5 Days 0 to + 25 Days
Event Date Event Date Event Date Award/Award Filing Award Filing Award Filing Mkt. Cap
Litigants (t-stat) (t-stat) (t-stat) RatioPennzoil v Texaco -0.0130 0.0017 -0.0260 0.0006 -0.0093-0.0007 121.98
(-1.9954)** 0.2980 (-2.9121)*** (-0.0786) (-2.1642)** (-0.1877)Bartlett v Mitchell Energy -0.0058 NA -0.0164 NA -0.0023 NA 48.71
(-1.1806) (-2.3263)*** (-0.7257)O'Keefe v Loewen -0.0284 -0.005 -0.0463 -0.0012 -0.0129-0.0051 32.51
(-3.6861)***(-1.0314) (-4.391)*** (-1.7369)** (-2.4751)*** (-1.5364)*Whittington v US Steel -0.0035 -0.0118 0.0009 -0.0089 0.0114 -0.0084 24.12
(-0.4585) (-1.5248)* 0.0915 (-0.8231) 2.2068 (-1.656)**B. Coulter v Flextronics -0.0008 0.0134 -0.0109 -0.0044 -0.008 0.0051 11.91
(-0.0918) (-0.8389) (-0.8737) (-0.1981) (-1.3827)* (-0.4857)Patricia Anderson v GM 0.0023 NA 0.0003 NA 0.0002 NA 11.39
-0.3569 0.0304 0.0569
Exxon Valdez spill dateζ -0.0038 see below -0.0088 see below -0.0038 see below 9.06
(-1.5823)*** (-2.766)*** (-2.3243)***ζExxon Valdez award date is actually the spill date. For Exxon Valdez there is no stock market effect when running the
event study on the award date.
*Significant at 10%, t critical 1.2816**Significant at 5%, t critical 1.6449
***Significant at 1%, t critical 2.3264
3 In the Results section, the lack of more comprehensive response to the -5 day to +5 day event period may have been caused by the dilution of the pre-event period extending 5 days before the actual announcement of the award which has the effect of biasing the dummy variable. It is probable that jury deliberations are not known to the media until the jury actually announces its verdict. Thus to eliminate the pre-event period would seem to be reasonable since we do not expect leaks before the jury verdict. Thus, we ran the event period 0 to +25 days.

Table 4: Comparing Post-Event Periods Using the Dummy Variable Method for Companies With Market/Cap Below 8%. Event dates are award dates and filing dates.
Dummy Dummy Dummy Minus 5 to + 5 Days 0 to + 5 Days 0 to + 25 Days
Event Date Event Date Event Date Award/Award File Award File Award File Mkt. Cap
Litigants (t-stat) (t-stat) (t-stat) RatioForti v General Dynamics 0.0017 0.8750 0.0004 1.7841 -0.0001 -0.0031 2.73
-0.4543 0.2637 (+0.0818) 0.3868 (-0.0272) (-1.2074)
City of Hope v Genentech -0.0026 NAζ
-0.015 NAζ 0.0062 NAζ 2.73(-0.2962) (-1.2796) (+1.0209)
Houchens v Rockwell 0.0111 0.0010 0.009 -0.0016 0.0058 0.0011 1.72(+1.9241) 0.2353 (+1.1602) -0.2915 (+1.4576) 0.3669
M. Proctor v Davis/UpJohn -0.0009 -0.0049 -0.0032 -0.0052 -0.0013 -0.0005 1.65(-0.159) (-1.3172)* (-0.4299) (-1.0491) (-0.0341) (-0.1968)
Jimenez v Chrysler -0.0021 0.0001 -0.012 -0.0069 0.0005 0.0025 1.14(-0.4781) 0.1033 (-2.0731)** (-0.9518) (+0.1823) 0.7230
Goodrich v Aetna -0.0076 -0.0007 -0.0109 0.0006 -0.0064 -0.0027 0.99(-1.3662)* (-0.139) (-1.4111)* 0.0937 (-1.7373)** -0.8576
Six Flags v Time Warner 0.0036 -0.0003 0.0099 0.0013 0.002 -0.0025 0.70(+0.6105) (-0.1926) (+1.2752) 0.0791 (+0.4982) -0.2746
Romo v Ford -0.0084 0.0046 -0.0056 0.0099 -0.0026 0.0036 0.48(-1.5254)* 0.8222 (-0.7594) 1.3571 (-0.6775) 1.0495
Moseley v GM 0.0027 NA 0.0054 NA -0.0018 NA 0.39(+0.4738) (+0.6915) (-0.4506)
Robinson v Ford -0.0031 NA -0.0085 NA -0.0123 NA 0.22(-0.3724) (-0.8192) (-2.295)**
ζGenentech did not become publicly traded until 7/20/99, 6 months beyond the filing date.
*Significant at 10%, t critical 1.2816**Significant at 5%, t critical 1.6449***Significant at 1%, t critical 2.3264

Table 5: Comparing Post-Event Periods Using the Market Adjustment Method for Large Award-Market Cap R atio Cases
An equally-weighted portfolio of the listed forms is shown below. CPE CPE CPE
Minus 5 to + 5 Days 0 to + 5 Days 0 to + 25 Days Event Date Event Date Event Date Award/
Award Filing Award Filing Award Filing Mkt. CapLitigants (t-stat) (t-stat) (t-stat) RatioPennzoil v Texaco -0.2140 0.0248 -0.2039 0.0077 -0.2761 0.0107 121.98
(-5.3392)*** 0.6064 (-7.2001)*** 0.2661 (-4.3612)*** 0.1656
Bartlett v Mitchell Energy -0.0555 NA -0.0820 NA -0.1036 NA 48.71
(-1.3660)* (-2.8557)*** (-1.6145)*
O'Keefe v Loewen -0.3087 -0.0624 -0.2527 -0.0702 -0.3923 -0.1327 32.51
(-7.0285)*** (-1.2169) (-8.1370)*** (-1.9362)** (-5.6493)*** (-1.6380)*
Whittington v US Steel -0.0223 -0.1484 0.0136 -0.0724 0.2823 -0.1845 24.12
(-0.2893) (-2.1358)** 0.2494 (-1.4742)* 2.3133 (-0.6593)
B. Coulter v Flextronics -0.0539 0.1126 -0.1086 -0.0190 -0.0958 0.1741 11.91
(-0.5645) 0.5977 (-1.6095)* (-0.1423) (-0.6418) 0.5845
Patricia Anderson v GM 0.0156 NA 0.0030 NA 0.0008 NA 11.39
0.2361 0.0644 0.0076
Exxon Valdez spill dateζ -0.0539 see below -0.0536 see below -0.1037see below 9.06
(-2.1634)** (-3.0452)*** (-2.6341)***
CAPE CAPE CAPE Average
Minus 5 to + 5 Days 0 to + 5 Days 0 to + 25 Days Award-
(t-stat) (t-stat) (t-stat) Cap Ratio Correspond
Portfolio 1 firms ≥9% Ratio -0.6927 -0.6842 -0.6894 37.10 yes
(-6.2420)*** (-8.5171)*** (-4.7549)***ζSee notes bottom Table 3.
*Significant at 10%, t critical 1.2816
**Significant at 5%, t critical 1.6449
***Significant at 1%, t critical 2.3264

Table 6: Comparing Post-Event Periods Using the Market Adjustment Method for Small Award-Market Cap R atio Cases
An equally-weighted portfolio of the above-listed firms is shown below. CPE CPE CPE
Minus 5 to + 5 Days 0 to + 5 Days 0 to + 25 Days Event Date Event Date Event Date Award/
Award Filing Award Filing Award Filing Mkt. CapLitigants (t-stat) (t-stat) (t-stat) RatioForti v General Dynamics 0.0127 0.0303 -0.0129 0.0103 0.0015 -0.0726 2.73
0.3298 0.8249 (-0.4733) 0.3970 0.0244 -1.2508
City of hope v Genentech -0.0573 NA -0.1019 NA 0.1012 NA 2.73
(-0.6565) (-1.6521)** 0.7340
Houchens v Rockwell 0.0180 0.0047 0.0478 -0.0131 0.1458 0.0180 1.72
1.9068 0.0996 1.0915 -0.3926 1.4909 0.2408
M. Proctor v Davis/UpJohn -0.0113 -2.0919 -0.0171 -1.4737 -0.0566 2.9711 1.65
(-0.2139) (-0.4868) (-0.4585) (-0.6590) -0.6785 -0.5942
Jimenez v Chrysler -0.0037 0.0251 0.0814 0.0565 0.0416 -0.0608 1.14
(-0.1041) 0.5001 3.2362 1.5900 0.7393 -0.7646
Goodrich v Aetna -0.0581 -0.0176 (-0.0432) -0.0019 -0.1240 -0.0631 0.99
(-1.0450) (-0.3504) (-1.1003) -0.0522 (-1.4116)* -0.7958
Six Flags v Time Warner 0.0558 0.0070 0.0674 0.0524 0.0928 0.2114 0.70
0.6628 0.0527 1.5806 0.5543 0.9805 1.0007
Romo v Ford -0.1002 0.0081 -0.0397 0.0360 -0.0833 0.0842 0.48
(-1.7212)** 0.0001 -0.9652 0.0005 -0.9047 0.0005
Moseley v GM 0.0452 NA 0.0353 NA -0.019 NA 0.39
0.7370 0.8142 -0.1963
Robinson v Ford -0.0594 NA -0.0336 NA -0.2416 NA 0.22
(-0.7386) -0.5901 (-1.8997)**CAPE CAPE CAPE Average
Minus 5 to + 5 Days 0 to + 5 Days 0 to + 25 Days Award-(t-stat) (t-stat) (t-stat) Cap RatioCorrespond
Portfolio 2 firms < 9% -0.1583 -0.0169 -0.1416 1.28 yes
(-0.2685) (-0.4626) (-0.0539)
*Significant at 10%, t critical 1.2816
**Significant at 5%, t critical 1.6449
***Significant at 1%, t critical 2.3264 Out of the 17 firms studied, only six firms had a measureable statistically significant response to the award announcement. They were as follows: Pennzoil v Texaco, Barlett v Mitchell Energy, O’Keefe v Loewen (both filing date and award date response), Whittington v US Steel (filing date response only), Exxon Valdez, and Goodrich v Aetna. The combined results can more easily be seen in Table 7. Note from Table 7 that there was generally a significant response only in the case of firms where the award comprised ≥ 9% portion of the firm's market capitalization, as we would expect. Notice in Table 7 the last column. We are looking for expected correspondence. That is, we would expect the stock of a firm with a low ratio of award to market capitalization to easily absorb the jury award, and thus show little statistical correlation of stock price movement to the event. Likewise, the larger ratio impact on market capitalization should produce an important effect on the stock price. If the result was as expected, we denoted the last column of the table as "yes." Notice that there are also indicated "uncertain" entries. These are cases where the statistical result is not strong enough to produce a convincing stock market effect.

Table 7: Combining Tables 3, 4, 5 and 6 for a Comprehensive Look. Correspondence is "yes" either if there is a statistical relationship and the award-cap ratio is ≥ 9%, or if there is no statisticalrelationship and the award-cap ratio is < 9%. Correspondence is "no" otherwise. "Uncertain" occurs when there is a a weak statistical (two instances with positive alphas) relationship and the market cap ratio is either ≥ 9% or < 9%. Numbers shown are alpha statistics.
Dummy CPE Dummy CPE Dummy CPE - 5 to + 5 Days - 5 to + 5 Days 0 to + 5 Days 0 to + 5 Days 0 to + 25 Days 0 to + 25 DaysAward/
Event Date Event Date Event Date Event Date Event Date Event Date Cap Award Filing Award Filing Award Filing Award Filing Award Filing Award Filing Ratio Correspond
Pennzoil v Texaco 5% 1% 1% 1% 5% 1% 121.98 yesBartlett v Mitchell Energy NA 10% NA 1% NA 1% NA NA 10% NA 48.71 yesO'Keefe v Loewen 1% 1% 1% 5% 1% 5% 1% 10% 1% 10% 32.51 yesWhittington v US Steel 10% 5% 10% 5% 24.12 yesB. Coulter v Flextronics 10% 10% 11.91 uncertainAnderson v GM NA NA NA NA NA NA 11.39 noExxon Valdez Spill* 10% 5% 1% 1% 1% 1% 9.06 yes
Forti v General Dynamics 2.73 YesCity of hope v Genentech NA NA NA 5% NA NA NA 2.73 yesHouchens v Rockwell 1.72 yesProctor v Davis and UpJohn 10% 1.65 yesJimenez v Chrysler 5% 1.14 yesGoodrich v Aetna 10% 10% 5% 10% 0.99 noSix Flags v Time Warner 0.70 yesRomo v Ford 10% 5% 0.48 uncertainMoseley v GM NA NA NA NA NA NA 0.40 yesRobinson v Ford NA NA NA NA 5% NA 5% NA 0.22 uncertain In the lower panels of Tables 5 and 6 we formed equally weighted portfolios of the firms listed in the panel above. The portfolio results show robustly that stock market response does depend upon the award to market cap ratio. This is also suggested visually in Table 7 where one can see that statistical significance depends upon market capitalization (above the horizontal line).
Yet there are many exceptions. To further examine what is suggested by the portfolio results in Tables 5 and 6 and the combined results in Table 7, we utilized data from Table 7 to do a χ2 test on a 4 X 4 matrix as follows4.
We take the following approach to matrix analysis. Looking at the last column of Table 7, we have "yes" correspondence if (1) there is a statistically significant stock market response (" ≤ 10%) combined with an award-market cap ratio that is ≥ 9%, or (2) the share response is not detectable and also the award-cap ratio is < 9%. The column tabulates "no" otherwise.
In the 4 X 4 matrix, yes votes are in the NW box if (1) in the above is true. Likewise yes votes are in the SE box if (2) in the above is true.
Tabulations of "no" correspondence are made in the SW and NE boxes. To the extent that there are tabulations in the SW and NE boxes, our hypothesis does not hold that there is a stock market response only when the award is large relative to market capitalization.
The 4 X 4 results are as follows. Our results for the chi square test are as follows
4 See Siegel, page 104.
Statistical Significance
Award-Cap Ratio signf
insignf
≥ 9% 28 14 < 9% 11 48

χ
2 actual 25.5718 > χ2 critical of 3.84, α = 5%, df = 1.0
Thus, there is a statistical relation between award-cap ratio and stock market response as shown in Table 7; that is, there is correspondence. This confirms the results on the portfolios in table 5 and 6. While the break line at 9% seems visually logical, it is a bit arbitrary. Thus, we redid the count as a median test5. The median for the sample is an award-cap ratio of 2.73. Using this divider, we provide the following matrix from the count. The result on the median test is as follows: χ
2 actual 8.4196 > χ2 critical of 3.84, α = 5%, df = 1.0 For an " = 1%, χ2 critical is 6.64. Thus, while the results are still significant with a divider of 2.73%, the results are much less robust than when the dividing value of 9% for damages-market capitalization. This actually might suggest that a dividing line of 2.73% is just about as good as a divider of 9%, although the results are barely significant. 6.2. Cumulative Average Residual Results. We also ran the traditional market model for all the 17 cases to study the post-event period 0 to +25 days using the award date as the event date6. The cumulative average residuals (CAR) plots in Figure 2 suggest that it might be taking time for the stock market to fully absorb the full effects of a blockbuster award7. See, for example, Pennzoil v Texaco, Bartlett v Mitchell Energy, O'Keefe v Loewen, Beckman Coulter v Flextronics, Exxon Valdez spill, Proctor v David and Upjohn, Goodrich v Aetna, Romo v Ford, and Robinson v Ford.
5 See Siegel, page 111. 6 We do CAR analysis only using the award date as the event date since we have already found in this study that, with the exceptions of Whittington v US Steel and O'Keefe v Loewen, the stock market does not generally respond to filing date information. 7 We do not report out statistical tests on the CAR since such tests are already performed using the dummy variable and market adjustment methods.
THE MEDIAN TEST
Statistical Significance
Award- Cap Ratio signf
insignf
≥ 2.73% 29 25 < 2.73% 11 36

Figure 2: Stock Market Response to Blockbuster Award Announcements as Evidenced by Cumulative Average
Residuals (CAR) Using the Market Model (Estimation Period 0 to minus 100 Days)


One must interpret the results of the 0 to +25 days results in Figure 2 with caution since they suggest that markets are inefficiently digesting the award event. Such an approach violates the basic tenant of event study technology that markets are absorbing the entire information almost immediately. Thus, we should see the entire award (if it comprises an important part of the firm's total market capitalization) reflected in a drop in the share price on the day of the award, or the day following to give the press a chance to publish the event, with the plots then becoming horizontal thereafter. 6.3. Cumulative Prediction Errors Figure 3 plots the cumulative PEs for the filing and award dates for the whole period of the case since its origins. The PE is the defendant stock return less the return on the S&P 500. As one can see, there is little to suggest that the market is responding to filing dates.

Figure 3. S tock Market Reaction to Filing Date and Award Date News as Represented by Cumulative PEs. A chart is shown only in the case where both filing and award dates are known.
-0.6
-0.5
-0.4
-0.3
-0.2
-0.1
0
0.1
0.2
0.3
0.4
1 77 153 229 305 381 457 533 609 685 761 837
Cum
PE
time
pennzoil v texaco
Award Date
File Date
-0.4
-0.2
0
0.2
0.4
0.6
0.8
1
1 43 85 127 169 211 253 295 337 379 421 463 505 547
Cum
PE
time
whittenton v us steel
file date
award date
-0.6
-0.4
-0.2
0
0.2
0.4
0.6
0.8
1
1.2
1 97 193 289 385 481 577 673 769 865 961
Cum
PE
time
Coulter v Flextronics
File
Award date
-0.25
-0.2
-0.15
-0.1
-0.05
0
0.05
1 19 37 55 73 91 109 127 145 163 181 199
Cum
PE
time
exxonvaldez Spill Date
Spill date -0.25
-0.2
-0.15
-0.1
-0.05
0
0.05
0.1
1 76 151 226 301 376 451 526 601 676 751 826
Cum
PE
time
forti v general dynamics
File date
Award date
-0.5
-0.4
-0.3
-0.2
-0.1
0
0.1
0.2
0.3
1 140 279 418 557 696 835 974 1113 1252
Cum
PE
time
o'keefe v loewen
filing date
award date

-0.3
-0.2
-0.1
0
0.1
0.2
0.3
1 65 129 193 257 321 385 449 513 577 641 705
Cum
PE
time
jimenez v chrysler
Award date
file date -1.4
-1.2
-1
-0.8
-0.6
-0.4
-0.2
0
0.2
0.4
1 146 291 436 581 726 871 1016 1161 1306
Cum
PE
time
goodrich v aetna
filing date award date
-0.5
0
0.5
1
1.5
2
2.5
Cum
PE
time
Six Flags v Times Warner
File date
Award date
-0.5
-0.4
-0.3
-0.2
-0.1
0
0.1
0.2
0.3
0.4
1 152 303 454 605 756 907 1058 1209 1360 1511
Cum
PE
time
romo v ford
File date
Award date
-0.2
0
0.2
0.4
0.6
0.8
1
1.2
1.4
1 210 419 628 837 1046 1255 1464 1673 1882 2091
Cum
PE
time
proctor v upjohn
filing date
award date
-0.15-0.1
-0.050
0.050.1
0.150.2
0.250.3
0.35
1 93 185 277 369 461 553 645 737 829
Cum
PE
time
houchens v rockwell
award date
filing date
6.4 Reputation Loss Reputation loss occurs when the loss in market value exceeds the amount of the total award, both compensatory and punitive damages together. A loss is evidenced by negative-number reputational loss. Note in Table 8 that we list the daily average dummies from Tables 3 and 4. To obtain a cumulative effect, we must multiply by the 5 day event period. Thus, is the change in value per day, and times 5 days is the change in market value over 5 days.

Table 8: Reputational Loss by Overabsorption by the Defendant's Stock Price of the Total Award During the Event Period, 0 to + 5 Days. Beginning value set at event date. A boxed negative number indicates reputational loss.
Loss Computed only when the coefficient is statistically significant as indicated in Table 7.
Mkt. Mkt.
Award to Market Value Reput. Value Reput.
Market Total Cap at Loss - Loss - Loss - Loss -
Cap Award Event Date Dummy Dummy CPE Mkt. Adj Mkt. Adj
Litigants Ratio (In Mil $) (In Mil $) Dummy (In Mil $) (In Mil $) Mkt. Adj. (in Mil $) (In Mil $)
Pennzoil v Texaco 121.98 10530 8632 -0.026*** -1122 9408 -0.2039*** -1760 8770
Bartlett v Mitchell Energy 48.72 205 421 -0.0164*** -35 170 -0.082*** -35 170
O'Keefe v Loewen 32.50 500 1538 -0.0463*** -356 144 -0.2527*** -389 111
Whittington v US Steel 24.12 250 1036 -0.0089 -0.0724* -75 175
B. Coulter v Flextronics 11.80 934 7913 -0.0109 -0.1086* -859 75
Patricia Anderson v GM 11.39 4883 42875 0.0003 0.003 4883
Exxon spill date 9.06 5287 58369 -0.0088*** -2568 2719 -0.0536*** -3129 2158
Forti v General Dynamics 2.73 108 3941 0.0004 -0.0129 108
City of hope v Genentech 2.73 500 18311 -0.015 -0.1019** -1866 -1366
Houchens v Rockwell 1.72 218 12682 0.009 0.0478
M. Proctor v Davis/UpJohn 1.65 128 7750 -0.0032 -0.0171
Jimenez v Chrysler 1.14 262 22932 -0.012** -1376 -1114 0.0814
Goodrich v Aetna 0.99 121 12222 -0.0109* -666 -546 -0.0432
Six Flags v Time Warner 0.70 454 64823 0.0099 0.067
Romo v Ford 0.48 293 61325 -0.0056 -0.0397
Moseley v GM 0.40 105 26621 0.0054 0.0353
Robinson v Ford 0.22 145 67243 -0.0085 -0.0336
Notes. Whittington v US Steel is significant on the filing date only.
*Significant at 10%, t critical 1.2816
**Significant at 5%, t critical 1.6449
***Significant at 1%, t critical 2.3264 For example, for Pennzoil v Texaco, the daily dummy for the period 0 to + 5 days is -0.026 times 5 days = 0.13 (or 13%) change in market value over the five days times the beginning market value at event date of $8,632 million = $1,122 million drop in market value as a result of the award. However, the award is $10,530 million. So the reputation loss is +$9,408 million. Since the number is positive (indicating that the award is larger than the market value loss), there is no reputation loss using the dummy measure. For the CPE involving the market adjustment method, the number for Pennzoil v Texaco is -0.2039 times original capital $8,632 million = $1,760 million loss in market value as a result of the award (notice that the -0.2039 is for the 5 days). Taking this from the award of $10,530 million = $8,770 million, a positive number. So there is no reputation loss. In another example, for Jimenez v Chrysler the award was $262 million. But the dummy-variable market value loss was so much more, at $1,376 million, causing a reputation loss of -$1,114 million. Since the number is negative, there is a non-trivial reputation loss. Similar results are shown for Table 9 where the event period is 0 to +25 days. For

Table 9: Reputational Loss Due to Overabsorption of Total Award by Defendant's Stock Price During Event Period, 0 to + 25 days. Beginning value set at event date. Boxed negative number indicates reputational loss.
Loss computed only when coefficient is significant according to Table 7
Mkt Mkt.
Award to Value Reput. Value Reput.
Market Total Market Loss - Loss - Loss - Loss -
Cap Award Cap Dummy Dummy CPE Mkt. Adj Mkt. Adj
Litigants Ratio % (In Mil $) at Event Date Dummy (In Mil $) (In Mil $) Mkt. Adj. (In Mil $) (In Mil $)
Pennzoil v Texaco 121.98 10530 8632 -0.0093** -2007 8523-0.2761*** -2383 8147
Bartlett v Mitchell Energy 48.72 205 421 -0.0023 -0.1036* -44 161
O'Keefe v Loewen 32.50 500 1538 -0.0129*** -496 4 -0.3923*** -603 -103
Whittington v US Steel 24.12 250 1036 -0.0084** -218 32 -0.1845
B. Coulter v Flextronics 11.80 934 7913 -0.008* -1583 -649 -0.0968
Patricia Anderson v GM 11.39 4883 42875 0.0002 0.0008
Exxon spill date 9.06 5287 58369 -0.0038*** -5545 -258 -0.1037*** -6053 -766
Forti v General Dynamics 2.73 108 3941 -0.0001 0.0015
City of hope v Genentech 2.73 500 18311 0.0062 0.1012
Houchens v Rockwell 1.72 218 12682 0.0058 0.1458
M. Proctor v Davis/UpJohn 1.65 128 7750 -0.0013 -0.0566
Jimenez v Chrysler 1.14 262 22932 0.0005 0.0416
Goodrich v Aetna 0.99 121 12222 -0.0064** -1956 -1836 -0.124* -1516 -1395
Six Flags v Time Warner 0.70 454 64823 0.002 0.0928
Romo v Ford 0.48 293 61325 -0.0025 -0.0833
Moseley v GM 0.40 105 26621 -0.0018 -0.019
Robinson v Ford 0.22 145 67243 -0.0123** -20677 -20532 -0.2416** -16246 -16101
*Significant at 10%, t critical 1.2816
**Significant at 5%, t critical 1.6449
***Significant at 1%, t critical 2.3264 Tables 8 and 9, notice that reputation losses are computed only when the dummy or CPE is statistically significant. Reputation losses that do occur are boxed. The results of Tables 8 and 9 evidence some reputation losses, especially if one goes out 25 days from event date. Consistent in the data are reputation losses at Exxon Valdez, Aetna, and Ford. Sporadic computed reputation losses for others in Tables 8 and 9 should be viewed with caution since coefficients were significant in only one or two of the tests summarized in Table 7. While one must also be cautious about interpretations + 25 days from the event date, yet it is possible that the full effects of the award might be taking time to be recognized by investors, especially because these awards unprecedented in size are such a surprise. 7. CONCLUDING REMARKS Using the blockbuster list from Viscusi, this study investigated the relationship of large blockbuster awards, defined as those exceeding $100 million, to the market value of individual defendant companies. This study differs from previous studies in that it concentrates on large blockbuster awards. Employing commonly used event study methodologies, we concluded that the size of the award in relation to the market capitalization of the firm was important in producing a negative stock market reaction. Thus, blockbuster awards that could be easily absorbed by much larger market capitalization were largely ignored by the stock market.

We also investigated possible reputation loss caused by award announcements. We found that the study had to go + 25 days beyond the award date in order to get evidence of reputational loss. According to our measurements, only the defendant firms Exxon and Aetna experienced convincing reputation losses due to the blockbuster awards.
8. BIBLIOGRAPHY
Barber, Brad M. and Masako N. Darrough. 1996. "Product Reliability and Firm Value: The Experience of American and Japanese Automakers, 1973-1992," 104: 5 Journal of Political Economy. 1084-1099. Coutts, J. Andrew, Terence C. Mills, and Jennifer Roberts. 1995. "Testing Cumulative Prediction Errors in Event Study Methodology," 14 Journal of Forecasting. 107-115. Garber, Steven and John Adams. 1998. "Product and Stock Market Responses to Automotive Product Liability Verdicts," Brookings Papers on Economic Activity: Microeconomics. Govindaraj, Suresh, Picheng Lee, and Daniel Tinkelman. 2007. "Using the Event Study Methodology to Measure the Social Costs of Litigation -- A Re-Examination Using Cases from the Automobile Industry, " Review of Law and Economics. 341-382. Herbst, Anthony F., John F. Marshall, and John Wingender. 1996. "An Analysis of the Stock Market's Response to the Exxon Valdez Disaster," 7:1 Global Finance Journal. 101-114. Hertzel, Michael G. and Janet Kiholm Smith. 1993. "Industry Effects of Interfirm Lawsuits: Evidence from Pennzoil v Texaco," 9:2 Journal of Law, Economics, and Organization. 425-444. Jarrell, Gregg and Sam Peltzman. 1985. "The Impact of Product Recalls on Wealth of Sellers," 93:3 Journal of Political Economy. 512-536. Prince, David W. and Paul H. Rubin. 2002. "The Effects of Product Liability Litigation on the Value of Firms," 4:1 American Law and Economic Review. 44-87. Karafiath, Imre. 1988. "Using Dummy Variables in Event Methodology," 23:3 The Financial Review. 351-357. MacKinlay, A. Craig. 1997. "Event Studies in Economics and Finance," 35 Journal of Economic Literature. 13-39. McWilliams, Abagail and Donald Siegel. 1997. "Event Studies in Management Research: Theoretical and Empirical Issues," 40:3 Academy of Management Journal. 626-657. Siegel, Sidney. 1956. Nonparametric Statistics for the Behavioral Sciences: McGraw Hill.

Viscusi, W. Kip, and Joni Hersch. 1990. "The Market Response to Product Safety Litigation," 2 Journal of Regulatory Economics. 215-230. Viscusi, W. Kip. 2004. "Blockbuster Punitive damage Awards," 53:3 Emory Law Journal. 1405. Warren-Boulton, Frederick R. and Serdar Dalkir. 2001. "Staples and Office Depot: An Event-Probability Case Study," 19 Review of Industrial Organization. 469-481.